leading factors contributing international organizations
26
ISSN: 2587-2621 Volume 3 Issue 3, November 2019 ORCID ID: 0000-0002-4966-8074 Makale Gönderim Tarihi: 09.05.2019 Makale Kabul Tarihi: 04.10.2019 LEADING FACTORS CONTRIBUTING INTERNATIONAL ORGANIZATIONS TO BE AGILE AND BLUE OCEAN STRATEGY; AN EVIDENCE FROM TURKISH CIVIL AVIATION SECTOR Filiz MIZRAK [email protected] Elif BAYKAL Dr. [email protected] Abstract: International companies must change and develop very rapidly to find their place in the intense competition environment of today's world. For this reason, it is important to adopt agile approach which is a systematic perspective developed to respond quickly to changes and developments that have occurred in the sector in which an organization operates. The purpose of this study is to determine significant factors that support companies to be “Agile” in harsh conditions and offer strategies regarding “Blue Ocean Strategy” which is among the strategies that ensure the survival of the organizations in the markets where competition is intense. In this regard, the case of Pegasus Airlines has been analyzed using annual report of the company starting from 2013 when the company went public. As a result of the study, although Pegasus Airlines has been proved to be an agile company by confronting the key factors that contribute to agility, it has
-
Upload
khangminh22 -
Category
Documents
-
view
3 -
download
0
Transcript of leading factors contributing international organizations

ISSN: 2587-2621
Volume 3 Issue 3, November 2019
ORCID ID: 0000-0002-4966-8074
Makale Gönderim Tarihi: 09.05.2019
Makale Kabul Tarihi: 04.10.2019
LEADING FACTORS CONTRIBUTING INTERNATIONAL ORGANIZATIONS
TO BE AGILE AND BLUE OCEAN STRATEGY; AN EVIDENCE FROM
TURKISH CIVIL AVIATION SECTOR
Filiz MIZRAK
Elif BAYKAL
Dr.
Abstract: International companies must change and develop very rapidly to find their place in the intense competition environment of today's world. For this reason, it is important to adopt agile approach which is a systematic perspective developed to respond quickly to changes and developments that have occurred in the sector in which an organization operates. The purpose of this study is to determine significant factors that support companies to be “Agile” in harsh conditions and offer strategies regarding “Blue Ocean Strategy” which is among the strategies that ensure the survival of the organizations in the markets where competition is intense. In this regard, the case of Pegasus Airlines has been analyzed using annual report of the company starting from 2013 when the company went public. As a result of the study, although Pegasus Airlines has been proved to be an agile company by confronting the key factors that contribute to agility, it has

Leading Factors Contributing International Organizations To Be Agile and Blue Ocean Strategy; 466 an Evidence From Turkish Civil Aviation Sector
Stratejik ve Sosyal Araştırmalar Dergisi
been suggested that the company needs to find blue oceans; new markets away from competition in order to increase its sales. This study is expected to contribute to literature well since it will be the first study that measure the agility of a
company which operates in civil aviation sector.
Keywords: Agility, Blue ocean strategy, Civil Airlines, Competitiveness, Low-cost strategy
INTRODUCTION
In today’s rapidly and constantly changing world, companies strive to make profit, sometimes strive even to survive by applying different strategies. The determiners of success have evolved in time;
what measured success used to be the more product that was manufactured with the least material in
a limited time; however now, it depends on the ability of adapting to the changing environment, thus satisfying the needs of highly demanding customers. This is because, consumers have plenty of
alternatives to choose since the boundaries between the nations have disappeared due to globalization.
Especially, companies operating in service sector, such as civil aviation need to follow the latest trends, developments, changes in order to meet the expectations of its customers.
The fact that the international side of air transport compared to other sectors is predominant has made
it necessary for the air transport sector to act in accordance with international rules. The Chicago Convention of 7 December 1944 is a text that regulates the principles of international civil aviation
at the universal level and serves as an international guide to the air traffic rights of commercial air
carriers. Thus, international aviation services are carried out through bilateral agreements between states. Globalization, privatization, liberalization and deregulation have forced the air transport sector
to enter a new era and as a result, competition in air transport has increased. The increasing
competition in the international air transport market makes the world a single global market.
When the highly competitive situation of the current Civil Aviation sector with its global players has
been taken into consideration, one can say that the necessity for these players to be agile has increased.
Because, with their dynamic employees, passionate bosses, and flexible structures, agile companies have the ability to make quick decisions, take quick action, finish work quickly and react to changes
instantly. Institutional agility is evident in many points, from product delivery time, speed of
complaint response, flexibility to reorganize according to changes in the market, to quick decision making in the event of a natural disaster. Agile companies live fast, exciting and ready for anything
at any time. When you enter an agile company, the positive energy and determination to finish the
job is immediately evident (Sekman M, Utku A., 2009:3). However, despite the capability of
organizations to be agile, the competition in some markets become so intense that companies start to search for other strategies to gain advantage.
Businesses, who want to provide competitive advantage, often get into intense competition with their competitors in terms of price, quality, speed and cost. In this struggle, all the rivals continue their
activities with different losses in an extreme competition environment that almost resembles a red
ocean. The term red ocean is used to describe this contentious and extreme competition environment, whereas the term blue ocean strategy which means to go beyond the current competitive conflicts and
make the competition meaningless has been used to describe the opposite. Blue oceans refer to
industries that have not yet emerged, namely, undiscovered markets due to competition. Rather than
fighting with rivals, companies can go for blue oceans where there is a wide opportunity for both profitable and rapid growth.

467 Filiz MIZRAK & Elif BAYKAL
Stratejik ve Sosyal Araştırmalar Dergisi
In this study, it is aimed to discuss what makes companies to be agile in harsh condition and suggest
strategies accordingly. The study will be supported with a case study of Pegasus Airlines Co. which is operating in Turkish Civil Aviation sector, thus competing with the market leader; Turkish Airlines.
What strategies have Pegasus Airlines improved so far will be the focus of this paper. This study will
be an important one in the literature as it is the first one which assess the agility of a company
operating in civil aviation. The organization of the paper will be as followed; after the introduction part, brief information concerning the similar studies about agility and blue ocean strategies in the
literature will be given. In the third part, the case of Pegasus Airlines will be analyzed with the
company’s annual report starting from 2013. Finally, in the conclusion part, suggestions related to “Blue Ocean Strategy” will be presented.
1. LITERATURE REVIEW
Definition of Agility in Literature
Identifying the changes in the internal and external environment of the organization and recognizing
the difficulties and opportunities that they will create can be considered agile. The ability of
organizations to find and use appropriate ways to respond to these changes in a timely manner is the
best way to explain agility (Braunscheidel and Suresh, 2009:136). According to (Iscan, Karabey, 2006) the concept of agility lies at the core of speed and flexibility. But just being fast or flexible
doesn't mean being agile. In order to be agile, organizations should also take the aims, benefits and
time elements into consideration, In other words, organizations should be able to go not only to go fast, but to go in the right direction, to stop and change direction. For example, today's organizations
should use new technology and information systems to keep up with the speed of change and to show
flexible responses, integrate business processes, integrate virtual organizational forms, create internal and external cooperation system and perform activities such as integrating the supply chain.
From the late 1980s to the mid-1990s, a great deal of effort was made to understand the broad
economic and political developments around the world and the factors affecting new labor laws. In 1991, some scientists have found that organizations are facing problems such as internal and external
inconsistency against change. In those years, Yusuf and others (1999) stress the importance of speed,
flexibility, quality, profitability for agility. Dove (1999) defines agility as an ability of responding both opportunities and threats in uncertain environments. According to Hormozi (2001), the
organizations which have not been able to use the advantages of these opportunities for themselves
will fail in the long run due to problems in adapting to change.
Agility is the most important success factor for enterprises in today's competitive and rapidly
changing environments (Sharifi and Zang, 1999:11; Sherehiy, Karwowski, Layer, 2007:446). Agility
also means agile production (Upton, 1994:72). It is perceived as a response to changes in the business environment and can be used as an opportunity (Sharifi and Zang, 1999:9). Lin, Chiu and Chu (2006)
thought that the main driving force behind agility was change, and that this change was mainly
represented in customer needs, competitive measures, market, technology and social components.
Sherehiy B. and others (2007) defines agility as having speed, flexibility, responsiveness to
innovation and high quality, personalized products, adaptability to change in culture, mobility of basic
functions and best practice of resources to provide flexible products and services. According to Kim TY and others (2006), agility and interoperability are fundamental requirements for adapting to
rapidly changing environmental conditions. Interoperability is a great communication between
business departments and agility is the flexibility to cope with.

Leading Factors Contributing International Organizations To Be Agile and Blue Ocean Strategy; 468 an Evidence From Turkish Civil Aviation Sector
Stratejik ve Sosyal Araştırmalar Dergisi
On the other hand, according to Menor and others (2001), the most important factors contributing to the agility are the capability of flexibility, quality, cost and speed. Moreover, Asharafi and others
(2005) concludes agility to be good at detecting both threats and opportunities in the environment
thus responding with suitable strategies. Table 1 demonstrates key factors that contributes companies
to be agile in harsh and competitive markets.
Table 1: Key factors contributing to Agility
Reference Cost Responsiveness Flexibility Quality Custome
r needs
Yusuf et al. (1999)
x x x x x
Dove (1999)
x x x x x
Menor et al. (2001)
x x x x x
Asharafi et al.
(2005)
x x
Kim TY. Et.al
(2006)
x x
Sherehiy B. et. al. (2007)
x x x
Lin, Chiu and Chu (2006)
x x
Sherehiy et.
al.(2007)
x x x x x
Braunscheidel and
Suresh (2009)
x x
Rigby, D. K. et. al (2016)
x x x
Lou, A. M., and
Rezaeenour, J. (2016)
x x x x
Khan, H. and
Wisner, J. D. (2019)
x x x
Uğurlu et. al (2019)
x x

469 Filiz MIZRAK & Elif BAYKAL
Stratejik ve Sosyal Araştırmalar Dergisi
It can be concluded from the table that each study above points out at least one factor required to be an agile company.
Agility Approach
There are many studies about agility applied in different sectors in empirical and theoretical
literature. Some of them are given in the following table.
Table 2: Studies related to agility in history
Authors Scope & Sector Method Result
Nagel and
Bhargava (1994)
US. Industry,
Manufacturing
Descriptive
Statistics
It is concluded in the study that manufacturing industry in US can be more powerful, if it gets
more agile.
Upton (1994) Manufacturing Descriptive
Statistics
The study claims that the achievement of
flexibility which is one of the fundamentals of
agility in manufacturing is a critical source of
competitive advantage for many manufacturing firms.
Sharifi and
Zhang (1999) Manufacturing Survey
It emphasizes agility as an essential ability in the revolutionary turning of the business
environment to be able overcome the competition
in the industry.
Yusuf et al.
(1999) Manufacturing
Descriptive
Statistics
The study tries to make definition of agility and
find out determiners of agility for manufacturing.
Dove (1999) Knowledge
Management
Descriptive
Statistics
The study concludes that becoming agile requires
managing and applying knowledge effectively and responsiveness to change.
Menor et al.
(2001) Retail Banking Empirical
The importance of investment in technology and infrastructure has been stressed for retail banks to
be agile.

Leading Factors Contributing International Organizations To Be Agile and Blue Ocean Strategy; 470 an Evidence From Turkish Civil Aviation Sector
Stratejik ve Sosyal Araştırmalar Dergisi
Hormozi
(2001) Manufacturing
Descriptive
Statistics
The study suggests that successful
implementation of manufacturing requires to be agile which means change in regulations,
information technology and improvement in
engineering.
Sambamurthy et. al (2003)
Information Technology
Descriptive Statistics
As a result of the study, it is stressed that
investment in information technology is essential for companies to be able to cope with change and
be agile.
Lin, Chiu and
Chu (2006) Supply Chain
Fuzzy Logic
Case Study
The study tries to demonstrate that to be able to
adapt to the changes in the competitive markets, it is necessary to have agile supply chain
management. Measuring the agility is a matter to
be solved in the study.
Sherehiy et.
al.(2007)
Organizational
Agility
Descriptive
Statistics
The study is mainly focused on the definition and
dimensions of agility.
Brannen and
Doz (2012)
Strategic Agility
Descriptive
Statistics
Case Study
The study tries to suggest solutions for
companies to get through their specific language trap and gain strategic agility.
Vagnoni and
Khoddami
(2016)
Strategic agility Empirical
The study aims to prove that strategic agility is a
key factor for organizations to increase
competitive advantage, thus companies need to improve IT competency and strategic foresight.
Rigby, D. K.
et. al (2016)
Organizational
Agility
Descriptive
Statistics
The study proposes right conditions for agility in terms of market environment, customer
involvement, innovation type etc. Furthermore, it
offers ways to have smooth agile transformation.
Lou, A. M. and
Rezaeenour, J.
(2016)
Supply Chain
Agility Case Study
The importance of knowledge management on
supply chain agility is emphasized in the study.
471 Filiz MIZRAK & Elif BAYKAL
Stratejik ve Sosyal Araştırmalar Dergisi
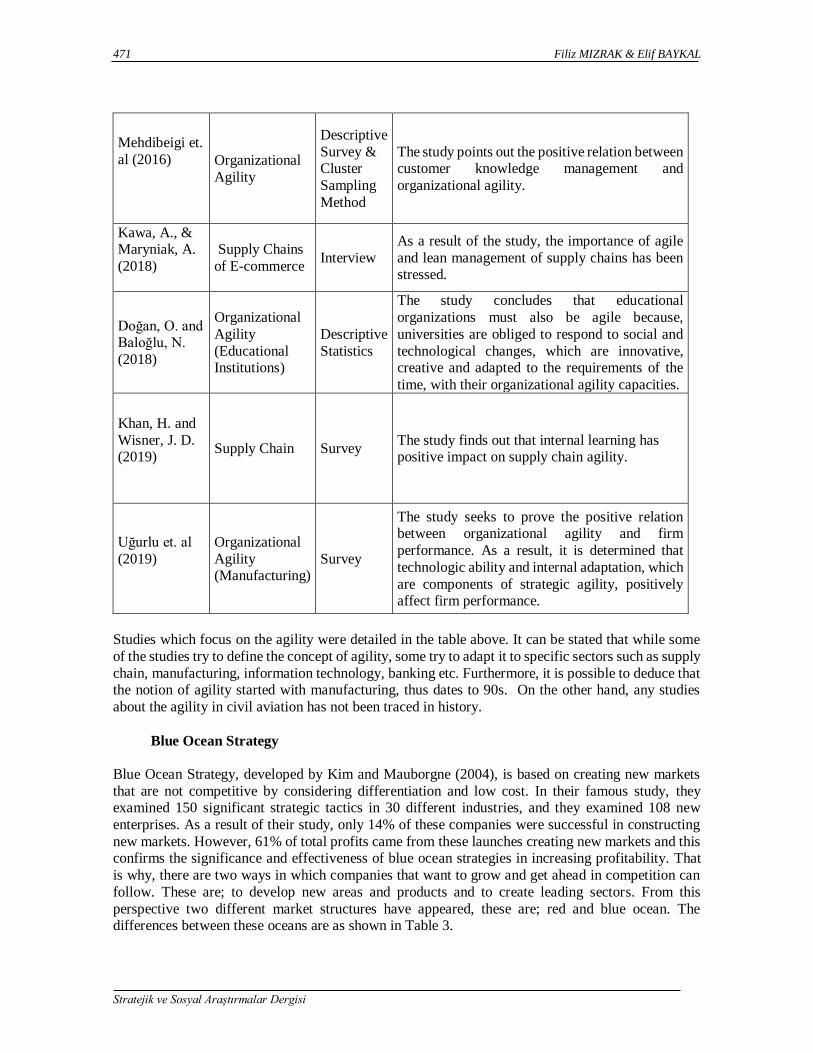
Mehdibeigi et.
al (2016)
Organizational
Agility
Descriptive
Survey & Cluster
Sampling
Method
The study points out the positive relation between customer knowledge management and
organizational agility.
Kawa, A., & Maryniak, A.
(2018)
Supply Chains
of E-commerce Interview
As a result of the study, the importance of agile
and lean management of supply chains has been stressed.
Doğan, O. and Baloğlu, N.
(2018)
Organizational
Agility
(Educational Institutions)
Descriptive
Statistics
The study concludes that educational
organizations must also be agile because,
universities are obliged to respond to social and
technological changes, which are innovative, creative and adapted to the requirements of the
time, with their organizational agility capacities.
Khan, H. and
Wisner, J. D. (2019)
Supply Chain Survey The study finds out that internal learning has positive impact on supply chain agility.
Uğurlu et. al
(2019)
Organizational
Agility (Manufacturing)
Survey
The study seeks to prove the positive relation between organizational agility and firm
performance. As a result, it is determined that
technologic ability and internal adaptation, which
are components of strategic agility, positively affect firm performance.
Studies which focus on the agility were detailed in the table above. It can be stated that while some
of the studies try to define the concept of agility, some try to adapt it to specific sectors such as supply
chain, manufacturing, information technology, banking etc. Furthermore, it is possible to deduce that the notion of agility started with manufacturing, thus dates to 90s. On the other hand, any studies
about the agility in civil aviation has not been traced in history.
Blue Ocean Strategy
Blue Ocean Strategy, developed by Kim and Mauborgne (2004), is based on creating new markets
that are not competitive by considering differentiation and low cost. In their famous study, they examined 150 significant strategic tactics in 30 different industries, and they examined 108 new
enterprises. As a result of their study, only 14% of these companies were successful in constructing
new markets. However, 61% of total profits came from these launches creating new markets and this confirms the significance and effectiveness of blue ocean strategies in increasing profitability. That
is why, there are two ways in which companies that want to grow and get ahead in competition can
follow. These are; to develop new areas and products and to create leading sectors. From this
perspective two different market structures have appeared, these are; red and blue ocean. The differences between these oceans are as shown in Table 3.

Leading Factors Contributing International Organizations To Be Agile and Blue Ocean Strategy; 472 an Evidence From Turkish Civil Aviation Sector
Stratejik ve Sosyal Araştırmalar Dergisi
Table 3: Differences between Red Ocean and Blue Ocean Strategy
Red Ocean Strategy Blue Ocean Strategy
Competing in the existing market. Creating a non-contentious marketplace.
Competing with the opponent. There is no competitor for competition.
Benefiting from existing demand. Creating new demands.
The price and the cost of the product are balanced over time.
Price of the product can be determined over the cost as desired.
Consisting of the activities of a company which
align the whole system with the strategic choice between differentiation or low cost
While trying to achieve differentiation
and low cost, the company aims at harmonizing the whole system
Source: Kim ve Mauborgne, 2004:5
The market consists of red and blue oceans. Red oceans are known market area and represents all existing industries. Red ocean refers to the kind of industries wherein limits are clear, and competition
is fierce (Welch and Edmondson, 2011:256). According to Lindič, Bavdaž and Kovačič (2012) in red
oceans, companies follow traditional strategies in looking forward to beating the fierce competition
while exploiting the existing customer demands and making classic value–cost trade-offs. Boundaries of industry have been defined and accepted. Blue oceans are an unknown marketplace and are not
present today. In red oceans, industrial boundaries are defined, and the competition rules of the game
are known. Here, companies are trying to perform better than their competitors to attract more of the existing demands. As the market area of the red oceans gets denser, profits and growth prospects
decrease. Since the competition is transformed into angry ocean, the term “red ocean” is used. The
untapped market space of blue oceans expresses demand creation and extremely profitable growth opportunities. Blue oceans are irrelevant to competition, because the rules of the game are waiting to
be determined. The term “blue ocean” is used to define the potential of a wide, deep and undiscovered
wide market area. Companies must create blue oceans to go beyond competition and to assess new
profits and growth opportunities (Kim and Mauborgne, 2005: 106). While the product and services of companies floating in the blue ocean cannot be directly compared with others due to lack of
competition, those of the companies fighting in the red ocean are compared in terms of price (Yardley,
2015: 355). Creating a submarket in an existing market may also create a blue ocean strategy since a niche market creates an atmosphere protected from fierce competition (Orlow and Chubarkina,
2017:2).
The aim of the Blue Ocean Strategy is to develop a set of guidelines for the creation of new markets
(Wengel et al., 2010: 57). Creating blue oceans is a static process, not a dynamic process. When a
company becomes competitive and performs superbly, sooner or later imitators begin to appear on
the market. A good blue ocean strategy is not easy to stimulate. Making a great innovation effectively prevents imitators from entering the market and saves cost (Chang, 2010: 220). Blue Ocean Strategy
is built on seven principles. These are;
restarting market limits, not focusing on numbers,
building an application,
designing quality levels attributed to each activity throughout the chain of value,
reaching beyond the request,
overcoming key obstacles
achieving the right strategic ranking by using a leadership style (Butler, 2008:170).

473 Filiz MIZRAK & Elif BAYKAL
Stratejik ve Sosyal Araştırmalar Dergisi
Table: 4 Studies in Literature that Propose Blue Ocean Strategy
Authors Scope & Sector Method Result
Chang, S. C.
(2010)
Cellphone
market in China Case Study
As a result of the study, the
importance of value innovation
in “Blue Ocean Strategy” was stressed. If organizations
applying this strategy do not
give importance to value creation, what they have
innovated can easily be imitated
which will result in the failure of strategy and targeted product
or service.
Kim C. et. al
(2008) Logistics Case Study
It is concluded that due to
expansion of global e-business, there has been intense
competition in the market. For
this reason, companies need to find blue oceans thus apply the
Blue Ocean strategy which
provides a guideline for how
companies can survive by creating new, uncontested
market space.
Dvorak, J.
And Razova,
I. (2018).
Civil Aviation
Industry (Low-cost
Airlines)
Survey
It is concluded that although Blue Ocean Strategy was not
used consciously by Ryanair as
the foundation of the company dates back to 1990s, with the
sub-strategies exemplified, it is
suggested that Ryanair is a successful example of the
mentioned strategy as it took the
first movers’ advantage as low-
cost carrier in the market.
Yap, J. and Chua, K.
(2018)
Property Industry Mixed method of questionnaire and
interview
It is stated that although e-
booking system is widely used
in property industry, it is limited to searching and registration.
For this reason, enhancing the e
booking system can be a blue
ocean for the sector.
Siddique, A.
And Shukla, A. (2016)
Sports Industry Descriptive Statistic
The study suggests that cricket games in India has become a
blue ocean for the industry as it
has aroused the appeal in the

Leading Factors Contributing International Organizations To Be Agile and Blue Ocean Strategy; 474 an Evidence From Turkish Civil Aviation Sector
Stratejik ve Sosyal Araştırmalar Dergisi
support and contributed with the
increased sales of the ticket.
Iqbal, Q. And
Hassan, S. H.
(2018)
Human Resource Questionnaire & SPSS
In the study, green human
resource management is
indicated as a blue ocean
strategy since it moderates the green human power with the
environmental sustainability.
GHRM is a blue ocean as it helps companies to reduce
operating and business expenses
thanks to employees’ green
behaviors.
Lohtander, M. et. al (2017)
Manufacturing Case Study
It emphasizes the components
of blue ocean strategy can
increase the competitive advantage of manufacturing
firms. Especially being location
independent is identified as a
blue ocean since it will increase the speed, mobility and
flexibility of manufacturing.
Lindič, J.
(2012) Economics Case & Empirical Study
The study proposes different propositions for the market. The
one related to Blue ocean
strategy is that creating new
market does not bring high growth but to be the first one is
the key to growth.
Slocum, P. C.
and Papa, F.
(2014)
Education Descriptive Statistics
The study seeks to find out blue oceans for health care
education. In this scope, the
proposed training “osteopathic
medical education” is seen as the blue ocean for the health
care education by giving
mobility advantage to the students.
Ahmad, R.
(2010). Aviation Case Study
Marketing strategies of Air Asia
were detailed by showing each
as blue ocean for the industry.
475 Filiz MIZRAK & Elif BAYKAL
Stratejik ve Sosyal Araştırmalar Dergisi
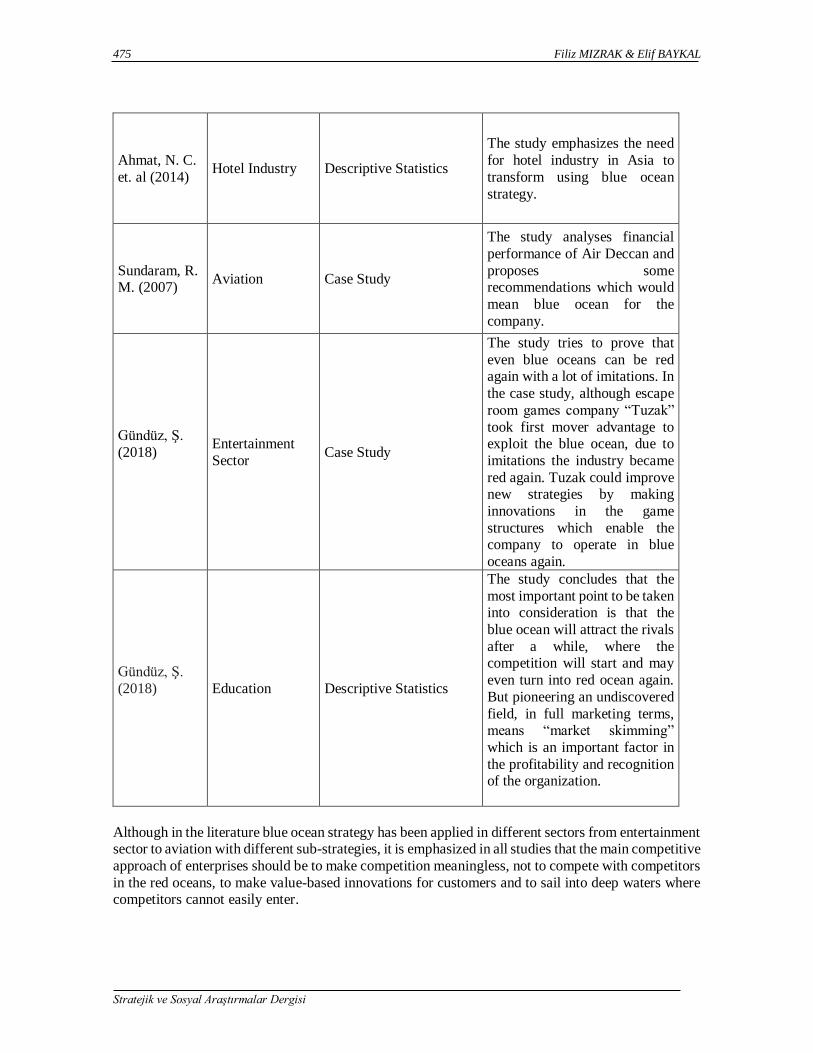
Ahmat, N. C.
et. al (2014) Hotel Industry Descriptive Statistics
The study emphasizes the need
for hotel industry in Asia to
transform using blue ocean
strategy.
Sundaram, R. M. (2007)
Aviation Case Study
The study analyses financial
performance of Air Deccan and
proposes some recommendations which would
mean blue ocean for the
company.
Gündüz, Ş.
(2018)
Entertainment
Sector Case Study
The study tries to prove that
even blue oceans can be red again with a lot of imitations. In
the case study, although escape
room games company “Tuzak”
took first mover advantage to exploit the blue ocean, due to
imitations the industry became
red again. Tuzak could improve new strategies by making
innovations in the game
structures which enable the company to operate in blue
oceans again.
Gündüz, Ş.
(2018)
Education Descriptive Statistics
The study concludes that the
most important point to be taken into consideration is that the
blue ocean will attract the rivals
after a while, where the competition will start and may
even turn into red ocean again.
But pioneering an undiscovered
field, in full marketing terms, means “market skimming”
which is an important factor in
the profitability and recognition of the organization.
Although in the literature blue ocean strategy has been applied in different sectors from entertainment sector to aviation with different sub-strategies, it is emphasized in all studies that the main competitive
approach of enterprises should be to make competition meaningless, not to compete with competitors
in the red oceans, to make value-based innovations for customers and to sail into deep waters where competitors cannot easily enter.
Leading Factors Contributing International Organizations To Be Agile and Blue Ocean Strategy; 476 an Evidence From Turkish Civil Aviation Sector
Stratejik ve Sosyal Araştırmalar Dergisi
2. METHODOLOGY
Related studies in the literature regarding “Agility” and “Blue Ocean Strategy” have been detailed in
order to demonstrate key points contributing the agility and to have a deep understanding of the areas
blue ocean strategy is used. Furthermore, case of Pegasus Airlines along with its current strategies have been analyzed to prove whether it is an agile company in competitive Turkish Civil Aviation
market.
The Case of Pegasus Airlines
World Economy
The slowdown in economic activity since the second half of 2018 continues due to the increasing
economic, political and geopolitical uncertainties in the global conjuncture. While the recovery in the US is one of the factors driving global growth upwards, growth and inflation figures that do not reach
the target values in the Eurozone put downward pressure on world growth. On the other hand, the
slowdown in China as a result of increasing tensions in trade wars constitutes an important obstacle to world growth in the first half of 2019.
The decline in foreign demand is one of the major factors that have brought down the dynamism in the world economy. Especially in China, the growth rate, which was 6.8 percent in the first quarter
of 2018, gradually decreased and decreased to 6.4 percent in the first quarter of 2019 and to 6.2
percent in the second quarter. On the other hand, the growth rate of India, which grew by 8.1 percent
in the first quarter of 2018 to 5.8 percent in the first quarter of 2019, reveals that the effect of the decrease in global demand originating from Asia continues.
The IMF stated that it expects the slowdown in global economic growth since the second half of 2018 to continue in 2019 as well. According to the IMF's Global Economic Outlook Report published in
April, the world economy is projected to grow by 3.3 percent in 2019, down 0.3 percentage points
from the previous year and 0.2 percentage points from the previous January report. In the report published in July 2019 and 2020 forecasts were reduced by 0.1 percentage points to 3.2 percent and
3.5 percent, respectively. Thus, the IMF reduced its growth forecasts for the fourth time in the last
six months.
In the OECD's Global Economic Outlook report released on May 21, a downward revision was made
in the global growth forecast. The global economy is projected to grow by 3.2% this year, slightly
lower than the previous estimate of 3.3%. The report urged governments to resolve commercial disputes. It was noted that the already fragile economy was affected by commercial tensions. It is
emphasized that trade and investments have fallen sharply especially in Europe and China, business
and consumer confidence has been damaged and the uncertainties in policies have continued. The
OECD expects world trade to grow by 2 percent in 2019. This is the lowest level in the last 10 years.
In the April Report of the IMF, the expectations of the increase in global trade in 2019 were down by
0.4 points compared to 2018 and by 0.6 points compared to the previous report and announced as 3.4 percent. On the other hand, in July, it pulled the expectations down again and forecasted the increase
in global trade volume to be 2.5 percent. The World Trade Organization has also reduced the growth

477 Filiz MIZRAK & Elif BAYKAL
Stratejik ve Sosyal Araştırmalar Dergisi
forecast for global trade. The world trade volume, which increased by 3 percent in 2018, is expected
to grow by 2.6 percent in 2019.
In May 2018, the European Commission lowered its growth forecast for the Eurozone and lowered
its growth forecast by warning that trade tensions could make the outlook worse. The European
Commission revised the growth forecast of Germany from 1.1 percent to 0.5 percent for 2019. Officials in Brussels warned that downside risks in the region are still significant. On the basis of
these negative expectations; The slowdown in the global economy, trade tension and weakness in
manufacturing are due to negative performance in the region. However, uncertainties about Brexit, disruptions in the automobile industry and social unrest also increase the fragility in the Eurozone.
There has been an intense election period in Europe. Elections of the European Parliament were held,
and new leaders of the European Union were elected. In the European Parliament, there was an increase in the votes of anti-immigrant far-right parties, Liberals and Greens, while there was a
decline in the votes of central parties. However, populist parties and the votes of the Greens increased
considerably, but pro-EU parties constituted 3/3 of the parliament. The leaders of the European Union (EU) member states agreed to appoint German Defense Minister Ursula von der Leyen as President
of the EU Commission, Charles Michel as President of the Council of the EU, Josep Borrell as the
EU High Representative and Christine Lagarde as the President of the ECB.
The economy of Turkey faced a remarkable financial turbulence in 2018 which resulted in a loss in
the value of TL against USD by 60 percent. Having entered the year at 3.80 TL and having an average
of 3.87 TL in the first four months of the year, the dollar exchange rate rose significantly in May and July and reached to 4.89 TL. The real jump in the exchange rate took place in August and the exchange
rate reached its historical peak on August 14 with 6.89 TL (as of the end of the day). Due to the
volatility of currency in Turkey, all sectors including civil aviation has been affected and the number of bankruptcies has increased as a result.
The US has increased its sanctions against Iran. After the oil export, US President Donald Trump has signed the presidential decree, which imposes additional sanctions on Iran for the iron, steel, copper
and aluminum sectors.
Oil prices fluctuated in the second quarter. At the end of April, the US stated that due date 2th May for countries that are exempted from buying Iranian oil, will not be extended. As a result, oil prices
climbed to $ 75, a six-month high. However, in the US high oil production will increase expectations,
the recession of the global economy and the negative data of the real sector leading data play an important role in the downward balancing of oil prices. OPEC + countries are extending measures to
reduce oil production by another 9 months to ensure that oil prices do not fall below $ 60.
In July, the damage to oil production facilities due to the hurricane in the US led oil prices to rise, fearing that supply-side cuts would be experienced. On the other hand, the fall in oil prices with the
warning of President Trump's tariff increase to China started to rise again with the oil tankers crisis
between Iran and England. As of July 23, the barrel of oil was traded at $ 63.2. (Annual Report 2018, Turkish Civil Aviation)
The oil price shocks created a crisis in the global context, and the effects on Turkey's economy has been profound. As in every emerging country there is a high demand for energy in Turkey industrial
development. Therefore, rising oil prices have the potential to create cost inflation. Apart from this,
the persistence and magnitude of the shock as well as the reactions of the central bank and the

Leading Factors Contributing International Organizations To Be Agile and Blue Ocean Strategy; 478 an Evidence From Turkish Civil Aviation Sector
Stratejik ve Sosyal Araştırmalar Dergisi
monetary and fiscal policies government has created, due to these reactions, are of great importance.
Turkey as an energy-dependent country, has been seriously affected negatively by the cost inflation that the world economy has been experiencing.
Civil Aviation in the World
The rapidly increasing trade volume in the world with globalization has made the transportation sector
one of the most important actors of the world economy today. In parallel, the aviation sector is
developing at a dizzying pace, playing a major role, even leading international integration between the continents.
Over the past thirty years, it has been observed that there is a dramatic movement in air transport with
the influence of increasing social, political and economic relations in the world and it is increasingly more important than alternative transportation systems. According to the inaccurate data published
by the International Civil Aviation Organization (ICAO), 4.3 billion scheduled passenger
transportation increased by 6.1% compared to 2017. In 2018, the number of scheduled aircraft departures reached 38 million worldwide.
Figure 1: Number of scheduled flight passengers in the world
Source: ICAO 2018 Annual Report
Asia Pacific, ranked as second with 30% share in international scheduled passenger traffic, became the fastest growing region in 2018 with an increase of 7.3% compared to the previous year. Asia
Pacific was followed by Europe, which has the largest international market with a 37% share. In 2018,
Europe grew by 6.7% compared to the previous year.
1995
2000
2005
2010
2015
2020
2025
0 0.5 1 1.5 2 2.5 3 3.5 4 4.5 5
Year
Number of Pasangers Billion

479 Filiz MIZRAK & Elif BAYKAL
Stratejik ve Sosyal Araştırmalar Dergisi
Figure 2: Passenger Traffic Change by Region in 2018
Source: ICAO 2018 Annual Report
World passenger traffic increased by 6.7% with an estimated revenue of 8.2 trillion, according to the
revenue passenger km (RPK) figures. According to available seat km (ASK) figures, the total capacity
of airlines in the world increased by 6% in 2018. In 2018, the load factor of the aircraft reached a record level of 81.9%.
In 2018, The number of passenger that Low-Cost carriers carried increased by 8,7 percent which reached to approximately 1.3 billion passengers, meaning 31 percent of the world total scheduled
passengers. In the same year, the world cargo segment increased by 4.5% in terms of freight ton
compared to 2017, and international cargo traffic, which constitutes approximately 87% of total air cargo transportation, grew by 4.6% compared to the previous year.
Turkish Air Transport Market
Turkey has made significant contributions to the development of the civil aviation sector in the world
and especially in Europe with its growth in the field of civil aviation in the last 16 years. It is stated
in the annual reports of ICAO 2018 that Turkey will continue its growth in this field in the following years. According to annual report of ICAO, Turkey has become 12. In terms of revenue passenger
km, 11 in the ranks of revenue ton km, 13. based on freight ton km.
According to the International Airport Council (ACI) 2018 Year-end “Air Traffic Report; Antalya
Airport has increased its number of passengers by 21% compared to the previous period in the
category of airports that meet more than 25 million passengers annually. In the same category,
Istanbul Sabiha Gokcen Airport increased the number of passengers by 8.8% and ranked 4th.
According to the International Airport Council (ACI) 2018 Airport Connection Report, Atatürk
Airport ranks 7th among the top 20 airports in the world with an increase of 4.8% compared to the previous year. Furthermore, Istanbul Atatürk Airport, which ranks among the top 20 airports
8%3%
11%
44%
28%
6%
Passanger Traffic in 2018Change by Region
Europe Africa Middle East Asia and Pasific North America Latin America abd Caribbean
Leading Factors Contributing International Organizations To Be Agile and Blue Ocean Strategy; 480 an Evidence From Turkish Civil Aviation Sector
Stratejik ve Sosyal Araştırmalar Dergisi
according to the direct flight connection in Europe, ranks 18th in 2008, growing by 1.2% in 2018
compared to the previous year and ranks 5th in 2018.
With the increase in the number of airline companies operating in the sector following the legal
arrangements made since 2003, the rapidly growing aviation sector continues to develop as a result
of increasing infrastructure and fleet investments, number of connections and regulations in airline ticket prices. While approximately 65,000 employees were employed in the sector in 2003, this
number reached 196,041 in 2017. The turnover of the sector in 2017 has increased by 30 times in TL
terms since 2003 and by 11 times in dollar terms despite the increase in exchange rates.
In Turkish Aviation Sector, as of the end of 2018, there were a total of 1,404 aircraft including 515
aircraft, 200 air taxis, 367 general aviation, 260 balloons and 62 agricultural combat aircraft. As of
the end of 2018, the total number of pilots was 10.189. The proportion of foreign pilots in the number of aircraft and helicopter pilots is 6%. By the end of 2018, the total number of other licensed technical
personnel, including 1,594 air traffic controllers, 397 dispatchers, 4,310 technicians and 569 ATSEP,
reached 6,870.
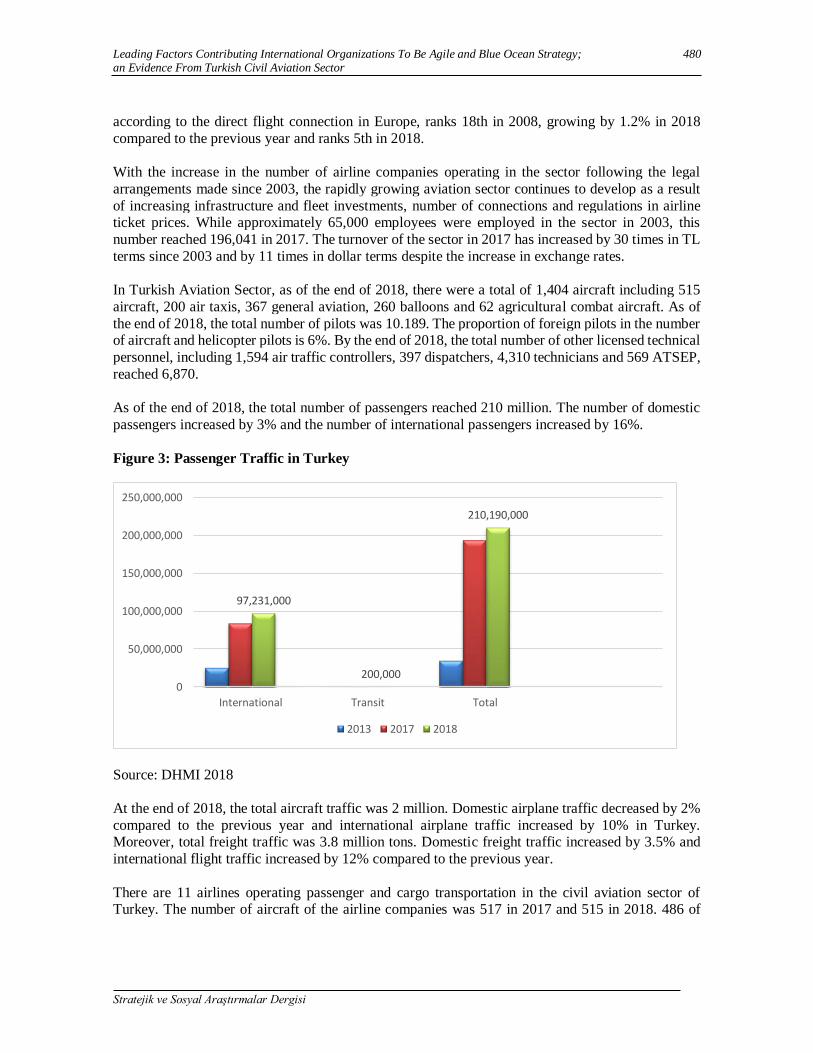
As of the end of 2018, the total number of passengers reached 210 million. The number of domestic
passengers increased by 3% and the number of international passengers increased by 16%.
Figure 3: Passenger Traffic in Turkey
Source: DHMI 2018
At the end of 2018, the total aircraft traffic was 2 million. Domestic airplane traffic decreased by 2%
compared to the previous year and international airplane traffic increased by 10% in Turkey. Moreover, total freight traffic was 3.8 million tons. Domestic freight traffic increased by 3.5% and
international flight traffic increased by 12% compared to the previous year.
There are 11 airlines operating passenger and cargo transportation in the civil aviation sector of Turkey. The number of aircraft of the airline companies was 517 in 2017 and 515 in 2018. 486 of
97,231,000
200,000
210,190,000
0
50,000,000
100,000,000
150,000,000
200,000,000
250,000,000
International Transit Total
2013 2017 2018

481 Filiz MIZRAK & Elif BAYKAL
Stratejik ve Sosyal Araştırmalar Dergisi
these planes are passengers and 29 are cargo planes. The total seat capacity of Turkish airline fleet is
97,351 and the total cargo capacity of cargo aircraft is 2,194,450 kg.
Table 5: Number of Aircraft by Airline in Turkey
Number of Aircraft by Airline 2017 2018 Change %
THY A.O. 304 309 1,6
Pegasus Hava Taşımacılık A.Ş 66 81 22,7
Güneş Ekspres Havacılık A.Ş. 52 46 -11,5
Onur Air Taşımacılık A.Ş 24 27 12,5
Atlasjet Havacılık A.Ş. 24 16 -33,3
Turistik Hava Taşımacılık A.Ş 10 10 0
Hürkuş Hava Yolu Taşımacılık ve
Ticaret A.Ş.
7 7 0
Tailwind Havayolları A.Ş. 5 5 0
MNG Hava Yolları ve Taşımacılık
A.Ş.
7 6 -14,3
ACT Hava Yolları A.Ş 5 5 0
ULS Havayolları Kargo
Taşımacılık A.Ş.
3 3 0
IHY İzmir Hava Yolları A.Ş 7 - -
Borajet Havacılık Taşımacılık Uçak Bakım Onarım Tic. A.Ş.
3 - -
Total 517 515 -0,4
Source: Annual Report 2018, Turkish Civil Aviation
Table 6: Total Seat Capacity
2003 2017 2018 203-2018
Change %
Seat Capacity 27.599 97.500 97.351 253
Source: Annual Report 2018, Turkish Civil Aviation
In 2003, domestic flights were carried out from 2 centers to 26 destinations and as of the end of 2018, 56 destinations were reached from 7 centers. As of the end of 2018, 318 destinations were
reached in 124 countries with 5 airline companies (Annual Report 2018, Turkish Civil Aviation).
Pegasus Airlines
Pegasus which operates in Turkish Civil Aviation sector, is a leading low-cost airline carrier. Pegasus
entered the aviation sector in 1990 with charter flights. With the acquisition of Esas Holding by Pegasus in early 2005, Pegasus has transformed its business model into a low-cost network carrier,
focusing on providing a low-cost, timely launch performance with a young aircraft fleet.
As a result of the successful implementation of the low-cost operating strategy, activities carried out
on both domestic and international lines increased rapidly. Pegasus became the fastest growing airline
in terms of seat capacity among the 25 largest airlines in Europe in 2011, 2012 and 2013 according

Leading Factors Contributing International Organizations To Be Agile and Blue Ocean Strategy; 482 an Evidence From Turkish Civil Aviation Sector
Stratejik ve Sosyal Araştırmalar Dergisi
to the Official Airline Guide (OAG) data. As of the end of 2019, Pegasus aims to become the leading
low-cost airline in its region with a growing, young and modern fleet of 81 aircraft with an average age of 5.7.
Pegasus focuses on offering short and medium-distance, point-to-point and transit high frequency
flights within the scope of its domestic and international flight network, with the main base being located at Istanbul Sabiha Gökçen Airport. As of June 30, 2019, Pegasus offers scheduled flights to
35 destinations in Turkey, 75 destinations to Europe, North Cyprus, the Commonwealth of
Independent States, the Middle East and Africa thus serve a route network covering 110 destinations in 42 countries.
The business model of Pegasus is based on generating revenue from a variety of by-products and
services related to passenger transport, as well as a direct revenue from passenger transport services with efficient operation and effective cost control. As of 30 June 2019, Pegasus' unit cost (CASK)
was € 2.33, while revenues from by-product services amounted to 29% of total revenue. In the first
half of 2019, Pegasus generated 3% of its total revenue from other operations, including low volume charter and split charter services to major tour operators. (Annual Report 2019, Pegasus Airlines)
The Position of Pegasus in the Sector
Pegasus has adopted a business model that makes a difference in Turkish aviation sector. Entering
the aviation sector in 1990 with charter flights, PGS was taken over by Esas Holding in early 2005.
With this change in the shareholder structure, the Company's business model has changed to a low-cost network carrier.
Pegasus continues to strengthen its position in the Turkish aviation sector by demonstrating a growth performance above the market with its low-priced and timely take-off performance focused on high
service delivery strategy. While the years between 2012-2017, the average annual total number of
passengers increased by 8.2% in the market, the total passenger traffic in the said period, Pegasus could increase its total passenger traffic by % 15.4. This led to an increase in the domestic and
international market share of the company. Accordingly, the market share of Pegasus in the domestic
line increased from 26% in 2012 to ~ 31% in 2017, while the international market share increased
from 8% to 12.4%. While not neglecting the impact of the low base on this increase, Pegasus's development is remarkable in the market where THY has a significant competitive advantage as a
flag carrier airline.
With 109 destinations in 42 countries, Pegasus focuses on short and medium distance, point-to-point
and transit high-frequency flights, mainly from its base Sabiha Gökçen Airport (SAW), In addition
to SAW, the company operates scheduled flights from airports in Adana, Ankara, Antalya and İzmir.
In 2018, Pegasus expanded its flight network covering 27 countries and 60 destinations (23 domestic and 37 international). (Annual Report 2018, Pegasus Airlines)

483 Filiz MIZRAK & Elif BAYKAL
Stratejik ve Sosyal Araştırmalar Dergisi
Table:7 Number of Passengers, Pegasus
Number (mn) 2011 2012 2013 2014 2015 2016 2017
Domestic
Passengers 10,9 13,4 16,8 19,7 22,3 24,1
27,8
International
Passengers 5 6,6 8,3 12 13,8 15,3
16,9
Total 3,3 4,3 5,1 6,5 8,5 8,9
10,9
Source: Annual Report 2018, Pegasus
Young fleet structure – Although at the end of 2012, Pegasus had a fleet of 40 aircraft, it could succeed
in increasing the number to 83 as of August 2018, and has become the airline with Turkey's youngest
fleet with average age of 5.6 years. 4 of the planes in Pegasus' fleet are owned by the company and while 38 of them are obtained through financial leasing, 41 of them are obtained through operational
leasing. The Company management aims to balance financial and operational leasing in aircraft
purchases due to both cost factors and market dynamics (Annual Report 2018, Pegasus Airlines).
Pegasus aims to transform its fleet consisting of Boeing type aircraft to Airbus in the coming period
and to complete this transformation by the end of 2024. Accordingly, the company has 78 aircraft
orders for the period 2019-2024, and plans to rent 4 Airbus A320 neo aircraft in the following years.
Strategies of Pegasus Airlines
1. Investments
Conversion to a single aircraft fleet increases operational efficiency- Pegasus has a fleet of 83 aircraft,
49 of which are Boeing and 34 of which are Airbus. The fleet, which consists of two types of aircraft, limits the flexibility of replacement due to differences in seat capacities in aircraft failures, as well as
the cost of pilot, technician and technical maintenance it creates. Due to these constraints, the
company aims to fully transform its fleet into Airbus in the coming period to benefit from a uniform
aircraft economy. Although, it is expected that the conversion to a single type fleet will increase operational efficiency, the most important contribution is expected to be made by A321neo type
aircraft that is included in the fleet as of 2019. While the A321neo type aircraft provides 15-18%
savings in fuel usage, it provides an advantage with its higher seat capacity compared to the other aircraft types in the fleet (A321neo aircraft has 239 seats capacity while A320-200 ceo & neo aircraft
180, B737-800 aircraft) 189 seats) (Annual Report 2018, Pegasus Airlines).
2. Internal Audit Unit
Pegasus internal audit unit was first established in June 2006, and as of September 2010 it was
structured as Internal Audit Directorate. The Internal Audit Directorate is currently operating under the supervision of the Audit Committee. Findings related to internal control and internal audit
activities carried out in the company are communicated to the Audit Committee by the Internal Audit
Director and the opinions and suggestions determined by the Committee are regularly reported to the Board of Directors. In this context, the Audit Committee ensures that all necessary measures are taken
to ensure that internal audit activities are carried out adequately and transparently (Annual Report
2018, Pegasus Airlines).
Leading Factors Contributing International Organizations To Be Agile and Blue Ocean Strategy; 484 an Evidence From Turkish Civil Aviation Sector
Stratejik ve Sosyal Araştırmalar Dergisi
3. Change in Currency Policy
Pegasus can actively manage the uncertainty arising from exchange rate fluctuations. The company
converts international ticket revenues that are sold in US $ but can be collected in TL, Euro and GBP
basis to US $ daily. At the same time, Pegasus receives US $ with up to 25% of the domestic tickets
collected in TL according to the exchange rate position (Annual Report 2018, Pegasus Airlines).
4. Protection strategy (Hedge)
Hedging is the activity of making an opposite transaction (reverse position taking) to minimize or
eliminate the investment risk undertaken in finance. This transaction can be done in two different
positions, long and short. A long position is a contract purchase and protects the buyer against price
increases or interest rate decreases. The short position is a contract selling process and protects the contract seller against price decreases or interest rate.
Pegasus, on the other hand, hedges 60% of the annual balance sheet period in a layered manner to avoid risk. In addition, at the discretion of the Hedge Committee, 20% additional hedging is possible,
and the hedging period is 24 months. (Annual Report 2018, Pegasus Airlines)
3C Management Action Plan
Pegasus has been applying an important set of action plans, unit costs (CASK), cash (Cash) and capacity (Capacity) which are called “3C Management Action Plan” since 2016. Among the most
effective actions; i) revision of the organization; ii) marketing activities; shifting to digital platforms;
iii) switching to TL in many expense items and iv) the strategy of transformation into a single type of fleet. With the support of these applications, there was a significant decrease of 9.3% and 12.5%,
respectively in the company's unit price excluding fuel in € 2017. It is anticipated that the measures
will continue to support the operational profitability by continuing the measures within the scope of
“3C Management Action Plan” in the upcoming period (Annual Report 2018, Pegasus Airlines).
A. CASK
With the strategy of “CASK”, Pegasus aims at keeping the cost called Cost per Available Seat
Kilometer at the lowest level, while trying to push “RASK” (Revenue per available seat kilometer)
to the highest point. In this regard, Pegasus has taken a set of precautions to lower its costs. Cost
reduction activities within the scope of the Management Action Plan were launched in 2016. Turquality Project, Marketing Budget Optimization, Human Resources Employee Number
Optimization in Lean Management, Process and Organization Optimization, Optimization of Fuel
Consumption are the project that have been carried out so far. Below are the significant precautions taken in this context;
Price revision of agreements made with suppliers,
Workforce optimization,
Marketing activities optimization,
Simplification of processes,
Optimization of fuel consumption,
Configuration of revenue management,
485 Filiz MIZRAK & Elif BAYKAL
Stratejik ve Sosyal Araştırmalar Dergisi
B. CASH
Cash flow consists of changes or decreases in the cash position of the entity over a period. For
businesses to maintain their business in a healthy manner, there must be a balance between cash
inflows and outflows. Operational cash flow is generally called working capital. It expresses the cash
flow generated from the main activities within the company and mainly covers cash generated from service and product sales and cash outflows while supplying them. Regularizing the cash flow is one
of the most important points that Pegasus has concentrated, and below are the activities that has
carried so far;
sales of first major engine maintenance aircraft within the scope of fleet rejuvenation,
achieving cash inflow through the sale and lease back method of the simulator and some 737-
800 replacement engines,
advancement of replacement neo engine cash incentive,
dynamic pricing of side revenue.
C. CAPACITY
Considering developments in the airline industry in Turkey, it is observed that an increase in business
in the sector in terms of both quality and quantity. Therefore, many passengers prefer these businesses. Rapid changes in technology are reflected in the performance of these enterprises and
increased customer awareness affected the structure of the markets. Airline companies have been
competing each other to increase their capacity thus, to respond more quickly to market demand conditions. Below are the recent actions, by Pegasus to increase its capacity;
T he opening of SAW fast taxi way in the summer season.
Plane deliveries which have been previously delayed.
1. FINDINGS
After a detailed analysis of history and business operations and strategies of Pegasus Airlines, the
question whether it is an agile company in Civil Aviation Market need to be answered. As mentioned in the literature, to be agile, companies need to take actions in order to minimize their operation cost
and they have to respond to the changes in the environment, while doing this, they also need to be
flexible with their operations without sacrificing quality so as to meet the customer needs.
Especially with “3C Management Action Plan”, Pegasus Airlines improved strategies such as
renewing its agreements with the suppliers, optimizing fuel consumption to minimize the operating
costs. Furthermore, it responded the changing trends well by opening Saw fast taxi way in the summer reason. Pegasus Airlines is flexible enough by changing its currency policy in charging international
flights fares. However, since it started as a low-cost airline carrier, it does not have a business class
segment which means the quality comes just after the cost. Before the private companies started to operate in the market, the prices were rather high that only upper segment could prefer air transport.
Thanks to Pegasus Airlines and other low-cost carrier in the market the need for low-cost air
transportation could be met. Table 8 demonstrates the key factors of agility which have already been proved in literature and discuss if Pegasus has these attributions.

Leading Factors Contributing International Organizations To Be Agile and Blue Ocean Strategy; 486 an Evidence From Turkish Civil Aviation Sector
Stratejik ve Sosyal Araştırmalar Dergisi
Table 8: Key factors of Agility for Pegasus Airlines
In this scope, when we applied to key factors previously mentioned in “Literature Review” part, we
can conclude that except for quality, Pegasus Airlines has all the attributes that prove it to be an agile company.
2. CONCULUSION
Along with globalization, international competition conditions as well as national competition
conditions are changing rapidly. Businesses operate in a dynamic, constantly changing, customer-
affected competitive environment. At the same time, shortening of product life span, increase of product variety and rapid change of technology influence businesses. Changes in customer
expectations force firms to develop new management understandings.
In this study, the aim was to shed light upon the concept of agility with the case study of Pegasus
Airlines. As a result, it is concluded that with its ongoing strategies on cost reduction, responsiveness,
flexibility and meeting customer needs, Pegasus Airlines has been an agile company which also proved its strengths being the fastest growing airline carrier of Turkey and Europe in terms of seat
capacity. However, it is foreseen that Civil Aviation sector will turn into red ocean in the upcoming
years, which means that to be able to make more sales, or even to take over the market, the companies
should make other campaigns by creating opportunities or by producing more quality products and selling them at a more affordable price. It is implied that firms lose blood in this process and therefore
the ocean turns red. When the competition starts to become that much fierce, Pegasus should find
ways to increase its sales and its profit.
In this regard, Pegasus needs to find blue oceans which are defined as the unopened market area,
demand creation and high profitable growth opportunity. The aim is to make competition meaningless, to break the value-cost exchange. Many of the blue oceans are created from red oceans
by expanding the boundaries of existing industries. The blue oceans are irrelevant to competition,
because the rules of the game are waiting to be determined.
For an organization like Pegasus which operates in highly competitive aviation sector, blue oceans
can be opening new destinations with which the origin country has strong relations in terms of trade,
tourism, education. Furthermore, it can be getting into cargo business which means investing in cargo aircrafts after a detailed research into potential destinations where Turkey mostly export to or import
from.
As in every study, this study has also some limitations. The most important one is the limitation on the source of the case study. In order to get information about organizational structure and strategies
of Pegasus, only the annual reports that the company has published were utilized. For future studies,
the method of interview could be applied to benefiting from the knowledge of specialist from different departments. The results can be analyzed with empirical methods.
Cost x
Responsiveness x
Flexibility x
Quality
Customer needs x
487 Filiz MIZRAK & Elif BAYKAL
Stratejik ve Sosyal Araştırmalar Dergisi
Kaynakça
Ahmad, R. (2010). AirAsia. Asian Journal of Management Cases, 7(1), 7-31.
Ahmat, N. C., Abas, R., Ahmad-Ridzuan, A. H., Radzi, S. M., & Zahari, M. S. M. (2014). Blue Ocean
strategies in hotel industry. Theory and Practice in Hospitality and Tourism Research, 43.
Ashrafi, N., Xu, P., Sathasivam, M., Kuilboer, J. P., Koelher, W., Heimann, D., & Waage, F. (2005,
July). A framework for implementing business agility through knowledge management systems. In E-Commerce Technology Workshops, 2005. Seventh IEEE International
Conference on (pp. 116-121). IEEE.
Brannen, M. Y., & Doz, Y. L. (2012). Corporate languages and strategic agility: trapped in your jargon or lost in translation? California Management Review, 54(3), 77-97.
Braunscheidel, M. J., & Suresh, N. C. (2009). The organizational antecedents of a firm’s supply chain agility for risk mitigation and response. Journal of operations Management, 27(2), 119-140.
Butler, C. (2008). Planning with blue ocean strategy in the United Arab Emirates. Strategic
Change, 17(5‐6), 169-178.
Chang, S. C. (2010). Bandit cellphones: A blue ocean strategy. Technology in society, 32(3), 219-
223.
Doğan, O., & Baloğlu, N. (2018). ÖRGÜTSEL ÇEVİKLİK VE BAZI EĞİTİM
KURUMLARINDAKİ YANSIMALARI. In 13. ULUSLARARASI EĞİTİM YÖNETİMİ KONGRESİ THE 13 TH INTERNATIONAL CONGRESS ON EDUCATIONAL
ADMINISTRATION (p. 100).
Dove, R. (1999). Knowledge management, response ability, and the agile enterprise. Journal of knowledge management, 3(1), 18-35.
Dvorak, J., & Razova, I. (2018). Empirical Validation of Blue Ocean Strategy Sustainability in an International Environment. Foundations of Management, 10(1), 143-162.
Gündüz, Ş. (2018). Preventing blue ocean from turning into red ocean: A case study of a room escape
game. Journal of Human Sciences, 15(1), 1-7.
Gündüz, Ş. (2018). Yükseköğretimde Mavi Okyanuslar. Üniversite Araştırmaları Dergisi, 1(3), 116-
120.
Hormozi, A. M. (2001). Agile manufacturing: the next logical step. Benchmarking: An International
Journal, 8(2), 132-143.
Iqbal, Q., & Hassan, S. H. (2018). Green management matters: green human resource management as blue ocean strategy. Firms’ Strategic Decisions: Theoretical and Empirical Findings, 3, 214.

Leading Factors Contributing International Organizations To Be Agile and Blue Ocean Strategy; 488 an Evidence From Turkish Civil Aviation Sector
Stratejik ve Sosyal Araştırmalar Dergisi
Işcan, Ö. F., & Karabey, A. G. C. N. (2006). Bilgi Teknolojilerinin Benimsenmesi İle Örgütsel Atiklik
Arasındaki İlişki Üzerine Bir Araştırma. Erciyes Üniversitesi İktisadi ve İdari Bilimler Fakültesi Dergisi, (26).
Kawa, A., & Maryniak, A. (2018). Lean and agile supply chains of e-commerce in terms of customer
value creation. In Modern approaches for intelligent information and database systems (pp. 317-327). Springer, Cham.
Khan, H., & Wisner, J. D. (2019). Supply Chain Integration, Learning, and Agility: Effects on Performance. Journal of Operations and Supply Chain Management, 12(1), 14.
Kim, C., Yang, K. H., & Kim, J. (2008). A strategy for third-party logistics systems: A case analysis
using the blue ocean strategy. Omega, 36(4), 522-534.
Kim, T. Y., Oh, H., & Swaminathan, A. (2006). Framing interorganizational network change: A
network inertia perspective. Academy of management review, 31(3), 704-720
Kim, W. C., & Mauborgne, R. (2004). Blue ocean strategy. If you read nothing else on strategy, read
thesebest-selling articles., 71.
Lin, C. T., Chiu, H., & Chu, P. Y. (2006). Agility index in the supply chain. International Journal of
Production Economics, 100(2), 285-299.
Lindič, J., Bavdaž, M., & Kovačič, H. (2012). Higher growth through the Blue Ocean Strategy:
Implications for economic policy. Research policy, 41(5), 928-938.
Lohtander, M., Aholainen, A., Volotinen, J., Peltokoski, M., & Ratava, J. (2017). Location
independent manufacturing–Case-based blue ocean strategy. Procedia Manufacturing, 11,
2034-2041.
Lou, A. M., & Rezaeenour, J. (2016). The Impact of Knowledge Management Processes on Agile
Supply Chain (Case study: Iran Khodro Foundry Co.).
Mathiyakalan, S., Ashrafi, N., Zhang, W., Waage, F., Kuilboer, J. P., & Heimann, D. (2005, May).
Defining business agility: an exploratory study. In Proceedings of the 16th Information Resources Management Conference, San Diego, CA (pp. 15-18).
Mehdibeigi, N., Dehghani, M., & mohammad Yaghoubi, N. (2016). Customer knowledge management and organization's effectiveness: explaining the mediator role of organizational
agility. Procedia-Social and Behavioral Sciences, 230, 94-103.
Menor, L. J., Roth, A. V., & Mason, C. H. (2001). Agility in retail banking: a numerical taxonomy
of strategic service groups. Manufacturing & Service Operations Management, 3(4), 273-292.
Nagel, R. N., & Bhargava, P. (1994). Agility: the ultimate requirement for world‐class manufacturing performance. National Productivity Review, 13(3), 331-340.
489 Filiz MIZRAK & Elif BAYKAL
Stratejik ve Sosyal Araştırmalar Dergisi
Orlov, A. K., & Chubarkina, I. Y. (2017). Blue ocean strategy application in the course of planning
and implementation of construction projects in the area of SMART housing and social infrastructure. In MATEC Web of Conferences (Vol. 106, p. 08015). EDP Sciences.
Rigby, D. K., Sutherland, J., & Takeuchi, H. (2016). Embracing agile. Harvard Business Review,
94(5), 40-50.
Sambamurthy, V., Bharadwaj, A., & Grover, V. (2003). Shaping agility through digital options:
Reconceptualizing the role of information technology in contemporary firms. MIS quarterly, 237-263.
Sekman M, Utku A. Çevik şirketler: Kurumsal ataleti yenmek. 6. Baskı. Alfa yayınları, İstanbul,
Türkiye;2009.
Sharifi, H., & Zhang, Z. (1999). A methodology for achieving agility in manufacturing organisations:
An introduction. International journal of production economics, 62(1-2), 7-22.
Sherehiy, B., Karwowski, W., & Layer, J. K. (2007). A review of enterprise agility: Concepts, frameworks, and attributes. International Journal of industrial ergonomics, 37(5), 445-460.
Siddique, A., & Shukla, A. (2016). An Analytical Study of Red Ocean and Blue Ocean Strategy with Special Reference to Indian Premier League Twenty-20 Cricket. Available at SSRN 2772558.
Slocum, P. C., & Papa, F. (2014). Envisioning a global role for osteopathic medicine in the 21st
century: Using Blue Ocean Strategy to promote osteopathic health care as the World's leader
in healthcare education and do it more efficiently, effectively and at the lowest cost.
International Journal of Osteopathic Medicine, 17(1), 38-42.
Sundaram, R. M. (2007). Blue ocean strategy?: has it really enhanced performance or is it just hype?,
a study of firms of the Indian airline industry.
Gündüz, Ş. (2018). Yükseköğretimde Mavi Okyanuslar. Üniversite Araştırmaları Dergisi, 1(3), 116-
120.
Ter Wengel, J., Villegas, G. B. F., Hernández, G. P., & Cruz, L. M. S. (2010). Schumpeter and the
Blue Ocean Strategy. Revista de la Maestría en Derecho Económico, (6), 53-85.
Upton, D. M. (1994). The management of manufacturing flexibility. California management
review, 36(2), 72-89.
Vagnoni, E., & Khoddami, S. (2016). Designing competitivity activity model through the strategic
agility approach in a turbulent environment. foresight, 18(6), 625-648.
Welch, S. J., and Edmondson, B., (2012). Commentary: Applying blue ocean strategy to the
foundation of accountable care. American Journal of Medical Quality 27: 256–57

Leading Factors Contributing International Organizations To Be Agile and Blue Ocean Strategy; 490 an Evidence From Turkish Civil Aviation Sector
Stratejik ve Sosyal Araştırmalar Dergisi
Yap, J. and Chua, K. (2018), "Application of e-booking system in enhancing Malaysian property
developers’ competitive advantage", Property Management, Vol. 36 No. 1, pp. 86-102.
Yardley, J. (2015). Swimming in the blue ocean versus riding the choppy waves of the red
ocean. Journal of Aesthetic Nursing, 4(7), 354-355.
Yusuf, Y. Y., Sarhadi, M., & Gunasekaran, A. (1999). Agile manufacturing:: The drivers, concepts
and attributes. International Journal of production economics, 62(1-2), 33-43.
Uğurlu, Ö. Y., Çolakoğlu, E., & Öztosun, E. (2019). Stratejik Çevikliğin Firma Performansına Etkisi:
Üretim İşletmelerinde Bir Araştırma. İş ve İnsan Dergisi, 6(1), 93-106.
Upton, D. M. (1994). The management of manufacturing flexibility. California management review, 36(2), 72-89.
http://web.shgm.gov.tr/documents/sivilhavacilik/files/pdf/kurumsal/faaliyet/2018.pdf
https://www.icao.int/annual-report-2018/Pages/default.aspx
http://www.pegasusyatirimciiliskileri.com/medium/image/2-ceyrek-faaliyet-raporu_890/view.aspx
http://www.pegasusyatirimciiliskileri.com/medium/image/2-ceyrek-yatirimci-
sunumu_891/view.aspx
http://www.pegasusyatirimciiliskileri.com/medium/image/2018-4-ceyrek-faaliyet-
raporu_834/view.aspx