Leading the way - HKEXnews
173
Annual Report and Accounts 2007 Leading the way in Asia, Africa and the Middle East
-
Upload
khangminh22 -
Category
Documents
-
view
0 -
download
0
Transcript of Leading the way - HKEXnews

Annual Report and Accounts 2007
Leadingthe way
inAsia, Africa andtheMiddle East

Standard Chartered aims to be the world’s bestinternational bank. With 70,000 people employedin more than 50 countries, we are well positionedto achieve growth from opportunities in some ofthe world’s most exciting and diverse markets.We are leading the way through our:
• Growth Markets• Innovative Products and Services• Talented and Diverse Teams• Sustainable Business Strategy
Leading the way
For more information visit:www.standardchartered.com
What we stand for
Strategic Intent
Leading by Example to be The Right Partner
ParticipationFocusing on attractive, growing
markets where we can leverage ourrelationships and expertise
CustomersPassionate about ourcustomers’ success,
delighting them with thequality of our service
Our PeopleHelping our people to
grow, enabling individualsto make a difference and
teams to win
CommunitiesTrusted and caring,dedicated to making
a difference
InvestorsA distinctive investmentdelivering outstandingperformance andsuperior returns
RegulatorsExemplary governanceand ethics wherever
we are
Competitive PositioningCombining global capability,
deep local knowledge and creativityto outperform our competitors
Management DisciplineContinuously improving the way we work,balancing the pursuit of growth with firm
control of costs and risk
ResponsiveTrustworthy Creative CourageousInternational
Brand Promise
Values
Approach
Commitment to Stakeholders
To be the world’s best international bankLeading the way in Asia, Africa and the Middle East
© Standard Chartered PLC. All rights reserved. The STANDARD CHARTERED word mark, its logo device and associated product brand names are owned byStandard Chartered PLC and centrally licensed to its operating entities. Registered Office: 1 Aldermanbury Square, London EC2V 7SB. Telephone +44 (0) 20 7280 7500.Principal place of business in Hong Kong: 32nd Floor, 4-4A Des Voeux Road, Central, Hong Kong. Registered in England No. 966425. Stock Code: 2888.

At the core of global trade flowsOur International Footprint
Standard Chartered is well positioned to capitalise on the growinginternational trade flows as a result of our broad geographicalfootprint, the depth of our customer relationships, delivery of ourproduct capabilities and the expertise of our people. The Groupis investing in dynamic markets and benefiting from the shift ineconomic power from West to East.
For more information visit:www.standardchartered.com
Our OfficesStandard Chartered isheadquartered in Londonwhere it is regulated by theUK’s Financial ServicesAuthority. The Group’s headoffice provides guidance ongovernance and regulatorystandards. Our WholesaleBanking team in Londonplays a key role in servingcorporate clients and financialinstitutions doing businessin our markets.
• China is likely to remainthe top source of foreigndirect investment
• Africa-China tradeup over 10 fold inless than a decadeto $73bn in 2007
• Over 5,500 employees in over 140branches spread across 13 countriesin Sub-Saharan Africa
• Local subsidiaries listed on the stockexchanges of Botswana, Kenya, Ghana,Zambia and Uganda
• Over 100 years in the Americas, withover 500 employees
• $144bn cleared daily, making StandardChartered the 8th largest US dollarclearing house in the US
• Standard Chartered handles 30% ofChile’s Letter of Credit business with Asia
Regional facts Standard Chartered facts Trade flows
• Over 3,000 employees in 39 branches
• Long banking history – 50 years in the UAE;86 years in Bahrain
• Appointed as the official clearing bank for theDubai International Financial Exchange
• First bank to create a world-class businesshub in Dubai International Financial Centre
• Current account and budgetsurpluses over 20% of GDPsince 2004
• $800bn investment expected ininfrastructure over the next five years
• Economic growth at an averageof 7% p.a.
AsiaAfghanistanAustraliaBangladeshBruneiCambodiaChinaHong KongIndiaIndonesiaJapanLaosMacauMalaysiaMauritius
NepalPakistanPhilippinesSingaporeSouth KoreaSri LankaTaiwanThailandVietnam
TheMiddle EastBahrainJordanLebanonOmanQatarUAE
AfricaBotswanaCameroonCote d'IvoireGhanaKenyaNigeriaSierra LeoneSouth AfricaTanzaniaThe GambiaUgandaZambiaZimbabwe
EuropeIrelandJerseySwitzerlandTurkeyUK
The AmericasArgentinaBahamasBrazilCanadaColombiaFalkland Is.MexicoPeruUSVenezuela
* According to latest official data.
• North East Asia’s exports toChina increased 16% in 2007,vs. no growth in exports to the US
• Total trade between ASEAN andChina was $202bn in 2007, up26% from 2006. ASEAN-Indiatrade rose 44% to $30bn in 2007
• $500bn investment expectedin infrastructure in India over thenext five years, with the economygrowing at around 8% p.a.
• 150 years in Asia – firstbranches opened in Calcutta,Shanghai and Mumbai in 1858,followed by branches in HongKong and Singapore in 1859
• Over 80% of total Group staffwork in Asia
• Largest international bankin India & Pakistan
• Locally incorporated inChina in 2007
• Over 80% of Group’s profitsgenerated from Asia
• Latin America’s exports increasedby 12% to $661bn in 2007
• Latin America’s exports to Asiaincreased by 24% to $62bn in 2006*and are up 51% since 2004
• China & South Korea are amongthe top five trading partners for mostcountries in Latin America

Contents
2 2007 Highlights4 Group Overview: Our Business6 Group Overview: Performance by Geography8 Chairman’s Statement10 Group Chief Executive’s Review16 Key Performance Indicators18 Business Review: Performance26 Business Review: People30 Business Review: Sustainability
Financial and Risk Review34 Financial Review43 Risk Review60 Capital
Business Review
Corporate Governance
Financial Statements and Notes to the Accounts
62 Board of Directors64 Senior Management65 Report of the Directors68 Corporate Governance73 Directors’ Remuneration Report86 Statement of Directors’ Responsibilities
87 Independent Auditor’s Report88 Consolidated Income Statement89 Consolidated Balance Sheet90 Statement of Recognised Income and Expense91 Cash Flow Statement92 Company Balance Sheet93 Notes to the Accounts160 Supplementary Financial Information
Supplementary Information165 Shareholder Information167 Index168 Major Awards 2007
Get More On LinePlease visit us on line atwww.standardchartered.com formore information on the Group andits full range of banking services.Sign up to receive our latest pressreleases to stay up to date with allour latest news.
Environment-friendly ReportThis report is printed on recycledpaper by a CarbonNeutral® printer.As part of our ongoing policy toreduce our environmental impactwe encourage all interested partiesto review our on-line Annual Report athttp://investors.standardchartered.com
Our Sustainability ReviewWe take a long-term view of theconsequences of our actions andhave identified seven pillars tobuild a sustainable business.These are outlined in ourSustainability Review 2007. This isavailable in HTML and for downloadat www.standardchartered.com/sustainability

2 Standard Chartered Annual Report and Accounts 2007
2007 Highlights
A year of growth and
• Record earnings: Operating income exceeded $11 billion and profit beforetax surpassed $4 billion, both for the first time
• Broad-based growth: Headline income grew 28 per cent, with organicincome growth accelerating to 23 per cent, a record high
• EPS growth: Normalised earnings per share increased 15.8 per centto 197.6 cents
• Strong markets: For the first time, profit before tax surpassed $1 billionfrom Hong Kong and $500 million each from India and the MESA region
• Strong balance sheet: The Group’s liquidity and capital positions remaincomfortably above targets, despite market turbulence
• Private banking: Launched The Standard Chartered Private Bank,with offices now spread across 11 locations in seven markets
• Acquisition of American Express Bank to give a further boost to thePrivate Bank and Transaction Banking
• Islamic Banking: Launched Saadiq, our global Islamic Banking brand,in the UAE, Malaysia, Pakistan and Bangladesh
• China: Incorporated in China and launched local renminbi banking services
• Sustainable business strategy: Committed $8 –10 billion over the nextfive years to finance renewable and clean energy projects
Operational highlights
The Group achieved record income and profit in 2007, reflectingthe resilience of our businesses amidst the financial market turmoil.Our strong balance sheet and healthy liquidity profile has putus in a strong position to seize the business opportunities thatare unfolding in the financial services industry.
For more information visit:www.standardchartered.com

0706050403
120 147 *
215
266
329
0706050403
4,74
0
5,27
4 *6,86
1 8,62
0
11,067
1,55
0 2,25
1 * 2,68
1 3,17
8
4,03
5
0706050403 0706050403
52.00
57.50 * 64.00 71.04 79.35
3
Bus
ines
sRev
iew
strong performance
Five-year review
Total assets($bn)
Operating income($m)
Dividend pershare (cents)
Profit beforetaxation ($m)
Normalised earnings per share
197.6cents2006: 170.7 cents2005: 153.7 cents
Normalised return on equity
15.6%2006: 16.9%2005: 18.0%
Dividend per share
79.35cents2006: 71.04 cents2005: 64.00 cents
Employees
70,0002006: 59,0002005: 44,000
Countries and territories
572006: 562005: 56
Nationalities
1152006: 1052005: 89
Operating income
$11,067m2006: $8,620m2005: $6,861m
Profit before taxation
$4,035m2006: $3,178m2005: $2,681m
Total assets
$329bn2006: $266bn2005: $215bn
Financial highlights
Non-financial highlights
Throughout this document, unless another currency is specified, the word ‘dollar’ or symbol ‘$’ means United States dollarand the word ‘cents’ or symbol ‘c’ means one-hundredth of one United States dollar.
* Figures for 2004 have been restated under IFRS, excluding IAS32 and IAS39.
For more information on our Key Performance Indicators, please turn to pages 16 and 17.
www.standardchartered.com

4 Standard Chartered Annual Report and Accounts 2007
Group Overview: Our Business
ConsumerBankingWe delivered strong performance across the business and integratedrecent acquisitions. We further consolidated our presence in key marketsthrough significant investments in strengthening distribution, deepeningproduct capability and launching our Private Bank.
• Launched The Standard Chartered PrivateBank, with offices now spread across 11locations in seven markets; we have hadsignificant success in building a strong newteam and attracting new clients and assets
• Locally incorporated in China enabling us toserve our customers in local currency; nowrepresented in 13 cities across the nationthrough 38 outlets
• Launched Consumer Transaction Bankingto deepen capability in serving customers’transaction needs through all channels,including the internet and mobile phones
• Agreed to acquire a stake in UTI Securitiesin India, adding on-line and off-line brokeragecapabilities and 39 outlets
• Continued strong growth in WealthManagement driven by product innovationand deeper customer penetration
• Invested significantly in SME Banking acrossour franchise yielding strong income growthacross major markets and product areas
• Continued to drive product innovation;launched over 1,500 global product initiativesacross Wealth Management, SME Bankingand other product areas
• Conducted over 150 Rapid ImprovementEvents to improve cycle times, accuracyand costs of key processes
2007 highlights and achievements
DescriptionConsumer Banking provides innovative financial products and services to over 14 millioncustomers, including individuals and small and medium enterprises (‘SME’), in Asia, Africaand the Middle East. We also launched The Standard Chartered Private Bank to serve thegrowing demand for more specialised products and services tailored for high net worthindividuals in our markets. We are focused on continuously improving the benefits andexperience of our customers.
• Enhance the overall experience we provideto our customers
• Continue to innovate in products and servicesacross our markets
• Further develop and leverage our networkof branches and ATMs
• Strengthen our internet and mobilebanking capabilities
• Continue progress on the integration ofour acquisitions
• Simplify processes and provide support toolsto improve the effectiveness and experienceof our frontline staff
• Improve productivity levels acrossthe organisation
Priorities
‘‘Breadth and balance of businessesacross fast-growing and attractive marketsdrove income and profit growth.’’Mike DeNoma, Group Executive Director, Consumer Banking
Operating income
$5,806m2006: $4,684m2005: $3,802m
Profit before taxation
$1,677m2006: $1,322m2005: $1,273m
Operating income by region (%)
Hong Kong – 20%
Other Asia Pacific – 20%
Korea – 20%
Middle East and Other South Asia – 13%
Singapore – 8%
India – 7%
Malaysia – 5%
Africa – 5%
Americas, United Kingdom and Europe – 2%
For more information visit:www.standardchartered.com
Balancedgrowthacross

www.standardchartered.com 5
Bus
ines
sRev
iew
WholesaleBankingWe reported record income for the year as a result of organic growthand acquisitions that added critical capabilities in key strategic businessareas and broadened our geographical coverage. We expanded intonew markets and delivered more sophisticated products and solutionsto meet client demand.
• Exceptional year with very strong financialperformance across the board, reflectingcontinued success of our client-led incomegrowth strategy
• Our core markets showed resilience amidstthe market turmoil
• Investments were focused on our big enginesof growth such as Hong Kong, India andSingapore, among other markets
• Continued to deliver on our acquisitionsin Korea, Taiwan, Indonesia and Pakistan
• Significantly strengthened our presencein the UAE to further support growingclient demand in the region
• Invested in building our Equity Derivatives,Commodity Derivatives and Convertiblesbusinesses and accelerated Principal Finance
• The acquisition of Pembroke, HarrisonLovegrove and A Brain added strategiccapabilities to our business. AmericanExpress Bank and UTI Securities acquisitionswill further expand our strategic capabilities
• Launched Straight2Bank – our e-bankingplatform
• Established Wholesale Banking SustainableBusiness Council to commercialiseenvironmental opportunities
2007 highlights and achievements
DescriptionWholesale Banking provides a wide range of solutions to help corporate and institutionalclients facilitate trade and finance across some of the fastest growing markets and tradecorridors in today’s global economy. Our focus is on building a client-driven business,being the leading international bank of choice in Asia, Africa and the Middle East andleveraging our in-depth local knowledge and extensive cross-border network.
• Continue to build scale in our core businesses
• Continue to strengthen and deepen ourclient relationships
• Increase focus on our Local Corporatesand Financial Institutions businesses
• Expand our product sophistication andprovide increasingly strategic and value-added capabilities to clients
• Increase geographical coverage – particularlyfocusing on our eight key markets
Priorities
‘‘We have delivered strong resultswith growth across all product streams,geographies and client sectors.’’Mike Rees, Chief Executive, Wholesale Banking
Operating income
$5,243m2006: $3,923m2005: $3,059m
Profit before taxation
$2,347m2006: $1,849m2005: $1,444m
Operating income by region (%)
Other Asia Pacific – 18%
Hong Kong – 17%
India – 17%
Middle East and Other South Asia – 13%
Africa – 9%
Singapore – 8%
Korea – 8%
Americas, United Kingdom and Europe – 7%
Malaysia – 3%
For more information visit: http://wholesalebanking.standardchartered.com
our businesses

6 Standard Chartered Annual Report and Accounts 2007
Group Overview: Performance by Geography
Strong growth acrossThe Group’s strong results in 2007 were a product of excellentperformances in our biggest markets such as Hong Kong, India andSingapore as well as in our emerging markets such as China and Nigeria.Our business surpassed new milestones on the back of strong economicgrowth and rising demand for banking and financial services.
Employees
2,1352006: 1,9552005: 1,804
Employees
8,9832006: 7,1862005: 4,240
Employees
5,5862006: 5,0702005: 4,893
AfricaOur franchise in Africa benefited from theregion’s strong economic growth. Incomeand profit increased across the region onthe back of a boom in commodity pricesand Africa’s growing trade links with Asia.In 2007, Nigeria and Botswana eachcontributed more than $100 million inincome to the Group for the first time.In Nigeria, we doubled the number ofbranches to 12 in 2007, increased thenumber of employees to about 350 andnow offer services as diverse as i-Bankingand Corporate Finance.
Operating income
$795m +24%2006: $640m2005: $553m
Americas, UKand EuropeStandard Chartered is headquarteredin London where it is regulated by theFinancial Services Authority. The Group’shead office provides guidance ongovernance and regulatory standards. OurWholesale Banking team in London playsa key role in serving corporate and financialinstitutional clients doing business in ourmarkets. The acquisition of Pembroke andHarrison Lovegrove and that of AmericanExpress Bank, once completed, will addspecialist capabilities to the Group andhelp expand our Private Bank networkand Transaction Banking capabilities.
Operating income
$452m -22%2006: $579m2005: $556m
Middle East andOther South Asia(MESA)Our business across MESA performedstrongly on the back of growth in WealthManagement and SME Banking business.The region is benefiting from high oil prices,large trade surpluses, increased incomefrom tourism and heavy investments inconstruction and infrastructure building.In Pakistan, as in the Middle East, weleveraged our Islamic Banking platformto win 10 out of a total 18 mandatesfor issuing Islamic Sukuk.
Operating income
$1,428m +33%2006: $1,070m2005: $812m
For more information visit:www.standardchartered.com

www.standardchartered.com 7
Bus
ines
sRev
iew
our regionsEmployees
52,9082006: 44,9942005: 32,962
AsiaHong KongHong Kong reinforced its position asStandard Chartered’s biggest market bybecoming the first to report profit beforetax of more than $1 billion. It made moreprofit in 2007 than the entire Group madein 2001. Consumer Banking in Hong Kong,the Group’s biggest single source ofincome, achieved double-digit incomegrowth for the first time in seven years onrising revenues from Wealth Managementand SME businesses. Wholesale Bankingsaw broad-based contribution from acrossclient groups and products.
Operating income
$2,068m +28%2006: $1,615m2005: $1,484m
KoreaSC First Bank benefited from strong growthin Wealth Management and SME Bankingincome. Excluding one-off charges, bothWholesale Banking and Consumer Bankingreported double-digit profit growth.
During the year, the Group recruitedmore relationship managers, opened newbranches and upgraded ATMs. We had364 outlets and 6,000 employees in Koreaat the end of 2007.
Operating income
$1,564m +3%2006: $1,522m2005: $957m
SingaporeSingapore had another record year ofprofits. Deposits grew strongly as aresult of our successful and innovativee$aver and Business$aver campaigns.The Standard Chartered Private Bankadded clients and assets since its launch inMay. Wholesale Banking profits got a boostfrom loan syndications, structured financetransactions, private equity gains andhigher revenues from foreign exchangeand interest rate derivative sales.
Operating income
$892m +43%2006: $622m2005: $514m
MalaysiaIn Malaysia, Standard Chartered investedin a new flagship branch and seven SMEcentres during the year. Our ConsumerBanking business benefited from highercredit card balances and personal lending.Wholesale Banking income was boostedby higher fees from syndications, debtfinancing and corporate advisory,besides higher income from custodyand securities services.
Operating income
$459m +24%2006: $371m2005: $335m
Other Asia PacificStandard Chartered continued withits organic-led growth strategy in othermarkets in Asia Pacific. In China, we wereone of the first four international banks tolocally incorporate their operations. Duringthe year, we started renminbi business inthe country, doubled the number of staffand increased the number of outlets to 38.In Taiwan, we have made good progresssince the amalgamation with HsinchuInternational Bank in June.
Operating income
$2,101m +52%2006: $1,384m2005: $1,057m
IndiaStandard Chartered earned more profit inIndia in 2007 than in the previous two yearscombined. Already the largest internationalbank in the country, in terms of our branchnetwork, we added two more branches totake the network to 83 across 33 cities. Weparticipated in several high-profile cross-border acquisitions, advising and fundingboth Indian and foreign multinationals. Wealso agreed to acquire a strategic stake inUTI Securities, a securities brokerage.
Operating income
$1,308m +60%2006: $817m2005: $593m
Within this document the Hong Kong Special Administrative Region of the People’s Republic of China is referred to as ‘Hong Kong’;The Republic of Korea is referred to as Korea or South Korea; ‘Middle East and Other South Asia’ (‘MESA’) includes: Pakistan,United Arab Emirates (‘UAE’), Bahrain, Jordan and Bangladesh; and ‘Other Asia Pacific’ includes: China, Indonesia, Thailand,Taiwan and the Philippines.
8 Standard Chartered Annual Report and Accounts 2007
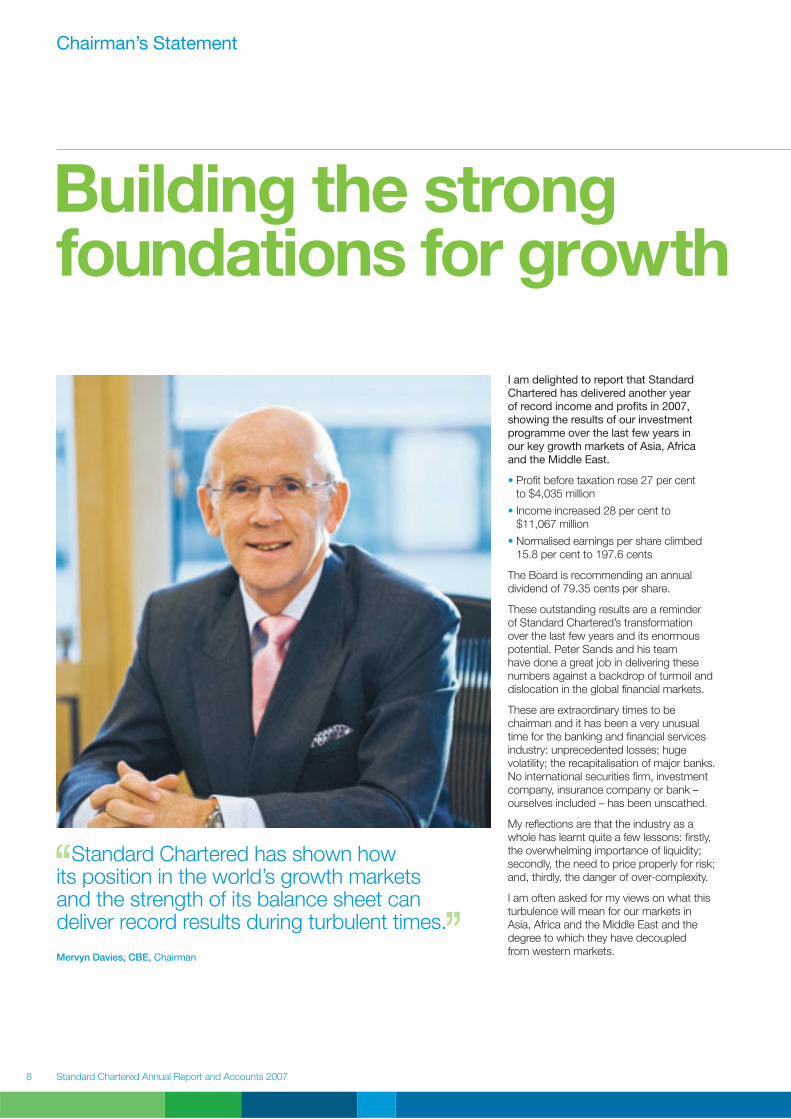
I am delighted to report that StandardChartered has delivered another yearof record income and profits in 2007,showing the results of our investmentprogramme over the last few years inour key growth markets of Asia, Africaand the Middle East.
• Profit before taxation rose 27 per centto $4,035 million
• Income increased 28 per cent to$11,067 million
• Normalised earnings per share climbed15.8 per cent to 197.6 cents
The Board is recommending an annualdividend of 79.35 cents per share.
These outstanding results are a reminderof Standard Chartered’s transformationover the last few years and its enormouspotential. Peter Sands and his teamhave done a great job in delivering thesenumbers against a backdrop of turmoil anddislocation in the global financial markets.
These are extraordinary times to bechairman and it has been a very unusualtime for the banking and financial servicesindustry: unprecedented losses; hugevolatility; the recapitalisation of major banks.No international securities firm, investmentcompany, insurance company or bank –ourselves included – has been unscathed.
My reflections are that the industry as awhole has learnt quite a few lessons: firstly,the overwhelming importance of liquidity;secondly, the need to price properly for risk;and, thirdly, the danger of over-complexity.
I am often asked for my views on what thisturbulence will mean for our markets inAsia, Africa and the Middle East and thedegree to which they have decoupledfrom western markets.
Standard Chartered has shown howits position in the world’s growth marketsand the strength of its balance sheet candeliver record results during turbulent times.
Mervyn Davies, CBE, Chairman
Chairman’s Statement
Building the strongfoundations for growth
www.standardchartered.com 9
Bus
ines
sRev
iew
The global economyWhat is clear is that the US economyis now facing a period of weaker growth.While there is some evidence of decouplingacross our markets, a US slowdown willimpact the rest of the world, dampen globalgrowth, slow the pace of trade and willtake the heat out of commodity markets.
If we look back at the last US slowdownin 2001, the export-oriented economiesof Asia such as Hong Kong, Singaporeand Malaysia were significantly impacted.Although growth rates in Asia will slow thistime, the region now enjoys a degree ofinsulation and resilience due to strongerdomestic demand, economic resurgencein China, growing trade links within Asiaand strong policy response fromgovernments and authorities.
It is easy to focus on China as the growthengine but we should not underestimatethe diversification of the ASEAN economies,the catch-up potential of India, huge wealthcreation in the Middle East and theinfrastructure boom across the regions.The emergence of sovereign wealth fundsin Asia and the Middle East is emblematicof the shift in wealth that is underway.
So while we forecast GDP growth rateswill soften slightly in these markets in 2008,these economies will remain robust andtheir growth will be significantly higher thanthose expected in the US and eurozone.
Standard Chartered today is extraordinarilywell positioned to seize these new realitiesthanks to its growing geographical reach,scale and the breadth of its products andcapabilities developed in recent years.
We have a loyal and supportive shareholderbase and, in my view, an exceptionalmanagement. In August, we welcomedJohn Peace to the board as deputychairman and senior independent directorand Sunil Bharti Mittal as an independentnon-executive director. We also welcomedGareth Bullock to the board as groupexecutive director in August.
In September, Kai Nargolwala steppeddown from the board after eight years.We would like to thank him for hissignificant contribution to the Group’ssuccess. We are also very grateful toSir CK Chow, who will retire from theboard this year after 10 years of dedicatedservice as a non-executive director.
In my last report to you I was cautiousabout the outlook, but I did not anticipatesuch extremes as we have seen since then.In the past six months we have witnessedbig upheavals in our sector.
At Standard Chartered, we know thatcomplacency kills. We are operating in aperiod of sustained uncertainty. We havelearnt lessons in recent months and we areconstantly reminded of the importance ofpreserving our liquidity and capital strength.
SummaryBanking remains a risk-based industry andwe will remain prudent in our managementand pricing of risk. At the same time, weare well placed to take advantage of theopportunities that will undoubtedly arise.
Standard Chartered has shown how itsposition in the world’s growth marketsand the strength of its balance sheet candeliver record results during turbulent times.We are not complacent about the futurebut are confident that we will deliveranother strong performance in 2008.
Mervyn Davies, CBEChairman26 February 2008
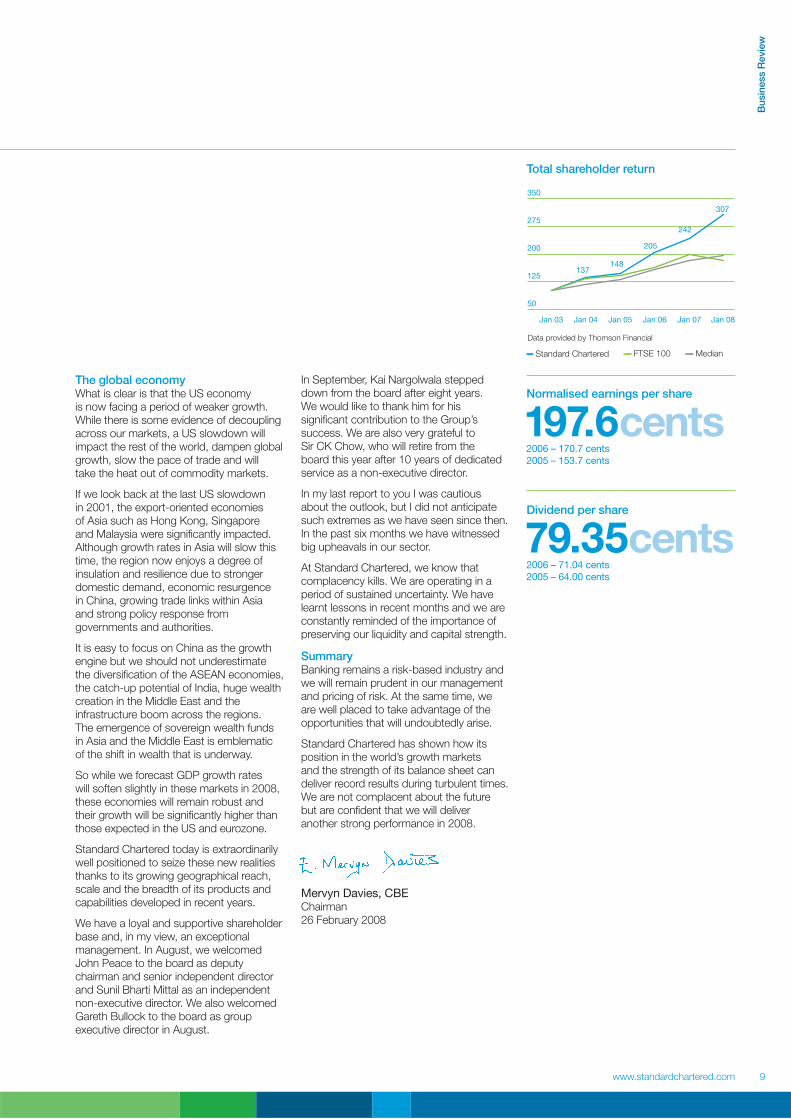
Total shareholder return
Normalised earnings per share
197.6cents2006 – 170.7 cents2005 – 153.7 cents
Dividend per share
79.35cents2006 – 71.04 cents2005 – 64.00 cents
50
125
200
275
350
Jan 08Jan 07Jan 06Jan 05Jan 04Jan 03
– Standard Chartered – FTSE 100 – Median
Data provided by Thomson Financial
137148
205
242
307

10 Standard Chartered Annual Report and Accounts 2007
Our performance in 2007 was underpinnedby firm foundations in the way we manage ourliquidity, capital, risk profile and costs.
Peter Sands, Group Chief Executive
Group Chief Executive’s Review
Multiple enginesof growth

www.standardchartered.com 11
Bus
ines
sRev
iew
2007 was my first full year as ChiefExecutive of Standard Chartered andI am delighted by our achievements.Despite the turbulence, financialshocks and uncertainties in thefinancial services industry, we haveagain delivered record profits.
We have invested in both our businessesat record levels and stepped up the paceof organic growth: underlying incomegrowth reached 23 per cent. We have alsoannounced six acquisitions since our lastset of results.
We have not been unscathed by thefinancial crisis nor do we expect to beimmune as it continues to unfold. But ourdisciplined approach to running the Group,focusing on our strategic priorities, hasstood us in good stead, and will continueto do so.
We start 2008 confident but notcomplacent. The Group is in great shapeand both businesses have begun the yearwell. It will be a testing year but it will alsobe exciting, with new opportunitiesemerging alongside new challenges.
Our performance in 2007 was underpinnedby firm foundations in the way we manageour liquidity, capital, risk profile and costs.
Firm foundationsWe are a bank with strong liquidity,a well-diversified retail funding baseand a conservative balance sheet. Wehave a healthy A/D ratio – the ratio ofcustomer loans to customer deposits– at 86 per cent; and 24 per cent of ourassets are highly liquid.
Many years of managing in highlyvolatile markets mean we have alwaystaken a proactive approach to managingour liquidity.
We are very well capitalised. The Group’scapital ratios are well above our targetranges, reflecting deliberate and effectivemanagement of the capital base. InSeptember 2007, we raised $2 billion inTier 2 capital which, despite stressedmarket conditions, was more than fivetimes oversubscribed.
We are very disciplined in the risks wetake. We have no direct exposure andvery limited indirect exposure to USsubprime assets. Our entire exposure toasset-backed securities (‘ABS’), includingcollateralised debt obligations (‘CDO’),is under $6 billion.
We have faced challenges and takensome writedowns as a result of the financialturmoil. On Whistlejacket, the structuredinvestment vehicle, and on our assetsecuritisation portfolio, the profit and lossaccount impact was $300 million in total.On the other hand, we have had anoutstanding performance on the corporateloan portfolio and kept a tight grip onconsumer credit.
We have also had to take some very difficultdecisions – such as on Whistlejacket. Weworked very hard since August to find aviable way forward for Whistlejacket and aredisappointed that we were ultimately unableto do so.
Overall, I am confident that our strategy forbalancing risk and return and the systemsand processes that underpin this are workingwell. We also take a very disciplined approachtowards the management of our cost base.We continue to drive for greater efficiency ineverything we do and manage our investmentprogramme on a dynamic basis.
We are not going to stop investing forgrowth. The opportunities in our marketsare hugely exciting and now is the timeto seize them. But, as always, we will beprepared to pace and scale this investment,taking account of changes in our marketsand in our own performance.
Challenges aheadThese firm foundations will prove criticalto our continued success as we face thechallenges ahead. The turmoil in financialmarkets is far from over.
We anticipate strains in the global economy,with the slowdown in the US having at leastsome effect on our markets in Asia, Africaand the Middle East. How profound thateffect will be, we do not know.
We also see a range of political risks inour markets. Yet, as a bank that has grownup in emerging markets over more than150 years, we have plenty of experiencein dealing with such issues.
Alongside these external challenges,we also face one major internal challenge:that of managing extremely rapid growth.This is about attracting and developingexceptional talent, ensuring our culture andvalues remain robust, ensuring our controlsystems and infrastructure keep pace withthe business.
Singapore – First visit as CEOVisiting Singapore always feels like ahomecoming for me as I grew up here.Singapore is also the hub for many ofour Group’s global businesses andhome for many of our clients.
2007: A rewarding yearof growth and momentumIt has been a very busy year for the Bank andfor me, personally, as I visited our marketsaround the world to meet our customers,regulators and colleagues to share our visionto become the world’s best international bank.
India – Continued growth in ChennaiChennai, our biggest technology andoperations hub, continued to grow.We have 5,500 people in this centreand this number will double over thenext five years.
12 Standard Chartered Annual Report and Accounts 2007
Group Chief Executive’s Review continued
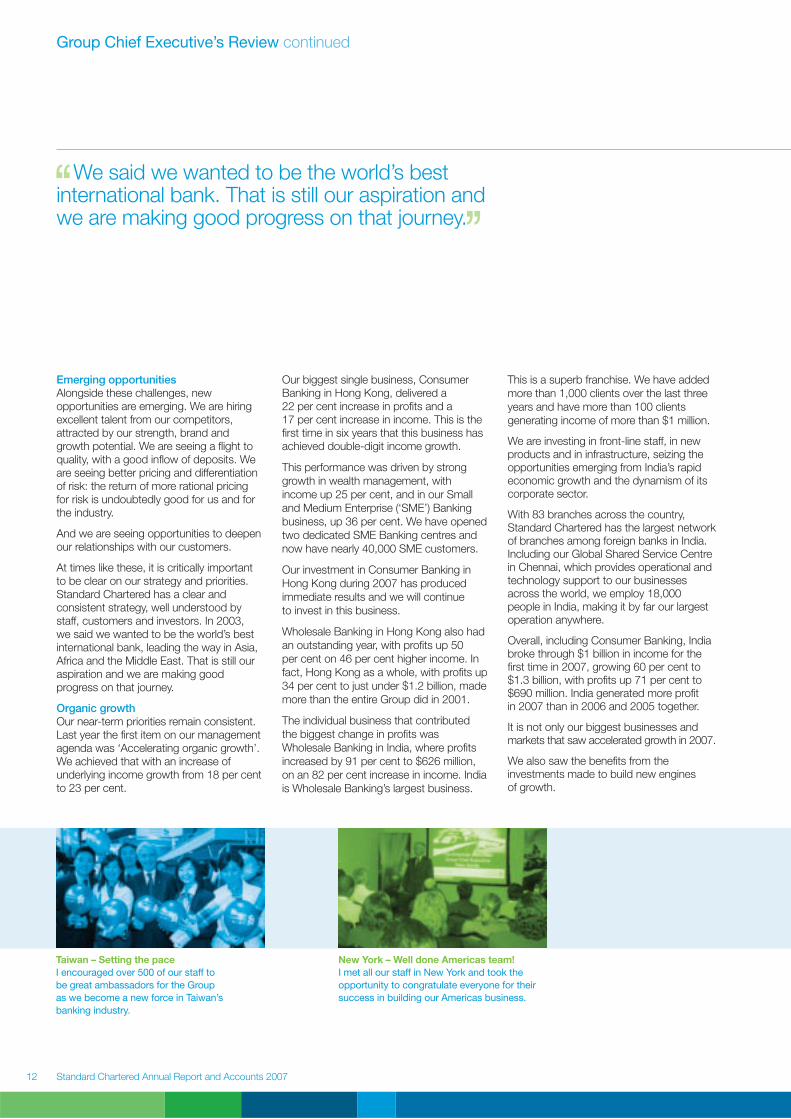
We said we wanted to be the world’s bestinternational bank. That is still our aspiration andwe are making good progress on that journey.
Taiwan – Setting the paceI encouraged over 500 of our staff tobe great ambassadors for the Groupas we become a new force in Taiwan’sbanking industry.
Emerging opportunitiesAlongside these challenges, newopportunities are emerging. We are hiringexcellent talent from our competitors,attracted by our strength, brand andgrowth potential. We are seeing a flight toquality, with a good inflow of deposits. Weare seeing better pricing and differentiationof risk: the return of more rational pricingfor risk is undoubtedly good for us and forthe industry.
And we are seeing opportunities to deepenour relationships with our customers.
At times like these, it is critically importantto be clear on our strategy and priorities.Standard Chartered has a clear andconsistent strategy, well understood bystaff, customers and investors. In 2003,we said we wanted to be the world’s bestinternational bank, leading the way in Asia,Africa and the Middle East. That is still ouraspiration and we are making goodprogress on that journey.
Organic growthOur near-term priorities remain consistent.Last year the first item on our managementagenda was ‘Accelerating organic growth’.We achieved that with an increase ofunderlying income growth from 18 per centto 23 per cent.
Our biggest single business, ConsumerBanking in Hong Kong, delivered a22 per cent increase in profits and a17 per cent increase in income. This is thefirst time in six years that this business hasachieved double-digit income growth.
This performance was driven by stronggrowth in wealth management, withincome up 25 per cent, and in our Smalland Medium Enterprise (‘SME’) Bankingbusiness, up 36 per cent. We have openedtwo dedicated SME Banking centres andnow have nearly 40,000 SME customers.
Our investment in Consumer Banking inHong Kong during 2007 has producedimmediate results and we will continueto invest in this business.
Wholesale Banking in Hong Kong also hadan outstanding year, with profits up 50per cent on 46 per cent higher income. Infact, Hong Kong as a whole, with profits up34 per cent to just under $1.2 billion, mademore than the entire Group did in 2001.
The individual business that contributedthe biggest change in profits wasWholesale Banking in India, where profitsincreased by 91 per cent to $626 million,on an 82 per cent increase in income. Indiais Wholesale Banking’s largest business.
This is a superb franchise. We have addedmore than 1,000 clients over the last threeyears and have more than 100 clientsgenerating income of more than $1 million.
We are investing in front-line staff, in newproducts and in infrastructure, seizing theopportunities emerging from India’s rapideconomic growth and the dynamism of itscorporate sector.
With 83 branches across the country,Standard Chartered has the largest networkof branches among foreign banks in India.Including our Global Shared Service Centrein Chennai, which provides operational andtechnology support to our businessesacross the world, we employ 18,000people in India, making it by far our largestoperation anywhere.
Overall, including Consumer Banking, Indiabroke through $1 billion in income for thefirst time in 2007, growing 60 per cent to$1.3 billion, with profits up 71 per cent to$690 million. India generated more profitin 2007 than in 2006 and 2005 together.
It is not only our biggest businesses andmarkets that saw accelerated growth in 2007.
We also saw the benefits from theinvestments made to build new enginesof growth.
New York – Well done Americas team!I met all our staff in New York and took theopportunity to congratulate everyone for theirsuccess in building our Americas business.

www.standardchartered.com 13
Bus
ines
sRev
iew
Hong Kong – Keeping busyMy Hong Kong visit was the busiestyet. I shared the Group’s priorities withour staff and opened our newestbranch and Priority Banking Centre.
brand are proving enormously appealingto our customers.
The acquisition of American Express Bank,announced in September, will turbo-chargethe growth of our private banking business,adding over $22 billion in AUM, newbooking centres, investment products andcapabilities and another 120 experiencedrelationship managers.
Korea, Pakistan and TaiwanIn 2008, delivering on our acquisitionswill remain a top priority. 2007 wasundoubtedly a challenging year forour business in Korea. Whilst reportedperformance was adversely affected bya number of one-off items, we are still notsatisfied with our performance, even afteradjusting for these effects.
I have changed the management team inKorea and we are now executing a rangeof strategic initiatives to reshape thebusiness – to accelerate income growth,to improve productivity and to enhancereturn on capital.
We are confident that SC First Bank isfundamentally a great business and a largegrowth platform in a very big, growingeconomy. It will be a powerful engine ofsustained profit growth for the Group.
In Pakistan we have made rapid progresswith the integration of Union Bank. Todaywe are the sixth largest bank in the countryin terms of profits with over 170 branches in39 cities. However, the political environmenthas had a negative impact, particularly onloan impairment, and we enter 2008 witha somewhat cautious stance.
In Taiwan, we have made good progresssince amalgamating the businesses inJune. We are on course to meet ourtarget of delivering double-digit returnon investment and earnings-per-shareaccretion in 2008.
In China, income was up 73 per cent to$498 million. About three quarters ofincome was generated by the WholesaleBanking business. We have been investingsignificantly to build a business of scaleand breadth.
In 2007, we more than doubled thenumber of permanent staff from 2,100to over 4,300 and our local networkexpanded from 21 to 38 locations. Despiteinvesting over $60 million in the ConsumerBanking business, profits from Chinaincreased by 72 per cent in 2007 and arenow in excess of some $180 million.
Nigeria is another example. It is a countrywith around six per cent GDP growth,140 million people and a rapidly growingmiddle class. Over the past three yearswe have invested in building a full rangeof products in both Consumer Bankingand Wholesale Banking.
In 2007, we doubled the number ofbranches to 12 and now employ about350 people. As a result of this investment,our income in Nigeria increased by over62 per cent to over $140 million and profitsincreased by 87 per cent. In 2008, subjectto approval, we plan to double again thesize of our branch network in Nigeria.
Another new engine of organic growth isThe Standard Chartered Private Bank.Launched just nine months ago, thePrivate Bank is making excellent progress.With 11 offices across seven markets and118 relationship managers, the PrivateBank has $10 billion of assets undermanagement (‘AUM’), of which 28 per centis from 1,300 clients who are entirely newto Standard Chartered.
Whilst it is still early days, we are alreadyseeing that our unique combination of localheritage and international capability, ourability to offer a broad range of onshore andoffshore wealth products and our distinctive
China – Cultural highlights of the job‘Dotting the eye of the lion’ in Tianjinas we celebrated the opening of ourfirst Shared Service Centre in China.It was the cultural highlight of my trip.
2008 Management Agenda
• Sustain organic momentum
• Deliver growth fromour acquisitions
• Continuously improvethe way we work
• Build leadership
• Reinforce the brand

14 Standard Chartered Annual Report and Accounts 2007
Group Chief Executive’s Review continued
Over the last few years we have builta track record of consistent delivery, ofsuperior financial performance. We arecommitted to build on that record.
This is a highly complex integration,spanning 47 countries and involving theintegration of high-volume transactionsystems, but the prize is also verysignificant. We anticipate that 2008integration costs are likely to be around$150 million, so the acquisition is likelyto be slightly dilutive this year, net ofunderlying earnings and early synergies.
We remain confident that American ExpressBank will increase earnings per share in2009 and will deliver a double-digit returnon investment. This is a great deal,strategically compelling and financiallyattractive. We are bringing on board somehighly talented international bankers andthere is a strong cultural fit.
In the second half of 2007 we announcedfour other capability-driven acquisitions, allmuch smaller than American Express Bank:
• Pembroke, a specialist in aviation finance,which will reinforce our ability to play apart in the rapid growth of aviation acrossour markets
• Harrison Lovegrove, an oil and gasadvisory boutique, which adds to ourexisting strengths in the energy business
• A Brain, a securities services companyin Korea, which brings new capabilitiesand customers to our securitiesservices business
• UTI Securities, an equity brokerage andadvisory firm in India, which will enable usto provide a broader rangeof wealth management products to ourretail and private banking clients
In January 2008, we also announced theacquisition of Yeahreum, a mutual savingsbank in South Korea, which will enable usto broaden the current product offering.
The logic behind all these capability-drivenacquisitions is to extend and deepen ourproduct range and expertise, enabling us toserve our clients more effectively across abroader range of needs. They add fuel toour organic growth.
Sustainable business strategyBuilding a sustainable business is anintegral part of our long-term strategyto enhance shareholder value. AtStandard Chartered, we are determinedto lead by example within the markets inwhich we operate. As well as finding waysto drive economic growth, we also want tohelp protect the environment and to have apositive impact on the societies where welive and work.
We are constantly challenging ourselves onhow we can contribute in a distinctive wayin the countries where we operate. Forexample, at the Clinton Global Initiative inSeptember, Standard Chartered committed$8-10 billion financing over the next fiveyears in renewable and clean energyprojects in Asia, Africa and the Middle East.By making our commitment public, wehope to be a catalyst for change, influencingbusinesses to invest in the transition to alow-carbon and more sustainable future.
Capability acquisitionsWhile our acquisitions in Korea, Pakistan andTaiwan were primarily about achieving criticalmass and distribution in key geographies,the rationale for the acquisition of AmericanExpress Bank was to reinforce ourcapabilities and scale in two key businessesacross the world: private banking andfinancial institutions. I have already outlinedthe benefits to private banking.
In financial institutions, American ExpressBank will double the size of our US dollarclearing business, give us direct yen- andeuro-clearing capability, as well as asophisticated sales and service model.American Express Bank will also extendour reach into a number of new countries.Following completion of the transaction,Standard Chartered will be represented inover 70 markets.
We expect to complete this transactionshortly and look forward to welcomingAmerican Express Bank’s 2,800 staff intoStandard Chartered. Our detailed planningfor the integration is going very well and hasconfirmed our initial view of both the scaleand cost of the integration task as wellas the magnitude of the synergies.
India – Helping communities growWhile in India I had the privilege to visitGoal, our pilot for a women’s empowermentinitiative which uses sport to help womenbecome leaders in their communities.
South Korea – At the World Knowledge ForumIt was an honour to speak at the WorldKnowledge Forum in Seoul. I spoke aboutthe drivers of change and Seoul’s futureas a global financial centre.

www.standardchartered.com 15
Bus
ines
sRev
iew
We will not stop investing given theopportunities we are seeing in ourmarkets. But we will remain vigilant in ourmanagement of risk, and we will continue toflex the pace of investment to ensure costsgrow broadly in line with income growth.
2007 was a year of strong performance, ayear of delivery despite the external turmoil.We enter 2008 amid almost unprecedentedmarket volatility and uncertainty, but in greatshape and with great momentum.
Summary2007 was a great year for the Group. Wewere not unscathed by the financial crisis,but we delivered record results. I thank allour customers and shareholders for theirsupport and the Group’s staff for playingtheir part in our growth story in 2007.Standard Chartered has never been ina better shape.
Peter Sands,Group Chief Executive26 February 2008
The year aheadIn the year ahead we will stick to ourstrategy. We will continue to focus ondeepening our relationships with our clients.And we will continue to be proactive anddisciplined in managing our liquidity, ourcapital, our risk profile and our costs.
We will keep investing to sustain ourorganic growth momentum. In China, forexample, subject to regulatory approval, weanticipate having at least 60 locations bythe end of this year. This year we celebrate150 years of being in China and India: wehave deep roots in these markets and theyare a huge part of our future.
We will deliver on our acquisitions: makeprogress in Korea; deliver earnings-per-share growth from Taiwan; and completethe American Express Bank transactionand drive its integration.
OutlookWe ended 2007 with strong momentumin both businesses and the Group has hadan excellent start to 2008, particularly inWholesale Banking which had a recordJanuary. The Bank is in great shape. Thefoundations are firm. We are extraordinarilywell-placed to capture the huge opportunitiesin our markets. There is more breadthand scale in the Group and our strongperformance in 2007 is well spread acrossmultiple products and multiple geographies.
The level of risk and uncertainty in theexternal environment makes the horizonmore difficult to read. However, we knowwhat our shareholders expect us to deliver:double-digit income growth, double-digitearnings growth and mid-to-high-teensreturn on equity (‘ROE’). Over the last fewyears we have been building a track recordof consistent delivery of superior financialperformance. We are committed to keepbuilding on that track record.
Singapore – Business Leadership Team meetingMy message to all 450 attending managers wasthat we can deliver our dream if we work togetheras a team and be courageous, creative, daringand disciplined.
UK –My volunteering dayVolunteering is a hugely rewarding way tosupport our community. I volunteered atTerrence Higgins Trust, a leading HIV/AIDScharity in the UK, and encourage staff tovolunteer their time for the community.

16 Standard Chartered Annual Report and Accounts 2007
Key Performance Indicators
Setting high standards2007 has been another excellent year as we turbo-charged growth inincome and profit, bolstered capital, increased return to our shareholders,enhanced service quality to customers and improved staff engagement.Our Key Performance Indicators reflect the substantial improvement wehave made on several fronts.
Normalisedearnings per share
Description
Aim
Analysis
Source
Operating income
This Key Performance Indicator(KPI) is calculated as profitattributable to ordinaryshareholders of the Group asnormalised for certain one-offor irregular items, divided by theweighted average of the numberof shares in issue during the year.
Operating income is calculated asthe sum of the net interest income,net commission income, and nettrading income.
This measure is reported inthe Group’s audited financialstatements within note 13.
This measure is reportedin the Group’s auditedfinancial statements.
To consistently deliver year-on-year growth in normalisedearnings per share.
To sustain organic momentum.
During 2007, we had growth of 16per cent, with strong contributionsfrom both businesses.
During 2007, operating incomegrew by 28 per cent comparedwith 2006, and underlyingoperating income increasedby 23 per cent.
Financial
Tier 1 capital ratio
Tier 1 capital, the componentsof which are summarised on page61, is measured by the ratio of Tier1 capital to risk-weighted assetsand contingents.
This measure is reported in theaudited Capital section of theRisk Review on page 61 of theAnnual Report.
To maintain Tier 1 capital ratiobetween 7 and 9 per cent.
During 2007, the Groupmaintained a strong Tier 1capital ratio at 9.8 per cent,which increased from 8.3 percent at the end of 2006.
For more information visit:www.standardchartered.com
Trend Normalised EPS
197.6cents2006: 170.7 cents2005: 153.7 cents2004: 124.6 cents2003: 90.1 cents
Operating income
$11,067m2006: $8,620m2005: $6,861m2004: $5,274m2003: $4,740m
Tier 1 capital ratio
9.8%2006: 8.3%2005: 7.7%2004: 8.6%2003: 8.6%

www.standardchartered.com 17
Bus
ines
sRev
iew
Normalised return onshareholders’ equity
Wholesale BankingService Quality Index
Consumer BankingLoyal and Positive Index
Q12 ratio of engagedto disengaged staff
Normalised return onshareholders’ equity iscalculated as the normalisedprofit attributable to ordinaryshareholders as a percentageof average shareholders’ equity.
This Index measures WholesaleBanking client satisfaction andengagement with StandardChartered relative to the bestcompetitor bank in each of thekey markets where we operate.Client satisfaction studies are runannually and provide feedbackon the Group and its maincompetitors across the GlobalCorporates, Local Corporatesand other client segments.
This measure is derived frominformation within the Group’saudited financial statements,being normalised earnings (note13) as a percentage of averageshareholders’ equity (excludingpreference shares).
Third party client satisfactionstudies conducted by reputableand accredited third partyorganisations. The 2007 index isderived from surveys managedby TNS, ClientKnowledge andGreenwich Associates.
To deliver superior returns onshareholders’ equity comparedto the industry average.
To deliver superior serviceto clients, demonstrably aheadof our main competitors in ourkey markets.
During 2007, normalised returnon shareholders’ equity, declinedto 15.6 per cent, reflecting anincrease in non-revenue reserves.
During 2007, we expanded clientsatisfaction measurement inWholesale Banking so that itnow covers more than half ofclient revenues. Despite thisexpansion in coverage ourService Quality Index remainsstrong, at 98 per cent comparedwith 97 per cent in 2006.
This indicator gauges customersatisfaction and loyalty to theproducts and services providedby Consumer Banking. Keysatisfaction and recommendationmeasures are combined toprovide an index of loyalty. Thesemeasures of reported customersatisfaction and loyalty arebenchmarked against thosereported for main competitorsin each product and servicewithin each market.
Market Probe CustomerSatisfaction and LoyaltySurvey (26 markets onaverage each year).
To increase customer satisfactionwith the products and servicesprovided by Consumer Banking andto drive overall customer loyalty.
We have seen steady growthover the last four years witha one percentage point increasethus far in 2007 results.
Q12 ratio is based on theGroup’s annual employeeengagement survey. Itassesses the proportion ofengaged employees in theGroup to each disengagedemployee. High employeeengagement has beenshown to be strongly relatedto increased businessperformance, through bothinternal and external research.
The Gallup Organization, Q12Employee Engagement Survey.
To continue to foster a cultureof high employee engagementas the Group continues to growand change.
Employee engagement continuesto increase year-on-year, despitehigh growth, both organically andthrough acquisitions.
Non-financial
* In 2006, the Wholesale Banking Service Quality Index was re-calibrated to include additional satisfaction surveys covering bothGlobal Corporate clients and Local Corporates, reflecting a larger share of client revenues.
# Index data for 2005 is based on a survey conducted in Asia by Greenwich Associates covering our Global Corporate clients only.
Wholesale BankingService Quality Index
98%2006: 97%*2005: 93%#
2004: 99%2003: 92%
Global (26 countries) – % ofLoyal and Positive customers
84%2006: 83%2005: 80%2004: 74%
Q12 ratio of engagedto disengaged staff
4.7:12006: 4.5:12005: 4.4:12004: 3.7:12003: 2.8:1
Normalised return onordinary shareholders’ equity
15.6%2006: 16.9%2005: 18.0%2004: 18.6%2003: 15.7%

18 Standard Chartered Annual Report and Accounts 2007
Private Bank global launchThe Standard Chartered Private Bank offers anopen architecture and best-of-breed products,besides delivering first-class service to highnet worth clients. Headquartered in Singapore,it spans across 11 locations in seven markets.
Expanding network in IndonesiaPT Bank Permata, jointly owned by StandardChartered and PT Astra International, is leadingthe way in Indonesia. We had 256 branchesand six Islamic Banking centres acrossthe country at the end of 2007.
Business ReviewPerformance
The stable economic outlook for our key markets and ourstrong liquidity and balance sheet give us the confidenceto pursue our key strategic priorities.
Standard Chartered had another year ofrecord performance in 2007 on the backof the targeted investments made inprevious years in our key growth marketsin Asia, Africa and the Middle East. TheGroup crossed several notable milestonesduring the year:
• Record earnings: Operating incomeexceeded $11 billion and profit before taxsurpassed $4 billion, both for the first time
• Broad-based growth: Headline incomegrew 28 per cent, with organic incomegrowth accelerating to 23 per cent,a record high
• EPS growth: Normalised earnings pershare increased 15.8 per cent to197.6 cents
• Strong markets: For the first time, profitbefore tax surpassed $1 billion in HongKong and $500 million each in India andthe Middle East and Other South Asia(MESA) region
• Strong balance sheet: The Group’sliquidity and capital positions remainedcomfortably above targets throughout2007, despite the market turbulence,reflecting our vigilant and prudentapproach to risk management
• Private banking: Launched The StandardChartered Private Bank, with offices now
spread across 11 locations in sevenmarkets worldwide
• Acquisition of American Express Bank,which is due to be completed in the firstquarter of 2008, will further boost thePrivate Bank and Transaction Banking
• Islamic Banking: Launched Saadiq, ourglobal Islamic Banking brand, in the UAE,Malaysia, Pakistan and Bangladesh
• Taiwan: Rebranded all Hsinchu branchesovernight following amalgamation in June
• China: Incorporated in China, launchedlocal renminbi banking services andincreased the number of outlets to servelocal customers
The record performance in 2007 ushers ina very special year for the Group. This yearStandard Chartered will celebrate 150years of its presence in India and China.
In 1858, when we set up our first branchesin Calcutta and Shanghai, India andChina were among the world’s largesteconomies. The world has turned full circleand Asia’s two most populous economiesare again among the biggest drivers of theglobal economy.
This is a huge opportunity for StandardChartered. We are in the right place at theright time. The Group aims to leverage its
knowledge, relationships and branchnetwork to lead the way in Asia, Africaand the Middle East and become theworld’s best international bank.
The stable economic outlook for our keymarkets and the Group’s strong liquidityand balance sheet give us the confidenceto pursue our key strategic priorities:
• Sustaining organic momentum
• Delivering growth from our acquisitions
• Continuously improving the way we work
• Building our leadership
• Reinforcing the brand
These priorities will allow us to pursuegrowth, value creation and the strategicbusiness opportunities thrown up by thecurrent market dislocation.
This report explores some of thesepriorities to assess our performance in2007 and to lay out how we aim to makeprogress in 2008.
Organic growthHere, the numbers speak for themselves.Our income soared 28 per cent to $11,067million, driving up profit before tax by 27 percent to $4,035 million.
Most of our regions delivered strongperformances as business conditions in

Leading across ourgrowthmarkets
Our strong local presence in Hong Kong
Leading the way
Leading across our growth markets
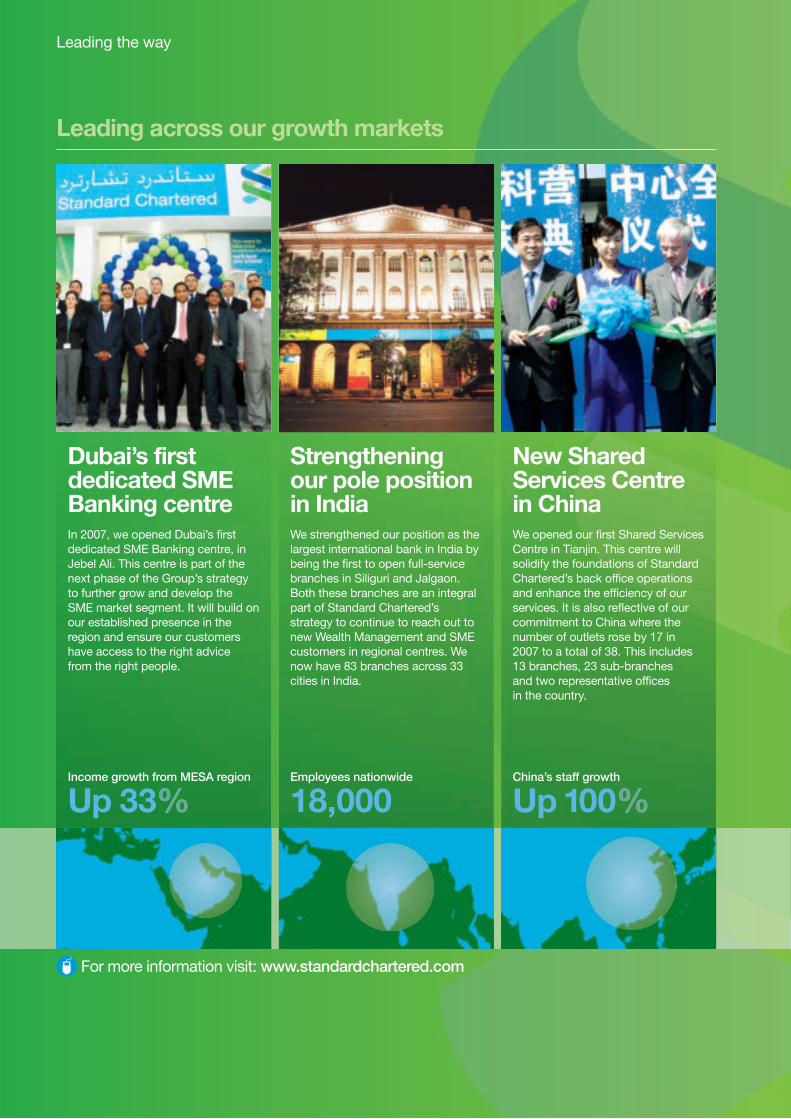
Dubai’s firstdedicated SMEBanking centre
Income growth from MESA region
Up 33
Strengtheningour pole positionin India
Employees nationwide
18,000
New SharedServices Centrein China
China’s staff growth
Up100
For more information visit:www.standardchartered.com
In 2007, we opened Dubai’s firstdedicated SME Banking centre, inJebel Ali. This centre is part of thenext phase of the Group’s strategyto further grow and develop theSME market segment. It will build onour established presence in theregion and ensure our customershave access to the right advicefrom the right people.
We strengthened our position as thelargest international bank in India bybeing the first to open full-servicebranches in Siliguri and Jalgaon.Both these branches are an integralpart of Standard Chartered’sstrategy to continue to reach out tonew Wealth Management and SMEcustomers in regional centres. Wenow have 83 branches across 33cities in India.
We opened our first Shared ServicesCentre in Tianjin. This centre willsolidify the foundations of StandardChartered’s back office operationsand enhance the efficiency of ourservices. It is also reflective of ourcommitment to China where thenumber of outlets rose by 17 in2007 to a total of 38. This includes13 branches, 23 sub-branchesand two representative officesin the country.
www.standardchartered.com 21
Bus
ines
sRev
iew
Singapore, Malaysia, Africa and our recentlyrelaunched UK business also generateddouble-digit income growth each with growthrates of over 20 per cent. Hong Kong sawa 17 per cent income growth while Indiahad a 26 per cent income growth.
We invested in distribution capabilities,key for both SME Banking and WealthManagement, with over 70 new branchesin Pakistan, China, Korea, Africa and HongKong and over 600 new and upgraded ATMs.
As a result of these expansions and newinvestments, Consumer Banking expensesrose 28 per cent, or 20 per cent on anunderlying basis. Almost half of theunderlying growth can be attributed to theaccelerated investment in future growth.
We continued with product innovation andover the course of the year launched morethan 1,500 global product initiatives acrossWealth Management and SME Banking.We also launched Consumer TransactionBanking to deepen our capabilities to meetcustomers’ needs through all channels,including the internet and mobile phones.
Our presence in the UAE received a boostwith the opening of Dubai’s first dedicatedSME Banking centre in Jebel Ali.
The Standard Chartered Private Bank hasnow been rolled out across a total of 11locations in seven markets and we havehad significant success in building a strongteam and attracting new clients and assets.
The acquisition of American Express Bank,which is scheduled to be completed in thefirst quarter of this year, will turbo-chargethis effort by adding 19 markets, keybooking centres, 120 relationship managersand over $22 billion of private bankingassets under management.
To summarise for Consumer Banking, wemaintained double-digit income momentum;growth remained broad-based, reflecting thebreadth and scale of our franchise; we have
a confident investment agenda for futuregrowth; and the asset quality is excellent.
Wholesale BankingWholesale Banking had an outstandingyear. Across the spectrum, the WholesaleBanking business, whether viewed byproduct, by customer segment or bygeography, fired on all cylinders.
Income grew 34 per cent, againunderpinned by strong growth in clientincome of 37 per cent as we continuedto deepen client relationships, increasedcross-sell and shifted to highervalue products.
Profit before tax grew 27 per cent ona headline basis and 28 per cent on anunderlying basis.
The Wholesale Banking strategy is clearlyworking well. We have focused ondeepening client relationships and we areseeing good results as we become a corebank to more of our clients. As an example,income from our top 50 clients was up over50 per cent year on year and income fromour top 10 clients was up over 85 per centyear on year.
Turning to costs, expenses grew by 31 percent. A good portion of the investment wasfocused on higher staff compensation aswe strengthened our teams with productspecialists, in areas such as CorporateAdvisory, and with relationship managersto enhance our sales coverage.
We are also scaling up our product offeringand capabilities, such as Principal Finance,Equity Derivatives, Commodity Derivativesand Convertibles.
In 2007, we launched our global IslamicBanking brand, Saadiq, in the UAE,Malaysia, Pakistan and Bangladesh,seeking to capitalise on the growingdemand for specialised financial servicesin these markets.
Business Review: Performance continued
the Group’s main markets continued tobenefit from strong economic growth, goodlocal currency liquidity and benign creditenvironments. In many markets we areseeing a clear re-pricing for risk.
As seen in recent years, it is the organicfranchise that continues to drive performance.Of the total income growth of 28 per cent,approximately 80 per cent of the increasecame from the organic business.
The underlying rate of income growth of 23per cent is a record high with 2007 beingthe fourth consecutive year of acceleratingdouble-digit organic income growth. Thisis a clear indication that our disciplinedinvestment programme over the last fewyears is paying off.
What is also pleasing is the continuedbalance of income growth across bothbusinesses – Consumer Banking andWholesale Banking. We have two strongengines of growth, each of which contributedover $1 billion of incremental income in 2007.
Consumer BankingOn a headline basis, Consumer Bankingdelivered income growth of 24 per centand expense growth of 28 per cent,with profit before tax rising 27 per cent,reflecting healthy returns on ourinvestments in our Wealth Managementand SME Banking businesses.
Underlying income growth in ConsumerBanking rose 15 per cent.
Income growth from the ConsumerBanking business was well diversified withnine markets now contributing $200 millionor more in income, compared with only fivemarkets in 2005. Wealth Managementincome now contributes over 45 per centof total Consumer Banking income.
Other Asia Pacific region, with an incomegrowth of 60 per cent and MESA region,with a growth of 38 per cent, performedparticularly well.
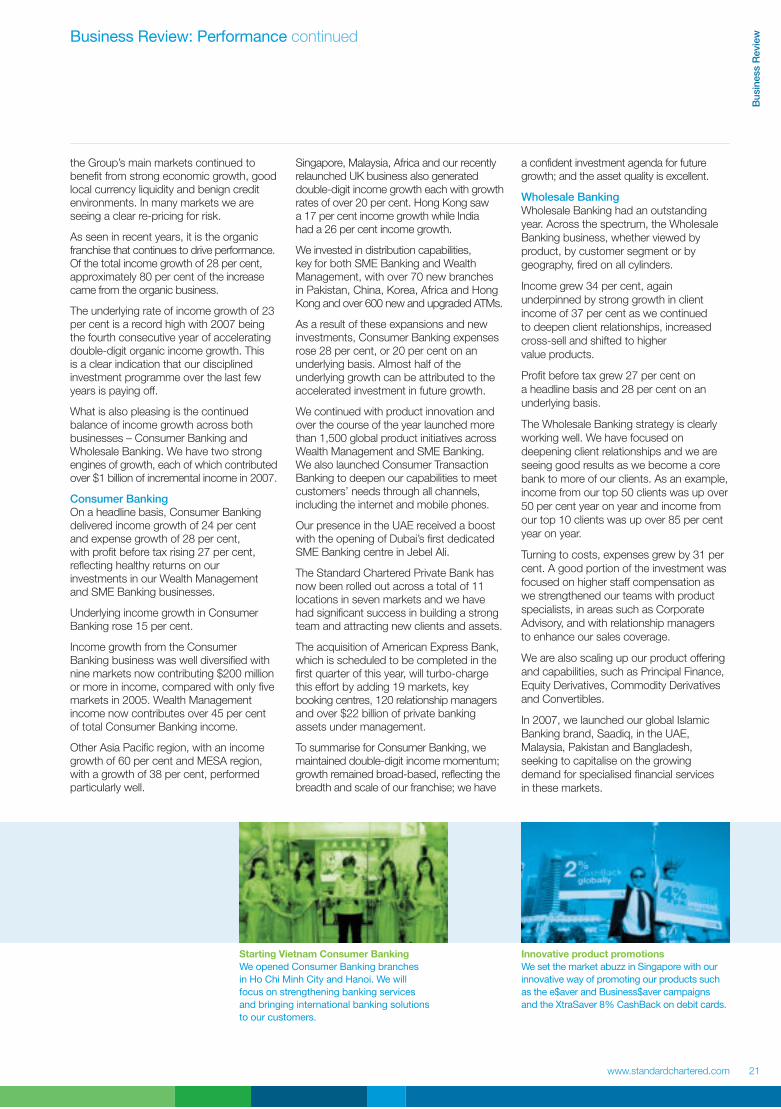
Starting Vietnam Consumer BankingWe opened Consumer Banking branchesin Ho Chi Minh City and Hanoi. We willfocus on strengthening banking servicesand bringing international banking solutionsto our customers.
Innovative product promotionsWe set the market abuzz in Singapore with ourinnovative way of promoting our products suchas the e$aver and Business$aver campaignsand the XtraSaver 8% CashBack on debit cards.

22
Tesco PLC’s first Islamic financing programmeWe managed the Islamic Sukuk issue for TescoStores (Malaysia) Sdn Bhd through theirMYR3.5 billion conventional and Islamic notesprogramme. The issue was guaranteed byTesco PLC.
First bank account in Africa designed for womenThe DIVA Account offers discounts and lifestylebenefits designed especially for women. This isa first-to-market product which recognises thepivotal role played by women in the economicdevelopment of Africa.
We also set up new offices, such as inGeneva, to deepen our client relationshipsin markets which are getting more closelyinterlinked with our key markets of Asia,Africa and the Middle East.
Wholesale Banking’s product capabilitywas enhanced through acquisitions ofseveral specialist businesses in 2007.These included Pembroke, a leading aircraftleasing, financing and management firm;Harrison Lovegrove, a global oil and gasadvisory boutique; A Brain, a fundadministration company in Korea; and,American Express Bank, which, once thedeal is closed in 2008, will bolster our USdollar-clearing capabilities and expandour euro- and yen-clearing capabilities inTransaction Banking.
Wholesale Banking achieved significantproductivity increases in 2007 withbusiness-as-usual expenses growing farmore slowly than client revenue and we arecontinually looking to improve the flexibilityof our expense base.
To give a sense of this, performance relatedcompensation now constitutes over 40 percent of total Wholesale Banking staff costs,up from 24 per cent in 2004, 31 per centin 2005 and 35 per cent in 2006.
Growth marketsStandard Chartered’s outstandingperformance in 2007 was a result of thestrong growth in our biggest markets suchas Hong Kong and India as well as in ourfast-growing emerging markets such asChina and Nigeria. We exceeded ourperformance targets in many markets bya good margin in a very difficult year for thebanking industry in Europe and the US.Several of our markets set new records.
For instance, Hong Kong became the firstof our markets to make over $1 billion inprofit before tax. Consumer Banking inHong Kong saw a double-digit income
growth for the first time since 2001driven by strong growth in SME Bankingand Wealth Management.
The business in India, our second biggestmarket by profit, broke through $1 billionin income for the first time in 2007. Profitbefore tax rose 71 per cent to $690 million.India is now the Group’s largest WholesaleBanking market.
ChinaChina is increasingly becoming a majordriver of income for the Group.
Income increased 73 per cent to $498million in 2007 with about three quartersbeing generated by the Wholesale Bankingbusiness. We were one of the first fourinternational banks to locally incorporatelast April.
Since then we have been investing to capturethe opportunities afforded by the marketreforms – such as providing local currency(renminbi) consumer banking services –and rapidly positioning our franchise asa business of scale and breadth.
In 2007, we doubled the number of staff inChina from 2,100 to 4,300. Our local networkexpanded from 21 to 38 outlets. Profit beforetax from China increased by 72 per cent in2007 and is now about $180 million.
Delivering growth through acquisitionsOne of the key determinants of the successof our business is our ability to integrateacquired businesses. We have madetremendous headway in 2007.
In Korea, our business reported a threeper cent headline income growth in 2007.But, excluding the impact of three one-offaccounting adjustments and charges,income increased by 15 per cent.
Consumer Banking in Korea had stronggrowth in SME Banking and WealthManagement, offset by a fall in mortgageincome. However, we are beginning to see
a modest revival in mortgage margins in ournew business booked at the end of the year.
Wholesale Banking income momentumpicked up as the investments in peopleand products began to pay off.
In Pakistan, where we acquired Union Bankin 2006, the economy continued to expanddespite the uncertain political environmentand this was reflected in our performance.
To give a sense of the momentum, on acomparable basis, income grew 17 per cent.
Profit before tax on the same basis fell 17per cent, reflecting the impact of integrationexpenses as we continue to build out theplatform for future growth.
We had particular success in cross-sellingStandard Chartered products such asIslamic finance, commodity-relatedproducts and export finance to the UnionBank customer base. Our market share ofthe export finance business rose to 10 percent in 2007, from three per cent prior tothe Union Bank acquisition.
In Taiwan, following the amalgamationof Hsinchu and Standard Chartered’sTaiwan operation on 30 June 2007,we were successful in selling StandardChartered products through the Hsinchudistribution network.
Income in Taiwan in the second six monthsof the year was 10 per cent higher than inthe first six months when no StandardChartered products were sold through theHsinchu platform. Expenses also increasedhalf on half as integration commenced.
We remain confident that Hsinchu will beearnings-per-share accretive and deliverdouble-digit return on investment in 2008.
Continuously improving the way we workAs we build up our infrastructure in line withour growing business needs, we are awarethat there are other sources of uniquestrength which can provide StandardChartered a huge competitive advantage.
Business Review: Performance continued
Standard Chartered Annual Report and Accounts 2007

Leading with innovativeproducts and services
Introducing innovative financial solutions in the Middle East

Leading the way
Leading with innovative products and services
LaunchingSaadiq inmajor marketsThrough Saadiq, our global IslamicBanking brand which means truthful,we aim to capitalise on the growingdemand for Islamic Banking andfinancial services for the benefit ofour customers and stakeholders.We launched Saadiq in the UAE,Malaysia, Pakistan and Bangladeshin 2007. The launch was supportedby a combination of policies andincentives that were put in placeby governments and regulatorsin these markets.
The increasing importance of Chinato the global economy has attracteda lot of attention to US dollarpayments into China. We identifiedthis as a gap and promptly offeredour clients the US dollar China-bound payment service withreal-time access to New Yorkpayment systems. Through thisservice, we aim to streamline theend-to-end process, reducingturnaround time and allowingpayments to reach the beneficiarywithin the local business day.
Islamic Banking productsdeveloped to date
27
Starting US dollarChina-boundpayment service
Global US dollar transactionscleared daily by StandardChartered in New York
$144
Straight2Bank is our one-stopproprietary electronic bankingchannel for corporate andinstitutional clients. The fullyintegrated end-to-end platformprovides cash, trade and securitiesservices through a single sign-onaccess. The enhancements provideclients with streamlined andstraight-through processing oftransactions, resulting in significantoperating efficiencies and costsavings. This platform can beaccessed by our clients fromany location.
IntroducingStraight2Bank
Growth in client base with tradefacility as a result of Straight2Bank
Up 238
For more information visit:www.standardchartered.com
www.standardchartered.com 25
Bus
ines
sRev
iew
indicates the level of employee engagement,also shows a steady improvement despiteour rapid growth, both organically andthrough acquisitions.
Having dealt with the plumbing and wiringof the business, we need to redouble ourfocus on the second aspect of improvingthe way we work. This is about our culture,our values, the way we interact with eachother and with our customers. Our cultureand values allow us to collaborate acrossborders and across businesses, attractnew hires, keep people in the Group andattract clients.
The challenge is to avoid getting toocomplacent about these values andtaking them for granted.
Building the brandWe recognise that how we continue to buildour brand in the coming months will havean impact on shareholder value creation.
We want to build our brand at the pacewe are growing the business. A big partof brand building is our commitment tolive the brand and values in everythingwe do. We continue to embed our brandpromise, Leading by Example to beThe Right Partner in our markets, intoour business agenda.
The People and Sustainability sectionsof this review have more details aboutour initiatives in these areas.
So, leveraging our brand, values, culture andthe way we work remain among the toppriorities for this year. These are the keydrivers of shareholder value for the Group.
All in all, we start 2008 in good shapewith strong momentum. While the globalenvironment is undoubtedly morechallenging and there are manyuncertainties in the world, our businessesare performing strongly and we are clearabout our strategy and priorities. We arewell positioned to meet future challenges.
The first is our processes, policies andprocedures – the plumbing and wiring ofthe Group. This comes under our OutservePlus umbrella where we strive to becomeoperationally excellent by embedding aculture of continuous improvementthroughout the Group. By doing this, weaim to delight customers with the quality ofour service, make life easier for our staff andcustomers, and create capacity to enablethe Group to grow on a sustained basis.
We will know we are succeeding whencustomers and clients tell us that wereally understand their needs; ouremployees feel a deep sense of prideto work for the Group; and when we arewidely acknowleged to have ‘Best in Class’standards of operational experience.
We have already had several successes onthis front. For example, in Singapore, thesimplification of the account opening processhas reduced the time taken to openaccounts from 35 minutes to nine minutes.
In Wholesale Banking, we launchedStraight2Bank, our one-stop proprietaryelectronic banking channel for corporateand institutional clients. The fully integratedend-to-end platform provides cash,trade and securities services througha single sign-on access.
The enhancements provide clients withstreamlined and straight-through processingof transactions, resulting in significantoperating efficiencies and cost savings.This platform was introduced in responseto our clients’ need for sophisticatedtransaction, hedging and informationservices through a single interface.
Our Key Performance Indicators (pages16-17) show that our efforts are making adifference to our customers, employees andother stakeholders. For example, WholesaleBanking’s Service Quality Index andConsumer Banking’s Loyal and PositiveIndex have both risen in 2007 over theprevious year. The Q12 ratio, which
Business Review: Performance continued
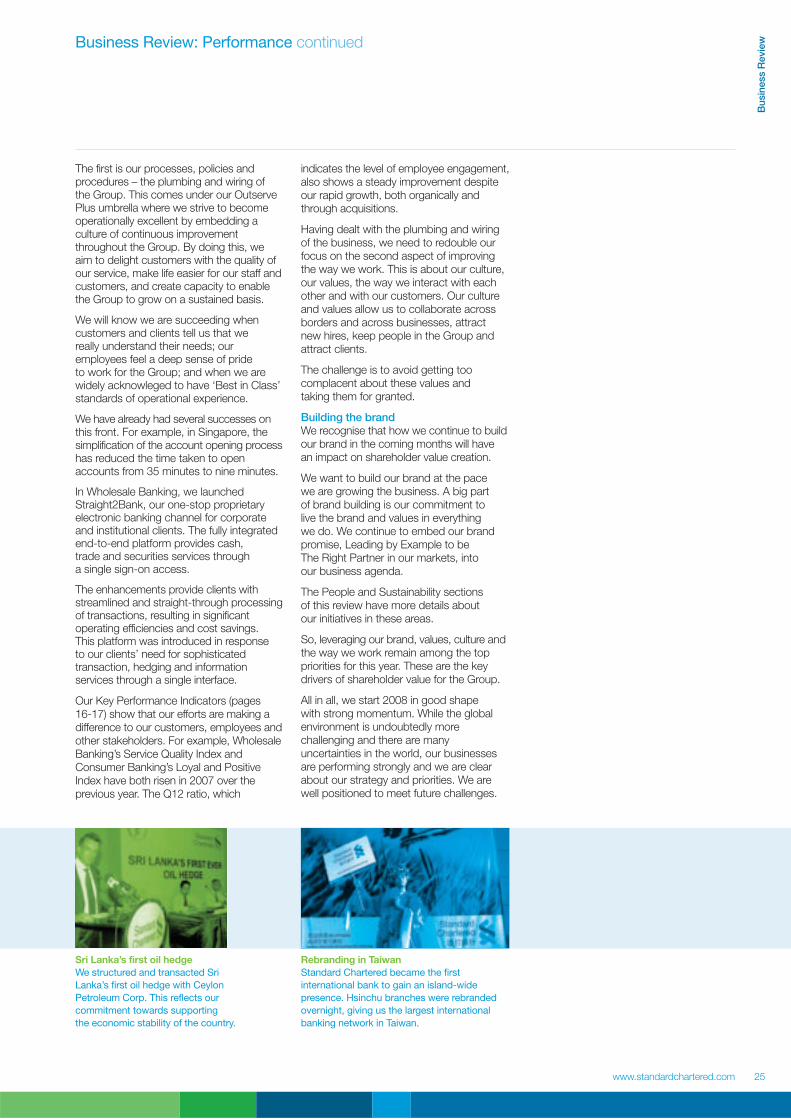
Sri Lanka’s first oil hedgeWe structured and transacted SriLanka’s first oil hedge with CeylonPetroleum Corp. This reflects ourcommitment towards supportingthe economic stability of the country.
Rebranding in TaiwanStandard Chartered became the firstinternational bank to gain an island-widepresence. Hsinchu branches were rebrandedovernight, giving us the largest internationalbanking network in Taiwan.

26 Standard Chartered Annual Report and Accounts 2007
Training academies to nurture talentWe believe in the continuous training anddevelopment of our people, so we are investingin training academies in India, China andTaiwan. We want to become the employer ofchoice by providing outstanding talent training.
Bringing in the best to Standard CharteredOver 330 International Graduates joined theBank in 2007, representing 34 nationalities.Of the new recruits, 42 per cent are women.We also recruited 57 Management Associatesfrom business schools during the year.
Business ReviewPeople
2007 was a year of tremendous expansion for the Group.We have been very successful in supporting this growthdue to our ability to attract, engage and develop thebest international talent across our markets.
Attracting and retaining the best talentStandard Chartered saw a 19 per centnet increase in the number of employeesin 2007 to 70,000, as we stepped uprecruitment to support our business growth.Attracting and retaining the best talent,driving performance and engagement andbuilding leadership capability are criticalpriorities for the Group.
There were particularly strong increases inthe number of employees in many of ourcore strategic markets. For example, werecruited almost 3,000 employees in India,just under 1,000 in Pakistan andover 1,000 employees each in China,Hong Kong and Singapore. We expect tocontinue hiring in these growing marketsin the coming years.
We are very proud of our deep history andlocal knowledge across our markets. Weare particularly proud of the diversity thatwe have worked very hard to promote.Our employees represent over 100 differentnationalities and we have maintained anapproximately equal gender balanceacross the Group.
In 2007, we focused on increasing theproportion of women at senior levels. Todate, the shift has been particularly strong inAsia, where 45 per cent and 31 per cent of
the senior management positions in Chinaand Hong Kong, respectively, now arerepresented by women. Globally, 20 per centof all senior managers are women.
Leveraging local knowledge is one ofthe key components of our success andwe have extended this approach to ourrecruitment strategy. In 2007, we launcheda global employee referral programme.This has been very successful with morethan 36 per cent and 37 per cent of newhires in China and India, respectively,referred to the Group by current employees.
We also re-launched our internal job postingguidelines in 2007. The number of positionsadvertised internally has since increasedfrom 26 per cent in 2006 to 67 per centin 2007. This provides greater visibilityof career opportunities to our currentemployees and also allows the Groupto further develop its internal talent pool.
In 2007, we exceeded our InternationalGraduate intake targets and hired morebusiness school graduates as ManagementAssociates. We place a strong emphasis onthese diverse individuals as they are a keypart of our leadership pipeline.
Alongside attracting talented individuals,we continue to focus on creating the right
environment to retain employees. Thisprocess begins from the day an individualjoins the Group. Since launching the RightStart induction programme in 2006, thepercentage of employees leaving the Groupwithin a year of joining has decreased byfive per cent.
As part of our efforts to retain talented staff,we continued to provide an inclusiveenvironment for our people. In 2007, a newflexible working framework that includesworking flexible hours and part-timeworking was piloted in Ghana, Singapore,the UK and the US. The Group alsolaunched the work@home programme at itsShared Services Centre in Chennai, India.Over 100 employees have already enrolledthemselves into the programme.
In 2008, the Group will extend the policyto another six to eight countries. We willalso work towards including other kinds offlexible working arrangements to help ouremployees enjoy a healthy and manageablework-life balance.
The Group has been researching the rootcauses of attrition and the drivers of retentionin some of our core markets. Our integratedapproach offers a more proactive strategytowards attrition and was launched in India,China and the UAE in 2007.

Leading the way through ourtalented and diverse teams
Making Standard Chartered a great place to work

Leading the way
Leading the way through our talented and diverse teams
Bringingemerging womenleaders together
Women in seniormanagement
20
A great placeto work
Working week launchedacross Asia
5-day week
Building ourmanagementskills
Managers participating in theGreat Manager Programme
5,500
For more information visit:www.standardchartered.com/sustainability/great-place-to-work
In 2007, we organised the GlobalWomen’s Forum in Dubai, bringingtogether over 100 emerging womenleaders from across 37 countries.The Forum focused on genderdiversity with regard to customers,community and workplace. Duringthe year, we focused on increasingthe proportion of women in seniorpositions. To date, the shift has beenparticularly strong in Asia, especiallyamong the senior management inChina and Hong Kong.
As part of our efforts to retain talentedstaff we continued to provide aninclusive environment for our people.In 2007, a newworking frameworkthat includes working flexible hoursand part-time working was pilotedin Ghana, Singapore, the UnitedKingdom and the United States.We also launched the work@homeprogramme at our Global SharedServices Centre in Chennai, India.We also implemented a five-dayworking week across Asia.
The Great Manager Programme isour scalable approach to buildingmanagement skills. We deliveredthis programme to 5,500 peoplemanagers. Almost 90 per cent ofthe managers surveyed have madechanges or intend to change theway they manage and engage theirteams as a result of the programme.The programme was conductedthrough numerous communications,an intranet site and a numberof podcasts.
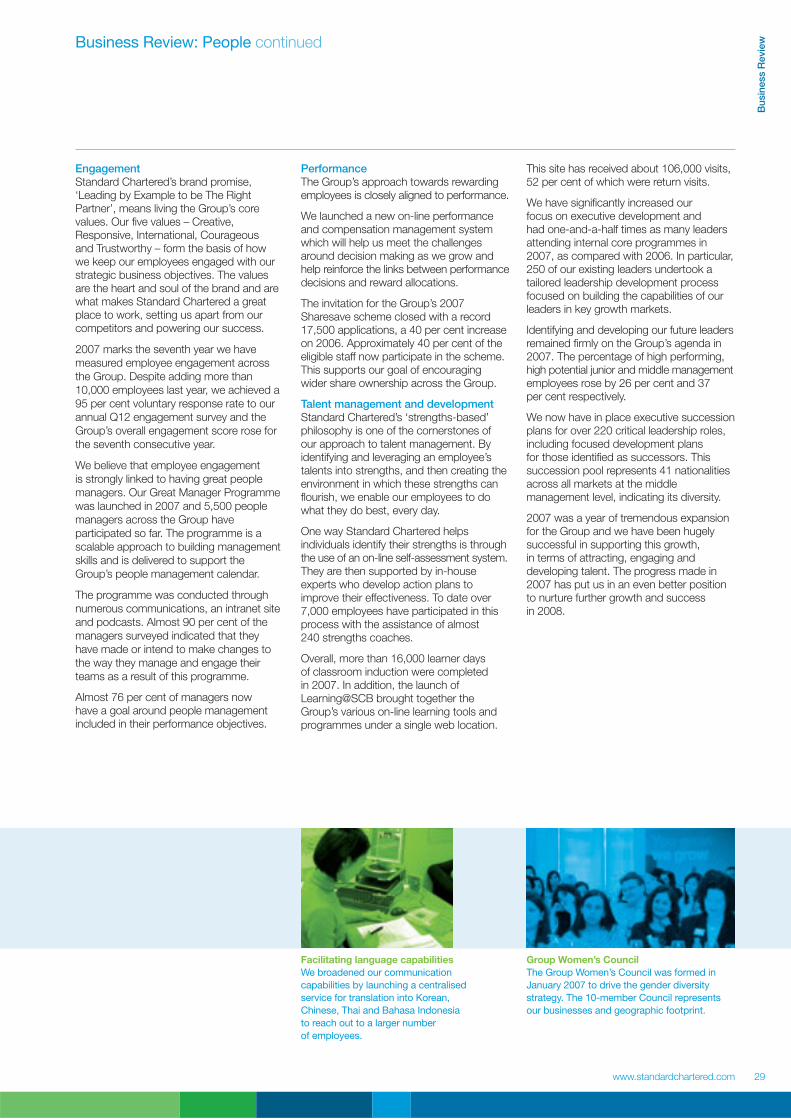
www.standardchartered.com 29
Bus
ines
sRev
iew
PerformanceThe Group’s approach towards rewardingemployees is closely aligned to performance.
We launched a new on-line performanceand compensation management systemwhich will help us meet the challengesaround decision making as we grow andhelp reinforce the links between performancedecisions and reward allocations.
The invitation for the Group’s 2007Sharesave scheme closed with a record17,500 applications, a 40 per cent increaseon 2006. Approximately 40 per cent of theeligible staff now participate in the scheme.This supports our goal of encouragingwider share ownership across the Group.
Talent management and developmentStandard Chartered’s ‘strengths-based’philosophy is one of the cornerstones ofour approach to talent management. Byidentifying and leveraging an employee’stalents into strengths, and then creating theenvironment in which these strengths canflourish, we enable our employees to dowhat they do best, every day.
One way Standard Chartered helpsindividuals identify their strengths is throughthe use of an on-line self-assessment system.They are then supported by in-houseexperts who develop action plans toimprove their effectiveness. To date over7,000 employees have participated in thisprocess with the assistance of almost240 strengths coaches.
Overall, more than 16,000 learner daysof classroom induction were completedin 2007. In addition, the launch ofLearning@SCB brought together theGroup’s various on-line learning tools andprogrammes under a single web location.
This site has received about 106,000 visits,52 per cent of which were return visits.
We have significantly increased ourfocus on executive development andhad one-and-a-half times as many leadersattending internal core programmes in2007, as compared with 2006. In particular,250 of our existing leaders undertook atailored leadership development processfocused on building the capabilities of ourleaders in key growth markets.
Identifying and developing our future leadersremained firmly on the Group’s agenda in2007. The percentage of high performing,high potential junior and middle managementemployees rose by 26 per cent and 37per cent respectively.
We now have in place executive successionplans for over 220 critical leadership roles,including focused development plansfor those identified as successors. Thissuccession pool represents 41 nationalitiesacross all markets at the middlemanagement level, indicating its diversity.
2007 was a year of tremendous expansionfor the Group and we have been hugelysuccessful in supporting this growth,in terms of attracting, engaging anddeveloping talent. The progress made in2007 has put us in an even better positionto nurture further growth and successin 2008.
Business Review: People continued
EngagementStandard Chartered’s brand promise,‘Leading by Example to be The RightPartner’, means living the Group’s corevalues. Our five values – Creative,Responsive, International, Courageousand Trustworthy – form the basis of howwe keep our employees engaged with ourstrategic business objectives. The valuesare the heart and soul of the brand and arewhat makes Standard Chartered a greatplace to work, setting us apart from ourcompetitors and powering our success.
2007 marks the seventh year we havemeasured employee engagement acrossthe Group. Despite adding more than10,000 employees last year, we achieved a95 per cent voluntary response rate to ourannual Q12 engagement survey and theGroup’s overall engagement score rose forthe seventh consecutive year.
We believe that employee engagementis strongly linked to having great peoplemanagers. Our Great Manager Programmewas launched in 2007 and 5,500 peoplemanagers across the Group haveparticipated so far. The programme is ascalable approach to building managementskills and is delivered to support theGroup’s people management calendar.
The programme was conducted throughnumerous communications, an intranet siteand podcasts. Almost 90 per cent of themanagers surveyed indicated that theyhave made or intend to make changes tothe way they manage and engage theirteams as a result of this programme.
Almost 76 per cent of managers nowhave a goal around people managementincluded in their performance objectives.
Facilitating language capabilitiesWe broadened our communicationcapabilities by launching a centralisedservice for translation into Korean,Chinese, Thai and Bahasa Indonesiato reach out to a larger numberof employees.
Group Women’s CouncilThe Group Women’s Council was formed inJanuary 2007 to drive the gender diversitystrategy. The 10-member Council representsour businesses and geographic footprint.

30 Standard Chartered Annual Report and Accounts 2007
Working with SME clients on Living with HIVWe are providing training resources to ourSME clients to help them implement theirown HIV/AIDS programmes. This programmestarted in Tanzania and was extended toSingapore and Hong Kong.
Supporting Microfinance in IndiaWe partnered with OpportunityInternational and World Vision toprovide cross-border securitysolutions to independent start-upMicrofinance Institutions in India.
Business ReviewSustainability
We are leading by example through our sustainable approachto business and society. We are constantly challenging ourselvesas to how we can contribute in our markets in a distinctive way.
Building a sustainable business is anintegral part of our long-term strategy toenhance shareholder value. At StandardChartered, we are determined to leadby example in the markets in which weoperate. As well as contributing to economicgrowth through our core business activities,we want to help protect the environmentand to have a broader positive impact onthe societies in which we live and work.And as we engage as a partner withgovernments and communities inaddressing these wider challenges,we are learning more about how theissues interact with each other andour core business objectives.
There are numerous ways we are strivingto be a force for good. These examplesare documented in our SustainabilityReview 2007 and in the sustainabilitysection of our website. There we discussin detail how we progressed in 2007 inour seven sustainable business priorities:Sustainable Finance, Access to FinancialServices, Protecting the Environment,Responsible Selling and Marketing, TacklingFinancial Crime, Community Investmentand a Great Place to Work.
We apply three tests to decide which areasof sustainability to focus on: first, we ensurethat what we do is relevant to the markets
we operate in; second, we want to dothings which leverage our capabilities andinfrastructure; and third, we focus on wherewe can add distinctive value. In this report,we highlight some of our success stories of2007, which passed the three tests, anddiscuss some of our unfinished tasks.
Access to financial servicesStandard Chartered is committed tobringing millions of people in our marketsinto the mainstream economy by improvingaccess to financial services and helpingthem make an economic contribution.
Our partnerships with over 40 microfinanceinstitutions (‘MFI’) enabled us to disburse$170 million in 2007 across 13 countries.These loans will help improve the livelihoodsof 1.2 million people and stimulategrassroots enterprise. We are on track todeliver on our commitment to originateand disburse $500 million by 2011.
In January 2008, we signed loan andco-operation agreements with the ChinaFoundation for Poverty Alleviation at ameeting attended by Premier Wen Jiabaoof the People’s Republic of China andGordon Brown, Prime Minister of theUnited Kingdom. This is the first timean international bank has provided sucha microfinance credit facility in China.
Renewable energyAs with every aspect of business, we have toidentify areas where we can achieve criticalscale and have a distinctive edge in order tocreate long-term value for our stakeholders.
As a leading international bank, wecontinued to leverage our expertise topromote the deployment of clean andrenewable technologies across ourmarkets. In May 2007, we financed theworld’s largest photovoltaic plant inSouth Korea, a project which will reducegreenhouse gas emissions and generatenew jobs and industries.
In September, at the Clinton GlobalInitiative, we committed $8 –10 billion infunding and advisory services over the nextfive years to develop clean technology andrenewable energy in Asia, Africa and theMiddle East. By making our commitmentpublic, we hope to be a catalyst for change,influencing businesses to invest in thetransition to a low-carbon future.
We are also minimising the environmentalimpact of what we do and influencing ourcustomers and suppliers worldwide todo likewise through our sustainablelending practices and our procurementselection process.

Leading with our sustainablebusiness strategy
Incorporating social and environmental issues in our lending policies
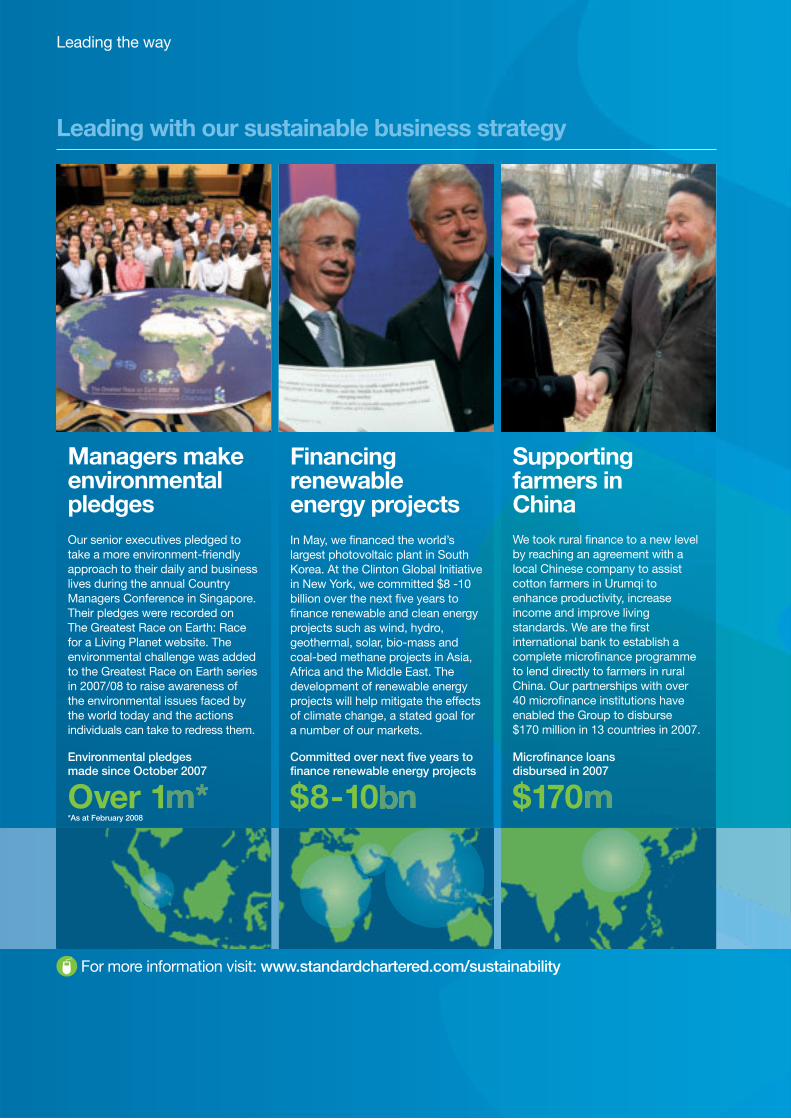
Leading the way
Leading with our sustainable business strategy
Managers makeenvironmentalpledgesOur senior executives pledged totake a more environment-friendlyapproach to their daily and businesslives during the annual CountryManagers Conference in Singapore.Their pledges were recorded onThe Greatest Race on Earth: Racefor a Living Planet website. Theenvironmental challenge was addedto the Greatest Race on Earth seriesin 2007/08 to raise awareness ofthe environmental issues faced bythe world today and the actionsindividuals can take to redress them.
In May, we financed the world’slargest photovoltaic plant in SouthKorea. At the Clinton Global Initiativein New York, we committed $8 -10billion over the next five years tofinance renewable and clean energyprojects such as wind, hydro,geothermal, solar, bio-mass andcoal-bed methane projects in Asia,Africa and the Middle East. Thedevelopment of renewable energyprojects will help mitigate the effectsof climate change, a stated goal fora number of our markets.
Environmental pledgesmade since October 2007
Over 1*As at February 2008
Financingrenewableenergy projects
Committed over next five years tofinance renewable energy projects
$8-10
We took rural finance to a new levelby reaching an agreement with alocal Chinese company to assistcotton farmers in Urumqi toenhance productivity, increaseincome and improve livingstandards. We are the firstinternational bank to establish acomplete microfinance programmeto lend directly to farmers in ruralChina. Our partnerships with over40 microfinance institutions haveenabled the Group to disburse$170 million in 13 countries in 2007.
Supportingfarmers inChina
Microfinance loansdisbursed in 2007
$170
For more information visit:www.standardchartered.com/sustainability

www.standardchartered.com 33
Bus
ines
sRev
iew
critical trends, issues and opportunities thatwe should address.
The Committee also oversees deliveryagainst the Group’s seven sustainablebusiness priorities.
The second change on the governancefront in 2007 involved setting up theWholesale Banking Sustainable BusinessCouncil. The purpose of this Council isto identify and respond to commercialopportunities that help addresssustainability challenges.
We also developed position papers on keysectors such as dams, power generation,forestry and palm oil plantations as well ason key issues such as child labour.
In 2007, we set up two specialisedcommittees to look at certain key areas ofsustainability. These are the EnvironmentCommittee and the Group Financial CrimeRisk Committee. Both are chaired byDr Tim Miller, director for People, Propertyand Assurance.
A detailed report on our performance in2007 with regard to Corporate Governanceissues is available on pages 68-72.
EngagementWe can deliver on our ambitious plansthrough the enthusiasm, talent and skills ofevery employee in the Group. In 2007, wesignificantly stepped up efforts to get allour 70,000 employees engaged through:
• Employee volunteering: Senior executivesled our efforts by getting involved involunteering their skills and thousandsof employees participated as well.
• All employees were provided with accessto a range of tools such as our innovativeand international Carbon Calculatorwhich enable them to measure andreduce the impact of their actions onthe environment.
• The Greatest Race on Earth: Race fora Living Planet encouraged employees,customers and members of the publicto commit to take steps in their daily livesto help improve the environment.Cumulatively, participants have pledgedto save three billion litres of water andtake steps that could save over 100,000trees from being cut down.
Measurement and reviewWe continued to review our progressagainst external measures andcommitments such as the Global ReportingInitiative, the Global Compact and theEquator Principles, reporting progressagainst each of these on our website.
We are pleased that our performancewas recognised by the industry. In 2007,we were included in the FTSE4GoodEnvironment Leaders Europe 40 Indexand the Climate Leadership Index for ourreporting to the Carbon Disclosure Project.We also won the Global Business CoalitionBusiness Excellence Award for using ourcore competencies in addressing HIV/AIDS.
The recognition has made us redoubleour commitment to our brand promise:Leading by Example to be The RightPartner to all our stakeholders. We areconvinced that we can deliver on thispromise through our approach towardsbuilding a sustainable business in ourmarkets. We are focused on deliveringon this commitment. The success of ourbusiness depends on it.
HIV educationOur work on HIV education throughour ‘Living with HIV’ programme and onprevention and treatment of certain formsof blindness such as cataracts through our`Seeing is Believing’ initiative are examplesof how we are making a difference to thelives of many people whilst also helpingto create healthy and stable workforces,another condition for sustainableeconomic growth.
We have extended our HIV educationprogramme to SME Banking clientsand corporate clients to help themmanage HIV/AIDS programmes withintheir workplaces.
In 2007, as part of our Clinton GlobalInitiative commitment to educate one millionpeople by the end of 2010, we partneredwith AIESEC, the world’s largest studentorganisation, to educate 300,000 students.
‘Seeing is Believing’In Phase III of ‘Seeing is Believing’ wereached our goal of raising $10 million by2010, to make a difference to the lives of10 million people, three years ahead oftarget. In 2008, we will launch Phase IV –a more ambitious programme of sustainableeye care targeted at the poor andmarginalised communities in citieswhere the Group has a presence.
GovernanceWe reshaped the strategic direction ofthe two-year-old Corporate Responsibilityand Community Committee, which isa sub-committee of the board, andrenamed it the Sustainability andResponsibility Committee.
The change in the name was deliberate.The role of the Committee is to stretch theGroup’s ambition to build a sustainablebusiness that delivers long-term shareholdervalue, challenge practice and identify the
Business Review: Sustainability continued
Reducing operational impactWe have rolled out initiatives acrossour markets to reduce waste by usingmore recycled paper and ensuring werecycle our waste paper to helpprotect the environment.
Improving anti-money laundering systemsOver the last three years, Standard Charteredhas invested over $55 million in improvedanti-money laundering monitoring systemsand automated surveillance to identifyterrorist finance-related transactions.

Standard Chartered Annual Report and Accounts 2007
Financial Review
34
Group Summary The Group has delivered another strong performance for the year ended 31 December 2007. Profit before taxation rose 27 per cent to $4,035 million, with operating income increasing 28 per cent.
Normalised cost income ratio was 56.0 per cent compared to 55.2 per cent in 2006. Normalised earnings per share increased by 15.8 per cent to 197.6 cents. Further details of basic and diluted earnings per share are provided in note 13 on page 107.
The Group made a number of acquisitions in 2006 and 2007. It has owned Union Bank Limited (‘Union’) since 5 September 2006 and Hsinchu International Bank (‘Hsinchu’) since 19 October 2006.
On 30 December 2006, the assets and business of Union and the Standard Chartered Bank branches in Pakistan were amalgamated into Standard Chartered Bank (Pakistan) Limited. On 30 June 2007, the assets and business of the Standard
Chartered Bank branch in Taiwan were amalgamated into Hsinchu, and the combined entity was renamed Standard Chartered Bank (Taiwan) Limited.
On 5 September 2006, the Group acquired an additional stake of 12.96 per cent in PT Bank Permata Tbk (‘Permata’). The Group completed the acquisitions of Pembroke Group Limited (‘Pembroke’), Harrison Lovegrove & Co. Limited (‘Harrison Lovegrove’) and A Brain Co. Limited (‘A Brain’) on 5 October 2007, 3 December 2007 and 5 December 2007 respectively.
The underlying results of the Group exclude the results of the following:
Standard Chartered Bank (Pakistan) Limited, comprising the Standard Chartered Bank branches in Pakistan and Union; Hsinchu; the incremental stake in Permata; A Brain; Pembroke; and Harrison Lovegrove.
Operating Income and Profit
2007
$million 2006
$million Increase
%
Net interest income 6,265 5,328 18
Fees and commissions income, net 2,661 1,881 41
Net trading income 1,261 920 37
Other operating income 880 491 79
4,802 3,292 46
Operating income 11,067 8,620 28
Operating expenses (6,215) (4,796) 30
Operating profit before impairment losses and taxation 4,852 3,824 27
Impairment losses on loans and advances and other credit risk provisions (761) (629) 21
Other impairment (57) (15) 280
Profit/(loss) from associates 1 (2) N/A
Profit before taxation 4,035 3,178 27
See page 36 for analysis of the underlying results.
The external environment remained generally favourable in the Group’s key markets despite difficulties experienced in the financial markets in the second half of the year.
Operating income grew $2,447 million, or 28 per cent, to $11,067 million. On an underlying basis, operating income grew 23 per cent.
Wholesale Banking had an excellent year, with very strong income growth across all client segments and product categories. In Consumer Banking, strong income growth was achieved in Wealth Management and the SME segment.
The key markets of the Group continued to perform very well, with over 20 per cent income growth achieved in Hong Kong, Singapore and the MESA region. In Hong Kong, operating income exceeded $2 billion and operating profit exceeded $1 billion for the first time. In India and China, operating income grew 60 per cent to $1,308 million and 73 per cent to $498 million, respectively. However, operating conditions remained challenging in Korea, and in the UK, income was adversely impacted by the market turmoil in the second half of the year.
Net interest income was up $937 million, or 18 per cent, to $6,265 million. The increase in net interest income was predominantly from higher average balances and increased volumes from transaction banking and cash management services, together with the growth in current and savings accounts balances across the geographies. Net interest income from trade and lending revenues also grew, particularly in the MESA region. Underlying net interest income grew 12 per cent. Net interest margin was 2.5 per cent, in line with last year.
Non-interest income grew $1,510 million, or 46 per cent, to $4,802 million, with underlying growth of 41 per cent.
Net fees and commissions income increased by $780 million, or
41 per cent, to $2,661 million. On an underlying basis, net fees
and commissions income grew 35 per cent. Robust economic
growth in the Group’s key markets, underpinned by good
economic fundamentals and firmer domestic demand drove stock
markets higher. Strong investor sentiment resulted in increased
demand for investment products and services. As a consequence,
sales of wealth management products such as unit trusts,
insurance and structured investment products increased
significantly. Custody and securities services benefited from
higher volumes in the regional equity markets. Moreover, the
Group achieved an increase in deal flows which drove fee income
growth in syndications, corporate finance and advisory. Trade
finance commission income benefited from higher transaction
volumes, and in transaction banking, payments and cash
management services delivered strong performances, driven
by the growth in commercial balances.
Net trading income increased $341 million, or 37 per cent, to
$1,261 million. On an underlying basis, net trading income grew
32 per cent. A significant proportion of this growth was client
driven, with particularly high growth in derivatives sales. Income
from interest rates and foreign exchange derivatives sales grew
60 per cent as a result of an expansion in product capabilities,
improved electronic channel functionality and a continued focus
on cross-selling. Own account income was broadly unchanged,
as gains in foreign exchange trading were offset by losses
incurred on interest rate derivatives and debt securities trading,
and a $155 million mark-to-market loss incurred on economic
hedges on mortgages in Korea.

Fin
an
cia
l an
d R
isk R
evie
w
www.standardchartered.com
35
Other operating income increased $389 million, or 79 per cent,
to $880 million. On an underlying basis, other operating income
increased 78 per cent, benefiting from higher dividend income
received on structured finance transactions, gains realised from
the sale of private equity investments and the disposal of debt
securities, and a gain of $107 million in relation to the shares
received as a consequence of the restructuring of Visa. Also
included in other operating income is a $109 million foreign
exchange gain realised on the repatriation of Singapore branch
capital. These gains were offset, in part, by a loss of $116 million
on the exchange of capital notes invested in Whistlejacket
Capital Limited (‘Whistlejacket’), a structured investment
vehicle sponsored by the Group, and $87 million in relation to
writedowns on asset backed securities (‘ABS’). Other operating
income also included $98 million (2006: $106 million) of
recoveries in respect of assets that had been fair valued at
acquisition in Korea.
Operating expenses increased $1,419 million, or 30 per cent, to $6,215 million. Underlying expenses grew 24 per cent. Expenses grew mainly due to the increase in staffing levels, particularly in sales staff, and higher performance related pay. Staff costs increased 36 per cent, or $1,036 million, to $3,949 million. Other investments were directed at enhancing the product suite and extending branch networks in China, Hong Kong, India, Pakistan and Korea. The Standard Chartered Private Bank was launched in 11 locations across seven markets. Further expenditure was incurred to upgrade and expand office premises and to strengthen regulatory compliance and control systems.
Operating profit before impairment increased $1,028 million, or 27 per cent, to $4,852 million. On an underlying basis, operating profit before impairment increased by 23 per cent.
The credit environment remained generally favourable during the period, notwithstanding the turbulent market conditions triggered by the sub-prime mortgage crisis in the US. Overall loan impairment charges increased by $132 million, or 21 per cent, to $761 million. The incremental impact from acquisitions of $171 million was offset by a $39 million reduction in the underlying loan impairment charges. In Taiwan, total net impairment charges fell $96 million to $159 million, with underlying impairment falling $199 million due to the improved consumer credit environment, partially offset by a $103 million increase in impairment charges due to the full year impact of the Hsinchu acquisition. In Pakistan, total impairment charges were $65 million higher at $94 million, in part due to the full year impact of the Union acquisition and also as a result of the deteriorating credit environment caused by political uncertainties. In Thailand and India, higher impairment charges were incurred due to a wider deterioration in the unsecured and consumer lending environment.
Other impairment charges increased to $57 million, mainly due to $35 million impairment in asset backed securities and $17 million intangible asset impairment related to Whistlejacket.

Standard Chartered Annual Report and Accounts 2007
Financial Review continued
36
Underlying Results To facilitate effective review of the Group’s results, the table below shows the underlying results.
2007 2006
Acquisitions
$million Underlying
$million As reported
$million Acquisitions
$million Underlying
$million As reported
$million
Net interest income 521 5,744 6,265 218 5,110 5,328
Fees and commissions income, net 216 2,445 2,661 75 1,806 1,881
Net trading income 72 1,189 1,261 21 899 920
Other operating income 18 862 880 8 483 491
306 4,496 4,802 104 3,188 3,292
Operating income 827 10,240 11,067 322 8,298 8,620
Operating expenses (480) (5,735) (6,215) (170) (4,626) (4,796)
Operating profit before impairment losses and taxation 347 4,505 4,852 152 3,672 3,824
Impairment losses on loans and advances and other credit risk provisions (208) (553) (761) (37) (592) (629)
Other impairment – (57) (57) – (15) (15)
Profit/(loss) from associates – 1 1 – (2) (2)
Profit before taxation 139 3,896 4,035 115 3,063 3,178
The effect of the acquisitions on the geographic results is shown below:
2007 2006
Middle East & Other S Asia Acquisitions
$million Underlying
$million As reported
$million Acquisitions
$million Underlying
$million As reported
$million
Operating income 361 1,067 1,428 226 844 1,070
Operating expenses (189) (505) (694) (113) (401) (514)
Loan impairment (94) (49) (143) (29) (24) (53)
Profit before taxation 78 513 591 84 419 503
2007 2006
Other Asia Pacific Acquisitions
$million Underlying
$million As reported
$million Acquisitions
$million Underlying
$million As reported
$million
Operating income 459 1,642 2,101 96 1,288 1,384
Operating expenses (286) (927) (1,213) (57) (728) (785)
Loan impairment (114) (204) (318) (8) (376) (384)
Other impairment – – – – (3) (3)
Profit/(loss) from associates – 2 2 – (4) (4)
Profit before taxation 59 513 572 31 177 208
The acquisition of Pembroke and Harrison Lovegrove are included within the ‘Americas, UK & Europe’ segment. The acquisition of A Brain is included with the ‘Korea’ segment. Additional disclosures of the effect of these acquisitions for these segments have not been made as the impact is not significant.

Fin
an
cia
l an
d R
isk R
evie
w
www.standardchartered.com
37
Consumer Banking The following tables provide an analysis of operating profit by geographic segment for Consumer Banking:
2007
Asia Pacific
Hong Kong
$million Singapore
$million Malaysia $million
Korea $million
Other Asia
Pacific $million
India $million
Middle East
& Other S Asia
$million Africa
$million
Americas UK &
Europe $million
Underlying$million
Consumer Banking
Total $million
Operating income 1,188 471 274 1,142 1,167 408 751 310 95 5,125 5,806
Operating expenses (478) (191) (116) (907) (760) (268) (395) (224) (54) (3,003) (3,393)
Loan impairment (53) (15) (41) (96) (308) (77) (129) (17) – (544) (736)
Operating profit 657 265 117 139 99 63 227 69 41 1,578 1,677
2006
Asia Pacific
Hong Kong
$million Singapore
$million Malaysia $million
Korea $million
Other Asia
Pacific $million
India $million
Middle East
& Other S Asia
$million Africa
$million
Americas UK &
Europe $million
Underlying$million
Consumer Banking
Total $million
Operating income 1,019 367 221 1,146 729 323 545 257 77 4,454 4,684
Operating expenses (428) (142) (101) (799) (445) (201) (280) (194) (51) (2,508) (2,641)
Loan impairment (53) (36) (36) (88) (390) (46) (61) (12) 1 (686) (721)
Operating profit/(loss) 538 189 84 259 (106) 76 204 51 27 1,260 1,322
An analysis of Consumer Banking income by product is set out below:
Operating income by product 2007
$million 2006
$million
Cards, Personal Loans and Unsecured Lending 2,089 1,799
Wealth Management and Deposits 2,621 1,938
Mortgages and Auto Finance 906 780
Other 190 167
Total operating income 5,806 4,684 Consumer Banking’s operating income increased by $1,122 million, or 24 per cent, to $5,806 million. Net interest income grew $649 million, or 18 per cent, to $4,194 million while non-interest income grew $475 million, or 39 per cent, to $1,689 million. Underlying income was up $671 million, or 15 per cent.
In Hong Kong, income growth gained momentum with 17 per cent growth compared with four per cent last year. Elsewhere, income grew strongly in Singapore, Malaysia, the UAE and India. In Korea, operating income was flat year-on-year.
Operating expenses grew $752 million, or 28 per cent, to $3,393 million. Underlying expenses were up $495 million, or 20 per cent. Significant investments were made in China, Hong Kong, Korea, Singapore and India. Investments were made to expand the sales force, with more than 4,000 branch sales consultants, customer relationship managers and direct sales agents recruited in the year. Over 70 new branches were opened and over 600 new ATMs installed or upgraded. The Standard Chartered Private Bank was launched in seven markets and 11 locations and the business in China was incorporated and approvals to conduct additional Renminbi businesses granted, providing further opportunities to grow the franchise.
Loan impairment increased marginally to $736 million. The loan impairment charge in the Taiwan branch decreased by $199 million as the credit environment continued to improve. In Pakistan, loan impairment was higher due to the full year impact of Union and political uncertainties which disrupted collection activities. In Thailand, higher loss rates were experienced due to a wider deterioration in the unsecured loan portfolio. Underlying
loan impairment charges fell 21 per cent, or $142 million, to $544 million.
Operating profit improved $355 million, or 27 per cent, to $1,677 million. Underlying operating profits grew $318 million or 25 per cent, to $1,578 million.
In Hong Kong, income grew $169 million, or 17 per cent, to $1,188 million. Expenses rose $50 million, or 12 per cent. Higher average customer balances in current and savings accounts, and fixed deposits, complemented by improved spreads in current and savings accounts, contributed to the increase in net interest income. Net interest income in mortgages declined as higher new mortgage sales and average balances outstanding were more than offset by intense competition and rising funding costs which adversely affected net interest margins. Net interest income from credit cards, personal loans and other lending were largely unchanged. Higher average loan balances increased personal lending income while lower average balances and rollover rates reduced credit cards income. Against the backdrop of buoyant investor sentiment and ample liquidity, fee income grew significantly as a result of higher unit trust sales, higher insurance premiums and new structured investment products sold. Additional investments were made to expand the sales force, launch the private banking business, open five new branches and relocate and upgrade several other branches. Continued advertising expenditure and direct marketing campaigns were undertaken to support the increased sales initiatives during the period. Operating profit was up 22 per cent to $657 million.
Standard Chartered Annual Report and Accounts 2007
Financial Review continued
38
In Singapore, income was up 28 per cent to $471 million. Net interest income from mortgages increased as a result of significantly higher new mortgage sales and average balances outstanding, against the backdrop of a vibrant domestic property market. Income also grew in credit cards and personal loans and the SME segment. Net interest income from deposit products was lower as the growth in average current and savings accounts balances was offset by a reduction in margins. Higher investment services fees from unit trust sales, structured investment products and foreign exchange services contributed to strong non-interest income growth. Expenses grew $49 million, or 35 per cent, to $191 million. Investments were made to expand the sales force, particularly in the SME segment and in private banking. Two new priority banking centres were opened and a customer service centre upgraded. Loan impairment fell 58 per cent to $15 million, as provisions were reduced in line with improved credit experience. Operating profit increased $76 million, or 40 per cent to $265 million.
In Malaysia, income increased $53 million, or 24 per cent, to $274 million. Operating profit was up by 39 per cent to $117 million. Improved rollover rates in credit cards and increased personal lending volumes, coupled with higher average credit card balances drove net interest income growth. Higher average balances of current and savings accounts compensated for the slight deterioration in savings accounts margin. Income from mortgages grew 11 per cent through tight margin management and anti-attrition efforts despite the stiff competition. Non-interest income was higher, driven by fees from unit trust and insurance sales. Operating expenses increased $15 million, or 15 per cent, to $116 million as investments were made to launch a new flagship branch and seven SME centres during the year, as well as increased personnel costs due to higher headcount and salary adjustments.
In Korea, operating income was marginally lower at $1,142 million. Net interest income grew as income from current and savings accounts increased due to margin improvements, partly offset by lower average balances. Fixed deposit balances reduced during the period as changes to regulations enabled the use of lower cost alternative funding sources to meet statutory liquidity requirements. Strong income growth was achieved in commercial lending to the SME segment with income increasing 42 per cent. Credit cards and personal loan income grew nine per cent, whilst income from mortgages was seven per cent lower due to lower average mortgages outstanding and margin deterioration. While fee income from unit trust, investment and insurance products grew, total non-interest income fell as there were additional charges incurred in relation to dormant accounts and on economic hedges of the mortgage portfolios due to accounting asymmetry, partially offset by a release of $67 million (2006: $55 million) fair value provisions due to further recoveries made. After adjusting for these items, the operating income growth would have been 10 per cent for the year. Expenses grew $108 million, or 14 per cent, to $907 million, with significant investments in distribution channels, over 100 new relationship managers recruited, four additional new branches opened, two branches relocated and 23 priority banking branches upgraded. Loan impairment was $8 million higher at $96 million. Operating profit fell $120 million, or 46 per cent, to $139 million.
In Other Asia Pacific, income grew $438 million, or 60 per cent, to $1,167 million. Expenses grew $315 million, or 71 per cent, to $760 million. Operating profit for the year was $99 million. Underlying income grew $94 million, or 15 per cent, to $742 million. Underlying expenses of the region grew $115 million, or 29 per cent. Loan impairment for the region was $82 million lower, at $308 million. Underlying loan impairment fell by $185 million primarily due to the improved credit environment in Taiwan, and lower impairment in the Philippines and Indonesia. Loan impairment in Thailand, however, increased by $18 million as a result of a wider credit deterioration in the unsecured lending portfolio.
In China, operating income grew 95 per cent, with net interest income growth driven by increased trade and lending volumes, supplemented by a significant increase in income from structured deposits and higher average current and savings accounts balances. Over $60 million of investments were made to customise retail banking products and services, to extend branches and ATM distribution infrastructure, and to increase sales, marketing and support staff. This high level of investment expenditure resulted in an operating loss for the year. In Taiwan, operating income grew by $301 million to $484 million reflecting the full year impact of the Hsinchu acquisition.
In India, income increased $85 million, or 26 per cent, to $408 million while operating expenses increased $67 million, or 33 per cent, to $268 million. Significantly higher average balances and improved margins on current and savings accounts contributed to a 28 per cent increase in overall net interest income. Investment in people, premises and private banking increased expenses. Other significant costs included investments in branches, service centre centralisation, ATMs and technology. Loan impairment increased $31 million, due to a wider deterioration in the unsecured consumer lending environment and increased portfolio impairment provision in unsecured lending and credit cards as the portfolio size increased. Operating profit fell $13 million, to $63 million.
Operating income in the MESA region increased by $206 million, or 38 per cent, to $751 million. Underlying income grew $99 million or 25 per cent. In the UAE, income grew 32 per cent to $302 million. Net interest income increased driven by higher average balances in current and savings accounts. Investment services and insurance continued to drive non-interest income growth. Significant growth in trade finance, business instalment loans and cash management and treasury services resulted in the doubling of operating income from the SME segment. Income in Pakistan grew 72 per cent to $256 million reflecting the full year impact of the Union acquisition. Expenses in the MESA region grew by $115 million, or 41 per cent to $395 million. Underlying expenses grew $58 million, or 29 per cent. Investments were targeted at improving premises infrastructure, expanding distribution channels and increasing the sales force. Additional expenses were also incurred for the integration of the Union acquisition. Loan impairment increased $68 million to $129 million, reflecting higher impairment in Pakistan due to increased political uncertainties, and in the UAE, in relation to the credit cards and unsecured lending portfolios. Operating profit increased $23 million to $227 million for the region.

Fin
an
cia
l an
d R
isk R
evie
w
www.standardchartered.com
39
In Africa, operating profit grew $18 million, or 35 per cent to $69 million. Income grew 21 per cent, as higher volumes and improvements in margins drove deposit net interest income. Income from the SME segment improved as product capability was significantly upgraded to capture the increasing trade finance opportunities.
The Americas, UK & Europe saw an increase in operating profit of $14 million to $41 million. Income grew $18 million, or 23 per cent, to $95 million driven primarily by higher average deposit balances. Operating costs increased as additional expenses were incurred to launch the private banking business and additional recruitment of sales staff.
Product Performance Credit Cards, Personal Loans and Unsecured Lending grew operating income by $290 million, or 16 per cent, to $2,089 million. Underlying income grew nine per cent. This included a $107 million gain in relation to the shares received from the restructuring of Visa, with approximately three quarters of this gain recorded in Hong Kong and Singapore. Asset growth was controlled with stricter credit underwriting and approval policies to ensure the balance between good growth and credit quality was maintained.
Wealth Management and Deposits grew operating income by $683 million, or 35 per cent, to $2,621 million. Underlying income
grew 18 per cent. The continued investment in the development of products and their wider distribution to more markets significantly enhanced the client proposition. Sales volumes of investment products increased over 50 per cent, driving a 38 per cent increase in non-interest income. Net interest income grew due to higher customer balances, with current and savings accounts now representing almost half of the deposit base.
Mortgages and Auto Finance income grew by $126 million, or 16 per cent, to $906 million. Underlying income grew three per cent. Mortgage balances outstanding were broadly unchanged, reflecting competitive pressures in a number of key markets.

Standard Chartered Annual Report and Accounts 2007Standard Chartered Annual Report and Accounts 2007
Financial Review continued
40
Wholesale Banking The following tables provide an analysis of operating profit by geographic segment for Wholesale Banking:
2007
Asia Pacific
Hong Kong
$million
Singapore
$million Malaysia $million
Korea $million
Other Asia
Pacific $million
India $million
Middle East
& Other S Asia
$million Africa
$million
Americas UK &
Europe $million
Underlying$million
Wholesale Banking
Total $million
Operating income 870 421 184 418 933 899 676 485 357 5,097 5,243
Operating expenses (347) (239) (69) (239) (445) (260) (299) (244) (672) (2,724) (2,814)
Loan impairment 3 (1) 3 2 (10) (13) (14) (10) 15 (9) (25)
Other impairment – – – – – – – (2) (55) (57) (57)
Operating profit/(loss) 526 181 118 181 478 626 363 229 (355) 2,307 2,347
2006
Asia Pacific
Hong Kong
$million
Singapore
$million Malaysia $million
Korea $million
Other Asia
Pacific $million
India $million
Middle East
& Other S Asia
$million Africa
$million
Americas UK &
Europe $million
Underlying$million
Wholesale Banking
Total $million
Operating income 596 255 150 380 655 494 525 383 485 3,831 3,923
Operating expenses (292) (152) (63) (173) (336) (174) (234) (219) (508) (2,114) (2,151)
Loan impairment 46 (3) 7 (8) 6 7 8 (14) 43 94 92
Other impairment – – – – (3) – – (9) (3) (15) (15)
Operating profit 350 100 94 199 322 327 299 141 17 1,796 1,849
An analysis of Wholesale Banking income by product is set out below:
Operating Income by product
2007
$million 2006
$million
Trade and Lending 1,236 1,006
Global Markets* 2,673 1,895
Cash Management and Custody 1,334 1,022
Total operating income 5,243 3,923 * Global Markets comprises the following businesses: foreign exchange and derivatives, private equity, debt capital markets, corporate finance and asset and
liability management (‘ALM’).
Wholesale Banking had a very strong year with significantly higher business volumes and income momentum. The key markets of the Group remained resilient in the midst of financial market turbulence. The investments made in a number of businesses and products have driven growth across key geographies.
Operating income grew $1,320 million, or 34 per cent, to $5,243 million. Net interest income was up 16 per cent to $2,071 million while non-interest income increased 50 per cent to $3,095 million. Operating profit increased $498 million, or 27 per cent, to $2,347 million. On an underlying basis, operating income grew 33 per cent.
Client revenues grew 37 per cent. Client income represented approximately four-fifths of total income and remained the key driver of growth. The focus on nurturing key client relationships, attracting new clients, improving product cross-sell and investing in higher-value and strategic products resulted in a broad based income momentum across all client segments.
Operating expenses grew $663 million, or 31 per cent, to $2,814 million. Underlying expenses grew 29 per cent. A large proportion of the cost growth was due to increased performance related pay and personnel costs. Further investments were targeted to expand product capabilities, such as in equity derivatives and in electronic foreign exchange dealing channels, and to broaden principal finance coverage to include the Middle East and Africa. Investments were also made to improve operational efficiencies and service levels, for example, investment in a new documentary
trade system which enables straight through processing as well as expenditure to strengthen the compliance and control systems.
The benign credit environment persisted through most of the year with the recent turmoil in the credit markets having limited impact on the results for the year. Low specific provisions reflected strong risk management discipline and portfolio quality. Loan impairment recoveries were significantly lower, resulting in a net loan impairment charge of $25 million for the year. However, other impairment charges increased to $57 million, mainly due to impairment in asset backed securities of $35 million, and $17 million intangible asset impairment relating to Whistlejacket.
In Hong Kong, income grew $274 million, or 46 per cent, to $870 million. Operating profit grew 50 per cent to $526 million. Higher average client account balances resulting, in part, from strong equity market activities, drove overall net interest income up by $70 million. Higher foreign exchange, options and other derivatives sales contributed significantly to non-interest income growth, with improved trading performance driving own account income. Increased volumes in securities services and higher average assets under management drove custodial services fees higher. In addition, there was strong growth in fees earned from corporate finance and structured finance transactions during the year. Expenses grew $55 million, or 19 per cent, to $347 million with this increase primarily directed towards building the sales force, improving sales and performance incentives and enhancing product capabilities.

Fin
an
cia
l an
d R
isk R
evie
w
www.standardchartered.com
41
Income in Singapore grew $166 million, or 65 per cent, to $421 million. Operating profit grew $81 million, or 81 per cent, to $181 million. Significant contributions from loan syndications, structured finance transactions and private equity gains added over $100 million to overall income growth. Revenues were also higher from foreign exchange and interest rate derivative sales. Own account income was flat with higher ALM income offset by lower trading income from interest rates and foreign exchange derivatives. Expenses grew $87 million, or 57 per cent, to $239 million reflecting increased recruitment, higher salary and performance related incentives and continued investments in product capabilities.
In Malaysia, income increased $34 million, or 23 per cent, to $184 million. Expenses grew $6 million, or 10 per cent, to $69 million. Operating profit increased by 26 per cent to $118 million. Higher average balances contributed to net interest income growth while the growth in non-interest income was principally due to higher fees from syndications, debt financing and corporate advisory. Custody and securities services benefited from higher stock market activities. Income from foreign exchange and derivatives sales grew strongly but this was partly offset by losses incurred on own account trading.
Income in Korea increased $38 million, or 10 per cent, to $418 million. Net interest income increased 11 per cent, as higher average balances drove interest income growth. Trade and lending revenues were broadly unchanged. Non-interest income increased as a result of higher income from foreign exchange and derivatives sales and private equity gains, offset by interest rate derivatives trading losses. During the period, there were $32 million (2006: $51 million) of recoveries on assets that had been fair valued at acquisition, offset by the loss arising from economic hedges due to accounting asymmetry. Excluding these items adjusted operating income growth would have been 31 per cent. Expenses grew $66 million, or 38 per cent, to $239 million. Operating income for the year was $181 million.
Other Asia Pacific region delivered strong income growth of $278 million, or 42 per cent, to $933 million, with expenses rising 32 per cent, to $445 million. Operating profit grew $156 million, or 48 per cent, to $478 million. Underlying income grew $259 million, or 40 per cent, to $899 million. Underlying profit was up 54 per cent.
In China, operating income grew 67 per cent to $379 million. Interest income from cash management was significantly higher, as average deposit balances grew over 50 per cent. Higher utilisation of trade facilities more than compensated for regulatory restrictions which affected lending revenues. Custody and securities services income grew as the number of settled trades and assets under custody increased. Fee income from debt financing and syndications were higher and there was also a gain realised from a private equity investment. In Indonesia, Thailand and the Philippines, there was strong income growth, up 33 per cent, to $345 million, on the back of strong foreign exchange and derivatives sales.
In India, income grew $405 million, or 82 per cent, to $899 million. Operating profit increased 91 per cent to $626 million. A buoyant domestic economy drove capital market activities and improved investor sentiment. Assets under administration and settlement volumes increased significantly amidst a booming equity market. Higher average customer balances and improved liability margins drove interest income higher. In addition, income grew from increased lending to the commercial real estate sector, several large acquisition finance transactions, and higher trade
financing volumes. Fee income growth was generated from corporate finance and advisory, debt capital markets, structured finance transactions and private equity gains. Own account trading income increased with good performance in fixed income and foreign exchange trading. Expenses increased by $86 million, or 49 per cent, to $260 million, with increased hiring of product specialists and sales staff, increased performance related incentives, premises improvements and systems infrastructure expenditure.
Operating income in the MESA region rose $151 million, or 29 per cent, to $676 million. Operating profit grew $64 million, or 21 per cent, to $363 million. Income growth was broad based across the region with most countries generating high growth in operating income and profit. In the UAE, income grew 24 per cent to $261 million. Client revenues grew across most products, notably in cash management and transaction banking, interest rate and foreign exchange derivatives sales, reflecting the benefits of investment in adding product capability and range in recent years. However, own account income was lower due to losses incurred in interest rate derivatives trading. In Bahrain and Qatar, the combined operating income was up over 51 per cent, to $145 million. In Pakistan, income grew 36 per cent, to $105 million, reflecting good underlying growth as well as the full year impact of the Union acquisition. Expenses in the region grew $65 million, or 28 per cent, to $299 million due to higher recruitment levels, premises and infrastructure costs as well as acquisition integration costs.
In Africa, income grew $102 million, or 27 per cent, to $485 million. In Nigeria, income was up 60 per cent to $115 million. In Tanzania, Kenya and Uganda, the combined income grew $36 million, or 34 per cent, to $141 million. Operating income was driven by growth in transaction banking revenues, with average wholesale deposit balances increasing significantly, offsetting a small decline in margins. Higher fees were earned on corporate advisory and debt financing transactions. Expenses increased 11 per cent to $244 million. Operating profit increased $88 million, or 62 per cent, to $229 million.
Operating income in the Americas, UK & Europe decreased by $128 million, or 26 per cent, to $357 million. Expenses grew by $164 million, or 32 per cent, to $672 million. Operating loss for the period was $355 million.
In the Americas, income was up 33 per cent, or $71 million, to $289 million as revenues grew strongly in foreign exchange and derivatives sales, trade and cash management, as well as achieving higher corporate finance and ALM income. Operating expenses were up 15 per cent, or $28 million, to $212 million. Operating profit in the Americas was $86 million, or 72 per cent higher than last year.
In the UK & Europe, income fell $199 million, to $68 million. Growth in client revenues was strong, particularly in foreign exchange and derivatives sales, trade finance and cash management. However this was offset by a loss of $116 million incurred on the exchange of capital notes held in Whistlejacket, and $131 million writedowns and trading losses in asset backed securities incurred in turbulent market conditions during the second half of the year. Operating expenses were up $136 million, to $460 million, reflecting continued investment in product development, new business initiatives, and higher salary costs, mainly performance related pay. Other impairment charges increased, due to a $17 million intangible asset impairment related to Whistlejacket, and $35 million impairment in asset backed securities held.
Standard Chartered Annual Report and Accounts 2007Standard Chartered Annual Report and Accounts 2007
Financial Review continued
42
Product Performance Trade and Lending income increased 23 per cent to $1,236 million, with underlying income growing 19 per cent. Trade income grew as volumes increased, driven in part by supply-chain financing and receivables services, partially offsetting the impact of tightening margins. While higher loan origination activities grew lending assets, this was offset by active loan sales and structured credit transactions to optimise capital deployment. Lending income was up 19 per cent.
Global Markets’ income grew 41 per cent to $2,673 million. Client revenues grew significantly on the back of improved product cross-selling efforts and higher client penetration. Derivatives and foreign exchange sales grew income by 60 per cent. Client income grew over 70 per cent in the debt capital markets and corporate finance units on the back of strong loan syndication and bond issuance volumes, combined with the
completion of several landmark cross-border corporate advisory and project finance transactions. Private equity investments have delivered high return on investments, with a number of realisations during the period. However, own account income was affected by losses due to writedowns and trading losses in asset backed securities of $131 million and a $116 million loss incurred on the exchange of capital notes held in Whistlejacket.
Cash Management and Custody income was up 31 per cent at $1,334 million. Underlying income grew 26 per cent, as higher transaction volumes drove fee income growth, and higher cash balances increased net interest income. Securities assets under administration grew significantly as higher transaction volumes drove increased income in securities services.
Fin
an
cia
l an
d R
isk R
evie
w
www.standardchartered.com
Risk Review
43
Except where indicated (#) the Risk Review is an integral part of the audited financial statements.
Risk Management Review The credit environment in the majority of the Group’s core markets remained generally benign throughout 2007, notwithstanding the turbulent market conditions in some western markets in the second half of the year triggered by the sub-prime mortgage crisis in the United States. The Group’s strategy to pursue growth in Asia, Africa and the Middle East has resulted in no direct exposure to US sub-prime mortgages and extremely limited indirect exposure.
The Group’s liquidity remains strong and is being used to strengthen relationships with key clients and to continue to support growth opportunities.
Market risk is tightly controlled using Value at Risk (‘VaR’) methodologies complemented by stress testing. VaR increased in 2007 as a consequence of increased volatility and growth in the financial markets business of the Wholesale Bank.
The Wholesale Banking portfolio remains robust with new provisions continuing at a low level. The absolute level of recoveries in 2007 was lower than in recent years due to a lower stock of problem accounts after several years of benign credit conditions, and good progress in management of these accounts. Forward credit portfolio quality indicators remain stable. The Wholesale Banking asset backed securities portfolio includes mortgage backed securities and collateralised debt obligations. This portfolio, representing around two per cent of assets, has been affected by the market dislocation but has had limited impact on the Group’s performance. The asset backed securities portfolio continues to be closely monitored and proactively managed.
In 2007, the Consumer Banking credit portfolio performance continued to be driven primarily by country specific factors. Total net loan impairment as a percentage of loans and advances improved marginally year-on-year and gross non-performing loans were significantly lower than at last year end. There was a material improvement in Taiwan’s loan impairment as compared to 2006 due to a more favourable consumer credit climate. The Consumer Banking portfolios in Singapore also performed particularly well in terms of delinquency and impairment. Economic conditions, in part resulting from political instability, led to a deterioration in credit quality in Pakistan and Thailand in 2007.
Good progress is being made on the integration of risk controls and processes into the two acquisitions, Union in Pakistan and Hsinchu in Taiwan.
The requirements of Basel II are broadly consistent with our established approaches to risk measurement: the Group strongly supports the principle of a more risk sensitive approach to capital adequacy, facilitated by the Basel II framework. Accordingly, we are pleased to have received from the Financial Services Authority (‘FSA’) in the United Kingdom approval to use the Advanced Internal Ratings Based approaches for the calculation of credit risk capital, covering the vast majority of our assets globally. We have also received a similar approval from the Hong Kong Monetary Authority in respect of our business there. Management is working closely with other regulators to ensure that the Group is well placed to benefit from the local rollout of Basel II.
Risk Governance Through its risk management framework the Group seeks to efficiently manage credit, market, country and liquidity risk, which arise directly through the Group’s commercial activities, as well as
operational, regulatory and reputational risks which arise as a normal consequence of any business undertaking.
As part of this framework, the Group uses a set of principles that describe the risk management culture the Group wishes to sustain. All risk decisions and risk management activity should be in line with, and in the spirit of, the risk principles of the Group.
The principles of risk management followed by the Group include:
• Balancing risk and reward: risk is taken in support of the requirements of the Group’s stakeholders, in line with the
Group’s strategy and within its risk appetite;
• Responsibility: given the Group is in the business of taking risk, it is everyone’s responsibility to seek to ensure that risk taking is both disciplined and focused. The Group takes account of its social, environmental and ethical responsibilities in taking risk to
produce a return;
• Accountability: risk is taken only within agreed authorities and
where there is appropriate infrastructure and resource. All risk
taking must be transparent, controlled and reported;
• Anticipation: the Group looks to anticipate future risks and
seeks to ensure awareness of all risks; and
• Competitive advantage: the Group seeks competitive
advantage through efficient and effective risk management
and control.
Ultimate responsibility for the effective management of risk rests
with the Board of Standard Chartered PLC. Acting within an
authority delegated by the Board, the Audit and Risk Committee
(‘ARC’), whose members are all Non-Executive Directors of the
Company, reviews specific risk areas and monitors the activities
of the Group Risk Committee (‘GRC’) and the Group Asset and
Liability Committee (‘GALCO’).
The Board’s remit for management of credit risk, country risk,
market risk, operational risk, regulatory risk and reputational risk
is delegated to the GRC.
All the Group Executive Directors (‘GEDs’) of Standard Chartered
PLC, members of the Standard Chartered Bank Court and the
Group Chief Risk Officer are members of the GRC. This
Committee is chaired by the Group Chief Risk Officer.
GALCO, through authority delegated by the Board, is responsible
for the maintenance of capital ratios and the establishment
of, and compliance with, policies relating to balance sheet
management including management of the Group’s liquidity,
capital adequacy and structural foreign exchange rate risk.
GALCO membership consists of all the GEDs of Standard
Chartered PLC and members of Standard Chartered Bank
Court. The committee is chaired by the Group Finance Director.
The committee governance structure seeks to ensure that risk
management standards and policies are cascaded down
through the organisation from the Board through the GRC and
the GALCO to functional, regional and country level committees.
Information is communicated through the country, regional
and functional committees to the Group level committees,
which seeks to ensure that key risk issues are addressed at
the appropriate level and to provide assurance that standards
and policies are being followed.

Standard Chartered Annual Report and Accounts 2007
Risk Review continued
44
Risk Governance continued
The following diagram illustrates the high level committee structure.
Individual GEDs and members of the Standard Chartered Bank Court are accountable for risk management in their businesses and support functions, and for countries where they have governance responsibilities. This includes:
• implementing the policies and standards as agreed by the GRC across all business activities;
• managing risk in line with appetite levels agreed by the GRC; and
• developing and maintaining appropriate risk management infrastructure and systems to facilitate compliance with risk policies.
The Group Executive Director with responsibility for Risk (‘GED Risk’) and the Group Chief Risk Officer manage a Risk function which is independent of the origination and sales functions of the businesses. The Risk function performs the following core activities:
• informs and challenges business strategy, material discussions and processes to encourage rigour, quality, optimisation and transparency in relation to risk efficiency;
• independently controls the risk management processes which seeks to ensure discipline and consistency with risk standards, policy and risk appetite;
• advises on risk management frameworks, the structuring of products and transactions and on the assessment and measurement of risk;
• facilitates and manages risk processes which seeks to ensure operational efficiency, effectiveness and best practice; and
• communicates with stakeholders to demonstrate compliance with requirements in relation to risk management.
The Group’s Risk Management Framework (‘RMF’) identifies the risk types, each of which is managed by a designated Risk Type Owner (‘RTO’). The RTOs, who are all approved persons under the FSA regulatory framework, have responsibility for establishing minimum standards and governance and for implementing governance and assurance processes. The RTOs report up through specialist risk committees to the GRC or GALCO.
The GED Risk and the Group Chief Risk Officer, together with Director, People, Property and Assurance and Group Internal Audit, provide assurance, independent from the businesses, that risk is being measured and managed in accordance with the Group’s standards and policies.
Standard Chartered PLC Board
Standard Chartered Bank Court
Audit and Risk Committee
Group Asset and Liability Committee (GALCO)
Wholesale Banking Risk
Committee
Consumer Banking Risk
CommitteeCapital
Management
Committee
Tax Management
Committee
Liquidity
Management
CommitteeGroup Credit
Committee
Group Market Risk
Committee
Group Reputaional Risk and
Responsibility Committee
Group Compliance and
Regulatory Risk Committee
Group Operational Risk
Committee
Other Risk Type
Committee
Group risk committee structure
Group Risk Committee (GRC)
Risk types
eg. Credit, Market, Operational, Liquidity and Reputational
Risk Management Standards Global Policies and Procedures
Wholesale and Consumer Banking Policies and Procedures
Countries – Local Policy Addenda and Procedures
Assura
nces
Risk management framework

Fin
an
cia
l an
d R
isk R
evie
w
www.standardchartered.com
45
Risk Appetite Risk appetite is an expression of the amount of risk the Group is prepared to take to achieve its strategic objectives. The Group’s risk appetite defines the acceptable level of earnings volatility. Recognising a range of outcomes as business plans are implemented, risk appetite reflects the Group’s capacity to sustain potential losses at varying levels of probability, based on available capital resources.
The Group has defined its risk appetite in the context of three key criteria: the overall capacity to take risk; balancing the expectations of all key stakeholders; and support for the Group’s credit rating.
The Group uses a range of quantitative risk indicators including capital ratios, profitability, return on equity, portfolio credit risk profile and market risk VaR, through which senior management monitor the Group’s risk profile. In addition to financial measures of risk, the Group also controls risk through concentration caps and underwriting policies. Measures vary by country, business and product area.
The annual business planning and regular performance management processes aim to ensure the expression of risk appetite remains appropriate.
Stress Testing Stress testing and scenario analysis are used to assess the financial and management capability of the Group to continue operating effectively under extreme but plausible trading conditions. Such conditions may arise from economic, legal, political, environmental, and social factors.
Stress testing and scenario analysis help to inform management with respect to:
• the identification of potential future risks;
• the setting of the Group’s risk appetite;
• the nature and dynamics of the risk profile;
• the robustness of risk management systems and controls;
• the adequacy of contingency planning; and
• the effectiveness of risk mitigants.
The diagram below illustrates the stress testing framework, which has been implemented to meet the following requirements:
• enable the Group to set and monitor its risk appetite;
• identify key risks to the Group’s strategy, financial position, and reputation;
• assess the impact on the Group’s profitability and business plans;
• seek to ensure effective governance, processes and systems are in place to co-ordinate and integrate stress testing;
• inform senior management; and
• satisfy regulatory requirements.
The stress testing forum is led by the Risk function with participation from the businesses, Finance and Group Treasury. Its primary objective is to seek to ensure the Group understands the earnings volatility and capital implications of given stress scenarios. A key responsibility of the stress testing forum is to generate and consider pertinent and plausible scenarios that have the potential to adversely affect the Group.
In view of recent market turbulence, stress testing activity has been intensified at country, business and Group levels, with specific focus on certain asset classes, client segments and the potential impact of macro economic factors. Stress tests have taken into consideration possible future scenarios that could arise as a result of prevailing market conditions. The stress tests provide the Group with an understanding of the way in which its portfolios may react to stress events and the management actions that would need to be taken if these scenarios unfold. The results confirm that the Group’s geographic and business diversity reduce the impact at a Group level with no material vulnerabilities in the short-term in the Group’s overall portfolio.
Stress testing framework
Management
ActionAnalysis
Scenario
Selection
Business Stress
Testing
Country Stress
Testing
Risk Type
Stress Testing
Risk types
eg. Credit, Market, Operational, Liquidity and Reputaional
Stress Testing Forum
Risk Type Owners, Chief Risk Officers,Group Risk, Global Research and
Regional Representatives
Standard Chartered Annual Report and Accounts 2007
Risk Review continued
46
Credit Risk Credit Risk Management Credit risk is the risk that a counterparty to a financial instrument will cause a financial loss for the Group by failing to discharge an obligation.
Credit exposures include both individual borrowers and groups of connected counterparties, and portfolios in the banking and trading books.
The Group Chief Credit Officer (‘GCCO’) is the RTO for credit risk. The standards and Group-wide credit policies recommended by the GCCO are considered and approved by the GRC, which also oversees the delegation of credit authorities.
Policies and procedures that are specific to each business are established by both Consumer and Wholesale Banking. These are consistent with the Group-wide credit policies, but are adapted to reflect the different risk environments and portfolio characteristics. There are Chief Risk Officers for both the Consumer and Wholesale Banking businesses, who have their primary reporting line into the Group Chief Risk Officer. This ensures the independence of the Risk function from the origination and sales functions.
Risk Mitigation Collateral types which are eligible for risk mitigation include: cash; residential, commercial and industrial property; fixed assets such as motor vehicles, aircraft, plant and machinery; marketable securities; commodities; bank guarantees and letters of credit. The Group also enters into collateralised reverse repurchase agreements. Risk mitigation policies control the approval of collateral types.
Collateral is valued in accordance with the Group’s risk mitigation policy, which prescribes the frequency of valuation for different collateral types. The valuation frequency is driven by the level of price volatility of each type of collateral.
Collateral held against impaired loans is maintained at fair value. The valuation of collateral is monitored regularly and is back-tested at least annually.
Concentration Risk Credit concentration risk in the Wholesale Banking portfolio is managed through the Credit Issues Forum, which is chaired by the Wholesale Bank Chief Risk Officer and comprises members of senior management from the Risk function and the business. Various concentration dimensions are assessed including industry sector, geographic spread, credit rating, customer segment and exposure to single counterparties or groups of related counterparties.
Credit concentration risk in Consumer Banking is managed within exposure limits set for each product segment in each country. These limits are reviewed at least annually and are approved by the responsible business and risk officer in accordance with their delegated authority level.
Derivatives The credit risk arising from derivatives is managed as part of the overall lending limits to banks and customers. The amount of credit risk is the current positive fair value of the underlying contract together with potential exposures from future market movements. The Group further limits its exposure to credit losses in the event of default by entering into master netting agreements with certain market counterparties. As required by IAS 32, exposures are not presented net in the financial statements as in the ordinary course of business they are not intended to be settled net.
Where appropriate, derivatives are used to reduce credit risks in the portfolio. Due to their potential impact on income volatility,
derivatives are only used in a controlled manner and within a pre-defined volatility expectation.
Securities Within Wholesale Banking, the Underwriting Committee approves the portfolio limits and parameters by business units for the underwriting and purchase of all pre-defined securities assets to be held for sale. The Underwriting Committee is established under the authority of the GRC. The business operates within set limits, which include country, single issuer, holding period and credit grade limits. The Underwriting Committee approves underwriting applications. Day to day credit risk management activities are carried out by Markets & Institution Risk Management (‘MIRM’) whose activities include oversight and approval of temporary excesses within the levels as delegated by the Underwriting Committee.
Issuer risk monitoring is performed by Group Market Risk, whilst the counterparty pre-settlement and settlement risk arising on the sale and purchase of securities is monitored by MIRM. The price risk in respect of these assets is controlled by the Market Risk function.
Wholesale Banking Credit Risk Credit risk is managed through a framework which sets out policies and procedures covering the measurement and management of credit risk. There is a clear segregation of duties between transaction originators and the approvers in the Risk function.
An alphanumeric grading system is used for quantifying the
risk associated with a counterparty. The grading is based on a
probability of default measure, with customers analysed against
a range of quantitative and qualitative measures. The numeric
grades run from 1 to 14. Counterparties with lower credit grades
are assessed as being less likely to default. An A to C scale is assigned to the original numeric rating scale, to enable more
granular mapping of the probability of default, which results
in more refined risk assessment, risk control and pricing. A
counterparty with an A suffix has a lower probability of default
than a counterparty with a C suffix. Credit grades 1A to credit
grade 12C are assigned to performing customers while credit grades 13 and 14 are assigned to non-performing
(or defaulted) customers.
There is no direct relationship between the Group’s internal credit
grades and those used by external rating agencies. The Group’s
credit grades are not intended to replicate external credit grades,
although as the factors used to grade a borrower are often similar, a borrower rated poorly by an external rating agency
is typically rated in the lower rank of the Group’s internal
credit grades.
In addition to nominal aggregate exposure, expected loss is
used in the assessment of individual exposures and for portfolio
analysis. Expected loss is the long-run average credit loss across a range of typical economic conditions. It is used in the delegation
of credit approval authority and must be calculated for every
transaction to determine the appropriate level of approval.
Significant exposures are reviewed and approved centrally
through a Group or regional level credit committee. These
committees derive their authority from GRC.
To assist risk officers in monitoring the portfolio, various
internal risk management reports are available on a regular
basis, providing individual counterparty, counterparty group
and portfolio exposure information, credit grade migration
information, the status of accounts showing signs of weakness
or financial deterioration and updates on credit markets. Internal Ratings Based (‘IRB’) portfolio metrics are widely used.

Fin
an
cia
l an
d R
isk R
evie
w
www.standardchartered.com
47
Credit Risk continued Consumer Banking Credit Risk Credit risk in Consumer Banking is also managed through a framework of policies and procedures. Credit origination uses standard application forms, which are processed in central units using largely automated approval processes. Where appropriate to the customer, the product or the market, a manual approval process is in place. As with Wholesale Banking, origination and approval roles are segregated.
To aid Credit Managers in portfolio management, regular internal risk management reports contain information on key environmental and economic trends across major portfolios and countries, portfolio delinquency and loan impairment performance, as well as IRB portfolio metrics including migration across credit grades and other trends.
Credit grades within Consumer Banking are based on a probability of default calculated using advanced IRB models.
For portfolios where such models have not yet been developed, the probability of default is calculated using portfolio delinquency flow rates. An alphanumeric grading system identical to that of the Wholesale Banking business is used as an index of portfolio quality.
Loan Portfolio Loans and advances to customers have grown by $16.5 billion to $157.0 billion.
The total Consumer Banking portfolio has grown by $3.6 billion since December 2006. The majority of the growth has been in the SME business, with nearly half of that growth coming from Korea. The Singapore mortgage portfolio also grew significantly, fuelled by a buoyant property market.
Growth in the Wholesale Banking customer portfolio was $12.9 billion, or 21 per cent. Over 40 per cent of that growth was in Asia Pacific, widely spread across a number of countries in that region. The significant growth in Americas, UK & Europe primarily reflects the increased contribution from the Global Markets products.
Exposures to banks grew by 79 per cent. This reflects the Group’s strong liquidity position, with much of that liquidity placed with high quality bank counterparties. The growth was well spread across geographies, with about two-thirds of it in Asia Pacific.
Single borrower concentration risk has been mitigated by active distribution of assets to banks and institutional investors. The Group has achieved additional risk distribution through credit default swaps and synthetic risk transfer structures.
The Wholesale Banking portfolio remains well diversified across both geography and industry, with no significant concentration within the industry classifications of Manufacturing; Financing, insurance and business services; Commerce; or Transport, storage and communication.
2007
Asia Pacific
Hong Kong
$million Singapore
$million Malaysia $million
Korea $million
Other Asia
Pacific $million
India $million
Middle East & Other
S Asia $million
Africa $million
Americas UK &
Europe$million
Total $million
Loans to individuals
Mortgages 11,845 4,615 2,441 22,634 6,333 1,638 493 254 120 50,373
Other 2,288 1,396 1,002 4,712 3,929 1,208 2,829 615 170 18,149
Small and medium enterprises 1,188 1,687 828 5,937 2,375 920 660 143 2 13,740
Consumer Banking 15,321 7,698 4,271 33,283 12,637 3,766 3,982 1,012 292 82,262
Agriculture, forestry and fishing 16 163 102 26 186 51 193 335 529 1,601
Construction 111 35 38 204 246 225 487 48 27 1,421
Commerce 1,865 2,094 369 434 2,510 722 2,430 703 1,758 12,885
Electricity, gas and water 550 76 45 176 352 9 411 277 883 2,779
Financing, insurance and business services 2,129 1,858 606 910 2,276 566 1,517 227 4,540 14,629
Governments – 3,220 3,941 8 26 – 341 8 265 7,809
Mining and quarrying – 31 8 93 159 65 238 138 2,722 3,454
Manufacturing 1,908 701 453 3,533 5,896 1,789 1,524 374 3,727 19,905
Commercial real estate 1,050 675 3 1,094 995 364 99 8 10 4,298
Transport, storage and communication 313 323 209 124 680 137 709 196 1,660 4,351
Other 148 338 7 424 268 18 796 22 102 2,123
Wholesale Banking 8,090 9,514 5,781 7,026 13,594 3,946 8,745 2,336 16,223 75,255
Portfolio impairment provision (47) (40) (25) (80) (182) (56) (81) (18) (6) (535)
Total loans and advances to customers 23,364 17,172 10,027 40,229 26,049 7,656 12,646 3,330 16,509 156,982
Total loans and advances to banks 15,156 2,531 928 1,504 4,866 552 1,406 371 10,365 37,679
Total loans and advances to customers include $2,716 million held at fair value through profit or loss. Total loans and advances to banks include $2,314 million held at fair value through profit or loss.

Standard Chartered Annual Report and Accounts 2007
Risk Review continued
48
2006
Asia Pacific
Hong Kong
$million Singapore
$million Malaysia $million
Korea $million
**Other Asia
Pacific $million
India $million
*Middle East & Other
S Asia $million
Africa $million
Americas UK &
Europe $million
*Total $million
Loans to individuals
Mortgages 11,245 3,551 2,593 23,954 5,968 1,492 416 239 155 49,613
Other 2,235 1,028 771 4,612 4,523 928 2,650 483 537 17,767
Small and medium enterprises 919 1,548 883 4,907 2,023 567 323 133 – 11,303
Consumer Banking 14,399 6,127 4,247 33,473 12,514 2,987 3,389 855 692 78,683
Agriculture, forestry and fishing 53 13 53 20 108 25 65 159 297 793
Construction 57 29 26 262 181 198 332 78 2 1,165
Commerce 1,986 1,320 331 348 1,407 608 1,995 457 1,269 9,721
Electricity, gas and water 176 17 56 31 314 26 193 80 815 1,708
Financing, insurance and business services 1,817 1,664 724 1,176 1,901 479 1,245 182 3,264 12,452
Governments – 3,328 3,397 13 20 – 4 – 235 6,997
Mining and quarrying – 3 – 50 324 32 352 110 1,624 2,495
Manufacturing 2,282 701 228 3,208 4,756 1,435 1,848 406 2,504 17,368
Commercial real estate 819 708 5 849 720 231 27 7 – 3,366
Transport, storage and communication 277 338 149 189 495 249 810 173 1,647 4,327
Other 220 406 9 496 357 5 314 39 115 1,961
Wholesale Banking 7,687 8,527 4,978 6,642 10,583 3,288 7,185 1,691 11,772 62,353
Portfolio impairment provision (49) (28) (26) (86) (246) (33) (58) (10) (6) (542)
Total loans and advances to customers 22,037 14,626 9,199 40,029 22,851 6,242 10,516 2,536 12,458 140,494
Total loans and advances to banks 6,474 939 161 1,753 4,462 477 1,058 387 5,353 21,064
* Amounts have been restated as explained in note 51 on page 154.
** Amounts have been re-presented following a re-analysis of acquired loan portfolios.
Total loans and advances to customers include $1,194 million held at fair value through profit or loss. Total loans and advances to banks include $1,340 million held at fair value through profit or loss.

Fin
an
cia
l an
d R
isk R
evie
w
www.standardchartered.com
49
Maturity Analysis Approximately 51 per cent of the Group’s loans and advances to customers are short term having a contractual maturity of one year or less. The Wholesale Banking portfolio is predominantly short term, with 79 per cent of loans and advances having a contractual maturity of one year or less. In Consumer Banking, 61 per cent of the portfolio is in the mortgage book, traditionally longer term in nature and well secured. Whilst
the Other and SME loans in Consumer Banking have short contractual maturities, typically they may be renewed and repaid over longer terms in the normal course of business.
The following tables show the maturity of loans and advances to customers by each principal category of borrower’s business or industry:
.
2007
One year or less
$million
One to five years
$million
Over five years
$million Total
$million
Loans to individuals
Mortgages 3,490 8,027 38,856 50,373
Other 8,941 7,325 1,883 18,149
Small and medium enterprises 8,028 3,494 2,218 13,740
Consumer Banking 20,459 18,846 42,957 82,262
Agriculture, forestry and fishing 1,332 227 42 1,601
Construction 1,128 249 44 1,421
Commerce 11,585 1,066 234 12,885
Electricity, gas and water 1,727 398 654 2,779
Financing, insurance and business services 12,073 2,054 502 14,629
Governments 7,618 86 105 7,809
Mining and quarrying 1,515 1,029 910 3,454
Manufacturing 15,603 3,128 1,174 19,905
Commercial real estate 2,761 1,510 27 4,298
Transport, storage and communication 2,373 980 998 4,351
Other 1,704 348 71 2,123
Wholesale Banking 59,419 11,075 4,761 75,255
Portfolio impairment provision (535)
156,982
2006*
One year or less
$million
One to five years
$million
Over five years
$million Total
$million
Loans to individuals
Mortgages 4,378 8,729 36,506 49,613
Other 9,141 6,393 2,233 17,767
Small and medium enterprises 6,299 2,812 2,192 11,303
Consumer Banking 19,818 17,934 40,931 78,683
Agriculture, forestry and fishing 637 63 93 793
Construction 973 161 31 1,165
Commerce 9,015 630 76 9,721
Electricity, gas and water 762 334 612 1,708
Financing, insurance and business services 9,401 2,296 755 12,452
Governments 6,759 117 121 6,997
Mining and quarrying 1,836 231 428 2,495
Manufacturing 13,951 2,239 1,178 17,368
Commercial real estate 1,996 1,343 27 3,366
Transport, storage and communication 2,079 1,360 888 4,327
Other 1,177 431 353 1,961
Wholesale Banking 48,586 9,205 4,562 62,353
Portfolio impairment provision (542)
140,494
* Amounts have been restated as explained in note 51 on page 154.

Standard Chartered Annual Report and Accounts 2007
Risk Review continued
50
Problem Credit Management and Provisioning Consumer Banking Within Consumer Banking, an account is considered to be delinquent when payment is not received on the due date. For delinquency reporting purposes, the Group follows industry standards, measuring delinquency as of 30, 60, 90, 120, and 150 days past due. Accounts that are overdue by more than 30 days are closely monitored and subject to specific collections processes.
The process used for raising provisions is dependent on the product. For mortgages, individual impairment provisions (‘IIP’) are generally raised at 150 days past due based on the difference between the outstanding amount of the loan, and the present value of the estimated future cash flows which includes the realisation of collateral. For other secured loans (where the collateral value is typically realised in less than 12 months), loan impairment is calculated using the forced sale value of the collateral without further discounting. For unsecured products, individual provisions are raised for the entire outstanding amount at 150 days past due. For all products there are certain accounts, such as cases involving bankruptcy, fraud and death, where the loss recognition process is accelerated.
A portfolio impairment provision (‘PIP’) is held to cover the inherent risk of losses which, although not identified, are known through experience to be present in the loan portfolio. PIP covers
both loans for which payments are current and loans overdue for less than 150 days.
The PIP is set with reference to past experience using a flow rate methodology, as well as taking account of judgemental factors such as the economic and business environment in core markets, and the trends in a range of portfolio indicators. These include flow rates across all delinquency buckets, portfolio loss severity, collections and recovery performance trends.
Non-performing loans are loans past due by more than 90 days or have an individual impairment provision raised against them. The cover ratio reflects the extent to which the gross non-performing loans are covered by the individual and portfolio impairment provisions.
The table below sets out the total non-performing loans in Consumer Banking, which includes $517 million (2006: $909 million) of net individually impaired loans (note 21). The significant decrease in non-performing loans is a result of improved conditions in Taiwan, strong performance in Singapore, and improvements in SME portfolio quality in Korea.
The following table sets out the total non-performing portfolio in Consumer Banking:
2007
Asia Pacific
Hong Kong
$million Singapore
$millionMalaysia $million
Korea $million
Other Asia
Pacific $million
India $million
Middle East & Other
S Asia $million
Africa $million
Americas UK &
Europe$million
Total $million
Loans and advances
Gross non-performing 65 61 166 336 475 56 126 38 1 1,324
Individual impairment provision (24) (26) (38) (125) (329) (19) (75) (18) (1) (655)
Non-performing loans net of individual impairment provision 41 35 128 211 146 37 51 20 – 669
Portfolio impairment provision (412)
Net non-performing loans and advances 257
Cover ratio 81%
2006
Asia Pacific
Hong Kong
$million Singapore
$millionMalaysia $million
Korea $million
*Other Asia
Pacific $million
India $million
*Middle East & Other
S Asia $million
Africa $million
Americas UK &
Europe $million
*Total $million
Loans and advances
Gross non-performing 80 100 202 531 821 48 98 24 5 1,909
Individual impairment provision (29) (38) (67) (239) (387) (17) (62) (10) (3) (852)
Non-performing loans net of individual impairment provision 51 62 135 292 434 31 36 14 2 1,057
Portfolio impairment provision (448)
Net non-performing loans and advances 609
Cover ratio* 68%
* Individual impairment provisions relating to the finalisation of acquisition fair values have been restated as explained in note 51 on page 154. Gross non-
performing loans within ‘Other Asia Pacific’ have been increased by $153 million to reflect additional non-performing loans identified as part of these fair values.

Fin
an
cia
l an
d R
isk R
evie
w
www.standardchartered.com
51
Wholesale Banking In Wholesale Banking, accounts or portfolios are placed on Early Alert when they display signs of weakness or financial deterioration, for example where there is a rapid decline in the client’s position within the industry, a breach of covenants, non-performance of an obligation, or there are issues relating to ownership or management.
Such accounts and portfolios are subject to a dedicated process with oversight involving senior officers from the Risk function and Group Special Asset Management (‘GSAM’), the specialist recovery unit. Account plans are re-evaluated and remedial actions are agreed and monitored. Remedial actions include, but are not limited to, exposure reduction, security enhancement, exit of the account or immediate movement of the account into the control of GSAM.
Loans are classified as impaired and considered non-performing where analysis and review indicates that full payment of either interest or principal is questionable, or as soon as payment of interest or principal is 90 days overdue. Impaired accounts are managed by GSAM which is independent of the main businesses of the Group. Where any amount is considered uncollectable, an individual impairment provision is raised, being the difference between the loan carrying amount and the present value of estimated future cash flows.
Future cash flows are estimated by taking into account the individual circumstances of each customer and can arise from
operations, sales of assets or subsidiaries, realisation of collateral or payments under guarantees. Cash flows from all available sources are considered. In any decision relating to the raising of provisions, the Group attempts to balance economic conditions, local knowledge and experience, and the results of independent asset reviews.
Where it is considered that there is no realistic prospect of recovering an element of an exposure against which an impairment provision has been raised, then that amount will be written off.
As with Consumer Banking, a PIP is held to cover the inherent risk of losses which, although not identified, are known through experience to be present in any loan portfolio. In Wholesale Banking, the PIP is set with reference to past experience using loss rates, and judgemental factors such as the economic environment and the trends in key portfolio indicators.
The cover ratio reflects the extent to which gross non-performing loans are covered by individual and portfolio impairment provisions. At 75 per cent, the Wholesale Banking non-performing portfolio is well covered. The balance uncovered by individual impairment provision represents the value of collateral held and/or the Group’s estimate of the net value of any work-out strategy.
The following table sets out the total non-performing portfolio in Wholesale Banking, which includes net individually impaired loans of $372 million (2006: $538 million) (note 21):
2007
Asia Pacific
Hong Kong
$million Singapore
$millionMalaysia $million
Korea $million
Other Asia
Pacific $million
India $million
Middle East & Other
S Asia $million
Africa $million
Americas UK &
Europe$million
Total $million
Loans and advances
Gross non-performing 92 26 23 47 358 27 147 79 193 992
Individual impairment provision (50) (18) (21) (12) (235) (25) (122) (48) (87) (618)
Non-performing loans and advances net of individual impairment provision 42 8 2 35 123 2 25 31 106 374
Portfolio impairment provision (124)
Net non-performing loans and advances 250
Cover ratio 75%

Standard Chartered Annual Report and Accounts 2007
Risk Review continued
52
Wholesale Banking continued
2006
Asia Pacific
Hong Kong
$million Singapore
$millionMalaysia $million
Korea $million
*Other Asia
Pacific $million
India $million
*Middle East & Other
S Asia $million
Africa $million
Americas UK &
Europe$million
*Total $million
Loans and advances
Gross non-performing 167 69 29 110 626 24 121 100 152 1,398
Individual impairment provision (130) (46) (25) (46) (238) (22) (114) (58) (151) (830)
Non-performing loans and advances net of individual impairment provision 37 23 4 64 388 2 7 42 1 568
Portfolio impairment provision (95)
Net non-performing loans and advances 473
Cover ratio* 66%
* Individual impairment provisions relating to the finalisation of acquisition fair values have been restated as explained in note 51 on page 154. Gross non-performing
loans within ‘Other Asia Pacific’ have been increased by $375 million to reflect additional non-performing loans identified as part of these fair values.
2007
Asia Pacific
Hong Kong
$million Singapore
$millionMalaysia $million
Korea $million
Other Asia
Pacific $million
India $million
Middle East & Other
S Asia $million
Africa $million
Americas UK &
Europe$million
Total $million
Gross impairment charge 22 7 1 5 11 13 18 15 2 94
Recoveries/provisions no longer required (25) (9) (4) (3) (5) (7) (11) (14) (17) (95)
Net individual impairment (credit)/charge (3) (2) (3) 2 6 6 7 1 (15) (1)
Portfolio impairment provision 26
Net impairment charge 25
2006
Asia Pacific
Hong Kong
$million Singapore
$millionMalaysia $million
Korea $million
Other Asia
Pacific $million
India $million
Middle East & Other
S Asia $million
Africa $million
Americas UK &
Europe$million
Total $million
Gross impairment charge 14 9 2 7 3 9 10 19 7 80
Recoveries/provisions no longer required (50) (6) (8) (3) (11) (19) (18) (6) (49) (170)
Net individual impairment (credit)/charge (36) 3 (6) 4 (8) (10) (8) 13 (42) (90)
Portfolio impairment provision (2)
Net impairment credit (92)

Fin
an
cia
l an
d R
isk R
evie
w
www.standardchartered.com
53
Movement in Group Individual Impairment Provision The following tables set out the movements in the Group’s total individual impairment provision against loans and advances:
2007
Asia Pacific
Hong Kong
$million Singapore
$millionMalaysia $million
Korea $million
Other Asia
Pacific $million
India $million
Middle East & Other
S Asia $million
Africa $million
Americas UK &
Europe$million
Total $million
Provisions held at 1 January 2007 159 84 92 285 625 39 176 68 154 1,682
Exchange translation differences – 2 5 (1) 6 5 (3) 5 1 20
Amounts written off (161) (62) (92) (128) (468) (84) (115) (19) (54) (1,183)
Recoveries of acquisition fair values – – – (98) – – – – – (98)
Recoveries of amounts previously written off 34 12 16 – 42 19 12 1 3 139
Discount unwind (4) (4) (4) (21) (28) (1) (1) (2) (1) (66)
Other – – – – 2 1 7 – – 10
New provisions 113 52 109 119 484 98 170 35 2 1,182
Recoveries/provisions no longer required (67) (40) (67) (19) (99) (33) (49) (22) (17) (413)
Net charge against/(credit to) profit 46 12 42 100 385 65 121 13 (15) 769
Provisions held at 31 December 2007 74 44 59 137 564 44 197 66 88 1,273
2006
Asia Pacific
Hong Kong
$million Singapore
$millionMalaysia $million
Korea $million
*Other Asia
Pacific $million
India $million
*Middle East & Other
S Asia $million
Africa $million
Americas UK &
Europe$million
*Total $million
Provisions held at 1 January 2006 279 140 96 361 179 40 64 60 167 1,386
Exchange translation differences – 7 6 29 8 1 (2) (1) 9 57
Amounts written off (119) (108) (51) (64) (403) (64) (88) (17) (48) (962)
Recoveries of acquisition fair values – – – (106) – – – – – (106)
Recoveries of amounts previously written off 49 8 11 8 18 17 12 2 3 128
Acquisitions – – – – 463 – 144 – – 607
Discount unwind (2) (2) (4) (32) (7) (1) – (2) (2) (52)
Other (63) – – 14 1 1 – – 67 20
New provisions 126 71 94 131 403 76 79 44 9 1,033
Recoveries/provisions no longer required (111) (32) (60) (56) (37) (31) (33) (18) (51) (429)
Net charge against/(credit to) profit 15 39 34 75 366 45 46 26 (42) 604
Provisions held at 31 December 2006 159 84 92 285 625 39 176 68 154 1,682
* Amounts have been restated as explained in note 51 on page 154.

Standard Chartered Annual Report and Accounts 2007
Risk Review continued
54
Asset Backed Securities#
Total exposures to Asset Backed Securities#
At 31 December 2007, the Group had the following exposures to asset backed securities prior to writedowns noted below:
Asset Securitisation
Group$million
Purchased from Whistlejacket
$million Total
$million
Percentage of Portfolio
%
Residential Mortgage Backed Securities (‘RMBS’) 607 1,316 1,923 33
Collateralised Debt Obligations (‘CDO’) 219 491 710 12
Commercial Mortgage Backed Securities (‘CMBS’) 830 308 1,138 19
Other Asset Backed Securities (‘Other ABS’) 970 1,115 2,085 36
2,626 3,230 5,856 100
Writedowns of Asset Backed Securities#
Asset Securitisation Group
Trading$million
Available -for-sale$million
**Purchased from Whistlejacket
$million Total
$million
2007
Charge to available-for-sale reserves – (38) (45) (83)
Charge to the profit and loss account (44) (122) † (116) (282)
2008*
Charge to available-for-sale reserves – (21) (15) (36)
Charge to the profit and loss account (13) – – (13)
* Movements from 1 January 2008 to 31 January 2008.
** All classified as available-for-sale. † This relates to the loss incurred on the exchange of capital notes held in Whistlejacket.
The credit quality of the asset backed securities remains strong. With the exception of those securities which have been subject to an impairment charge, 98 per cent of the overall portfolio is rated A, or better, and 86 per cent of the overall portfolio rated at AAA. The portfolio is broadly diversified across asset classes and geographies and there is no direct exposure to the US sub- prime market.
33 per cent of the overall portfolio is invested in RMBS, with a weighted average credit rating of AAA. Over 60 per cent of the underlying residential mortgage exposures were originated in 2005 or earlier years.
12 per cent of the overall portfolio is in CDOs. This includes $291 million exposures to Mezzanine and High Grade CDOs, of which $122 million have been fully provided for in the profit and loss account. The remainder of the CDOs have a weighted average credit rating of AAA.
19 per cent of the overall portfolio is in CMBS, of which $159 million is in respect of US CMBS. The weighted average credit rating of the CMBS is AA.
36 per cent of the overall portfolio is in Other ABS, which includes securities backed by credit card receivables, bank collateralised loan obligations and student loans, with a weighted average credit rating of AAA.

Fin
an
cia
l an
d R
isk R
evie
w
www.standardchartered.com
55
Country Risk Country Risk is the risk that the Group will be unable to obtain payment from its customers or third parties on their contractual obligations as a result of certain actions taken by foreign governments, chiefly relating to convertibility and transferability of foreign currency.
The GRC is responsible for the Group’s country risk limits and delegates the setting and management of the country limits to the Deputy Group Chief Risk Officer and Group Country Risk department.
The business and country Chief Executive Officers manage exposures within these limits and policies. Countries designated as higher risk are subject to increased central monitoring.
Cross border assets comprise loans and advances, interest bearing deposits with other banks, trade and other bills, acceptances, amounts receivable under finance leases, certificates of deposit and other negotiable paper and investment securities where the counterparty is resident in a country other than that where the assets are recorded. Cross border assets also include exposures to local residents denominated in currencies other than the local currency.
Cross border exposure to countries in which the Group does not have a significant presence predominantly relates to money market and global corporate activity. This business is originated in the Group’s key markets, but is conducted with counterparties domiciled in the country against which the exposure is reported.
Cross border exposures to USA, Korea and Hong Kong have increased by more than $3 billion each since 2006. Growth in the US was due to a steady increase in non-US dollar funded lending to US corporates and banks. General business growth in Korea, and in particular an increase in business with Korean counterparties in the Group’s key markets outside of Korea, has led to an increase in Korea’s cross border exposure. The increase in cross border exposure to Hong Kong was driven by business growth, including some large Corporate Finance transactions, and increased lending to Chinese subsidiaries of Hong Kong domiciled customers.
The following table, based on the Group’s internal country risk reporting requirements, shows cross border outstandings where they exceed one per cent of the Group’s total assets.
2007 2006
One year or less
$million
Over one year$million
Total $million
One year or less
$million
Over one year$million
Total $million
USA 8,622 5,835 14,457 6,900 3,329 10,229
Korea 6,617 4,299 10,916 5,591 2,274 7,865
Hong Kong 7,681 3,043 10,724 5,414 1,783 7,197
India 6,228 3,667 9,895 5,508 1,774 7,282
United Arab Emirates 4,600 3,004 7,604 3,963 1,371 5,334
Singapore 5,490 1,700 7,190 5,786 1,108 6,894
China 3,634 2,041 5,675 2,739 1,292 4,031
Australia 2,680 1,086 3,766 3,425 569 3,994
Switzerland 2,628 1,136 3,764 1,926 519 2,445

Standard Chartered Annual Report and Accounts 2007
Risk Review continued
56
Market Risk The Group recognises market risk as the exposure created by potential changes in market prices and rates. The Group is exposed to market risk arising principally from customer driven transactions. The objective of the Group’s market risk policies and processes is to obtain the best balance of risk and return while meeting our customers’ requirements.
Market risk is governed by the GRC, which agrees policies and levels of risk appetite in terms of VaR. The Group Market Risk Committee (‘GMRC’) provides market risk oversight and guidance on policy setting. Policies cover both trading and non-trading books of the Group. The trading book is defined as per the FSA handbook, Prudential Sourcebook for Banks, Building Societies and Investment Firms (‘BIPRU’). This is more restrictive than the broader IAS 39 definition, as the FSA only permits certain types of financial instruments or arrangements to be included within the trading book. Limits by location and portfolio are proposed by the businesses within the terms of agreed policy.
Group Market Risk (‘GMR’) approves the limits within delegated authorities and monitors exposures against these limits. Additional limits are placed on specific instruments and position concentrations where appropriate. Sensitivity measures are used in addition to VaR as risk management tools. For example, interest rate sensitivity is measured in terms of exposure to a one basis point increase in yields, whereas foreign exchange, commodity and equity sensitivities are measured in terms of the underlying values or amounts involved. Option risks are controlled through revaluation limits on underlying price and volatility shifts, limits on volatility risk and other variables that determine the options’ value.
Value at Risk The Group measures the risk of losses arising from future potential adverse movements in market rates, prices and volatilities using a VaR methodology.
VaR is calculated for expected movements over a minimum of one business day and to a confidence level of 97.5 per cent. This confidence level suggests that potential daily losses, in excess of the VaR measure, are likely to be experienced six times per year.
The Group uses historic simulation as its VaR methodology with an observation period of one year. Historic simulation involves the revaluation of all unmatured contracts to reflect the effect of historically observed changes in market risk factors on the valuation of the current portfolio.
The Group recognises that there are limitations to the VaR methodology including the possibility that the historical data may not be the best proxy for future price movements.
VaR models are back tested against actual results to ensure pre-determined levels of statistical accuracy are maintained.
Losses beyond the confidence interval are not captured by a VaR calculation, which therefore gives no indication of the size of unexpected losses in these situations.
GMR, therefore, complements the VaR measurement by regularly stress testing market risk exposures to highlight potential risk that may arise from extreme market events that are rare but plausible.
Stress testing is an integral part of the market risk management framework and considers both historical market events and forward looking scenarios. Ad hoc scenarios are also prepared reflecting specific market conditions. A consistent stress testing methodology is applied to trading and non-trading books.
Stress scenarios are regularly updated to reflect changes in risk profile and economic events. GMRC has responsibility for reviewing stress exposures and, where necessary, enforcing reductions in overall market risk exposure. GRC considers stress testing results as part of its supervision of risk appetite.
The stress testing methodology assumes that scope for management action would be limited during a stress event, reflecting the decrease in liquidity that often occurs.
VaR is calculated as the Group’s exposure as at the close of business, London time. Intra-day risk levels may vary from those reported at the end of the day.
Trading, non-trading and total VaR have increased in 2007 compared to 2006 due to increased market volatility following the sub-prime credit crisis in August 2007. This surfaced in the US sub-prime mortgage market and spilled over into wider global markets. Trading VaR has also increased due to the expansion of the Commodities and Equities trading businesses throughout 2007, and further due to the inclusion of credit spread risk in interest rate risk VaR from August 2007.
0
10
20
30
40
50
60
70
<-5 -4 -5 0-5 5-10 10-15 15-20 20-30
2007 Revenue Distribution
$ million
3 4 43
72
3
1
62
20
Num
ber
of d
ays
0
10
20
30
40
50
60
70
80
90
<-4 -2-4 -2-0 0-2 2-4 4-6 6-8 8-10 10-12 12-14 14-16 16-18
2006 Revenue Distribution
1
0 4
18
72 79
51
13
12 7
2
1
$ million
Num
ber
of d
ays

Fin
an
cia
l an
d R
isk R
evie
w
www.standardchartered.com
57
Trading and Non-trading (VaR at 97.5%, 1 day) 2007 2006
Daily value at risk Average
$million
High
$million
Low
$million
Actual^$million
Average
$million
High
$million
Low
$million
Actual^$million
Interest rate risk 12.2 19.6 7.0 17.1 10.5 13.9 7.6 9.3
Foreign exchange risk 3.2 7.2 1.7 4.4 2.6 4.8 1.1 1.5
Commodity risk 0.6 3.5 0.2 0.6 – – – –
Equity risk 0.6 1.9 – 1.4 – – – –
Total* 12.9 20.0 7.5 18.6 10.6 14.0 8.0 10.3
Trading (VaR at 97.5%, 1 day)
2007 2006
Daily value at risk Average
$million
High
$million
Low
$million
Actual^$million
Average
$million
High
$million
Low
$million
Actual^$million
Interest rate risk* 6.2 11.9 2.8 11.0 3.5 5.3 2.5 3.9
Foreign exchange risk 3.2 7.2 1.7 4.4 2.6 4.1 1.4 1.5
Commodity risk 0.6 3.5 0.2 0.6 – – – –
Equity risk 0.6 1.9 – 1.4 – – – –
Total** 7.0 12.5 3.5 12.5 4.3 5.6 3.1 4.0
* The total VaR shown in the tables above is not a sum of the component risks due to offsets between them.
** Interest rate risk VaR includes credit spread risk. ^ This represents the actual one day VaR as at 31 December.
The highest and lowest VaR are independent and could have occurred on different days.
The average daily income earned from market risk related activities is as follows:
2007
$million
2006
$million
Interest rate risk 2.3 1.8
Foreign exchange risk 3.0 2.0
Commodity risk 0.1 –
Equity risk – –
Total 5.4 3.8
Non-trading (VaR at 97.5%, 1 day)
2007 2006
Daily value at risk Average
$million
High
$million
Low
$million
Actual^$million
Average
$million
High
$million
Low
$million
Actual^$million
Interest rate risk 9.5 16.8 6.5 14.7 9.0 10.7 7.0 8.0 ^ This represents the actual one day VaR as at 31 December.
The average daily income earned from non-trading market risk related activities is as follows:
2007
$million
2006
$million
Interest rate risk 1.7 1.3
Interest rate risk from across the non-trading book portfolios is
transferred to Global Markets where it is managed by local
ALM desks under the supervision of local Asset and Liability
Committees. The ALM desks deal in the market in approved
financial instruments in order to manage the net interest rate
risk subject to approved VaR and risk limits.
VaR and stress tests are applied to non-trading book interest
rate exposure in the same way as for the trading book.
Foreign exchange risk on the non-trading book portfolios
is minimised by match funding assets and liabilities in the
same currency.
Structural foreign exchange risks are not included within the VaR and arise from net investments in non-US dollar currency entities. These are managed separately under the Group Capital
Management Committee by Group Treasury. Further analysis of structural risks can be found in note 48 on page 149.
Equity risk relating to private holdings is not included within the VaR and is separately managed through delegated limits for both investment and divestment, and is also subject to regular review by an investment committee.
Derivatives Derivatives are contracts whose characteristics and value derive from underlying financial instruments, interest and exchange rates or indices. They include futures, forwards, swaps and options transactions. Derivatives are an important risk management tool for banks and their customers because they can be used to manage market price risk. The market risk of all products, including derivatives, is managed in essentially the same way as described above.

Standard Chartered Annual Report and Accounts 2007
Risk Review continued
58
Derivatives continued The Group’s derivative transactions are principally in instruments where the mark-to-market values are readily determinable by reference to independent prices and valuation quotes or by using standard industry pricing models.
The Group enters into derivative contracts in the normal course of business to meet customer requirements and to manage its own exposure to fluctuations in market price movements.
Derivatives are carried at fair value and shown in the balance sheet as separate totals of assets and liabilities. Recognition of fair value gains and losses depends on whether the derivatives are classified as trading or held for hedging purposes.
The Group applies a future exposure methodology to manage counterparty credit exposure associated with derivative transactions.
Hedging In accounting terms under IAS 39, hedges are classified into three types: fair value hedges, predominantly where fixed rates of interest or foreign exchange are exchanged for floating rates; cash flow hedges, predominantly where variable rates of interest or foreign exchange are exchanged for fixed rates; and hedges of net investments in overseas operations translated to the parent company’s functional currency, US dollars.
The Group uses futures, forwards, swaps and options transactions in the foreign exchange and interest rate markets to hedge risk.
The Group occasionally hedges the value of its foreign currency denominated investments in subsidiaries and branches. Hedges may be taken where there is a risk of a significant exchange rate movement but, in general, management believes that the Group’s reserves are sufficient to absorb any foreseeable adverse currency depreciation.
The effect of exchange rate movements on the capital risk asset ratio is mitigated by the fact that both the underlying net asset value of these investments and the risk weighted value of assets and contingent liabilities follow substantially the same exchange rate movements.
The Group may also, under certain individually approved circumstances, enter into economic hedges which do not qualify for IAS 39 hedge accounting treatment, and which are accordingly marked to market through the profit and loss account creating an accounting asymmetry. These are entered into primarily to ensure that residual interest rate and foreign exchange risks are being effectively managed.
Liquidity Risk Liquidity risk is the risk that the Group either does not have sufficient financial resources available to meet all its obligations and commitments as they fall due, or can only access these financial resources at excessive cost.
It is the policy of the Group to maintain adequate liquidity at all times, in all geographic locations and for all currencies, and hence to be in a position to meet all obligations as they fall due. The Group manages liquidity risk both on a short term and medium term basis. In the short term, the focus is on ensuring that the cash flow demands can be met through asset maturities, supported by customer deposits and wholesale raisings where required.
GALCO is the responsible governing body that approves the Group’s liquidity management policies. The Liquidity Management Committee (‘LMC’) receives authority from GALCO and is
responsible for setting liquidity limits, proposing liquidity risk policies and practices, assisting in cross-business and cross-geography liquidity discussions and helping establish country balance sheet targets. Liquidity in each country is managed by the Country ALCO within the pre-defined liquidity limits set by the LMC and in compliance with Group liquidity policies and local regulatory requirements.
Policies and procedures Due to the diversified nature of the Group’s business, the Group’s policy is that liquidity is more effectively managed locally, in-country. Each ALCO is responsible for ensuring that the country is self-sufficient and is able to meet all its obligations to make payments as they fall due by operating within the liquidity limits set for the country.
The Group liquidity risk management framework requires limits to be set for prudent liquidity management. There are limits on:
• the mismatch in local and foreign currency behavioural cash flows;
• the level of wholesale borrowing to ensure that the size of this funding is proportional to the local market and the Group’s local operations;
• commitments, both on and off balance sheet, to ensure there are sufficient funds available in the event of drawdown on these commitments;
• the advances to deposits ratio to ensure that commercial advances are funded by stable sources;
• the amount of medium term funding to support the asset portfolio; and
• the amount of local currency funding sourced from foreign currency sources.
In addition, the Group prescribes a liquidity stress scenario that assumes accelerated withdrawal of deposits over a period of time. Each country has to ensure that cash inflows exceed outflows under such a scenario.
All limits are reviewed at least annually, and more frequently if required, to ensure that they are relevant given market conditions and business strategy. Compliance with limits is monitored independently on a regular basis by Group Market Risk. Limit excesses are escalated and approved under a delegated authority structure and reviewed by ALCO. Excesses are also reported monthly to LMC and GALCO which provide further oversight.
In addition, regular reports to the ALCO include the following:
• information on the concentration and profile of debt maturities; and
• depositor concentration report to monitor reliance on large individual depositors.
The Group has significant levels of marketable securities, principally government securities and bank paper, which can be realised in the event that there is a need for liquidity in a crisis. In addition, each country and the Group maintain a liquidity crisis management plan which is reviewed and approved annually. The liquidity crisis management plan lays out trigger points and actions in the event of a liquidity crisis to ensure that there is an effective response by senior management in case of such an event.
Primary sources of funding A substantial portion of the Group’s assets are funded by customer deposits made up of current and savings accounts and other deposits. These customer deposits, which are widely

Fin
an
cia
l an
d R
isk R
evie
w
www.standardchartered.com
59
diversified by type and maturity, represent a stable source of funds. Country ALCO monitors trends in the balance sheet and ensures that any concerns that might impact the stability of these deposits are addressed effectively. ALCO also reviews balance sheet plans to ensure that asset growth plans are matched by growth in the stable funding base.
The Group maintains access to the inter-bank wholesale funding markets in all major financial centres and countries in which it operates. This seeks to ensure that the Group has flexibility around maturity transformation, has market intelligence, maintains stable funding lines and is a price maker when it performs its interest rate risk management activities.
Liquid assets to total assets ratio The holdings of liquid assets in the balance sheet reflect the prudent approach that is inherent in the Group’s liquidity policies and practices. Whilst liquidity is managed in-country, compliance with these policies and practices results in substantial holdings of liquid assets as a Group. The following shows the ratio of the liquid assets to total assets:
2007
%
2006
%
Liquid assets* to total assets ratio 23.9 21.7
* Liquid assets is the total of Cash (less restricted balances), net interbank,
Treasury bills and Debt securities less the asset backed securities portfolio.
Operational Risk# Operational risk is the risk of direct or indirect loss due to an event or action resulting from the failure of internal processes, people and systems, or from external events. The Group seeks to ensure that key operational risks are managed in a timely and effective manner through a framework of policies, procedures and tools to identify, assess, monitor, control and report such risks.
The Group Operational Risk Committee (‘GORC’) supervises and directs the management of operational risks across the Group. GORC is also responsible for ensuring adequate and appropriate policies and procedures are in place for the identification, assessment, monitoring, control and reporting of operational risks.
Group Operational Risk is responsible for setting the Operational Risk policy, defining standards for measurement and for Operational Risk capital calculation. A Group Operational Risk Assurance function, independent from the businesses, is responsible for deploying and assuring the operational risk management framework, and for monitoring the Group’s key operational risk exposures. This unit is supported by units within the Wholesale Banking and Consumer Banking businesses which have responsibility for ensuring compliance with policies and procedures in the business, monitoring key operational risk exposures, and the provision of guidance to the respective business areas on operational risk.
Regulatory Risk# Regulatory risk includes the risk of non-compliance with regulatory requirements in a country in which the Group operates. The Group Compliance and Regulatory Risk function is responsible for establishing and maintaining an appropriate framework of Group compliance policies and procedures. Compliance with such policies and procedures is the responsibility of all managers.
Reputational Risk# Reputational risk is the risk of failure to meet the standards of performance or behaviours, expected by stakeholders in the way in which business is conducted. It is Group policy that, at all times, the protection of the Group’s reputation should take priority over all other activities, including revenue generation.
Reputational risk will arise from the failure to effectively mitigate one or more of country, credit, liquidity, market, regulatory and operational risk. It may also arise from the failure to comply with Social, Environmental and Ethical standards. All staff are responsible for day to day identification and management of reputational risk.
From an organisational perspective the Group manages reputational risk through the Group Reputational Risk and Responsibility Committee (‘GRRRC’) and Country Management Committees. Wholesale Banking has a specialised Responsibility and Reputational Risk Committee which reviews individual transactions. In Consumer Banking, potential reputational risks resulting from transactions or products are reviewed by the Product and Reputational Risk Committee. Issues are then escalated to the GRRRC.
A critical element of the role of the GRRRC is to alert the Group to emerging or thematic risks. The GRRRC also seeks to ensure that effective risk monitoring is in place for Reputational Risk and reviews mitigation plans for significant risks.
At a country level, the Country CEO is responsible for the Group’s reputation in their market. The Country CEO and their Management Committee must actively:
• promote awareness and application of the Group’s policy and procedures regarding reputational risk;
• encourage business and functions to take account of the Group’s reputation in all decision making, including dealings with customers and suppliers;
• implement effective in-country reporting systems to ensure they are aware of all potential issues; and
• promote effective, proactive stakeholder management.
Monitoring# Group Internal Audit is a separate Group function that reports to the Group Chief Executive and the ARC. Group Internal Audit provides independent confirmation that Group and business standards, policies and procedures are being complied with. Where necessary, corrective action is recommended.

Standard Chartered Annual Report and Accounts 2007
Capital
60
Except where indicated (#) this information is an integral part of the audited financial statements.
Capital management The Group’s capital management approach is driven by its desire to maintain a strong capital base to support the development of its business, to meet regulatory capital requirements at all times and to maintain good credit ratings.
Strategic business and capital plans are drawn up annually covering a three year horizon and approved by the Board. The plan ensures that adequate levels of capital and an optimum mix of the different components of capital are maintained by the Group to support the strategy. This is integrated with the Group’s annual planning process that takes into consideration business growth assumptions across products and geographies and the related impact on capital resources.
The capital plan takes the following into account:
• regulatory capital requirements;
• forecast demand for capital to maintain the credit ratings;
• increases in demand for capital due to business growth, market shocks or stresses;
• available supply of capital and capital raising options; and
• internal controls and governance for managing the Group’s risk, performance and capital.
The Group uses a capital model to assess the capital demand for material risks, and to support its internal capital adequacy assessment. Each material risk is assessed, relevant mitigants considered, and appropriate levels of capital determined. The capital model is a key part of the Group’s management disciplines and formed the basis of the Group’s submission to the FSA of its Internal Capital Adequacy Assessment Process (‘ICAAP’) for Basel II.
A strong governance culture and framework is embedded in the capital planning and assessment methodology. Overall responsibility for the effective management of risk rests with the Group’s Board. The ARC reviews specific risk areas and reviews the issues discussed at the key capital management committees. The GALCO has set internal triggers and target ranges for capital management, and oversees adherence with these.
Current compliance with Basel I and the FSA Handbook The Group’s supervisor is the FSA. The capital that the Group is required to hold by the FSA is determined by its balance sheet, off-balance sheet and market risk positions weighted according to the type of counterparty instrument and collateral held. Further detail on counterparty and market risk positions is included in the Risk Review section on pages 56 to 57.
Local capital is maintained on the basis of host regulator’s requirements. Processes are in place to ensure compliance with local regulatory ratios in all entities. The Group has put in place processes and controls to monitor and manage capital adequacy, and no breaches were reported during the year.
The table on page 61 summarises the capital position of the Group. The principal forms of capital are included in the following balances on the consolidated balance sheet: share capital and reserves (called-up ordinary share capital and preference shares, and eligible reserves), subordinated liabilities (innovative Tier 1 securities and qualifying subordinated liabilities), and loans to banks and customers (portfolio impairment provision).
Movement in capital Total capital has increased by $6,902 million to $28,727 million compared to 2006. The increase has been primarily driven by increased ordinary and preference share capital, up by $1,144 million largely from a $750 million preference share issue during the year, increased eligible reserves, up by $2,445 million largely due to increased retained earnings, and an increase in qualifying subordinated liabilities, net of amortisation, of $2,884 million following issues of £300 million Lower Tier 2 Step-Up Dated Subordinated Notes, and €700 million and $1 billion of subordinated debt.
Basel II
The Basel Committee on Banking Supervision published a
framework for International Convergence of Capital Measurement
and Capital Standards (‘Basel II’), which replaces the 1988 Basel
Accord. Basel II is structured around three ‘pillars’:
• Pillar 1 sets out minimum regulatory capital requirements –
the minimum amount of capital banks must hold against risks;
• Pillar 2 sets out the key principles for supervisory review of an
institution’s risk management framework and, ultimately, its
capital adequacy. It sets out specific oversight responsibilities
for the Board and senior management, thus reinforcing
principles of internal control and other corporate governance
practices; and
• Pillar 3 aims to bolster market discipline through enhanced
disclosure by banks.
Basel II provides three approaches of increasing sophistication to
the calculation of credit risk capital; the Standardised Approach,
the Internal Ratings Based Foundation Approach and the Internal
Ratings Based Advanced Approach. Basel II also introduces
capital requirements for operational risk for the first time.
The EU Capital Requirements Directive (‘CRD’) is the means by
which Basel II is being implemented in the EU. EU Member States
were required to bring implementing provisions into force by 1
January 2007. In the case of the provisions relating to advanced
approaches for credit risk and operational risk, implementation
becomes available from 1 January 2008. In the UK the CRD is
implemented by the FSA through the General Prudential
Sourcebook (‘GENPRU’) and BIPRU.
Transitional provisions mean that, unless firms notify the FSA to
the contrary, they continue to apply existing capital calculations
until 1 January 2008.
From 1 January 2008 the Group will use Advanced Internal
Ratings Based Approach for the measurement of credit risk
capital. This approach builds on the Group’s risk management
practices and is the result of a significant investment in data
warehouse and risk models.
The Group applies a VaR model for the measurement of market
risk capital in accordance with the scope of the permission to use
such a model granted by the FSA. Where the Group’s market risk
exposures are not approved for inclusion in its VaR model, capital
requirements are based on standard rules provided by the
regulator which are less risk sensitive.

Fin
an
cia
l an
d R
isk R
evie
w
www.standardchartered.com
61
Capital continued For the first time the Group will also be required to calculate a new capital charge to cover operational risk. The Group will apply the Standardised Approach for determining the capital requirements for operational risk.
During the transition period, Basel II capital requirements must not be less than 90 per cent of Basel I capital requirements in 2008 reducing to 80 per cent in 2009.
2007
$million 2006*
$million
Tier 1 capital:
Called-up ordinary share capital and preference shares 8,915 7,771
Eligible reserves 11,382 8,937
Minority interests 271 209*
Innovative Tier 1 securities 2,338 2,262
Less: Restriction on innovative Tier 1 securities – (355)*
Goodwill and other intangible assets (6,380) (6,247)*
Unconsolidated associated companies 283 229
Other regulatory adjustments (19) (94)
Total Tier 1 capital 16,790 12,712
Tier 2 capital:
Eligible revaluation reserves 927 509
Portfolio impairment provision 536 543*
Qualifying subordinated liabilities:
Perpetual subordinated debt 3,394 3,368
Other eligible subordinated debt 8,764 5,387
Less: Amortisation of qualifying subordinated liabilities (1,037) (518)
Restricted innovative Tier 1 securities – 355*
Total Tier 2 capital 12,584 9,644
Investments in other banks (136) (211)
Other deductions (511) (320)
Total capital base 28,727 21,825
Banking book:
Risk weighted assets# 132,942 120,018*
Risk weighted contingents# 22,531 21,106
155,473 141,124
Trading book:
Market risks# 8,396 5,834
Counterparty/settlement risks# 7,964 6,475
Total risk weighted assets and contingents# 171,833 153,433
Capital ratios – Basel I
Tier 1 capital# 9.8% 8.3%*
Total capital# 16.7% 14.2%*
Total capital ratio – Basel II# 15.2% N/A
* Amounts have been restated as explained in note 51 on page 154.

62 Standard Chartered Annual Report and Accounts 2007
Val Gooding CBE†
Appointed to the Board on1 January 2005. She is ChiefExecutive Officer of BUPA anda non-executive director ofJ Sainsbury plc and of the LawnTennis Association and of the BBC’sExecutive Board. She is alsoa Trustee of the British Museum.Previously she was Director, AsiaPacific with British Airways. Age 57.
Rudy Markham†
Appointed to the Board on19 February 2001. He is anon-executive director of Legaland General Group Plc and ofUnited Parcel Service, Inc. andis a member of the Board ofthe Financial Reporting Council.Previously he was Chief FinancialOfficer of Unilever. Age 61.
Ruth Markland†
Appointed to the Board on3 November 2003. She is Chairmanof the Board of Trustees of theWRVS and a non-executive directorof The Sage Group plc. Previouslyshe was Managing Partner Asia forthe international law firm FreshfieldsBruckhaus Deringer. Age 55.
Sunil Mittal†Appointed to the Board 1 August2007. He is Chairman and GroupCEO of Bharti Enterprises andPresident of the Confederation ofIndian Industry. He sits on variousboards and councils including thePrime Minister of India’s Councilon Trade and Industry, the IndiaAdvisory Council of the HarvardBusiness School and theSingapore-India PartnershipFoundation. He is the recipient ofPadma Bhushan, one of the highestcivilian awards in India. Age 50.
E Mervyn Davies CBEChairmanAppointed to the Board on16 December 1997. He wasappointed as Chairman on20 November 2006. Immediatelyprior to this he had been GroupChief Executive since 28 November2001. Before his appointment asGroup Chief Executive he was theexecutive director with responsibilityfor Hong Kong, China and NorthEast Asia and for Group-wideTechnology and Operations. He isa non-executive director of TescoPLC and Tottenham Hotspur plcand is Chairman of Fleming Family& Partners Limited. He is alsoChairman of the Government’sBusiness Council for Britain andthe Chair of Council of BangorUniversity. Age 55.
Peter Sands*Group Chief ExecutiveAppointed to the Board on 14 May2002. Appointed as Group ChiefExecutive on 20 November 2006.Immediately prior to this he hadbeen Group Finance Director sincehis appointment to the Board andwas responsible for Finance, Risk,Strategy and Technology andOperations. Before his appointmentto the Standard Chartered PLCBoard he was a director withworldwide consultants McKinsey& Co. He had been with McKinseysince 1988, where he workedextensively in the banking andtechnology sectors in a wide rangeof international markets. Age 46.
John Peace†
Deputy Chairman andSenior Independent DirectorAppointed to the Board on1 August 2007. He is Chairmanof Experian Group Limited andBurberry Group plc. He is alsoChairman of the Board ofGovernors of Nottingham TrentUniversity, Deputy Lieutenant for theCounty of Nottinghamshire, a Fellowof the Royal Society of Arts andChairman of The Work Foundation.Previously he was Group ChiefExecutive of GUS plc from 2000until 2006, having been a director ofGUS since 1997. Age 58.
Gareth Bullock*Appointed to the Board on6 August 2007. He is GroupExecutive Director with responsibilityfor growth and governance inAfrica, the Middle East, Europe andthe Americas and for Risk andSpecial Asset Management. Hejoined Standard Chartered in 1996and was appointed as a director ofStandard Chartered Bank in 2003.His previous senior appointmentsinclude Group Head of Strategy,Group Chief Information Officerand CEO Africa. He is Chairmanof Mcashback Limited and is anon-executive director of FlemingFamily & Partners Limited and ofSpirax-Sarco Engineering plc.Age 54.
Board of Directors

www.standardchartered.com 63
CorporateGov
erna
nce
Jamie Dundas†Appointed to the Board on15 March 2004. He is Chairmanof Jupiter Investment ManagementHoldings Limited and anon-executive director of DraxGroup plc. He is also Chairmanof Macmillan Cancer Support.Previously he was Chief ExecutiveOfficer of the UK property companyMEPC and Finance Director ofthe Airport Authority Hong Kong.Age 57.
Paul Skinner†Appointed to the Board on3 November 2003. He is Chairmanof Rio Tinto plc and is a non-executive director of the TetraLaval Group and L’Air Liquide SA.He is also a member of the boardof INSEAD and of the DefenceBoard of the UK Ministry ofDefence. Previously he was adirector of The ‘Shell’ Transportand Trading Company plc andGroup Managing Director of theRoyal Dutch/Shell Group ofcompanies where he was CEOof its global Oil Products business.Age 63.
Oliver Stocken†
Appointed to the Board on 1 June2004. He is Chairman of HomeRetail Group plc, Deputy Chairmanof 3i plc and Chairman of OvalLimited and Stanhope GroupHoldings Limited. He is alsoChairman of the Trustees of theNatural History Museum. Previouslyhe was Group Finance Director ofBarclays PLC. Age 66.
Lord Turner†Appointed to the Board on1 August 2006. He is a non-executive director of UnitedBusiness Media plc, SiemensHoldings plc and Paternoster UKLimited. He is also Chairman of theOverseas Development Institute,the Climate Change Committee andof the Economic and SocialResearch Council, and is a memberof the Board of Trustees of Save theChildren Fund UK. Previously hewas Director General of the CBIand Vice Chairman of Merrill LynchEurope Limited. Age 52.
Audit and Risk CommitteeRudy Markham (Chairman)John PeaceJamie DundasRuth MarklandLord Turner
Board NominationCommitteeMervyn Davies (Chairman)John PeaceJamie DundasRudy MarkhamRuth Markland
Board RemunerationCommitteeRuth Markland (Chairman)Val GoodingPaul SkinnerOliver StockenLord Turner
Sustainability andResponsibility CommitteeMervyn Davies (Chairman)Peter SandsJamie DundasVal GoodingOliver Stocken
* Also a director of Standard Chartered Bank.† Independent non-executive director.
Mike DeNoma*Appointed to the Board on 12 May2000. He is Group ExecutiveDirector with responsibility forthe Group’s Consumer Bankingbusiness worldwide and leadsthe Group’s Strategy function.He joined Standard Charteredin 1999 with responsibility forConsumer Banking in Asia.He is also a director of StandardChartered Bank (Hong Kong)Limited, of MasterCard Asia PacificPte Ltd and of the InternationalCentre for Missing and ExploitedChildren, and is a member of theboard of Singapore ManagementUniversity. He is based inSingapore. Age 51.
Richard Meddings*Appointed to the Board on16 November 2002. He wasappointed as Group FinanceDirector on 20 November 2006and is responsible for Finance,Corporate Treasury and CorporateDevelopment. Immediately priorto this he was Group ExecutiveDirector responsible for growthand governance across Africa, theMiddle East, Pakistan, the UnitedKingdom, Europe and the Americasand before that was responsible forRisk, Special Assets Managementand Legal & Compliance. Beforehis appointment to the StandardChartered PLC Board he was ChiefOperating Officer, Barclays PrivateClients at Barclays PLC and priorto that Group Financial Controllerat Barclays PLC. Age 49.
Sir CK Chow†
Appointed to the Board on24 February 1997. He is ChiefExecutive Officer of MTRCorporation Limited of Hong Kongand is non-executive Chairman ofStandard Chartered Bank (HongKong) Limited. He is a member ofthe Hong Kong Tourism Board, theCouncil of the Chinese University ofHong Kong and the Council of theHong Kong General Chamber ofCommerce. Previously he wasChief Executive Officer of GKNplc and Brambles Industries plc.He is based in Hong Kong. Age 57.
Board Committees

Standard Chartered Annual Report and Accounts 2007
Senior Management
64
Standard Chartered Bank The directors of Standard Chartered Bank comprise the executive directors of Standard Chartered PLC and the following three senior executives:
Jaspal Bindra Joined Standard Chartered in 1998. He is a director of Standard Chartered Bank and Chief Executive Officer Asia. He has previously held the positions of General Manager, South East and South Asia, Global Head Client Relationships and Regional General Manager, India. He is a director of Standard Chartered Bank (Hong Kong) Limited, Standard Chartered Bank Malaysia Berhad, Standard Chartered Bank (Taiwan) Limited, Scope International Private Limited and Chairman of Standard Chartered (Thai) Public Company Limited, Prime Financial Holdings Limited and Scope International (Malaysia) Sdn Bhd. Age 47.
Mike Rees Joined Standard Chartered in 1990. He is a director of Standard Chartered Bank and Chief Executive Officer Wholesale Bank. He has previously held the positions of Chief Financial Officer of Group Treasury, Regional Treasurer in Singapore and Group Head of Global Markets. Age 52.
Dr Tim Miller Joined Standard Chartered in 2000. He is Director, People, Property and Assurance and has responsibility for Human Resources, Corporate Real Estate, Compliance and Regulatory Risk, Legal, Global Research and Operational Excellence. He also has functional responsibility for Internal Audit and the Corporate Secretariat. He was previously Group Head of Human Resources. He is non-executive Chairman of Standard Chartered First Bank Korea Limited and a non-executive director of Michael Page International plc. Age 50.
Group Management Committee The Group Management Committee as at 26 February 2008 comprises the directors of Standard Chartered Bank and the following senior executives:
Tracy Clarke Joined Standard Chartered in 1985. She is Group Head of Human Resources. She has previously held the positions of Group Head Corporate Affairs, Head of the Group Chief Executive’s Office and other banking roles in the UK and Hong Kong. She is a non-executive director of eaga plc. Age 41.
Richard Goulding Joined Standard Chartered in 2002. He is Group Chief Risk Operating Officer. He was previously the Chief Operating Officer of Wholesale Bank. Prior to joining the Group he was Chief Operating Officer of the Old Mutual Group and before that was a member of the Global Executive Board of UBS investment banking division. Age 48.
Vis Shankar Joined Standard Chartered in 2001. He is Group Head Origination & Client Coverage and is Executive Chairman of Principal Finance and Chairman of the Private Bank. He has previously held the position of Group Head, Corporate Finance. He is a member of the Board of the Inland Revenue Authority of Singapore, on the Board of Trustees of Sinda, Singapore and Chairman of Nuovobanq, Seychelles. Age 50.
David Edwards Joined Standard Chartered in 1999. He is President and Chief Executive Officer of Standard Chartered First Bank Korea Limited. He has previously held the positions of Chief Operating Officer of Wholesale Bank, Group Head Risk and Group Special Assets Management, Regional General Manager Middle East and South Asia and Group Head Risk Management. Age 54.
Jan Verplancke Joined Standard Chartered in 2004. He is Chief Information Officer for the Group and is responsible for all systems development, technology support and banking operations. Prior to joining the Group he was Chief Information Officer – EMEA at Dell. Age 44.

Co
rpo
rate
Go
vern
an
ce
www.standardchartered.com
Report of the Directors
65
The directors have pleasure in submitting their report and accounts of the Company and its subsidiaries for the year ended 31 December 2007.
Activities The Company is the holding company for the Standard Chartered Group of companies (the ‘Group’) which are principally engaged in the business of banking and the provision of other financial services.
Business Review A fair review of the business performance of the Group during the financial year ended 31 December 2007, the position of the Group at the end of the year and a description of the principal risks and uncertainties facing the Group can be found in the Chairman’s Statement on pages 8 and 9, the Group Chief Executive’s Review on pages 10 to 15, the Key Performance Indicators on pages 16 and 17 and the Business, Financial and Risk Reviews on pages 18 to 61, all of which are incorporated into this report by reference.
Share Capital During the year 9,012,891 ordinary shares were issued under the Company’s employee share plans at prices between nil and 1064 pence and 15,928,740 ordinary shares were issued under the Company’s share dividend scheme.
Further details of these issues of ordinary shares and other matters relating to the Company’s share capital, including information on the structure, and rights and obligations attaching to each class of the Company’s shares, can be found in note 38.
At the annual general meeting (‘AGM’) in May 2007 the shareholders granted authority for the Company to buy back up to 138,476,606 of the Company’s ordinary shares (approximately 10 per cent of the Company’s issued ordinary share capital as at 19 March 2007). In addition, the shareholders granted authority for the Company to buy back up to all of the Company’s issued preference share capital. The Company did not purchase any of its own shares during the period and therefore these authorities remained in force at 31 December 2007.
On 25 May 2007 the Company issued 7,500 7.014 per cent non-cumulative redeemable preference shares of $5 each. These US dollar preference shares were issued in the form of American Depository shares and further details can be found in note 38 to the accounts.
Dividends The directors recommend a final dividend for 2007 of 56.23 cents per ordinary share which, if approved at the 2008 AGM, will be paid on 16 May 2008 to shareholders on the register at 7 March 2008. The 2007 interim dividend of 23.12 cents per ordinary share was paid on 10 October 2007, making a total dividend of 79.35 cents for the year.
The ordinary shareholders will again be offered the choice to receive their cash dividends in either sterling, Hong Kong dollars or US dollars. It is also intended that the share dividend alternative to the cash dividend will be offered during 2008.
Major Interests in Shares and Voting Rights As far as the directors are aware as at 31 December 2007, Temasek Holdings (Private) Limited (‘Temasek’) was the only shareholder that had an interest of more than 10 per cent in the Company’s issued ordinary share capital carrying a right to vote at any general meeting of the Company.
As at 26 February 2008, the Company had been notified by the following companies of their interests in the total voting rights of the Company:
Shareholder
Number of ordinary
shares
Percentage
of voting
rights
Direct
Percentage
of voting rights
Indirect
Temasek* 268,197,219 19.03 Legal & General Group PLC 57,361,033
4.08
* The Company has been notified that Temasek’s interest in the
total voting rights of the Company is held indirectly through Fullerton
Management Pte Ltd, Dover Investments Pte Ltd and other subsidiaries
of Fullerton Management Pte Ltd.
Loan Capital Details of the loan capital of the Company and its subsidiaries are set out in note 37.
Directors The directors of the Company are listed on pages 62 and 63. Mr Peace was appointed as Deputy Chairman and the Senior Independent Director and Mr Mittal was appointed as an independent non-executive director, both with effect from 1 August 2007. Mr Bullock was appointed as Group Executive Director with effect from 6 August 2007. Mr Nargolwala resigned as a director on 6 September 2007.
Mr Peace, Mr Mittal and Mr Bullock will offer themselves for election by the shareholders at this year’s AGM. Mr DeNoma, Miss Gooding, Mr Markham, Mr Sands and Mr Stocken will retire from office by rotation and will offer themselves for re-election at this year’s AGM, in accordance with the Company’s articles of association.
Sir CK Chow, will step down from the Board at the conclusion of this year’s AGM.
Directors’ Interests The directors’ beneficial interests in the ordinary shares of the Company as at 31 December 2007 are shown in the Directors’ Remuneration Report on pages 73 to 85.
Qualifying Third Party Indemnities The Company has granted qualifying third party indemnities to the directors of the Company and the directors of Standard Chartered Bank. These indemnities remain in force at the date of this report.
Risk Management The risk management objectives and policies of the Group, including its policy for hedging risk, are set out in the Risk Review on pages 43 to 61 and the Group’s exposure to credit risk is set out in note 49, liquidity risk in note 47 and market risk on page 56. Company only risks are managed as a part of overall Group risks, all of which are incorporated by reference to this report.
Significant Contracts and Agreements There were no contracts of significance during the year in which any of the directors were materially interested.

Standard Chartered Annual Report and Accounts 2007
Report of the Directors continued
66
Related Party Transactions Details of transactions with directors and officers and other related parties are set out in note 52 to the accounts.
Continuing Connected Transactions By virtue of its shareholding of more than 10 per cent in the Company, Temasek and its associates are related parties and connected persons of the Company for the purposes of the UK Listing Rules and the Listing Rules of The Stock Exchange of Hong Kong Limited (the ‘HK Listing Rules’) respectively (together, the ‘Rules’). Neither Temasek nor its associates are related parties for the purposes of IAS 24.
The Rules are intended to ensure that there is no favourable treatment to Temasek or its associates (as defined under the Rules) as a result of such shareholding, to the detriment of other shareholders in the Company. Unless transactions which the Company and its subsidiaries undertake with Temasek or its associates are specifically exempt under the Rules or the subject of a specific waiver, they may require a combination of announcement, reporting, shareholder approval and/or disclosure. To ensure transparency, the Rules also impose additional reporting and disclosure requirements on the Company in respect of certain non-exempt and other transactions with Temasek or its associates.
In 2007, the Group entered into certain connected transactions with Temasek and its associates in the normal course of its business that are not exempt and are subject to the annual reporting and/or shareholders approval requirements of the HK Listing Rules. At the 2007 AGM, shareholders gave authority for the Company to enter into certain ongoing transactions and this authority will expire on 3 May 2010. Further details of transactions undertaken with Temasek and its associates during 2007 are set out in the Supplementary Financial Information on pages 162 and 163.
The independent non-executive directors of the Company confirm that the continuing connected transactions have been entered into by members of the Group with Temasek or its associates:
• in the ordinary and usual course of business of the Group;
• either on normal commercial terms or, if there are not sufficient comparable transactions to judge whether they are on normal commercial terms, on terms that are no less favourable to the Group than terms available to or from (as appropriate) independent third parties; and
• in accordance with the relevant agreement governing them on terms that are fair and reasonable and in the interests of the shareholders of the Company as a whole.
For the purposes of Rule 14A.38 of the HK Listing Rules, the Company’s auditor, KPMG Audit Plc and its associated firms (together ‘KPMG’), has performed certain agreed-upon procedures on the aforementioned continuing connected transactions for the year ended 31 December 2007, in accordance with International Federation of Accountants Related Services 4400 ‘Engagement to Perform Agreed-Upon Procedures Regarding Financial Information’.
Employee Engagement The Group employs 70,000 staff in over 50 countries and territories. The average number of people employed by the Group in the United Kingdom during the year was 1,400 and their total remuneration for the year was $368 million. Employees in all the countries and territories where the Group operates have the opportunity to participate in the Group’s all-employee
sharesave schemes and share in the success of the Group. Further details of the sharesave schemes are given on page 77 and in note 41.
The Group’s employment policies are designed to accommodate the relevant social, statutory and market conditions and practices in each country where the Group operates whilst encouraging equal opportunities and diversity. The Group is committed to communicating effectively with its employees on a wide range of issues. Employees are kept informed through briefings given to managers who are in turn encouraged to hold subsequent meetings with staff. In addition, circulars, publications and videos are used to disseminate information.
The Group recognises its social and statutory duty to employ disabled people and has followed a policy in the United Kingdom by providing, wherever possible, the same employment opportunities for disabled people as for others. If employees become disabled every effort is made to ensure their employment continues, with appropriate training where necessary. Further details of the Group’s employees can be found in the Business Review on pages 18 to 33.
The Group has measured employee engagement for the last seven years using the Gallup Organization’s Q12 survey. The annual survey provides important feedback to managers and teams and internal research has demonstrated a strong relationship between high engagement and increased business performance. In 2007, 95 per cent of employees voluntarily took part in the survey.
Areas of Operation The Group has over 1,600 branches and outlets. Further details of the branches and outlets can be found on the Company’s website at: www.standardchartered.com
Major Customers Taken together, the five largest customers of the Group account
for 2.31 per cent of the total interest income and other operating
income of the Group in the year ended 31 December 2007.
Creditor Payment Policy
Operating businesses are responsible for agreeing the terms
and conditions with their suppliers in the economies where they
conduct business and for bringing those terms and conditions to
the attention of the supplier. It is the Group’s policy to pay
creditors in accordance with the agreed terms and conditions,
provided the supplier has complied with them.
Standard Chartered PLC is a holding company and does not
trade. Therefore, it is not considered meaningful to give a number
of days’ purchases outstanding for the Company as at
31 December 2007. For the Group’s operations in the United
Kingdom, there were 35 days’ purchases outstanding as at
31 December 2007.
Community Investment
The Group is committed to building a sustainable business and a
more sustainable society. It recognises its responsibility to invest
in the communities where it operates. In 2007, the Group made
a total investment of $24.5 million in the communities in which it
operates. This includes direct financial support of $18.2 million
to various community programmes and non-governmental
organisations, of which $4.5 million was given to United Kingdom
registered charities, focusing on supporting their work outside the
United Kingdom.
In addition to many initiatives at a global, regional and local level
the Group operates four major programmes; Living with HIV,
Seeing is Believing, Empowering Women and Employee
Co
rpo
rate
Go
vern
an
ce
www.standardchartered.com
67
Volunteering. Further details of community projects can be found
in the Business Review on pages 18 to 33.
HIV/AIDS Policy The Group is committed to addressing social, health and human rights issues confronting its employees, their families and the communities in which it operates. The Group recognises that the principal competitive advantage of any business is gained through its employees, and this advantage is only sustainable if they are healthy, skilled and motivated.
HIV/AIDS directly and indirectly impacts the Group’s staff and therefore its business. The Group’s policy on HIV/AIDS has been adopted across all the countries in which the Group operates and applies to all staff and their families in a manner consistent with existing medical cover. A copy of the Group’s HIV/AIDS policy is available to shareholders on the Company’s website at: www.standardchartered.com/sustainability
Environmental Policy The Group recognises that it should minimise any adverse impact of the conduct of business on the environment. It therefore aims to manage its businesses with regard to the use of energy and other resources and by disposing of waste responsibly, by encouraging its customers to ensure that their products, processes and businesses do not damage the environment unnecessarily and by taking environmental considerations into account in business decisions.
A copy of the Group’s environmental policy is available to shareholders on the Company’s website at: www.standardchartered.com/sustainability
Social, Ethical and Environmental (‘SEE’) Responsibilities A report on SEE responsibilities can be found on page 72 and further details of the Group’s policies on SEE risk can be found on the Company’s website: www.standardchartered.com/sustainability
Auditor Having reviewed the independence and the effectiveness of the external auditors, a resolution will be proposed at the 2008 AGM to reappoint KPMG as auditor to the Company.
So far as each director is aware, there is no relevant audit information of which the Company’s auditors are unaware, and each director has taken all steps that he or she ought to have taken as a director in order to make themselves aware of, and to establish that the auditors are aware of any relevant audit information.
Annual General Meeting The Company’s AGM will be held at 12 noon (UK time) (7.00 pm Hong Kong time) on Wednesday 7 May 2008 at The Plaisterers’ Hall, One London Wall, London EC2Y 5JU. Details of the business to be transacted at the AGM are included in the Notice of AGM.
By order of the Board
Annemarie Durbin Group Company Secretary 26 February 2008
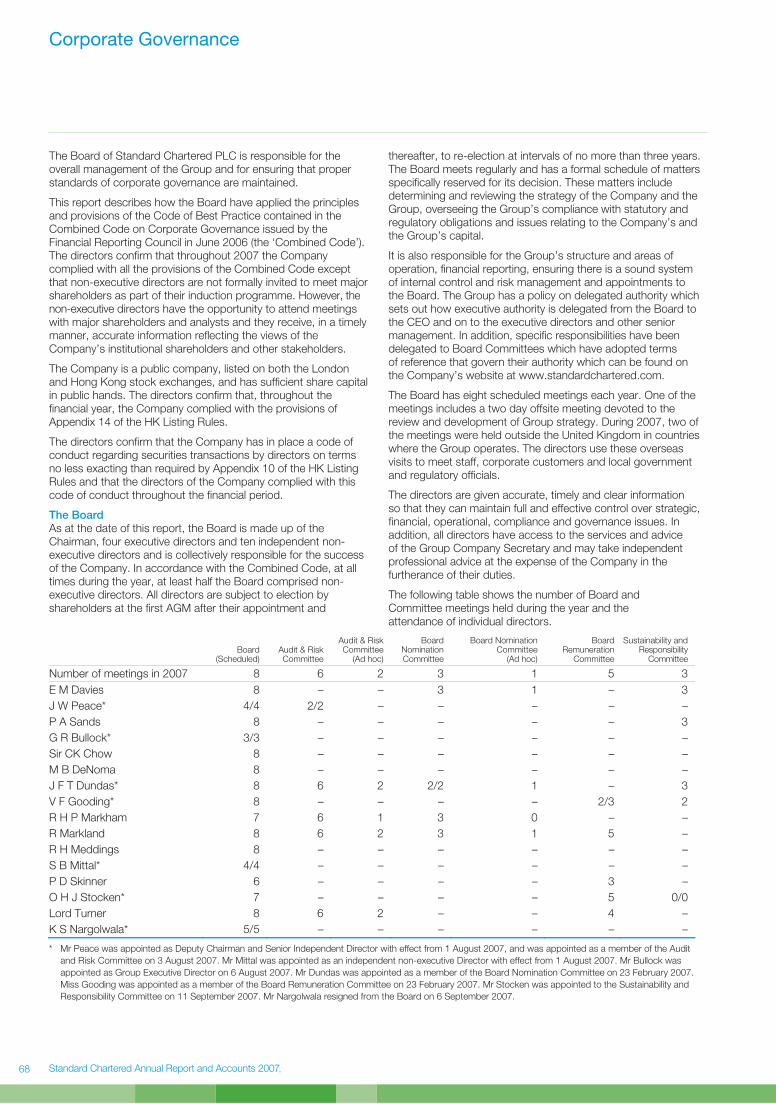
Standard Chartered Annual Report and Accounts 2007
Corporate Governance
68
The Board of Standard Chartered PLC is responsible for the overall management of the Group and for ensuring that proper standards of corporate governance are maintained.
This report describes how the Board have applied the principles and provisions of the Code of Best Practice contained in the Combined Code on Corporate Governance issued by the Financial Reporting Council in June 2006 (the ‘Combined Code’). The directors confirm that throughout 2007 the Company complied with all the provisions of the Combined Code except that non-executive directors are not formally invited to meet major shareholders as part of their induction programme. However, the non-executive directors have the opportunity to attend meetings with major shareholders and analysts and they receive, in a timely manner, accurate information reflecting the views of the Company’s institutional shareholders and other stakeholders.
The Company is a public company, listed on both the London and Hong Kong stock exchanges, and has sufficient share capital in public hands. The directors confirm that, throughout the financial year, the Company complied with the provisions of Appendix 14 of the HK Listing Rules.
The directors confirm that the Company has in place a code of conduct regarding securities transactions by directors on terms no less exacting than required by Appendix 10 of the HK Listing Rules and that the directors of the Company complied with this code of conduct throughout the financial period.
The Board As at the date of this report, the Board is made up of the Chairman, four executive directors and ten independent non-executive directors and is collectively responsible for the success of the Company. In accordance with the Combined Code, at all times during the year, at least half the Board comprised non-executive directors. All directors are subject to election by shareholders at the first AGM after their appointment and
thereafter, to re-election at intervals of no more than three years. The Board meets regularly and has a formal schedule of matters specifically reserved for its decision. These matters include determining and reviewing the strategy of the Company and the Group, overseeing the Group’s compliance with statutory and regulatory obligations and issues relating to the Company’s and the Group’s capital.
It is also responsible for the Group’s structure and areas of operation, financial reporting, ensuring there is a sound system of internal control and risk management and appointments to the Board. The Group has a policy on delegated authority which sets out how executive authority is delegated from the Board to the CEO and on to the executive directors and other senior management. In addition, specific responsibilities have been delegated to Board Committees which have adopted terms of reference that govern their authority which can be found on the Company’s website at www.standardchartered.com.
The Board has eight scheduled meetings each year. One of the meetings includes a two day offsite meeting devoted to the review and development of Group strategy. During 2007, two of the meetings were held outside the United Kingdom in countries where the Group operates. The directors use these overseas visits to meet staff, corporate customers and local government and regulatory officials.
The directors are given accurate, timely and clear information so that they can maintain full and effective control over strategic, financial, operational, compliance and governance issues. In addition, all directors have access to the services and advice of the Group Company Secretary and may take independent professional advice at the expense of the Company in the furtherance of their duties.
The following table shows the number of Board and Committee meetings held during the year and the attendance of individual directors.
Board
(Scheduled) Audit & Risk Committee
Audit & Risk Committee
(Ad hoc)
Board Nomination Committee
Board Nomination Committee
(Ad hoc)
Board Remuneration
Committee
Sustainability and Responsibility
Committee
Number of meetings in 2007 8 6 2 3 1 5 3
E M Davies 8 – – 3 1 – 3
J W Peace* 4/4 2/2 – – – – –
P A Sands 8 – – – – – 3
G R Bullock* 3/3 – – – – – –
Sir CK Chow 8 – – – – – –
M B DeNoma 8 – – – – – –
J F T Dundas* 8 6 2 2/2 1 – 3
V F Gooding* 8 – – – – 2/3 2
R H P Markham 7 6 1 3 0 – –
R Markland 8 6 2 3 1 5 –
R H Meddings 8 – – – – – –
S B Mittal* 4/4 – – – – – –
P D Skinner 6 – – – – 3 –
O H J Stocken* 7 – – – – 5 0/0
Lord Turner 8 6 2 – – 4 –
K S Nargolwala* 5/5 – – – – – –
* Mr Peace was appointed as Deputy Chairman and Senior Independent Director with effect from 1 August 2007, and was appointed as a member of the Audit
and Risk Committee on 3 August 2007. Mr Mittal was appointed as an independent non-executive Director with effect from 1 August 2007. Mr Bullock was
appointed as Group Executive Director on 6 August 2007. Mr Dundas was appointed as a member of the Board Nomination Committee on 23 February 2007.
Miss Gooding was appointed as a member of the Board Remuneration Committee on 23 February 2007. Mr Stocken was appointed to the Sustainability and
Responsibility Committee on 11 September 2007. Mr Nargolwala resigned from the Board on 6 September 2007.

Co
rpo
rate
Go
vern
an
ce
www.standardchartered.com
69
The directors have a diverse range of skills and experience and each brings an independent judgement and considerable knowledge to the Board’s discussions. On appointment, each director receives a comprehensive and tailored induction covering the Group’s business and operations and also the legal, regulatory and other obligations of a director of a dual-listed company. As well as a formal induction, directors receive ongoing training through a wide ranging programme to continually develop and update their knowledge and capabilities. Where an independent non-executive director is appointed to one of the Board’s committees, additional relevant training is provided. Mr Peace was appointed as Deputy Chairman and Senior Independent Director, and Mr Mittal was appointed as an independent non-executive director both with effect from 1 August 2007. Mr Peace and Mr Mittal have substantially completed their induction programmes.
The Company has arranged appropriate insurance cover in respect of legal proceedings and other claims against its directors. In addition, the Company has granted qualifying third party indemnities to the directors and these indemnities remain in force as at 26 February 2008.
The Board’s executive directors are not permitted to hold more than one non-executive directorship of a FTSE 100 company. Details of the directors’ other directorships can be found in their biographies on pages 62 and 63.
Chairman, Deputy Chairman and Group Chief Executive The separate roles and objectives of the Chairman, Deputy Chairman and the Group Chief Executive are clearly defined in written role descriptions which have been approved by the Board and are available on the Company’s website at www.standardchartered.com.
Independent Non-Executive Directors The Board considers that all of the non-executive directors are independent and has received from each of them the annual confirmation of independence required by the HK Listing Rules. Non-executive directors are appointed for an initial three-year term. The reviews of the non-executive directors who have served on the Board for more than six years are covered in the section on the work of the Board Nomination Committee below.
Mr J W Peace, in addition to being Deputy Chairman, is the Senior Independent Director. Shareholders may discuss any issues or concerns with the Senior Independent Director where they have been unable to resolve them through existing channels for investor communications. The Chairman meets with the non-executive directors without the executive directors being present at least annually.
The Board is aware of the other commitments of its non-executive directors and is satisfied that these do not conflict with their duties as directors of the Company. Changes to the commitments of the non-executive directors are reported to the Board.
Board Committees The Board has four committees with specific delegated authorities: the Audit and Risk Committee, the Board Nomination Committee, the Board Remuneration Committee and the Sustainability and Responsibility Committee (previously the Corporate Responsibility and Community Committee).
The Board’s committees are able to take independent professional advice or use external consultants, where appropriate, at the Company’s expense.
Details of these committees and their members are given right and on pages 70-71.
Audit and Risk Committee
The members of the Audit and Risk Committee are:
Mr R H P Markham (chairman) Mr J F T Dundas Ms R Markland Mr J W Peace (appointed 3 August 2007) Lord Turner
All the members of the Committee are independent non-executive directors. The Board considers that each member brings a broad experience and knowledge of financial reporting to the Committee’s deliberations. The Board is satisfied that the Committee’s chairman has recent and relevant financial experience.
The Committee reviews and monitors the integrity of the Company’s annual and interim financial statements, circulars to shareholders and any formal announcements relating to the Group’s financial performance, including significant financial reporting judgements contained in them. The Committee also reviews the recommendations for provisions against bad or doubtful loans and other credit exposures. It keeps under review the appropriateness of the Group’s accounting policies and considers changes to them. Ultimate responsibility for the approval of the annual and interim financial statements rests with the Board.
At least once a year, the Committee meets separately with each of the external auditor and Group Head of Internal Audit without management being present to discuss matters relating to the auditor’s remit and any issues arising from the audit.
In relation to the Group’s internal audit function, the Committee’s responsibilities include:
• monitoring and assessing the role and effectiveness of the Group’s internal audit function and receiving reports from the Group Head of Internal Audit on these matters; and
• considering the appointment, resignation or dismissal of the Group Head of Internal Audit.
In relation to the Group’s external auditor, the Committee’s responsibilities include:
• considering and making recommendations to the Board on the appointment, re-appointment, resignation or dismissal of the external auditor;
• approving the terms of engagement, nature and scope of the audit;
• reviewing the findings of the audit including any major issues that arose during the course of the audit;
• reviewing and monitoring the cost effectiveness of the audit taking into consideration relevant UK professional and regulatory requirements and approving the audit fee; and
• monitoring the fees paid to the auditor for non-audit work and providing prior approval of substantial non-audit work, in accordance with the Group’s policy.
The Committee reviews and reports to the Board on the Group’s compliance with relevant regulatory and statutory requirements. It also reviews the Group’s overall principles for risk management and the processes by which each risk type is managed. It considers reports on the management of risk, including adherence to Group standards, and reports on compliance with policies in respect of liquidity, capital adequacy and interest rate management. The Committee reviews the Group’s internal financial controls and the Group’s internal control systems and reports on these to the Board. Details of the Company’s internal

Standard Chartered Annual Report and Accounts 2007
Corporate Governance continued
70
controls and how risk is managed can be found under the Internal Control section on pages 71 and 72.
During the year the Committee had six scheduled committee meetings where it covered all its responsibilities set out in its Terms of Reference. The Committee’s activities also included regular reviews of progress towards the implementation of Basel II; monitoring the risks associated with the Group’s rapid growth in countries such as China; and it reviewed the Group’s policy and procedures for the governance of its subsidiaries. A further two half-day informal meetings were held to consider more closely the Group’s new areas of business, balance sheet management and Basel II.
Arrangements are in place by which the Company’s employees may, in confidence, raise concerns about possible improprieties in matters of financial reporting or other areas. These arrangements are covered in the Company’s ‘Speaking Up’ policy. The Committee is responsible for reviewing these arrangements and for ensuring that any matters of concern are investigated appropriately.
Board Nomination Committee The members of the Board Nomination Committee are:
Mr E M Davies (chairman) Mr J W Peace (appointed 20 February 2008) Mr J F T Dundas (appointed 23 February 2007) Mr R H P Markham Ms R Markland
The Committee’s responsibilities include:
• reviewing the structure, size and composition of the Board and making recommendations with regard to any changes that the Committee deems necessary to ensure the Board has the optimum balance of skills, knowledge and experience;
• where Board vacancies arise, evaluating the skill, knowledge and experience needed to fill the vacancy, and identifying and nominating suitable candidates to the Board; and
• keeping under review the succession plans for the Group relating to both directors and other senior executives to ensure the Company continues to compete effectively in the marketplace and making consequential recommendations to the Board.
The Committee is also responsible for making recommendations to the Board for the appointment of the Group Chairman, Group Chief Executive or any other director. The Group Chairman will not chair any meeting at which the Committee is considering the appointment of a successor to the Group Chairman.
In the selection process for new directors, the Committee can consult external advisors. An external search consultant was used in the selection processes prior to the appointments of Mr Peace as an independent non-executive director, Deputy Chairman and Senior Independent Director and Mr Mittal as an independent non-executive director. Before recommending the appointment of a non-executive director, the Committee considers the suitability of a candidate against the skills, knowledge and experience required to produce a balanced Board. In addition, the Committee takes into account whether the candidate would have an appropriate amount of time to devote to their duties.
During the year, the Committee reviewed and was assured of the Group’s succession planning processes and the succession plans relating to executive directors and other senior executives with continued focus on both the identification and development of a successor pool that reflects the diversity of our geographic footprint.
Mr Markham has served on the Board for more than six years and the Committee has carried out a rigorous review of his performance and contributions to the deliberations of the Board and the Audit and Risk Committee during 2007. The Committee, as part of its review, has taken into account the need for the progressive refreshing of the Board and believes that Mr Markham continues to be committed to the Company and remains independent in character and judgement.
In addition, the Committee has reviewed the performance of the non-executive directors standing for re-election at the 2008 AGM and made recommendations to the Board on their re-election. Members of the Committee take no part in any discussion concerning their own performance or circumstance.
Board Remuneration Committee The members of the Board Remuneration Committee are:
Ms R Markland (chairman) Miss V F Gooding (appointed 23 February 2007) Mr P D Skinner Mr O H J Stocken Lord Turner
The Committee determines the pay and benefits of the Group Chairman, the Group Chief Executive and all other executive directors. It also reviews and approves the remuneration of certain other highly paid senior management. The remuneration of all directors and senior management is subject to regular monitoring to ensure that levels of remuneration and compensation are appropriate.
A statement of the Company’s remuneration policy for directors and details of the work of the Committee are included in the Directors’ Remuneration Report on pages 73 to 85.
Sustainability and Responsibility Committee The members of the Sustainability and Responsibility Committee are:
Mr E M Davies (chairman) Mr P A Sands Mr J F T Dundas Miss V F Gooding Mr O H P Stocken (appointed 11 September 2007) The Committee considers matters relating to how Standard Chartered can build a sustainable business through consideration of environmental protection, social investment, economic development and other sustainability and responsibility matters which are an integral part of enhancing the Company’s long-term shareholder value.
The Committee’s responsibilities include:
• ensuring that the Group’s sustainability and responsibility aspirations and business activities are aligned;
• responding to emerging sustainability and responsibility issues arising from external trends in sustainability, regulation, legislation, stakeholder guidance and reporting;
• reviewing new Company policies or material changes to existing policies relating to matters of sustainability and responsibility, to ensure changes are in line with sustainability and responsibility principles and reflect emerging trends and developments; and
• ensuring that the Group is in a position to deliver an annual Sustainability Review in line with best practice.

Co
rpo
rate
Go
vern
an
ce
www.standardchartered.com
71
During the year, the Committee discussed progress against the sustainability priority areas including the Group’s response to protecting the environment, responsible selling and marketing of products and services, microfinance and financial inclusion, and diversity and inclusion.
The Committee ensures that the Group continues to make progress in its efforts to understand and respond to the concerns and interests of stakeholders. The Group has a formal plan for stakeholder engagement that builds on the comprehensive work already carried out on employee engagement and customer satisfaction. In 2007, this plan focused at a Group level on the socially responsible investment analyst community, development organisations as well as on the development and environmental departments within the UK government.
The findings of this stakeholder research, alongside peer analysis and consideration of recognised sustainability benchmarks and indices are used in setting the agendas for the Committee’s meetings.
Performance Evaluation The Board is responsible for ensuring that a rigorous evaluation is carried out of its performance, and that of its committees and individual directors.
During 2007, each of the directors completed a questionnaire and supplementary interviews were held between the Chairman and each of the non-executive directors. The evaluation of the Chairman formed part of this process. The results of the evaluation were presented to the Board and the Board was satisfied that it continues to operate in an effective manner. Individual appraisals of the directors were undertaken during 2007 by the Chairman, Group Chief Executive and Board Nomination Committee as appropriate.
The Board Nomination Committee and the Board Remuneration Committee each conducted a questionnaire based self-assessment of their effectiveness. The performance of the Audit and Risk Committee was evaluated by an independent external assessor. The Sustainability and Responsibility Committee carried out a full review of its remit during 2007, and as a result, revised its terms of reference.
Relations with Shareholders The Board recognises the importance of good communications with all shareholders. There is a regular dialogue with institutional shareholders and general presentations are made when the financial results are announced. The AGM is used as an opportunity to communicate with all shareholders.
The Combined Code requires companies send the notice of the AGM to shareholders at least 20 working days before the date of the meeting. In addition to this requirement the Company will always give shareholders the 21 days’ notice required by the Companies Act 2006 and the HK Listing Rules. Separate resolutions are proposed for each substantially separate issue. The Company displays the proxy voting on each resolution at the AGM and the full voting results on the Company’s website. The notice of AGM is also available on audio cassette and CD.
The Company encourages its shareholders to receive the Company’s corporate documents electronically. The annual and interim financial statements, notice of AGM and dividend circulars are all available electronically. Shareholders are also able to vote electronically on the resolutions being put to the AGM. If you do not already receive your corporate documents electronically and would like to do so in future please contact the Company’s Registrars at the address on page 166.
Auditor Independence and Objectivity The Company has adopted a policy on the use of non-audit services provided by the Company’s external auditor, KPMG. The Audit and Risk Committee’s pre-approval is required before the Company uses non-audit services that fall within definitions contained in the policy. The non-audit services of KPMG will only be used where the Company benefits in a cost-effective manner and the auditor maintains the necessary degree of independence and objectivity.
In addition to audit-related services, KPMG provided the following types of services in 2007:
• tax advisory and compliance;
• advice and support with due diligence exercises;
• advice on IFRS accounting;
• regulatory reviews and reporting;
• corporate recovery services; and
• risk and compliance advisory services.
Details of the amounts paid to KPMG during the year for audit and non-audit services are set out in note 8 to the accounts.
Going Concern The Board is satisfied that the Group has adequate resources to continue in business for the foreseeable future. For this reason it continues to adopt the going concern basis when preparing the financial statements.
Internal Control The Board is committed to managing risk and to controlling its business and financial activities in a manner which enables it to maximise profitable business opportunities, avoid or reduce risks which can cause loss or reputational damage, ensure compliance with applicable laws and regulations, and enhance resilience to external events. To achieve this, the Board has established a process for the identification, evaluation and management of the risks faced by the Group which operated throughout the year ended 31 December 2007 and to 26 February 2008, the date the Board approved this annual report and accounts. It should be recognised that such a process can only provide reasonable, not absolute, assurance against material misstatement or loss. This process is reviewed regularly by the Board and meets the requirements of the guidance entitled ‘Internal Control: Guidance for Directors on the Combined Code’ issued by the Institute of Chartered Accountants in England and Wales in 1999 and revised in 2005. The system of internal control of the Group is also subject to regulatory oversight in the United Kingdom and overseas.
The effectiveness of the Group’s internal control system is reviewed regularly by the Board, its committees, Group management, and Group Internal Audit. The Audit and Risk Committee has reviewed the effectiveness of the Group’s system of internal control during the year ended 31 December 2007 and reported on its review to the Board. The Committee’s review was supported by an annual business self-certification process, which was managed by Group Internal Audit.
Group Internal Audit monitors compliance with policies and standards and the effectiveness of internal control structures across the Group through its programme of business audits. The work of Group Internal Audit is focused on the areas of greatest risk as determined by a risk-based assessment methodology.
Group Internal Audit reports regularly to the Audit and Risk Committee, the Chairman and to the Group Chief Executive. The findings of all adverse audits are reported to the Chairman and to the Group Chief Executive and immediate corrective action is required.

Standard Chartered Annual Report and Accounts 2007
Corporate Governance continued
72
The Risk Review on pages 43 to 61 describes the Group’s risk management structure. The Group’s business is conducted within a developed control framework, underpinned by policy statements, written procedures and control manuals. This ensures that there are written policies and procedures to identify and manage risk including operational risk, country risk, liquidity risk, regulatory risk, legal risk, reputational risk, market risk and credit risk. The Board has established a management structure that clearly defines roles, responsibilities and reporting lines. Delegated authorities are documented and communicated. Executive risk committees regularly review the Group’s risk profile.
The performance of the Group’s businesses is reported regularly to senior line management and the Board. Performance trends and forecasts, as well as actual performance against budgets and prior periods, are monitored closely. Financial information is prepared using appropriate accounting policies, which are applied consistently. Operational procedures and controls have been established to facilitate complete, accurate and timely processing of transactions and the safeguarding of assets. These controls include appropriate segregation of duties, the regular reconciliation of accounts and the valuation of assets and positions.
Compliance and Regulatory Matters During 2004, Standard Chartered Bank entered into a Written Agreement with the Federal Reserve Bank of New York and the New York State Banking Department to address deficiencies relating to compliance with applicable federal and state laws, rules and regulations governing anti-money laundering. The Bank achieved full compliance with the terms of the Written Agreement during 2007, and accordingly the Written Agreement was lifted by the regulators.
Group Code of Conduct The Board has approved a Group Code of Conduct relating to the lawful and ethical conduct of business and this is supported by the Group’s core values. The Group Code of Conduct has been communicated to all employees. All employees are expected to observe high standards of integrity and fair dealing in relation to customers, staff and regulators in the communities in which the Group operates.
Social, Ethical and Environmental Responsibilities The Group complies with the guidelines issued by the Association of British Insurers on socially responsible investment and reporting on social, ethical and environmental (‘SEE’) matters and is committed to the communities and environments in which it operates. The Board is responsible for ensuring that high standards of responsible business are maintained and that an effective control framework is in place. The Group has established and maintains policies and procedures in relation to SEE related risks. Details of these policies can be found on the Company’s website at: www.standardchartered.com/sustainability. Through the Group’s risk management structure and control framework, the Board receives regular and adequate information to identify and assess significant risks and opportunities arising from SEE matters.
Designated policy owners monitor risks in their area. They also work with line management to assist them in designing procedures to ensure compliance with these requirements. In every country, the Country Management Committee (‘MANCO’) supported by the Country Operational Risk Group (‘CORG’) is responsible for ensuring there are risk management frameworks in place to monitor, manage and report SEE risk. The Country Chief Executives chair both the MANCOs and CORGs.
Compliance with these policies and procedures is the responsibility of all managers. In assessing, incentivising and rewarding performance, guidance to managers was published during 2002. This explicitly states that account should be taken of adherence to all relevant Group policies, including those associated with SEE risk. Significant exceptions and emerging risks are escalated to senior management through clearly documented internal reporting procedures such as MANCO.
Key areas of risk are those associated with customers’ social issues and any impact they may have on the natural environment. The Board recognises its responsibility to manage these risks and that failure to manage them adequately would have an adverse impact on the Group’s business. These risks are implicitly recognised in reaching lending decisions explicitly identified in the Group’s lending policies. The Group has adopted the revised Equator Principles 2 that set procedures, based on the International Finance Corporation guidelines, for recognising the environmental and social impacts and risks associated with project finance. The Principles have been embedded in the Group’s project finance lending policy and procedures.
The Group continues to review and, where appropriate, strengthen its money laundering prevention policies, procedures and training.
The Board is not aware of any material exceptions to its policies.

Co
rpo
rate
Go
vern
an
ce
www.standardchartered.com
Directors’ Remuneration Report
73
Dear Shareholder
The Directors’ Remuneration Report (the ‘DRR’) has been prepared by the Board Remuneration Committee (the ‘Committee’) and approved by the Board as a whole. In line with previous years, this report sets out:
• background information on the Committee’s members, role and advisors;
• the Group’s remuneration policy for executive directors and other employees;
• an outline of the remuneration arrangements for the Group Chairman, executive directors and non-executive directors;
• detailed information on the Group’s share plans;
• tabular information on directors’ emoluments, pension arrangements and share awards; and
• tabular information on highest paid individuals.
2007 was a busy year for the Committee. As the Group continued to grow both organically and inorganically, the Committee conducted, at the beginning of the year, a full review of its effectiveness. As a result of this, we were able to prioritise discussions to enable the Committee to focus on key substantive issues. In addition to our regular agenda items, such as reviewing directors’ compensation, managing the Group-wide variable compensation spend and reviewing share plan design and performance conditions, we held specific sessions on other remuneration-related issues including, amongst other things:
• Wholesale Bank’s reward programmes, to ensure that these are consistent with the business strategy and market practice, but also aligned with the Group’s overarching reward principles; and
• an extensive strategic review of the overall shape of the executive remuneration package, including the balance between fixed, short and long term elements.
On behalf of the Committee, I encourage you to vote in favour of our report at the Company’s 2008 Annual General Meeting and, in the meantime, welcome any questions and feedback that you may have.
Ms R Markland Chairman, Board Remuneration Committee 26 February 2008
Background Information on the Committee Membership In 2007, the Committee comprised the following independent non-executive directors:
Ms R Markland (Chairman)
Miss V F Gooding (appointed 23 February 2007)
Mr P D Skinner
Mr O H J Stocken
Lord Turner
Role of the Committee During 2007, the Committee met five times. Details of attendance at meetings by Committee members are shown on page 68.
The Committee has specific terms of reference which are placed on the Group’s website at www.standardchartered.com. It considers and recommends to the Board the Group’s remuneration policy and agrees the individual remuneration packages of the Group Chairman, Group Chief Executive and all other executive directors.
The Committee also reviews and approves the remuneration of certain other highly paid senior management of the Group and advises on any major changes in employee remuneration throughout the Group, including the continuous review of incentive schemes to ensure that they remain appropriate.
Advisors to the Board Remuneration Committee In 2004, the Committee appointed Kepler Associates as its independent advisors. In 2007, the Committee reappointed Kepler Associates to advise it on a range of executive remuneration-related issues for a further 12-month period. Kepler Associates does not provide any other advice or services to the Group.
In addition, during 2007, the Committee received advice from the Director of People, Property and Assurance (Dr T J Miller), the Group Head of Human Resources (Mrs T J Clarke) and the Group Head of Reward (Dr N A Cuthbertson). Their advice draws on formal remuneration survey data provided by Towers Perrin and McLagan Partners.
Towers Perrin also provided advice to the Group on executive remuneration issues as well as retirement consulting issues in North America and, together with Clifford Chance LLP, on the design and operation of the Group’s share plans. Clifford Chance LLP also advises on issues relating to executive directors’ contracts. McLagan Partners also provided advice to the Group on market practice in variable compensation plans within the wholesale banking sector.
Remuneration Policy Group The success of the Group depends upon the performance and commitment of talented employees. The Group’s reward programmes support and drive its business strategy and reinforce its values. Its existing remuneration policy for 2007 and, so far as practicable, for subsequent years is to:
• support a strong performance-oriented culture and ensure that individual rewards and incentives relate directly to the performance of the individual, the operations and functions in which they work or for which they are responsible, the Group as a whole and shareholders’ interests; and

Standard Chartered Annual Report and Accounts 2007
DDirectors’ Remuneration Report continued
74
• maintain competitive reward that reflects the international nature of the Group and enables it to attract and retain talented executives of the highest quality internationally. Many of the Group’s employees bring international experience and expertise to the Group and the Group recognises that it recruits from an international marketplace.
The Committee reviews the remuneration policy on a regular basis against significant regulatory developments, market practice and shareholder expectations.
Executive Directors Target remuneration levels for the executive directors are set with reference to individual experience as well as the pay levels in the FTSE 30 and the Group’s international competitors. These two groupings have business characteristics similar to the Group such as international scope of operations, complexity and size (both in financial terms and with regard to numbers of employees), and represent organisations which compete alongside the Group for talent.
Although target remuneration levels are aligned to the market, excellent performance by both the Group and by the individual executive director is rewarded with higher bonus levels and share awards, taking potential total remuneration to the upper quartile or higher of the Group’s key international competitors.
As the table below demonstrates, each executive director’s target remuneration is structured to give the heaviest weighting to performance-related elements.
Percentage of indicative total
target remuneration
Percentage of actual 2007 total
remuneration*
Base Salary 34% 23%
Bonus 43% 42%
Long-Term Incentives** 23% 35%
* Based on average of Group Executive Directors
** Includes an expected value of target share awards.
Other Employees The Committee considers the remuneration policy in the context of all Group employees.
Base salaries of employees are determined in a similar way to those of executive directors. The Group’s approach is to ensure that target total compensation is benchmarked to the relevant market in which the individual is employed. Potential total compensation is set at upper quartile or higher for excellent individual and business performance. In addition:
• all employees are eligible to receive a discretionary bonus dependent upon performance and their contractual position;
• all employees are eligible to participate in the Group’s all- employee sharesave schemes;
• core benefits are provided to all employees worldwide based on local regulations and competitive practice. These will normally include retirement benefits, medical insurance, life assurance and annual leave;
• all employees are eligible to receive an award under one or more of the Group’s discretionary share plans depending on performance and potential. The Group is actively seeking to extend the level of equity participation enabling more employees to share in the Group’s success, rewarding and retaining talent throughout the Group at all levels. In 2005 and 2006, over 1,000 and 1,300 employees respectively received a discretionary share award for the first time. In 2007, a further 1,591 were added to this total; and
• the Group is keen that an element of each employee’s total compensation is performance-related. The proportion of this variable compensation (which might be delivered through bonus and share awards) increases with seniority. In addition, as the chart below shows, the balance of shares as opposed to cash also increases with seniority. The chart also shows the typical level of target variable compensation for senior executives/management (the Group’s bands 1-4) expressed as a percentage of base salary.
200
150
100
50
0
Band 1 Band 2
Band of executive
Band 3 Band 4BankDirectors
Breakdown of target variable compensation between cash and sharesAs a percentage of base salary
Delivered in shares (based on expected value and as % of base)
Delivered as cash bonus (as % of base)
Although the above principles apply Group-wide, there is some variation in how compensation is delivered. The Group employs 70,000 employees worldwide in over 50 countries and territories. There are differing local market conditions which means compensation is often structured in different ways (for example, base salaries are not always the only element of core compensation). Furthermore, due to the different costs of living in the countries in which the Group operates and fluctuations in foreign exchange rates, the Committee does not consider a ratio comparison between executive directors and non-Board employees to be a useful way of assessing the fairness of the Group’s practices.
Remuneration Arrangements for Executive Directors Base Salaries Salary levels are reviewed annually by the Committee taking account of the latest available market data.
Any increases in annual base salary are normally effective from 1 April of the relevant year. The annual base salary levels of executive directors as at 31 December 2006 and 31 December 2007 were as follows:
31 December
2006* 31 December
2007
Increase as a percentage of
base salary
P A Sands $1,102,970 (£550,000)
$1,504,050 (£750,000)
36.36%
G R Bullock n/a** $952,565 (£475,000)
n/a
M B DeNoma $932,511 (£465,000)
$982,646 (£490,000)
5.38%
R H Meddings $932,511 (£465,000)
$1,022,754 (£510,000)
9.68%
* In 2007, increases to base salaries took effect from 1 January following the
reconfiguration of the executive directors’ portfolios as a result of Board
changes in November 2006.
** Mr Bullock was appointed to the Board with effect from 6 August 2007.

Co
rpo
rate
Go
vern
an
ce
www.standardchartered.com
75
Annual Performance Bonus Eligibility Criteria Executive directors (and most employees) are eligible to receive a discretionary annual bonus. The objective of the annual bonus is to focus participants on the achievement of annual objectives, which align the short-term performance of the Group with the creation of shareholder value.
Plan Mechanics The target and maximum award levels for executive directors are 125 per cent and 200 per cent of base salary respectively. Two-thirds of any bonus payment is payable immediately in cash. The balance is deferred into Company shares, which vest up to one year later. The deferred element is forfeited if the executive leaves voluntarily during that period. Notional dividends accrue on deferred hares during the vesting period and are delivered in the form of shares.
As part of its strategic review of executive compensation, the Committee reviewed the existing maximum it had previously set under the plan and decided to exercise its discretion to increase it, for outstanding performance, with effect from 2008, from 200 per cent to 250 per cent of base salary. Any bonus over the previous plan maximum would be awarded entirely in deferred shares. No change has been made to the target bonus level which remains at 125 per cent of salary.
The change in maximum bonus ensures that the Plan remains competitive against the market, increases the proportion of the annual incentive awarded for exceptional performance which is deferred and provides the Committee with greater scope to differentiate in award levels for those with exceptional performance.
Bonus Pools The Committee has oversight on the overall spend under the Group’s Annual Bonus Plan in which executive directors and employees participate. The bonus pool size is linked to the Committee’s formal assessment of Group performance by considering a number of quantitative and qualitative measures, including earnings per share; revenue growth; costs and cost control; bad debts; operating profit; risk management; cost to income ratio, total shareholder return, corporate social responsibility and customer service.
Determining Individual Awards Executive directors’ bonus awards are made based on Group (as described above) and individual performance.
Personal performance is appraised taking account not only of the results achieved by the individual but also their support of the Group’s values and contribution to the collective leadership of the Group. The ‘values’ principle is applied throughout the organisation. Each executive director has written objectives which are presented to the Committee at the start of the financial year and then assessed at the year-end.
The importance of individual and Group performance as a determinant of the level of awards is reflected in the variation of actual bonus award levels made to executive directors in recent years.
Min award actually made
(as percentage of base salary)
Max award actually made
(as percentage of base salary)
Target award (as percentage of base salary)
Max award permitted
under rules (as percentage of base salary)
2007 164% 200% 125% 200%
2006 161% 191% 125% 200%
Long Term Incentives 2001 Performance Share Plan (the ‘PSP’) Outline of the PSP The PSP is designed to be an intrinsic part of total remuneration for the Group’s executive directors and a growing number of the Group’s senior executives. It is an internationally competitive long-term incentive plan that focuses executives on meeting and exceeding the Group’s long-term performance targets. The significance of the PSP as a percentage of executive directors’ total potential remuneration is one of the strongest indicators of the Group’s commitment to paying for demonstrable performance.
Under the PSP, awards of deferred rights or nil price options to acquire shares are granted and are exercisable after the third, but before the tenth anniversary of the date of grant, if the individual is still employed by the Group.
The target and maximum levels of award are 150 per cent and 400 per cent of base salary respectively in any one year. Awards are entirely discretionary and are based on directors’ individual performance.
As shown in the table below, there has been variation in the levels of share awards made to executive directors, again illustrating the importance the Group places on individual performance. A performance test is therefore effectively applied both at the time of award and upon vesting. The table shows the face value of the awards made in recent years.
Min award actually made
(as percentage of base salary)
Max award actually made
(as percentage of base salary)
Target award (as percentage of base salary)
Max award permitted
under rules (as percentage of base salary)
2007 250% 275%* 150% 400%
2006 275% 350% 150% 400%
* As disclosed in last year’s report and accounts, a PSP award of £2.6 million
was granted to Mr Davies in respect of his performance as Group CEO for
the financial year ending 31 December 2006. This award equated to 306 per
cent of his former base salary.
At its meeting in February 2008, the Committee recommended the following proposed PSP awards for executive directors in respect of performance for the 2007 financial year.
Face value (£000s)
Percentage of
current base salary
P A Sands 2,625 350%
G R Bullock 1,544 325%
M B DeNoma 1,348 275%
R H Meddings 1,785 350%
The Committee reviewed the performance conditions in 2007 and concluded that, in aggregate, the combination of the EPS and TSR performance measures and their targets remained appropriate, providing a balance between driving stretching performance and having an effective retention and motivation tool.
Performance Conditions The Committee will set appropriate performance conditions each time that awards are made under the PSP. Half of the award is dependent upon the Group’s TSR performance compared to that of a comparator group at the end of a three-year period. The other half of the award will be subject to an EPS growth target applied over the same three-year period.
s

Standard Chartered Annual Report and Accounts 2007
DDirectors’ Remuneration Report continued
76
The rationale for the selection of these performance conditions is set out in the following table:
TSR Measuring growth in share price plus dividends paid to shareholders during that period, relative TSR is recognised as one of the best indicators of whether a shareholder has achieved a good return on investing in the Group relative to a basket of companies or a single index.
EPS An EPS performance condition provides an appropriate measure of the Group’s underlying financial performance.
TSR Element The constituents of the TSR Comparator Group are set out in the table below:
ABN AMRO HSBC
Bank of America JP Morgan Chase
Bank of East Asia Lloyds TSB
Barclays
Citigroup Overseas Chinese Banking Corporation
DBS Group Royal Bank of Scotland
Deutsche Bank United Overseas Bank
HBOS Standard Chartered
The percentage of award which will normally be exercisable at the end of the relevant three-year performance period is as follows:
Position within Comparator Group Percentage of
award exercisable
9th – 15th Nil
8th 15
7th 22
6th 29
5th 36
4th 43
1st – 3rd 50
The Committee believes that it is preferable to measure TSR performance using a local currency approach. This is considered the most appropriate approach given the international composition of the Comparator Group, particularly as a significant proportion of comparator companies’ profits are in the same currency as their primary listing. This local currency approach measures the real impact for a shareholder focusing on relative stock movement rather than taking into account exchange rate fluctuation.
EPS Element The percentage of award which will normally be exercisable at the end of the relevant three-year performance period is as follows:
Increase in EPS Percentage of
award exercisable
Less than 15% Nil
15% 15
Between 15% and 30% >15 but <50*
30% or greater 50
* Calculated on a straight-line basis.
Vesting of Awards The Committee recently reviewed whether the performance conditions on the awards granted in 2005 were satisfied at the end of December 2007. At the end of the performance period, the Group was ranked third out of the comparator group of 15 in terms of TSR. Over the same period, the Group’s EPS growth was 58 per cent. Consequently, the Committee determined that 100 per cent of the shares subject to each award has now vested. For awards granted in 2007, normalised EPS of 170.7 cents was used as a base EPS figure.
2000 Executive Share Option Scheme (the ‘2000 ESOS’) Outline of the 2000 ESOS It is proposed that no further awards will be made under the 2000 ESOS. However, the scheme will be retained for use in exceptional circumstances or if there is a subsequent change in policy in response to future market trends.
Executive share options to acquire the Company’s ordinary shares are exercisable after the third, but before the tenth, anniversary of the date of grant. The exercise price per share is the share price at the date of grant and options can normally only be exercised if a performance condition is satisfied.
Performance Conditions Options awarded since January 2004 are subject to a sliding scale EPS target without re-testing, as set out in the following table.
Increase in EPS (over performance period)
Percentage of award exercisable
Less than 15% Nil
15% 40
Between 15% and 30% >40 but <100*
30% or greater 100
* Calculated on a straight-line basis.
Vesting of Awards The Committee recently reviewed whether the performance conditions on the awards granted in 2005 were satisfied at the end of December 2007. Over this period, the Group's EPS growth was 58 per cent. As a result, 100 per cent of the options subject to each award has now vested.
Restricted Share Scheme (the ‘RSS’) The RSS is designed to motivate and retain high performing and high potential staff at any level of the organisation.
Executive directors are not generally eligible to participate in the RSS. However, upon recruitment to the Group, awards may be made on an exceptional basis, for example, to newly appointed executive directors to compensate such directors for share awards forfeited on leaving their previous employer. No such awards have been made since 2003.
Under the RSS, the value of shares awarded in any year to any individual may not exceed two times’ their base salary. 50 per cent of the award vests two years after the date of grant and the balance after three years. The RSS, in line with other similar schemes operated by our competitors, does not have performance conditions.
Along with the all-employee sharesave schemes detailed below, the RSS plays an important part in the Group’s ambition to increase employee share ownership at all levels across its operations internationally.

Co
rpo
rate
Go
vern
an
ce
www.standardchartered.com
77
All-employee Sharesave Schemes The Group believes strongly in encouraging employee share ownership at all levels in the organisation. It seeks to engage employees in the Group’s performance, align their interests more closely with those of shareholders and offer them an opportunity for long-term savings and a share in the Group’s financial success which they help to create. The Group has operated UK and International sharesave schemes since 1984 and 1996 respectively, the latter being specifically launched to allow all non UK based employees to participate.
Under sharesave, employees are invited to open a three-year or a five-year savings contract. Within a period of six months after the third or fifth anniversary, employees may purchase ordinary shares in the Company at a price which is at a discount of up to 20 per cent on the share price at the date of invitation. As at 31 December 2007, 42 per cent of employees globally participate in the Group’s all-employee sharesave schemes (2006: 37 per cent). There are no performance conditions attached to options granted under these schemes.
In some countries in which the Group operates, it is not possible to operate sharesave, typically because of securities laws, regulatory or other similar issues. In these countries the Group offers an equivalent cash-based scheme to its employees.
Further details on the long term incentives operated by the Group are set out in note 41.
Shareholding Guidelines The Group operates a shareholding guideline policy which aims to align the interests of executives with shareholders by ensuring that they build up a significant equity stake in the Company. The key aspects of the guidelines are as follows:
there is a single shareholding target for employees at specific levels;
executives will be expected to retain any shares acquired on the exercise of awards granted under the 2000 ESOS, the PSP and the Deferred Bonus Plan until such time as the shareholding guideline is satisfied. However, executives may sell sufficient shares to pay for any tax and exercise price (if any). Vested but unexercised RSS awards and interests under the Deferred Bonus Plan count towards the guideline level; and
the Committee annually reviews the progress made by executives in terms of meeting their guideline targets. It will also continue to review the guideline levels to ensure they remain challenging and appropriate.
The current guideline levels are as follows:
Group CEO at least 100,000 shares
Group Executive Directors at least 60,000 shares
Standard Chartered Bank Directors at least 40,000 shares
Other Senior Management at least 10 – 15,000 shares
Retirement Benefits All of the executive directors are eligible for retirement benefits. The Group policy is to provide a retirement benefit to executive directors, equivalent to two-thirds of base salary for those who have completed at least 20 years’ service with the Group at retirement.
The retirement benefits are provided through a combination of approved and/or unapproved defined benefit and cash structures depending upon when the executive director joined the Group and his geographical location. Executive directors are given the opportunity to waive a proportion of any potential bonus to enhance their unfunded unapproved retirement benefits. Any amounts waived in respect of 2007 are shown on page 81 and
the additional pension benefits have been calculated by the Group’s actuary using the assumptions adopted for IAS 19 reporting.
The defined benefit plans comprise a combination of the Standard Chartered Pension Fund, an approved non-contributory scheme, and an unapproved retirement benefit scheme. The unapproved scheme is unfunded but the benefits are secured by a charge, in the name of an independent trustee, over specific Group assets. The unapproved unfunded retirement benefit scheme provides that part of the benefit which exceeds the lifetime allowance. In other respects the terms of the unapproved scheme are designed to mirror the provisions of the Standard Chartered Pension Fund. On the death in service of an executive director, pension benefits are available to a spouse and dependant children and a lump sum is payable.
Base salary is the only element of remuneration which is pensionable.
Executive Directors’ Contracts of Employment The Group policy is for all executive directors to receive and be required to give 12 months’ notice. The dates of the executive directors’ contracts of employment are as follows:
Mr P A Sands 31 December 2003
Mr G R Bullock 19 October 2004
Mr M B DeNoma 11 December 2003
Mr R H Meddings 12 December 2003
Mr K S Nargolwala* 14 December 2006
* Mr Nargolwala resigned from the Board on 6 September 2007.
All executive directors have contracts subject to 12 months’ rolling notice. These terminate automatically at the first annual general meeting following the executive directors’ 60th birthday.
The contracts contain payment in lieu of notice (‘PILON’) provisions which can be exercised at the Group’s discretion. The PILON would comprise an amount equal to 12 months’ base salary, pension contributions/entitlement and certain benefits and allowances (such as life assurance and car allowance). The amount of any bonus payable as part of a PILON is determined by the Committee taking into consideration individual and Group performance. Any payment under the PILON provisions would be paid in quarterly instalments and be subject to mitigation.
There are special provisions which apply in the event that the Company terminates the executive’s contract in the 12 months following a change of control without giving notice. These provide that, if the executive’s contract is terminated by the Group (other than where summary dismissal is appropriate or the executive serves out notice), the Group will pay in four equal instalments an amount equal to 12 months’ base salary, bonus, pension contributions/entitlement and certain benefits and allowances. The amount of bonus payable in respect of the 12 months following the date of termination is the executive’s target bonus. The amount of bonus payable in respect of the performance period which the executive director worked prior to termination will be decided by the Committee taking into consideration individual and Group performance, unless such a period is less than six months, in which case a pro rata target bonus is payable.
Group Chairman Contract Mr Davies’ contract of employment is dated 23 February 2007 and is subject to 12 months’ rolling notice, albeit that the contract automatically expires on 31 December 2011. The terms of his contract governing PILON provisions and payments on termination are similar to those outlined above in relation to executive directors.

Standard Chartered Annual Report and Accounts 2007
DDirectors’ Remuneration Report continued
78
Compensation Mr Davies is paid a base fee of $1,303,510 (£650,000) per annum, payable in cash. In addition, he is provided with a car and driver, private healthcare provision and life assurance coverage. As reported last year, Mr Davies received a final PSP award in March 2007 in respect of his performance as Group Chief Executive during the financial year ended 31 December 2006. As Group Chairman, Mr Davies is no longer eligible to receive future discretionary share awards or to participate in either the Group’s annual bonus or retirement plans. The Chairman’s fees will be reviewed in 2008.
Non-executive Directors of Standard Chartered PLC The fees of the non-executive directors are determined by the Chairman and the executive directors and are non-pensionable. Non-executive directors’ fees are reviewed at least every two years and, as with executive directors’ remuneration, reflect the international nature of the roles which they perform.
Basic annual fees and committee fees are set to be competitive against the Group’s international comparator group. The non-executive directors’ fees were reviewed in July 2007 and are set out in the table below (fees prior to review are shown in italics). Increases in fee levels, particularly for involvement in committees, reflect, in part, the growing regulatory and governance responsibilities resulting in an increase in the time commitment required by non-executive directors.
Ordinary membership Chairmanship
PLC Board $130,351 (£65,000)
$120,324 (£60,000)
–
–
Deputy Chairman* $300,810 (£150,000) –
Audit and Risk $40,108 (£20,000)
$30,081 (£15,000)
$100,270 (£50,000)
$80,216 (£40,000)
Board Nomination $15,041 (£7,500)
$6,016 (£3,000)
N/A**
Board Remuneration $30,081 (£15,000)
$25,068 (£12,500)
$60,162 (£30,000)
$50,135 (£25,000)
Sustainability and Responsibility
$10,027 (£5,000)
$10,027 (£5,000)
N/A**
* Mr J W Peace was appointed as Deputy Chairman and Senior Independent
Director with effect from 1 August 2007 and receives an all-inclusive fee.
** Mr Davies is chairman of the Board Nomination Committee and the
Sustainability and Responsibility Committee. As Group Chairman, he does
not receive any fees in his capacity as a member of either committee.
Further detail on non-executive directors’ fees is set out on page 80.
Details of Non-executive Directorships held by the Executive Directors Certain directors serve as non-executive directors of other companies. Details of these directorships are contained on pages 62 and 63. Details of non-executive fees of executive directors are shown below:
Name Organisation Current annual fees
G R Bullock Fleming Family & Partners Limited
MCashback Limited
Spirax-Sarco Engineering plc
No fees payable
No fees payable $60,162*
M B DeNoma MasterCard Asia Pacific Pte Ltd
No fees payable
* Indicates fees are retained by the director.
Performance Graph The graph below shows the Group’s TSR performance on a cumulative basis over the last five years alongside that of the FTSE 100 and the PSP comparator group. The FTSE 100 provides a broad comparator group against which the Group’s shareholders may measure their relative returns. The Company is a constituent member of the FTSE 100 Index and the London Stock Exchange is the principal exchange for the Company’s shares.
Total Shareholder Return Performance Graph Percentage change in TSR over five-year period
50
125137
148
205
242
307
200
275
350
Jan 08Jan 07Jan 06Jan 05Jan 04Jan 03
– Standard Chartered – FTSE 100 – Median
Data provided by Thomson Financial
Co
rpo
rate
Go
vern
an
ce
www.standardchartered.com
79
Miscellaneous Long Term Incentive-related Matters Employee Benefit Trusts The Group has two employee benefit trusts which are administered by an independent trustee and which hold ordinary shares to meet various obligations under the Group’s incentive plans. One trust (the ‘2004 trust’) is used in conjunction with the 2004 Deferred Bonus Plan. The other trust (the ‘1995 trust’) holds shares to satisfy the exercise of awards under the Group’s various share plans. The independent trustee does not have any rights to dividends and voting is at the discretion of the trustee.
The respective holdings of the trusts are as follows:
31 December
2007 31 December
2006
1995 trust 261,495 2,148,874
2004 trust 377,270 311,157
As the Chairman and each executive director is within the class of beneficiary of these trusts, they are deemed, for the purposes of the Companies Act 1985, to have an interest in the trusts’ shares.
Dilution Limits The Group’s existing share plans contain various limits which govern the amount of awards that may be granted and also the amount of shares which may be issued to satisfy any subsequent exercise of awards. These limits, which are monitored, are in line with those stated in the Association of British Insurers’ corporate guidelines. Under the terms of the Company’s listing on the Stock Exchange of Hong Kong, there is an additional limit which provides that awards under any plan cannot be granted (whether to be satisfied through the issue of new shares or market purchased shares) which would cause the total number of shares under option (all schemes) to exceed 10 per cent of issued share capital at that time.
Vesting Provisions on a Change of Control The rules of the PSP do not provide for automatic vesting in the event of a change in control. However, the rules do provide that the number of shares subject to the award be pro-rated, based on the length of the shortened performance period. The Committee may ‘at its discretion, and acting fairly and reasonably’, determine the extent to which awards vest having regard for the performance of the Group in the period since the date of grant.
International Financial Reporting Standards Details on how share awards have been expensed under IFRS 2 are set out in note 41.
During 2005, the Committee considered the impact of the International Financial Reporting Standards on performance measurement for the Group’s share schemes. An approach to measuring EPS performance for PSP and 2000 ESOS awards was agreed by the Committee, which will ensure that performance is measured on a consistent basis without resulting in either advantage or disadvantage to participants.
General The middle market price of an ordinary share at the close of business on 31 December 2007 was 1844 pence. The share price range during 2007 was 1366 pence to 1960 pence per share (based on closing middle market prices). Full details of the directors’ shares and options can be found in the Company’s register of directors’ interests.
Unless indicated otherwise, the foreign exchange rates used in this directors’ remuneration report are based on the average rates throughout the relevant financial year. The rates are £1:$2.0054 (2007) and £1:$1.8431 (2006).

Standard Chartered Annual Report and Accounts 2007
DDirectors’ Remuneration Report continued
80
Audited Information Remuneration of Directors
2007 2006 2007 2006
Directors Notes
Salary/ fees $000
Cash bonus(a)
$000
Deferred bonus(b)
$000 Benefits(c)
$000 Total$000
Salary/fees
$000
Cash bonus(a)
$000
Deferred bonus(b)
$000 Benefits(c)
$000 Total $000
Expected value of shares(d)
$000
Expected value of shares(d)
$000
E M Davies (e)(f) 1,304 – – 21 1,325 1,584 1,775 973 99 4,431 – 2,398
Sub total 1,304 – – 21 1,325 1,584 1,775 973 99 4,431 – 2,398
P A Sands (f) 1,504 2,005 1,003 63 4,575 1,002 1,296 639 66 3,003 2,422 1,903
G R Bullock (g) 900 543 521 50 2,014 – – – – – 1,424 –
M B DeNoma (h) 1,218 1,103 551 1,233 4,105 1,041 926 456 501 2,924 1,243 1,130
R H Meddings 1,023 1,036 682 46 2,787 841 841 480 48 2,210 1,647 1,176
K S Nargolwala (i) 496 – – 664 1,160 327 496 493 212 1,528 – 1,306
Sub total 5,141 4,687 2,757 2,056 14,641 3,211 3,559 2,068 827 9,665 6,736 5,515
J W Peace (j) 125 – – – 125 – – – – – – –
Sir CK Chow (k) 282 – – – 282 266 – – – 266 – –
J F T Dundas (e)(f)(j) 180 – – – 180 143 – – – 143 – –
V F Gooding (f)(l) 159 – – – 159 117 – – – 117 – –
R H P Markham (e)(j)(m) 250 – – – 250 185 – – – 185 – –
R Markland (e)(j)(l) 224 – – – 224 176 – – – 176 – –
S B Mittal (n) 54 – – – 54 – – – – – – –
P D Skinner (l) 153 – – – 153 130 – – – 130 – –
O H J Stocken (f)(l) 156 – – – 156 130 – – – 130 – –
Lord Turner (j)(l) 188 – – – 188 67 – – – 67 – –
Sub total 1,771 – – – 1,771 1,214 – – – 1,214 – –
Total 8,216 4,687 2,757 2,077 17,737 6,009 5,334 3,041 926 15,310 6,736 7,913
Notes
(a) The cash bonus amounts shown here for 2007 are net of any amounts waived to provide additional pension benefits. See page 81 for further details.
(b) The amounts shown in the deferred bonus column represent the amount of bonus payable to an employee benefit trust to acquire shares in the Company of an equivalent value.
(c) The benefits column includes amounts relating to car allowances and medical and life insurance benefits. Mr DeNoma and Mr Nargolwala carried out their duties overseas and had their remuneration adjusted to take local living costs into account. This adjustment was to put them in a position, after taxation differentials, where they are no worse off as a result of carrying out their duties overseas. The benefits column for these directors also includes additional benefits, such as allowances for working overseas, the provision of accommodation or education of children. For Mr DeNoma and Mr Nargolwala, these allowances and benefits amounted to $1,233,100 (2006: $500,899) and $664,336 (2006: $212,490), respectively.
(d) The expected value of any performance share awards granted or to be granted (i.e. March 2008) in respect of the 2006 and 2007 financial years. The values are based on an initial value adjusted for factors such as performance conditions, forfeiture risk and lack of dividends.
(e) Member of the Board Nomination Committee. Mr Dundas was appointed to this Committee on 23 February 2007.
(f) Member of the Sustainability and Responsibility Committee. Mr Stocken was appointed to the Committee on 11 September 2007.
(g) Mr Bullock was appointed to the Board with effect from 6 August 2007.
(h) Mr DeNoma receives a cash allowance of $258,648 (2006: $223,610) in lieu of his participation in any pension plan and this is reflected in the table above.
(i) Mr Nargolwala resigned from the Board on 6 September 2007. However, he continued to be an employee of the Group until 31 December 2007. His base salary and other contractual benefits continued to be paid until 31 December 2007 in line with his contract of employment.
(j) Member of the Audit and Risk Committee. Mr Peace was appointed to this Committee on 3 August 2007 and to the Board as Deputy Chairman and Senior Independent Director with effect from 1 August 2007. He receives an all-inclusive fee of $300,810 for these roles.
(k) Sir CK Chow is also Chairman of Standard Chartered Bank (Hong Kong) Limited. He received an all-inclusive fee for his Hong Kong and Standard Chartered PLC Board duties of HK$2,100,000.
(l) Member of the Board Remuneration Committee. Miss Gooding was appointed to this Committee on 23 February 2007.
(m) Mr Markham was appointed Senior Independent Director on 1 January 2007 and stepped down from this role on 1 August 2007, following the appointment of Mr Peace. An additional fee of $23,396 (based on an annualised equivalent fee of £20,000) was payable to Mr Markham during this period to reflect the further workload that was associated specifically with this role. This figure is reflected in the table above.
(n) Mr Mittal was appointed as an independent non-executive director with effect from 1 August 2007.
(o) Further details on the fees for non-executive directors are shown on page 78.
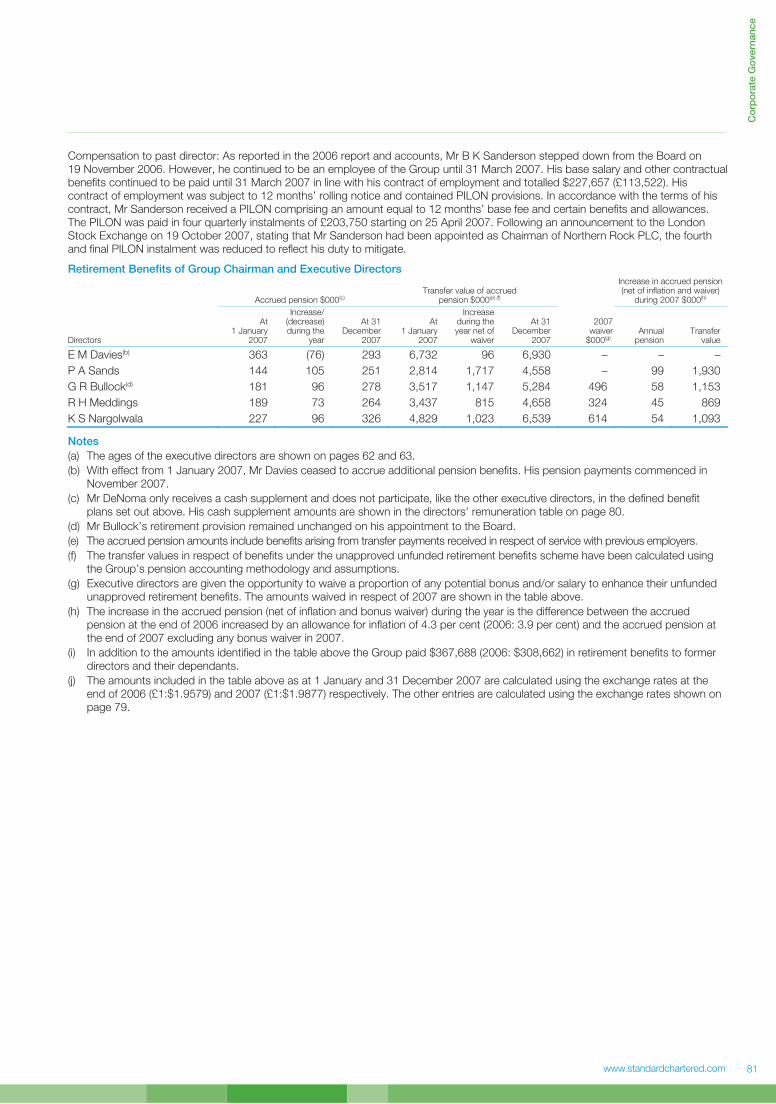
Co
rpo
rate
Go
vern
an
ce
www.standardchartered.com
81
Compensation to past director: As reported in the 2006 report and accounts, Mr B K Sanderson stepped down from the Board on 19 November 2006. However, he continued to be an employee of the Group until 31 March 2007. His base salary and other contractual benefits continued to be paid until 31 March 2007 in line with his contract of employment and totalled $227,657 (£113,522). His contract of employment was subject to 12 months’ rolling notice and contained PILON provisions. In accordance with the terms of his contract, Mr Sanderson received a PILON comprising an amount equal to 12 months’ base fee and certain benefits and allowances. The PILON was paid in four quarterly instalments of £203,750 starting on 25 April 2007. Following an announcement to the London Stock Exchange on 19 October 2007, stating that Mr Sanderson had been appointed as Chairman of Northern Rock PLC, the fourth and final PILON instalment was reduced to reflect his duty to mitigate.
Retirement Benefits of Group Chairman and Executive Directors
Accrued pension $000(c) Transfer value of accrued
pension $000(e) (f)
Increase in accrued pension (net of inflation and waiver)
during 2007 $000(h)
Directors
At 1 January
2007
Increase/ (decrease) during the
year
At 31 December
2007
At 1 January
2007
Increase during the year net of
waiver
At 31 December
2007
2007 waiver
$000(g) Annual
pension Transfer
value
E M Davies(b) 363 (76) 293 6,732 96 6,930 – – –
P A Sands 144 105 251 2,814 1,717 4,558 – 99 1,930
G R Bullock(d) 181 96 278 3,517 1,147 5,284 496 58 1,153
R H Meddings 189 73 264 3,437 815 4,658 324 45 869
K S Nargolwala 227 96 326 4,829 1,023 6,539 614 54 1,093
Notes
(a) The ages of the executive directors are shown on pages 62 and 63.
(b) With effect from 1 January 2007, Mr Davies ceased to accrue additional pension benefits. His pension payments commenced in November 2007.
(c) Mr DeNoma only receives a cash supplement and does not participate, like the other executive directors, in the defined benefit plans set out above. His cash supplement amounts are shown in the directors’ remuneration table on page 80.
(d) Mr Bullock’s retirement provision remained unchanged on his appointment to the Board.
(e) The accrued pension amounts include benefits arising from transfer payments received in respect of service with previous employers.
(f) The transfer values in respect of benefits under the unapproved unfunded retirement benefits scheme have been calculated using the Group’s pension accounting methodology and assumptions.
(g) Executive directors are given the opportunity to waive a proportion of any potential bonus and/or salary to enhance their unfunded unapproved retirement benefits. The amounts waived in respect of 2007 are shown in the table above.
(h) The increase in the accrued pension (net of inflation and bonus waiver) during the year is the difference between the accrued pension at the end of 2006 increased by an allowance for inflation of 4.3 per cent (2006: 3.9 per cent) and the accrued pension at the end of 2007 excluding any bonus waiver in 2007.
(i) In addition to the amounts identified in the table above the Group paid $367,688 (2006: $308,662) in retirement benefits to former directors and their dependants.
(j) The amounts included in the table above as at 1 January and 31 December 2007 are calculated using the exchange rates at the end of 2006 (£1:$1.9579) and 2007 (£1:$1.9877) respectively. The other entries are calculated using the exchange rates shown on page 79.
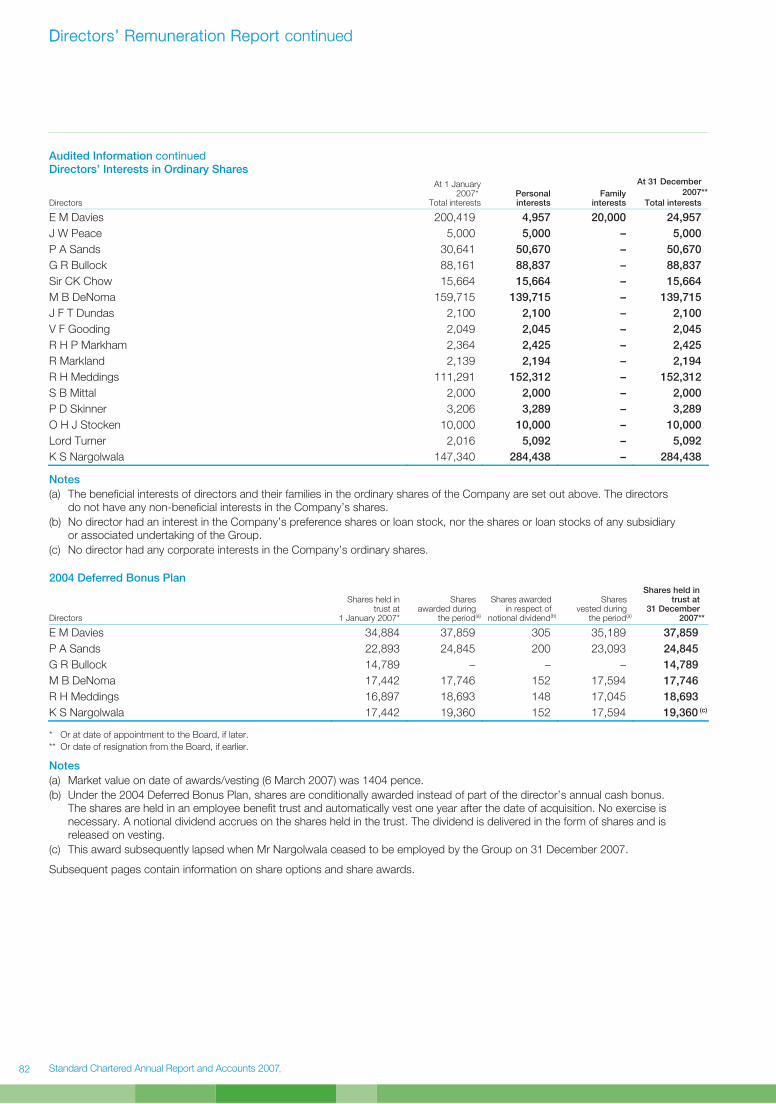
Standard Chartered Annual Report and Accounts 2007
DDirectors’ Remuneration Report continued
82
Audited Information continued Directors’ Interests in Ordinary Shares
Directors
At 1 January2007*
Total interestsPersonal interests
Family interests
At 31 December
2007**
Total interests
E M Davies 200,419 4,957 20,000 24,957
J W Peace 5,000 5,000 – 5,000
P A Sands 30,641 50,670 – 50,670
G R Bullock 88,161 88,837 – 88,837
Sir CK Chow 15,664 15,664 – 15,664
M B DeNoma 159,715 139,715 – 139,715
J F T Dundas 2,100 2,100 – 2,100
V F Gooding 2,049 2,045 – 2,045
R H P Markham 2,364 2,425 – 2,425
R Markland 2,139 2,194 – 2,194
R H Meddings 111,291 152,312 – 152,312
S B Mittal 2,000 2,000 – 2,000
P D Skinner 3,206 3,289 – 3,289
O H J Stocken 10,000 10,000 – 10,000
Lord Turner 2,016 5,092 – 5,092
K S Nargolwala 147,340 284,438 – 284,438
Notes
(a) The beneficial interests of directors and their families in the ordinary shares of the Company are set out above. The directors do not have any non-beneficial interests in the Company’s shares.
(b) No director had an interest in the Company’s preference shares or loan stock, nor the shares or loan stocks of any subsidiary or associated undertaking of the Group.
(c) No director had any corporate interests in the Company’s ordinary shares.
2004 Deferred Bonus Plan
Directors
Shares held in trust at
1 January 2007*
Shares awarded during
the period(a)
Shares awarded in respect of
notional dividend(b)
Shares vested during
the period(a)
Shares held in trust at
31 December 2007**
E M Davies 34,884 37,859 305 35,189 37,859
P A Sands 22,893 24,845 200 23,093 24,845
G R Bullock 14,789 – – – 14,789
M B DeNoma 17,442 17,746 152 17,594 17,746
R H Meddings 16,897 18,693 148 17,045 18,693
K S Nargolwala 17,442 19,360 152 17,594 19,360 (c)
* Or at date of appointment to the Board, if later.
** Or date of resignation from the Board, if earlier.
Notes
(a) Market value on date of awards/vesting (6 March 2007) was 1404 pence.
(b) Under the 2004 Deferred Bonus Plan, shares are conditionally awarded instead of part of the director’s annual cash bonus. The shares are held in an employee benefit trust and automatically vest one year after the date of acquisition. No exercise is necessary. A notional dividend accrues on the shares held in the trust. The dividend is delivered in the form of shares and is released on vesting.
(c) This award subsequently lapsed when Mr Nargolwala ceased to be employed by the Group on 31 December 2007.
Subsequent pages contain information on share options and share awards.
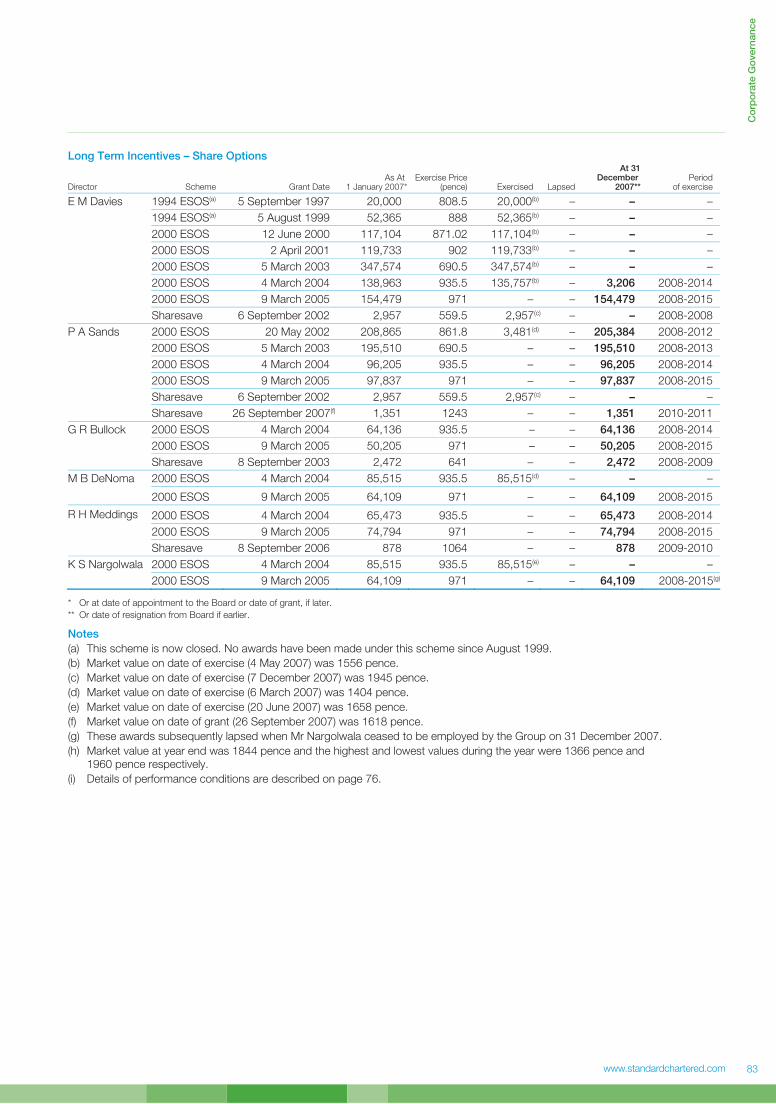
Co
rpo
rate
Go
vern
an
ce
www.standardchartered.com
83
Long Term Incentives – Share Options
Director Scheme Grant Date As At
1 January 2007*Exercise Price
(pence) Exercised Lapsed
At 31 December
2007** Period
of exercise
E M Davies 1994 ESOS(a) 5 September 1997 20,000 808.5 20,000(b) – – –
1994 ESOS(a) 5 August 1999 52,365 888 52,365(b) – – –
2000 ESOS 12 June 2000 117,104 871.02 117,104(b) – – –
2000 ESOS 2 April 2001 119,733 902 119,733(b) – – –
2000 ESOS 5 March 2003 347,574 690.5 347,574(b) – – –
2000 ESOS 4 March 2004 138,963 935.5 135,757(b) – 3,206 2008-2014
2000 ESOS 9 March 2005 154,479 971 – – 154,479 2008-2015
Sharesave 6 September 2002 2,957 559.5 2,957(c) – – 2008-2008
P A Sands 2000 ESOS 20 May 2002 208,865 861.8 3,481(d) – 205,384 2008-2012
2000 ESOS 5 March 2003 195,510 690.5 – – 195,510 2008-2013
2000 ESOS 4 March 2004 96,205 935.5 – – 96,205 2008-2014
2000 ESOS 9 March 2005 97,837 971 – – 97,837 2008-2015
Sharesave 6 September 2002 2,957 559.5 2,957(c) – – –
Sharesave 26 September 2007(f) 1,351 1243 – – 1,351 2010-2011
G R Bullock 2000 ESOS 4 March 2004 64,136 935.5 – – 64,136 2008-2014
2000 ESOS 9 March 2005 50,205 971 – – 50,205 2008-2015
Sharesave 8 September 2003 2,472 641 – – 2,472 2008-2009
M B DeNoma 2000 ESOS 4 March 2004 85,515 935.5 85,515(d) – – –
2000 ESOS 9 March 2005 64,109 971 – – 64,109 2008-2015
R H Meddings 2000 ESOS 4 March 2004 65,473 935.5 – – 65,473 2008-2014
2000 ESOS 9 March 2005 74,794 971 – – 74,794 2008-2015
Sharesave 8 September 2006 878 1064 – – 878 2009-2010
K S Nargolwala 2000 ESOS 4 March 2004 85,515 935.5 85,515(e) – – –
2000 ESOS 9 March 2005 64,109 971 – – 64,109 2008-2015(g)
* Or at date of appointment to the Board or date of grant, if later.
** Or date of resignation from Board if earlier.
Notes
(a) This scheme is now closed. No awards have been made under this scheme since August 1999.
(b) Market value on date of exercise (4 May 2007) was 1556 pence.
(c) Market value on date of exercise (7 December 2007) was 1945 pence.
(d) Market value on date of exercise (6 March 2007) was 1404 pence.
(e) Market value on date of exercise (20 June 2007) was 1658 pence.
(f) Market value on date of grant (26 September 2007) was 1618 pence.
(g) These awards subsequently lapsed when Mr Nargolwala ceased to be employed by the Group on 31 December 2007.
(h) Market value at year end was 1844 pence and the highest and lowest values during the year were 1366 pence and 1960 pence respectively.
(i) Details of performance conditions are described on page 76.

Standard Chartered Annual Report and Accounts 2007
DDirectors’ Remuneration Report continued
84
Audited Information continued Long Term Incentives – Shares
Director Scheme Grant date As at
1 January 2007* Exercised Lapsed
As at 31 December
2007** Period
of exercise
E M Davies PSP 4 March 2004 69,481 69,481(b) – – –
PSP 9 June 2004 70,575 70,575(c) – – –
PSP 9 March 2005 154,479 – – 154,479 2008-2015(i)
PSP 14 March 2006 111,498 – – 111,498 2009-2016
PSP 11 May 2006 82,191 – – 82,191 2009-2016
PSP 12 March 2007(f) 179,186 – – 179,186 2010-2017
P A Sands RSS 20 May 2002 52,216 – 52,216 2008-2009(h)
PSP 4 March 2004 48,102 – – 48,102 2008-2014(h)
PSP 9 June 2004 36,644 – – 36,644 2008-2014(h)
PSP 9 March 2005 97,837 – – 97,837 2008-2015(i)
PSP 14 March 2006 73,170 – – 73,170 2009-2016
PSP 11 May 2006 35,958 – – 35,958 2009-2016
PSP 12 March 2007(f) 142,143 – – 142,143 2010-2017
G R Bullock PSP 9 March 2005 58,573 – – 58,573 2008-2015(i)
PSP 14 March 2006 48,780 – – 48,780 2009-2016
PSP 11 May 2006 17,979 – – 17,979 2009-2016
PSP 12 March 2007(f) 81,495 – – 81,495 2010-2017
M B DeNoma PSP 4 March 2004 42,757 42,757(d) – – –
PSP 9 June 2004 21,715 21,715(e) – – –
PSP 9 March 2005 74,794 – – 74,794 2008-2015(i)
PSP 14 March 2006 59,930 – – 59,930 2009-2016
PSP 11 May 2006 22,089 – – 22,089 2009-2016
PSP 12 March 2007(f) 84,424 – – 84,424 2010-2017
R H Meddings PSP 4 March 2004 37,413 37,413(e) – – –
PSP 9 June 2004 9,500 9,500(e) – – –
PSP 9 March 2005 74,794 – – 74,794 2008-2015(i)
PSP 14 March 2006 59,930 – – 59,930 2009-2016
PSP 11 May 2006 22,089 – – 22,089 2009-2016
PSP 12 March 2007(f) 87,870 – – 87,870 2010-2017
K S Nargolwala PSP 5 March 2003 55,032 55,032(d) – – –
PSP 4 March 2004 42,757 42,757(d) – – –
PSP 9 June 2004 21,715 21,715(e) – – –
PSP 9 March 2005 74,794 – – 74,794 2008-2015(j)
PSP 14 March 2006 59,930 – – 59,930 2009-2016(j)
PSP 11 May 2006 29,452 – – 29,452 2009-2016(j)
PSP 12 March 2007(f) 97,605 – – 97,605 2010-2017(j)
* Or at date of appointment to the Board or date of grant if later.
** Or date of resignation from the Board, if earlier.
Notes
(a) Details of performance conditions are described on pages 75 and 76.
(b) Market value on date of exercise (4 May 2007) was 1556 pence.
(c) Market value on date of exercise (16 October 2007) was 1658 pence.
(d) Market value on date of exercise (6 March 2007) was 1404 pence.
(e) Market value on date of exercise (20 June 2007) was 1658 pence.
(f) Market value on date of award (12 March 2007) was 1430 pence.
(g) Market value of awards in previous years: 20 May 2002 – 861.8 pence; 5 March 2003 – 690.5 pence; 13 May 2003 – 742.5 pence; 4 March 2004 – 935.5 pence; 9 June 2004 – 921 pence; 9 March 2005 – 971 pence; 14 March 2006 – 1450 pence; 11 May 2006 – 1460 pence.
(h) These awards are exercisable as any associated performance and service conditions have already been met.
(i) The performance conditions attached to these awards have been met and the awards will be exercisable after meeting the service conditions on 9 March 2008.
(j) These awards subsequently lapsed when Mr Nargolwala ceased to be employed by the Group on 31 December 2007.
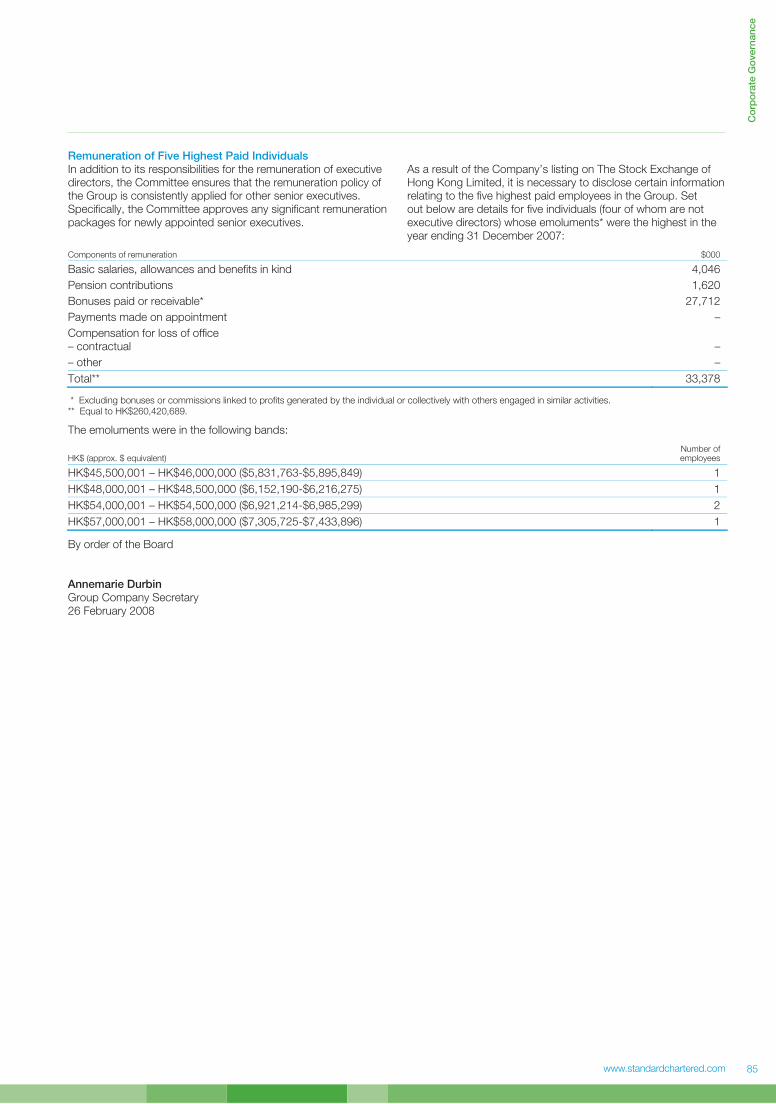
Co
rpo
rate
Go
vern
an
ce
www.standardchartered.com
85
Remuneration of Five Highest Paid Individuals In addition to its responsibilities for the remuneration of executive directors, the Committee ensures that the remuneration policy of the Group is consistently applied for other senior executives. Specifically, the Committee approves any significant remuneration packages for newly appointed senior executives.
As a result of the Company’s listing on The Stock Exchange of Hong Kong Limited, it is necessary to disclose certain information relating to the five highest paid employees in the Group. Set out below are details for five individuals (four of whom are not executive directors) whose emoluments* were the highest in the year ending 31 December 2007:
Components of remuneration $000
Basic salaries, allowances and benefits in kind 4,046
Pension contributions 1,620
Bonuses paid or receivable* 27,712
Payments made on appointment –
Compensation for loss of office – contractual –
– other –
Total** 33,378
* Excluding bonuses or commissions linked to profits generated by the individual or collectively with others engaged in similar activities. ** Equal to HK$260,420,689.
The emoluments were in the following bands:
HK$ (approx. $ equivalent) Number of employees
HK$45,500,001 – HK$46,000,000 ($5,831,763-$5,895,849) 1
HK$48,000,001 – HK$48,500,000 ($6,152,190-$6,216,275) 1
HK$54,000,001 – HK$54,500,000 ($6,921,214-$6,985,299) 2
HK$57,000,001 – HK$58,000,000 ($7,305,725-$7,433,896) 1
By order of the Board
Annemarie Durbin Group Company Secretary 26 February 2008

Standard Chartered Annual Report and Accounts 2007
Statement of directors’ responsibilities in respect of the Annual Report and the financial statements
86
The directors are responsible for preparing the Annual Report and the Group and Company financial statements in accordance with applicable law and regulations.
Company law requires the directors to prepare Group and Company financial statements for each financial year. Under that law they are required to prepare the Group financial statements in accordance with IFRSs as adopted by the EU and applicable law and have elected to prepare the Company financial statements on the same basis.
The Group and Company financial statements are required by law and IFRSs as adopted by the EU to present fairly the financial position of the Group and Company and the performance of the Group for that period; the Companies Act 1985 provides in relation to such financial statements that references in the relevant part of that Act to financial statements giving a true and fair view are references to their achieving a fair presentation.
In preparing each of the Group and Company financial statements, the directors are required to:
• select suitable accounting policies and then apply them consistently;
• make judgements and estimates that are reasonable and prudent;
• state whether they have been prepared in accordance with IFRSs as adopted by the EU; and
• prepare the financial statements on the going concern basis unless it is inappropriate to presume that the Group and the Company will continue in business.
The directors are responsible for keeping proper accounting records that disclose with reasonable accuracy at any time the financial position of the Company and enable them to ensure that its financial statements comply with the Companies Act 1985. They have general responsibility for taking such steps as are reasonably open to them to safeguard the assets of the Group and to prevent and detect fraud and other irregularities.
Under applicable law and regulations, the directors are also responsible for preparing a Directors’ Report, Directors’ Remuneration Report and the Corporate Governance Statement that comply with that law and those regulations.
The directors are responsible for the maintenance and integrity of the corporate and financial information included on the Company’s website. Legislation in the UK governing the preparation and dissemination of financial statements may differ from legislation in other jurisdictions.

www.standardchartered.com
Independent Auditor’s Report to the members of Standard Chartered PLC
87
We have audited the Group (Standard Chartered PLC and its subsidiaries) and Company (Standard Chartered PLC) financial statements (together referred to as the ‘financial statements’) for the year ended 31 December 2007 which comprise the Group Income Statement, the Group and Company Balance Sheets, the Group and Company Cash Flow Statements, the Group and Company Statements of Recognised Income and Expense, and the related notes. These financial statements have been prepared under the accounting policies set out therein. We have also audited the information in the Directors’ Remuneration Report that is described as having been audited.
This report is made solely to the Company’s members, as a body, in accordance with section 235 of the Companies Act 1985. Our audit work has been undertaken so that we might state to the Company’s members those matters we are required to state to them in an auditor’s report and for no other purpose. To the fullest extent permitted by law, we do not accept or assume responsibility to anyone other than the Company and the Company’s members as a body, for our audit work, for this report, or for the opinions we have formed.
Respective responsibilities of directors and auditor The directors’ responsibilities for preparing the Annual Report, the Directors’ Remuneration Report and the financial statements in accordance with applicable law and International Financial Reporting Standards (IFRSs) as adopted by the EU are set out in the Statement of Directors’ Responsibilities on page 86.
Our responsibility is to audit the financial statements and the part of the Directors’ Remuneration Report to be audited in accordance with relevant legal and regulatory requirements and International Standards on Auditing (UK and Ireland).
We report to you our opinion as to whether the financial statements give a true and fair view and whether the financial statements and the part of the Directors’ Remuneration Report to be audited have been properly prepared in accordance with the Companies Act 1985 and, as regards the Group financial statements, Article 4 of the IAS Regulation. We also report to you whether in our opinion the information given in the Report of the Directors is consistent with the financial statements. The information given in the Report of Directors includes information presented in the Chairman’s statement, the Group Chief Executive’s Review and the Financial and Business Reviews that are cross referenced from the Report of the Directors. In addition we report to you if the Company has not kept proper accounting records, if we have not received all the information and explanations we require for our audit, or if information specified by law regarding directors’ remuneration and other transactions is not disclosed.
We review whether the Corporate Governance Statement reflects the Company’s compliance with the nine provisions of the 2006 FRC Combined Code specified for our review by the Listing Rules of the Financial Services Authority, and we report if it does not. We are not required to consider whether the Board’s statements on internal control cover all risks and controls, or form an opinion on the effectiveness of the Group’s corporate governance procedures or its risk and control procedures.
We read other information contained in the Annual Report and consider whether it is consistent with the audited financial statements. We consider the implications for our report if we become aware of any apparent misstatements or material inconsistencies with the financial statements. Our responsibilities do not extend to any other information.
Basis of audit opinion We conducted our audit in accordance with International Standards on Auditing (UK and Ireland) issued by the Auditing Practices Board. An audit includes examination, on a test basis, of evidence relevant to the amounts and disclosures in the financial statements and the part of the Directors’ Remuneration Report to be audited. It also includes an assessment of the significant estimates and judgements made by the directors in the preparation of the financial statements, and of whether the accounting policies are appropriate to the Group’s and Company’s circumstances, consistently applied and adequately disclosed.
We planned and performed our audit so as to obtain all the information and explanations which we considered necessary in order to provide us with sufficient evidence to give reasonable assurance that the financial statements and the part of the Directors’ Remuneration Report to be audited are free from material misstatement, whether caused by fraud or other irregularity or error. In forming our opinion we also evaluated the overall adequacy of the presentation of information in the financial statements and the part of the Directors’ Remuneration Report to be audited.
Opinion In our opinion:
• the Group financial statements give a true and fair view, in accordance with IFRSs as adopted by the EU, of the state of the Group’s affairs as at 31 December 2007 and of its profit for the year then ended;
• the Company financial statements give a true and fair view, in accordance with IFRSs as adopted by the EU as applied in accordance with the provisions of the Companies Act 1985, of the state of the Company’s affairs as at 31 December 2007;
• the financial statements and the part of the Directors’ Remuneration Report to be audited have been properly prepared in accordance with the Companies Act 1985 and, as regards the Group financial statements, Article 4 of the IAS Regulation; and
• the information given in the Report of the Directors is consistent with the financial statements.
KPMG Audit Plc London Chartered Accountants Registered Auditor 26 February 2008
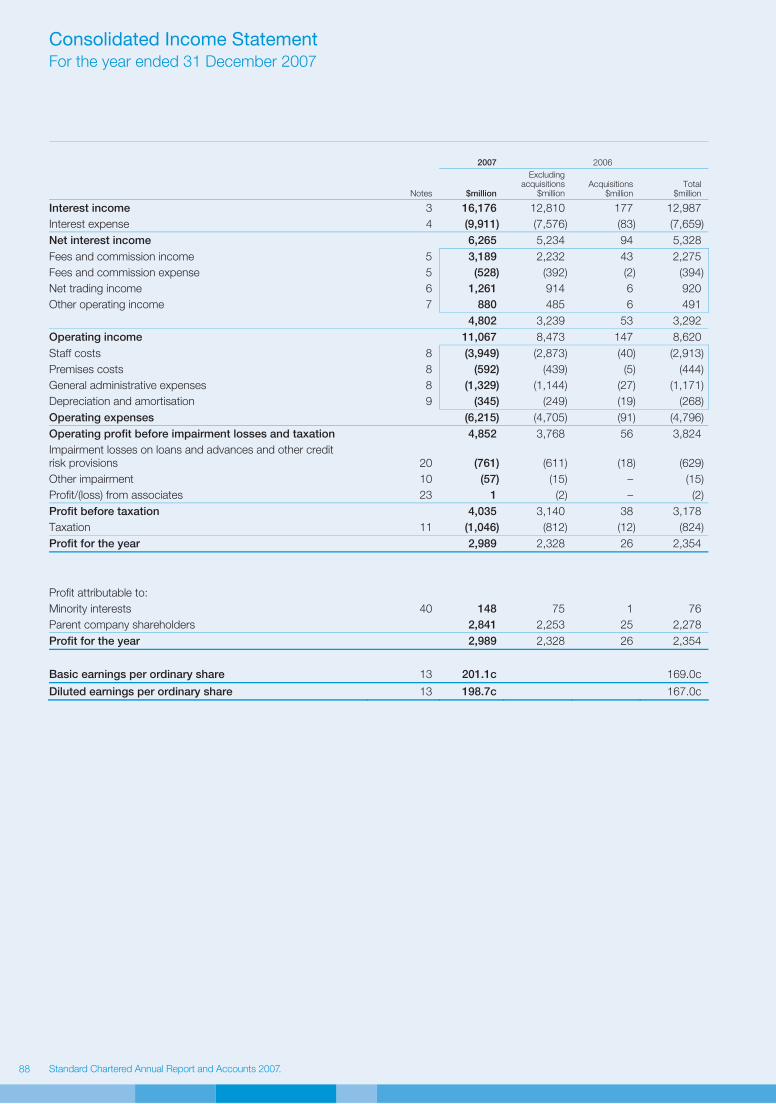
Standard Chartered Annual Report and Accounts 2007
Consolidated Income Statement For the year ended 31 December 2007
88
2007 2006
Notes $million
Excluding acquisitions
$million Acquisitions
$million Total
$million
Interest income 3 16,176 12,810 177 12,987
Interest expense 4 (9,911) (7,576) (83) (7,659)
Net interest income 6,265 5,234 94 5,328
Fees and commission income 5 3,189 2,232 43 2,275
Fees and commission expense 5 (528) (392) (2) (394)
Net trading income 6 1,261 914 6 920
Other operating income 7 880 485 6 491
4,802 3,239 53 3,292
Operating income 11,067 8,473 147 8,620
Staff costs 8 (3,949) (2,873) (40) (2,913)
Premises costs 8 (592) (439) (5) (444)
General administrative expenses 8 (1,329) (1,144) (27) (1,171)
Depreciation and amortisation 9 (345) (249) (19) (268)
Operating expenses (6,215) (4,705) (91) (4,796)
Operating profit before impairment losses and taxation 4,852 3,768 56 3,824
Impairment losses on loans and advances and other credit risk provisions 20 (761) (611) (18) (629)
Other impairment 10 (57) (15) – (15)
Profit/(loss) from associates 23 1 (2) – (2)
Profit before taxation 4,035 3,140 38 3,178
Taxation 11 (1,046) (812) (12) (824)
Profit for the year 2,989 2,328 26 2,354
Profit attributable to:
Minority interests 40 148 75 1 76
Parent company shareholders 2,841 2,253 25 2,278
Profit for the year 2,989 2,328 26 2,354
Basic earnings per ordinary share 13 201.1c 169.0c
Diluted earnings per ordinary share 13 198.7c 167.0c

www.standardchartered.com
Fin
an
cia
l S
tate
men
ts a
nd
No
tes t
o t
he A
cco
un
tsConsolidated Balance Sheet As at 31 December 2007
89
Notes 2007
$million
2006*
$million
Assets
Cash and balances at central banks 42 10,175 7,698
Financial assets held at fair value through profit or loss 15 22,958 15,715
Derivative financial instruments 16 26,204 13,154
Loans and advances to banks 17, 20 35,365 19,724
Loans and advances to customers 18, 20 154,266 139,300
Investment securities 22 55,274 49,497
Interests in associates 23 269 218
Goodwill and intangible assets 25 6,380 6,247
Property, plant and equipment 26 2,887 2,168
Deferred tax assets 27 559 512
Other assets 28 11,011 8,601
Prepayments and accrued income 3,857 3,268
Total assets 329,205 266,102
Liabilities
Deposits by banks 29 25,880 26,233
Customer accounts 30 179,760 147,382
Financial liabilities held at fair value through profit or loss 31 14,250 9,969
Derivative financial instruments 16 26,270 13,703
Debt securities in issue 32 27,137 23,514
Current tax liabilities 185 68
Other liabilities 34 14,742 11,331
Accruals and deferred income 3,429 3,210
Provisions for liabilities and charges 35 38 45
Retirement benefit obligations 36 322 553
Subordinated liabilities and other borrowed funds 37 15,740 12,699
Total liabilities 307,753 248,707
Equity
Share capital 38 705 692
Reserves 39 20,146 16,161
Total parent company shareholders’ equity 20,851 16,853
Minority interests 40 601 542
Total equity 21,452 17,395
Total equity and liabilities 329,205 266,102
* Amounts have been restated as explained in note 51 on page 154.
These accounts were approved by the Board of Directors on 26 February 2008 and signed on its behalf by:
E M Davies P A Sands R H Meddings Chairman Group Chief Executive Group Finance Director
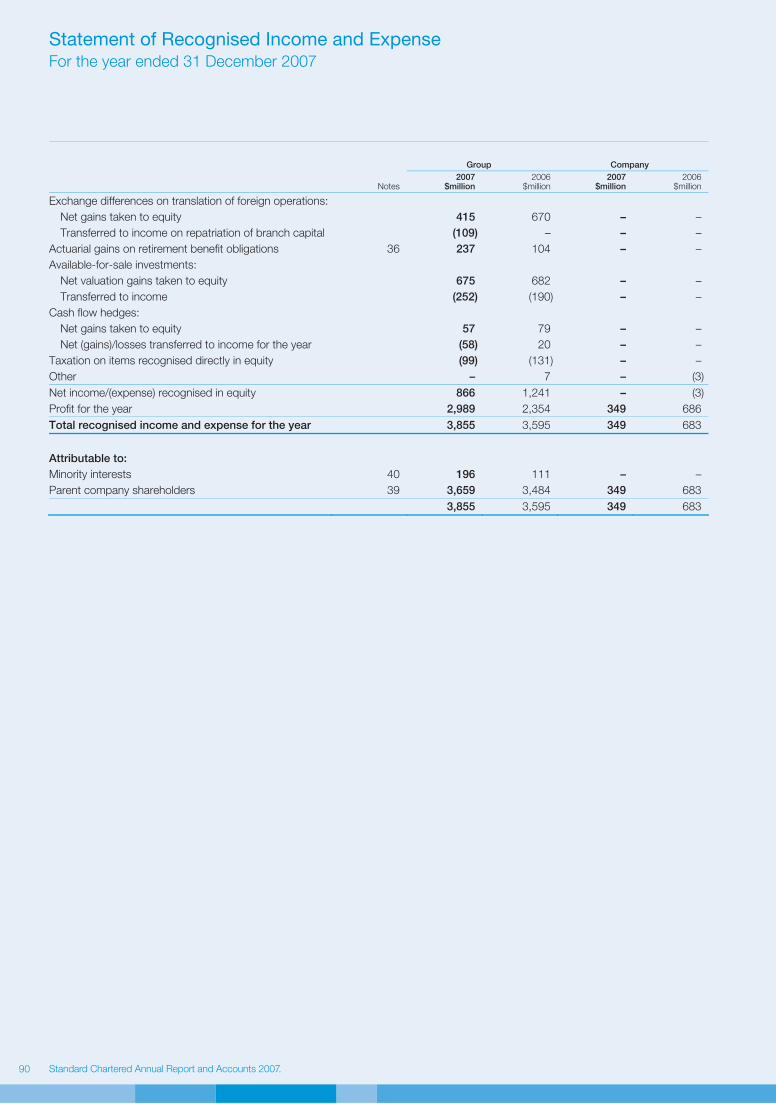
Standard Chartered Annual Report and Accounts 2007
Statement of Recognised Income and Expense For the year ended 31 December 2007
90
Group Company
Notes 2007
$million 2006
$million 2007
$million 2006
$million
Exchange differences on translation of foreign operations:
Net gains taken to equity 415 670 – –
Transferred to income on repatriation of branch capital (109) – – –
Actuarial gains on retirement benefit obligations 36 237 104 – –
Available-for-sale investments:
Net valuation gains taken to equity 675 682 – –
Transferred to income (252) (190) – –
Cash flow hedges:
Net gains taken to equity 57 79 – –
Net (gains)/losses transferred to income for the year (58) 20 – –
Taxation on items recognised directly in equity (99) (131) – –
Other – 7 – (3)
Net income/(expense) recognised in equity 866 1,241 – (3)
Profit for the year 2,989 2,354 349 686
Total recognised income and expense for the year 3,855 3,595 349 683
Attributable to:
Minority interests 40 196 111 – –
Parent company shareholders 39 3,659 3,484 349 683
3,855 3,595 349 683

www.standardchartered.com
Fin
an
cia
l S
tate
men
ts a
nd
No
tes t
o t
he A
cco
un
tsCash Flow Statement For the year ended 31 December 2007
91
Group Company
2007
$million
2006*
$million 2007
$million
2006*
$million
Cash flow from operating activities
Profit before taxation 4,035 3,178 310 713
Adjustment for items not involving cash flow or shown separately:
Depreciation and amortisation 345 268 – –
Gain on disposal of property, plant and equipment (1) (16) – –
Gain on disposal of investment securities and loan and receivable financial assets (342) (190) – –
Gain arising on initial recognition of Visa Inc. shares (107) – – –
Writedowns relating to asset backed securities 87 – – –
Movement in fair value hedges on available-for-sale assets (21) (5) – –
Amortisation of discounts and premiums of investment securities (259) (257) – –
Pension costs for defined benefit schemes 110 96 – –
Impairment losses on loans and advances and other credit risk provisions 761 629 – –
Dividend income from subsidiaries – – (385) (656)
Other impairment 57 15 – –
Recoveries of acquisition fair values and discount unwind (164) (158) – –
466 382 (385) (656)
Net (decrease)/increase in derivative financial instruments (466) 45 – –
Net increase in debt securities, treasury bills and equity shares held at fair value through profit or loss (3,691) (4,259) – –
Net increase in loans and advances to banks and customers (14,983) (11,664) – –
Increase in prepayments and accrued income (519) (901) – –
Net increase in deposits from banks, customer accounts and debt securities in issue 36,135 16,914 – –
Increase/(decrease) in accruals and deferred income 289 786 (1,051) (101)
Net increase/(decrease) in other accounts (1,880) 4,408 111 297
14,885 5,329 (940) 196
Interest expense on subordinated liabilities 811 643 126 115
Net return from defined benefit schemes 16 47 – –
UK and overseas taxes (paid)/refunded (1,097) (903) 14 –
Net cash from/(used in) operating activities 19,116 8,676 (875) 368
Net cash flows from investing activities
Purchase of property, plant and equipment (471) (245) – –
Disposal of property, plant and equipment 22 40 – –
Acquisition of investment in subsidiaries, net of cash acquired (85) (937) (750) (2,683)
Redemption of capital in subsidiary – – – 1,000
Acquisition of investment securities (78,292) (71,115) – –
Dividends received from investment in subsidiaries – – 385 656
Disposal and maturity of investment securities 74,457 63,896 – –
Net cash used in investing activities (4,369) (8,361) (365) (1,027)
Net cash flows from financing activities
Issue of ordinary and preference share capital 861 2,070 861 2,070
Purchase of own shares (15) (9) – –
Exercise of share options through ESOP 39 158 – –
Redemption of preference share capital – (328) – (328)
Interest paid on subordinated liabilities (737) (562) (118) (124)
Gross proceeds from issue of subordinated liabilities 3,051 1,591 – –
Repayment of subordinated liabilities (505) (390) – –
Dividends paid to minority interests and preference shareholders (148) (80) (28) (25)
Dividends paid to ordinary shareholders (573) (496) (573) (496)
Net cash from financing activities 1,973 1,954 142 1,097
Net increase/(decrease) in cash and cash equivalents 16,720 2,269 (1,098) 438
Cash and cash equivalents at beginning of year 38,161 35,226 2,028 1,590
Effect of exchange rate movements on cash and cash equivalents 457 666 – –
Cash and cash equivalents at end of year (note 42) 55,338 38,161 930 2,028
* Amounts have been re-presented as explained in note 51 on page 154.

Standard Chartered Annual Report and Accounts 2007
Company Balance Sheet As at 31 December 2007
92
Notes 2007
$million 2006
$million
Non-current assets
Investments in subsidiary undertakings 23 10,406 9,656
Current assets
Amounts owed by subsidiary undertakings 2,019 3,181
Taxation 183 158
Other 127 103
2,329 3,442
Current liabilities
Amounts owed to subsidiary undertakings 1,089 1,153
Other creditors, including taxation 102 71
Deferred income 40 154
1,231 1,378
Net current assets 1,098 2,064
Total assets less current liabilities 11,504 11,720
Non-current liabilities
Subordinated liabilities and other borrowed funds 37 1,987 1,977
Deferred income 271 1,208
9,246 8,535
Equity
Share capital 38 705 692
Reserves 39 8,541 7,843
Total equity 9,246 8,535
These accounts were approved by the Board of Directors on 26 February 2008 and signed on its behalf by:
E M Davies P A Sands R H Meddings Chairman Group Chief Executive Group Finance Director
www.standardchartered.com
Fin
an
cia
l S
tate
men
ts a
nd
No
tes t
o t
he A
cco
un
tsNotes to the Accounts
93
1. Accounting Policies
Statement of compliance The Group financial statements consolidate those of the Company and its subsidiaries (together referred to as the ‘Group’), equity account the Group’s interest in associates and proportionately consolidate interests in jointly controlled entities. The parent company financial statements present information about the Company as a separate entity and not about its group.
Both the parent company financial statements and the Group financial statements have been prepared and approved by the directors in accordance with International Financial Reporting Standards (‘IFRS’) and International Financial Reporting Interpretation Committee (‘IFRIC’) Interpretations as adopted by the EU (together ‘adopted IFRS’). In publishing the parent company financial statements together with the Group financial statements, the Company has taken advantage of the exemption in section 230 of the Companies Act 1985 not to present its individual income statement and related notes that form a part of these approved financial statements.
The Group has retrospectively adopted IFRIC 7 ‘Applying the Restatement Approach under IAS 29 Financial Reporting in Hyperinflationary Economies’, IFRIC 8 ‘Scope of IFRS 2’, IFRIC 9 ‘Reassessment of Embedded Derivatives’ and IFRIC 10 ‘Interim Financial Reporting and Impairment’, none of which had an impact on the Group’s consolidated financial statements.
The Group has also adopted IFRS 7 ‘Financial Instruments: Disclosures’ and the Amendment to IAS 1 ‘Presentation of Financial Statements – Capital Disclosures’ and the disclosures required are presented within the ‘Risk Review’ on pages 43 to 59 and ‘Capital’ on pages 60 to 61, except where indicated as not audited, and the notes to the accounts.
The consolidated balance sheet at 31 December 2006 has been restated as explained in note 51 on page 154 to reflect the revised fair values of the assets and liabilities acquired on the acquisitions of Union Bank and Hsinchu. Certain items in the Group and Company cash flow statements for the year ended 31 December 2006 have been re-presented as explained in note 51.
Basis of preparation The consolidated financial statements have been prepared under the historical cost convention, as modified by the revaluation of cash-settled share based payments, available-for-sale assets, and financial assets and liabilities (including derivatives) at fair value through profit or loss.
The preparation of financial statements in conformity with adopted IFRS requires the use of certain critical accounting estimates. It also requires management to exercise its judgement in the process of applying the Group’s accounting policies.
The accounting policies set out below have been applied consistently across the Group and to all periods presented in these financial statements.
Consolidation Subsidiaries Subsidiaries are all entities (including special purpose entities) over which the Group has the power to directly or indirectly govern the financial and operating policies, generally accompanying a shareholding of more than one half of the voting rights. Subsidiaries are fully consolidated from the date on which the Group effectively obtains control. They are de-consolidated from the date that control ceases.
The purchase method of accounting is used to account for the acquisition of subsidiaries by the Group. The cost of an acquisition is measured as the fair value of the assets given, equity instruments issued and liabilities incurred or assumed at the date of exchange, together with costs directly attributable to the acquisition. Identifiable net assets and contingent liabilities acquired are fair valued at the acquisition date, irrespective of the extent of any minority interest. The excess of the cost of acquisition over the fair value of the Group’s share of the identifiable net assets and contingent liabilities acquired is recorded as goodwill. If the cost of acquisition is less than the fair value of the net assets and contingent liabilities of the subsidiary acquired, the difference is recognised directly in the income statement. Where the fair values of the identifiable net assets and contingent liabilities acquired have been determined provisionally or where contingent or deferred consideration is payable, any adjustments arising from their subsequent finalisation are made as of the date of acquisition and amounts restated as appropriate.
Inter-company transactions, balances and unrealised gains on transactions between Group companies are eliminated in the Group accounts. Unrealised losses are also eliminated unless the transaction provides evidence of impairment of the asset transferred.
Associates Associates are all entities over which the Group has the ability to significantly influence the financial and operating policies and procedures, but not control, generally accompanying a shareholding of between 20 per cent and 50 per cent of the voting rights. Investments in associates are accounted for by the equity method of accounting and are initially recognised at cost.
The Group’s investment in associates includes goodwill identified on acquisition (net of any accumulated impairment loss).
The Group’s share of its associates’ post-acquisition profits or losses is recognised in the income statement, and its share of post-acquisition movements in reserves is recognised in reserves. The cumulative post-acquisition movements are adjusted against the carrying amount of the investment. When the Group’s share of losses in an associate equals or exceeds its interest in the associate, including any other unsecured receivables, the Group does not recognise further losses, unless it has incurred obligations or made payments on behalf of the associate.
Unrealised gains on transactions between the Group and its associates are eliminated to the extent of the Group’s interest in the associates. Unrealised losses are also eliminated unless the transaction provides evidence of an impairment of the asset transferred.
Joint ventures Interests in jointly controlled entities are recognised using proportionate consolidation whereby the Group’s share of the joint venture’s assets, liabilities, income and expenses are combined line by line with similar items in the Group’s financial statements.
Investment in subsidiaries, associates and joint ventures In the Company’s financial statements, investment in subsidiaries, associates and joint ventures are held at cost less impairment and dividends from pre-acquisition profits received, if any.
Standard Chartered Annual Report and Accounts 2007
Notes to the Accounts continued
94
1. Accounting Policies continued
Foreign currency translation Both the parent company financial statements and the Group financial statements are presented in US dollars, which is the presentation currency of the Group and the functional and presentation currency of the Company.
Transactions and balances Foreign currency transactions are translated into the functional currency using the exchange rates prevailing at the dates of the transactions. Foreign exchange gains and losses resulting from the settlement of such transactions, and from the translation at year-end exchange rates of monetary assets and liabilities denominated in foreign currencies, are recognised in the income statement. Non-monetary assets and liabilities are translated at historical exchange rates if held at historical cost, or year-end exchange rates if held at fair value, and the resulting foreign exchange gains and losses are recognised in either the income statement or shareholders’ equity depending on the treatment of the gain or loss on the asset or liability.
Group companies The results and financial position of all the entities included in the Group financial statements that have a functional currency different from the presentation currency are accounted for as follows:
• assets and liabilities for each balance sheet presented are translated at the closing rate at the balance sheet date;
• income and expenses for each income statement are translated at average exchange rates or at rates on the date of the transaction where exchange rates fluctuate significantly; and
• all resulting exchange differences arising since 1 January 2004 are recognised as a separate component of equity.
On consolidation, exchange differences arising from the translation of the net investment in foreign entities, and of borrowings and other currency instruments designated as hedges of such investments, are taken to shareholders’ equity. When a foreign operation is sold or capital repatriated they are recognised in the income statement as part of the gain or loss on disposal.
Goodwill and fair value adjustments arising on the acquisition of a foreign entity are treated as assets and liabilities of the foreign entity and translated at the closing rate.
Intangible assets Goodwill Goodwill represents the excess of the cost of an acquisition over the fair value of the Group’s share of the identifiable net assets and contingent liabilities of the acquired subsidiary or associate at the date of acquisition. Goodwill on acquisitions of subsidiaries is included in ‘Intangible assets’. Goodwill on acquisitions of associates is included in ‘Investments in associates’. Goodwill is assessed at each balance sheet date for impairment and carried at cost less any accumulated impairment losses. Gains and losses on the disposal of an entity include the carrying amount of goodwill relating to the entity sold. Goodwill is allocated to cash-generating units for the purpose of impairment testing.
Acquired intangibles At the date of acquisition of a subsidiary or associate, intangible assets which are deemed separable and that arise from contractual or other legal rights are capitalised and included within the net identifiable assets acquired. These intangible assets are initially
measured at fair value, which reflects market expectations of the probability that the future economic benefits embodied in the asset will flow to the entity, and are amortised on the basis of their expected useful lives (four to sixteen years). At each balance sheet date, these assets are assessed for indicators of impairment. In the event that an asset’s carrying amount is determined to be greater than its recoverable amount, the asset is written down immediately.
Computer software Acquired computer software licenses are capitalised on the basis of the costs incurred to acquire and bring to use the specific software. Costs associated with the development of software are capitalised where it is probable that it will generate future economic benefits in excess of its cost. Computer software costs are amortised on the basis of expected useful life (three to five years). Costs associated with maintaining software are recognised as an expense as incurred. At each balance sheet date, these assets are assessed for indicators of impairment. In the event that an asset’s carrying amount is determined to be greater than its recoverable amount, the asset is written down immediately.
Property, plant and equipment Land and buildings comprise mainly branches and offices. All property, plant and equipment is stated at cost less accumulated depreciation and impairment losses. Cost includes expenditure that is directly attributable to the acquisition of the assets.
Subsequent costs are included in the asset’s carrying amount or are recognised as a separate asset, as appropriate, only when it is probable that future economic benefits associated with the item will flow to the Group and the cost of the item can be measured reliably. All other repairs and maintenance are charged to the income statement during the financial period in which they are incurred.
Land is not depreciated although it is subject to impairment testing. Depreciation on other assets is calculated using the straight-line method to allocate their cost to their residual values over their estimated useful lives, as follows:
Buildings up to 50 years
Leasehold improvements life of lease, up to 50 years
Equipment and motor vehicles 3 to 15 years The assets’ residual values and useful lives are reviewed, and adjusted if appropriate, at each balance sheet date. At each balance sheet date, assets are also assessed for indicators of impairment. In the event that an asset’s carrying amount is determined to be greater than its recoverable amount, the asset is written down immediately.
Gains and losses on disposals are included in the income statement.
Leases Where a Group company is the lessee The leases entered into by the Group are primarily operating leases. The total payments made under operating leases are charged to the income statement on a straight-line basis over the period of the lease.
When an operating lease is terminated before the lease period has expired, any payment required to be made to the lessor by way of penalty is recognised as an expense in the period in which termination takes place.
www.standardchartered.com
Fin
an
cia
l S
tate
men
ts a
nd
No
tes t
o t
he A
cco
un
ts
95
1. Accounting Policies continued
Leases continued Where the group is a lessee under finance leases, the leased assets are capitalised and included in ‘Property, plant and equipment’ with a corresponding liability to the lessor recognised in ‘Other liabilities’. Finance charges payable are recognised over the period of the lease based on the interest rate implicit in the lease to give a constant periodic rate of return.
Where a Group company is the lessor When assets are held subject to a finance lease, the present value of the lease payments is recognised as a receivable. The difference between the gross receivable and the present value of the receivable is recognised as unearned finance income. Lease income is recognised over the term of the lease using the net investment method (before tax), which reflects a constant periodic rate of return ignoring tax cash flows.
Assets leased to customers under operating leases are included within ‘Property, plant and equipment’ and depreciated over their useful lives. Rental income on these leased assets is recognised in the income statement on a straight-line basis unless another systematic basis is more representative.
Cash and cash equivalents For the purposes of the cash flow statement, cash and cash equivalents comprise balances with less than three months’ maturity from the date of acquisition, including: cash and balances at central banks (unless restricted), treasury bills and other eligible bills, loans and advances to banks, and short-term government securities.
Provisions Provisions for restructuring costs and legal claims are recognised when: the Group has a present legal or constructive obligation as a result of past events; it is more likely than not that an outflow of resources will be required to settle the obligation and the amount can be reliably estimated.
Employee benefits Pension obligations The Group operates a number of pension and other post-retirement benefit plans around the world, including defined contribution plans and defined benefit plans.
For defined contribution plans, the Group pays contributions to publicly or privately administered pension plans on a mandatory, contractual or voluntary basis, and such amounts are charged to operating expenses. The Group has no further payment obligations once the contributions have been paid.
For defined benefit plans, the liability recognised in the balance sheet is the present value of the defined benefit obligation at the balance sheet date less the fair value of plan assets. The defined benefit obligation is calculated annually by independent actuaries using the projected unit method. The present value of the defined benefit obligation is determined by discounting the estimated future cash outflows using an interest rate equal to the yield on high-quality corporate bonds that are denominated in the currency in which the benefits will be paid, and that have a term to maturity approximating to the term of the related pension liability.
Actuarial gains and losses that arise are recognised in shareholders’ equity and presented in the statement of recognised income and expense in the period they arise. Past service costs are recognised immediately to the extent
that benefits are vested and are otherwise recognised over the average period until benefits are vested on a straight-line basis. Current service costs and any past service costs, together with the unwinding of the discount on plan liabilities, offset by the expected return on plan assets, are charged to operating expenses.
Share-based compensation The Group operates equity-settled and cash-settled share-based compensation plans. The fair value of the employee services received in exchange for the grant of the options is recognised as an expense.
For equity-settled awards, the total amount to be expensed over the vesting period is determined by reference to the fair value of the options granted, excluding the impact of any non-market vesting conditions (for example, profitability and growth targets). The fair value of equity instruments granted is based on market prices, if available, at the date of grant. In the absence of market prices, the fair value of the instruments is estimated using an appropriate valuation technique, such as a binomial option pricing model. Non-market vesting conditions are included in assumptions about the number of options that are expected to vest. At each balance sheet date, the Group revises its estimates of the number of options that are expected to vest. It recognises the impact of the revision of original estimates, if any, in the income statement, and a corresponding adjustment to equity over the remaining vesting period. For forfeitures prior to vesting attributable to factors other than failure to satisfy market-based performance conditions, the cumulative charge incurred is credited to the income statement.
The proceeds received net of any directly attributable transaction costs are credited to share capital (nominal value) and share premium when the options are exercised.
Cash-settled awards are revalued at each balance sheet date and a liability recognised on the balance sheet for all unpaid amounts, with any changes in fair value charged or credited to staff costs in the income statement.
Taxation Deferred tax is provided in full, using the liability method, on temporary differences arising between the tax bases of assets and liabilities and their carrying amounts in the consolidated financial statements. Deferred income tax is determined using tax rates (and laws) that have been enacted or substantially enacted as at the balance sheet date and that are expected to apply when the related deferred income tax asset is realised or the deferred income tax liability is settled.
Deferred tax assets are recognised where it is probable that future taxable profit will be available against which the temporary differences can be utilised.
Income tax payable on profits, based on the applicable tax law in each jurisdiction, is recognised as an expense in the period in which profits arise. The tax effects of income tax losses available for carry forward are recognised as an asset when it is probable that future taxable profits will be available against which these losses can be utilised.
Current and deferred tax relating to items which are charged or credited directly to equity, is credited or charged directly to equity and is subsequently recognised in the income statement together with the current or deferred gain or loss.

Standard Chartered Annual Report and Accounts 2007
Notes to the Accounts continued
96
1. Accounting Policies continued
Borrowings Borrowings are recognised initially at fair value, being their issue proceeds (fair value of consideration received) net of directly attributable transaction costs incurred. Borrowings are subsequently stated at amortised cost, with any difference between proceeds net of directly attributable transaction costs and the redemption value recognised in the income statement over the period of the borrowings using the effective interest method.
Preference shares which carry a mandatory coupon that represents a market rate of interest at the issue date, or which are redeemable on a specific date or at the option of the shareholder, are classified as financial liabilities and are presented in other borrowed funds. The dividends on these preference shares are recognised in the income statement as interest expense on an amortised cost basis using the effective interest method.
If the Group purchases its own debt, it is removed from the balance sheet, and the difference between the carrying amount of the liability and the consideration paid is included in other income.
Share capital Incremental costs directly attributable to the issue of new shares or options, or to the acquisition of a business, are shown in equity as a deduction, net of tax, from the proceeds.
Dividends on ordinary shares are recognised in equity in the period in which they are declared.
Where the Company or other members of the consolidated Group purchases the Company’s equity share capital, the consideration paid is deducted from the total shareholders’ equity of the Group (but not of the Company) as treasury shares until they are cancelled. Where such shares are subsequently sold or reissued, any consideration received is included in shareholders’ equity of the Group (but not of the Company).
Fiduciary activities The Group commonly acts as trustee and in other fiduciary capacities that result in the holding or placing of assets on behalf of individuals, trusts, retirement benefit plans and other institutions. The assets and income arising thereon are excluded from these financial statements, as they are not assets of the Group.
Financial assets and liabilities (excluding derivatives) The Group classifies its financial assets in the following categories: financial assets held at fair value through profit or loss; loans and receivables; held-to-maturity investments and available-for-sale financial assets. Financial liabilities are classified as either held at fair value through profit or loss, or at amortised cost. Management determines the classification of its financial assets and liabilities at initial recognition.
(a) Financial assets and liabilities held at fair value through profit or loss
This category has two sub-categories: financial assets and liabilities held for trading, and those designated at fair value through profit or loss at inception. A financial asset or liability is classified as trading if acquired principally for the purpose of selling in the short term. Derivatives are also categorised as trading unless they are designated as hedges.
Financial assets and liabilities may be designated at fair value through profit or loss when:
• the designation eliminates or significantly reduces a measurement or recognition inconsistency that would otherwise arise from measuring assets or liabilities on a different basis; or
• a group of financial assets and/or liabilities is managed and its performance evaluated on a fair value basis; or
• the assets or liabilities include embedded derivatives and such derivatives are required to be recognised separately.
(b) Loans and receivables Loans and receivables are non-derivative financial assets with fixed or determinable payments that are not quoted in an active market.
(c) Held-to-maturity Held-to-maturity assets are non-derivative financial assets with fixed or determinable payments and fixed maturities that the Group’s management has the positive intention and ability to hold to maturity. Were the Group to sell other than an insignificant amount of held-to-maturity assets, the entire category would be tainted and reclassified as available-for-sale.
(d) Available-for-sale Available-for-sale assets are those non-derivative financial assets intended to be held for an indefinite period of time, which may be sold in response to liquidity requirements or changes in interest rates, exchange rates or equity prices.
Initial recognition Purchases and sales of financial assets and liabilities held at fair value through profit or loss, financial assets held-to-maturity and available-for-sale are initially recognised on trade-date (the date on which the Group commits to purchase or sell the asset). Loans are recognised when cash is advanced to the borrowers. Financial assets and financial liabilities are initially recognised at fair value plus, for those financial assets and liabilities not carried at fair value through profit and loss, directly attributable transaction costs. In those cases where the initially recognised fair value is based on a valuation model that uses inputs which are not observable in the market, the difference between the transaction price and the valuation model is not recognised immediately in the income statement. The difference is amortised to the income statement until the inputs become observable, or the transaction matures or is terminated.
Subsequent measurement Available-for-sale financial assets and financial assets and liabilities held at fair value through profit or loss are subsequently carried at fair value. Loans and receivables and held-to-maturity investments are carried at amortised cost using the effective interest method.
The fair values of quoted financial assets or financial liabilities in active markets are based on current prices. If the market for a financial asset or financial liability is not active, and for unlisted securities, the Group establishes fair value by using valuation techniques. These include the use of recent arm’s length transactions, discounted cash flow analysis, option pricing models and other valuation techniques commonly used by market participants.
Renegotiated loans Loans whose original terms have been modified are considered renegotiated loans. If the renegotiation occurs before a customer is either past due or impaired and the revised terms are consistent with those readily available in the market, the account will not be considered past due. If the renegotiations are on terms that are not consistent with those readily available on the market, this provides objective evidence of impairment and the loan is assessed accordingly. If the account was past due or impaired prior to the renegotiation, the loan will remain past due until the customer complies with the revised terms for 12 months.

www.standardchartered.com
Fin
an
cia
l S
tate
men
ts a
nd
No
tes t
o t
he A
cco
un
ts
97
1. Accounting Policies continued
Financial assets and liabilities (excluding derivatives) continued Derecognition Financial assets are derecognised when the rights to receive cash flows from the financial assets have expired or where the Group has transferred substantially all risks and rewards of ownership. If substantially all the risks and rewards have been neither retained nor transferred and the Group has retained control, the assets continue to be recognised to the extent of the Group’s continuing involvement. Financial liabilities are derecognised when they are extinguished.
Income recognition For available-for-sale assets and financial assets and liabilities held at amortised cost, interest income and interest expense is recognised in the income statement using the effective interest method.
Gains and losses arising from changes in the fair value of financial instruments at fair value through profit or loss are included in the income statement in the period in which they arise. Contractual interest income and expense on financial instruments designated at fair value through profit or loss is recognised within net interest income. For trading financial instruments, interest income and expense is recognised within net interest income using the effective interest method.
Gains and losses arising from changes in the fair value of available-for-sale financial assets, other than foreign exchange gains and losses from monetary items, are recognised directly in equity, until the financial asset is derecognised or impaired at which time the cumulative gain or loss previously recognised in equity is recognised in profit or loss.
Dividends on equity instruments are recognised in the income statement within ‘Other income’ when the Group’s right to receive payment is established.
Impairment of financial assets Assets carried at amortised cost The Group assesses at each balance sheet date whether there is objective evidence that a financial asset or group of financial assets is impaired. A financial asset or a group of financial assets is impaired and impairment losses are incurred if, and only if, there is objective evidence of impairment as a result of one or more events that occurred after the initial recognition of the asset (a ‘loss event’), and that loss event (or events) has an impact on the estimated future cash flows of the financial asset or group of financial assets that can be reliably estimated.
The following factors are considered in assessing objective evidence of impairment:
• whether the customer is more than 90 days past due;
• a customer files for bankruptcy protection (or the local equivalent) where this would avoid or delay repayment of its obligation;
• the Group files to have the customer declared bankrupt or files a similar order in respect of a credit obligation;
• the Group consents to a restructuring of the obligation, resulting in a diminished financial obligation, demonstrated by a material forgiveness of debt or postponement of scheduled payments;
• the Group sells a credit obligation at a material credit-related economic loss; or
• there is observable data indicating that there is a measurable decrease in the estimated future cash flows of a group of
financial assets, although the decrease cannot yet be identified with specific individual financial assets.
The Group first assesses whether objective evidence of impairment exists individually for financial assets that are individually significant, and individually or collectively for financial assets that are not individually significant.
If the Group determines that no objective evidence of impairment exists for an individually assessed financial asset, whether significant or not, it includes the asset in a group of financial assets with similar credit risk characteristics and collectively assesses them for impairment. Assets that are individually assessed for impairment and for which an impairment loss is or continues to be recognised, are not included in a collective assessment of impairment.
If there is objective evidence that an impairment loss on a loan and receivable or a held-to-maturity asset has been incurred, the amount of the loss is measured as the difference between the asset’s carrying amount and the present value of estimated future cash flows (excluding future credit losses that have not been incurred), discounted at the asset’s original effective interest rate. The carrying amount of the asset is reduced through the use of an allowance account and the amount of the loss is recognised in the income statement. If a loan and receivable or held-to-maturity asset has a variable interest rate, the discount rate for measuring any impairment loss is the current effective interest rate determined under the contract. As a practical expedient, the Group may measure impairment on the basis of an instrument’s fair value using an observable market price.
The calculation of the present value of the estimated future cash flows of a collateralised financial asset reflects the cash flows that may result from foreclosure, less costs for obtaining and selling the collateral, whether or not foreclosure is probable. For the purposes of a collective evaluation of impairment, financial assets are grouped on the basis of similar credit risk characteristics (i.e. on the basis of the Group’s grading process which considers asset type, industry, geographic location, collateral type, past-due status and other relevant factors). These characteristics are relevant to the estimation of future cash flows for groups of such assets being indicative of the debtors’ ability to pay all amounts due according to the contractual terms of the assets being evaluated.
Future cash flows in a group of financial assets that are collectively evaluated for impairment are estimated on the basis of the historical loss experience for assets with credit risk characteristics similar to those in the group. Historical loss experience is adjusted on the basis of current observable data to reflect the effects of current conditions that did not affect the period on which the historical loss experience is based, and to remove the effects of conditions in the historical period that do not exist currently.
To the extent a loan is irrecoverable, it is written off against the related provision for loan impairment. Such loans are written off after all the necessary procedures have been completed and the amount of the loss has been determined. Subsequent recoveries of amounts previously written off decrease the amount of the provision for loan impairment in the income statement. If, in a subsequent period, the amount of the impairment loss decreases and the decrease can be related objectively to an event occurring after the impairment was recognised (such as an improvement in the debtor’s credit rating), the previously recognised impairment loss is reversed by adjusting the allowance account. The amount of the reversal is recognised in the income statement.

Standard Chartered Annual Report and Accounts 2007
Notes to the Accounts continued
98
1. Accounting Policies continued
Impairment of financial assets continued Available-for-sale assets A significant or prolonged decline in the fair value of a security below its cost is considered, amongst other indicators of impairment, in determining whether an asset is impaired. If any such evidence exists for available-for-sale financial assets, the cumulative loss (measured as the difference between the acquisition cost and the current fair value, less any impairment loss on that financial asset previously recognised in the income statement) is removed from equity and recognised in the income statement. If, in a subsequent period, the fair value of a debt instrument classified as available-for-sale increases and the increase can be objectively related to an event occurring after the impairment loss was recognised, the impairment loss is reversed through the income statement. Impairment losses recognised in the income statement on equity instruments are not reversed through the income statement.
Derivative financial instruments and hedge accounting Derivative contracts are initially recognised at fair value on the date on which a derivative contract is entered into and are subsequently remeasured at their fair value. Fair values may be obtained from quoted market prices in active markets, recent market transactions, and valuation techniques, including discounted cash flow models and option pricing models, as appropriate. Where the initially recognised fair value of a derivative contract is based on a valuation model that uses inputs which are not observable in the market, it follows the same initial recognition accounting policy as for other financial assets and liabilities. All derivatives are carried as assets when fair value is positive and as liabilities when fair value is negative.
Certain derivatives embedded in other financial instruments, such as the conversion option in a convertible bond, are treated as separate derivatives when their economic characteristics and risks are not closely related to those of the host contract and the host contract is not carried at fair value through profit or loss. These embedded derivatives are measured at fair value with changes in fair value recognised in the income statement.
The method of recognising the resulting fair value gain or loss depends on whether the derivative is designated as a hedging instrument, and if so, the nature of the item being hedged. The Group designates certain derivatives as either: (1) hedges of the fair value of recognised assets or liabilities or firm commitments (fair value hedge); or, (2) hedges of highly probable future cash flows attributable to a recognised asset or liability, or a forecasted transaction (cash flow hedge). Hedge accounting is used for derivatives designated in this way provided certain criteria are met.
The Group documents, at the inception of the transaction, the relationship between hedging instruments and hedged items, as well as its risk management objective and strategy for undertaking various hedge transactions. The Group also documents its assessment, both at hedge inception and on an ongoing basis, of whether the derivatives that are used in hedging transactions are highly effective in offsetting changes in fair values or cash flows of hedged items.
(a) Fair value hedge Changes in the fair value of derivatives that are designated and qualify as fair value hedges are recorded in the income statement,
together with any changes in the fair value of the hedged asset or liability that are attributable to the hedged risk. If the hedge no longer meets the criteria for hedge accounting, the adjustment to the carrying amount of a hedged item for which the effective interest method is used is amortised to profit or loss over the period to maturity.
(b) Cash flow hedge The effective portion of changes in the fair value of derivatives that are designated and qualify as cash flow hedges is recognised in equity. The gain or loss relating to the ineffective portion is recognised immediately in the income statement.
Amounts accumulated in equity are recycled to the income statement in the periods in which the hedged item affects profit or loss.
When a hedging instrument expires or is sold, or when a hedge no longer meets the criteria for hedge accounting, any cumulative gain or loss existing in equity at that time remains in equity and is recognised when the forecast transaction is ultimately recognised in the income statement. When a forecast transaction is no longer expected to occur, the cumulative gain or loss that was reported in equity is immediately transferred to the income statement.
(c) Net investment hedge Hedges of net investments in foreign operations are accounted for similarly to cash flow hedges. Any gain or loss on the hedging instrument relating to the effective portion of the hedge is recognised in the translation reserve; the gain or loss relating to the ineffective portion is recognised immediately in the income statement. Gains and losses accumulated in equity are included in the income statement when the foreign operation is disposed of.
Derivatives that do not qualify for hedge accounting Changes in the fair value of any derivative instrument that does not qualify for hedge accounting are recognised immediately in the income statement.
Offsetting financial instruments Financial assets and liabilities are offset and the net amount reported in the balance sheet when there is a legally enforceable right to offset the recognised amounts and there is an intention to settle on a net basis, or to realise the asset and settle the liability simultaneously.
Sale and repurchase agreements Securities sold subject to repurchase agreements (‘repos’) remain on the balance sheet; the counterparty liability is included in amounts due to other banks, deposits from banks, other deposits or deposits due to customers, as appropriate. Securities purchased under agreements to resell (‘reverse repos’) are recorded as loans and advances to other banks or customers, as appropriate. The difference between sale and repurchase price is treated as interest and accrued over the life of the agreements using the effective interest method.
Securities lent to counterparties are also retained in the financial statements. Securities borrowed are not recognised in the financial statements, unless these are sold to third parties, in which case the purchase and sale are recorded with the gain or loss included in trading income.

www.standardchartered.com
Fin
an
cia
l S
tate
men
ts a
nd
No
tes t
o t
he A
cco
un
ts
99
1. Accounting Policies continued
Interest income and expense Interest income and expense is recognised in the income statement using the effective interest method.
The effective interest method is a method of calculating the amortised cost of a financial asset or a financial liability and of allocating the interest income or interest expense over the relevant period. The effective interest rate is the rate that discounts estimated future cash payments or receipts through the expected life of the financial instrument or, when appropriate, a shorter period, to the net carrying amount of the financial asset or financial liability. When calculating the effective interest rate, the Group estimates cash flows considering all contractual terms of the financial instrument (for example, prepayment options) but does not consider future credit losses. The calculation includes all fees and points paid or received between parties to the contract that are an integral part of the effective interest rate, transaction costs and all other premiums or discounts.
Where the estimates of cash flows have been revised, the carrying amount of the financial asset or liability is adjusted to reflect the actual and revised cash flows. The adjustment is recognised as interest income or expense in the period in which the revision is made.
Once a financial asset or a group of similar financial assets has been written down as a result of an impairment loss, interest income is recognised using the rate of interest used to discount the future cash flows for the purpose of measuring the impairment loss.
Fees and commissions Fees and commissions are generally recognised on an accrual basis when the service has been provided. Loan syndication fees are recognised as revenue when the syndication has been completed and the Group retained no part of the loan package for itself, or retained a part at the same effective interest rate for the other participants. Portfolio and other management advisory and service fees are recognised based on the applicable service contracts, usually on a time-apportionate basis.
Hyperinflation Where the Group has operations in countries that experience hyperinflation, the financial statements are restated for changes in general purchasing power of the local currency.

Standard Chartered Annual Report and Accounts 2007
Notes to the Accounts continued
100
2. Segmental Information
The Group is organised on a worldwide basis into two main business segments: Wholesale Banking and Consumer Banking. The types of products and services within these segments are set out in the Financial Review. The Group’s secondary reporting format comprises geographic segments, classified by the location of the customer.
By Class of Business 2007 2006
Consumer Banking $million
WholesaleBanking$million
Corporateitems notallocated
$million Total
$million
Consumer Banking$million
Wholesale Banking $million
Corporate items not allocated
$million Total
$million
Internal income (77) 77 – – (75) 75 – –
Net interest income 4,194 2,071 – 6,265 3,545 1,783 – 5,328
Other income 1,689 3,095 18 4,802 1,214 2,065 13 3,292
Operating income 5,806 5,243 18 11,067 4,684 3,923 13 8,620
Operating expenses (3,393) (2,814) (8) (6,215) (2,641) (2,151) (4) (4,796)
Operating profit before impairment losses and taxation 2,413 2,429 10 4,852 2,043 1,772 9 3,824
Impairment (losses)/releases on loans and advances and other credit risk provisions (736) (25) – (761) (721) 92 – (629)
Other impairment – (57) – (57) – (15) – (15)
Profit/(loss) from associates – – 1 1 – – (2) (2)
Profit before taxation 1,677 2,347 11 4,035 1,322 1,849 7 3,178
Total assets employed** 90,238 238,408 559* 329,205 86,902 178,688 512* 266,102
Total liabilities employed** 120,213 187,355 185* 307,753 107,165 141,474 68* 248,707
Total risk weighted assets and contingents** 63,516 108,317 – 171,833 60,380 93,053 – 153,433
Other segment items:
Capital expenditure 418 208 – 626 209 150 – 359
Depreciation 136 46 – 182 100 35 – 135
Amortisation of intangible assets 68 95 – 163 52 81 – 133
* As required by IAS 14, tax balances are not allocated.
** Amounts have been restated as explained in note 51 on page 154. In addition, certain assets have been reallocated between Consumer Banking and Wholesale
Banking to present on a consistent basis.
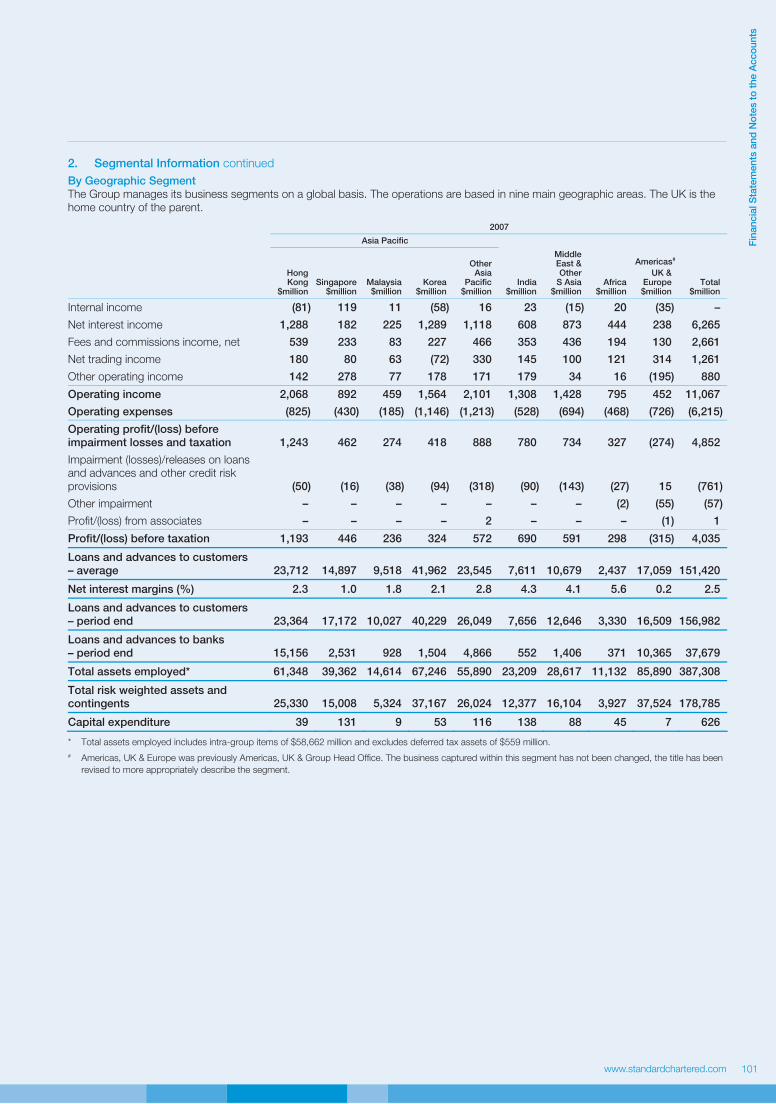
www.standardchartered.com
Fin
an
cia
l S
tate
men
ts a
nd
No
tes t
o t
he A
cco
un
ts
101
2. Segmental Information continued
By Geographic Segment The Group manages its business segments on a global basis. The operations are based in nine main geographic areas. The UK is the home country of the parent.
2007
Asia Pacific
Hong Kong
$million Singapore
$million Malaysia$million
Korea$million
OtherAsia
Pacific$million
India$million
Middle East & Other
S Asia $million
Africa $million
Americas#
UK &Europe$million
Total$million
Internal income (81) 119 11 (58) 16 23 (15) 20 (35) –
Net interest income 1,288 182 225 1,289 1,118 608 873 444 238 6,265
Fees and commissions income, net 539 233 83 227 466 353 436 194 130 2,661
Net trading income 180 80 63 (72) 330 145 100 121 314 1,261
Other operating income 142 278 77 178 171 179 34 16 (195) 880
Operating income 2,068 892 459 1,564 2,101 1,308 1,428 795 452 11,067
Operating expenses (825) (430) (185) (1,146) (1,213) (528) (694) (468) (726) (6,215)
Operating profit/(loss) before impairment losses and taxation 1,243 462 274 418 888 780 734 327 (274) 4,852
Impairment (losses)/releases on loans and advances and other credit risk provisions (50) (16) (38) (94) (318) (90) (143) (27) 15 (761)
Other impairment – – – – – – – (2) (55) (57)
Profit/(loss) from associates – – – – 2 – – – (1) 1
Profit/(loss) before taxation 1,193 446 236 324 572 690 591 298 (315) 4,035
Loans and advances to customers – average 23,712 14,897 9,518 41,962 23,545 7,611 10,679 2,437 17,059 151,420
Net interest margins (%) 2.3 1.0 1.8 2.1 2.8 4.3 4.1 5.6 0.2 2.5
Loans and advances to customers – period end 23,364 17,172 10,027 40,229 26,049 7,656 12,646 3,330 16,509 156,982
Loans and advances to banks – period end 15,156 2,531 928 1,504 4,866 552 1,406 371 10,365 37,679
Total assets employed* 61,348 39,362 14,614 67,246 55,890 23,209 28,617 11,132 85,890 387,308
Total risk weighted assets and contingents 25,330 15,008 5,324 37,167 26,024 12,377 16,104 3,927 37,524 178,785
Capital expenditure 39 131 9 53 116 138 88 45 7 626
* Total assets employed includes intra-group items of $58,662 million and excludes deferred tax assets of $559 million.
# Americas, UK & Europe was previously Americas, UK & Group Head Office. The business captured within this segment has not been changed, the title has been
revised to more appropriately describe the segment.

Standard Chartered Annual Report and Accounts 2007
Notes to the Accounts continued
102
2. Segmental Information continued
2006
Asia Pacific
Hong Kong
$million Singapore
$million Malaysia$million
Korea$million
OtherAsia
Pacific$million
India$million
Middle East & Other
S Asia $million
Africa $million
Americas UK &
Europe$million
Total$million
Internal income (14) 3 (2) 50 17 (17) (7) (10) (20) –
Net interest income 1,115 345 242 1,097 788 445 660 396 240 5,328
Fees and commissions income, net 406 159 50 152 302 204 296 160 152 1,881
Net trading income 74 56 60 64 166 101 115 91 193 920
Other operating income 34 59 21 159 111 84 6 3 14 491
Operating income 1,615 622 371 1,522 1,384 817 1,070 640 579 8,620
Operating expenses (720) (294) (164) (972) (785) (375) (514) (413) (559) (4,796)
Operating profit before impairment losses and taxation 895 328 207 550 599 442 556 227 20 3,824
Impairment (losses)/releases on loans and advances and other credit risk provisions (7) (39) (29) (96) (384) (39) (53) (26) 44 (629)
Other impairment – – – – (3) – – (9) (3) (15)
(Loss)/profit from associates – – – – (4) – – – 2 (2)
Profit before taxation 888 289 178 454 208 403 503 192 63 3,178
Loans and advances to customers – average 22,859 12,976 8,671 38,986 12,261 5,876 9,531 2,397 10,415 123,972
Net interest margin (%) 2.3 1.3 2.1 1.9 3.0 3.4 3.8 5.7 0.3 2.5
Loans and advances to customers – period end* 22,037 14,626 9,199 40,029 22,851 6,242 10,516 2,536 12,458 140,494
Loans and advances to banks – period end 6,474 939 161 1,753 4,462 477 1,058 387 5,353 21,064
Total assets employed* # 49,845 25,400 11,849 64,178 46,886 14,386 18,118 7,794 65,918 304,374
Total risk weighted assets and contingents* 23,784 13,681 5,315 35,330 24,874 8,450 13,564 3,287 28,282 156,567
Capital expenditure 78 65 3 35 49 22 37 13 57 359
* Amounts have been restated as explained in note 51 on page 154.
# Total assets employed includes intra-group items of $38,784 million and excludes deferred tax assets of $512 million.

www.standardchartered.com
Fin
an
cia
l S
tate
men
ts a
nd
No
tes t
o t
he A
cco
un
ts
103
2. Segmental Information continued
Apart from the entities that have been acquired in the last two years, Group central expenses have been distributed between segments in proportion to their direct costs, and the benefit of the Group’s capital has been distributed between segments in proportion to their average risk weighted assets. In the year in which an acquisition is made the Group does not charge or allocate the benefit of the Group’s capital. The distribution of central expenses is phased in over two years, based on an estimate of central management costs associated with the acquisition.
In 2007, corporate items not allocated to businesses relate to profits on disposal of businesses, pre-incorporation costs in China and profits from associates.
Assets held at the centre have been distributed between geographic segments in proportion to their total assets employed.
Total risk weighted assets and contingents include $6,952 million (2006: $3,134 million) of balances which are netted in calculating capital ratios.
Capital expenditure comprises additions to property and equipment (note 26) and software related intangibles (note 25) including any post-acquisition additions made by acquired entities.
3. Interest Income
2007 $million
2006$million
Balances at central banks 39 29
Treasury bills 884 746
Loans and advances to banks 1,975 1,177
Loans and advances to customers 10,746 8,997
Listed debt securities 1,081 855
Unlisted debt securities 1,385 1,131
Accrued on impaired assets (discount unwind) 66 52
16,176 12,987
Total interest income from financial instruments held at amortised cost in 2007 is $11,070 million (2006: $8,738 million) and from financial instruments held as available-for-sale is $2,390 million (2006: $2,027 million).
4. Interest Expense
2007 $million
2006$million
Deposits by banks 1,497 1,122
Customer accounts:
Interest bearing current accounts and savings deposits 1,508 1,567
Time deposits 4,552 3,141
Debt securities in issue 1,543 1,186
Subordinated liabilities and other borrowed funds:
Wholly repayable within five years 245 227
Other 566 416
9,911 7,659
Total interest expense on financial instruments held at amortised cost in 2007 is $8,347 million (2006: $6,948 million).
5. Fees and Commissions
2007 $million
2006$million
Fee income:
Arising from financial instruments that are not fair valued through profit or loss 1,160 1,145
Arising from trust and other fiduciary activities 302 155
Other 1,727 975
3,189 2,275
Fee expense:
Arising from financial instruments that are not fair valued through profit or loss 285 253
Arising from trust and other fiduciary activities 26 14
Other 217 127
528 394

Standard Chartered Annual Report and Accounts 2007
Notes to the Accounts continued
104
6. Net Trading Income
2007 $million
2006$million
Gains less losses on instruments held for trading:
Foreign currency 862 645
Trading securities 102 109
Interest rate derivatives 257 151
Credit and other derivatives 39 40
Gains less losses from fair value hedged items and hedging instruments (3) 14
Gains less losses on instruments designated at fair value:
Financial assets designated at fair value through profit or loss 44 –
Financial liabilities designated at fair value through profit or loss (37) (37)
Derivatives managed with financial instruments designated at fair value through profit or loss (3) (2)
1,261 920
7. Other Operating Income
2007 $million
2006$million
Other operating income includes:
Gains less losses on available-for-sale financial assets:
On disposal 339 185
Writedowns on asset backed securities (87) –
Gains less losses on disposal of loan and receivable financial assets 3 5
Dividend income 279 77
Gains arising on assets fair valued at acquisition 98 106
Recognition of profit on Visa shares 107 –
Income on repatriation of branch capital 109 –
Gain on effective part disposal of Pakistan branches – 17
Profit on part disposal of merchant acquiring business 15 –
Net profit on sale of businesses 3 –
8. Operating Expenses
2007 $million
2006$million
Staff costs:
Wages and salaries 2,970 2,278
Social security costs 67 74
Other pension costs (note 36) 213 166
Other staff costs 699 395
3,949 2,913
Premises and equipment expenses:
Rental of premises 259 215
Other premises and equipment costs 307 208
Rental of computers and equipment 26 21
592 444
General administrative expenses 1,329 1,171
Wages and salaries include share based payments – see note 41.
The Group employed 69,612 staff at 31 December 2007 (2006: 59,205).
The Company employed nil staff at 31 December 2007 (2006: nil) and it incurred costs of $7 million (2006: $2 million).
Directors’ emoluments Details of directors’ pay and benefits and interests in shares are disclosed in the directors’ remuneration report on pages 73 to 85.
Transactions with directors, officers and other related parties are disclosed in the related parties note 52 on page 155.
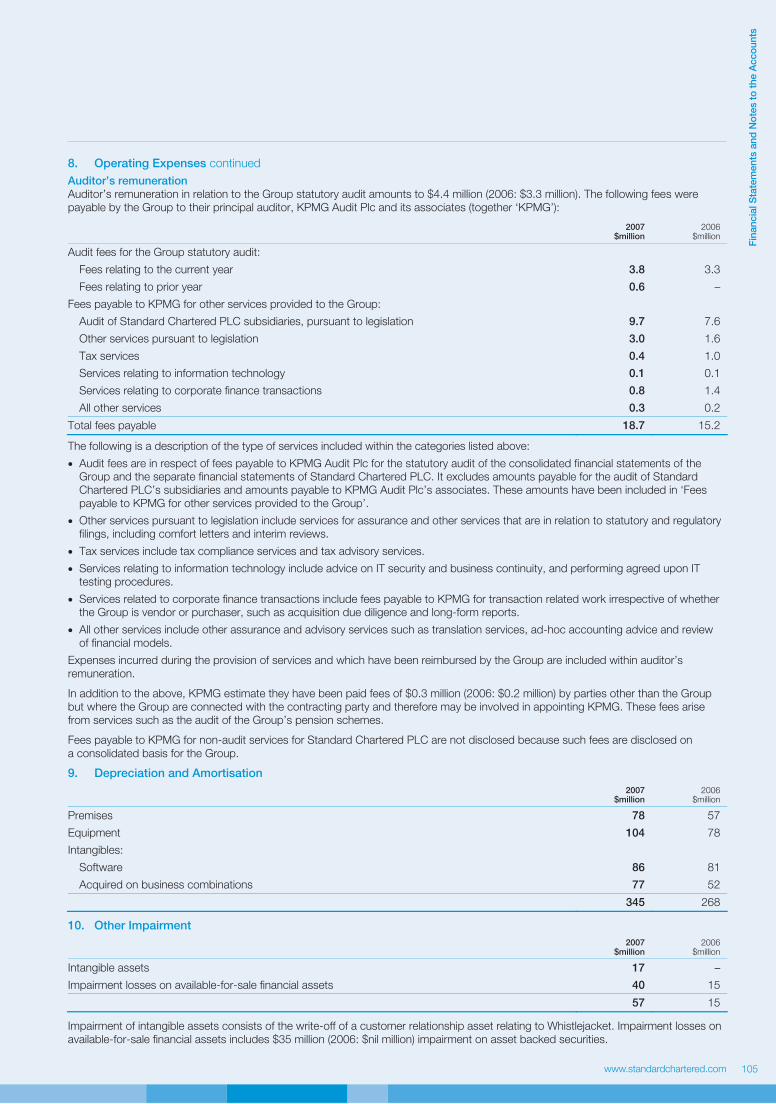
www.standardchartered.com
Fin
an
cia
l S
tate
men
ts a
nd
No
tes t
o t
he A
cco
un
ts
105
8. Operating Expenses continued
Auditor’s remuneration Auditor’s remuneration in relation to the Group statutory audit amounts to $4.4 million (2006: $3.3 million). The following fees were payable by the Group to their principal auditor, KPMG Audit Plc and its associates (together ‘KPMG’):
2007 $million
2006$million
Audit fees for the Group statutory audit:
Fees relating to the current year 3.8 3.3
Fees relating to prior year 0.6 –
Fees payable to KPMG for other services provided to the Group:
Audit of Standard Chartered PLC subsidiaries, pursuant to legislation 9.7 7.6
Other services pursuant to legislation 3.0 1.6
Tax services 0.4 1.0
Services relating to information technology 0.1 0.1
Services relating to corporate finance transactions 0.8 1.4
All other services 0.3 0.2
Total fees payable 18.7 15.2
The following is a description of the type of services included within the categories listed above:
• Audit fees are in respect of fees payable to KPMG Audit Plc for the statutory audit of the consolidated financial statements of the Group and the separate financial statements of Standard Chartered PLC. It excludes amounts payable for the audit of Standard Chartered PLC’s subsidiaries and amounts payable to KPMG Audit Plc’s associates. These amounts have been included in ‘Fees payable to KPMG for other services provided to the Group’.
• Other services pursuant to legislation include services for assurance and other services that are in relation to statutory and regulatory filings, including comfort letters and interim reviews.
• Tax services include tax compliance services and tax advisory services.
• Services relating to information technology include advice on IT security and business continuity, and performing agreed upon IT testing procedures.
• Services related to corporate finance transactions include fees payable to KPMG for transaction related work irrespective of whether the Group is vendor or purchaser, such as acquisition due diligence and long-form reports.
• All other services include other assurance and advisory services such as translation services, ad-hoc accounting advice and review of financial models.
Expenses incurred during the provision of services and which have been reimbursed by the Group are included within auditor’s remuneration.
In addition to the above, KPMG estimate they have been paid fees of $0.3 million (2006: $0.2 million) by parties other than the Group but where the Group are connected with the contracting party and therefore may be involved in appointing KPMG. These fees arise from services such as the audit of the Group’s pension schemes.
Fees payable to KPMG for non-audit services for Standard Chartered PLC are not disclosed because such fees are disclosed on a consolidated basis for the Group.
9. Depreciation and Amortisation
2007 $million
2006$million
Premises 78 57
Equipment 104 78
Intangibles:
Software 86 81
Acquired on business combinations 77 52
345 268
10. Other Impairment
2007
$million 2006
$million
Intangible assets 17 –
Impairment losses on available-for-sale financial assets 40 15
57 15
Impairment of intangible assets consists of the write-off of a customer relationship asset relating to Whistlejacket. Impairment losses on available-for-sale financial assets includes $35 million (2006: $nil million) impairment on asset backed securities.
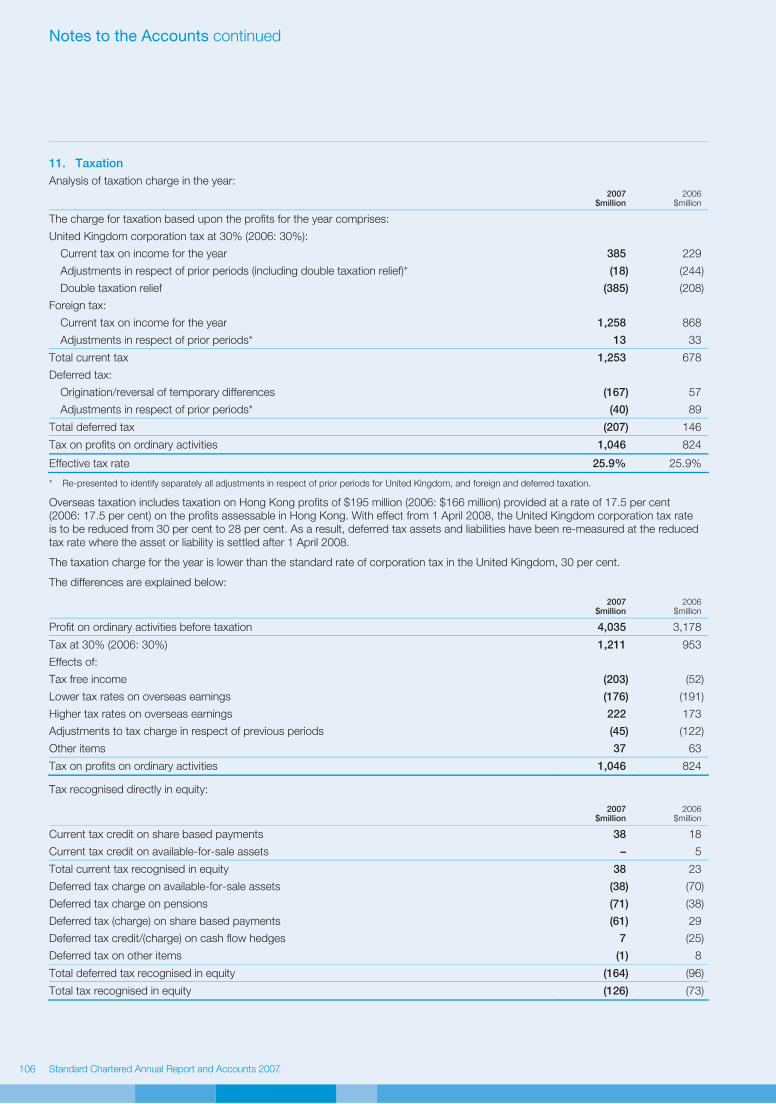
Standard Chartered Annual Report and Accounts 2007
Notes to the Accounts continued
106
11. Taxation
Analysis of taxation charge in the year:
2007 $million
2006$million
The charge for taxation based upon the profits for the year comprises:
United Kingdom corporation tax at 30% (2006: 30%):
Current tax on income for the year 385 229
Adjustments in respect of prior periods (including double taxation relief)* (18) (244)
Double taxation relief (385) (208)
Foreign tax:
Current tax on income for the year 1,258 868
Adjustments in respect of prior periods* 13 33
Total current tax 1,253 678
Deferred tax:
Origination/reversal of temporary differences (167) 57
Adjustments in respect of prior periods* (40) 89
Total deferred tax (207) 146
Tax on profits on ordinary activities 1,046 824
Effective tax rate 25.9% 25.9%
* Re-presented to identify separately all adjustments in respect of prior periods for United Kingdom, and foreign and deferred taxation.
Overseas taxation includes taxation on Hong Kong profits of $195 million (2006: $166 million) provided at a rate of 17.5 per cent (2006: 17.5 per cent) on the profits assessable in Hong Kong. With effect from 1 April 2008, the United Kingdom corporation tax rate is to be reduced from 30 per cent to 28 per cent. As a result, deferred tax assets and liabilities have been re-measured at the reduced tax rate where the asset or liability is settled after 1 April 2008.
The taxation charge for the year is lower than the standard rate of corporation tax in the United Kingdom, 30 per cent.
The differences are explained below:
2007 $million
2006$million
Profit on ordinary activities before taxation 4,035 3,178
Tax at 30% (2006: 30%) 1,211 953
Effects of:
Tax free income (203) (52)
Lower tax rates on overseas earnings (176) (191)
Higher tax rates on overseas earnings 222 173
Adjustments to tax charge in respect of previous periods (45) (122)
Other items 37 63
Tax on profits on ordinary activities 1,046 824
Tax recognised directly in equity:
2007 $million
2006$million
Current tax credit on share based payments 38 18
Current tax credit on available-for-sale assets – 5
Total current tax recognised in equity 38 23
Deferred tax charge on available-for-sale assets (38) (70)
Deferred tax charge on pensions (71) (38)
Deferred tax (charge) on share based payments (61) 29
Deferred tax credit/(charge) on cash flow hedges 7 (25)
Deferred tax on other items (1) 8
Total deferred tax recognised in equity (164) (96)
Total tax recognised in equity (126) (73)
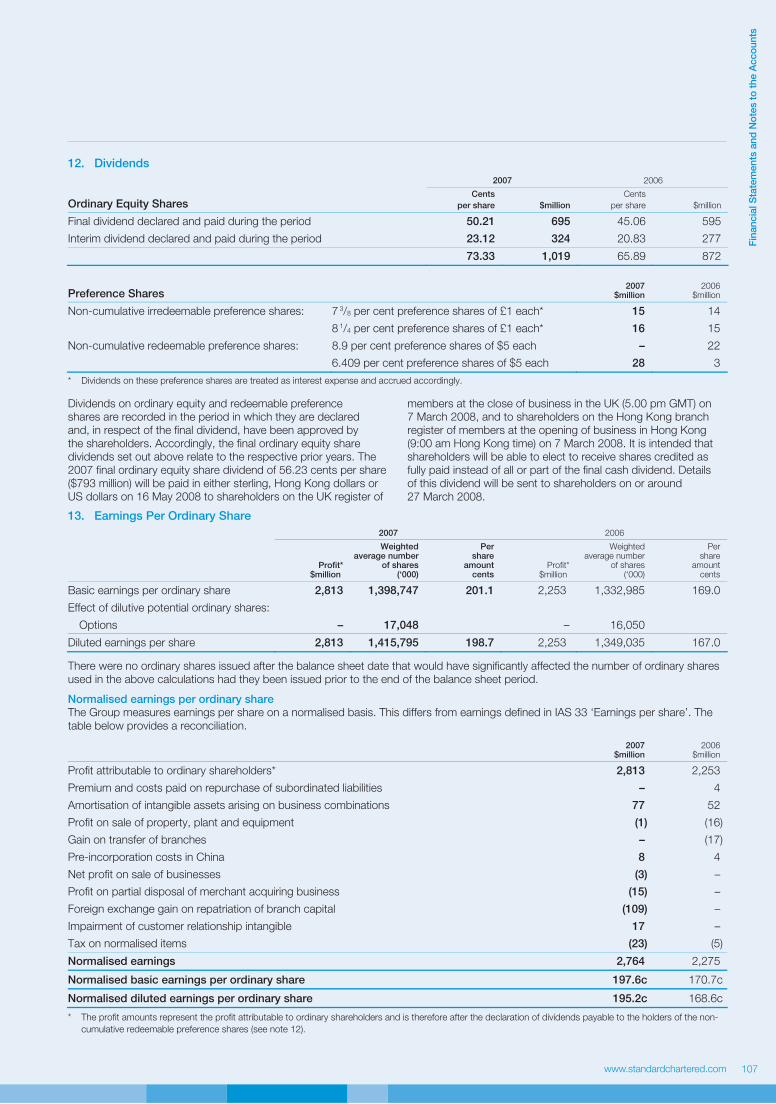
www.standardchartered.com
Fin
an
cia
l S
tate
men
ts a
nd
No
tes t
o t
he A
cco
un
ts
107
12. Dividends
2007 2006
Ordinary Equity Shares Cents
per share
$million
Cents
per share $million
Final dividend declared and paid during the period 50.21 695 45.06 595
Interim dividend declared and paid during the period 23.12 324 20.83 277
73.33 1,019 65.89 872
Preference Shares 2007
$million 2006
$million
Non-cumulative irredeemable preference shares: 7 3/8 per cent preference shares of £1 each* 15 14
8 1/4 per cent preference shares of £1 each* 16 15
Non-cumulative redeemable preference shares: 8.9 per cent preference shares of $5 each – 22
6.409 per cent preference shares of $5 each 28 3
* Dividends on these preference shares are treated as interest expense and accrued accordingly.
Dividends on ordinary equity and redeemable preference shares are recorded in the period in which they are declared and, in respect of the final dividend, have been approved by the shareholders. Accordingly, the final ordinary equity share dividends set out above relate to the respective prior years. The 2007 final ordinary equity share dividend of 56.23 cents per share ($793 million) will be paid in either sterling, Hong Kong dollars or US dollars on 16 May 2008 to shareholders on the UK register of
members at the close of business in the UK (5.00 pm GMT) on 7 March 2008, and to shareholders on the Hong Kong branch register of members at the opening of business in Hong Kong (9:00 am Hong Kong time) on 7 March 2008. It is intended that shareholders will be able to elect to receive shares credited as fully paid instead of all or part of the final cash dividend. Details of this dividend will be sent to shareholders on or around 27 March 2008.
13. Earnings Per Ordinary Share
2007 2006
Profit*$million
Weighted average number
of shares(‘000)
Pershare
amountcents
Profit* $million
Weighted average number
of shares (‘000)
Pershare
amountcents
Basic earnings per ordinary share 2,813 1,398,747 201.1 2,253 1,332,985 169.0
Effect of dilutive potential ordinary shares:
Options – 17,048 – 16,050
Diluted earnings per share 2,813 1,415,795 198.7 2,253 1,349,035 167.0
There were no ordinary shares issued after the balance sheet date that would have significantly affected the number of ordinary shares used in the above calculations had they been issued prior to the end of the balance sheet period.
Normalised earnings per ordinary share The Group measures earnings per share on a normalised basis. This differs from earnings defined in IAS 33 ‘Earnings per share’. The table below provides a reconciliation.
2007 $million
2006$million
Profit attributable to ordinary shareholders* 2,813 2,253
Premium and costs paid on repurchase of subordinated liabilities – 4
Amortisation of intangible assets arising on business combinations 77 52
Profit on sale of property, plant and equipment (1) (16)
Gain on transfer of branches – (17)
Pre-incorporation costs in China 8 4
Net profit on sale of businesses (3) –
Profit on partial disposal of merchant acquiring business (15) –
Foreign exchange gain on repatriation of branch capital (109) –
Impairment of customer relationship intangible 17 –
Tax on normalised items (23) (5)
Normalised earnings 2,764 2,275
Normalised basic earnings per ordinary share 197.6c 170.7c
Normalised diluted earnings per ordinary share 195.2c 168.6c
* The profit amounts represent the profit attributable to ordinary shareholders and is therefore after the declaration of dividends payable to the holders of the non-
cumulative redeemable preference shares (see note 12).

Standard Chartered Annual Report and Accounts 2007
Notes to the Accounts continued
108
14. Financial Instruments Classification Summary
Financial instruments are classified between four recognition principles: held at fair value through profit or loss (comprising trading and designated), available-for-sale, held-to-maturity, loans and receivables, and for financial liabilities, amortised cost. The face of the balance sheet combines financial instruments that are held at their fair value and subdivided between those assets and liabilities held for trading purposes and those that the Group has elected to hold at fair value.
The Group’s classification of its principal financial assets and liabilities (excluding derivatives which are classified as trading and are disclosed in note 16) is summarised in the table below. Cash and balances at central banks of $10,175 million (2006: $7,698 million) is deemed to be held at amortised cost.
Trading$million
Designated at fair value
through profit or loss
$million
Available-for-sale$million
Loans and receivables
$million
Held-to- maturity $million
Total$million
Loans and advances to banks 2,314 – – 35,365 – 37,679
Loans and advances to customers 1,978 738 – 154,266 – 156,982
Treasury bills and other eligible bills 2,942 453 11,667 – – 15,062
Debt securities 13,829 334 38,098 2,719 100 55,080
Equity shares 108 262 2,690 – – 3,060
Total at 31 December 2007 21,171 1,787 52,455 192,350 100 267,863
Loans and advances to banks 1,340 – – 19,724 – 21,064
Loans and advances to customers* 1,000 194 – 139,300 – 140,494
Treasury bills and other eligible bills 2,722 696 12,522 – – 15,940
Debt securities* 8,906 695 32,711 2,649 137 45,098
Equity shares 162 – 1,478 – – 1,640
Total at 31 December 2006 14,130 1,585 46,711 161,673 137 224,236
* Amounts have been restated as explained in note 51 on page 154.
Trading$million
Designated at fair value
through profit or loss
$million
Amortised cost
$million Total
$million
Deposits by banks 2,532 173 25,880 28,585
Customer accounts 772 2,064 179,760 182,596
Debt securities in issue 2,665 2,351 27,137 32,153
Short positions 3,693 – – 3,693
Total at 31 December 2007 9,662 4,588 232,777 247,027
Deposits by banks 1,286 603 26,233 28,122
Customer accounts 485 1,421 147,382 149,288
Debt securities in issue 1,514 1,771 23,514 26,799
Short positions 2,889 – – 2,889
Total at 31 December 2006 6,174 3,795 197,129 207,098
15. Financial Assets Held at Fair Value through Profit or Loss
For certain loans and advances and debt securities with fixed rates of interest, interest rate swaps have been acquired with the intention of significantly reducing interest rate risk. Derivatives are recorded at fair value whereas loans and advances are usually recorded at amortised cost. To significantly reduce the accounting mismatch between fair value and amortised cost, these loans and advances and debt securities have been designated at fair value through profit or loss. The Group ensures the criteria under IAS 39 are met by
matching the principal terms of interest rate swaps to the corresponding loans and debt securities.
The changes in fair value of both the underlying loans and advances and debt securities and interest rate swaps are monitored in a similar manner to trading book portfolios.
The maximum exposure to credit risk for loans designated at fair value through profit or loss was $738 million (2006: $194 million).

www.standardchartered.com
Fin
an
cia
l S
tate
men
ts a
nd
No
tes t
o t
he A
cco
un
ts
109
15. Financial Assets Held at Fair Value through Profit or Loss continued
The fair value loss on loans and advances to customers designated at fair value through profit or loss was $1.0 million (2006: $4.7 million). Of this, $nil million (2006: $0.4 million) relates to changes in credit risk. The cumulative fair value movement relating to changes in credit risk was $0.4 million (2006: $0.4 million).
The changes in fair value attributable to credit risk was determined by comparing fair value movements in risk-free bonds with similar maturities to the changes in fair value of loans designated at fair value through profit or loss.
2007 2006
Trading$million
Designated at fair value
through profit or loss
$million Total
$million Trading $million
Designated at fair value through
profit or loss $million
Total$million
Loans and advances to banks 2,314 – 2,314 1,340 – 1,340
Loans and advances to customers 1,978 738 2,716 1,000 194 1,194
Treasury bills and other eligible bills 2,942 453 3,395 2,722 696 3,418
Debt securities 13,829 334 14,163 8,906 695 9,601
Equity shares 108 262 370 162 – 162
21,171 1,787 22,958 14,130 1,585 15,715
Debt securities
2007 $million
2006$million
Issued by public bodies:
Government securities 5,344 2,321
Other public sector securities 30 45
5,374 2,366
Issued by banks:
Certificates of deposit 479 405
Other debt securities 2,672 2,082
3,151 2,487
Issued by corporate entities and other issuers:
Other debt securities 5,638 4,748
Total debt securities 14,163 9,601
Of which:
Listed on a recognised UK exchange 536 418
Listed elsewhere 5,641 2,819
Unlisted 7,986 6,364
14,163 9,601
Equity shares
Listed elsewhere 3 36
Unlisted 367 126
Total equity shares 370 162

Standard Chartered Annual Report and Accounts 2007
Notes to the Accounts continued
110
15. Financial Assets Held at Fair Value through Profit or Loss continued
For certain loans and advances designated at fair value through profit or loss, the difference arising between the fair value at initial recognition and the amount that would have arisen had the valuation techniques used for subsequent
measurement been used at initial recognition is amortised to the income statement until the inputs become observable or the transaction matures or is terminated. The table below sets out a reconciliation of amounts deferred:
2007 $million
2006$million
At 1 January 2 –
Additional amount deferred 10 2
Recognised in income (3) –
At 31 December 9 2
Changing one or more of the assumptions to reasonably possible alternatives would not significantly change the fair value.
16. Derivative Financial Instruments
Derivatives are financial instruments that derive their value in response to changes in interest rates, financial instrument prices, commodity prices, foreign exchange rates, credit risk and indices. The types of derivatives used by the Group are set out below.
All derivatives are classified as trading and recognised and subsequently measured at fair value, with all revaluation gains recognised in profit and loss (except where cash flow hedging has been achieved, in which case the effective portion of changes in fair value go through reserves).
These tables analyse the notional principal amounts and the positive and negative fair values of the Group’s derivative
financial instruments. Notional principal amounts are the amount of principal underlying the contract at the reporting date.
The Group limits its exposure to credit losses in the event of default by entering into master netting agreements with certain market counterparties. As required by IAS 32, exposures are not presented net in these accounts as in the ordinary course of business they are not intended to be settled net. Details of the amounts available for offset can be found in note 49, under maximum exposure to credit risk.
The Derivatives and Hedging sections of the Risk Review on pages 57 and 58 explains the Group’s risk management of derivative contracts.
2007 2006
Total derivatives
Notionalprincipalamounts$million
Assets$million
Liabilities$million
Notional principal amounts $million
Assets $million
Liabilities$million
Foreign exchange derivative contracts:
Forward foreign exchange contracts 775,663 7,376 7,852 434,569 3,805 4,165
Currency swaps and options 512,833 8,955 8,516 295,845 4,698 4,793
1,288,496 16,331 16,368 730,414 8,503 8,958
Interest rate derivative contracts:
Swaps 979,727 8,473 8,365 653,283 4,353 4,348
Forward rate agreements and options 166,563 556 745 94,244 138 195
Exchange traded futures and options 322,520 336 282 260,182 42 47
1,468,810 9,365 9,392 1,007,709 4,533 4,590
Credit derivative contracts 21,035 165 160 22,195 49 70
Equity and stock index options 1,057 58 106 699 18 44
Commodity derivative contracts 16,971 285 244 2,469 51 41
Total derivatives 2,796,369 26,204 26,270 1,763,486 13,154 13,703

www.standardchartered.com
Fin
an
cia
l S
tate
men
ts a
nd
No
tes t
o t
he A
cco
un
ts
111
16. Derivative Financial Instruments continued
The Group uses derivatives primarily to mitigate interest rate and foreign exchange risk. Hedge accounting is applied to derivatives and hedged items when the criteria under IAS 39
have been met. The table below lists the types of derivatives that the Group holds for hedge accounting.
2007 2006
Derivatives held for hedging
Notionalprincipalamounts$million
Assets$million
Liabilities$million
Notional principal amounts $million
Assets$million
Liabilities$million
Derivatives designated as fair value hedges:
Swaps 13,392 352 161 10,570 589 464
13,392 352 161 10,570 589 464
Derivatives designated as cash flow hedges:
Swaps 5,120 35 13 5,596 17 21
Forward foreign exchange contracts 1,414 37 19 921 61 2
6,534 72 32 6,517 78 23
Total derivatives held for hedging 19,926 424 193 17,087 667 487
Fair value hedges The Group uses interest rate swaps to manage fixed rates of interest. The swaps exchange fixed rates for floating rates on funding to match floating rates received on assets, or exchanges fixed rates on assets to match the floating rates paid on funding. For qualifying hedges, the fair value changes of the derivative are substantially matched by corresponding fair value changes of the hedged item, both of which are recognised in profit and loss.
In respect of fair value hedges, gains arising on the hedging instruments during the year were $49 million (2006: losses of $218 million) compared to losses arising on the hedged items of $52 million (2006: gains of $232 million).
Cash flow hedges The Group uses swaps to manage the variability in future interest cash flows on assets and liabilities that have floating rates of interest by exchanging the floating rates for fixed rates. It also uses foreign exchange contracts to manage the variability in future exchange rates on its assets and liabilities and costs in
foreign currencies. Gains and losses arising on the hedges are deferred in equity until the variability on the cash flow affects profit and loss, at which time the gains or losses are transferred to profit and loss.
The Group has hedged the following cash flows which are expected to impact the income statement in the following periods:
2007
Less than one year$million
One to two years
$million
Two to three years
$million
Three to four years
$million
Four to five years
$million
Over five years
$million Total
$million
Forecast receivable cash flows 98 82 31 36 2 1 250
Forecast payable cash flows (724) (706) (14) (5) (3) – (1,452)
(626) (624) 17 31 (1) 1 (1,202)
2006
Less than one year$million
One to two years
$million
Two to three years
$million
Three to four years
$million
Four to five years
$million
Over five years
$million Total
$million
Forecast receivable cash flows 101 82 51 18 32 – 284
Forecast payable cash flows (721) (335) (55) (13) (3) – (1,127)
(620) (253) (4) 5 29 – (843) During the year, $nil million (2006: $nil million) was recognised in the income statement in respect of ineffectiveness arising on cash flow hedges.
During the period $58 million (2006: $20 million) was removed from the cash flow hedging reserve and included in profit and loss. The whole $58 million (2006: $20 million) was recognised within operating costs.

Standard Chartered Annual Report and Accounts 2007
Notes to the Accounts continued
112
17. Loans and Advances to Banks
2007 $million
2006$million
Loans and advances to banks 37,682 21,074
Individual impairment provision (note 20) (2) (9)
Portfolio impairment provision (note 20) (1) (1)
37,679 21,064
Of which: loans and advances held at fair value through profit or loss (note 15) (2,314) (1,340)
35,365 19,724
18. Loans and Advances to Customers
2007 $million
2006*
$million
Loans and advances to customers 158,788 142,709
Individual impairment provision (note 20) (1,271) (1,673)
Portfolio impairment provision (note 20) (535) (542)
156,982 140,494
Of which: loans and advances held at fair value through profit or loss (note 15) (2,716) (1,194)
154,266 139,300
* Amounts have been restated as explained in note 51 on page 154.
The Group has transferred to third parties by way of securitisation the rights to any collections of principal and interest on customer loan assets with a face value of $5,742 million (2006: $3,935 million). The Group continues to be exposed to related credit and foreign exchange risk on these assets. The Group continues to recognise these assets in addition to the proceeds and related liability of $5,155 million (2006: $3,519 million) arising from the securitisations.
The Group has entered into synthetic loan securitisations of $11.7 billion (2006: $5.6 billion) and synthetic trade receivable securitisations of $12.7 billion (2006: $1.5 billion). The assets remain on the Group’s balance sheet and the Group continues
to be exposed to some credit risks and foreign exchange risks on these assets.
The Group’s exposure to credit risk is concentrated in Hong Kong, Korea, Singapore and the Other Asia Pacific region. The Group is affected by the general economic conditions in the territories in which it operates. The Group sets limits on the exposure to any counterparty and credit risk is spread over a variety of different personal and commercial customers. The Group has outstanding residential mortgage loans to Korea residents of $22.6 billion (2006: $24.0 billion) and Hong Kong residents of approximately $11.8 billion (2006: $11.2 billion).
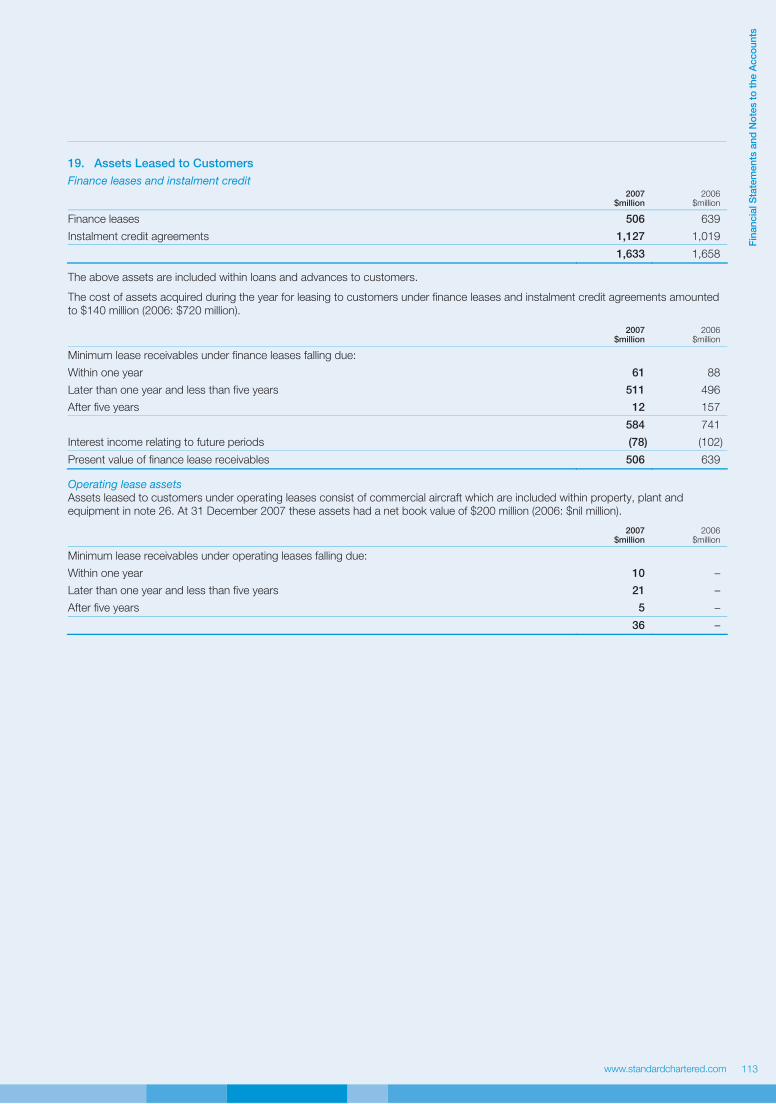
www.standardchartered.com
Fin
an
cia
l S
tate
men
ts a
nd
No
tes t
o t
he A
cco
un
ts
113
19. Assets Leased to Customers
Finance leases and instalment credit
2007 $million
2006$million
Finance leases 506 639
Instalment credit agreements 1,127 1,019
1,633 1,658
The above assets are included within loans and advances to customers.
The cost of assets acquired during the year for leasing to customers under finance leases and instalment credit agreements amounted to $140 million (2006: $720 million).
2007 $million
2006$million
Minimum lease receivables under finance leases falling due:
Within one year 61 88
Later than one year and less than five years 511 496
After five years 12 157
584 741
Interest income relating to future periods (78) (102)
Present value of finance lease receivables 506 639 Operating lease assets Assets leased to customers under operating leases consist of commercial aircraft which are included within property, plant and equipment in note 26. At 31 December 2007 these assets had a net book value of $200 million (2006: $nil million).
2007 $million
2006$million
Minimum lease receivables under operating leases falling due:
Within one year 10 –
Later than one year and less than five years 21 –
After five years 5 –
36 –

Standard Chartered Annual Report and Accounts 2007Standard Chartered Annual Report and Accounts 2007
Notes to the Accounts continued
114
20. Impairment Provisions on Loans and Advances
2007 $million
2006*
$million
At 1 January 2,225 1,754
Exchange translation differences 28 74
Acquisitions – 743
Amounts written off (1,183) (962)
Recoveries of acquisition fair values (98) (106)
Recoveries of amounts previously written off 139 128
Discount unwind (66) (52)
Other 10 12
New provisions 1,352 1,131
Recoveries/provisions no longer required (598) (497)
Net charge against profit** 754 634
Provisions held at 31 December# 1,809 2,225
* Amounts have been restated as explained in note 51 on page 154.
** The net charge of $754 million (2006: $634 million) comprises $769 million (2006: $604 million) individual impairment charge and $(15) million (2006: $30 million)
portfolio impairment (release)/charge. It excludes provision releases of $3 million (2006: $11 million) for credit commitments (note 35) and impairment charges of
$10 million (2006: $6 million) relating to debt securities designated as loans and receivables (note 22).
# The provision of $1,809 million held at 31 December 2007 (2006: $2,225 million) comprises $1,273 million (2006: $1,682 million) individual impairment provision
and $536 million (2006: $543 million) portfolio impairment provision.
The following table shows impairment provisions by each principal category of borrowers’ business or industry:
2007 $million
2006*
$million
Loans to individuals
Mortgages 99 132
Other 200 226
Small and medium enterprises 356 494
Consumer Banking 655 852
Agriculture, forestry and fishing 33 23
Construction 10 4
Commerce 152 169
Electricity, gas and water 25 6
Financing, insurance and business services 27 20
Mining and quarrying 12 36
Manufacturing 290 507
Commercial real estate 23 12
Transport, storage and communication 22 31
Other 22 13
Wholesale Banking 616 821
Individual impairment provision against loans and advances to customers (note 18) 1,271 1,673
Individual impairment provision against loans and advances to banks (note 17) 2 9
Portfolio impairment provision (note 17, 18) 536 543
Total impairment provisions on loans and advances 1,809 2,225
* Amounts have been restated as explained in note 51 on page 154.

www.standardchartered.com
Fin
an
cia
l S
tate
men
ts a
nd
No
tes t
o t
he A
cco
un
ts
115
21. Individually Impaired Loans and Advances
2007 2006
Consumer Banking
$million
Wholesale Banking
$million
Total
$million
Consumer Banking
$million
Wholesale Banking
$million
Total
$million
Individual impaired loans 1,172 990 2,162 1,761 1,368 3,129
Individual impairment provisions (655) (618) (1,273) (852) (830) (1,682)
Net impaired loans 517 372 889 909 538 1,447 Net impaired loans within Wholesale Banking includes individually impaired loans to banks of $10 million (2006: $18 million) and individual impairment provisions on these loans of $2 million (2006: $9 million). Collateral held as security against impaired loans primarily relates to property and equipment. The fair value of collateral held against impaired loans is estimated at $1,121 million (2006: $1,466 million), of which $918 million
(2006: $1,068 million) relates to Consumer Banking and $203 million (2006: $398 million) to Wholesale Banking. Where the fair value of collateral held exceeds the outstanding loan, any excess is paid back to the customers and is not available for offset against other loans.
22. Investment Securities
Held-to-maturity$million
Available- for-sale $million
Loans and receivables
$million Total
$million
Treasury and other eligible bills – 11,667 – 11,667
Debt securities 100 38,098 2,719 40,917
Equity shares – 2,690 – 2,690
At 31 December 2007 100 52,455 2,719 55,274
Treasury and other eligible bills – 12,522 – 12,522
Debt securities* 137 32,711 2,649 35,497
Equity shares – 1,478 – 1,478
At 31 December 2006 137 46,711 2,649 49,497
* Amounts have been restated as explained in note 51 on page 154.
2007
Debt securities
Held-to-maturity$million
Available-for-sale$million
Loans and receivables
$million
Equity shares
$million
Treasury bills
$million Total
$million
Issued by public bodies:
Government securities 100 12,658 –
Other public sector securities – 1,008 –
100 13,666 –
Issued by banks:
Certificates of deposit – 6,248 2,175
Other debt securities – 12,904 18
19,152 2,193
Issued by corporate entities and other issuers:
Other debt securities – 5,280 526
Total debt securities 100 38,098 2,719
Listed on a recognised UK exchange – 3,663 – 58 – 3,721
Listed elsewhere 77 16,060 – 1,842 6,346 24,325
Unlisted 23 18,375 2,719 790 5,321 27,228
100 38,098 2,719 2,690 11,667 55,274
Market value of listed securities 75 19,723 – 1,900 6,346 28,044

Standard Chartered Annual Report and Accounts 2007Standard Chartered Annual Report and Accounts 2007
Notes to the Accounts continued
1116
22. Investment Securities continued
2006
Debt securities
Held-to-maturity$million
Available-for-sale*$million
Loans and receivables
$million
Equity shares
$million
Treasury bills
$million Total
$million
Issued by public bodies:
Government securities 137 10,379 –
Other public sector securities – 1,403 –
137 11,782 –
Issued by banks:
Certificates of deposit – 8,433 2,280
Other debt securities – 9,505 178
– 17,938 2,458
Issued by corporate entities and other issuers:
Other debt securities – 2,991 191
Total debt securities 137 32,711 2,649
Listed on a recognised UK exchange – 6,679 – 38 – 6,717
Listed elsewhere 113 10,183 132 795 7,027 18,250
Unlisted 24 15,849 2,517 645 5,495 24,530
137 32,711 2,649 1,478 12,522 49,497
Market value of listed securities 109 16,862 130 833 7,027 24,961
* Amounts have been restated as explained in note 51 on page 154.
Equity shares largely comprise investments in corporates.
The change in the carrying amount of investment securities comprised:
2007 2006
Debt securities
$million
Equityshares
$million
Treasury bills
$million Total
$million
Debt securities*
$million
Equity shares
$million
Treasury bills
$million Total
$million
At 1 January 35,497 1,478 12,522 49,497 26,710 954 10,199 37,863
Exchange translation differences 846 20 171 1,037 949 9 528 1,486
Acquisitions – – – – 1,155 21 842 2,018
Additions 53,574 1,248 23,470 78,292 47,411 328 23,376 71,115
Maturities and disposals (48,850) (970) (24,637) (74,457) (40,909) (337) (22,650) (63,896)
Provisions (45) (3) (2) (50) (6) (4) (16) (26)
Changes in fair value (including the effect of fair value hedging) (205) 920 (19) 696 142 510 28 680
Amortisation of discounts and premiums 100 (3) 162 259 45 (3) 215 257
At 31 December 40,917 2,690 11,667 55,274 35,497 1,478 12,522 49,497
* Amounts have been restated as explained in note 51 on page 154.
Treasury bills and other eligible bills include $492 million (2006: $393 million) of bills sold subject to sale and repurchase transactions. Debt securities include $1,958 million (2006: $896 million) of securities sold subject to sale and repurchase transactions.
At 31 December 2007, unamortised premiums on debt securities held for investment purposes amounted to $46 million (2006: $39 million) and unamortised discounts amounted to $186 million (2006: $112 million).
Income from listed equity shares amounted to $9 million (2006: $4 million) and income from unlisted equity shares amounted to $270 million (2006: $73 million).

www.standardchartered.com
Fin
an
cia
l S
tate
men
ts a
nd
No
tes t
o t
he A
cco
un
ts
1117
22. Investment Securities continued
The change in impairment provisions is as follows:
2007 2006
Debt securities
$million
Equity shares
$million
Treasury bills
$million Total
$million
Debt securities
$million
Equity shares
$million
Treasury bills
$million Total
$million
At 1 January 9 23 10 42 4 30 16 50
Exchange translation differences – 1 (10) (9) – 1 (15) (14)
Amounts written off – (5) – (5) (1) (12) (7) (20)
New provisions* 45 3 2 50 6 4 16 26
At 31 December 54 22 2 78 9 23 10 42
* Of the new provisions raised of $50 million (2006: $26 million), $10 million (2006: $6 million) relates to debt securities classified as loans and receivables and is
included with impairment losses on loans and advances and other credit provisions, with the balance reported within ‘Other Impairments’.
23. Investments in Subsidiary Undertakings, Joint Ventures and Associates
Investment in subsidiary undertakings 2007
$million 2006
$million
At 1 January 2007 9,656 7,973
Additions 750 2,683
Redemption of capital – (1,000)
At 31 December 2007 10,406 9,656
At 31 December 2007, the principal subsidiary undertakings, all indirectly held and principally engaged in the business of banking and provision of other financial services, were as follows:
Country and place of incorporation or registration Main areas of operation
Group interest in ordinary share
capital
Standard Chartered Bank, England and Wales United Kingdom, Middle East, South Asia, Asia Pacific, Americas and, through Group companies, Africa
100%
Standard Chartered First Bank Korea Limited, Korea Korea 100%
Standard Chartered Bank Malaysia Berhad, Malaysia Malaysia 100%
Standard Chartered Bank (Pakistan) Limited, Pakistan Pakistan 99.0%
Standard Chartered Bank (Taiwan) Limited, Taiwan* Taiwan 100%
Standard Chartered Bank (Hong Kong) Limited, Hong Kong Hong Kong 100%
Standard Chartered Bank (China) Limited, China China 100%
Standard Chartered Bank (Thai) Public Company Limited, Thailand Thailand 99.97%
Standard Chartered Capital Management (Jersey) LLC, United States United States 100%
Standard Chartered Receivables (UK) Limited, England and Wales United Kingdom 100%
Standard Chartered Financial Investments Limited, England and Wales United Kingdom 100%
Standard Chartered Debt Trading Limited, England and Wales Hong Kong 100%
* Formerly Hsinchu International Bank.
Details of all Group companies will be filed with the next annual return of the Company.
Joint venture The Group has a 44.51 per cent interest through a joint venture company which holds a majority investment in PT Bank Permata Tbk (‘Permata’), in Indonesia. The Group proportionately consolidates its share of the assets, liabilities, income and expense of Permata on a line by line basis.
Contingent liabilities set out in note 45, include $72 million (2006: $24 million) relating to this joint venture arrangement.
These mainly comprise banking guarantees and irrevocable letters of credit.
There are no capital commitments related to the Group’s investment in Permata.
Related party transactions are disclosed in note 52.
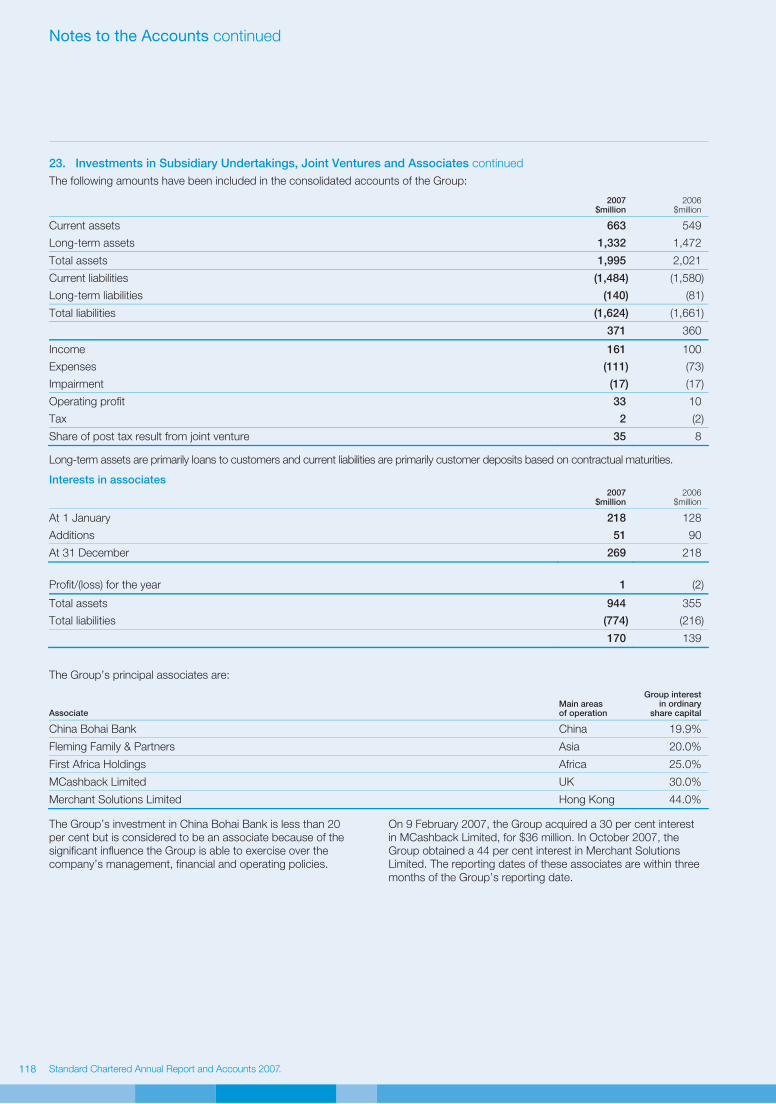
Standard Chartered Annual Report and Accounts 2007Standard Chartered Annual Report and Accounts 2007
Notes to the Accounts continued
1118
23. Investments in Subsidiary Undertakings, Joint Ventures and Associates continued
The following amounts have been included in the consolidated accounts of the Group:
2007 $million
2006$million
Current assets 663 549
Long-term assets 1,332 1,472
Total assets 1,995 2,021
Current liabilities (1,484) (1,580)
Long-term liabilities (140) (81)
Total liabilities (1,624) (1,661)
371 360
Income 161 100
Expenses (111) (73)
Impairment (17) (17)
Operating profit 33 10
Tax 2 (2)
Share of post tax result from joint venture 35 8
Long-term assets are primarily loans to customers and current liabilities are primarily customer deposits based on contractual maturities.
Interests in associates
2007 $million
2006$million
At 1 January 218 128
Additions 51 90
At 31 December 269 218
Profit/(loss) for the year 1 (2)
Total assets 944 355
Total liabilities (774) (216)
170 139
The Group’s principal associates are:
Associate Main areas of operation
Group interest in ordinary
share capital
China Bohai Bank China 19.9%
Fleming Family & Partners Asia 20.0%
First Africa Holdings Africa 25.0%
MCashback Limited UK 30.0%
Merchant Solutions Limited Hong Kong 44.0% The Group’s investment in China Bohai Bank is less than 20 per cent but is considered to be an associate because of the significant influence the Group is able to exercise over the company’s management, financial and operating policies.
On 9 February 2007, the Group acquired a 30 per cent interest in MCashback Limited, for $36 million. In October 2007, the Group obtained a 44 per cent interest in Merchant Solutions Limited. The reporting dates of these associates are within three months of the Group’s reporting date.

www.standardchartered.com
Fin
an
cia
l S
tate
men
ts a
nd
No
tes t
o t
he A
cco
un
ts
1119
24. Business Combinations
2007 acquisitions On 5 October 2007, the Group acquired 100 per cent of the share capital of Pembroke Group Limited, an aircraft leasing, financing and management company. On 3 December 2007, the Group acquired 100 per cent of the share capital of Harrison Lovegrove & Co Limited, an oil and gas advisory boutique company. On 5 December 2007, the Group acquired 80 per cent of A Brain Limited, a Korean fund administration company. None of these acquisitions were individually material.
The acquired businesses contributed operating income of $7 million and loss before tax of $2 million to the Group from the date of their acquisition to 31 December 2007.
If the acquisition had occurred on 1 January 2007, the operating income of the Group would have been approximately $11,132 million and profit before taxation would have been approximately $4,043 million.
During 2007, the Group acquired the remaining minority interest of Hsinchu for a consideration of $43 million and generated additional goodwill of $34 million.
$million
Details of net assets acquired and goodwill are as follows:
Purchase consideration:
– cash paid 151
– loan notes issued 5
– deferred consideration 65
– direct costs relating to the acquisitions 3
Total purchase consideration 224
Fair value of net assets acquired 187
Goodwill 37 Deferred consideration is payable between 6 months and 36 months after the date of acquisition.
Goodwill arising on these acquisitions is attributable to the synergies expected to arise and to the value of the workforce in place which is not recognised separately.
The assets and liabilities arising from the acquisitions are as follows:
Fair value $million
Acquiree’scarryingamount$million
Cash and balances at central banks* 66 66
Loans and advances to customers 2 2
Intangibles other than goodwill 63 –
Property, plant and equipment 189 152
Deferred tax assets 4 4
Other assets 28 28
Total assets 352 252
Other liabilities 162 162
Total liabilities 162 162
Minority interest 3 –
Net assets acquired 187 90
Purchase consideration settled in cash 151
Cash and cash equivalents in subsidiaries acquired (66)
Cash outflow on acquisition 85
* Cash and balances at central banks include amounts subject to regulatory restrictions.
The fair value amounts contain some provisional balances which will be finalised within 12 months of the acquisition date.
The intangible assets acquired as part of the acquisitions can be analysed as follows:
$million
Brand names 6
Customer relationships 55
Capitalised software 2
Total 63

Standard Chartered Annual Report and Accounts 2007Standard Chartered Annual Report and Accounts 2007
Notes to the Accounts continued
1120
24. Business Combinations continued
2006 acquisitionsOn 5 September 2006, the Group acquired 95.4 per cent of the share capital of Union, following which on 30 December 2006, the business and assets of the Standard Chartered Bank branch in Pakistan was transferred into a new entity, Standard Chartered (Pakistan) Limited, generating additional goodwill of $17 million and increasing the Group’s shareholding to 99 per cent.
On 19 October 2006, the Group acquired a controlling interest of 95.4 per cent of the share capital of Hsinchu. Subsequent to this, the Group acquired a further 0.8 per cent of Hsinchu through share purchase to take its overall share to 96.2 per cent at 31 December 2006.
The assets and liabilities arising from the acquisitions are as follows:
Union Hsinchu
Fair value*
$million
Acquiree’scarryingamount$million
Fair value* $million
Acquiree’scarryingamount$million
Cash and balances at central banks 148 148 481 481
Financial assets held at fair value through profit or loss – – 563 563
Loans and advances to banks 104 104 440 440
Loans and advances to customers 1,118 1,206 9,225 9,352
Investment securities 404 411 1,614 1,609
Intangibles other than goodwill 55 3 122 –
Property, plant and equipment 44 28 287 307
Deferred tax assets 43 1 162 151
Other assets 48 61 212 213
Total assets 1,964 1,962 13,106 13,116
Deposits by banks 425 425 988 988
Customer accounts 1,320 1,309 10,709 10,709
Debt securities in issue – – 532 532
Other liabilities 97 96 48 41
Retirement benefit obligations – – 116 27
Subordinated liabilities and other borrowed funds 40 41 545 545
Total liabilities 1,882 1,871 12,938 12,842
Minority interest 7 7 8 10
Net assets acquired 75 84 160 264
Purchase consideration settled in cash 489 1,201
Cash and cash equivalents in subsidiary acquired (164) (589)
Cash outflow on acquisition 325 612
Total purchase consideration 489 1,201
Fair value of net assets acquired 75 160
Goodwill 414 1,041
Intangible assets acquired:
Brand names 6 24
Customer relationships 13 43
Core deposits 33 55
Capitalised software 3 –
Total 55 122
* During 2007 certain of the provisionally determined fair value amounts have been finalised and in accordance with IFRS 3 Business Combinations, the
adjustments have been made as at the date of acquisition and the 2006 balance sheet amounts restated. Details of these adjustments are explained in note 51.
Goodwill arising on the acquisitions of Union and Hsinchu is attributable to the significant synergies expected to arise from their development within the Group and to those intangibles
which are not recognised separately, such as the branch networks and, for Hsinchu, a workforce in place with Mandarin speaking capabilities.
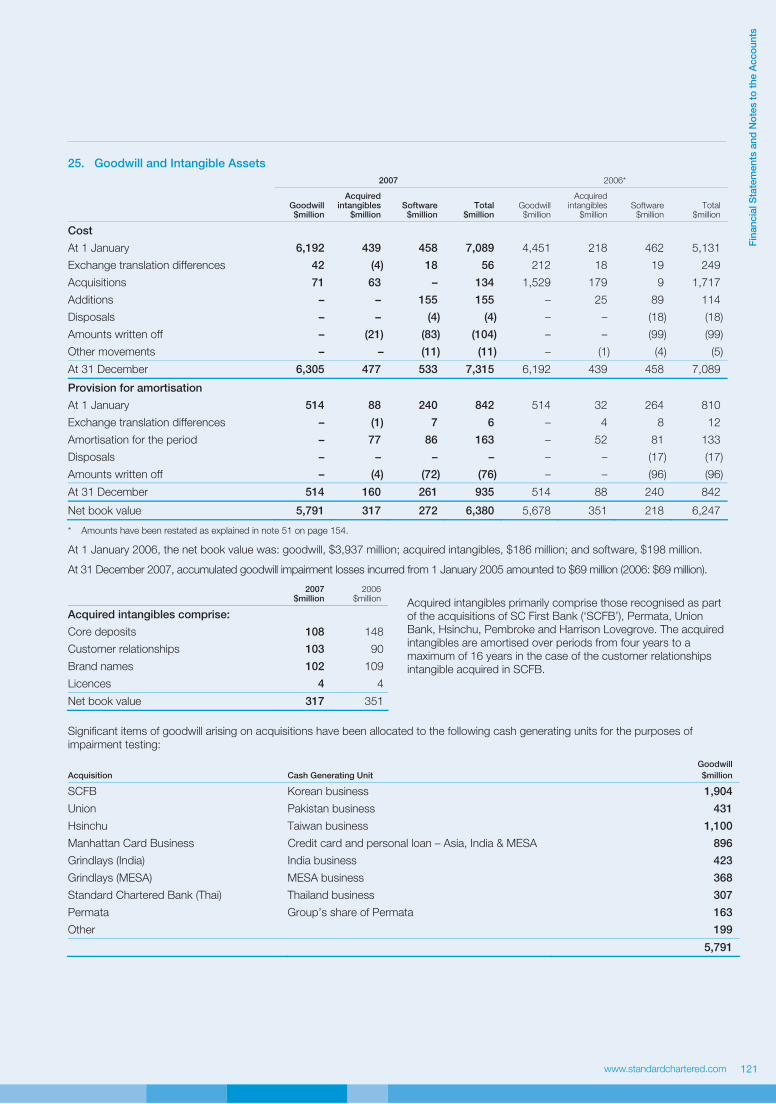
www.standardchartered.com
Fin
an
cia
l S
tate
men
ts a
nd
No
tes t
o t
he A
cco
un
ts
1121
25. Goodwill and Intangible Assets
2007 2006*
Goodwill$million
Acquiredintangibles
$million Software
$million
Total$million
Goodwill$million
Acquired intangibles
$million Software
$million
Total$million
Cost
At 1 January 6,192 439 458 7,089 4,451 218 462 5,131
Exchange translation differences 42 (4) 18 56 212 18 19 249
Acquisitions 71 63 – 134 1,529 179 9 1,717
Additions – – 155 155 – 25 89 114
Disposals – – (4) (4) – – (18) (18)
Amounts written off – (21) (83) (104) – – (99) (99)
Other movements – – (11) (11) – (1) (4) (5)
At 31 December 6,305 477 533 7,315 6,192 439 458 7,089
Provision for amortisation
At 1 January 514 88 240 842 514 32 264 810
Exchange translation differences – (1) 7 6 – 4 8 12
Amortisation for the period – 77 86 163 – 52 81 133
Disposals – – – – – – (17) (17)
Amounts written off – (4) (72) (76) – – (96) (96)
At 31 December 514 160 261 935 514 88 240 842
Net book value 5,791 317 272 6,380 5,678 351 218 6,247
* Amounts have been restated as explained in note 51 on page 154.
At 1 January 2006, the net book value was: goodwill, $3,937 million; acquired intangibles, $186 million; and software, $198 million.
At 31 December 2007, accumulated goodwill impairment losses incurred from 1 January 2005 amounted to $69 million (2006: $69 million).
2007$million
2006$million
Acquired intangibles comprise:
Core deposits 108 148
Customer relationships 103 90
Brand names 102 109
Licences 4 4
Net book value 317 351
Acquired intangibles primarily comprise those recognised as part of the acquisitions of SC First Bank (‘SCFB’), Permata, Union Bank, Hsinchu, Pembroke and Harrison Lovegrove. The acquired intangibles are amortised over periods from four years to a maximum of 16 years in the case of the customer relationships intangible acquired in SCFB.
Significant items of goodwill arising on acquisitions have been allocated to the following cash generating units for the purposes of impairment testing:
Acquisition Cash Generating Unit
Goodwill
$million
SCFB Korean business 1,904
Union Pakistan business 431
Hsinchu Taiwan business 1,100
Manhattan Card Business Credit card and personal loan – Asia, India & MESA 896
Grindlays (India) India business 423
Grindlays (MESA) MESA business 368
Standard Chartered Bank (Thai) Thailand business 307
Permata Group’s share of Permata 163
Other 199
5,791

Standard Chartered Annual Report and Accounts 2007Standard Chartered Annual Report and Accounts 2007
Notes to the Accounts continued
1122
25. Goodwill and Intangible Assets continued
All recoverable amounts were measured based on value in use. The key assumptions and approach to determining value in use calculations, as set out below, are solely estimates for the purposes of assessing impairment on acquired goodwill. The calculation for each unit uses cash flow projections based on budgets and forecasts approved by management covering one year, except for Permata (five years). These are then extrapolated for periods of up to a further 19 years using steady long-term forecast GDP growth rates and a terminal value determined based on long-term earning multiples. Where these rates are different from available market data on long-term rates, that fact is stated below. The cash flows are discounted using a pre-tax discount rate which reflects current market rates appropriate to the cash generating unit. Management believes that any reasonable possible change in the key assumptions on which the recoverable amounts have been based would not cause the carrying amounts to exceed their recoverable amount.
SCFB SCFB was acquired in April 2005 with initial goodwill recognised of $1,738 million. The business comprises Consumer and Wholesale Banking operations in Korea.
In assessing impairment of goodwill, the Group assumed that growth would increase at a steady rate of 4.2 per cent in line with the long-term forecast GDP growth of Korea. A pre-tax discount rate of 16.4 per cent was used.
Union Union was acquired in September 2006 with initial goodwill recognised of $414 million. Additional goodwill of $17 million arose as a result of a share swap. The business comprises Consumer and Wholesale Banking operations in Pakistan.
In assessing impairment of goodwill, the Group assumed that growth would increase at a steady rate of 7.4 per cent in line with the long-term forecast GDP growth of Pakistan. A pre-tax discount rate of 26.1 per cent was used.
Hsinchu Hsinchu was acquired in October 2006 with initial goodwill recognised of $1,041 million and a further $34 million in 2007. The business comprises Consumer and Wholesale Banking operations in Taiwan.
In assessing impairment of goodwill, the Group assumed that growth would increase at a steady rate of 4.5 per cent in line with the long-term forecast GDP growth of Taiwan. A pre-tax discount rate of 14.9 per cent was used.
Manhattan Card Business Manhattan Card Business was acquired in 2000 with initial goodwill recognised of $1,061 million. This was amortised to $892 million under UK GAAP until 31 December 2003. The
business comprises a credit card business and a personal loans business across Asia, India and MESA.
In assessing impairment of goodwill, the Group assumed that growth would increase at a steady rate of 3.8 per cent in line with the long-term forecast global GDP growth. A pre-tax discount rate of 13.0 per cent was used.
Grindlays (India) Grindlays (India) was acquired in 2000 with initial goodwill recognised of $446 million. This was amortised to $366 million under UK GAAP until 31 December 2003. It comprises Consumer and Wholesale Banking operations in India.
In assessing impairment of goodwill, the Group assumed that growth would increase at a steady rate of 7.1 per cent in line with the long-term forecast GDP growth of India. A pre-tax discount rate of 26.5 per cent was used.
Grindlays (MESA) Grindlays (MESA) was acquired in 2000 with initial goodwill recognised of $446 million. This was amortised to $366 million under UK GAAP until 31 December 2003. It comprises Consumer and Wholesale Banking operations in MESA.
In assessing impairment of goodwill, the Group assumed that growth would increase at a steady rate of 3.8 per cent in line with the long term forecast GDP growth of MESA. A pre-tax discount rate of 15.8 per cent was used.
Standard Chartered Bank (Thai) 75 per cent of Standard Chartered Bank (Thai) was acquired in 1999 with initial goodwill recognised of $222 million. This was amortised to $204 million under UK GAAP until 31 December 2003. In 2005 the Group acquired the remaining 25 per cent, increasing goodwill to $272 million. The business comprises Consumer and Wholesale Banking operations in Thailand.
In assessing impairment of goodwill, the Group assumed that growth would increase at a steady rate of 5.6 per cent in line with the long term forecast GDP growth of Thailand. A pre-tax discount rate of 19.5 per cent was used.
Permata 31.55 per cent of Permata was acquired in 2004 with initial goodwill recognised of $115 million. A further 12.96 per cent was acquired in September 2006 with goodwill of $57 million. This business comprises Consumer and Wholesale Banking operations in Indonesia.
In assessing impairment of goodwill, the Group assumed that growth would increase at a steady rate of 5.4 per cent in line with the long-term forecast GDP growth of Indonesia. A pre-tax discount rate of 25.9 per cent was used.

www.standardchartered.com
Fin
an
cia
l S
tate
men
ts a
nd
No
tes t
o t
he A
cco
un
ts
1123
26. Property, Plant and Equipment
2007 2006*
Premises
$million Equipment
$million Total
$million Premises
$million Equipment
$million Total
$million
Cost or valuation
At 1 January 2,184 509 2,693 1,694 414 2,108
Exchange translation differences 71 20 91 106 10 116
Additions 309 162 471 146 99 245
Acquisitions – 189 189 288 47 335
Disposals and fully depreciated assets written off (55) (55) (110) (47) (64) (111)
Reclassification** 202 (8) 194 (3) 3 –
At 31 December 2,711 817 3,528 2,184 509 2,693
Depreciation
Accumulated at 1 January 215 310 525 177 287 464
Exchange translation differences 5 17 22 6 7 13
Charge for the year 78 104 182 57 78 135
Attributable to assets sold or written off (37) (51) (88) (25) (62) (87)
Accumulated at 31 December 261 380 641 215 310 525
Net book amount at 31 December 2,450 437 2,887 1,969 199 2,168
* Amounts have been restated as explained in note 51 on page 154.
** Reclassified from other assets.
At 1 January 2006, the net book value was: premises, $1,517 million; and equipment, $127 million.
Assets held under finance leases have the following net book amount:
2007 2006
Premises$million
Equipment $million
Premises
$million
Equipment
$million
Cost 53 13 47 4
Aggregate depreciation (6) (5) (4) (2)
Net book amount 47 8 43 2
The Group’s premises leases include rent review periods, renewal terms and in some cases purchase options.
2007 $million
2006$million
Minimum lease payments under finance leases falling due:
Within one year 4 1
Later than one year and less than five years 8 2
12 3
Future finance charges on finance leases (2) –
Present value of finance lease liabilities 10 3
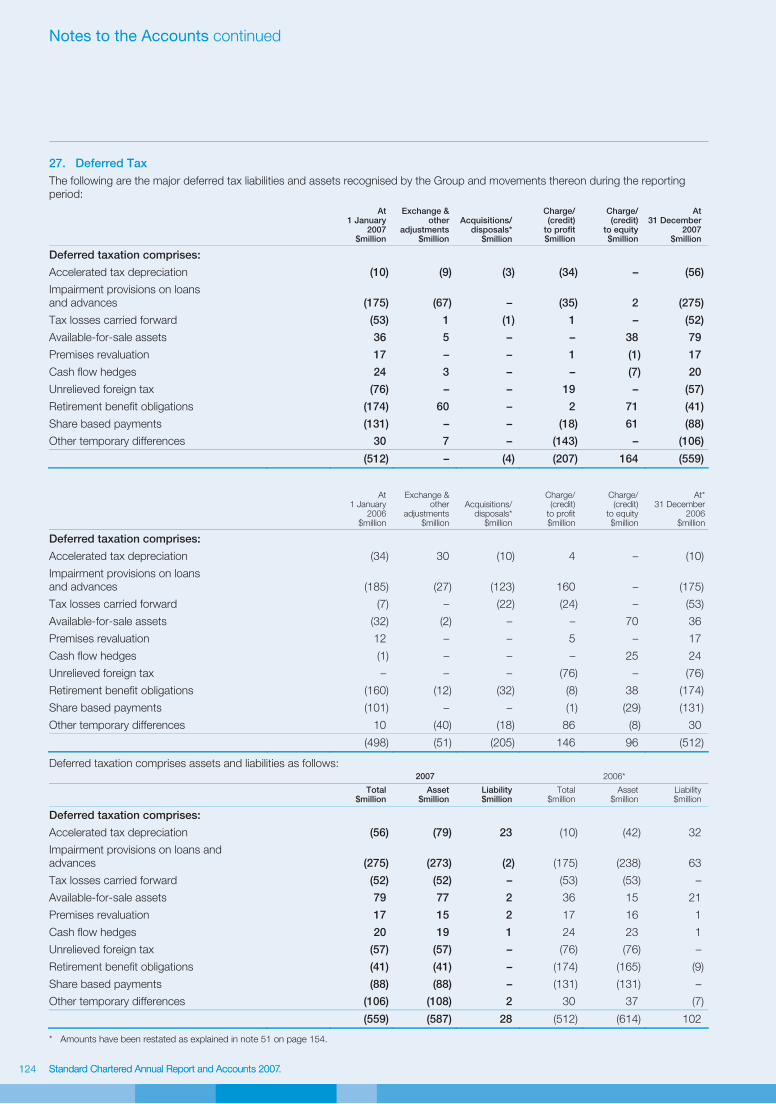
Standard Chartered Annual Report and Accounts 2007Standard Chartered Annual Report and Accounts 2007
Notes to the Accounts continued
1124
27. Deferred Tax
The following are the major deferred tax liabilities and assets recognised by the Group and movements thereon during the reporting period:
At 1 January
2007 $million
Exchange & other
adjustments$million
Acquisitions/disposals*
$million
Charge/ (credit)
to profit $million
Charge/ (credit)
to equity $million
At 31 December
2007 $million
Deferred taxation comprises:
Accelerated tax depreciation (10) (9) (3) (34) – (56)
Impairment provisions on loans and advances (175) (67) – (35) 2 (275)
Tax losses carried forward (53) 1 (1) 1 – (52)
Available-for-sale assets 36 5 – – 38 79
Premises revaluation 17 – – 1 (1) 17
Cash flow hedges 24 3 – – (7) 20
Unrelieved foreign tax (76) – – 19 – (57)
Retirement benefit obligations (174) 60 – 2 71 (41)
Share based payments (131) – – (18) 61 (88)
Other temporary differences 30 7 – (143) – (106)
(512) – (4) (207) 164 (559)
At 1 January
2006$million
Exchange & other
adjustments$million
Acquisitions/disposals*
$million
Charge/ (credit)
to profit $million
Charge/ (credit)
to equity $million
At*31 December
2006 $million
Deferred taxation comprises:
Accelerated tax depreciation (34) 30 (10) 4 – (10)
Impairment provisions on loans and advances (185) (27) (123) 160 – (175)
Tax losses carried forward (7) – (22) (24) – (53)
Available-for-sale assets (32) (2) – – 70 36
Premises revaluation 12 – – 5 – 17
Cash flow hedges (1) – – – 25 24
Unrelieved foreign tax – – – (76) – (76)
Retirement benefit obligations (160) (12) (32) (8) 38 (174)
Share based payments (101) – – (1) (29) (131)
Other temporary differences 10 (40) (18) 86 (8) 30
(498) (51) (205) 146 96 (512)
Deferred taxation comprises assets and liabilities as follows: 2007 2006*
Total$million
Asset$million
Liability$million
Total $million
Asset $million
Liability$million
Deferred taxation comprises:
Accelerated tax depreciation (56) (79) 23 (10) (42) 32
Impairment provisions on loans and advances (275) (273) (2) (175) (238) 63
Tax losses carried forward (52) (52) – (53) (53) –
Available-for-sale assets 79 77 2 36 15 21
Premises revaluation 17 15 2 17 16 1
Cash flow hedges 20 19 1 24 23 1
Unrelieved foreign tax (57) (57) – (76) (76) –
Retirement benefit obligations (41) (41) – (174) (165) (9)
Share based payments (88) (88) – (131) (131) –
Other temporary differences (106) (108) 2 30 37 (7)
(559) (587) 28 (512) (614) 102
* Amounts have been restated as explained in note 51 on page 154.

www.standardchartered.com
Fin
an
cia
l S
tate
men
ts a
nd
No
tes t
o t
he A
cco
un
ts
1125
27. Deferred Tax continued
2007$million
2006$million
No account has been taken of the following potential deferred taxation assets/(liabilities):
Unrelieved foreign tax 408 222
Unremitted earnings from overseas subsidiaries (369) (282)
Foreign exchange movements on investments in branches (136) (41)
Tax losses 56 34
28. Other Assets
2007 $million
2006$million
Hong Kong SAR Government certificates of indebtedness (note 34) 2,862 2,605
Other 8,149 5,996
11,011 8,601
The government of Hong Kong certificates of indebtedness are subordinated to the claims of other parties.
29. Deposits by Banks
2007 $million
2006$million
Deposits by banks 25,880 26,233
Deposits by banks included within:
Financial liabilities held at fair value through profit or loss (note 31) 2,705 1,889
28,585 28,122
30. Customer Accounts
2007 $million
2006$million
Customer accounts 179,760 147,382
Customer accounts included within:
Financial liabilities held at fair value through profit or loss (note 31) 2,836 1,906
182,596 149,288
Included in customer accounts were deposits of $2,805 million (2006: $1,724 million) held as collateral for irrevocable commitments under import letters of credit.

Standard Chartered Annual Report and Accounts 2007Standard Chartered Annual Report and Accounts 2007
Notes to the Accounts continued
1126
31. Financial Liabilities Held at Fair Value through Profit or Loss
2007
Trading$million
Designated at fair value
through profit or loss
$million Total
$million
Deposits by banks 2,532 173 2,705
Customer accounts 772 2,064 2,836
Debt securities in issue 2,665 2,351 5,016
Short positions 3,693 – 3,693
9,662 4,588 14,250
2006
Trading$million
Designated at fair value
through profit or loss
$million Total
$million
Deposits by banks 1,286 603 1,889
Customer accounts 485 1,421 1,906
Debt securities in issue 1,514 1,771 3,285
Short positions 2,889 – 2,889
6,174 3,795 9,969 The Group designates certain financial liabilities at fair value through profit or loss where either the liabilities:
• have fixed rates of interest and interest rate swaps or other interest rate derivatives have been entered into with the intention of significantly reducing interest rate risk; or
• are exposed to foreign currency risk and derivatives have been acquired with the intention of significantly reducing exposure to market changes; or
• have been acquired to fund trading asset portfolios or assets, or where the assets and liabilities are managed, and performance evaluated, on a fair value basis for a documented risk management or investment strategy.
Derivatives are recorded at fair value whereas non-trading financial liabilities (unless designated at fair value) are recorded at amortised cost. Designation of certain liabilities at fair value through profit or loss significantly reduces the accounting mismatch between fair value and amortised cost expense recognition (a criterion of IAS 39). The Group ensures the criteria under IAS 39 are met by matching the principal terms of
derivatives to the corresponding liabilities, either individually or on a portfolio basis.
The changes in fair value of both the underlying liabilities and derivatives are monitored in a similar manner to trading book portfolios.
The fair value loss on liabilities designated at fair value through profit or loss was $37.3 million for the year (2006: $31.2 million). Of this, a gain of $0.2 million (2006: loss of $3.7 million) relates to changes in credit risk. The cumulative fair value movement relating to changes in credit risk was a loss of $5.2 million (2006: a loss of $5.4 million).
As at 31 December 2007, the amount the Group is contractually obliged to pay at maturity to the holders of these obligations was $52 million (2006: $68 million) lower than the carrying amount at fair value.
The change in fair value attributable to credit risk was determined by comparing fair value movements in risk-free debt instruments with similar maturities, to the changes in fair value of liabilities designated at fair value through profit or loss.
32. Debt Securities in Issue
2007 2006
Certificates of deposit of $100,000
or more$million
Other debt securities
in issue$million
Total$million
Certificates of deposit of $100,000
or more$million
Other debt securities
in issue $million
Total$million
Debt securities in issue 8,502 18,635 27,137 10,939 12,575 23,514
Debt securities in issue included within:
Financial liabilities held at fair value through profit or loss (note 31) 951 4,065 5,016 1,154 2,131 3,285
9,453 22,700 32,153 12,093 14,706 26,799

www.standardchartered.com
Fin
an
cia
l S
tate
men
ts a
nd
No
tes t
o t
he A
cco
un
ts
1127
33. Structure of Deposits
The following tables set out the structure of the Group’s deposits by principal geographic areas as at 31 December 2007 and 31 December 2006:
2007
Asia Pacific
Hong Kong
$million Singapore
$million Malaysia$million
Korea$million
OtherAsia
Pacific$million
India$million
Middle East & Other
S Asia $million
Africa $million
Americas UK &
Europe$million
Total$million
Non-interest bearing current and demand accounts 3,838 2,310 639 91 1,818 2,569 2,915 1,768 1,189 17,137
Interest bearing current accounts and savings deposits 22,971 8,062 2,598 13,287 18,658 1,843 5,600 2,784 7,730 83,533
Time deposits 21,734 10,892 6,608 12,172 19,529 4,757 6,929 1,380 20,912 104,913
Other deposits 32 20 208 1,223 815 317 593 452 1,938 5,598
Total 48,575 21,284 10,053 26,773 40,820 9,486 16,037 6,384 31,769 211,181
Deposits by banks 1,128 1,548 883 6,964 5,464 585 2,039 568 9,406 28,585
Customer accounts 47,447 19,736 9,170 19,809 35,356 8,901 13,998 5,816 22,363 182,596
48,575 21,284 10,053 26,773 40,820 9,486 16,037 6,384 31,769 211,181
Debt securities in issue 545 2,065 792 19,701 2,830 1,556 22 141 4,501 32,153
Total 49,120 23,349 10,845 46,474 43,650 11,042 16,059 6,525 36,270 243,334
2006
Asia Pacific
Hong Kong
$million Singapore
$million Malaysia$million
Korea$million
OtherAsia
Pacific$million
India$million
Middle East & Other S Asia
$million Africa
$million
Americas UK &
Europe$million
Total$million
Non-interest bearing current and demand accounts 3,320 1,722 1,435 163 2,123 2,082 3,654 1,649 894 17,042
Interest bearing current accounts and savings deposits 16,904 4,821 1,002 15,274 16,545 1,456 2,985 1,585 5,529 66,101
Time deposits 18,961 9,754 5,211 16,682 12,293 4,073 6,901 1,575 13,574 89,024
Other deposits 14 7 750 1,756 1,507 241 568 140 260 5,243
Total 39,199 16,304 8,398 33,875 32,468 7,852 14,108 4,949 20,257 177,410
Deposits by banks 734 1,276 597 9,297 5,869 871 1,968 323 7,187 28,122
Customer accounts 38,465 15,028 7,801 24,578 26,599 6,981 12,140 4,626 13,070 149,288
39,199 16,304 8,398 33,875 32,468 7,852 14,108 4,949 20,257 177,410
Debt securities in issue 627 1,087 992 17,561 1,597 932 12 171 3,820 26,799
Total 39,826 17,391 9,390 51,436 34,065 8,784 14,120 5,120 24,077 204,209
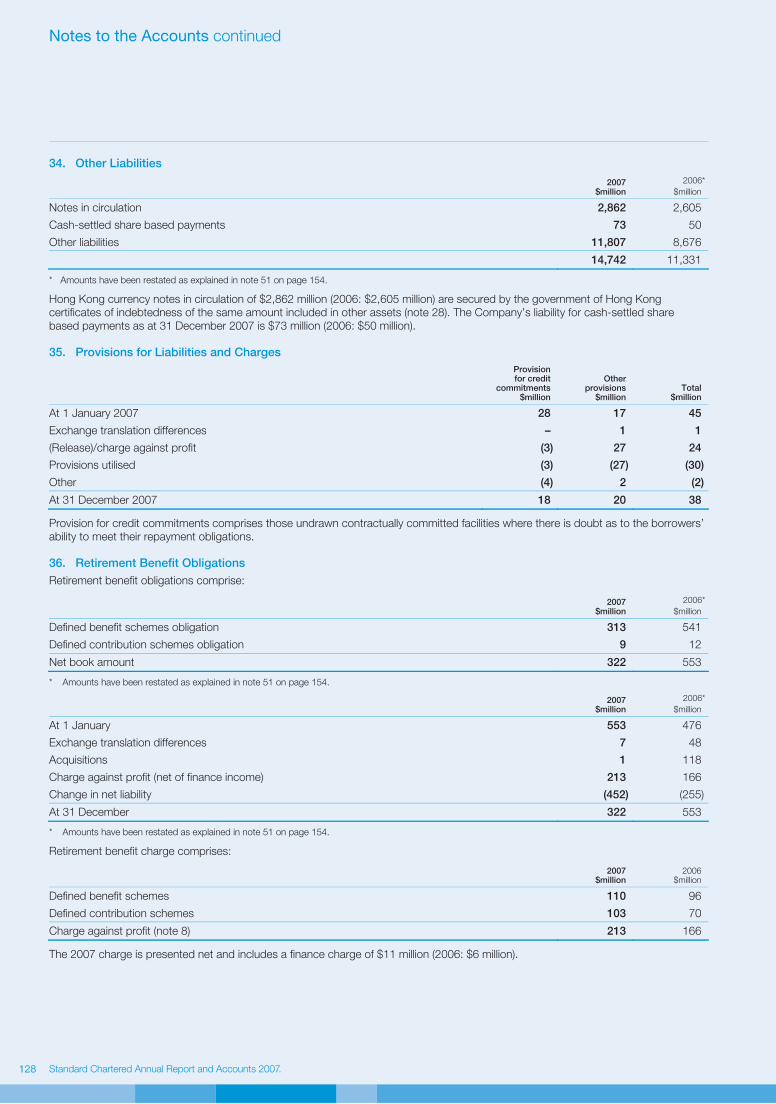
Standard Chartered Annual Report and Accounts 2007Standard Chartered Annual Report and Accounts 2007
Notes to the Accounts continued
1128
34. Other Liabilities
2007 $million
2006*
$million
Notes in circulation 2,862 2,605
Cash-settled share based payments 73 50
Other liabilities 11,807 8,676
14,742 11,331
* Amounts have been restated as explained in note 51 on page 154.
Hong Kong currency notes in circulation of $2,862 million (2006: $2,605 million) are secured by the government of Hong Kong certificates of indebtedness of the same amount included in other assets (note 28). The Company’s liability for cash-settled share based payments as at 31 December 2007 is $73 million (2006: $50 million).
35. Provisions for Liabilities and Charges
Provision for credit
commitments$million
Other provisions
$million Total
$million
At 1 January 2007 28 17 45
Exchange translation differences – 1 1
(Release)/charge against profit (3) 27 24
Provisions utilised (3) (27) (30)
Other (4) 2 (2)
At 31 December 2007 18 20 38
Provision for credit commitments comprises those undrawn contractually committed facilities where there is doubt as to the borrowers’ ability to meet their repayment obligations.
36. Retirement Benefit Obligations
Retirement benefit obligations comprise:
2007 $million
2006*
$million
Defined benefit schemes obligation 313 541
Defined contribution schemes obligation 9 12
Net book amount 322 553
* Amounts have been restated as explained in note 51 on page 154.
2007 $million
2006*
$million
At 1 January 553 476
Exchange translation differences 7 48
Acquisitions 1 118
Charge against profit (net of finance income) 213 166
Change in net liability (452) (255)
At 31 December 322 553
* Amounts have been restated as explained in note 51 on page 154.
Retirement benefit charge comprises:
2007 $million
2006$million
Defined benefit schemes 110 96
Defined contribution schemes 103 70
Charge against profit (note 8) 213 166
The 2007 charge is presented net and includes a finance charge of $11 million (2006: $6 million).

www.standardchartered.com
Fin
an
cia
l S
tate
men
ts a
nd
No
tes t
o t
he A
cco
un
ts
1129
36. Retirement Benefit Obligations continued
UK Fund The financial position of the Group’s principal retirement benefit scheme, the Standard Chartered Pension Fund (the ‘Fund’) (a defined benefit scheme), is assessed in the light of the advice of an independent qualified actuary. The most recent actuarial assessment of the Fund for the purpose of funding was performed
as at 31 December 2005 by M. Slack, Fellow of the Institute of Actuaries, of Lane, Clark and Peacock Actuaries, using the projected unit method. The assumptions having the most significant effect on the outcome of this valuation were:
Return from gilts 3.95 per cent per annum
Return from return seeking assets 5.70 per cent per annum
General increase in salaries 4.40 per cent per annum
Rate of price inflation 2.90 per cent per annum
Increase in pensions:
In deferment (where applicable) 2.90 per cent per annum
In payment* (pre April 1997 service) 2.70 per cent per annum
In payment (post April 1997 service) 2.20 - 2.90 per cent per annum
* Applies to discretionary increases and some guaranteed increases.
Applying these assumptions, at the valuation date the market value of the assets of the Fund ($1,772 million) was sufficient to cover 99.5 per cent of the benefits that had accrued to members. Additional contributions of $8.4 million were paid during 2007. Additional contributions of $5.6 million are payable in 2008 and $1.8 million in each of 2009 and 2010.
Contributions paid to the Fund during 2007 were $24 million (2006: $19 million) and regular contributions were set at 32.5 per cent of pensionable salary for all members. With effect from 1 July 1998 the Fund was closed to new entrants and new employees have subsequently been offered membership of a defined contribution scheme. Due to the closure of the Fund to new entrants, the current service cost will increase as a percentage of pensionable pay as the members approach retirement.
Pension costs for the purpose of these accounts were assessed using the projected unit method, and the assumptions set out below were based on market data at the date of calculation.
Overseas Schemes The principal overseas defined benefit arrangements operated by the Group are in Hong Kong, India, Jersey, Korea, Taiwan and the United States.
The disclosures required under IAS 19 have been calculated by qualified independent actuaries based on the most recent full actuarial valuations updated, where necessary, to 31 December 2007.
Separate figures are disclosed for the UK Fund, Overseas Funded Defined Benefit, Post-retirement Medical and Other Unfunded Schemes.
The financial assumptions used at 31 December 2007 were:
Funded Defined Benefit Schemes
UK Fund** Overseas Scheme*
2007%
2006 %
2007 %
2006%
Price inflation 3.20 3.00 1.50 - 4.50 1.50 - 4.50
Salary increases 4.70 4.50 3.50 - 6.00 3.25 - 5.50
Pension increases 3.10 2.90 0.00 - 3.10 0.00 - 2.90
Discount rate 5.90 5.20 2.50 - 8.00 2.25 - 8.00
Post-retirement medical trend rate N/A N/A N/A N/A
* The range of assumptions shown is for the main funded defined benefit overseas schemes in Hong Kong, India, Jersey, Korea, Taiwan and the United States.
These comprise over 90 per cent of the total liabilities of funded overseas schemes.
** The assumption for life expectancy for the UK fund assumes that a male member currently aged 60 will live for 27 years (2006: 26 years) and a female member
30 years (2006: 29 years) and a male member currently aged 40 will live for 28 years (2006: 27 years) and a female member 31 years (2006: 30 years) after their
60th birthday.

Standard Chartered Annual Report and Accounts 2007Standard Chartered Annual Report and Accounts 2007
Notes to the Accounts continued
1130 130
36. Retirement Benefit Obligations continued
Unfunded Schemes
Post-retirement Medical* Other
2007
% 2006
% 2007
% 2006
%
Price inflation 2.70 2.70 1.50 - 7.00 2.50 - 7.00
Salary increases 4.00 4.00 3.50 - 9.00 4.00 - 9.00
Pension increases N/A N/A 0.00 - 3.10 0.00 - 2.90
Discount rate 6.00 6.00 2.75 - 10.00 3.00 - 10.50
Post-retirement medical rate* 8% in 2007 reducing by
1% per annum to
5% in 2010
9% in 2006 reducing by
1% per annum to
5% in 2010
N/A N/A
* The Post-retirement Medical plan is in the United States.
The assets and liabilities of the schemes, attributable to defined benefit members, at 31 December 2007 were:
Funded Defined Benefit Schemes Unfunded Schemes
UK Fund Overseas Schemes Post-retirement Medical Other
At 31 December 2007
Expected return on assets %
Value$million
Expected return on assets %
Value$million
Expected return on assets %
Value $million
Expected return on assets %
Value$million
Equities 8.50 628 8.30 - 13.00 224 N/A N/A N/A N/A
Bonds 4.80 1,188 4.25 - 10.00 186 N/A N/A N/A N/A
Property N/A – 5.90 - 11.00 3 N/A N/A N/A N/A
Others 4.80 97 2.50 - 8.00 162 N/A N/A N/A N/A
Total market value of assets 1,913 575 N/A N/A
Present value of the schemes’ liabilities (1,931) (602) (11) (257)
Net pension liability (18) (27) (11) (257)
Funded Defined Benefit Schemes Unfunded Schemes
UK Fund Overseas Schemes Post-retirement Medical Other*
At 31 December 2006
Expected return on assets %
Value$million
Expected return on assets %
Value$million
Expected return on assets %
Value $million
Expected return on assets %
Value$million
Equities 7.50 570 8.00 - 14.00 210 N/A N/A N/A N/A
Bonds 4.50 1,144 4.25 - 8.00 155 N/A N/A N/A N/A
Property N/A – 7.00 - 12.00 3 N/A N/A N/A N/A
Others 4.50 108 2.50 - 5.10 149 N/A N/A N/A N/A
Total market value of assets 1,822 517 N/A N/A
Present value of the schemes’ liabilities* (1,982) (542) (9) (347)
Net pension liability (160) (25) (9) (347)
* Amounts have been restated as explained in note 51 on page 154.
Funded Defined Benefit Schemes Unfunded Schemes
UK Fund Overseas Schemes Post-retirement Medical Other
At 31 December 2005 Value
$million Value
$million Value
$million Value
$million
Total market value of assets 1,550 380 N/A N/A
Present value of the schemes’ liabilities (1,785) (403) (11) (196)
Net pension liability (235) (23) (11) (196)
At 31 December 2004
Total market value of assets 1,596 317 N/A N/A
Present value of the schemes’ liabilities (1,679) (338) (11) (45)
Net pension liability (83) (21) (11) (45)
The range of assumptions shown is for the main Overseas Schemes in Hong Kong, India, Jersey, Korea, Taiwan and the United States.
The expected return on plan assets is set by reference to historical returns in each of the main asset classes, current market indicators such as long term bond yields and the expected long term strategic asset allocation of each plan.

www.standardchartered.com
Fin
an
cia
l S
tate
men
ts a
nd
No
tes t
o t
he A
cco
un
ts
1131
36. Retirement Benefit Obligations continued
The pension cost for defined benefit schemes was:
Funded Defined Benefit Schemes Unfunded Schemes
Year ending 31 December 2007 UK Fund$million
Overseas Schemes
$million
Post- retirement
Medical $million
Other $million
Total$million
Current service cost 18 52 – 25 95
Past service cost 1 4 – 2 7
Gain on settlements and curtailments – – – (3) (3)
Expected return on pension scheme assets (100) (32) – – (132)
Interest on pension scheme liabilities 100 24 1 18 143
Total charge to profit before deduction of tax 19 48 1 42 110
Gain on assets in excess of expected return* (28) (2) – – (30)
Experience (gain)/loss on liabilities (113) 12 2 (108) (207)
Total (gain)/loss recognised directly in Statement of Recognised Income and Expense before tax (141) 10 2 (108) (237)
Deferred taxation 44 – – 27 71
Total (gain)/loss after tax (97) 10 2 (81) (166)
* The actual return on the UK fund assets was $128 million and on overseas scheme assets was $34 million.
The total cumulative amount recognised directly in the Statement of Recognised Income and Expense before tax to date is a gain of $186 million (2006: loss of $51 million).
Funded Defined Benefit Schemes Unfunded Schemes
Year ending 31 December 2006 UK Fund
$million
Overseas Schemes
$million
Post- retirement
Medical $million
Other $million
Total$million
Current service cost 21 42 – 17 80
Past service cost 9 1 – (1) 9
Loss on settlements and curtailments 1 – – – 1
Expected return on pension scheme assets (93) (23) – – (116)
Interest on pension scheme liabilities 92 19 1 10 122
Total charge to profit before deduction of tax 30 39 1 26 96
Gain on assets in excess of expected return* (23) (27) – – (50)
Experience (gain)/loss on liabilities (90) 20 (2) 18 (54)
Total (gain)/loss recognised directly in Statement of Recognised Income and Expense before tax (113) (7) (2) 18 (104)
Deferred taxation 34 3 – 1 38
Total (gain)/loss after tax (79) (4) (2) 19 (66)
* The actual return on the UK fund assets was $116 million and on overseas scheme assets was $50 million.

Standard Chartered Annual Report and Accounts 2007Standard Chartered Annual Report and Accounts 2007
Notes to the Accounts continued
1132 132
36. Retirement Benefit Obligations continued
Funded Defined Benefit Schemes Unfunded Schemes
Year ending 31 December 2005 UK Fund
$million
Overseas Schemes
$million
Post- retirement
Medical$million
Other $million
Total$million
Gain on assets in excess of expected return* (91) (20) – – (111)
Experience loss on liabilities 256 5 – – 261
Total loss/(gain) recognised directly in Statement of Recognised Income and Expense before tax 165 (15) – – 150
Deferred taxation (50) 5 – – (45)
Total loss/(gain) after tax 115 (10) – – 105
Year ending 31 December 2004
Gain on assets in excess of expected return** (20) (2) – – (22)
Experience gain on liabilities – (1) (1) – (2)
Loss/(gain) on change of assumptions 23 7 – (1) 29
Total loss/(gain) recognised directly in Statement of Recognised Income and Expense before tax 3 4 (1) (1) 5
Deferred taxation (1) – – – (1)
Total loss/(gain) after tax 2 4 (1) (1) 4
* The actual return on the UK fund assets was $184 million and on overseas scheme assets was $48 million.
** The actual return on the UK fund assets was $111 million and on overseas scheme assets was $31 million.
Movement in the pension schemes and post–retirement medical deficit during the year comprise:
Funded Defined Benefit Schemes Unfunded Schemes
Year ending 31 December 2007 UK Fund$million
Overseas Schemes
$million
Post- retirement
Medical$million
Other $million
Total$million
Deficit at 1 January 2007 (160) (25) (9) (347) (541)
Contributions 24 58 1 26 109
Current service cost (18) (52) – (25) (95)
Past service cost (1) (4) – (2) (7)
Settlement/curtailment costs – – – 3 3
Other finance income/(charge) – 8 (1) (18) (11)
Actuarial gain/(loss) 141 (10) (2) 108 237
Acquisitions – – – (1) (1)
Exchange rate adjustment (4) (2) – (1) (7)
Deficit at 31 December 2007 (18) (27) (11) (257) (313)

www.standardchartered.com
Fin
an
cia
l S
tate
men
ts a
nd
No
tes t
o t
he A
cco
un
ts
1133
36. Retirement Benefit Obligations continued
Funded Defined Benefit Schemes Unfunded Schemes
Year ending 31 December 2006 UK Fund
$million
Overseas Schemes
$million
Post- retirement
Medical $million
Other*
$million
Total*
$million
Deficit at 1 January 2006 (235) (23) (11) (196) (465)
Contributions 19 51 1 11 82
Current service cost (21) (42) – (17) (80)
Past service cost (9) (1) – 1 (9)
Settlement/curtailment costs (1) – – – (1)
Other finance income/(charge) 1 4 (1) (10) (6)
Actuarial gain/(loss) 113 7 2 (18) 104
Acquisitions – (25) – (93) (118)
Exchange rate adjustment (27) (3) – (18) (48)
Reclassifications – 7 – (7) –
Deficit at 31 December 2006 (160) (25) (9) (347) (541)
* Amounts have been restated as explained in note 51 on page 154.
Movement in the pension schemes and post–retirement medical gross assets and obligations during the year comprise:
Year ending 31 December 2007
Assets
$million Obligations
$million Total
$million
Deficit at 1 January 2007 2,339 (2,880) (541)
Contributions 109 – 109
Current service cost – (95) (95)
Past service cost – (7) (7)
Settlement/curtailment costs – 3 3
Interest cost – (143) (143)
Expected return on scheme assets 132 – 132
Benefits paid out (146) 146 –
Actuarial gain 30 207 237
Acquisitions – (1) (1)
Exchange rate adjustment 24 (31) (7)
Deficit at 31 December 2007 2,488 (2,801) (313)
Year ending 31 December 2006
Assets
$million
Obligations*
$million
Total*
$million
Deficit at 1 January 2006 1,930 (2,395) (465)
Contributions 82 – 82
Current service cost – (80) (80)
Past service cost – (9) (9)
Settlement/curtailment costs – (1) (1)
Interest cost – (122) (122)
Expected return on scheme assets 116 – 116
Benefits paid out (119) 119 –
Actuarial gain 50 54 104
Acquisitions 48 (166) (118)
Exchange rate adjustment 232 (280) (48)
Deficit at 31 December 2006 2,339 (2,880) (541)
* Amounts have been restated as explained in note 51 on page 154.

Standard Chartered Annual Report and Accounts 2007Standard Chartered Annual Report and Accounts 2007
Notes to the Accounts continued
1134 134
37. Subordinated Liabilities and Other Borrowed Funds
2007
$million 2006
$million
Subordinated loan capital – issued by subsidiary undertakings
£675 million 5.375 per cent undated step up Subordinated Notes (callable and floating rate from 2020) 1,276 1,252
£600 million 8.103 per cent Step-Up Callable Perpetual Trust Preferred Securities (callable 2016) 1,356 1,342
£300 million 6.0 per cent Subordinated debt 2018 610 –
£300 million 6.75 per cent Notes 2009 535 526
£200 million 7.75 per cent Notes (callable 2022) 454 454
£30 million Floating Rate Notes 2009 59 58
€750 million 3.625 per cent Subordinated Notes 2017 (Floating rate from 2012) 1,043 946
€700 million 5.875 per cent Subordinated debt 2017 1,013 –
€675 million Floating Rate Notes 2018 983 885
€600 million 5.375 per cent Notes 2009 783 710
€500 million 8.16 per cent non-cumulative Trust Preferred Securities (callable 2010) 734 674
$1 billion 6.4 per cent Subordinated debt 2017 1,042 –
$700 million 8.0 per cent Subordinated Notes 2031 753 724
$500 million Floating Rate Notes 2016 499 498
$500 million Floating Rate Notes 2015 499 499
$350 million 4.375 per cent Notes 2014 (Floating rate from 2009) 351 340
$300 million Floating Rate Note 2017 300 –
$154 million Subordinated debt 2013 147 148
$100 million Floating Rate Notes 2018 100 100
$92 million Subordinated debt 2013 92 92
BWP 75 million Subordinated debt 2017 13 –
BWP 75 million Floating Rate Notes 2012 12 13
BWP 50 million Fixed and Floating Rate Subordinated Notes 2015 8 8
HKD 670 million Floating Rate Notes 2014 86 80
HKD 500 million 3.5 per cent Notes 2014 (Floating rate from 2009) 64 63
IDR 500 billion Floating Rate Notes 2016 23 24
KRW 205 billion Subordinated debt 2009 214 218
KRW 160 billion Subordinated debt 2008 161 167
KRW 136 billion Subordinated debt 2007 – 146
KRW 104 billion Subordinated debt 2007 – 109
KRW 30 billion Subordinated debt 2011 32 32
KRW 27 billion Subordinated debt 2008 28 29
KRW 3 billion Subordinated debt 2011 3 3
MYR 500 million 4.28 per cent Subordinated Bonds 2017 151 –
PKR 1 billion Floating Rate Notes 2015 16 17
PKR 750 million Floating Rate Notes 2011 12 12
PKR 750 million Floating Rate Notes 2008 3 11
TWD 10 billion undated Floating Rate Notes 308 306
TWD 8 billion Floating Rate Notes 2007 – 246
TZS 8 billion Subordinated Notes 2015 7 6
13,770 10,738
Subordinated loan capital – issued by Company: Primary Capital Floating Rate Notes
$400 million 400 400
$300 million (Series 2) 300 300
$400 million (Series 3) 400 400
$200 million (Series 4) 200 200
£150 million 298 294
Other borrowings – issued by Company 372* 367*
1,970 1,961
Total for Group 15,740 12,699
Total for Company 1,987 1,977
* In the balance sheet of the Company the amount recognised is $389 million (2006: $383 million) with the difference being the effect of hedge accounting
achieved on a Group basis.

www.standardchartered.com
Fin
an
cia
l S
tate
men
ts a
nd
No
tes t
o t
he A
cco
un
ts
1135
37. Subordinated Liabilities and Other Borrowed Funds continued
All subordinated liabilities described above are unsecured, unguaranteed and subordinated to the claims of other creditors including without limitation, customer deposits and deposits by banks. The Group has the right to settle these debt instruments in certain circumstances as set out in the contractual agreements.
Of the total subordinated liabilities and other borrowings, $10,166 million is at fixed interest rates (2006: $5,118 million).
On 12 April 2007, Standard Chartered Bank (Hong Kong) Limited issued Lower Tier 2 capital in the form of $300 million Floating Rate Notes, which have a maturity of 10 years, with an issuer’s call option after five years.
On 26 April 2007, the Group issued £300 million Lower Tier 2 Step-Up Dated Subordinated notes, which have a maturity of 11 years, with an issuer’s call option after six years.
On 26 September 2007, the Group issued $1,000 million Lower Tier 2 Notes with a coupon of 6.4 per cent maturing September 2017, and €700 million Lower Tier 2 Notes with a coupon of 5.875 per cent, maturing September 2017.
On 15 November 2007 Standard Chartered Bank Malaysia Berhad issued MYR500 million Lower Tier 2 Subordinated Unsecured Floating Rate Notes due 2017, with an issuer’s call option after five years.
On 27 November 2007, Standard Chartered Bank Botswana Limited issued BWP75 million Subordinated Unsecured Floating Rate Notes due 2017, with an issuer’s call option after five years.
38. Share Capital
The authorised share capital of the Company at 31 December 2007 was $5,269 million (2006: $5,113 million) made up of 2,632 million ordinary shares of $0.50 each, 500 million non-cumulative irredeemable preference shares of £1 each, 300 million non-cumulative redeemable preference shares of $5 each and one million non-cumulative redeemable preference share of €1,000 each.
The available profits of the Company are distributed to the holders of the issued preference shares in priority to payments made to holders of the ordinary shares and in priority to, or pari passu with, any payments to the holders of any other class of shares in issue. On a winding up, the assets of the Company are applied to the holders of the preference shares in priority to any payment to the ordinary shareholders and in priority to, or pari passu with, the holders of any other shares in issue, for an amount equal to any
dividends accrued and/or payable and the nominal value of the shares together with any premium as determined by the Board. The redeemable preference shares are redeemable at the paid up amount (which includes premium) at the option of the Company in accordance with the terms of the shares. The holders of the preference shares are not entitled to attend or vote at any general meeting except where any relevant dividend due is not paid in full or where a resolution is proposed varying the rights of the preference shares.
As at 31 December 2007, 15,000 $5 non-cumulative redeemable preference shares were in issue. The irredeemable preference shares of £1 each are classified as other borrowed funds as required by IAS 32.
Group and Company
Number ofordinary shares
(millions)
Ordinary share capital
$million
Preference share capital
$million Total
$million
At 1 January 2006 1,316 658 2 660
Capitalised on scrip dividend 15 7 – 7
Shares repurchased – – (2) (2)
Shares issued 53 27 – 27
At 31 December 2006 1,384 692 – 692
Capitalised on scrip dividend 16 8 – 8
Shares issued 10 5 – 5
At 31 December 2007 1,410 705 – 705 On 12 January 2006, the Company issued 3,401,290 new ordinary shares at an average price of 1301 pence per share representing approximately 0.3 per cent of the Company’s existing issued ordinary share capital. The middle market price on 12 January 2006 was 1323 pence. The issue of ordinary shares was used to acquire 20 per cent of Fleming Family & Partners Limited.
On 2 October 2006, the Company repurchased the remaining 328,388 8.9 per cent non-cumulative preference shares. The preference shares were repurchased at a premium of $326 million and were cancelled.
On 4 October 2006, the Company issued 48,500,000 ordinary shares of $0.50 each at a placing price of 1375 pence per share representing approximately 3.7 per cent of the Company’s existing issued ordinary share capital. The middle market price on 4 October 2006 was 1363 pence. The proceeds of the issue of ordinary shares was used to acquire Hsinchu. The placing used a cash box structure involving a Jersey subsidiary (‘JerseyCo’) which was 89 per cent owned by the Company prior to the
transaction. In return for an issue of shares by the Company to the placees, the net proceeds of the placing were paid to JerseyCo. Pursuant to the issue of those shares, the Company acquired the remaining share capital of JerseyCo, being all of its redeemable preference shares and the 11 per cent of the ordinary shares it did not own. Under this structure merger relief applies under Section 131 of the Companies Act 1985 which provides relief from the requirements under Section 130 of the Companies Act 1985 to create a share premium account. JerseyCo then redeemed its redeemable shares in exchange for the placing proceeds.
On 8 December 2006, the Company issued 7,500 non-cumulative redeemable preference shares of $5 each at a placing price of $100,000 each. The shares are redeemable at the option of the Company in accordance with the terms of the shares at their paid up amount (which includes premium) and have discretionary dividend payments and are accordingly classified as equity as required by IAS 32. The shares were issued to fund the continuing business of the Group.

Standard Chartered Annual Report and Accounts 2007Standard Chartered Annual Report and Accounts 2007
Notes to the Accounts continued
1136
38. Share Capital continued
On 10 May 2007, the Company issued 12,765,274 new ordinary shares instead of the 2006 final dividend. On 10 October 2007, the Company issued 3,163,466 new ordinary shares instead of the 2007 interim dividend.
On 25 May 2007, the Company issued 7,500 non-cumulative redeemable preference shares of $5 each at a placing price of $100,000 each. The shares are redeemable at the option of the Company in accordance with the terms of the shares at the paid up amount (which includes premium) and have discretionary
dividend payments and are accordingly classified as equity as required by IAS 32. The shares were issued to fund the continuing business of the Group.
During the year, 9,012,891 ordinary shares were issued under the Company’s employee share plans at prices between nil and 1064 pence.
The holding of Standard Chartered PLC shares for the beneficiaries of the Group’s share based award schemes is set out in note 39.
39. Reserves
Group
Share premium account* $million
Capitalreserve$million
Capital redemption
reserve$million
Mergerreserve$million
Available- for-sale reserve$million
Cash flow hedge
reserve$million
Translation reserve $million
Retainedearnings$million
Total $million
At 1 January 2006 3,034 5 11 1,944 23 (20) 6 6,219 11,222
Recognised income and expense – – – – 387 71 672 2,354 3,484
Capitalised on scrip dividend (7) – – – – – – – (7)
Shares issued, net of expenses 838 – – 1,205 – – – – 2,043
Shares repurchased* – – 2 – – – – (328) (326)
Net own shares adjustment – – – – – – – 149 149
Share option expense and related taxation – – – – – – – 115 115
Dividends, net of scrip – – – – – – – (519) (519)
At 31 December 2006 3,865 5 13 3,149 410 51 678 7,990 16,161
Recognised income and expense – – – – 340 6 303 3,010 3,659
Capitalised on scrip dividend (8) – – – – – – – (8)
Shares issued, net of expenses 856 – – – – – – – 856
Net own shares adjustment – – – – – – – 24 24
Share option expense and related taxation – – – – – – – 55 55
Dividends, net of scrip – – – – – – – (601) (601)
At 31 December 2007 4,713 5 13 3,149 750 57 981 10,478 20,146
* The premium paid on the 8.9 per cent non-cumulative preference shares redeemed in 2006 has been reclassified as a deduction from retained earnings rather
than a deduction from the share premium account. Subsequently it has been deemed not appropriate to apply the relief given in section 160(2) of the Companies
Act 1985 that allows a premium payable on redemption to be paid out of the proceeds of a fresh issue of shares made for the purpose of the redemption. This is
because the fresh issue of shares contemplated for the redemption was not complete at the date of the redemption.
Transaction costs relating to share issues deducted from reserves account total $5 million (2006: $20 million).
The cumulative amount of goodwill on the acquisition of subsidiary and associated undertakings written off against Group reserves since 1973 is $27 million (2006: $27 million).
Capital reserves represent the exchange difference on redenomination of share capital and share premium from sterling to US dollars in 2001.
Capital redemption reserve represents the nominal value of the repurchase of preference shares redeemed.
The merger reserve represents the premium arising on the shares issued to assist in the funding of certain of the Group’s acquisitions. The issues were made using a financing structure which required the Company to create a merger reserve under section 131 of the Companies Act 1985.
Available-for-sale reserve is the fair value movement of financial assets classified as available-for-sale. Gains and losses are deferred to this reserve until such time as the underlying asset is sold or matures.
Cash flow hedge reserve is the fair value movement of derivatives that meet the criteria of a cash flow hedge. Gains and losses are
deferred to this reserve until such time as the underlying hedged item affects profit and loss.
Translation reserve represents the cumulative foreign exchange gains and losses on translation of the net investment of the Group in foreign operations. Since 1 January 2004, gains and losses are deferred to this reserve until such time as the underlying foreign operation is disposed. Gains and losses arising from derivatives used as hedges of net investments are netted against the foreign exchange gains and losses on translation of the net investment of the foreign operations.
Retained earnings are the carried forward recognised income and expenses of the Group plus current period recognised income and expenses less dividend distribution, treasury shares and share option expenses.
A substantial part of the Group’s reserves are held in overseas subsidiary undertakings and branches, principally to support local operations or to comply with local regulations. The maintenance of local regulatory capital ratios could potentially restrict the amount of reserves which can be remitted. In addition, if these overseas reserves were to be remitted, further unprovided taxation liabilities might arise.

www.standardchartered.com
Fin
an
cia
l S
tate
men
ts a
nd
No
tes t
o t
he A
cco
un
ts
1137
39. Reserves continued
Shares of the Group held for the beneficiaries of the Group’s share based payment schemes Bedell Cristin Trustees Limited is trustee of both the 1995 Employees’ Share Ownership Plan Trust (‘the 1995 trust’), which is an employee benefit trust used in conjunction with some of the Group’s employee share schemes, and of the Standard Chartered 2004 Employee Benefit Trust (‘the 2004 trust’) which is an employee benefit trust used in conjunction with the Group’s deferred bonus plan. The trustee has agreed to satisfy a number of awards made under the employee share schemes and the deferred bonus plan through the relevant employee benefit trust. As part of these arrangements Group companies fund the trust, from time to time, to enable the trustee to acquire shares to satisfy these awards. All shares have been acquired through the London Stock Exchange.
During 2007, the 1995 trust acquired 190,600 shares at a market price of $5 million (2006: nil). At 31 December 2007, the 1995 trust held 261,495 (2006: 2,148,874) shares. The shares are held in a pool for the benefit of participants under the Group’s Restricted Share
Scheme, Supplementary Restricted Share Scheme, Performance Share Plan and Executive Share Option Schemes. The purchase of these shares has been fully funded by the Group.
During the current year the 2004 trust has acquired, at market value, 351,340 (2006: 301,952) shares of the Company for an aggregate price of $10 million (2006: $9 million), which are held in a pool for the benefit of participants under the Group’s deferred bonus plan. The purchase of these shares has been fully funded by the Group. At 31 December 2007, the 2004 trust held 377,270 (2006: 311,157) shares of the Company, of which none (2006: none) have vested unconditionally.
Own shares held total 638,765 at 31 December 2007 (2006: 2,460,031). The maximum number of shares held during the year was 2,526,144 (2006: 14,040,907). Except as disclosed above, neither the Company nor any of its subsidiaries has bought, sold or redeemed any securities of the Company listed on The Stock Exchange of Hong Kong Limited during the year ended 31 December 2007.
Company
Share premium account$million
Capitalreserve$million
Capital redemption
reserve$million
Merger reserve $million
Retained earnings$million
Total $million
At 1 January 2006 3,034 5 11 1,944 759 5,753
Recognised income and expenses – – – – 683 683
Capitalised on scrip dividend (7) – – – – (7)
Shares issued, net of expenses 838 – – 1,205 – 2,043
Net own shares adjustment – – – – 149 149
Shares repurchased* – – 2 – (328) (326)
Share option expense and related taxation – – – – 67 67
Dividends, net of scrip – – – – (519) (519)
At 31 December 2006 as revised 3,865 5 13 3,149 811 7,843
Recognised income and expenses – – – – 349 349
Capitalised on scrip dividend (8) – – – – (8)
Shares issued, net of expenses 856 – – – – 856
Shares repurchased – – – – – –
Net own shares adjustment – – – – 24 24
Share option expense and related taxation – – – – 78 78
Dividends, net of scrip – – – – (601) (601)
At 31 December 2007 4,713 5 13 3,149 661 8,541
* The premium paid on the 8.9 per cent non-cumulative preference shares redeemed in 2006 has been reclassified as a deduction from retained earnings rather
than a deduction from the share premium account. Subsequently it has been deemed not appropriate to apply the relief given in section 160(2) of the Companies
Act 1985 that allows a premium payable on redemption to be paid out of the proceeds of a fresh issue of shares made for the purpose of the redemption. This is
because the fresh issue of shares contemplated for the redemption was not complete at the date of the redemption.

Standard Chartered Annual Report and Accounts 2007Standard Chartered Annual Report and Accounts 2007
Notes to the Accounts continued
1138
40. Minority Interests
$300m 7.267% Hybrid Tier 1 Securities
$million
Other minority*
interests $million
Total$million
At 1 January 2006 336 115 451
Arising on acquisitions* – 15 15
Income/expenses in equity attributable to minority interests – 35 35
Other profits attributable to minority interests 19 57 76
Recognised income and expense 19 92 111
Distributions (22) (33) (55)
Other increases – 20 20
At 31 December 2006 333 209 542
Arising on acquisition – 3 3
Income/expenses in equity attributable to minority interests – 48 48
Other profits attributable to minority interests 19 129 148
Recognised income and expense 19 177 196
Distributions (22) (98) (120)
Reductions – (20) (20)
At 31 December 2007 330 271 601
* Amounts have been restated as explained in note 51 on page 154.
41. Share Based Payments The Group operates a number of share based payment schemes for its directors and employees.
The total charge for the year relating to employee share based payment plans was $117 million (2006: $96 million) of which $78 million (2006: $67 million) relates to equity-settled awards, and $39 million (2006: $29 million) relates to cash-settled awards. After deferred tax, the total charge to the income statement was $99 million (2006: $93 million).
1994 Executive Share Option Scheme (closed) No awards have been made under this scheme since August 1999 as the scheme was replaced by the 2000 Executive Share Option Scheme. Executive share options to purchase ordinary shares in the Company are exercisable after the third, but before the tenth anniversary of the date of grant. The exercise price is the share price at the date of grant and options can only be exercised if EPS increases by at least 15 per cent over three consecutive years.
2000 Executive Share Option Scheme The 2000 scheme is designed to be internationally competitive and focus executive directors and their senior management teams on delivering long-term performance. An EPS performance criterion must be met before options can be exercised.
Executive share options to purchase ordinary shares in the Company are exercisable after the third, but before the tenth, anniversary of the date of grant. The exercise price per share is the share price at the date of grant and options can only be exercised if a performance condition is satisfied.
2001 Performance Share Plan The Performance Share Plan is designed to be an intrinsic part of total remuneration for the Group’s executive directors and for a small number of the Group’s most senior executives. It is an internationally competitive long-term incentive plan that focuses executives on meeting and exceeding the long-term performance targets of the Group. The performance criteria which need to be met are set out in the Directors’ Remuneration Report on pages 75 to 76. Awards of nil price options to acquire shares are granted to the executives and will normally be exercisable between three and ten years after the date of grant if the individual is still employed by the Group. There is provision for earlier exercise in certain limited circumstances.
1997/2006 Restricted Share Scheme The Group operates a discretionary Restricted Share Scheme (‘RSS’) for high performing and high potential staff at any level of the organisation whom the Group wishes to motivate and retain. Except upon appointment when an executive director may be granted an award of restricted shares, the RSS is not applicable to executive directors, as it has no performance conditions attached to it. 50 per cent of the award vests two years after the date of grant and the balance after three years. The awards can be exercised within seven years of the grant date. The value of shares awarded in any year to any individual may not exceed two times their base salary.
2006 Supplementary Restricted Share Scheme In addition, the Group operates a Supplementary Restricted Share Scheme which can be used to defer part of an employee’s annual bonus in shares. The plan is principally used for employees in the global markets area and is similar to the RSS outlined above except for three important factors: executive directors are specifically prohibited from the plan; no new shares can be issued to satisfy awards; and there is no individual annual limit.
2004 Deferred Bonus Plan Under the 2004 Deferred Bonus Plan, shares are conditionally awarded instead of all or part of the executive directors’ and certain senior executives’ annual cash bonus. Further details are contained in the Directors’ Remuneration Report on pages 75 and 82.
All Employee Sharesave Schemes No awards have been made under the 1994 UK Sharesave and 1996 International Sharesave schemes since 2003, as these were replaced by the 2004 UK and International Sharesave schemes. Under these Sharesave schemes, employees have the choice of opening a three-year or five-year savings contract. Within a period of six months after the third or fifth anniversary, as appropriate, employees may purchase ordinary shares in the Company. The price at which they may purchase shares is at a discount of up to 20 per cent on the share price at the date of invitation. There are no performance conditions attached to options granted under all the employee sharesave schemes.
In some countries in which the Group operates, it is not possible to operate Sharesave schemes, typically because of securities law, regulatory or other similar restrictions. In these countries the Group offers an equivalent cash-based scheme to its employees.

www.standardchartered.com
Fin
an
cia
l S
tate
men
ts a
nd
No
tes t
o t
he A
cco
un
ts
1139
41. Share Based Payments continued
1994 Executive Share Option Scheme (‘1994 ESOS’) Awards made under this scheme are not subject to the valuation criteria of IFRS 2, as all awards are granted prior to 7 November 2002, and are all vested as at that date. A reconciliation of option movements over the year to 31 December 2007 and 2006 is shown below:
2007 2006
No. of shares
Weighted average
exercise price No. of shares
Weighted average
exercise price
Outstanding at 1 January 359,207 £8.18 1,114,542 £7.64
Lapsed (18,250) £8.09 (4,830) £7.29
Exercised (330,151) £8.26 (750,505) £7.39
Outstanding at 31 December 10,806 £6.20 359,207 £8.18
Exercisable at 31 December 10,806 £6.20 359,207 £8.18
2007 2006
Range of exercise price for options outstanding
Weighted average
exercise price
Weighted average
remaining contractual life
Weightedaverage
exercise price
Weightedaverage
remainingcontractual life
£6.20 £6.20 0.7 years – –
£6.20/£8.88 – – £8.18 1.1 years
The intrinsic value of vested 1994 ESOS cash-settled awards as at 31 December 2007 was $nil million (2006: $0.3 million).
The weighted average share price at the time the options were exercised during 2007 was £15.34 (2006: £14.20).
2000 Executive Share Option Scheme (‘2000 ESOS’) No share awards were granted during 2007 or 2006.
A reconciliation of option movements over the year to 31 December 2007 and 2006 is shown below:
2007 2006
No. of shares
Weighted average
exercise price No. of shares
Weighted average
exercise price
Outstanding at 1 January 14,974,196 £8.37 23,634,660 £8.08
Lapsed (282,650) £9.04 (204,514) £9.77
Exercised (6,116,337) £8.47 (8,455,950) £7.52
Outstanding at 31 December 8,575,209 £8.28 14,974,196 £8.37
Exercisable at 31 December 7,931,565 £8.16 8,758,519 £7.63
2007 2006
Range of exercise price for options outstanding
Weighted average
exercise price
Weighted average
remaining contractual life
Weightedaverage
exercise price
Weightedaverage
remainingcontractual life
£6.905/£10.395 £8.28 5.2 years £8.37 6.2 years
The intrinsic value of vested 2000 ESOS cash-settled awards as at 31 December 2007 was $9 million (2006: $6 million).
The weighted average share price at the time the options were exercised during 2007 was £14.36 (2006: £14.63).

Standard Chartered Annual Report and Accounts 2007Standard Chartered Annual Report and Accounts 2007
Notes to the Accounts continued
1140
41. Share Based Payments continued
2001 Performance Share Plan (‘2001 PSP’) Valuation For awards, the fair value is based on the market value less an adjustment to take into account the expected dividends over the vesting period.
2007 2006
Grant date 17 September 12 March 12 September 11 May 14 March
Share price at grant date £14.69 £14.51 £13.17 £14.60 £14.35
Vesting period (years) 3 3 3 3 3
Expected dividends (yield) (%) 2.9 2.8 3.2 3.0 3.0
Fair value (EPS) (£) 6.74 6.68 6.00 6.67 6.56
Fair value (TSR) (£) 2.92 2.89 2.60 2.89 2.84 The expected dividend yield is based on the historical dividend yield over the last three years or the three years prior to grant. The EPS and TSR fair value relates to the performance criteria to be satisfied as explained in the Directors’ Remuneration Report. The TSR fair value is derived by discounting 50 per cent of the award which is subject to the TSR condition by the loss of expected
dividends over the performance period, and the likelihood of meeting the TSR condition which is calculated by the area under the TSR vesting schedule curve. The EPS fair value is derived by discounting 50 per cent of the award by the loss of expected dividends over the performance period and is adjusted for actual performance as appropriate.
A reconciliation of option movements over the year to 31 December 2007 and 2006 is shown below:
2007 2006
No. of shares
Weighted average
exercise price No. of shares
Weighted average
exercise price
Outstanding at 1 January 4,976,599 – 3,919,726 –
Granted 2,487,273 – 2,125,493 –
Lapsed (490,718) – (101,878) –
Exercised (1,087,557) – (966,742) –
Outstanding at 31 December 5,885,597 – 4,976,599 –
Exercisable at 31 December 279,028 – 405,798 –
2007 2006
Range of exercise price for options outstanding
Weighted average
exercise price
Weighted average
remaining contractual life
Weighted average
exercise price
Weightedaverage
remainingcontractual life
n/a – 8.3 years – 8.3 years
The intrinsic value of vested 2001 cash-settled awards as at 31 December 2007 was $1 million (2006: $nil million).
The weighted average share price at the time the options were exercised during 2007 was £14.98 (2006: £14.69).
1997/2006 Restricted Share Scheme (‘1997/2006 RSS’) Valuation For awards, the fair value is based on the market value less an adjustment to take into account the expected dividends over the vesting period.
2007 2006
Grant date 17 September 12 March 12 September 11 May 14 March
Share price at grant date £14.69 £14.51 £13.17 £14.60 £14.35
Vesting period (years) 2/3 2/3 2/3 2/3 2/3
Expected dividends (yield) (%) 2.9 2.8 3.2 3.0 3.0
Fair value (£) 13.49 13.36 12.00 13.34 13.12
The expected dividend yield is based on the historical dividend yield over the last three years or the three years prior to grant.

www.standardchartered.com
Fin
an
cia
l S
tate
men
ts a
nd
No
tes t
o t
he A
cco
un
ts
1141
41. Share Based Payments continued
A reconciliation of option movements over the year to 31 December 2007 and 2006 is shown below:
2007 2006
No. of shares
Weighted average
exercise price No. of shares
Weighted average
exercise price
Outstanding at 1 January 6,298,386 – 6,410,044 –
Granted 2,546,148 – 1,691,508 –
Lapsed (689,603) – (312,453) –
Exercised (1,879,033) – (1,490,713) –
Outstanding at 31 December 6,275,898 – 6,298,386 –
Exercisable at 31 December 1,597,255 – 1,330,250 –
The weighted average share price at the time the options were exercised during 2007 was £15.42 (2006: £14.35).
2007 2006
Range of exercise price for options outstanding
Weighted average
exercise price
Weighted average
remaining contractual life
Weightedaverage
exercise price
Weightedaverage
remainingcontractual life
n/a – 4.3 years – 4.9 years
The intrinsic value of vested 1997/2006 RSS cash-settled awards as at 31 December 2007 was $9 million (2006: $5 million).
2006 Supplementary Restricted Share Scheme (‘2006 SRSS’) Valuation The first awards under this scheme were made on 12 March 2007.
For awards, the fair value is based on the market value less an adjustment to take into account the expected dividends over the vesting period.
2007
Grant date 17 September 12 March
Share price at grant date £14.69 £14.51
Vesting period (years) 2/3 2/3
Expected dividends (yield) (%) 2.9 2.8
Fair value (£) 13.49 13.36
The expected dividend yield is based on the historical dividend yield over the last three years or the three years prior to grant.
A reconciliation of option movements over the year to 31 December 2007 is shown below:
2007
No. of shares
Weighted average
exercise price
Outstanding at 1 January – –
Granted 187,602 –
Lapsed – –
Exercised – –
Outstanding at 31 December 187,602 –
Exercisable at 31 December – –
2007
Range of exercise price for options outstanding
Weighted average
exercise price
Weighted average
remainingcontractual life
n/a – 6.5 years
There are no vested 2006 SRSS cash-settled awards as at 31 December 2007.
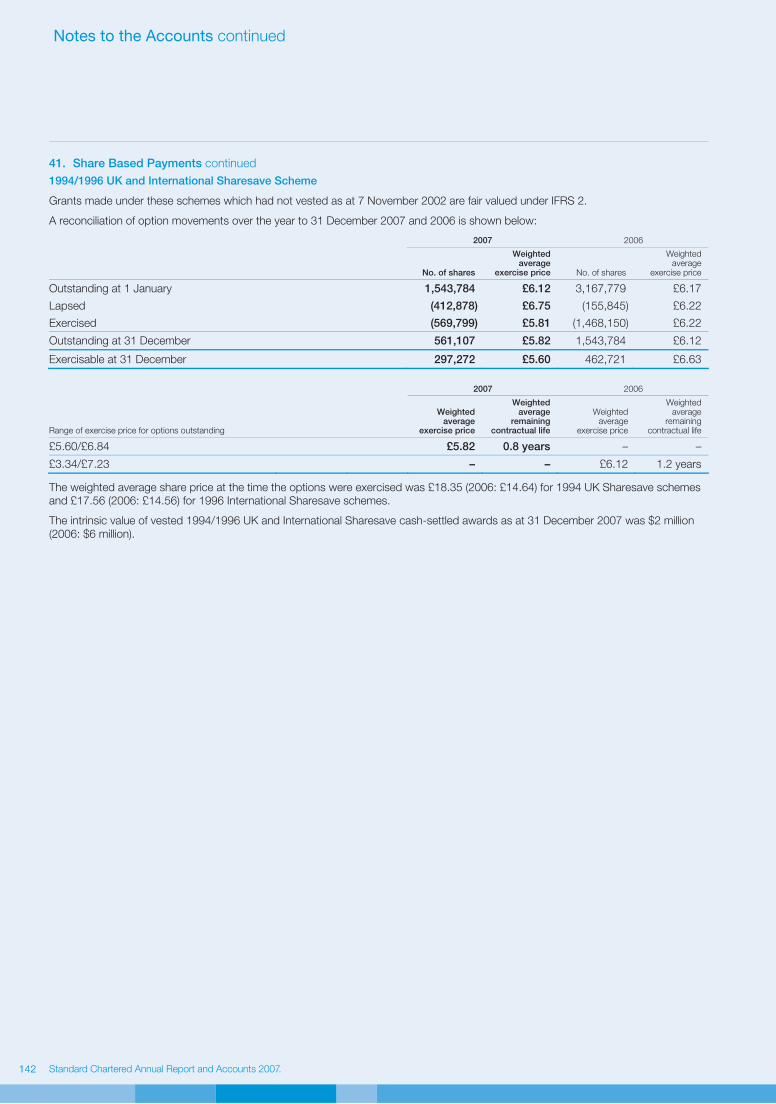
Standard Chartered Annual Report and Accounts 2007Standard Chartered Annual Report and Accounts 2007
Notes to the Accounts continued
1142
41. Share Based Payments continued
1994/1996 UK and International Sharesave Scheme
Grants made under these schemes which had not vested as at 7 November 2002 are fair valued under IFRS 2.
A reconciliation of option movements over the year to 31 December 2007 and 2006 is shown below:
2007 2006
No. of shares
Weighted average
exercise price No. of shares
Weighted average
exercise price
Outstanding at 1 January 1,543,784 £6.12 3,167,779 £6.17
Lapsed (412,878) £6.75 (155,845) £6.22
Exercised (569,799) £5.81 (1,468,150) £6.22
Outstanding at 31 December 561,107 £5.82 1,543,784 £6.12
Exercisable at 31 December 297,272 £5.60 462,721 £6.63
2007 2006
Range of exercise price for options outstanding
Weighted average
exercise price
Weighted average
remainingcontractual life
Weighted average
exercise price
Weightedaverage
remainingcontractual life
£5.60/£6.84 £5.82 0.8 years – –
£3.34/£7.23 – – £6.12 1.2 years
The weighted average share price at the time the options were exercised was £18.35 (2006: £14.64) for 1994 UK Sharesave schemes and £17.56 (2006: £14.56) for 1996 International Sharesave schemes.
The intrinsic value of vested 1994/1996 UK and International Sharesave cash-settled awards as at 31 December 2007 was $2 million (2006: $6 million).

www.standardchartered.com
Fin
an
cia
l S
tate
men
ts a
nd
No
tes t
o t
he A
cco
un
ts
1143
41. Share Based Payments continued
2004 UK and International Sharesave Schemes Valuation Options are valued using a binomial option-pricing model. The fair value per option granted and the assumptions used in the calculation are as follows:
2007 2006
Grant date 1 October 26 September 12 September 8 September
Share price at grant date £15.88 £16.18 £13.17 £13.03
Exercise price £12.43 £12.43 £10.64 £10.64
Vesting period (years) 3/5 3/5 3/5 3/5
Expected volatility (%) 20.7/24.2 20.7/24.2 20.5/28.9 20.5/29.6
Expected option life (years) 3.33/5.33 3.33/5.33 3.33/5.33 3.33/5.33
Risk free rate (%) 4.9/5.00 5.10/5.00 4.9/4.8 4.8/4.7
Expected dividends (yield) (%) 2.9/3.3 2.9/3.3 3.1/3.5 3.1/3.5
Fair value (£) 4.4/4.9 4.7/5.1 3.35/4.07 3.31/4.05 The expected volatility is based on historical volatility over the last three to five years, or three to five years prior to grant. The expected life is the average expected period to exercise. The risk free rate of return is the yield on zero-coupon UK government bonds of a term consistent with the assumed option life. The expected dividend yield is based on historical
dividend yield over the last three years or three years prior to grant. Where two amounts are shown for volatility, risk free rates, expected dividends yield and fair values, the first relates to a three year vesting period and the second to a five year vesting period.
A reconciliation of option movements over the year to 31 December 2007 and 2006 is shown below:
2007 2006
No. of shares
Weighted average
exercise price No. of shares
Weighted average
exercise price
Outstanding at 1 January 11,155,911 £9.76 7,892,513 £9.24
Granted 5,207,207 £12.43 4,035,972 £10.64
Lapsed (884,620) £10.04 (756,606) £9.07
Exercised (1,211,767) £7.43 (15,968) £7.95
Outstanding at 31 December 14,266,731 £10.91 11,155,911 £9.76
Exercisable at 31 December 235,616 £7.43 – –
2007 2006
Range of exercise price for options outstanding
Weighted average
exercise price
Weighted average
remaining contractual life
Weightedaverage
exercise price
Weightedaverage
remainingcontractual life
£7.43/£12.43 £10.91 2.7 years – –
£7.43/£10.64 – – £9.76 3.0 years The weighted average share price at the time the options were exercised during 2007 was £18.59 (2006: £13.98) for the UK Sharesave scheme and £18.72 (2006: £13.87) for the International Sharesave scheme.
The intrinsic value of vested 2004 UK and International Sharesave cash-settled awards as at 31 December 2007 was $2 million (2006: $nil million).
2004 Deferred Bonus Plan
Under this plan shares are issued directly to participants upon vesting.
A reconciliation of share movements over the year to 31 December 2007 and 2006 is shown below: 2007 2006
No. of shares No. of shares
Outstanding at 1 January 301,952 408,742
Shares vested (285,227) (399,537)
Shares awarded 351,340 301,952
Shares lapsed (16,725) (9,205)
Outstanding at 31 December 351,340 301,952
Notes:
a) Market value of shares on date of awards (6 March) was £13.95 (2006: £15.12).
b) The shares vest one year after the date of award.

Standard Chartered Annual Report and Accounts 2007Standard Chartered Annual Report and Accounts 2007
Notes to the Accounts continued
1144
42. Cash and Cash Equivalents
For the purposes of the cash flow statement, cash and cash equivalents comprise the following balances with less than three months maturity from the date of acquisition. Restricted balances comprise minimum balances required to be held at central banks.
Group Company
2007
$million 2006
$million 2007
$million 2006
$million
Cash and balances at central banks 10,175 7,698 – –
Less restricted balances (4,846) (3,958) – –
Treasury bills and other eligible bills 6,203 6,233 – –
Loans and advances to banks 32,464 16,084 – –
Trading securities 11,342 12,104 – –
Amounts owed by and due to subsidiary undertakings – – 930 2,028
Total 55,338 38,161 930 2,028
43. Capital Commitments
Capital expenditure approved by the directors but not provided for in these accounts amounted to:
2007
$million 2006
$million
Contracted 29 19
44. Operating Lease Commitments
2007 2006
Premises
$million Equipment
$million
Premises
$million
Equipment
$million
Commitments under non-cancellable operating leases expiring:
Within one year 179 3 156 3
Later than one year and less than five years 434 2 358 4
After five years 491 1 529 –
1,104 6 1,043 7
During the year $159 million (2006: $155 million) was recognised as an expense in the income statement in respect of operating leases.
The Group leases various premises and equipment under non-cancellable operating lease agreements. The leases have various terms, escalation clauses and renewal rights.
The total future minimum sublease payments expected to be received under non-cancellable subleases at 31 December 2007 is $17 million (2006: $17 million).
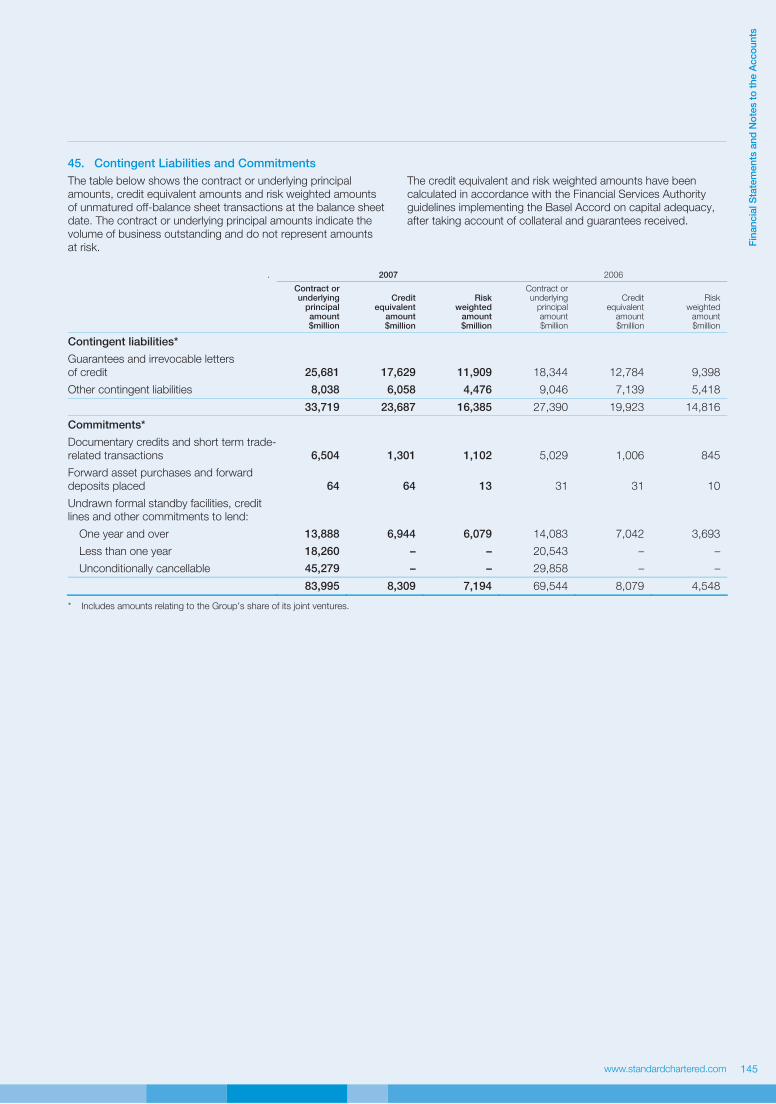
www.standardchartered.com
Fin
an
cia
l S
tate
men
ts a
nd
No
tes t
o t
he A
cco
un
ts
1145
45. Contingent Liabilities and Commitments
The table below shows the contract or underlying principal amounts, credit equivalent amounts and risk weighted amounts of unmatured off-balance sheet transactions at the balance sheet date. The contract or underlying principal amounts indicate the volume of business outstanding and do not represent amounts at risk.
The credit equivalent and risk weighted amounts have been calculated in accordance with the Financial Services Authority guidelines implementing the Basel Accord on capital adequacy, after taking account of collateral and guarantees received.
. 2007 2006
Contract orunderlying
principalamount$million
Creditequivalent
amount$million
Riskweighted
amount$million
Contract or underlying
principal amount $million
Credit equivalent
amount $million
Riskweighted
amount$million
Contingent liabilities*
Guarantees and irrevocable letters of credit 25,681 17,629 11,909 18,344 12,784 9,398
Other contingent liabilities 8,038 6,058 4,476 9,046 7,139 5,418
33,719 23,687 16,385 27,390 19,923 14,816
Commitments*
Documentary credits and short term trade-related transactions 6,504 1,301 1,102 5,029 1,006 845
Forward asset purchases and forward deposits placed 64 64 13 31 31 10
Undrawn formal standby facilities, credit lines and other commitments to lend:
One year and over 13,888 6,944 6,079 14,083 7,042 3,693
Less than one year 18,260 – – 20,543 – –
Unconditionally cancellable 45,279 – – 29,858 – –
83,995 8,309 7,194 69,544 8,079 4,548
* Includes amounts relating to the Group’s share of its joint ventures.

Standard Chartered Annual Report and Accounts 2007Standard Chartered Annual Report and Accounts 2007
Notes to the Accounts continued
1146
46. Repurchase and Reverse Repurchase Agreements
The Group enters into collateralised reverse repurchase and repurchase agreements and securities borrowing and lending transactions. It also receives securities as collateral for commercial lending.
Balance sheet assets
2007 Reverse
repurchase agreements
$million
2006Reverse
repurchase agreements
$million
Banks 1,349 1,359
Customers 1,068 630
2,417 1,989
Balance sheet liabilities
2007 Repurchase agreements
$million
2006Repurchase agreements
$million
Banks 2,150 1,449
Customers 364 681
2,514 2,130
Collateral pledged against these liabilities is disclosed in note 22 on page 116. The terms and conditions relating to the collateral pledged typically permits the collateral to be sold or repledged, subject to the obligation to return the collateral at the end of the agreement.
Under reverse repurchase and securities borrowing arrangements, the Group obtains securities on terms which permit it to repledge or resell the securities to others. Amounts on such terms are:
2007
$million 2006
$million
Securities and collateral which can be repledged or sold (at fair value) 2,410 1,379
Thereof repledged/transferred to others for financing activities or to satisfy commitments under short sale transactions (at fair value) 1,714 866

www.standardchartered.com
Fin
an
cia
l S
tate
men
ts a
nd
No
tes t
o t
he A
cco
un
ts
1147
47. Liquidity Risk
This table analyses assets and liabilities into relevant maturity groupings based on the remaining period to the contractual maturity date as at the balance sheet date, on a discounted basis. Contractual maturities do not necessarily reflect actual repayments or cash flow.
The Risk Review on pages 43 to 59 explains the Group’s and Company’s risk management with respect to asset and liability management.
2007
Threemonthsor less
$million
Between threemonths and
one year$million
Between one year and
five years $million
More than five years
$million Total
$million
Assets
Cash and balances at central banks 5,329 – – 4,846 10,175
Derivative financial instruments 6,228 7,042 9,740 3,194 26,204
Loans and advances to banks 32,461 3,613 1,269 336 37,679
Loans and advances to customers 51,010 28,334 29,921 47,717 156,982
Investment securities 18,526 21,269 20,034 13,373 73,202
Other assets 7,139 392 322 17,110 24,963
Total assets 120,693 60,650 61,286 86,576 329,205
Liabilities
Deposits by banks 25,524 2,361 540 160 28,585
Customer accounts 160,925 15,883 3,791 1,997 182,596
Derivative financial instruments 6,810 7,024 9,716 2,720 26,270
Debt securities in issue 10,964 11,637 6,363 3,189 32,153
Other liabilities 9,533 724 739 11,413 22,409
Subordinated liabilities and other borrowed funds – 502 6,092 9,146 15,740
Total liabilities 213,756 38,131 27,241 28,625 307,753
Net liquidity gap (93,063) 22,519 34,045 57,951 21,452
2006*
Threemonthsor less
$million
Between threemonths and
one year$million
Between one year and five years
$million
More than five years
$million Total
$million
Assets
Cash and balances at central banks 3,740 – – 3,958 7,698
Derivative financial instruments 2,710 4,178 4,190 2,076 13,154
Loans and advances to banks 16,214 2,305 2,403 142 21,064
Loans and advances to customers 44,062 23,590 28,771 44,071 140,494
Investment securities 19,311 20,141 18,207 5,016 62,675
Other assets 1,316 509 789 18,403 21,017
Total assets 87,353 50,723 54,360 73,666 266,102
Liabilities
Deposits by banks 24,109 3,360 621 32 28,122
Customer accounts 125,790 19,061 3,233 1,204 149,288
Derivative financial instruments 2,766 5,278 4,006 1,653 13,703
Debt securities in issue 8,382 9,216 8,231 970 26,799
Other liabilities 2,533 523 887 14,153 18,096
Subordinated liabilities and other borrowed funds – 501 2,440 9,758 12,699
Total liabilities 163,580 37,939 19,418 27,770 248,707
Net liquidity gap (76,227) 12,784 34,942 45,896 17,395
* Amounts have been restated as explained in note 51 on page 154.
The Company has financial liabilities of $1,987 million (2006: $1,977 million) maturing in five years or more.

Standard Chartered Annual Report and Accounts 2007Standard Chartered Annual Report and Accounts 2007
Notes to the Accounts continued
1148
47. Liquidity Risk continued
The following table analyses the contractual cash flows payable for the Group’s financial liabilities by remaining contractual maturities on an undiscounted basis. The financial liability balances in the table below will not agree to the balances reported in the consolidated balance sheet as the table incorporates all contractual cash flows, on an undiscounted basis, relating to both principal and interest payments.
Within the ‘More than five years’ maturity band are undated financial liabilities of $5,640 million (2006: $5,515 million), all of which relate to subordinated debt, on which interest payments are not included as this information would not be meaningful. Interest payments on these instruments are included within the maturities up to five years.
2007 2006
Three months or
less $million
Betweenthree
months and one year $million
Between one and
five years$million
More than five years
$million
Three months or
less $million
Between three
months and one year $million
Between one and five years
$million
More than five years
$million
Deposits by banks 22,752 1,880 526 133 23,039 3,000 780 192
Customer accounts 158,937 15,896 3,183 1,888 126,458 18,550 3,767 2,051
Financial liabilities at fair value 3,662 3,407 2,463 1,767 2,079 2,451 2,424 892
Derivative financial instruments 420,884 260,597 91,272 22,962 258,936 211,952 63,932 23,773
Debt securities in issue 10,535 10,594 6,242 2,436 7,738 7,983 8,825 900
Subordinated liabilities and other borrowed funds 305 1,190 5,476 20,247 205 1,154 5,683 15,447
Other liabilities 10,645 663 437 9,120 7,057 930 354 8,011
Total liabilities 627,720 294,227 109,599 58,533 425,512 246,020 85,765 51,266
Gross loan commitments 20,207 14,215 3,446 293 9,488 16,801 2,570 136 The cash flows presented in the above table reflect the cash flows which will be contractually payable over the residual maturity of the instruments. In practice, however, the liability instruments behave differently from their contractual terms and typically, for short term customer accounts, extend to a longer period than their contractual maturity.
Derivative financial instruments include those net settled derivative contracts in a net liability position, together with the pay leg of gross settled contracts regardless of whether the overall contract is in an asset or liability position. The receive leg is not shown in
this table and as a result the derivative amounts in this table are inflated by their exclusion.
The Company has financial liabilities payable on an undiscounted basis of $4,655 million (2006: $5,751 million), of which $1,104 million (2006: $1,167 million) matures in three months or less, $101 million (2006: $103 million) matures between three months and one year, $543 million (2006: $528 million) matures between one to five years, and $2,554 million (2006: $2,555 million) matures in more than five years.

www.standardchartered.com
Fin
an
cia
l S
tate
men
ts a
nd
No
tes t
o t
he A
cco
un
ts
1149
48. Currency Risk
Foreign exchange risk is managed and measured as set out in the Market risk section of the Risk Review on pages 56 to 57.
Foreign exchange risk arising within the non-trading portfolio, excluding structural positions, is minimised by match funding assets and liabilities in the same foreign currency.
Structural foreign exchange risks arise from net investments in currencies other than US dollars. The Group has made net
investments in Group undertakings in a number of currencies. The subsequent foreign exchange exposures are managed on an individual basis, and are assessed regularly for significant foreign exchange rate expectations. The positions are treated as long-term embedded exposures, and are not treated as trading positions, so hedges are considered in certain limited cases.
The table below sets out the principal structural foreign exchange exposures of the Group at 31 December 2007 and 2006:
2007
$million 2006
$million
Korean won 5,607 5,225
Hong Kong dollar 5,090 4,743
Indian rupee 2,258 1,682
Taiwanese dollar 1,833 1,397
Thai baht 958 824
UAE dirham 808 655
Singapore dollar 734 1,129
Chinese yuan 727 549
Pakistani rupee 705 668
Malaysian ringgit 674 696
Indonesian rupiah 475 475
Other 1,965 1,518
21,834 19,561 An analysis has been performed on these exposures to assess the impact of a one per cent fall in the US dollar exchange rates adjusted to incorporate the impacts of correlations. The impact of these on the positions above would be an increase of $91 million (2006: $60 million). Changes in the valuations of these positions are taken to reserves.
The Company’s assets and liabilities are predominantly in US dollars. It has assets of $687 million (2006: $732 million) and liabilities of $724 million (2006: $738 million) other than US dollars.
49. Credit Risk
Maximum exposure to credit risk The table on page 150 presents the Group’s maximum exposure to credit risk of the Group’s balance sheet and off-balance sheet financial instruments at 31 December 2007, before taking into account any collateral held or other credit enhancements. For on-balance sheet instruments, the maximum exposure to credit risk is the carrying amount reported on the balance sheet. For off-balance sheet instruments, the maximum exposure to credit risk represents the contractual nominal amounts.
The Group’s maximum exposure to credit risk has increased by $59 billion compared to 2006, primarily due to increased lending to banks, up $16.6 billion, reflecting the Group’s
strong liquidity and $16.5 billion increase in Wholesale lending portfolios. Derivative instruments increased by $13.0 billion as a result of increased volumes in the foreign exchange and rates business.
Collateral is held to mitigate the credit risk exposures primarily in respect of loans and advances, and consisting of residential, commercial and industrial properties, securities and other assets such as plant and machinery. Further details of the credit risk mitigation undertaken by the Group is contained within the Risk Review on page 46.

Standard Chartered Annual Report and Accounts 2007Standard Chartered Annual Report and Accounts 2007
Notes to the Accounts continued
1150
49. Credit Risk continued
Maximum exposure to credit risk (continued)
2007
$million 2006
$million
Financial assets held at fair value through profit or loss* 22,588 15,553
Derivative financial instruments 26,204 13,154
Loans and advances to banks and customers 189,631 159,024
Investment securities* 52,584 48,019
Contingent liabilities 33,719 27,390 Undrawn irrevocable standby facilities, credit lines and other commitments to lend 32,148 34,626
356,874 297,766
* Excludes equity shares.
In respect of derivative financial instruments, $17,282 million (2006: $6,425 million) is available for offset as a result of master netting agreements which do not meet the criteria under IAS 32 to enable these balances to be presented on a net basis in the financial statements as in the ordinary course of business they are not intended to be settled net. As set out in note 18, the Group
has entered into synthetic loan securitisations and synthetic trade receivable securitisations on which it has mitigated certain of the credit risks.
The maximum exposure to credit risk of the Company is $2,019 million (2006: $3,181 million), which relates to amounts owed by subsidiary undertakings.
Summary analysis of the loan portfolio 2007 2006
Loans to banks
$million
Loans to customers –
ConsumerBanking $million
Loans to customers –
WholesaleBanking $million
Total Loans to
customers $million
Loans to banks
$million
Loans to customers –
Consumer Banking $million
Loans to customers –
Wholesale Banking $million
Total Loans to
customers $million
Individually impaired loans, net of provisions 8 517 364 881 9 909 529 1,438
Past due but not impaired loans 10 4,589 422 5,011 32 4,896 379 5,275
Neither past due nor impaired loans 37,662 77,156 74,469 151,625 21,024 72,878 61,445 134,323
37,680 82,262 75,255 157,517 21,065 78,683 62,353 141,036
Portfolio impairment provision (1) (412) (123) (535) (1) (446) (96) (542)
37,679 81,850 75,132 156,982 21,064 78,237 62,257 140,494 $2,314 million (2006: $1,340 million) of loans to banks is held at fair value and $2,726 million (2006: $1,212 million) of loans to customers is held at fair value. The Company has loans neither past due nor impaired of $2,019 million (2006: $3,181 million),
and has no individually impaired loans or past due but not impaired loans. Details of loan loss provisions and individually impaired loans are disclosed in notes 20 and 21.
Loans and advances past due but not individually impaired The following table set out the ageing of loans and advances which are past due and for which no individual impairment provision has been raised. A loan is considered to be past due when the counterparty has failed to make a principal or interest payment when contractually due. Past due does not necessarily mean that counterparty is impaired.
For Consumer Banking loans, individual impairment provisions are generally raised at 150 days past due.
For Wholesale Banking, individual impairment provisions are generally raised only when interest and/or principal payments are deemed uncollectible.
The value of loans past due has declined compared to 2006, primarily within the up to 30 days bucket largely as a result of improvements in the Consumer Banking collection processes, particularly in Singapore.
2007 2006
Loans to banks
$million
Loans to customers –
ConsumerBanking $million
Loans to customers –
WholesaleBanking $million
Total Loans to
customers $million
Loans to banks
$million
Loans to customers –
Consumer Banking $million
Loans to customers –
Wholesale Banking $million
Total Loans to
customers $million
Up to 30 days past due – 3,559 239 3,798 32 3,911 200 4,111
Between 31 - 60 days past due – 536 38 574 – 553 71 624
Between 61 - 90 days past due 10 342 143 485 – 284 78 362
Between 91 - 150 days past due – 152 2 154 – 148 30 178
10 4,589 422 5,011 32 4,896 379 5,275 Within loans to banks past due balance, $nil million (2006: $nil million) is held at fair value. Within the Consumer Banking loans to customers past due balance, $nil million (2006: $nil million) is held at fair value; and within the Wholesale Banking loans to customers past due balance, $nil million (2006: $nil million) is held at fair value.
The fair value of collateral held against past due but not impaired Consumer Banking loans is $4,419 million (2006: $3,444 million)
and largely comprises residential and commercial property. The fair value of collateral held against past due but not impaired Wholesale Banking loans is $157 million (2006: $161 million) and largely comprises property and securities.
Where the fair value of collateral held exceeds the outstanding loan, any excess is paid back to the customers and is not available for offset against other loans.
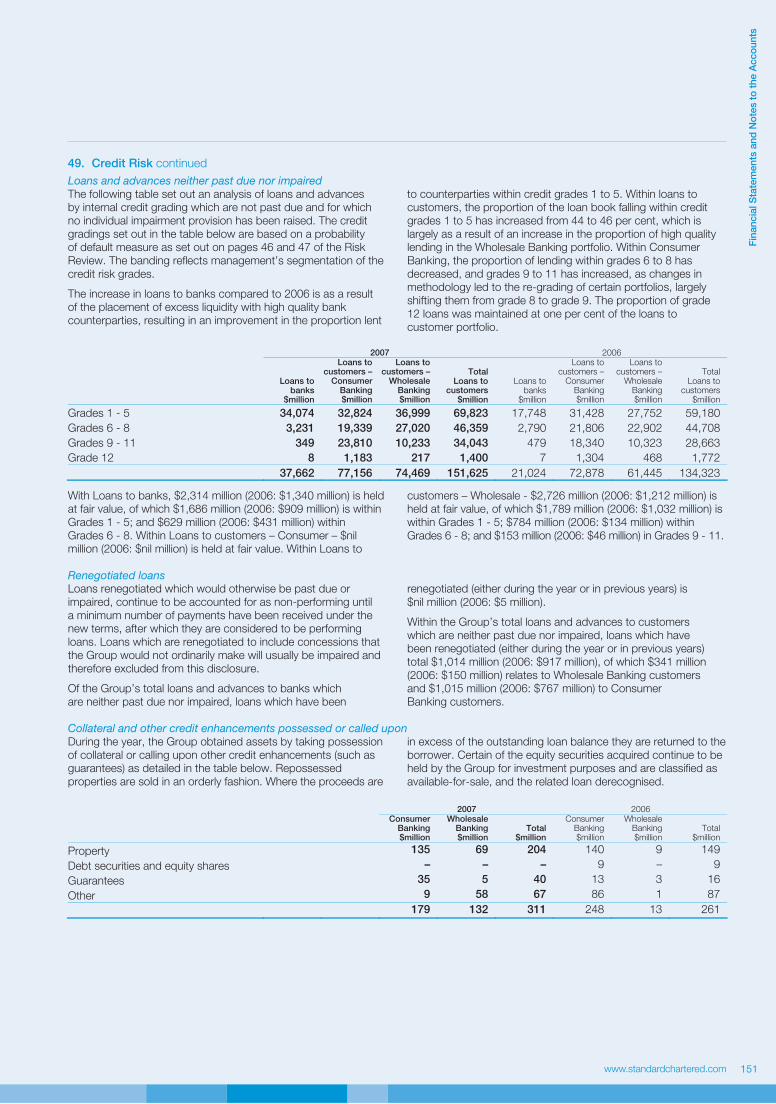
www.standardchartered.com
Fin
an
cia
l S
tate
men
ts a
nd
No
tes t
o t
he A
cco
un
ts
1151
49. Credit Risk continued
Loans and advances neither past due nor impairedThe following table set out an analysis of loans and advances by internal credit grading which are not past due and for which no individual impairment provision has been raised. The credit gradings set out in the table below are based on a probability of default measure as set out on pages 46 and 47 of the Risk Review. The banding reflects management’s segmentation of the credit risk grades.
The increase in loans to banks compared to 2006 is as a result of the placement of excess liquidity with high quality bank counterparties, resulting in an improvement in the proportion lent
to counterparties within credit grades 1 to 5. Within loans to customers, the proportion of the loan book falling within credit grades 1 to 5 has increased from 44 to 46 per cent, which is largely as a result of an increase in the proportion of high quality lending in the Wholesale Banking portfolio. Within Consumer Banking, the proportion of lending within grades 6 to 8 has decreased, and grades 9 to 11 has increased, as changes in methodology led to the re-grading of certain portfolios, largely shifting them from grade 8 to grade 9. The proportion of grade 12 loans was maintained at one per cent of the loans to customer portfolio.
2007 2006
Loans to banks
$million
Loans to customers –
ConsumerBanking $million
Loans to customers –
WholesaleBanking $million
Total Loans to
customers $million
Loans to banks
$million
Loans to customers –
Consumer Banking $million
Loans to customers –
WholesaleBanking $million
Total Loans to
customers $million
Grades 1 - 5 34,074 32,824 36,999 69,823 17,748 31,428 27,752 59,180
Grades 6 - 8 3,231 19,339 27,020 46,359 2,790 21,806 22,902 44,708
Grades 9 - 11 349 23,810 10,233 34,043 479 18,340 10,323 28,663
Grade 12 8 1,183 217 1,400 7 1,304 468 1,772
37,662 77,156 74,469 151,625 21,024 72,878 61,445 134,323 With Loans to banks, $2,314 million (2006: $1,340 million) is held at fair value, of which $1,686 million (2006: $909 million) is within Grades 1 - 5; and $629 million (2006: $431 million) within Grades 6 - 8. Within Loans to customers – Consumer – $nil million (2006: $nil million) is held at fair value. Within Loans to
customers – Wholesale - $2,726 million (2006: $1,212 million) is held at fair value, of which $1,789 million (2006: $1,032 million) is within Grades 1 - 5; $784 million (2006: $134 million) within Grades 6 - 8; and $153 million (2006: $46 million) in Grades 9 - 11.
Renegotiated loans Loans renegotiated which would otherwise be past due or impaired, continue to be accounted for as non-performing until a minimum number of payments have been received under the new terms, after which they are considered to be performing loans. Loans which are renegotiated to include concessions that the Group would not ordinarily make will usually be impaired and therefore excluded from this disclosure.
Of the Group’s total loans and advances to banks which are neither past due nor impaired, loans which have been
renegotiated (either during the year or in previous years) is $nil million (2006: $5 million).
Within the Group’s total loans and advances to customers which are neither past due nor impaired, loans which have been renegotiated (either during the year or in previous years) total $1,014 million (2006: $917 million), of which $341 million (2006: $150 million) relates to Wholesale Banking customers and $1,015 million (2006: $767 million) to Consumer Banking customers.
Collateral and other credit enhancements possessed or called upon During the year, the Group obtained assets by taking possession of collateral or calling upon other credit enhancements (such as guarantees) as detailed in the table below. Repossessed properties are sold in an orderly fashion. Where the proceeds are
in excess of the outstanding loan balance they are returned to the borrower. Certain of the equity securities acquired continue to be held by the Group for investment purposes and are classified as available-for-sale, and the related loan derecognised.
2007 2006
ConsumerBanking $million
WholesaleBanking $million
Total $million
Consumer Banking $million
WholesaleBanking $million
Total $million
Property 135 69 204 140 9 149
Debt securities and equity shares – – – 9 – 9
Guarantees 35 5 40 13 3 16
Other 9 58 67 86 1 87
179 132 311 248 13 261

Standard Chartered Annual Report and Accounts 2007Standard Chartered Annual Report and Accounts 2007
Notes to the Accounts continued
1152
49. Credit Risk continued
Debt securities, equity shares and treasury bills Debt securities, equity shares and treasury bills can be analysed as follows:
2007 2006
Debt securities
$million
Equityshares
$million
Treasurybills
$million
Total
$million
Debtsecurities
$million
Equity shares
$million
Treasury bills
$million
Total
$million
Impaired securities 71 30 17 118 18 34 30 82
Impairment provisions (54) (22) (2) (78) (9) (23) (10) (42)
Net impaired securities 17 8 15 40 9 11 20 40
Securities neither past due nor impaired 55,063 3,052 15,047 73,162 45,089 1,629 15,920 62,638
55,080 3,060 15,062 73,202 45,098 1,640 15,940 62,678
$3,395 million (2006: $3,418 million) of treasury bills and $14,163 million (2006: $9,601 million) of debt securities are held at fair value.
Movements in provisions on impaired securities are disclosed in note 22. The impaired debt securities largely include the Group’s holdings of ABS CDOs, on which a $35 million impairment charge and other writedowns of $87 million were taken in 2007. Further details of these writedowns are set out on page 54 of the Risk Review.
Collateral is held against impaired securities and primarily consists of properties. The undiscounted fair value of collateral held relating to impaired securities is estimated at $24 million (2006: $21 million).
The Company has no debt securities, equity shares or treasury bills other than investments in subsidiary undertakings.
Where the fair value of collateral held exceeds the outstanding securities obligations, any excess is paid back to the customers and is not available for offset against other securities obligations.
Securities neither past due nor impaired The following table analyses debt securities and treasury bills which are neither past due or impaired by external credit rating. The standard credit ratings used by the Group are those used by Standard & Poors or their equivalent. Debt securities held which
have a short-term rating are reported against the long-term rating of the issuer. For securities which are unrated, the Group applies an internal credit rating as described under Loans and Advances.
2007 2006
Debt
securities
$million
Treasury bills
$million
Total
$million
Debt
securities
$million
Treasury bills
$million
Total
$million
AAA 12,364 570 12,934 6,685 644 7,329
AA- to AA+ 16,426 3,216 19,642 14,992 3,125 18,117
A- to A+ 14,358 7,788 22,146 13,517 9,986 23,503
BBB- to BBB+ 6,341 1,822 8,163 4,834 852 5,686
Lower than BBB- 2,586 1,357 3,943 3,225 1,072 4,297
Unrated 2,988 294 3,282 1,836 241 2,077
55,063 15,047 70,110 45,089 15,920 61,009 Unrated securities primarily relate to corporate investments. Using internal credit ratings, $2,606 million (2006: $1,353 million) of these securities are considered to be investment grade and $676 million (2006: $724 million) sub-investment grade.
The increase in AAA debt securities compared to 2006 has largely been driven by the asset backed securities acquired from Whistlejacket following the ‘vertical’ slice transactions. Further details of these transactions are set out in note 52 and within the Risk Review on page 54.

www.standardchartered.com
Fin
an
cia
l S
tate
men
ts a
nd
No
tes t
o t
he A
cco
un
ts
1153
50. Fair Value of Financial Assets and Liabilities
The following table summarises the carrying amounts and fair values of those financial assets and liabilities not presented on the Group’s balance sheet at fair value.
2007 2006
Book amount
$million
Fair value
$million
Book amount*
$million
Fair value*
$million
Assets
Cash and balances at central banks 10,175 10,175 7,698 7,698
Loans and advances to banks 35,365 35,316 19,724 19,727
Loans and advances to customers 154,266 153,828 139,300 139,654
Investment securities 2,819 2,779 2,786 2,754
Liabilities
Deposits by banks 25,880 25,844 26,233 26,184
Customer accounts 179,760 179,694 147,382 147,492
Debt securities in issue 27,137 27,072 23,514 23,518
Subordinated liabilities and other borrowed funds 15,740 15,029 **12,699 12,877
* Amounts have been restated as explained in note 51 on page 154.
** The book amount includes adjustments as a result of fair value hedging relationships.
The following sets out the Group’s basis of establishing fair values of the financial instruments shown above and those financial assets classified as available-for-sale and financial assets and liabilities held at fair value through profit and loss as disclosed within notes 14, 15, 17, 18, 22 and 31. The Group’s basis for establishing the fair value of financial assets and liabilities held at fair value through profit or loss and of derivatives is set out in note 1.
Cash and balances at central banks The fair value of cash and balances at central banks is their carrying amounts.
Loans and advances to banks The fair value of floating rate placements and overnight deposits is their carrying amounts. The estimated fair value of fixed interest bearing deposits is based on discounted cash flows using the prevailing money-market rates for debts with a similar credit risk and remaining maturity.
Loans and advances to customers Loans and advances are net of provisions for impairment. The estimated fair value of loans and advances represents the discounted amount of future cash flows expected to be received, including assumptions relating to prepayment rates. Expected cash flows are discounted at current market rates to determine fair value. The Group’s loan portfolio is well diversified by geography and industry and is in markets that have had little contagion from the turmoil brought about by the
sub-prime mortgage crisis in the United States. Approximately half of the portfolio reprices within one month, and over 80 per cent reprices within 12 months. The fair value of loans and advances to customers is therefore close to the book amount.
Investment securities Investment securities with observable market prices, including debt and equity securities, are fair valued using that information. Debt securities that do not have observable market data are fair valued by either discounting cash flows using the prevailing market rates for debts with a similar credit risk and remaining maturity or using quoted market prices for securities with similar credit, maturity and yield characteristics.
Deposits and borrowings The estimated fair value of deposits with no stated maturity is the amount repayable on demand. The estimated fair value of fixed interest bearing deposits and other borrowings without quoted market prices is based on discounting cash flows using the prevailing market rates for debts with a similar credit risk and remaining maturity.
Debt securities in issue, subordinated liabilities and other borrowed funds The aggregate fair values are calculated based on quoted market prices. For those notes where quoted market prices are not available, a discounted cash flow model is used based on a current market related yield curve appropriate for the remaining term to maturity.
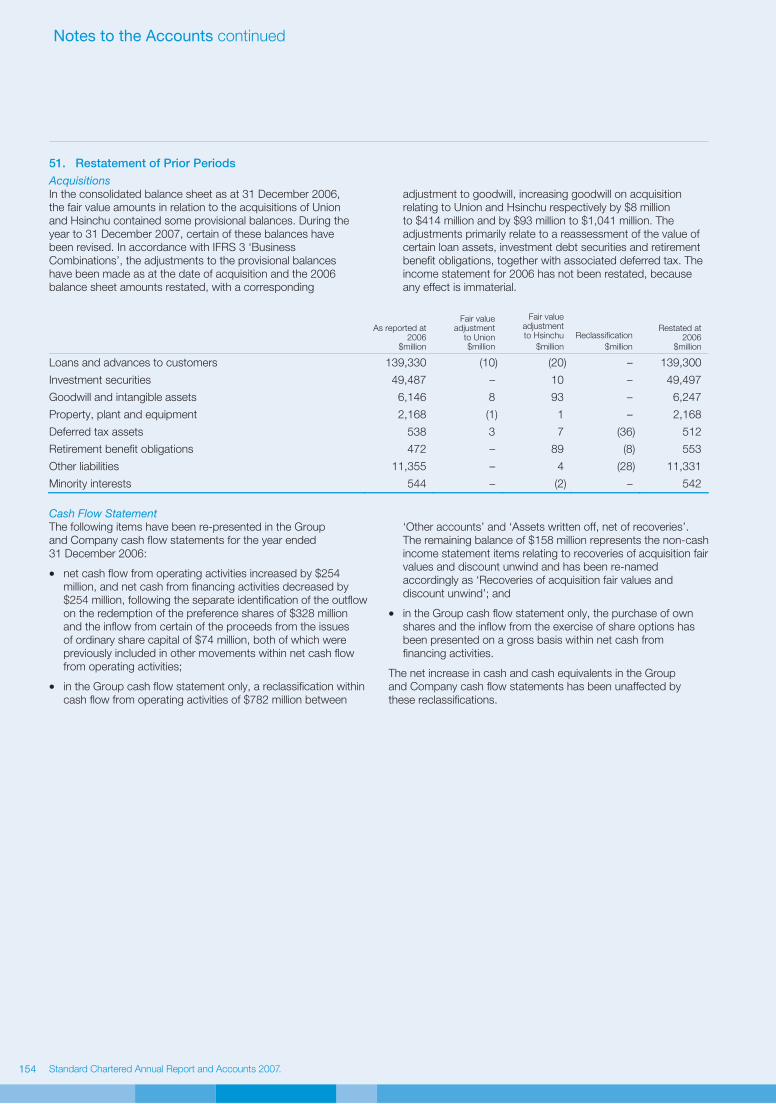
Standard Chartered Annual Report and Accounts 2007Standard Chartered Annual Report and Accounts 2007
Notes to the Accounts continued
1154
51. Restatement of Prior Periods
Acquisitions In the consolidated balance sheet as at 31 December 2006, the fair value amounts in relation to the acquisitions of Union and Hsinchu contained some provisional balances. During the year to 31 December 2007, certain of these balances have been revised. In accordance with IFRS 3 ‘Business Combinations’, the adjustments to the provisional balances have been made as at the date of acquisition and the 2006 balance sheet amounts restated, with a corresponding
adjustment to goodwill, increasing goodwill on acquisition relating to Union and Hsinchu respectively by $8 million to $414 million and by $93 million to $1,041 million. The adjustments primarily relate to a reassessment of the value of certain loan assets, investment debt securities and retirement benefit obligations, together with associated deferred tax. The income statement for 2006 has not been restated, because any effect is immaterial.
As reported at2006
$million
Fair value adjustment
to Union$million
Fair value adjustment to Hsinchu
$million
Reclassification
$million
Restated at2006
$million
Loans and advances to customers 139,330 (10) (20) – 139,300
Investment securities 49,487 – 10 – 49,497
Goodwill and intangible assets 6,146 8 93 – 6,247
Property, plant and equipment 2,168 (1) 1 – 2,168
Deferred tax assets 538 3 7 (36) 512
Retirement benefit obligations 472 – 89 (8) 553
Other liabilities 11,355 – 4 (28) 11,331
Minority interests 544 – (2) – 542
Cash Flow Statement The following items have been re-presented in the Group and Company cash flow statements for the year ended 31 December 2006:
• net cash flow from operating activities increased by $254 million, and net cash from financing activities decreased by $254 million, following the separate identification of the outflow on the redemption of the preference shares of $328 million and the inflow from certain of the proceeds from the issues of ordinary share capital of $74 million, both of which were previously included in other movements within net cash flow from operating activities;
• in the Group cash flow statement only, a reclassification within cash flow from operating activities of $782 million between
‘Other accounts’ and ‘Assets written off, net of recoveries’. The remaining balance of $158 million represents the non-cash income statement items relating to recoveries of acquisition fair values and discount unwind and has been re-named accordingly as ‘Recoveries of acquisition fair values and discount unwind’; and
• in the Group cash flow statement only, the purchase of own shares and the inflow from the exercise of share options has been presented on a gross basis within net cash from financing activities.
The net increase in cash and cash equivalents in the Group and Company cash flow statements has been unaffected by these reclassifications.

www.standardchartered.com
Fin
an
cia
l S
tate
men
ts a
nd
No
tes t
o t
he A
cco
un
ts
1155
52. Related Party Transactions
Directors and Officers Directors’ emoluments Details of directors’ pay and benefits and interests in shares are disclosed in the directors’ remuneration report on pages 73 to 85.
IAS 24 ‘Related party disclosures’ requires the following additional information for key management compensation. Key management comprises members of the Group Management Committee, which includes all executive and non-executive directors.
2007
$million 2006
$million
Salaries, allowances and benefits in kind 19 14
Pension contributions 6 5
Bonuses paid or receivable 23 17
Share based payments 22 16
70 52 Transactions with directors, officers and others At 31 December 2007, the total amounts to be disclosed under the Companies Act 1985 (the Act) and the HK Listing Rules about loans to directors and officers were as follows:
2007 2006
Number $000 Number $000
Directors 1 14 – –
Officers* 4 7,090 2 203
* For this disclosure, the term ‘Officers’ means the members of the Group Management Committee, other than those who are directors of Standard Chartered
PLC, and the Company Secretary.
Mr Sunil Mittal, appointed as an independent non-executive director of Standard Chartered PLC with effect from 1 August 2007, is Chairman and Group CEO of the Bharti Enterprises Group. Due to his significant voting power in the Bharti Enterprises Group, it is a related party of Standard Chartered PLC. As at 31 December 2007, the Group has loans to the Bharti Enterprises Group of $123 million, guarantees of $47 million and foreign exchange deals with a notional value of $52 million.
As at 31 December 2007, Standard Chartered Bank had created a charge over $24 million (2006: $5 million) of cash assets in favour of the independent trustees of its employer financial retirement benefit schemes.
Other than as disclosed in this Annual Report and Accounts, there were no other transactions, arrangements or agreements outstanding for any director, connected person or officer of the Company which have to be disclosed under the Act, the rules of the UK Listing Authority or the HK Listing Rules.
Joint ventures The Group has loans and advances to PT Bank Permata Tbk totalling $4 million at 31 December 2007 (2006: $8 million), and deposits of $7 million (2006: $nil million).
Associates During 2007, the Group acquired a 30 per cent holding in MCashback Limited for $36 million.
During 2007, the Group contributed $11 million to the establishment of Merchant Solutions Limited.
At 31 December 2007, the Group has loans and advances to China Bohai Bank Limited of $nil million (2006: $54 million).
Structured investment vehicles Whistlejacket Capital Limited (‘Whistlejacket’) is a structured investment vehicle sponsored by the Group. In November and December 2007, the Group entered into two vertical slice transactions to acquire a portfolio of Whistlejacket’s securities, settled by a cash payment, which is net of the redemption value of the capital notes invested by the Group in the vehicle. The capital notes were redeemed at net asset value, crystallising a loss for the Group of $116 million, which is reported within ‘Other
operating income’. The portfolio of debt securities acquired totalled $3.4 billion and has been classified as available-for-sale. In addition to these transactions, the Group acquired $1.7 billon of assets, some of which were subsequently sold, without any significant profit and loss impact.
Open ended investment company Standard Chartered Global Liquidity Funds p.l.c. is an open-ended investment company domiciled in Ireland and has a single sub-fund, the US Dollar Liquidity Fund. The Fund is a Treasury Style Institutional Money Market Fund that holds a Aaa/MR1+ rating from Moody's Investor services and is managed to maximise current income consistent with the preservation of capital and liquidity and is structured to maintain a stable net asset value per share of $1.00 with the income distributed in the form of dividends. As at 31 December 2007, the Fund had $1,325 million in assets under management. Standard Chartered Bank is the Investment Manager and Distributor of the Fund and has an investment in the shares of $251 million.
Company The Company has received $95 million of interest income from Standard Chartered Bank. The Company issues debt externally and lends the proceeds to Group companies. At 31 December 2007, it has loans to and debt instruments issued by Standard Chartered Bank of $343 million (2006: $3,180 million), loans of $77 million (2006: $nil million) to Standard Chartered Holdings Limited and loans of $1 million (2006: $1 million) to other subsidiaries.
At 31 December 2007, the Company had no amounts owed to Standard Chartered Holdings Limited (2006: $1,151 million).
In 2006, the Company licensed intellectual property rights related to the Company’s main brands to an indirect wholly owned subsidiary, Standard Chartered Strategic Brand Management Limited (‘SCSBM’), the income for which is held on the Company’s balance sheet and released as income over the term of the license. The Company entered into an agreement to pay a partial rebate of the initial licence value to SCSBM in January 2008. This amounted to $1,089 million, which has been included as amounts owed to subsidiary undertakings at 31 December
Standard Chartered Annual Report and Accounts 2007Standard Chartered Annual Report and Accounts 2007
Notes to the Accounts continued
1156
52. Related Party Transactions continued
2007. As a consequence, in the year ended 31 December 2007, the Company has written back $192 million of income recognised in prior years. At the year end $311 million (2006: $1,362 million) has been included as deferred income in the Company balance sheet in relation to this license.
The Company has an agreement with Standard Chartered Bank that in the event of the Bank defaulting on its debt coupon interest payments, where the terms of such debt requires it, the Company shall issue shares as settlement for non-payment of the coupon interest.
53. Post Balance Sheet Events Group The Group announced, on 18 September 2007, the acquisition of American Express Bank Limited (‘AEB’), from American Express Company for a total cash consideration equal to the net asset value of AEB at completion plus $300 million. The transaction will complete on 29 February 2008.
On 11 January 2008, the Group completed the acquisition of a 49 per cent stake in UTI Securities Limited, an equity brokerage firm in India.
On 11 January 2008, the Group announced the acquisition of a Korean mutual savings bank, Yeahreum Mutual Savings Bank which was completed on 25 February 2008.
On 31 January 2008, the Group announced that it intended to provide liquidity to Whistlejacket subject to certain pre-conditions,
one of which was that enforcement proceedings had not commenced. On 11 February 2008, Whistlejacket advised that it had breached its capital note Net Asset Value (‘NAV’) trigger of 50 per cent. The breach of the trigger was an enforcement event, which required the security trustee, BNY Corporate Trustee Service, to appoint a receiver to manage Whistlejacket. As a result, the proposal announced on 31 January 2008 lapsed. However, the Group continued to discuss with the receiver alternative arrangements to provide liquidity. Subsequently on 20 February 2008, the Group announced that it had withdrawn the conditional proposals made to the receiver as a result of a number of factors, including the pace of continuing deterioration in the market for certain assets classes and the impracticality of completing any proposal within the confines of the receivership as it has evolved.
54. Significant Accounting Estimates and Judgements
In determining the carrying amounts of certain assets and liabilities, the Group makes assumptions of the effects of uncertain future events on those assets and liabilities at the balance sheet date. The Group’s estimates and assumptions are based on historical experience and expectation of future events and are reviewed periodically. This disclosure excludes uncertainty over future events and judgements in respect of measuring financial instruments. Further information about key assumptions concerning the future, and other key sources of estimation uncertainty, are set out in the notes.
Loan loss provisioning The Group’s loan loss provisions are established to recognise incurred impairment losses either on specific loan assets or within a portfolio of loans and receivables.
Impairment losses for specific loan assets are assessed either on an individual or on a portfolio basis. Individual impairment losses are determined as the difference between the carrying value and the present value of estimated future cash flows, discounted at the loans’ original effective interest rate. Impairment losses determined on a portfolio basis are assessed based on the probability of default inherent within the portfolio of impaired loans or receivables.
Estimating the amount and timing of future recoveries involves significant judgement, and considers the level of arrears as well as the assessment of matters such as future economic conditions and the value of collateral, for which there may not be a readily accessible market.
Loan losses that have been incurred but have not been separately identified at the balance sheet date are determined on a portfolio basis, which takes into account past loss experience as a result of uncertainties arising from the economic environment, and defaults based on portfolio trends. Actual
losses identified could differ significantly from the impairment provisions reported as a result of uncertainties arising from the economic environment.
Fair value of financial instruments Fair value is the amount for which an asset could be exchanged, or a liability settled, between knowledgeable, willing parties in an arm’s length transaction.
All financial instruments are initially recognised at fair value, which is normally the transaction price. In certain circumstances, the initial fair value may be based on a valuation technique which may lead to the recognition of profits or losses at the time of initial recognition. However, these profits or losses can only be recognised when the valuation technique used is based solely on observable market inputs.
Subsequent to initial recognition, some of the Group’s financial instruments are carried at fair value, with changes in fair value either reported within the income statement or within equity until the instrument is sold or becomes impaired. Details of the type and classification of the Group’s financial instruments are set out in notes 14 and 16 to the accounts and the accounting policy set out in note 1 to the accounts. In addition to these instruments, the carrying value of a financial instrument carried at amortised cost that is the hedged item in a qualifying fair value hedge relationship is adjusted by the fair value gain or loss attributable to the hedged risk.
The fair values of quoted financial instruments in active markets are based on current prices. If the market for a financial instrument is not active, and for unlisted securities, the Group establishes fair value by using valuation techniques. These include the use of recent arm’s length transactions, discounted cash flow analysis, option pricing models and other valuation techniques commonly used by market participants.

www.standardchartered.com
Fin
an
cia
l S
tate
men
ts a
nd
No
tes t
o t
he A
cco
un
ts
1157
54. Significant Accounting Estimates and Judgements continued
Where representative prices are unreliable because of illiquid markets, the determination of fair value may require estimation of certain parameters, which are calibrated against industry standards and observable market data, or the use of valuation models that are based on observable market data.
The fair value for the majority of the Group’s financial instruments is based on observable market prices or derived from observable market parameters. The most significant element of Group assets in which observable prices are not available relates to certain instruments held within the Asset Backed Securities portfolio. At 31 December 2007, assets with a market value of $1.5 billion were held in respect of which there was no observable market data. For these instruments, changing one or more of the assumptions used to reasonably possible alternatives would not significantly change their fair value.
Equity investments that do not have an observable market price are fair valued by applying various valuation techniques, such as earnings multiples, net assets multiples, discounted cash flows, and industry valuation benchmarks. These techniques are generally applied prior to any initial public offering, after which an observable market price becomes available. Disposal of such investments are generally by market trades or private sales.
Goodwill impairment An annual assessment is made, as set out in note 25, as to whether the current carrying value of goodwill is impaired. Detailed calculations are performed based on discounting expected pre-tax cash flows of the relevant cash generating units and discounting these at an appropriate discount rate, the determination of which requires the exercise of judgement.
Acquired intangible assets Acquired intangible assets are those that derive their value from contractual customer relationships or that can be separated and sold, and are amortised over their estimated useful lives. They comprise customer relationships, core deposits, brands and acquired licences. The valuation and estimated useful lives of customer relationships, core deposits and brands is dependent on a number of assumptions and judgements, such as expected cash flows, customer attrition, royalty rates and applicable costs, variations in which could produce different values and/or useful lives.
For example, if the royalty rates were increased by one per cent per annum (or decreased by one per cent per annum) the value of the brand names acquired in the acquisitions in 2007 would increase by approximately $3 million (or decrease by $3 million). Likewise, if the attrition rates were increased by four per cent per annum (or decreased by four per cent per annum) the value of the customer relationships acquired in the acquisitions in 2007 would decrease by approximately $10 million (or increase by approximately $10 million).
Acquired licences are valued at their purchase price and amortised over the period of the licence.
Pensions Actuarial assumptions are made in valuing future defined benefit pension obligations as set out in note 36 and are updated periodically. The principal assumptions relate to the rate of inflation and the discount rate. The assumed rate of inflation affects the rate at which salaries grow and therefore the size of the pensions that employees receive on retirement. The discount rate is equal to the yield on high-quality corporate bonds which have a term to maturity approximating that of the related liability, and is potentially subject to significant variation. As a result, there is uncertainty that these assumptions will continue in the future. For example, if the discount rate for the UK fund increased by 25 basis points, the liability would reduce by approximately $66 million, and vice versa. Whilst changes in other assumptions would have an impact, the effect would not be as significant.
Taxes Determining income tax provisions involves judgement on the tax treatment of certain transactions. Deferred tax is recognised on tax losses not yet used and on temporary differences where it is probable that there will be taxable revenue against which these can be offset. Management has made judgements as to the probability of tax losses being available for offset at a later date.
Provisions for liabilities and charges The Group receives legal claims against it in the normal course of business. Management has made judgements as to the likelihood of any claim succeeding in making provisions. The time of concluding legal claims is uncertain, as is the amount of possible outflow of economic benefits. Timing and cost ultimately depends on the due process in respective legal jurisdictions.
Share based payments Equity-settled share awards are recognised as an expense based on their fair value at date of grant. The fair value of equity-settled share options is estimated through the use of option valuation models – which require inputs such as the risk-free interest rate, expected dividends, expected volatility and the expected option life – and is expensed over the vesting period. Some of the inputs used, such as the expected option life, are not market observable and are based on estimates derived from available data, such as employee exercise behaviour. The models utilised, such as the binomial option pricing model, are intended to value options traded in active markets. The share options issued by the Group, however, have a number of features that make them incomparable to such traded options. Using different input estimates or models could produce different option values, which would result in the recognition of a higher or lower expense. For example, if the volatility assumption was increased by five per cent (or decreased by five per cent), the fair values for options granted under the Sharesave schemes in 2007 would increase by approximately £0.28 for 3 year grants, and by £0.39 for 5 year grants (or decrease by approximately £0.20 for 3 year grants, and by £0.32 for 5 year grants).

Standard Chartered Annual Report and Accounts 2007Standard Chartered Annual Report and Accounts 2007
Notes to the Accounts continued
1158
55. Recently Issued Accounting Pronouncements
The following pronouncements relevant and applicable to the Group and Company were issued as at 31 December 2007 but have effective dates for periods beginning after 31 December 2007. The use of IFRSs and certain IFRIC Interpretations that have yet to be endorsed by the European Union is not permitted. Those IFRSs and IFRIC Interpretations listed below that have been endorsed by the European Union,
and whose use is therefore permitted, have not been applied in preparing these financial statements.
The full impact of these IFRSs and IFRIC Interpretations is currently being assessed by the Group; none of these pronouncements are expected to result in any material adjustments to the financial statements.
Pronouncement
Description of impact Latest effective date for the
Group and Company
IFRIC 11 IFRS 2: Group and Treasury Share Transactions
IFRIC 11 clarifies the treatment in the subsidiary’s accounts for share awards made by the parent to the employees of a subsidiary.
1 January 2008
IFRS 8 Operating Segments IFRS 8 supersedes IAS 14 ‘Segment Reporting’ and requires the reporting of operating segments on the same basis as is used internally for evaluating performance.
1 January 2009**
IFRIC 13 Accounting for Customer Loyalty Programmes*
IFRIC 13 clarifies that consideration received for the sale of services for which customer loyalty awards are awarded is allocated between the service delivered and the award credit, based on the fair value of the credit awarded.
1 January 2009**
IFRIC 14 IAS 19 – The Limit on Defined Benefit Asset Minimum Funding Requirements and their Interaction*
IFRIC 14 requires the recognition of defined benefit assets to the extent that the Group has the right to an unconditional refund during the life of the plan, or assuming the gradual settlement of the plan’s liabilities or assuming full settlement of the plan’s liabilities.
1 January 2008
IAS 23 Revised Borrowing Costs* IAS 23 has been revised to remove the option to expense borrowing costs incurred in respect of the construction and development of qualifying assets. Such costs will now be capitalised as a part of the cost of the asset.
1 January 2009**
IAS 1 Revised Presentation of Financial Statements*
IAS 1 Revised provides the option to either disclose all non-owner changes in equity in one statement of Comprehensive Income or continue to disclose two statements. The standard also requires an additional balance sheet to be presented at the beginning of the earliest comparative period when a change in accounting policy is applied retrospectively or a retrospective restatement is made.
1 January 2009**
Amendment to IAS 27 Consolidated and Separate Financial Statements*
This amendment changes the treatment for part disposals, both when control is retained (which is accounted for as an equity transaction, generating no profit or loss in the income statement) and when control is lost (where the residual holding is measured at fair value with any changes reflected in income).
1 January 2010
IFRS 3 Revised Business Combinations* IFRS 3 Revised requires acquisition costs to be expensed and not capitalised; an estimate of cash contingent consideration to be made at the date of acquisition, with any future changes recognised in income; provides the option to recognise 100 per cent of the goodwill of an acquired entity in a partial acquisition. The Standard can be applied early, on a prospective basis, for annual periods beginning on or after 30 June 2007.
1 January 2010
Amendment to IFRS 2 Share-based payment*
The amendments clarify the definition of vesting conditions and the accounting treatment of cancellations by employees, whereby such cancellations will immediately result in the recognition of the amount of the expense that would otherwise have been recognised over the remainder of the vesting period.
1 January 2009**
Amendment to IAS 32 Financial Instruments: Presentation*
This amendment is in respect of the balance sheet classification of puttable financial instruments and obligations arising only on liquidation. Some financial instruments that currently meet the definition of a financial liability may be classified as equity if they represent the last residual interest in the net assets of an entity.
1 January 2009**
* This IFRS or IFRIC Interpretation has not yet been endorsed by the European Union.
** The Group has not yet made a final decision as to whether it will apply in the 2008 financial statements those pronouncements marked (**) in the table above.

www.standardchartered.com
Fin
an
cia
l S
tate
men
ts a
nd
No
tes t
o t
he A
cco
un
ts
1159
56. UK and Hong Kong Accounting Requirements
As required by the HK Listing Rules, an explanation of the differences in accounting practices between EU endorsed IFRS and Hong Kong Financial Reporting Standards is summarised below.
There would be no significant differences had these accounts been prepared in accordance with Hong Kong Financial
Reporting Standards. As set out in note 55, EU endorsed IFRS may differ from IFRSs published by the International Accounting Standards Board if a standard has not been endorsed by the European Union.

Standard Chartered Annual Report and Accounts 2007
Supplementary Financial Information
1160
Average Balance Sheets and Yield The following tables set out the average balances and yields for the Group’s assets and liabilities for the years ended 31 December 2007 and 31 December 2006. For the purpose of the following table, average balances have generally been determined on the basis of daily balances, except for certain
categories, for which balances have been determined less frequently.
The Group does not believe that the information presented in this table would be significantly different had such balances been determined on a daily basis.
2007
Averagenon-interest
earningbalance$million
Averageinterestearningbalance$million
Interest income $million
Grossyield
%
Assets
Cash and balances at central banks 5,910 3,087 39 1.3
Gross loans and advances to banks 2,602 31,446 1,975 6.3
Gross loans and advances to customers 1,324 152,555 10,812 7.1
Impairment provisions against loans and advances to banks and customers (1,629) – – –
Investment securities 2,666 66,131 3,350 5.1
Property, plant and equipment and intangible assets 3,263 – – –
Prepayments, accrued income and other assets 36,996 – – –
Total average assets 51,132 253,219 16,176 6.4
2006
Average non-interest
earning balance $million
Average interest earning balance $million
Interest income $million
Gross yield
%
Assets
Cash and balances at central banks 4,736 959 29 3.0
Gross loans and advances to banks 1,715 23,528 1,177 5.0
Gross loans and advances to customers 308 128,278 9,049 7.1
Impairment provisions against loans and advances to banks and customers (1,723) – – –
Investment securities 628 58,721 2,732 4.7
Property, plant and equipment and intangible assets 6,610 – – –
Prepayments, accrued income and other assets 26,186 – – –
Total average assets 38,460 211,486 12,987 6.1

www.standardchartered.com
Su
pp
lem
en
tary
Fin
an
cia
l In
form
atio
nSupplementary Financial Information continued
Average Balance Sheets and Yield continued 2007
Averagenon-interest
bearingbalance$million
Average interest bearing balance $million
Interest expense $million
Rate paid%
Liabilities
Non-interest bearing current and demand accounts 18,004 – – –
Interest bearing current accounts and savings deposits – 65,718 1,508 2.3
Time and other deposits 547 112,616 6,049 5.4
Debt securities in issue 1,302 26,637 1,543 5.8
Accruals, deferred income and other liabilities 46,566 – – –
Subordinated liabilities and other borrowed funds – 14,220 811 5.7
Minority interests 425 – – –
Shareholders’ funds 18,316 – – –
Total average liabilities and shareholders’ funds 85,160 219,191 9,911 4.5
Net yield 1.9
Net interest margin 2.5
2006
Averagenon-interest
bearingbalance$million
Average interest bearing balance $million
Interest expense $million
Rate paid%
Liabilities
Non-interest bearing current and demand accounts 13,742 – – –
Interest bearing current accounts and savings deposits – 52,893 1,567 3.0
Time and other deposits 632 98,501 4,263 4.3
Debt securities in issue 2,326 24,610 1,186 4.8
Accruals, deferred income and other liabilities 31,238 – – –
Subordinated liabilities and other borrowed funds – 12,711 643 5.1
Minority interests 420 – – –
Shareholders’ funds 14,369 – – –
Total average liabilities and shareholders’ funds 62,727 188,715 7,659 4.1
Net yield 2.1
Net interest margin 2.5
1161

Standard Chartered Annual Report and Accounts 2007
Supplementary Financial Information continued
Volume and Price Variances The following table analyses the estimated change in the Group’s net interest income attributable to changes in the average volume of interest-earning assets and interest-bearing liabilities, and changes in their respective interest rates for the periods presented. Volume and rate variances have been determined
based on movements in average balances and average exchange rates over the period and changes in interest rates on average interest-earning assets and average interest-bearing liabilities. Variances caused by changes in both volume and rate have been allocated to changes in volume.
2007 versus 2006
Increase/(decrease) in interest due to:
Volume $million
Rate $million
Netincrease/
(decrease)in interest
$million
Interest earning assets
Cash and unrestricted balances at central banks 27 (17) 10
Loans and advances to banks 498 300 798
Loans and advances to customers 1,724 39 1,763
Investment securities 378 240 618
Total interest earning assets 2,627 562 3,189
Interest bearing liabilities
Subordinated liabilities and other borrowed funds 86 82 168
Interest bearing current accounts and savings deposits 294 (353) (59)
Time and other deposits 762 1,024 1,786
Debt securities in issue 118 239 357
Total interest bearing liabilities 1,260 992 2,252
2006 versus 2005
Increase/(decrease) in interest due to:
Volume $million
Rate $million
Netincrease
in interest$million
Interest earning assets
Cash and unrestricted balances at central banks 11 10 21
Treasury bills and other eligible bills
Loans and advances to banks (99) 424 325
Loans and advances to customers 1,893 1,006 2,899
Investment securities 724 268 992
Total interest earning assets 2,529 1,708 4,237
Interest bearing liabilities
Subordinated liabilities and other borrowed funds 97 24 121
Interest bearing current accounts and savings deposits 391 563 954
Time and other deposits 873 813 1,686
Debt securities in issue 101 382 483
Total interest bearing liabilities 1,462 1,782 3,244
Continuing Connected Transactions As noted in the Directors’ Report on page 66 the Group is required to include in this Annual Report information regarding certain transactions with Temasek.
During the year to 31 December 2007, members of the Group have entered into non-exempt continuing connected transactions (as defined by reference to the HK Listing Rules) with Temasek or its associates in the ordinary and usual course of its business and
on normal commercial terms (and with reference to prevailing market rates as applicable) or in accordance with the practice commonly adopted in the market (where applicable). These transactions are detailed in the tables on page 163. Additional details are provided on page 66 of the Report of the Directors. The increase in volume of transactions compared to 2006 is largely due to the inclusion of several new Temasek associates.
.
1162

www.standardchartered.com
Su
pp
lem
en
tary
Fin
an
cia
l In
form
atio
n
Continuing Connected Transactions continued
Year to 31 December 2007*
Transaction Category Notes
Aggregate notional value/
principal amounts during
the year$million
Notional value of outstanding
transactions or principal
amounts as at 31 December 2007 $million
Fair value of outstanding transactions
as at 31 December
2007 $million
Total number of transactions during the year
Total numberof Temasek associates with whom
transactions were entered
Foreign exchange i 145,160 5,843 (9) 17,157 83
Derivatives ii 66,734 21,467 (530) 5,294 29
Capital markets dealing iii 1,665 – – 832 12
Physical commodity dealing iv 18 – – 8 2
Financial assistance by non-banking licensed subsidiaries v 16 – – 1 1
Period from 20 July 2006 to 31 December 2006
Transaction Category Notes
Aggregate notional value/
principal amounts during the period
$million
Notional value of outstanding
transactions or principal
amounts as at 31 December 2006 $million
Fair value of outstanding
transactions as at 31 December
2006 $million
Total number of transactions
during the period
Total numberof Temasek
associates with whom
transactions were entered
Foreign exchange i 15,916 1,119 4 2,650 44
Derivatives ii 8,827 2,555 19 755 16
Capital markets dealing iii 709 – – 125 13
Financial assistance by non-banking licensed subsidiaries v 14 14 – 1 1
Year to
31 December 2007*
Period from 20 July 2006
to 31 December 2006
Transaction Category Notes
Gross fee revenue to the Group
$million
Total number of Temasek
associates with whom transactions
were entered
Gross fee revenue to the Group
$million
Total number of Temasek
associates with whom transactions
were entered
Securities services vi 4.0 18 1.8 13
Cash management services vii 0.7 111 1.2 93
Trade services viii 2.9 74 0.5 19
Advisory and arranging services xi 1.5 10 0.2 2
* This data reflects transactions with Temasek or its associates (as defined by the HK Listing Rules) which the Group was able to identify within the extensive
Temasek group of companies as at 15 December 2007.
i Foreign exchange includes spot, forward and foreign exchange swap transactions.
ii Derivatives includes over-the-counter derivatives (including swaps, forwards, options and combinations thereof) on currencies, interest rates, commodities, credit risk, bonds, equities and any other classes of underlying prices, rates, indices or instruments.
iii Capital markets dealing includes sales, purchases and participations of securities, loans and other financial instruments.
iv Physical commodity dealing relates to financing transactions, such as inventory finance in which a member of the Group takes title to the relevant commodities, and have the benefit of the financial assistance exemptions in the HK Listing Rules. However, transactions entered into for hedging purposes in connection with commodity derivatives and some other transactions in physical commodities are not connected with a financing and are not, therefore, exempt under the HK Listing Rules.
v Financial assistance by non-banking subsidiaries includes the granting of credit, lending money, providing security for or guaranteeing a loan and transactions of a similar nature or directly related to the same, by members of the Group which are not licensed as banking companies which would otherwise have allowed them to benefit from the exemption for such transactions as is available to licensed banking companies under the HK Listing Rules.
vi Securities services includes custody, escrow agency, receiving bank, trustee, transfer agency, paying agency and funds administration services, derivatives clearing services and facilities for custody clients to lend their securities.
vii Cash management services includes account services (payments and collections), liquidity management services and clearing services.
viii Trade services includes trade services not involving credit exposure, such as export bills collection, advising of letters of credit, document preparation, processing and checking services and safekeeping of documents.
xi Advisory and arranging services includes corporate finance advisory services, arranging and advising on loans from third party lenders and public and private placements of securities (where the Group does not participate as lender, underwriter or subscriber).
1163

Standard Chartered Annual Report and Accounts 2007
Supplementary Financial Information continued
Five Year Summary
2007
$million
2006*
$million
2005
$million
2004**
$million
2003†
$million
Operating profit before impairment losses and taxation 4,852 3,824 3,050 2,533 2,097
Impairment losses on loans and advances and other credit risk provisions (761) (629) (319) (214) (536)
Other impairment (57) (15) (50) (68) (11)
Profit before taxation 4,035 3,178 2,681 2,251 1,550
Profit attributable to shareholders 2,841 2,278 1,946 1,578 1,024
Loans and advances to banks 35,365 19,724 21,701 16,687 13,354
Loans and advances to customers 154,266 139,300 111,791 72,019 59,744
Total assets 329,205 266,102 215,096 147,124 120,202
Deposits by banks 25,880 26,233 18,834 15,162 10,924
Customer accounts 179,760 147,382 119,931 85,093 73,767
Shareholders’ equity 20,851 16,853 11,882 9,105 7,529
Total capital resources1 37,192 30,096 22,682 16,837 14,110
Information per ordinary share
Basic earnings per share 201.1c 169.0c 148.5c 129.6c 82.0c
Normalised earning per share2 197.6c 170.7c 153.7c 124.6c 90.1c
Dividends per share 79.35c 71.04c 64.0c 57.5c 52.0c
Net asset value per share 1,374.2c 1,208.5c 897.3c 719.0c 588.0c
Ratios
Post-tax return on ordinary shareholders’ equity – normalised basis2 15.6% 16.9% 18.0% 18.6% 15.7%
Basic cost-income ratio 56.2% 55.6% 55.5% 52.9% 55.8%
Cost-income ratio – normalised basis2 56.0% 55.2% 54.5% 54.0% 53.6%
Capital ratios:
Tier 1 capital# 9.8% 8.3% 7.7% 8.6% 8.6%
Total capital# 16.7% 14.2% 13.6% 15.0% 14.5%
1 Shareholders’ funds, minority interests and subordinated loan capital.
2 Results on a normalised basis reflect the Group’s results, excluding amortisation and impairment of intangible assets, profits and losses of a capital nature, and
profits and losses on repurchase of share capital.
* Amounts have been restated as explained in note 51 on page 154.
** IFRS (excluding IAS 32 and 39).
† UK GAAP.
# Unaudited.
1164

www.standardchartered.com
Su
pp
lem
en
tary
In
form
atio
n
Shareholder Information
165
Dividend and Interest Payment Dates
Ordinary shares Final dividend Interim dividend(provisional only)
Results and dividend announced 26 February 2008 5 August 2008
Ex dividend date 5 March 2008 13 August 2008
Record date for dividend 7 March 2008 15 August 2008
Last date to elect for share dividend or to change standing instructions 18 April 2008 22 September 2008
Dividend payment date 16 May 2008 9 October 2008
Preference shares 1st half yearly dividend 2nd half yearly dividend
73/8 per cent Non-cumulative irredeemable preference shares of £1 each 1 April 2008 1 October 2008
81/4 per cent Non-cumulative irredeemable preference shares of £1 each 1 April 2008 1 October 2008
6.409 per cent Non-cumulative redeemable preference shares of $5 each 30 January 2008 30 July 2008
7.014 per cent Non-cumulative redeemable preference shares of $5 each 30 January 2008 30 July 2008
Annual General Meeting The Annual General Meeting will be held at 12 noon (UK time) (7.00 pm Hong Kong time) on Wednesday 7 May 2008 at The Plaisterers’ Hall, One London Wall, London EC2Y 5JU. Details of the business to be transacted at the AGM are included in the Notice of AGM.
Details of voting at the Company’s AGM and of proxy votes cast can be found on our website: www.standardchartered.com
Interim Results The interim results will be announced to the London Stock Exchange, the Stock Exchange of Hong Kong and put on our website: www.standardchartered.com
ShareCare ShareCare is available to shareholders on the Company’s United Kingdom register who have a United Kingdom address and bank account, and allows you to hold your Standard Chartered shares in a nominee account. Your shares will be held in electronic form so you will no longer have to worry about keeping your share certificates safe. If you join ShareCare you will still be invited to attend the Company’s AGM and receive your dividend at the same time as everyone else. ShareCare is free to join and there are no annual fees to pay. If you would like to receive more information please visit our website at http://investors.standardchartered.com/mypage.cfm or contact the shareholder helpline on 0870 702 0138.
Previous Dividend Payments
Dividend and financial year Payment date Dividend per
ordinary share Cost of one new ordinary share
under share dividend scheme
Interim 1998 16 October 1998 6.25p 587.2p
Final 1998 28 May 1999 14.50p 889.5p
Interim 1999 15 October 1999 6.75p 860.8p
Final 1999 26 May 2000 16.10p 797.9p
Interim 2000 13 October 2000 7.425p 974.3p
Final 2000 25 May 2001 17.71p No offer
Interim 2001 12 October 2001 12.82¢/8.6856p No offer
Final 2001 17 May 2002 29.10¢/19.91p £8.43/$12.32
Interim 2002 15 October 2002 14.10¢/9.023p £6.537/$10.215
Final 2002 13 May 2003 32.9¢/20.692p/HK$2.566 £6.884/$10.946
Interim 2003 10 October 2003 15.51¢/9.3625p/HK$1.205 £8.597/$14.242
Final 2003 14 May 2004 36.49¢/20.5277p/HK$2.8448 £8.905/$15.830
Interim 2004 8 October 2004 17.06¢/9.4851p/HK$1.3303 £9.546/$17.16958
Final 2004 13 May 2005 40.44¢/21.145p/HK$3.15156 £9.384/$17.947
Interim 2005 14 October 2005 18.94¢/10.7437p/HK$1.46911 £11.878/$21.3578
Final 2005 12 May 2006 45.06¢/24.9055p/HK$3.49343 £14.2760/$24.77885
Interim 2006 11 October 2006 20.83¢/11.14409p/HK$1.622699 £13.2360/$25.03589
Final 2006 11 May 2007 50.21¢/25.17397p/HK$3.926106 £14.2140/$27.42591
Interim 2007 10 October 2007 23.12¢/11.39043p/HK$1.794713 £15.2560/$30.17637

Standard Chartered Annual Report and Accounts 2007
Shareholder Information continued
166
Donating shares to ShareGift Shareholders who have a small number of shares can often find it uneconomical to sell them. An alternative is to consider donating them to the charity ShareGift (registered charity 1052686), which collects donations of unwanted shares until there are enough to sell and uses the proceeds to support UK charities. Further information can be obtained from the Company's Registrars or from ShareGift on 020 7930 3737 or from www.ShareGift.org. There is no implication for Capital Gains Tax (no gain or loss) when you donate shares to charity and UK taxpayers may be able to claim income tax relief on the value of their donation.
Bankers’ Automated Clearing System (BACS) Dividends can be paid straight into your bank or building society account. Please contact our registrar for a mandate form.
Registrars and Shareholder Enquiries If you have any enquiries relating to your shareholding and you hold your shares on the United Kingdom register, please contact our registrar Computershare Investor Services PLC, The Pavilions, Bridgwater Road, Bristol, BS99 6ZY. There is a shareholder helpline on 0870 702 0138. If you hold your shares on the Hong Kong branch register please contact Computershare Hong Kong Investor Services Limited at Rooms 1806-1807, 18th Floor, Hopewell Centre, 183 Queen’s Road East, Hong Kong. You can check your shareholding at: www.computershare.com
Chinese Translation If you would like a Chinese version of this Report and Accounts please contact:
Computershare Hong Kong Investor Services Limited at Rooms 1806-1807, 18th Floor, Hopewell Centre, 183 Queen’s Road East, Hong Kong.
183 18 1806-1807
Shareholders on the Hong Kong branch register who have asked to receive the Report and Accounts in either Chinese or English can change this election by contacting Computershare.
If there is a dispute between any translation and the English version of this Report and Accounts, the English text shall prevail.
Taxation Information on taxation applying to dividends paid to you if you are a shareholder in the United Kingdom, Hong Kong or the United States will be sent to you with your dividend documents.
Electronic Communications If you hold your shares on the United Kingdom register and in future you would like to receive the Report and Accounts electronically rather than by post, please register online at: www.standardchartered.com/investors. Then click on Update Shareholder Details and follow the instructions. You will need to have your Shareholder or ShareCare Reference number when you log on. You can find this on your share certificate or ShareCare statement.
Forward Looking Statements It is possible that this document could or may contain forward looking statements that are based on current expectations or beliefs, as well as assumptions about future events. These forward looking statements can be identified by the fact that they do not relate only to historical or current facts. Forward looking statements often use words such as anticipate, target, expect, estimate, intend, plan, goal, believe, will, may, should, would, could or other words of similar meaning. Undue reliance should not be placed on any such statements because, by their very nature, they are subject to known and unknown risks and uncertainties and can be affected by other factors that could cause actual results, and the Group’s plans and objectives, to differ materially from those expressed or implied in the forward looking statements.
There are several factors which could cause actual results to differ materially from those expressed or implied in forward looking statements. Among the factors that could cause actual results to differ materially from those described in the forward looking statements are changes in the global, political, economic, business, competitive, market and regulatory forces, future exchange and interest rates, changes in tax rates and future business combinations or dispositions.
The Group undertakes no obligation to revise or update any forward looking statement contained within this document, regardless of whether those statements are affected as a result of new information, future events or otherwise.
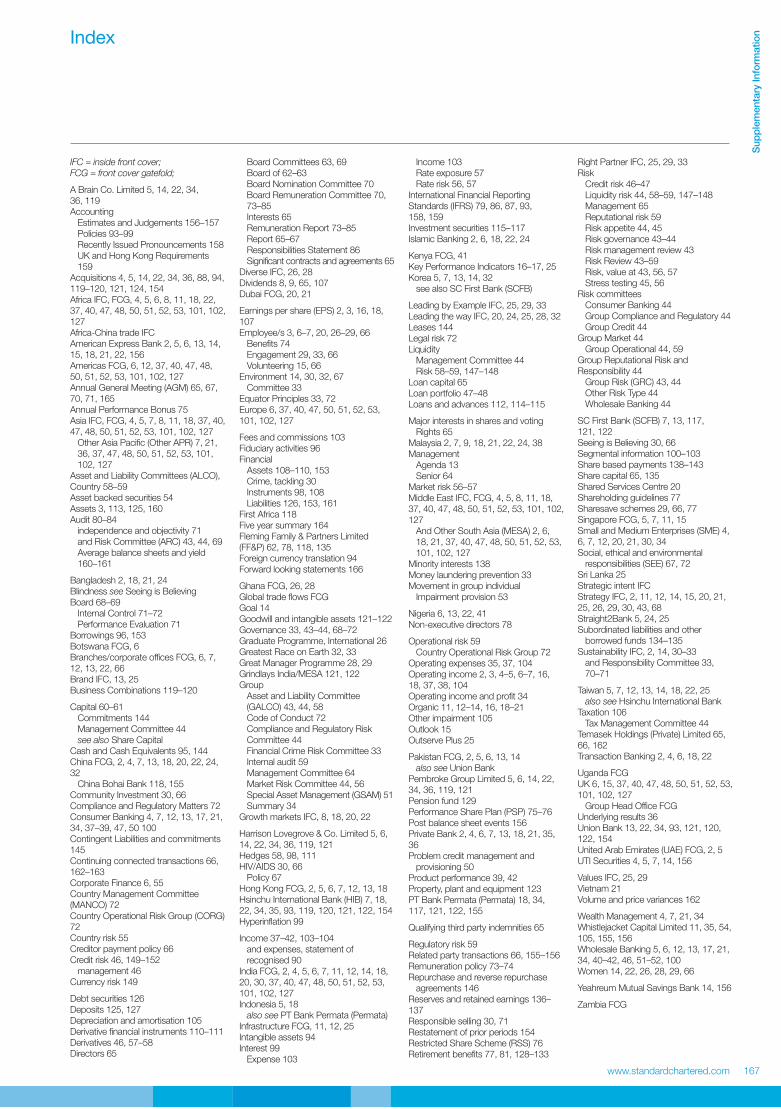
IFC = inside front cover;FCG = front cover gatefold;
A Brain Co. Limited 5, 14, 22, 34,36, 119AccountingEstimates and Judgements 156–157Policies 93–99Recently Issued Pronouncements 158UK and Hong Kong Requirements159
Acquisitions 4, 5, 14, 22, 34, 36, 88, 94,119–120, 121, 124, 154Africa IFC, FCG, 4, 5, 6, 8, 11, 18, 22,37, 40, 47, 48, 50, 51, 52, 53, 101, 102,127Africa-China trade IFCAmerican Express Bank 2, 5, 6, 13, 14,15, 18, 21, 22, 156Americas FCG, 6, 12, 37, 40, 47, 48,50, 51, 52, 53, 101, 102, 127Annual General Meeting (AGM) 65, 67,70, 71, 165Annual Performance Bonus 75Asia IFC, FCG, 4, 5, 7, 8, 11, 18, 37, 40,47, 48, 50, 51, 52, 53, 101, 102, 127Other Asia Pacific (Other APR) 7, 21,36, 37, 47, 48, 50, 51, 52, 53, 101,102, 127
Asset and Liability Committees (ALCO),Country 58–59Asset backed securities 54Assets 3, 113, 125, 160Audit 80–84independence and objectivity 71and Risk Committee (ARC) 43, 44, 69Average balance sheets and yield160–161
Bangladesh 2, 18, 21, 24Blindness see Seeing is BelievingBoard 68–69Internal Control 71–72Performance Evaluation 71
Borrowings 96, 153Botswana FCG, 6Branches/corporate offices FCG, 6, 7,12, 13, 22, 66Brand IFC, 13, 25Business Combinations 119–120
Capital 60–61Commitments 144Management Committee 44see also Share Capital
Cash and Cash Equivalents 95, 144China FCG, 2, 4, 7, 13, 18, 20, 22, 24,32China Bohai Bank 118, 155
Community Investment 30, 66Compliance and Regulatory Matters 72Consumer Banking 4, 7, 12, 13, 17, 21,34, 37–39, 47, 50 100Contingent Liabilities and commitments145Continuing connected transactions 66,162–163Corporate Finance 6, 55Country Management Committee(MANCO) 72Country Operational Risk Group (CORG)72Country risk 55Creditor payment policy 66Credit risk 46, 149–152management 46
Currency risk 149
Debt securities 126Deposits 125, 127Depreciation and amortisation 105Derivative financial instruments 110–111Derivatives 46, 57–58Directors 65
Board Committees 63, 69Board of 62–63Board Nomination Committee 70Board Remuneration Committee 70,73–85Interests 65Remuneration Report 73–85Report 65–67Responsibilities Statement 86Significant contracts and agreements 65
Diverse IFC, 26, 28Dividends 8, 9, 65, 107Dubai FCG, 20, 21
Earnings per share (EPS) 2, 3, 16, 18,107Employee/s 3, 6–7, 20, 26–29, 66Benefits 74Engagement 29, 33, 66Volunteering 15, 66
Environment 14, 30, 32, 67Committee 33
Equator Principles 33, 72Europe 6, 37, 40, 47, 50, 51, 52, 53,101, 102, 127
Fees and commissions 103Fiduciary activities 96FinancialAssets 108–110, 153Crime, tackling 30Instruments 98, 108Liabilities 126, 153, 161
First Africa 118Five year summary 164Fleming Family & Partners Limited(FF&P) 62, 78, 118, 135Foreign currency translation 94Forward looking statements 166
Ghana FCG, 26, 28Global trade flows FCGGoal 14Goodwill and intangible assets 121–122Governance 33, 43–44, 68–72Graduate Programme, International 26Greatest Race on Earth 32, 33Great Manager Programme 28, 29Grindlays India/MESA 121, 122GroupAsset and Liability Committee(GALCO) 43, 44, 58Code of Conduct 72Compliance and Regulatory RiskCommittee 44Financial Crime Risk Committee 33Internal audit 59Management Committee 64Market Risk Committee 44, 56Special Asset Management (GSAM) 51Summary 34
Growth markets IFC, 8, 18, 20, 22
Harrison Lovegrove & Co. Limited 5, 6,14, 22, 34, 36, 119, 121Hedges 58, 98, 111HIV/AIDS 30, 66Policy 67
Hong Kong FCG, 2, 5, 6, 7, 12, 13, 18Hsinchu International Bank (HIB) 7, 18,22, 34, 35, 93, 119, 120, 121, 122, 154Hyperinflation 99
Income 37–42, 103–104and expenses, statement ofrecognised 90
India FCG, 2, 4, 5, 6, 7, 11, 12, 14, 18,20, 30, 37, 40, 47, 48, 50, 51, 52, 53,101, 102, 127Indonesia 5, 18also see PT Bank Permata (Permata)
Infrastructure FCG, 11, 12, 25Intangible assets 94Interest 99Expense 103
Income 103Rate exposure 57Rate risk 56, 57
International Financial ReportingStandards (IFRS) 79, 86, 87, 93,158, 159Investment securities 115–117Islamic Banking 2, 6, 18, 22, 24
Kenya FCG, 41Key Performance Indicators 16–17, 25Korea 5, 7, 13, 14, 32see also SC First Bank (SCFB)
Leading by Example IFC, 25, 29, 33Leading the way IFC, 20, 24, 25, 28, 32Leases 144Legal risk 72LiquidityManagement Committee 44Risk 58–59, 147–148
Loan capital 65Loan portfolio 47–48Loans and advances 112, 114–115
Major interests in shares and votingRights 65
Malaysia 2, 7, 9, 18, 21, 22, 24, 38ManagementAgenda 13Senior 64
Market risk 56–57Middle East IFC, FCG, 4, 5, 8, 11, 18,37, 40, 47, 48, 50, 51, 52, 53, 101, 102,127And Other South Asia (MESA) 2, 6,18, 21, 37, 40, 47, 48, 50, 51, 52, 53,101, 102, 127
Minority interests 138Money laundering prevention 33Movement in group individualImpairment provision 53
Nigeria 6, 13, 22, 41Non-executive directors 78
Operational risk 59Country Operational Risk Group 72
Operating expenses 35, 37, 104Operating income 2, 3, 4–5, 6–7, 16,18, 37, 38, 104Operating income and profit 34Organic 11, 12–14, 16, 18–21Other impairment 105Outlook 15Outserve Plus 25
Pakistan FCG, 2, 5, 6, 13, 14also see Union Bank
Pembroke Group Limited 5, 6, 14, 22,34, 36, 119, 121Pension fund 129Performance Share Plan (PSP) 75–76Post balance sheet events 156Private Bank 2, 4, 6, 7, 13, 18, 21, 35,36Problem credit management andprovisioning 50
Product performance 39, 42Property, plant and equipment 123PT Bank Permata (Permata) 18, 34,117, 121, 122, 155
Qualifying third party indemnities 65
Regulatory risk 59Related party transactions 66, 155–156Remuneration policy 73–74Repurchase and reverse repurchaseagreements 146
Reserves and retained earnings 136–137Responsible selling 30, 71Restatement of prior periods 154Restricted Share Scheme (RSS) 76Retirement benefits 77, 81, 128–133
Right Partner IFC, 25, 29, 33RiskCredit risk 46–47Liquidity risk 44, 58–59, 147–148Management 65Reputational risk 59Risk appetite 44, 45Risk governance 43–44Risk management review 43Risk Review 43–59Risk, value at 43, 56, 57Stress testing 45, 56
Risk committeesConsumer Banking 44Group Compliance and Regulatory 44Group Credit 44
Group Market 44Group Operational 44, 59
Group Reputational Risk andResponsibility 44Group Risk (GRC) 43, 44Other Risk Type 44Wholesale Banking 44
SC First Bank (SCFB) 7, 13, 117,121, 122Seeing is Believing 30, 66Segmental information 100–103Share based payments 138–143Share capital 65, 135Shared Services Centre 20Shareholding guidelines 77Sharesave schemes 29, 66, 77Singapore FCG, 5, 7, 11, 15Small and Medium Enterprises (SME) 4,6, 7, 12, 20, 21, 30, 34Social, ethical and environmentalresponsibilities (SEE) 67, 72
Sri Lanka 25Strategic intent IFCStrategy IFC, 2, 11, 12, 14, 15, 20, 21,25, 26, 29, 30, 43, 68Straight2Bank 5, 24, 25Subordinated liabilities and otherborrowed funds 134–135
Sustainability IFC, 2, 14, 30–33and Responsibility Committee 33,70–71
Taiwan 5, 7, 12, 13, 14, 18, 22, 25also see Hsinchu International Bank
Taxation 106Tax Management Committee 44
Temasek Holdings (Private) Limited 65,66, 162Transaction Banking 2, 4, 6, 18, 22
Uganda FCGUK 6, 15, 37, 40, 47, 48, 50, 51, 52, 53,101, 102, 127Group Head Office FCG
Underlying results 36Union Bank 13, 22, 34, 93, 121, 120,122, 154United Arab Emirates (UAE) FCG, 2, 5UTI Securities 4, 5, 7, 14, 156
Values IFC, 25, 29Vietnam 21Volume and price variances 162
Wealth Management 4, 7, 21, 34Whistlejacket Capital Limited 11, 35, 54,105, 155, 156Wholesale Banking 5, 6, 12, 13, 17, 21,34, 40–42, 46, 51–52, 100Women 14, 22, 26, 28, 29, 66
Yeahreum Mutual Savings Bank 14, 156
Zambia FCG
Index
Sup
plemen
tary
Inform
ation
www.standardchartered.com 167

168 Standard Chartered Annual Report and Accounts 2007
The Asset Triple A
Best Transaction Bank inKorea – SC First Bank
Best Domestic Custodianin Korea – SC First Bank
Best Structured TradeFinance Bank
Best Sub-Custodian inIndonesia, Korea and Thailand
Best Asian CurrencyBond House
Best Securitisation House
Rising Star M&A House
Best Project Finance House
Best Debt House in Singapore
Best Debt House in Thailand
Best Loan House
Banking & Financial ServicesIn-House Team of the Year
Singapore In-House Teamof the Year
Best Structured Deal: Start II($1.6 billion) and Start III($1.5 billion), CollateralisedLoan Obligations
Best Synthetic CLO: Start II($1.6 billion) and Start III($1.5 billion), CollateralisedLoan Obligations
Best Local Currency CBO:Polaris and BOOC, NT$12.225billion, Five-year CBO Notes
Best Cash Management Deal:Prudential Corporation Asia,Pan Asia Cash ManagementMandate
Best Deal in India: Corus byTata Steel, $13 billion,Acquisition Financing
Best Convertible Bond: TataSteel Convertible Alternative,$875 million, Joint Bookrunner
Best Syndicated Loan: Corusby Tata Steel, $13 billion,Acquisition Financing
Best Cross-borderSecuritisation: Sealane,$3 billion, Trade FinanceSecuritisation
The Banker Awards 2007
Bank of the Year for Africa
Bank of the Year forAfghanistan
Bank of the Year for Botswana
Bank of the Year for Pakistan
Bank of the Year forSierra Leone
Bank of the Year for Tanzania
Bank of the Year for Zambia
Angola Deal of the Year:Sonangol Sinopec International,$1.4 billion, Term Loan Facility
Ghana Deal of the Year: AfricanDevelopment Bank, GHC414.9billion, Eurobond CrossCurrency Swap
Kenya Deal of the Year: TiominResources, $201 million,Project Financing
Zambia Deal of the Year:Lumwana Copper Project,$584 million, Project Financing
Saudi Arabia Deal of the Year:SABIC, $1.73 billion & $700million, Commercial Facility andECA-covered Facility
Singapore Deal of the Year:Start III, $1.5 billion,Collateralised Loan Obligations
India Deal of the Year: ReliancePetroleum, $2 billion, GreenfieldRefinery Financing
Oman Deal of the Year: OmaniGovernment, $925 million, RealEstate Bond Financing
Euromoney IslamicFinance Awards 2007
Most Improved InternationalIslamic Bank
Euromoney Awardsfor Excellence 2007
Best Emerging Markets Bank
Best Bank in Africa
Best Bank in Ghana
Project Finance Dealsof the Year 2007
African Oil & Gas Deal of theYear: Addax PetroleumCorporation, $1.5 billion,Acquisition Financing
African Transport/Ports Dealof the Year: Djibouti
Best Power Deal for Africa:Bujagali Energy Limited
Middle East Refinancing Dealof the Year: SEGAS
Middle East ManufacturingDeal of the Year: EMAL
Middle East IWPP Deal ofthe Year: Marafiq
Middle East Oil & Gas Dealof the Year: Qatargas 4
Middle East IPP Deal ofthe Year: Mesaieed
Asia-Pacific Acquisition Dealof the Year: Corus by TataSteel, $13 billion, AcquisitionFinancing
Asia-Pacific PetrochemicalsDeal of the Year: HMC
Asia-Pacific RenewablesDeal of the Year: Sinan Solar
Latin America PowerDeal of the Year: Ventanas
Latin America Oil & Gas Dealof the Year: Schahin Drilling
FinanceAsia AchievementAwards 2007
Best Foreign Bank in Korea
Best Local CurrencyBond House
Best India Deal: Vodafone, $12billion, Acquisition Financing
Deal of the Year: Corus byTata Steel, $13 billion,Acquisition Financing
Best M&A Deal: Corus byTata Steel, $13 billion,Acquisition Financing
Best Cross-border M&A Deal:Corus by Tata Steel, $13 billion,Acquisition Financing
Best Securitisation Deal:Sealane, $3 billion,Trade Finance Securitisation
Global Investor Awards 2007
Best Sub-Custodianin Bangladesh
Best Sub-Custodian in China
Best Sub-Custodianin Hong Kong
Best Sub-Custodianin South Korea
Best Sub-Custodianin Sri Lanka
Major Awards 2007

Designed by Black Sun Plc
Printed in the UK by Beacon Press usingtheir pureprint® environmental technology onRevive 75 Silk containing 75% recovered fibreand FSC mixed sources accredited. All theelectricity used in the production of this reportwas generated from renewable sources andvegetable based inks were used throughout.Beacon Press is a CarbonNeutral® companyand registered to the Environmental Manage-ment System, ISO 14001 and EMAS, the EcoManagement and Audit Scheme.This document is fully recyclable.
Global Finance
Best Foreign Exchange Bankin Gambia 2007
Best Trade Finance Bankin Singapore
Best Emerging Market Bankin Botswana 2007
Best Emerging Market Bankin Zambia 2007
Best Interest Rate DerivativesProvider
Best Bank for LiquidityManagement in Africa(includes cross-borderpooling & netting)
Best Bank for RiskManagement in Africa
Best Bank in Botswana
Best Bank in Zambia
Best Corporate/InstitutionalInternet Bank in Asia Pacific:Bangladesh, Hong Kong,Korea, Nepal and Pakistan
Best Corporate/InstitutionalInternet Bank in MiddleEast/Africa: Bahrain, Botswana,Ghana, Jordan, Kenya, Qatar,Sierra Leone, Tanzania,Uganda, Zimbabwe
Best Corporate Internet Bankin Asia Pacific, Europe andNorth America
Best Internet Bank for TradeFinance Services in Asia Pacific,Middle East/Africa, Europe andNorth America
Best Internet Bank for Web SiteDesign in Asia Pacific, MiddleEast/Africa, Europe
Best Integrated CorporateBank Site in North America
Regional Winner: BestCorporate/Institutional InternetBank - Asia Pacific Region
Global Sub-Category Winner:Best Corporate/InstitutionalInternet Bank – Best TradeFinance Services
Global Winner: BestCorporate/InstitutionalInternet Bank
IFR Asia Awards 2007
Domestic Bond House
Syndicated Loan: Corus byTata Steel, $13 billion,Acquisition Financing
Leveraged Loan: Corus byTata Steel, $13 billion,Acquisition Financing
India Bond Deal: Indian Hotel,Rs3 billion, 3-year Non-Convertible Debenture
Philippines Capital MarketsDeal: Metrobank, PHP10 billion,Lower Tier 2 Sub-Bond
PFI Awards 2007
Bank of the Year in Asia Pacific
Best Oil and Gas Deal in theAmericas: Black Gold Drilling,$800 million, Mandated LeadArranger
Best Mining Deal in Asia Pacific:Phu Kham and Phu Bia, $242million, Lead Arranger
Best Power Deal in MESA:Marafiq IWPP, $3.443 billion,Mandated Lead Arranger
Best Industry Deal in MESA:Emirates Aluminium, $4.6billion, Mandated LeadArranger
Trade Finance Awardsfor Excellence 2007
Best Trade Finance Bankin Sub-Saharan Africa
Asian Legal BusinessSouthEast Asia Awards 2007
Project Finance Deal of theYear: Reliance Petroleum,$2 billion, Greenfield RefineryFinancing
Asiamoney Dealsof the Year 2007
Best Securitisation: Sealane,$3 billion, Trade FinanceSecuritisation
Best Syndicated Loan: CorusGroup, $7.5 billion, AcquisitionRefinancing
Best Leveraged Finance:Binariang GSM, $7.1 billion,Acquisition Financing
The Asian BankerAwards 2007
Best Deposit Product in AsiaPacific and Gulf States –Standard Chartered Bank,Singapore – XtraSaver
Excellence in RetailBanking Award – StandardChartered Bank, Singapore
Best Retail Banker of theYear – Mike DeNoma,Group Executive Director,Standard Chartered
Asian BankingFinancial Awards 2007Standard Chartered Bank,Singapore:
– Singapore Retail Bankof the Year
– Best Credit Card Initiative:Platinum Access
– Best Branch Initiative:VivoCity Branch
– Best Advertising Campaign:XtraSaver
Global BusinessCoalition Awards 2007
2007 Award for BusinessExcellence using corecompetencies to combatHIV/AIDS, Tuberculosisand Malaria
Sup
plemen
tary
Inform
ation

Getmoreon lineAs part of our policy to minimise our environmentalimpact, we have provided more information on lineabout our business.
A guide to our websiteInformation on the Groupwww.standardchartered.comOur website contains comprehensiveinformation on Standard Chartered.
Log on to find out more about our innovativeproduct offerings and financial solutions.
Investor informationhttp://investors.standardchartered.comYou will find detailed information on our corporategovernance practices, current debt ratings andrecent press releases on this section of ourwebsite. The on-line version of our AnnualReport and Accounts can also be found here.
Information on building a sustainable businesswww.standardchartered.com/sustainabilityWe have just relaunched the sustainability sectionof our website. On this site you will find details ofour approach to building a sustainable business,policies and procedures and progress againstour priorities.
Our approach to people managementwww.standardchartered.com/sustainability/great-place-to-workTo find out more about our approach to peoplemanagement and career opportunities atStandard Chartered, please log on to our website.
The information here includes Diversity andInclusion, employee engagement and how wedevelop, reward and recognise our employees.
For more information visit:www.standardchartered.com