
Molecular Orientation of Asphaltenes and PAH Model Compounds in Langmuir−Blodgett Films Using Sum...
10
rXXXX American Chemical Society A dx.doi.org/10.1021/la200466b | Langmuir XXXX, XXX, 000–000 ARTICLE pubs.acs.org/Langmuir Molecular Orientation of Asphaltenes and PAH Model Compounds in LangmuirBlodgett Films Using Sum Frequency Generation Spectroscopy A. Ballard Andrews,* ,† Arthur McClelland, ‡ Oona Korkeila, †,§ Alexander Demidov, ‡ Amber Krummel, ||,^ Oliver C. Mullins, † and Zhan Chen # † Schlumberger-Doll Research, Cambridge, Massachusetts, United States ‡ Northeastern University, Boston, Massachusetts, United States § Helsinki University of Technology, Helsinki, Finland ) Harvard University, Cambridge, Massachusetts, United States ^ Colorado State University, Fort Collins, Colorado, United States # University of Michigan, Ann Arbor, Michigan, United States 1. INTRODUCTION Recovery factors in oil fields are well-known to be rather small. For example, in many fields, only 22% of the original oil in place is recovered by current methods. Even small increases in recovery could result in vast increases in produced crude oil, for example, by enhanced oil recovery (EOR) methods. 1 In particular, in large carbonate reservoirs in the Middle East, it is well-known that rock wettability controls irreducible oil saturation in the reservoir rock; much more oil can be recovered from water wet formations. Furthermore, the wettability changes from oil wet in the oil zone to water wet in the water zone; this wettability change often occurs continuously through an extended zone of mixed wettability. 2 These mixed wettability zones can contain one-half of the current field reserves in giant Middle East reservoirs. Consequently, any ability to alter wettability even if only subtly could result in huge increases in oil production. There have been many predominantly phenomenological studies establishing the interfacial activity of asphaltenes with high energy surfaces such as water. 35 There have been far fewer studies that are sensitive to the molecular orientation of asphal- tenes at the interface. Langmuir isotherms for asphaltene films on water coupled with Brewster angle microscopy (BAM) have been used to imply molecular orientations of asphaltenes. 69 The data has been interpreted as consistent with the asphaltenes or polycyclic aromatic hydrocarbons (PAHs) tilted at some angle with respect to the surface normal, rather than a flat-on arrange- ment parallel to the interface. The evidence against a flat-on geometry is based partly on the small mean molecular area (MMA) per molecule observed in the Langmuir isotherms, which can be interpreted as due to the stacking of the molecules with either a head-on or edge-on orientation at the interface. 613 As noted by several authors, 811 inferring the orientation from the MMA is reliable only when a monolayer is present. The formation of nanoaggregates 14 in solution prior to spreading or during the compression phase provides an alternative explana- tion for the observed small MMA. It is evident that the asphaltene dispersion in the bulk toluene prior to evaporation, whether molecular, nanocolloidal, or cluster dispersion, has a pronounced Received: February 3, 2011 Revised: March 18, 2011 ABSTRACT: Asphaltenes are an important class of compounds in crude oil whose surface activity is important for establishing reservoir rock wettability which impacts reservoir drainage. While many phenomenological interfacial studies with crude oils and asphaltenes have been reported, there is very little known about the molecular level interactions between asphaltenes and mineral surfaces. In this study, we analyze LangmuirBlodgett films of asphaltenes and related model compounds with sum frequency generation (SFG) vibrational spectroscopy. In SFG, the polariza- tion of the input (vis, IR) and output (SFG) beams can be varied, which allows the orientation of different functional groups at the interface to be determined. SFG clearly indicates that asphaltene polycyclic aromatic hydrocarbons (PAHs) are highly oriented in the plane of the interface and that the peripheral alkanes are transverse to the interface. In contrast, model compounds with oxygen functionality have PAHs oriented transverse to the interface. Computational quantum chemistry is used to support corresponding band assignments, enabling robust determination of functional group orientations.
-
Upload
independent -
Category
Documents
-
view
5 -
download
0
Transcript of Molecular Orientation of Asphaltenes and PAH Model Compounds in Langmuir−Blodgett Films Using Sum...

rXXXX American Chemical Society A dx.doi.org/10.1021/la200466b | Langmuir XXXX, XXX, 000–000
ARTICLE
pubs.acs.org/Langmuir
Molecular Orientation of Asphaltenes and PAH Model Compounds inLangmuir�Blodgett Films Using Sum Frequency GenerationSpectroscopyA. Ballard Andrews,*,† Arthur McClelland,‡ Oona Korkeila,†,§ Alexander Demidov,‡ Amber Krummel,||,^
Oliver C. Mullins,† and Zhan Chen#
†Schlumberger-Doll Research, Cambridge, Massachusetts, United States‡Northeastern University, Boston, Massachusetts, United States§Helsinki University of Technology, Helsinki, Finland
)Harvard University, Cambridge, Massachusetts, United States^Colorado State University, Fort Collins, Colorado, United States#University of Michigan, Ann Arbor, Michigan, United States
1. INTRODUCTION
Recovery factors in oil fields are well-known to be rather small.For example, in many fields, only 22% of the original oil in place isrecovered by current methods. Even small increases in recoverycould result in vast increases in produced crude oil, for example, byenhanced oil recovery (EOR) methods.1 In particular, in largecarbonate reservoirs in the Middle East, it is well-known that rockwettability controls irreducible oil saturation in the reservoir rock;much more oil can be recovered from water wet formations.Furthermore, the wettability changes from oil wet in the oil zoneto water wet in the water zone; this wettability change often occurscontinuously through an extended zone ofmixed wettability.2 Thesemixed wettability zones can contain one-half of the current fieldreserves in giant Middle East reservoirs. Consequently, any ability toalter wettability even if only subtly could result in huge increases inoil production.
There have been many predominantly phenomenologicalstudies establishing the interfacial activity of asphaltenes withhigh energy surfaces such as water.3�5 There have been far fewerstudies that are sensitive to the molecular orientation of asphal-tenes at the interface. Langmuir isotherms for asphaltene films on
water coupled with Brewster angle microscopy (BAM) havebeen used to imply molecular orientations of asphaltenes.6�9
The data has been interpreted as consistent with the asphaltenesor polycyclic aromatic hydrocarbons (PAHs) tilted at some anglewith respect to the surface normal, rather than a flat-on arrange-ment parallel to the interface. The evidence against a flat-ongeometry is based partly on the small mean molecular area(MMA) per molecule observed in the Langmuir isotherms,which can be interpreted as due to the stacking of the moleculeswith either a head-on or edge-on orientation at the interface.6�13
As noted by several authors,8�11 inferring the orientation fromthe MMA is reliable only when a monolayer is present. Theformation of nanoaggregates14 in solution prior to spreading orduring the compression phase provides an alternative explana-tion for the observed smallMMA. It is evident that the asphaltenedispersion in the bulk toluene prior to evaporation, whethermolecular, nanocolloidal, or cluster dispersion, has a pronounced
Received: February 3, 2011Revised: March 18, 2011
ABSTRACT: Asphaltenes are an important class of compoundsin crude oil whose surface activity is important for establishingreservoir rock wettability which impacts reservoir drainage.Whilemany phenomenological interfacial studies with crude oils andasphaltenes have been reported, there is very little known aboutthe molecular level interactions between asphaltenes and mineralsurfaces. In this study, we analyze Langmuir�Blodgett films ofasphaltenes and related model compounds with sum frequencygeneration (SFG) vibrational spectroscopy. In SFG, the polariza-tion of the input (vis, IR) and output (SFG) beams can be varied,which allows the orientation of different functional groups at theinterface to be determined. SFG clearly indicates that asphaltene polycyclic aromatic hydrocarbons (PAHs) are highly oriented in theplane of the interface and that the peripheral alkanes are transverse to the interface. In contrast, model compounds with oxygenfunctionality have PAHs oriented transverse to the interface. Computational quantum chemistry is used to support corresponding bandassignments, enabling robust determination of functional group orientations.

B dx.doi.org/10.1021/la200466b |Langmuir XXXX, XXX, 000–000
Langmuir ARTICLE
impact on the resulting Langmuir film. Consequently, possiblemolecular orientation of asphaltenes must be considered withregard to the initial concentration of asphaltenes in toluene.15
Studies of PAH model compounds have reached similar con-clusions.11,12 Perylene tetracarboxylic acid derivatives (PTCDs)form stable Langmuir�Blodgett (LB) films and provide usefulanalogues for comparison with asphaltenes.10�14 In PTCDs theπ orbital overlap facilitates π�π stacking with an intermoleculardistance of 3.4 Å.13 Excimer emission and UV�vis absorption ofLB films indicate a stacking formation at the water interface, andthis organization is transferable to LB films.12�14 TheMMA fromΠ�A isotherms is smaller than expected for a flat-on configura-tion, and the consensus is that these molecules must be orien-tated either head-on or edge-on with the PAH core tilted at anangle with respect to the surface normal. Columnar stacking hasalso been reported for a perylene bisimide derivative, with anaverage of 11 molecules per nanoaggregate at 40C.13 In additionto interesting semiconductor properties and practical applica-tions, PTCDs have many similarities with the chemical moietiesfound in the asphaltene fraction. Table 1 lists the full names andstructures of the model compounds investigated in this study,
and Table 2 lists some of the similarities they have with asphaltenes:properties of the twomodel compounds are calculated directly fromthe molecular structure; for UG8 (column 3�6), the averages arecalculated from quantitative 13C NMR measurements.28
When attempting to determine the molecular orientation ofasphaltenes at the interface, it is important to consider asphaltenemolecular architecture. This topic is still being debated in theliterature; nevertheless, there appears to be convergence frommany different analytical methods.16,17 Themost probable size ofasphaltene PAHs is seven fused rings as given by direct molecularimaging using scanning tunneling microscopy18 and transmis-sion electron microscopy.19 This is consistent with a comparisonof asphaltene absorption and emission spectra with exhaustivemolecular orbital calculations20 and with molecular dynamicssimulations.21 Time-resolved fluorescence depolarization mea-surements and fluorescence correlation spectroscopy showedthat the diffusion constants of asphaltenes are comparable toPTCDs.22�24 Both ultrahigh resolution mass spectrometry andtwo-color photoionizationmass spectrometry are consistent witha single PAH.25,26 In addition, electron impact unimoleculardecomposition of asphaltenes also shows that island molecular
Table 1. Names, Chemical Formulas, Molecular Weights, and Structures of the Three Compounds Examined in This Studya
a For the UG8 asphaltene sample, the structure is hypothetical and the MW is the average of the distribution based on the predominant evidence.

C dx.doi.org/10.1021/la200466b |Langmuir XXXX, XXX, 000–000
Langmuir ARTICLE
architecture dominates asphaltenes.27 The SFG data hereinprovides a test of the asphaltene molecular architecture in thata single large PAH compound is compatible with a high degree ofmolecular alignment at the interface.
Sum frequency generation (SFG) vibrational spectroscopy29�38
is a second-order nonlinear optical technique that is inherentlysurface specific because of its selection rule.Under the electric dipoleapproximation, SFG signal intensity is proportional to the square ofthe second order nonlinear susceptibility χ(2) of the material. Thisχ(2) is a polar third-rank tensor, which changes sign under theinversion operation: χ(2)(r) = �χ(2)(�r). For any materials withinversion symmetry, nothing will be changed under the inversionoperation: χ(2)(r) = χ(2)(�r). The only possible solution for theabove two equations is χ(2) = 0. Therefore, for materials withinversion symmetry, no SFG signal is detected (under the electricdipole approximation). Most bulk materials generally do haveinversion symmetry, because various functional groups in thesebulk materials more or less have a random orientation distributionand thus they would not generate SFG signals. However, formolecules or functional groups on surfaces or at interfaces, becauseinversion symmetry is broken at the surface/interface, the equationof χ(2)(r) = χ(2)(�r) is not valid anymore. Here, χ(2) does not needto be zero, and SFG signals can be detected. Moreover, the SFGsurface/interface sensitivity is not determined by the penetrationdepth of the input laser beams on the sample. Even when the inputlaser beams can penetrate the entire sample, only molecules on thesurface or at the interface contribute to the signal due to the SFGselection rule. In summary, SFG is allowed at interfaces or surfaceswhere inversion symmetry is broken, but it is forbidden in bulkmedia where it is intact. Therefore, the bulk produces no SFGcontribution, even if the interface is buried.33,34
In a typical SFG experiment, a visible (ωVIS) beam and a fre-quency tunable infrared beam (ωIR) are overlapped (temporally andspatially) on the sample (a surface or an interface). Light generated atthe sumof these two frequencies,ωSUM=ωVISþωIR, is collected. Inan SFG spectrum, the intensity of the sum frequency signal beam isplotted as a function of the input IR wavenumber. When thefrequency of the input infrared beammatches a vibrational resonanceofmolecules on the surface (or at the interface), the SFGsignal canbeenhanced.Therefore, a SFGspectrum is similar to aFourier transforminfrared (FTIR) or Raman spectrum. By selecting the polarization ofthe input (vis, IR) and output (SFG) beams, the orientation ofdifferent functional groups at the interface can be probed.
As mentioned, the SFG signal intensity is proportional to thesquare of the second order nonlinear susceptibility of the mediumwhich can be decomposed into a nonresonant and resonant term:χ(2) = χNR þ χR, where χR depends on the density of surfacemolecules, their orientations, and the hyper-polarizability β. TheSFG intensity is described by eq 1, where Aq is the oscillatorstrength, ωq is the resonant frequency, and Γ is the line width.The intensity is enhanced when ωIR is in resonance with the SF-active mode, as described above. The complex term can lead to
constructive or destructive interferences in the SFG spectrum.
Isfg �
�����χð2ÞNR þ χð2ÞR
�����
2
¼�����χð2ÞNR þ ∑
q
Aq
ωIR �ωq þ iΓ
�����
2
ð1Þ
Aq is proportional to the product of the Raman and IR transitionmatrix elements. Thus, SFG vibrational modes are active onlyif they are both IR and Raman active. The SSP (SSFGSvisPIR)polarization combination probes surface vibrational modes with aprojection dipole moment perpendicular to the interface. Amaximum is achieved when every molecule is aligned with itsvibrational dipole component directed along the surface. The SPSpolarization combination accesses modes that have transitiondipole components parallel to the surface. If polarization isneglected, the SFG response can be approximated as a productof the IR and Raman intensities, which is useful for interpreting theSFG spectra.
2. METHODS
The full names, molecular structures, and MWs of the model com-pounds investigated in the present study are listed in Table 1. Violan-throne-78 (V-78) was dissolved in toluene from powdered samples(Sigma-Aldrich). The perylene derivative N-(1-hexylheptyl)-N0-(5-car-boxylic-pentyl)-perylene-3,4,9,10-tetracarboxylicbisimide (C5Pe) wassynthesized and purified according to methods detailed by Nordgardet al. (ref 10 and references therein). Asphaltenes were extracted from ablack oil (UG-8) using standard procedures. Briefly, an oil sample wasdiluted 1:40 in n-heptane and stirred for 24 h. Asphaltenes were extractedfrom the solution by vacuum filtration through a nylon filter with 1.2 μmpores and were washed with additional n-heptane until the wash solventwas colorless. Note that asphaltene floc sizes range from 1 to 400 μm;consequently, they will not pass through a 1.2 μm filter (by Abram’s rule).The extracted asphaltenes were then resuspended in a small volume oftoluene. This solution was diluted 1:40 in n-heptane, and the asphalteneswere extracted as before. Finally, the asphaltenes were washed by extensiveSoxhlet extraction in n-heptane. All samples were dissolved in spectro-photometric grade toluene.
Surface pressure�area isotherms were recorded using a KSV Instru-ments Teflon mini-trough (225 mm2) equipped with double Delrinbarriers and a platinumWilhelmy plate. All experiments were conductedat room temperature at a neutral pH. Before each use, the troughassembly was cleaned with toluene and ethanol, and then rinsed withultrapure water. The pressure of the clean subphase at full compressionwas typically less than 0.1 mN/m. The MMA per molecule wascalculated by extrapolation from the slope of the isotherm in the solidphase. To prepare Langmuir�Blodgett films,39�42 the KSVmini-troughwas equipped with a dipping arm with a feedback system that adjusts thebarriers during deposition so that the surface concentration remainsconstant. Target pressures for LB depositions are listed in Table 3,column 5. For preliminary film characterization, thicker films weregrown on CaF2 windows (d = 25.38 mm, t = 5.59 mm) and FTIRspectra were collected between cycles. Spreading concentrations,
Table 2. Comparison of Selected Properties of UG8 Asphaltene and PAH Model Compoundsa
cmpd wt % C H:C atomic ratio carbon aromaticity % carbon aliphaticity % bridgehead aromatic carbon % aromatic PAH size
UG8 81.1 1.1 49.5* 50.5* 27.1* 28.5*
C5Pe 76.2 1.2 48 50 24 24
V-78 82.3 1.2 49 51 23 34a For UG8, entries marked with an asterisk (*) in columns 4�7 are obtained from quantitative 13C NMR measurements.28 For the model compounds,the entries are calculated directly from the structure.

D dx.doi.org/10.1021/la200466b |Langmuir XXXX, XXX, 000–000
Langmuir ARTICLE
injected volumes, surface pressures, and deposition types are listed inTable 3. The hydrophilic CaF2 substrates were positioned below thesubphase prior to spreading the solution on the surface of the subphasewith aHamilton syringe. Solvents were typically allowed to evaporate for20�30 min before beginning to compress the barriers until the targetpressure was reached. After this, we waited a further 10 min for thepressure to stabilize before beginning the deposition. Typical dippingspeeds were 1�2 mm/min. After each dipping cycle, the samples wereallowed to dry for at least 30 min before continuing. The transfer ratio iscalculated from the decrease in area divided by the coated area of thesolid substrate, τ = AL/AS. With a hydrophilic substrate, there are twopossible deposition patterns: in Y-type growth, layers are depositedhead-to-head and tail-to-tail; in Z-type growth, layers are depositedhead-to-tail.FTIR spectra of the thin films and powder samples were acquired with a
BrukerVertex 70 spectrometer equippedwith aPikeMIRacle attenuated totalreflection (ATR) accessory. A Norton-Beer apodization function withMertzphase correction and 4 cm�1 spectral resolutionwere employed. LB films as afunction of coverage were acquired in transmission mode by removing thedisk from the dipping arm holder and placing it in the FTIR sample chamberbetween odd numbered cycles. Long purging times (∼1 h) were required toremove atmospheric CO2 and H2O from the sample chamber prior toscanning, and consequently, a complete series took many hours to acquire. Aspectrum of the clean substrate was used as reference for each series. Forbackground removal, we used an (iterative) rubberband procedure with 64baseline points, which gave more consistent results than manual subtraction.SFG spectroscopy was performed using a Eksma system (Vilnius,
Lithuania) that has been described elsewhere.29�32 The system layout isshown in Figure 1. Briefly, the laser is operating at a 20Hz repetition rateand generates pulses that are 20 ps in duration. The Nd:YAG 1064 nmfundamental beam was frequency doubled to 532 nm for the visiblebeam that was used in the SFG experiments. Fundamental and tripledbeams were sent to an optical parametric oscillator/optical parametricamplifier/difference frequency generation (OPO/OPA/DFG) systemto produce the tunable infrared beam from 3 to 10 μm. Thin films of
3�5 layers were deposited onCaF2 prisms (Altos Photonics), and a neartotal internal reflection prism geometry was used to reduce sampledamage. SFG measurements were collected by overlapping the 532 nmand tunable IR beam at incident angles of 60� and 54� to the vertical faceof the prism respectively as shown in Figure 1.
For C5Pe and Violanthrone we calculated the infrared and Ramanspectra using the Gaussian 03 software package.43 Geometry optimiza-tion was done without symmetry restrictions. Gas phase density func-tional theory (DFT) methods with the Lee�Yang�Parr B3LYP hybridexchange-correlation functional44,45 and the 6-31G(d) basis set46�48
were employed. The calculations are for gas phase molecules, so therecould be noticeable differences with the solid phase, but our primarymotivation for performing the theoretical calculations was to identify thevibrational modes and their associated transition dipole moments(TDMs), and not to assess the accuracy of the computational model.
The product of the experimental infrared and Raman intensitiesshould resemble the SFG intensity if polarization effects are ignored, butPAH fluorescence prevented us from obtaining the experimental Ramanspectra. Therefore, we formed the product of the theoretical Raman andinfrared intensities (hereafter referred to as the RIRth) and compared itwith the SFG. A shortcoming of this procedure is that errors in thecalculated Raman spectra will affect the “predicted” SFG spectra. Weapplied a 20 cm�1 Doppler broadening to the calculated mode distribu-tions and scaled the wavenumbers with the factor 0.9614 determined byScott and Radom49 for the B3LYP functional and 6-31G(d) basis set.
3. RESULTS AND DISCUSSION
The Langmuir isotherm for V-78 (Figure 2) does not exhibit asharp liquid�solid transition, and a gradual collapse begins at35 mN/m. The MMA of 65 Å2 (Table 3) is consistent with anedge-on orientation; A flat-on configuration would result in a muchlarger MMA (for monolayer coverage). For PTCD, the minimumintermolecular distance (IMD) is estimated to be 3.4 Å.12,14 ForV-78, the IMD is likely to be larger because the steric repulsion of the
Table 3. Parameters Used for Langmuir�Blodgett Film Depositionsa
cmpd MMA (Å2) injected volume (μL) concentration (mg/mL) pressure (mN/m) deposition pattern
C5Pe 57 125 0.25 20 Y
V-78 65 300 0.1 20 Z
UG8 27 225 0.25 15 ZaThe deposition patterns are inferred from the transfer ratios as seen in Figure 3. For the hydrophilic CaF2 substrate, both Y and Z type are observed.
Figure 1. Experimental apparatus for SFG. A 20 Hz 20 ps Nd:YAG 1064 nm fundamental beam (red) is frequency doubled to 532 nm for the visiblebeam (green). Fundamental and tripled beams are sent to an OPO/OPA/DFG system to produce the tunable infrared beam from 3 to 10 μm. For amore complete description of the apparatus, see refs 30�32. Inset on the left-hand side illustrates the geometry for SFG measurements. LB films weredeposited on one side of the CaF2 prism. The 532 nm visible beam (ωvis) and the tunable infrared beam (ωir) are mixed on the sample surface, and theSFG (ωsfg) signal is detected.

E dx.doi.org/10.1021/la200466b |Langmuir XXXX, XXX, 000–000
Langmuir ARTICLE
two ester groups causes a twist in the core of the PAHat themidline.A slightly larger intermolecular separation of 3.6 Å (6%) would besufficient to explain our observed MMA of 65 Å2.
The isotherm for UG8 is also shown in Figure 2. The absence ofa liquid�solid phase transition in the UG-8 isotherm has beenobserved bymanyothers.3�11TheMMA is 27Å2 (Table 3), smallerthan that of V-78 or C5Pe. Fluorescence correlation spectroscopy(FCS) measurements of the translational diffusion constants foundthat the hydrodynamic radius of V-78 and PTCDs similar to C5Pewere 50% smaller on average than all petroleum derivedasphaltenes.22�24 If asphaltenes are stacked in a head-on or evenedge-on geometry, the MMA should be larger than that of C5Pe orV-78. There is strong evidence in the literature8,9 that the asphal-tenes form nanoaggregates in solution or during compression,resulting in a smaller apparent MMA.
Figure 3 shows the transfer ratios for the first few layers. ForC5Pe, we observed Y-type deposition (a). The two compoundswithout acid groups, V-78 and UG8 asphaltene, exhibited theZ-type deposition pattern (b,c). For C5Pe, evidently the acidgroup results in the Y type because the head�head interactionsare stronger than the tail�tail interactions and the molecule isable to invert during the immersion downstroke. For V-78 andUG8, the Z-type pattern indicates that there is greater conforma-tional stability in the monolayer, and no material is depositedduring immersion.
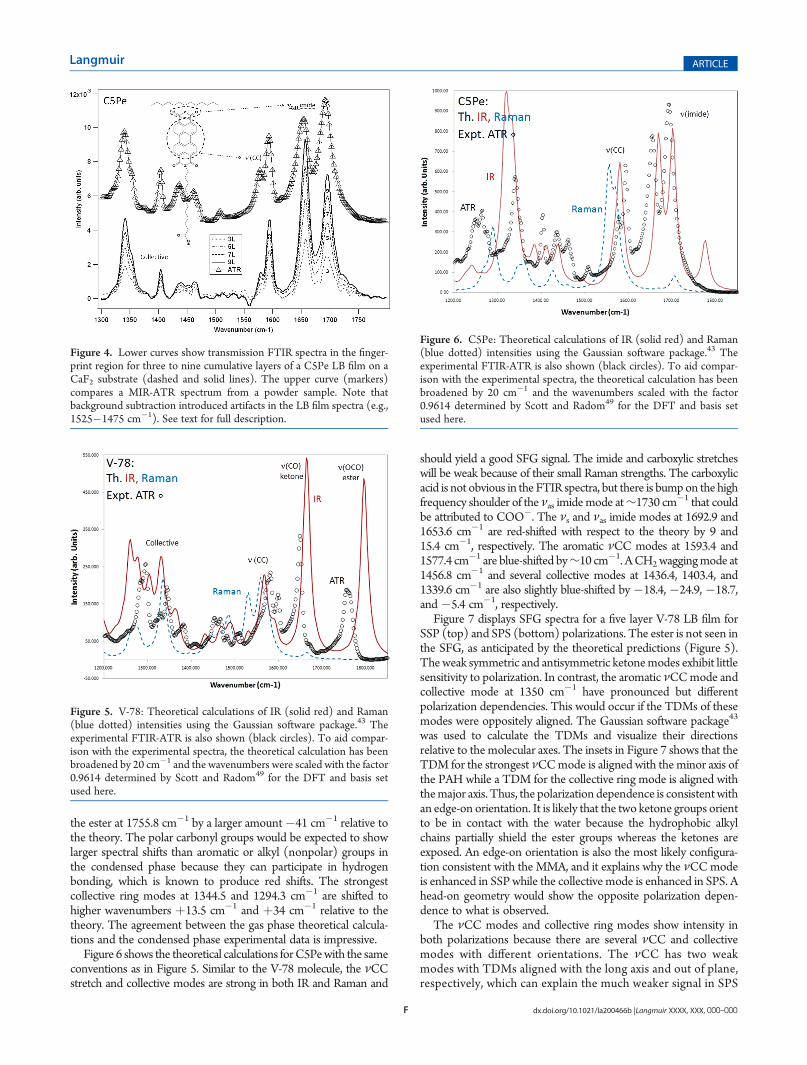
In the lower half of Figure 4, transmission FTIR spectra in thefingerprint region for three to nine cumulative layers of a C5PeLB film are displayed (dashed and solid lines). The peakintensities scale with increasing film thickness, but calibrationwas deemed unreliable because variations in the sample referenceoccurred between scans when the sample was repeatedly movedback and forth between the LB trough and the FTIR. Note thatbackground subtraction introduces some artifacts in the LB filmspectra (e.g., 1525�1475 cm�1). The upper half of Figure 4(solid line with markers) compares a mid-infrared (MIR) ATRspectrum from a powder sample. The powder spectrum is verysimilar to that of the film, except for the relative intensities of theνs and νas imide stretches.
Figure 5 shows the theoretical IR (solid red) and Raman (bluedotted) calculations for V-78; the experimental FTIR-ATR isalso shown (black circles). We note that the CC stretch andcollective (fingerprint) modes are excited in both IR and Ramanso we can anticipate that the SFG signal will also be strong forthese modes. The ketone and ester both have strong IR signalsbut their Raman signals are small, so these modes will be weak inSFG. There is good agreement between the theoretical andexperimental IR spectra for the aromatic νCC at 1580.6 cm�1.The ketone mode at 1648.5 cm�1 is red-shifted by�16 cm�1 and
Figure 2. Langmuir isotherms for V-78 and UG8. Neither V-78 norUG8 show a clear break in slope between the liquid and solid phases.The MMA of V-78 is smaller than that of UG8 (see Table 3 for C5Pe).Inset shows three possible orientations for a PAHmolecule adsorbed onthe CaF2 surface (alkyl chains not shown for clarity). In the edge-on andhead-on configurations, the molecular axis could be tilted with respect to(wrt) the surface normal.
Figure 3. Cumulative transfer ratios versus layer numbers for (a) C5Pe,(b) V-78, and (c) UG8. C5Pe exhibits Y-type deposition (upstroke anddownstroke), while V-78 and UG8 exhibit Z-type deposition (upstrokeonly). Spreading concentrations, injected volumes, surface pressures,and depositions patterns are listed in Table 3.
F dx.doi.org/10.1021/la200466b |Langmuir XXXX, XXX, 000–000
Langmuir ARTICLE
the ester at 1755.8 cm�1 by a larger amount�41 cm�1 relative tothe theory. The polar carbonyl groups would be expected to showlarger spectral shifts than aromatic or alkyl (nonpolar) groups inthe condensed phase because they can participate in hydrogenbonding, which is known to produce red shifts. The strongestcollective ring modes at 1344.5 and 1294.3 cm�1 are shifted tohigher wavenumbers þ13.5 cm�1 and þ34 cm�1 relative to thetheory. The agreement between the gas phase theoretical calcula-tions and the condensed phase experimental data is impressive.
Figure 6 shows the theoretical calculations forC5Pewith the sameconventions as in Figure 5. Similar to the V-78 molecule, the νCCstretch and collective modes are strong in both IR and Raman and
should yield a good SFG signal. The imide and carboxylic stretcheswill be weak because of their small Raman strengths. The carboxylicacid is not obvious in the FTIR spectra, but there is bumpon the highfrequency shoulder of the νas imidemode at∼1730 cm�1 that couldbe attributed to COO�. The νs and νas imide modes at 1692.9 and1653.6 cm�1 are red-shifted with respect to the theory by 9 and15.4 cm�1, respectively. The aromatic νCC modes at 1593.4 and1577.4 cm�1 are blue-shifted by∼10 cm�1. ACH2waggingmode at1456.8 cm�1 and several collective modes at 1436.4, 1403.4, and1339.6 cm�1 are also slightly blue-shifted by �18.4, �24.9, �18.7,and �5.4 cm�1, respectively.
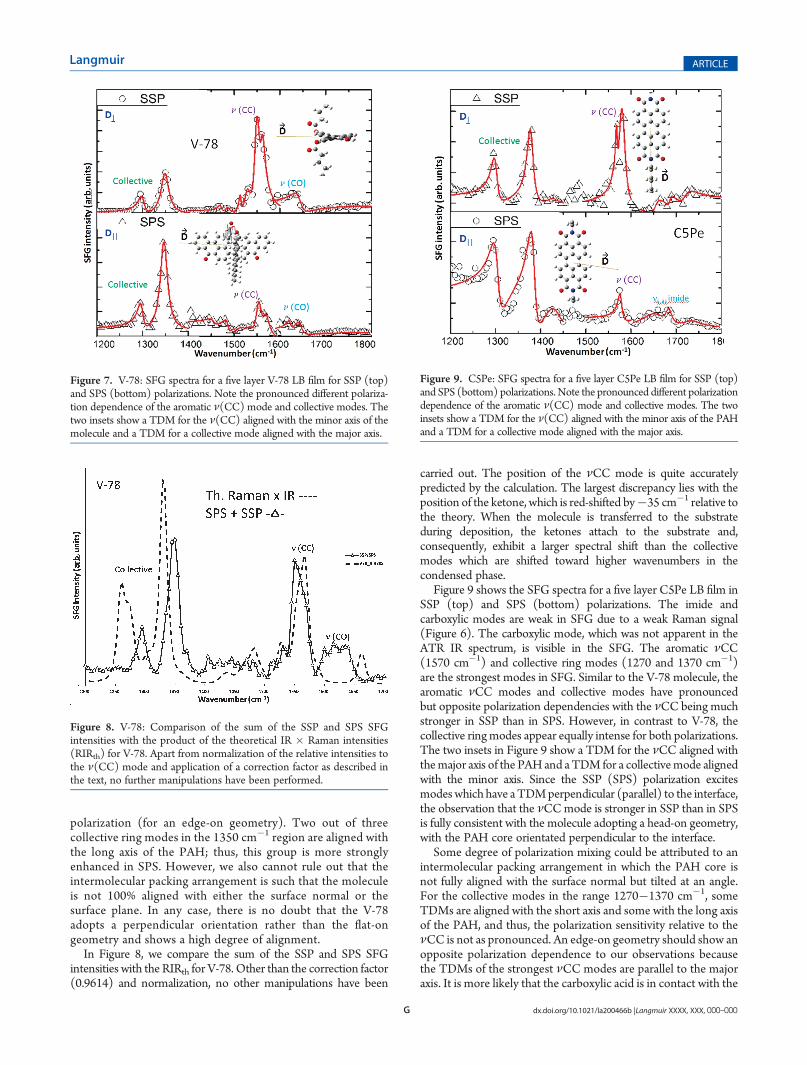
Figure 7 displays SFG spectra for a five layer V-78 LB film forSSP (top) and SPS (bottom) polarizations. The ester is not seen inthe SFG, as anticipated by the theoretical predictions (Figure 5).Theweak symmetric and antisymmetric ketonemodes exhibit littlesensitivity to polarization. In contrast, the aromatic νCCmode andcollective mode at 1350 cm�1 have pronounced but differentpolarization dependencies. This would occur if the TDMs of thesemodes were oppositely aligned. The Gaussian software package43
was used to calculate the TDMs and visualize their directionsrelative to the molecular axes. The insets in Figure 7 shows that theTDM for the strongest νCCmode is aligned with the minor axis ofthe PAH while a TDM for the collective ring mode is aligned withthemajor axis. Thus, the polarization dependence is consistentwithan edge-on orientation. It is likely that the two ketone groups orientto be in contact with the water because the hydrophobic alkylchains partially shield the ester groups whereas the ketones areexposed. An edge-on orientation is also the most likely configura-tion consistent with the MMA, and it explains why the νCCmodeis enhanced in SSPwhile the collective mode is enhanced in SPS. Ahead-on geometry would show the opposite polarization depen-dence to what is observed.
The νCC modes and collective ring modes show intensity inboth polarizations because there are several νCC and collectivemodes with different orientations. The νCC has two weakmodes with TDMs aligned with the long axis and out of plane,respectively, which can explain the much weaker signal in SPS
Figure 4. Lower curves show transmission FTIR spectra in the finger-print region for three to nine cumulative layers of a C5Pe LB film on aCaF2 substrate (dashed and solid lines). The upper curve (markers)compares a MIR-ATR spectrum from a powder sample. Note thatbackground subtraction introduced artifacts in the LB film spectra (e.g.,1525�1475 cm�1). See text for full description.
Figure 5. V-78: Theoretical calculations of IR (solid red) and Raman(blue dotted) intensities using the Gaussian software package.43 Theexperimental FTIR-ATR is also shown (black circles). To aid compar-ison with the experimental spectra, the theoretical calculation has beenbroadened by 20 cm�1 and the wavenumbers were scaled with the factor0.9614 determined by Scott and Radom49 for the DFT and basis setused here.
Figure 6. C5Pe: Theoretical calculations of IR (solid red) and Raman(blue dotted) intensities using the Gaussian software package.43 Theexperimental FTIR-ATR is also shown (black circles). To aid compar-ison with the experimental spectra, the theoretical calculation has beenbroadened by 20 cm�1 and the wavenumbers scaled with the factor0.9614 determined by Scott and Radom49 for the DFT and basis setused here.
G dx.doi.org/10.1021/la200466b |Langmuir XXXX, XXX, 000–000
Langmuir ARTICLE
polarization (for an edge-on geometry). Two out of threecollective ring modes in the 1350 cm�1 region are aligned withthe long axis of the PAH; thus, this group is more stronglyenhanced in SPS. However, we also cannot rule out that theintermolecular packing arrangement is such that the moleculeis not 100% aligned with either the surface normal or thesurface plane. In any case, there is no doubt that the V-78adopts a perpendicular orientation rather than the flat-ongeometry and shows a high degree of alignment.
In Figure 8, we compare the sum of the SSP and SPS SFGintensities with the RIRth for V-78. Other than the correction factor(0.9614) and normalization, no other manipulations have been
carried out. The position of the νCC mode is quite accuratelypredicted by the calculation. The largest discrepancy lies with theposition of the ketone, which is red-shifted by�35 cm�1 relative tothe theory. When the molecule is transferred to the substrateduring deposition, the ketones attach to the substrate and,consequently, exhibit a larger spectral shift than the collectivemodes which are shifted toward higher wavenumbers in thecondensed phase.
Figure 9 shows the SFG spectra for a five layer C5Pe LB film inSSP (top) and SPS (bottom) polarizations. The imide andcarboxylic modes are weak in SFG due to a weak Raman signal(Figure 6). The carboxylic mode, which was not apparent in theATR IR spectrum, is visible in the SFG. The aromatic νCC(1570 cm�1) and collective ring modes (1270 and 1370 cm�1)are the strongest modes in SFG. Similar to the V-78 molecule, thearomatic νCC modes and collective modes have pronouncedbut opposite polarization dependencies with the νCC being muchstronger in SSP than in SPS. However, in contrast to V-78, thecollective ringmodes appear equally intense for both polarizations.The two insets in Figure 9 show a TDM for the νCC aligned withthemajor axis of the PAHand aTDM for a collectivemode alignedwith the minor axis. Since the SSP (SPS) polarization excitesmodeswhich have aTDMperpendicular (parallel) to the interface,the observation that the νCCmode is stronger in SSP than in SPSis fully consistent with the molecule adopting a head-on geometry,with the PAH core orientated perpendicular to the interface.
Some degree of polarization mixing could be attributed to anintermolecular packing arrangement in which the PAH core isnot fully aligned with the surface normal but tilted at an angle.For the collective modes in the range 1270�1370 cm�1, someTDMs are aligned with the short axis and some with the long axisof the PAH, and thus, the polarization sensitivity relative to theνCC is not as pronounced. An edge-on geometry should show anopposite polarization dependence to our observations becausethe TDMs of the strongest νCC modes are parallel to the majoraxis. It is more likely that the carboxylic acid is in contact with the
Figure 7. V-78: SFG spectra for a five layer V-78 LB film for SSP (top)and SPS (bottom) polarizations. Note the pronounced different polariza-tion dependence of the aromatic ν(CC) mode and collective modes. Thetwo insets show a TDM for the ν(CC) aligned with the minor axis of themolecule and a TDM for a collective mode aligned with the major axis.
Figure 8. V-78: Comparison of the sum of the SSP and SPS SFGintensities with the product of the theoretical IR � Raman intensities(RIRth) for V-78. Apart from normalization of the relative intensities tothe ν(CC) mode and application of a correction factor as described inthe text, no further manipulations have been performed.
Figure 9. C5Pe: SFG spectra for a five layer C5Pe LB film for SSP (top)and SPS (bottom) polarizations. Note the pronounced different polarizationdependence of the aromatic ν(CC) mode and collective modes. The twoinsets show a TDM for the ν(CC) aligned with the minor axis of the PAHand a TDM for a collective mode aligned with the major axis.

H dx.doi.org/10.1021/la200466b |Langmuir XXXX, XXX, 000–000
Langmuir ARTICLE
water because it is more polar than the ketones. Thus, we believethat the head-on orientation is the most likely configurationconsistent with both theMMA and SFG.Only a head-on geometrycan explain both the enhanced signal from the νCC mode in SSPand the enhanced signal from the collective mode in SPS. In anycase, there is no doubt that the C5Pe adopts a perpendicularorientation rather than flat-on geometry and shows a high degree ofalignment.
Figure 10 shows a MIR-ATR powder spectrum of UG8asphaltene with the modes labeled. Figure 11 shows SFG data inthe same region for a LB asphaltenefilm. TheδCH2 andδCH3 areenhanced in SSP polarization, and the νCC is enhanced in SPS.In contrast to the model compounds, the asphaltenes appear to beanisotropic, and fully molecularly aligned at the interface, becausethe aliphatic modes are not visible in SPS and aromatic is absent inSSP. Thus, the data show unambiguously that the asphaltene PAHsare parallel to the interface while the asphaltene alkanes are per-pendicular to the interface.
In the model compounds, the polar or charged O moieties(C5Pe = 12.68%, V-78 = 9.4%) are in exposed and interfaciallyactive sites. In contrast, the oxygen content of asphaltenes isgenerally low (UG8 = 1.6%), with acid groups present only insmall concentrations. We speculate that other types of asphalteneswill orient similarly to UG8 because the variations in oxygencontent that are typically observed are small and therefore arenot likely to influence the alignment.
Sulfur is the predominant heteroatom; however, its species areless polar or charged in asphaltenes than eitherNorOand thereforeless likely to play a significant role in molecular orientation. Smallquantities of nitrogen are found in asphaltenes, all in pyrrole andpyridine type moieties;50 consequently, there is some chargeseparation in the asphaltene PAH. However, for most asphaltenemolecules, the aromatic core is the site of the greatest molecularpolarizability. Moreover, it is the polarizability that gives rise tomany of their properties.51 Thus, we believe it is the asphaltene ringsystem rather than the relative amount of heteroatoms whichdetermines the alignment.
It is not surprising that, without other strongly hydrophilicgroups, the asphaltene PAHwould align parallel with the interface.Moreover, it is expected and observed here by SFG thatthe asphaltene alkanes are perpendicular to the interface. Thisconsistency builds confidence that indeed the interpretation of theSFG data regarding asphaltene PAHs is correct. Theoreticalsupport for these observations is provided by recent moleculardynamics simulations of asphaltenes on a mineral surface.52
We note that very low initial concentrations (∼0.2 mg/mL)have been used to prepare the asphaltene film. The concentrationis below the critical nanoaggregate concentration (CNAC), andthus, a molecular dispersion of asphaltene in the Langmuir film isexpected. It is possible that during surface compression someaggregation occurs prior to LB deposition, consistent with theobserved small MMA. Nevertheless, these nanoaggregates thatcould form by surface compression may have a molecularorientation memory of the initial molecular dispersion. Thedeposition process could also affect the orientation because thestructure of the LB film at the water interface is transferred to thesubstrate. The asphaltenes are forced to the interface by tolueneevaporation so that a bulk film is obtained, not only the mostinterfacially active moieties. Determining orientation versusconcentration is likely a worthwhile future experiment.
4. CONCLUSIONS
The SFG results show that asphaltenes are highly oriented inLangmuir�Blodgett films with their PAH in plane and the alkylgroups out of plane. This result indicates that understandingasphaltene and petroleum interfacial science necessitates notonly a molecular understanding of asphaltenes but in additionrequires knowledge of molecular orientation, which SFG isuniquely positioned to provide. The measured orientation isconsistent with the “island” asphaltene molecular architecture,with a single somewhat large PAH per asphaltene molecule. Thismay be required to yield highly oriented aromatic carbon, since smallcross-linked PAHs would likely align less due to steric constraints.Thus, island architecture could yield the observed alignment, but ourresults do not prove the absence of archipelago structures since we
Figure 11. UG-8: SFG SSP (perpendicular) and SPS (parallel) inten-sities. The asphaltenes appear to be anisotropic and thus molecularlyaligned at the interface. The data show unambiguously that theasphaltene PAHs are parallel to the interface while the asphaltenealkanes are perpendicular to the interface. The inset shows a hypothe-tical asphaltene structure.Figure 10. UG-8: Experimental FTIR-ATR powder spectra corre-
sponding to the region probed by SFG. The carbonyl, ν(CC) aromatic,and aliphatic deformation modes are identified in the figure.

I dx.doi.org/10.1021/la200466b |Langmuir XXXX, XXX, 000–000
Langmuir ARTICLE
have not investigated these model compounds. Island model PAHcompounds also exhibit a high degree of molecular orientation,consistent with the above reasoning. However, due to differentfunctionality discussed below, the model compounds show differentorientation from that of asphaltenes.
SFG clearly demonstrates that the asphaltenes adopt anorientation that is transverse to the model compounds, withthe PAH core in parallel to the interface and the alkyl chainsperpendicular to the interface, in sharp contrast to the modelcompounds for which the PAH core is aligned in an edgeconfiguration. In contrast to asphaltenes, the model compoundsexamined here have oxygen functional groups. In addition, thesefunctional groups are either on the alkyl chains or at the edges ofthe core. For asphaltenes, there is little oxygen functionality, andperipheral substituents are predominantly alkane. The asphal-tenes also possess some polarity within the PAH due to nitrogenfunctionalities. These chemical structural differences plausiblygive rise to the opposite orientation of various model compoundsexamined here versus asphaltenes. Future work involving SFGneeds to investigate the role of asphaltene aggregation, and makeuse of atomically rough (mineral) surfaces associated with oil-bearing rock formations in order to connect basic science resultsherein with wettability impact on oil production. Nevertheless,these experiments represent a major step forward in treatingimportant phenomenology of petroleum interfacial science froma first principles approach.
’AUTHOR INFORMATION
Corresponding Author*E-mail: [email protected]. Phone: þ1 617 768 2154. Fax:þ1 617.768.2398.
’ACKNOWLEDGMENT
We would like to thank Prof. Mary Shultz (Tufts U.) formany discussions about SFG, Prof. Katarzyna M. Marzec(Jagiellonian U.) for calculations with an augmented basis set,and Dr. Sergey Shilov (Brucker Optics) for assistance withPM-IRRAS experiments.
’REFERENCES
(1) Sandrea, I.; Sandrea, R. Oil Gas J. 2007, 105, (42), 39–42.(2) Carnegie, A. Society of Petroleum Engineers, SPE# 99240, SPE/
DOE Symposium on Improved Oil Recovery, Tulsa, Oklahoma, 2006;DOI: 10.2118/99240-MS.(3) Zhang, L. Y.; Lawrence, S.; Xu, Z.; Masliyah, J. H. J. Colloid
Interface Sci. 2003, 264, 128–140.(4) Zhang, L. Y.; Lawrence, S.; Xu, Z.; Masliyah, J. H. Ind. Eng. Chem.
Res. 2005, 44, 1160–1174.(5) Cadena-Nava, R. D.; Cosultchi, A.; Ruiz-Garcia, J. Energy Fuels
2007, 21, 2129–2137.(6) Lobato, M. D.; Pedrosa, J. M.; Hortal, A. R.; Mar�tınez-Haya, B.;
Leb�ron-Aguilar, R.; Lagoa, S. Colloids Surf., A 2007, 298, 72–79.(7) Lobato, M. D.; Pedrosa, J. M.; Mobius, D.; Lago, S. Langmuir
2009, 25, 1377–1384.(8) Orbulescu, J.; Mullins, O. C.; Leblanc, R. M. Langmuir 2010,
26, 15257–15264.(9) Orbulescu, J.; Mullins, O. C.; Leblanc, R. M. Langmuir 2010,
26, 15265–15271.(10) Nordgard, E. L.; Landsem, E.; Sjoblom, J. Langmuir 2008,
24, 8742–8751.(11) Sorland, G. Langmuir 2010, 26, 2352–2360.
(12) Antunes, P. A.; Constantino, C. J. L.; Aroca, R. F.; Duff, J.Langmuir 2001, 12, 2958–2964.
(13) Constantino, C. J. L.; Antunes, P. A.; Oliveira, C. B.; Trsic, M.;Caracelli, I.; Aroca, R. F.Canadian J. Anal. Sci. and Spec. 2004, 49, 64–72.
(14) Wurthner, F.; Chen, Z.; Dehm, V.; Stepanenko, V. Chem.Commun. 2006, 1188–1190.
(15) Andreatta, G.; Bostrom,N.;Mullins,O. C.Langmuir 2005, 21, 272.(16) Mullins, O. C. Energy Fuels 2010, 24, 2179–2207.(17) Mullins, O. C. The Asphaltenes. Annu. Rev. Anal. Chem. 2011,
4, 393–418.(18) Zajac, G. W.; Sethi, N. K.; Joseph, J. T. Scanning Microsc. 1994,
8, 463.(19) Sharma, A.; Groenzin, H.; Tomita, A.; Mullins, O. C. Energy
Fuels 2002, 16, 490.(20) Ruiz-Morales, Y.;Mullins, O. C. Energy Fuels 2009, 23, 1169–1177.(21) Boek, E. S.; Yakovlev, D. S.; Headen, T. F. Energy Fuels 2009,
23, 1209–1219.(22) Groenzin, H.; Mullins, O. C. Energy Fuels 2000, 14, 677.(23) Schneider, M. H.; Andrews, A. B.; Mitra-Kirtley, S.; Mullins,
O. C. Energy Fuels 2007, 21, 2875–2882.(24) Andrews, A. B.; Guerra, R.; Mullins, O. C.; Sen, P. N. J. Phys.
Chem. A 2006, 110, 8095.(25) McKenna, A.M.; Purcell; J. M., Rodgers, R.P.; Marshall, A.G.
9th Int’l Conference on Petroleum Phase Behavior & Fouling, Victoria,B.C., Canada, Abstract #17, 2008.
(26) Sabbah, H.; Morrow, A. L.; Pomerantz, A. E.; Zare, R. N. EnergyFuels 2011, DOI: 10.1021/ef101522w.
(27) Borton, D; Pinkston, D. S.; Hurt, M. R.; Tan, X.; Azyat, K.;Scherer, A.; Tykwinski, R.; Gray, M.; Qian, K.; Kentt€amaa, H.I. EnergyFuels 2010, 24, 5548–5559.
(28) Andrews, A. B.; Edwards, J. C.; Pomerantz, D.; Mullins O. C.;and Norinaga, K. Energy Fuels, submitted.
(29) Shen, Y. R. Nature 1989, 337, 519–525.(30) Wang, J.; Chen, C. Y.; Buck, S.M.; Chen, Z. J. Phys. Chem. B 2001,
105, 12118–12125.(31) Wang, J.; Woodcock, S. E.; Buck, S. M.; Chen, C. Y.; Chen, Z.
J. Am. Chem. Soc. 2001, 123, 9470–9471.(32) Chen, C. Y.; Even, M. A.; Wang, J.; Chen, Z. Macromolecules
2002, 35, 9130–9135.(33) Walker, D. S.; Richmond, G. L. J. Phys. Chem. C 2008, 112, 201–
209.(34) Richmond, G. L. Annu. Rev. Phys. Chem. 2001, 52, 357–89.(35) Chen, Z.; Shen, Y. R.; Samorjai, G. A. Annu. Rev. Phys. Chem.
2002, 53, 437–465.(36) Richmond, G. L. Chem. Rev. 2002, 102, 2693–2724.(37) Shultz, M. J. Advances in Multi-photon Processes and Spectroscopy;
Lin, S. H., Villaeys, A. A. Fujimura, Y., Eds.; World Scientific: Singapore,Japan, 2008; Vol. 18, pp 133�200.
(38) Gopalakrishnan, S.; Liu, D.; Allen, H. C.; Kuo, M.; Shultz, M. J.Chem. Rev. 2006, 106, 1155–1175.
(39) Langmuir, I. J. Am. Chem. Soc. 1917, 39, 1848.(40) Blodgett, K. A. J. Am. Chem. Soc. 1935, 57, 1007.(41) Peterson, I. R. Langmuir Blodgett Films. J. Phys. D 1990,
23, 379–95.(42) Petty, C. P. Langmuir-Blodgett Films: An Introduction; Cambridge
University Press: Cambridge, UK, 1996.(43) Frisch, M. J.; Trucks, G. W.; Schlegel, H. B.; Scuseria, G. E.;
Robb, M. A.; Cheeseman, J. R.; Montgomery, J. A., Jr.; Vreven, T.;Kudin, K. N.; Burant, J. C.; Millam, J. M.; Iyengar, S. S.; Tomasi, J.;Barone, V.; Mennucci, B.; Cossi, M.; Scalmani, G.; Rega, N.; Petersson,G. A.; Nakatsuji, H.; Hada, M.; Ehara, M.; Toyota, K.; Fukuda, R.;Hasegawa, J.; Ishida, M.; Nakajima, T.; Honda, Y.; Kitao, O.; Nakai, H.;Klene, M.; Li, X.; Knox, J. E.; Hratchian, H. P.; Cross, J. B.; Bakken, V.;Adamo, C.; Jaramillo, J.; Gomperts, R.; Stratmann, R. E.; Yazyev, O.;Austin, A. J.; Cammi, R.; Pomelli, C.; Ochterski, J. W.; Ayala, P. Y.;Morokuma, K.; Voth, G. A.; Salvador, P.; Dannenberg, J. J.; Zakrzewski,V. G.; Dapprich, S.; Daniels, A. D.; Strain, M. C.; Farkas, O.; Malick,D. K.; Rabuck, A. D.; Raghavachari, K.; Foresman, J. B.; Ortiz, J. V.; Cui,

J dx.doi.org/10.1021/la200466b |Langmuir XXXX, XXX, 000–000
Langmuir ARTICLE
Q.; Baboul, A. G.; Clifford, S.; Cioslowski, J.; Stefanov, B. B.; Liu, G.;Liashenko, A.; Piskorz, P.; Komaromi, I.; Martin, R. L.; Fox, D. J.; Keith,T.; M. A. Al-Laham, Peng, C. Y.; Nanayakkara, A.; Challacombe, M.;Gill, P. M. W.; Johnson, B.; Chen, W.; Wong, M. W.; Gonzalez, C.; ,Pople, J. A. Gaussian 03, revision D.01; Gaussian, Inc.: Wallingford, CT,2004.(44) Becke, A. D. J. Chem. Phys. 1993, 98, 5648.(45) Lee, C.; Yang, W.; Parr, R. G. Phys. Rev. B 1988, 37, 785.(46) Ditchfield, R.; Hehre, W. J.; Pople, J. A. J. Chem. Phys. 1971,
54, 724.(47) Hehre, W. J.; Ditchfield, R.; Pople, J. A. J. Chem. Phys. 1972,
56, 2257.(48) Hariharan, P. C.; Pople, J. A. Theor. Chim. Acta 1973, 28, 213.(49) Scott, A. P.; Radom, L. J. Phys. Chem. 1996, 100, 16502.(50) Mitra-Kirtley, S.;Mullins, O.C.; Chen, J.; van Elp, J.; George, S. J.;
Cramer, S. P. J. Am. Chem. Soc. 1993, 115, 252.(51) Buckley, J. S.; Wang, J.; Creek, J. L. In Asphaltenes, Heavy Oils
and Petroleomics; Mullins, O. C., Sheu, E. Y., Hammami, A., Marshall,A. G., Eds.; Springer: New York, 2007; Chapter 16.(52) Headen, T. F.; Boek, E. S. Energy Fuels 2011, 25, 499–502.