Mono and multiparticulate Langmuir-Blodgett films prepared from surfactant-stabilized silver...
99
November 1995 Editors: D. De Rossi P. Calvert T. Tateishi Volume C3 No. 2 f 1 I c ISSN 0928-4931 Materials, Sensors and Systems Special Issue containing selected papers presented at Symposium S: Biomolecular and Biomimetic Materials MRS Fall Meeting, Boston, USA November 28 - December 2,1994 9951228 029 USrc»? STJHES tos fiUßMe rei@s " * ; i% ..,4S---r...i3><fei ELSEVIER
Transcript of Mono and multiparticulate Langmuir-Blodgett films prepared from surfactant-stabilized silver...
November 1995
Editors: D. De Rossi P. Calvert T. Tateishi
Volume C3 No. 2 f 1 I
c
ISSN 0928-4931
Materials, Sensors and Systems
Special Issue containing selected papers presented at Symposium S: Biomolecular and Biomimetic Materials MRS Fall Meeting, Boston, USA
November 28 - December 2,1994
9951228 029 USrc»? STJHES
tos fiUßMe rei@s
" * ;i% ..,4S---r...i3><fei
ELSEVIER
MATERIALS SCIENCE AND ENGINEERING C
Editors P. Calvert (Tucson, AZ, USA) D. De Rossi (Pisa, Italy) T. Tateishi (Ibaraki, Japan)
Associate Editors I. Aksay (Princeton, NJ, USA) G. Casalino (Genova, Italy) E. Chen (Research Triangle Park, NC, USA) H. Cruse (Bielefeld, Germany) F. Hedberg (Washington, DC, USA) I.W. Hunter (Montreal, Que., Canada) H. Komatsu (Sendai, Japan)
B. Lundstrom (Linkoping, Sweden) G. McVay (Richland, WA, USA) S. Mann (Bath, UK) J.E. Mark (Cincinnati, OH, USA) T. Matsuda (Osaka, Japan) T. Motokawa (Tokyo, Japan) F. Oosawa (Toyota, Japan) K. Persaud (Manchester, UK) CA. Rogers (Blacksburg, VA, USA) Y. Sakurai (Tokyo, Japan) S. Shankar Sastry (Berkeley, CA, USA) D. Tirrell (Amherst, MA, USA) T. Tsuruta (Tokyo, Japan) J.F.V. Vincent (Reading, UK)
Aims and Scope Materials Science and Engineering C, Biomimetic Materials, Sensors and Systems, is an international and interdisciplinary journal which reports on scientific and technical contributions dealing with all aspects of conceiving, designing, constructing and testing man-made materials, structures, devices and sys- tems which replicate or are inspired by biological entities and processes. These include, but are not limited to: Materials and Structures (e.g. mimicking biological design, synthesis or properties; self-assembled materials, biological manufacturingof materials) Sensors and Information Processes (e.g. artificial sensing and perception processes, biosensors) and Dynamics and Control Systems (e.g. artificial muscles, sup- port structures, smart structures and systems).
Types of contributions Original research work not already published; plenary lectures and/or individual papers given at conferences; reviews of spe- cialized topics within the scope of the journal; letters intended for rapid publication.
Submission of electronic text The final text may be submitted on a 3.5 in or 5.25 in diskette (in addition to a hard copy with original figures). Double density (DD) or high density (HD) diskettes are acceptable, but must be formatted to their capacity before the files are copied on to them. The main text, list of references, tables and figure leg- ends should be stored in separate text files with clearly iden- tifiable file names. The format of these files depends on the word processor used,^WocdPerfect §. 1 isthe most preferable but for other formats'please refer to the Instructions to Authors booklet. It is essential that the name and version of the word- processing program, type of computer on which the text was prepared, and format of the text files are clearly indicated. The final manuscript may contain last minute corrections which are not included in the electronic text but such correc- tions must be clearly marked on the hard copy.
Abstracting Services This journal is cited by the following Abstracting Services: Cambridge Scientific Abstracts; Chemical Engineering and Biotechnology Abstracts (online database); Current Biotech- nology Abstracts; Engineered Materials Abstracts; Engineer- ing Index; Fluid Abstracts; Fluidex; FIZ Karlsruhe; Glass Technology Abstracts; INSPEC Information Services; Metals Abstracts; Phys Database; Physics and Chemistry of Glasses; Surface Treatment Technology Abstracts.
Subscription information 1995 Volume 3 containing 4 issues is scheduled for publication. Prices are available from the publishers upon request. Sub- scriptions are accepted on a prepaid basis only. Issues are sent by SAL (Surface Air Lifted) mail wherever this service is available. Airmail rates are available upon request. Please address all requests regarding orders and subscription que- ries to:
ELSEVIER SCIENCE S.A.
P.O. Box 564,1001 Lausanne, Switzerland Telephone: +41 (21)320 73 81 Fax: +41 (21)323 54 44 Telex: 450 620 ELSA CH
Customers in the United States and Canada may obtain information from:
ELSEVIER SCIENCE INC. Attn.: Journal Information Center, 655 Avenue of the Americas New York, NY 10010, USA Telephone: +1 (212)633-3750 Fax: +1 (212)633-3764 Telex: 420-643 AEPUI
Special Issue containing selected papers presented at
Symposium S: Biomolecular and Biomimetic Materials MRS Fall Meeting, Boston, USA
November 28 - December 2,1994
Accesion For
NTIS CRA&I DTIC TAB Unannounced Justification
D D
By Distribution/
Availability Codes
DM
A'i
Avail and/or Special
DKG QtJAUT* wsB&mm t

This work relates to Department of Navy Grant N00014-95-1-0131 issued by the Office of Naval Research.
The United States Government has a royalty-free license throughout the world in all copyrightable material contained herein.
MATERIALS SCIENCE &
ENGINEERING
ELSEVIER Volume 3, Number 2, November 1995
Contents
Preface xi
Design and processing of ceramic-based analogs to the dental crown 63 L.F. Francis, K.J. Vaidya, H.Y. Huang, W.D. Wolf (Minneapolis, MN, USA)
Synthesis of ultrafine hydroxyapatite particles by a spray dry method 75 P. Luo, T.G. Nieh (Livermore, CA, USA)
A chemiluminescence-based biosensor for metal ion detection 79 S.D. Kamtekar, R. Pande, M.S. Ayyagari, K.A. Marx (Lowell, MA, USA), D.L. Kaplan (Natick, MA, USA), J. Kumar, S.K. Tripathy (Lowell, MA, USA)
Scanning force microscopy of gelatin films in the dry, swollen and redried states 85 G. Haugstad, W.L. Gladfelter (Minneapolis, MN, USA), E.B. Weberg, R.T. Weberg, T.D. Weatherill, R.R. Jones (Brevard, NC, USA)
Effect of sterilization on the structure and fatigue resistance of medical grade UHMWPE 91 L. Pruitt, R. Ranganathan (Berkeley, CA, USA)
Textural analysis of eggshells . 95 J.M. Garcfa-Ruiz, A. Rodriguez Navarro, O. Kälin (Granada, Spain)
A self-assembled collagen scaffold suitable for use in soft and hard tissue replacement 101 GD. Pins, F.H. Silver (Piscataway, NJ, USA)
The chemistry of polymer-clay hybrids 109 A. Okada, A. Usuki (Aichi, Japan)
Chitosan-calcium carbonate composites by a biomimetic process 117 S. Zhang, K.E. Gonsalves (Storrs, CT, USA)
Biomimicry of bamboo bast fiber with engineering composite materials 125 S.H. Li, Q.Y. Zeng, Y.L. Xiao, S.Y. Fu, B.L. Zhou (Shenyang, People's Republic of China)
Preparation of fibrin glue: the effects of calcium chloride and sodium chloride 131 M.-C. Wang, G.D. Pins, F.H. Silver (Piscataway, NJ, USA)
Template-assisted assembly of metal binding sites on a silica surface 137 K.-0. Hwang, Y. Yakura, F.S. Ohuchi, T. Sasaki (Seattle, WA, USA)
Scanning tunnelling microscopy imaging of the DNA base molecules on reduced SrTiO3(100) surfaces 143 H. Tanaka, T. Kawai (Osaka, Japan)
Mono- and multiparticulate Langmuir-Blodgett films prepared from surfactant-stabilized silver particles 149 F.C. Meldrum, N.A. Kotov, J.H. Fendler (Syracuse, NY, USA)
Cracking cholesterol from a phase transition at body temperatures 153 S. Kumar, S.J. Burns (Rochester, NY, USA)
The publisher encourages the submission of articles in electronic form thus saving time and avoiding rekeying errors. A leaflet describing our requirements is available from the publisher upon request.
Elsevier Science S.A.

3ÜÄ»® '"£?: iÄll "ÄTERIA1S ^mm'' SCIENCE & «SMSMMSH EMCIIIEERIMC
ELSEVIER Materials Science and Engineering: C 3 (1995) xi
Preface
This issue contains a group of papers presented at the Fall 1994 Materials Research Society meeting in the Symposium on Biomolecular and Biomimetic Materials. For the last seven years the MRS has organised a symposium, which deals with the biology/materials interface, during the Boston meeting. This annual event is probably the best regular survey of the various fields which can be grouped under the "Biomimetic" heading. The shift in emphasis each year also means that different areas come under the spotlight. In this last meeting there were particular emphases on membranes and interfaces and on applications of biological polymers. The next meeting will take place from November 27th-December 1 st in Boston. Symposium U is called "Materials Inspired by Biology" and the program can be seen via the network at http://www.mrs.org. Symposium V at the 1996 spring meeting also has a biomimetic component.
P.D. Calvert
Elsevier Science S.A.

MATERIALS SCIENCE &
ENGINEERING
ELSEVIER Materials Science and Engineering: C 3 (1995) 63-74
Design and processing of ceramic-based analogs to the dental crown
L.F. Francis *, K.J. Vaidya, H.Y. Huang, W.D. Wolf Department of Chemical Engineering and Materials Science, University of Minnesota, Minneapolis, MN 55455, USA
Abstract
The structure and properties of the crown of a human tooth were used as a model for the design and processing of dental restorative materials. The synthetic analog to the crown was composed of a dentin-like material (alumina-glass or alumina-polymer composite) and an enamel-like material (calcium phosphate-based coating). The dentin composites had high strength (~ 450 MPa and ~ 160 MPa for alumina- glass and alumina-PMMA composites, respectively) and good fracture toughness ( ~ 3.8 MPa m1/2 and ~ 3.3 MPa m1/2 for alumina-glass and alumina-PMMA composites, respectively). The calcium phosphate-based enamel region was roughly 80 /xm thick, dense and fully crystalline. Bonding between the dentin and enamel in the analog was accomplished in a manner similar to the dentinoenamel junction in the natural tooth. A region of interpentrating phases from the synthetic dentin and enamel coating was created and excellent bonding was achieved using a eutectic melt in the CaO-Al203-Si02 system.
Keywords: Tooth crown; Alumina-polymer composite; Dentinoenamel junction; Crystalline microstructure; CaO-Al203-Si02 system
1. Introduction
The natural dental crown is a remarkable example of natu- re's ability to design a complex, functional composite. The crown consists of three major regions: pulp, dentin and enamel, as illustrated in Fig. 1 [ 1,2]. Pulp is an organic, soft connective tissue; dentin and enamel are hard tissues com- posed of inorganic minerals and organic materials. The two hard tissues have dissimilar structures and properties, but they work together harmoniously as a single unit (the dentin- enamel complex). The properties and performance of dentin- enamel complex are owed to several levels of structural organization. On a microstructural level, dentin and enamel are each well designed organic-inorganic composites, and on a macrostructural level they are joined at an interface known as the dentinoenamel junction (DEJ). The two part macros- tructure, complex microstructures and the unique interfacial bonding result in a composite with strength, fracture tough- ness and a hard, durable outer surface. The goal of our research is to use features of the natural structure of the dentin-enamel complex to design and process ceramic-based dental replacement materials.
The effectiveness of the dentin-enamel complex is revealed by abrief examination of its histology and function- ing. Dentin is an intricate connective tissue with an average composition of ~50 vol.% inorganic crystals, 23 vol.%
* Corresponding author.
0928-4931/95/$09.50 © 1995 Elsevier Science S.A. All rights reserved SSDI0928-4931(95)00088-7
ENAMEL
DENTIN
PULP
DENTINOENAMEL JUNCTION (DEJ)
Fig. 1. Schematic diagram of the human tooth.
organic material and 27 vol.% water [ 1-3,5]. In the natural formation process, dentinogenesis, an organic collagen matrix is mineralized with Cai0(PO4)6(OH)2 (hydroxyapa- tite, HAP) crystallites [6]. In an adult tooth several types of dentin structure can be discerned [ 1-4]. The dentinal tubules pass through the entire dentin structure, following an S shaped path from the pulp to the DEJ. The tubules are surrounded by a layer of peritubular dentin which is more mineralized (by about 9%) than other portions [3,5]. The majority of the dentin, intertubular dentin, lies between the tubules and is made up of a highly crosslinked collagen phase mineralized with HAP crystallites (~0.l fim long) [ 1,3]. An unminer- alized portion, interglubular dentin, is interspersed in small pockets. The properties of natural dentin are listed in Table
64 L.F. Francis et at. /Materials Science and Engineering: C 3 (1995) 63-74
Table 1 Physical and mechanical properties of the oral hard tissues of human teeth [7]
Property Dentin Enamel
Density (gem-3) 2.2 3.0 Modulus of rupture (MPa) 51 10.3 Elastic modulus (GPa) 18.31 84.1 Shear strength (MPa) 138 90.2 Vicker's hardness (GPa) 0.68 3.43 Fracture toughness (MPam"2) 3.08 [8] 0.8
1. Dentin's main structural function is to provide a mechan- ically tough support for the outer enamel layer [3]. The crosslinked and mineralized collagen phase imparts defor- mation resistance to the natural material in a similar fashion to synthetic crosslinked polymers. The highly mineralized walls, dentinal tubules and their short lateral extensions may also play a role in stiffening the structure. Fracture toughness is enhanced by the composite microstructure which contains dispersed inorganic particles in a collagen matrix and hence a multitude of interfaces to interfere with crack propagation. An investigation of the fracture properties of dentin revealed that dentin is tougher through its thickness (perpendicular to the DEJ) than it is laterally [8].
Enamel is the most highly mineralized tissue of the body, roughly 90 vol.% hydroxyapatite. Like dentin, enamel forms by a biomineralization process, but the organic matrix in enamel is composed mainly of non-collagenous glycopro- teins [ 1 ]. Mature enamel is a complex inorganic-organic composite [1,2,4]. The HAP phase has a highly organized structure composed of long rods (or prisms) of packed crys- tallites extending from the outer enamel surface downward to the DEJ. Within each rod, the orientation of the asymmetric HAP crystallites changes from parallel to the rod at its center to near perpendicular to the rod at the edge where adjacent rods abut. Sheaths surrounding the prisms contain most of the organic phase [4]. Enamel's function is to provide a hard, wear resistant surface for mastication. The hardness of enamel is roughly 5 times that of dentin. Enamel is a brittle material which fractures readily (see Table 1 for properties). The fracture process occurs along the weak paths parallel to the prisms [9]. However, the well designed microstructure and strong attachment to the underlying dentin serve to arrest cracks, which preferentially propagate down the rod axes to the dentinoenamel junction.
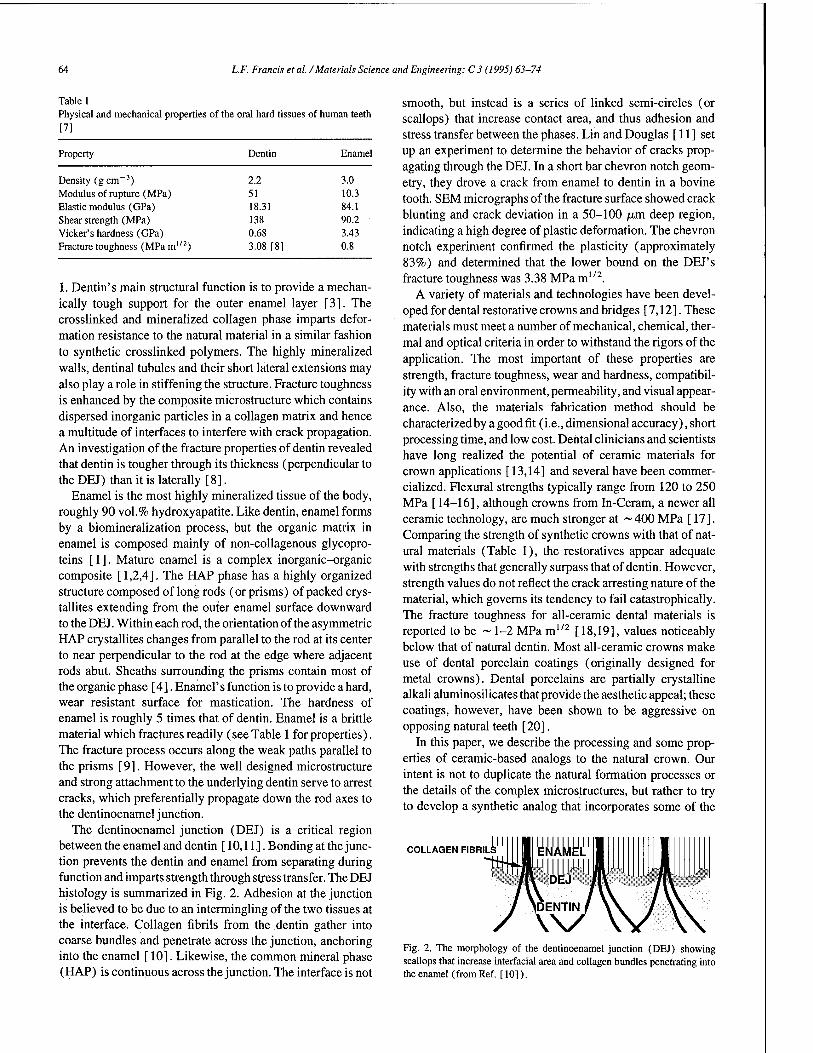
The dentinoenamel junction (DEJ) is a critical region between the enamel and dentin [ 10,11]. Bonding at the junc- tion prevents the dentin and enamel from separating during function and imparts strength through stress transfer. The DEJ histology is summarized in Fig. 2. Adhesion at the junction is believed to be due to an intermingling of the two tissues at the interface. Collagen fibrils from the dentin gather into coarse bundles and penetrate across the junction, anchoring into the enamel [ 10]. Likewise, the common mineral phase (HAP) is continuous across the junction. The interface is not
smooth, but instead is a series of linked semi-circles (or scallops) that increase contact area, and thus adhesion and stress transfer between the phases. Lin and Douglas [11] set up an experiment to determine the behavior of cracks prop- agating through the DEJ. In a short bar chevron notch geom- etry, they drove a crack from enamel to dentin in a bovine tooth. SEM micrographs of the fracture surface showed crack blunting and crack deviation in a 50-100 yum deep region, indicating a high degree of plastic deformation. The chevron notch experiment confirmed the plasticity (approximately 83%) and determined that the lower bound on the DEJ's fracture toughness was 3.38 MPa mI/2.
A variety of materials and technologies have been devel- oped for dental restorative crowns and bridges [7,12]. These materials must meet a number of mechanical, chemical, ther- mal and optical criteria in order to withstand the rigors of the application. The most important of these properties are strength, fracture toughness, wear and hardness, compatibil- ity with an oral environment, permeability, and visual appear- ance. Also, the materials fabrication method should be characterized by a good fit (i.e., dimensional accuracy), short processing time, and low cost. Dental clinicians and scientists have long realized the potential of ceramic materials for crown applications [13,14] and several have been commer- cialized. Flexural strengths typically range from 120 to 250 MPa [ 14-16], although crowns from In-Ceram, a newer all ceramic technology, are much stronger at ~400 MPa [17]. Comparing the strength of synthetic crowns with that of nat- ural materials (Table 1), the restoratives appear adequate with strengths that generally surpass that of dentin. However, strength values do not reflect the crack arresting nature of the material, which governs its tendency to fail catastrophically. The fracture toughness for all-ceramic dental materials is reported to be ~ 1-2 MPa m1/2 [18,19], values noticeably below that of natural dentin. Most all-ceramic crowns make use of dental porcelain coatings (originally designed for metal crowns). Dental porcelains are partially crystalline alkali aluminosilicates that provide the aesthetic appeal; these coatings, however, have been shown to be aggressive on opposing natural teeth [20].
In this paper, we describe the processing and some prop- erties of ceramic-based analogs to the natural crown. Our intent is not to duplicate the natural formation processes or the details of the complex microstructures, but rather to try to develop a synthetic analog that incorporates some of the
COLLAGEN FIBRILS ..MIL. NAMEL
-INjIlil
DENTIN
Fig. 2. The morphology of the dentinoenamel junction (DEJ) showing scallops that increase interfacial area and collagen bundles penetrating into the enamel (from Ref. [10]).
L.F. Francis et al. /Materials Science and Engineering: C 3 (1995) 63-74 65
qualities of the natural materials. In the past we reported on the processing and properties of alumina-glass composites [21,22] which could serve the dentin function in the analog. Here, we expand the dentin materials range to alumina-pol- ymer composites, and describe methods for creating a syn- thetic analog to the DEJ and enamel.
2. Experimental methods
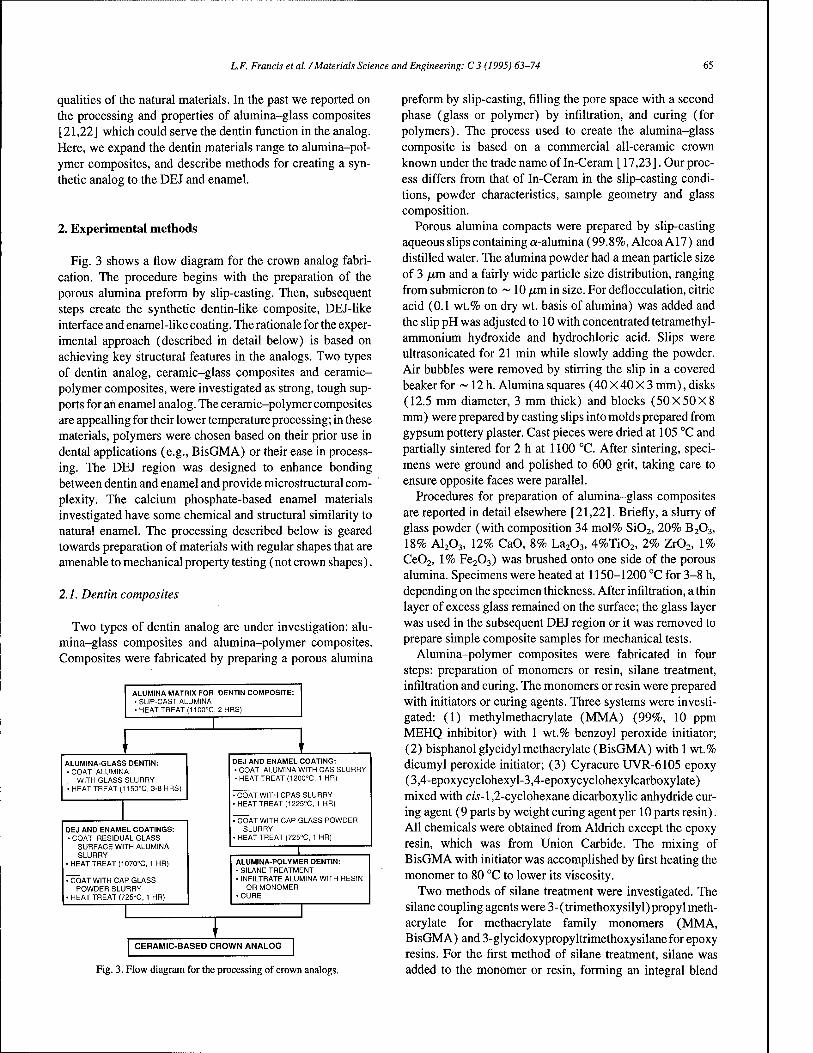
Fig. 3 shows a flow diagram for the crown analog fabri- cation. The procedure begins with the preparation of the porous alumina preform by slip-casting. Then, subsequent steps create the synthetic dentin-like composite, DEJ-like interface and enamel-like coating. The rationale for the exper- imental approach (described in detail below) is based on achieving key structural features in the analogs. Two types of dentin analog, ceramic-glass composites and ceramic- polymer composites, were investigated as strong, tough sup- ports for an enamel analog. The ceramic-polymer composites are appealling for their lower temperature processing; in these materials, polymers were chosen based on their prior use in dental applications (e.g., BisGMA) or their ease in process- ing. The DEJ region was designed to enhance bonding between dentin and enamel and provide microstructural com- plexity. The calcium phosphate-based enamel materials investigated have some chemical and structural similarity to natural enamel. The processing described below is geared towards preparation of materials with regular shapes that are amenable to mechanical property testing (not crown shapes).
2.1. Dentin composites
Two types of dentin analog are under investigation: alu- mina-glass composites and alumina-polymer composites. Composites were fabricated by preparing a porous alumina
ALUMINA MATRIX FOR DENTIN COMPOSITE: • SLIP-CAST ALUMINA • HEAT TREAT (1100°C, 2 HRS)
ALUMINA-GLASS DENTIN: • COAT ALUMINA
WITH GLASS SLURRY • HEAT TREAT (1150°C, 3-8 HRS)
DEJ AND ENAMEL COATINGS: •COAT RESIDUAL GLASS
SURFACE WITH ALUMINA SLURRY
• HEAT TREAT (1070°C, 1 HR)
^CÖATWITH CAP GLASS POWDER SLURRY
• HEAT TREAT (725°C, 1 HR)
DEJ AND ENAMEL COATING: • COAT ALUMINA WITH CAS SLURRY •HEAT TREAT (1200°C, 1 HR)
• COAT WITH CPAS SLURRY • HEAT TREAT (1225°C. 1 HR)
■ COAT WITH CAP GLASS POWDER SLURRY
• HEAT TREAT (725°C, 1 HR)
ALUMINA-POLYMER DENTIN: • SILANE TREATMENT • INFILTRATE ALUMINA WITH RESIN
OR MONOMER •CURE
CERAMIC-BASED CROWN ANALOG
Fig. 3. Row diagram for the processing of crown analogs.
preform by slip-casting, filling the pore space with a second phase (glass or polymer) by infiltration, and curing (for polymers). The process used to create the alumina-glass composite is based on a commercial all-ceramic crown known under the trade name of In-Ceram [ 17,23 ]. Our proc- ess differs from that of In-Ceram in the slip-casting condi- tions, powder characteristics, sample geometry and glass composition.
Porous alumina compacts were prepared by slip-casting aqueous slips containing a-alumina (99.8%, Alcoa A17) and distilled water. The alumina powder had a mean particle size of 3 ixm and a fairly wide particle size distribution, ranging from submicron to ~ 10 /im in size. For deflocculation, citric acid (0.1 wt.% on dry wt. basis of alumina) was added and the slip pH was adjusted to 10 with concentrated tetramethyl- ammonium hydroxide and hydrochloric acid. Slips were ultrasonicated for 21 min while slowly adding the powder. Air bubbles were removed by stirring the slip in a covered beaker for ~ 12 h. Alumina squares (40 X 40 X 3 mm), disks (12.5 mm diameter, 3 mm thick) and blocks (50X50X8 mm) were prepared by casting slips into molds prepared from gypsum pottery plaster. Cast pieces were dried at 105 °C and partially sintered for 2 h at 1100 °C. After sintering, speci- mens were ground and polished to 600 grit, taking care to ensure opposite faces were parallel.
Procedures for preparation of alumina-glass composites are reported in detail elsewhere [21,22]. Briefly, a slurry of glass powder (with composition 34 mol% Si02, 20% B203, 18% A1203, 12% CaO, 8% La203, 4%Ti02, 2% Zr02, 1% Ce02, 1% Fe203) was brushed onto one side of the porous alumina. Specimens were heated at 1150-1200 °C for 3-8 h, depending on the specimen thickness. After infiltration, a thin layer of excess glass remained on the surface; the glass layer was used in the subsequent DEJ region or it was removed to prepare simple composite samples for mechanical tests.
Alumina-polymer composites were fabricated in four steps: preparation of monomers or resin, silane treatment, infiltration and curing. The monomers or resin were prepared with initiators or curing agents. Three systems were investi- gated: (1) methylmethacrylate (MMA) (99%, 10 ppm MEHQ inhibitor) with 1 wt.% benzoyl peroxide initiator; (2) bisphanol glycidyl methacrylate (BisGMA) with 1 wt.% dicumyl peroxide initiator; (3) Cyracure UVR-6105 epoxy (3,4-epoxycyclohexyl-3,4-epoxycyclohexylcarboxylate) mixed with m-l,2-cyclohexane dicarboxylic anhydride cur- ing agent (9 parts by weight curing agent per 10 parts resin). All chemicals were obtained from Aldrich except the epoxy resin, which was from Union Carbide. The mixing of BisGMA with initiator was accomplished by first heating the monomer to 80 °C to lower its viscosity.
Two methods of silane treatment were investigated. The silane coupling agents were 3- (trimethoxysilyl) propy 1 meth- acrylate for methacrylate family monomers (MMA, BisGMA) and 3-glycidoxypropyltrimethoxysilane for epoxy resins. For the first method of silane treatment, silane was added to the monomer or resin, forming an integral blend

66 L.F. Francis et al. /Materials Science and Engineering: C 3 (1995) 63-74
prior to infiltration. Silane additions ranging from 1 to 20 wt.% were investigated. Solutions were aged for approxi- mately 1 h before infiltration (described below). In the sec- ond method, the porous alumina piece was treated with silane before infiltration. A silane solution was prepared by adding 1-20 wt.% silane to a methanol + water solution (20 wt.% water). The porous alumina pieces were immersed in the solution for 6 h followed by 30 min heating at 75 °C to promote condensation reactions between silanol groups and surface hydroxyl groups on A1203. The solution was then drained and a vacuum was applied for an additional 30 min to remove residual solvent and water.
Monomer or resin infiltration was carried out by immersing the alumina or silylated alumina into a monomer or resin bath. (Specimens for mechanical property testing were pre- pared by infiltrating pieces of porous alumina; others were prepared by infiltrating porous alumina which had a DEJ and enamel coating on one side.) The viscosities of epoxy resin and BisGMA were measured using a Rheometrics RFS2 flu- ids rheometer. The alumina was preheated to 70,120 and 140 °C for infiltration with MMA, BisGMA and epoxy, respec- tively. Infiltration of MMA and epoxy was conducted at room temperature and BisGMA at 80 °C. The preheating of alumina created a temperature gradient across the sample which enhanced infiltration. Similar techniques are used to promote penetration of tar into concrete [24]. Samples were com- pletely immersed for 12 h before curing.
The following curing schedules were used. For PMMA composites, the specimen (still immersed in MMA bath in a sealed container) was placed in an oven preheated to 70 °C and held there for 12 h. The initiator concentration (1 wt.%) was low enough to avoid Tromsdorph's effect [25] for a 5 g sample of MMA. If a larger batch was used, either the initiator concentration or the curing temperature had to be lowered. For BisGMA and epoxy composites, the specimens were removed from the infiltration bath, placed in sealed aluminum foil pouches and cured. BisGMA composites were cured for 12 h at 120 °C. Epoxy composites were cured for 2 h at 120 °C followed by 4-6 h at 140 °C. After curing, excess polymer was removed by grinding and polishing down to 600 grit.
2.2. DEJ and enamel coatings
Fig. 3 shows the different routes necessary for processing complete crown analogs using alumina-glass and alumina- polymer composites. Procedures to produce a DEJ-like inter- face and enamel coating involved depositing slurries of oxide or glass powder by a draw-down blade method, drying at 100 °C for 15 min and then higher temperature heating.
For the alumina-glass composite, two layers were used to create the DEJ and enamel. First, the residual glass layer on the infiltration side of the composite was coated with a slurry of aluminum oxide (25 vol.%) and heated at 1070 °C for 1 h. This procedure resulted in a porous top alumina layer ( ~ 40 /u,m in thickness) with glass from the composite drawn up during heating to partially fill the porosity. Next, CaO-
A1203-P205 (CAP) glass powder with a composition of 21- 8.5-67.5 wt.% was dispersed in methanol (25 vol.%) and deposited to produce a ~ 30 yum thick wet coating. The glass was prepared by quenching from the oxide melt and grinding in a tungsten carbide ball mill. The glass powder coating was heated at high heating rate (50 C min "') to 725 °C and held there for 1 h.
For analogs with alumina-polymer composites, the DEJ and enamel coatings were prepared on the porous alumina preform and then the dentin processing was completed by infiltrating monomer or resin from the other side. For these composites, a more complex DEJ and enamel were prepared. First, a CaO-Al203-Si02 (CAS) powder with a composition of 25-5-65 wt.% was prepared by calcining the oxides at 800 °C for 24 h with intermediate grindings. An aqueous slurry of CAS powder (25 vol.%) was blade coated (wet thickness of ~35 /xm) and heated at 1200 °C for 1 h. A eutectic melt formed and penetrated into the porous alumina preform. A Ca(P03)2-Al203-Si02 (CPAS) powder with a composition of 33.3-16.7-50 wt.% was then prepared by calcining at 800 °C for 24 h. A CPAS aqueous powder slurry (25 vol.%) was deposited (wet thickness of ~ 100 /xm) on top of the CAS layer and heated at 1225 °C for 1 h. Finally, a final CAP layer was deposited according to the procedure described above.
2.3. Characterization
Physical and mechanical properties of alumina-polymer composites were determined by a series of techniques, similar to those reported previously for alumina-glass composites [21,22]. The Young's moduli were determined by the sonic resonance technique (ASTM C623). Sample sizes were 40 X 1.8 X 3.0 mm and 40 X 9 X 2.25 mm. Flexural strength was characterized by the four point bend method using bar specimens (40X3X2.25 mm) with edges chamfered to approximately 45°. These bars were obtained from the larger square samples. Testing was performed with a crosshead rate of 0.5 mm min-1 in an environment with ~20% relative humidity. Mean strengths were determined by testing at least ten samples. Fracture toughness was measured using a short bar chevron notch test. Specimens were notched bars with dimensions 4X4X8 mm. Results are based on an average from ten samples. Composite hardness was measured with a Leco microhardness tester (model M-400).
The wear behavior of alumina-polymer composites against a natural tooth was tested according to the procedures developed by DeLong et al. [ 20,26]. The composite disk was investigated in an artificial oral environment and exposed to 300 000 defined masticatory cycles under simulated physio- logical conditions. Digital techniques were used to map the occlusal surfaces before and after each test. By comparing the before and after profiles, the depth, area and volume of wear were determined for the composite and natural tooth. Wear surfaces were examined using scanning electron microscopy.
L.F. Francis el at. /Materials Science and Engineering: C 3 (1995) 63-74 67
Microstructure investigations were carried out on all mate- rials using a field emission scanning electron microscope (Hitachi S-900 FESEM). Backscatter electron images were used to enhance compositional contrast. Planar and cross- sectional views were useful to identify the interpenetration in the DEJ region, and the thicknesses and microstructures of enamel layers. X-ray diffraction (Seimens D500) was used after each DEJ and enamel deposition to determine the crys- talline phases present.
3. Results and discussion
3.1. Dentin composites
The dentin analogs are composites composed of a rigid ceramic matrix impregnated by a polymer (or glass) com- ponent. Below, the microstructure and properties of the ceramic matrix and the composites are discussed. In a later section, the materials will be compared with natural dentin.
The density, microstructure and stiffness of the porous alumina preforms used for dentin composites depends on the slip-casting and thermal treatment conditions [22]. For the materials reported here, the dispersion (or slip) was formu- lated with a pH and deflocculant content to enhance repulsive interactions between particles, creating a stable dispersion and maximizing the green density. The green density of the cast and dried ceramic preform was measured to be 73% of theoretical. Thermal treatment was necessary before infiltra- tion to establish strong particle-particle contacts and increase rigidity of the preform. The standard heat treatment at 1100 °C for 2 h results in a microstructure with increased contact area between particles and an increase in Young's modulus from 15 to 50 GPa. This heating results in a very low shrink- age (< 0.2% linear) and the fired density is virtually the same as that of the green body. Since the pore space is filled with glass or polymer, the density of the slip-cast alumina determines the alumina content in the composites. To deter- mine the effect of alumina content on properties, we prepared alumina preforms with range of densities from 62 to 73%. Considering the principles of powder packing, green densities much greater than 73% are not possible. Less dense preforms are prepared by changing the slip formulations so that parti- cle-particle interactions are less repulsive and particles tend to form floes which pack less efficiently during casting. For example, lowering the pH to ~ 6 results in a density of about 62%. Densities lower than 62% may be achieved if the par- ticle size distribution is made more monodisperse, as mono- sized particles pack less efficiently during slip casting. Alu- mina preforms with a green and fired density of ~ 73% were used for all composites reported here.
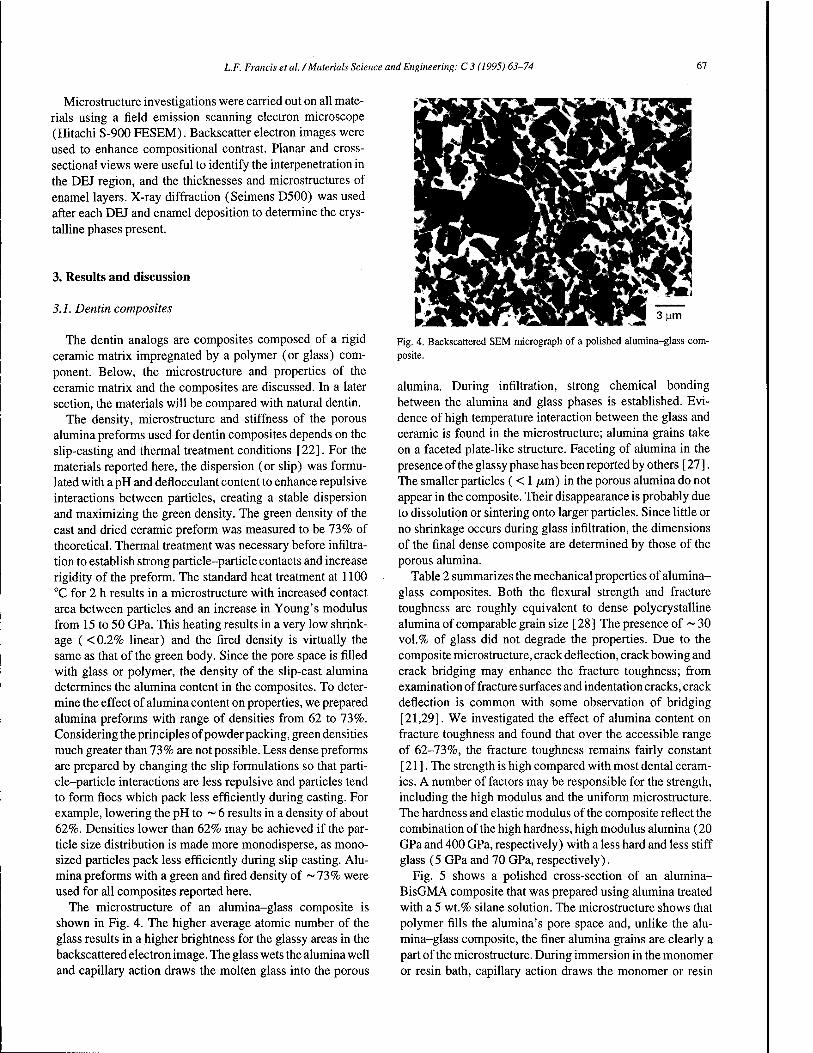
The microstructure of an alumina-glass composite is shown in Fig. 4. The higher average atomic number of the glass results in a higher brightness for the glassy areas in the backscattered electron image. The glass wets the alumina well and capillary action draws the molten glass into the porous
Fig. 4. Backscattered SEM micrograph of a polished alumina-glass com- posite.
alumina. During infiltration, strong chemical bonding between the alumina and glass phases is established. Evi- dence of high temperature interaction between the glass and ceramic is found in the microstructure; alumina grains take on a faceted plate-like structure. Faceting of alumina in the presence of the glassy phase has been reported by others [ 27 ]. The smaller particles ( < 1 /xm) in the porous alumina do not appear in the composite. Their disappearance is probably due to dissolution or sintering onto larger particles. Since little or no shrinkage occurs during glass infiltration, the dimensions of the final dense composite are determined by those of the porous alumina.
Table 2 summarizes the mechanical properties of alumina- glass composites. Both the flexural strength and fracture toughness are roughly equivalent to dense polycrystalline alumina of comparable grain size [28] The presence of ~30 vol.% of glass did not degrade the properties. Due to the composite microstructure, crack deflection, crack bowing and crack bridging may enhance the fracture toughness; from examination of fracture surfaces and indentation cracks, crack deflection is common with some observation of bridging [21,29]. We investigated the effect of alumina content on fracture toughness and found that over the accessible range of 62-73%, the fracture toughness remains fairly constant [21]. The strength is high compared with most dental ceram- ics. A number of factors may be responsible for the strength, including the high modulus and the uniform microstructure. The hardness and elastic modulus of the composite reflect the combination of the high hardness, high modulus alumina (20 GPa and 400 GPa, respectively) with a less hard and less stiff glass (5 GPa and 70 GPa, respectively).
Fig. 5 shows a polished cross-section of an alumina- BisGMA composite that was prepared using alumina treated with a 5 wt.% silane solution. The microstructure shows that polymer fills the alumina's pore space and, unlike the alu- mina-glass composite, the finer alumina grains are clearly a part of the microstructure. During immersion in the monomer or resin bath, capillary action draws the monomer or resin

68 L.F. Francis et al. /Materials Science and Engineering: C 3 (1995) 63-74
Table 2 Mechanical properties of dentin composites
Property Alumina- glass *
Alumina- PMMAb
Alumina- BisGMA b
Alumina- epoxy b
Young's modulus (GPa)
Vicker's hardness (GPa)
Flexural strength (MPa)
Fracture toughness (MPam1/2)
270
11.8±0.3
458 ±77
3.8±0.1
84
2.8 + 0.3
161 ±15
3.23 ±0.21
2.4 ±0.1
164 ±29
2.31 ±0.17
85
2.6 ±0.2
218 ±20
2.43 ±0.25
'FromRefs. [21] and [22]. ' Prepared with alumina pretreated with 5 wt.% silane solution.
Fig. 5. SEM micrograph of apolished alumina-BisGMA composite prepared with alumina pretreated with 5 wt.% silane solution.
into the matrix with the assistance of the temperature gradient between the liquid and the ceramic preform. The temperature gradient effectively creates a vacuum condition in the alu- mina pores. For BisGMA, the infiltration was carried out at 80 °C; at this temperature the viscosity is lowered to 0.72 Pa s. Dicumyl peroxide was chosen as the initiator for polym- erization, because it decomposes and begins polymerization at a higher temperature (120 °C). BisGMA, a commonly used polymer for composites used for filling teeth, has little volume change on curing (5-8%) [ 30,31 ]. For our compos- ites, the small volume change is advantageous to ensure the polymer continues to fill the pores after curing. Epoxy infil- tration was carried out at room temperature with curing at elevated temperature. The epoxy resin had a viscosity of 0.20 Pa s at room temperature. Due to the ring opening crosslink-
ing reaction, epoxies typically have a very low volume change on curing [32]. These composites also form in a near net shape manner, since the dimensions are fixed by the dimen- sions of the slip-cast alumina. The use of silane coupling agents was important for the microstructures and properties of the composites, as described below.
Processing of a dense alumina-PMMA composites required attention to the monomer volatility during curing and the use of silane coupling agents to enhance bonding between polymer and ceramic. Infiltration of MMA was car- ried out at room temperature with higher temperature curing. MMA is extremely fluid with a viscosity of 0.85 cP (8.5 X 10~3 Pa s) [33]. Due to the volatility of the MMA monomer, care was taken to have excess monomer in the infiltration bath and to seal the container to prevent monomer loss. Fig. 6 show fracture surfaces of alumina-PMMA com- posites with and without a silane treatment. For composites without the silane treatment, the fracture surface shows exposed ceramic particles and with the silane the fracture occurs primarily in the polymer phase. Similar results were obtained for the alumina-BisGMA and alumina-epoxy com- posites, but the separation from the matrix for non-silane
Fig. 6. SEM micrographs showing fracture surfaces of alumina-PMMA composites prepared with (a) no silane treatment and (b) alumina pretreated with a 5 wt.% silane solution.
L.F. Francis et al. /Materials Science and Engineering: C 3 (1995) 63-74 69
ZOO--
150--
10 15
wt % Silane
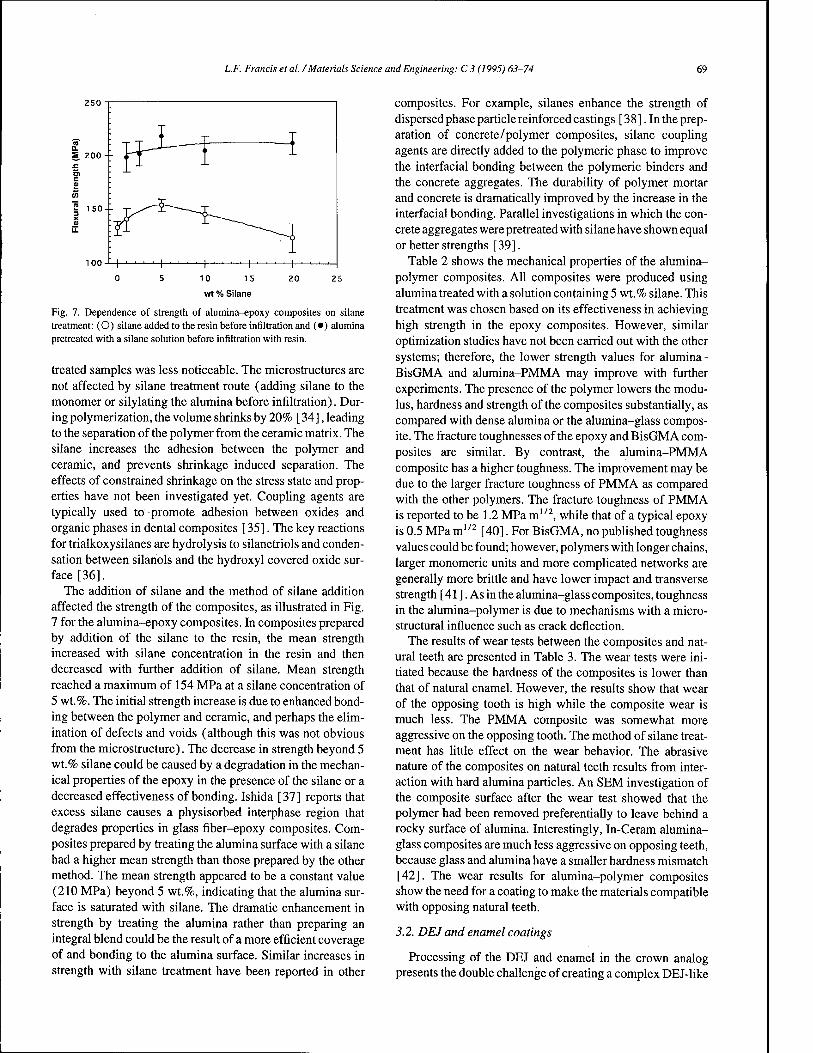
Fig. 7. Dependence of strength of alumina-epoxy composites on silane treatment: (O) silane added to the resin before infiltration and (•) alumina pretreated with a silane solution before infiltration with resin.
treated samples was less noticeable. The microstructures are not affected by silane treatment route (adding silane to the monomer or silylating the alumina before infiltration). Dur- ing polymerization, the volume shrinks by 20% [ 34], leading to the separation of the polymer from the ceramic matrix. The silane increases the adhesion between the polymer and ceramic, and prevents shrinkage induced separation. The effects of constrained shrinkage on the stress state and prop- erties have not been investigated yet. Coupling agents are typically used to promote adhesion between oxides and organic phases in dental composites [35]. The key reactions for trialkoxysilanes are hydrolysis to silanetriols and conden- sation between silanols and the hydroxyl covered oxide sur- face [36].
The addition of silane and the method of silane addition affected the strength of the composites, as illustrated in Fig. 7 for the alumina-epoxy composites. In composites prepared by addition of the silane to the resin, the mean strength increased with silane concentration in the resin and then decreased with further addition of silane. Mean strength reached a maximum of 154 MPa at a silane concentration of 5 wt.%. The initial strength increase is due to enhanced bond- ing between the polymer and ceramic, and perhaps the elim- ination of defects and voids (although this was not obvious from the microstructure). The decrease in strength beyond 5 wt.% silane could be caused by a degradation in the mechan- ical properties of the epoxy in the presence of the silane or a decreased effectiveness of bonding. Ishida [37] reports that excess silane causes a physisorbed interphase region that degrades properties in glass fiber-epoxy composites. Com- posites prepared by treating the alumina surface with a silane had a higher mean strength than those prepared by the other method. The mean strength appeared to be a constant value (210 MPa) beyond 5 wt.%, indicating that the alumina sur- face is saturated with silane. The dramatic enhancement in strength by treating the alumina rather than preparing an integral blend could be the result of a more efficient coverage of and bonding to the alumina surface. Similar increases in strength with silane treatment have been reported in other
composites. For example, silanes enhance the strength of dispersed phase particle reinforced castings [ 3 8 ]. In the prep- aration of concrete/polymer composites, silane coupling agents are directly added to the polymeric phase to improve the interfacial bonding between the polymeric binders and the concrete aggregates. The durability of polymer mortar and concrete is dramatically improved by the increase in the interfacial bonding. Parallel investigations in which the con- crete aggregates were pretreated with silane have shown equal or better strengths [39].
Table 2 shows the mechanical properties of the alumina- polymer composites. All composites were produced using alumina treated with a solution containing 5 wt.% silane. This treatment was chosen based on its effectiveness in achieving high strength in the epoxy composites. However, similar optimization studies have not been carried out with the other systems; therefore, the lower strength values for alumina- BisGMA and alumina-PMMA may improve with further experiments. The presence of the polymer lowers the modu- lus, hardness and strength of the composites substantially, as compared with dense alumina or the alumina-glass compos- ite. The fracture toughnesses of the epoxy and BisGMA com- posites are similar. By contrast, the alumina-PMMA composite has a higher toughness. The improvement may be due to the larger fracture toughness of PMMA as compared with the other polymers. The fracture toughness of PMMA is reported to be 1.2 MPa m1 /2, while that of a typical epoxy is 0.5 MPa m1/2 [40]. For BisGMA, no published toughness values could be found; however, polymers with longer chains, larger monomeric units and more complicated networks are generally more brittle and have lower impact and transverse strength [ 41 ]. As in the alumina-glass composites, toughness in the alumina-polymer is due to mechanisms with a micro- structural influence such as crack deflection.
The results of wear tests between the composites and nat- ural teeth are presented in Table 3. The wear tests were ini- tiated because the hardness of the composites is lower than that of natural enamel. However, the results show that wear of the opposing tooth is high while the composite wear is much less. The PMMA composite was somewhat more aggressive on the opposing tooth. The method of silane treat- ment has little effect on the wear behavior. The abrasive nature of the composites on natural teeth results from inter- action with hard alumina particles. An SEM investigation of the composite surface after the wear test showed that the polymer had been removed preferentially to leave behind a rocky surface of alumina. Interestingly, In-Ceram alumina- glass composites are much less aggressive on opposing teeth, because glass and alumina have a smaller hardness mismatch [42], The wear results for alumina-polymer composites show the need for a coating to make the materials compatible with opposing natural teeth.
3.2. DEJ and enamel coatings
Processing of the DEJ and enamel in the crown analog presents the double challenge of creating a complex DEJ-like

70 L.F. Francis et al. /Materials Science and Engineering: C 3 (1995) 63-74
Table 3 Wear properties of alumina-polymer composites
Material Volume loss Maximum Volume loss Maximum from composite wear depth from opposing wear depth (mm3) in composite
(/urn) tooth (mm3) in opposing
tooth (fim)
Alumina- 0.0563 ±0.0039 66 ±3.2 0.2379 ±0.0223 244 ±14.8 BisGMA *
Alumina- 0.0621 ±0.0103 69 ±5.4 0.2879 ±0.0156 285 ±8.3 BisGMA b
Alumina- 0.0408-0.0027 59 ±1.2 0.4275 ±0.2366 260 ±29.6 PMMAb
1 Prepared with 5 wt.% silane added to the monomer solution. b Prepared with alumina prepared with a 5 wt.% silane solution.
interface and a thick, dense polycrystalline enamel-like coat- ing. The DEJ regions described here were created by promoting interpenetration of glass and polymer through porous alumina and choosing materials for their bonding abil- ities. Thick, dense ceramic coatings (desired for the enamel region) are difficult to process, because sintering is slowed by substrate constraint [43], and residual stresses develop from sintering and thermal expansion mismatch. Densifica- tion by solid state diffusion requires high temperatures that may result in undesired reactions between the coating and the substrate and higher thermal expansion mismatch stresses. Therefore, we chose densification methods that involve the formation of a low temperature melt or a liquid phase at the sintering temperature. Similar approaches have been shown to be successful in ceramic processing. For example, enhancement of sintering kinetics in the presence of a liquid
M*^
Fig. 8. SEM micrograph of crown analog on alumina-glass composite den- tin, showing DEJ region and CAP glass-ceramic enamel. The alumina-glass composite is out of the picture.
phase is reported for sintering of silicon nitride ceramics [ 44 ] and glass powder compacts are commonly sintered by viscous flow driven mass transport [45].
The DEJ and enamel for the alumina-glass composite den- tin had a relatively simple structure prepared by directly coat- ing the composite. Fig. 8 is a cross-sectional view of the completed crown analog showing the DEJ and enamel. (The alumina-glass composite is out of the picture.) The DEJ is formed using an alumina layer originally deposited on the residual glass side of the composite. On heating to 1070 °C, the residual glass from the composite below was pulled into the alumina's pore space, creating a strong bond and inter- penetration. The penetration was not complete and some residual porosity was evident in this layer after firing. Next, a layer of CaO-Al203-P205 (CAP) glass powder (compo- sition 21-8.5-67.5 wt.%) was coated onto the alumina layer and heated (725 °C). Through this thermal treatment, we hoped that some of the CAP glass melt would flow into the residual pore space in the alumina below. Unfortunately, no such penetration was observed. Therefore, the DEJ region consisted solely of glass penetrating into the porous alumina from below. However, the CAP glass-ceramic layer formed a dense, crack-free, polycrystalline coating. Two depositions and thermal treatments resulted in a ~ 13 /xm thick glass- ceramic coating.
Fig. 9 shows the top surface of the CAP glass-ceramic layer. The key to the densification was enhancing sintering relative to crystallization [46]. By choosing a high heating rate (50 °C min ~'), the crystallization was delayed to high temperature and viscous flow densified the layer before crys- tallization. The conditions for thermal treatment were based on our previous study of the densification and crystallization behavior of these coatings on dense alumina substrates [47]. The final heat-treatment was at a low temperature (725 CC); therefore, no changes in the microstructure or properties of the alumina-glass composite are anticipated. XRD analysis of the coating showed that two phases were present: A1P04
and Ca(P03)2. The microstructure contained grains with a spherulitic morphology. SEM backscattered electron images showed a lower contrast A1P04 phase in the center of the

L.F. Francis et al. /Materials Science and Engineering: C 3 (1995) 63-74 71
Fig. 9. Backscattered SEM micrograph of the top surface of the CAP glass- ceramic layer.
spherulite and Ca(P03)2 around the center. CAP was chosen as the enamel layer because its use in other biomaterial appli- cations [48] indicated that it may have some bioactivity in the mouth and because the reported hardness for a calcium phosphate glass-ceramic (3.8 GPa [49]) is comparable with enamel (3.43 GPa [7]). The hardness of our CAP coating was measured by nanoindentation to be 5.2 GPa. This value is higher than expected; the difference may be due to the A1P04 content in our glass-ceramic. Wear tests are planned for CAP and the more complex enamel (see below) to deter- mine their effect on opposing teeth. Two difficulties arose in using CAP glass-ceramic for enamel. First, the CAP melt did not penetrate into the porous alumina layer to provide a good interpenetrating DEJ region. The second drawback was the thermal expansion mismatch with the alumina-glass com- posite. The thermal expansion coefficient of the alumina- glass composite is 7.5 X 10~6 °C_1 [22] and that of CAP ceramic is 16.7X 10"6 °C~' [50]. The coating is put into tension on cooling so that coatings crack and peel at greater thicknesses. As described below, we were able to overcome these limitations using different processing approaches.
The DEJ and enamel coatings for the alumina-polymer composites were prepared on one side of the porous alumina preforms before monomer or resin infiltration. To achieve a fully dense, thick coating we used a combined approach, involving sequential deposition of a melt forming layer, a reaction sintered coating and a glass-ceramic coating. This processing sequence was attempted on the alumina-glass composite, but the temperatures needed led to recrystalliza- tion and reaction in the alumina-glass composite. Infiltration of glass into the porous alumina with DEJ and enamel coating has not been attempted yet.
The melt forming layer was largely responsible for the DEJ-like interface. The coating was prepared using a eutectic composition in the CaO-Al203-Si02 (CAS) system (25-5- 65 wt.%). The layer of CAS powder was coated on the porous alumina preform, heated above the ternary eutectic temper- ature and then cooled. Fig. 10 shows SEM micrographs of the top view and cross-section of the CAS coated alumina. The layer is partially crystalline (Fig. 10(a)). In agreement with the reported crystallization sequence [51], wollastonite and silica (quartz modification) were identified as the crys- talline phases in the CAS coating. The eutectic liquid pene- trates downward into the porous alumina preform, reacting with alumina to form rounded grains; the dark band (Fig. 10(b)) is a silica (and alumina) rich penetration zone. This zone did not have a consistent thickness. Differentiating between phases in the dark band using the backscattered electron image was not possible, because the atomic numbers of Al and Si are close. The penetation zone is crack-free and well-bonded to the alumina. This zone serves to create the DEJ, as the interpenetration and bonding are evident. To show
^^^^^B^^^mSU ■K'^liPi ^^HBBki. ' .„M . *.-,»v»W..-A' i&g&iii IM HHHHHH^HlLj '.,- ij^'JrV^' \-^-: ■ ̂$£wS$ w ■■••^1
A
Fig. 10. (a) SEM micrograph of the top surface of CAS coating showing wollastonite grains in a glassy matrix, (b) Backscattered SEM micrograph of a cross-section showing partially crystallized layer of the CAS coating (top), a dark silica and alumina rich pentration zone (middle) and the alumina-PMMA composite (bottom).

72 L.F. Francis et al. /Materials Science and Engineering: C 3 (1995) 63-74
r, i*>
WmBSSKBm
Fig. 11. Backscattered SEM micrograph of a cross-section after coating CPAS onto CAS. A discontinuous, dark silica-rich band marks a rough separation between CPAS (top) and CAS (bottom) layers. A continuous, dark band is the penetration zone noted in Fig. 10(b).
the complete DEJ, MMA infiltration and polymerization were carried out on this specimen. The cross-section (Fig. 10(b)) shows that the polymer penetrates completely to the interface.
For the first enamel layer, a reaction sintering approach was used to build a thick coating that adheres well to the CAS beneath. A mixture in the Ca(P03)2-Al203-Si02 (CPAS) system (33.3-16.7-50 wt.%) was chosen. During thermal treatment, a liquid phase formed which promoted reaction sintering. Fig. 11 is the backscattered electron image showing the cross-section of the CPAS coating on CAS. The discon- tinuous, dark regions in the upper part of the micrograph are a silica-rich phase at the CPAS /CAS interface. This interface is not well defined due to the reaction between CAS melt and CPAS during the second heat treatment. The grains in the CPAS coating have rounded edges which form during the particle rearrangement stage of the liquid phase sintering, ß- Tricalcium phosphate (Ca3(P04)2, TCP), aluminum phos- phate (A1P04) and silica (quartz modification) were detected by XRD as the major phases with small amounts of A1203 and Ca(P03)2. These phases and their distribution are in good agreement with the reported equilibrium phases in the CaO-Al203-P205-Si02 quarternary [52]. TCP is likely to have formed by the reaction:
3Ca(P03)2 + 2Al203 —* Ca3(P04)2 + 4AlP04
The CPAS layer is fully crystalline. Toriyama et al. [53] reported the growth of TCP films on alumina and showed that good bonding between the two is achieved by the pres- ence of an anorthite layer. We did not observe anorthite dif- fraction peaks in the XRD as the penetration depth of the
20 um
Fig. 12. Backscattered SEM micrograph showing the cross-section of the crown analog, including the thin CAP glass-ceramic (very top) and CPAS enamel coatings (top), the DEJ region formed from CAS interpenetration (middle) and the alumina-PMMA dentin composite (bottom).
X-rays is less than the coating thickness. In the present case, the CAS layer appears to help bond the CPAS to alumina. We deposited a ~40 pm thick CPAS layer on CAS and indications are that thicker layers are possible. Thermal expansion coefficients of the CAS and CPAS layers are better matched to the alumina so that thermal stresses are less of a problem. A final layer of CAP glass-ceramic layer was pre- pared on the CPAS layer as described above. Fig. 12 shows the cross-section of the entire crown with the alumina-poly- mer composite dentin, interpenetrating DEJ bonding region and enamel coatings.
3.3. Comparisons between analogs and the natural crown
The natural crown is well designed for its purpose of mechanically breaking down food for digestion. To achieve the required hardness and fracture toughness, a combination of hard tissues (dentin, enamel) is formed with a complex interface (DEJ) between them for bonding and arresting cracks. Nature has a limited selection of materials for this construction, but the level of sophistication in the 'processing method' and the microstructures is astonishing. As a conse- quence, the natural crown has superior overall properties. Man-made components, by contrast, fall short on processing and microstructural complexity, but surpass natural structures in the diversity of materials available for use. Therefore, one approach to gaining practical benefit from nature's examples is to apply simple structural and microstructural lessons to the development of new man-made components. In this
L.F. Francis et al. /Materials Science and Engineering: C 3 (1995) 63-74 73
research, we have used nature's example to design materials that meet the demands of a practical application, a dental crown restoration.
Natural dentin is designed to be a rugged support for enamel. The natural material has modest strength, but rela- tively high fracture toughness (see Table 1). One similarity between our dentin analogs (alumina-glass and alumina- polymer composites) and natural dentin is fracture tough- ness. Microstructurally, the natural and analog materials are both composites that gain their toughness, in part, from mech- anisms related to microstructure. However, the microstruc- tural details of the synthetic composites do not bear direct resemblance to natural dentin's structure. The ceramic con- tent is higher in the synthetic materials and the ceramic phase is continuous. The microstructure and the use of alumina in the analog results in a stronger, harder material with a higher modulus. The alumina-polymer composites are more like the natural material in composition and have properties closer to natural dentin. The polymer process also offers more flexi- bility for property modification and improvement. Another dissimilarity between the natural and synthetic materials is their wear behavior. Natural dentin is worn away easily and requires enamel for a hard and protective layer; the alumina- polymer composites are aggressive on opposing natural teeth and need a coating to make them more compatible. Despite the differences, the dentin in the analog, like natural dentin, provides a strong tough support for the enamel.
The functional features of natural enamel are its hardness and wear behavior which are needed for mastication. Enamel is brittle, but the microstructure design of the natural material cleverly allows for directed crack propagation down to the DEJ. The enamel analogs are not as microstructurally com- plex as the prisms of anisotropic hydroxyapatite crystallites found in natural enamel, but the enamel analogs are fully crystalline and the CAP glass-ceramic has the desired fine grain microstructure. Incorporation of the anisotropic nature of the enamel structure in our future analogs may be benefi- cial. While the hardness and wear properties of these mate- rials require further investigation, the calcium phosphate class of materials (which includes hydroxyapatite) appears to be a good candidate for enamel analogs. The DEJ is as vital a part of the natural structure as dentin and enamel. The natural DEJ supplies the bond between dentin and enamel and serves to arrest cracks that originate in enamel. To provide these functions, nature designs a complex interface in which com- ponents from enamel and dentin interpenetrate and intermin- gle. The DEJs in our analogs were designed as bonding regions with complex microstructures that may act to deter crack propagation. The intricate DEJ prepared for the alu- mina-polymer composite is more complex than the simpler structure on alumina-glass. Microstructural analysis shows that the interpenetration in this DEJ region originates from a solidified melt phase penetrating into the dentin analog below. The CAS composition provides strong bonding to the alumina in dentin and also to the enamel-like coating. The polymer phase in the analog penetrates to the DEJ region.
The natural DEJ goes a step further with collagen projections across the interface. The development of greater polymer reinforcement of the DEJ in the analog will be attempted in the future. We have not yet tested the fracture properties of the DEJ interface in the analog and thus the ability of this region to interfere with or arrest crack propagation is not known. However, the DEJ in the analog, like the natural DEJ, provides bonding between the dentin and enamel.
4. Summary
The structure and properties of the crown of a human tooth were used to guide the design and processing of restorative dental materials. The goal was to use the natural structure as a model and not to reproduce the natural formation process or duplicate the complex microstructures. Alumina-glass and alumina-polymer composites were prepared by slip-casting an alumina shape, infiltrating with a glass, monomer (MMA, BisGMA) or epoxy resin and then curing (for polymers). Silane coupling agents were used to aid in processing dense alumina-polymer composites and enhance strength. The composites displayed high strength and toughness which make them analogous to the natural hard tissue, dentin. Cal- cium phosphate-based materials were chosen for the enamel region. These materials were applied as coatings which devel- oped into fully dense and crystalline microstructures. The region between the synthetic dentin and enamel was designed to be similar to the natural dentinoenamel junction (DEJ) . The most effective synthetic DEJ was formed by coating a eutectic composition in the CaO-Al203-Si02 system onto the porous alumina (before monomer or resin infiltration). On heating, a melt formed which penetrated and bonded to the alumina below and promoted bonding to the calcium phosphate-based enamel layers above. While there are dif- ferences between the natural materials and the synthetic analogs, results from this research show that adopting simple design principles from natural materials has the potential to improve man-made materials.
Acknowledgements
We gratefully acknowledge research funding from the National Science Foundation, the McKnight Foundation, the Shell Oil Company Foundation and the Minnesota Dental Research Center for Biomaterials and Biomechanics. We thank Dr. W. Cheng for fracture toughness measurements, Dr. M. Pintado for wear measurements on alumina-polymer composites and Prof. W. H. Douglas for helpful discussions.
References
[ 1 ] A.R. Ten Cate, Oral Histology: Development, Structure and Function, The C. V. Mosby Co., St. Louis, MO, 1980.

74 L.F. Francis et al. /Materials Science and Engineering: C 3 (1995) 63-74
[2] A.E. W. Miles, Structural and Chemical Organization of Teeth, Academic Press, New York, 1967.
[3] J.K. Avery, in S.N. Bhaskar (ed.), Orban's Oral Histology and Embryology, 11th Edition, Mosby-Year Book Inc., St. Louis, MO, 1991, p. 105.
[4] J.K. Avery, in S.N. Bhaskar (ed.), Orban's Oral Histology and Embryology, Mosby-Year Book Inc., St. Louis, MO, llthedn., 1991, p. 49.
[5] I.A. Mjor, in A. Linde (ed.), Dentin andDentinogenesis, Vol. I, CRC Press, Boca Raton, FL, 1984, p. 1.
[6] W.T. Butler, in A. Linde (ed.), Dentin and Dentinogenesis, Vol. I, CRC Press, Boca Raton, FL, 1984, p. 37.
[7] R.G. Craig, Restorative Dental Materials, C.V. Mosby, St. Louis, MO, 1989.
[8] O.M. El Mowafy and D.C. Watts, J. Dent. Res., 65 (1986) 677. [9] S.T. Ramussen, R.E. Patchin, D.B. Scott and A.H. Heuer, J. Dent. Res.,
55(1976) 154. [ 10] C.P. Lin, W.H. Douglas and S.L. Erlandsen, J. Histochem. Cytochem.,
47 (1993) 381. [11] C.P. Lin and W.H. Douglas, J. Dental Res., 75(1994) 1072. [12] J.W. McLean, The Science and Art of Dental Ceramics, Vol. 1: the
Nature of Dental Ceramics and Their Clinical Use, Quintessence, Chicago, IL, 1979.
[13] D.W. Jones, Dent. Clin. North Am., 29 (1985) 621. [ 14] P.F. Messet, V. Piddock and C.H. Lloyd, J. Dent., 19 (1991) 51. [ 15] V. Piddock and A.J.E. Qualtrough, J. Dent., 18 (1990) 227. [16] R.R.Seghi.T. Daher, and A. Caputo, Dental Mater., 6(1990) 181. [17] L. Probster and J. Diehl, Quintessence Int., 23 (1992) 25. [18] M. Taira, Y. Normura, K. Wakasa, M. Yamaki and A. Matsui, J. Oral
Rehab., 17 (1990) 551. [19] S.F. Rosenstiel and S.S. Porter, J. Prosthet. Dent., 62 (1989) 529. [20] R. DeLong, C. Sasik, M.R. Pinado and W.H. Douglas, Dental Mater.,
5(1989)266. [21 ] W.D. Wolf, L.F. Francis, C.P. Lin and W.H. Douglas, J. Am. Ceram.
Soc, 76(1993)2691. [22] W.D. Wolf and L.F. Francis, in G. Fischman (ed.), Bioceramics:
Materials and Applications, American Ceramic Soc, Columbus, OH, 1994, in press.
[23] J. Fischer, M. Schmid, H.F Kappert and J.R. Strub, Dtsch. Zahnarztl, 46(1991)461.
[24] S. Chandra and Y. Ohama, Polymers in Concrete, CRC Press, Boca Raton, FL, 1994, p. 8.
[25] G. Odian, Principles of Polymerization, John Wiley, New York, 1991, p. 261.
[26] R. DeLong, M.R. Pintado and W.H. Douglas, J. Prosthet. Dent, 68 (1992)42.
[27] Y.K. Simpson and C.B. Carter, / Am. Ceram. Soc, 73 (1990) 2391. [28] R.F. Cook, B.R. Lawn and C.J. Fairbanks, /. Am. Ceram. Soc, 68
(1985)604. [29] W.D. Wolf and L.F. Francis, J. Am. Ceram. Soc, submitted. [30] R.G. Craig, Dental Clin. North Am., 25 (1981) 219. [31] B.A.M. Venhoven, A.J. de Gee, and C.L. Davidson, Biomaterials, 14
(1993) 871. [ 32] H. Lee and K. Neville, Handbook ofEpoxy Resins, McGraw-Hill, New
York, 1967, p. 1. [33] C.A. Harper, Handbook of Plastics and Elastomers, McGraw-Hill,
New York, 1975, p. 8. [34] G. Odian, Principles of Polymerization, John Wiley, New York, 1991
p. 216. [35] T. Anagnostopoulos, G. Eliades and G. Palaghias, Dent. Mater., 9
(1993) 182. [36] F.D. Osterholtz and E.R. Pohl, in Silanes and Other Coupling Agents,
1992, p. 119. [37] H. Ishida, in G. Akovali (ed.), The Interfacial Interactions in
Polymeric Composites, Kluwer Academic, Boston, MA, 1993, p. 169. [38] B.M. Vanderbilt and R.E. Clayton, Ind. Eng. Chem. Prod. Res. Dev.,
4(1965) 16. [39] L.E. Kukacka, P. Colombo, A. Auskern, J. Fontana and M. Steinberg,
Introductory Course on Concrete-Polymer Materials, Federal Highway Administration, United States Department of Transportation, Washington, DC, 1974, p. 36.
[40] R.J. Young and P.A. Lovell, Introduction to Polymers, Chapman & Hall, New York, 2nd edn., 1991, p. 420.
[41] W.J. O'Brien, Dental Materials: Properties and Selection, Quintessence, Chicago, IL, 1989, p. 131.
[42] W.H. Douglas, personal communication. [43] T.J. Garino and H.K. Bowen, J. Am. Ceram. Soc, 73 (1990) 251. [44] F.F. Lange, Int. Met. Rev., 1 (1980) 1. [45] E.M. Rabinovich, /. Mater. Sei., 20 (1985) 4259. [46] P.C. Panda, W.M. Mobley, and R. Raj, J. Am. Ceram. Soc, 72 (1989)
2361. [47] K.J. Vaidya and L.F. Francis, /. Mater. Res., submitted. [48] H. Fukui, Y. Taki and Y. Abe, J. Dent. Res., 56 (1977) 1260. [49] S. Kihara, A. Watanabe and Y. Abe, J. Am. Ceram. Soc, 67 (1984)
C100. [50] F. Pernot and R. Rogier, J. Mater. Sei., 28 (1993) 6676. [51] G.A. Rankin and F.E. Wright, Am. J. Sei. 4th Ser., XXXIX (1915) 1. [52] P.D.S. St. Pierre, / Am Ceram. Soc, 37 (1954) 243. [53] M. Toriyama, S. Kawamura, Y. Kawamoto and T. Suzuki, J. Ceram.
Soc. Japan, 98 (1990) 1054.
&?&gm mm- MATERIALS SCIENCE &
ENCINEERING
ELSEVIER Materials Science and Engineering: C 3 (1995) 75-78
Synthesis of ultrafine hydroxyapatite particles by a spray dry method
P. Luo *, T.G. Nieh Lawrence Livermore National Laboratory, Livermore, CA, USA
Abstract
A technique was developed to synthesize hydroxyapatite (HA) with a nanocrystalline structure. The method involved the initial preparation of an aqueous solution using inorganic water-soluble compounds. A precursor powder mixture was subsequently formed Via atomization by spray drying the aqueous solution. Calcination of the spray-dried precursor powder resulted in the formation of a nanocrystalline structure. Structural and morphological characterizations of the synthesized material were conducted using X-ray diffraction (XRD), Fourier Transform Infrared Spectroscopy (FTIR), and electron microscopy (SEM and TEM). Particle size distribution was analyzed using X-ray peak broadening and TEM techniques. The thermal stability of the powder was also characterized and was compared with that of powders made using conventional precipitation methods.
Keywords: Hydroxyapatite; Nanocrystalline structure; Thermal stability
1. Introduction
It is known that bone and teeth are mineralized tissues whose primary function is "load-bearing". A typical wet cortical bone is composed of 22 wt.% organic matrix, 69 wt.% mineral, and 9 wt.% water, as shown in Fig. 1 [ 1 ]. The major subphase of the mineral consists of submicroscopic crystals of an apatite of calcium and phosphate, whose crystal structure resembles that of hydroxyapatite (HA). The apatite crystals are usually formed as slender needles, 20-40 nm in length and 1.5-7 nm in diameter [2]. The mineral phase is not a discrete aggregation of calcium phosphate mineral crys- tals per se. Rather, it is made of a continuous cellular structure which gives good mechanical strength. The apatite family of minerals, A10(BO4)6X2, crystallizes into a hexagonal rhom- bic prism. Hydroxyapatite (Ca10(PO4)6(OH)2), in particu- lar, has the unit cell dimensions of a = 0.9432-0.9418 nm and c = 0.6881-0.6884 nm, and the maximum X-ray diffrac- tion plane is (211) [3,4] . The ideal Ca:P ratio of HA is 10:6 and the calculated density is 3.219 g cm-3 [5]. Calcium phosphate-based bioceramics have been in use in medicine and dentistry for over 20 years, because of their excellent biocompatibility with human tissues. Applications of hydrox- yapatite bioceramics include dental implants, percutaneous devices, and use in periodontal treatment, alveolar ridge aug- mentation, orthopedics, maxillofacial surgery, otolaryngol- ogy, and spinal surgery [6].
* Corresponding author.
Fig. 1. Typical composition of wet cortical bone.
Many synthesis methods for HA have been published, but they are all essentially chemical precipitation methods [7- 9]. Controlled powder morphology with the nanocrystalline structure was not the primary concern. Spherical powders, in general, have better rheological properties than irregular powders and, thus, produce better coatings for hip implants and Chromatographie separation [7,10]. In the present inves- tigation, spherical HA powders with nanocrystalline struc- tures are synthesized by spraying an aqueous solution via atomization. Morphology, chemical homogeneity, and phase stability of these powders are presented and related to proc- essing variables.
2. Experiments
An overview of the synthesis procedure is given schemat- ically in Fig. 2. It consists primarily of three steps: (1) solu- tion preparation, (2) precursor synthesis, and (3) thermal treatment. In step (1), a solution was made of water-soluble
0928-4931/95/$09.50 © 1995 Elsevier Science S.A. All rights reserved SSD/0928-4931(95)00089-5

76 P. Luo et at. /Materials Science and Engineering: C 3 (1995) 75-78
1 1
-^A,_B,C)- -
^
V
Nk
Precursor powder: (A,B,C) are well mixed in one particle«
Liquid solution of Spray dry tne solution elements A,B, C \/ >
High Temperature
Nanostructured powder
Fig. 2. Schematic illustration of the synthesis procedure used in the present study.
compounds containing constituent elements in HA, i.e., cal- cium nitrate and ammonium hydrophosphate. Ca:P is in the ratio 10:6. The solution was mixed thoroughly in a flask with a magnetic stirrer. Dilute acid (HN03) and basic (NH4OH) solutions were added to the mixture (without changing the concentrations of the constituent elements) to adjust its pH value to 2, in order to aviod precipitation. In step (2), drying of the solution mixture was carried out with a spray dryer. The solution was extracted from a feed tank and passed through the spray nozzle. Compressed air with a selected pressure was used during spraying (atomization). The atom- ized liquid was rapidly dried by a coaxial flow of air (flow rate= 1.0 m3 min-1) which was preheated to a temperature of 100 °C. The dried powder (i.e., precursor powder) was cyclone separated from the flowing air stream. In step (3). the precursor powder mixture was calcinated to form nano- crystalline HA. Calcination was performed by placing the precursor powder mixture in an alumina boat in a furnace preheated to a given temperature. All experiments were con- ducted in air.
The characterization of powders produced using different experimental parameters, i.e., temperature and time, was con- ducted by X-ray diffraction (XRD), Fourier transform infra- red spectroscopy (FTIR), scanning electron microscopy (SEM), and transmission electron microscopy (TEM). X- ray diffractometry was used to determine the crystallographic lattice spacing and structure. A monochromatic copper K, radiation (wavelength'= 1.54 A) was selected. The opera- tional tube voltage and current were 40 kV and 120 mA, respectively. Diffraction patterns and corresponding intensi- ties were compared with data from ASTM standards. Crys- talline phases present in the as-synthesized powders were identified and the average grain sizes were calculated by the line broadening method. In the case of FTIR analysis, samples were prepared by pressing small amount of as-synthesized HA into standard KBr powders. The chemical nature and molecular bond structure of the synthesized HA were deter- mined from the measured FTIR. The morphology and size distribution of the synthesized HA were investigated using SEM. In addition, energy dispersive X-ray analysis (EDAX)
was used to examine the compositional uniformity of the specimen. Due to the fineness of the nanograins, TEM was also employed to examine the microstructure. Sample prep- aration was carried out initially by breaking down the agglomerated powder into nanograins using an ultrasonic bath and then collecting them on a copper grid coated with carbon film. Bright field imaging provides information on the morphology of the nanograins (shape and size) and the cor- responding diffraction pattern indicates the crystalline struc- ture.
3. Result and discussion
3.1. Morphology and size distribution
Scanning electron micrographs of the precprsor powder (Fig. 3(a)) and as-synthesized powder (Fig. 3(b)) are shown in Fig. 3. The spray dried precursor powders are about 2 ^uri in size. Most of them are agglomerated into spherical particles. They have a rough surface morphology. High tem- perature calcination causes the powders to slightly sinter and coarsen. This is due to the liquid phase formation and the vaporization of by-products such as ammonium nitrate. Cal- cination at 700 °C for 1.5 h results in an average particle size of about 8 /mi, as shown in Fig. 3(b). Although it is not evident in the figure, the particles are essentially hollow shells. Close examination indicates that the surface of these particles consists of many ultrafine particulates, as schemat- ically illustrated in Fig. 2. To evaluate the chemical homo- geneity, an EDAX analysis (Fig. 4) was performed on the
Spray dried HA precursor powder
10 urn
Sintered at 700°C/1.5 hours
10 u.m
Fig. 3. Scanning electron micrographs of the precursor powder (a) and as- synthesized powder (b).
10'
o I DC -,J . . **« a—t • 10'
10l
10"2 10'1 10° 101 102 103
Area (/im )
Fig. 4. EDAX analysis illustrating the chemical homogeneity of the as- synthesized HA powders.

P. Luo et al. / Materials Science and Engineering: C 3 (1995) 75-78 77
As-synthesized hydroxyapatite powder at 700°C for 1.5 hours
*&&:*'*
Corresponding diffraction pattern
'••«
M A ** *Ä'jd 140 nm
- Agglomeration of nanoparticles - Hexagonal crystalline structure
Fig. 5. Transmission electron micrograph with the corresponding diffraction pattern from powders synthesized at 700 °C for 1.5 h.
As-synthesized hydroxyapatite powder at 700°C for 1.5 hours
Corresponding diffraction pattern
- Single crystal
Fig. 6. A rod-shape particle (50 nm in lateral dimension) and its correspond- ing diffraction pattern.
as-synthesized (700 °C for 1.5 h) HA powders. In Fig. 4, the relative concentration ratio of Ca:P (corresponding to the intensity ratio) is plotted as a function of the probe area. Although there may be a slight localized ( ~0.1 /am2) vari- ation, the Ca:P ratio is noted to be essentially a constant up to a probe area of 200 ^im2. This indicates that as-synthesized calcium phosphate is quite homogenous.
The microstructure of the synthesized powder was further examined using TEM. Shown in Fig. 5 is a TEM micrograph with the corresponding diffraction pattern from powder syn- thesized at 700 °C for 1.5 h. The powders are nanometer sized and most of them are rod shaped. The corresponding diffrac- tion pattern indicates the as-synthesized powder is polycrys- talline with preferred orientations. Shown in Fig. 6 is a rod-shape particle (50 nm in lateral dimension). The corre- sponding diffraction pattern suggests that the particle is single crystal (hexagonal) with a (2110) zone axis.
3.2. Bond structure and crystalline structure
The FTIR analysis of the powder synthesized at 700 °C for 1.5 h is shown in Fig. 7. This spectrum is consistent with that observed from hydroxyapatite synthesized by different meth- ods [10]. Most of the peaks are attributed to two kinds of vibration mode [11]: three (P04) "
3 stretching modes occur-
4000 3500 3000 2500 2000 1800 1600 1400 1200 1000 800 600 400
Fig. 7. Particle size distribution of as-synthesized hydroxyapatite by the TEM examination.
w c
I2KJ f(321.<10.40]
35 40 26
The lattice parameters are calculated to be a = 0.9410 nm and c = 0.6842 nm. . According to literature, the lattice parameters are a = 0.9432-0.9418 nm and c = 0.6881 -0.6884 nm
Fig. 8. Lattice parameter determination of the as-synthesized HA powder at 700 °C for 1.5 h.
ring at 962,1045,and 1090 cm"1, and two (P04)~3 bending
modes at 569 and 603 cm"1. The stretching modes of OH" occur at about 3572 and 3641 cm "', where the powder exhib- its relatively sharp absorption peaks. The flexural mode of OH" at 632 cm"1 is also observed. In addition, a small amount of (C03) ~
3 is recorded at 1400 to 1460 cm-1, but the intensities of these peaks are relatively low. Shown in Fig. 8 is the diffraction spectrum of the as-synthesized HA heat treated at 700 °C for 1.5 h. The diffraction peak with maximum intensity is (211). The lattice parameters are cal- culated to be a = 0.9410 nm and c = 0.6842 nm. These values are noted to be slightly different from those reported previ- ously. According to the literature, the lattice parameters are a = 0.9432-0.9418 nm and c = 0.6881-0.6884 nm [3,4]. Also pointed out in Fig. 8 is the absence of other phase modifications of calcium phosphates.
3.3. Thermal stability
Hydroxyapatite becomes unstable at 1000 °C; phase decomposition occurs after heat treating (calcinating) the spray dried powder at 1000 °C for 10 min (see the middle of Fig. 9). The whitlockite Ca3(P04)2 and lime CaO phases begin to form, but the major phase is Ca10(PO4)6(OH)2. In this case, the reaction can be described by: _ 1000 "C/10 min CaI0(PO4)6(OH)2 >
3Ca3(P04)2 + CaO + H20 (1)

78 P. Luo et al. /Materials Science and Engineering: C 3 (1995) 75-78
700°C/1.5hours
* *
JH-LM,
£A
1000"C/10min.
1000°C/1.5hours
7YAW teJUwvJuki^ 2025 Ü 35~lo 45 50 *Ca10(PO4)6(OH)2 . Ca4H2(P3O10)2
2© eCaO VCa3(P04)2 x Ca(P03)2
55
Fig. 9. X-ray diffraction analysis of as-synthesized hydroxyapatite powder.
Table 1 Average crystallite size under various processing conditions
Crystallite size (nm)
Conditions
Spray dried powder
20 42 55
700 °C, 1.5 h, in air 1000 °C, 10 min, in air 1000 °C, for 1.5 h, in air
A longer thermal exposure (e.g., 1.5 h) at 1000 °C causes further decomposition of Ca10(PO4)6(OH)2 and the forma- tion of other phases, e.g., calcium phosphate Ca(P03)2, cal- cium hydrogen phosphate, and Ca4H2(P3O10)2. Despite this decomposition, the major phase is still hydroxyapatite Ca10(PO4)6(OH)2. The following chemical reactions are proposed to describe the phase decomposition:
Ca10(PO4)6(OH)2- 1000 °C71.5 h
3Ca3(P04)2 + CaO + H20 (2)
2Ca10(PO4)6(OH)2 + l/2O2 1000 'C/1.5 h
3Ca(PO3)2 + Ca4H2(P3O10)2 + 13CaO (3)
It is pointed out that Reaction (3) involves both the decom- position and oxidation processes. Reaction (2) is predicted by the phase diagram [12], but Reaction (3) has not been reported previously. It is worth noting that all dehydrated high-temperature calcium phosphates interact with water, or body fluids, at 37 °C to form HA [6]. Therefore, the decom- position of HA during high temperature processing may be of little consequence for many biomaterials applications.
3.4. Average grain size
A qualitative analysis of the average particle size, calcu- lated by X-ray line broadening, is given in Table 1. A higher processing temperature or a longer time results in a larger
crystallite size. However, even at 1000 °C, which is within the temperature range for sintering HA [13], the average crystallite size is still below 60 nm, suggesting the sluggish- ness of grain growth in nanocrystalline HA.
4. Conclusion
Nanocrystalline hydroxyapatite (HA) is synthesized, for the first time, using a solution spray dry method. Synthesized HA consists of spherical agglomerates (about 2 /nm in diam- eter) which contain nanoparticles with an average size of 20 nm. These ultrafine particles are essentially single crystallites and rod shaped. Both X-ray diffraction and FTIR analysis indicate that the as-synthesized HA is pure. The synthesized HA powder decomposes into whitlockite Ca3(P04)2, cal- cium phosphate Ca(P03)2, calcium hydrogen phosphate Ca4H2(P3O10)2, and lime CaO phases at 1000 °C. Particle (grain) coarsening in nanocrystalline HA appears to be slug- gish.
Acknowledgment
This work was performed under the auspices of the U.S. Department of Energy by Lawrence Livermore National Lab- oratory under contract No. W-7405-Eng-48.
References
[1] J.T. Triffit, in M.R. Urist (ed.), Fundamental and Clinical Bone Physiology, Lippincott, Philadelphia, 1980, Chapter 3.
[2] H.J. Hohling, B.A. Ashton and H.D. Koster, Cell Tissue Res., 148 (1974) 11.
[3] PDF card 090432, ASTM standard. [4] A.S. Posner, A. Perloff and A.D. Diorio, Ada Crystallogr., 11 (1958)
308. [5] D. McConell, Apatite: Its Crystal Chemistry, Mineralogy, Utilization,
and Biologic Occurrence, Springer-Verlag, Berlin, 1973. [6] L.L. Hench, J. Am. Ceram. Soc, 74 (1991) 1487. [7] M. Tanahashi, K. Kamiya, T. Suzuki and H. Nasu, J. Mater. Sei. Med.,
5(1992)48. [8] P. Li, C. Ohtsuki, T. Kokubo, K. Nakanishi, N. Soga, T. Nakamura
and T. Yamamuro, / Mater. Sei. Med., 4 (1993) 127. [9] L. Yubao, J. de Wijn, C.P.A.T. Klein, S. van der Meer and K. de Groot,
J. Mater. Sei. Med., 5 (1994) 252. [ 10] D.M. Liu, H.M. Chou and J.D. Wu, J. Mater. Sei. Med, 5 (1994) 147. [ 11 ] B.O. Fowler, J. Inorg. Chem., 13 (1974) 194. [ 12] K. de Groot, C.P.A.T. Klein, J.G.C. Wolke and D. Blieck-Hogervorst,
in T. Yamamuro, L.L. Hench and J. Wilson (eds.), Handbook of Bioactive Ceramics, Vol. II: Calcium Phosphate and Hydroxyapatite Ceramics, CRC Press, Boca Raton, FL, 1990.
[13] M. Jarco, Clin. Orthoped. Relat. Res., 157 (1981) 259.

HS MATERIALS SCIENCE &
ENGINEERING
ELSEVIER Materials Science and Engineering: C 3 (1995) 79-83
A chemiluminescence-based biosensor for metal ion detection
Sanjay D. Kamtekar a, Rajiv Pande a, Madhu S. Ayyagari ab, Kenneth A. Marx c, David L. Kaplan b, Jayant Kumar d, Sukant K. Tripathy a'*
a Center for Advanced Materials, Department of Chemistry, University of Massachusetts, Lowell, MA 01854, USA b Biotechnology Division, US Army Natick RD&E Center, Natick, MA 01760, USA
c Center for Intelligent Biomaterials, Department of Chemistry, University of Massachusetts, Lowell, MA 01854, USA " Center for Advanced Materials, Department of Physics, University of Massachusetts, Lowell, MA 01854, USA
Abstract
Inhibition of the native metalloenzyme, alkaline phosphatase, in the presence of some metal ions, and the reactivation of its apoenzyme by Zn(II) ions is used to determine metal ion concentrations. Alkaline phosphatase-catalysed hydrolysis of a chemiluminescent substrate, chloro 3-(4-methoxy spiro [l,2-dioxetane-3-2'-tricyclo-[3.3.1.1]-decan]-4-yl) phenyl phosphate, generates light. By measuring the chemilumi- nescence signal strength in the presence or absence of metal ions, this reaction can be used to detect and determine metal ion concentrations. The immobilization of alkaline phosphatase on different glass surfaces by covalent coupling using a bifunctional reagent, glutaraldehyde, was demonstrated. Using chemiluminescence measurements, Zn(II), Be(II) and Bi(III) were detected in trace levels. This technique forms the basis in the development of a metal ion-based fibre optic sensor.
Keywords: Alkaline phosphatase; Metal ion detection; Chemiluminescence; Fibre optics
1. Introduction
Trace analysis of heavy metals is important in the chemical, environmental and biomedical fields. Chemical and biochem- ical methods using optical or electrochemical techniques of signal transduction to detect metals have been studied [ 1-5 ]. Biochemical means of detection of metal ions often involve metalloenzymes, which require metals as cofactors for their enzyme activity [6].
Alkaline phosphatase (EC 3.1.3.1), a non-specific phos- pho monoesterase, is a dimeric metalloenzyme containing four zinc ions and two magnesium ions coordinated to the active site [6]. Although the Zn(II) ion is necessary for enzyme activity, excessive amounts of the ion result in the inhibition of enzyme catalytic activity [7-9]. Moreover, some other metal ions, such as Be(II) and Bi(III), are also known to be potent inhibitors of alkaline phosphatase [7-9]. Removal of metal ions from the native enzyme with strong chelating agents or by partial denaturation of the enzyme results in the formation of the corresponding apoenzyme that lacks catalytic activity. By exposure to a Zn(II) ion-contain- ing solution, the apoenzyme can be reversibly activated [ 8- 10]. The restored enzyme activity is proportional to the stoi-
* Corresponding author.
0928-4931/95/$09.50 © 1995 Elsevier Science S.A. All rights reserved SSDI0928-4931(95)00095-X
chiometric amount of Zn(II) ion present in the solution, and this measure of activity allows the evaluation of the metal ion content [ 8-10]. It is thus possible to develop sensitive meth- ods for the determination of Zn(II) (in stoichiometric excess), Be and Bi based on enzyme inhibition. The presence of Zn(II) can also be determined by the apoenzyme reacti- vation.
Zri(II) ions in trace levels (p.p.b. range by enzyme reac- tivation and p.p.b. to p.p.m. range by enzyme inhibition) in bulk solutions have been determined by the present authors [9]. In addition to Zn(II), Be(II) and Bi(III) were also determined quantitatively. The technique involved the meas- urement of the chemiluminescence signal generated by the alkaline phosphatase-catalysed dephosphorylation of chloro 3-(4-methoxy spiro [l,2-dioxetane-3-2'-tricyclo-[3.3.1.1]- decan] -4-yl) phenyl phosphate (CSPD), in the presence and absence of metal ions. As described earlier, the assembly and alignment of optical components for the detection system were simple because of in situ light generation in the reaction mixture [11]. In this paper, the same approach has been extended by immobilizing alkaline phosphatase on a glass surface via covalent bonding using a bifunctional reagent, glutaraldehyde. Upon introduction of the substrate solution, light generation was observed on the glass surface (for exam- ple, on the inside walls of a glass capillary) due to enzymatic
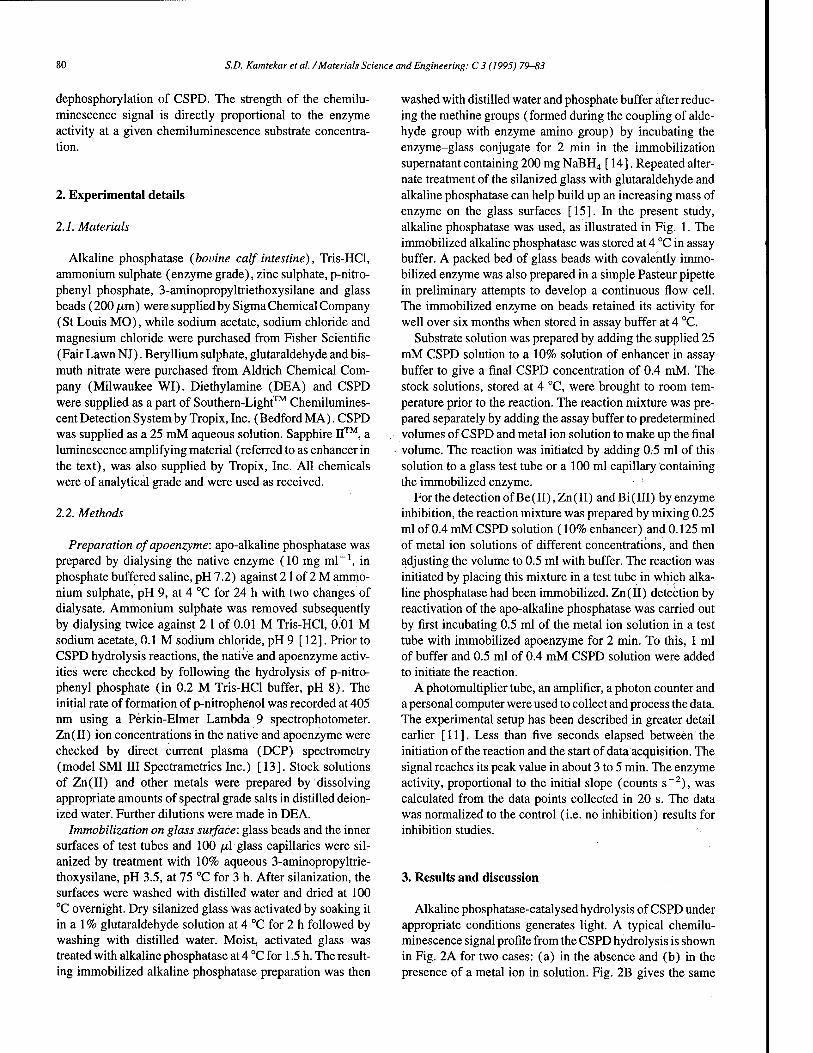
80 S.D. Kamtekar et ed. /Materials Science and Engineering: C 3 (1995) 79-83
dephosphorylation of CSPD. The strength of the chemilu- minescence signal is directly proportional to the enzyme activity at a given chemiluminescence substrate concentra- tion.
2. Experimental details
2.1. Materials
Alkaline phosphatase (bovine calf intestine), Tris-HCl, ammonium sulphate (enzyme grade), zinc sulphate, p-nitro- phenyl phosphate, 3-aminopropyltriethoxysilane and glass beads (200 /tm) were supplied by Sigma Chemical Company (St Louis MO), while sodium acetate, sodium chloride and magnesium chloride were purchased from Fisher Scientific (Fair Lawn NJ). Beryllium sulphate, glutaraldehyde and bis- muth nitrate were purchased from Aldrich Chemical Com- pany (Milwaukee WI). Diethylamine (DEA) and CSPD were supplied as a part of Southern-Light™ Chemilumines- cent Detection System by Tropix, Inc. (Bedford MA). CSPD was supplied as a 25 mM aqueous solution. Sapphire II™, a luminescence amplifying material (referred to as enhancer in the text), was also supplied by Tropix, Inc. All chemicals were of analytical grade and were used as received.
2.2. Methods
Preparation of apoenzyme: apo-alkaline phosphatase was prepared by dialysing the native enzyme (10 mg ml-1, in phosphate buffered saline, pH 7.2) against 21 of 2 M ammo- nium sulphate, pH 9, at 4 °C for 24 h with two changes of dialysate. Ammonium sulphate was removed subsequently by dialysing twice against 2 1 of 0.01 M Tris-HCl, 0.01 M sodium acetate, 0.1 M sodium chloride, pH 9 [ 12]. Prior to CSPD hydrolysis reactions, the native and apoenzyme activ- ities were checked by following the hydrolysis of p-nitro- phenyl phosphate (in 0.2 M Tris-HCl buffer, pH 8). The initial rate of formation of p-nitrophenol was recorded at 405 nm using a Perkin-Elmer Lambda 9 spectrophotometer. Zn(II) ion concentrations in the native and apoenzyme were checked by direct current plasma (DCP) spectrometry (model SMI III Spectrametrics Inc.) [13]. Stock solutions of Zn(II) and other metals were prepared by dissolving appropriate amounts of spectral grade salts in distilled deion- ized water. Further dilutions were made in DEA.
Immobilization on glass surface: glass beads and the inner surfaces of test tubes and 100 /xl glass capillaries were sil- anized by treatment with 10% aqueous 3-aminopropyltrie- thoxysilane, pH 3.5, at 75 °C for 3 h. After silanization, the surfaces were washed with distilled water and dried at 100 °C overnight. Dry silanized glass was activated by soaking it in a 1% glutaraldehyde solution at 4 °C for 2 h followed by washing with distilled water. Moist, activated glass was treated with alkaline phosphatase at 4 °C for 1.5 h. The result- ing immobilized alkaline phosphatase preparation was then
washed with distilled water and phosphate buffer after reduc- ing the methine groups (formed during the coupling of alde- hyde group with enzyme amino group) by incubating the enzyme-glass conjugate for 2 min in the immobilization supernatant containing 200 mg NaBH4 [ 14]. Repeated alter- nate treatment of the silanized glass with glutaraldehyde and alkaline phosphatase can help build up an increasing mass of enzyme on the glass surfaces [15]. In the present study, alkaline phosphatase was used, as illustrated in Fig. 1. The immobilized alkaline phosphatase was stored at 4 °C in assay buffer. A packed bed of glass beads with covalently immo- bilized enzyme was also prepared in a simple Pasteur pipette in preliminary attempts to develop a continuous flow cell. The immobilized enzyme on beads retained its activity for well over six months when stored in assay buffer at 4 °C.
Substrate solution was prepared by adding the supplied 25 mM CSPD solution to a 10% solution of enhancer in assay buffer to give a final CSPD concentration of 0.4 mM. The stock solutions, stored at 4 °C, were brought to room tem- perature prior to the reaction. The reaction mixture was pre- pared separately by adding the assay buffer to predetermined volumes of CSPD and metal ion solution to make up the final volume. The reaction was initiated by adding 0.5 ml of this solution to a glass test tube or a 100 ml capillary containing the immobilized enzyme.
For the detection of Be(II),Zn(II) andBi(III) by enzyme inhibition, the reaction mixture was prepared by mixing 0.25 ml of 0.4 mM CSPD solution (10% enhancer) and 0.125 ml of metal ion solutions of different concentrations, and then adjusting the volume to 0.5 ml with buffer. The reaction was initiated by placing this mixture in a test tube in which alka- line phosphatase had been immobilized. Zn(II) detection by reactivation of the apo-alkaline phosphatase was carried out by first incubating 0.5 ml of the metal ion solution in a test tube with immobilized apoenzyme for 2 min. To this, 1 ml of buffer and 0.5 ml of 0.4 mM CSPD solution were added to initiate the reaction.
A photomultiplier tube, an amplifier, a photon counter and a personal computer were used to collect and process the data. The experimental setup has been described in greater detail earlier [11]. Less than five seconds elapsed between the initiation of the reaction and the start of data acquisition. The signal reaches its peak value in about 3 to 5 min. The enzyme activity, proportional to the initial slope (counts s~2), was calculated from the data points collected in 20 s. The data was normalized to the control (i.e. no inhibition) results for inhibition studies.
3. Results and discussion
Alkaline phosphatase-catalysed hydrolysis of CSPD under appropriate conditions generates light. A typical chemilu- minescence signal profile from the CSPD hydrolysis is shown in Fig. 2A for two cases: (a) in the absence and (b) in the presence of a metal ion in solution. Fig. 2B gives the same

S.D. Kamtekar et al. /Materials Science and Engineering: C 3 (1995) 79-83 81
I- NH, |— N=CH-(CH2)3-CHO
OHC-(CH2)3-CHO H2N-Protein-NH2
I— NH2 : Silane treated glass
(a)
I N=CH-(CH2)3-C=N I
H2N-Protein
- Alkaline Phosphatase
\y) I -CSPD C3>&.^ZI Dissociated CSPD
_^~^ - Glutaraldehyde spacer
.(b)
Fig. 1. (a) Reaction schemes of immobilization of alkaline phosphatase onto silane treated glass surface using glutaraldehyde cross-linker, (b) Schematic representation of reaction of CSPD with alkaline phosphatase immobilized on a glass surface.
profile for the enzyme in the immobilized state. As explained in the methods section, the initial slope of these profiles was used as a measure of the reaction rate.
Immobilized alkaline phosphatase shows a similar chem- iluminescence signal profile to that in bulk solution under similar experimental conditions. However, the signal inten- sity with immobilized enzyme is weaker, perhaps due to relatively fewer numbers of enzyme molecules (calculated on the basis of complete surface coverage by the immobilized enzyme) catalysing the reaction. It is also possible that the enzyme may have partially lost its activity during the process of immobilization. In order to enhance the initial burst of photon release, the number density of enzyme on the glass surface could be increased by repeated alternate treatments of the surface with glutaraldehyde and the enzyme.
3.1. Detection ofBe(II), Zn(II) and Bi(III) by the inhibition of immobilized alkaline phosphatase
The inhibition of alkaline phosphatase in the presence of Be(II), Zn(II) and Bi(III) was studied to quantify the metal ion concentrations. As described in Section 2, the enzyme was immobilized on the inside walls of a test tube. Data collection for successive lower metal ion concentrations was continued until the detection limit was reached, i.e. the point where the difference in the initial slopes for the lowest metal ion concentration and the corresponding control (absence of any metal ion inhibitor) is indistinguishable. The error bars in the figures signify the standard deviation of three different samples taken at the same metal ion concentration. Figs. 3(a), (b) and (c) show the calibration curves obtained for Be(II),

82 S.D. Kamtekar et al. /Materials Science and Engineering: C 3 (1995) 79-83
Zn(II) and Bi(III) respectively. The detection of 5 p.p.b. Be, 120 p.p.b. Zn and 2.4 p.p.m. Bi was achieved with immobi- lized alkaline phosphatase. These detection limits are com- parable to our solution data and to the values reported in the literature [1,3-10]. The detection of these three metal ions can be made more specific by using different masking agents and by sample pre-treatment [7-9]. Determination of Zn(II) in the presence of Be(II) by selective masking of Be(II) using acetylacetone and sodium fluoride has been demon- strated in earlier studies [ 9 ]. Acetylacetone effectively masks silver, nickel, cobalt and copper ions along with beryllium, and fluoride masks the effect of aluminium, strontium, cal- cium and manganese if these interfering metal ions are present in the sample [7,16]. Investigations are currently under way to develop sample pre-treatment protocols for selective metal ion detection.
6e+03
1
a
i i
■ •""* *•* •
& 4e+03 f
4-» a 3 O
„% b
U '" •/.«.'■""•
2e+03 ■.
.-•-"•■•
1 1
(a)
2.0e+04
30 60
Time (sec)
90
0.0e+00
Fig. 2. A: Chemiluminescence signal profile of alkaline phosphatase-cata- lysed dephosphorylation of CSPD (a) in the absence and (b) in the presence of Zn(II) 100 p.p.b. in solution. B: Chemiluminescence signal profile of alkaline phosphatase-catalysed dephosphorylation of CSPD (a) in the absence and (b) in the presence of Zn(II) 400 p.p.b. in immobilized state.
(a) 10 20 30 40
[Be(II)] ppb
50
(b) [Zn(II)] ppb
> ■a 03
ID > ■a
(c) [Bi(ni)] ppm
Fig. 3. (a), (b) and (c) represent the relative enzyme activity of the immo- bilized alkaline phosphatase in the presence of inhibiting metal ions, Be (II), Zn(II) and Bi(III) respectively, against the activity in the absence of these metal ions.
3.2. Detection ofZn(II) by reactivation of immobilized apo- alkaline phosphatase
It was observed earlier in bulk solutions that apo-alkaline phosphatase exhibited reduced catalytic activity towards
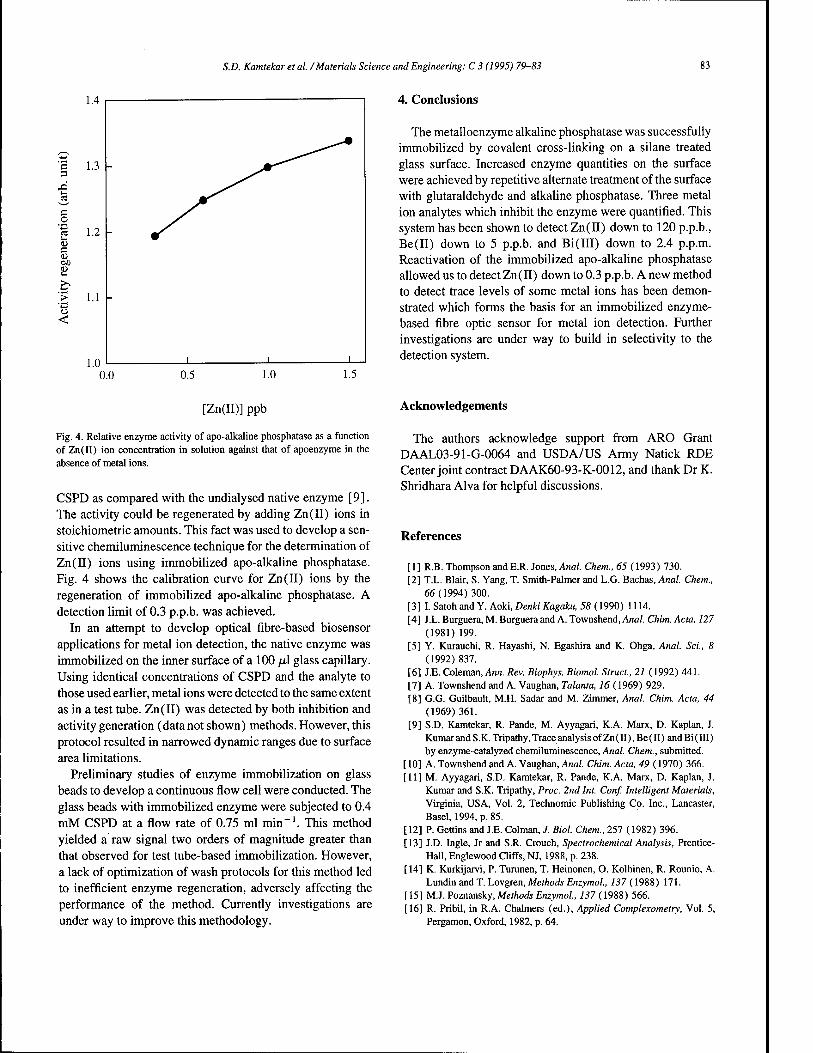
S.D. Kamtekar et al. /Materials Science and Engineering: C 3 (1995) 79-83 83
c 3
C o
c u Oß
ü <
4. Conclusions
The metalloenzyme alkaline phosphatase was successfully immobilized by covalent cross-linking on a silane treated glass surface. Increased enzyme quantities on the surface were achieved by repetitive alternate treatment of the surface with glutaraldehyde and alkaline phosphatase. Three metal ion analytes which inhibit the enzyme were quantified. This system has been shown to detect Zn(II) down to 120 p.p.b., Be(II) down to 5 p.p.b. and Bi(III) down to 2.4 p.p.m. Reactivation of the immobilized apo-alkaline phosphatase allowed us to detectZn(II) down to 0.3 p.p.b. A new method to detect trace levels of some metal ions has been demon- strated which forms the basis for an immobilized enzyme- based fibre optic sensor for metal ion detection. Further investigations are under way to build in selectivity to the detection system.
[Zn(II)] ppb
Fig. 4. Relative enzyme activity of apo-alkaline phosphatase as a function of Zn(II) ion concentration in solution against that of apoenzyme in the absence of metal ions.
CSPD as compared with the undialysed native enzyme [9]. The activity could be regenerated by adding Zn(II) ions in stoichiometric amounts. This fact was used to develop a sen- sitive chemiluminescence technique for the determination of Zn(II) ions using immobilized apo-alkaline phosphatase. Fig. 4 shows the calibration curve for Zn(II) ions by the regeneration of immobilized apo-alkaline phosphatase. A detection limit of 0.3 p.p.b. was achieved.
In an attempt to develop optical fibre-based biosensor applications for metal ion detection, the native enzyme was immobilized on the inner surface of a 100 fil glass capillary. Using identical concentrations of CSPD and the analyte to those used earlier, metal ions were detected to the same extent as in a test tube. Zn(II) was detected by both inhibition and activity generation (data not shown) methods. However, this protocol resulted in narrowed dynamic ranges due to surface area limitations.
Preliminary studies of enzyme immobilization on glass beads to develop a continuous flow cell were conducted. The glass beads with immobilized enzyme were subjected to 0.4 mM CSPD at a flow rate of 0.75 ml min-1. This method yielded a raw signal two orders of magnitude greater than that observed for test tube-based immobilization. However, a lack of optimization of wash protocols for this method led to inefficient enzyme regeneration, adversely affecting the performance of the method. Currently investigations are under way to improve this methodology.
Acknowledgements
The authors acknowledge support from ARO Grant DAAL03-91-G-0064 and USDA/US Army Natick RDE Center joint contract DAAK60-93-K-0012, and thank Dr K. Shridhara Alva for helpful discussions.
References
[1] R.B.Thompson and E.R.Jones, Anal. Chem., 65 (1993) 730. [2] T.L. Blair, S. Yang, T. Smith-Palmer and L.G. Bachas, Anal. Chem.,
66(1994)300. [3] I. Satoh and Y. Aoki, Denki Kagaku, 58 (1990) 1114. [4] J.L. Burguera, M. Burguera and A. Townshend, Anal. Chim. Ada, 127
(1981) 199. [5] Y. Kurauchi, R. Hayashi, N. Egashira and K. Ohga, Anal. Sei., 8
(1992) 837. [6] J.E. Coleman, Ann. Rev. Biophys. Biomol. Struct., 21 (1992) 441. [7] A. Townshend and A. Vaughan, Talanta, 76 (1969) 929. [8] G.G. Guilbault, M.H. Sadar and M. Zimmer, Anal. Chim. Ada, 44
(1969) 361. [9] S.D. Kamtekar, R. Pande, M. Ayyagari, K.A. Marx, D. Kaplan, J.
Kumar and S.K. Tripathy, Trace analysis of Zn(II),Be(II)andBi(III) by enzyme-catalyzed chemiluminescence, Anal. Chem., submitted.
[ 10] A. Townshend and A. Vaughan, Anal. Chim. Ada, 49 (1970) 366. [11] M. Ayyagari, S.D. Kamtekar, R. Pande, K.A. Marx, D. Kaplan, J.
Kumar and S.K. Tripathy, Proc. 2nd Int. Conf. Intelligent Materials, Virginia, USA, Vol. 2, Technomic Publishing Co. Inc., Lancaster, Basel, 1994, p. 85.
[12] P. Gettins and J.E. Colman, J. Biol. Chem., 257 (1982) 396. [13] J.D. Ingle, Jr and S.R. Crouch, Spectrochemical Analysis, Prentice-
Hall, Englewood Cliffs, NJ, 1988, p. 238. [14] K. Kurkijarvi, P. Turunen, T. Heinonen, O. Kolhinen, R. Rounio, A.
Lundin and T. Lovgren, Methods Enzymol, 137 (1988) 171. [15] M.J. Poznansky, Methods Enzymol., 137 (1988) 566. [16] R. Pribil, in R.A. Chalmers (ed.), Applied Complexometry, Vol. 5,
Pergamon, Oxford, 1982, p. 64.

•■•S»'*«'4. MATERIALS SCIENCE &
ENGINEERING
ELSEVIER Materials Science and Engineering: C 3 (1995) 85-89
Scanning force microscopy of gelatin films in the dry, swollen and redried states
Greg Haugstad a, Wayne L. Gladfelter b, Elizabeth B. Webergc, Rolf T. Weberg c, Timothy D. Weatherillc, Richard R. Jones c
* Center for Interfacial Engineering, University of Minnesota, 187 Shepherd Labs, Minneapolis, MN 55455, USA b Department ofChemistry, University of Minnesota, Minneapolis, MN 55455, USA
c Medical Products Division, E.I. du Pont de Nemours and Company, Inc., Brevard, NC 28712, USA
Abstract
We employ scanning force microscopy (SFM) to investigate films of the complex biopolymer gelatin. We distinguish different phases of gelatin via frictional force signatures. A low-friction minority phase is substantially present in thin dry films prepared from low-concentration aqueous solutions. Frictional force is measured as a function of tip speed comparatively on the different phases and related to the degree of "crystallinity" (triple-helical content) in the different film regions. The mechanical properties and surface forces are characterized in force vs. distance measurements on thick, water-swollen gelatin films prepared with and without covalent crosslinking agents. SFM imaging of redried thick films reveal "craters", which were absent in the original film. These craters are increasingly prevalent as a function of increased drying rate; an anisotropic distribution results from extremely fast directional drying. In some cases craters are observed only along boundaries between dissimilar friction domains, suggesting that interfacial stresses between domains may yield the formation of crater defects. Topographic SFM images display substantial reticulation in redried films containing a peptide coupler crosslinking agent.
Keywords: Drying; Gelatin; Scanning force microscopy
1. Introduction
Following its invention [ 1 ], scanning force microscopy (SFM) quickly established itself as a premier tool for imag- ing many classes of material structures down to the nanometre scale [2]. More recently, the ability to probe material prop- erties relevant to practical applications, e.g. adhesion and tribology, has been demonstrated on model systems [3-5]. It is our observation, however, that SFM investigations of complex materials in general, and biomaterials in particular, have largely focused on topographic imaging [6,7]; the broader capabilities of SFM have yet to be exploited fully. In the present study we employ SFM measurements of topog- raphy, frictional force, and long- and short-range surface forces to investigate the structure and properties of complex biopolymer films of great importance to the photographic industry: gelatin films. Gelatin is derived from collagen and comprises the binding matrix in which light-sensitive silver halide crystals are suspended in photographic media [ 8]. Our intention here is not to present a comprehensive study of gelatin films, but rather to demonstrate SFM methods which can yield practical information on such complex systems.
We present results for dry gelatin films ranging from ~ 1 nm to microns in thickness, prepared on mica and polyester substrates. In the thinnest films on mica we image in air two distinct phases of gelatin distinguished by their frictional signature and morphology. We further differentiate the phases via the rate-dependence of sliding friction and the effects of frictional heating. In water we perform force vs. distance measurements to (1) compare the mechanical stiff- ness of swollen gelatin films prepared with and without a covalent crosslinking agent, and (2) investigate long-range, electrostatically derived forces during approach and compli- cated ' 'stick-slip'' behaviour during withdrawal. After redry- ing, imaged gelatin films contain crater-shaped defects or reticulation, depending on the rate of drying and the presence of extrinsic crosslinking agents. Frictional imaging elucidates the origin of the crater defects.
2. Experimental details
The Nanoscope III SFM (Digital Instruments, Santa Bar- bara, CA) was used, employing the 1231J scanner with lat- eral/vertical scanning ranges of 150/4.7 [im. Triangular
0928-4931/95/S09.50 © 1995 Elsevier Science S.A. All rights reserved 55D/0928-4931(95)00096-8
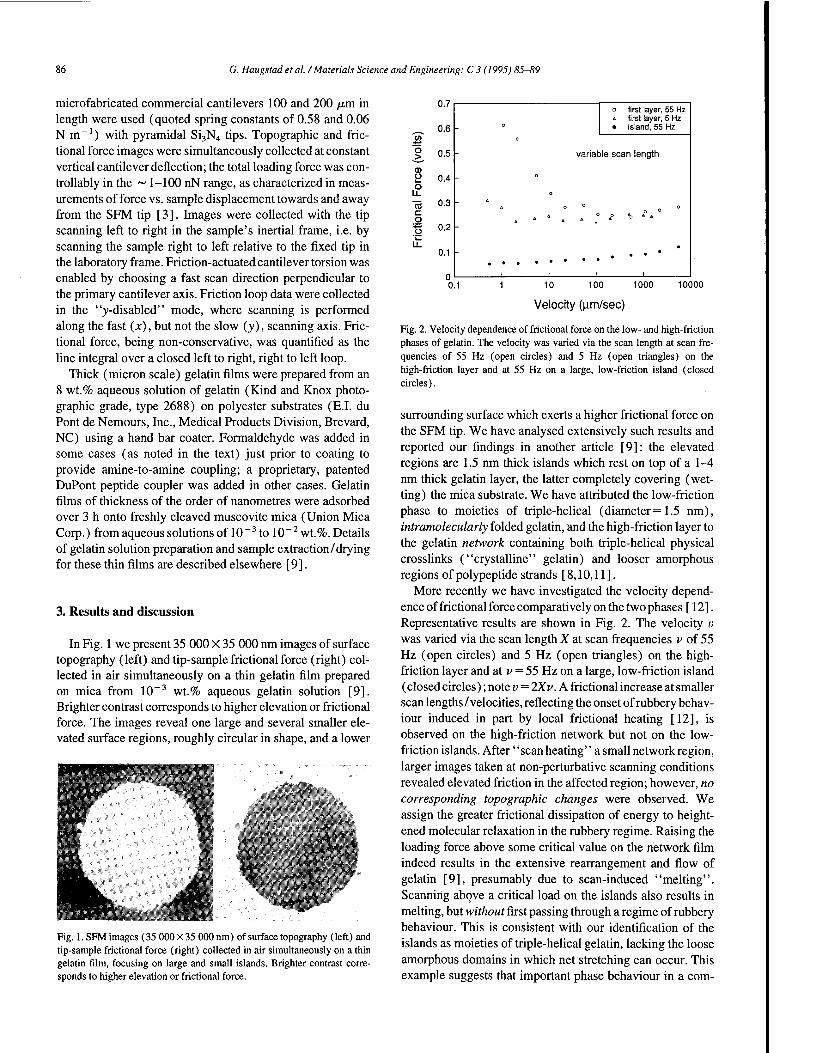
86 G. Haugstad et al. /Materials Science and Engineering: C 3 (1995) 85-89
microfabricated commercial cantilevers 100 and 200 /xm in length were used (quoted spring constants of 0.58 and 0.06 N m_1) with pyramidal Si3N4 tips. Topographic and fric- tional force images were simultaneously collected at constant vertical cantilever deflection; the total loading force was con- trollably in the ~ 1-100 nN range, as characterized in meas- urements of force vs. sample displacement towards and away from the SFM tip [3]. Images were collected with the tip scanning left to right in the sample's inertial frame, i.e. by scanning the sample right to left relative to the fixed tip in the laboratory frame. Friction-actuated cantilever torsion was enabled by choosing a fast scan direction perpendicular to the primary cantilever axis. Friction loop data were collected in the "y-disabled" mode, where scanning is performed along the fast (x), but not the slow (y), scanning axis. Fric- tional force, being non-conservative, was quantified as the line integral over a closed left to right, right to left loop.
Thick (micron scale) gelatin films were prepared from an 8 wt.% aqueous solution of gelatin (Kind and Knox photo- graphic grade, type 2688) on polyester substrates (E.I. du Pont de Nemours, Inc., Medical Products Division, Brevard, NC) using a hand bar coater. Formaldehyde was added in some cases (as noted in the text) just prior to coating to provide amine-to-amine coupling; a proprietary, patented DuPont peptide coupler was added in other cases. Gelatin films of thickness of the order of nanometres were adsorbed over 3 h onto freshly cleaved muscovite mica (Union Mica Corp.) from aqueous solutions of 10~3 to 10~2 wt.%. Details of gelatin solution preparation and sample extraction/drying for these thin films are described elsewhere [9].
3. Results and discussion
In Fig. 1 we present 35 000 X 35 000 nm images of surface topography (left) and tip-sample frictional force (right) col- lected in air simultaneously on a thin gelatin film prepared on mica from 10~3 wt.% aqueous gelatin solution [9]. Brighter contrast corresponds to higher elevation or frictional force. The images reveal one large and several smaller ele- vated surface regions, roughly circular in shape, and a lower
U./ o first layer, 55 Hz * first layer, 5 Hz
0.6 ° • island, 55 Hz "5T o •*-» o > 0.5 variable scan length
a> ü 0.4 o
o LL o
"5 0.3 & O ° 0
o o °
0.2 -
LL # 0.1
n
•
i I 1 1
0.1 10 100 1000
Velocity (Lim/sec)
10000
Fig. 1. SFM images (35 000X35 000 nm) of surface topography (left) and tip-sample frictional force (right) collected in air simultaneously on a thin gelatin film, focusing on large and small islands. Brighter contrast corre- sponds to higher elevation or frictional force.
Fig. 2. Velocity dependence of frictional force on the low- and high-friction phases of gelatin. The velocity was varied via the scan length at scan fre- quencies of 55 Hz (open circles) and 5 Hz (open triangles) on the high-friction layer and at 55 Hz on a large, low-friction island (closed circles).
surrounding surface which exerts a higher frictional force on the SFM tip. We have analysed extensively such results and reported our findings in another article [9]: the elevated regions are 1.5 nm thick islands which rest on top of a 1-4 nm thick gelatin layer, the latter completely covering (wet- ting) the mica substrate. We have attributed the low-friction phase to moieties of triple-helical (diameter = 1.5 nm), intramolecularly folded gelatin, and the high-friction layer to the gelatin network containing both triple-helical physical crosslinks ("crystalline" gelatin) and looser amorphous regions of polypeptide strands [8,10,11].
More recently we have investigated the velocity depend- ence of frictional force comparatively on the two phases [ 12]. Representative results are shown in Fig. 2. The velocity v was varied via the scan length X at scan frequencies v of 55 Hz (open circles) and 5 Hz (open triangles) on the high- friction layer and at v = 55 Hz on a large, low-friction island (closed circles); note v = 2Xv. A frictional increase at smaller scan lengths/velocities, reflecting the onset of rubbery behav- iour induced in part by local frictional heating [12], is observed on the high-friction network but not on the low- friction islands. After "scan heating'' a small network region, larger images taken at non-perturbative scanning conditions revealed elevated friction in the affected region; however, no corresponding topographic changes were observed. We assign the greater frictional dissipation of energy to height- ened molecular relaxation in the rubbery regime. Raising the loading force above some critical value on the network film indeed results in the extensive rearrangement and flow of gelatin [9], presumably due to scan-induced "melting". Scanning above a critical load on the islands also results in melting, but without first passing through a regime of rubbery behaviour. This is consistent with our identification of the islands as moieties of triple-helical gelatin, lacking the loose amorphous domains in which net stretching can occur. This example suggests that important phase behaviour in a com-
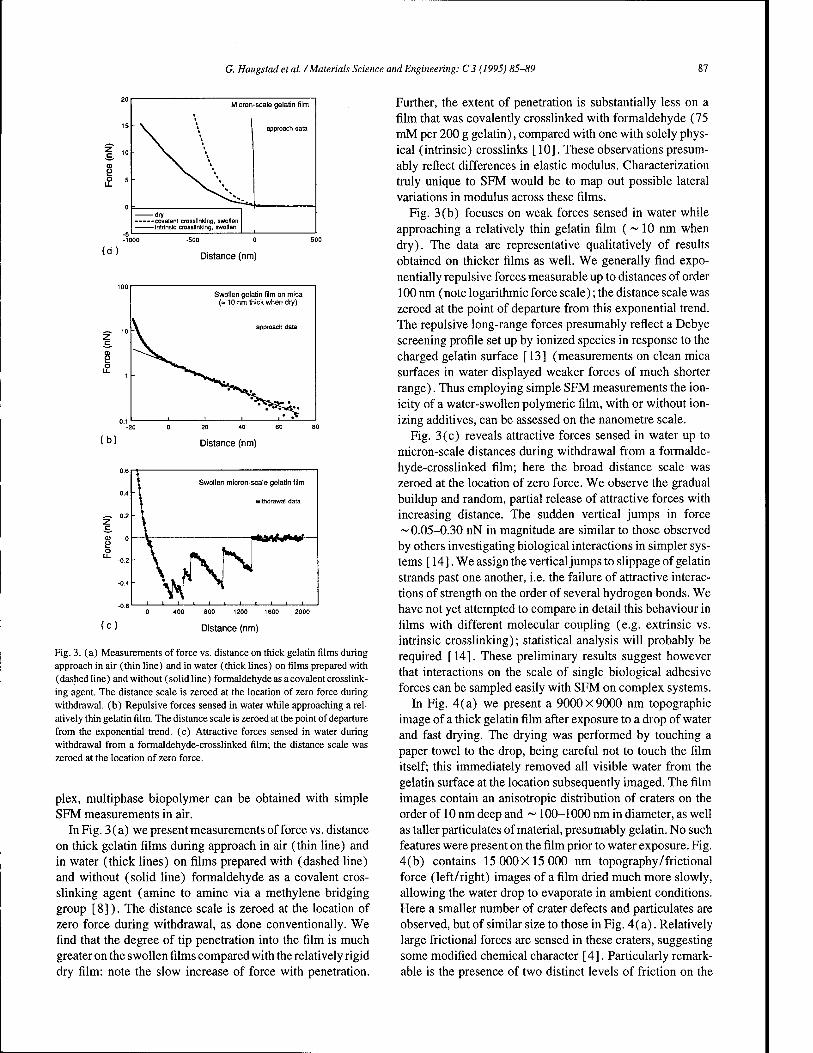
G. Haugstad et al. /Materials Science and Engineering: C 3 (1995) 85-89 87
Micron-scale gelatin film
approach data
• covalent crosslinking, swollen -intrinsic crossllnklng, swollen
(Q)
-500 0
Distance (nm)
Swollen gelatin film on mica (= 10 nm thick when dry)
approach data
Distance (nm)
Swollen micron-scale gelatin film
withdrawal data
1200 1600 2000
Distance (nm)
Fig. 3. (a) Measurements of force vs. distance on thick gelatin films during approach in air (thin line) and in water (thick lines) on films prepared with (dashed line) and without (solid line) formaldehyde as a covalent crosslink- ing agent. The distance scale is zeroed at the location of zero force during withdrawal, (b) Repulsive forces sensed in water while approaching a rel- atively thin gelatin film. The distance scale is zeroed at the point of departure from the exponential trend, (c) Attractive forces sensed in water during withdrawal from a formaldehyde-crosslinked film; the distance scale was zeroed at the location of zero force.
plex, multiphase biopolymer can be obtained with simple SFM measurements in air.
In Fig. 3(a) we present measurements of force vs. distance on thick gelatin films during approach in air (thin line) and in water (thick lines) on films prepared with (dashed line) and without (solid line) formaldehyde as a covalent cros- slinking agent (amine to amine via a methylene bridging group [8]). The distance scale is zeroed at the location of zero force during withdrawal, as done conventionally. We find that the degree of tip penetration into the film is much greater on the swollen films compared with the relatively rigid dry film: note the slow increase of force with penetration.
Further, the extent of penetration is substantially less on a film that was covalently crosslinked with formaldehyde (75 mM per 200 g gelatin), compared with one with solely phys- ical (intrinsic) crosslinks [ 10]. These observations presum- ably reflect differences in elastic modulus. Characterization truly unique to SFM would be to map out possible lateral variations in modulus across these films.
Fig. 3(b) focuses on weak forces sensed in water while approaching a relatively thin gelatin film ( ~ 10 nm when dry). The data are representative qualitatively of results obtained on thicker films as well. We generally find expo- nentially repulsive forces measurable up to distances of order 100 nm (note logarithmic force scale); the distance scale was zeroed at the point of departure from this exponential trend. The repulsive long-range forces presumably reflect a Debye screening profile set up by ionized species in response to the charged gelatin surface [13] (measurements on clean mica surfaces in water displayed weaker forces of much shorter range). Thus employing simple SFM measurements the ion- icity of a water-swollen polymeric film, with or without ion- izing additives, can be assessed on the nanometre scale.
Fig. 3(c) reveals attractive forces sensed in water up to micron-scale distances during withdrawal from a formalde- hyde-crosslinked film; here the broad distance scale was zeroed at the location of zero force. We observe the gradual buildup and random, partial release of attractive forces with increasing distance. The sudden vertical jumps in force ~ 0.05-0.30 nN in magnitude are similar to those observed by others investigating biological interactions in simpler sys- tems [ 14]. We assign the vertical jumps to slippage of gelatin strands past one another, i.e. the failure of attractive interac- tions of strength on the order of several hydrogen bonds. We have not yet attempted to compare in detail this behaviour in films with different molecular coupling (e.g. extrinsic vs. intrinsic crosslinking); statistical analysis will probably be required [14]. These preliminary results suggest however that interactions on the scale of single biological adhesive forces can be sampled easily with SFM on complex systems.
In Fig. 4(a) we present a 9000X9000 nm topographic image of a thick gelatin film after exposure to a drop of water and fast drying. The drying was performed by touching a paper towel to the drop, being careful not to touch the film itself; this immediately removed all visible water from the gelatin surface at the location subsequently imaged. The film images contain an anisotropic distribution of craters on the order of 10 nm deep and ~ 100-1000 nm in diameter, as well as taller particulates of material, presumably gelatin. No such features were present on the film prior to water exposure. Fig. 4(b) contains 15 000X15 000 nm topography/frictional force (left/right) images of a film dried much more slowly, allowing the water drop to evaporate in ambient conditions. Here a smaller number of crater defects and particulates are observed, but of similar size to those in Fig. 4(a). Relatively large frictional forces are sensed in these craters, suggesting some modified chemical character [4]. Particularly remark- able is the presence of two distinct levels of friction on the
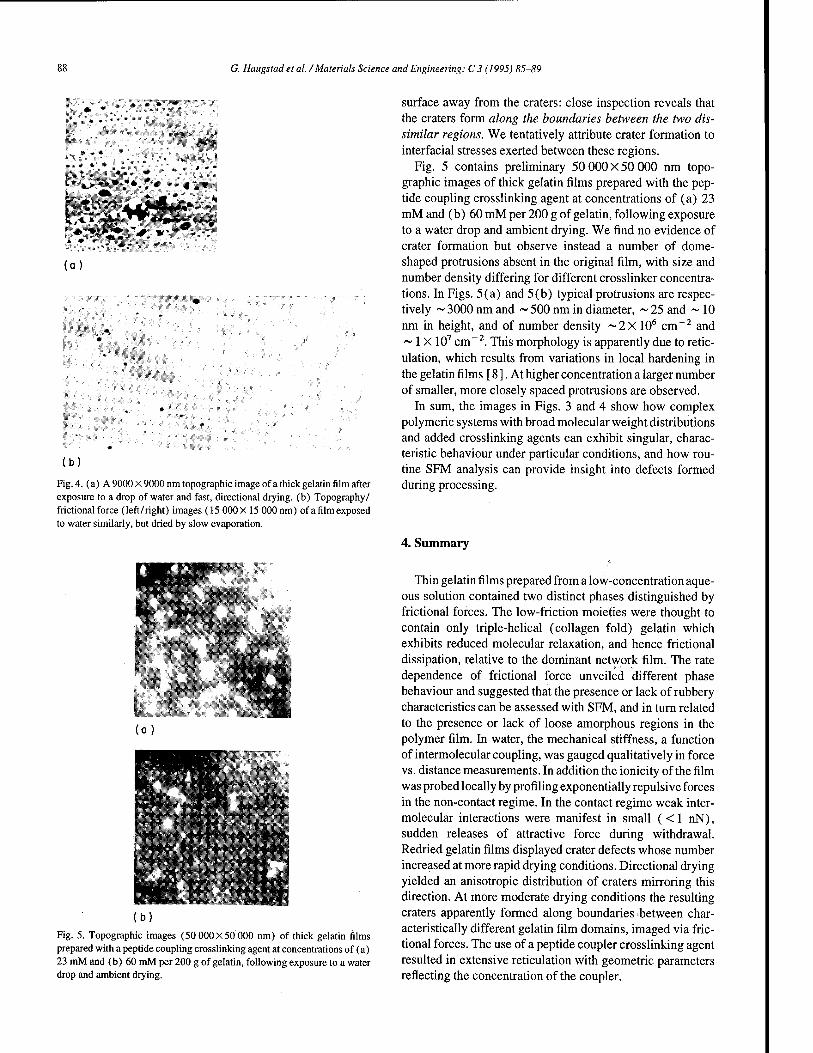
G. Haugstad et al. /Materials Science and Engineering: C 3 (1995) 85-89
liiJitiN^L«
{a
(b)
Fig. 4. (a) A 9000 X 9000 nm topographic image of a thick gelatin film after exposure to a drop of water and fast, directional drying, (b) Topography/ frictional force (left/right) images (15 000X 15 000 nm) of a film exposed to water similarly, but dried by slow evaporation.
TIFSS
(a)
mm,
X3x
I'm**«
m
Fig. 5. Topographic images (50 000X50 000 nm) of thick gelatin films prepared with a peptide coupling crosslinking agent at concentrations of (a) 23 mM and (b) 60 mM per 200 g of gelatin, following exposure to a water drop and ambient drying.
surface away from the craters: close inspection reveals that the craters form along the boundaries between the two dis- similar regions. We tentatively attribute crater formation to interfacial stresses exerted between these regions.
Fig. 5 contains preliminary 50 000 X 50 000 nm topo- graphic images of thick gelatin films prepared with the pep- tide coupling crosslinking agent at concentrations of (a) 23 mM and (b) 60 mM per 200 g of gelatin, following exposure to a water drop and ambient drying. We find no evidence of crater formation but observe instead a number of dome- shaped protrusions absent in the original film, with size and number density differing for different crosslinker concentra- tions. In Figs. 5(a) and 5(b) typical protrusions are respec- tively ~ 3000 nm and ~ 500 nm in diameter, ~ 25 and ~ 10 nm in height, and of number density ~2X 106 cm-2 and ~ 1 X 107 cm-2. This morphology is apparently due to retic- ulation, which results from variations in local hardening in the gelatin films [ 8 ]. At higher concentration a larger number of smaller, more closely spaced protrusions are observed.
In sum, the images in Figs. 3 and 4 show how complex polymeric systems with broad molecular weight distributions and added crosslinking agents can exhibit singular, charac- teristic behaviour under particular conditions, and how rou- tine SFM analysis can provide insight into defects formed during processing.
4. Summary
Thin gelatin films prepared from a low-concentration aque- ous solution contained two distinct phases distinguished by frictional forces. The low-friction moieties were thought to contain only triple-helical (collagen fold) gelatin which exhibits reduced molecular relaxation, and hence frictional dissipation, relative to the dominant network film. The rate dependence of frictional force unveiled different phase behaviour and suggested that the presence or lack of rubbery characteristics can be assessed with SFM, and in turn related to the presence or lack of loose amorphous regions in the polymer film. In water, the mechanical stiffness, a function of intermolecular coupling, was gauged qualitatively in force vs. distance measurements. In addition the ionicity of the film was probed locally by profiling exponentially repulsive forces in the non-contact regime. In the contact regime weak inter- molecular interactions were manifest in small ( < 1 nN), sudden releases of attractive force during withdrawal. Redried gelatin films displayed crater defects whose number increased at more rapid drying conditions. Directional drying yielded an anisotropic distribution of craters mirroring this direction. At more moderate drying conditions the resulting craters apparently formed along boundaries between char- acteristically different gelatin film domains, imaged via fric- tional forces. The use of a peptide coupler crosslinking agent resulted in extensive reticulation With geometric parameters reflecting the concentration of the coupler.

G. Haugstad et al. /Materials Science and Engineering: C 3 (1995) 85-89 89
Acknowledgements
Support by the Center for Interfacial Engineering, a National Science Foundation Engineering Research Center, and a grant from E.I. du Pont de Nemours and Co., Inc., is gratefully acknowledged.
References
[ 1 ] G. Binnig, C.F. Quate and C. Gerber, Phys. Rev. Lett., 56 (1986) 930. [2] D. Rugarand P. Hansma, Phys. Today, October (1990) 23. [3] N.A. Burnham,D.D. Dominguez,R.L.Mowery andR.J. Colton,Phys.
Rev. Lett., 64 (1990) 1931.
[4] R.M. Overney, E. Meyer, J. Frommer, D. Brodbeck, R. Liithi, L. Howald, H.-J. Giintherodt, M. Fujihira, H. Takano and Y. Gotoh, Nature, 359 (1992) 133.
[5] CM. Mate, Phys. Rev. Lett, 68 (1992) 3323. [6] J. Frommer, Angew. Chem. Int. Ed. Eng., 31 (1992) 1298. [7] M. Anders and H. Fuchs, Scanning, 15 (1993) 275. [8] H.G. Curme, in C.E.K. Mees and T.H. James (eds.), The Theory of
the Photographic Process, 4th edn, Macmillan, New York, 1966, p. 45.
[9] G. Haugstad, W.L. Gladfelter, E.B. Weberg, R.T. Weberg and T.D. Weatherill, Langmuir, 10 (1994) 4295.
[10] M. Djabourov, Contemp. Phys., 29 (1988) 273. [11] W.F. Harrington and N.V. Rao, Biochemistry, 9 (1970) 3714. [12] G. Haugstad, W.L. Gladfelter, E.B. Weberg, R.T. Weberg and R.
Jones, Langmuir, in press. [13] J.N. Israelachvili, Intermolecular and Surface Forces, 2nd edn,
Academic Press, San Diego, 1991. [ 14] E.-L. Florin, V.T. Moy and H.E. Gaub, Science, 264 (1994) 415.
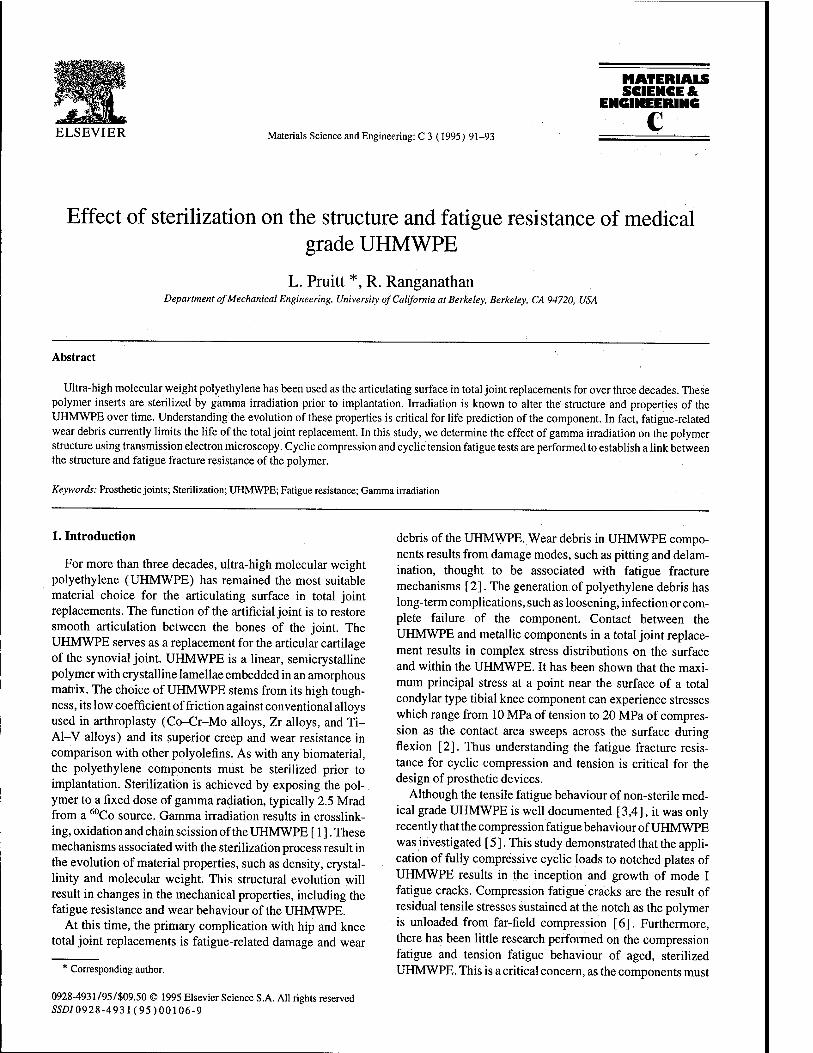
MATERIALS SCIENCE &
ENGINEERING
ELSEVIER Materials Science and Engineering: C 3 (1995) 91-93
Effect of sterilization on the structure and fatigue resistance of medical grade UHMWPE
L. Pruitt *, R. Ranganathan Department of Mechanical Engineering, University of California at Berkeley, Berkeley, CA 94720, USA
Abstract
Ultra-high molecular weight polyethylene has been used as the articulating surface in total joint replacements for over three decades. These polymer inserts are sterilized by gamma irradiation prior to implantation. Irradiation is known to alter the structure and properties of the UHMWPE over time. Understanding the evolution of these properties is critical for life prediction of the component. In fact, fatigue-related wear debris currently limits the life of the total joint replacement. In this study, we determine the effect of gamma irradiation on the polymer structure using transmission electron microscopy. Cyclic compression and cyclic tension fatigue tests are performed to establish a link between the structure and fatigue fracture resistance of the polymer.
Keywords: Prosthetic joints; Sterilization; UHMWPE; Fatigue resistance; Gamma irradiation
1. Introduction
For more than three decades, ultra-high molecular weight polyethylene (UHMWPE) has remained the most suitable material choice for the articulating surface in total joint replacements. The function of the artificial joint is to restore smooth articulation between the bones of the joint. The UHMWPE serves as a replacement for the articular cartilage of the synovial joint. UHMWPE is a linear, semicrystalline polymer with crystalline lamellae embedded in an amorphous matrix. The choice of UHMWPE stems from its high tough- ness, its low coefficient of friction against conventional alloys used in arthroplasty (Co-Cr-Mo alloys, Zr alloys, and Ti- Al-V alloys) and its superior creep and wear resistance in comparison with other polyolefins. As with any biomaterial, the polyethylene components must be sterilized prior to implantation. Sterilization is achieved by exposing the pol- ymer to a fixed dose of gamma radiation, typically 2.5 Mrad from a 60Co source. Gamma irradiation results in crosslink- ing, oxidation and chain scission of the UHMWPE [ 1 ]. These mechanisms associated with the sterilization process result in the evolution of material properties, such as density, crystal- linity and molecular weight. This structural evolution will result in changes in the mechanical properties, including the fatigue resistance and wear behaviour of the UHMWPE.
At this time, the primary complication with hip and knee total joint replacements is fatigue-related damage and wear
* Corresponding author.
debris of the UHMWPE. Wear debris in UHMWPE compo- nents results from damage modes, such as pitting and delam- ination, thought to be associated with fatigue fracture mechanisms [2]. The generation of polyethylene debris has long-term complications, such as loosening, infection or com- plete failure of the component. Contact between the UHMWPE and metallic components in a total joint replace- ment results in complex stress distributions on the surface and within the UHMWPE. It has been shown that the maxi- mum principal stress at a point near the surface of a total condylar type tibial knee component can experience stresses which range from 10 MPa of tension to 20 MPa of compres- sion as the contact area sweeps across the surface during flexion [2]. Thus understanding the fatigue fracture resis- tance for cyclic compression and tension is critical for the design of prosthetic devices.
Although the tensile fatigue behaviour of non-sterile med- ical grade UHMWPE is well documented [3,4], it was only recently that the compression fatigue behaviour of UHMWPE was investigated [5]. This study demonstrated that the appli- cation of fully compressive cyclic loads to notched plates of UHMWPE results in the inception and growth of mode I fatigue cracks. Compression fatigue cracks are the result of residual tensile stresses sustained at the notch as the polymer is unloaded from far-field compression [6]. Furthermore, there has been little research performed on the compression fatigue and tension fatigue behaviour of aged, sterilized UHMWPE. This is a critical concern, as the components must
0928-4931/95/$09.50 © 1995 Elsevier Science S.A. All rights reserved SSD/0928-4931(95) 00106-9
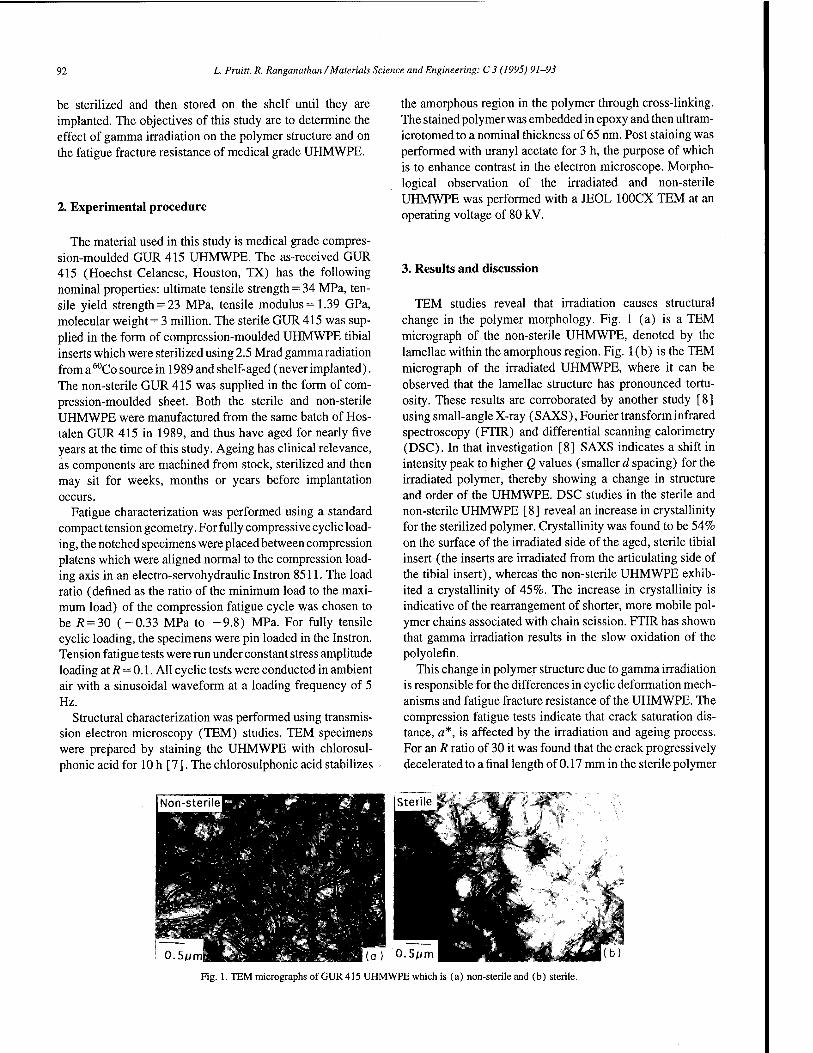
92 L. Pruitt, R. Ranganathan /Materials Science and Engineering: C 3 (1995) 91-93
be sterilized and then stored on the shelf until they are implanted. The objectives of this study are to determine the effect of gamma irradiation on the polymer structure and on the fatigue fracture resistance of medical grade UHMWPE.
2. Experimental procedure
The material used in this study is medical grade compres- sion-moulded GUR 415 UHMWPE. The as-received GUR 415 (Hoechst Celanese, Houston, TX) has the following nominal properties: ultimate tensile strength = 34 MPa, ten- sile yield strength = 23 MPa, tensile modulus =1.39 GPa, molecular weight = 3 million. The sterile GUR 415 was sup- plied in the form of compression-moulded UHMWPE tibial inserts which were sterilized using 2.5 Mrad gamma radiation from a 60Co source in 1989 and shelf-aged (never implanted). The non-sterile GUR 415 was supplied in the form of com- pression-moulded sheet. Both the sterile and non-sterile UHMWPE were manufactured from the same batch of Hos- talen GUR 415 in 1989, and thus have aged for nearly five years at the time of this study. Ageing has clinical relevance, as components are machined from stock, sterilized and then may sit for weeks, months or years before implantation occurs.
Fatigue characterization was performed using a standard compact tension geometry. For fully compressive cyclic load- ing, the notched specimens were placed between compression platens which were aligned normal to the compression load- ing axis in an electro-servohydraulic Instron 8511. The load ratio (defined as the ratio of the minimum load to the maxi- mum load) of the compression fatigue cycle was chosen to be 7? = 30 (-0.33 MPa to -9.8) MPa. For fully tensile cyclic loading, the specimens were pin loaded in the Instron. Tension fatigue tests were run under constant stress amplitude loading at R = 0.1. All cyclic tests were conducted in ambient air with a sinusoidal waveform at a loading frequency of 5 Hz.
Structural characterization was performed using transmis- sion electron microscopy (TEM) studies. TEM specimens were prepared by staining the UHMWPE with chlorosul- phonic acid for 10 h [7]. The chlorosulphonic acid stabilizes
JNon-sterileH ß ]
• -', • 1*"
0.5 p m iSU^SaH *fc ■, v.,. . ■ 1 (o )
the amorphous region in the polymer through cross-linking. The stained polymer was embedded in epoxy and then ultram- icrotomed to a nominal thickness of 65 nm. Post staining was performed with uranyl acetate for 3 h, the purpose of which is to enhance contrast in the electron microscope. Morpho- logical observation of the irradiated and non-sterile UHMWPE was performed with a JEOL 100CX TEM at an operating voltage of 80 kV.
3. Results and discussion
TEM studies reveal that irradiation causes structural change in the polymer morphology. Fig. 1 (a) is a TEM micrograph of the non-sterile UHMWPE, denoted by the lamellae within the amorphous region. Fig. 1 (b) is the TEM micrograph of the irradiated UHMWPE, where it can be observed that the lamellae structure has pronounced tortu- osity. These results are corroborated by another study [8] using small-angle X-ray (S AXS), Fourier transform infrared spectroscopy (FTIR) and differential scanning calorimetry (DSC). In that investigation [8] SAXS indicates a shift in intensity peak to higher Q values (smaller d spacing) for the irradiated polymer, thereby showing a change in structure and order of the UHMWPE. DSC studies in the sterile and non-sterile UHMWPE [8] reveal an increase in crystallinity for the sterilized polymer. Crystallinity was found to be 54% on the surface of the irradiated side of the aged, sterile tibial insert (the inserts are irradiated from the articulating side of the tibial insert), whereas the non-sterile UHMWPE exhib- ited a crystallinity of 45%. The increase in crystallinity is indicative of the rearrangement of shorter, more mobile pol- ymer chains associated with chain scission. FTIR has shown that gamma irradiation results in the slow oxidation of the polyolefin.
This change in polymer structure due to gamma irradiation is responsible for the differences in cyclic deformation mech- anisms and fatigue fracture resistance of the UHMWPE. The compression fatigue tests indicate that crack saturation dis- tance, a*, is affected by the irradiation and ageing process. For an R ratio of 30 it was found that the crack progressively decelerated to a final length of 0.17 mm in the sterile polymer
ISterile £•:''
) 0.5f/m
Fig. 1. TEM micrographs of GUR 415 UHMWPE which is (a) non-sterile and (b) sterile.
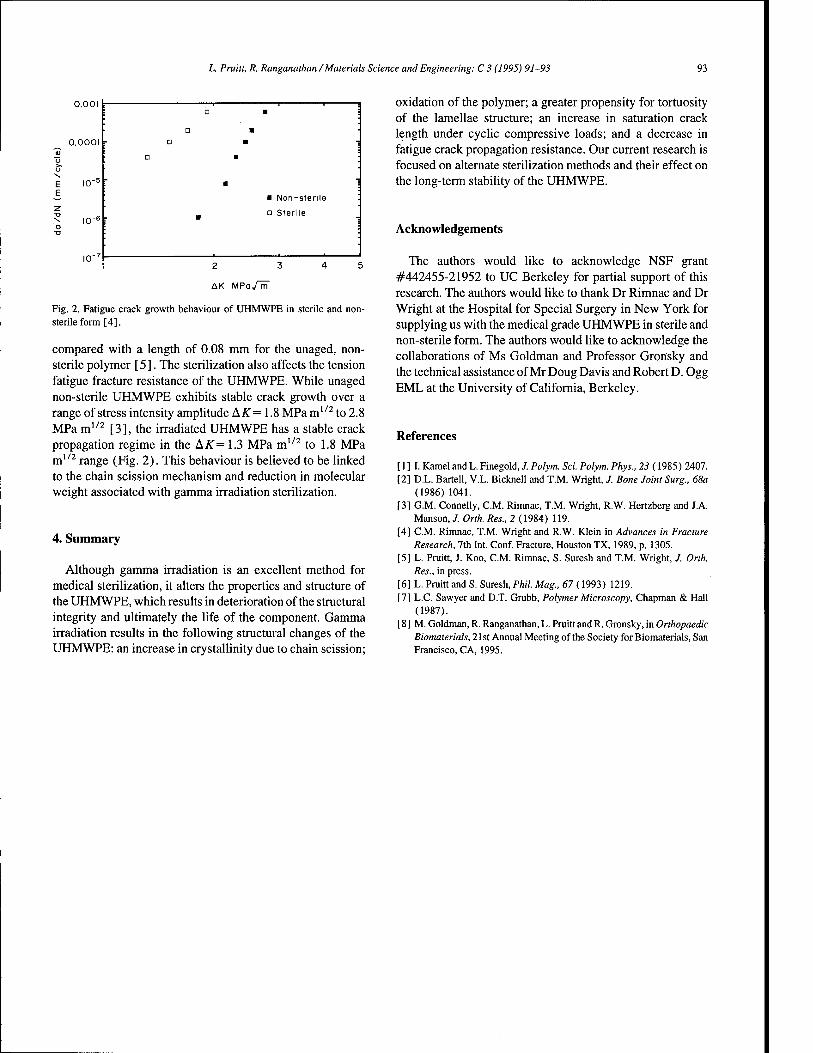
L. Pruitt, R. Ranganathan /Materials Science and Engineering: C 3 (1995) 91-93 93
0.001
0.0001 -
I0"D i
10"
■ □ ■
■ D m ■
- D m - G m
■ ■
- m 1
\ ■ Non-sterile '. •
□ Sterile '
~ ■ 1
■ ■
10" I 2 3 4 5
AK MPa/m"
Fig. 2. Fatigue crack growth behaviour of UHMWPE in sterile and non- sterile form [4].
compared with a length of 0.08 mm for the unaged, non- sterile polymer [5]. The sterilization also affects the tension fatigue fracture resistance of the UHMWPE. While unaged non-sterile UHMWPE exhibits stable crack growth over a range of stress intensity amplitude AK= 1.8 MPa m1/2 to 2.8 MPa m1/2 [3], the irradiated UHMWPE has a stable crack propagation regime in the A#= 1.3 MPa m1/2 to 1.8 MPa m1/2 range (Fig. 2). This behaviour is believed to be linked to the chain scission mechanism and reduction in molecular weight associated with gamma irradiation sterilization.
4. Summary
Although gamma irradiation is an excellent method for medical sterilization, it alters the properties and structure of the UHMWPE, which results in deterioration of the structural integrity and ultimately the life of the component. Gamma irradiation results in the following structural changes of the UHMWPE: an increase in crystallinity due to chain scission;
oxidation of the polymer; a greater propensity for tortuosity of the lamellae structure; an increase in saturation crack length under cyclic compressive loads; and a decrease in fatigue crack propagation resistance. Our current research is focused on alternate sterilization methods and their effect on the long-term stability of the UHMWPE.
Acknowledgements
The authors would like to acknowledge NSF grant #442455-21952 to UC Berkeley for partial support of this research. The authors would like to thank Dr Rimnac and Dr Wright at the Hospital for Special Surgery in New York for supplying us with the medical grade UHMWPE in sterile and non-sterile form. The authors would like to acknowledge the collaborations of Ms Goldman and Professor Gronsky and the technical assistance of Mr Doug Davis and Robert D. Ogg EML at the University of California, Berkeley.
References
[ 1 ] I. Kamel and L. Finegold, J. Polym. Sei. Polym. Phys., 23 (1985) 2407. [2] D.L. Bartell, V.L. Bicknell and T.M. Wright, J. Bone Joint Surg., 68a
(1986) 1041. [3] G.M. Connelly, CM. Rimnac, T.M. Wright, R.W. Hertzberg and J.A.
Manson,/ Orth. Res., 2 (1984) 119. [4] CM. Rimnac, T.M. Wright and R.W. Klein in Advances in Fracture
Research, 7th Int. Conf. Fracture, Houston TX, 1989, p. 1305. [5] L. Pruitt, J. Koo, CM. Rimnac, S. Suresh and T.M. Wright, / Orth.
Res., in press. [6] L. Pruitt and S. Suresh, Phil. Mag., 67 (1993) 1219. [7] L.C Sawyer and D.T. Grubb, Polymer Microscopy, Chapman & Hall
(1987). [8] M. Goldman, R. Ranganathan, L. Pruitt and R. Gronsky, in Orthopaedic
Biomaterials, 21st Annual Meeting of the Society for Biomaterials, San Francisco, CA, 1995.

&WIM
ELSEVIER
MATERIALS SCIENCE &
ENGINEERING
Materials Science and Engineering: C 3 (1995) 95-100
Textural analysis of eggshells
J.M. Garcia-Ruiz, A. Rodriguez Navarro, O. Kälin Laboratorio de Estudios Cristalogräficos, IAGM, CSIC-Universidadde Granada, Av. Fuentenueva s/n, Granada 18002, Spain
Abstract
We discuss an experimental protocol to measure the degree of preferred orientation by using a textural index (T) consisting of a single parameter easily derived from X-ray diffraction data recovered with a powder diffractometer. This textural index can be used for a quantitative characterization of the development of crystallographic orientation in biominerals and biomimetic materials which in many cases can be considered as layered structures showing preferred orientation across the structure but a quasi-homogeneous architecture in the normal to the growth direction. We demonstrate with the help of a computer simulation that the variation of the textural index with eggshell thickness and curvature arises from a competition for space between the mineral units growing outwards from the nucleation substrate.
Keywords: Eggshell; Textural analysis; Preferred orientation; X-ray diffraction
1. Introduction
The avian eggshell is a ceramic material made of inter- and intracrystalline organic matter enfolding a mineral phase with perfect crystallographic continuity [ 1 ]. It is known that the mineral phase is formed by calcite crystals which display a well-defined textural arrangement. In brief, the structure is currently described as consisting of four (sometimes three) successive layers [2]: (a) an inner layer of hemispherical nucleation centres termed mamillary cores which are partially embedded in an organic matrix; (b) a layer of cone-shaped structure; (c) a layer of columnar crystals also called palisade layer; and (d) a dense outer layer usually markedly lami- nated. Thus, the avian eggshell can be considered as a layered structure which develops a preferred orientation in the normal to the eggshell surface. Although the mechanical properties of eggshells are currently linked to their thickness [3], the eggshell is not a homogeneous but a functionally gradient material [4] made of a ceramic with a progressive change in both grain size and crystal orientation throughout its thickness and therefore it seems clear that these mechanical properties have to correlate rather with their textural features [ 5 ]. There- fore, this type of characterization becomes important for the assessment of the reproductive success in conservational studies of threatened wild species and for the control of the breaking properties of eggshells of domestic species [6].
We discuss below an experimental procedure to obtain textural information from eggshells using an X-ray powder diffractometer. A textural index consisting of a single param- eter is defined and discussed. The degree of textural arrange-
ment of calcite crystals in avian eggshells at different levels across the structure is then described by the change in the value of the textural index. Optical studies as well as some features of the X-ray diagrams suggest that eggshell structure is a typical case of competitive crystal growth. In conse- quence, we tested this.hypothesis by comparing the infor- mation derived from X-ray studies with the laws governing the competition process derived from our two-dimensional computer simulation of the problem.
2. Textural analysis
The intensity I (hkl) of a given Bragg reflection corre- sponding to the family of planes {hkl} of a poly crystalline powder is a statistical property [7]. As soon as the specimen has some degree of preferred orientation, the intensities of the reflections are corrected by a factor that measures the volume fraction of the crystallites with a given orientation fulfilling the Bragg equation. The Rietveld index [8] is the parameter currently used to estimate the existence of pre- ferred orientation in a polycrystalline material by comparing the intensities I (hkl) corresponding to a given textured sam- ple with the intensities I0(hkl) corresponding to a completely disordered powder of the specimen [ 9].
■■& (1) TJ(hkl) -U(hkl)0
LI(hkl) o
Sharp and Sylin-Roberts [10] estimate the degree of pre- ferred orientation of the mineral part of eggshells by using
0928-4931/95/$09.50 © 1995 Elsevier Science S.A. All rights reserved 550/0928-4931(95)00107-7

96 J.M. Garcia-Ruiz et al. /Materials Science and Engineering: C 3 (1995) 95-100
Angle -10 0 10 20 30 40 50 60 70 80 90 100
I ' I ' I '—I-1-1—"—I—l—P'1 I v I -10 0 10 20 30 40 50 60 70 80 90 100
[006] [108] [1041116] [113] [202] [110]
Fig. 1. The normalised intensities of diffraction peaks in front to the inter- planar angle co at different eggshell thickness. The data correspond to the flamingo (Phoenicopterus piber) eggshell.
plots of the type shown in Fig. 1 where the ratio of the intensities of the textured / and random I0 specimens for several families of diffracting planes {hkl} are plotted against the interplanar angle co between different [hkl] diffracting planes with respect to a reference family of planes. The ref- erence {hkl} currently used is that corresponding to the greater I/I0 ratio, which for the case shown in Fig. 1 corre- sponds to the {006} direction, i.e., the direction perpendicular to the stacking of carbonate groups in the calcite structure. The sharpness of this curve is then qualitatively related to the degree of texturation and the higher value I/I0 (or (I/I0)
05) is the one used to estimate the degree of texturation.
As discussed by Valdova [11], this method making use of the distribution of the normalised values of the intensities belonging to all the reflections in the structure with respect to the interplanar angles co(hkl) is equivalent to performing an «-scan of the sample, that is, to measuring the intensity values of a given reflection (hkl) as a function of the incli- nation of the sample. This technique is currently used to correct the effect of texture in structural studies for those cases when the texturation with <j> does not exist, i.e. when there is a random orientation in the plane normal to the pre- ferred orientation. Such a variation follows a Gaussian dis- tribution of intensity values as a function of u>. In fact, we have noticed that the variation of I/I0, with co(hkl) in egg- shells can be properly represented by a Gaussian-type func- tion:
7 = 7f exp( - TO)2)
to ■'o
and therefore when plotting the log of the intensity values versus co2, a linear relationship can be obtained with a slope defined by an expression of the type:
In jrt
In IS I0 (2)
The parameter rcan be proposed as a single parameter defin- ing quantitatively the degree of texturation of the eggshell. The larger the value of T, the higher the selective orientation of the calcite crystals forming the eggshell. The parameter T
is related to the full width half maximum (FWHM) of the Gaussian distribution of crystals by the relation:
VJFWHM/
This method was applied to the eggshell of flamingo (Phoenicopterus piber) and several dinosaur eggshells at discrete values of thickness which were obtained by succes- sive thinning of the shell fragments. As shown for the case of the flamingo eggshell in Fig. 2, the values of T obtained when polishing the eggshell outward or inward are different. This mismatch is a consequence of the different regions of the eggshell explored by the incident X-ray beam in both polishing directions. Diffracted X-rays arise from a certain depth below the surface exposed to the incident beam. The penetration depth of the X-rays used in this study (filtered Cu Ka radiation) is about 40 yarn (99% of absorption) and therefore it provides information on the textural properties of this narrow part of the shell. As diagrammatically shown in Fig. 3, it is clear that, for the same value of the eggshell thickness, the information recovered by the diffracted beam belongs to adjacent but different regions of the eggshell. In addition, it should be noted that this information has to be weighted owing to the exponential decay of the X-ray absorp- tion. To reduce this mismatch and therefore to obtain accurate values of the textural index with higher spatial resolution, X- ray sources with less penetration power should be used at thickness intervals as small as possible. It can be observed in Fig. 2 that when T increases, it follows a linear relationship with thickness. This is clearly observed for the case of the flamingo eggshell, for which we found that outward from the inner shell surface (h = 0), the textural index T increases continuously, displaying a linear relationship with the thick- ness. The absence of preferred orientation at zero eggshell thickness (inner face of the eggshell) and the Gaussian dis- tribution of the normalised X-ray intensities with the angle of orientation of the sample, obtained at positive eggshell thickness, suggest the existence of a physical selection from an initial random distribution of growing crystal units. Fur- thermore, when thin slides made from radial sections of the eggshell are studied by optical and electron microscopy, they reveal typical geometrical patterns of competition for space [ 12] between the different wedge-shaped crystals forming the eggshell structure which correlate well with the regions

J.M. Garcia-Ruiz et at /Materials Science and Engineering: C 3 (1995) 95-100 97
1,8
1,6
1,4
x 1,2 <u -D ^1,0 CO
!°.8
0,6
0,4
0,2?
Flaningo eggshell (a) Ftolished fromthe internal face (b) Fblished fromthe external face
>"
?) D'^b
1/
100 200 300 400
Thickness (urn)
500 600
2,5
2,0
1,5 $
"O
"I 1,0
I 0,5
0,0 -
i ' i 1 i , | , | , i
Dno eggshells B
:
r iß
1
> • d-cr / ,B °o • ■)'!■ ■■.
DD1-^ °°D %BBBH B B □ n D ° D _
■p —D— From Argentina (a) -B- From Argentina (b) —O— From Cuenca (Spain) —•— From Biscarri (Spain)
i . i ' i.i, i
1000 2000 3000
Thickness (p.m)
4000 5000
Fig. 2. The variation of textural index with eggshell thickness. For the case of flamingo, a linear trend is obtained for the whole eggshell thickness (the regression analysis yields a slope value of 0.002 with a correlation coefficient of 0.94. For the case of dinosaur eggshell, such a linear trend is only fulfilled for the first 1000 fim of the eggshell.
where T varies linearly with thickness. To test whether the textural properties of these regions arise from a competition for space we performed the following computer-based study [13].
3. Computer simulation of competitive crystal growth
The substrate where nucleation of 2-D square crystals takes place and from which they will grow outward is a horizontal line located in the lower part of a 650x450 pixels screen. We arrange periodically on the substrate line a number n0 of seeds with a distance between neighbours of p pixels. The seeds are randomly oriented in the range between 0 and 180 degrees and their faces belonging to the same crystal form {hk], i.e., those related by symmetry operators, were allowed to growth at the same constant linear rate. An ad-hoc algo- rithm calculates the intersection points between the growing crystals and the growth of those arriving later is cancelled. The output information is stored in such a way that the pro- gram permits discrimination of the regions belonging to dif- ferent crystals, to calculate the number of surviving crystals n(h) as a function of the distance h to the substrate as well as the outer surface area of the different {hk} faces of the crystals. A typical result is shown in Fig. 4. Note that the faces belonging to a given crystal have been drawn with the same value of the grey scale and the columnar structure char- acterising competitive crystal growth is clearly observed. The intercrystalline boundaries are visible and the idea of com- petition for space immediately appears. For any time, the distribution of the crystal orientation at the growth front can be obtained by measuring the surface area of the outer crystal faces. Fig. 5 shows the development in time (or distance to the substrate) of the surface area S(CD) of the {kh} faces of the outer crystals with different inclination co with respect to the substrate. From the initial random distribution of the ori- entation of the crystals with S = S0 a preferred orientation around wpref=45° (for the case of the {10} faces) appears. For any stage of the growth history, the values of S( co) fit a Gaussian distribution around this angle &>pref:
5(<U) =5pref *exp[ - X(0>- «pref)2] (3)
The parameter x is a measurement of the degree of texturation obtained by competition for space between growing crystals, in such a way that higher the value x higher the degree of
(A (A 0) c Ü Z ö
X-rays
Polished from the outer face
X-ray penetration length X-rays
«Mb**
Polished from the T inner face
Fig. 3. The two different regions of the eggshell from which measured rvalues are obtained when polishing from the inner and the outer surface of the eggshell. Note that for both cases the corresponding eggshell thickness is the same.
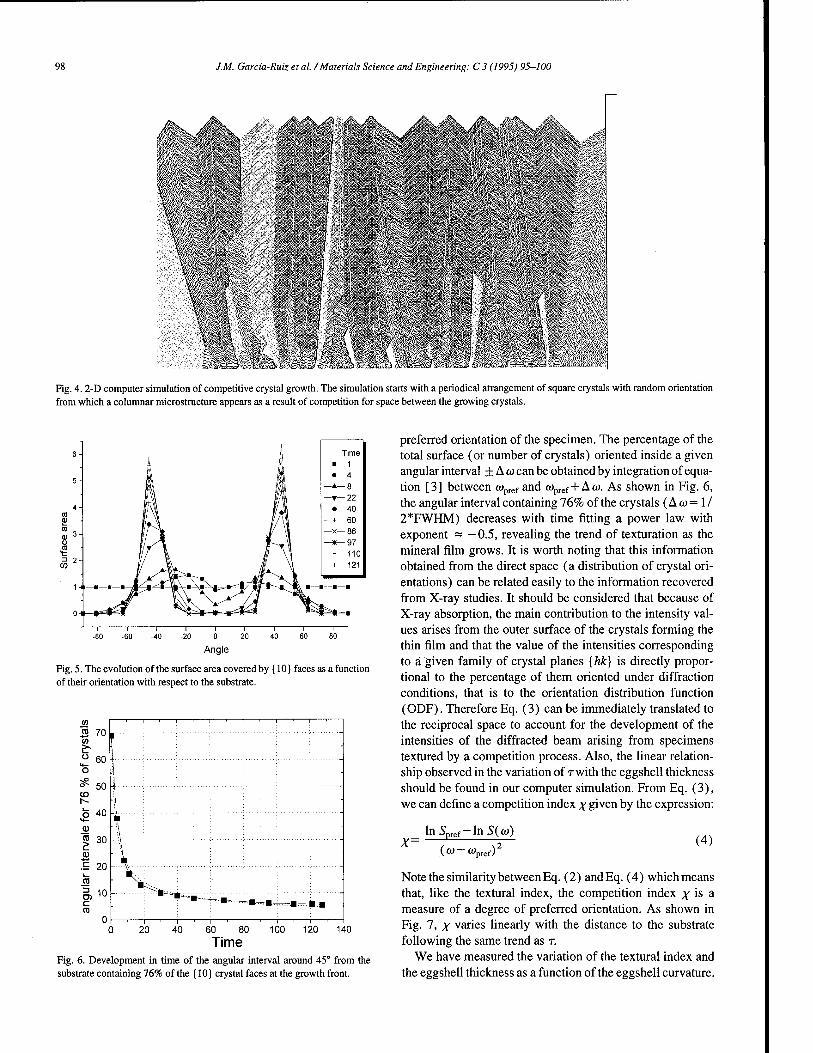
98 J.M. Garcia-Ruiz et al. /Materials Science and Engineering: C 3 (1995) 95-100
SU
? / 1 ■:' ■/ \ /; ■/
lljlj
'' / ■
[:■:'■/
/.'
i ^;
\
Fig. 4.2-D computer simulation of competitive crystal growth. The simulation starts with a periodical arrangement of square crystals with random orientation from which a columnar microstructure appears as a result of competition for space between the growing crystals.
t => 2 W
Time
—•- -4 —A- -8 —T- -22
-40 —+- -60 —X- -86 —*- -97 -110 — t- -121
Angle
Fig. 5. The evolution of the surface area covered by {10} faces as a function of their orientation with respect to the substrate.
40 30 80
Time 100 120 140
preferred orientation of the specimen. The percentage of the total surface (or number of crystals) oriented inside a given angular interval +Aw can be obtained by integration of equa- tion [3] between wpref and ft>pref+A<t>. As shown in Fig. 6, the angular interval containing 76% of the crystals (A w = 1 / 2*FWHM) decreases with time fitting a power law with exponent ~ — 0.5, revealing the trend of texturation as the mineral film grows. It is worth noting that this information obtained from the direct space (a distribution of crystal ori- entations) can be related easily to the information recovered from X-ray studies. It should be considered that because of X-ray absorption, the main contribution to the intensity val- ues arises from the outer surface of the crystals forming the thin film and that the value of the intensities corresponding to a given family of crystal planes [hk] is directly propor- tional to the percentage of them oriented under diffraction conditions, that is to the orientation distribution function (ODF). Therefore Eq. (3) can be immediately translated to the reciprocal space to account for the development of the intensities of the diffracted beam arising from specimens textured by a competition process. Also, the linear relation- ship observed in the variation of Twith the eggshell thickness should be found in our computer simulation. From Eq. (3), we can define a competition index x given by the expression:
_ lnSpref-lnS(<o)
(co-<opref) (4)
Fig. 6. Development in time of the angular interval around 45° from the substrate containing 76% of the {10} crystal faces at the growth front.
Note the similarity between Eq. (2) andEq. (4) whichmeans that, like the textural index, the competition index x IS a
measure of a degree of preferred orientation. As shown in Fig. 7, x varies linearly with the distance to the substrate following the same trend as T.
We have measured the variation of the textural index and the eggshell thickness as a function of the eggshell curvature.

J.M. Garcia-Ruiz etal. /Materials Science and Engineering: C 3 (1995) 95-100 99
CO
25-
20- O
X ^ 15 x <s> -a c 'Z 10
E o o
20 -1—
60 80 120 140
Time
Fig. 7. The variation of the competition index # with time or distance to the substrate. The time step corresponds to 0.3-times the distance between seeds. The slope of the linear regression is 0.18 with a correlation coefficient of 0.99.
To quantify the eggshell curvature the eggshell was cut into two halves from the north to the south pole. The cross-section was then scanned, the contour line cleaned by a sharpening process and then converted to a set of equidistant x-y points. From any set of three consecutive points we calculated the radius R of the circumference fitting them. The curvature at the middle point is then defined by 1IR (mm "1). The results are shown in Fig. 8 for the case of ostrich and flamingo. Note that for the almost spherical geometry of the ostrich eggshell a correlation between these three parameters exists. However, for the case of the anisotropic (oval) flamingo eggshell, the curvature correlates exclusively with the textural index. This correlation can be explained in the framework of the com- petitive growth model. The equatorial zone is the one of lower shell curvature, in comparison to that at the blunt as well as the sharp pole. It is clear that a higher curvature introduces a small reduction of the intermammillary core distance but also
obviously a noticeable increment of available growth space. Therefore, at these eggshell locations of higher curvature, competition for space is reduced and the number of surviving crystals in these locations will be higher, explaining their higher measured rvalues. The results are in agreement with those found by Sharp and Silyn-Roberts, for the case of domestic fowl, who reported that the I/I0 values at the blunt and sharp poles were respectively 0.52- and 0.38-times the equatorial.
Our results demonstrate that the mineral architecture of the eggshell is basically the result of a competition between cal- cite crystals arising from the mamillary core and that the main features of this structure can be obtained by X-ray diffraction and compared with micromorphological observations made in the direct space. The explanation of the mineral structure of the eggshell as the result of competitive growth processes permits a simple parametrization of great potential value for taxonomic purposes. In particular, we can define the rate of development of preferred texture by the ratio rlh. This ratio, either being constant across the whole shell thickness or not, along with other simple parameters such as the average dis- tance between mamillary cores could be enough to differen- tiate types of avian eggshell. The next step of this investigation currently under way is to relate the ratio r/h to mechanical properties of the eggshell.
4. Conclusions
It is demonstrated that the mineral structure of eggshells can be properly described in terms of competitive crystal growth. We show that the variation of the X-ray normalised intensities belonging to different families of diffracting planes with interplanar angle values fits a Gaussian distribu- tion that permits the definition of a textural index raccounting for the degree of preferred orientation of the mineral phase
-□- Textural Index —O- -Thickness —A- - curvature
-Shape
Fig. 8. Correlation between the textural index (measured at the outer surface) and eggshell curvature, shape and thickness.

100 J.M. Garcia-Ruiz etal. /Materials Science and Engineering: C 3 (1995) 95-100
across the eggshell. Using a computer simulation of the prob- lem we demonstrate that the origin of this linear relationship and therefore of the textural properties of the eggshell is the competition for space between the crystallographic units growing outward from the mamillary knobs. Therefore, any deviation from this geometrical law has to be explained in terms of a chemical process which, in the case of the eggshell mineralisation, is mainly due to the specific interactions of the protein matrix with the calcium carbonate growth units. The result of this study can be also applied to other biomineral architectures for which the existence of competitive crystal growth has been also suggested [ 14].
Acknowledgements
This work was performed with financial support from CICYT Project PB92-1137.
References
[1] D.J. Fink, A.I. Caplan and A.H. Heuer, MRS Bulletin, 27 (1992) 27. [2] C. Tyler, 1964. Wilhelm von Nathusius. On Avian Eggshells. A
translated and edited version of his work, University of Reading, UK, 1964.
[3] L.J. Blus, Nature, 235 (1972) 376. [4] S. Amada. MRS Bull., 20 (1995) 35. [5] P. Calvert, MRS Bull., 27(1992) 37. [6] R.M. Solomon, Eggshell and Eggshell Quality, Wolfe Ltd., London,
1992. [7] HJ. Bunge, M. Dahms and H.G. Brokmeier, Cryst. Rev., 2 (1989) 67. [8] H.M. Rietveld,/ Appl. Crystallogr., 2 (1969) 65. [9] M. Fritz, A.M. Belcher, M. Radmacher, D.A. Walters, P.K. Hansma,
G.D. Stucky, D.E. Morse and S . Mann, Nature, 371 (1994) 49. [ 10] H. Sylin-Roberts and R.M. Sharp, / Zool., Lond., 205 (1985) 39. [11] V. Valdova, Powder Diffraction, 1 (1986) 28. [12] G.C. Lemmlem, Dokl. Akad. Nauk. SSSR, 48(1945) 177. [13] J.M. Garcia-Ruiz and A. Rodriguez-Navarro, in Evolution of Thin
Films and Surface Structure and Morpholgy. Proc, Mater. Res. Soc, 555(1995) 107.
[14] T. Ubukata, Palaeontology, 37 (1994) 241.
Skr MATERIALS SCIENCE &
ENGINEERING
ELSEVIER Materials Science and Engineering: C 3 (1995) 101-107
A self-assembled collagen scaffold suitable for use in soft and hard tissue replacement
George D. Pins, Frederick H. Silver * Division of Biomaterials, Department of Pathology, University of Medicine and Dentistry of New Jersey, Robert Wood Johnson Medical School,
675 Hoes Lane, Piscataway, NJ 08854-5635, USA
Abstract
Over a period of several million years, natural selection and evolution have optimized the morphological and mechanical properties of biological tissues. The biomaterials scientist can make use of these 'natural' design processes by mimicking the extracellular matrix, the primary natural scaffolding material. Previous studies have documented the propensity of acid soluble type I collagen to self-assemble in vitro and form microscopic collagen fibrils with D periodic banding analogous to native fibrils. Recently, our laboratory extended the in vitro fibrillogenesis process to self-assemble macroscopic fibers from solutions of acid extracted type I collagen. These fibers may serve as scaffolding material for a variety of soft and hard tissue replacements.
Results of mechanical analyses demonstrated that the self-assembled collagen fibers, 60-120 fim in diameter, have dry tensile properties comparable with native, aligned fibrous tissue and wet tensile properties which are superior to similarly produced collagen fibers from insoluble type I collagen.
Results of the birefringence analysis conducted in this study suggest that this technique is useful for correlating the degree of fibrillar alignment and packing with the mechanical properties of fibrous collagen scaffolds. Preliminary ultrastructural findings show that self- assembled collagen fibers contain aligned collagen fibrils with diameter distributions similar to native collagen fibers. Additionally, the uniaxial alignment of fibrils in collagen fibers self-assembled from soluble collagen was greater than similar fibrils observed in collagen fibers produced from disrupted, insoluble corium.
Keywords: Collagen fibers; Self-assembly; Mechanical properties; Birefringence; Electron microscopy
1. Introduction
It has been known since the 1950s that collagen molecules self-assemble in a physiological salt buffer to form micro- scopic fibrils, fibril bundles and fibers that exhibit D periodic banding patterns characteristic of those seen in connective tissue when viewed with an electron microscope [ 1,2]. Later studies showed that aspects of this process supported both nucleation and growth mechanisms as well as multi-step assembly [3-7]. In the late 1970s and early 1980s these findings were first utilized to produce collagenous scaffolds which mimicked the structure of connective tissue constructs [8,9]. These tissue analogs were subsequently used to study wound-healing phenomena and to treat patients with burns or chronic ulcers (see Silver and Pins for a review [ 10]).
Recently, mature, corium-derived, insoluble type I colla- gen was used to produce reconstituted collagen fibers. These fibers have been used to investigate the de novo mineraliza-
* Corresponding author.
0928-4931/95/$09.50 © 1995 Elsevier Science S.A. All rights reserved SAD/0928-493 1(95)00109-3
tion of collagen for hard tissue repair [11,12] and they have been implemented into fibrous biocomposites as scaffolds for the repair of soft tissue injuries [ 13-15]. Results of implan- tation studies in a variety of animal models demonstrated that the repair rate of tissue replacements composed of fibrous, collagen scaffolds was maximized when the scaffold degra- dation rate paralleled the rate of wound healing in a particular anatomical site [15]. Additional findings suggested that these fibrous scaffolds should possess greater mechanical stability to maintain a smooth transfer of load from the implant to the host tissue and to promote rapid organization and remodeling of the newly formed tissue [16]. Finally, it was suggested that the next generation of collagen fiber scaffold should have a hierarchical substructure which mimics native connective tissue to further enhance tissue remodeling and strength regeneration [ 16].
The results of in vitro collagen fibrillogenesis studies con- ducted in the 1950s have led to the hypothesis that soluble type I collagen may be self-assembled into fibrous collagen scaffolds for soft tissue repair with mechanical properties and

102 CD. Pins, F.H. Silver /Materials Science and Engineering: C 3 (1995) 101-107
fibrillar substructure comparable with native connective tis- sue. The purpose of this paper is to report the results of a study designed to compare the tensile properties and fibrillar substructures of collagen scaffolds self-assembled from a solution of acid extracted type I collagen and those prepared from disrupted insoluble corium fibers.
2. Materials and methods
2.1. Preparation of soluble collagen (SOL)
Rat tail tendon collagen was extracted from rat tail tendons as described previously [ 17]. The tails of Sprague-Dawley rats were removed by clamping a hemostat on the thin, free end and then applying a tensile force along the tendon axis. Tendon fibers were then immersed in a 0.01 M HC1 solution (~ 10 tendons per 100 ml) for 24 h at 4 °C. The soluble material was separated from the tendons by centrifugation three times for 30 min at 30 000 g then sequentially filtered through 0.65 and 0.45 /xm filters (Millipore Corp., Marlbor- ough, MA).
Soluble collagen in 0.01 M HC1 was concentrated by pour- ing approximately 300 ml into a dialysis bag (MW cut-off of 12,000-14,000) and then placing the dialysis bag in contact with about 50 g of poly(ethylene glycol) (molecular weight 15,000-20,000, Sigma, Inc., St. Louis, MO). The collagen solution was subsequently diluted to a concentration of 10 mg ml ~' using 0.01 M HC1 and a Gilford Spectrophotometer Model 250 (A = 230 nm) to monitor the concentration of the solution. Collagen solutions, 1% (w/v), were stored in dis- posable 30 cm3 syringes at 4 °C.
2.2. Preparation of insoluble collagen (INS)
Insoluble type I collagen obtained from bovine corium was obtained from Devro Inc. (Somerville, N.J.) and Kensey Nash Corp. (Exton, PA). The corium was limed, fragmented, swollen in acid, precipitated, washed with distilled water and isopropanol, lyophilized and stored at - 30 °C as described previously [18,19]. Collagen-derived peptides were char- acterized by SDS-PAGE and amino acid analysis as typical of type I collagen without non-collagenous protein contami- nation [20].
A dispersion of insoluble type I collagen was prepared by adding 1.2 g of collagen to 120 ml of 0.01 M HC1 solution, as described previously [21]. Insoluble collagen was dis- persed in a blender and mixed at a speed of 10,000 rev min~' for 4 min. The resulting dispersion was placed under a vac- uum of 50-100 mTorr at room temperature to remove any trapped air bubbles. The dispersion was then stored in dis- posable 30 cm3 syringes at 4 °C.
2.3. Collagen fiber production
Collagen fibers were produced by extruding the collagen dispersion through polyethylene tubing with an inner diam- eter of 0.86 mm into a 37 °C bath of aqueous fiber formation
buffer composed of 135 mM NaCl, 30 mM TES (N- tris(hydroxylmethyl)methyl-2-aminoethanesulphonicacid) and 30 mM sodium phosphate dibasic. The final bath was adjusted to pH 7.5 by adding 5.0 N NaOH drop-wise. Fibers were allowed to remain in the buffer for 60 min, and then placed in isopropyl alcohol for at least 8 h. Finally, the fibers were immersed in distilled water for 60 min then air dried under tension [21].
Collagen fibers were cross-linked using an optimized severe dehydration treatment [22]. Briefly, collagen fibers were placed in an oven at a vacuum of 50-100 mTorr for five days at 110 °C. Cross-linked fibers were placed on a shelf in a sealed desiccator and stored at room temperature.
2.4. Rat tail tendon fibers (RTT)
Collagen fibers 3-4 cm in length were isolated from the tails of Sprague-Dawley rats by dissection under a micro- scope. Tendons were removed by placing a wire stripper on the free end of the tail (end opposite to the dissected stump) and pulling the the tendon free from the rest of the tail. Each tendon bundle was split in half along its axis repeatedly until the fiber diameter was about 50 /j,m. RTT fibers were air dried overnight by hanging the free ends over glass coverslips.
2.5. Mechanical testing
Stress-strain curves for the collagen and RTT fibers were determined in tension using an Instron Tester Model 1122. Fibers were tested dry or in phosphate-buffered saline (PBS) using a gauge length of 2.0 cm and a strain rate of 50% min"'. Load extension curves obtained from the chart recorder were used to calculate stress-strain behavior, ultimate tensile strength (UTS), and tensile moduli. In making area calcu- lations, it was assumed that the fibers were circular. The cross- sectional area was then determined by measuring the diameter of the fiber at three places using a Leitz 12 Pol microscope fitted with a calibrated eye piece. It was also assumed that the moduli were equivalent to the tangent of the stress-strain curves in the linear regions.
Using an epoxy adhesive, 48 air dried fibers from each group were mounted on paper frames by gluing the ends of the fibers to vertical lines drawn on the frames. The mounted fibers were then divided into two groups and either tested dry (24 fibers) or after being rehydrated in PBS for at least 30 min (24 fibers) using a protocol described previously [21 ]. Fibers that fail at the glue joints were excluded from the experiment. Statistical evaluations of the mechanical data were conducted using ANOVA (p<0.05) and Extended Tukey Tests (p< 0.05).
2.6. Birefringence measurements
Semi-thin (6 /xm), longitudinal sections of collagen fibers were examined with polarizing optics and monochromatic light to determine birefringence retardation. Prior to analysis, bundles of 10 fibers, 0.5 cm in length, were tied together with 6-0 prolene suture (Ethicon, Inc., Somerville, NJ) and rehy- drated in PBS for 90 min. The fiber bundles were subse-
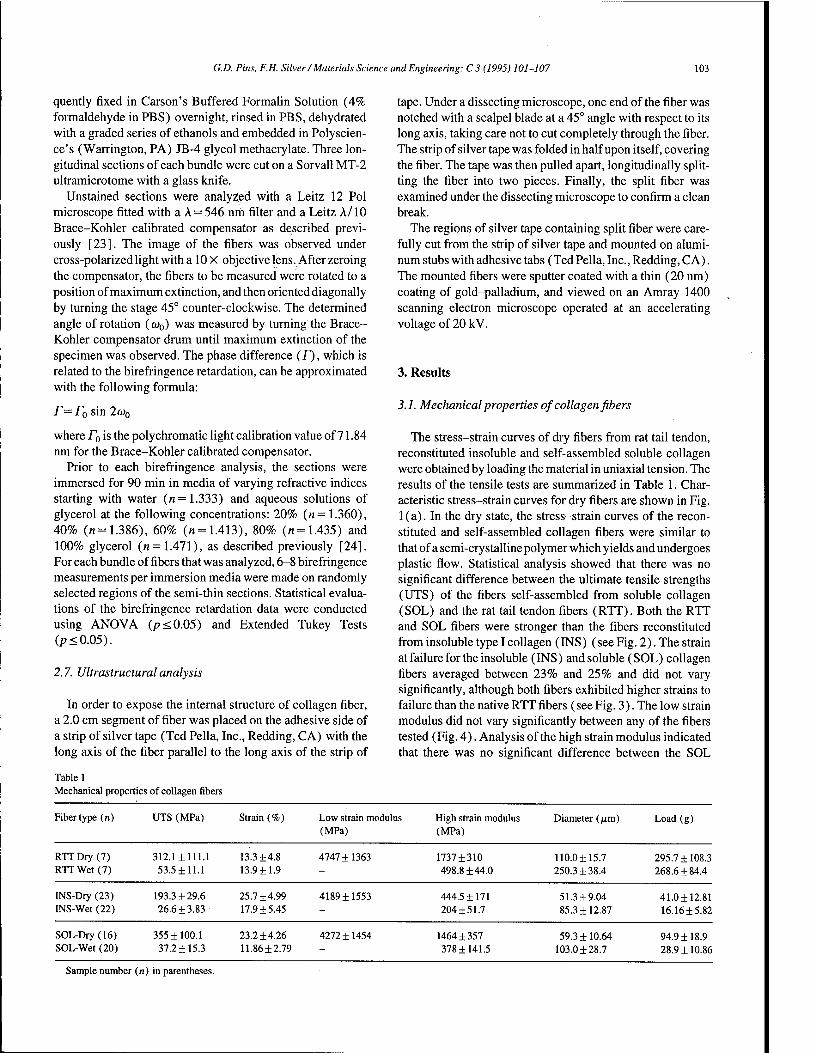
G.D. Pins, F.H. Silver /Materials Science and Engineering: C3 (1995) 101-107 103
quently fixed in Carson's Buffered Formalin Solution (4% formaldehyde in PBS) overnight, rinsed in PBS, dehydrated with a graded series of ethanols and embedded in Polyscien- ce's (Warrington, PA) JB-4 glycol methacrylate. Three lon- gitudinal sections of each bundle were cut on a Sorvall MT-2 ultramicrotome with a glass knife.
Unstained sections were analyzed with a Leitz 12 Pol microscope fitted with a A = 546 nrri filter and a Leitz A/10 Brace-Kohler calibrated compensator as described previ- ously [23]. The image of the fibers was observed under cross-polarized light with a 10 X objective lens. After zeroing the compensator, the fibers to be measured were rotated to a position of maximum extinction, and then oriented diagonally by turning the stage 45° counter-clockwise. The determined angle of rotation (w0) was measured by turning the Brace- Kohler compensator drum until maximum extinction of the specimen was observed. The phase difference (JT), which is related to the birefringence retardation, can be approximated with the following formula:
r= ro sin 2<w0
where T0 is the polychromatic light calibration value of 71.84 nm for the Brace-Kohler calibrated compensator.
Prior to each birefringence analysis, the sections were immersed for 90 min in media of varying refractive indices starting with water (n= 1.333) and aqueous solutions of glycerol at the following concentrations: 20% (n= 1.360), 40% («=1.386), 60% (n = 1.413), 80% (n= 1.435) and 100% glycerol (n= 1.471), as described previously [24]. For each bundle of fibers that was analyzed, 6-8 birefringence measurements per immersion media were made on randomly selected regions of the semi-thin sections. Statistical evalua- tions of the birefringence retardation data were conducted using ANOVA (p<0.05) and Extended Tukey Tests (p<0.05).
2.7. Ultrastructuralanalysis
In order to expose the internal structure of collagen fiber, a 2.0 cm segment of fiber was placed on the adhesive side of a strip of silver tape (Ted Pella, Inc., Redding, CA) with the long axis of the fiber parallel to the long axis of the strip of
Table 1 Mechanical properties of collagen fibers
tape. Under a dissecting microscope, one end of the fiber was notched with a scalpel blade at a 45° angle with respect to its long axis, taking care not to cut completely through the fiber. The strip of silver tape was folded in half upon itself, covering the fiber. The tape was then pulled apart, longitudinally split- ting the fiber into two pieces. Finally, the split fiber was examined under the dissecting microscope to confirm a clean break.
The regions of silver tape containing split fiber were care- fully cut from the strip of silver tape and mounted on alumi- num stubs with adhesive tabs (Ted Pella, Inc., Redding, CA). The mounted fibers were sputter coated with a thin (20 nm) coating of gold-palladium, and viewed on an Amray 1400 scanning electron microscope operated at an accelerating voltage of 20 kV.
3. Results
3.1. Mechanical properties of collagen fibers
The stress-strain curves of dry fibers from rat tail tendon, reconstituted insoluble and self-assembled soluble collagen were obtained by loading the material in uniaxial tension. The results of the tensile tests are summarized in Table 1. Char- acteristic stress-strain curves for dry fibers are shown in Fig. 1(a). In the dry state, the stress-strain curves of the recon- stituted and self-assembled collagen fibers were similar to that of a semi-crystalline polymer which yields and undergoes plastic flow. Statistical analysis showed that there was no significant difference between the ultimate tensile strengths (UTS) of the fibers self-assembled from soluble collagen (SOL) and the rat tail tendon fibers (RTT). Both the RTT and SOL fibers were stronger than the fibers reconstituted from insoluble type I collagen (INS) (see Fig. 2). The strain at failure for the insoluble (INS) and soluble (SOL) collagen fibers averaged between 23% and 25% and did not vary significantly, although both fibers exhibited higher strains to failure than the native RTT fibers (see Fig. 3). The low strain modulus did not vary significantly between any of the fibers tested (Fig. 4). Analysis of the high strain modulus indicated that there was no significant difference between the SOL
Fiber type (n) UTS (MPa) Strain (%) Low strain modulus (MPa)
High strain modulus (MPa)
Diameter (/xm) Load (g)
RTT Dry (7) RTT Wet (7)
312.1 ±111.1 53.5±11.1
13.3±4.8 13.9 ±1.9
4747 ±1363 1737±310 498.8 ±44.0
110.0±15.7 250.3 ±38.4
295.7 ±108.3 268.6 ±84.4
INS-Dry (23) INS-Wet (22)
193.3 ±29.6 26.6 ±3.83
25.7 ±4.99 17.9 ±5.45
4189 ±1553 444.5 ±171 204±51.7
51.3 ±9.04 85.3 ±12.87
41.0±12.81 16.16±5.82
SOL-Dry(16) SOL-Wet (20)
355 ±100.1 37.2 ±15.3
23.2 ±4.26 11.86 ±2.79
4272 ±1454 1464 ±357 378±141.5
59.3 ±10.64 103.0 ±28.7
94.9 ±18.9 28.9 ±10.86
Sample number (n) in parentheses.

104 G.D. Pins, F.H. Silver /Materials Science and Engineering: C 3 (1995) 101-107
RTT ^-^~\J*^'
,-. 50 R
n 40 — / SOL
c t 30
~~ / /^ 0J / S 20 H — / / /-*■ INS
- / / .1 io B
J^ \ « . 1 5.0
(b) 10.0 15.0
Percent Strain ( % )
20.0
Fig. 1. Tensile stress versus percent strain for native rat tail tendon (RTT) fiber, reconstituted insoluble (INS) fiber and self-assembled soluble (SOL) fiber tested (a) in a dry state or (b) after rehydration in PBS for 30 min.
Fig. 2. Ultimate tensile strength of dry and wet native (RTT) fiber, insoluble (INS) fiber and soluble (SOL) fiber pulled to failure in uxiaxial tension.
fibers and native RTT collagen fibers, but both types of fiber had significantly greater moduli than the reconstituted INS fibers (see Fig. 4).
Typical stress-strain curves for wet, cross-linked fibers were observed to be similar to those of native RTT tissue (see Fig. 1 (b)). In general, the stress-strain curves exhibited non-linear toe regions followed by regions where the stress increased linearly with the strain. Statistical analysis showed that the ultimate tensile strength of the self-assembled SOL
■ % Strain Dry ■ % Strain Wet
RTT INS SOL Fiber Type
Fig. 3. Percent strain at failure of different dry and wet native (RTT) fiber, insoluble (INS) fiber and soluble (SOL) fiber pulled to failure in uxiaxial tension.
Low Strain Modulus
High Strain Modulus 6000" I
•5 5000"
H !■■ M l- m
RTT INS SOL Fiber Type
Fig. 4. Low and high strain modulus values of dry native (RTT) fiber, insoluble (INS) fiber and soluble (SOL) fiber pulled to failure in uxiaxial tension.
fibers was significantly greater than the fibers reconstituted from insoluble collagen (INS), but the native RTT fibers were stronger than both the SOL and INS collagen fibers (see Fig. 2). The strain at failure for the native RTT fibers, when compared with the reconstituted INS and self-assembled SOL fibers, ranged from 11% to 14% and showed no statistical variation, although the INS fibers were more extensible than the SOL fibers (Fig. 3). The tensile modulus of the wet collagen fibers was measured as the slope of the linear region of the stress-strain curve. The tensile modulus of the self- assembled SOL fibers was significantly greater than the ten- sile modulus of the reconstituted INS fibers, but the tensile modulus of the native RTT fibers was significantly higher than either the SOL or INS fibers (Fig. 5).
3.2. Birefringence retardation of collagen fibers
The results of the optical retardation measurements made on 6 /xm sections of collagen fiber immersed in media of varying refractive indices are summarized in Table 2 and shown graphically in Fig. 6. Statistical analysis indicated that at refractive indices of 1.333, 1.360, 1.386 and 1.413, the optical retardation values for RTT fibers were significantly

G.D. Pins, F.H. Silver /Materials Science and Engineering: C 3 (1995) 101-107 105
Table 2 Birefringence retardation (nm) of fibers in a series of immersing media
Immersing media
Water 20% glycerol 40% glycerol 60% glycerol 80% glycerol 100% glycerol
Refractive index
1.333 1.360 1.386 1.413 1.435 1.461
Sample number («) in parentheses.
Optical retardation (nm)
RTT fibers
29.8 ±1.853 (6) 22.3 ±1.460 (6) 18.38±1.15 (6) 13.42 + 0.288(6) 10.90 ±1.28 (6) 6.76±1.118(6)
SOL fibers
19.10±4.55 (8) 14.62±2.92(8) 11.97±2.80(8) 9.97±1.61 (8) 8.32±1.74(8) 7.01 ±0.692 (7)
INS fibers
9.70±2.68 (6) 8.87±2.12(8) 7.05± 1.11 (6) 6.14 ±0.565 (6) 5.22 ±0.872 (6) 4.47 ±0.732 (6)
3 400
Fig. 5. Tensile modulus values of wet native (RTT) fiber, insoluble (INS) fiber and soluble (SOL) fiber pulled to failure in uxiaxial tension.
1.30 1.32 1.34 1.36 1.38 1.40 1.42 1.44 1.46 1.48 1.50
Refractive Index
Fig. 6. Optical retardation values (nm) of semi-thin (6 ßm) sections of wet native (RTT) fiber, insoluble (INS) fiber and soluble (SOL) fiberimmersed in aqueous glycerol solutions with varied refractive indices. Standard devi- ation values for each point were omitted from this figure for clarity but are tabulated in Table 2.
greater than those of SOL or INS fibers, and the SOL fibers have optical retardation values which exceed those for the INS fibers. When immersed in 80% or 100% glycerol (n= 1.435 or 1.461, respectively), there was no statistical difference between the optical retardation values of the RTT or SOL collagen fibers, but both of these fibers demonstrated
birefringence retardation values that were significantly greater that those of the INS fibers.
3.3. Ultrastmctural analysis of collagen fibers
Figs. 7(a) and 7(b) show low and high magnification views, respectively, of RTT fiber which has been split lon- gitudinally. The high magnification micrograph (Fig. 7(b)) shows clean structural detail within the fiber. Well-defined
Fig. 7. (a) Low and (b) high magnification scanning electron micrographs of longitudinally split native rat tail tendon fiber. In (b), well oriented, uniaxially aligned collagen fibrils (CF) can be resolved.

106 G.D. Pins, F.H. Silver /Materials Science and Engineering: C 3 (1995) 101-107
INS Fiber SOL Fiber
Fig. 8. (a) Low and (b) high magnification scanning electron micrographs of longitudinally split reconstituted insoluble (INS) fiber. In (b), collagen fibrils (CF) and fibril segments can be resolved.
collagen fibrils (CF) with diameters ranging from 55 nm to 211 nm may be seen oriented parallel to the long axis of the rat tail tendon fiber. Figs. 8(a) and 8(b) illustrate views of an insoluble collagen fiber which has been fractured longi- tudinally. The high magnification micrograph (Fig. 8(b)) shows collagen fibrils (CF) and segments of collagen fibrils 95-228 nm in diameter oriented both parallel and obliquely to the long axis of the INS fiber. Low and high magnification electron micrographs of a split SOL collagen fiber can be seen in Figs. 9(a) and 9(b). From the high magnification micrograph (Fig. 9(b)) collagen fibrils (CF) with diameters of 57-219 nm are observed oriented with the long axis of the soluble collagen fiber.
4. Discussion
The aim of this study was to evaluate the mechanical prop- erties and fibrillar substructure of a fibrous scaffold self- assembled from acid soluble collagen (SOL) by comparing it with native rat tail tendon fibers (RTT) and fibers recon- stituted from insoluble type I collagen (INS). Uniaxial tensile tests conducted on dry fibers produced stress-strain curves
Fig. 9. (a) Low and (b) high magnification scanning electron micrographs of longitudinally split self-assembled soluble (SOL) fiber. In (b), uniaxially aligned collagen fibrils (CF) can be resolved.
similar to those observed for semi-crystalline polymers. Quantitative analyses of these tests showed that self-assem- bled (SOL) fibers had ultimate tensile strengths and moduli comparable with native RTT fibers and significantly higher than reconstituted INS fibers. Mechanical analyses of rehy- drated fibers resulted in stress-strain curves which exhibited non-linear toe regions followed by regions where stress increased linearly with the strain rate. The low modulus of the non-linear toe region is believed to reflect the uncrimping of the collagen fibrils in the fiber [25]. The linear region of the curve, where the tensile modulus of the fibers was meas- ured, represents the state where the collagen fibrils in the fiber have straightened and are in tension [23]. Statistically, the ultimate tensile strengths and tangent modulus values of self- assembled SOL fibers were significantly greater than those of the reconstituted INS fibers, although rehydrated RTT fibers had mechanical properties which were significantly higher than either SOL or INS fibers.
In order to assess the effects of molecular orientation and fibril alignment and packing density on the variation in mechanical properties between native RTT, self-assembled SOL and reconstituted INS fibers, birefringence retardation measurements were made on semi-thin (6 /xm) sections of collagen fibers. Previously, McBride et al. [23] observed
G.D. Pins, F.H. Silver /Materials Science and Engineering: C3 (1995) 101-107 107
increases in form birefringence which corresponded to increases in fibril diameter and packing density during chick tendon development. Vilarta and Vidal [24] showed that form birefringence values increased with the tensile strength of the Achilles tendon fibers, suggesting stronger collagen fibers possess improved fibril alignment and aggregation. Additionally, Vidal and Carvalho [26] used intrinsic bire- fringence measurements to positively correlate the effect of tissue aging with changes in molecular orientation, crystal- linity and lateral aggregation within fibrils. When semi-thin sections of collagen fibers used in this study were observed with a polarizing microscope they failed to exhibit the peri- odicity characteristic of crimped tendon fiber, probably because of inadvertent stretching during sample preparation. Consequently, the effects of crimp on birefringence measure- ments in this study are considered negligible. The results of the form birefringence measurements made in pure water and in aqueous glycerol solutions indicate that fibril packing den- sity and alignment in SOL fibers are significantly greater than in INS fibers, although inferior to those in native RTT fibers. These results are consistent with ultimate tensile strength values of wet fibers measured in this study and parallel the findings of Vilarta and Vidal [24] and Vidal and Carvalho [26] which suggest that the improved tensile strength of the collagen fiber may be a result of increased fibrillar alignment and packing density leading to increased' 'strong interactions within or between collagen fibrils" [26]. Therefore, the results of the birefringence analysis conducted in this study suggest that this technique is useful for correlating the degree of fibrillar alignment and packing with the mechanical prop- erties of fibrous collagen scaffolds. Intrinsic birefringence retardation measurements made in pure glycerol solution sug- gest that the crystallinity and lateral aggregation of collagen molecules in native RTT and self-assembled SOL fibers are comparable and that both fibers exhibit greater molecular orientation than reconstituted INS fibers. These results cor- relate with the ultimate tensile strengths of the dry fiber tested in this study and support an earlier hypothesis that the degree of crystallinity is higher for fiber that exhibits greater mechan- ical strength [21].
Scanning electron microscopic analyses of longitudinally split collagen fiber provided preliminary quantitative data about fibrillar substructure and qualitative support for form birefringence data. Electron micrographs of longitudinally split native tendon fiber reveal highly oriented, uniaxially aligned collagen fibrils with a distribution of fibril diameters ranging from approximately 50 nm to 210 nm. These results are consistent with previous evaluations of tendon ultrastruc- ture [27] and measurements of fibril diameter distribution [28]. Electron micrographic studies of longitudinally split INS and SOL fibers suggest that both of these scaffolds con- tained collagen fibrils with diameter distributions similar to native collagen fibers, but the fibrils in the SOL fibers exhib- ited greater uniaxial alignment than similar fibrils in the INS fibers. These microscopic evaluations of fibrillar orientation
add qualitative morphological evidence to the differences seen in the birefringence retardation study, but transmission electron micrographic studies and small angle electron dif- fraction analyses are presently being conducted to further substantiate ultrastructural differences between types of col- lagen fiber.
In conclusion, this study has shown that collagen fibers self-assembled from solutions of collagen molecules have mechanical properties that are superior to similar fibers recon- stituted from insoluble, type I collagen. Additionally, prelim- inary characterization of fiber ultrastructure suggests that self-assembled collagen fibers are composed of uniaxially aligned collagen fibrils. The ability to self-assemble collagen fibers with a fibrillar substructure makes possible the con- struction of a variety of unmineralized and mineralized biom- imetic materials for the replacement of tissues.
References
[ 1 ] J. Gross, J.H. Highberger and F.O. Schmitt, Proc. Soc. Exp. Biol. Med., 80(1952)462.
[2] D.S. Jackson and J.H. Fessler, Nature, 176 (1955) 69. [3] J.M. Cassell, L. Mandelhern and D.E. Roberts, /. Amer. Leather Chem.
Assoc, 57(1962)556. [4] R.L. Trelstad, K. Hayashi and J. Gross, Proc. Nat. Acad. Sei. USA, 73
(1976)4027. [5] F.H. Silver, K.H. Langley and R.L. Trelstad, Biopolymers, 18 (1979)
2523. [6] R.A. Gelman, D.C. Poppke and K.A. Piez, / Biol. Chem., 254 (1979)
11741. [7] S. Färber, A.K. Garg, D.E. Birk and F.H. Silver, Int. J. Biol. Macromol,
8 (1986) 37. [8] E. Bell, B. Ivarsson and C. Merrill, Proc. Nat. Acad. Sei. USA, 76
(1979) 1274. [9] I.V. Yannas, J.F. Burke, D.P. Orgill and E.M. Skrabut, Science, 215
(1982) 174. [ 10] F.H. Silver and G. Pins, J Long-Term Eff. Med. Imp., 2 (1992) 67. [11] D.L. Christiansen and F.H. Silver, Cells Mater., 3 (1993) 177. [12] D.L. Christiansen and F.H. Silver, Biomimetics, 1 (1992) 265. [13] J.D. Goldstein, A.J. Tria, J.P. Zawadsky, Y.P. Kato, D. Christiansen
and F.H. Silver,/ Bone and Joint Surg., 71A (1989) 1183. [14] Y.P. Kato, Ph.D. Thesis, Rutgers University and University of
Medicine and Dentistry of New Jersey, 1991. [15] D.L. Christiansen, G. Pins, M.-C. Wang, M.G. Dunn and F.H. Silver,
Mater. Res. Soc. Symp. Proc, 252 (1992) 151. [16] Y.P. Kato, M.G. Dunn, J.P. Zawadsky, A.J. Tria and F.H. Silver, J.
Bone and Joint Surg., 73A (1991) 561. [17] F.H. Silver and R.L. Trelstad, J. Biol. Chem., 255 (1980) 9427. [18] A. Chernomorsky, MS Thesis, Rutgers University, 1987. [19] M. Komanowsky, H.I. Sinnamon, S. Elias, W.K. Heiland and N.C.
Aceto, J. Amer. Leather Chem. Assoc, 69 (1974) 410. [20] K.S. Weadock, R.M. Olson and F.H. Silver, Biomater., Med. Device,
Artif. Organs, 11 (1984) 293. [21] Y.P. Kato, D.L. Christiansen, R.A. Hahn, S.-J. Shieh, J.D. Goldstein
and F.H. Silver, Biomaterials, 10 (1989) 38. [22] M.-C. Wang, G.D. Pins and F.H. Silver, Biomaterials, 15 (1994) 507. [23] DJ. Mc Bride, Jr., R.A. Hahn and F.H. Silver, Int. J. Biol. Macromol.,
7(1985)71. [24] R. Vilarta and B.C. Vidal, Matrix, 9 (1989) 55. [25] J. Kastelic, I. Palley and E. Baer, J. Biomeck, 13 (1980) 887. [26] B.C. Vidal and H.F. de Carvalho, Matrix, 10 (1990) 48. [27] R.W.D. Rowe, Connect. Tissue Res., 14 (1985) 21. [28] D.A.D. Parry, A.S. Craig and G.R.G. Barnes, Proc. R. Soc. London B,
205(1978)293.
MATERIALS SCIENCE &
ENGINEERING
ELSEVIER Materials Science and Engineering: C 3 (1995) 109-115
The chemistry of polymer-clay hybrids
Akane Okada *, Arimitsu Usuki Toyota Central Research and Development Laboratories, Inc., 41-1, Yokomichi, Nagakute, Aichi, 480-11, Japan
Abstract
There are many organic-inorganic hybrid materials, or molecular composites, in biomineral systems such as bones, teeth, shells and so on. Owing to their complexity a synthetic approach to these materials has not fully developed. Recently, however, synthetic methods have been proposed to prepare artificial organic-inorganic hybrid materials. One is the sol-gel method using metal alkoxides and organic molecules. Another method is the utilization of intercalation reactions of clay minerals. In this paper we review our research in the latter field. We have prepared several polymer-clay hybrids, in which polymers are nylon 6, nitrile rubber and others. They, when molded, have excellent mechanical, thermal and chemical properties compared with unfilled polymers and/or conventional composites. Syntheses, structures and application of the hybrids are presented. In the hybrids negatively charged silicate (clay mineral) and positively charged polymer-ends are directly bonded through ionic bonds. The mechanism of reinforcement is also discussed with the results of CP-MAS NMR and pulsed NMR studies.
Keywords: Molecular composite; Hybrid material; Clay hybrid; Intercalation; Montmorillonite; Nylon 6-clay hybrid
1. Introduction
In structural biological systems, polymers such as proteins and minerals sometimes form composites at the molecular level and with the gradation of components to fulfill strength and toughness [ 1 ]. Artificial composites have been prepared by the mechanical blending of polymers and glass fibers or other inorganic materials to reinforce unfilled polymers. In these reinforced composites, the polymer and additives are not homogeneously dispersed at the microscopic level. If the dispersion could be achieved at the microscopic level, the mechanical properties would be expected to be further improved and/or new unexpected features might appear [2]. A synthetic or chemical approach to organic-inorganic molecular composites has not fully developed due to their complexity. Recently, however, synthetic methods have been proposed to prepare artificial inorganic-organic hybrid mate- rials. One is the sol-gel method using metal alkoxides and organic molecules [3]. Another method is the utilization of intercalation reactions of clay minerals [4]. A clay mineral is a potential candidate for the filler of the molecular com- posites since it is composed of layered silicates, 1 nm thick, and undergoes intercalation with organic molecules [5]. The lack of affinity between hydrophylic silicate and hydrophobic synthetic polymers causes agglomeration of the mineral in
* Corresponding author.
0928-4931/95/$09.50 © 1995 Elsevier Science S.A. All rights reserved 550/0928-4931(95)00110-7
the polymer matrix. Swelling of each template of silicate with organic molecules is a matter of vital importance to reach to these types of molecular composites.
In this paper we present two polymer-clay hybrids: a nylon 6-clay hybrid (NCH) and a rubber-clay hybrid (RCH), in which each 1 nm template of silicate is homogeneously dis- persed in the polymer matrix. Syntheses and the properties of hybrids, and the interaction of the organic-inorganic sur- faces are discussed.
2. Nylon 6-clay hybrid (NCH)
Nylon 6 (polycaploractam) has good mechanical proper- ties and is a commonly used engineering polymer [6]. We tried to prepare NCH by mechanical blending commercial nylon 6 and montmorillonite, a common clay mineral, in a twin screw extruder, which gave just a phase separated, con- ventional nylon 6-clay composite (NCC). So, we tried polymerization of e-caprolactam in the interlayer space of montmorillonite to disperse each template of silicate into a nylon 6 matrix at the molecular level. Swelling of the silicate by e-caprolactam is of key importance. We found that mont- morillonite ion-exchanged with 12-aminolauric acid can be swollen by e-caprolactam to fulfill our purpose.
In what follows the swelling behavior, preparation and properties of NCH and the mechanism of reinforcement are
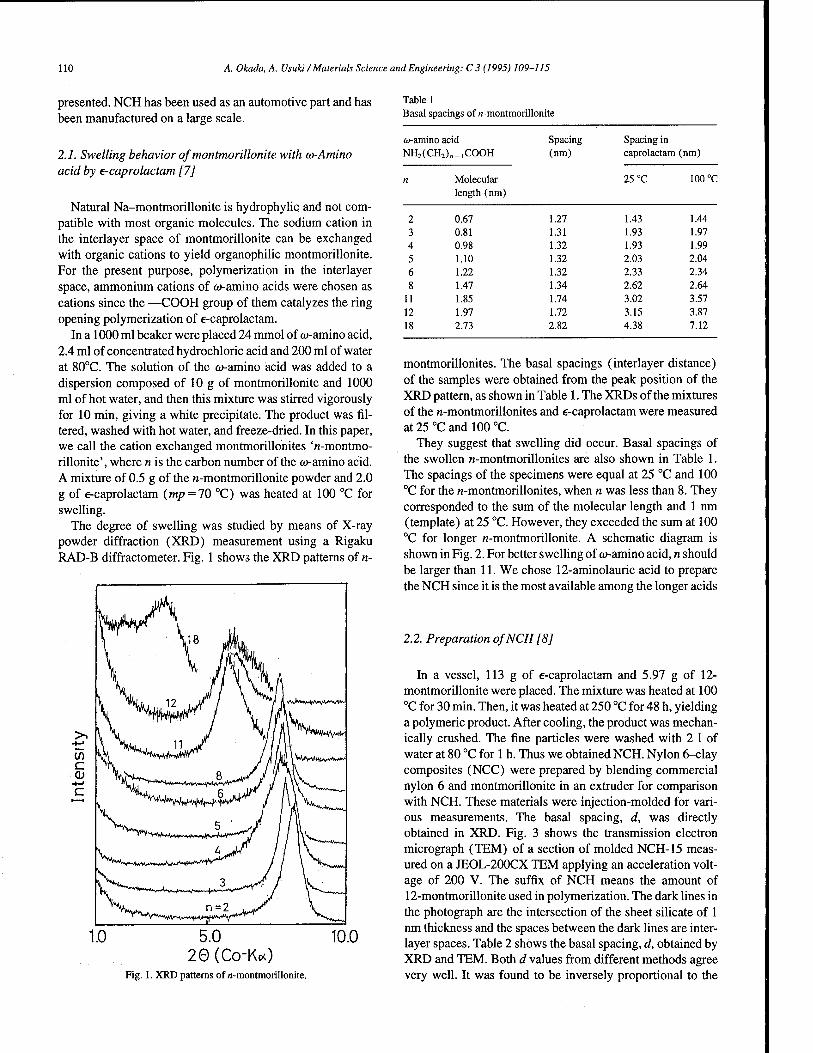
110 A. Okada, A. Usuki/ Materials Science and Engineering: C 3 (1995) 109-115
presented. NCH has been used as an automotive part and has been manufactured on a large scale.
2.1. Swelling behavior of montmorillonite with co-Amino acid by e-caprolactam [7]
Natural Na-montmorillonite is hydrophylic and not com- patible with most organic molecules. The sodium cation in the interlayer space of montmorillonite can be exchanged with organic cations to yield organophilic montmorillonite. For the present purpose, polymerization in the interlayer space, ammonium cations of «-amino acids were chosen as cations since the —COOH group of them catalyzes the ring opening polymerization of e-caprolactam.
In a 1000 ml beaker were placed 24 mmol of «-amino acid, 2.4 ml of concentrated hydrochloric acid and 200 ml of water at 80°C. The solution of the <w-amino acid was added to a dispersion composed of 10 g of montmorillonite and 1000 ml of hot water, and then this mixture was stirred vigorously for 10 min, giving a white precipitate. The product was fil- tered, washed with hot water, and freeze-dried. In this paper, we call the cation exchanged montmorillonites 'n-montmo- rillonite', where n is the carbon number of the <w-amino acid. A mixture of 0.5 g of the n-montmorillonite powder and 2.0 g of e-caprolactam (mp = 70 °C) was heated at 100 °C for swelling.
The degree of swelling was studied by means of X-ray powder diffraction (XRD) measurement using a Rigaku RAD-B diffractometer. Fig. 1 shows the XRD patterns of n-
Table 1 Basal spacings of n-montmorillonite
&>-amino acid Spacing Spacing in NH2(CH2)„_,COOH (nm) caprolactam ( nm)
n Molecular 25 °C 100 °C length (nm)
2 0.67 1.27 1.43 1.44 3 0.81 1.31 1.93 1.97 4 0.98 1.32 1.93 1.99 5 1.10 1.32 2.03 2.04 6 1.22 1.32 2.33 2.34 8 1.47 1.34 2.62 2.64
11 1.85 1.74 3.02 3.57 12 1.97 1.72 3.15 3.87 18 2.73 2.82 4.38 7.12
5.0 20 (Co-KoO
10.0
Fig. 1. XRD patterns of «-montmorillonite.
montmorillonites. The basal spacings (interlayer distance) of the samples were obtained from the peak position of the XRD pattern, as shown in Table 1. The XRDs of the mixtures of the n-montmorillonites and e-caprolactam were measured at 25 °C and 100 °C.
They suggest that swelling did occur. Basal spacings of the swollen n-montmorillonites are also shown in Table 1. The spacings of the specimens were equal at 25 °C and 100 °C for the n-montmorillonites, when n was less than 8. They corresponded to the sum of the molecular length and 1 nm (template) at 25 °C. However, they exceeded the sum at 100 °C for longer n-montmorillonite. A schematic diagram is shown in Fig. 2. For better swelling of &>-amino acid, n should be larger than 11. We chose 12-aminolauric acid to prepare the NCH since it is the most available among the longer acids
2.2. Preparation of NCH [8]
In a vessel, 113 g of e-caprolactam and 5.97 g of 12- montmorillonite were placed. The mixture was heated at 100 °C for 30 min. Then, it was heated at 250 °C for 48 h, yielding a polymeric product. After cooling, the product was mechan- ically crushed. The fine particles were washed with 2 1 of water at 80 °C for 1 h. Thus we obtained NCH. Nylon 6-clay composites (NCC) were prepared by blending commercial nylon 6 and montmorillonite in an extruder for comparison with NCH. These materials were injection-molded for vari- ous measurements. The basal spacing, d, was directly obtained in XRD. Fig. 3 shows the transmission electron micrograph (TEM) of a section of molded NCH-15 meas- ured on a JEOL-200CX TEM applying an acceleration volt- age of 200 V. The suffix of NCH means the amount of 12-montmorillonite used in polymerization. The dark lines in the photograph are the intersection of the sheet silicate of 1 nm thickness and the spaces between the dark lines are inter- layer spaces. Table 2 shows the basal spacing, d, obtained by XRD and TEM. Both d values from different methods agree very well. It was found to be inversely proportional to the
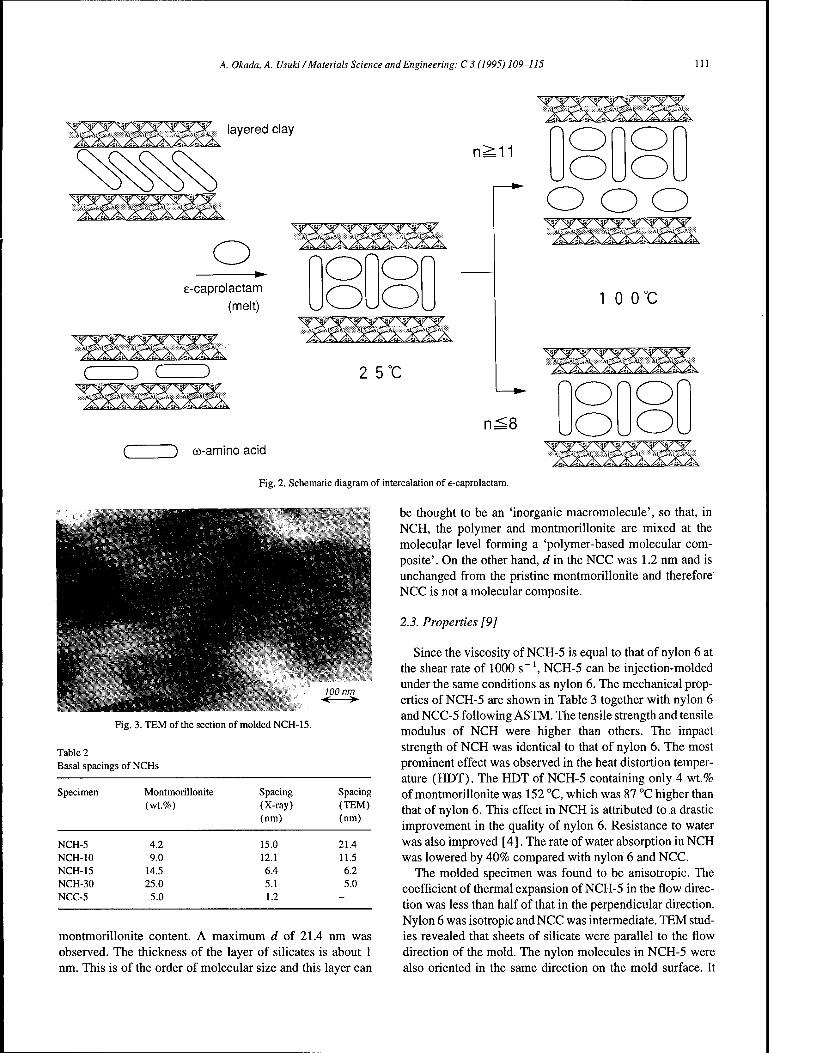
A. Okada, A. Usuki/Materials Science and Engineering: C 3 (1995) 109-115 111
XXXXXXy^X layered clay
n^11 O O
o o r~\
o >~
e-caprolactam (melt)
n
VJ
o o o uOu
wywYYYY A)<%r\ \-%r\ V^rtv
CZZ> C ) 2 5°C
o oo AT^-AI^-AI Al/>A1~>1 Al^-Ai-Al.
1 0 o°c
n^8 O o
r^ o o C ) co-ami no acid
Fig. 2. Schematic diagram of intercalation of e-caprolactam.
*T>M^>L AI*>Al^Al. A1^.AL^.A1
Fig. 3. TEM of the section of molded NCH-15.
Table 2 Basal spacings of NCHs
Specimen Montmorillonite Spacing Spacing (wt.%) (X-ray) (TEM)
(nm) (nm)
NCH-5 4.2 15.0 21.4 NCH-10 9.0 12.1 11.5 NCH-15 14.5 6.4 6.2 NCH-30 25.0 5.1 5.0 NCC-5 5.0 1.2 -
montmorillonite content. A maximum d of 21.4 nm was observed. The thickness of the layer of silicates is about 1 nm. This is of the order of molecular size and this layer can
be thought to be an 'inorganic macromolecule', so that, in NCH, the polymer and montmorillonite are mixed at the molecular level forming a 'polymer-based molecular com- posite'. On the other hand, d in the NCC was 1.2 nm and is unchanged from the pristine montmorillonite and therefore NCC is not a molecular composite.
2.3. Properties [9]
Since the viscosity of NCH-5 is equal to that of nylon 6 at the shear rate of 1000 s~ \ NCH-5 can be injection-molded under the same conditions as nylon 6. The mechanical prop- erties of NCH-5 are shown in Table 3 together with nylon 6 and NCC-5 following ASTM. The tensile strength and tensile modulus of NCH were higher than others. The impact strength of NCH was identical to that of nylon 6. The most prominent effect was observed in the heat distortion temper- ature (HDT). The HDT of NCH-5 containing only 4 wt.% of montmorillonite was 152 °C, which was 87 °C higher than that of nylon 6. This effect in NCH is attributed to a drastic improvement in the quality of nylon 6. Resistance to water was also improved [4]. The rate of water absorption in NCH was lowered by 40% compared with nylon 6 and NCC.
The molded specimen was found to be anisotropic. The coefficient of thermal expansion of NCH-5 in the flow direc- tion was less than half of that in the perpendicular direction. Nylon 6 was isotropic and NCC was intermediate. TEM stud- ies revealed that sheets of silicate were parallel to the flow direction of the mold. The nylon molecules in NCH-5 were also oriented in the same direction on the mold surface. It

112 A. Okada, A. Usuki/ Materials Science and Engineering: C 3 (1995) 109-115
Table 3 Properties of NCH-5(1)
Specimen Montmorillonite (wt.%)
Tensile strength (MPa)
Tensile modulus (GPa)
Charpy impact strength (kJ/m2)
HDT at 18.5 kg cm" (°C)
Specimen Clay mineral Tensile strength at 120 °C (MPa)
Rate of water absorption 23 °C, 1 day
Coefficient of thermal expansion
Flow direction
(cm cm"
Perpendicular direction
°CX105)
NCH-5 4.2 107 2.1 6.1 152 0.51 6.3 13.1 NCC-5 5.0 61 1.0 5.9 89 0.90 10.3 13.4 nylon 6 0 69 1.1 6.2 65 0.87 11.7 11.8
Table 4 Mechanical properties of NCHs
Tensile modulus at 120 °C (GPa)
HDT at 18.5 kg cm"2
(°C)
NCH-5 NCHM-5 NCHP-5 NCHH-5 Nylon 6
montmorillonite synthetic mica saponite hectorite
32.3 30.2 29.0 26.4 26.6
0.61 0.52 0.29 0.29 0.19
152 145 107 93 65
Table 5 15N-NMR chemical shift
Specimen 15N-NMR chemical shift (ppm)
Cl-N+H3CH2COOH Montmorillonite-N+H3CH2COOH Synthetic mica-N+H3CH2COOH Saponite-N+H3CH2COOH Hectrite-N+H3CH2COOH NH2(CH2)6NH2
15.6 11.2 9.4 8.4 8.3 7.0
seems that anisotropy of the thermal expansion results from the orientations of silicate and polymer chains [ 10].
2.4. Bond character of organic and inorganic surfaces [11]
The excellent mechanical properties in NCH can be con- sidered to have their origin in an enormous surface area and ionic bonds between the organic polymer and inorganic sili- cate. Nylon 6 molecules have one —NH2 and one —COOH end group, so titration of nylon 6 with hydrochloric acid and NaOH aqueous solution always gives the same value of con- centration of both end groups. However, the titration study of NCH revealed that the concentration of—COOH ends was much higher than that of—NH2 ends. The decreased —NH2
corresponds to —NH3 + in NCH. The results strongly indicate that substantial number of nylon molecules in NCH are ion- bonded to silicate at the —NH3
+ end. Each silicate works as a cross-linker of them and restricts their motion. In anticipa- tion of better NCH, other clay minerals were examined such as synthetic mica (sodium tetrasilicic mica), saponite and hectorite. The mechanical properties of new hybrids are
shown in Table 4. Contrary to expectation, among four clays, montmorillonite is the most effective on improvement of the properties. In order to evaluate the strength of the ionic bond at the interface between the silicate and organic moiety, we studied 15N CP-MAS NMR spectroscopy using a Brucker MSL 300 WB spectrometer operating at 30.41 Hz and a magnetic field strength of 7.0 T. Nylon 6 in NCH has more than 100 mers, so that the terminal (surface) nitrogen is less than 1% of the total nitrogens. We had to choose a simpler organic compound as a model for ion-bonding nylon 6.
Thus, we prepared intercalation compounds of clay min- erals and glycine since it is the simplest amino acid and its isotope-enriched reagent is commercially available. Hexamethylenediamine was chosen as a model for non-bond- ing nylon 6. The 15N chemical shifts are summarized in Table 5. As the positive charge on nitrogen increases, its chemical shift goes downfield. The results revealed that all glycines in the interlayer space of minerals are partially ionized, and that the order of the positive charge density (i.e. the order of the ionic bond strength) agrees with that of the mechanical prop- erties in Table 4. It is clarified that the chemical bond between the inorganic silicate and the organic polymers at the molec- ular level causes an improvement in the macroscopic mechan- ical properties of materials.
2.4.1. Application The timing belt covers of automotive engines are usually
made of glass fiber reinforced nylon or polypropylene. Since NCH has a high modulus and a high distortion temperature, as mentioned above, we tried to make it by injection-molding, as shown in Fig. 4. The belt cover showed good rigidity, excellent thermal stability and no warp. Also, weight saving
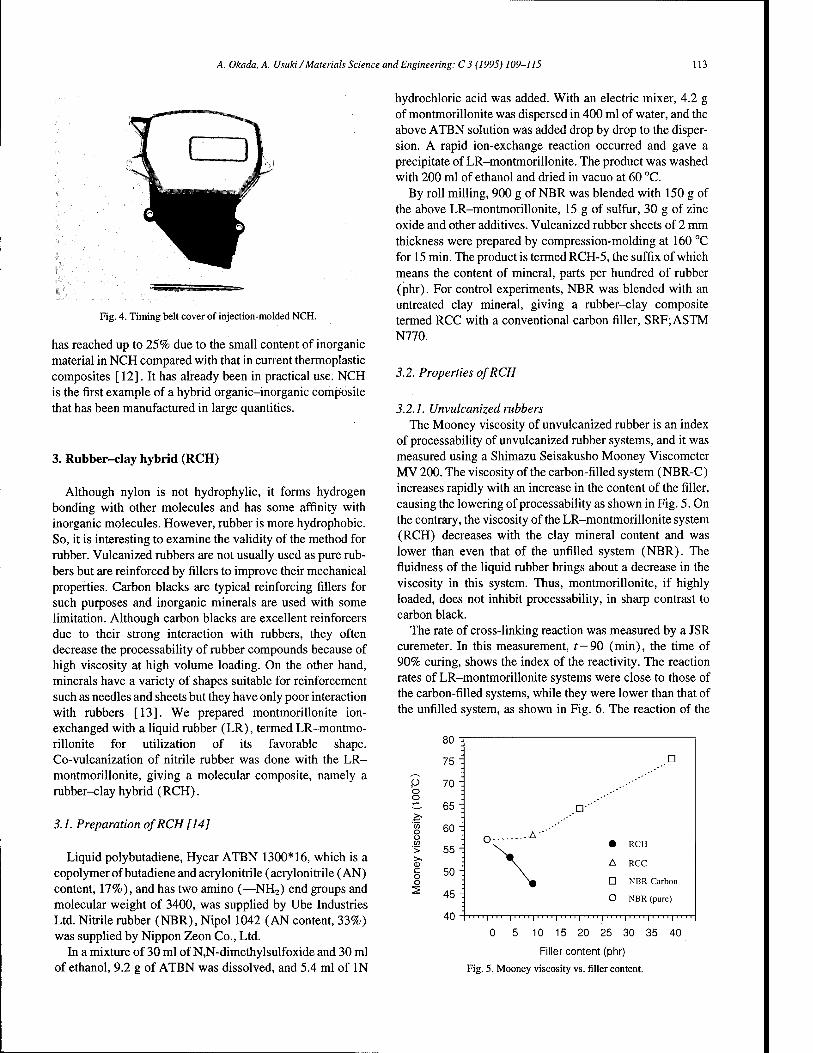
A. Okada, A. Usuki / Materials Science and Engineering: C 3 (1995) 109-115 113
Fig. 4. Timing belt cover of injection-molded NCH.
has reached up to 25% due to the small content of inorganic material in NCH compared with that in current thermoplastic composites [ 12]. It has already been in practical use. NCH is the first example of a hybrid organic-inorganic composite that has been manufactured in large quantities.
3. Rubber-clay hybrid (RCH)
Although nylon is not hydrophylic, it forms hydrogen bonding with other molecules and has some affinity with inorganic molecules. However, rubber is more hydrophobic. So, it is interesting to examine the validity of the method for rubber. Vulcanized rubbers are not usually used as pure rub- bers but are reinforced by fillers to improve their mechanical properties. Carbon blacks are typical reinforcing fillers for such purposes and inorganic minerals are used with some limitation. Although carbon blacks are excellent reinforcers due to their strong interaction with rubbers, they often decrease the processability of rubber compounds because of high viscosity at high volume loading. On the other hand, minerals have a variety of shapes suitable for reinforcement such as needles and sheets but they have only poor interaction with rubbers [13]. We prepared montmorillonite ion- exchanged with a liquid rubber (LR), termed LR-montmo- rillonite for utilization of its favorable shape. Co-vulcanization of nitrile rubber was done with the LR- montmorillonite, giving a molecular composite, namely a rubber-clay hybrid (RCH).
3.1. Preparation ofRCH [14]
Liquid polybutadiene, Hycar ATBN 1300*16, which is a copolymer of butadiene and aery lonitrile (acrylonitrile (AN) content, 17%), and has two amino (—NH2) end groups and molecular weight of 3400, was supplied by Ube Industries Ltd. Nitrile rubber (NBR), Nipol 1042 (AN content, 33%) was supplied by Nippon Zeon Co., Ltd.
In a mixture of 30 ml of N,N-dimethylsulfoxide and 30 ml of ethanol, 9.2 g of ATBN was dissolved, and 5.4 ml of IN
hydrochloric acid was added. With an electric mixer, 4.2 g of montmorillonite was dispersed in 400 ml of water, and the above ATBN solution was added drop by drop to the disper- sion. A rapid ion-exchange reaction occurred and gave a precipitate of LR-montmorillonite. The product was washed with 200 ml of ethanol and dried in vacuo at 60 °C.
By roll milling, 900 g of NBR was blended with 150 g of the above LR-montmorillonite, 15 g of sulfur, 30 g of zinc oxide and other additives. Vulcanized rubber sheets of 2 mm thickness were prepared by compression-molding at 160 °C for 15 min. The product is termed RCH-5, the suffix of which means the content of mineral, parts per hundred of rubber (phr). For control experiments, NBR was blended with an untreated clay mineral, giving a rubber-clay composite termed RCC with a conventional carbon filler, SRF;ASTM N770.
3.2. Properties of RCH
3.2.1. Unvulcanized rubbers The Mooney viscosity of unvulcanized rubber is an index
of processability of unvulcanized rubber systems, and it was measured using a Shimazu Seisakusho Mooney Viscometer MV 200. The viscosity of the carbon-filled system (NBR-C) increases rapidly with an increase in the content of the filler, causing the lowering of processability as shown in Fig. 5. On the contrary, the viscosity of the LR-montmorillonite system (RCH) decreases with the clay mineral content and was lower than even that of the unfilled system (NBR). The fluidness of the liquid rubber brings about a decrease in the viscosity in this system. Thus, montmorillonite, if highly loaded, does not inhibit processability, in sharp contrast to carbon black.
The rate of cross-linking reaction was measured by a JSR curemeter. In this measurement, t — 90 (min), the time of 90% curing, shows the index of the reactivity. The reaction rates of LR-montmorillonite systems were close to those of the carbon-filled systems, while they were lower than that of the unfilled system, as shown in Fig. 6. The reaction of the
p
o o 2
80
75
70
65
60
55
50
45
40
D
D-'
• RCH
A RCC
D NBR-Carbon
O NBR (pure)
11 " I"1 'I1 "'I " ' 'I " "I " " I " " I1 " 'I ' ' ' 'I ' "
0 5 10 15 20 25 30 35 40
Filler content (phr)
Fig. 5. Mooney viscosity vs. filler content.

114 A. Okada, A. Usuki /Materials Science and Engineering: C 3 (1995) 109-115
c 'E o
CO CL
p ID
CO
LU
CO Q.
Fig.
0 5 10 15 20 25 30 35 40
Filler content (phr)
6. Time of 90% curing vs. filler content.
1 1 1 1 1 1 1 1 r 0 5 10 15 20 25 30 35 40
Filler content (phr)
Fig. 7. Storage modulus vs. filler content.
2.5
1.5
- ,o
- ..G''
• RCH
I
..A-'''
l i
A RCC
D NBR-carbon
O NBR i i i i 0.5
0 5 10 15 20 25 30 35 40
Filler content (phr)
Fig. 8. Stress at 100% strain vs. filler content.
pristine clay composite system (RCC) retarded so remarka- bly that this system is not of practical use, maybe owing to reaction inhibition on the mineral surface. Thus, this new system can improve processability.
3.2.2. Vulcanized rubbers A transmission electron micrographic study indicates that
sheets of silicate are dispersed in rubber at the molecular level. The storage modulus (£') was obtained at 10 Hz between - 150 °C and 150 °C using an Iwamoto Seisakusho VES-F Viscoelastometer. The E' values at 25 °C of RCH are shown in Fig. 7. In RCH, montmorillonite reinforces four times as much as carbon when added to the rubber as a filler. Thus the E' value of RCH-10 is almost identical to that of NBR-C40. Similar results were obtained also at 100 °C.
The 100% tensile stress at 25 °C of RCH-10, containing 10 phr of clay mineral, is equal to that of the rubber containing 40 phr of carbon black, as shown in Fig. 8. However, the clay mineral does not have a reinforcing effect in RCC, a conven- tional composite. Swelling of NBR reaches equilibrium in benzene at 25 °C after 48 h. Thus the polymer in the vicinity of the silicate is restricted in mobility by the silicate so that the polymer is effectively reinforced and also restricted in swelling.
3.3. Mechanism of reinforcement
The favorable properties of RCH can be considered to have their origin in an enormous surface area and ionic bonds between the organic polymers and inorganic silicate sheets as in the case of NCH. If such a strong interaction exists in rubber systems, one can expect some increase in the fast component of the proton spin-spin relaxation time, T2. T2
measurements were performed on a JEOL FSE 60Q breadline pulsed NMR spectrometer operating at 60 Hz for protons using the solid echo and CPMG (Carr-Purcell-Meiboon- Gill) pulse sequences. Fig. 9 shows the T2 signals for both liquid rubber (LR) and LR-montmorillonite. The T2 profile of the conventional blend of LR and montmorillonite was identical to that of LR. The T2 signal for LR-montmorillonite was actually resolved into a fast decaying rigid component and a slowly decaying rubbery component (corresponding to the rubbery molecules in mobility). The rigid component, which cannot be observed in LR (nor in the conventional
0.4 0.6
Time (ms)
Fig. 9. T2 signal for LR-montmorillonite.
1.0

A. Okada, A. Usuki /Materials Science and Engineering: C 3 (1995) 109-115 115
composite), is assigned to the motionally constrained regions of LR molecules in LR-montmorillonite through the rubber- filler interactions, and its fraction can be evaluated to be about 20%. That is equal to the fraction of the tightly bound com- ponent in the inextractable rubber-filler gel, the so-called 'bound rubber', for carbon-black-filled systems [ 15]. There is now general agreement that 'bound rubber' is an important factor in reinforcement, depending on the characteristics of the filler particles such as particle size, surface area, structure, and surface activity. Thus, it is considered that there appear to be strong rubber-filler interactions (comparable to those in carbon-black- filled systems) in LR-montmorillonite, in which negatively charged silicate layers are bonded to LR- molecules with positively charged terminal sites, forming 'bound rubber'.
4. Conclusion
Polymer-clay hybrids, i.e. organic-inorganic molecular composites, were prepared. X-ray and TEM measurements revealed that each 1 nm thick template of clay mineral was dispersed in the polymer matrix and that the repeat unit increased from 1 nm in unintercalated materials to more than 15 nm in the intercalated materials. Thus, polymer-clay hybrids are real molecular composites, or nanocomposites. They, when molded, show excellent mechanical properties compared with unfilled polymers and/or conventional com- posites. Owing to its properties, the nylon 6-clay hybrid is manufactured in large quantities. In the hybrids, negatively charged silicates (clay mineral) and positively charged pol- ymer ends are directly bonded through ionic bonds. The
mechanism of reinforcement was explained using the results of 15N CP-MAS and proton pulsed NMR studies.
We believe that the method described here, which exploits intercalation, has opened a new field of artificial/synthetic organic-inorganic molecular composites, though it is not yet as sophisticated as their counterparts in biological systems.
References
[ 1 ] J.E. Mark and P.D. Calvert, Mater. Sei. Eng., Cl (1994) 159. [2] E.P. Giannelis, J. Minerals, Met. Mater. Soc, March (1992) 28. [3] H. Schmidt, in D.W. Schaefer and J.E. Mark (eds.), Polymer Based
Molecular Composites, Mater. Res. Soc, Pittsburgh, PA, 1990, p. 3. [4] A. Okada, M. Kawasumi, T. Kurauchi and O. Kamigaito, Polym.
Prepr., 28 (1987) 447. [5] J.M. Jordan, / Phys. Colloid Chem., 53 (1950) 245. [6] M.I. Kohan (ed.),Nylon Plastics, Interscience, New York, NY, 1973. [7] A. Usuki, Y. Kojima, M. Kawasumi, A. Okada, T. Kurauchi and O.
Kamigaito,/ Mater. Res., 8 (1993) 1174. [8] A. Usuki, Y. Kojima, M. Kawasumi, A. Okada, T. Kurauchi, Y.
Fukushima and O. Kamigaito, J. Mater. Res., 8 (1993) 1179. [9] Y. Kojima, A. Usuki, M. Kawasumi, A. Okada, T. Kurauchi, Y.
Fukushima and O. Kamigaito, J. Mater. Res., 8 (1993) 1185. [10] Y. Kojima, A. Usuki, M. Kawasumi, A. Okada, T. Kurauchi, O.
Kamigaito and K. Kaji, J. Polym. Sei. B (1994) in press. [11] A. Usuki, A. Koiwai, Y. Kojima, M. Kawasumi, A. Okada, T. Kurauchi
and O. Kamigaito, J. Appl. Polym. Sei. (1994) in press. [ 12] T. Kurauchi, A. Okada, T. Nomura, T. Nishio, S. Saegusa and R.
Deguchi, SAE Paper Series 910584, Soc. Automotive Eng., Warrendale, PA, 1991.
[13] E.M. Dannenberg, Rubber Chem. Technoi, 59 (1986) 512. [14] A. Okada, K. Fukumori, A. Usuki, Y. Kojima, T. Kurauchi and O.
Kamigaito, Polym. Prepr., 32 (1991) 540; K. Fukumori, A. Usuki, N. Sato, A. Okada and T. Kurauchi, Proc. 2nd Japan International SAMPE Symposium, 1991, p. 89.
[15] T. Nishi,/ Polym. Sei. Polym. Phys. Ed., 12 (1974) 685.
MATERIALS SCIENCE &
ENGINEERING
ELSEVIER Materials Science and Engineering: C 3 (1995) 117-124
Chitosan-calcium carbonate composites by a biomimetic process
Sukun Zhanga, K.E. Gonsalves a'b'* a Polymer Science Program, Institute ofMaterials Science, U-136, University of Connecticut, Storrs, CT 06269, USA
b Department of 'Chemistry, U-136, University of Connecticut, Storrs, CT 06269, USA
Abstract
The crystal growth of calcium carbonate on a chitosan substrate was achieved using a supersaturated calcium carbonate solution, by using various additives, such as 6-aminocaproic acid (6AA) and polyacrylic acid (PAA). Polyacrylic acid modified the chitosan-film surface and promoted the nucleation of calcium carbonate crystals. In the absence of polyacrylic acid, sporadic nucleation and crystallization was observed via optical microscopy. By introducing polyacrylic acid into the systems, positively charged protonated nitrogen and negatively charged carboxylate ions were produced by reaction between the amino group in the chitosan and carboxyl group in polyacrylic acid, which were detected by ATR-IR and XPS techniques. These charges induced the nucleation of the calcium carbonate crystals, calcite and vaterite, on the chitosan-film surface. In this case, the crystals showed spherical morphology, which consisted of a large number of small particles with a diameter of about 0.2 /am. The calcium carbonate crystals growing on the rigid chitosan-film surfaces are uniform.
Keywords: Calcium carbonate; Composites; Chitosan film; Biomimetics; X-ray diffraction; X-ray photoelectron spectroscopy
1. Introduction
In biological systems, organisms efficiently design and produce ceramic-polymer composites which have properties far beyond those that can be achieved by present technolog- ical materials. Two examples are nacre and bone. Nacre is a composite consisting of more than 95 vol.% calcium carbon- ate. The remaining 5 vol.% is an organic matrix that is a composite of proteins and chitin. The inorganic phase consists of crystallographically highly oriented aragonite platelets forming the 'bricks' and the organic matrix is like the mortar in between the bricks [ 1 ].
There is considerable interest in this biological system. Weiner and Addadi [2] extracted proteins from mineralized crab shells and reported that these proteins (rich in acidic amino acids) exist between the surfaces of the calcium car- bonate crystals and chitin, the matrix macromolecule. They proposed that the soluble acidic proteins are responsible for both the nucleation and crystallization of calcium carbonate because the /3-sheet conformation of acidic proteins matches one of the calcium carbonate crystal lattices.
Recently there has been an interest in using polymers [3] as organic matrices coated with ceramics from aqueous solu- tions under ambient conditions. Generally, biomimetic ceramic-polymer composites can be produced by depositing
' Corresponding author.
mineral crystals onto an organic matrix from a supersaturated aqueous solution. Ionic groups existing on the polymer sur- face are essential for crystallization. Functionalized poly(dimethylsiloxane) film was reported to lower the acti- vation energy of calcite nucleation in the crystallization of calcium carbonate [4]. In addition, compressed Langmuir monolayer films of surfactants have been used to control the crystallization of calcium carbonate [5 ].
Potential applications for biomimetic coatings cover a broad range of industries and medicine. The coatings can be used as a ceramic thin film on plastics to improve abrasion- resistance. Another promising application is to coat ceramic thin films which have optical or magnetic properties on pat- terned polymer surfaces [6,7]. Stupp and coworkers [8] developed organoapatite materials which have potential applications for artificial bone. The materials were synthe- sized by the nucleation and growth of apatite crystals in media containing either poly (amino acids) or synthetic organic polyelectrolytes.
Although the study of biomineralization has progressed steadily, it is still not quite possible to tailor-make composites with a controlled size, shape and orientation of inorganic crystals on specific polymer surfaces by means of biomimetic processing. To meet specific applications in the industrial and biomedical fields, more work needs to be done in the biomi- metic area. In this paper we describe the influence of additives on the crystallization and crystal morphology of calcium car-
0928-4931/95/$09.50 © 1995 Elsevier Science S.A. All rights reserved 550/0928-4931(95)00111-5

118 S. Zhang, K.E. Gonsalves /Materials Science and Engineering: C 3 (1995) 117-124
bonate growing on chitosan films. In particular emphasis is on the change of charges on the chitosan surface with and without the additives, which as a result influences the crys- tallography and crystalline size of calcium carbonate crystals.
2. Experimental
2.1. Preparation of calcium carbonate supersaturated solution
The supersaturated calcium bicarbonate solution was pre- pared following the procedure described by Kitano [16] and Mann [5]. A suspension of CaC03 (calcite) with the ratio 0.9/100 (mg/ml) of calcium carbonate to distilled water was first prepared. While stirring, C02 was bubbled into the sys- tem at room temperature and kept for 6 h. The suspension was then filtered and the filtrate purged with C02 gas for 30 min to dissolve any remaining crystals. The pH of the result- ing supersaturated solution was about 6.00.
2.2. Preparation of chitosan films
A chitosan film was obtained by casting the 1% (w/w) solution of chitosan (Sigma Co.) in 1% (w/w) acetic acid aqueous solution on a polymethylmethacry late plate or a glass slide. In a typical preparation of the casting solution, 2 g of chitosan (the formula and structure are shown in Fig. 4 below) was added to 100 ml of distilled water and stirred for 10 min. Then 100 g of 2% (w/w) acetic acid was added and stirred at room temperature for another 30 min [ 9 ]. A viscous solution was obtained and filtered. The chitosan film made in this way was then neutralized with dilute ammonium hydrox- ide and washed extensively with water. After air drying, it was further dried under vacuum at room temperature.
Polyacrylic acid (Aldrich Co.) with a molecular weight of 2000 was employed as an additive. Various amounts of the polyacrylic acid were weighed and placed into polystyrene (PS) bottles, before adding the calcium carbonate supersat- urated solution.
2.3. Characterization
The pH of the solution was measured by a Fisher pH meter (model 107). CaC03 crystallite sizes and morphology were observed under a polarized optical microscope, model Nikon Labophot-pol, and also by scanning electron microscopy (SEM, AMR 1200B). X-ray diffraction (XRD) was carried out to determine the crystallite sizes and phases. The surfaces of the chitosan films, with or without soaking in polyacrylic acid solution, were examined by attenuated total reflectance infrared spectroscopy (ATRIR, Mattson Polaris) by using a 60° germanium analyzer. X-ray photoelectron spectroscopy (XPS) was used to detect the surface structures of chitosan films. XPS spectra were collected on a monochromatic spec- trometer (Perkin-Elmer, 5300) using an Al Ka source (600
W, 15 keV) with a pass energy of 37.5 eV. The vacuum was maintained at approximately 1 X 10~9 Torr.
3. Results and discussion
3.1. Chitosan surface analysis
The chitosan-film surfaces with or without modification were monitored by XPS and ATR.
Fig. 1 shows a series of XPS 0-1000 eV wide scan and core-level spectra of the chitosan-film surfaces after being soaked in supersaturated calcium carbonate aqueous solution for 4 h under a series of concentrations of polyacrylic acid. In the absence of polyacrylic acid, only one kind of nitrogen and oxygen appears. Three types of carbon detected in this case represent O-C-O, C-C-0 and C-N, respectively [ 10- 12] and their area ratio is 1:4:1, which matches the ratio of the chitosan repeat unit. The absence of a calcium element in this situation indicates that no calcium carbonate nuclei formed at the beginning of the crystallization. In the presence
0.06% PAA
5 o
M Ml , "MX\ CJ o
w o
1
I ^
0.02% PAA
Q. Cd CO
1 (/) o
1 —^
288 286 284 282
800 600 400 200
Binding energy, eV
Fig. 1. XPS wide scan and core-level spectra of chitosan-film surface after soaking in a supersaturated calcium carbonate aqueous solution at different concentrations of polyacrylic acid.

S. Zhang, K.E. Gonsalves /Materials Science and Engineering: C 3 (1995) 117-124 119
Table 1 Atomic concentrations of carbon, oxygen, nitrogen and calcium on a chitosan-film surface at different concentration of polyacrylic acid
Cone. ofPAA c O N Ca N/N+ PAA/chitosan (%w/w) (AC %) (AC %) (AC%) (AC %) (AC/AC) (repeat-unit ratio)
0.00 55.43 36.27 8.30 0.00 95/5 0.0 0.01 56.32 38.02 4.64 1.00 50/50 2.62 0.02 57.75 37.15 4.12 0.97 62/38 2.50 0.06 56.89 38.26 3.66 1.18 51/49 3.23 0.10 59.06 37.40 3.54 - 50/50 3.28
of polyacrylic acid, however, two peaks occurred at binding energies of about 400 eV and 398 eV, which represent pro- tonated nitrogen and free base nitrogen, respectively. The other two peaks detected at binding energies of about 531 eV and 530 eV pertain to the oxygen of-C-O-C of chitosan and -C=0 of polyacrylic acid, respectively. The appearance an element of calcium in the XPS spectra results from the nucle- ation of calcium carbonate on the chitosan-film surface in the
PAA
Oxalic acid
6AA
No additive
402 400 398 396
Binding energy, eV
Fig. 2. XPS core-level spectra of chitosan-film surfaces after soaking in aqueous solutions with various additives.
presence of polyacrylic acid. In this case, the positive and the negative charges occur on the chitosan film.
Table 1 summarizes both the atomic concentrations of ele- ments and the repeat-unit ratios of chitosan to polyacrylic acid on the chitosan-film surface at different concentrations of polyacrylic acid. The atomic concentration ratios of free nitrogen to protonated nitrogen were around 1/1 after adding polyacrylic acid to the systems. The atomic concentration of nitrogen decreased dramatically after adding polyacrylic acid to the system and decreased slightly as the concentration of polyacrylic acid increased, while the repeat-unit ratio of poly- acrylic acid to chitosan showed the opposite trend. Therefore, the higher the concentration of polyacrylic acid, the more the polyacrylic acid was adsorbed onto the chitosan-film surface. However, above 0.06% w/w, the adsorption appeared to reach equilibrium. At a concentration of 0.1% w/w, there were more mobile carboxylate anions of polyacrylic acid in the solution, which inhibited the crystallization. This was also confirmed by ATR analysis.
Fig. 2 shows the nitrogen core-level XPS spectra of the chitosan-film surfaces after being soaked in oxalic acid, 6- aminocaproic acid and PAA (0.02% w/w) aqueous solutions, respectively, for 4 h. Two kinds of nitrogen peaks, which represent the protonated nitrogen and amino nitrogen, occurred in the all the systems in the presence of additives. The highest ratio of protonated nitrogen to amino nitrogen occurred in the system with PAA. A chitosan film fell apart in the oxalic acid aqueous solution.
The ATR spectra of chitosan-film surfaces with and with- out polyacrylic acid are shown in Fig. 3. Sample A is the one without soaking in the polyacrylic acid aqueous solution and sample B was soaked in a 0.2% polyacrylic acid aqueous solution for 3 h. A new band at 1707 cm"1 appearing in sample B corresponds to the carbonyl C=0 stretching absorption of the carboxyl group in polyacrylic acid. The band appearing at 1550 cm"' in the spectrum can be assigned to a symmetric -NH3 + deformation, and broad bands appear- ing at 2500 cm-1 and 1900 cm-' confirm the presence of - NH3
+ on the chitosan film [ 13]. Another new band at 1400 cm-1 represents the carboxylate ion. Thus, the negatively charged carboxylate ion and the positively charged —NH3 +
coexist on the chitosan-film surface in the presence of poly- acrylic acid. Fig. 4 shows a schematic diagram of the structure of unmodified and modified chitosan-film surfaces.
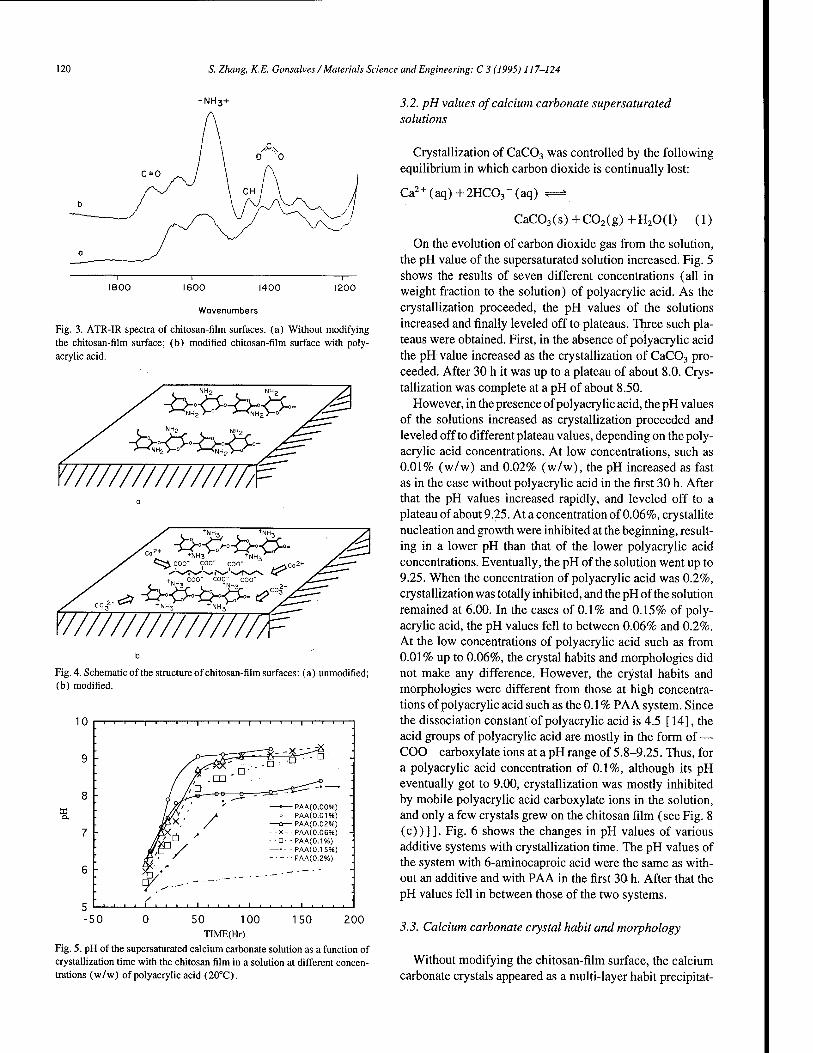
120 S. Zhang, K.E. Gonsalves /Materials Science and Engineering: C 3 (1995) 117-124
-NH3+
1800 1600 1400 1200
Wavenumbers
Fig. 3. ATR-IR spectra of chitosan-film surfaces, (a) Without modifying the chitosan-film surface; (b) modified chitosan-film surface with poly- acrylic acid.
'/////////////////
»-54 coo" coo- coo"
t.lu COO" COO" COO"
C032 V^ tNH3 * NH3
Fig. 4. Schematic of the structure of chitosan-film surfaces: (a) unmodified; (b) modified.
10
9
—1—i—I—1—|—I—I 1—i—|—I—I—I—I 1 1—i 1 1—| 1 1—I—r-
PAA(0.00%) PAA(0.01%) PAA(0.02%)
--X--PAA(0.06%) ■ D- - PAA(0.1%) PAA(0.15%) PAA(0.2%)
9V~ ■ ■ ■ ■
-50 0 150 200 50 100 TIME(Hr)
Fig. 5. pH of the supersaturated calcium carbonate solution as a function of crystallization time with the chitosan film in a solution at different concen- trations (w/w) of polyacrylicacid (20°C).
3.2. pH values of calcium carbonate supersaturated solutions
Crystallization of CaC03 was controlled by the following equilibrium in which carbon dioxide is continually lost:
Ca2+(aq)+2HC03-(aq) *=*
CaC03(s)+C02(g)+H20(l) (1)
On the evolution of carbon dioxide gas from the solution, the pH value of the supersaturated solution increased. Fig. 5 shows the results of seven different concentrations (all in weight fraction to the solution) of polyacrylic acid. As the crystallization proceeded, the pH values of the solutions increased and finally leveled off to plateaus. Three such pla- teaus were obtained. First, in the absence of polyacrylic acid the pH value increased as the crystallization of CaC03 pro- ceeded. After 30 h it was up to a plateau of about 8.0. Crys- tallization was complete at a pH of about 8.50.
However, in the presence of polyacrylic acid, the pH values of the solutions increased as crystallization proceeded and leveled off to different plateau values, depending on the poly- acrylic acid concentrations. At low concentrations, such as 0.01% (w/w) and 0.02% (w/w), the pH increased as fast as in the case without polyacrylic acid in the first 30 h. After that the pH values increased rapidly, and leveled off to a plateau of about 9.25. At a concentration of 0.06%, crystallite nucleation and growth were inhibited at the beginning, result- ing in a lower pH than that of the lower polyacrylic acid concentrations. Eventually, the pH of the solution went up to 9.25. When the concentration of polyacrylic acid was 0.2%, crystallization was totally inhibited, and the pH of the solution remained at 6.00. In the cases of 0.1% and 0.15% of poly- acrylic acid, the pH values fell to between 0.06% and 0.2%. At the low concentrations of polyacrylic acid such as from 0.01% up to 0.06%, the crystal habits and morphologies did not make any difference. However, the crystal habits and morphologies were different from those at high concentra- tions of polyacrylic acid such as the 0.1% PAA system. Since the dissociation constant of polyacrylic acid is 4.5 [ 14], the acid groups of polyacrylic acid are mostly in the form of — COO" carboxylate ions at a pH range of 5.8-9.25. Thus, for a polyacrylic acid concentration of 0.1%, although its pH eventually got to 9.00, crystallization was mostly inhibited by mobile polyacrylic acid carboxylate ions in the solution, and only a few crystals grew on the chitosan film (see Fig. 8 (c))]]. Fig. 6 shows the changes in pH values of various additive systems with crystallization time. The pH values of the system with 6-aminocaproic acid were the same as with- out an additive and with PAA in the first 30 h. After that the pH values fell in between those of the two systems.
3.3. Calcium carbonate crystal habit and morphology
Without modifying the chitosan-film surface, the calcium carbonate crystals appeared as a multi-layer habit precipitat-
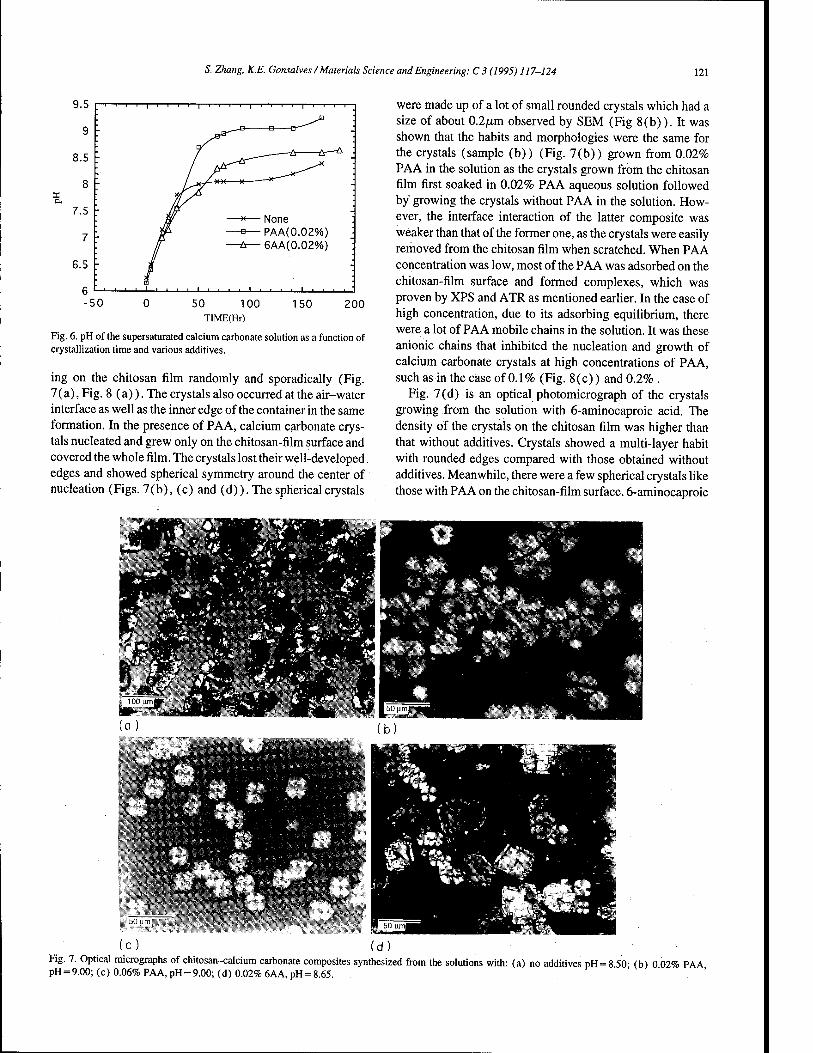
5. Zhang, K.E. Gonsalves /Materials Science and Engineering: C 3 (1995) 117-124 121
9.5
9
8.5
8
7.5
7
6.5
■h är—& '■
None PAA(0.02%) 6AA(0.02%)
■50 50 100 TIME(Hr)
150 200
Fig. 6. pH of the supersaturated calcium carbonate solution as a function of crystallization time and various additives.
ing on the chitosan film randomly and sporadically (Fig. 7(a), Fig. 8 (a)). The crystals also occurred at the air-water interface as well as the inner edge of the container in the same formation. In the presence of PAA, calcium carbonate crys- tals nucleated and grew only on the chitosan-film surface and covered the whole film. The crystals lost their well-developed, edges and showed spherical symmetry around the center of nucleation (Figs. 7(b), (c) and (d)). The spherical crystals
were made up of a lot of small rounded crystals which had a size of about 0.2/xm observed by SEM (Fig 8(b)). It was shown that the habits and morphologies were the same for the crystals (sample (b)) (Fig. 7(b)) grown from 0.02% PAA in the solution as the crystals grown from the chitosan film first soaked in 0.02% PAA aqueous solution followed by growing the crystals without PAA in the solution. How- ever, the interface interaction of the latter composite was weaker than that of the former one, as the crystals were easily removed from the chitosan film when scratched. When PAA concentration was low, most of the PAA was adsorbed on the chitosan-film surface and formed complexes, which was proven by XPS and ATR as mentioned earlier. In the case of high concentration, due to its adsorbing equilibrium, there were a lot of PAA mobile chains in the solution. It was these anionic chains that inhibited the nucleation and growth of calcium carbonate crystals at high concentrations of PAA, such as in the case of 0.1% (Fig. 8(c)) and 0.2% .
Fig. 7(d) is an optical photomicrograph of the crystals growing from the solution with 6-aminocaproic acid. The density of the crystals on the chitosan film was higher than that without additives. Crystals showed a multi-layer habit with rounded edges compared with those obtained without additives. Meanwhile, there were a few spherical crystals like those with PAA on the chitosan-film surface. 6-aminocaproic
■f ^* ™ v. i*. «-TO»»
(c) :d) Fig. 7. Optical micrographs of chitosan-calcium carbonate composites synthesized from the solutions with: (a) no additives pH = 8 50- (b) 0 02% PAA pH = 9.00;(c) 0.06% PAA, pH = 9.00; (d) 0.02% 6AA,pH = 8.65. '

122 5. Zhang, K.E. Gonsalves /Materials Science and Engineering: C 3 (1995) 117-124
Fig. 8. SEM pictures of the crystal surfaces of chitosan-calcium carbonate composites synthesized from solutions with: (a) 0.0% PAA; (b) 0.02% PAA; (c) 0.1% PAA;(d) 0.02% 6AA.
acid reacted with the chitosan-film surface and formed pro- tonated nitrogen which was also proven by XPS (Fig. 2). However, the ratio of protonated nitrogen to amino nitrogen was much lower than that of the system using PAA as an additive. Consequently, a few spherical crystals occurred on the chitosan-film surface. 6-aminocaproic acid was adsorbed on the crystals while crystals grew, resulting in a rounding of the edges of the crystals (Fig. 8(d)).
3.4. The influence of chitosan-film rigidity
Nucleation is dependent not only on the charge of the nucleation surface, but also on its rigidity. Soft chitosan film was made by casting a chitosan aqueous solution onto a PMMA plate, neutralizing it with dilute ammonium hydrox- ide and peeling it off. It was mounted on a glass slide by using double-sided tape. The film swelled in the supersatu- rated solution. A rigid chitosan film was obtained by casting the chitosan-acetic acid aqueous solution on a glass slide by spin coating. The film was not swollen in the solution. The optical photomicrographs of uniform thin ceramic films coated on rigid chitosan films are shown in Figs. 9(a) and (b). The cross-section of the composite synthesized from the solution with 0.02% PAA is shown in Fig. 9(e). In compar- ison, the OM picture of crystals on soft chitosan film is shown
in Fig. 9(c) and the corresponding cross-section is shown in Fig. 9(f). Calcium carbonate nucleated and grew uniformly on the rigid chitosanLfilm surface. The concentration of PAA in the solution did not have much effect on the crystal habit and morphology; however, the oriented crystals (Fig. 9(d) occurred on the top of the uniform spherical crystals in the case with 0.0025% (w/w) PAA. In this case the crystals grown on the top of the uniform layer were not influenced by PAA at all. The ceramic film was very thin as a result of the transparent composite.
3.5. The X-ray diffraction patterns of calcium carbonate
The crystallographic orientation can be estimated by atomic matching at the interface of the organic matrix and inorganic minerals. In the absence of poly aery lie acid only calcite appears in the XRD pattern (Fig. 10(a)). However, in the presence of polyacrylic acid, the XRD pattern shows that a mixture of calcite and vaterite was formed (Fig. 10(b)). Positively charged protonated nitrogen and nega- tively charged carboxylate ions were obtained by modifying the chitosan-film surface with PAA. They induced nuclei of vaterite and calcite, respectively (see Fig. 12). The high and sharp peak at 20= 37.6° and small peak at 20= 28.8° repre-
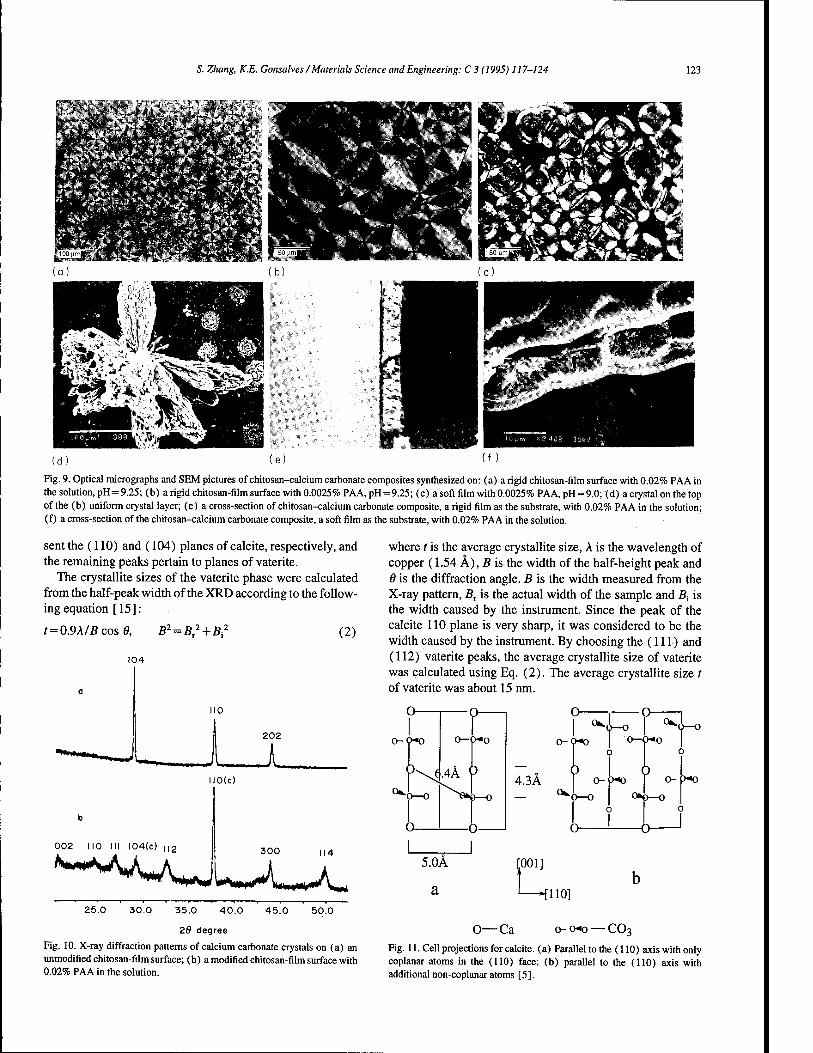
S. Zhang, K.E. Gonsalves / Materials Science and Engineering: C 3 (1995) 117-124 123
Fig. 9. Optical micrographs and SEM pictures of chitosan-calcium carbonate composites synthesized on: (a) a rigid chitosan-film surface with 0.02% PAA in the solution, pH = 9.25; (b) a rigid chitosan-film surface with 0.0025% PAA, pH = 9.25; (c) a soft film with 0.0025% PAA, pH = 9.0; (d) a crystal on the top of the (b) uniform crystal layer; (e) a cross-section of chitosan-calcium carbonate composite, a rigid film as the substrate, with 0.02% PAA in the solution; (f) a cross-section of the chitosan-calcium carbonate composite, a soft film as the substrate, with 0.02% PAA in the solution.
sent the (110) and (104) planes of calcite, respectively, and the remaining peaks pertain to planes of vaterite.
The crystallite sizes of the vaterite phase were calculated from the half-peak width of the XRD according to the follow- ing equation [15]:
t=0.9X1 Bcos 6, B2 = Br2 + B2
(2)
104
where t is the average crystallite size, A is the wavelength of copper (1.54 Ä), B is the width of the half-height peak and 6 is the diffraction angle. B is the width measured from the X-ray pattern, Br is the actual width of the sample and ßj is the width caused by the instrument. Since the peak of the calcite 110 plane is very sharp, it was considered to be the width caused by the instrument. By choosing the (111) and (112) vaterite peaks, the average crystallite size of vaterite was calculated using Eq. (2). The average crystallite size t of vaterite was about 15 nm.
110(c)
002 110 III 104(c) ||2 300 114
•-W»*AMW**«»A^
o 1 O 1
0*0 I °—9*o |
OKI 0—0
O
xo 0
o-
c*o—o
xo
001]
25.0 30.0 35.0 40.0 45.0 50.0
28 degree
Fig. 10. X-ray diffraction patterns of calcium carbonate crystals on (a) an unmodified chitosan-film surface; (b) a modified chitosan-film surface with 0.02% PAA in the solution.
O—Ca
-fHO]
o- o*o — C03
Fig. 11. Cell projections for calcite. (a) Parallel to the (110) axis with only coplanar atoms in the (110) face; (b) parallel to the (110) axis with additional non-coplanar atoms [5].

124 S. Zhang, K.E. Gonsalves /Materials Science and Engineering: C 3 (1995) 117-124
5.03A
2xl.54cos(70.5/2)
Fig. 12. Schematic of the conformation of polyacrylic acid on the chitosan- film surface, zig-zag conformation.
In the presence of polyacrylic acid, the XRD pattern showed a high and sharp peak at 26=37.6° corresponding to the 110 plane of calcite. This indicated that calcite crystals were preferentially oriented with the 110 plane parallel to the chitosan film. The Ca-Ca distance of calcite is about 5.0 A on the (110) plane (Fig. 11) [ 5 ]. In a zig-zag conformation, the distance between the two carboxylate ions in polyacrylic acid is 5.03 Ä (Fig. 12), which matches the lattice of the (110) plane of calcite. Thus, Ca-binding to negatively charged carboxylate ions in polyacrylic acid results in the nucleation of the (110) plane of calcite.
4. Conclusions
Polyacrylic acid is an effective additive to promote calcium carbonate nucleation and growth on the chitosan-film surface. Introducing polyacrylic acid into the system for the biomi- metic growth of calcium carbonate crystals on a chitosan-
film surface results in creating protonated nitrogen and carboxylate anions on the chitosan-film surface. Nucleation is initiated from these charges. At low concentrations of poly- acrylic acid, nucleation and crystallization occurred and crys- tals covered the whole film with a spherical morphology. At higher concentration, such as 0.1 %, even though nucleation did occur, crystallization was inhibited by the mobile carbox- ylate anions of polyacrylic acid in the solution. The rigid chitosan film favored the uniform nucleation and growth of the calcium carbonate crystals.
References
[ 1 ] M. Sarikaya and I.A. Aksay, Chapter 1 in Structure Cellular Synthesis and Assembly of Biopolymers, vol. 19.
[2] S.Weiner.L. Addadi, Calcif. Tissue Int., 29 (1979) 163; Nature, 331 (1988) 546; Trends Biochem. Sei., 16 (1988) 252; Phil. Trans. R. Soc.Lond.B 304 (1984) 425.
[3] P. Calvert, Mater. Sei. Eng., Cl (1994) 69. [4] B.J. Brisdon, B.R. Heywood, A.G. W. Hodson, S. Mann and K.W.
Wong, Adv. Mater., 5 (1993) 49. [5] S. Mann, Chem. Mater., 6 (1994) 311; J. Chem. Soc. Faraday, 86
(1990) 1873; Nature, 334 (1988) 692. [6] P.C. Rieke, B.J. Tarasevich, S.B. Bentjen, G.E. Fryxell and A.A.
Campbell, ACS Symp. Sen, 499 (1992) 1; Mater. Res. Soc. Symp. Proc, 174 (1990) 51; Chem. Mater., 5 (1993) 43.
[7] B.C. Bunker and P.C. Rieke, Science, 264 (1994) 48. [8] S.I.Stupp.J. Biomed. Mater. Res., 26(1992) 169; 27 (1993) 301; 27
(1993)289. [9] P.R. Austin and D. Wilmington, US Pat. 4, 309, 534 (1982).
[10] CD. Wagner, Handbook of X-ray Photoelectron Spectroscopy, Perkin-Elmer, 1979.
[11] J.D. Andrade, Chapter 5 in Surface and Interfacial Aspects of Biomedical Polymers, 1985, p. 1.
[12] D.T. Clark, Chapter 6 in D.T. Clark and W.J. Feast (eds.), Polymer Surfaces, Wiley, New York, 1978.
[13] F.G. Pearson,/. Polym. Sei., 43 (1960) 101. [14] S. Chibowski, 7. Colloid Interface Sei., 140(1990) 444. [15] B.D. Cullity, Elements of X-ray Diffraction, Addison-Wesley,
Reading, MA, 1956. [16] Y. Kitano, Bull. Chem. Soc. Jpn, 12 (1962) 1980.

Ällllllil
SBK/T 3" o'** -17 d«
MATERIALS SCIENCE &
ENGINEERING
ELSEVIER Materials Science and Engineering: C 3 (1995) 125-130
Biomimicry of bamboo bast fiber with engineering composite materials
S.H. Li a-b-*, Q.Y. Zengc, Y.L. Xiao a, S.Y. Fu a-b, B.L. Zhou ab
' International Center for Materials Physics, Academia Sinica, 72 Wenhua Road, Shenyang 110015, People's Republic of China b Institute of Metal Research, Academia Sinica, 72 Wenhua Road, Shenyang 110015, People's Republic of China c Institute of Applied Ecology, Academia Sinica, 72 Wenhua Road, Shenyang 110015, People's Republic of China
Abstract
Bamboo, one of the strongest natural structural composite materials, has many distinguishing features. It has been found that its reinforcement unit, hollow, multilayered and spirally-wound bast fiber, plays an extremely important role in its mechanical behavior. In the present work, on the basis of the study on bamboo bast fiber and wood tracheid; a biomimetic model of the reinforcing element, composed of two layers of helically wound fiber, was suggested. To detect the structural characteristics of such a microstructure, four types of macro fiber specimens made of engineering composites were employed: axially aligned solid and hollow cylinders, and single- and double-helical hollow cylinders. These specimens were subjected to several possible loadings, and the experimental results reveal that only the double-helical structural unit possesses the optimum comprehensive mechanical properties. An interlaminar transition zone model imitating bamboo bast fiber was proposed and was verified by engineering composite materials. In our work, the transition zone can increase the interlaminar shear strength of the composite materials by about 15%. These biomimetic structural models can be applied in the design and manufacture of engineering composite materials.
Keywords: Bamboo; Bast fiber; Biomimetics; Engineering composites
1. Introduction
Mankind has long had the idea that we should learn from nature. There are innumerable biological materials in nature that exhibit distinguishing performance. All biological mate- rials are, without exception, composites. With the rapid devel- opment of engineering composite materials in recent years, various problems were encountered in both the design and fabrication process. To solve these newly emerging problems, many measures were attempted. Among them, one interesting method became increasingly attractive; this new interdisci- plinary subject is called biomimetics [1,2], the purpose of which is to advance man-made composite materials through guidance from nature. In the former biomimetic study, wood as the most common natural composite, was noticed as early as 1980. Gordon and Jeronimidis extensively studied the tra- cheid of timber, and successfully applied the energy absorp- tion mechanism of wood cells under tension in engineering composite materials to increase the work of fracture [ 3]. The thorough understanding of the interplay between the mor- phology and structural performance of different types of wood led to a remarkable development of a patented new material [4].
! Corresponding author.
Bamboo is another kind of common natural structural com- posite. It is a widespread plant family found in all continents. Apart from being a basic material in the construction and paper industries, bamboo is a more typical long-fiber rein- forced composite than wood. Thus, some biomimetic studies on bamboo have been carried out in recent years by Li et al. [5]. Earlier works were primarily focused on the macro and meso scales. From the results of the present work, it was found that on a micro scale, bamboo has some unique features which are essentially important for the high performance of bamboo.
2. Comparison of wood and bamboo
Wood is a natural composite that exhibits a remarkable combination of strength, stiffness and toughness. Detailed studies have established that the unique hierarchical architec- ture with which the constituents of wood are arranged is the basis for achieving excellent properties. Besides wood, bam- boo has a gradient structure and excellent specific properties which are even comparable with ARALL® [ 5 ]. The chemical composition of wood and bamboo [6] are listed in Table 1.
From Table 1 it can be seen that bamboo and wood have very similar chemical components, but their mechanical
0928-4931/95/S09.50 © 1995 Elsevier Science S.A. All rights reserved 550/0928-4931(95)00115-8
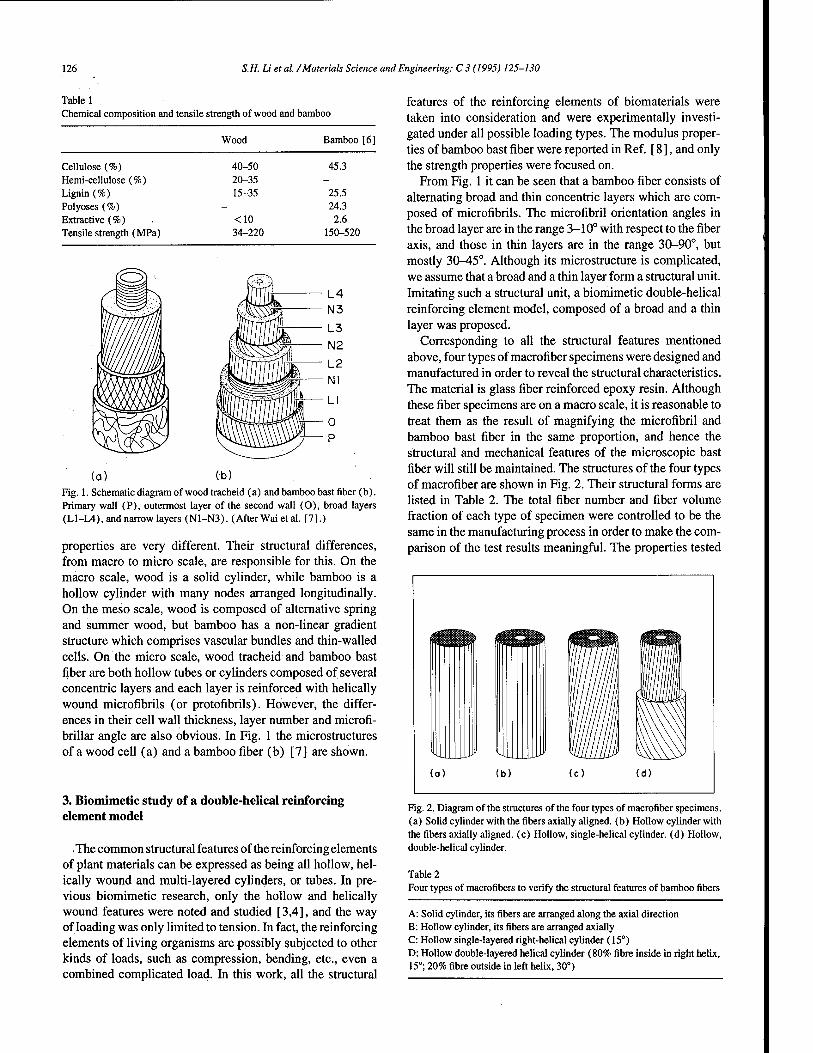
126 S.H. Li et al. /Materials Science and Engineering: C 3 (1995) 125-130
Table 1 Chemical composition and tensile strength of wood and bamboo
Wood Bamboo [6]
Cellulose (%) Hemi-cellulose (%) Lignin (%) Polyoses (%) Extractive (%) Tensile strength (MPa)
40-50 20-35 15-35
<10 34-220
45.3
25.5 24.3
2.6 150-520
(a) (b)
Fig. 1. Schematic diagram of wood tracheid (a) and bamboo bast fiber (b). Primary wall (P), outermost layer of the second wall (O), broad layers (L1-L4), and narrow layers (N1-N3). (After Wai et al. [7].)
properties are very different. Their structural differences, from macro to micro scale, are responsible for this. On the macro scale, wood is a solid cylinder, while bamboo is a hollow cylinder with many nodes arranged longitudinally. On the meso scale, wood is composed of alternative spring and summer wood, but bamboo has a non-linear gradient structure which comprises vascular bundles and thin-walled cells. On the micro scale, wood tracheid and bamboo bast fiber are both hollow tubes or cylinders composed of several concentric layers and each layer is reinforced with helically wound microfibrils (or protofibrils). However, the differ- ences in their cell wall thickness, layer number and microfi- brillar angle are also obvious. In Fig. 1 the microstructures of a wood cell (a) and a bamboo fiber (b) [7] are shown.
3. Biomimetic study of a double-helical reinforcing element model
. The common structural features of the reinforcing elements of plant materials can be expressed as being all hollow, hel- ically wound and multi-layered cylinders, or tubes. In pre- vious biomimetic research, only the hollow and helically wound features were noted and studied [3,4], and the way of loading was only limited to tension. In fact, the reinforcing elements of living organisms are possibly subjected to other kinds of loads, such as compression, bending, etc., even a combined complicated load. In this work, all the structural
features of the reinforcing elements of biomaterials were taken into consideration and were experimentally investi- gated under all possible loading types. The modulus proper- ties of bamboo bast fiber were reported in Ref. [ 8 ], and only the strength properties were focused on.
From Fig. 1 it can be seen that a bamboo fiber consists of alternating broad and thin concentric layers which are com- posed of microfibrils. The microfibril orientation angles in the broad layer are in the range 3-10° with respect to the fiber axis, and those in thin layers are in the range 30-90°, but mostly 30-45°. Although its microstructure is complicated, we assume that a broad and a thin layer form a structural unit. Imitating such a structural unit, a biomimetic double-helical reinforcing element model, composed of a broad and a thin layer was proposed.
Corresponding to all the structural features mentioned above, four types of macrofiber specimens were designed and manufactured in order to reveal the structural characteristics. The material is glass fiber reinforced epoxy resin. Although these fiber specimens are on a macro scale, it is reasonable to treat them as the result of magnifying the microfibril and bamboo bast fiber in the same proportion, and hence the structural and mechanical features of the microscopic bast fiber will still be maintained. The structures of the four types of macrofiber are shown in Fig. 2. Their structural forms are listed in Table 2. The total fiber number and fiber volume fraction of each type of specimen were controlled to be the same in the manufacturing process in order to make the com- parison of the test results meaningful. The properties tested
Fig. 2. Diagram of the structures of the four types of macrofiber specimens, (a) Solid cylinder with the fibers axially aligned, (b) Hollow cylinder with the fibers axially aligned, (c) Hollow, single-helical cylinder, (d) Hollow, double-helical cylinder.
Table 2 Four types of macrofibers to verify the structural features of bamboo fibers
A: Solid cylinder, its fibers are arranged along the axial direction B: Hollow cylinder, its fibers are arranged axially C: Hollow single-layered right-helical cylinder (15°) D: Hollow double-layered helical cylinder (80% fibre inside in right helix, 15°; 20% fibre outside in left helix, 30°)

S.H. Li et al. /Materials Science and Engineering: C 3 (1995) 125-130 127
Table 3 The properties tested and geometric size of the specimen (D and d are the outer and inner diameters of the macro fiber specimen, respectively)
Properties tested Specimen length Specimen diameter (mm) (mm)
Compressive buckling strength 300 A:D=13.8 Three-point bending 230 (span = 190) B,C&D:D = = 14.7;d = 5
Compressive strength 30 Post-buckling compressive strength 20
Tensile modulus and strength 210 A:D = 7.5 Gauge length =80 B,C&D:D = = 8;rf=2.8
Table 4 A summary of the experimental results on the six mechanical properties of the four types of structures (the data in parentheses are standard deviations)
No. of A B C D
samples
3 Compressive buckling strength (MPa)
vf= = 40% 49.4 (5.1)
- 38.9 (7.4)
49.4 (4.7)
vf= = 50% 63.9 (6.8)
89.5 (14.1)
53.1 (8.3)
82.5 (5.9)
12 Compressive strength (MPa)
vf= = 40% 138.1 (8.4)
- 128.5 (7.3)
141.2 (5.9)
vt- = 50% 201.1 (20.4)
262.1 (29.9)
199.3 (24.1)
208.1 (18.9)
5 Apparent flexural strength 251.7 262.2 253.0 253.9 (MPa) (14.2) (21.8) (19.2) (16,1)
3 Post-buckling compressive 207.5 213.0 180.6 176.8 strength (MPa) (32.2) (29.1) (33.4) (17.4)
3 Tensile modulus (GPa) 25.6 (2.2)
- 22.1
.' (1-8)
22.1 (1.4)
8 Tensile strength (MPa) 410.7 (24.6)
— 373.9 (16.2)
401.3 (21.2)
and the geometric size of the specimens are listed in Table 3. The mechanical properties tested and the experimental results are summarized in Table 4.
Natural bamboo bast fiber is so slender that its diameter ranges between 20 fjum and 45 fim and its length is 1000- 2000 jum. For a single fiber, the stability of such a structure with a high length to diameter ratio cannot be overlooked. Thus the axial compressive buckling test was performed to compare the structural stability of the four types of specimens. The testing speed was 2 mm min"1 and the test was per- formed at room temperature. From the experimental data listed in Table 4, it can be seen that the D-type specimen is more stable than the C-type specimen but less than the B- type, and shows no inferiority to the A-type specimen. That is to say, double-helical structures will be more stable than single-helical ones, although only a thin layer of left-helical fibers was wound outside. The inversely wound helical fiber layers restrained each other when the specimen was com- pressed. During the test for axial compressive buckling, an interesting phenomenon was observed. Of the four types of specimens, only on the surface of the D-type specimen was obvious damage found after buckling. This can be explained as follows. When buckling occurs, the specimen will bend in
the central part and hence relative displacement occurs between two oppositely arranged helical layers and the out- side thin layer is more easily damaged. To determine the extent of the damage caused by buckling, the post-buckling compressive strength was tested and the results are also listed in Table 4. From these data it is evident that buckling causes more damage to double-helical structures than the other three types of structure. This is also the reason why D-type struct tures can improve the structural stability. - ■ i
For the bending test, owing to the anisotropy and thick wall of the four types of specimens, the precise calculation of the maximum normal stress according to classical com- posites theory is very complicated. Here the geometric sizes, fiber volume fraction and total number of fibers were con- trolled as seriously as possible in the manufacturing process of the specimens so that a comparison of the maximum bend- ing load is meaningful. Furthermore, for the A-type specie men, its fibers were arranged along the axial-direction, and the deviation angle of the C-type specimen was 15°. For the D-type specimen, there are only 20% of fibers whose helical angle is 30°, thus the relative anisotropy is not very strong. If the anisotropy of the specimen was not taken into account, the maximum normal stress, calculated according to the

128 S.H. Li et al. /Materials Science and Engineering: C 3 (1995) 125-130
(0 e
Displacement (mm) Fig. 3. Typical curve of the D-type specimen under compressive load.
mechanics of the materials, can give a rough comparison of the maximum normal stress. This can be called the 'apparent flexural strength', a parameter of the relative capacity to bear a bending load. From the calculated results listed in Table 4, it can be seen that the D-type specimens show no inferiority to the other types of structure in bearing the bending load.
For the compressive test, the load-displacement curve of the D-type specimen is much different from those of the others. Its typical curve is shown in Fig. 3. If only from the viewpoint of compressive strength, the D-type structure is closer to the A type, but is better than the C-type structure. However, if the pseudo-plastic phenomenon which occurred in the D-type specimen is considered, the structural advantage of the D-type specimen is evident. The displacement of the D-type structure is increased as much as twice, but its strength is maintained at a level of 85% of the maximum compressive strength. In other words, at the expense of 15% strength loss, the plasticity of the double-helical structure is increased by 200%.
The tensile property is always very important for any struc- ture. To compare the tensile behavior of the spiral and non- spiral structures, three types of tensile specimens were made and tested. Since the tensile load is very high and the pressure stress of the tabbed region is of considerable value, to prevent a collapse occurring in the end part under the pressure of jigs, the tabbed region was filled inside with iron wire and was reinforced outside with glass fiber and epoxy resin. The test- ing speed for the tensile modulus is 2 mm min-' and 5 mm min~' for the tensile strength. The results of the apparent tensile modulus and the tensile strength of the three types of specimen are listed in Table 4. For the tensile property, according to the classical theory of fibrous composite mate- rials, there is no difference between structures A and B.
For the spirally wound tube under tension load, an inter- esting phenomenon of tension buckling was observed by Page et al. when they studied wood tracheid in 1971 [9]. Although not all the fibers in a given cross-section of wood actually buckle in this manner when wood fractures, a considerable
Displacement (mm) Fig. 4. Load-displacement curve of the type-C specimen under tension.
number of them, perhaps about 10%, do. This phenomenon was then applied in engineering composite materials and the work of fracture was increased successfully at the expense of a moderate loss of stiffness and axial strength [3].
In our tension experiment, the so-called pseudo-plasticity existed only in the C-type specimen, as shown in Fig. 4, although not as obvious as reported in Ref. [3] for the long spirally wound tube. The fiber fully aligned A-type specimens fracture abruptly after the maximum load. This can be explained as follows. According to the buckling theory of composite materials, the critical buckling stress is a function of the principal elastic constants of the tube, the angle of the spiral winding, and tube thickness [ 10]. Compared with the specimen in Ref. [ 3 ], the specimens in our work have thicker tube walls. For the D-type specimen, the double-helical ele- ment, the two inversely wound fiber layers restrain each other and thus reduce the possibility of buckling. In other words, the structural stability is increased. However, compared with the plain A-type specimen, the double-helical structure improves the plasticity to some extent.
What was analyzed above is for a single fiber cylinder. However, compared with the A-type structure, which can be thought of as a model of a bundle of fibers in laminates, the D-type structures have other advantages when they are used in bundle form. The firm attachment of a fiber cylinder to other adjacent ones can effectively prevent them from twist- ing. Hence, there exists a restraint against any shear strain which might otherwise result from the application of a normal stress along the fiber cylinder axis. More specifically, the restraint arises because, in the double cylinder wall of two adjacent cylinders, the same helical sense of equivalent layers in both cylinders will mean opposite signs of the helical angle in the two layers. The shear strains of the separate equivalent layers would thus also be of opposite sign, but since the layers are connected and two cylinder walls must deform as a unit, the shear strain is effectively restrained.
On the basis of above experimental data and analysis, a useful conclusion can be drawn: a double-helical fiber struc-
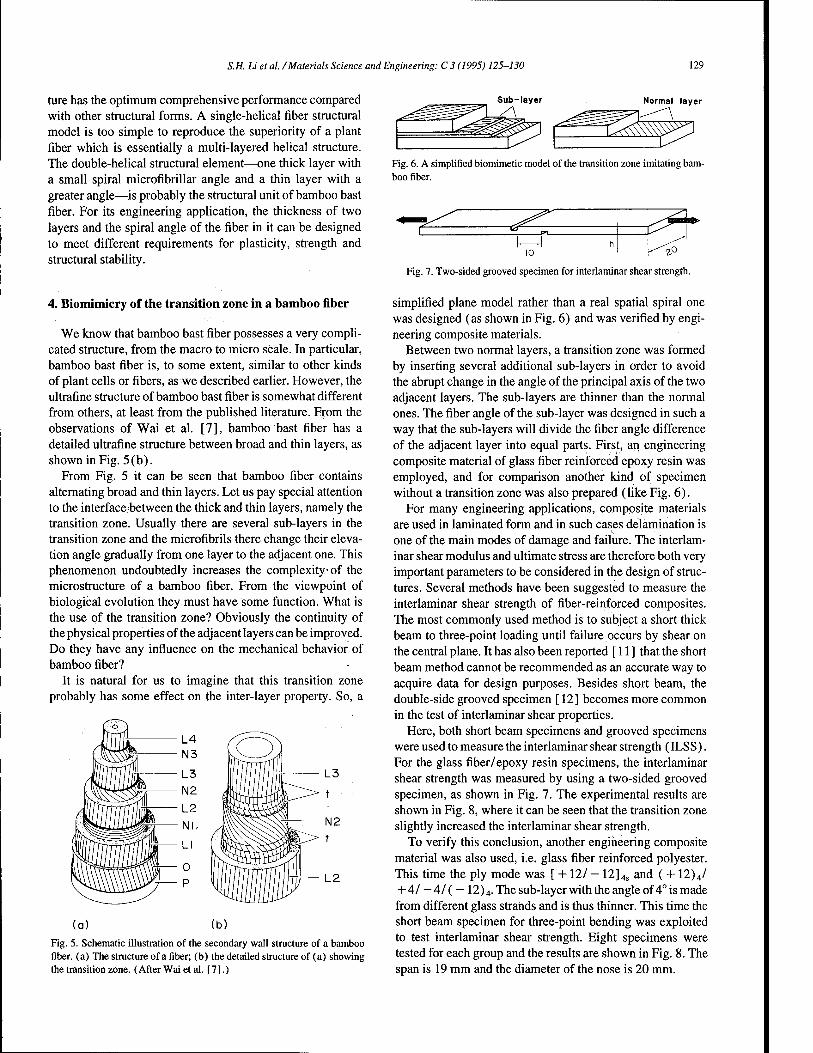
S.H. Li et al. /Materials Science and Engineering: C 3 (1995) 125-130 129
ture has the optimum comprehensive performance compared with other structural forms. A single-helical fiber structural model is too simple to reproduce the superiority of a plant fiber which is essentially a multi-layered helical structure. The double-helical structural element—one thick layer with a small spiral microfibrillar angle and a thin layer with a greater angle—is probably the structural unit of bamboo bast fiber. For its engineering application, the thickness of two layers and the spiral angle of the fiber in it can be designed to meet different requirements for plasticity, strength and structural stability.
Normal layer
Fig. 6. A simplified biomimetic model of the transition zone imitating bam- boo fiber.
Z 10 ' V 1?
Fig. 7. Two-sided grooved specimen for interlaminar shear strength.
4. Biomimicry of the transition zone in a bamboo fiber
We know that bamboo bast fiber possesses a very compli- cated structure, from the macro to micro scale. In particular, bamboo bast fiber is, to some extent, similar to other kinds of plant cells or fibers, as we described earlier. However, the ultrafine structure of bamboo bast fiber is somewhat different from others, at least from the published literature. From the observations of Wai et al. [7], bamboo bast fiber has a detailed ultrafine structure between broad and thin layers, as shown in Fig. 5(b).
From Fig. 5 it can be seen that bamboo fiber contains alternating broad and thin layers. Let us pay special attention to the interface between the thick and thin layers, namely the transition zone. Usually there are several sub-layers in the transition zone and the microfibrils there change their eleva- tion angle gradually from one layer to the adjacent one. This phenomenon undoubtedly increases the complexity of the microstructure of a bamboo fiber. From the viewpoint of biological evolution they must have some function. What is the use of the transition zone? Obviously the continuity of the physical properties of the adjacent layers can be improved. Do they have any influence on the mechanical behavior of bamboo fiber?
It is natural for us to imagine that this transition zone probably has some effect on the inter-layer property. So, a
(a) (b)
Fig. 5. Schematic illustration of the secondary wall structure of a bamboo fiber, (a) The structure of a fiber; (b) the detailed structure of (a) showing the transition zone. (After Wai et al. [7].)
simplified plane model rather than a real spatial spiral one was designed (as shown in Fig. 6) and was verified by engi- neering composite materials.
Between two normal layers, a transition zone was formed by inserting several additional sub-layers in order to avoid the abrupt change in the angle of the principal axis of the two adjacent layers. The sub-layers are thinner than the normal ones. The fiber angle of the sub-layer was designed in such a way that the sub-layers will divide the fiber angle difference of the adjacent layer into equal parts. First, an engineering composite material of glass fiber reinforced epoxy resin was employed, and for comparison another kind of specimen without a transition zone was also prepared (like Fig. 6).
For many engineering applications, composite materials are used in laminated form and in such cases delamination is one of the main modes of damage and failure. The interlam- inar shear modulus and ultimate stress are therefore both very important parameters to be considered in the design of struc- tures. Several methods have been suggested to measure the interlaminar shear strength of fiber-reinforced composites. The most commonly used method is to subject a short thick beam to three-point loading until failure occurs by shear on the central plane. It has also been reported [11] that the short beam method cannot be recommended as an accurate way to acquire data for design purposes. Besides short beam, the double-side grooved specimen [12] becomes more common in the test of interlaminar shear properties.
Here, both short beam specimens and grooved specimens were used to measure the interlaminar shear strength (ILSS). For the glass fiber/epoxy resin specimens, the interlaminar shear strength was measured by using a two-sided grooved specimen, as shown in Fig. 7. The experimental results are shown in Fig. 8, where it can be seen that the transition zone slightly increased the interlaminar shear strength.
To verify this conclusion, another engineering composite material was also used, i.e. glass fiber reinforced polyester. This time the ply mode was [ +12/ - 12]4s and ( +12)4/ + 4/ — 4/( — 12) 4. The sub-layer with the angle of 4° is made from different glass strands and is thus thinner. This time the short beam specimen for three-point bending was exploited to test interlaminar shear strength. Eight specimens were tested for each group and the results are shown in Fig. 8. The span is 19 mm and the diameter of the nose is 20 mm.
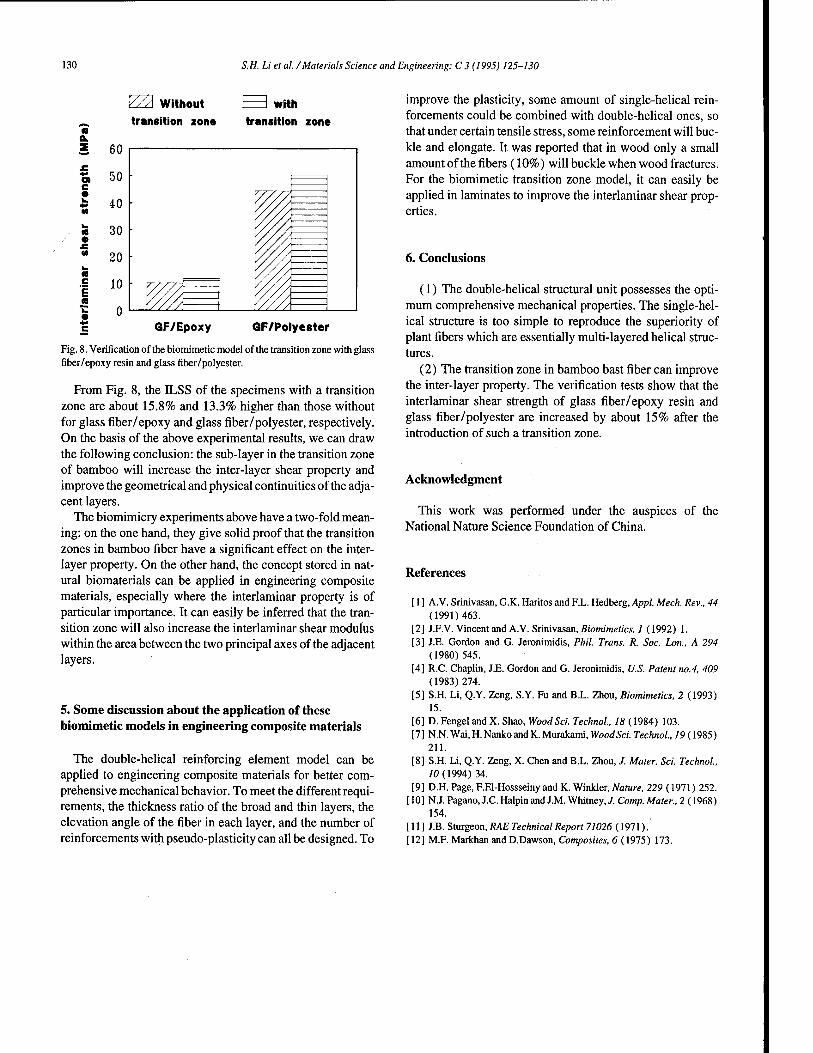
130 S.H. Li et al. /Materials Science and Engineering: C 3 (1995) 125-130
a 60
50
40
30
20
10
0
Y./A Without transition zone
1 1 with transition zone
JE
at e • w
yy
L. ** CO
.
■C CIS
. m
I N eg
it C GF/E poxy GF/Polyester
Fig. 8. Verification of the biomimetic model of the transition zone with glass fiber/epoxy resin and glass fiber/polyester.
From Fig. 8, the ILSS of the specimens with a transition zone are about 15.8% and 13.3% higher than those without for glass fiber/epoxy and glass fiber/polyester, respectively. On the basis of the above experimental results, we can draw the following conclusion: the sub-layer in the transition zone of bamboo will increase the inter-layer shear property and improve the geometrical and physical continuities of the adja- cent layers.
The biomimicry experiments above have a two-fold mean- ing: on the one hand, they give solid proof that the transition zones in bamboo fiber have a significant effect on the inter- layer property. On the other hand, the concept stored in nat- ural biomaterials can be applied in engineering composite materials, especially where the interlaminar property is of particular importance. It can easily be inferred that the tran- sition zone will also increase the interlaminar shear modulus within the area between the two principal axes of the adjacent layers.
5. Some discussion about the application of these biomimetic models in engineering composite materials
The double-helical reinforcing element model can be applied to engineering composite materials for better com- prehensive mechanical behavior. To meet the different requi- rements, the thickness ratio of the broad and thin layers, the elevation angle of the fiber in each layer, and the number of reinforcements with pseudo-plasticity can all be designed. To
improve the plasticity, some amount of single-helical rein- forcements could be combined with double-helical ones, so that under certain tensile stress, some reinforcement will buc- kle and elongate. It was reported that in wood only a small amount of the fibers (10%) will buckle when wood fractures. For the biomimetic transition zone model, it can easily be applied in laminates to improve the interlaminar shear prop- erties.
6. Conclusions
(1) The double-helical structural unit possesses the opti- mum comprehensive mechanical properties. The single-hel- ical structure is too simple to reproduce the superiority of plant fibers which are essentially multi-layered helical struc- tures.
(2) The transition zone in bamboo bast fiber can improve the inter-layer property. The verification tests show that the interlaminar shear strength of glass fiber/epoxy resin and glass fiber/polyester are increased by about 15% after the introduction of such a transition zone.
Acknowledgment
This work was performed under the auspices of the National Nature Science Foundation of China.
References
[ 1 ] A.V. Srinivasan, G.K. Haritos and F.L. Hedberg, Appl. Mech. Rev., 44 (1991)463.
[2] J.F.V. Vincent and A.V. Srinivasan, Biomimetics, 1 (1992) 1. [3] J.E. Gordon and G. Jeronimidis, Phil. Trans. R. Soc. Lon., A 294
(1980)545. [4] R.C. Chaplin, J.E. Gordon and G. Jeronimidis, U.S. Patent no.4, 409
(1983)274. [5] S.H. Li, Q.Y. Zeng, S.Y. Fu and B.L. Zhou, Biomimetics, 2 (1993)
15. [6] D. Fengel and X. Shao, Wood Sei. Technol, 18 (1984) 103. [7] N.N. Wai,H. Nankoand K. Murakami, WoodSci. Technol., 19 (1985)
211. [8] S.H. Li, Q.Y. Zeng, X. Chen and B.L. Zhou, / Mater. Sei. Technol.,
70(1994)34. [9] D.H. Page, F.El-Hossseiny and K. Winkler, Nature, 229 (1971) 252.
[ 10] N.J. Pagano, J.C. Halpin and J.M. Whitney,/ Comp. Mater., 2 (1968) 154.
[ 11 ] J.B. Sturgeon, RAE Technical Report 71026 (1971). [12] M.F. Markhan and D.Dawson, Composi tes, 6(1975) 173.
MATERIALS SCIENCE &
ENGINEERING
ELSEVIER Materials Science and Engineering: C 3 (1995) 131-135
Preparation of fibrin glue: the effects of calcium chloride and sodium chloride
Ming-Che Wang, George D. Pins, Frederick H. Silver * Department of Pathology, UMDNJ-Robert Wood Johnson Medical School, 675 Hoes Lane, Piscataway, NJ 08854, USA
Abstract
Concentrated fibrinogen is prepared from whole blood by cryoprecipitation and is then combined with a thrombin solution to make fibrin glue. Fibrin glue has been widely employed in many phases of surgery to control bleeding and to seal tissue defects. The purpose of this research was to study the effect of ionic strength of thrombin solutions on the properties of fibrin glue.
Fresh bovine plasma was frozen at -15 °C for 24 h to prepare concentrated fibrinogen. The thrombin solution was prepared by reconstituting topical bovine thrombin with calcium chloride solutions to give a final concentration of 10,20,40, or 80 mM calcium chloride, with or without 0.9% w/v sodium chloride solution. The clotting time was measured by using a fibrometer and the bonding strength of fibrin glue was determined by measuring the force required to shear apart two collagen films joined by fibrin glue.
The results showed that faster gelation was obtained when 20-40 mM calcium chloride was used. In contrast, the addition of physiologic saline (0.9% w/v sodium chloride), slowed down the gelation of all samples. It is concluded that high bonding strength and rapid formation of fibrin glue can be obtained using 10 units ml-' thrombin reconstituted with 20 mM calcium chloride solution, in the absence of sodium chloride.
Keywords: Fibrinogen; Fibrin glue; Cryoprecipitation
1. Introduction
Fibrin glue, a biological tissue glue derived from blood, is an effective hemostatic agent and sealant for tissue defects, and has been widely employed in many phases of surgery [ 1 ]. After application, fibrin glue is slowly reabsorbed over a period of days to weeks by fibrinolysis. The major com- ponent of fibrin glue is fibrinogen, which is a soluble protein present in blood and composes about 0.2% by volume of whole blood. The normal level of fibrinogen in blood plasma ranges from 2 to 4 mg ml-1 [2]. The major function of fibrinogen is to form a clot to stop bleeding. In the presence of thrombin and calcium ions, fibrinogen molecules are pro- teolytically cleaved and converted to fibrin monomers. Fibrin monomers assemble into fibrils and then fibers to form a three-dimensional, insoluble fibrin network, a fibrin clot, in the presence of calcium ions and Factor XHIa. A fibrin clot is the final product of the normal coagulation cascade [3]. The fibrin glue system mimics this coagulation process and
* Correspondence to: F.H. Silver, Biomaterials, V-14, UMDNJ-Robert Wood Johnson Medical School, 675 Hoes Lane, Piscataway, NJ 08854, USA.
is usually composed of two major components, a fibrinogen solution and a thrombin solution.
Autologous blood, single donor blood, or pooled homol- ogous blood are commonly used to prepare concentrated fibrinogen solutions. Citrated blood is first centrifuged to remove the cells and then the plasma is treated with either physical or chemical precipitation methods to produce a con- centrated fibrinogen solution [4]. Commercially available bovine thrombin is usually used as the second component. These two solutions are simultaneously ejected from syringes and mixed at the desired application site to form a gel.
There are several factors that affect the properties of fibrin glue: the precipitation method [5], the thrombin concentra- tion [ 5 ], and the ionic strength of the fibrinogen and thrombin solutions [5]. Cryoprecipitation is considered to be the stan- dard method for preparing fibrinogen; however, one freeze- thaw cycle can take more than 24 h. Chemical precipitation is considered a faster and easier way to prepare fibrinogen. The use of chemicals, such as ammonium sulfate, ethanol, and poly(ethylene glycol), have been reported [6-10].
In our laboratory, we have compared cryoprecipitation (cryo) to precipitation of fibrinogen using ammonium sulfate (AS), ethanol, and poly(ethylene glycol) (PEG) in terms of their fibrinogen yields, total protein yields, clotting time,
0928-4931/95/$09.50 © 1995 Elsevier Science S.A. All rights reserved S5D/0928-4931(95)00116-6

132 Ming-Che Wang et al. /Materials Science and Engineering: C 3 (1995) 131-135
and bonding strength [4]. The results suggest that AS pre- cipitation is as effective as cryo in forming concentrated fibrinogen solutions and fibrin glue, and more effective than ethanol and PEG precipitation.
Commercial bovine thrombin is usually supplied as freeze- dried powder in a sterilized container and must be reconsti- tuted to the desired concentration before use. Thrombin is commonly reconstituted using either sterile water, calcium chloride solution, or isotonic saline; however, the effects of these ions added to the fibrin glue system are not clear. The purpose of this research is to study the effects of calcium chloride and sodium chloride on the gelation time and bond- ing strength of fibrin glue. The results of this study showed that high bonding strength and rapid formation of fibrin glue can be obtained using 10 units ml-1 thrombin reconstituted with 20 mM calcium chloride solution, in the absence of sodium chloride.
2. Materials and methods
2.1. Isolation of fibrinogen
Fresh bovine blood, obtained at slaughter, was collected in a container containing sodium citrate buffer (10% w/v, pH 7.4) to give a final concentration of 1% w/v. The blood was centrifuged at 600g for 20 min, and then the plasma was carefully pipetted out. 10 ml of plasma was transferred to each of eight plastic tubes, frozen at - 15 °C for 24 h, and then thawed at 4 °C. The thawed plasma was centrifuged at 3000g for 5 min and the supernatant discarded. The pellet was resolubilized in 1 ml distilled water, then centrifuged at 3000g for 5 min. The supernatant was retained as the soluble fraction and the pellet was discarded.
The protein concentration of the soluble fraction was deter- mined by spectrophotometry at a wavelength of 280 nm. The optical density at n = 280 nm was converted to concentration in mg ml"' by multiplying the absorbance by 0.667 mg ml ~'. The fibrinogen concentration was determined by the clot col- lection method based on Ratnoff and Menzie [11] that was later modified [12].
2.2. Measurement of gelation time
A thrombin solution (20 units ml-1) was prepared by reconstituting one vial of topical bovine thrombin (Throm- binar, 1000 units per vial, Armour Pharmaceutical Co., Kan- kakee, IL) with 50 ml distilled water. Calcium chloride solutions were prepared with concentrations of 20, 40, 60, 80, and 160 mM (with or without 1.8% w/v sodium chlo- ride).
0.1 ml of concentrated fibrinogen solution was transferred to each of three test cups placed on the fibrometer. 0.1 ml of calcium chloride solution and 0.1 ml thrombin solution were transferred together to three additional test cups placed on the fibrometer to produce a final thrombin concentration of
10, 20, 40, and 80 mM (0.9% w/v sodium chloride). The solutions were allowed to warm up to 37 °C for 3 min prior to testing. The thrombin and calcium chloride solution were then pipetted into the cup containing 0.1 ml concentrated fibrinogen solution. The timer was started at the end of ejec- tion and the clotting time was recorded.
2.3. Fibrin glue preparation and shear strength testing
Collagen films, 4.5 cm X 9.0 cm, were glued with epoxy to a vellum paper frame (7.0 cm X 7.5 cm) which had borders measuring 1.0 cm in width. After the epoxy had dried, the film and the frame were cut into two equal halves. The two halves of the collagen film and paper frame were overlapped exactly 1.0 cm. The paper frame was then rejoined with tape ensuring that the overlapped ends of the collagen films remained unrestrained. Using the fibrin sealant applicator system, 0.15 ml of soluble fibrinogen solution and 0.15 ml of thrombin solution were simultaneously injected onto the overlapped area of the films. The fibrin glue was carefully pressed into an even layer between the films with a 1.0 kg weight. The fibrin sealant bound films were placed in a humid atmosphere and allowed to cure for 30 min at 37 °C. After curing for 30 min, the films were removed from the incubator and cut into strips 1.0 cm in width. The strips were tested in uniaxial tension at a strain rate of 5 mm min-1 using an Instron Model 1122 mechanical tester. The shear strengths of the fibrin glue were calculated from the load/elongation curves. The statistical variation between samples was deter- mined using a Student's Mest (p <0.05).
3. Results
3.1. Clotting times
Fig. 1 summarizes the results of the clotting time experi- ments conducted as a function of CaCl2 concentration with and without the addition of physiologic saline (0.9% w/v NaCl) to the thrombin solution. The experimental results indicate that in the absence of sodium chloride, the clotting time of the cryoprecipitate gradually decreased from 5.7 s to 2.3 s with the addition of up to 20 mM calcium chloride to the thrombin solution (10 units ml"1). The clotting time curve did not change from 20 to 40 mM of calcium chloride, but when 80 mM calcium chloride was added to the thrombin solution the clotting time increased to 4.7 s. When 0.9% w/ v sodium chloride was added with calcium chloride to the reconstituted thrombin solution, the clotting time of all sam- ples increased significantly.
3.2. Shear strength of fibrin glue
Fig. 2 summarizes the results of the shear strength exper- iments conducted as a function of CaCl2 concentration with and without the addition of 0.9% w/v NaCl to the thrombin
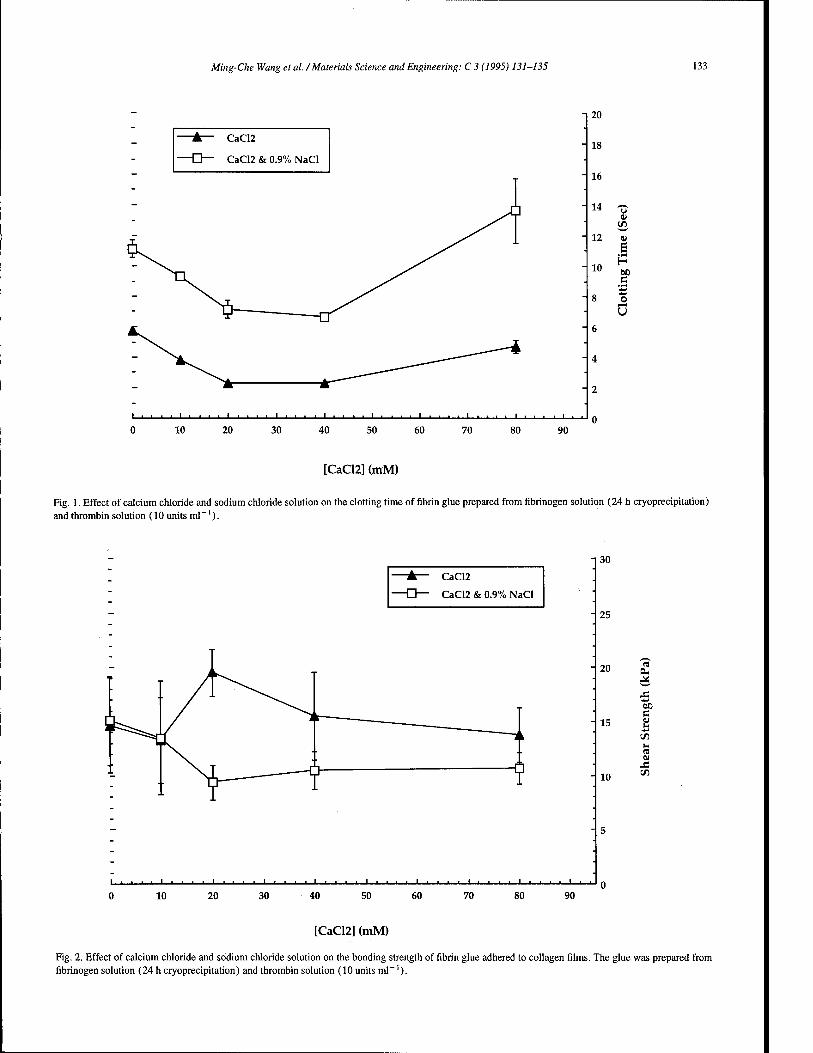
Ming-Che Wang et al. /Materials Science and Engineering: C 3 (1995) 131-135 133
"A— CaC12
-O— CaC12 & 0.9% NaCl
i .... i i . . . .i i . ■ ■ ■ i i I_I t_
18
16
14 u 4)
V)
12 <u £ H
10 on a 4-*
8 O
U
6
4
2
0 0 10 20 30 40 50 60 70 80 90
[CaCl2] (mM)
Fig. 1. Effect of calcium chloride and sodium chloride solution on the clotting time of fibrin glue prepared from fibrinogen solution (24 h cryoprecipitation) and thrombin solution (10 units ml ~').
30
"A— CaC12
-D— CaC12 & 0.9% NaCl
'■•■■' i i i i i i ■ ■ ■ . ■ . ■ i i ■ . i i i i i i
25
20
- 15
10
60 G <u u
55 u QJ
t/5
10 20 30 40 50 60 70 80 90
[CaCl2] (mM)
Fig. 2. Effect of calcium chloride and sodium chloride solution on the bonding strength of fibrin glue adhered to collagen films. The glue was prepared from fibrinogen solution (24 h cryoprecipitation) and thrombin solution (10 units ml-1).
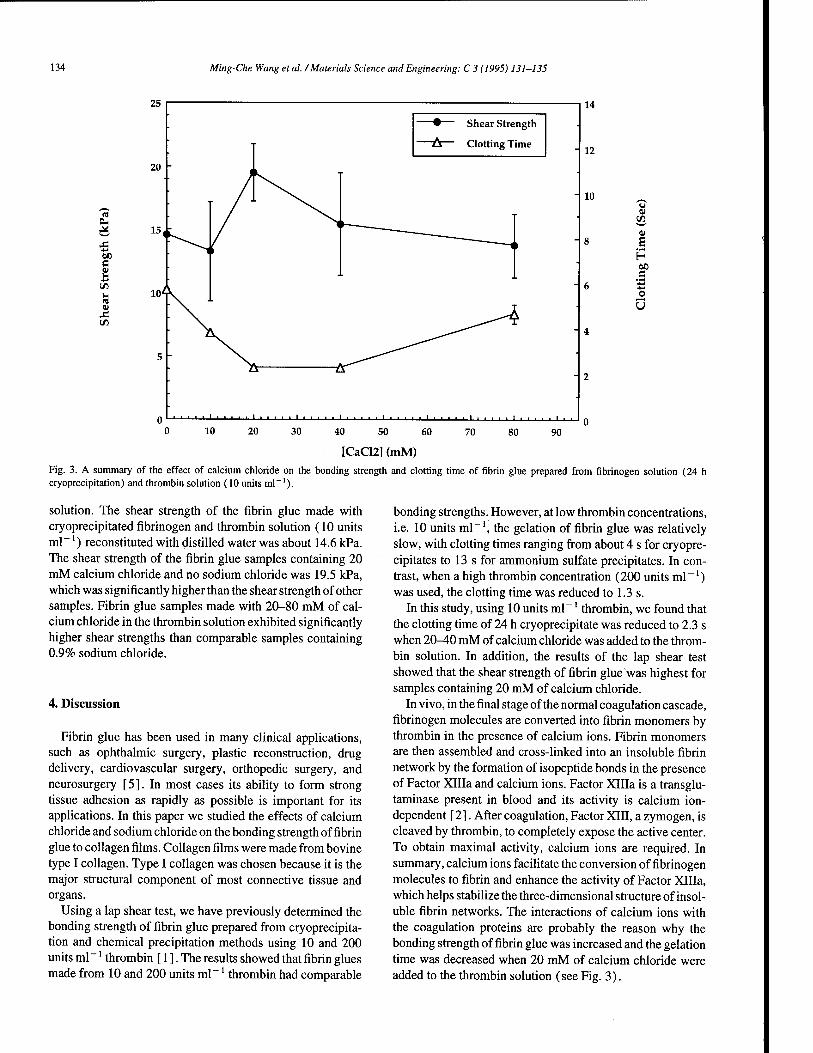
134 Ming-Che Wang et al. /Materials Science and Engineering: C 3 (1995) 131-135
25
60 C 0J
X
""• Shear Strength
"A Clotting Time
1111 ' ■ ■ ■ ■ t i . .
14
12
10 u
s HI
60 e o U
10 20 30 40 50 60
[CaC12] (mM)
70 80 90
Fig. 3. A summary of the effect of calcium chloride on the bonding strength and clotting time of fibrin glue prepared from fibrinogen solution (24 h cryoprecipitation) and thrombin solution (10 units ml-1).
solution. The shear strength of the fibrin glue made with cryoprecipitated fibrinogen and thrombin solution (10 units ml-') reconstituted with distilled water was about 14.6 kPa. The shear strength of the fibrin glue samples containing 20 mM calcium chloride and no sodium chloride was 19.5 kPa, which was significantly higher than the shear strength of other samples. Fibrin glue samples made with 20-80 mM of cal- cium chloride in the thrombin solution exhibited significantly higher shear strengths than comparable samples containing 0.9% sodium chloride.
4. Discussion
Fibrin glue has been used in many clinical applications, such as ophthalmic surgery, plastic reconstruction, drug delivery, cardiovascular surgery, orthopedic surgery, and neurosurgery [5]. In most cases its ability to form strong tissue adhesion as rapidly as possible is important for its applications. In this paper we studied the effects of calcium chloride and sodium chloride on the bonding strength of fibrin glue to collagen films. Collagen films were made from bovine type I collagen. Type I collagen was chosen because it is the major structural component of most connective tissue and organs.
Using a lap shear test, we have previously determined the bonding strength of fibrin glue prepared from cryoprecipita- tion and chemical precipitation methods using 10 and 200 units ml-' thrombin [ 1 ]. The results showed that fibrin glues made from 10 and 200 units ml- * thrombin had comparable
bonding strengths. However, at low thrombin concentrations, i.e. 10 units ml"1, the gelation of fibrin glue was relatively slow, with clotting times ranging from about 4 s for cryopre- cipitates to 13 s for ammonium sulfate precipitates. In con- trast, when a high thrombin concentration (200 units ml-1) was used, the clotting time was reduced to 1.3 s.
In this study, using 10 units ml"' thrombin, we found that the clotting time of 24 h cryoprecipitate was reduced to 2.3 s when 20-40 mM of calcium chloride was added to the throm- bin solution. In addition, the results of the lap shear test showed that the shear strength of fibrin glue was highest for samples containing 20 mM of calcium chloride.
In vivo, in the final stage of the normal coagulation cascade, fibrinogen molecules are converted into fibrin monomers by thrombin in the presence of calcium ions. Fibrin monomers are then assembled and cross-linked into an insoluble fibrin network by the formation of isopeptide bonds in the presence of Factor XHIa and calcium ions. Factor XHIa is a transglu- taminase present in blood and its activity is calcium ion- dependent [ 2]. After coagulation, Factor XIII, a zymogen, is cleaved by thrombin, to completely expose the active center. To obtain maximal activity, calcium ions are required. In summary, calcium ions facilitate the conversion of fibrinogen molecules to fibrin and enhance the activity of Factor XHIa, which helps stabilize the three-dimensional structure of insol- uble fibrin networks. The interactions of calcium ions with the coagulation proteins are probably the reason why the bonding strength of fibrin glue was increased and the gelation time was decreased when 20 mM of calcium chloride were added to the thrombin solution (see Fig. 3).

Ming-Che Wang et al. /Materials Science and Engineering: C 3 (1995) 131-135 135
In contrast, sodium ions had the opposite effect on the fibrin glue system. The addition of 0.9% w/v sodium chloride slowed down the gelation of all samples (see Fig. 1) and offset the increase in shear strength caused by the addition of 20-80 mM calcium chloride. As indicated by a recent article [ 13], when the ionic strength is increased, the fibrin diame- ters and pore sizes of the fibrin gel are reduced, resulting in the formation of a thinner gel. Thinner fibrin fibrils would be expected to give a lower shear strength glue under these conditions, as was observed in our study.
The amount of thrombin used to make fibrin glue for the treatment of severely traumatized and burned patients is an important consideration. The human coagulation system is capable of responding to the severity of body injuries. After trauma, fibrinogen and platelet concentration in the body are elevated and the body is in a state of hypercoaguability [14,15], where disseminated intravascular coagulation is likely to occur [16]. When thrombin enters into the blood circulation, platelet and fibrin start to deposit in capillaries, arterioles, and venules of various organs, and sometimes thrombosis occurs. In animal studies, thrombin infusion caused pulmonary embolization [17,18], increased pulmo- nary vascular permeability to proteins [ 17-19], pulmonary edema [17,18], PMNs accumulation in the pulmonary cir- culation [ 19], and neutrophil-dependent pulmonary vascular injury [20,21]. In addition, fibrin deposition in the pulmo- nary circulation is associated with the disruption of micro- vascular endothelium [ 19,21 ], and the degradation products of fibrin can cause pulmonary edema. Therefore, caution should be taken in the use of fibrin glue for hemostasis in severe traumatized or burned patients, and the use of a lower concentration of thrombin would probably reduce the risk of these potential adverse reactions.
5. Conclusions
The results of our previous study showed that the bonding strengths of fibrin glue are similar for samples using 10 and
200 units ml"' thrombin. In this study it was shown that the gelation time can be reduced to 2.3 s when 10 units ml-1
thrombin is reconstituted with 20-40 mM calcium chloride. High bonding strength and rapid formation of fibrin glue can be obtained using 20 mM calcium chloride solution, no sodium chloride, and 10 units ml""1 thrombin.
References
[1] F.H. Silver, M.-C. Wang and G.D. Pins, Biomaterials, in press. [2] A. Henschen and J. McDonagh, in R.F. A. Zwaal and H.C. Hemker
(eds.), Blood Coagulation, Elsevier, Amsterdam, 1986, p. 171. [3] M. Furlan, in J.L. Francis (ed.), Fibrinogen, Fibrin Stabilization, and
Fibrinolysis: Clinical, Biochemical and Laboratory Aspects, Ellis Horwood, Chichester, 1988, p. 17.
[4] F.H. Silver, M.-C. Wang and G.D. Pins, J. Applied Biomaterials, 6 (1995) 175.
[5] D.H. Sierra, J. Biomater. Appi, 7 (1993) 309. [6] A. Dresdale,E.A. Rose, V. Jeevanandam, K. Reemtsma,F.O.Bowman
and J.R. Malm, Surgery, 97 (1985) 750. [7] W. Moretz, J.J. Shea, Jr., J.R. Emmett and J.J. Shea, III,
Otolaryngology—Head and Neck Surg., 95(1986) 122. [8] W.D. Spotnitz, P.D. Mintz, N. Avery, T.C. Bithell, S. Kaul and S.P.
Nolan, The Am. Surgeon, 53 (1987) 460. [9] D.H. Sierra, A.J. Nissen and J. Welch, Laryngoscope, 100 (1990) 360.
[10] K.H. Siedentop, D.M. Harris and B.S. Sanchez, Laryngoscope, 95 (1985) 1074.
[11] O.D.RatnoffandC.Menzie./.Löfc. Clin. Med., 37 (1951) 316. [12] R. Hall and R.G. Malia, Medical Laboratory Haematology, 2nd edn.,
Butterworth-Heinemann, Oxford, 1991, p. 561. [13] D.H. Sierra, J. Biomater. Appl, 7 (1993) 309. [ 14] S. Attar, D. Boyd and E. Layne, J. Trauma, 9 (1969) 939. [15] W.F. Mcmanus, K. Eurenius and B.A. Pruitt, J. Trauma, 13 (1973)
416. [ 16] D.G. Mckay, J. Trauma, 9 (1969) 646. [17] R. Berguer, R.L. Staerkel, E.E. Moore, F.A. Moore, W.B. Galloway
and M.B. Mockus, J. Trauma, 31 (1991) 408. [18] A. Johnson, M.V. Tahamont and A.B. Malik, Am. Rev. Respir. Dis.,
128 (1983) 38. [19] F.L. Minnear, D. Martin, L. Hill, A.E. Taylor and A.B. Malik, Am. J.
Physiol., 253 (1987) 634. [20] G.A. Zimmerman, T.M. Mclntyre and S.M. Prescott, J. Clin. Invest,
7(5(1985)2235. [21] A.B. Malik and M.J. Horgan,/lm. Rev. Respir. Dis., 136 (1987) 467.
MATERIALS SCIENCE &
ENGINEERING
Materials Science and Engineering: C 3 (1995) 137-141
Template-assisted assembly of metal binding sites on a silica surface
Ki-Oh Hwang a, Yuji Yakura b, Fumio S. Ohuchib, Tomikazu Sasaki a-* * Department of Chemistry, University of Washington, Seattle, WA 98195, USA
b Department of Material Science and Engineering, University of Washington, Seattle, WA 98195, USA
Abstract
Tridentate templates were synthesized to introduce three organized amino groups on the surface of silica gel. The template-assisted modification generates a monolayer of tris-aminopropyl sites that can be further modified to construct various metal binding sites. Bipyridyl and pyridyl aldehydes were reacted with the modified silica surface followed by NaBH4 reduction. Iron(II) and copper(II) complexes of these surface-bound ligands were characterized by UV and XPS spectroscopies. A library of metal binding ligands could be constructed by the reaction of the modified silica gel with a combination of different monodentate ligands.
Keywords: Tridentate templates; Silica gel; Metal binding sites; Molecular imprinting
1. Introduction
A number of functional groups have been introduced on the surface of silica gel to develop materials for various chem- ical and biochemical applications. Metal complexes immo- bilized on the surface of silica gel or a silica thin film have been actively investigated as catalysts [1-3]. The catalytic activities of these metal complexes are highly dependent on the structure of their coordinating ligands. Appropriate ligand structures have to be identified and synthesized for a partic- ular reaction prior to their attachment to the solid support. We are interested in developing a method that would allow us to construct a library of metal binding ligands on a surface for rapid screening and selection.
'Molecular imprinting' or 'template polymerization' was first developed to synthesize polymers bearing multiple func- tional groups placed in the polymer matrix with a defined spatial orientation [4-20]. Polymerizable monomers with functional groups were synthesized, and these functional monomers were attached to a rigid template with a cleavable bond such as a Schiffs base bond. The modified template was then co-polymerized with a parent monomer. Finally, the template was removed to leave the functional groups in the polymer matrix. Polyacrylamide resin imprinted with sin- gle enantiomers of phenylalanine anilide acrylate was able to resolve D- and L-phenylalanine anilide [18]. The enantio- selectivity is modest (2-4 times difference in their binding
constants), but the two enantiomers can be separated with a column packed with this imprinted polymer. Interestingly, methylation of the amide destroys most of the enantioselec- tive interactions with the imprinted polymer. If the polymer is imprinted with N-methylphenylalanine anilide, it shows enantioselective binding of N-methylphenylalanine anilide with comparable selectivity to the phenylalanine anilide sys- tem.
Recently, Shea et al. [ 14] prepared imprinted polymers that recognize nucleotide bases. Polyacrylamide/acrylate cross-linked resin that was imprinted with 9-ethyladenine showed selective binding of adenine bases. The binding con- stant of 9-ethyladenine to the imprinted polymer was 79,000 M_1, which is comparable with the best synthetic receptors [21-23]. The imprinted polymer gave a remarkable Chro- matographie separation of adenine from guanine, uracil, cytosine and thymine. A variation of molecular imprinting can be used to modify the surface of rigid polymers, as shown in Fig. 1.
We have synthesized tridentate templates to introduce three organized amino groups on the surface of silica gel [ 8,24]. At low substitution levels, the template-assisted mod- ification generates a monolayer of tris-aminopropyl sites that can be further modified to construct various metal binding sites. A library of metal binding ligands could be constructed by the reaction of the modified silica gel with a combination of different monodentate ligands (Fig. 2). In this paper, we report the synthesis of silica-supported ligands for iron(II)
s Corresponding author.
0928-4931/95/$09.50 © 1995 Elsevier Science S.A. All rights reserved 5SD/0928-4931(95)00117-4

138 K.O. Hwang et al. /Materials Science and Engineering: C 3 (1995) 137-141
template
•;
// /j/ mmm mmm *- +
// /JT NH2
silica gel
f- £r
NH2| NH2
Ml
m£m£ym high substitution level
Fig. 1. Molecular imprinting of a silica surface with a tridentate siloxane template. The template is removed after the surface is modified with a monolayer of the tridentate siloxane. At high substitution levels, the triden- tate siloxane polymerizes to form multiple layers.
and dried under reduced pressure to yield Ru(II)(bipy- CHO)3-2PF6 in 95% yield. 'H NMR (300 MHz, CD3CN) 5 2.55 (s,9H), 7.29 (m,3H), 7.51 (m,3H),7.71 (m,3H), 7.95 (m, 3H), 8.53 (s, 3H), 8.83 (s, 3H), 10.14 (s, 3H) ppm; IR (KBr) 1711,1622, 1555 cm"1; FAB-MS (calc. for C36H3oN603Ru [M-2PF6]
+: m/z 696) m/z 696.
2.1.2. Synthesis ofRu(II)(4-(aminopropyl-3-triethoxysilane) methyl-4'-methyl-2,2'-bipyridine)3 ■ 2PF6- ([Ru"(bipy-APTES)3](PF6)2)
To a solution of 41 mgof Run(bipy-CHO)3 (4.16X10⁻⁵
mol) in 1 ml of CH3CN was added 35 mg of freshly distilled 3-aminopropyltriethoxysilane(1.4X 10⁻⁴mol) inCHCl3 (1 ml). The mixture was stirred for 3 h at room temperature under nitrogen atmosphere. The solvent was removed under reduced pressure. To the sticky residue was added anhydrous ethyl ether, and the suspension was sonicated to yield a red- dish solid. The solid was collected by centrifugation, and was washed (with sonication) twice with ethyl ether. The yield was90%.1H-NMR(CD3CN)S0.64(m,6H),1.14(t,27H), 1.79 (m, 6H), 2.54 (s, 9H), 3.69 (t, 18H), 3.78 (q, 6H), 7.24 (d, 3H), 7.51 (d, 3H), 7.59 (m, 3H), 7.77 (m, 3H), 8.40 (s, 3H), 8.43 (s, 3H), 8.71 (s, 3H) ppm; IR(KBr) 1708, 1641, 1621, 1546 cm"1; FAB-MS (calc. for C63H93N909Si3Ru [M-2PF6]
+: m/z 1306) m/z 1306.
Fig. 2. Synthesis of Ru(II)-siloxane template 1. Ru(bipy-CHO)3 is reacted with excess aminopropyl triethoxysilane (APTES) to form Shiff s base which can be hydrolyzed under mild conditions.
and copper(II) ions and their spectroscopic characteriza- tions.
2. Experimental
2.1. Synthesis of ruthenium template
2.1.1. Synthesis of Ru(II)(4-formyl-4'-methyl-2,2'- bipyridine)3 ■ 2PF6([Ru"(bipy-CHO)3](PF6)2)
To a solution of 96 mg of RuCl3 ;cH20 in 30 ml of warm 1:1 ethanol/water mixture was added 310 mg of 4-formyl- 4'-methyl-2, 2'-bipyridine (0.78 mmol) dissolved in 95% EtOH, with stirring. The mixture was refluxed for 24 h. The reaction mixture was then cooled to room temperature and the solvent was removed by rotary evaporation. The residue was dissolved in 30 ml of water. The aqueous solution was washed with CH2C12 (2X30 ml) and ethyl ether (1X20 ml). The total volume of the aqueous layer was then reduced by half under reduced pressure. NH4PF6 dissolved in water (600 mg/3 ml) was then added to the solution with stirring. The mixture was warmed to about 50°C and stirred for 30 min. After cooling to room temperature, the precipitate was collected by filtration, washed with cold water (3X5 ml),
2.2. Modification of silica gel
2.2.1. Template-assisted molecular imprinting of silica gel To a stirred suspension of pre-dried silica gel (0.5 g, All-
tech Associates Inc., pore diameter 300 A, particle size 30- 40 fjum, surface area 250 m2/g) in 30 ml of anhydrous CH3CN was added 20.7 mg of [Ru11 (bipy-APTES)3](PF6)2
(1.3 X 10"5 mol) dissolved in 30 ml of anhydrous CH3CN. The mixture was refluxed for 24 h with vigorous stirring under nitrogen atmosphere. The silica gel was then separated by centrifugation and washed with CH3CN (3X20 ml), absolute MeOH (5 X 30 ml) and with CH2C12 until the super- natant remained colorless. The modified silica gel was dried under vacuum at room temperature (5 h) and then at 60°C until the weight remained constant. Unreacted silanol groups on the surface were capped with excess ethoxytrimethylsilane in refluxing CH3CN (or in toluene) as described elsewhere [8]. The resulting modified silica gel (100 mg) was treated with 1% HC1 in MeOH:H20 (1:1) at room temperature for 3 h to release the template, Run(bipy-CHO)3. The hydro- lyzed silica gel was washed with 1% HC1 in MeOH:H20 (1:1) until the filtrate remained colorless. The silica gel was washed further with H20 (2X 10 ml), 5% NaHC03 (2X5 ml), H20 (3X10 ml), MeOH (2X10 ml) and CH2C12
(1 X5 ml). The imprinted amino silica gel was dried under vacuum.

K.O. Hwang et al. /Materials Science and Engineering: C 3 (1995) 137-141 139
2.2.2. Preparation of randomly modified 3-aminopropyl- silated-silica gel
To a stirred suspension of pre-dried silica gel (0.5 g, All- tech Associates Inc., pore diameter 300 A, particle size 30-40 /xm, surface area 250 m2/g) in 30 ml of anhydrous CH3CN was added 8.8 mg of 3-aminopropyltriethoxysilane (3.98 X 10"5 mol, freshly distilled before use) dissolved in 2 ml of anhydrous CH3CN dropwise. The mixture was refluxed for 24 h with vigorous stirring under nitrogen atmos- phere. The silica gel was then separated by centrifugation and washed with CH3CN (5 X 10 ml), absolute MeOH (5 X 10 ml) and with CH2C12 (3 X 10 ml). The washed amino silica gel was dried in a vacuum oven at room temperature (5 h) and then at 60°C until the weight remained constant. The level of substitution of amine on the surface was determined by the ninhydrin test (substitution level = 8XlO~5 mol/g silica gel). Unreacted silanol groups on the surface were capped with excess ethoxytrimethyl silane (or trimethylch- lorosilane) as described above.
2.2.3. Modification of imprinted silica gel with metal binding ligands
2.2.3.1. Bipyridyl silica Dried amino silica gel (imprinted Si02; substitution level= ~7.6X 10~5mol/gorrandomlymodifiedSiO2; sub- stitution level = 8.0 X 10~5 mol/g, 200 mg) in CHC13 (5 ml) was mixed with 4-formyl-4'-methyl-2,2'-bipyridine (30 mg, 1.5X10"4 mol). The mixture was stirred overnight. The mixture was filtered and washed with CHC13 (5 X 5 ml) and CH2C12 (2 X 5 ml). After drying under vacuum, the modified silica gel was suspended in absolute MeOH and treated with NaBH4 in portions (20 mgX4) every 10 min. After stirring overnight, IN HC1 was added to the mixture until acidic (pH = 4-5). The solid was washed (with sonication) with MeOH (2X5 ml), H20 (2 X 10 ml), 5% aqueous NaHC03
(3ml),H20 (5X10 ml) and MeOH (3X5 ml). The result- ing bipyridine-modified silica gel was dried under vacuum overnight.
2.2.3.2. Pyridyl silica (or benzyl silica) . Amino silica gel was modified by the same method as described above, using 4-formylpyridine (or benzaldehyde) instead of 4-formyl-4'-methyl-2,2'-bipyridine.
2.3. Metal binding experiment
using a UV-visible spectrophotometer at Amax = 298 nm and 521 nm. The formation of free iron(II) and bipyridine by dissociation of tris-(bipyridine)Fen-Cl2 (12 mg) in MeOH was negligible under the experimental conditions. Plain silica gel (capped) showed negligible binding of Fe(II) (bipy)3.
2.3.2. Complexation of pyridine (or benzyl)-attached silica gel with copper(II)
Pyridyl silica (or benzyl silica) (400 mg) was mixed with 15 mg of CuCl2 (or CuS04) dissolved in absolute EtOH (3 ml). The suspension was stirred for 20 h at room temperature under nitrogen. The mixture was centrifuged to remove the supernatant. The silica gel was washed with absolute EtOH (4X5 ml) and then dried under vacuum. Plain silica gel (capped) was treated with copper(II) salts by the same pro- cedure, and used as a reference.
2.4. Characterization of modified silica surface with XPS
The instrument used in this experiment was a Perkin- Elmer Phi 560 ESCA/SAM system with an Al Ka X-ray source. The copper(II) complex of modified silica gel was attached on one side of the indium foil by applying gentle pressure from the other side. The sample was mounted on the sample holder and irradiated by varying numbers of X-ray scans at 8 X 10"9 Torr. All binding energies were referenced to the Si2S and Si2P signals.
3. Results and discussion
Molecular imprinting with the Ru(II) template should cre- ate sites of three organized amino groups on the surface of silica gel. We have shown [24] that the ratio of amino groups on the surface to the Run(bipy-CHO)3 complex remains 3:1 at substitution levels of amino groups on the surface lower than approximately 1 X10"4 mol/g silica. At higher substi- tution levels, the imprinting process appears to promote polymerization of the Ru (II) template to form multiple layers on the surface. All the metal binding experiments were there- fore carried out with modified silica of substitution level = 7-8 X 10 ~5 mol / g to ensure monolay er coverage of the silica surface with metal binding ligands. i.
3.1. Construction ofiron(II) binding sites with bipyridine aldehyde
2.3.1. Complexation of bipyridine-attached silica gel with iron(ll)
Tris-(bipyridine)Fen • Cl2 (12 mg) was dissolved in 10 ml of MeOH to prepare a stock solution ([Fe(II)] =2X 10~3
M). To the stock solution (4 ml), 20 mg of bipyridine attached to silica gel (imprinted Si02; substitution level = 7.6 X 10~5 mol/g or randomly modified Si02; sub- stitution level = 8.0 X 10~5 mol/g) was added with stirring at 18°C under nitrogen. Absorbance changes were monitored
Excess 4-methyl-4'-formyl-2, 2'-bipyridine (bipy-.CHO) was reacted with the imprinted silica gel followed by NaBH4
reduction. The reductive amination reaction introduces three bipyridine units at the imprinted sites for iron(II) binding. A similar reaction was carried out with,randomly-modified sil- ica gel on which the bipyridine units should, be too far apart to form a tris complex with iron (II).
Bipyridine forms a stable tris-complex with the iron(II) ion in solution. The tris-bipyridine-Fe(II) complex is red

140 K.O. Hwang et al. /Materials Science and Engineering: C 3 (1995) 137-141
1.8-
1.6-
~ 1.4 E c
S 1.2 OJ
1 '
0.8
0.6
0 imprinted • randomly modified
10 15 Time(hour)
20
Fig. 3. UV absorption changes of Fe(II)(bipy)3 after mixing with bipyri- dine-modified silica.
NH2-
Ä7 1) imprinted 2) randomly modified
3bipy
£17 ZH7 2 bipy
Fig. 4. Schematic diagram of iron(II) extraction from Fe(II)(bipy)3 to bipyridine-modified silica. When three bipyridine units are appropriately placed, one iron(II) is extracted by three bipyridines on the silica surface. Otherwise, each bipyridine unit on the surface would bind one iron(II) together with two bipyridines from the solution.
colored and shows characteristic absorptions at 521,348, and 298 nm. The cumulative binding constant for the formation of the tris complex is approximately 3 X 10¹⁷ M~3. Since the third binding constant of the Fe(II)-bipyridine system is approximately five orders of magnitude higher than the first and second binding constants [25], no appreciable amounts of mono- and bis-bipyridine complexes are formed at con- centrations of bipyridine of more than 10~6M.
When bipyridine-modified silica is added to a solution of tris-bipyridine-Fe(II) complex, the characteristic red color of tris-bipyridine-Fe(II) complex disappears and the silica gel becomes red colored, indicating the extraction of iron (II) from the solution to the solid surface, pig. 3 shows the dis- appearance of tris-bipyridine-Fe(II) complex from the solu- tion in the presence of bipyridine-modified silica. More iron (II) was adsorbed to the randomly-modified silica than to the imprinted silica in spite of similar substitution levels. The ratio of adsorbed iron (II) and bipyridine groups on the surface was calculated to be 1:3 and 1:1,5 for imprinted silica
and randomly-modified silica, respectively [32]. Three immobilized bipyridine groups appear to participate to form a tris-bipyridine complex on the surface of imprinted silica. On the other hand, randomly-modified silica has isolated bipyridine units that are distributed on the surface in random fashion. Since the tris-bipyridine-Fe(II) complex is much more stable than the mono-bipyridine complex, two bipyri- dine molecules should also be extracted from the solution to the silica surface (Fig. 4). Randomly modified silica, there- fore, should extract one iron(II) per one bipyridine unit on the surface. The observed 1:1.5 ratio can be explained by the presence of sites where two bipyridine units are by chance located close enough to coordinate to the same iron (II).
25 3.2. XPS analysis of copper bound silica
Imprinted silica was reacted with 4-pyridine aldehyde fol- lowed by NaBH4 reduction to construct tri-pyridyl cop- per(II) binding sites on the surface (Fig. 5). Benzaldehyde was also reacted with imprinted silica under the same con- ditions to prepare a control compound. After the reaction, the modified silica developed the brown color for the Kaiser test that is characteristic of secondary amines.
Both silicas were treated with CuS04 (or CuCl2) in abso- lute ethanol and were washed with absolute ethanol (4X5 ml) [26,27]. Fig. 6 shows the XPS spectra of Cu-treated 3 and 4 (Cu-3 and Cu-4). Cu-3 showed a strong Cu (2p3/2) peak at 935.3 eV along with a weak peak at 931.6 eV. The major peak is similar in position to that of Cu(II)-phthalo- cyanine (934.5 eV) andtetra-pyridinecopper(II) complexes (934.8-936.1 eV) [28-31]. The origin of the minor peak is currently unknown although it appears to be due to the Cu2+
ion coordinated to secondary amines. Cu-4 showed a weak peak at 931.3 eV. The total Cu2+ content in Cu-3 was calculated to be approximately four times higher than the Cu-4. These XPS data are consistent with the formation of a tripyridyl-Cu2+ complex, accompanied by weak interactions of Cu2+ with secondary amines on the surface of Cu-3.
In conclusion, we have demonstrated a novel metal-medi- ated molecular imprinting reaction on the surface of silica
JK y
NH2 NH2
INH,:
ZL7 imprinted silica
2
i_N u ZJ7
1) NaBH4 m.
2) Cu2* , 4^
NOT Al/
■0 99? 90P -Ni N 1) NaBH,_ If (<H
/I7 &
Fig. 5. Modification of imprinted silica, 2, with 4-pyridyl aldehyde and benzaldehyde. The resulting Schiffs bases were reduced by NaBft,. The resulting pyridyl silica, 3, strongly binds copper(II) while benzyl silica, 4, shows only weak interactions with copper( II).
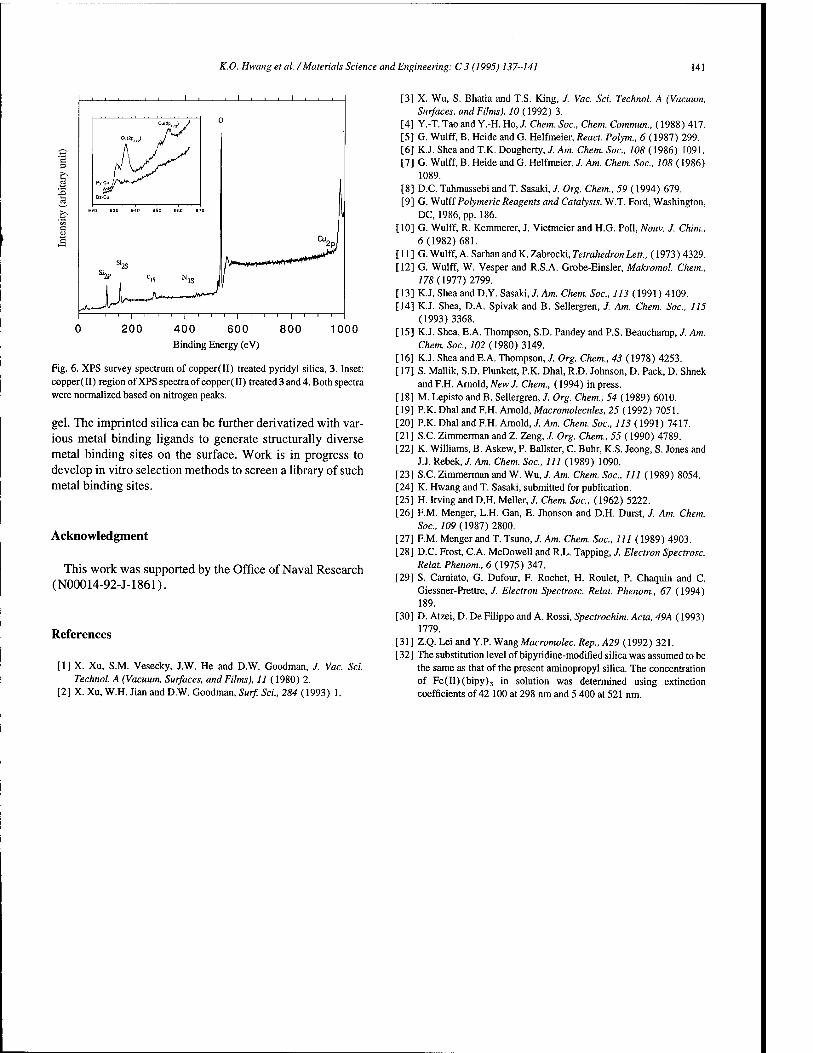
K.O. Hwang et al. /Materials Science and Engineering: C 3 (1995) 137-141 141
J3
. , 1 , , , 1 ,
0 C"(2p„ji y
Cu(apJJS} / ^^
Py-Cu jf\^^r^
Bz-Cu
0
( a 0 930 840 950 960 9
^j S2S
Si2p c» N.S
1 n,v ,„,.,■■.,,>* j IW^^^^^-^-^^*^^
sK. „J^"—"" " i i i i i i i ' 1 1 1 1 1 1 1 1 1
200 400 600 800
Binding Energy (eV)
1000
Fig. 6. XPS survey spectrum of copper(II) treated pyridyl silica, 3. Inset: copper(II) region of XPS spectra of copper(II) treated 3 and 4. Both spectra were normalized based on nitrogen peaks.
gel. The imprinted silica can be further derivatized with var- ious metal binding ligands to generate structurally diverse metal binding sites on the surface. Work is in progress to develop in vitro selection methods to screen a library of such metal binding sites.
Acknowledgment
This work was supported by the Office of Naval Research (N00014-92-J-1861).
References
[1] X. Xu, S.M. Vesecky, J.W. He and D.W. Goodman, J. Vac. Sei. Technol. A (Vacuum, Surfaces, and Films), 11 (1980) 2.
[2] X. Xu, W.H. Jian and D.W. Goodman, Surf. Sei., 284 (1993) 1.
[3] X. Wu, S. Bhatia and T.S. King, J. Vac. Sei. Technol. A (Vacuum, Surfaces, and Films), 10(1992) 3.
[4] Y.-T. Tao and Y.-H. Ho, J. Chem. Soc, Chem. Commun., (1988) 417. [5] G. Wulff, B. Heide and G. Helfmeier, React. Polym., 6 (1987) 299. [6] K.J. Shea and T.K. Dougherty, /. Am. Chem. Soc, 108 (1986) 1091. [7] G. Wulff, B. Heide and G. Helfmeier, J. Am. Chem. Soc, 108 (1986)
1089. [8] D.C. Tahmassebi and T. Sasaki, J. Org. Chem., 59 (1994) 679. [9] G. Wulff Polymeric Reagents and Catalysts. W.T. Ford, Washington,
DC, 1986, pp. 186. [ 10] G. Wulff, R. Kemmerer, J. Vietmeier and H.G. Poll, Nouv. J. Chim.,
6(1982)681. [ 11 ] G. Wulff, A. Sarhan and K. Zabrocki, Tetrahedron Lett., (1973) 4329. [12] G. Wulff, W. Vesper and R.S.A. Grobe-Einsler, Makromol. Chem.,
778(1977)2799. [13] K.J. Shea and D.Y. Sasaki,/ Am. Chem. Soc, 113 (1991) 4109. [14] K.J. Shea, D.A. Spivak and B. Sellergren, J. Am. Chem. Soc, 115
(1993)3368. [15] K.J. Shea, E.A. Thompson, S.D. Pandey and P.S. Beauchamp, J. Am.
Chem. Soc, 102 (1980) 3149. [ 16] K.J. Shea and E.A. Thompson, /. Org. Chem., 43 (1978) 4253. [ 17] S. Mallik, S.D. Plunkett, P.K. Dhal, R.D. Johnson, D. Pack, D. Shnek
and F.H. Arnold, New J. Chem., (1994) in press. [ 18] M. Lepisto and B. Sellergren, J. Org. Chem., 54 (1989) 6010. [19] P.K. Dhal and F.H. Arnold, Macromolecules, 25 (1992) 7051. [20] P.K. Dhal and F.H. Arnold, J. Am. Chem. Soc, 113 (1991) 7417. [21 ] S.C. Zimmerman and Z. Zeng, J. Org. Chem., 55 (1990) 4789. [22] K. Williams, B. Askew, P. Ballster, C. Buhr, K.S. Jeong, S. Jones and
J.J. Rebek,/. Am. Chem. Soc, 111 (1989) 1090. [23] S.C. Zimmerman and W. Wu, /. Am. Chem. Soc, HI (1989) 8054. [24] K. Hwang and T. Sasaki, submitted for publication. [25] H. Irving and D.H. Meiler, J. Chem. Soc, (1962) 5222. [26] F.M. Menger, L.H. Gan, E. Jhonson and D.H. Durst, J. Am. Chem.
Soc, 709(1987)2800. [27] F.M. Menger and T. Tsuno, J. Am. Chem. Soc, HI (1989) 4903. [28] D.C. Frost, C.A. McDowell and R.L. Tapping, J. Electron Spectrosc.
Relat. Phenom., 6 (1975) 347. [29] S. Camiato, G. Dufour, F. Rochet, H. Roulet, P. Chaquin and C.
Giessner-Prettre, J. Electron Spectrosc. Relat. Phenom., 67 (1994) 189.
[30] D. Atzei, D. De Filippo and A. Rossi, Spectrochim. Acta, 49A (1993) 1779.
[31] Z.Q. Lei and Y.P. Wang Macromolec Rep., A29 (1992) 321. [32] The substitution level of bipyridine-modified silica was assumed to be
the same as that of the present aminopropyl silica. The concentration of Fe(II)(bipy)3 in solution was determined using extinction coefficients of 42 100 at 298 nm and 5 400 at 521 nm.

MATERIALS SCIENCE &
ENGINEERING
ELSEVIER Materials Science and Engineering: C 3 (1995) 143-148
Scanning tunnelling microscopy imaging of the DNA base molecules on reduced SrTi03( 100) surfaces
Hiroyuki Tanaka, Tomoji Kawai * The Institute of Scientific and Industrial Research, Osaka University, 8-1 Mihogaoka, Ibaraki, Osaka 567, Japan
Abstract
The four DNA bases, adenine, guanine, thymine and cytosine, have been deposited on a reduced SrTi03( 100) substrate and been observed by scanning tunnelling microscopy (STM) in ultrahigh vacuum (UHV) conditions. The images indicate that the bases are deposited as individual molecules in UHV conditions, and can be individually observed by STM. The lateral dimensions of adenine and guanine are 1.5- 1.0 nm and of thymine and cytosine are 1.0-0.6 nm with a sample bias voltage from - 1 to - 3 V. It has been revealed that a comparison of the heights and lateral dimensions of the deposited species, and also of the bias dependence of the heights, allows differentiation between the four DNA bases in real space.
Keywords: DNA base molecules; Ultrahigh vacuum; Lateral dimensions; Scanning tunnelling microscopy
1. Introduction
The imaging of DNA and DNA bases by scanning tunnel- ling microscopy (STM) is of great interest for a better under- standing of genetic properties [1-3]. In order- to get information on the sequencing of the bases by STM, it is necessary to discriminate the four bases. So far, STM has visualized only macrostrings of the DNA or monolayer film of bases but not isolated bases [4-7]. We have deposited four nucleic acid bases as molecules on a substrate in ultra- high vacuum (UHV) and have studied the possibility of discriminating between these four bases by STM. The bases are adenine, thymine, guanine and cytosine. STM images of these bases adsorbed on a reduced SrTi03( 100) clean surface [8] are presented in this paper. The images indicate that the bases are deposited as molecules in UHV, and are individu- ally observed by STM. A comparison of the heights and lateral dimensions of the deposited species, and of the bias dependence of the heights, allows differentiation between the DNA bases in real space.
2. Experimental details
Adenine, thymine, guanine and cytosine are planar mole- cules with dimensions of about 0.45 nm for adenine and
ADENINE
* Corresponding author; phone, 81 (Japan)-6-879-8445; fax, 81 (Japan)- 6-875-2440.
0928-4931/95/S09.50 © 1995 Elsevier Science S.A. All rights reserved 5SD/0928-4931(95)00119-0
0.45nm
GUANINE 06
0.45nm
THYMINE C5
0.25 nm
CYTOSINE "'
0.25nm
Fig. 1. Molecular structures of adenine, thymine, guanine and cytosine with atomic labelling convention and with scales.
guanine and about 0.25 nm for thymine and cytosine, as shown in Fig. 1. For the observation of the individual mole- cules, it is necessary to prepare surfaces with submonolayer coverages. We have performed deposition of these bases by evaporation under UHV conditions on clean reduced SrTi03( 100) surfaces which are revealed to anchor the four base molecules. The substrates for the deposition of the bases were prepared as follows. Polished, (100)-oriented, plate- shaped crystal of SrTi03 were purchased from Earth-Jewelry

144 H. Tanaka, T. Kawai / Materials Science and Engineering: C 3 (1995) 143-148
Co (Japan). The SrTi03 crystal was clamped onto on Si heater mounted on a holder made of Ta. The substrate was degassed at 1000 °C for 30 min in the preparation chamber and further annealed at 1200 °C for 1 min in the STM cham- ber. After the anneal, the sample was transferred to the STM head. It was routinely possible to obtain atomic resolution STM images of the substrate within 3 h after the anneal [ 8 ]. The STM measurements were performed using a USM-301 (Unisoku, Japan) microscope, installed in a UHV chamber with a base pressure of 5 X 10~'' Torr. Mechanically formed Pt-Ir or a.c.-etched W tips were used for the experiments. The x-y-z scale was calibrated by imaging a Si (111) 7X7 surface.
Adenine, thymine, guanine and cytosine were crystalline Sigma graded bases and purified by sublimation in vacuum in the UHV chamber. The purified nucleic acid base was loaded into an electrically heated Ta source cell holder to bring about the deposition. After introduction into the prep- aration chamber, the cell holder was degassed for 30 min prior to the deposition process in the STM chamber. Depo- sition of more than one molecular species was performed by repeated deposition of each base using the same procedure as described above. The evaporated species were examined by mass spectroscopy. This revealed that single molecules are evaporated from the cell and deposition of intact single mol- ecules is possible.
3. Results and discussion
Figs. 2(a) and 2(b) show 44 nm X40 nm X 1.0 nm (x, y, z) STM images of the reduced SrTiO3(100) clean surface obtained (a) before and (b) after deposition of adenine. The crystal structure of SrTi03 is a perovskite structure with a lattice constant of 3.91 Ä (AB03, where A is a group I or II ion and B is a transition metal). In Fig. 2(a), small bright features are observed on the surface domain boundaries and also on the flat domains. They are considered to be Sr and/ or SrO which have not been evaporated from the surface during the annealing process even at higher temperatures. The surface has ordered oxygen vacancy y5 X y5 — R±26.6° superstructures which appear as bright spots of square lattices in the image. A domain boundary intersects neighbouring domains which have a different phase of super- structure (translational mismatch of square lattices) and/or slanting angle ( +53° or -53°) from each other [8]. Upon deposition (about 0.2 monolayer) of adenine on the substrate, many round protrusions which are not observed before the deposition appear, as shown in Fig. 2(b). This image shows that adenine molecules are deposited on the substrate and were observed by STM. There is a possibility that adsorption of adenine monomers on the domain boundaries changes their structure. However, in the experiments, a remarkable differ- ence such as change of height or shape has not been recog- nized, though isolated adenine molecules tend to have relatively large lateral dimensions. We think their structural
Fig. 2. Constant current STM image (44 nm X 40 nm X 1.0 nm (x, y, z)) of a reduced SrTi03 clean surface obtained (a) before and (b) after deposition of adenine (about 0.2 monolayer). The crystal structure of SrTi03 is a perovskite structure with a lattice constant of 3.91 Ä (AB03, where A is a group I or II ion and B is a transition metal), (a) This image was obtained with a sample bias of - 1.5 V and tunnelling current of 0.2 nA. (b) This image was obtained with a sample bias of - 3 V and tunnelling current of 0.2 nA.
change would be trivial enough to be ignored. Note that adenine is evaporated in a molecular form to be deposited as individual adsorbed molecules on the surfaces mentioned in the experimental section.
Fig. 3(a) shows a higher magnification (22 nmX21 nm X 0.8 nm (x, y, z)) STM image of adenine molecules with coverage of about 0.2 monolayer deposited on the SrTi03
substrate. A cross-section of Fig. 3(a) is presented in Fig. 3(b). The adsorbed adenine molecules appear to have a round shape. In addition, noisy lines of molecules are in the image. These lines imply some of the molecules are mobile on the surface. The literature on adenine adsorbed on KBr( 100) by infrared absorption studies [9], benzene on Pt( 111) by STM [ 10], azulene on Pt( 111) by STM [ 11 ], and so on, indicates that the molecules of the IT system lie flat on the surfaces. In our result, the image indicates that individual monomers are resolved as a round shape with a fairly uniform height. Thus, we assume that the adenine adsorbates also lie flat on the SiTiO3(100) surface. The typical height and lateral dimen- sions of the adenine adsorbates in the image are 0.50 ± 0.05 nm and 1.4 + 0.6 nm, respectively. These values are larger than expected based on the size of the molecules. For exam- ple, the lateral dimensions are about three times larger than
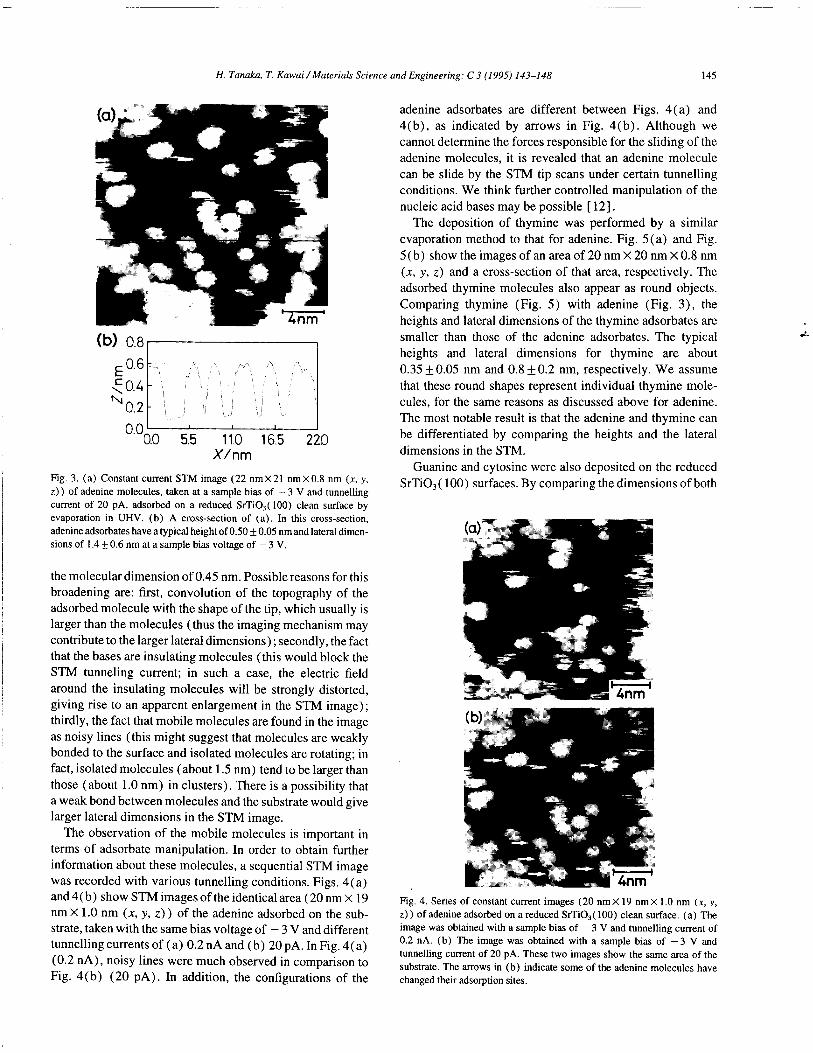
H. Tanaka, T. Kawai /Materials Science and Engineering: C 3 (1995) 143-148 145
(b) 0.8
E0.6
^0.4 N0.2
0.0, 0.0 5.5 11.0 16.5
AVnm 220
Fig. 3. (a) Constant current STM image (22 nmX21 nmX0.8 nm (x, y, z)) of adenine molecules, taken at a sample bias of - 3 V and tunnelling current of 20 pA, adsorbed on a reduced SrTiO3(100) clean surface by evaporation in UHV. (b) A cross-section of (a). In this cross-section, adenine adsorbates have a typical height of 0.50 ± 0.05 nm and lateral dimen- sions of 1.4 ± 0.6 nm at a sample bias voltage of - 3 V.
the molecular dimension of 0.45 nm. Possible reasons for this broadening are: first, convolution of the topography of the adsorbed molecule with the shape of the tip, which usually is larger than the molecules (thus the imaging mechanism may contribute to the larger lateral dimensions); secondly, the fact that the bases are insulating molecules (this would block the STM tunneling current; in such a case, the electric field around the insulating molecules will be strongly distorted, giving rise to an apparent enlargement in the STM image); thirdly, the fact that mobile molecules are found in the image as noisy lines (this might suggest that molecules are weakly bonded to the surface and isolated molecules are rotating; in fact, isolated molecules (about 1.5 nm) tend to be larger than those (about 1.0 nm) in clusters). There is a possibility that a weak bond between molecules and the substrate would give larger lateral dimensions in the STM image.
The observation of the mobile molecules is important in terms of adsorbate manipulation. In order to obtain further information about these molecules, a sequential STM image was recorded with various tunnelling conditions. Figs. 4(a) and 4 (b) sho w STM images of the identical area (20 nm X 19 nm X 1.0 nm (x, y, z)) of the adenine adsorbed on the sub- strate, taken with the same bias voltage of - 3 V and different tunnelling currents of (a) 0.2 nA and (b) 20pA. InFig.4(a) (0.2 nA), noisy lines were much observed in comparison to Fig. 4(b) (20 pA). In addition, the configurations of the
adenine adsorbates are different between Figs. 4(a) and 4(b), as indicated by arrows in Fig. 4(b). Although we cannot determine the forces responsible for the sliding of the adenine molecules, it is revealed that an adenine molecule can be slide by the STM tip scans under certain tunnelling conditions. We think further controlled manipulation of the nucleic acid bases may be possible [ 12].
The deposition of thymine was performed by a similar evaporation method to that for adenine. Fig. 5(a) and Fig. 5(b) show the images of an area of 20 nm X 20 nm X 0.8 nm (x, y, z) and a cross-section of that area, respectively. The adsorbed thymine molecules also appear as round objects. Comparing thymine (Fig. 5) with adenine (Fig. 3), the heights and lateral dimensions of the thymine adsorbates are smaller than those of the adenine adsorbates. The typical heights and lateral dimensions for thymine are about 0.35+0.05 nm and 0.8 + 0.2 nm, respectively. We assume that these round shapes represent individual thymine mole- cules, for the same reasons as discussed above for adenine. The most notable result is that the adenine and thymine can be differentiated by comparing the heights and the lateral dimensions in the STM.
Guanine and cytosine were also deposited on the reduced SrTi03( 100) surfaces. By comparing the dimensions of both
Fig. 4. Series of constant current images (20 nmX 19 nmX 1.0 nm (x, y, z)) of adenine adsorbed on a reduced SrTi03( 100) clean surface, (a) The image was obtained with a sample bias of — 3 V and tunnelling current of 0.2 nA. (b) The image was obtained with a sample bias of —3 V and tunnelling current of 20 pA. These two images show the same area of the substrate. The arrows in (b) indicate some of the adenine molecules have changed their adsorption sites.

146 H. Tanaka, T. Kawai / Materials Science and Engineering: C 3 (1995) 143-148
(b) 0.8
0.6
0.4 E c N
0.2
0.0
-, j ■ /; <\ " V'\ -./ l/
/ V V ' ,!
I I 1
0.0 50 10.0 15.0 20.0 X/nm
Fig. 5. (a) Constant current STM image (20 nmX20 nmX0.8 nm (x, y, z)) of thymine on a reduced SrTi03( 100) clean surface, taken at a sample bias of - 3 V and tunnelling current of 20 pA. (b) A cross-section of (a). In this cross-section, thymine adsorbates have a typical height of 0.35 ± 0.05 nm and lateral dimensions of 0.8 ± 0.2 nm at a sample bias voltage of - 3 V.
adsorbates, guanine and cytosine can be distinguished in the same way as adenine and thymine.
We have measured and presented the typical heights and lateral dimensions for the bases. However, these dimensions are the largest values measured and we have observed values down to half these.
The large variation of these apparent dimensions may be explained as follows. The corrugation in STM images depends strongly on the convolution of the sample shape and the tip shape. Moreover, the tunnelling conductance is a con- voluted function of the relevant electronic states of both the sample and the tip. Considering these basic imaging mecha- nisms of STM, it is plausible that the tip condition, in partic- ular with respect to atomic or molecular species at the apex of the tip, and the corresponding differences in the electronic states form a major factor contributing to the variations in the observed dimensions.
The bias dependence of the image of the bases is also of interest. Fig. 6(a) and Fig. 6(b) show adenine images (18 nm X 18 nm X 0.8 nm (x, y, z)) taken at sample bias of + 2 V and +3 V, respectively. These images were obtained on an identical area of the substrate. In Fig. 6(a) ( +3 V) the adenine adsorbates appear as protrusions, while in Fig. 6(b) ( +3 V) the adenine adsorbates appear to be more depres- sions than protrusions. This bias dependence suggests that the observed corrugations of the nucleic acid bases vary with the applied sample bias voltage and, therefore, that bias
dependence may facilitate a reproducible distinction between adenine, thymine, guanine and cytosine. The results of the bias dependence of the four bases are summarized in the form of a height vs. bias voltage diagram, as shown in Fig. 7. Since the values strongly depend on tip conditions as described above, we tentatively employ ' 'the moderate values'' as the data for the each base to reduce the tip effect. This diagram
Fig. 6. this series of constant current STM images (18 nmX 18 nmX0.8 nm (x, y, z)) shows adenine molecules adsorbed on the same area of the sub- strate, (a) This image was obtained with a sample bias of +2 V and tunnelling current of 20 pA. (b) This image was obtained with a sample bias of +3 V and tunnelling current of 20 pA. In (a) adenine adsorbates appear as protrusions, while in (b) adenine molecules appear as depressions rather than protrusions.
0.5
0.4
0.3
0.2
0.1
0.0
o Adenine • Thymine □ Guanine ■ Cytosine
Vs/V Fig. 7. A diagram of the bias dependence of the four bases, plotted as height vs. sample bias voltage. The values strongly depend on tip conditions as described in the text. We tentatively employed "the moderate values" as the data for the each base to reduce the tip effect.
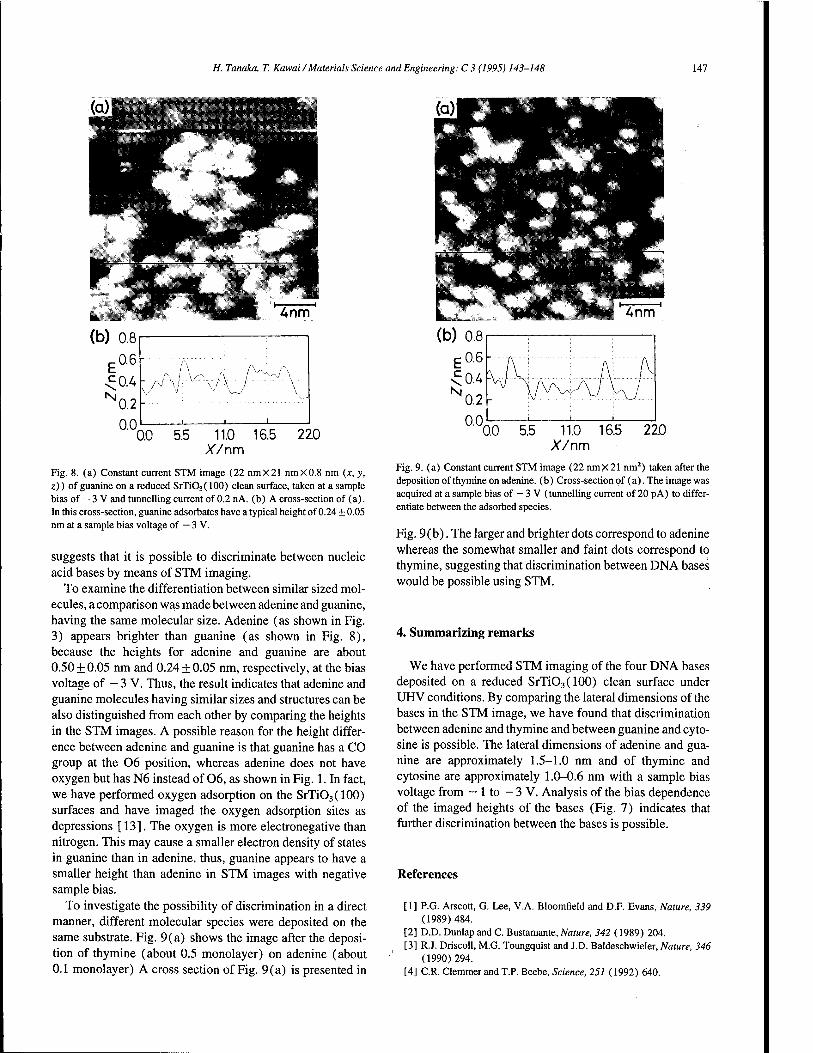
H. Tanaka, T. Kawai /Materials Science and Engineering: C 3 (1995) 143-148 147
0.0 0.0 5.5 11.0 16.5 22.0
X/nm Fig. 8. (a) Constant current STM image (22 nmX21 nmX0.8 nm (x, y, z)) of guanine on a reduced SrTi03( 100) clean surface, taken at a sample bias of — 3 V and tunnelling current of 0.2 nA. (b) A cross-section of (a). In this cross-section, guanine adsorbates have a typical height of 0.24 ± 0.05 nm at a sample bias voltage of — 3 V.
suggests that it is possible to discriminate between nucleic acid bases by means of STM imaging.
To examine the differentiation between similar sized mol- ecules, a comparison was made between adenine and guanine, having the same molecular size. Adenine (as shown in Fig. 3) appears brighter than guanine (as shown in Fig. 8), because the heights for adenine and guanine are about 0.50 + 0.05 nm and 0.24 ± 0.05 nm, respectively, at the bias voltage of — 3 V. Thus, the result indicates that adenine and guanine molecules having similar sizes and structures can be also distinguished from each other by comparing the heights in the STM images. A possible reason for the height differ- ence between adenine and guanine is that guanine has a CO group at the 06 position, whereas adenine does not have oxygen but has N6 instead of 06, as shown in Fig. 1. In fact, we have performed oxygen adsorption on the SrTi03( 100) surfaces and have imaged the oxygen adsorption sites as depressions [13]. The oxygen is more electronegative than nitrogen. This may cause a smaller electron density of states in guanine than in adenine. thus, guanine appears to have a smaller height than adenine in STM images with negative sample bias.
To investigate the possibility of discrimination in a direct manner, different molecular species were deposited on the same substrate. Fig. 9(a) shows the image after the deposi- tion of thymine (about 0.5 monolayer) on adenine (about 0.1 monolayer) A cross section of Fig. 9(a) is presented in
!$i«Ps,,. **W Anm
(b) 0.8
11.0 16.5 X/nm
22.0
Fig. 9. (a) Constant current STM image (22 nmX21 ran) taken after the deposition of thymine on adenine. (b) Cross-section of (a). The image was acquired at a sample bias of - 3 V (tunnelling current of 20 pA) to differ- entiate between the adsorbed species.
Fig. 9(b). The larger and brighter dots correspond to adenine whereas the somewhat smaller and faint dots correspond to thymine, suggesting that discrimination between DNA bases would be possible using STM.
4. Summarizing remarks
We have performed STM imaging of the four DNA bases deposited on a reduced SrTiO3(100) clean surface under UHV conditions. By comparing the lateral dimensions of the bases in the STM image, we have found that discrimination between adenine and thymine and between guanine and cyto- sine is possible. The lateral dimensions of adenine and gua- nine are approximately 1.5-1.0 nm and of thymine and cytosine are approximately 1.0-0.6 nm with a sample bias voltage from - 1 to - 3 V. Analysis of the bias dependence of the imaged heights of the bases (Fig. 7) indicates that further discrimination between the bases is possible.
References
[1] P.G. Arscott, G. Lee, V.A. Bloomfield and D.F. Evans, Nature, 339 (1989)484.
[2] D.D. Dunlap and C. Bustamante, Nature, 342 (1989) 204. [3] R.J. Driscoll, M.G. Toungquist and J.D. Baldeschwieler, Nature, 346
(1990)294. [4] CR. Clemmer and T.P. Beebe, Science, 251 (1992) 640.

148 H. Tanaka, T. Kawai /Materials Science and Engineering: C 3 (1995) 143-148
[5] R. Srinivasan, J.C. Murphy and R. Fainchtein, J. Electroanal. Chem., [9] J.T. Kim, M. Kanai, T. Kawai and S. Kawai, Jpn. J. Appl. Phys., 33 312 (1993) 293. (1993)5027.
[6] M.J. Allen, M. Balooch, S. Subbiah, R.J. Tech, W. Sieklaus and R. [10] P.S. Weiss and D.M. Eigler, Phys. Rev. Lett., 71 (1993) 3129. Bdlhom, Scann. Microsc, 5(1991)625. [11] V.M. Hallmark and S. Chiang, Surf. Sei., 286 (1993) 190.
[7] N.J. Tao and Z. Shi, J. Phys. Chem., 98 (1994) 1464. [ 12] D.M. Eigler and E.K. Schweizer, Nature, 344 (1990) 524. [8] H. tanaka, T. Matsumoto, T. Kawai and S. Kawai, Jpn. J. Appl. Phys., [ 13] H. Tanaka, T. Matsumoto, T. Kawai and S. Kawai, Surf. Sei., 318
32(1992)1405. (1994)29.
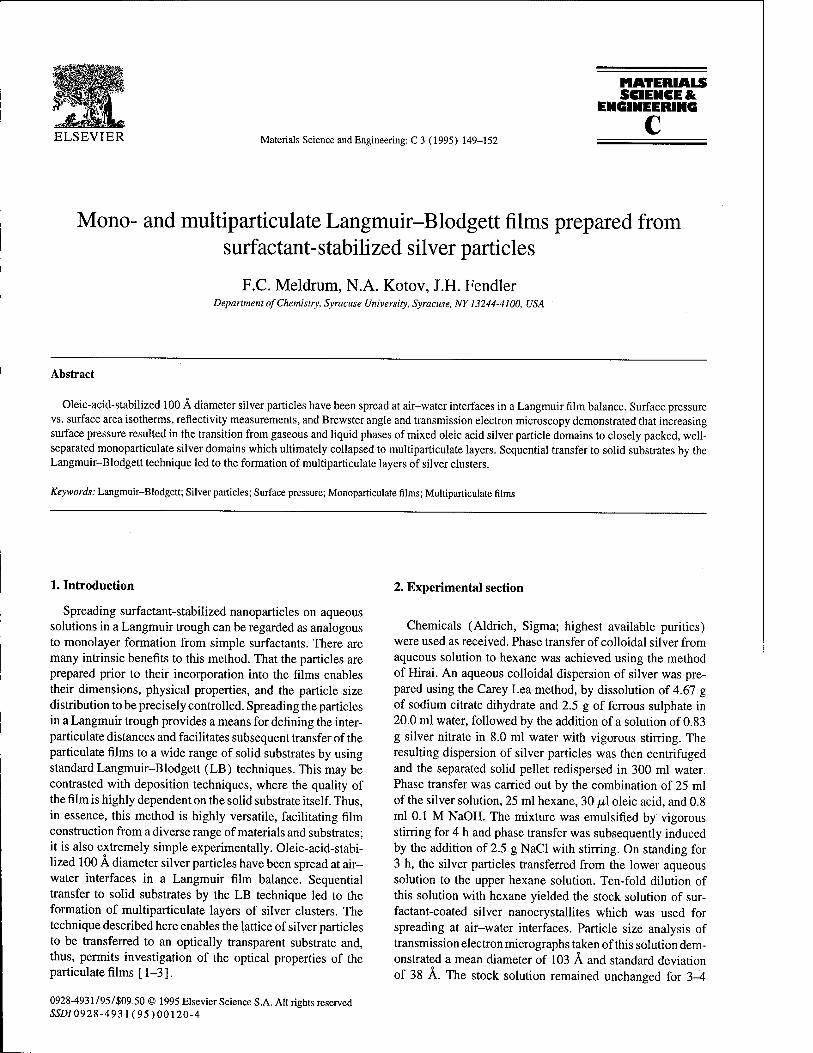
MATERIALS SCIENCE &
ENGINEERING
ELSEVIER Materials Science and Engineering: C 3 (1995) 149-152
Mono- and multiparticulate Langmuir-Blodgett films prepared from surfactant-stabilized silver particles
F.C. Meldrum, N.A. Kotov, J.H. Fendler Department of Chemistry, Syracuse University, Syracuse, NY 13244-4100, USA
Abstract
Oleic-acid-stabilized 100 Ä diameter silver particles have been spread at air-water interfaces in a Langmuir film balance. Surface pressure vs. surface area isotherms, reflectivity measurements, and Brewster angle and transmission electron microscopy demonstrated that increasing surface pressure resulted in the transition from gaseous and liquid phases of mixed oleic acid silver particle domains to closely packed, well- separated monoparticulate silver domains which ultimately collapsed to multiparticulate layers. Sequential transfer to solid substrates by the Langmuir-Blodgett technique led to the formation of multiparticulate layers of silver clusters.
Keywords: Langmuir-Blodgett; Silver particles; Surface pressure; Monoparticulate films; Multiparticulate films
1. Introduction
Spreading surfactant-stabilized nanoparticles on aqueous solutions in a Langmuir trough can be regarded as analogous to monolayer formation from simple surfactants. There are many intrinsic benefits to this method. That the particles are prepared prior to their incorporation into the films enables their dimensions, physical properties, and the particle size distribution to be precisely controlled. Spreading the particles in a Langmuir trough provides a means for defining the inter- particulate distances and facilitates subsequent transfer of the particulate films to a wide range of solid substrates by using standard Langmuir-Blodgett (LB) techniques. This may be contrasted with deposition techniques, where the quality of the film is highly dependent on the solid substrate itself. Thus, in essence, this method is highly versatile, facilitating film construction from a diverse range of materials and substrates; it is also extremely simple experimentally. Oleic-acid-stabi- lized 100 A diameter silver particles have been spread at air- water interfaces in a Langmuir film balance. Sequential transfer to solid substrates by the LB technique led to the formation of multiparticulate layers of silver clusters. The technique described here enables the lattice of silver particles to be transferred to an optically transparent substrate and, thus, permits investigation of the optical properties of the paniculate films [ 1-3].
2. Experimental section
Chemicals (Aldrich, Sigma; highest available purities) were used as received. Phase transfer of colloidal silver from aqueous solution to hexane was achieved using the method of Hirai. An aqueous colloidal dispersion of silver was pre- pared using the Carey Lea method, by dissolution of 4.67 g of sodium citrate dihydrate and 2.5 g of ferrous sulphate in 20.0 ml water, followed by the addition of a solution of 0.83 g silver nitrate in 8.0 ml water with vigorous stirring. The resulting dispersion of silver particles was then centrifuged and the separated solid pellet redispersed in 300 ml water. Phase transfer was carried out by the combination of 25 ml of the silver solution, 25 ml hexane, 30 /xl oleic acid, and 0.8 ml 0.1 M NaOH. The mixture was emulsified by vigorous stirring for 4 h and phase transfer was subsequently induced by the addition of 2.5 g NaCl with stirring. On standing for 3 h, the silver particles transferred from the lower aqueous solution to the upper hexane solution. Ten-fold dilution of this solution with hexane yielded the stock solution of sur- factant-coated silver nanocrystallites which was used for spreading at air-water interfaces. Particle size analysis of transmission electron micrographs taken of this solution dem- onstrated a mean diameter of 103 Ä and standard deviation of 38 A. The stock solution remained unchanged for 3-A
0928-4931/95/$09.50 © 1995 Elsevier Science S.A. All rights reserved 55D/0928-4931(95)00120-4
150 F.C. Meldrum etal. /Materials Science and Engineering: C3 (1995) 149-152
days, after which time a small quantity of dark precipitate was observed. Consequently, only freshly prepared disper- sions were used for each series of experiments.
Surface pressure vs. surface area isotherms were deter- mined by using a Lauda Langmuir film balance. 400-750 ix\ of the silver stock solution were spread on a water subphase (purified by a Millipore Milli-Q system with a resistivity of 18 MO cm) by using a Hamilton syringe in 50-100 /xl por- tions so as to avoid initial multilayer formation. Evaporation of the spreading solvent was permitted for 30 min prior to compression of the film. Compression and expansion were then carried out by using a moving barrier rate of 0.30 cm s ~l. LB films were prepared by compression of the particulate film to a surface pressure of 15-30 nN m"' and maintenance of the film at constant pressure. Either glass or silanized glass substrates were dipped into and out of the film at a rate of 1.0 cm min-1 with residence times of 30 s and 4.5 min in the solution and air, respectively.
Absorption spectra of all samples were determined by using an HP 8452A diode-array spectrometer.
3. Results and discussion
Surface pressure IT VS. surface area A isotherms, measured on compression of films obtained from spreading 0.6 ml of the silver colloid solution, are shown in Fig. 1(a). A TT-A
curve for oleic acid only is illustrated in Fig. 1 (b). Isotherms of very similar shape and position, with respect to the surface area axis, were obtained on spreading 0.4 and 0.75 ml silver colloid solutions. The isotherms were reproducible within the precision of the trough (20% of surface pressure and surface area) and the films were fairly uniform, as viewed by eye. The Ag-oleic acid isotherms show five distinct regions, as marked in Fig. 1(a), and can be interpreted in terms of a film composed of two distinct, immiscible components. In con- junction with the transmission electron microscopy (TEM) visualization of the film structure (see below), these can be regarded as surfactant-stabilized Ag colloids and oleic acid not associated with Ag (that is, oleic acid present in a purely organic environment). In the case of simple immiscible sur- factants, the immiscible compounds comprising the mono- layer can exist as domains and, provided that these are of sufficient magnitude to be representative of the bulk materi- als, the resultant monolayers will begin to collapse at the lower characteristic collapse pressure. Continuation of com- pression until all domains of the first material have collapsed then leads to a second pressure increase until the higher coll- pase pressure is achieved [4]. Discussion of the present sys- tem cannot be simplified to such a degree since the "silver colloid'' and "oleic acid" domains are unlikely to remain completely immiscible at high compression. Thus, a general discussion of Fig. 1(a) suggests that regions 1 and 2 corre- spond to the gaseous and liquid phases of the mixed film. Plateau 3 occurs at ir= 20 mN m~ \ a value comparable to the collapse pressure of the oleic acid monolayer (see Fig.
% E
w Pi D co GO u Pi
pa u
A D w
(a)
0 5 10 15 20 25 30 35 40 45
AREA PER UNIT, Ä2/particle x 10"4
E Z 8
W ti & CO CO w
PA
a pi Ö CO
(b)
120
AREA PER MOLECULE, k /mol
Fig. 1. Surface pressure vs. molecular area isotherms of thin films on distilled water subphases of (a) 0.6 ml of Ag-oleic acid solution where labels 1-5 refer to the different phases of the monolayer structure, as discussed in the text, and (b) oleic acid.
1 (b)), and can thus be interpreted in terms of the beginning of the collapse of the oleic acid domains. The silver domains change size and shape throughout these pressure regimes. Further compression of the silver domains occurs during stage 4 and continues until collapse at stage 5. Full compres- sion of the Ag film (region 5 in Fig. 1(a)) resulted in the development of a distinct yellow color and shiny surface. The film was very rigid at high compressions and was observed to crease at the collapse pressure and then crumple along the moving barrier with further compression. These results are consistent with observations made on the collapse of mono- layers formed from spherical latex particles [5] and orgna- oclay platelets [6].
Thg area occupied per silver particle was calculated from a knowledge of the mean particle size, the concentration of silver in the spreading solution, and the critical area per par- ticle (corresponding to the concept of headgroup areas in surfactant monolayers). The critical area-per-particle quan- tity was determined from the surface pressure vs. surface area isotherm as the point at which a tangent drawn to the solid
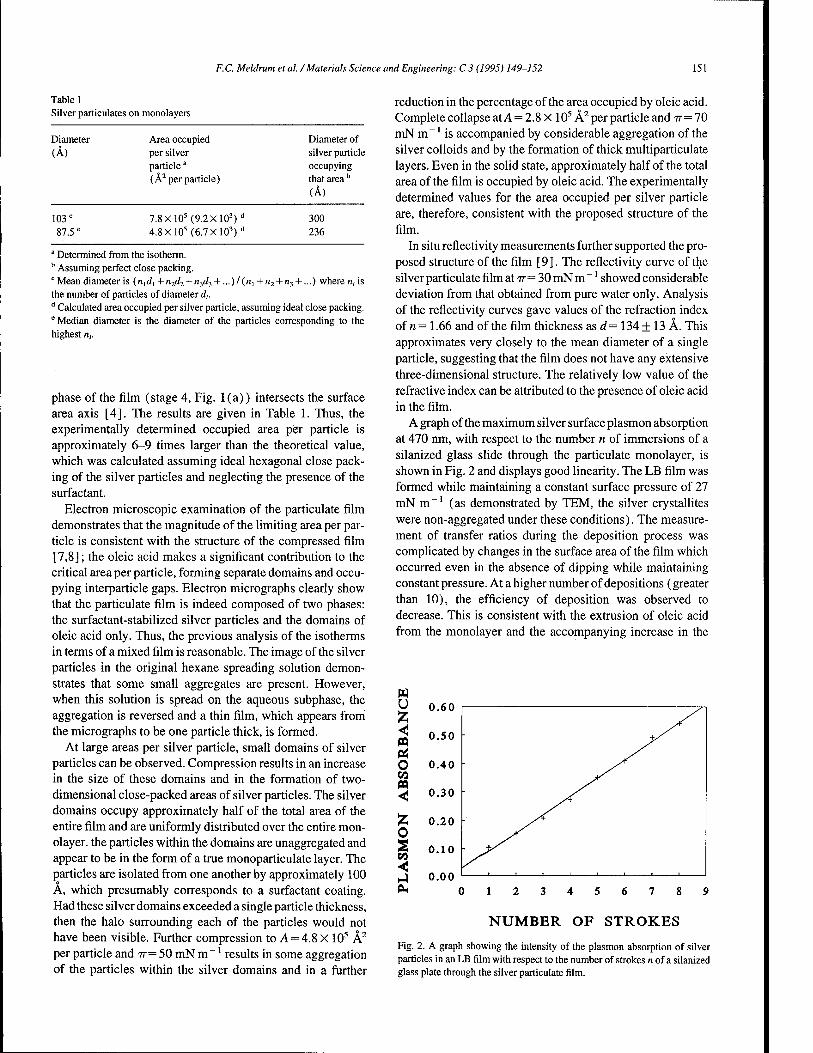
F.C. Meldrum et at /Materiah Science and Engineering: C 3 (1995) 149-152 151
Table 1 Silver particulates on monolayers
Diameter (Ä)
Area occupied per silver particlea
(A2 per particle)
Diameter of silver particle occupying that area b
(Ä)
103c
87.5' 7.8Xl05(9.2Xl03)d
4.8 X10⁵ (6.7X10³)" 300 236
" Determined from the isotherm. b Assuming perfect close packing. c Mean diameter is (nldl + n2d2 + n3d3 + ...)/(nl + n2 + n} + ...) where n, is the number of particles of diameter d,. d Calculated area occupied per silver particle, assuming ideal close packing. e Median diameter is the diameter of the particles corresponding to the highest n,.
phase of the film (stage 4, Fig. 1(a)) intersects the surface area axis [4]. The results are given in Table 1. Thus, the experimentally determined occupied area per particle is approximately 6-9 times larger than the theoretical value, which was calculated assuming ideal hexagonal close pack- ing of the silver particles and neglecting the presence of the surfactant.
Electron microscopic examination of the paniculate film demonstrates that the magnitude of the limiting area per par- ticle is consistent with the structure of the compressed film [7,8]; the oleic acid makes a significant contribution to the critical area per particle, forming separate domains and occu- pying interparticle gaps. Electron micrographs clearly show that the paniculate film is indeed composed of two phases: the surfactant-stabilized silver particles and the domains of oleic acid only. Thus, the previous analysis of the isotherms in terms of a mixed film is reasonable. The image of the silver particles in the original hexane spreading solution demon- strates that some small aggregates are present. However, when this solution is spread on the aqueous subphase, the aggregation is reversed and a thin film, which appears from the micrographs to be one particle thick, is formed.
At large areas per silver particle, small domains of silver particles can be observed. Compression results in an increase in the size of these domains and in the formation of two- dimensional close-packed areas of silver particles. The silver domains occupy approximately half of the total area of the entire film and are uniformly distributed over the entire mon- olayer. the particles within the domains are unaggregated and appear to be in the form of a true monoparticulate layer. The particles are isolated from one another by approximately 100 Ä, which presumably corresponds to a surfactant coating. Had these silver domains exceeded a single particle thickness, then the halo surrounding each of the particles would not have been visible. Further compression to A = 4.8 X 10⁵ Ä2
per particle and TT= 50 mN m~' results in some aggregation of the particles within the silver domains and in a further
reduction in the percentage of the area occupied by oleic acid. Complete collapse at A = 2.8 X 10⁵ A2 per particle and TT= 70 mN m~' is accompanied by considerable aggregation of the silver colloids and by the formation of thick multiparticulate layers. Even in the solid state, approximately half of the total area of the film is occupied by oleic acid. The experimentally determined values for the area occupied per silver particle are, therefore, consistent with the proposed structure of the film.
In situ reflectivity measurements further supported the pro- posed structure of the film [9]. The reflectivity curve of the silver particulate film at TT= 30 mN m ~' showed considerable deviation from that obtained from pure water only. Analysis of the reflectivity curves gave values of the refraction index of n= 1.66 and of the film thickness as d= 134+ 13 A. This approximates very closely to the mean diameter of a single particle, suggesting that the film does not have any extensive three-dimensional structure. The relatively low value of the refractive index can be attributed to the presence of oleic acid in the film.
A graph of the maximum silver surface plasmon absorption at 470 nm, with respect to the number n of immersions of a silanized glass slide through the particulate monolayer, is shown in Fig. 2 and displays good linearity. The LB film was formed while maintaining a constant surface pressure of 27 mN m_1 (as demonstrated by TEM, the silver crystallites were non-aggregated under these conditions). The measure- ment of transfer ratios during the deposition process was complicated by changes in the surface area of the film which occurred even in the absence of dipping while maintaining constant pressure. At a higher number of depositions (greater than 10), the efficiency of deposition was observed to decrease. This is consistent with the extrusion of oleic acid from the monolayer and the accompanying increase in the
W U z < m o CO m <
o a < PM
NUMBER OF STROKES
Fig. 2. A graph showing the intensity of the plasmon absorption of silver particles in an LB film with respect to the number of strokes n of a silanized glass plate through the silver particulate film.
152 F. C. Meldrum et al. /Materials Science and Engineering: C 3 (1995) 149-152
rigidity of the film; highly viscous films traditionally display low transfer ratios [4]. The quality of the LB films formed will necessarily suffer from the limitation that the structure of the particulate film varies as a function of time. However, that the absorption of the LB film varies linearly with the number of layers deposited suggests that the structure of the component layers does not vary considerably over the time span of the experiment.
Acknowledgments
Support of this work by a grant from the National Science Foundation is gratefully acknowledged. We thank Dr. Z. Hor- völgyi for helpful discussion.
References
[1] A. Henglein, Isr. J. Chem., 33 (1993) 77. [2] H. Raether, Surface Plasmons on Smooth and Rough Surfaces and on
Gratings, Springer, Berlin, 1988. [3] S. Efrima, Crit. Rev. Surf. Chem., 1 (1991) 167. [4] G.Roberts (ed.), Langmuir-Blodgett Films, Plenum, New York, 1990. [5] M.J. Garvey, D. Mitchell and A.L. Smith, Colloid Polym. Sei., 257
(1979)70. [6] N.A. Kotov, F.C. Meldrum, J.H. Fendler, E. Tombäcz and I. Dekany,
Langmuir, 70(1994)3797. [7] K. Meguro.M. TorizukaandK.Esumi,B«M. CÄ«m. Sec. Jpn.,67 (1988)
341. [8] K. Esumi, M. Shiratori, H. Ishizuka, T. Tana, K. Torige and K. Meguro,
Langmuir, 7(1991)457. [9] N.A. Kotov, F.C. Meldrum, C. Wu and J.H. Fendler, / Phys. Chem.,
95(1994)2735.
MATERIALS SCIENCE &
ENGINEERING
ELSEVIER Materials Science and Engineering: C 3 (1995) 153-158
Cracking cholesterol from a phase transition at body temperatures
S. Kumar *, S.J. Bums Materials Science Program, Department of Mechanical Engineering, University of Rochester, Rochester, NY 14627-0133, USA
Abstract
The microstructure of cholesterol crystals grown from gallstone melt have been studied using hot-stage microscopy. The microstructure is comprised of needle-shaped crystals growing radially from a unique nucleation center. The growth direction has been found to be [001 ] using X-ray diffraction methods. The radial growth rate has been reported over a range of temperatures. The growth kinetic curve and the microstructural evidence clearly suggest that cholesterol grows by a spherulitic mechanism. The phase transitions in cholesterol have been studied using differential scanning calorimetry. Anhydrous cholesterol has a phase change a few degrees below body temperature. Optical microscopy establishes that this phase transformation cracks the spherulitic crystals perpendicular to the fast growth direction. Thermal expansion measurements demonstrate that upon cooling across this phase boundary large shrinkage is induced in the growth direction with an expansion in the perpendicular direction. This phase transition and repeated cracking may prove to be useful in destroying natural gallstones, while suppressing this transformation and its associated cracking might aid in securing other cholesterol deposits within the human body.
Keywords: Cholesterol; Microstructure; Phase transitions; Gallstones
1. Introduction
Cholesterol is a lipid compound which plays an important role in human body functions. The biochemistry of choles- terol has been studied extensively in solutions [1-3]. The microstructure of solid cholesterol and the mechanism of growth process are not well defined nor understood [4]. These solid deposits include gallstones and atherosclerotic plaques. Cholesterol is the major constituent of almost all gallstones found in the Western hemisphere [ 5 ]. The micros- tructure of natural cholesterol gallstones has been observed using optical microscopy and shows characteristics of spher- ulitic growth [6,7]. The microstructure is comprised of nee- dle-shaped crystals growing from a unique nucleation center. This structure of spherulitic crystallization is reproduced by melting gallstones and resolidification in a hot-stage micro- scope. The synthetic stones grown from commercial purity cholesterol melt also exhibit a similar microstructure.
The growth kinetics and solidification mechanism in body- generated cholesterol have been observed recently using hot- stage microscopy [6,7]. The kinetic rate of biochemical processes at elevated temperatures can be increased by orders of magnitude so observations are accelerated; thermal energy increases the normally slow kinetic processes in the human body. Rate increases of many orders of magnitude make it
* Corresponding author.
Elsevier Science S.A.
possible to observe in a single session with a video camera in vitro processes that take months or years in vivo. The technique of accelerated bio-chemical observations is the basis for our microstructural characterization of cholesterol. The growth kinetics curve obtained using this technique sup- port our spherulitic model of stone formation.
Cholesterol can occur with two chemistries either as anhy- drous or as monohydrate cholesterol. Both forms are crystal- line and exhibit polymorphic transitions [8-11]. Anhydrous cholesterol has a polymorphic transition a few degrees below body temperature. Cholesterol monohydrate exhibits a sep- arate polymorphic transition at around 86 °C and a smectic liquid crystalline phase transition at about 124 °C [ 11 ]. It is widely believed that gallstones are made up of cholesterol monohydrate because anhydrous cholesterol, when sus- pended in water, forms cholesterol monohydrate slowly with time [11]. The bile in the gallbladder which holds the gall- stones, has water as a major constituent. However, in the literature it is also reported that both chemistries are present in cholesterol-rich stones, with the anhydrous cholesterol being the most abundant [12,13].
Anhydrous cholesterol crystals are needle-shaped, whereas cholesterol monohydrate crystals are shaped like plates often with small corner notches. On the basis of microstructural observations and crystallographic considerations, we believe that natural gallstones first deposit in the gallbladder as anhy- drous material. Then later, before observation, they are con-

154 S. Kumar, SJ. Burns /Materials Science and Engineering: C 3 (1995) 153-158
verted to cholesterol monohydrate. Konikoff et al. [14] observed cholesterol precipitation from a model bile solution, and arrived at the similar conclusions.
Some concretions can be pulverized inside a patient's body using ultrasonic extracorporeal shock wave lithotripsy (ESWL). Gallstone lithotripsy is successful in only about 20% of the patients treated using this procedure, whereas kidney stone lithotripsy is successful in over 95% of the patients [15]. We have found that anhydrous cholesterol exhibits a first-order, solid-state phase transition near human body temperatures. Cooling across this phase boundary induces large shrinkage in the growth direction and an expan- sion in the perpendicular direction. This leads to vigorous cracking of synthetic stones when this phase boundary is crossed. Optical microscopy establishes that the crystals are cracked perpendicular to the growth direction. The growth direction has been found to be [001 ] using X-ray diffraction techniques. The cracking can be exploited to produce internal flaws or cracks in solid anhydrous cholesterol (presumably in gallstones and possibly in other forms of cholesterol) by repeatedly changing phases. As a result, flawed cholesterol would be frangible and susceptible to fragmentation, espe- cially when using ESWL.
2. Spherulitic growth
The growth kinetics and solidification mechanism in cho- lesterol gallstones has been observed using hot-stage micros- copy [ 2,3 ]. The source of cholesterol was gallstones obtained at surgery and stored in saline solution. They were subse- quently washed, wiped dry and then ground to a fine powder. Cholesterol crystals were prepared on a microscope slide by melting this powder and solidifying the melt while under optical observations inside a microscope's hot stage. The specimen's growth was observed in transmission micros- copy.
Fig. 1 shows the microstructure of crystals grown from the melt between a glass slide and cover slip. The spherulitic growth temperature in this case is 84 °C and is thus under- cooled from the melting point of cholesterol by about 65 °C. The radial crystals start to grow in all directions spherically from a centrally located nucleation site. The radius of the growing spherulite was measured from the pictures recorded using a video camera. The radial growth rate on an isotherm is constant and therefore independent of time. The logarithm of this growth rate is plotted as a function of temperature in Fig. 2. The rate of spherulitic growth is determined by the undercooling temperature, while the microstructural size of the acicular crystals is related to the kinetics of solidification and degree of supercooling. The fastest growth rate occurs at about 115 °C [7]. This growth pattern and undercooling is a direct characteristic of spherulitic crystallization, as we have reported earlier [6,7]. The growth rate we observed has been extrapolated to measured in vivo growth rates at body tem- perature. Gallstones grow in a saturated cholesterol solution
in bile inside the gallbladder. The kinetics of growth in solu- tion might be different from the kinetics of growth in melt, but our extrapolated growth rate compares well with the in vivo measured growth rate [ 16].
It is seen that the growth kinetics curve in Fig. 2 has no data between the temperature range 115 °C and 144 °C. This is because no nucleation occurs even after waiting for an hour at this particular temperature range. The data at 144 °C were obtained by taking the slide slightly out of the hot stage for a very brief period of time and then quickly replacing it. Nucle- ation occurred because the melt was disturbed during removal, while further growth took place at a constant tem- perature, as mentioned previously. However, this technique
:" \ *?*'/.*
Fig. 1. A transmission optical micrograph of crystals grown from gallstone melt on a microscope slide. The «crystallization temperature was 84 °C. The resulting microstructure consists of radiating arrays of cholesterol crys- tals emerging from a unique nucleation center exhibiting spherulitic crys- tallization.
*»^*V ,200 Mm,
E
+- D
120 140 160
Temperature °C
Fig. 2. The radial growth rate for a gallstone as a function of «crystallization temperature; the extrapolated curve on the left describes growth rates reported for in vivo conditions.
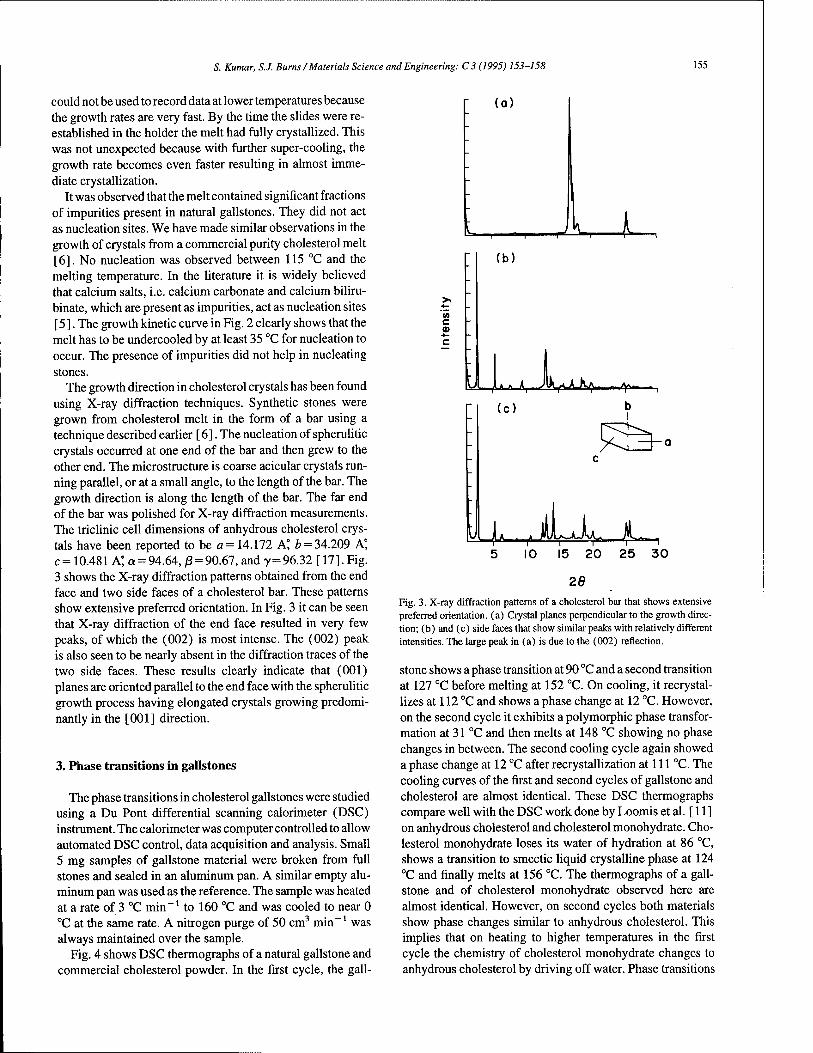
S. Kumar, S.J. Burns /Materials Science and Engineering: C 3 (1995) 153-158 155
could not be used to record data at lower temperatures because the growth rates are very fast. By the time the slides were re- established in the holder the melt had fully crystallized. This was not unexpected because with further super-cooling, the growth rate becomes even faster resulting in almost imme- diate crystallization.
It was observed that the melt contained significant fractions of impurities present in natural gallstones. They did not act as nucleation sites. We have made similar observations in the growth of crystals from a commercial purity cholesterol melt [6]. No nucleation was observed between 115 °C and the melting temperature. In the literature it is widely believed that calcium salts, i.e. calcium carbonate and calcium biliru- binate, which are present as impurities, act as nucleation sites [5]. The growth kinetic curve in Fig. 2 clearly shows that the melt has to be undercooled by at least 35 °C for nucleation to occur. The presence of impurities did not help in nucleating stones.
The growth direction in cholesterol crystals has been found using X-ray diffraction techniques. Synthetic stones were grown from cholesterol melt in the form of a bar using a technique described earlier [6]. The nucleation of spherulitic crystals occurred at one end of the bar and then grew to the other end. The microstructure is coarse acicular crystals run- ning parallel, or at a small angle, to the length of the bar. The growth direction is along the length of the bar. The far end of the bar was polished for X-ray diffraction measurements. The triclinic cell dimensions of anhydrous cholesterol crys- tals have been reported to be a = 14.172 A° £ = 34.209 A° c= 10.481 A; a = 94.64, )3 = 90.67, and y=96.32 [ 17]. Fig. 3 shows the X-ray diffraction patterns obtained from the end face and two side faces of a cholesterol bar. These patterns show extensive preferred orientation. In Fig. 3 it can be seen that X-ray diffraction of the end face resulted in very few peaks, of which the (002) is most intense. The (002) peak is also seen to be nearly absent in the diffraction traces of the two side faces. These results clearly indicate that (001) planes are oriented parallel to the end face with the spherulitic growth process having elongated crystals growing predomi- nantly in the [001] direction.
3. Phase transitions in gallstones
The phase transitions in cholesterol gallstones were studied using a Du Pont differential scanning calorimeter (DSC) instrument. The calorimeter was computer controlled to allow automated DSC control, data acquisition and analysis. Small 5 mg samples of gallstone material were broken from full stones and sealed in an aluminum pan. A similar empty alu- minum pan was used as the reference. The sample was heated at a rate of 3 °C min"1 to 160 °C and was cooled to near 0 °C at the same rate. A nitrogen purge of 50 cm3 min-1 was always maintained over the sample.
Fig. 4 shows DSC thermographs of a natural gallstone and commercial cholesterol powder. In the first cycle, the gall-
(a)
1
(A C
(b)
jL » A MfA K/i. - ^-
(c)
JLL JULsJUyu^ 4- 10 15 20 25 30
20 Fig. 3. X-ray diffraction patterns of a cholesterol bar that shows extensive preferred orientation, (a) Crystal planes perpendicular to the growth direc- tion; (b) and (c) side faces that show similar peaks with relatively different intensities. The large peak in (a) is due to the (002) reflection.
stone shows a phase transition at 90 °C and a second transition at 127 °C before melting at 152 °C. On cooling, it recrystal- lizes at 112 °C and shows a phase change at 12 °C. However, on the second cycle it exhibits a polymorphic phase transfor- mation at 31 °C and then melts at 148 °C showing no phase changes in between. The second cooling cycle again showed a phase change at 12 °C after recrystallization at 111 °C. The cooling curves of the first and second cycles of gallstone and cholesterol are almost identical. These DSC thermographs compare well with the DSC work done by Loomis et al. [ 11 ] on anhydrous cholesterol and cholesterol monohydrate. Cho- lesterol monohydrate loses its water of hydration at 86 °C, shows a transition to smectic liquid crystalline phase at 124 °C and finally melts at 156 °C. The thermographs of a gall- stone and of cholesterol monohydrate observed here are almost identical. However, on second cycles both materials show phase changes similar to anhydrous cholesterol. This implies that on heating to higher temperatures in the first cycle the chemistry of cholesterol monohydrate changes to anhydrous cholesterol by driving off water. Phase transitions
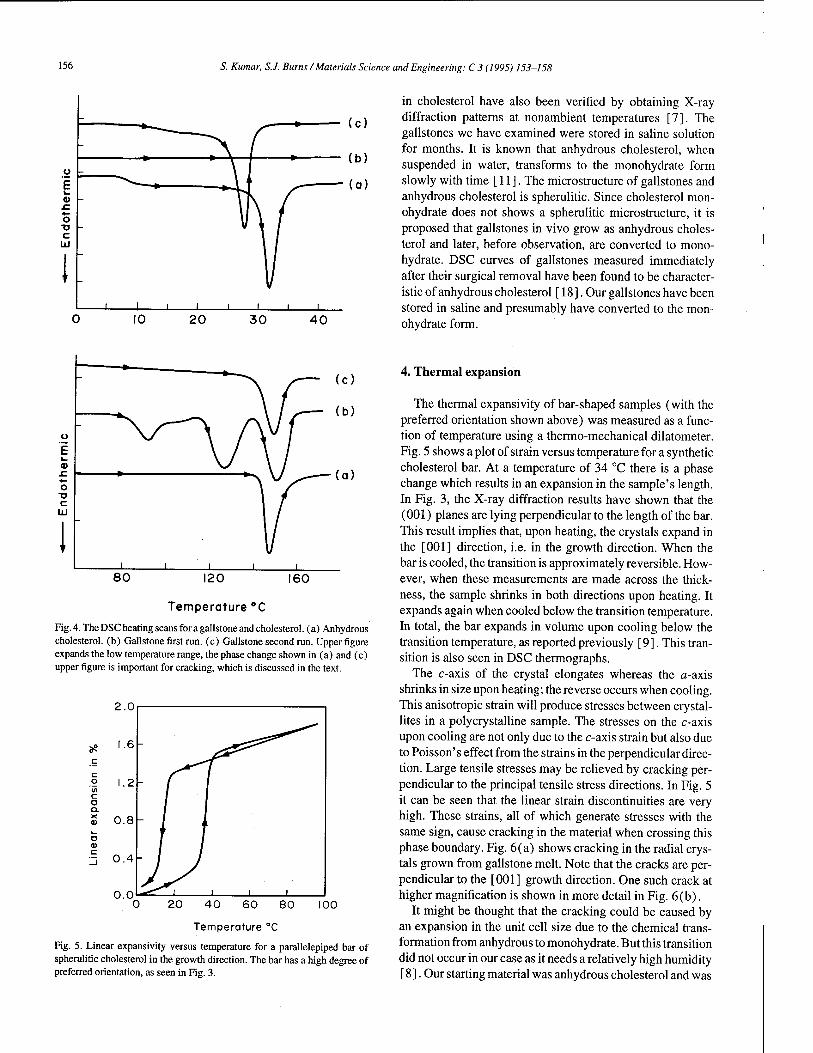
156 S. Kumar, S.J. Burns /Materials Science and Engineering: C 3 (1995) 153-158
in cholesterol have also been verified by obtaining X-ray diffraction patterns at nonambient temperatures [7]. The gallstones we have examined were stored in saline solution for months. It is known that anhydrous cholesterol, when suspended in water, transforms to the monohydrate form slowly with time [11]. The microstructure of gallstones and anhydrous cholesterol is spherulitic. Since cholesterol mon- ohydrate does not shows a spherulitic microstructure, it is proposed that gallstones in vivo grow as anhydrous choles- terol and later, before observation, are converted to mono- hydrate. DSC curves of gallstones measured immediately after their surgical removal have been found to be character- istic of anhydrous cholesterol [ 18]. Our gallstones have been stored in saline and presumably have converted to the mon- ohydrate form.
160
Temperature °C
Fig. 4. The DSC heating scans for a gallstone and cholesterol. (a) Anhydrous cholesterol, (b) Gallstone first run. (c) Gallstone second run. Upper figure expands the low temperature range, the phase change shown in (a) and (c) upper figure is important for cracking, which is discussed in the text.
c
o Q.
D 0) c
2.0
100
Temperature °C
Fig. 5. Linear expansivity versus temperature for a parallelepiped bar of spherulitic cholesterol in the growth direction. The bar has a high degree of preferred orientation, as seen in Fig. 3.
4. Thermal expansion
The thermal expansivity of bar-shaped samples (with the preferred orientation shown above) was measured as a func- tion of temperature using a thermo-mechanical dilatometer. Fig. 5 shows a plot of strain versus temperature for a synthetic cholesterol bar. At a temperature of 34 °C there is a phase change which results in an expansion in the sample's length. In Fig. 3, the X-ray diffraction results have shown that the (001) planes are lying perpendicular to the length of the bar. This result implies that, upon heating, the crystals expand in the [001] direction, i.e. in the growth direction. When the bar is cooled, the transition is approximately reversible. How- ever, when these measurements are made across the thick- ness, the sample shrinks in both directions upon heating. It expands again when cooled below the transition temperature. In total, the bar expands in volume upon cooling below the transition temperature, as reported previously [9]. This tran- sition is also seen in DSC thermographs.
The c-axis of the crystal elongates whereas the a-axis shrinks in size upon heating; the reverse occurs when cooling. This anisotropic strain will produce stresses between crystal- lites in a polycrystalline sample. The stresses on the c-axis upon cooling are not only due to the c-axis strain but also due to Poisson' s effect from the strains in the perpendicular direc- tion. Large tensile stresses may be relieved by cracking per- pendicular to the principal tensile stress directions. In Fig. 5 it can be seen that the linear strain discontinuities are very high. These strains, all of which generate stresses with the same sign, cause cracking in the material when crossing this phase boundary. Fig. 6(a) shows cracking in the radial crys- tals grown from gallstone melt. Note that the cracks are per- pendicular to the [001] growth direction. One such crack at higher magnification is shown in more detail in Fig. 6(b).
It might be thought that the cracking could be caused by an expansion in the unit cell size due to the chemical trans- formation from anhydrous to monohydrate. But this transition did not occur in our case as it needs a relatively high humidity [ 8]. Our starting material was anhydrous cholesterol and was

5. Kumar, S.J. Burns / Materials Science and Engineering: C 3 (1995) 153-158 157
- ' *.•■•■ in*' '' y* '•■«¥?•*,
. ■'- ■**>■■ ">■;■ . -'~>(&&5M* \o:». m >fc.>-- J^i *"*5>*'." *
7,-:-tt
<b) |fc':£S$ ^TTW '^W^ ^HI Fig. 6. (a) A transmission optical micrograph showing cracks in the radial crystals grown from a gallstone melt. These cracks are perpendicular to the growth direction, (b) A high magnification photograph of one such crack.
protected from the atmosphere by a glass cover slip. In addi- tion, we have noticed that gallstones and our synthetic cho- lesterol bars change density and are flawed when cooled to room temperature; this makes them fragile. Others [ 19] have argued that natural gallstones generate cavities by evapora- tion of bile afterremoval from the human body. These cavities are most likely the cracks produced by the phase transition discussed. Another possible reason for cracking might be cooling due to anisotropic thermal expansion of asymmetric crystals. We observed cracking only when the crystals were cooled across the phase boundary. No cracking was observed between the resolidification temperature and the phase tran- sition temperature. We believe therefore that cracking in gall- stones is caused by the phase change at 31 °C. It is known that in vivo and in vitro lithotripsy treatments require a dif- ferent number of pulses to break gallstones. The stones are easy to break in vitro but very stubborn in vivo. Gallstones removed from the body are generally cooled to room tem- perature, thereby inducing a phase transition in the stones. The phase change in turn may generate many internal cracks.
The phase transitions observed here could also presumably be achieved chemically. The temperature of the last phase transition described will occur in natural anhydrous stones if
it is only a few degrees below body temperature. The phase boundary might also be traversed by chemical destabilization. The phase transformation for repeated cracking might be very useful in flawing anhydrous cholesterol. Gallstones which are cracked when subjected to lithotripter pulses will be much easier to break resulting in higher success rates for patients treated using this method.
5. Conclusions
We have studied the microstructure after recrystallization from gallstone melt. The microstructure consists of radial crystals emerging from a unique nucleation center. The microstructure is similar to the stones grown from cholesterol and gallstones grown in vivo. The radial growth length is a linear function of time. The growth rate has been reported over a range of temperatures. With increasing supercooling the growth rate increases, reaches a maximum, and then decreases again. From the growth kinetics curve the growth rate at body temperature is projected to be between 10~4 jam s_1 to 10~6 yum s_1. The radial crystals of cholesterol grow preferentially in the [001] direction. The growth kinetics curve and microstructural evidence prove that the gallstones grow by the spherulitic mechanism.
In the human body cholesterol occurs as anhydrous and monohydrate cholesterol. It is believed that gallstones first deposit in the body in the anhydrous form and presumably later convert to cholesterol monohydrate. The DSC thermo- graph of a gallstone is similar to that of cholesterol mono- hydrate showing two phase changes before melting. At 86 °C it shows a loss of water of hydration, then a smectic liquid crystalline phase change at 124 °C. Upon melting it converts to its anhydrous form. It is the anhydrous form which exhibits the property of spherulitic crystallization. The anhydrous form shows a phase change close to human body temperature. There is a significant amount of strain associated with the phase change which results in cracking of the cholesterol crystals.
Acknowledgments
We wish to thank the National Institutes of Health for supporting this work through USPHS Grant DK 39796. We are also grateful to Professor A.R. Basu for showing us a collection of natural gallstone sections which resulted from his collaboration with Dr. N. Vakil.
References
[1] G.F. Gibbons, K.A. Mitropoulos and N.B. Myant, Biochemistry of Cholesterol, Elsevier Biomedical, Amsterdam, 1982.
[2] M. Esfahani and J.B. Swaney, Advances in Cholesterol Research, Telford Press, Philadelphia, 1990.

158 S. Kumar, S.J. Burns /Materials Science and Engineering: C 3 (1995) 153-158
[3] D. Kritchevsky, Cholesterol, Wiley, New York, 1958. [4] D.M. Small, Gastroenterology, 52 (1967) 607. [5] DJ. Sutorand S.E. Wooley, Gut, 12 (1971) 55. [6] S. Kumar and S.J. Bums, J. Mater. Sei.: Mater. Med., 4 (1993) 460. [7] S. Kumar, S.J. Burns and T.N. Blanton, J. Mater. Res., 10 (1995) 216. [8] H.L. Spier and K.G. Van Seneden, Steroids, 6 (1965) 871. [9] K. Van Putte, W. Skoda and M. Petroni, Chem. Phys. Lipids, 2 (1968)
361. [10] N.N. Petropavlov and N.F. Kostin, Sov. Phys. Crystall, 21 (1976)
525. [11] C.R. Loomis, G.G. Shipley and D.M. Small,/ LipidRes., 20 (1979)
525.
[12] A.J. Aho, E. Vilhonen, S. Peltola and A. Ixhtonen, Scand. J. Gastroenterol, 20 (1985) 901.
[13] W. Eprecht, H. Rosenmund and H.R. Schinz, Fortschr. Gebiete Roengenstrahlen Nuklearmed., 79 (1953) 1.
[14] F.M. Konikoff, D.S. Chung, J.M. Donovan, D.M. Small and M.C. Carvey, J. Clin. Invest., 90 (1992) 1155.
[15] G.W. Drach,7. Urol, 141 (1989) 711. [ 16] I. Nudelman, J. Cryst. Growth 130 (1993) 1. [17] H.S. Shieh, L.G. Hoard and C.E. Nordman, Nature, 267 (1977) 287. [ 18] E. Dubler and B. Kambler, Proc. 6th Int. Conf. on Thermal Analysis,
Bayreuth, Germany, Birkhauser Verlag, Basel, 1980, p. 531. [ 19] N. Vakil and E.C. Everbach, Gastroenterology, 707 (1991) 1628.
OPTICAL MATERIALS An International Journal on the Physics and Chemistry of Optical Materials
and their Applications, including Devices
Editor-in-Chief: R.C. Powell, Center for Laser Research, Noble Research Center 413, Oklahoma State University, Stillwater, OK 74078, USA
Associate Editors:
C.B. de Aurajo, Recife, Brazil, T.T. Basiev, Moscow, Russia, J.D. Bierlein, Wilmington, DE, USA, LA. Boatner, Oak Ridge, TN, USA, G. Boulon, Villeurbanne, France, L.L. Chase, Livermore, CA, USA, Chen Chuangtian, Fujian, China, H.J. Eichler, Berlin, Germany, J. Fousek, Prague, Czechoslovakia, Fuxi Gan, Shanghai, China, D.C. Hanna, Southampton, UK, J. Hegarty, Dublin, Ireland, J.P. Huignard, Orsay, France, C. Klingshirn, Karlsruhe, Germany, G.C. Righini, Florence, Italy, J. Rubio, Istapalapa, Mexico, H. Sakaki, Tokyo, Japan, J. Shirk, Washington, DC, USA, G.I. Stegeman, Orlando, FL, USA, A. Szabo, Ottawa, Canada, C. Taliani, Bologna, Italy, R.J. Twieg, San Jose, CA, USA, S. Umegaki, Kanagawa, Japan, M.J. Weber, Livermore, CA, USA, B. Wherrett, Edinburgh, UK, D.J. Wolford, Yorktown Heights, NY, USA
Audience:
Academic and industrial researchers involved in emerging optical technologies such as optical computing, optical communications, optics in medicine, etc.
Abstracted/indexed in:
ASM International Materials Information, Chemical Abstract Service, Compendex Plus, Current Contents (ISI), IEE, Inspec.
1995 Subscription Data:
Volume 4 (in 6 issues) Price: Dfl. 580.00 (US$305.00) ISSN 0925-3467
MBiaiaa
jp -4 > I
Aims and Scope:
Optical Materials provides a means of communication and technology transfer between researchers who are interested in materials for potential device applications. The journal publishes original papers and review articles on the design, synthesis, characterisation and applications of optical materials. OPTICAL MATERIALS focuses on: • Optical Properties of Material
Systems; • The Materials Aspects of Optical
Phenomena; • The Materials Aspects of Devices
and Applications.
Special Volume 4/2-3: Photorefractive Materials Growth and Doping, Optical and Electrical Characterizations, Charge Transfer Processes and Space Charge Field Effects, Applications Proceedings of the 1994 E-MRS Spring Conf., Symp. C, Strasbourg, May 1994
Edited by G. Roosen, F. Agullö-Löpez, O. Schirmer
NORTH-HOLLAND (an imprint of Elsevier Science)
Elsevier Science B.V. P.O. Box 211
1000 AE Amsterdam The Netherlands
Tel: +31 (20) 485 3642 Fax: +31 (20) 485 3598
In the USA & Canada: Elsevier Science Inc.
PO Box 945, New York 10159-0945 Tel:+1(212) 633 3750 Fax:+1(212) 633 3764
ORDER FORM OPTICAL MATERIALS
El Please send me a free specimen copy.
D Please enter my 1995 subscription.
Ö Please send me a proforma invoice
D Payment enclosed (please underline): (Bank draft/Eurocheque/lnternational Money Order/Official Purchase Order Form/Personal Cheque/Postal Cheque)
EH Charge my credit card: D MasterCard D Eurocard D American Express D VISA D Access
Card No. Valid until
Name
Address
Tel: Fax: E mail:
Date Signature 415/J/693
Composite Materials Series, Volume 9
Damage Mechanics of Composite Materials
Edited by R. Take ja
©1994 320 pages Price: Dfl. 285.00 (US$162.75) ISBN 0-444-88852-7
Damage mechanics is concerned with mechanics-based analyses of microstructural events in solids responsible for changes in their response to external loading. The microstructural events can occur as cracks, voids, slipped regions, etc., with a spatial distribution within the volume of a solid. If a solid contains oriented elements in its microsctructure, e.g. fibers, the heterogeneity and asisotropy aspects create situations which form a class of problems worthy of special treatment. This book deals with such treatments with particular emphasis on application to technological composite materials. Chapter one describes the basic principles underlying both the micromechanics approach and the continuum damage mechanics approach. It also reviews the relevant statistical concepts. The next three chapters are devoted to developments of the continuum damage mechanics approach related to characterization of damage with internal variables, evolution of damage and its coupling
with other inelastic effects such as plasticity. Chapter 5 describes observations of damage from notches in composite laminates and puts forward some pragmatic modelling ideas for a complex damage configuration. The next two chapters form the bulk of the micromechanics approach in this volume. The first one deals with microcracking and the other with interfacial damage in composite materials. Contents: Preface. 1. Basic principles (D. Krijcinovic, M. Basista, D. Surname). 2. Damage characterization by internal variables (R. Talreja). 3. Damage evolution in laminates (D.H. Allen). 4. Inelastic strains and damage (P. Ladeveze). 5. Damage accumulation (P.W.R.Beaumont).
ELSEVIER SCIENCES
6. Matrix microcracking (J.A. Nairn, S. Hu). 7. Interfacial damage (}. Aboudi). Subject index. Author index.
TO ORDER Contact your regular supplier or: ELSEVIER SCIENCE B.V. attn. K. van der Harst P.O. Box 103 1000 AC Amsterdam The Netherlands Fax: (+31) 20 5862580
Customers in the USA and Canada: ELSEVIER SCIENCE INC. attn. J. Weislogel P.O. Box 882 Madison Square Station New York, NY 10159, USA Fax: (212) 633 3680
No postage will be added to prepaid book orders. Dutch Guilder pricefs) quoted applies worldwide US Dollar priceis) quoted may be subject to exchange rate fluctuations. Customers in the European Community should add the appropriate VAT rate applicable in their country to the price(s). In New York State please add applicable sales tax. All prices are subject to change without prior notice.
415fb/615
Guide for Authors
Submission of papers Manuscripts should be submitted to the Editor closest to you:
P. Calvert University of Arizona Arizona Materials Laboratories Department of Materials Science and Engineering 4715 E. Fort Lowell Road Tucson, AZ 85712, USA Telephone: +1(602)322-2994 Fax: +1(602)322-2993
D. De Rossi University of Pisa Centra E. Piaggio Faculty of Engineering Via Diotisalvi 2 56126 Pisa, Italy Telephone: +39(50)553639 Fax: +39(50)550650
T. Tateishi Mechanical Engineering Laboratory Agency for Industrial Science and Technology AIST/MITI 1-2Namiki Tsukuba, Ibaraki 305, Japan Telephone: +81(298)587013 Fax: +81(298)587091
Manuscripts Three copies should be submitted to the Editor, in double-spaced typing on pages of A4 size and with wide margins (Letters should not exceed 2000 words and a maximum of 5 figures). All tables and illus- trations should bear a title or legend. All papers should be written in English. An abstract should accompany reviews, original papers and Letters. It should present (preferably in 100-150 words; 50 words or less for Letters) a brief and factual account of the contents and conclusions of the paper, and an indication of the relevance of new material. References should be indicated by numerals in square brackets, intro- duced consecutively and appropriately in the text. References must be listed on separate sheet(s) atthe end of the paper.
Every reference appearing in the text should be quoted in the reference list, and vice versa. When reference is made to a publication written by more than two authors it is preferable to give only the first author's name in the text followed by 'etal.'. However, in the list of references the names and initials of all authors must be given. Three sets of figures should be submitted. One set of line drawings should be in a form suitable for reproduction, drawn in Indian ink on drawing or tracing paper (letter height, 3-5 mm). Alternatively, such illustrations may be supplied as high contrast, black-and-white glossy prints. Duplicate original micrographs should be provided wherever possible to facilitate the refereeing process. Magnifications should be indicated by a ruled scale bar on the micrograph. Captions to illustra- tions should be typed in sequence on a separate page. All abbreviated terms must be defined when first used (both in the abstract and in the text) and authors must express all quantities in SI units, with other units in parentheses if desired. Authors in Japan please note that information about how to have the English of your paper checked, corrected and improved (before sub- mission) is available from: Elsevier Science (Japan), 20-12 Yushima 3-chome, Bunkyo-ku, Tokyo 113; Tel: (03) 3833-3821; Fax: (03) 3836-3064.
Proofs Authors will receive proofs of papers in duplicate. (Authors will not receive proofs of letters, in order to achieve rapid publication.) They are requested to return one corrected proof as soon as possible. No new material may be inserted in the text at the time of proofreading. A 'note added in proof will be accepted only if permission has been obtained from the Editor.
Offprints Twenty-five offprints will be supplied free of charge to the author(s). Additional offprints may be ordered at prices shown on the offprint order form accompanying the proofs. For Letters an offprint order form will be sent after acceptance of the paper.
Further information All questions arising after acceptance of manuscripts, especially those relating to proofs, should be directed to: Elsevier Editorial Services, Mayfield House, 256 Banbury Road, Oxford OX2 7DH, UK. (tel. +44 1865 314900; fax. +441865 314990).
© 1995-Elsevier Science S.A. All rights reserved 0928-4931/95/$9.50 No part of this publication may be reproduced, stored in a retrieval system or transmitted in any form or by any means, electronic, mechanical, photocopying, recording or otherwise, without the prior written permission of the publisher, Elsevier Science S.A., P.O. Box 564,1001 Lausanne, Switzerland. Submission of an article for publication implies the transfer of the copyright from the author(s) to the publisher and entails the author(s) irrevocable and exclusive authorization of the publisher to collect any sums or considerations for copying or reproduction payable by third parties. Upon acceptance of an article by the journal, the author(s) will be asked to transfer copyright of the article to the publisher. This transfer will ensure the widest possible dissemination of information.
For Material Subject to US Copyright Law Special regulations for readers in the USA This journal has been registered with the Copyright Clearance Center, Inc. Consent is given for copying of articles for personal or internal use, or for the personal use of specific clients. This consent is given on the condition that the copier pays through the Center the per-copy fee stated in the code on the first page of each article for copying beyond that permitted by Sections 107 or 108 of the US Copyright Law. The appropriate fee should be forwarded with a copy of the first page of the article to the Copyright Clearance Center, Inc., 222 Rosewood Drive, Danvers, MA 01923, USA. If no code appears in an article, the author has not given broad consent to copy and permission to copy must be obtained directly from the author. The fee indicated on the first page of an article in this issue will apply retroactively to all articles published in the journal, regardless of the year of publication. This consent does not extend to other kinds of copying, such as for general distribution, resale, advertising and promotion purposes or for creating new collective works. Special written permission must be obtained from the publisher for such copying.
No responsibility is assumed by the publisher for any injury and/or damage to persons or property as a matter of products liability, negligence or otherwise, or from any use or operation of any methods, products, instructions or ideas contained in the material herein.
© The paper used in this publication meets the requirements of ANSI/NISO 239.48-1992 (Permanence of Paper).
Printed in The Netherlands

Fon Scientists and researchers working in the field of Materials Science and Engineering
Editors: L.J. Chen National Tsing Hua University Department of Materials Science and Engineering 101 Sec. 2 Kuang-Fu Road Hsinchu 300, Taiwan, ROC
U. Goesele Max-Planck-lnstitute for Microstructure Physics Weinbergweg 2 06120 Halle/Saale, Germany
K.N. Tu University of California Los Angeles Department of Materials Science and Engineering 405 Hilgard Avenue Los Angeles CA 90024-1595, USA
MATERIALS CHEMISTRY AND PHYSICS INCLUDING MATERIALS SCIENCE COMMUNICATIONS
An International, Interdisciplinary Journal on Science, Characterisation and Processing of Advanced Materials
... ■ :- -;:
Commenced publication 1976 Published in 16 issues in 1995 ISSN 0254-0584
AIMS AND SCOPE Materials Chemistry and Physics is devoted to short communications, full-length research papers and feature articles on interrelationships among structure, properties, processing and performance of materi- als. The Editors welcome manuscripts on thin films, surface and inter- face science, materials degradation and reliability, metallurgy, semiconductors and optoelectronic materials, fine ceramics, magnet- ics, superconductors, specialty polymers and composite materials.
The International Journal of the Chinese Society for Materials Science
ELSEVIER SCIENCE S.A. PO Box 564,1001 Lausanne Switzerland tel. :+41 (21)320 73 81 fax.:+41 (21)323 54 44
For customers in the USA and Canada:
ELSEVIER SCIENCE INC. Attn. Journal Information Center PO Box 882 Madison Square Station, New York NY 10159, USA tel. :+1 (212)633 3750 fax.:+1 (212)633 3764
MATERIALS CHEMISTRY AND PHYSICS Please send:
ELSEVIER
Name:
□ A free sample copy Q Instructions for authors □ Subscription information
o CO 5
Company/lnstitute:_
Street:
Country:
Date:
_City:
_PostalCode:_
^Signature:
0928-4931(199511)C3:2;1-H