Electron Transfer Kinetics on Mono- and Multilayer Graphene
12
VELICKÝ ET AL. VOL. 8 ’ NO. 10 ’ 10089–10100 ’ 2014 www.acsnano.org 10089 October 07, 2014 C 2014 American Chemical Society Electron Transfer Kinetics on Mono- and Multilayer Graphene Mat ej Velick y, † Dan F. Bradley, ‡ Adam J. Cooper, † Ernie W. Hill, § Ian A. Kinloch, ) Artem Mishchenko, ^ Konstantin S. Novoselov, ^ Hollie V. Patten, † Peter S. Toth, † Anna T. Valota, † Stephen D. Worrall, † and Robert A. W. Dryfe * ,† † School of Chemistry, § School of Computer Science, ) School of Materials, ^ School of Physics and Astronomy, University of Manchester, Oxford Road, Manchester M13 9PL, United Kingdom and ‡ Department of Chemistry, University of Liverpool, Crown Street, Liverpool L69 7ZD, United Kingdom G raphene has attracted significant interest due to its unique properties, namely, record charge carrier mobil- ity, 1 high thermal conductivity, 2 and me- chanical strength, 3 discovered following its isolation in 2004. 4 While applications of graphene in high-frequency transistors, flexible touch screens or photodetectors 5,6 will require high-quality material, other prop- erties of this two-dimensional (2D) nano- material, such as high specific surface area, optical transparency, 7 and the ability to sustain large current densities, 8 can be exploited using medium-quality material. Proposed applications include corrosion protection, 9 sensing and biotechnology, 10 and energy conversion/storage, i.e. Li-ion batteries, 11 solar cells, 12 and super- capacitors. 13 To evaluate graphene's perfor- mance as an electrode material, the hetero- geneous electron transfer (ET) rate between graphene surfaces and a redox mediator, k 0 , has to be determined and compared with its three-dimensional (3D) relativegraphite. Furthermore, the difference in ET kinetics at the basal planes, edges and defects of graphitic materials has been a topic of con- siderable scientific interest even before the discovery of graphene. 14,15 The literature, however, offers some contrasting views on the reactivity of mono- and multilayer gra- phene. Early ET measurements on individual graphene sheets were first reported by Li et al., 16 using both mechanically exfo- liated (ME) and chemical vapor deposition (CVD) grown flakes with ferrocenemethanol (FcMeOH) redox mediator, and Valota et al., 17 using ME flakes and Fe(CN) 6 3 : both reported accelerated kinetics on monolayer compared to bilayer samples (∼2-fold) 17 and graphite (∼10-fold), 16 respectively. Reactivity toward ET has been probed with Raman spectrosco- py to measure the extent of diazonium func- tionalization of ME graphene: the reactivity of the monolayer was again found to be higher than bi- and multilayers; similarly the diazo- nium reduction kinetics on the edge were faster than those on the basal plane. 18 ME yields high-quality flakes of pristine surface with limited contamination, allowing * Address correspondence to [email protected]. Received for review May 23, 2014 and accepted October 7, 2014. Published online 10.1021/nn504298r ABSTRACT Understanding of the electrochemical properties of graphene, especially the electron transfer kinetics of a redox reaction between the graphene surface and a molecule, in comparison to graphite or other carbon-based mate- rials, is essential for its potential in energy conversion and storage to be realized. Here we use voltammetric determination of the electron transfer rate for three redox mediators, ferricyanide, hexaammineruthenium, and hexachloroiridate (Fe(CN) 6 3 , Ru(NH 3 ) 6 3þ , and IrCl 6 2 , respectively), to measure the reactivity of graphene samples prepared by mechanical exfoliation of natural graphite. Electron transfer rates are measured for varied number of graphene layers (1 to ca. 1000 layers) using microscopic droplets. The basal planes of mono- and multilayer graphene, supported on an insulating Si/SiO 2 substrate, exhibit significant electron transfer activity and changes in kinetics are observed for all three mediators. No significant trend in kinetics with flake thickness is discernible for each mediator; however, a large variation in kinetics is observed across the basal plane of the same flakes, indicating that local surface conditions affect the electrochemical performance. This is confirmed by in situ graphite exfoliation, which reveals significant deterioration of initially, near-reversible kinetics for Ru(NH 3 ) 6 3þ when comparing the atmosphere- aged and freshly exfoliated graphite surfaces. KEYWORDS: graphene . graphite . basal plane . electron transfer . kinetics . electrochemistry . voltammetry ARTICLE
-
Upload
manchester -
Category
Documents
-
view
0 -
download
0
Transcript of Electron Transfer Kinetics on Mono- and Multilayer Graphene

VELICKÝ ET AL. VOL. 8 ’ NO. 10 ’ 10089–10100 ’ 2014
www.acsnano.org
10089
October 07, 2014
C 2014 American Chemical Society
Electron Transfer Kinetics onMono- and Multilayer GrapheneMat�ej Velick�y,† Dan F. Bradley,‡ Adam J. Cooper,† Ernie W. Hill,§ Ian A. Kinloch, ) Artem Mishchenko,^
Konstantin S. Novoselov,^ Hollie V. Patten,† Peter S. Toth,† Anna T. Valota,† Stephen D. Worrall,† and
Robert A. W. Dryfe*,†
†School of Chemistry, §School of Computer Science, )School of Materials, ^School of Physics and Astronomy, University of Manchester, Oxford Road,Manchester M13 9PL, United Kingdom and ‡Department of Chemistry, University of Liverpool, Crown Street, Liverpool L69 7ZD, United Kingdom
Graphene has attracted significantinterest due to its unique properties,namely, record charge carrier mobil-
ity,1 high thermal conductivity,2 and me-chanical strength,3 discovered following itsisolation in 2004.4 While applications ofgraphene in high-frequency transistors,flexible touch screens or photodetectors5,6
will require high-qualitymaterial, other prop-erties of this two-dimensional (2D) nano-material, such as high specific surfacearea, optical transparency,7 and the abilityto sustain large current densities,8 can beexploited using medium-quality material.Proposed applications include corrosionprotection,9 sensing and biotechnology,10
and energy conversion/storage, i.e. Li-ionbatteries,11 solar cells,12 and super-capacitors.13 To evaluate graphene's perfor-mance as an electrode material, the hetero-geneous electron transfer (ET) rate betweengraphene surfaces and a redoxmediator, k0,has to be determined and comparedwith itsthree-dimensional (3D) relative�graphite.Furthermore, the difference in ET kinetics
at the basal planes, edges and defects ofgraphitic materials has been a topic of con-siderable scientific interest even before thediscovery of graphene.14,15 The literature,however, offers some contrasting views onthe reactivity of mono- and multilayer gra-phene. Early ETmeasurements on individualgraphene sheets were first reported byLi et al.,16 using both mechanically exfo-liated (ME) and chemical vapor deposition(CVD) grown flakes with ferrocenemethanol(FcMeOH) redoxmediator, and Valota et al.,17
usingMEflakes and Fe(CN)63�: both reported
accelerated kinetics onmonolayer comparedto bilayer samples (∼2-fold)17 and graphite(∼10-fold),16 respectively. Reactivity towardET has been probed with Raman spectrosco-py to measure the extent of diazonium func-tionalization ofMEgraphene: the reactivity ofthe monolayer was again found to be higherthan bi- and multilayers; similarly the diazo-nium reduction kinetics on the edge werefaster than those on the basal plane.18
ME yields high-quality flakes of pristinesurface with limited contamination, allowing
* Address correspondence [email protected].
Received for review May 23, 2014and accepted October 7, 2014.
Published online10.1021/nn504298r
ABSTRACT Understanding of the electrochemical properties of graphene,
especially the electron transfer kinetics of a redox reaction between the graphene
surface and a molecule, in comparison to graphite or other carbon-based mate-
rials, is essential for its potential in energy conversion and storage to be realized.
Here we use voltammetric determination of the electron transfer rate for three
redox mediators, ferricyanide, hexaammineruthenium, and hexachloroiridate
(Fe(CN)63�, Ru(NH3)6
3þ, and IrCl62�, respectively), to measure the reactivity of graphene samples prepared by mechanical exfoliation of natural
graphite. Electron transfer rates are measured for varied number of graphene layers (1 to ca. 1000 layers) using microscopic droplets. The basal planes of
mono- and multilayer graphene, supported on an insulating Si/SiO2 substrate, exhibit significant electron transfer activity and changes in kinetics are
observed for all three mediators. No significant trend in kinetics with flake thickness is discernible for each mediator; however, a large variation in kinetics
is observed across the basal plane of the same flakes, indicating that local surface conditions affect the electrochemical performance. This is confirmed by
in situ graphite exfoliation, which reveals significant deterioration of initially, near-reversible kinetics for Ru(NH3)63þ when comparing the atmosphere-
aged and freshly exfoliated graphite surfaces.
KEYWORDS: graphene . graphite . basal plane . electron transfer . kinetics . electrochemistry . voltammetry
ARTIC
LE
VELICKÝ ET AL. VOL. 8 ’ NO. 10 ’ 10089–10100 ’ 2014
www.acsnano.org
10090
the fundamental electrochemical properties of graph-ene to be explored. Nevertheless, ME preparation islaborious, requires “hunting” for flakes, reliable con-tacting/masking of the electrode, and is further com-plicated by fracture of monolayer graphene uponexposure to many aqueous and organic solutions.19
Most reports of graphene electrochemistry use a mix-ture of graphene platelets of various thicknesses andlateral dimensions, usually prepared via liquid-phaseexfoliation or reduction of graphene oxide, immobi-lized on a conducting substrate.20�22 While this meth-od is convenient for characterization of graphenecomposites, sensing layers or paints, it does not pro-vide insight into electrochemical activity of individualgraphene flakes and the roles of the basal/edge planeand defects, due to the sample's polycrystalline natureand the presence of the underlying conductor. Also,the discontinuous nature of the plateletmixture resultsin poor conductivity in thin samples.23 Brownson et al.
reported slow ET kinetics for samples with a high basal-to-edge plane ratio (for Fe(CN)6
3�, Ru(NH3)63þ, and two
other mediators).20 Similarly, Zhang et al. reportedextremely high k0 for Fe(CN)6
3� and Ru(NH3)63þ on
reduced graphene oxide (∼1 and 10 cm s�1, re-spectively) attributed to edges and defects.24 Ambrosiet al. found that open graphene edges exhibit fasterkinetics than folded edges (Fe(CN)6
3�),25 while Gohand Pumera concluded that the ET rate is independentof the number of graphene layers (dopamine andascorbic acid mediators).21
CVDgrowngraphene has also been a popular choicefor ET studies, either using the original growth sub-strate (typically Cu or Ni)26 or following transfer onto aninsulating substrate as shown for Fe(CN)6
3� and IrCl62�
mediators.27 The underlying conductive substrate orchemicals used during the flake transfer, however, caninterfere with the electrochemical response. Consider-able advances have been made with the employmentof scanning electrochemicalmicroscopy (SECM), whichcan be efficiently used to monitor the electrochemicalresponse of a surface with submicrometer scale spatialresolution. Tan et al. reported increased ET rateson mechanically and chemically induced defects, incomparison to the pristine graphene surface, usingFcMeOH and Fe(CN)6
3�.28 The same group followedwith an extensive study in both aqueous and organicsolutions, demonstrating finite to near-reversible ki-netics (k0 between ∼10�4 to 10�2 cm s�1) of 10 differ-ent redoxmediators including FcMeOH, Fe(CN)6
3� andRu(NH3)6
3þ, with the limits in kinetics being inherentboth to graphene and the nature of the mediator.29
A variant of SECM, scanning electrochemical cell mi-croscopy (SECCM), was used successfully by Güell et al.,who reported increasing ET kinetics with increasingnumber of CVD stacked graphene layers (from 1 to 7)using a ferrocene derivative as a mediator. Further-more, no increase of the ET rate was observed by these
authors at the edges or steps in comparison to thebasal planes.30
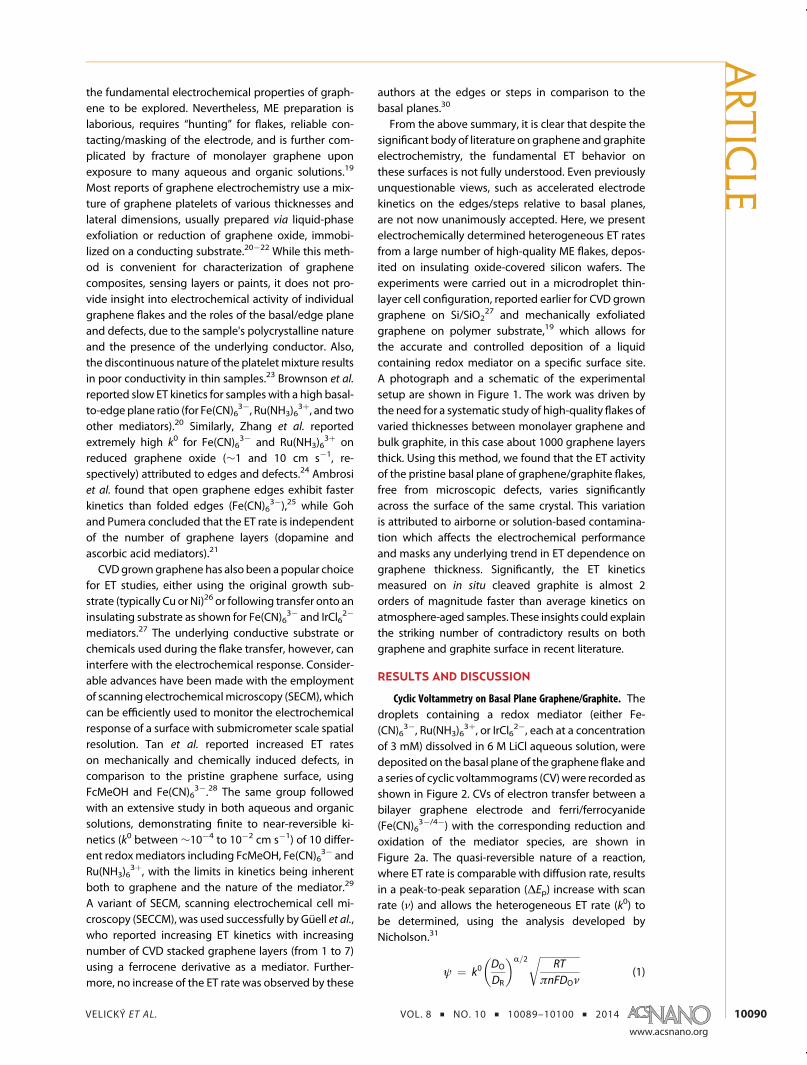
From the above summary, it is clear that despite thesignificant body of literature on graphene and graphiteelectrochemistry, the fundamental ET behavior onthese surfaces is not fully understood. Even previouslyunquestionable views, such as accelerated electrodekinetics on the edges/steps relative to basal planes,are not now unanimously accepted. Here, we presentelectrochemically determined heterogeneous ET ratesfrom a large number of high-quality ME flakes, depos-ited on insulating oxide-covered silicon wafers. Theexperiments were carried out in a microdroplet thin-layer cell configuration, reported earlier for CVD growngraphene on Si/SiO2
27 and mechanically exfoliatedgraphene on polymer substrate,19 which allows forthe accurate and controlled deposition of a liquidcontaining redox mediator on a specific surface site.A photograph and a schematic of the experimentalsetup are shown in Figure 1. The work was driven bythe need for a systematic study of high-quality flakes ofvaried thicknesses between monolayer graphene andbulk graphite, in this case about 1000 graphene layersthick. Using this method, we found that the ET activityof the pristine basal plane of graphene/graphite flakes,free from microscopic defects, varies significantlyacross the surface of the same crystal. This variationis attributed to airborne or solution-based contamina-tion which affects the electrochemical performanceand masks any underlying trend in ET dependence ongraphene thickness. Significantly, the ET kineticsmeasured on in situ cleaved graphite is almost 2orders of magnitude faster than average kinetics onatmosphere-aged samples. These insights could explainthe striking number of contradictory results on bothgraphene and graphite surface in recent literature.
RESULTS AND DISCUSSION
Cyclic Voltammetry on Basal Plane Graphene/Graphite. Thedroplets containing a redox mediator (either Fe-(CN)6
3�, Ru(NH3)63þ, or IrCl6
2�, each at a concentrationof 3 mM) dissolved in 6 M LiCl aqueous solution, weredeposited on the basal plane of the graphene flake anda series of cyclic voltammograms (CV)were recorded asshown in Figure 2. CVs of electron transfer between abilayer graphene electrode and ferri/ferrocyanide(Fe(CN)6
3�/4�) with the corresponding reduction andoxidation of the mediator species, are shown inFigure 2a. The quasi-reversible nature of a reaction,where ET rate is comparable with diffusion rate, resultsin a peak-to-peak separation (ΔEp) increase with scanrate (ν) and allows the heterogeneous ET rate (k0) tobe determined, using the analysis developed byNicholson.31
ψ ¼ k0DO
DR
� �R=2 ffiffiffiffiffiffiffiffiffiffiffiffiffiffiffiffiRT
πnFDOν
r(1)
ARTIC
LE

VELICKÝ ET AL. VOL. 8 ’ NO. 10 ’ 10089–10100 ’ 2014
www.acsnano.org
10091
where ψ is the dimensionless kinetic parameter deter-mined from ΔEp, R is the transfer coefficient, n is thenumber of electrons transferred, F is the Faradayconstant, and R and T have their usual meanings. Inmost cases, it can be assumed that the diffusioncoefficients of the oxidized and reduced form (DO
and DR, respectively) of the mediator are approxi-mately equal and the reduction/oxidation kinetics arefairly symmetrical (R ∼ 0.5). In that case, ΔEp dependssolely on ψ (one-electron processes),31 the latter isdetermined from ΔEp, and eq 1 can be simplified to
ψ ¼ k0ffiffiffiffiffiffiffiffiffiRT
πFD
rν�0:5 (2)
In practice, ψ is calculated from ΔEp using an appro-priate working function and k0 determined from theslope of the ψ�ν�0.5 dependence corresponding toeq 2 as shown in Figure 2e.
Full details of the Nicholson method can be foundin the Supporting Information. While the workingcurve defined using this approach is limited to ΔEpbelow ca. 220mV, amethod developed by Klingler andKochi allows much larger ΔEp to be used for k0 evalua-tion. The following expression, which is derived underassumptions of electrode reaction irreversibility, canbe used to directly calculate k0 from the scan rate andΔEp, and is reliable for ΔEp ∼ 150 mV and beyond:32
k0 ¼ 2:18RnFDνRT
� �1=2
e�[(R2F=RT )nΔEp] (3)
As in the case of Nicholson analysis, it was assumedthat the reduction and oxidation are symmetrical, i.e.,R ≈ 0.5. The method was also validated by finite-element simulation of the voltammograms (Figure S4,Supporting Information).
The diffusion coefficient, required for the aboveanalyses can be determined from the Randles-�Sev�cíkequation, which relates the peak current, Ip, to the scanrate for the case of planar diffusion:33
Ip ¼ 0:4463n3F3
RT
!1=2
AD1=2cν1=2 (4)
where A is the area of the flake surface in contact withthe liquid and c is the bulk concentration of themediator. Although eq 4 has been widely used byresearchers to determine diffusion coefficients duringET rate measurements, it is only strictly valid forreversible electrochemical reactions, i.e., where ETkinetics are significantly faster than mass-transport.The peak current in quasi-reversible reactions, as isthe case here, is no longer proportional to ν1/2 andinstead more complex analysis is required to describethe peak current, with the quasi-reversible reactionzone corresponding to ΔEp of ∼62/n to 1000/n mV.34
We also found that the linear ψ�ν�0.5 dependencebreaks down when the droplet is significantly smallerthan 20 μm in diameter and/or the scan rate is de-creased below 100 mV s�1, most likely due to adeviation from the ideal semi-infinite linear diffusion
Figure 1. Experimental setup. (a) Photograph of the experimental setup. (b) Schematic depicting the Si/SiO2 wafer withmechanically exfoliated flakes (working electrode, WE) contacted via silver epoxy and copper wire, microscope objective anda micropipette, which contains reference (RE) and counter electrodes (CE) and is connected to a micromanipulator andmicroinjector. (c) An optical micrograph of a droplet deposited on the surface of a monolayer graphene flake. The dashedlines and curves indicate edge planes (black), steps (white), cracks/defects (orange), folds (green), and microdroplet/flakeinterface (blue).
ARTIC
LE

VELICKÝ ET AL. VOL. 8 ’ NO. 10 ’ 10089–10100 ’ 2014
www.acsnano.org
10092
regime within small droplets. Hence, the applied scanratewaskeptbetween the limits of 100and1000mVs�1,or 250 and 3000 mV s�1, corresponding to typical ΔEp
ranges of 200�600 and 300�900 mV, or 60�250 mV,for Fe(CN)6
3� and Ru(NH3)63þ, or IrCl6
2�, respectively.For these reasons, diffusion coefficients of the redox
Figure 2. Cyclic voltammograms and associated kinetic analyses at graphene/graphite electrodes. (a) CV of Fe(CN)63�/4� on
bilayer graphene, (b and d) show comparison of ET kinetics on 4-layer graphene using Ru(NH3)63þ/2þ and on∼70-layer thick
graphite using IrCl62�/3�. Corresponding Klingler-Kochi and Nicholson analyses and calculated ET rates (k0) are shown in
(c) and (e), respectively. The insets in the bottom right of graphs (a), (b), and (d) showmicrographs of the deposited droplets.The series of voltammetric curves were obtained starting from the fastest scan rate of 1000 mV s�1 (dark blue) down to theslowest scan rate of 100mV s�1 (gray) for Fe(CN)6
3�/4� and Ru(NH3)63þ/2þ and 3000�250mV s�1 for IrCl6
2�/3�. The potentialwas referenced against Ag/AgCl wire in 6 M LiCl, and held at the upper vertex potential for 10 s prior to the voltammetry(1 V for IrCl6
2�/3�). Change of the initial direction of the potential sweep had no observable effect.
ARTIC
LE

VELICKÝ ET AL. VOL. 8 ’ NO. 10 ’ 10089–10100 ’ 2014
www.acsnano.org
10093
mediators in 6 M LiCl (aq.) were determined indepen-dently, using a platinum disk macro-electrode withwell-defined reversible ET behavior, as 1.84 ((0.19) �10�6 cm2 s�1, 2.36 ((0.11) � 10�6 cm2 s�1, 2.27((0.14) � 10�6 cm2 s�1 for Fe(CN)6
3�, Ru(NH3)63þ
and IrCl62�, respectively (full details of analysis in
Supporting Information).For ΔEp < 220 mV, the kinetic parameter ψ was
plotted as a function of the inverse square root of scanrate (all of IrCl6
2�/3� and some Fe(CN)63�/4� data).31,34
This dependence yields a linear gradient, which isanalyzed using eq 2 and the heterogeneous ET rate,k0, calculated as shown in Figure 2e. ForΔEp > 220 mV,eq 3 was used to calculate individual k0 for each scanrate and the arithmetic mean was obtained (allof Ru(NH3)6
3þ/2þ and most of Fe(CN)63�/4� data) as
shown in Figure 2c. The above analysis was performedfor each individual droplet, i.e. for a microscopic surfaceof area ca. 300�3000 μm2, and, except for the near-reversible kinetics of IrCl6
2�/3� reduction/oxidation,the kinetics were found to be independent of thedroplet/graphene area (full details in Supporting In-formation, Figure S8). A comparison of the CVs revealswider ΔEp, hence slower kinetics, for Ru(NH3)6
3þ/2þ
and Fe(CN)63�/4� reduction/oxidation (Figure 2a,b)
and smaller ΔEp, hence faster kinetics, for IrCl62�/3�
reduction/oxidation (Figure 2d).Dependence of Electron Transfer Kinetics on the Number of
Graphene Layers. This work was motivated by the lack ofliterature consensus on the effect of the number ofgraphene layers on ET kinetics of a pristine basal plane.However, during the initial investigation, it was foundthat the ET rate often varied significantly across thesurface of the same flake and the resulting plot of theaveraged ET rate vs, number of graphene layers wasvery scattered. On these grounds, eight or more in-dividual droplet measurements were carried out onseveral flakes of the same thickness (or similar thick-ness for >20 layers) and the arithmetic mean of k0
obtained, with a total of 435 individual droplets ana-lyzed across the surface of 69 individual flakes. The k0
values for Fe(CN)63�/4�, Ru(NH3)6
3þ/2þ, and IrCl62�/3�
reduction/oxidation on flakes of varied thickness be-tween 1 and ca. 1000 graphene layers are shown inFigure 3, panels a, b, and c, respectively. It is apparentthat despite the large statistical sample there is not astrong correlation between the flake thickness and thebasal plane ET kinetics, although the variation is morepronounced for flakes with thickness less than 20graphene layers. The k0 values are scattered aroundthe arithmetic mean of the whole data set, which isindicated by the colored dashed line. For Fe(CN)6
3�/4�,the mean ET rates range from 0.13 ((0.02) � 10�3
cm s�1 for the bilayer to 2.09 ((1.27) � 10�3 cm s�1
for 7 layers, with an overall mean value of 0.90 ((0.13)�10�3 cm s�1. Ru(NH3)6
3þ/2þ kinetics range from0.11 ((0.12) � 10�4 cm s�1 for 20�30 layers to
1.55 ((0.14) � 10�4 cm s�1 for 7 layers and an overallmean value of 0.53 ((0.04) � 10�4 cm s�1. Finally,IrCl6
2�/3� reduction/oxidation kinetics range from 2.14((0.32) � 10�2 cm s�1 for 8�9 layers to 4.91 ((0.58)�10�2 cm s�1 for a bilayer and an overall mean valueof 3.13 ((0.10) � 10�2 cm s�1. The IrCl6
2�/3� kineticsrecorded on multilayer graphene flakes are on thesame order of magnitude as our previous work onflakes on a polymer substrate.19
Figure 3. Heterogeneous ET rate, k0, between the aqueous-based redoxmediator andmechanically exfoliated graphiteflakes of varied thicknesses. The averaged ET rates ofreduction/oxidation of (a) Fe(CN)6
3�/4�, (b) Ru(NH3)63þ/2þ
and IrCl62�/3� reduction/oxidation are plotted as a function
of the number of graphene layers. Each point on the graphis an arithmetic mean of at least 8 (thick flakes >7 layers) or12 (thin flakes e7 layers) individual droplet measurementson a pristine basal plane surface of one or more flakes of agiven thickness. The error bars are standard deviations of themean. The number of individual droplets included in the ana-lysis was 145, 146, and 144 for Fe(CN)6
3�/4�, Ru(NH3)63þ/2þ,
and IrCl62�/3�, respectively. In total, 69 individual crystal
surfaces were used for the analysis. Note that the graphs areshown on a semilogarithmic scale.
ARTIC
LE

VELICKÝ ET AL. VOL. 8 ’ NO. 10 ’ 10089–10100 ’ 2014
www.acsnano.org
10094
The effects of uncompensated resistance due toflake thickness/ohmic contacts, which would affectΔEp and hence the calculated k0, were ruled out(Figures S11�S14, Supporting Information).
The variation of the kinetics across the surface ofthe same graphene crystal is the dominating factor,which increases the uncertainty and masks any under-lying trends in the change of kinetics with flake thick-ness. Table 1 summarizes the ET kinetics data obtainedfor all three redox mediators.
Surface Sensitivity to Contaminants. Significant variationof the ET rate across different surface sites of the sameflake is also reflected in the large relative errors of someofthe data in Table 1 (especially for Fe(CN)6
3�/4�). Thisconfirms that, beyond any intrinsic dependence flakethickness, the kinetics also reflect local surface conditions,i.e., are spatially dependent. Unfortunately, these twofactors are difficult to separate experimentally. Sensitivityof graphite surfaces to exposure to the atmosphere andtherefore oxygen, moisture and other contaminants, hasbeen previously reported to affect electrode kineticsmeasurements.35 For example, Patel et al. performed anextensive study of reduction/oxidation of Fe(CN)6
3�/4�
and Ru(NH3)63þ/2þ on highly oriented pyrolytic graphite
(HOPG), demonstrating that both atmospheric exposureof the HOPG and prolonged voltammetric measurementsignificantly diminish the ET kinetics, indicating surfacepoisoning and passivation.35 Indeed, other recent studiesby the same group confirmed that the pristine basalplane of freshly cleaved HOPG actually has remarkablyhigh ET activity,36,37 in contrast to previous reports.38,39
We observe a significant difference in kineticsbetween freshly cleaved and aged surfaces of naturalgraphite, exposed to the ambient environment fordays or weeks, in accordance with results reported byPatel et al.35 The tip of the micropipette was used tocleave layers of graphite from the edge, forcing theliquid into contact with the freshly exposed surface,without exposure to the atmosphere. The CVs re-corded immediately after the in situ cleavage of graph-ite (original thickness of 313 nm, ∼933 graphenelayers) revealed significantly reduced ΔEp of ca.
80�130 mV for the applied scan rate range, and k0,averaged for three different cleaved areas, was deter-mined as 4.73 ((0.39) � 10�3 cm s�1, indicating near-reversible kinetic behavior, close to 2 orders of magni-tude faster than the overall arithmetic mean for all theatmosphere-aged basal planes (see Table 1). It isevident that Ru(NH3)6
3þ/2þ reduction/oxidation exhi-bits much faster kinetics on the freshly cleaved surfacethan on surfaces exposed to the ambient environment.The microcleaved area includes the edges of graphite,so measurement of a droplet deposited such that itcovered the edge plane was carried out as a control.This did not reveal a significant change in the ET rate,which confirms that the observed difference is purelydue to the inherent difference between freshly cleavedand aged surfaces of graphite (Figure S15, SupportingInformation). The in situ cleavage was also attemptedon thinner flakes; however, the method fails for thick-nesses below ca. 20 nm as it is difficult to avoid tip-induced damage of the flakes. The rapid deterioration
TABLE 1. Heterogeneous ET Rate, k0, of Reduction/Oxidation of Three Redox Mediators on Natural Graphene/Graphite
Electrodes of Varied Thicknessesa
Fe(CN)63�/4� Ru(NH3)6
3þ/2þ IrCl62�/3�
no. of layers k0/10�3 cm s�1 Δ/k0 k0/10�4 cm s�1 Δ/k0 k0/10�2 cm s�2 Δ/k0
1 0.15 ( 0.02 0.12 0.31 ( 0.10 0.31 3.48 ( 0.47 0.132 0.13 ( 0.02 0.16 1.02 ( 0.12 0.12 4.91 ( 0.58 0.123 0.93 ( 0.35 0.38 0.52 ( 0.12 0.23 3.15 ( 0.48 0.154 0.57 ( 0.13 0.22 0.36 ( 0.09 0.24 3.07 ( 0.22 0.075 0.23 ( 0.05 0.23 0.52 ( 0.09 0.17 2.87 ( 0.19 0.076 0.46 ( 0.11 0.25 1.14 ( 0.12 0.10 2.93 ( 0.17 0.067 2.09 ( 1.27 0.61 1.55 ( 0.14 0.09 4.08 ( 0.47 0.118�9 � � 0.95 ( 0.25 0.27 2.14 ( 0.32 0.1511�13 2.07 ( 0.83 0.40 0.15 ( 0.05 0.34 3.16 ( 0.20 0.0620�30 1.97 ( 0.98 0.50 0.11 ( 0.06 0.59 3.40 ( 0.11 0.0350�60 0.68 ( 0.17 0.25 0.22 ( 0.10 0.47 3.11 ( 0.17 0.0580�90 0.24 ( 0.12 0.51 0.28 ( 0.08 0.29 2.73 ( 0.22 0.08100�130 1.22 ( 0.16 0.13 0.36 ( 0.03 0.09 3.20 ( 0.15 0.05220�250 0.84 ( 0.17 0.20 0.17 ( 0.03 0.16 2.87 ( 0.12 0.04300�500 1.33 ( 0.49 0.37 0.45 ( 0.08 0.19 3.30 ( 0.15 0.05>1000 0.78 ( 0.18 0.23 0.23 ( 0.07 0.31 2.25 ( 0.15 0.07mean 0.90 ( 0.13 0.30 0.53 ( 0.04 0.25 3.13 ( 0.10 0.08cleaved � � 47.3 ( 3.9 0.08 � �
a The errors are standard deviations of 8 or more measurements at various locations on flakes of the same thickness. The number of graphene layers was determined using acombination of optical microscopy, Raman spectroscopy and atomic force microscopy (AFM) as described in the Methods. The variation of the ET kinetics on flakes of the samethickness is reflected in the relative error, Δ/k0. Arithmetic means and their standard deviations are also listed at the bottom of table.
ARTIC
LE

VELICKÝ ET AL. VOL. 8 ’ NO. 10 ’ 10089–10100 ’ 2014
www.acsnano.org
10095
of the surface upon exposure to air is likely to occurwithin minutes or hours after exfoliation as suggestedby other groups.35,40
The findings above lead to several conclusionsabout the ET kinetics on mono- and multilayer gra-phene surface. The data supports an increasingamount of evidence in the literature,17,19,30,35�37 thatthe basal plane of graphitic surfaces is active withrespect to electron transfer. Only pristine basal planes,whose defect-free nature was confirmed by the ab-sence of D-peak in Raman spectrum (see Methods),were chosen for the droplet deposition. Nevertheless,the optical resolution of this method is ∼1 μm, mean-ing that nanoscale defects could remain undetectedand affect the ET measurement. In such a scenario, thelarge variation of the kinetics across the surface of thesame flakes could be explained by random distributionof nanoscale defects increasing the ET activity, inaccordance with the traditional view of graphiteelectrochemistry.14,15 Recent studies on the mobilityof atoms ongraphene surfaces show that not only doesthe graphene lattice undergo a self-repair mechanismof its basal plane, but also metallic impurities tend tomigrate toward the edge planes and defect sites,where they are stabilized.41,42 This insight plays asignificant role in the electrochemistry of grapheneand contributes to the ongoing debate regarding edgeplane/defect vs basal plane ET activity, as most metalshave very fast ET kinetics toward most redoxmediators.43 This was also demonstrated by Ritzertet al., who observed an increased ET rate upon adsorp-tion of kinetic-enhancing redox-active species on ca.
1/100 of the graphene surface, confirming that evensmall amounts of impurities play a significant role in
electrode kinetics.29 Furthermore, formation of elec-tron and hole “puddles” was observed and attributedto either warping of the suspended graphene sheets44
or doping induced by the underlying substrate.45
These imperfections will naturally lead to nano- ormicroscale inhomogeneity of the graphene surface.
Another significant observation is the accelerationof kinetics on freshly cleaved graphite. We found thatthe surface conditions and the sample exposure to theambient environment significantly perturb any inher-ent relationship between ET activity and the flakethickness. This is most likely due to a chemical mod-ification of the graphene/graphite surface due to reac-tion with oxygen, water or other chemicals present inthe air and/or adsorption of contaminant molecules/functional groups on the surface.15,46�48 X-ray photo-electron spectroscopy (XPS) shown in Figure 4 andenergy-dispersive X-ray spectroscopy (EDX) (FiguresS18 and S19, Supporting Information) were performedon both atmosphere-aged and freshly cleaved gra-phite surfaces.
The spectra are averaged over 5 different surfacesites to obtainedmaximum sensitivity to trace impurityelements. The full quantification of the spectroscopicdata across the 5 different surface sites is found inTable 2. Analysis of the averaged spectra revealed nosubstantial variation in the elemental composition.Both aged and cleaved surfaces contain ca.
92.8�93.2% carbon, 4.4�5.0% oxygen, 0.8�1.1% offluorine and a total of 0.7�2.0% of other impurities,including N, Na, Al, Si, S, K, Ca, and Ni (atomicpercentages). The cleaved sample, however, exhibitssignificant site-to-site variation, particularly in carbonand oxygen concentration, in comparison to the aged
Figure 4. XPS survey spectra of atmosphere-aged (>1 month) graphite surface (top green) and pristine graphite surfacecleaved immediately prior the XPSmeasurement (bottom red). Both spectra show data averaged from 5 different sites on thesurface (spot size of 400 μm2). The quantitative elemental analysis is given in Table 2.
ARTIC
LE

VELICKÝ ET AL. VOL. 8 ’ NO. 10 ’ 10089–10100 ’ 2014
www.acsnano.org
10096
sample. We attributed this to high reactivity of thefreshly cleaved graphite and enhanced ability of thepristine surface to adsorb organic and inorganic mol-ecules (Table 2), whereas the prolonged exposure ofthe aged graphite to the ambient environment yieldssimilar carbon/oxygen ratio at different surface sitesindicating uniformity of the surface modification.Furthermore, the extent of sp2 hybridization of carbonatoms in both samples is directly correlated with theoverall carbon concentration (Figure 5), which mostlikely points toward formation of an organic, sp3-richadsorbent layer, or suggests that the contaminantsreact with carbon and modify the graphite lattice (fulldetails of XPS and EDX analyses are found in Support-ing Information).
Comparison of the Kinetics for Fe(CN)63�/4�, Ru(NH3)6
3þ/2þ,and IrCl6
2�/3�. The droplet-to-droplet variation of ETrate on flakes of the same thickness, expressed in thearithmetic mean of the relative errors (Δ/k0) in Table 1,is most pronounced for Fe(CN)6
3�/4�, slightly less for
Ru(NH3)63þ/2þ, and the least for IrCl6
2�/3�. The sametrend is observed for a difference between the max-imum and minimum averaged and absolute kineticsfor the three mediators. The maximum difference inaveraged kinetics (from Table 1) is ca. 16-, 14-, and2-fold, and the maximum difference in absolute ki-netics (from individual droplet measurements) is ca. 3orders of magnitude for both Fe(CN)6
3�/4� and Ru-(NH3)6
3þ/2þ and only ca. 8-fold for IrCl62�/3�. This is
consistent with Fe(CN)63� being an inner-sphere redox
mediator with inherent sensitivity to surface states,15
and indeed, previously reported k0 values for thismediator on graphene vary significantly.17,19,20,24,27�29
In an idealized scenario, the observed kinetics ofa genuine outer-sphere mediator, which maintainsits original coordination sphere during the ETprocess,14,15,34 would only depend on the density ofstates (DOS) of the electrode material and wouldtherefore be less sensitive to mild surface contamina-tion. This behavior is, to an extent, observed for IrCl6
2�
as reflected in the error analysis above. Furthermore,the fact that the variation in ET kinetics of the twoouter-sphere mediators (Ru(NH3)6
3þ and IrCl62�) is
most pronounced for the thin flakes (<20 layers) raisesa question as to whether this is related to localimpurity-induced changes in the DOS, which shouldbe most pronounced in mono- and few-layergraphene.
Interestingly, the absolute value of k0 for Ru(NH3)63þ
reduction/oxidation is much lower than reported lit-erature values,15,29,35,37,49 contrary to the commonconception of Ru(NH3)6
3þ as an outer-spheremediator.Although, the number of electrochemical studies car-ried out on natural graphite is very limited, in contrastto the well-studied kinetics on other carbon electrodessuch as glassy carbon and HOPG, the slow kineticsobserved in this work is not the sole exception to thefast kinetics generally assumed for this mediator: k0 ofca. 10�5 to 10�4 cm s�1 were reported on the basalplane of HOPG surface.36 To provide a direct compar-ison with other materials, we employed amicrodroplettechnique to measure Ru(NH3)6
3þ/2þ ET kinetics onplatinum, gold and HOPG electrodes. Comparison ofvoltammetry and kinetics on these surfaces in Figure 6,panels a and b, respectively, shows that the kinetics onboth cleaved HOPG and natural graphite reach valuesclose to those of unpolishedmetal surfaces (Pt and Au).The difference between cleaved and aged surfaces,however, seems to be less pronounced for HOPG thannatural graphite, and furthermore, aged HOPG exhibitskinetics almost 1 order ofmagnitude faster than that ofaged natural graphite. Slow Ru(NH3)6
3þ/2þ kineticsobserved on natural ME graphite/graphene cannotsolely be explained via the intrinsically low DOS inthese materials because of the relatively facile kineticsof the other twomediators. The different behavior withRu(NH3)6
3þ/2þ is therefore attributed to fundamental
Figure 5. Effect of impurities on hybridization and functio-nalization of carbon atoms expressed by XPS analysis ofboth atmosphere-aged (circles) and cleaved (triangles) gra-phite surface. The extent of carbon sp2 hybridization,determined from C 1s peak (green) and Auger peak(D-parameter, blue), is proportional to the total carboncontent (XPS survey quantification).
TABLE 2. Quantitative Analysis of the XPS Spectra
Obtained at Five Different Surface Sites on Aged and
Cleaved Graphite Samples
surface site variation/At% mean/At%
element aged cleaved aged cleaved
C 88.54�94.08 85.76�97.42 92.84 93.17N 0.09�0.56 0.00�0.33 0.37 0.12O 4.31�8.06 1.35�12.10 4.98 4.39F 0.23�1.55 0.45�1.87 0.78 1.09Na <0.01 0.01�0.51 0.01 0.08Al 0.07�0.49 0.01�0.79 0.16 0.34Si 0.39�1.60 0.51�1.51 0.65 0.72S 0.14�0.24 0.00�0.10 0.14 0.03K 0.00�0.13 0.00�0.10 0.04 0.04Ca 0.00�1.64 <0.01 0.03 0.00Fe <0.01 <0.01 0.00 0.00Ni 0.00�0.01 0.00�0.06 0.01 0.03
ARTIC
LE

VELICKÝ ET AL. VOL. 8 ’ NO. 10 ’ 10089–10100 ’ 2014
www.acsnano.org
10097
differences between natural graphite/graphene andother carbon materials and misclassification ofRu(NH3)6
3þ as a “true” outer-sphere mediator. This isalso supported by the two-orders of magnitude differ-ence between the freshly cleaved and aged surfacedescribed above. Furthermore, adsorbed organicmolecules and/or a functionalized surface would alterthe DOS at the electrode surface and, in the case ofa sufficiently thick layer of modified surface, alter themeasured kinetics of an outer-sphere mediator.
Ongoing work is aimed at producing a full under-standing of the fundamental electrochemical proper-ties of graphene/graphite and elucidation of the in-herent relationship between ET kinetics and thickness,without interference from surface functionalization/contamination, which requires very careful surfacepreparation/treatment control.
CONCLUSIONS
The basal plane of graphene/graphite is found to beelectrochemically active, despite some contradictoryfindings in previous literature: both edge and basalplanes will have significant roles in the performance offuture graphene-based electrode materials. The elec-tron transfer kinetics between a substrate-bound nat-ural graphene/graphite and three different redoxmediators, Fe(CN)6
3�, Ru(NH3)63þ, and IrCl6
2� is dom-inated by the local microscopic condition of the flakesurface, a fact largely neglected in electrochemicalstudies of graphene. A significant variation of themeasured ET rate across the surface of a single basalplane crystal is observed, which largely obscures anyinherent correlations between the kinetics and num-ber of graphene layers. This is attributed to exposure ofthe graphene/graphite surface to ambient environ-ment and subsequent adsorption of contaminantsand/or functionalization of the surface. Most impor-tantly, the Ru(NH3)6
3þ couple on the in situ cleavedsurface exhibits kinetics several orders of magnitudefaster than that of an aged surface. These considera-tions are crucial for full exploitation of the large specificsurface area and transparency of graphene electrodeswhile maintaining superior electrochemical perfor-mance. It is clear that further investigations in this areaare desirable and that high surface quality control isnecessary to separate the effects of contamination andthe graphene/graphite thickness on electrochemicalactivity. Crucially, future studies should focus on dis-tinguishing spatial variations in kinetics from the tem-poral ones.
METHODS
Chemicals. Acetone (g99.0%), ethanol (g99.0%), potassiumferricyanide(III) (99þ%), hexaammineruthenium(III) chloride(98%), ammonium hexachloroiridate(IV) (99.99%), lithium chlor-ide (99%), and potassium chloride (99%) were purchased fromSigma-Aldrich, U.K. Methyl isobutyl ketone (MIBK, 99.0þ%) andisopropyl alcohol (IPA, 99.5%) were obtained from Fisher Scien-tific UK Ltd. All chemicals were used as received and aqueoussolutions prepared using deionized water (18.2 MΩ cm, Milli-QDirect 8, Merck Millipore, Nillerica, MA).
Experimental Setup. A photograph and a detailed schematicof the experimental setup are shown in Figure 1, panels a and b,respectively. The solution-filled borosilicate micropipette with atip of ca. 1 μm internal diameter (Figure S1, SupportingInformation), was connected to a MX7630 motorized micro-manipulator with MC 1000e motion controller (both Siskiyou,OR), providing motion control in horizontal and vertical plane
(5�2000 μm s�1) and visualized using either a GXML3030optical microscope (200� magnification) equipped with aGXCAM-9 CCD camera (both GT Vision Ltd., U.K.) or NikonEclipse LV100ND optical microscope with a DS-Fi2 U3 CCDcamera (both Nikon Metrology, UK, Ltd.).
A pair of reference and counter electrodes was embeddedin the micropipette. The Ag/AgCl reference electrode (RE inFigure 1b) was made by oxidation of a partially exposed PTFEcoated silver wire (99.99%, 0.15 mm diameter) in 0.1 M KCl andthe counter electrode (CE in Figure 1b)wasmade fromplatinumwire (99.99%, 0.1 mmdiameter). Graphene/graphite flake work-ing electrodes (WE in Figure 1b), visualized using a SMZ-168stereomicroscope (Motic GmbH, Germany), were connected toa copper wire (99.9%, 0.15mm diameter) with a silver epoxy (RSComponents Ltd., UK). SPI-1 grade HOPG (SPI Supplies Inc., WestChester, PA) and platinum and gold foils (both 99.99%) wereconnected the same way. All metals were purchased fromAdvent Research Materials, U.K. All the measurements were
Figure 6. (a) Cyclic voltammograms recorded on naturalgraphite (solid curve), HOPG (dashed curve), platinum(dotted curve), and gold (dash-dot curve), and (b) corre-sponding ET kinetics obtained as an arithmetic mean ofthree independent measurements. Data in red and graycorrespond to aged and cleaved surfaces, respectively.Mechanically polished metal surfaces exhibited almostreversible kinetics (>10�2 cm s�1) with peak separationbelow 65 mV at 1 V s�1.
ARTIC
LE

VELICKÝ ET AL. VOL. 8 ’ NO. 10 ’ 10089–10100 ’ 2014
www.acsnano.org
10098
carried out at times longer than 24 h after exfoliation (minimumtime needed for the silver epoxy to set). Comparison of the ETactivity of the same flake within a range of 24 h up to 1 monthafter exfoliation revealed no systematic changes in kinetics,which could be attributed to the varied time after exfoliation.The electrochemical cell, which was enclosed in a Faraday cageand controlled by a PGSTAT302N potentiostat (Metrohm Auto-lab B.V., The Netherlands), can be described as follows:
Ag(s)jAgCl(s)j3 mM X in 6 M LiCl(aq)jgraphene(s)where X is K3Fe(CN)6, Ru(NH3)6Cl3, or (NH4)2IrCl6. The referenceelectrode potential (Ag/AgCl, 6 M LiCl) of þ193 mV vs SHE wasdetermined from the Nernst equation and thermodynamic data(eqs S1�S3, Supporting Information). The high concentration ofthe electrolyte was used to prevent evaporation of the droplet.Dispensing and aspiration of the liquid from/into the micropi-pette was controlled via a microinjector (PV820 PneumaticPicoPump, WPI, Worcester, MA) and argon gas (99.998%, BOCIndustrial Gases, U.K.). The diameter of the deposited droplet(typically 20�50 μm in diameter, 2�30 pL volume) was con-trolled via combination of pressure and deposition time. Themicropipette and the liquid was changed every 6�10th dropletdeposition. A micrograph in Figure 1c shows a microdropletdeposited on a basal plane surface of a graphene monolayer.The droplet/graphene interfacial area was determined usingeither GXCapture 7.3 software (GT Vision Ltd., U.K.) or NISElements (D) software (Nikon Metrology, UK Ltd.). The experi-ments were carried out at ambient temperature (25�29 �C),which was recorded and accounted for in k0 calculations.
Flake Preparation. All samples were prepared by micro-mechanical exfoliation of graphite. Briefly, natural graphitecrystals (NGS, Naturgraphit, GmbH, Germany) were repeatedlycleaved using high-tack, low-stain cello-tape to obtain a flat andpristine graphite surface, which was pressed onto clean Si/SiO2
wafers. The tape was dissolved in MIBK and wafers washed withIPA, blow-dried with nitrogen, and baked on a hot plate for acouple of minutes. A fresh flake surface was exposed by a finalpeel using the above tape. Suitable flakeswere foundusingopticalmicroscopy and thewafer was immobilized on amicroscope slideso electrical contact could be made, as described above.
Monolayer graphene has been previously shown to besusceptible to damage by fracture, upon deposition of a liquid,when prepared via the above procedure, but stable on polymer-coated substrates.19 The reasons behind the monolayer
stability/instability are currently under investigation. Full detailsof the flake preparation are found in Supporting Information.
Flake Characterization. The number of graphene layers in thinflakes was estimated using optical microscopy, reliable for up to6�7 graphene layers providing there is a variety of comparablethin flakes present on the sample.50 Figure 1c shows an exampleof a monolayer graphene, with a bilayer ribbon stretching fromthe top left corner toward the middle and some thicker (3�7)terraced surfaces in the lower part of flake. The optical micro-scopy (brightfield and darkfield) was also used to locate areas ofpristine basal plane of the flake surface for droplet deposition.Optical assessment of the samples was supported by Ramanspectroscopy carried out using Renishaw RM MkI 1000 spec-trometer with a 633 nm HeNe laser (∼1 mW power) and anOlympus BH-2 microscope at 500� magnification, reliablydistinguishing between mono-, bi-, and trilayer graphene, andalso providing valuable information about doping and presenceof lattice defects.51,52 Raman spectra of amonolayer, bilayer andthree thicker flakes are shown in Figure 7a. Finally, atomic forcemicroscopy (AFM), using a Dimension Icon and SNL-10 Si-tip ona Si3N4 cantilever in a PeakForce tapping mode and MultiMode8 software (Bruker UK Ltd.), was employed to determinethe number of layers in thick flakes based on the minimumgraphite interlayer spacing of 0.3358 nm.53 A representativeAFM image of a thicker flake and its cross section are shown inFigures 7, panels b and c, respectively.
Elemental analysis of both atmosphere-aged and freshlycleaved graphite surface was obtained using XPS and EDXtechniques. One sample was exposed to ambient environmentfor longer than 1 month (aged sample), whereas the other wascleaved several times (using the tape above) until a pristineshiny graphite surface was exposed (cleaved sample) andplaced immediately into XPS, EDX vacuum chamber, respec-tively. XPS analysis was performed at 5 different surface sitesusing the largest available spot size (400 μm2) on K-Alphamonochromated (Al�1486 eV) X-ray Photoelectron Spectrom-eter system (Thermo Fisher Scientific, Inc.). All XPS data wereanalyzed and quantified using CasaXPS Software (version2.3.16, www.casaxps.com). Details of the EDX instrumentationand analysis are found in Supporting Information.
Conflict of Interest: The authors declare no competingfinancial interest.
Acknowledgment. The authors thank EPSRC (grant refer-ences: EP/I005145/1, EP/K039547/1 andEP/K016954/1) forfinancial
Figure 7. (a) Raman spectra of the mono-, bi-, tri-, tetra/penta-, and multilayer graphene flakes, bottom to top, respectively(each spectrum is shown on a different intensity scale for the purpose of clarity). (b) 3D and 2D AFM scans (top and bottom-left, respectively) of a ca.4/5-layer thick grapheneflakewith anothermonolayer on top, inset (bottom-right) shows theopticalimage of the scanned area, (c) cross-section of the same flake, indicated by green lines in (b).
ARTIC
LE

VELICKÝ ET AL. VOL. 8 ’ NO. 10 ’ 10089–10100 ’ 2014
www.acsnano.org
10099
support. The authors also thank Dr. Anders Barlow at nanoLAB(Newcastle University) for XPS measurement, and Greg Auton,ShengHu andHuafeng Yang, all fromManchester University, fortheir help with sample preparation and characterization.
Supporting Information Available:Micropipette preparation,reference electrode potential determination, Nicholson method,cyclic voltammetry fitting, mediator-free blank voltammetry,AFM of the stable and collapsedmicrodroplets, flake preparationprocedure, determination of the redox mediator diffusion coeffi-cients, kinetics-droplet size correlation, comparison of the rawand analyzed kinetic data, uncompensated resistance, com-parison of electrode kinetics on basal and edge plane of graph-ite, and X-ray photoelectron spectroscopy (XPS) and energy-dispersive X-ray spectroscopy (EDX) analysis of atmosphere-agedand freshly cleaved graphite surface. This material is availablefree of charge via the Internet at http://pubs.acs.org.
REFERENCES AND NOTES1. Mayorov, A. S.; Gorbachev, R. V.; Morozov, S. V.; Britnell, L.;
Jalil, R.; Ponomarenko, L. A.; Blake, P.; Novoselov, K. S.;Watanabe, K.; Taniguchi, T.; et al.Micrometer-Scale BallisticTransport in Encapsulated Graphene at Room Tempera-ture. Nano Lett. 2011, 11, 2396–2399.
2. Balandin, A. A. Thermal Properties of Graphene andNanostructured Carbon Materials. Nat. Mater. 2011, 10,569–581.
3. Lee, C.; Wei, X.; Kysar, J. W.; Hone, J. Measurement of theElastic Properties and Intrinsic Strength of MonolayerGraphene. Science 2008, 321, 385–388.
4. Novoselov, K. S.; Geim, A. K.; Morozov, S. V.; Jiang, D.;Zhang, Y.; Dubonos, S. V.; Grigorieva, I. V.; Firsov, A. A.Electric Field in Atomically Thin Carbon Films. Science2004, 306, 666–669.
5. Geim, A. K. Graphene: Status and Prospects. Science 2009,324, 1530–1534.
6. Novoselov, K. S.; Fal'Ko, V. I.; Colombo, L.; Gellert, P. R.;Schwab, M. G.; Kim, K. A Roadmap for Graphene. Nature2012, 490, 192–200.
7. Nair, R. R.; Blake, P.; Grigorenko, A. N.; Novoselov, K. S.;Booth, T. J.; Stauber, T.; Peres, N. M. R.; Geim, A. K. FineStructure Constant Defines Visual Transparency of Graph-ene. Science 2008, 320, 1308.
8. Moser, J.; Barreiro, A.; Bachtold, A. Current-Induced Clean-ing of Graphene. Appl. Phys. Lett. 2007, 91.
9. Topsakal, M.; Aahin, H.; Ciraci, S. Graphene Coatings: AnEfficient Protection from Oxidation. Phys. Rev. B: Condens.Matter Mater. Phys. 2012, 85.
10. Wang, Y.; Li, Z.; Wang, J.; Li, J.; Lin, Y. Graphene andGraphene Oxide: Biofunctionalization and Applicationsin Biotechnology. Trends Biotechnol. 2011, 29, 205–212.
11. Lee, J. K.; Smith, K. B.; Hayner, C. M.; Kung, H. H. SiliconNanoparticles-Graphene Paper Composites for Li Ion Bat-tery Anodes. Chem. Commun. (Cambridge, U.K.) 2010, 46,2025–2027.
12. Wang, X.; Zhi, L.; Müllen, K. Transparent, ConductiveGraphene Electrodes for Dye-Sensitized Solar Cells. NanoLett. 2008, 8, 323–327.
13. Stoller, M. D.; Park, S.; Yanwu, Z.; An, J.; Ruoff, R. S.Graphene-Based Ultracapacitors. Nano Lett. 2008, 8,3498–3502.
14. Brownson, D. A. C.; Kampouris, D. K.; Banks, C. E. GrapheneElectrochemistry: Fundamental Concepts through to Pro-minent Applications. Chem. Soc. Rev. 2012, 41, 6944–6976.
15. McCreery, R. L. Advanced Carbon Electrode Materials forMolecular Electrochemistry. Chem. Rev. (Washington, DC,U.S.) 2008, 108, 2646–2687.
16. Li, W.; Tan, C.; Lowe, M. A.; Abru~na, H. D.; Ralph, D. C.Electrochemistry of Individual Monolayer GrapheneSheets. ACS Nano 2011, 5, 2264–2270.
17. Valota, A. T.; Kinloch, I. A.; Novoselov, K. S.; Casiraghi, C.;Eckmann, A.; Hill, E. W.; Dryfe, R. A. W. ElectrochemicalBehavior of Monolayer and Bilayer Graphene. ACS Nano2011, 5, 8809–8815.
18. Sharma, R.; Baik, J. H.; Perera, C. J.; Strano, M. S. Anom-alously Large Reactivity of Single Graphene Layers andEdges toward Electron Transfer Chemistries. Nano Lett.2010, 10, 398–405.
19. Toth, P. S.; Valota, A.; Velicky, M.; Kinloch, I.; Novoselov, K.;Hill, E. W.; Dryfe, R. A. W. Electrochemistry in a Drop: AStudy of the Electrochemical Behaviour of MechanicallyExfoliated Graphene on Photoresist Coated Silicon Sub-strate. Chem. Sci. 2014, 5, 582–589.
20. Brownson, D. A. C.; Munro, L. J.; Kampouris, D. K.; Banks,C. E. Electrochemistry of Graphene: Not Such a BeneficialElectrode Material? RSC Adv. 2011, 1, 978–988.
21. Goh, M. S.; Pumera, M. The Electrochemical Response ofGraphene Sheets Is Independent of the Number of Layersfrom a Single Graphene Sheet to Multilayer StackedGraphene Platelets. Chem.;Asian J. 2010, 5, 2355–2357.
22. Xie, X.; Zhao, K.; Xu, X.; Zhao,W.; Liu, S.; Zhu, Z.; Li, M.; Shi, Z.;Shao, Y. Study of Heterogeneous Electron Transfer on theGraphene/Self-Assembled Monolayer Modified Gold Elec-trode by Electrochemical Approaches. J. Phys. Chem. C2010, 114, 14243–14250.
23. De, S.; Coleman, J. N. Are There Fundamental Limitationson the Sheet Resistance and Transmittance of Thin Graph-ene Films? ACS Nano 2010, 4, 2713–2720.
24. Zhang, B.; Fan, L.; Zhong, H.; Liu, Y.; Chen, S. GrapheneNanoelectrodes: Fabrication and Size-Dependent Electro-chemistry. J. Am. Chem. Soc. 2013, 135, 10073–10080.
25. Ambrosi, A.; Bonanni, A.; Pumera, M. Electrochemistry ofFolded Graphene Edges. Nanoscale 2011, 3, 2256–2260.
26. Brownson, D. A. C.; Banks, C. E. Cvd Graphene Electro-chemistry: The Role of Graphitic Islands. Phys. Chem. Chem.Phys. 2011, 13, 15825–15828.
27. Valota, A. T.; Toth, P. S.; Kim, Y. J.; Hong, B. H.; Kinloch, I. A.;Novoselov, K. S.; Hill, E. W.; Dryfe, R. A. W. ElectrochemicalInvestigation of Chemical Vapour Deposition Monolayerand Bilayer Graphene on the Microscale. Electrochim. Acta2013, 110, 9–15.
28. Tan, C.; Rodríguez-López, J.; Parks, J. J.; Ritzert, N. L.; Ralph,D. C.; Abru~na, H. D. Reactivity of Monolayer ChemicalVapor Deposited Graphene Imperfections Studied UsingScanning Electrochemical Microscopy. ACS Nano 2012, 6,3070–3079.
29. Ritzert, N. L.; Rodríguez-López, J.; Tan, C.; Abru~na, H. D.Kinetics of Interfacial Electron Transfer at Single-LayerGraphene Electrodes in Aqueous and Nonaqueous Solu-tions. Langmuir 2013, 29, 1683–1694.
30. Güell, A. G.; Ebejer, N.; Snowden, M. E.; MacPherson, J. V.;Unwin, P. R. Structural Correlations in HeterogeneousElectron Transfer at Monolayer and Multilayer GrapheneElectrodes. J. Am. Chem. Soc. 2012, 134, 7258–7261.
31. Nicholson, R. S. Theory and Application of Cyclic Voltam-metry for Measurement of Electrode Reaction Kinetics.Anal. Chem. 1965, 37, 1351–1355.
32. Klingler, R. J.; Kochi, J. K. Electron-Transfer Kinetics fromCyclic Voltammetry. Quantitative Description of Elec-trochemical Reversibility. J. Phys. Chem. 1981, 85, 1731–1741.
33. Randles, J. E. B. A Cathode Ray Polarograph. Part II. TheCurrent-Voltage Curves. Trans. Faraday Soc. 1948, 44, 327–338.
34. Bard, A. J.; Faulkner, L. R. Electrochemical Methods. Funda-mentals and Applications, 2nd ed.; John Wiley & Sons, Inc.:New York, 2001.
35. Patel, A. N.; Collignon, M. G.; Oconnell, M. A.; Hung, W. O. Y.;McKelvey, K.; MacPherson, J. V.; Unwin, P. R. A New View ofElectrochemistry at Highly Oriented Pyrolytic Graphite.J. Am. Chem. Soc. 2012, 134, 20117–20130.
36. Edwards, M. A.; Bertoncello, P.; Unwin, P. R. Slow DiffusionReveals the Intrinsic Electrochemical Activity of BasalPlane Highly Oriented Pyrolytic Graphite Electrodes.J. Phys. Chem. C 2009, 113, 9218–9223.
37. Lai, S. C. S.; Patel, A. N.; McKelvey, K.; Unwin, P. R. DefinitiveEvidence for Fast Electron Transfer at Pristine Basal PlaneGraphite from High-Resolution Electrochemical Imaging.Angew. Chem., Int. Ed. 2012, 51, 5405–5408.
ARTIC
LE

VELICKÝ ET AL. VOL. 8 ’ NO. 10 ’ 10089–10100 ’ 2014
www.acsnano.org
10100
38. Banks, C. E.; Davies, T. J.; Wildgoose, G. G.; Compton, R. G.Electrocatalysis at Graphite and Carbon Nanotube Modi-fied Electrodes: Edge-Plane Sites and Tube Ends Are theReactive Sites. Chem. Commun. (Cambridge, U.K.) 2005,829–841.
39. McDermott, M. T.; Kneten, K.; McCreery, R. L. Anthraqui-nonedisulfonate Adsorption, Electron-Transfer Kinetics,and Capacitance on Ordered Graphite Electrodes: TheImportant Role of Surface Defects. J. Phys. Chem. 1992,96, 3124–3130.
40. Li, Z.; Wang, Y.; Kozbial, A.; Shenoy, G.; Zhou, F.; McGinley,R.; Ireland, P.; Morganstein, B.; Kunkel, A.; Surwade, S. P.;et al. Effect of Airborne Contaminants on theWettability ofSupported Graphene and Graphite. Nat. Mater. 2013, 12,925–931.
41. Hardcastle, T. P.; Seabourne, C. R.; Zan, R.; Brydson, R. M. D.;Bangert, U.; Ramasse, Q. M.; Novoselov, K. S.; Scott, A. J.Mobile Metal Adatoms on Single Layer, Bilayer, and Tri-layer Graphene: An ab Initio DFT Study with van der WaalsCorrections Correlated with Electron Microscopy Data.Phys. Rev. B: Condens. Matter Mater. Phys. 2013, 87.
42. Zan, R.; Ramasse, Q. M.; Bangert, U.; Novoselov, K. S.Graphene Reknits Its Holes. Nano Lett. 2012, 12, 3936–3940.
43. Rooney, M. B.; Coomber, D. C.; Bond, A. M. Achievement ofNear-Reversible Behavior for the [Fe(CN)6]
3�/4� RedoxCouple Using Cyclic Voltammetry at Glassy Carbon, Gold,and Platinum Macrodisk Electrodes in the Absence ofAdded Supporting Electrolyte. Anal. Chem. 2000, 72,3486–3491.
44. Meyer, J. C.; Geim, A. K.; Katsnelson, M. I.; Novoselov, K. S.;Booth, T. J.; Roth, S. The Structure of Suspended GrapheneSheets. Nature 2007, 446, 60–63.
45. Wang, Q. H.; Jin, Z.; Kim, K. K.; Hilmer, A. J.; Paulus, G. L. C.;Shih, C. J.; Ham, M. H.; Sanchez-Yamagishi, J. D.; Watanabe,K.; Taniguchi, T.; et al. Understanding and Controlling theSubstrate Effect on Graphene Electron-Transfer Chemistryvia Reactivity Imprint Lithography. Nat. Chem. 2012, 4,724–732.
46. Elias, D. C.; Nair, R. R.; Mohiuddin, T. M. G.; Morozov, S. V.;Blake, P.; Halsall, M. P.; Ferrari, A. C.; Boukhvalov, D. W.;Katsnelson, M. I.; Geim, A. K.; et al. Control of Graphene'sProperties by Reversible Hydrogenation: Evidence forGraphane. Science 2009, 323, 610–613.
47. Pierce, C.; Ewing, B. Localized Adsorption on GraphiteSurfaces. J. Phys. Chem. 1967, 71, 3408–3413.
48. Schedin, F.; Geim, A. K.; Morozov, S. V.; Hill, E. W.; Blake, P.;Katsnelson, M. I.; Novoselov, K. S. Detection of IndividualGas Molecules Adsorbed on Graphene. Nat. Mater. 2007,6, 652–655.
49. Davies, T. J.; Moore, R. R.; Banks, C. E.; Compton, R. G. TheCyclic Voltammetric Response of Electrochemically Het-erogeneous Surfaces. J. Electroanal. Chem. 2004, 574, 123–152.
50. Blake, P.; Hill, E. W.; Castro Neto, A. H.; Novoselov, K. S.;Jiang, D.; Yang, R.; Booth, T. J.; Geim, A. K. MakingGrapheneVisible. Appl. Phys. Lett. 2007, 91.
51. Ferrari, A. C. Raman Spectroscopy of Graphene andGraphite: Disorder, Electron-Phonon Coupling, Dopingand Nonadiabatic Effects. Solid State Commun. 2007,143, 47–57.
52. Malard, L. M.; Pimenta, M. A.; Dresselhaus, G.; Dresselhaus,M. S. Raman Spectroscopy in Graphene. Phys. Rep. 2009,473, 51–87.
53. Walker, P. L.; McKinstry, H. A.; Wright, C. C. X-Ray DiffractionStudies of a Graphitized Carbon;Changes in InterlayerSpacing and Binding Energy with Temperature. Ind. Eng.Chem. 1953, 45, 1711–1715.
ARTIC
LE