Notice of EIR Preparation - Mono County - CA.gov
523
APPENDIX A1 Notice of EIR Preparation
-
Upload
khangminh22 -
Category
Documents
-
view
1 -
download
0
Transcript of Notice of EIR Preparation - Mono County - CA.gov
APPENDIX A1
Notice of EIR Preparation
NNOOTTIICCEE OOFF PPRREEPPAARRAATTIIOONN OF A SUBSEQUENT ENVIRONMENTAL IMPACT REPORT
AND SPECIFIC PLAN FOR THE TIOGA INN PROJECT
LEAD AGENCY: Mono County Community Development Department ADDRESS: Post Office Box 347 Mammoth Lakes, California 93546
COUNTY CONTACT: Gerry LeFrancois 760.924.1810
NOP ISSUED: 17 OCTOBER 2016 NOP COMMENTS DUE BY: 25 NOVEMBER 2016
SCOPING MEETING: 27 OCTOBER 2016 4:30-6:30 pm Lee Vining Community Center
A. PURPOSE OF NOTICE
As Lead Agency, the Mono County Community Development Department ("the County") is planning to prepare a Subsequent Environmental Impact Report (SEIR) and Specific Plan for the Tioga Inn development. CEQA §15162 requires preparation of a Subsequent Environmental Impact Report (SEIR) when warranted by changed project circumstances, the availability of new information, potential for new environmental effects, and potential for new mitigation measures and/or project alternatives to reduce significant effects.
Mono County has prepared this Notice of Preparation (NOP) to invite your comments on the scope and content of environmental information in the forthcoming SEIR.
→ In particular, the County is requesting your input regarding:
Permits and Approvals: Applicable permits and approvals that may be required from your agency and environmental review requirements associated with those approvals (please see NOP §H); Significant Issues & Thresholds of Significance: Potentially significant effects to be examined and Significance Thresholds that should be used; Alternatives & Cumulative Projects: Alternatives to the proposed project that merit evaluation in the forthcoming SEIR (please see discussion in NOP §I); Related Projects: Related projects or actions that should be considered in assessing cumulative effects; Reference Materials: Reference materials to review in setting forth baseline conditions, evaluating impacts, and mitigations.
B. PUBLIC ACCESS & PARTICIPATION
To optimize public access, the County will post project documents on the County website for review and downloading. SEIR copies will be provided at Lee Vining
Public Library and county offices in Mammoth Lakes and Bridgeport. Hard-bound copies can also be obtained for a nominal charge to cover reproduction costs. Agency and public comments and questions are welcomed throughout the review process.
C. OCTOBER 27 SCOPING MEETING
A scoping meeting will be held on 27 October 2016 from 4:30- 6:30 pm at the Lee Vining Community Center located at 296 Mattly Avenue in the community of Lee Vining. Following a brief presentation about the project and CEQA process, participants will be invited to comment on the proposed scope and focus of the forthcoming SEIR.
D. PROJECT INFORMATION
The applicants, Dennis and Jane Domaille, are proposing to construct the Tioga Inn and associated project features on the site of the existing Tioga Gas Mart and Whoa Nellie Deli, located at 22 Vista Point Drive in the unincorporated community of Lee Vining.
The project area encompasses 4 parcels totaling 67.8 acres of land within an overall ownership area of roughly 74 acres (including an outparcel with an existing road that connects Parcel 1 to the existing workforce housing on Parcel 4). State Route 120 (SR 120) provides access to the project site and also provides the only eastern access into Yosemite National Park. Located about one-half mile south of the main US 395 corridor through Lee Vining, the property is surrounded on the north, east and west by land owned by the Los Angeles Department of Water and Power (LADWP); adjoining acreage to the west is owned by Southern California Edison (SCE). The LADWP and SCE parcels are largely undeveloped but include a smattering of industrial uses, roads and utility improvements.
The project encompasses multiple elements, many of which were analyzed in the 1993 environmental and planning documents. The original concept was to provide

a full range of services and facilities for tourists (to Yosemite National Park, the Mono National Scenic Recreation Area, and the eastern Sierra Nevada generally), as well as meeting facilities, jobs and employee housing opportunities for area residents.
The current proposal embodies goals and concepts developed in 1993, with added refinements. Thus, the current proposal proposes up to 80 new workforce housing units, adds 100 seats to the full-service restaurant, adds a third story to the hotel to reduce its footprint while retaining the full 120 guest rooms, and adds a third gas pump island and overhead canopy. The proposal includes substantial additional parking to accommodate onsite guests (deli, hotel, restaurant and events) as well as a park-and-ride facility for Lee Vining residents and bus parking for Yosemite transit vehicles. The existing onsite septic system would be replaced by an onsite wastewater treatment plant to treat wastes before discharge to a designated leach field.
E. PROJECT LOCATION
The project is located at 22 Vista Point Road, close to the intersection of SR 120 and US395, and about one-half mile south of Lee Vining. The property is the location of the well-known Mobile Mart and Whoa Nellie Deli, established by Dennis and Jane Domaille in 1996. The proposed project retains all existing structures and services on the site, with the addition of the new elements described
herein. Exhibit 1 depicts the regional and local project vicinity, and Exhibit 2 shows the proposed layout of uses in the project site.
F. NOP RESPONSE PROCEDURE
Please include the name and telephone number of a contact person so that we can follow up if questions arise, and send your NOP by e-mail, fax or mail to:
Mono County c/o Gerry LeFrancois Bauer Planning & Environmental Svcs., Inc.
P.O. Box 347 Mammoth Lakes, California 93546
Tel: 760.924.1810 Fax: 760.924.1801 e-Mail: [email protected]
Due to time limits mandated by state law, your response to this NOP must be sent at the earliest possible date and no later than 25 NOVEMBER 2016. The schedule calls for the draft SEIR to be distributed for public review during late summer or autumn of 2017. If you have any questions, please feel free to contact Mr. LeFrancois 9760.924.1810), or the county’s CEQA consultant (Sandra Bauer, Bauer Planning & Environmental Services, Inc., 714.397.3301).
G. NOP CONTENTS
This NOP contains ten sections addressing the proposed project and forthcoming SEIR. Table 1 below outlines the NOP contents and sections.
Table 1 NOTICE OF PREPARATION CONTENTS
A. NOP Purpose B. Public Access C. Scoping Meeting D. Project Information E. Project Location
F. NOP Response Procedure G. NOP Contents H. Responsible Agencies & Approvals I. Project Alternatives J. Environmental Effects
H. DISCRETIONARY ACTIONS, RESPONSIBLEAGENCIES
LEAD AGENCY: Mono County is the designated Lead Agency for the project. In order to implement the project, the County will be required to certify that the Final Subsequent EIR has been prepared in compliance with CEQA, approve the Mitigation Program, adopt findings, approve the Specific Plan, and verify that water supplies are adequate to serve the project.
RESPONSIBLE AGENCIES: In addition to the Lead Agency project approvals described above, the SEIR may be used by other public agencies that will consider separate permits and approvals required before the project can be implemented. Table 2 provides a preliminary outline of discretionary approvals and actions associated with the proposed Tioga Inn project.

Table 2 LEAD, RESPONSIBLE & TRUSTEE AGENCIES
LEAD AGENCY: MONO COUNTY Certification of the Subsequent EIR Adoption of the Mitigation Program Review by Mono Co. Health Dept. of report addressing water availability for the project Adoption of the Specific Plan Approval of Wastewater Treatment Plant ?
RESPONSIBLE AGENCIES:
Lahontan Regional Water Quality Control Board
Approval of NPDES General Storm Water Permit Review of Stormwater Pollution Prevention Plan Approval of a Waste Discharge Permit
Great Basin Air Pollution Control District New Secondary Source Permit
TRUSTEE AGENCY: CA Dept. of Fish & Wildlife (CDFW) SEIR review & comment on botanical and wildlife trust resources in the project area
DISCRETIONARY ACTIONS: A key step in the initial review is to delineate between actions that were approved in 1993 and remain unchanged, and newly proposed actions that are now subject to discretionary approval. Table 3 is a preliminary outline
of the approved and proposed project elements. Only the newly proposed actions (shown in the right-most column) are subject to discretionary action as part of the current project proposal.
Table 3. EXISTING, APPROVED & PROPOSED LAND USES AND ACREAGES PARCEL ACREAGE
APPROVED IN 1993
PROPOSED ACREAGE
EXISTING LAND USES
LAND USES APPROVED IN 1993
LAND USES NOW PROPOSED
NEW DISCRETIONARY
ACTIONS
1 30.3 26.5
▪ Open Space Monument Signs (2)
▪ 120-room 2-story hotel with coffee
shop, banquet room & gift shop;
▪ Parking spaces foronsite parking
needs.
▪ 120-rm 3-story hotel with200-seat restaurant, fitness center, laundry, car rental, banquet room, gift shop,
electric car-charging; ▪ Added Parking spaces▪ Wastewater treatment
plant
▪ Hotel footprint
reduced by 23,189 sf withchange to 3-
stories; ▪ Added Parking
for new uses.
2 36.0 32.1
▪ Overflow parking ▪ Historical Marker▪ 4-unit workforce
housing ▪ Electric supply shed▪ Water Supply Well▪ SCE powerlines▪ Buried Utility Xing
septic tank/leach field
▪ Full-service 100-seat restaurant▪ Restaurant
parking spaces▪ Overflow/oversize
vehicle parking ▪ Maintenance Bldg▪ 30,000-gallon
Propane Tank
▪ Full-service 200-seatrestaurant
▪ Restaurant parking ▪ Overflow/oversized
vehicle parking ▪ 80-unit work-force
housing ▪ Sewage leach field
▪ 80-bedroom workforce
housing structure and access road; ▪ Restaurant
increased to 200 seats from 100
3 2.4 2.4
▪ 2 Gas PumpIslands/canopies ▪ Tioga Gas Mart▪ Whoa Nellie Deli
Reconfiguration of the 2 gas pump
islands for added parking
▪ 3 Gas pump islands withoverhead canopies &
lighting
▪ I new gas pump island with
canopy & lighting
4 5.0 6.8
▪ 10 Workforce Housing Units▪ 1 Water Tank▪ 1 Cell Tower
New water storage tank and location to replace existing tank.
▪ Construction of a 2nd water storage tank on site approved in 1993 (insteadof replacing existing tank)
▪ 1 new back-up water tank
SR 120 Ease-ment
TBD TBD * 2-lane access from SR-120 (1 lane each
direction, turn lanes)* Park & Ride Area
▪ 2-lane access to Mobile Mart off of SR-120, with
turn lanes.
▪ No changes proposed
TOTAL PROPOSED ACRES 67.83 (reduced from 73.7 acres in 1993)

I. ALTERNATIVES & CUMULATIVE EFFECTS
The purpose of alternatives is to identify feasible ways to avoid or reduce significant impacts identified in the environmental review, while meeting basic project objectives. The range of alternatives will therefore depend on findings in the SEIR, but at a minimum the SEIR will consider the mandatory ‘No Project’ alternative. Cumulative effects are defined as impacts that are created as a result of the project evaluated in the EIR together with other projects causing related impacts; the cumulative assessment relies heavily on the identification of other closely related past, present, and reasonably foreseeable probable future projects.
➔ You are invited to comment on the range of alternatives, and on the list of projects to be analyzed in the cumulative analysis.
J. ENVIRONMENTAL EFFECTS
The SEIR will be comprehensive in scope, addressing the full range of potential environmental issues. The document will focus on key issues that are expected to include:
❑ Water Supply: The SEIR will provide an updatedreview of project water use requirements, watersupply and water availability in the project area. The review will include results of a well stress test to determine whether increased well production wouldhave potential to impact area well facilities;
❑ Waste Treatment and Water Quality: The SEIR willassess the proposed new wastewater treatment plant and adequacy of the existing waste disposal leach field to accommodation additional loading. The SEIRwill also consider water quality associated with thesiting of a second well site relative to the proposed leach field. Compliance with applicable requirements and standards set by the Lahontan Regional WaterQuality Control Board (LRWQCB) and the MonoCounty Environmental Health Dept. will be addressed;
❑ Biological Resources: An updated assessment ofwildlife, vegetation and habitats will supplementinformation in the 1993 EIR. The SEIR will assessbiological resource impacts based on current listingsand regulations, and will analyze impacts to the CasaDiablo deer herd including updated review of theavailability of bitterbrush-dominated stands of GreatBasin Mixed Scrub and Jeffrey Pine Forest;
❑ Traffic: The SEIR will provide an updated review ofingress and egress requirements, parking and traffic demands associated with special events, overflow parking requirements, Caltrans’ concerns regarding use of the SR-120 right-of-way, and Encroachment
Permit requirements. Multi-modal issues will be considered, including internal and external bicycle and pedestrian trails and facilities as well as linkage to regional trail systems serving Lee Vining and Yosemite;
❑ Aesthetics: The SEIR will incorporate updated visualand schematic assessments to reflect the proposed project modifications. Schematic renderings will be taken from the locations used in the 1993 EIR tofacilitate comparison of aesthetic impacts associated with the 1993 and current project plans;
❑ Air Quality & Greenhouse Gases (GHG): The assessment of construction and mobile source emissions will be updated, with a new assessment ofGHG emissions, including impacts from the newlyproposed 80-unit workforce housing structure. The assessment will also consider compliance of proposed hotel fireplaces with applicable air quality standards including PM10;
❑ Cultural Resources: Impacts on cultural resources will be assessed for the revised project, along with a mandatory consultation with Native American tribes;
❑ Public Safety: Project impacts on public safety will bereassessed in light of proposed new access lanes andparking for onsite uses as well as proposed park and ride facilities and parking for Yosemite buses;
❑ Solid Waste: The Subsequent EIR will assess solid waste generation for the revised plan, as well as theadequacy of solid waste disposal facilities to accommodate the added demands;
❑ Fire Safety: Consultation with Cal Fire will be updated to evaluate adequacy of emergency access featuresand compliance with current fire safety regulations;
❑ Cumulative Effects, Alternatives, Mitigation Measures:The cumulative impact assessment will be updatedalong with the analysis of alternatives and mitigation measures that could avoid or reduce potentially significant environmental impacts;
❑ Specific Plan: The Specific Plan will be updated in tandem with the SEIR. Both documents will draw substantially upon information provided in the 1993 document, but with revisions to reflect changes in the project proposal and current state and county guidelines for Specific Plan and CEQA content and format.
➔ The County seeks your comments on the proposed scope and focus of analysis, as well as applicable thresholds of significance and key issues of particular concern. Please include this information as part of your response to the NOP and/or your comments at the scoping meeting.
APPENDIX A2
Comment Letters
on Notice of EIR Preparation
To: Mono County Community Development Department - Gerry LaFrancois
Comments on Specific Plan for Tioga Inn Project in Lee Vining , Oct. 27, 2016
From: Janet Carle, PO Box 39,Lee Vining, CA [email protected]
Thank you for the opportunity to comment on the Tioga Inn Project in Lee Vining.
I am Janet Carle, a retired State Park Ranger who worked at the Mono Lake Tufa SNR for over 20years. I have also worked part-time as the Coordinator of the Mono Lake Volunteer program for 13years. Recently, I helped found the Mono Climate Action group in the Basin. I am speaking today formyself as well as 14 others who have read and endorsed my comments. Their names appear at the endof my comments. Because of the short notice, we have not discussed this project at a meeting of 350MONO, so I am not officially representing the group.
Overview: This is a critically important project for the Mono Basin, Mono County and the wholeEastern Sierra. The site is not only the eastern gateway to internationally-renowned Yosemite NationalPark, but also the gateway to the Mono Lake Basin, with its history of battles over water diversions andsuccessfully reaching an agreement with Los Angeles to protect the inflows to Mono Lake. This site isa crossroads, with thousands of international visitors passing through every summer.
There is a golden opportunity with this proposal to create a project worthy of the site and its gatewaystatus -- a groundbreaking, climate-friendly, renewable, next generation project that the communitycan be proud of, and that sets an example for the whole Sierra of what can be done with thoughtfulplanning and building. Wise energy and water use is also good for business -- major money will besaved by the tenants and the owners, and visitors want to stay in places that are "doing the right thing,"recycling water and using energy wisely. Our local climate action group, 350MONO, is workingtoward the Mono Basin becoming a climate-friendly community, and this could be a signature project.There is certainly a great need for more motel rooms in town and for affordable workforce housing.
ENERGY: The scope of this project suggests a massive increase in energy use. The current Mobilstation is installing rooftop solar as we speak. This project needs to be totally passive solar designed,with good southern exposures, insulation, roofs with solar panels, etc. Our mountain climate demandsthoughtful building that minimizes the need for heating in the winter. We would like to see enoughsolar installation and energy saving design elements to be a net zero energy user, and platinum LEEDcertified as well as exceeding the requirements of Title 24 of the State energy code. This is the future.Outside lighting should also be muted and pointed downwards to preserve our night skies.
WATER: This is a huge issue throughout the Sierra. With climate change, snowfall is problematic andthe old formulas of water recharge are on shaky ground. This project uses well water, a limitedresource that needs to be used wisely and recycled as much as possible. With a big hotel, 2 bigrestaurants, 80 units of housing and a laundry, water use will go up far beyond the present demand.There is a potential for gray water (laundry, washing, showers, etc) use on landscaping, black water(treated sewage) to be dispersed underground, and an overall design that reduces water use. The RushCreek Lodge at the Big Oak Flat entrance to Yosemite has shown that this is possible. They are
operating 143 hotel rooms on 20 acres, re-using 3.8 million gallons annually from showers, sinks andlaundry to supply 95% of the water needed for outdoor irrigation of native landscaping with a gravity-flow system. They also have a capacity of 19,000 gallons per day of subsurface blackwater dispersal(treated sewage). The Tioga Inn project includes a waste water treatment plant. We would like to seea cutting-edge, gray water recycling and black water dispersal system required by the Plan.(see attached info on Rush Creek Lodge and their systems). There is an upcoming conference comingup in a few days on this topic near Big Oak Flat, info attached. Rainwater capture systems could alsobe designed into the project. The Mono Lake Basin's history is all about water. This project should be ashowcase for using water wisely. Native, drought-tolerant landscaping throughout this new project isdesirable. This is the future.
AFFORDABLE WORKFORCE HOUSING: There is certainly a need for additional affordablehousing in the Basin. Eighty additional units is a huge increase however, especially for year-roundwinterized housing. This would essentially double the available housing in Lee Vining. So manyadditional year round residents will need more services and will impact things like the local schools.There is a need for a thoughtful discussion about the scope of the housing and the consequences thatwill come. The current proposal is for 80 small cabins. This is inefficient in a mountain climate withmajor energy demands for heating in the winter. Two or three apartment-style buildings could be moreenergy efficient. (There is a good example in Yosemite Valley with the new workforce housing nearCurry Village.) Passive solar, a good southern exposure and state-of-the-art insulation is desirable.
COMMUNITY IMPACTSLee Vining is a small town with a big, international role to play, especially in the summer. A project
of this magnitude will have an unavoidable impact on the town. It can be a positive impact. Thisdevelopment can be something the whole community could be proud of, as it brings jobs and prosperityto the Basin. But there will also be more intensity in the summer: more traffic and more visitorseverywhere. The project developers should be encouraged to reach out to the community and try tointegrate the project's needs with those of the town, such as having a room locals can use for meetings,and sponsoring and supporting local events at the facility. We also hope for an aesthetically-pleasingdesign that blends in well with the site.
We are all in this together, and we will all be living with this project for years to come. There is somuch potential here for a next generation, groundbreaking showcase project. Please, Mono CountyPlanners, look toward the future and let's do it right.
Janet Carle, Mono CitySharon Geiken, BridgeportRobbie DiPaolo, Lee ViningIlene Mandelbaum, Lee ViningElena Espinosa, WalkerRebecca Watkins, Lee ViningAnn Howald, Hilton CreekMaureen McGlinchy, Mono CityJora Fogg, June LakeDanielle Dowers, San FranciscoGina Ruiz, Mono CityDuncan King, Mono CityLynn Boulton, Lee ViningRhonda Starr, Mammoth LakesDave Carle, Mono City
ST ATE OF CALIFORNIA-CALIFORNIA ST ATE TRANSPORT A TIQN AGF:NCY EDMUND G. BROWN Jr. Governor
DEPARTMENT OF TRANSPORTATION DISTRICT9
500 SOUTH MAIN STREET BISHOP, CA 93514 PHONE (760) 872-0785 FAX (760) 872-0678 TTY 711 www .dot.ca.gov
November 17, 2016
Mr. Gerry Le Francois Mono Community Development Dept. P.O. Box 347 Mammoth Lakes, California 93546
File: Mno-120-11.8 NOP/SEIR SCH#: 1992012113
Serious drought. Help save water!
Tioga Inn Development-Notice of Preparation of a Subsequent Environmental Impact Report (NOP/SEIR)
Dear Mr. Le Francois:
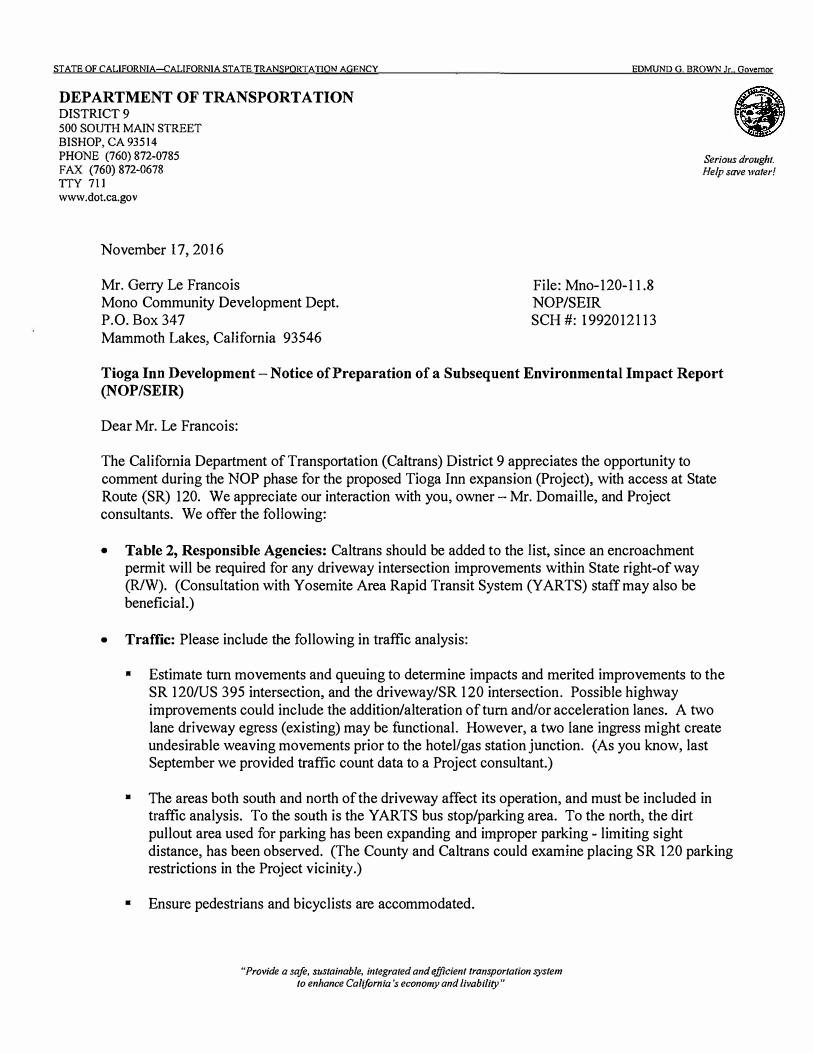
The California Department of Transportation (Caltrans) District 9 appreciates the opportunity to comment during the NOP phase for the proposed Tioga Inn expansion (Project), with access at State Route (SR) 120. We appreciate our interaction with you, owner- Mr. Domaille, and Project consultants. We offer the following:
• Table 2, Responsible Agencies: Caltrans should be added to the list, since an encroachmentpermit will be required for any driveway intersection improvements within State right-of way(R/W). (Consultation with Yosemite Area Rapid Transit System (YARTS) staff may also bebeneficial.)
• Traffic: Please include the following in traffic analysis:
• Estimate tum movements and queuing to determine impacts and merited improvements to theSR 120/US 395 intersection, and the driveway/SR 120 intersection. Possible highwayimprovements could include the addition/alteration of tum and/or acceleration lanes. A twolane driveway egress (existing) may be functional. However, a two lane ingress might createundesirable weaving movements prior to the hotel/gas station junction. (As you know, lastSeptember we provided traffic count data to a Project consultant.)
• The areas both south and north of the driveway affect its operation, and must be included intraffic analysis. To the south is the Y ARTS bus stop/parking area. To the north, the dirtpullout area used for parking has been expanding and improper parking - limiting sightdistance, has been observed. (The County and Caltrans could examine placing SR 120 parkingrestrictions in the Project vicinity.)
• Ensure pedestrians and bicyclists are accommodated.
"Provide a safe, sustainable, integrated and efficient transportation system to enhance California's economy and livab;/;ty"
Gerry Le Francois November 17, 2016 Page 2
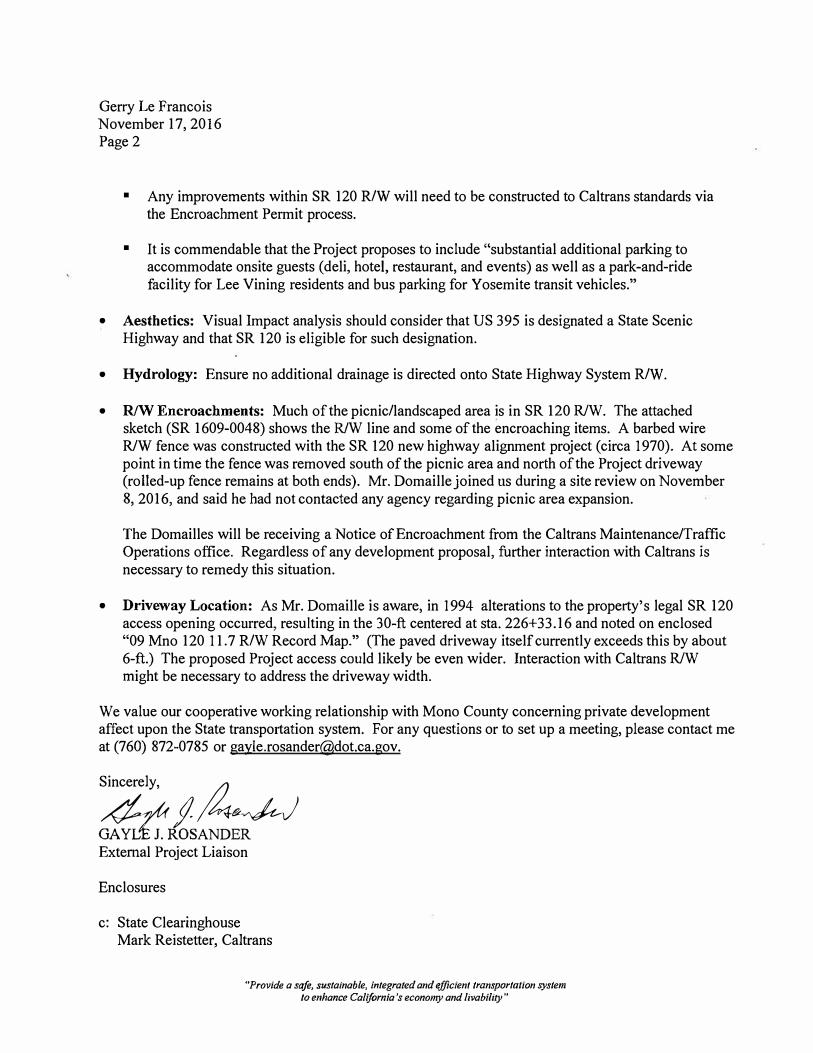
■ Any improvements within SR 120 R/W will need to be constructed to Caltrans standards viathe Encroachment Permit process.
■ It is commendable that the Project proposes to include "substantial additional parking toaccommodate onsite guests (deli, hotel, restaurant, and events) as well as a park-and-ridefacility for Lee Vining residents and bus parking for Yosemite transit vehicles."
• Aesthetics: Visual Impact analysis should consider that US 395 is designated a State ScenicHighway and that SR 120 is eligible for such designation.
• Hydrology: Ensure no additional drainage is directed onto State Highway System R/W.
• R/W Encroachments: Much of the picnic/landscaped area is in SR 120 R/W. The attachedsketch (SR 1609-0048) shows the R/W line and some of the encroaching items. A barbed wireR/W fence was constructed with the SR 120 new highway alignment project (circa 1970). At somepoint in time the fence was removed south of the picnic area and north of the Project driveway(rolled-up fence remains at both ends). Mr. Domaille joined us during a site review on November8, 2016, and said he had not contacted any agency regarding picnic area expansion.
The Domailles will be receiving a Notice of Encroachment from the Caltrans Maintenance/TrafficOperations office. Regardless of any development proposal, further interaction with Caltrans isnecessary to remedy this situation.
• Driveway Location: As Mr. Domaille is aware, in 1994 alterations to the property's legal SR 120access opening occurred, resulting in the 30-ft centered at sta. 226+33.16 and noted on enclosed"09 Mno 120 11.7 R/W Record Map." (The paved driveway itself currently exceeds this by about6-ft.) The proposed Project access could likely be even wider. Interaction with Caltrans R/Wmight be necessary to address the driveway width.
We value our cooperative working relationship with Mono County concerning private development affect upon the State transportation system. For any questions or to set up a meeting, please contact me at (760) 872-0785 or [email protected].
Sincerely, /4
�gAND� External Project Liaison
Enclosures
c: State Clearinghouse Mark Reistetter, Caltrans
"Provide a safe, sustainable, integrated and efficient transportation system to enhance California's economy and livabiUty"

From: Allison Brooker [mailto:[email protected]]Sent: Tuesday, November 15, 2016 6:20 PMTo: Gerry LeFrancois <[email protected]>Subject: NOP Comment: TIOGA INN PROJECT
Dear Gerry LeFrancois,
Thank you for the opportunity to comment on the proposed Specific Plan for the Tioga Inn Project.
I have been a frequent visitor to Lee Vining and the Eastern Sierra for more than 50 of my 57 years of life. Iconsider myself very lucky to spend every summer camping at the top of Tioga Pass. I know the entire area welland it is very dear to me. My mother and her father before her were very active in fighting to preserve Mono Lakeand the surrounding environs.
I have just became aware of this Tioga Inn project recently. I was wondering how it could be that I was not awarethat all this was approved in 1993, but there was no internet, blogs or Facebook pages then! Is there no action tobe taken to scale this development back?
My objections to the increase in scope to this project are based on aesthetics, cultural impact and concern for theoverall economic health of Lee Vining.
There are no visuals contained in the NOP document on which to comment. How can we comment on aestheticsif there is only a footprint to review?The existing Mobil Mart in my mind is an unremarkable, oversized mini-mall gas station to begin with. A biggerversion of that will not be better!
The personality of towns along Highway 395 have been complexity denigrated over the decades. Mojave is onegas station and fast food outlet after another, resulting in local small businesses being pushed out and a majorloss in the quality of life to the town’s inhabitants. There have been major declines to the character ofIndependence and Big Pine. If we have the power to make choices to protect the historical nature and characterof Lee Vining, I move to do so. Lee Vining will not be able to come back if we permit a larger entity to dominatebusiness in the area, due to their prime location at the exact intersection of Hwys 120 and 395.
Although the Tioga Mart is technically a small business, and the owners are local, exploiting this location to thedetriment of an an entire town should be minimized to the best of your ability.
Here are my specific comments:
A massive three story hotel structure is way out of proportion to the environment and dwarfs the localbusinesses
An 80-unit housing structure would also be too large a scale and out of proportion to the area. Logically itwould remain underutilized in the off months. Tioga Pass has the shortest season of all the trans-Sierrapasses. Again, I can’t comment on what it would look like since visuals are not presented. This is soimportant! It could look like a Motel 6 or the Westin Monache. We need to see the plans to comment on it!If they cannot be presented to us, then this decision must be postponed.
200 restaurant seats are too many and grants the Tioga Inn an unfair advantage over the localbusinesses. 100 seats are more than plenty.
A car rental agency outside a National Park for which the movement has been to reduce single vehicletraffic makes no sense! It makes no sense period in this location. One would have to drive there in a caror take a bus to get there in the first place to then rent a car.
Two gas pump islands is enough! They are quite large and I have never had to wait to purchase gasthere.
I do support the electric vehicle charging station While I do support the notion of 'meeting facilities, jobs and employee housing opportunities for area
residents’ a large scale, unremarkable architectural structure will do more harm than good. Thebeautiful Mono Basin Scenic Area Visitor Center offers facilities and an auditoriumthat well accommodates the activities and events of the area. I have attended many and found nothinglacking.

Other experts can speak to the impact on wildlife and environment. It is quite a large scale project and that therewon’t be impacts to either seems extremely unlikely.
I strongly urge Mono County does NOT move forward with approving this expansion. More detailed informationmust be made available to comment on. This is a fragile and cherished environment that needs to be respectedand preserved, not marred with large-scale, unremarkable structures for the ease and convenience of motoristspassing through on short-term visits.
If there is an opportunity to reduce the scope of this ‘approved' development, I will be there every step of the wayto participate in that action.
Thank you again for the opportunity to comment.
Kind regards,
Allison Brooker2556 Glen Green StreetLos Angeles, CA [email protected]
November 1, 2016
Gerry LeFrancoisMono County Community Development DepartmentPO Box 347Mammoth Lakes, CA [email protected]
Re: Scoping Comments on the Tioga Inn Project
Dear Sir:
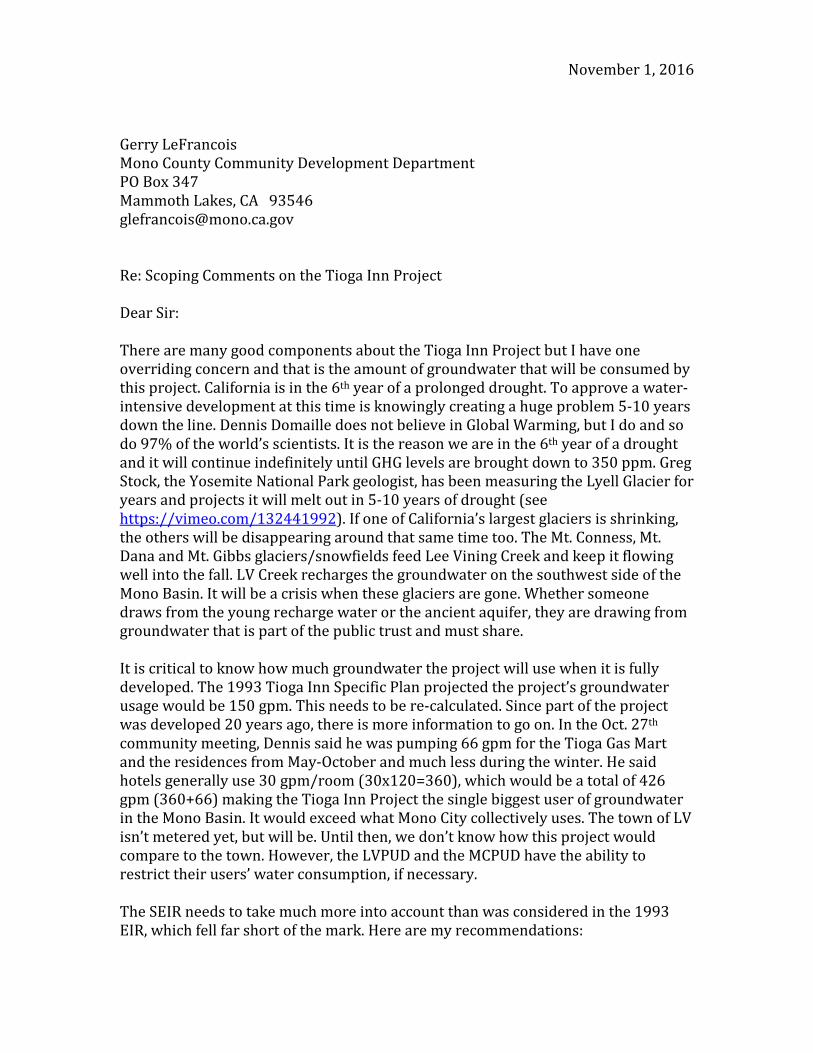
There are many good components about the Tioga Inn Project but I have oneoverriding concern and that is the amount of groundwater that will be consumed bythis project. California is in the 6th year of a prolonged drought. To approve a water-intensive development at this time is knowingly creating a huge problem 5-10 yearsdown the line. Dennis Domaille does not believe in Global Warming, but I do and sodo 97% of the world’s scientists. It is the reason we are in the 6th year of a droughtand it will continue indefinitely until GHG levels are brought down to 350 ppm. GregStock, the Yosemite National Park geologist, has been measuring the Lyell Glacier foryears and projects it will melt out in 5-10 years of drought (seehttps://vimeo.com/132441992). If one of California’s largest glaciers is shrinking,the others will be disappearing around that same time too. The Mt. Conness, Mt.Dana and Mt. Gibbs glaciers/snowfields feed Lee Vining Creek and keep it flowingwell into the fall. LV Creek recharges the groundwater on the southwest side of theMono Basin. It will be a crisis when these glaciers are gone. Whether someonedraws from the young recharge water or the ancient aquifer, they are drawing fromgroundwater that is part of the public trust and must share.
It is critical to know how much groundwater the project will use when it is fullydeveloped. The 1993 Tioga Inn Specific Plan projected the project’s groundwaterusage would be 150 gpm. This needs to be re-calculated. Since part of the projectwas developed 20 years ago, there is more information to go on. In the Oct. 27th
community meeting, Dennis said he was pumping 66 gpm for the Tioga Gas Martand the residences from May-October and much less during the winter. He saidhotels generally use 30 gpm/room (30x120=360), which would be a total of 426gpm (360+66) making the Tioga Inn Project the single biggest user of groundwaterin the Mono Basin. It would exceed what Mono City collectively uses. The town of LVisn’t metered yet, but will be. Until then, we don’t know how this project wouldcompare to the town. However, the LVPUD and the MCPUD have the ability torestrict their users’ water consumption, if necessary.
The SEIR needs to take much more into account than was considered in the 1993EIR, which fell far short of the mark. Here are my recommendations:
1. Mono Lake--One of the County’s most important assets is Mono Lake. MonoLake is at a tipping point right now from the 40-year drought LADWPimposed on the lake and the natural drought of the past 5 years. The lake isat its second lowest level since Europeans came to this basin. Even with 80%of normal snowpack in the mountains above us last winter (2015-16), MonoLake dropped a foot. The lake is at risk and the SEIR needs to prove thatpumping groundwater for the Tioga Inn Project will not affect it.
2. Local Springs--There are many freshwater springs around and under thelake. Wildlife use the springs at the lakeshore. Deer, coyotes, bobcats, andmountain lions drink from these springs. Birds drink from these streams tooand wash their feathers in it. As springs and streams dry up due to ClimateChange, protecting the ones that remain becomes a priority. The Mono Basinis a wildlife corridor and will become even more important as animalsmigrate, seeking refuge from the impacts of Climate Change. The springs alsocontribute the calcium that creates tufa, the unique feature of Mono Lake thatbrings 365,000 visitors from around the world each year. The SEIR mustshow that the project’s groundwater pumping must not affect these springs.The project’s Well #1 starts 400’ above the level of Mono Lake and goes 580’deep. It could affect the springs. A current stress test needs to measure theflow of the springs and needs to age the water from the well and the springsto determine if they are connected.
3. LV Creek--In 1984, when the first test was done on the Tioga Inn Project’sWell #1, LV Creek was fully diverted by LADWP and the streambed from thediversion to Mono Lake was dry. The creek was re-watered in 1986 underspecific agreements as to how many cfs were to flow downstream. Morerecently, the agreement has been refined even further to mimic the naturalhydrological flows. The SEIR must ensure that the project’s groundwaterpumping does not undercut those agreements. It must not reduce thecontractual cfs in LV Creek from the diversion to the mouth of the creek. The1992 well tests did show there was no impact, but the stream flow andground saturation was just starting. I suspect the lower LV Creek flow wasnot checked below the town.
4. Neighboring Wells--There are private wells on nearby properties thatprecede Dennis’s well. The closest well is on the Andrew’s property that isacross the highway from Well #1. They are a Native American family that hasbeen living here since the Europeans came to the Mono Basin. There is also awell at the USFS Ranger Station and probably some in town. The LVPUD isrequired to have a backup water source and will be drilling a well nearby too.The current LVPUD water source is a spring up LV canyon that wasdwindling in volume last year due to the drought. As the drought continues,the town of LV will be relying more and more on well water. All these wells(including the project’s) will eventually dry up due to the drought, but theprocess will be accelerated by the project’s higher rate of pumping. It is notfair that local citizens should have to pay to drill new wells every so manyyears because of this project. That imposes a huge financial burden on thosethat can least afford it. The project’s specific plan should stipulate that the

developer must post a bond to fully reimburse the owners of the neighboringwells for the cost of drilling new wells for as long as the project is pumpinggroundwater—especially the Andrew family’s well.
5. Surface Vegetation--Less recharge water flowing beyond the Tioga InnProject’s well site(s) to the basin floor, might affect the surface vegetation inthe basin. Sagebrush, Bitterbrush, Rabbitbrush, and Jeffrey Pines have deeproot systems that can reach the shallow groundwater flows coming from themountains above. There may be a point where the pumping for the Tioga InnProject prevents a sufficient amount of water from flowing past the well siteand into the basin to keep the natural vegetation in the basin alive.Bitterbrush is a very nutritious for deer, antelope, and the sheep that stillgraze in the Basin. It provides cover for the Bi-State Sage Grouse, which alsolive in the Basin. A baseline assessment should be made and the vegetationmonitored.
6. Prepare for Adjudication--The SEIR or the County should list eachneighboring well, its depth, when it was put in, and its current usage toprepare for future adjudication of groundwater rights as the droughtcontinues. The SEIR should also determine the size of the aquifer that theproject is tapping into and the age of the water, whether it is ancient water oryoung water (from stream recharge). California is far behind the rest of thewestern, drought-stricken states in adjudicating groundwater rights. A littleforesight on the part of the County now, can lay the groundwork for resolvingfuture conflicts, especially since it has approved a project that will certainlytrigger one.
The genie is out of the bottle with the 1993 project approval, but the County can stillmitigate the consequences. The specific plan can require annual monitoring of thewater table level, the recharge flow, the local springs, the basin vegetation, etc. Moreimportantly, it can and must cap the Tioga Inn Project’s groundwater use. Theremust be a restraint. The restraint could be tied to the recharge rate i.e. as the glaciermelt dwindles, pumping is reduced equivalently or there might be a cap on howmuch the ground table is allowed to drop. Once the threshold is reached, the projectwould be cut back to the level of the other users and after that, all users should bereduced equally. We want to avoid the situation where the citizens in LV areconserving water, flushing only once a day, and showering every other day to saveMono Lake while hotel guests are freely using water without any concern for theconsequences. Recycling grey water will not solve this problem and I stronglyrecommend that the hotel not include a swimming pool. Please keep the water hogin check.
Sincerely,
Lynn BoultonPO Box 234Lee Vining, CA 93541

From: Lynn Boulton [mailto:[email protected]]Sent: Tuesday, November 8, 2016 10:27 AMTo: Sandra Bauer [email protected]: Re: Tioga Inn Project–Scope of Hydrology Evaluation
Dear Ms. Bauer,I sent this email early yesterday and it was just now returned. The Mono County website doesn't have thecorrect email address for you in the agenda packet, which is where I got your email address. So thisemail is too late for you to consider raising the contract rate with the County as it is on the Board's agendafor today. You probably needed more time to change the contract anyway.
I'm concerned that the planned hydrology tests are limited to just figuring out if Dennis' well has enoughwater to support his project plans and are not robust enough to evaluate the impacts of a significantincrease in groundwater pumping on the Mono Basin environment. I hope the hydrology tests includedetermining the age of the groundwater Dennis' well is tapping into, the age of the springs going intoMono Lake, the age and size of the southern basin's aquifer, and the impacts to neighboring wells, thelocal springs that flow into Mono Lake, and to the flows in LV Creek. Will they?
Regards,Lynn BoultonLee Vining

1
November 10, 2016
Gerry LeFrancoisMono County Community Development DepartmentPO Box 347Mammoth Lakes, CA [email protected]: [email protected]
Re: Scoping Comments on the Tioga Inn Project
Dear Sir:
I appreciate the opportunity to comment on the Tioga Inn Project. Additional higherpaying jobs and employee housing is needed in Lee Vining and I’m sure, visitors willwelcome more hotel rooms. However, I believe the project will detract from thepeaceful and natural setting of the Mono Basin. It splits Lee Vining into an upscaleself-contained area and a quaint, run-down town center. It will lead to a traffic lightat Highway 120 and 395, the first between Gardnerville and Bishop, and it willcreate longer queues at the entrance to Yosemite National Park.
The Hotel:I’d like to see the project scaled down to mitigate the project’s impact on the MonoBasin viewshed and to be more in line with the County’s dark sky policy. I support atwo-story, not three-story, hotel and recommend that the restaurant be built inside(or beside the hotel) and not at the flagpole. Perhaps the County could negotiate thereversal of approval for the restaurant at the flagpole in exchange for a partial 3-story hotel. If not, the coffee shop in the 1993 plan can be built lower (withexcavation) than the Tioga Gas Mart to not block its view of Mono Lake. With the oldor the new plan, the view of the lake from the Tioga Gas Mart will be partiallyblocked anyway by the hotel. The hotel will act like a wall to everyone’s rightnarrowing the arc of the view to just the northeast. Even with a restricted viewpeople will still enjoy eating outdoors at the Whoa Nelly Deli. Besides, Mono Lakewill be continuously shrinking with Global Warming so the value of its view willdiminish over time. To prevent the wall effect the hotel creates, maybe the front ofthe hotel can be broken up. Maybe part of the hotel could be more forward than therest, tiered, or maybe just a part of it could be 3-stories.
I assume all the mitigations in the 1993 Specific Plan still apply. However, one of themitigations required the hotel to have an alpine design. That would work inMammoth, but an alpine style in Lee Vining doesn’t really fit with sagebrush. InsteadI’d like to suggest that the exteriors of the hotel and the restaurant(s) be unique,tasteful, and rustic—maybe matching the USFS Lee Vining Visitor Center. It wouldbe a travesty to have a hotel chain’s or restaurant chain’s regular design in such anunusual setting and location. If a chain were to move in, they should design uniquebuildings especially for this location.
2
Because anything built in sagebrush-steppe terrain will standout, an alternative is toconvert the sagebrush to a Jeffery/aspen tree forest by planting a lot of trees in frontof the hotel and around it to hide the buildings and block the lights. The hotel willhave a moraine behind it so it is only visible coming from town. I think one could getaway with a bit of forest there and have it look more or less natural. There are a fewJeffery trees growing there now. It would also match the terrain in the riparian zoneof Lee Vining Creek just across the street. This approach assumes that greywaterwould be used to make the trees grow. Trees will obviously block the view of MonoLake from the hotel, but hotel guests spend less than a minute looking out theirwindows even when there is a view.
To minimize the amount of pavement and the unnatural feel that comes with it andto have a darker sky, the hotel parking should be underground. Then the parkingarea could be as large as one wants and as lit up as one wants and there would bemore sagebrush terrain for wildlife passing through and less of a “pave paradise”effect.
Gas Pump:The sodium lights of the existing gas pumps are extremely bright and very visiblefrom town and the highway. Dimmer lights should be used for the existing two gaspumps as well as for the third gas pump. The Tioga Gas station’s lights are brighterthan the lights at the Shell station in town.
The Flagpole Restaurant:The 1993 Tioga Inn Project Specific Plan determined that a restaurant on top of themoraine east of the flagpole conformed to dark sky and low profile/aestheticrequirements of the Mono County General Plan because the building would be apretty (no guarantee) and could be screened by natural landscaping. I disagree. Itwill be sitting on top of a bare moraine, on a promontory that is visible from aroundthe lake. The native sagebrush is not high enough to cover it. Screening it with treeswill not make it blend in with the surrounding low sagebrush-steppe vegetation. Aclump of trees in the middle of the sagebrush will look out of place. However, since asmall restaurant has already been approved for that location, the new site planneeds to minimize the visual impact. A 24-hour restaurant should not be allowed,nor neon trademark signs on or around the building (or on the promontory), norlighted trademark signs after closing time, and no trademark signs visible fromanywhere in the Mono basin from that promontory. Shock went through the roomwhen Dennis mentioned the appalling possibility that an Applebee’s might be there.All we need is an Applebee’s neon sign that can be seen from anywhere in the MonoBasin. Besides, there is nothing special about their food that would be in line withthe uniqueness of the Mono Basin. I personally think a windbreak with outdoorbenches to watch the sunset would be more fitting instead of a restaurant. Therecould even be a footpath to/from the hotel.
Employee Housing:Employee housing is one of the few benefits this project can give to the town of LeeVining. Yet, 80 beds or 40 units are too many especially when they are little cabinspacked closely together. That means 40 more lights at night plus lights illuminatingthe way to the community bathrooms. That number should be cut in half and everyunit must include a bathroom. People should not have to go outside in the middle of
3
a winter night to another building to go to the bathroom. The current employeehousing is attractive only to 20-somethings who come with just a backpack ofbelongings for the summer. It will not attract a wider range of employees. If it is tohelp the town, then normal housing is required. What is needed are studio or 1-bedroom apartments big enough for a queen-size bed or two single beds (not bunkbeds) with minimal amenities. People would prefer to pay a lower rent (in the$400-$700/month range) than have garages, private laundry rooms, living rooms,or dining rooms. People just need a small sleeping area, small kitchen, a bathroom, asmall TV/eating area, and some storage/closet space. One communal laundry roomcould serve all the renters in the complex.
By taking advantage of the southern exposure to the sun, an apartment building,with common walls between units and proper insulation, might be warm enough inthe winter without needing a heat source inside each unit. If more heat is needed,renters can buy a plug-in heater. Certainly 80 wood-burning stoves would create toomuch smoke for everyone—for the hotel guests as well as the locals. The apartmentbuilding could be fitted with solar panels for hot water and electricity on the roof orthere could be a set of stand-alone solar panels for the whole apartment complex offto the side. This is an opportunity to be an energy efficient housing project.
Another reason to cut down on the number of employee units is to keep the unitsfrom being seen from Highway 395 during the day and from other parts of the MonoBasin at night. The more units there are, the further they will extend to the south orup the slope of the moraine and be seen. Right now the cabins can’t be seen from thehighway, but with more, they would be visible as one comes around the bend nearthe Test Station Road turnoff going north. Screening the units with Pinyon trees,Sagebrush, and Bitterbrush won’t be as effective as nestling them down in a hollow.The bench they are on could be carved out to make a bowl so that part of themoraine rises up behind them to the south and east as a screen. It would be best ifthe natural ridgeline of the moraine were to remain the same.
The Water Tank:Screen the second water tank with Pinyon Pine trees—it will be just as visible as theVerizon tower is now from many directions. I can see the VZ town from the LeeVining Creek trail even. There is a cluster of Pinyon trees behind the Verizon towernow that can be exploited to screen a green tank. Just add more Pinyon trees andmaybe a Jeffrey or two.
Landscaping:Require drought resistant, native landscaping (not lawn, not spruce trees)—toconserve water e.g. Sagebrush, Rabbitbrush, Bitterbrush, Juniper trees, Jeffrey Pines,Pinyon Pines, and Mountain Mahogany for screening and native pollinator flowersfor the small spaces around the buildings. The Native Plant Society can provide alist of flowers.
Wildlife:Since this project is set in the home of wildlife, herbicides should not be used. Thereare many birds, rabbits, and chipmunks on the property that eat the dandelions,seeds and worms in the lawn and along the sagebrush edge. Occasionally deerbrowse on the lawn areas as well. Please let’s not poison the wildlife.
4
The increase in year-round traffic with this development will keep the deer, coyotesand bobcats away in summer and, now, in winter too. On winter mornings after asnowfall, one can see coyote and bobcat tracks in the snow leading to the LV Creek.They go across the eastern end of Dennis’ property, crossing Highway 120, andturning down the driveway to the Andrew’s house on the SCE property. The SEIRshould acknowledge the loss of this route for wildlife. Wildlife will be forced to circlearound behind the development to travel up Lee Vining Canyon or to go around thetown to the east (via lower LV Creek). This development will force them to cross395 much more often. On 1/1/16 a coyote was hit by a vehicle and died in thecenter divider of 395 just where the lanes split below Dennis’ flagpole. The TiogaInn Project will bring more traffic and exacerbate the situation. Underpasses areneeded along Highway 395 at the eastern end of Dennis’ property and at thenorthern end of town for wildlife to go around this development and the town.
If we look down the road 20 years, the Tioga Pass Road will probably be open muchlonger due to Global Warming and less snow in winter. There will be more trafficand more wildlife collisions all along it. Lee Vining Canyon is a wildlife corridor andanimals cross the road. An over/underpass might be needed further up Lee ViningCanyon as well to help wildlife cross Highway 120.
The SEIR should also provide an update on the impact the current development hadon the Casa Diablo herd that used to pass through Dennis’ property to go up LVCanyon—the 113 deer. Only the occasional deer, one bear, one bobcat, and onecoyote have come through Parcel 4 in the six years I’ve lived there. Wildlife avoidshumans.
Bear-proof dumpsters and trashcans—bears have visited the Tioga Gas Mart andthey come into town each year. Fewer are hibernating with Global Warming.
Town Impacts:Encourage cross-pollination between the LV town guests and the Tioga Inn guests.There could be a footbridge and a nature trail connecting the two. The trail couldcross LV Creek (well west the Andrew’s place) and join up with one of the roads offof Utility Road that enters town between the LV Elementary School and the PostOffice—no lights along it. Although no one has been injured walking along thehighway, it is very unnerving walking along the curve wondering if the drivers arepaying attention. It would be nice if some the County taxes from the Tioga Innproject could go towards improvements in Lee Vining instead of Mammoth.
People come to the Mono Basin to get away from the crowds and traffic and toexperience nature in the raw. Let’s not lose what is so precious and special about theMono Basin.
Sincerely,
Lynn BoultonPO Box 234Lee Vining, CA 93541

From: Lynn Boulton [mailto:[email protected]]Sent: Tuesday, November 15, 2016 9:29 PMTo: Wendy Sugimura [email protected]; Gerry LeFrancois <[email protected]: Sandra Bauer [email protected]: Re: Tioga Inn Project–Scope of Hydrology Evaluation
Wendy,I'm thinking the well stress test should be done twice, at peak run-off in June and also at the lowest run-off in October or November. It is the low that will be the most important one to evaluate if there is enoughrecharge to support the quantities of the hotel's water use during the winter. Last time they only did it inJune 1992 at the peak. -Lynn
Malcolm and Ellen Mosher1054 Lundy Lake Road
Lee Vining, CA 93541
November 16, 2016Dear Mono County EIR Review Committee,
We attended the hearing at the Lee Vining Community Center in October, we raised several issues at that time, and per your suggestion I formalize those issues here in specific categories.
Water Issues1. With regard to water, the EIR appears to have reasoned that the water consumption for this project
was sustainable in 1993, but this is 23 years later, we have had an unprecedented drought for 5straight years, and this year has the appearance of being more of the same. The demands for waterare going to be much greater by way of all the rental property the owner wants to add and the jumpfrom 150 seats in the approved restaurant to his new request for 400. With global warming andclimate change, how can we be certain of that the proposed water usage is even sustainable for theoriginal 1993 plan?
Traffic Issues1. In 1993, who envisioned the dramatic increase in traffic going up to Yosemite as well as coming
down from Yosemite? As a resident traveling southbound on 395 to the dump, I have had numerouscars dart out in front of me from 120 to head southbound, and going northbound I have had themore than a few cars dart out in front of me to get into town or head northbound. The proposedproject is going to increase the volume of traffic going or down from 120.
2. In 1993, who envisioned the volume of cars driving through town. The speed limit is posted as 30,but it is rarely enforced, there are pedestrians crossing the streets all day long, and we can assureyou that very few observe that speed limit. Most go 35-45 through, and quite a few go in excess ofthat. This is an area that needs to be policed on a regular basis, it is not being done at all currently,and between the proposed rental properties and the 400-seat restaurants, the volume goingthrough town is going to increase, and it is highly doubtful that these people will be any more likelyto observe the posted speed limit than everyone else that bombs through town.
3. The hotel and the restaurants are going to add a significant increase to parking in town. Peoplebeing what most are, guests at the hotel are not going to want to walk from the hotel to the town;they will drive and park. Parking today is very limited during the summer due to the current volumeof visitors in town. Where will the increase park? An ugly parking lot is not a solution either.
4. I have mentioned the traffic above with respect to the center of town; by the school it is anothermatter. In years past, I remember law enforcement monitoring the traffic speeds by the school. Ihave not observed that at all in the last two years, and we can assure you that no one observes thatspeed limit there; the traffic routinely passes the posting at 50-60 mph and they do not begin to slowdown until they hit the area by the Mono Cone. This is not an issue as such for the proposal on thetable, but the traffic is already out of control by the school, law enforcement has done nothing aboutit (I realize that they may have more important work to do), and sooner or later there is going to be atragedy. While the hotel and restaurant proposal is not involved in the current traffic, is there anyreason not to believe that the new traffic from these new establishments is not going to follow thesame pattern? The greater issue here is that the increase in traffic already is not monitored by lawenforcement, and I should think that an EIR has to included the increased need for more lawenforcement or a possibly traffic light (which I doubt anyone wants). Where will the funding come forincreased law enforcement.
Discreet or Eyesore
1. The original approval was for a two-story structure that will sit on a promontory, and it will be highlyvisible. To increase it to three stories is going to increase it by another 3rd. Frankly I am utterlymystified how an EIR can be produced without knowing the exact height of the building.Environmental Impact has to consider resources like water, traffic impact, and there is also thevisual impact and a three-story building, including structures on the roof for elevators, a/c, andventing. This could easily fall in the 55-60 foot height, and on that promontory, it will loom up andappear gigantic. I my humble opinion, the elevation must be known, and story-poles should beerected to give all a chance to see exactly how big this is going to be. Story-poles are required inSanta Clara County and I suspect in other counties.
2. Night Lighting. When we built our house, the County said we must have night lighting, and that is aconcept that I embrace. How is a hotel with 120 rooms, all the additional proposed facilities, andtwo 200-seat restaurants NOT going to light up the night from lighting within the hotel. The only wayto control lighting coming through the windows of the hotel is through heavy tinting of the glass.Then there is the lighting for the parking lots. Between the hotel and the two restaurants, theparking area will be huge. If these are elevated lamps on poles, that lighting, even it pointing onlydownward, is going to light up the sky by the sheer volume of lights.
3. Between the lights within the hotel on a promontory, plus the external restaurant, plus all the parkinglots, the area will shine like a beacon all over the Basin, whether one is in Mono City or one is atSouth Tufa. From the Old Marina, the lights may not be visible, but glow will be.
4. The original approval provided for a 50-seat coffee shop plus the 100-seat restaurant on Parcel 2.The new proposal for 400 seats is nearly 200% increase, and this is on top of the Mobile Mart, theWhoa Nellie Deli, and the service station. As a resident, I strongly oppose this.
Parcel 2 Specifics1. With all due respect to the owner, the claiming that these are work-force housing is fiction; these are
income rental properties. Like the issue regarding the height of the hotel, how can one possiblygauge the environmental impact without out knowing exactly what he plans to build. Are they allstudio units? How many are one bedroom? How many are two bedroom? This has an impact onwater usage, sewage, night lighting, traffic, wildlife - just about everything you can think of.
2. For one and two bedroom units, one has to consider children and the impact on the Lee Viningschool system, classroom sizes, teachers, special education for non-English speaking students.
3. The owner’s suggested diagram is completely misleading; it lists 51 structures. So for 80 bedrooms,that represents 29 two-bedroom units, and this could mean an increase of from 29 to 90 students tothe school system. This could then result in bonds in the form of taxes on Lee Vining to pay for theinfrastructure to take on a huge increase in students. This is environmental impact because itaffects every one who pays taxes in Lee Vining.
4. Essentially what he proposes is a very low budget mini Mono City. This is about greed andmaximizing every square inch for profit. By his own admission, he said these would be bare-bonesunits and he would rent them for the highest he can get for them. The impact in all respects is bigfor Lee Vining.
5. The owner needs to be precise in specifying exactly how many structures he wants, how manybedrooms per structure, the height of each structure (one story, two story), how many garages willbe included.
We urge you to require that he be precise in specifying the height of the hotel, the number of structures in the so-called work-force housing, their heights, the number of bedrooms per unit. Without this information, you cannot possibly know the real impact of his proposal on the physical environment and the impact on all aspects of the community.
Personally, the owner was granted permission in 1993, but Lee Vining and the environment have changed. Since he was granted permission in 1993 and it cannot be rescinded, he should be held to what was granted in 1993. All of his new proposals have extraordinary impact on the landscape, the
community, and the classic issue of environment such as water, pollution, electricity, runoff and drainage. Putting in grass lawns in front of the hotel that would be visible from the highway - simply incongruous with the area and the visuals of the landscape. This is Lee Vining, not Beverly Hills.
What will be the impact of this on the workforce. This hotel will have very limited value during the Fall, Winter, and Spring, depending on when Tioga Pass closes. This means seasonal employment. What will happen to the workers when the hotel staff is reduced by 80-90%?
Finally, consider the impact on the other businesses in the town. The hotel will severely affect the motels in town, and the 400-seat restaurants will wipe out the food services in town. Further Applebees and Outback Steak are no better than Nicely’s. These are low-end fast-food joints. The proposed shops in the hotel will affect the shops in town that sell odds and ends, particularly the Bronze Bear and the Yosemite Trading Post. How will this not gut the businesses in town? There needs to be something for everyone, and the scaled-back 1993 proposal at least provides equal opportunity for all to co-exist, but not the revised proposal that is on the table. The proposal to increase the pumping islands from two to three is yet another means of trying to take over all business in town. I am of course for equal and fair opportunity, and free enterprise is of course an American ideal, but completely cornering all markets with the veiled purpose of driving other local business out of existence is not fair.
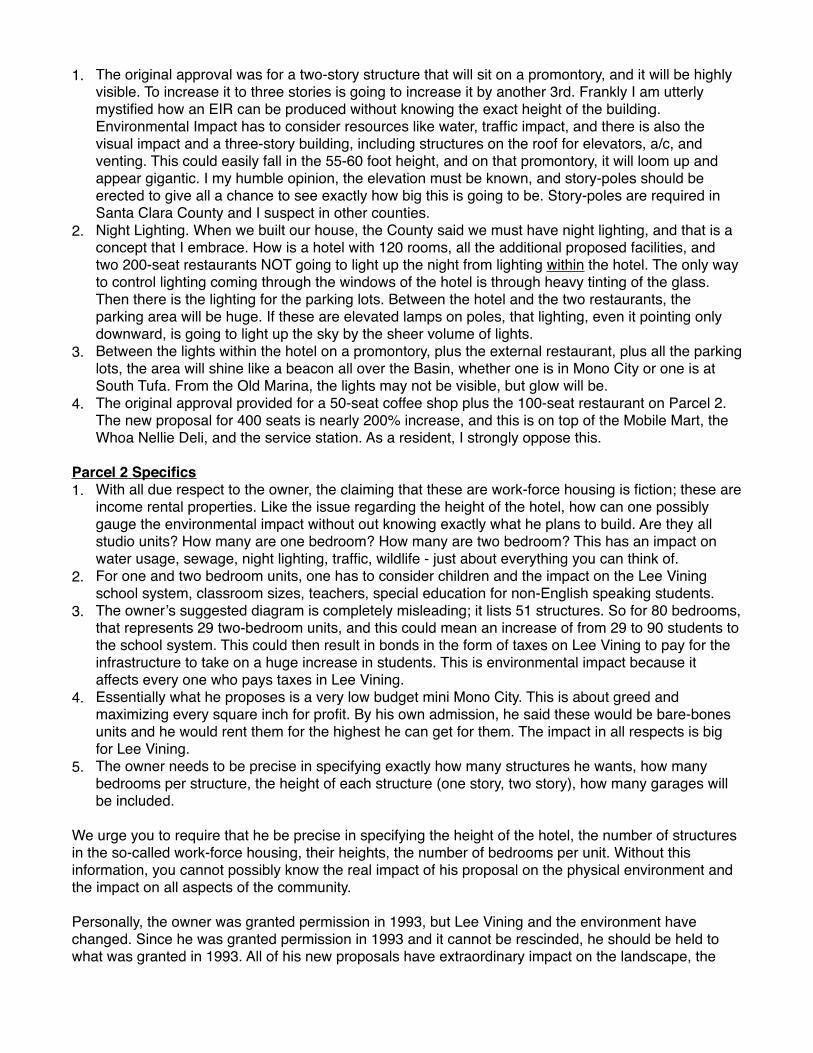
As for where to produce a rendering, on the next page is a suggested view, taken from Test Station Road
Sincerely,Malcolm and Ellen Mosher
November 17, 2016
Mono Countyc/o Gerry LeFrancoisBauer Planning and Environmental Services, Inc.P.O. Box 347Mammoth Lakes, CA 93546
Comments regarding the proposed Tioga Inn Project.
We are homeowners in Lee Vining and have reviewed the Notice of Preparation of aSubsequent Environmental Impact Report and Specific Plan for the Tioga Inn Project. Wehave a number of questions and concerns in connection with this proposal.
a. The Size of the Project.
This project is huge. It would almost double the number of lodging rooms in the townof Lee Vining. While hotel rooms are frequently sold out in the summer, are there reallyenough visitors to fill these rooms? The 120 rooms in the proposed hotel plus the 200seat restaurant would place a heavy burden on the existing services in Lee Vining. The80 workforce housing units, while laudable in their inclusion in the plan, could increasethe population of Lee Vining by up to 200 people. (80 workforce units at 2.5 occupantsper unit). What might be the effect on local schools?
b. Water.
There must be a careful analysis of the effect of well drilling to support 200 housingunits (120 hotel and 80 workforce) as well as the restaurant on the existing watersupply in the town. This past summer Lee Vining was on significant water restrictionsand a huge increase is groundwater draw could degrade the availability of water on theexisting users.Also I am concerned about the effect of this large groundwater draw on the water levelsin Mono Lake. The lake level has been falling for years and is approaching critical levelsin terms of salinity and the likely occurrence that the land bridge between Black Pointand Negit will be reopened.
c. Sewage
While the expansion plan includes a sewage treatment plant the effluent will bedisposed of through a leach field. It appears that the leach field flow could end up in LeeVining creek and thereon to Mono Lake. Have there been studies to see what negativeeffects this outflow could have on fish populations in Lee Vining Creek?

d. Fire Department
The proposal calls for a 3-story hotel. The Lee Vining Fire Department does not ownequipment to properly fight a fire on a 3-story building. This issue came up a few yearsago during the construction of a private resident in Lee Vining. Visitors staying in theproposed in 3-story building would not be able to be properly protected from fire. Evenif equipment were made available for the Lee Vining Fire Department, the firehouse istoo small to park any such equipment.
e. Visibility and Views
The proposed site overlooks the Mono Lake National Forest Scenic Area. The proposed3-story building could be a visual blight of the Scenic Area. Are there adequate setbacksin the plans to make sure that the buildings are not visible from the Scenic Area?
In summary, as currently proposed this project is too large and too great a burden on thecommunity of Lee Vining and the natural resources that make our town so special.
Thank you.
Larry & Carol Holt81 Paoha Drive / P.O. Box 24Lee Vining, CA 93541
619-733-8922
State of California - Natural Resources Agency DEPARTMENT OF FISH AND WILDLIFE Inland Deserts Region 3602 Inland Empire Blvd., Suite C-220 Ontario, CA 91764 (909) 484-0459www.wildlife.ca.gov
November 18, 2016
Gerry Le Francois Mono County PO Box 347 Mammoth Lakes, CA 93546
EDMUND G. BROWN, Jr •• Governor
CHARLTON H. BONHAM, Director
Subject: Notice of Preparation of a Draft Environmental Impact Report Tioga Inn Project State Clearinghouse No. 1992012113
Dear Mr. Le Francois:
The California Department of Fish and Wildlife (Department) appreciates the opportunity to comment on the Notice of Preparation (NOP) of a Draft Environmental Impact Report (DEIR) for the Tioga Inn Project (project) (State Clearinghouse No. 1992012113). The Department is responding to the NOP as a Trustee Agency for fish and wildlife resources (California Fish & G. Code, §§ 711.7 & 1802, and the California Environmental Quality Act [CEQA] Guidelines. § 15386), and as a Responsible Agency regarding any discretionary actions (CEQA Guidelines, § 15381 ), such as the issuance of a Lake or Streambed Alteration Agreement (California Fish & G. Code,§ 1600 et seq.) and/or a California Endangered Species Act (CESA) Permit for Incidental Take of Endangered, Threatened, and/or Candidate species (California Fish & G. Code,§§ 2080 & 2080.1 ).
The Project proposes to construct the Tioga Inn and associated project features on the site of the existing Tioga Gas Mart and Whoa Nellie Deli, in the unincorporated community of Lee Vining. The project area encompasses 4 parcels totaling 67.8 acres of land. The project consists of multiple elements, many of which were analyzed in the 1993 environmental and planning documents. The original concept was to provide a full range of services and facilities for tourists, as well as meeting facilities, jobs and employee housing opportunities for area residents.
COMMENTS AND RECOMMENDATIONS
The Department has jurisdiction over the conservation, protection, and management of fish, wildlife, native plants, and the habitat necessary for biologically sustainable populations of those species (i.e., biological resources. The Department offers the comments and recommendations presented below to assist Mono County (the CEQA lead agency) in adequately identifying and/or mitigating the project's significant, or
Conserving Ca{ifomia's Wi{a{ife Since 1870
Notice of Preparation of a Draft Environmental Impact Report Tioga Inn Project SCH No. 1992012113 Page 2 of 6
potentially significant, impacts on biological resources. The comments and recommendations are also offered to enable the Department to adequately review and comment on the proposed project with respect to impacts on biological resources. The Department recommends that the forthcoming DEIR address the following:
Assessment of Biological Resources
Section 15125(c) of the CEQA Guidelines states that knowledge of the regional setting of a project is critical to the assessment of environmental impacts and that special emphasis should be placed on environmental resources that are rare or unique to the region. To enable Department staff to adequately review and comment on the project, the DEIR should include a complete assessment of the flora and fauna within and adjacent to the project footprint, with particular emphasis on identifying rare, threatened, endangered, and other sensitive species and their associated habitats. The Department recommends that the DEIR specifically include:
1. An assessment of the various habitat types located within the project footprint, and amap that identifies the location of each habitat type. The Department recommendsthat floristic, alliance- and/or association based mapping and assessment becompleted following The Manual of California Vegetation, second edition (Sawyer etal. 2009). Adjoining habitat areas should also be included in this assessment wheresite activities could lead to direct or indirect impacts offsite. Habitat mapping at thealliance level will help establish baseline vegetation conditions;
2. A general biological inventory of the fish, amphibian, reptile, bird, and mammalspecies that are present or have the potential to be present within each habitat typeonsite and within adjacent areas that could be affected by the project. TheDepartment's California Natural Diversity Database (CNDDB) in Sacramento shouldbe contacted at (916) 322-2493 or http://wildlife.ca.gov/Data/CNDDB to obtaincurrent information on any previously reported sensitive species and habitat,including Significant Natural Areas identified under Chapter 12 of the Fish and GameCode, in the vicinity of the proposed project. The Department recommends thatCNDDB Field Survey Forms be completed and submitted to CNDDB to documentsurvey results. Online forms can be obtained and submitted at:https://www.wildlife.ca.gov/Data/CNDDB/Submitting-Data.
Please note that the Department's CNDDB is not exhaustive in terms of the data ithouses, nor is it an absence database. The Department recommends that it be usedas a starting point in gathering information about the potential presence of specieswithin the general area of the project site.
3. A complete, recent inventory of rare, threatened, endangered, and other sensitivespecies located within the project footprint and within offsite areas with the potentialto be affected, including California Species of Special Concern (CSSC) andCalifornia Fully Protected Species (Fish & G. Code, § 3511 ). Species to beaddressed should include all those which meet the CEQA definition (CEQA
Notice of Preparation of a Draft Environmental Impact Report Tioga Inn Project SCH No. 1992012113 Page 3 of 6
Guidelines, § 15380). The inventory should address seasonal variations in use of the project area and should not be limited to resident species. Focused species-specific surveys, completed by a qualified biologist and conducted at the appropriate time of year and time of day when the sensitive species are active or otherwise identifiable, are required. Acceptable species-specific survey procedures should be developed in consultation with the Department and the U.S. Fish and Wildlife Service, where necessary. Note that the Department generally considers biological field assessments for wildlife to be valid for a one-year period, and assessments for rare plants may be considered valid for a period of up to three years. Some aspects of the proposed project may warrant periodic updated surveys for certain sensitive taxa, particularly if the project is proposed to occur over a protracted lime frame, or in phases, or if surveys are completed during periods of drought.
4. A thorough, recent, floris!ic-based assessment of special status plants and naturalcommunities, following the Department's Protocols for Surveying and EvaluatingImpacts to Special Status Native Plant Populations and Natural Communities (seehttps://www.wildlife.ca.gov/Conservation/Plants);
5. Information on the regional setting that is critical to an assessment of environmentalimpacts, with special emphasis on resources that are rare or unique to the region(CEQA Guidelines,§ 15125[cl).
Analysis of Direct, Indirect, and Cumulative Impacts to Biological Resources
The DEIR should provide a thorough discussion of the direct, indirect, and cumulative impacts expected to adversely affect biological resources as a result of the project. To ensure that project impacts to biological resources are fully analyzed, the following information should be included in the DEIR:
1. A discussion of potential impacts from lighting, noise, human activity, and wildlifehuman interactions created by zoning of development projects or other projectactivities adjacent to natural areas, exotic and/or invasive species, and drainage. Thelatter subject should address project-related changes on drainage patterns and waterquality within, upstream, and downstream of the project site, including: volume,velocity, and frequency of existing and post-project surface flows; polluted runoff; soilerosion and/or sedimentation in streams and water bodies; and post-project fate ofrunoff from the project site.
2. A discussion of potential indirect project impacts on biological resources, includingresources in areas adjacent to the project footprint, such as nearby public lands (e.g.National Forests, State Parks, etc.), open space, adjacent natural habitats, riparianecosystems, wildlife corridors, and any designated and/or proposed reserve ormitigation lands (e.g., preserved lands associated with a Natural CommunityConservation Plan, or other conserved lands).
Notice of Preparation of a Draft Environmental Impact Report Tioga Inn Project SCH No. 1992012113 Page 4 of 6
3. An evaluation of impacts to adjacent open space lands from both the construction ofthe project and long-term operational and maintenance needs.
4. A cumulative effects analysis developed as described under CEQA Guidelinessection 15130. Please include all potential direct and indirect project related impactsto riparian areas, wetlands, vernal pools, alluvial fan habitats, wildlife corridors orwildlife movement areas, aquatic habitats, sensitive species and other sensitivehabitats, open lands, open space, and adjacent natural habitats in the cumulativeeffects analysis. General and specific plans, as well as past, present, and anticipatedfuture projects, should be analyzed relative to their impacts on similar plantcommunities and wildlife habitats.
Mitigation Measures for Project Impacts to Biological Resources
The DEIR should include appropriate and adequate avoidance, minimization, and/or mitigation measures for all direct, indirect, and cumulative impacts that are expected to occur as a result of the construction and long-term operation and maintenance of the project. When proposing measures to avoid, minimize, or mitigate impacts, the Department recommends consideration of the following:
1. Sensitive Plant Communities: The Department considers sensitive plantcommunities to be imperiled habitats having both local and regional significance.Plant communities, alliances, and associations with a statewide ranking of S-1, S-2,S-3, and S-4 should be considered sensitive and declining at the local and regionallevel. These ranks can be obtained by querying the CNDDB and are included in TheManual of California Vegetation (Sawyer et al. 2009). The DEIR should includemeasures to fully avoid and otherwise protect sensitive plant communities fromproject-related direct and indirect impacts.
2. Species of Special Concern (SSC) status applies to animals generally not listedunder the federal Endangered Species Act or the California Endangered SpeciesAct, but which nonetheless are declining at a rate that could result in listing, orhistorically occurred in low numbers and known threats to their persistence currentlyexist. SSC should be considered during the environmental review process.
3. Mitigation: The Department considers adverse project-related impacts to sensitivespecies and habitats to be significant to both local and regional ecosystems, and theDEIR should include mitigation measures for adverse project-related impacts tothese resources. Mitigation measures should emphasize avoidance and reduction ofproject impacts. For unavoidable impacts, onsite habitat restoration and/orenhancement should be evaluated and discussed in detail. If onsite mitigation is notfeasible or would not be biologically viable and therefore not adequately mitigate theloss of biological functions and values, offsite mitigation through habitat creationand/or acquisition and preservation in perpetuity should be addressed.
Notice of Preparation of a Draft Environmental Impact Report Tioga Inn Project SCH No. 1992012113 Page 5 of 6
The DEIR should include measures to perpetually protect the targeted habitat values within mitigation areas from direct and indirect adverse impacts in order to meet mitigation objectives to offset project-induced qualitative and quantitative losses of biological values. Specific issues that should be addressed include restrictions on access, proposed land dedications, long-term monitoring and management programs, control of illegal dumping, water pollution, increased human intrusion, etc.
4. Habitat Revegetation/Restoration Plans: Plans for restoration and revegetationshould be prepared by persons with expertise in southern California ecosystems andnative plant restoration techniques. Plans should identify the assumptions used todevelop the proposed restoration strategy. Each plan should include, at a minimum:(a) the location of restoration sites and assessment of appropriate reference sites;(b) the plant species to be used, sources of local propagules, container sizes, andseeding rates; (c) a schematic depicting the mitigation area; (d) a local seed andcuttings and planting schedule; (e) a description of the irrigation methodology; (f)measures to control exotic vegetation on site; (g) specific success criteria; (h) adetailed monitoring program; (i) contingency measures should the success criterianot be met; and (j) identification of the party responsible for meeting the successcriteria and providing for conservation of the mitigation site in perpetuity. Monitoringof restoration areas should extend across a sufficient time frame to ensure that thenew habitat is established, self-sustaining, and capable of surviving drought.
The Department recommends that local onsite propagules from the project area and nearby vicinity be collected and used for restoration purposes. Onsite seed collection should be initiated in the near future in order to accumulate sufficient propagule material for subsequent use in future years. Onsite vegetation mapping at the alliance and/or association level should be used to develop appropriate restoration goals and local plant palettes. Reference areas should be identified to help guide restoration efforts. Specific restoration plans should be developed for various project components as appropriate.
Restoration objectives should include protecting special habitat elements or recreating them in areas affected by the project; examples could include retention of woody material, logs, snags, rocks, and brush piles.
5. Nesting Birds and Migratory Bird Treaty Act: Please note that it is the projectproponent's responsibility to comply with all applicable laws related to nesting birdsand birds of prey. Migratory non-game native bird species are protected byinternational treaty under the federal Migratory Bird Treaty Act (MBTA) of 1918, asamended (16 U.S.C. 703 et seq.). In addition, sections 3503, 3503.5, and 3513 ofthe Fish and Game Code (FGC) also afford protective measures as follows: section3503 states that it is unlawful to take, possess, or needlessly destroy the nest oreggs of any bird, except as otherwise provided by FGC or any regulation madepursuant thereto; section 3503.5 states that is it unlawful to take, possess, or destroyany birds in the orders Falconiformes or Strigiformes (birds-of-prey) or to take,
Notice of Preparation of a Draft Environmental Impact Report Tioga Inn Project SCH No. 1992012113 Page 6 of 6
possess, or destroy the nest or eggs of any such bird except as otherwise provided by FGC or any regulation adopted pursuant thereto; and section 3513 states that it is unlawful to take or possess any migratory nongame bird as designated in the MBTA or any part of such migratory nongame bird except as provided by rules and regulations adopted by the Secretary of the Interior under provisions of the MBTA.
The Department recommends that the DEIR include the results of avian surveys, as well as specific avoidance and minimization measures to ensure that impacts to nesting birds do not occur. Project-specific avoidance and minimization measures may include, but not be limited to: project phasing and timing, monitoring of projectrelated noise (where applicable), sound walls, and buffers, where appropriate. The DEIR should also include specific avoidance and minimization measures that will be implemented should a nest be located within the project site. If pre-construction surveys are proposed in the DEIR, the Department recommends that they be required no more than three (3) days prior to vegetation clearing or ground disturbance activities, as instances of nesting could be missed if surveys are conducted sooner.
Further Coordination
The Department appreciates the opportunity to comment on the NOP of a DEIR for the Tioga Inn Project (SCH No. 1992012113) and recommends that Mono County address the Department's comments and concerns in the forthcoming DEIR.
If you should have any questions pertaining to the comments provided in this letter, or wish to schedule a meeting and/or site visit, please contact Rose Banks at (760) 873-4412 or at [email protected].
Sincerely,
-++�-C� Leslie MacNair Regional Manager
Literature Cited
Sawyer, J. 0., T. Keeler-Wolf, and J. M. Evens. 2009. A manual of California Vegetation, 2nd ed. California Native Plant Society Press, Sacramento, California. http://vegetation.cnps.org/

From: paul/revolver usa [mailto:[email protected]]Sent: Friday, November 18, 2016 11:46 AMTo: Gerry LeFrancois <[email protected]>Subject: comment on Tioga Inn project
Hello,
After poring over the details in the Notice of Preparation and accompanying maps for the Tioga InnProject, I would like to express my concern -- on several levels. These structures are far out ofproportion with the "carrying capacity" of the area, as well as out of place in the general landscape,especially in the context of Mono Basin's fragile ecosystems.
First, let's look at this project from an aesthetic angle. Currently, the moraines at the bottom of LeeVining canyon do a good job of concealing the bulk of the Mobil station from 395. From the maps youprovide, it seems nearly certain a 3-story structure would be visible from 395 and 120, presenting astartling change to the familiar natural landscape.
Secondly, we need to address the project from a commercial standpoint. Due to decreasedvisitation/demand over the winter months, existing retail and hospitality outlets in Lee Vining eithershut down or are greatly scaled back during the months when highway 120 is closed. How would a 120-room hotel and 100-seat restaurant sustain itself during the off-season?
During (yet not limited to) the season when 120 *is* open, I see this development severely affectingexisting restaurant and motel businesses. These are run by local citizens who've spent years buildingtheir reputations and clientele. Competing against a hospitality complex of this scale would be difficult,if not impossible. The impact would be extreme, and detrimental to the community.
If those businesses shut down, it would give visitors (and locals) less of a choice of where to stay andwhere to eat. This "Walmart effect" does nothing to enhance the character or the livability of the area. Itenhances only the bank account of the developer - at the expense of the local citizenry as well as that ofvisitors from around the country and around the world. The latter are the economic lifeblood of thecommunity and, to a great degree, Mono County - people who appreciate the Basin's unique beauty andcharm, and return year after year to spend their time and money there.
Currently, lodging in the area is spread out among Mammoth, June Lake, Lee Vining and Bridgeport. TheTioga Inn Project would concentrate large numbers of people within a very small space.
The population of Lee Vining was listed as 220 in the 2010 census, and has been trending downwardsince the 1990 census. Considering 75% occupancy in the proposed hotel during the height of the touristseason, with an average of two or three visitors per room, you'd be looking at between 180 and 270visitors at any one time. Add to that 70 to 80 employees and we've suddenly more than doubled thepopulation of Lee Vining for the duration of the tourist season. This is where my comment aboutcarrying capacity comes into play. How can such a large influx of transient population not impact theMono Basin and immediate area around Lee Vining?
Which brings me to the most important factor. Pending an EIR, my concerns go beyond the aestheticand commercial/competitive effects. The threat of any negative environmental impact on vitalwatershed in such close proximity to Mono Lake is alarming. A "designated leach field" is proposed
across 395, a short distance from Lee Vining Creek -- in an area where the ground consists mostly ofporous volcanic tuff, located slightly over a mile above a spring-fed terminal lake. Will the EIR includegeologic and hydrologic surveys with this in mind? What will the contingency plans be if the watertreatment system fails, or if an outflow pipe ruptures, or if a moderate-to-major earthquake hits thisseismically active area?
So much progress has been made in restoring this sensitive region, and so much remains to be done. Yetthe developer is asking us to consider these not-insignificant risks to be acceptable - in the name ofeconomic gain.
Even the original two-story plans for this site would have an adverse impact on each of the factors I'vediscussed. Perhaps in 1993 this establishment might have seemed like something worth pondering. Inthe current business and environmental climate, however, a development of the scale and configurationdescribed -- then or now - isn't something I can support.
This project is far better suited to Mammoth, where development of this sort has become the norm. TheTioga Inn Project is a potentially destructive development that does not fit in with Mono Basin's culture,commercial community, landscape, or ecosystems.
Sincerely,
Paul AshbyOrinda, CA415 516-5929
November 18, 2016To: Gerry LeFrancoisMono County Community DevelopmentPO Box 347Mammoth Lakes, Ca 93546
Comments on the NOP, SEIR and Specific Plan for Tioga Inn Project
The Revised Proposal for the Tioga Inn represents an opportunity to be a model project that
compliments and adds diversity to the commercial makeup of the Mono Basin and local economy.
However, in its current mix of goals, objectives and components, this is not the case.
The original Tioga Inn Specific Plan, analyzed in the 1993 EIR, called for the creation of a large scale
development, big enough to accomplish the goals and objectives of providing all the services and
amenities of an all-inclusive resort for the Mono Basin plus housing for resort employees. The EIR
identified at least two “significant irreversible environmental changes which would be involved in the
proposed action should it be implemented”: “a partial reduction in the area’s visual quality” and
“growth inducing impacts.”
There were alternatives considered in the 1993 EIR which reduced the number of project components to
address these significant impacts, but these alternatives were rejected because they did not meet the
“overall project objective”, were deemed “economically infeasible”, and/or would create additional
“significant impacts.”
Twenty-three years later, with a revised plan being proposed, it is important to revisit these conclusions.
A partial development of the site has been in place and operation for twenty years. The gas mart, deli
and convenience store have demonstrated that a much smaller project with a select few of the
components has been, contrary to the alternatives discussion in the EIR, economically feasible as
operated seasonally. Visual impacts, although notable, are arguably less than anticipated for the whole
project, because of the set-back location of the more limited development.
The original analysis never asked or answered a fundamental question: is a larger, all-inclusive resort of
such a scale an appropriate development for the Mono Basin and its community? It did not consider the
appropriateness of a project so large as to double the size of the developed footprint of the Lee Vining
area, yet wholly separate from Lee Vining, essentially a leap-frog development.
The Economic Analysis Technical Report for the EIR downplayed the realities of a seasonal tourism-
based economy. In fact, it gave a rosy but unrealistic forecast, based on unsupported projections, of the
size of the clientele base that would patronize a new hotel and restaurant development for the winter
half of the year. In summer, it is true that there are periods when existing motel accommodations do
not meet visitor demand. In the winter, however, the business provided by seasonal tourism supports
only two out of six local motels that are able to stay open more than 5 or 6 months of the year. Even
before Tioga Pass closes, local motels and restaurants often close for the winter. The proponents own
deli/convenience store business closes from the end of October to mid-April, certainly an
acknowledgement that even in 2016, staying open in the winter does not pencil out.
A new Economic Analysis should be done that examines: what would be the economic impact of the
revised project on other local businesses? The 1993 Economic Analysis projected 25% shift of the share
of business from Lee Vining and June Lake to the new resort. The stated project goal of “reducing trips
to town” by providing everything needed by resort patrons could result in a “Wal-Mart Effect”, further
reducing tourist patronage of other Lee Vining businesses. The goal of being a one-stop all-inclusive
resort may have negative repercussions on an already fragile, seasonal tourism-based economy.
On the other hand, if the projections for economic feasibility for a new big resort do not pan out, the
project may follow the general pattern of seasonal closures. The projected property tax and transient
occupancy tax increase for Mono County may be unrealistic. The Mono Basin community, furthermore,
has little use for a development which could stand empty half the year, occupying what was open space
in a critical location relative to the stunning viewshed of the gateway to Yosemite National Park.
I believe that the supplemental EIR must address this issue of the increased scope and scale of the
revised project and provide alternatives of reduced size, scale and intent. The analysis should show how
increased size, siting and height of structures, scope and unrealistic objectives of the newly revised
project will magnify and worsen numerous impacts.
The SEIR should disclose the fact that the project proponent plans to sell or lease the project site with an
approved Specific Plan to an outside developer, most likely a major corporate franchise or franchises
with pre-conceived requirements for size, project components and design practices. It cannot be
assumed that these types of corporations will be sensitive to community goals and objectives. Any
revised plan, therefore, should require a Design Review Permit, and must spell out in detail the required
standards and restrictions for siting, scope and design that will protect the area’s unique and sensitive
scenic and natural resources, as well as require energy efficiency in the form of passive solar design and
active solar installations, water conservation and other green building practices. Standards concerning
new signage, and location and dimensions of new roads need to be thoroughly considered and
prescribed. Mitigation for greenhouse gas emissions from the expansion of the development should
include funding to build a trail for pedestrians from town to the development to encourage pedestrian
VS car use.
The SEIR must show how the revised project will be compatible with the highly detailed Mono Basin
Community Plan Goals and Objectives. It is highly unlikely that issues such as avoidance of leap-frog
development, visual impacts and the preservation of dark night skies, habitat loss and conflicts with
migratory wildlife can be mitigated to insignificance.
The SEIR needs to examine the likely increased demands on existing services and infrastructure such as
fire protection, paramedic emergency services and law enforcement. The volunteer Lee Vining Fire
Department currently does not have the equipment or person-power to protect a development of the
proposed height and size of the proposed project. What are potential impacts on the size of the Lee
Vining Airport? Will there be increased pressure to expand that facility, adding to the cumulative
impacts on the scenic vista, vegetation and deer herd that have yet to be mitigated?

A three story structure plus two more separate areas of development for a second restaurant and
housing, including parking, simply cannot be sufficiently visually screened. The proposed restaurant on
the hill projects above the horizon as viewed from many locations. Approval of a three story high
structure sets an inappropriate precedent for the sage-brush steppe setting of the Mono Basin. The
result will be a jarring visual mar on the landscape, visible from many locations in a National Scenic Area,
a State Reserve and National Scenic Highway. The increased nightly light pollution will create a new
large glow visible from a near and far.
Wildlife habitat loss and barriers to deer and other wildlife migration are also significant and cumulative
impacts. The previous mitigation of leaving open space for the deer herd would be consumed by
development. In the very least a mitigation for deer habitat lost from the development should include
funding for bitterbrush plantings in the Azalea Fire area, right behind the development, which has had
poor recovery since the fire, to provide a green belt corridor for deer holding and migration.
The impacts of an increased concentration of visitor use in the Lee Vining Creek stream drainage needs
to be examined, as this finite habitat is of critical importance to a higher diversity of wildlife on the edge
of the Great Basin, that require access to the water, thermal and hiding cover and linkage to the High
Sierra that this riparian corridor provides.
The SEIR should determine the source of recharge for the groundwater aquifers in the area of the
development’s wells. What is the long-term potential of draining these aquifers, impacting area
vegetation or reducing spring recharge into Lee Vining Creek and along the Mono Lake shoreline- in a
time of continuous drought and climate change? Permitted drawdown of these aquifers would set a
dangerous precedent for Mono County.
The proponent has stated that water recycling and landscaping goals will significantly reduce water
consumption. The waste water management plan needs to be spelled out. In particular, non-native
vegetation needs to be minimized. Recycled water could be used to support plantings of native trees
and shrubs that would help screen structures, but the amount of water that requires treatment needs to
be disclosed.
Mono County needs to minimize parking requirements to reduce disturbance to native vegetation. This
includes reducing parking required for restaurant guests who are already parked for the motel. The use
of porous surfaces for parking areas to absorb rainfall and snowmelt should be encouraged to minimize
runoff and erosion.
The plan should require pesticide and herbicide-free landscape maintenance. Currently, herbicides are
being unnecessarily applied to the grounds of the Whoa Nellie Deli and housing areas, without posting,
where residents and patrons, including children, roll in the grass and dance barefoot. Mono County, in
response to community concerns, maintains the County Park in Lee Vining very successfully without
herbicides and pesticides. Tourists to this area who come to enjoy nature would be pleased to know that
a development’s grounds are pesticide-free and safe for children, pets and wildlife.
A “workforce housing” development is being proposed that could alleviate some of the housing needs
for the Mono Basin. The need in the Mono Basin, however, is for housing that is affordable, not just
market-rate housing. It needs to be truly available to the demographic that will fill the service positions
the resort would create. That means it should not only accommodate single workers, but also families,
who often provide multiple employees for local businesses, but can’t find housing of sufficient capacity
for growing families.
The footprint and visual issues for as many as 80 units of housing, plus parking, however, is too big a
development for all impacts to be adequately mitigated. In addition, it is highly unlikely that a three
story hotel structure (unless the first floor is underground), and a whole separate restaurant structure
on the hill can be adequately screened to avoid significant impacts to the scenic vistas, especially against
the backdrop of the Tioga Pass.
I believe that if the proponent significantly scaled down the proposal and sought a developer who
shared a vision more compatible with the wide-range of community goals and needs, a developer who
also understands the responsibility and the opportunity to protect an irreplaceable viewshed and
sensitive natural environment, then this project could be something the community and county could
support.
Thank you for the consideration of these comments.
Sincerely,
Ilene MandelbaumPO Box 89Lee Vining, Ca 93541
1
To: Gerry LaFrancois, Mono Co Community Development Department 707-‐924-‐1810 [email protected]
From: Ann Howald, Retired Botanist, #40 Finster Valley Rd, Hilton Creek, CA and 210 Chestnut Avenue, Sonoma, CA 95476 707-‐721-‐6120 [email protected]
Re: Comments on the Proposed Tioga Inn Development Project, Lee Vining, CA
Date: 19 November 2016
I’m a retired botanist who has spent summers in the Mammoth Lakes and Lee Vining areas since 1975. For 41 years I’ve been a paid researcher and a volunteer for the University of California’s Valentine Reserve at Valentine Camp in Old Mammoth, and at the Sierra Nevada Aquatic Research Lab on Convict Creek. For more than 25 years I’ve taught field seminars and been a volunteer for the Mono Lake Committee. I’ve worked for the Inyo National Forest on Mammoth Mountain, on botanical surveys. I’m a member of the Bristlecone Chapter (Mono and Inyo counties) of the California Native Plant Society. I’m a member of 350Mono, our local group advocating positive responses to climate change, and of the Mono Basin Historical Society. I’ve taught UC Extension courses and field courses for Santa Rosa Junior College in the Eastern Sierra. I’m currently completing a publication documenting the plant life of Mono County. I attended the public scoping meeting on this project held at the Lee Vining Community Center on October 27, 2016. The following comments represent my own views. Thank you for considering them.
General Comments: The Tioga Inn project site is located at the eastern gateway to Yosemite National Park, in Lee Vining, a place that is visited each summer by thousands of visitors from around the world. This project can be a showcase for the Eastern Sierra and a fitting entranceway to Yosemite National Park, and can demonstrate to all our visitors that we in the United States, in California, and in the Eastern Sierra, care about the environment and are addressing the challenges of climate change by using good planning, state-‐of-‐the-‐art design, and wise use of water, energy and space. These actions are especially important now. Such a large project has the potential to affect the lives of everyone in Lee Vining, and many in other nearby communities. There are environmentally friendly technologies that can be implemented in all aspects of the design and operation of this project, and many ways in which potential impacts to the community of Lee Vining can be mitigated. I sincerely hope that the Community Development staff will require when possible, and otherwise promote the use of “green” technologies during the review of this project under CEQA in the Subsequent EIR, and during the permitting process.
Definition of “Significant Impact” under CEQA: I request that the preparer of the SEIR state clearly in the document what qualifies as a “significant impact” under CEQA for each of the potential impact categories below, and also state clearly how any impacts found to be significant during the project review will be mitigated to a level of insignificance, as required by CEQA.
2
Water Use: This project has the potential to use large quantities of water, especially in summer when visitor numbers are highest. The Eastern Sierra is a high desert environment, and recent drought years have demonstrated the wide-‐ranging effects of increasingly dry conditions, which can be expected to persist and possibly grow more extreme with climate change. Drier conditions mean there is less water for wildlife, plants and people, leading to increased wildfire hazard, economic impacts from reduced tourism, and increased survival threats to plants and animals, and the ecosystems upon which they depend. The SEIR needs to thoroughly address impacts from increased water use. The Tioga Inn project should use every possible water-‐saving and water-‐recycling technology to reduce water consumption. Gray water recycling should be included in the project design. Low flush toilets, low flow showerheads, on demand water heaters in the housing units, and other water-‐efficient technologies should be required project design elements. Signage should be used in the hotel to encourage visitors to minimize water use, as is regularly done in Australia and other drought-‐affected areas of the world. Landscaping, if any, should utilize native plants that don’t require summer watering.
Impacts on Lee Vining Creek and Mono Lake: At the scoping meeting, the project proponent stated that he already has one groundwater well and he’s planning to drill another one. Groundwater and surface water are part of the same system. Pumping large amounts of groundwater from within the lower Lee Vining Creek watershed has the potential to reduce surface flows in the creek, and therefore to reduce freshwater inflows to Mono Lake, which could increase the likelihood of failures in that ecological system. In addition, groundwater is the ultimate source for the freshwater springs along the shore of Mono Lake, and within the lake itself -‐ springs that are important sources of fresh water to resident and migrating birds, and that contribute to the underwater formation of the lake’s signature tufa towers. Although groundwater extraction is not regulated in California under most circumstances, the potential impacts of the project, through increased groundwater pumping, to the aquatic and riparian resources of Lee Vining Creek and Mono Lake, should be addressed during the CEQA review process, and mitigated if found to be significant.
Energy Use and Greenhouse Gas Emissions: Energy-‐efficient technologies should be incorporated into all aspects of this project. As Janet Carle and others from 350Mono have previously commented, the goal should be for this project to be, at a minimum, a net zero energy user. Use of solar panels and other LEED technologies could result in net electricity production, which is a financial benefit to the operator. Solar panel installation should be required for the hotel, above any outdoor parking areas, on the separate restaurant, and on the housing units. Energy-‐efficient appliances should be used throughout – in the hotel and restaurant kitchens, the hotel laundry, and the housing units. All buildings should be insulated to the highest standards. As mitigation, the SEIR could require financial support of a walking and bicycle trail connecting the Tioga Inn/Mobil Mart complex, which would reduce greenhouse gases from vehicles, as well as reduce traffic, and could ease parking problems in Lee Vining due to increased numbers of visitors. It is our responsibility to take all feasible actions to reduce the production of greenhouse gases and attempt to slow down the warming of the planet.
Housing: The proposed number of individual housing units (“bedrooms”), at 80, has the potential to occupy a large amount of space. The proposed separate cabins are not space-‐saving, inherently not energy-‐efficient, and would require large amounts of energy to keep heated in the winter.
3
The SEIR should address this by requiring that these units be grouped together to create more environmentally friendly living spaces.
Traffic: For the SEIR, a traffic study should be performed to determine traffic impacts of the project at the intersection of Highway 120 and Highway 395, and in downtown Lee Vining. The increase in scope of this project from what was proposed in 1993, and the increases in baseline traffic, over what existed in 1993, is adequate justification for redoing any traffic study completed at that time. Promoting ridesharing, carpooling, and increasing bus services, and constructing a path connecting the Tioga Inn and downtown Lee Vining are ways of mitigating traffic impacts, as well as reducing greenhouse gas emissions.
Parking: Currently, parking conditions in Lee Vining are difficult in summer. Many residents, businesses, and the churches and schools, experience major parking inconveniences due to tourist visitors. Given the baseline of current conditions, any loss of parking for residents in Lee Vining due to this project should be deemed a significant impact. The project design should include adequate on-‐site parking for all resident and commuting workers, all customers of the Mobil Mart, and all visitors to the hotel and restaurants. In addition, visitors should be encouraged to leave their vehicles at the Tioga Inn by providing bus service into town, and constructing a pedestrian and bicycle path connecting the Inn with downtown Lee Vining.
Visual impacts: Maintaining a dark sky in the Mono Basin is highly desirable because this area offers excellent stargazing opportunities, which are enjoyed by the local community and its tourist visitors through sponsored evening events. The lights of Lee Vining already are a visual impact on the night sky. Simulations of the changes in the visual landscape that could result from the Tioga Inn project should be created for both daytime and nighttime conditions, from several vantage points in the Mono Basin, including locations near to, and at some distance from, the project site. Possible locations for the latter are: the northwest shoreline area of Mono Lake, for example, near County Park and Black Point, and the southwest shoreline area of the lake, for example, at South Tufa. These are areas heavily visited by local residents and tourists alike, and the visual impacts of the project from these vantage points should be minimized. Night sky impacts cannot be mitigated by planting trees. Light pollution can be greatly reduced by requiring outdoor lighting designed with this goal in mind, and by reducing night lights from hotel windows by using the appropriate window technology.
Biological impacts: The SEIR should address biological impacts from the proposed project. Deer migration impacts were mentioned during the scoping hearing, and should be evaluated. The need to consider potential impacts to Lee Vining Creek and Mono Lake from increased water use are discussed above. New biological surveys for protected plants and wildlife are needed, since the status of many species has changed since 1993. Qualified surveyors should be used, and should follow proper protocols. For plant surveys, The Rare Plant Survey Guidelines of the California Native Plant Society should be followed to assure that the survey accurately identifies potential impacts, as required by CEQA.
Fire Safety: The Lee Vining area has experienced two major fires in the last two years that have threatened the town and the surrounding area. Fire safety is a major issue that must be adequately

4
addressed in the SEIR. During the public scoping hearing, the Lee Vining fire chief explained that the current fire fighting resources in Lee Vining are inadequate to fight a fire in a three-‐story building like that of the current hotel design. There is no ladder truck, and there is no place to store such a vehicle. A major upgrade of the area’s fire fighting resources are needed if the town and nearby properties are to be protected from fire. Without adequate fire protection, residents will not be able to purchase fire insurance, which will affect property values throughout the area.
Community Impacts: Increases in local population size that will result from this project will affect schools, churches, businesses, availability of public services, and many other aspects of small town life in Lee Vining. Some of these impacts will be positive, but the SEIR needs to recognize and address the potential problems that can arise from dramatic and rapid population growth in such a small town.

From: [email protected] [mailto:[email protected]]Sent: Saturday, November 19, 2016 3:48 PMTo: Gerry LeFrancois <[email protected]>Subject: Comments on Tioga Inn Specific Plan Update and Subsequent Environmental Impact Report
Please see below our comments and concerns regarding the TiogaInn specific plan update and subsequent environmental impact report.
Name: Rocky & Cara Audenried (Property Owners)Joey & Cecily Audenried (Managers of Properties)
Address: PO BOX 350 & 57Lee Vining, CA 93541
Phone#: 760-647-6316Email: [email protected]
To Whom It May Concern:
We were recently alerted of the updated plan regarding the Tioga Inn and are ratherconcerned by the news. At the end of October, we were able to attend a communitymeeting regarding the updates proposed for the Tioga Inn and hear other communitymembers opinions and questions as well. After all the information gathered from themeeting, we would like to provide our feelings and concerns regarding this project. Wehave also provided our history and current status in Lee Vining to provide more insighton our beliefs of this proposed development.
As of today we own and run 3 business in Lee Vining; Mono Cone LLC, Mono Cup CoffeeLLC, and Murphey's Motel LLC. We have not only lived, but been business owners in LeeVining for over 25 years. Lee Vining, is a very special town known for its small, quaintsize, and beautiful setting in the Eastern Sierras. Having lived in this town for the timethat we have, we are familiar with locals/travelers and their reasons for coming here. Weare the gateway to Yosemite, but those that come to our town, do so for it's quaint sizeand "mom and pop" motels, restaurants, and shops. Travelers come for the beauty ofour area and the enjoyment of our local "small town" charm. That's what makes LeeVining so unique. In the 25 years we have been in Lee Vining, there have been very fewchanges to the town's structures and commercial properties. We have never seen aproposed project of this magnitude for our area and are very concerned of what willbecome of our town if it comes to fruition.
Our main concerns are as follows:
What will happen to all the small business currently functioning in Lee Vining atthis time? If this planned proposal is executed, how will the smaller restaurants,motels, shops, be able to compete and survive? The current proposal is for a 120room, 3 story hotel and 2 - 200 seat restaurants. Why would anyone need tocome into Lee Vining when a facility of this size would be able to accommodate allof their needs? They are also planning a fitness center, laundromat, car rental,banquet room, gift shop. It's almost as if they would have their own little city in
one spot. As we all know, Lee Vining is a seasonal town and many/most propertiescurrently live off of the earnings in the peak summer season. A facility of thismagnitude could easily put many small business owners out of business if they areunable to maintain the seasonal earnings with this form of competition. The charmand personality of this town would change forever and not for the better. Also,during peak times we send our overflow of travelers to neighboring cities formotels. If the Tioga Inn is approved and built, it is very likely this will effect ourneighboring cities as well.
As a current business owner it is extremely challenging to find employees in ourtown and neighboring towns. The proposal currently discusses more housing foremployees, but where will all these employees come from? Again if this plan goesthrough, will many of our current employees here in Lee Vining flock to the newproperty? If this is the case how will our town and businesses continue to function?This could cause many businesses in town to shorten their hours or even closedown due to lack of employees. If current employees in town do not assist in thenew project where do they propose to find workers? Currently in Mammoth Lakes,many businesses seek employees from other towns, states, countries etc. for theirpeak seasons. Does this new facility expect to do this as well? If so, how will ourtown keep up with this many new employees and their families? Our schools, firedepartment, and more would be greatly affected by this raise in population growth.Is our town ready to accommodate this flux in population?
Lee Vining is a quaint town that allows travelers and locals to enjoy the scenicviews of our grand area. Travelers visit to enjoy the scenic beauty of the area.They do not come to our town to enjoy the hustle and bustle of a big city and allthe luxuries it entails. The proposed size of this facility will definitely create a newimpact on the visual aspect of our area. With all the detailed items proposed onthe property; motel rooms, restaurants, new parking structures, and more, thiswill definitely change the scenic beauty of the entrance to Yosemite NationalPark. Also with the increased amount of facilities planned at the location, how willsound and lighting change in the area? Do our travelers really want to view ahuge motel, gas station, parking lot, restaurants as the entrance to the grandYosemite National Park? Currently our motel guests comment on how much theyenjoy our entrance because of the scenic beauty and smaller towns that do nottake away from this aspect.
Our other concern is the entrance of a "chain" property in our area. If a chainproperty is built, will that open the door to other chain business in our town? Dowe really want to see fast food chains, starbucks, etc in our area? Or do we wantto continue with our family run small business?
Overall, we truly hope all community members comments will be considered at greatlength before any further approvals. Please look at the overall changes this project willhave on all our business and townspeople of Lee Vining and also the visual aspect of ourbeautiful area. This is a very serious proposition to those who currently own and runproperties in Lee Vining and we hope all comments will be reviewed accordingly.
Thank you for your time and consideration,
Rocky, Cara, Joey, and Cecily Audenried
November 20, 2016
Mono County Community Development Dept.Attn. Gerry LeFranciosP.O. Box 347Mammoth Lakes, CA 93546Sent via email: [email protected]
Dear Gerry,
Thank you for the opportunity to provide scoping comments on the Notice of Preparation (NOP) for theTioga Inn Specific Plan and Subsequent EIR (SEIR). While I am generally supportive of the project, Iam concerned about the following issues and hope you will analyze them in the forthcoming CEQAanalysis (i.e., SEIR and related or additional documents). I hope that these issues will be addressed inthe County’s preferred alternative.
1. Minimize and mitigate impacts to Lee Vining Canyon
The federal lands in Lee Vining Canyon are largely undeveloped (except for the Forest Servicefacilities) and contain important wildlife habitat for mule deer, mountain lion, black bear and manyother animal species. Development of transient and year-round housing will likely lead to increasedhuman use of public lands in Lee Vining Canyon. Dog harassment of wildlife is a big concern.Proliferation of new off-road or mountain bikes trails, and associated impacts on wildlife habitat, is alsoa concern.
The SEIR should include measures to mitigate the impacts of parcel development and increased humanactivities associated with the development on Lee Vining Canyon’s wildlife. The County andproponent should work with the California Department of Fish and Wildlife and the Forest Service todevelop and implement effective mitigation measures both on the parcel and surrounding the projectarea (e.g., in Lee Vining Canyon west of the project site).
A wildlife study that is supplemental to previous wildlife studies should be conducted, with a specialemphasis on mule deer. The study should look at the changes in mule deer use of the area at the baseof Lee Vining and Horse Meadow/Gibbs Canyon (which includes the land where the parcel sits) in thepast 20 years. I’ve lived in Lee Vining for 32 years, and when I first moved here, it was customary thatthe deer would move east to spend their winters once the first big snows fell. In recent years of little tono snow, however, mule deer appear to have taken up winter residency near our towns, in thesagebrush-bitterbrush flats that surround Lee Vining (a group lived right below Lee Vining last winterand another group lived next to Mono City). I think the Lee Vining/Horse/Gibbs area may have alwaysbeen a major migration area for mule deer (mule deer use in spring/summer/fall in Lee Vining Canyonand surrounding mountains is extensive, based on personal observations of both animals and tracks),but it appears this area may have evolved into year-round habitat for mule deer, at least in droughtyears. This trend might be expected to continue with climate change. As evidence of both mule deermigration and residency habitat, there have been many vehicle-deer collisions along the section ofhighway 395 that borders the parcel (I was involved in a deer collision accident in this area in Dec.2014); additional traffic generated by the development will likely only increase the risk of collisionsand deer mortality.

Because the project area contains Great Basin sagebrush habitat it may also be considered potentialhabitat for the bi-state sage grouse.
2. Mitigate impacts of increased on traffic on Tioga Pass Road up to Yosemite
The addition of 80 year-round housing units and 120 transient/hotel units has the potential todramatically increase traffic on Tioga Road going into Yosemite, and at the Park entrance gate. Linesto get into Yosemite this past summer were at times down to Tioga Pass Resort, and the additionaltraffic induced by this development will only add to congestion along the Park entrance road and in theTuolumne-Tioga region of the Park. The plan should consider ways to mitigate traffic impacts intoYosemite. One way would be to increase the number and frequency of YARTS shuttles into the Parkduring peak seasons by requiring the proponent to help fund additional shuttles as mitigation for trafficimpacts. At least one additional YARTS Lee Vining-Yosemite Valley shuttle should be considered(early AM and late PM return times), as well as multiple Lee Vining-Tioga Pass shuttle buses (withstaggered AM and PM departure/pick up times); the latter shuttle would conceivably need to be put inplace by YARTS or by the developer and should be free of charge to those staying or living at theTioga Inn. (Note: People can catch a free Tuolumne area shuttle bus at Tioga Pass. This shuttle is runby the Park Service and operates frequently during peak seasons.https://www.nps.gov/yose/planyourvisit/tmbus.htm)
The plan should also consider the impact of buildout of the Tioga Inn parcel on existing YARTSparking. Many people park in the dirt just outside the current development footprint to catch a YARTSshuttle or carpool to the Park with friends. Will the existing parking be displaced and is there analternative where day users can park? The proponent should work with Caltrans to determine whereYARTS shuttle parking can be located in the project vicinity.
3. Preserve visual character of the Gateway to Yosemite and Mono Lake
Sitting at the Gateway to Yosemite and Mono Lake, it’s critical that the Tioga Inn facilities bethoughtfully developed to preserve the visual quality of and scenic views from the highway 120-395junction. I do not think a three story development is warranted in this location due to the visual impactsthat will result, and request that the hotel be limited to two stories. (To my knowledge there is only onethree-story building in Mono County, and that is located within the urban footprint of MammothLakes.) Mono County should appoint a Design Review Committee to provide input on project designand associated landscaping and hold a community meeting to display various potential designalternatives and gather public input on the project design. This step should occur before a design themeand landscaping plan are selected and prior to development of the preferred alternative.
Another useful too in the supplemental analysis would be for the County to hire an expert to prepare“visual simulations.” This tool has been used for many other proposed developments, especially invisually sensitive locations such as the Mono Basin.
4. Develop connectivity between Tioga Inn facilities and Lee Vining
Currently, it’s a “dangerous” endeavor for people to walk from their lodging in Lee Vining to eatdinner or see music up at the Mobil, especially during summer and holiday weekends when traffic isheaviest at the highway 120 & 395 junction. The expected significant increase in traffic from doublingthe restaurant capacity and adding 200 hotel and housing units (combined) will make it even more
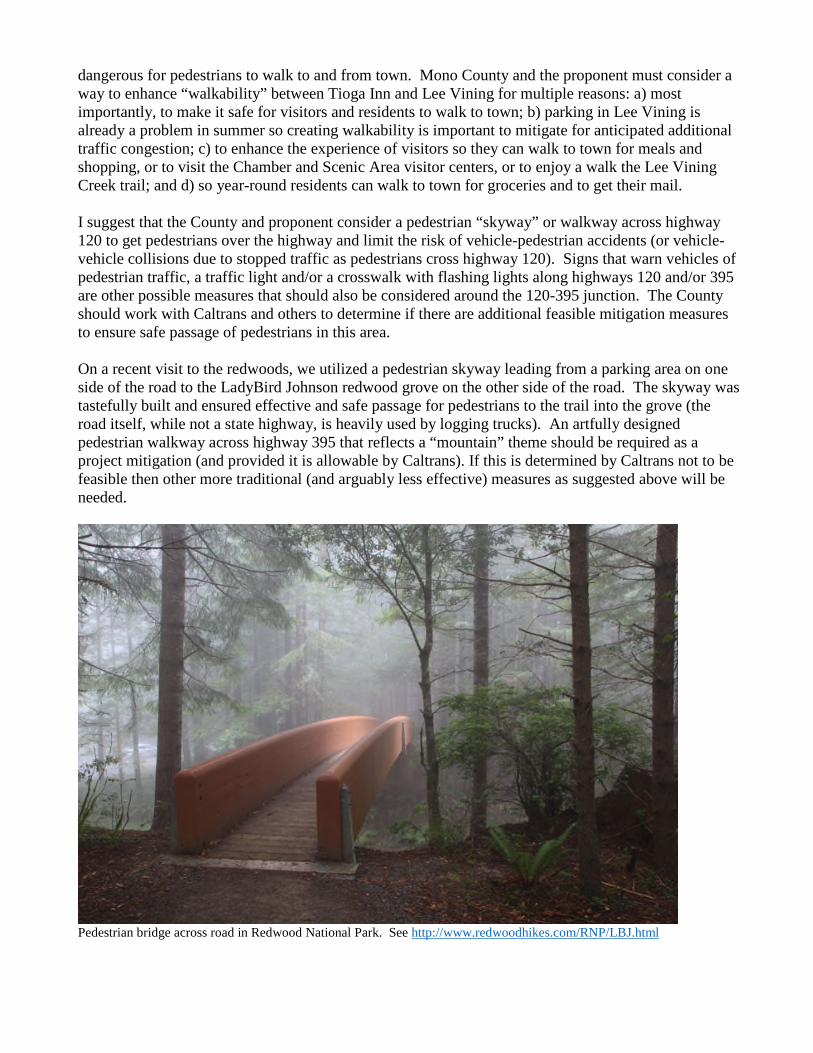
dangerous for pedestrians to walk to and from town. Mono County and the proponent must consider away to enhance “walkability” between Tioga Inn and Lee Vining for multiple reasons: a) mostimportantly, to make it safe for visitors and residents to walk to town; b) parking in Lee Vining isalready a problem in summer so creating walkability is important to mitigate for anticipated additionaltraffic congestion; c) to enhance the experience of visitors so they can walk to town for meals andshopping, or to visit the Chamber and Scenic Area visitor centers, or to enjoy a walk the Lee ViningCreek trail; and d) so year-round residents can walk to town for groceries and to get their mail.
I suggest that the County and proponent consider a pedestrian “skyway” or walkway across highway120 to get pedestrians over the highway and limit the risk of vehicle-pedestrian accidents (or vehicle-vehicle collisions due to stopped traffic as pedestrians cross highway 120). Signs that warn vehicles ofpedestrian traffic, a traffic light and/or a crosswalk with flashing lights along highways 120 and/or 395are other possible measures that should also be considered around the 120-395 junction. The Countyshould work with Caltrans and others to determine if there are additional feasible mitigation measuresto ensure safe passage of pedestrians in this area.
On a recent visit to the redwoods, we utilized a pedestrian skyway leading from a parking area on oneside of the road to the LadyBird Johnson redwood grove on the other side of the road. The skyway wastastefully built and ensured effective and safe passage for pedestrians to the trail into the grove (theroad itself, while not a state highway, is heavily used by logging trucks). An artfully designedpedestrian walkway across highway 395 that reflects a “mountain” theme should be required as aproject mitigation (and provided it is allowable by Caltrans). If this is determined by Caltrans not to befeasible then other more traditional (and arguably less effective) measures as suggested above will beneeded.
Pedestrian bridge across road in Redwood National Park. See http://www.redwoodhikes.com/RNP/LBJ.html
5. Leverage development of Tioga Inn facilities to benefit existing and new business in Lee Vining
The Tioga Inn, when developed, has the potential to enhance the town’s existing economy and to fosterthe development of new business in town by creating greater demand for additional restaurants, shops,local services and the like. On the flip side, if Tioga Inn is completely self-contained and strives toprovide all the services that are in town, it could significantly and adversely impact commerce in town.The County and proponent should work with community members in Lee Vining to determine howdevelopment at Tioga Inn can help leverage and benefit business in town. For example, creatingwalkability between the two areas as suggested above will benefit town businesses. What otherincentives can the County create to foster additional business development in Lee Vining? This issueshould be considered by community members, possibly via development of an Economic DevelopmentSubcommittee.
Thank you for considering my comments.
Sincerely,
Sally MillerP.O. Box 22Lee Vining, CA 93541
CC: Tim AlpersBob Gardner
1
Comments regarding Preparation of a Subsequent Environmental
Impact Report (SEIR) and Specific Plan for the Tioga Inn Development
To:
Mono County Community Development Department
Gerry LeFrancois
Post Office Box 347
Mammoth Lakes, CA 93546
(760)924.1810
From:
Barry McPherson
905 NE 7th St
Newport, OR 97365
Cell phones:
(760)965-6708
(503)708-8688
I have deep roots in the Mono Basin, and deep concerns about development in the Basin. I was born in
Bridgeport in 1947 and grew up in the home of my parents (Wallis R. and Virginia B. McPherson)
situated below Mono Inn, the resort that my Grandmother Venita R. McPherson operated from the
early 1920s until her death in 1961. After graduating from Lee Vining High School in 1965, obtaining
a BS in Zoology at UCSB in 1969, and working at the Sierra Nevada Aquatic Research Laboratory on
Convict Creek when it was a U.S. Fish and Wildlife Service facility, I moved to Oregon in 1970. I
earned an MS in Fisheries at Oregon State University in 1973 and spent a career as a salmon and
steelhead biologist in the Oregon Department of Fish and Wildlife.
With my wife Denise McPherson, I inherited historical McPherson property on Mono Lake below,
above, and to south of Mono Inn in 1997 after both of my parents had died. My parents had sold
Mono Inn and some of the land around it in the 1960s. We have managed the four rental houses on this
historical property since 1977, including the house in which I grew up, two other houses from the
1930s, and one dating back to the 1990s. We have spent time every year staying in motels in Lee
Vining or trailer camping nearby and doing business with Mono County stores, restaurants, gas
stations, contractors, and various Mono County government offices.
So it with these deep roots and current interest in the Mono Basin that I base my comments on the
proposed Tioga Inn development and what should be addressed in the Subsequent Environmental
Impact Report (SEIR). I hope my comments convey the overall theme that any development in the
Mono Basin needs to be done in ways that sustain the unique natural beauty and ecological function of
the Basin, and be done in ways that serve the community of people living in the Basin for past decades
and far into the future. The Tioga Inn development could be a positive addition to Lee Vining and the
Mono Basin if done carefully with this theme as the driving force.
Fire Issue
One of the biggest concerns I have for the Mono Basin is increased risk of fire. Two major wildfires in
2
the last 2 years have threatened Lee Vining from the south and then from the north. The Marina Fire in
2016 presented a major risk to my property and my tenants as well. An increased number of people and
vehicles spending time close to Lee Vining overnight or for multiple days and nights needs to be
evaluated for increased risk of wildfires. Preventative measures need to be evaluated and
recommended in the SEIR. Ways that the proposed development can help the Lee Vining Volunteer
Fire Department prevent and fight fires need to be addressed, such as building more and better capacity
of firefighting equipment and buildings. Clearly, a 3-story lodging development would be beyond the
capacity of the present volunteer fire department to handle should a fire break out in the new
development. An adequate hook-and-ladder fire truck would need to be acquired as well as a building
to store it in, and the proposed development should bear a major part of the cost of such upgrades.
In-town Parking Issue
The SEIR needs to address the substantial increase in places to park in Lee Vining due to those staying
at the Tioga Inn driving into Lee Vining for shopping, eating, and services like US Postal services.
Increased exhaust fumes from the additional vehicular traffic needs to be evaluated for impacts on
neighborhoods and schools in Lee Vining.
Night Sky Light Pollution Issue
A key issue that needs to be addressed in the SEIR is impact of outdoor lighting on the ability of
residents and visitors to enjoy the amazingly beautiful stars and planets over the Mono Basin at night.
Skies as dark as those of the Mono Basin are becoming increasingly rare due to human development
done without adequate means of limiting stray light (light pollution) from fixtures needed only to light
surface areas. Lighting fixtures for parking lots, sidewalks, and other outdoor areas have been
manufactured for decades that greatly limit stray light. The SEIR needs to thoroughly evaluate the
potential of the Tioga Inn development to increase stray light affecting visibility of stars and planets at
night in the Mono Basin, evaluate alternative lighting systems, and make recommendations. Since the
Lee Vining community already has many problem light fixtures, I recommend the developers be asked,
or even required, to provide financial assistance to the community to reduce stray light problems as a
partial offset to the unavoidable stray light problems Tioga Inn will create with even the best and latest
technology.
Greenhouse Gas Emission Issue
Global warming and associated drought and extreme storm events (wind and precipitation) from fossil
fuel consumption and other greenhouse gas emissions are issues that need to be addressed at the local
level whenever possible. Fuel efficient building design, lighting, and appliances need to be assessed
and recommended or required in the SEIR. “No vehicle idling” requirements need to be established,
clearly posted, and enforced within the proposed development. Ways to efficiently transport people to
and from the proposed development to Lee Vining for shopping and services need to be evaluated and
recommended. The emphasis needs to be on safe and gentle walking/universal access trails and mini-
bus service provided by the proposed development.
As a major tourist facility neighboring a National Scenic Area and National Park of international
renown, I think particularly rigorous efforts should be made to address greenhouse gas emissions. The
SEIR must take this special location into account and go beyond a typical SEIR for a typical location
not neighboring such local, national, and international treasures.
3
Water Conservation Issue
Water conservation has been a big issue in the Basin for at least 150 years. It is a growing issue that
was substantially ramped up with the Los Angeles Department of Water and Power diversions of
inflow streams to Mono Lake over 75 years ago. And now the area has suffered years of drought and
will be facing additional dryer decades ahead with less spring and summer flow and lower lake levels
as global warming/climate change continues to intensify those conditions.
Therefore, the planned Tioga Inn needs to implement the highest levels of water conservation inside
and outside throughout the project --- and provide guests with interpretive signs, literature, and other
communications on the need for water conservation and how Tioga Inn is addressing water
conservation. High efficiency showers, toilets, restaurant facilities, low water demand native plant
landscaping, water recycling, gray water use outdoors, and other such measures need to be
implemented and well publicized in hotel rooms, restaurants, and employee housing associated with
the Tioga Inn development. Rainwater capture and use systems need to be part of roof design, as well.
Mitigation for water use at the Tioga Inn development should also be required of the developers, such
as assistance to Lee Vining residences, schools, and businesses. This would include assistance with
purchase and/or installation of more water-efficient showers, toilets, washing machines, outdoor
watering systems, and more.
Other Community Issues
Increased numbers of visitors and resident workforce members always translates into need for
increased community services for safety, security, schools, and emergency medical situations. It is
essential that a plan for the Tioga Inn development needs a lot of local input and ways for the
development to assist the community with equipment and personnel that will be needed to address
these expanded concerns. That would include things such as EMT’s, teachers, classrooms, ambulance
capacity in the Basin, security equipment and personnel, and more. Assistance in acquiring at least one
stoplight in Lee Vining should be part of the agreed-to plan.
The Tioga Inn would be an ideal place to add larger meeting rooms for community meetings. These
should also be made available for holding people during emergencies such as earthquakes, snow slides,
wildfires, and flash floods. This should also be part of the agreed-to plan.
Conclusion
If the above issues can be adequately addressed, the Tioga Inn development could be a welcome
development in the Mono Lake Basin. Thank you for the opportunity to comment.
Barry McPherson
November 20, 2016
(Contact information at top of page 1)

To: Mono County Community Development Department attn: Gerry LeFrancois
Comments on Tioga Inn Project in Lee Vining
From: Nora Livingston, PO Box 371, Lee Vining, CA 93541, (415) 686-1935 [email protected]
Thank you for the opportunity to comment on the Tioga Inn Project in Lee Vining.
I am a Naturalist Guide in the Mono Basin and I have lived here on and off for 8 years. I love this little
town very much and hope it will be my home for a very long time. I work for the Mono Lake Committee
(though these comments are my own views, I am not representing the Committee in any way in this
letter) and see a lot of the tourist traffic all summer. This town wouldn’t be alive without it. That being
said, I do believe a project of this scope needs a LOT of assessment as to how it will affect the town and
it’s businesses, as well as the environment, both immediately on site of the project and the indirect
impacts as well. If, and only if, all of these concerns are addressed, should this project go forward.
I am concerned about a few things about this project:
FIRE SAFETY: Local fire department officials have stated that the Lee Vining Volunteer Fire Department
doesn’t have a truck with a ladder large enough to fight a fire on a three-story building that large. If they
were to get such a truck, they would then need to build a new firehouse. With the limited funds for the
LVFD, this would be difficult without substantial monetary help. Also, adding 80 employees AND having
over 200 extra guests may cause the town resources like the Fire Department’s time to become
depleted in times of high visitation.
INCREASED TRAFFIC at HWY 120 intersection: The intersection of HWY 395 and HWY 120 is notorious for
accidents. I am worried that adding a hotel in that particular location would cause a greater number of
accidents as that intersection would become much busier.
LIGHT POLLUTION: Lee Vining is lucky to have few lights---we can see the stars every night! Visitors
come from LA where they can’t see them EVER to be able to bask in the glory of the milky way. The
added lights of the hotel would need to be addressed. Perhaps special windows and street lights can
help with this. It MUST be included in the design. See http://physics.fau.edu/observatory/lightpol-
prevent.html
ENERGY: This proposed building will be much larger than any other in Lee Vining, and it will require a lot
of energy to run. This must be addressed with fossil fuels in mind. SOLAR energy is the answer. The
building must also be designed to be as energy efficient as possible. This is the future, we know how
unsustainable fossil fuels are and how damaging they are to the environment. Anything built new needs
to be on the forefront of energy technology, or life as we know it will soon come crashing down and this
hotel would be obsolete anyway. I recommend designing a LEED certified building to address the needs
of the future.
IMPACTS TO SCHOOLS: The local schools may not be able to handle an extra 30+ kids if the employees
have families. This should be considered. IF this project goes forward, there should be some kind of
mitigation paid by the project to help fund developments in the schools to hire more teachers and
expand their campuses to accommodate more children.

WATER: This project will consume a lot more water. We are in the middle of a catastrophic drought and
there is no end in sight. Conserving water is of the utmost importance, especially in the Mono Basin
where Mono Lake has been impacted by excessive diversions for decades. Drought has further brought
down the lake level. This Basin needs all the water it can get. If this project will negatively impact water
allocation and runoff to the lake in any way, now or in the future, it should not happen on such a grand
scale. If it does get built, it needs to have state-of-the-art gray water systems and water recycling plans,
including a black water system.
AFFORDABLE HOUSING: The currently plan adds much needed housing to the community. While this is
great, they need to be truly affordable and winterized for year round living. Dennis mentioned that his
employees are paid well and therefore can afford their housing. Not all businesses in Lee Vining can
afford to pay their employees as well as the Tioga Gas Mart (and potentially the Tioga Inn) can and living
in the Eastern Sierra is expensive with food and gas prices as high as they are. The buildings should also
address all the energy and water efficiency problems I addressed earlier, while also being affordable. If
you can figure out how to do that, I’m on board.
I hope to live in the Mono Basin for a long time. I want this community to thrive and I understand that
future development may be necessary to help businesses survive, but this particular project seems to be
less community-minded and more individual-minded to serve the owner’s wants. I want development
projects in the town to come up because they address a need that is not being met and could also bring
prosperity to the owner, in that order, not the reverse. If this project will address all of these concerns
and be able to be a cutting-edge example of a business for a better future of our community and our
planet, then I will support it. If it falls short, cuts corners, and impacts the community and environment
negatively, I will fight it tooth and nail.
Thank you for the opportunity to comment. Please, do what is right and good for our future.
Nora Livingston, Lee Vining

From: [email protected] [mailto:[email protected]]Sent: Monday, November 21, 2016 9:55 AMTo: Gerry LeFrancois <[email protected]>Subject: Tioga Inn
Thank you for the opportunity to comment on the Tioga Inn project in Lee Vining.Our first concern always when evaluating such a project is WHERE'S THE WATER? Both surface andground water sources have been in steady decline recently and almost all scientific studies suggest thatthis trend will continue. How will the greatly increased groundwater draw to support this project affectMono Lake and the Lee Vining PUD supplies?Since this project is still in the planning stage, now is the time to include requirements for passive solar,photovoltaic systems, graywater recycling, blackwater dispersal, and super insulation.All but one restaurant and several motels shut down for the winter because visitation drops offdramatically when Tioga Pass closes. Is this project economically feasible?Mr. Domaille has stated that he intends to sell the approved plans to a "chain" motel operator. I am notsure how binding these approved plans would be to the eventual operator, or if this would represent a"foot in the door" for greater expansion.Please consider these concerns. Gary Nelson and Deborah Lurie

From: [email protected] [mailto:[email protected]] On Behalf Of Ryan CarleSent: Monday, November 21, 2016 12:39 PMTo: Gerry LeFrancois <[email protected]>Subject: comments on proposed Tioga Inn expansion
To: Mono County Community Development Department - Gerry LaFrancois
Comments on Specific Plan for Tioga Inn Project in Lee Vining , Oct. 27, 2016
From: Ryan Carle, 2621 N Rodeo Gulch Rd, Soquel, CA [email protected]
Dear Mr. LaFrancois,I am writing in regards to the specific plan for the proposed Tioga Inn project in Lee Vining,California, which as currently proposed would entail building a 3-story/120 bedroom hotel, staffhousing with 80 bedrooms, new parking lots, and expansion of the current restaurant and gasstation at the current Mobil site. This site is right at the base of the road to Yosemite and theentrance to the Mono Basin.
I grew up in the Mono Basin and have lived there for two-thirds of my life, though I currently amlocated in Santa Cruz. I care deeply about the Mono Basin and preserving its cultural, scenic, andeconomic values. This area serves as the gateway to Yosemite National Park and the Mono LakeNational Forest Scenic Area, and its unique beauty is experienced by thousands of internationaland domestic tourists annually. I am writing to encourage you to only let the proposed TiogaInn development occur if they meet the highest possible standards for green building andlow visual impacts, and develop in a way that is responsible in its population and culturalimpact on our community.
The community of Lee Vining needs affordable housing, but the proposed development of 80units would increase the population of Lee Vining by 54%! This is conservatively assuminga1.5 person occupancy per unit (120 people total). Lee Vining’s population was 222 people in2010 (U.S. Census, 2010). Adding 120 more people would increase the population of theentire Mono Basin by 30%, as Mono City and Lee Vining combined totaled 394 people in 2010(U.S. Census, 2010).
Adding this many people to the Mono Basin would have a major impact on our schools and othercommunity services. Drawing hundreds of people to a self-contained resort outside of town maynegatively impact businesses in town. More residents, along with a 120 room hotel, would alterour quality of life, for example by increasing traffic. The turn from Highway 120 to 395 at theMobil is already dangerous and this project would increase the traffic by hundreds of cars a day.I encourage you to cap the number of residences at 40, which would represent a morereasonable, though still large, 22% increase in Lee Vining’s population and 15% increasefor the whole Mono Basin. I reiterate that affordable housing is needed, but not 80 units. At theleast I recommend further study of how many units are actually needed and what impactthey would have on the community, i.e. how much housing currently exists in Lee Vining toaccommodate laborers at the new hotel?

A development of this size will also be resource intensive. This project may not be terribly largeby the standards of urbanized places, but it will dramatically increase the amount of energy andwater consumed in the Mono Basin. I urge you to minimize this impact by requiring thebuilding meet the highest standards for green building and low visual impact. There iscurrently a movement underway to designate the Mono Basin a climate-friendly community (see350.org Mono Basin chapter; https://www.facebook.com/350MONO/ ) that sets an example forthe world of how we can adapt to and prevent climate change. Making sure this developmentproject meets the highest possible standards for sustainability will be a significant step inrealizing the plan to make the Mono Basin a world-wide example for climate-change resilience.
Therefore I urge you to only allow the Tioga Inn development if it requires:1. Enough solar installation and energy saving design elements to be a net zero energy user,and platinum LEED certified as well as exceeding the requirements of Title 24 of the Stateenergy code.2. A cutting-edge, gray water recycling and black water dispersal system3. Native, drought-tolerant landscaping4. Outside lighting should also be muted and pointed downwards to preserve our night skies.5. Two or three apartment style building for staff housing, which would be much more energyand land-use efficient than the currently proposed 80 small cabins. These apartments should alsoinclude passive solar, good southern sun exposure, and gray and black water systems to makethem as efficient as possible.
These reasonable requirements will substantially minimize the negative impacts on theenvironment and community, in this very special place beloved by locals and thousands ofpeople worldwide. Our actions now signal to our local communities and the world how wewill proceed into a future in which we are resilient to climate change, and respectful oflocal communities and the environment.
Sincerely,Ryan Carle
2621 N Rodeo Gulch Rd.
Soquel CA 95073

From: Don Condon [mailto:[email protected]]
Sent: Monday, November 21, 2016 9:42 AM
To: Gerry LeFrancois <[email protected]>
Subject: Tioga Inn Project
Mr. Lefrancois,We would encourage the reviewers, to the extent of their jurisdiction, to ensure that this Projectis environmentally sound and at a minimum will meet Leed Platinum requirements. Theresources, natural and otherwise, in this area are extremely limited.Therefore the most sustainable project possible is warranted. People come to this area with andinterest and appreciation of natural beauty and the fragility of the environment. In addition a newresort that models best practices in sustainability will be a draw to tourists and thus good forbusiness and the local economy.
Sincerely,Donald CondonVivian Barron983 Fairway CircleMammoth Lakes, Ca. 93546510 [email protected]

From: Yoel Kirschner [mailto:[email protected]]Sent: Monday, November 21, 2016 1:52 PMTo: Gerry LeFrancois <[email protected]>Subject: Tioga Inn Project in Lee Vining , Oct. 27, 2016 (Comment)
To: Mono County Community Development Department - Gerry LaFrancois
Comments on Specific Plan for Tioga Inn Project in Lee Vining , Oct. 27, 2016
Dear Mr. LaFrancois,
I write in regards to the proposed Tioga Inn project in Lee Vining, California, and urge you toconsider an environmentally preferred alternative for the proposed project. As currentlyproposed, a 3-story/120 bedroom hotel, staff housing with 80 bedrooms, new parking lots, andexpansion of the Mobile site, at the base of highway 120 in the town of Lee Vining would beconstructed.
I ask that you consider reducing the size of the staff housing by at least half the number currentlyproposed, and consider the use of efficient apartment style buildings, as opposed to individualhouses for staff quarters. Any construction should follow the principles of green building,including construction resulting in the lowest visual impact. The town of Lee Vining has apopulation of roughly 220. Adding a development of this size would change the nature of thecommunity and have potentially negative repercussions through increased traffic and roadaccidents, increased water use, and possibly by diverting economic activity away from existingservices in the town of Lee Vining.
I lived in Bishop, CA during my tenure as a natural resources technician with the US ForestService, and still make trips to the Mono Basin, both to visit Yosemite National Park, and to visitthe Mono Basin in its own right. I would like to see any future development in the area to beundertaken with the utmost restraint, in light of the Mono Basin's unique environmental andcultural resources.
Sincerely,Yoel KirschnerForeign Service Environmental OfficerU.S. Agency for International DevelopmentWashington, D.C.
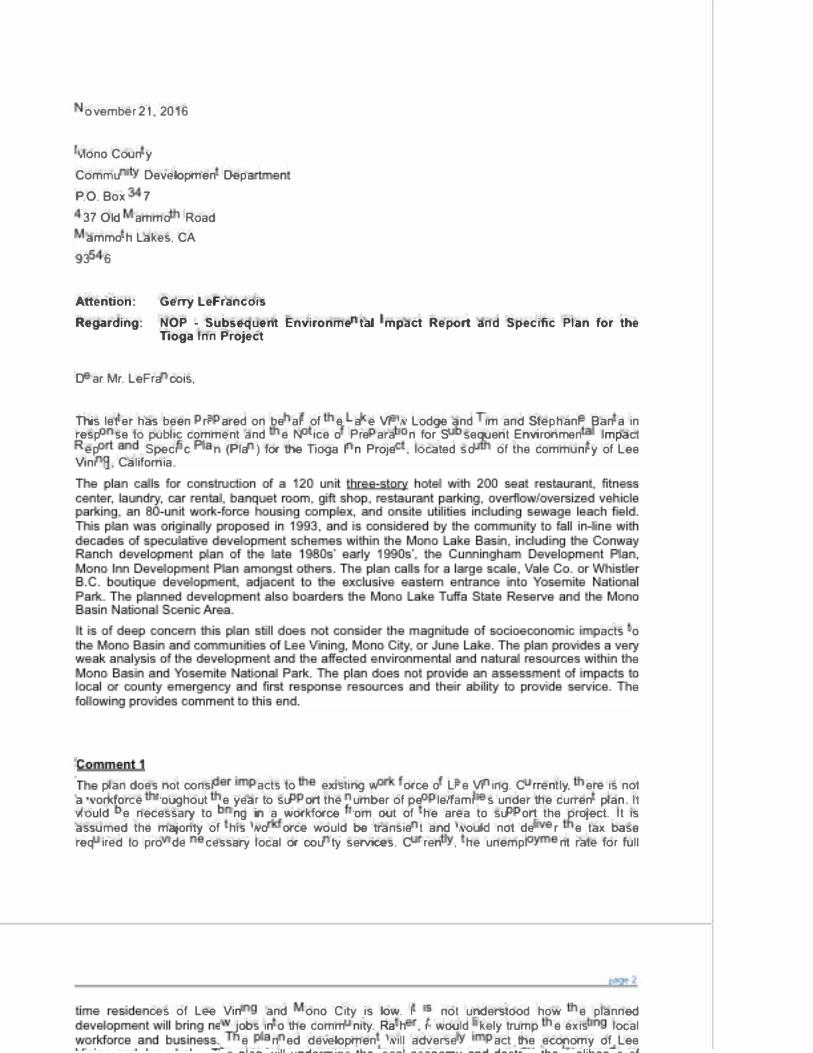
ovember 21, 2016
iAonoCoun y
Commu · Developmen Dep
P.O. Box 7
37 Old ammo Road
ammo h Lakes, CA
93 6
Attention: ,Gerry Lefrancois
Regarding: NOP - Subse-quent Environme taJ mpact Report and Specific Plan for the Tioga Inn Project
0 ar Mr. LeF re oois,
This let er has been ri ared on be al of e e e Vi v Lodge and 1m and stephani Ban e in resp se to pubrc comment and e N ice o Pre ara · n for S sequent Environmen lmpaci
ep Speci c n (Pie ) for 1he Tioga I n Proje , located so of the oommuni y of Lee Vini • Califomia.
acts o
e
e
plan does not oonsi acts to exi�ing w oroe o L e Vi ing. C rrently, ere is no1 a vori<force oughout e year to su ort the umber of pe lelfami · s under 1he curren plan. Ii "'ould e necessary to ·ng in a workforce om out of he eras to su ort the project It is assumed the majority of his vo orce would be 1ransie l end vow! not de r e tax base req ired to pro ·de cessary local or oou ty services. C ren , he unempl nt rate for full
p
oes of Lee Vin' and ono City is low. I · not understood how e planned jobs in o the comm nify. Ra h • i , woold kely trump e exis · local
e n ed developmen viii adverse act the economy of Lee -. -•-- .�ill .,_...; ___ :_._ •&...--- ---• -·-·----•" --...1 ...1--•- el-..-
.,.. --1!"---- - -.#
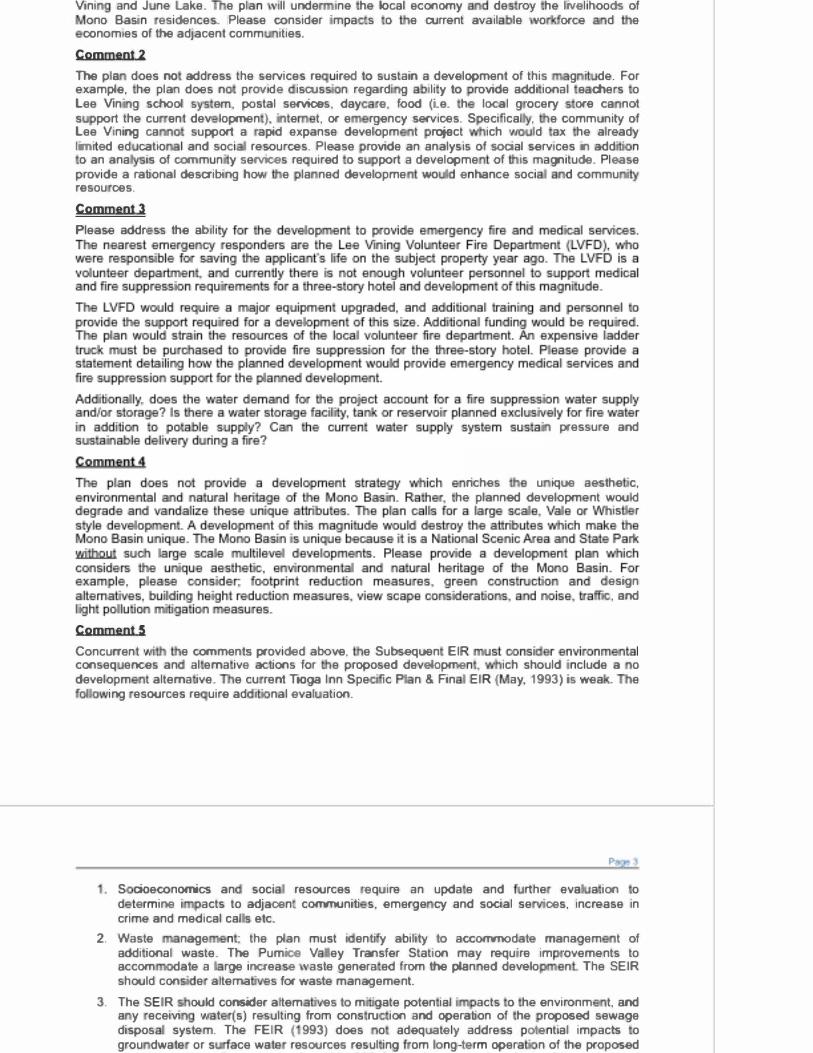
Vini and J ne Lake. e plan �ill unde ine he local ecooomy de ray he livelihoods of ono Bas:n esidences. Please consider ·mps ,s o e oorrent avail le vo orce d e
oonomies of 1he adjaoen1 comm ities.
Comment 2
The pis does no address the services re uired to sustain s development of this g · de. For example, he plan does n provide isouss· n regard· g iii y to rovide eddi iooel e cflers o Lee Vin· g school s em, postal services, day e. food (Le. h local g ocery ore cs no1 s port the cu ant dev lopmen }. · te t, or e rgency services. S eci 1csl • e oommooity of Lee Vining ca support a apid expanse developm t ro;ect ich "' Id ax he already lanited ed oatio I and soci resources. Please rovide an analysis of social services in add. · n o an ans is of commun· y services re uired o s port a developme of is magnitude. Please
provide a rational desaibing h� e la ned developme wo enhance soci d commu ·resou oes.
Commentl
Please add11 ss 1he abili
pressure and
riches u ique aes1he ·c, he planned development would
Comment 5
Concurrent "' · e comments provided above, e Subsequen El
is r
esign . and
conseq ences an al ema ive actions for e proposed develODmen. ich should ·nclude a o developm t altema ive. e cu rent Ttoga Inn Spe · 1c n & Fin EIR { ay. 1993) is wee • e
ing esouroes re uire ad i · nal eval ation.
p
S aoeconomics an soci resourices equire an upda e and rthe eve a ion o d termine i acts to adjaoen, comnMJniti s, emerge cy and social se ·oes, increase in crime and medical cal etc.
2. Waste nage n ; the plan must i anti y ability to accommodate managem t of addi ional waste. The Pumice Yi ey Transfer Station may requ·re im ovements to accom date a rge increase �aste genera ed f rom 1he plan ed develo n The SEIR should con · e attema · s for waste management.
3. The SEIR ould consider altem · es to m .. gate poten isl · acts o he environm t, enda i'J ecel\ll "' t s) resulting from oons ru ioo and operation of he rop05ed sewagedispos system. The FEIR ( 99-3) does o adequately address potential impacts ogrou dwa1a or s ace wets resources resul ·ng om ong-term opera · n of the proposed

5. The curre t developm nt is a po ular ven e for large events end oonc s. is element was not ad ressed ·n th FEIR. Th se con rts and events wo I increase u curren Ian. The S El R should provid an pdated e a ion of noise. raffic, end pollu ion · in the ono Basin a eti I See ic ea.
socioeconomi a
Please oon ec 1m or Ste enie Ban a et the ska View Lodge loca ed in Lee Vining California (7 0 6 7 • 543 should you eve any questions egard· g this le tar or h c ants herein.
Since ely,
nm Banta - Owner/Operator, Lake Vie•,11 Lodge
Lahontan Regional Water Quality Control Board
November 21, 2016
Gerry Le Francois Mono County Community Development Department P.O. Box 347 Mammoth Lakes, CA 93546 Email: [email protected]
� EDMUND G. BROWN JR.
� OOVO"NOR
File: Environmental Doc Review Mono County
Comments on the Notice of Preparation of a Subsequent Environmental Impact Report and Specific Plan for the Tioga Inn Project, Mono County, State Clearinghouse Number 1992012113
The California Regional Water Quality Control Board, Lahontan Region (Water Board) staff received the Notice of Preparation (NOP) of Subsequent Environmental Impact Report for the above-referenced project (Project) on October 24, 2016. The NOP, prepared by the Mono County Community Development Department, was submitted in compliance with provisions of the California Environmental Quality Act (CEQA) in order to solicit input on the potential impacts on the environment and ways in which those significant effects are proposed to be avoided or mitigated. The proposed Project is to construct a new hotel, new workforce housing units, upgrades to the existing gas station and restaurant, and additional parking areas including a park-and-ride facility. The existing onsite septic system will be replaced by an onsite wastewater treatment plant to treat wastes before discharge to a designated leach field downgradient of the site.
Water Board staff, acting as a responsible agency, is providing these comments to specify the scope and content of the environmental information germane to our statutory responsibilities pursuant to CEQA Guidelines, California Code of Regulations, title 14, section 15096. We encourage the County to take this opportunity to integrate storm water measures into the Project that support low impact development (LID) and reduce the effects of hydromodification. In addition, the environmental document will need to fully describe all components of the proposed wastewater treatment system and evaluate potential groundwater impacts as a result of onsite disposal practices. Our comments and list of potential permitting requirements are outlined below.
WATER BOARD'S AUTHORITY
All groundwater and surface waters are considered waters of the State. Surface waters include streams, lakes, ponds, and wetlands, and may be ephemeral, intermittent, or perennial. All waters of the State are protected under California law. State law assigns responsibility for protection of the quality of waters of the State in the Lahontan Region to the Lahontan Water Board. Some waters of the State are also waters of the United States. The Federal Clean Water Act (CWA) provides additional protection for those waters of the State that are also waters of the United States. Mono Lake and its tributaries are considered waters of the United States.
AMYL. HORNE, PHO, CHAIR I PATTY z. K0UY0UMDJIAN, EXECUTIVE OFFICER ---------------·
2501 Lake Tahoe Blvd., So. Lake Tahoe, CA 96150 I 15095 Amargosa Road, Bldg 2, Ste 210, Victorville CA 92394
e-mail [email protected] I website www.waterboards.ca.gov/lahontan
0 RECYCLED PAPER
Mr. Le Francois - 2 - November 21, 2016
The Water Quality Control Plan for the Lahontan Region (Basin Plan) contains policies that the Water Board uses with other laws and regulations to protect the quality of waters of the State within the Lahontan Region. The Basin Plan sets forth water quality standards for surface water and groundwater of the Region, which include designated beneficial uses as well as narrative and numerical objectives which must be maintained or attained to protect those uses. The Basin Plan can be accessed via the Water Board's web site at http://www.waterboards.ca.gov/lahontan/water_issues/programs/basin_plan/references.shtml.
RECOMMENDED ELEMENTS TO INCLUDE IN THE ENVIRONMENTAL REVIEW
We recommend the following be included as part of the proposed Project and considered in the environmental review.
1. Low Impact Development Strategies - The foremost method of reducing impacts towatersheds from development is LID, the goals of which are maintaining a landscapefunctionally equivalent to predevelopment hydrologic conditions and minimal generationof non-point source pollutants. The principles of LID include: maintaining naturaldrainage paths and landscape features to slow and filter runoff and maximizegroundwater recharge; reducing compacted soil and impervious cover; and managingrunoff as close to the source as possible.
Post-construction storm water control measures that are compatible with LID are preferred. Examples include the use of bioretention, soil amendments, pervious pavement, and vegetated infiltration basins, swales, and strips, all of which can effectively treat post-construction storm water runoff, help sustain watershed processes, protect receiving waters, and maintain healthy watersheds. Any particular one of these control measures may not be suitable, effective, or even feasible on every site, but the right combination, in the right places, can successfully achieve these goals. Information regarding LID and sustainable storm water management can be accessed online at http://www.waterboards.ca.gov/water_issues/programs/low_impact_development. We encourage the County to incorporate LID implementation strategies into this Project such as vegetated swales, pervious pavement, and vegetated infiltration basins.
2. Hydromodification - Hydromodification is the alteration of the natural flow of waterthrough a landscape (i.e. lining channels, flow diversions, culvert installations, armoring,etc.). Disturbing and compacting soils, changing or removing the vegetation cover,increasing impervious surfaces, and altering drainage patterns limit the natural hydrologiccycle processes of absorption, infiltration, and evapotranspiration, and increases thevolume and frequency of runoff and sediment transport. Hydromodification typicallyresults in stream channel instability, water quality degradation, changes in groundwaterrecharge processes, impacts to aquatic habitats, and disconnecting of a stream channelfrom its floodplain. Floodplain areas provide natural recharge, attenuate flood flows,provide habitat, and filter pollutants from urban runoff. Floodplain areas also store andrelease sediment, one of the essential processes to maintain the health of the watershed.Information regarding hydromodification can be accessed online athttp://www. waterboards. ca.gov/water _issues/programs/stormwater/hydromodification .shtml. We encourage the County to incorporate mitigation measures that will avoid orminimize the potential for hydromodification as a result of Project implementation.
3. Water Quality Standards and Thresholds of Significance - All surface waters andgroundwaters have applicable water quality standards, and each water quality standardhas two parts, (1) a designated beneficial use and (2) a water quality objective (eithernumerical or narrative) that must be maintained or attained to protect that beneficial use.
Mr. Le Francois - 3 - November 21, 2016
The environmental document will need to define the site-specific water quality standards (beneficial use and water quality objective) that are applicable to both the surface waters and groundwater potentially affected by this Project. It is these standards that should be used when evaluating thresholds of significance for Project impacts in the environmental review.
4. Beneficial Uses and Water Quality Objectives - The Project is located within theMono Hydrologic Unit 601.00 and overlies the Mono Valley Groundwater Basin No. 6-9.The designated beneficial uses of surface waters in the Mono Hydrologic Unit 601.00and of groundwaters of the Mono Valley Groundwater Basin No. 6-9 are outlined inChapter 2 of the Basin Plan. Water quality objectives, both numerical and narrative, forthese waters, are outlined in Chapter 3 of the Basin Plan. This information is necessaryto identify the site-specific water quality standards described in Comment No. 3 above.
5. Degradation Analysis - The environmental document should include a DegradationAnalysis that analyzes the existing water quality of the groundwater beneath the site andthe potential changes to the quality of the groundwaters as a result of implementing theproposed onsite wastewater treatment system. This analysis should be consistent withState Water Board Resolution 68-16, the Statement of Policy with Respect toMaintaining High Quality of Waters in California (hereafter the Antidegradation Policy),which requires that disposal of waste into waters of the State be regulated to achieve thehighest water quality consistent with the maximum benefit to the people of the State. Thequality of some waters is higher than established by adopted policies and that higherquality water shall be maintained to the maximum extent possible. The AntidegradationPolicy requires the following:
a. Higher quality water will be maintained until it has been demonstrated that anychange will be consistent with the maximum benefit to the people of the state, willnot unreasonably affect present and anticipated beneficial use of the water, andwill not result in water quality less than that prescribed in the policies.
b. Any activity that produces a waste and discharges to existing high quality waterswill be required to meet waste discharge requirements that will result in the BestPracticable Treatment or Control (BPTC) of the discharge necessary to assurepollution or nuisance will not occur, and the highest water quality consistent withthe maximum benefit to the people will be maintained.
6. Onsite Wastewater Treatment - The Project plans to construct and operate a domesticwastewater treatment plant. Onsite disposal of treated wastewater must not causepollution and shall minimize degradation. Denitrification should be included in the plantdesign to ensure that receiving water pollution from nitrate does not result fromwastewater effluent discharges. The environmental document should fully describe thefollowing information.
a. Domestic wastewater collection, conveyance, treatment, and disposal meansand methods.
b. Locations of all associated domestic wastewater systems, appurtenances, andstructures.
c. Treatment plan design criteria.d. Storage and disposal design criteria.e. Expected wastewater quality.f. Expected wastewater flow (average daily and daily maximum).g. Depth to groundwater and receiving groundwater quality.
Mr. Le Francois -4- November 21, 2016
h. Expected receiving groundwater degradation (nature and extent) resulting fromthe discharge according to State Water Resources Control Board Resolution 68-16. Additional information is available athttp://www.waterboards.ca.gov/board_decisions/adopted_orders/resolutions/1968/rs68_016.pdf.
i. Background receiving groundwater quality and direction of groundwater flowestablished from a statistically significant data set.
j. Location and design details for monitoring wells to be installed to monitorgroundwater quality.
k. Lift station locations and design.I. Backup power features.m. Entity responsible for owning and operating the treatment and related
infrastructure.n. Intentions, if any, regarding recycled water usage. If recycled water uses are
planned, an Engineering Report prepared in accordance with California Code ofRegulations, title 22, must be submitted to both the Water Board and State BoardDivision of Drinking Water for approval. Any recommendations regardingtreatment or disposal would be incorporated into waste discharge requirementsor water reclamations requirement issued by the Water Board.
The Lahontan Water Board's policy for domestic wastewater treatment, disposal, and reclamation is described in the Basin Plan, which is available online at http://www. waterboards. ca.gov/lahontan/water _issues/programs/basin_plan/docs/ch4_i mplementplans. pdf#page=67.
7. Jurisdictional Delineation of Surface Waters - Several streams traverse the site, allof which are considered waters of the State and subject to regulation by the WaterBoard. A jurisdictional delineation will need to be performed to determine the locationsand extent of all surface water resources within the boundaries of the Project, includingnon-federal waters of the State and federal waters of the United States. A JurisdictionalDelineation Report documenting the results of the delineation would contain essentialinformation for determining what state and federal water quality regulations might beapplicable to this Project and should be included as an appendix to the finalenvironmental document.
Prior to construction, the Jurisdictional Delineation Report will need to be submitted to Water Board staff for review and concurrence with respect to presence and extent of non-federal waters of the State on the Project site. We further request that a copy of the Jurisdictional Delineation Report also be provided to the United States Army Corps of Engineers to verify the presence or absence of federal waters on the Project site.
8. Restoration and Revegetation - All temporary impacts to water resources and uplandareas should be restored (recontoured and revegetated) to match pre-Project conditions.The environmental document should include a mitigation measure that requires aRestoration and Revegetation Monitoring Plan be prepared that includes monitoring forsome period of time (usually no less than 3 years), outlines a schedule with performancemeasures to be met in order for the restoration/revegetation to be deemed successful,and contains adaptive management criteria in the event performance measures are notbeing met.
9. Buffer Areas - The environmental document should include a mitigation measure thatrequires buffer areas to be identified and exclusion fencing to be used to protect surfacewater resources outside the Project area and prevent unauthorized vehicles or

Mr. Le Francois - 5 - November 21, 2016
equipment from entering or otherwise disturbing surface waters outside the Project. Construction equipment should use existing roadways to the extent feasible.
10. Vegetation Clearing - Vegetation clearing should be kept to a minimum. Wherefeasible, existing vegetation should be mowed so that after construction the vegetationcould reestablish more quickly and help mitigate for potential storm water impacts.
11. Spill Prevention and Response - The environmental document should include amitigation measure that requires the preparation and implementation of acomprehensive Spill Prevention and Response Plan. This plan should outline the sitespecific monitoring requirements and list the best management practices necessary toprevent hazardous material spills or to contain and cleanup a hazardous material spill,should one occur.
POTENTIAL PERMITTING REQUIREMENTS
A number of activities associated with the proposed Project have the potential to impact waters of the State and, therefore, may require permits issued by either the State Water Resources Control Board (State Water Board) or Lahontan Water Board. The required permits may include one or more of the following.
12. Projects that result in excavation in, discharge of fill to, or otherwise physical alteration ofsurface waters will require either (1) a CWA, section 401 water quality certification forimpacts to federal waters or (2) dredge and fill waste discharge requirements for impacts
' non-federal waters of the State, both of which are issued by the Lahontan Water Board.
13. Land disturbance of more than 1 acre will require a CWA, section 402(p) storm waterpermit, including a National Pollutant Discharge Elimination System (NPDES) GeneralConstruction Storm Water Permit, Water Quality Order (WQO) 2009-0009-DWQ,obtained from the State Water Board, where federal waters of the United States areaffected. The environmental document should identify where waters of the UnitedStates are present within the Project area. The Lahontan Water Board may establishindividual waste discharge requirements to address storm water impacts to non-federalstate only waters. The project- specific Storm Water Pollution Prevention Plan requiredby the permit must fully identify and describe both construction and post-constructionBest Management Practices (BMPs) that will be incorporated into the Project. Theenvironmental document should also fully describe the post-construction BMPs that willbe used and show locations of these features.
14. New industrial operations may require coverage under the NPDES General IndustrialStorm Water Permit, WQO-2014-0057-DWQ, obtained from the State Water Board,where federal waters of the United States are affected. The Lahontan Water Board mayestablish individual waste discharge requirements to address storm water impacts tonon-federal waters of the State.
15. Disposal from wastewater treatment facilities will likely require coverage under individualwaste discharge requirements issued by the Lahontan Water Board or through a Noticeof Applicability signed by the Executive Officer covering effluent dischargers under ageneral order for waste discharge requirements. Information on what information isneeded in a report of waste discharge is available on the State Water Board's web siteathttp://www.waterboards.ca.gov/water_issues/programs/land_disposal/waste_discharge_requirements.shtml.
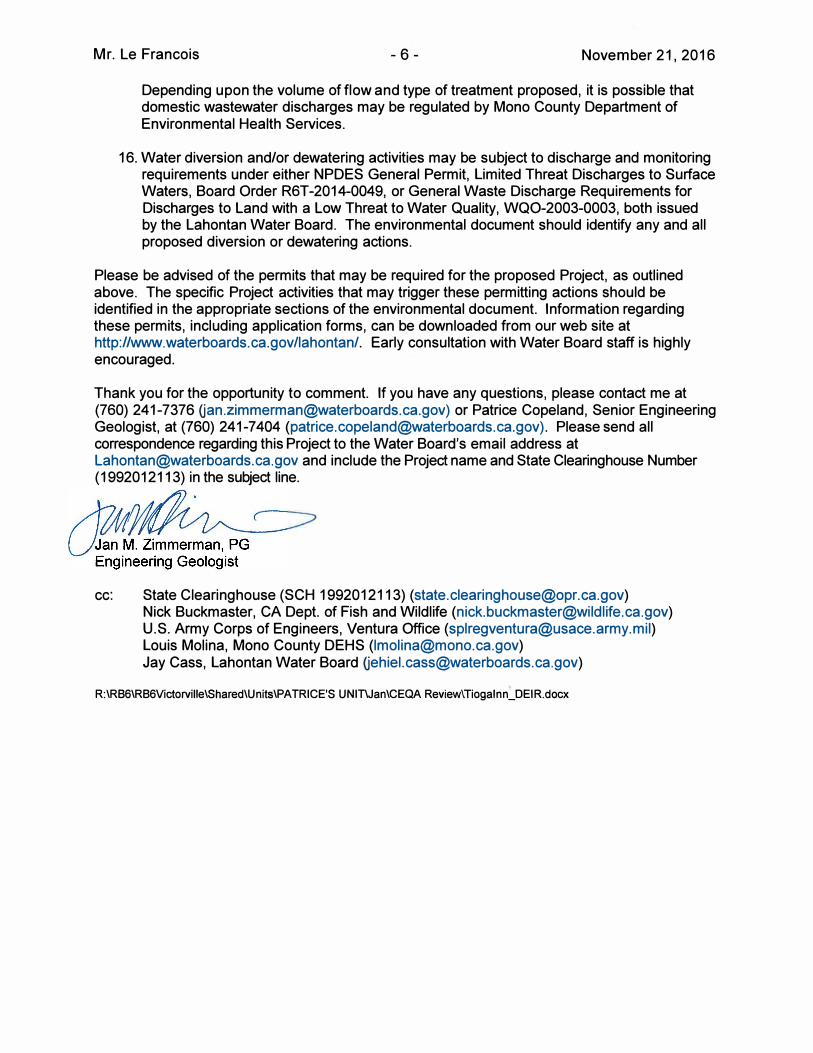
Mr. Le Francois -6- November 21, 2016
Depending upon the volume of flow and type of treatment proposed, it is possible that domestic wastewater discharges may be regulated by Mono County Department of Environmental Health Services.
16. Water diversion and/or dewatering activities may be subject to discharge and monitoringrequirements under either NPDES General Permit, Limited Threat Discharges to SurfaceWaters, Board Order R6T-2014-0049, or General Waste Discharge Requirements forDischarges to Land with a Low Threat to Water Quality, WQO-2003-0003, both issuedby the Lahontan Water Board. The environmental document should identify any and allproposed diversion or dewatering actions.
Please be advised of the permits that may be required for the proposed Project, as outlined above. The specific Project activities that may trigger these permitting actions should be identified in the appropriate sections of the environmental document. Information regarding these permits, including application forms, can be downloaded from our web site at http://www.waterboards.ca.gov/lahontan/. Early consultation with Water Board staff is highly encouraged.
Thank you for the opportunity to comment. If you have any questions, please contact me at (760) 241-7376 [email protected]) or Patrice Copeland, Senior EngineeringGeologist, at (760) 241-7404 ([email protected]). Please send allcorrespondence regarding this Project to the Water Board's email address [email protected] and include the Project name and State Clearinghouse Number(1992012113) in the subject line.
cc: State Clearinghouse (SCH 1992012113) ([email protected]) Nick Buckmaster, CA Dept. of Fish and Wildlife ([email protected]) U.S. Army Corps of Engineers, Ventura Office ([email protected]) Louis Molina, Mono County DEHS ([email protected]) Jay Cass, Lahontan Water Board [email protected])
R:\RB6\RB6Victorville\Shared\Units\PATRICE'S UNIT\Jan\CEQA Review\Tiogalnn�DEIR.docx
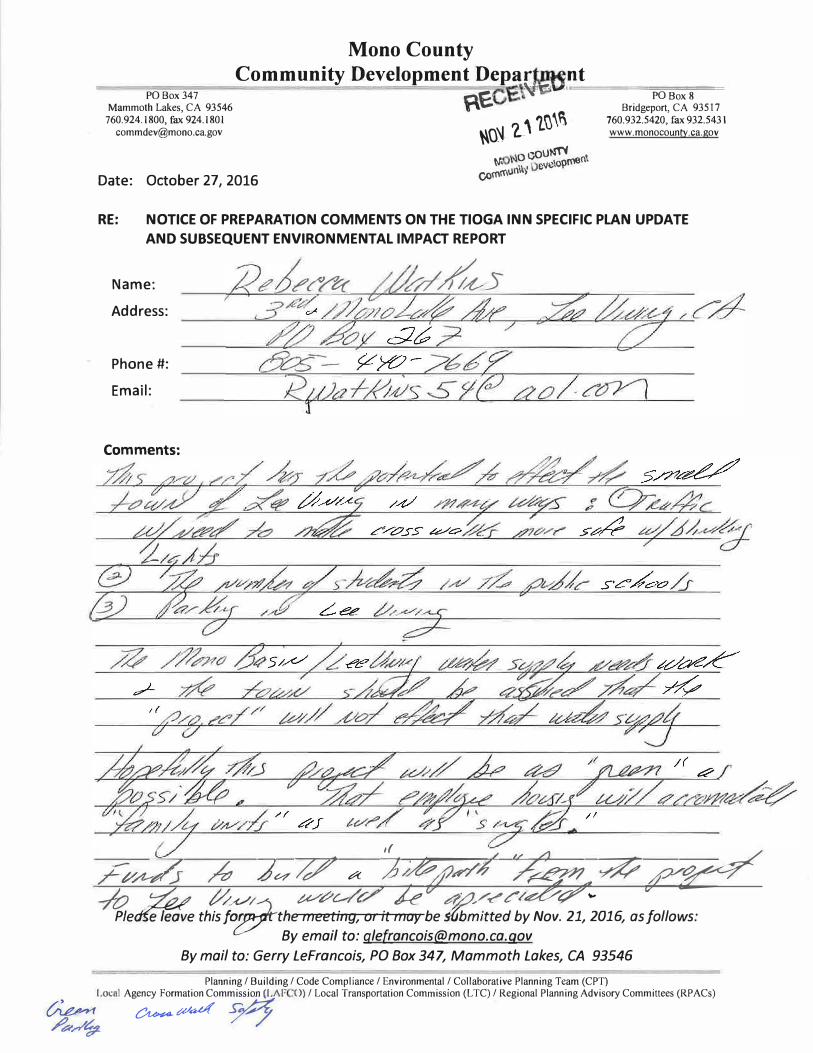
PO Box347 Mammoth Lakes, CA 93546
760.924.1800, fax [email protected]
nt
Mono County
Community Development Depar nE: �l-�'la'!=======po=so=x =8
==
n Bridgeport, CA 93517 I') <\ 1�\,� 760.932.5420, fax 932.543 I
�O�- f-.. 1 www.monocounty.ca.gov
0couN1"'
Date: October 27, 2016 M unM e11c11opment
comm
RE: NOTICE OF PREPARATION COMMENTS ON THE TIOGA INN SPECIFIC PLAN UPDATE
AND SUBSEQUENT ENVIRONMENTAL IMPACT REPORT
Name: e7 z!?t'°/7« wks Address:
Phone#:
Email:
Comments:
/-,</,A--/2 /4 :Jw V "" )z, r4' /�- ;;;e::; r� ✓o '-:/44 ��::1- ,??/??c-/1/ k 4�/-c"' c/�7 ...
Ple�e this f°J!:7• the meeting, or it may be 1ubmitted by Nov. 21, 2016, as follows:By email to: [email protected]
By mail to: Gerry Lefrancois, PO Box 347, Mammoth Lakes, CA 93546 Planning/ Building/ Code Compliance/ Environmental/ Collaborative Planning Team (CPT)
Local Agency Formation Commission (LAF 0) / Local Transportation Commission (LTC) / Regional Planning Advisory Committees (RPACs)
� c,u._�aV( 577 /4/�
From: Gerry LeFrancoisTo: Wendy Sugimura; Sandra BauerSubject: FW: Comments on SEIR and Specific Plan for Tioga Inn DevelopmentDate: Monday, November 21, 2016 2:38:15 PM
From: Wilma Wheeler [mailto:[email protected]] Sent: Monday, November 21, 2016 2:38 PMTo: Gerry LeFrancois <[email protected]>Subject: Comments on SEIR and Specific Plan for Tioga Inn Development
Dear Gerry LeFrancois,
Please accept our comments on the proposed development for Tioga Inn.
The proposed development is in an especially sensitive location as it is on the way intoYosemite Park and is high visible in the scenic Mono Basin and Mono Lake vicinity. It is veryimperative that that the project not stick out like a "sore thumb" in this scenic area. It is alsoimperative that it be developed in a way that is environmentally acceptable and be a projectthat is worthy of its site.
It is essential that this project be a result of wise and thoughtful planning. Require the latestdeveloped products including solar for heating and lighting.
Mono County is still in the midst of a severe drought so economical water use is a criticalrequirement. Consider requiring water recycling and the use of gray water for landscaping.Water use must be the minimal possible so as not to impact Mono Lake and other criticalhabitat.
Please consult with and listen to environmental organizations and informed citizens so thisproject will be one that works well for the community and its residents, as well as visitors,
Thank you for considering our comments.
Wilma and Bryce WheelerPO Box 3208Mammoth Lakes, CA 93546760 934-3764
From: susan DesBaillets [mailto:[email protected]]Sent: Monday, November 21, 2016 2:49 PMTo: Gerry LeFrancois <[email protected]>Subject: TIoga Inn Comments
Mono County Community Development DepartmentAttn: Gerry Le FrancoisP.O. Box 347Mammoth Lakes, CA 93546
RE: Comments on NOP, SEIR, and specific plan for the Tioga Inn project
I appreciate the opportunity to comment on the plans for the Tioga Inn project. My concern is the magnitude of this project and how itwill impact our community, the environment, and the viewshed. I’ve been a resident of Mono County since 1971, and the carefulplanning as well as respect for the nature of this relatively undisturbed area is of great importance to me.
As one descends Tioga Pass there is a largely undisturbed panoramic view of Mono Lake and the surrounding Mono Basin ScenicArea. Plans for a three story hotel do reduce the footprint from the original two story plan, however it will increase the vertical profileinterfering with the view. This along with a 200 seat restaurant on the highest point will further overcrowd the view.
Affordable housing for families is needed in this area, yet will the 80 unit work-force housing meet this need? This is a huge increase.Will the housing be single units or apartment style housing? I hope that every effort will be made to support the specific needs of thecommunity.
Water. How will the increase use effect the groundwater aquifers? Presently large lawns are maintained around the existing building. Iwould encourage some effort towards drought tolerant landscaping using native plants as well as reduced watering of the existing lawns,with gray water.
With the increased number of pedestrian traffic surely to follow such a project, I would encourage an effort towards designing a safepedestrian corridor between the Mobil site and the town of Lee Vining. Crosswalks and/or some structure for crossing Tioga Passshould be considered.
Lee Vining is a small community and I am concerned that the infrastructure will be severely impacted by the Tioga Inn. It seems that theplans are for an exclusive project and that will have a detrimental impact on the economy of Lee Vining. Will the fire department needto purchase new equipment to extinguishing fires on three story buildings? Will a volunteer fire department be adequate for such anincrease in structures?
I have a lot of questions and concerns about the Tioga Inn project—namely that it is a grandiose and deserves careful consideration andanalysis. The visual impact is huge as well as the effect on the local economy. I hope you will consider revisiting the scale of thisproject and working to come up with an alternative scaled down version. Please allow ample time for community input in the planningprocess.
Sincerely,Susan DesBaillets
November 21, 2016
Mr. Gerry LeFrancois And Bauer Planning & Environmental Services, Inc. Mono County Community Development Department P.O. Box 347 Mammoth Lakes, CA 93546
Dear Mr. LeFrancois,
I am a Mono Basin resident commenting on the Notice of a Subsequent Environmental Impact Report and Specific Plan for the Tioga Inn Project.
I have two substantive comment subjects with this project, one regarding the scenic considerations of the Mono Basin, and the other regarding the impact of what amounts to a substantial new housing development at the edge of Lee Vining.
Because the new Tioga Inn project proposal involves a 3-story structure and 80 units of additional private, residential housing there is the potential for significant, new scenic impacts. Given that the Tioga Crest and Mono Lake are iconic scenic locations, a full analysis of scenic impacts, including lighting, building colors, possible solar panel placement, and other associated development structures, must be fully considered from multiple vantage points along Highway 120 West, Highway 395, and from Panum Crater, South Tufa, Navy Beach and other potential, frequently-visited day use sights valuable to Mono County visitors. Of particular importance is the vantage point of South Tufa looking west with tufa towers in the foreground and the Sierra Crest beyond. This vantage point currently has little to no discernable human intrusion during day, dusk, and dawn views. This location is among the most visited, treasured, and shared locations in Mono County, and its scenic integrity looms large in the future of tourism and the quality of visitors’ experience. The spill-over lighting, direct intrusion of structures, lights, and general distraction on the horizon has potential, negative impacts from the South Tufa area. Currently, South Tufa visitation approaches 300,000 visitors a year as per Mono Lake Tufa State Reserve vehicle monitoring estimates.
The current proposed project of 80 additional housing units strikes me as a significantly new, independent project being inserted as an amendment under the existing specific plan.
Why the 4-fold increase in residential development? The project proponent has publicly stated on October 27, 2016 that these units will be “market rate” and not workforce housing. Eighty units have considerable economic, social, and environmental impacts in the region since they threaten to double the population of adjacent Lee Vining. The long-term housing implications for Mono City, Lee Vining, June Lake, Mammoth Lakes, and even Bridgeport are difficult to ascertain but must be evaluated since these units could potentially be built out of synch or without further motel development. The additional housing has the potential to radically skew market rentals, housing prices, and commuter traffic and habits. Given that the Eastern Sierra is a highly desirable place to live, and these units would be positioned to afford views and access to more affluent long or short-term renters from beyond local workforce needs, it does nothing to solve what is already a difficult and insufficient housing problem in the region. This project may in fact exacerbate the situation where more lower-income individuals/families turn to living seasonally on nearby Southern California Edison and Inyo National
Forest Land in Lee Vining and Lundy Canyon. These seasonal squatters, already a local issue, have impacts of their own, and there is a demonstrated lack of interest and capacity with SCE and the Inyo National Forest to enforce long-term camping and squatting regulations and the related waste, water, and fire-related issues. As we have seen in the history of Mono County, more market housing does not directly solve housing issues, in fact it has the real potential to force the opposite.
This project also brings the potential to double the demands on local Lee Vining Volunteer Fire Department, nearby Mono County EMS resources, and Mono County Sherriff Department, solid waste disposal services, local schools, and social services. Additional funding may come with this project, but scaling up all the aforementioned services in Lee Vining, June Lake, or Bridgeport may not be practical or even realistic.
A rough doubling of the population will also change the demands on other local services and businesses. This project will bring rapid growth to Lee Vining and will also impact traffic, parking, and pedestrian use along adjacent Highway 120 West, Highway 395, and nearby Utility Road, and local US Forest Service roads. Analysis and mitigation should address these demands.
It would be difficult to argue that the character and nature of the Lee Vining Gateway community and nearby Eastern Sierra would not change significantly. Further, the last 24 years of development history and increased tourism in the region has created the potential for more volatile changes making much of the original specific plan difficult to reckon in light of the additional and substantial specific plan amendment. There is merit to treating the 80 units of housing as a separate, independent project.
I urge you at the very least to implement the Mono Basin Community Plan and Mono County General Plan to evaluate all new changes.
Thank you for the opportunity to comment.
Sincerely,
Bartshe Miller PO Box 327 Lee Vining, CA 93541 760.648.3044
From: Claire Skinner [mailto:[email protected]]Sent: Monday, November 21, 2016 4:15 PMTo: Gerry LeFrancois <[email protected]>Subject: Mobil Mart expansion
Dear Gerry LaFrancois,
I am writing in regards to the specific plan for the proposed Tioga Inn project in Lee Vining, California,which as currently proposed would entail building a 3-story/120 bedroom hotel, staff housing with 80bedrooms, new parking lots, and expansion of the current restaurant and gas station at the currentMobil site. This site is right at the base of the road to Yosemite and the entrance to the Mono Basin.
I worked in the Mono Basin for three summers and Bishop for two summers, though I currently amlocated in Tucson. I visit the Eastern Sierra on vacation every year. I care deeply about the Mono Basinand preserving its cultural, scenic, and economic values. This area serves as the gateway to YosemiteNational Park and the Mono Lake National Forest Scenic Area, and its unique beauty is experienced bythousands of international and domestic tourists annually. I am writing to encourage you to only let theproposed Tioga Inn development occur if they meet the highest possible standards for green buildingand low visual impacts, and develop in a way that is responsible in its population and cultural impact onour community.
The community of Lee Vining needs affordable housing, but the proposed development of 80 unitswould increase the population of Lee Vining by 54%! This is conservatively assuming a1.5 personoccupancy per unit (120 people total). Lee Vining’s population was 222 people in 2010 (U.S. Census,2010). Adding 120 more people would increase the population of the entire Mono Basin by 30%, asMono City and Lee Vining combined totaled 394 people in 2010 (U.S. Census, 2010).
Adding this many people to the Mono Basin would have a major impact on our schools and othercommunity services. Drawing hundreds of people to a self-contained resort outside of town maynegatively impact businesses in town. More residents, along with a 120 room hotel, would alter ourquality of life, for example by increasing traffic. The turn from Highway 120 to 395 at the Mobil isalready dangerous and this project would increase the traffic by hundreds of cars a day. I encourage youto cap the number of residences at 40, which would represent a more reasonable, though still large,22% increase in Lee Vining’s population and 15% increase for the whole Mono Basin. I reiterate thataffordable housing is needed, but not 80 units. At the least I recommend further study of how manyunits are actually needed and what impact they would have on the community, i.e. how much housingcurrently exists in Lee Vining to accommodate laborers at the new hotel?
A development of this size will also be resource intensive. This project may not be terribly large by thestandards of urbanized places, but it will dramatically increase the amount of energy and waterconsumed in the Mono Basin. I urge you to minimize this impact by requiring the building meet thehighest standards for green building and low visual impact. There is currently a movement underway todesignate the Mono Basin a climate-friendly community (see 350.org Mono Basinchapter; https://www.facebook.com/350MONO/ ) that sets an example for the world of how we canadapt to and prevent climate change. Making sure this development project meets the highest possiblestandards for sustainability will be a significant step in realizing the plan to make the Mono Basin aworld-wide example for climate-change resilience.
Therefore I urge you to only allow the Tioga Inn development if it requires:1. Enough solar installation and energy saving design elements to be a net zero energy user, andplatinum LEED certified as well as exceeding the requirements of Title 24 of the State energy code.2. A cutting-edge, gray water recycling and black water dispersal system

3. Native, drought-tolerant landscaping4. Outside lighting should also be muted and pointed downwards to preserve our night skies.5. Two or three apartment style building for staff housing, which would be much more energy and land-use efficient than the currently proposed 80 small cabins. These apartments should also include passivesolar, good southern sun exposure, and gray and black water systems to make them as efficient aspossible.
These reasonable requirements will substantially minimize the negative impacts on the environmentand community, in this very special place beloved by locals and thousands of people worldwide. Ouractions now signal to our local communities and the world how we will proceed into a future in whichwe are resilient to climate change, and respectful of local communities and the environment.
Sincerely,Claire SkinnerTucson, Arizona
MONO LAKE C O M M I T T E E
P.O. Box 29Hwy 395 a t Th i rd S t ree tLee V in ing , CA 93541
P h on e ( 76 0 ) 64 7 -6 59 5
F a x ( 76 0 ) 64 7 -6 3 77
Board of DirectorsChair:Sally Gaines
Martha DavisVireo Gaines Schil lerDavid KannerRichard LehmanGina RadieveTom SotoSherryl TaylorDoug VirtueKristine Zeigler
Directors EmeritiHelen GreenEd GrosswilerGenny Smith
Executive DirectorGeoffrey McQuilkin
Southern California Office1718 Wellesley AvenueLos Angeles, CA90025-3634
On the Internetmonolake.orgmonobasinresearch.org
November 21, 2016
Mr. Gerry LeFrancois And Bauer Planning & Environmental Services, Inc. Mono County Community Development Department P.O. Box 347 Mammoth Lakes, CA 93546
Subject: Comments on the Notice of Preparation of a Subsequent Environmental Impact Report and Specific Plan for the Tioga Inn Project
Dear Mr. LeFrancois:
The Mono Lake Committee (MLC) is writing to provide comments on the scope and content of environmental information that will be reflected in the forthcoming Subsequent Environmental Impact Report (SEIR) for the Tioga Inn Project.
The MLC is a non-profit citizen’s group dedicated to protecting and restoring the Mono Basin ecosystem, educating the public about Mono Lake and the impacts on the environment of excessive water use, and promoting cooperative solutions that protect Mono Lake and meet real water needs without transferring environmental problems to other areas. Supported by 16,000 members, the MLC has been active in the Mono Basin since 1978.
The Tioga Inn Specific Plan and Final Environmental Impact Report were finalized and approved in May 1993, however the California Environmental Quality Act (CEQA) requires Mono County Community Development Department (the County) to prepare a SEIR “when warranted by changed project circumstance, the availability of new information, potential for new environmental effects, and potential for new mitigation measures and/or project alternatives to reduce significant effects.” The County has explained that the primary trigger for a SEIR is that the project proponent, Dennis Domaille, is proposing new additions to the project that were not included in the 1993 Specific Plan. MLC believes that current scoping analysis should include evaluating not only the new proposed land uses but also certain components of the entire project.
Water supply, water quality, and waste water management
The SEIR must analyze water supply sources and the impacts to Lee Vining Creek and spring/aquifer recharge below the project property. This analysis and groundwater testing should be done during all seasons and projections should be made into the future and take into consideration continuing—or more severe—drought conditions. The previous technical reports that supported the 1993 Specific Plan were lacking some analyses recommended by the Kleinfelder report, and are now outdated. The pump test will need to be redone and supplemented with a geologic analysis. The County should consider doing the geologic and pump test analysis together, which is not commonly done, but is
the best way to understand the aquifer, especially in complex situations; the presence of the Mono Lake Fault makes this a complex situation. Assumptions for pump test calculations are ideal and rarely seen on the ground, and a geologic analysis is an important check on those assumptions. The validity of each assumption must be disclosed and discussed, including whether the well has fully recovered from pumping prior to the test, whether the test is drawing water from another source, whether the aquifer is confined, etc.
Specific quantity details should be provided for expected water pumping, greywater disposal, and septic disposal, and should include maximum, minimum, and average amounts on a monthly basis. Comparison to current usage rates for the existing business and residential units should be included.
Water quality testing should be done in conjunction with an evaluation of water supply to ensure that a stable source for the planned development is there now and into the future. Lee Vining is already experiencing water quality and supply impacts and has been pursuing a secondary source of quality water to meet needs of residents and visitors—especially when fire suppression crews are stationed in Lee Vining and the town’s usage doubles—and to meet mandatory State requirements for a back-up water supply source.
The project proponent has stated a commitment to incorporating a greywater system to supplement a septic tank and leach field system. At the Scoping Meeting in October in Lee Vining, Mr. Domaille explained that the greywater system would provide water to the landscaping that he has planned for the hotel and restaurant grounds. The County should analyze the actual water needs and requirements of the proposed landscaping (see comments related to type of landscaping below) and compare that to the amount of greywater produced by the hotel, restaurants, and current and proposed housing units. If native landscaping is done, MLC believes there may be excess water available after vegetation needs (especially in the winter months) and where that water will go must be addressed. Will a septic tank also be necessary? Vegetation on adjacent parcels to the project should not receive an abnormal amount of water as that would be detrimental. Greywater systems have many specific requirements including that they need to be subsurface with no visible water above ground. How will this be accomplished with the landscaping plan? A call for a detailed landscaping plan should be required as part of the SEIR.
The Lahontan Regional Water Quality Control Board should be contacted for scoping comments to ensure their agency requirements are incorporated early in the process. With a significant amount of additional paving presumably required for the hotel, restaurants, and additional housing units, runoff issues will need to be addressed and planned for to reduce impacts. Potential mitigation measures should be considered and evaluated as part of the SEIR.
Scenic qualities of the Mono Basin
The Mono Basin has long been valued for the expansive vistas and unique open-space landscape of the Sierra escarpment, Mono Lake, and the western edge of the Great Basin. These scenic qualities are recognized and treasured by residents and visitors alike and have resulted in specific protections including the Mono Basin National Forest Scenic Area (the first designated Scenic Area in the nation) and specific guiding language in both the Mono Basin Community Plan and the Mono County General Plan.
The proposed project site is adjacent to the Scenic Area boundary (just across the highway) and while not directly affected by the Scenic Area Management Plan’s specific guidelines and prescriptions, they are worth noting given the proximity. The project will be potentially visible from Scenic Area lands that are a prime destination of Mono Basin visitors and the SEIR should evaluate the project’s visibility, both in daytime and at night due to lighting, and consider possible mitigations from the following key visitor locations: 1) Mono Basin National Forest Scenic Area Visitor Center, 2) Old Marina, 3) South Tufa, and

4) the Mono Lake Tufa State Natural Reserve boardwalk at Mono Lake County Park. While these site aredistant from the project, current conditions provide for expansive scenic views and changes from thiscondition would be significant and should be evaluated for mitigation. Visual impacts from Lee ViningCanyon, Lee Vining, and Mono City should also be analyzed. Visual simulations should be a majorcomponent of the draft SEIR so that the true visual impacts can be represented to the public. Simulationsshould include nighttime photos that capture the impacts from increased lighting. The project should alsobe analyzed for its conformance to the Mono County Night Sky ordinance.
The project is immediately adjacent to State Route 120 that leads to the east entrance of Yosemite National Park. Both Highway 395 and State Route 120 (outside of Yosemite) are currently being considered for Scenic Byway designation. This Federal Highway Administration designation recognizes roads for one or more of six qualities: archeological, cultural, historic, natural, recreational, and scenic. This project is located at the junction of Highway 395 and 120 and therefore within a future Scenic Byway corridor, if designated. Proactive steps throughout the development process should reflect this potential designation.
Two major project elements should be analyzed for visual impacts. First, the change from a two-story hotel to three stories. Second, and less discussed, is the housing complex, which is located in a potentially highly-visible area and is less clearly defined in terms of height and size.
Design components that the developer chooses to use for the hotel and/or the housing could cause additional significant impacts. These include the color of structures, roofing materials used, anything that is reflective, and the amount and type of lighting used (even downward lighting will “glow” in the night sky). Because the proponent plans to lease or sell a large portion of the project to a hotel developer, a stringent design review process should be required. This process should include an additional public comment period and approval by the Mono County Planning Commission and the Board of Supervisors.
Natural environment
The proposed project is at the lower end of Lee Vining Canyon and as close as 750 feet to Lee Vining Creek. Lee Vining Canyon is rich in a variety of wildlife including deer, bear, coyote, and mountain lion. Increasing the amount of people in this area will need to be studied for impacts to resident and migratory wildlife populations. Studies done for the 1993 Specific Plan need to be updated as many wildlife patterns have changed in response to drought and climate change. If the hotel operates year-round as planned, impacts to animal populations during winter months will also need to be studied. The creek corridor is a natural corridor for many of these animals and the potential to displace them needs to be studied.
It appears that the proposed plan eliminates the deer herd open space migration route required in the 1993 plan. New mitigation will need to be analyzed and developed in coordination with the California Department of Fish & Wildlife. Reducing the current development footprint should be analyzed as an option.
The effects of the project on the natural landscape of Lee Vining Canyon also include how recreational use and the visitor experience will change and be affected. Coordination with the Inyo National Forest will be necessary.
Lee Vining Canyon is a place valued for its scenic beauty and natural, wild habitat. Impacts to Lee Vining Canyon should be analyzed and they include: impacts to current recreational use carrying capacities; impacts to resident and migratory wildlife; and impacts to the current visitor experience of solitude. Coordination with both Yosemite National Park and Inyo National Forest should occur.

Landscaping analysis
The SEIR should analyze and compare various landscaping options for their overall effect on the project. Options range from exclusively using native plants and trees so that the area blends in with the natural landscape to incorporating non-native grasses and shrubs to appeal to visitors and non-native trees to shield the structures and provide another type of aesthetic. There are pros and cons to each and the degree of landscaping also directly ties into the greywater system issues described above.
Growth impacts
The size and capacity of this project will easily double the current population of Lee Vining. Additional studies need to analyze the effects on current businesses and the economic stability of Lee Vining.
The project is proposing to change the amount and type of housing from 10 workforce housing units to 80 non-workforce housing units. This is a huge shift from the 1993 Specific Plan which states that the residential area will “consist of five, two-bedroom one-story duplexes” and that the “Mono County Housing Element requires that development of this type provide opportunities for employee housing.” At the October Scoping meeting, the proponent explained that the 80 proposed units would not be “workforce housing” and that he would charge fair market value for the units. New housing in a gateway community to Yosemite could attract long-term renters who do not intend to reside at the site but instead use the unit for Yosemite access, vacations, family events, etc. The housing could also potentially be used for short-term and nightly rentals such as Airbnb and VRBO. This could cause actual project employees to search for housing in already-at-capacity adjacent housing locations such as Lee Vining, Mono City, and June Lake. The project could help to alleviate or could exacerbate housing shortages in the region, and so the impacts of the change from dedicated workforce housing to market rental units needs to be studied and analyzed. It appears as though, with this shift from 10 workforce housing units to 80 market-rate housing units, that the proponent is using the project to create a housing subdivision outside of Lee Vining. It should be noted that with the finalization of the Tuolumne River Plan, Yosemite National Park does not need local employee housing for Tuolumne staff as was once being explored.
Increasing the population of Lee Vining—in terms of both residents and visitors—will put a strain on Mono County and public services, such as Lee Vining Fire Department, Mono County Paramedics, Mono County Sherriff Department, and local schools. The Lee Vining Fire Department is currently staffed with volunteers. Could this continue under the new project? Do volunteers, who leave their own jobs and businesses when calls come in, have the capacity to handle an increased load of medical and emergency calls? This should be considered and, if not, then the cost of a paid fire department would need to be analyzed. Also, Lee Vining Fire Department has expressed concerns that their equipment cannot reach a three-story building. If new equipment was purchased, then it is likely a new fire station would need to be built to house the new, larger vehicles. New training requirements for volunteers to operate such equipment could be substantial. All of these impacts need to be studied and various alternatives analyzed, including limiting the hotel to two stories while maintaining the current footprint.
Project impacts will also include impacts to the town of Lee Vining. Additional visitors and workforce staff will exacerbate existing parking problems. Increased traffic could result in the need for a stoplight at the busy intersection of Highways 395 and 120. Crossing Highway 395 as a pedestrian in town is already dangerous and is something the community has been trying to resolve for several years—increased traffic from the project would exacerbate this problem.
Connectivity from the project site to Lee Vining will need to be addressed from an infrastructure, safety, and economic perspective. Parking and traffic impacts could be mitigated through construction of pedestrian and bicycle linkages between the site and Lee Vining, and these should be studied in the SEIR.
Mitigation measures should include the construction of new infrastructure measures, such as overcrossings and trails, to enable safe pedestrian mobility.
Climate change
The draft SEIR should update all appropriate sections of the Specific Plan related to federal, state, and local climate change development requirements including, but not limited to, appropriate water conservation measures and greenhouse gas emissions. The proponent stated that the hotel and housing units would have wood-burning fireplaces. If used as a primary heating source this amount of additional woodstove smoke could have a significant impact on current air quality in the local area, especially in winter when there is often a cold air inversion that prevents the smoke from rising, keeping it closer to ground levels.
During the design review process, which should be a public process and occur before final project approval, conservation measures can be outlined in greater detail. Implementing a greywater system, including solar panels, locating structures to take advantage of passive solar, installing low-flow toilets, low-flow showerheads, and calculating the water requirements and developing a plan for swimming pool wastewater will all need to be evaluated in greater detail and included in the draft SEIR.
The proponent should consider pursuing a hotel developer that would build a LEED Certified project. Given the location of the project, this would likely be an attractive marketing approach and likely address many of the concerns related to the scope of this project.
Compliance with the Mono Basin Community Plan
The Mono Basin Community Plan, finalized in 2012 after years of community meetings and discussions, should be used to guide all aspects of the draft SEIR process. The Mono Basin Community Plan “is a community-based planning effort intended to guide future land-use, development, and quality-of-life decisions. The purpose of the plan is to inform decision makers at the community and local government levels, as well as other agencies, businesses and entities operating in the Mono Basin, about the needs and aspirations of the community.”
Specific relevant points include:
Issues/Opportunities/Constraints (p. 15)
1. Residents express conflicting sentiments about additional growth. The concept of a sustainable,successful economy is supported, but the fear is that communities will need to become too big or“citified” to achieve this, sacrificing the rural characteristics and healthy natural environmentvalued by residents. The challenge is to appropriately balance economic development goals withthe desired rural community characteristics and protection of the natural, scenic, historical andrecreational values of the area. Growth does not necessarily mean becoming bigger; it could alsomean improving what already exists within the current development footprint.
4. Workforce housing opportunities, both to rent and buy, are needed to sustain the existingcommunity and enable people to live where they work.
10. The physical layout of Lee Vining’s Main Street area, where a five-lane highway under theauthority of Caltrans bisects the corridor, creates challenges for establishing a vibrant, walkablecommercial area, ensuring safe and convenient pedestrian crossings, and creating physicalconnectivity between the east and west sides of the highway.

Goal 1: Maintain the spectacular natural values of the Mono Basin and rural, small-town character of communities by managing growth, ensuring high-quality aesthetics, and providing for community development needs to enhance the quality of life for residents. (p.17)
Objective A: Provide for the orderly growth of Lee Vining in a manner that retains the small-town character by directing future development to occur in and adjacent to Lee Vining. (p.17)
Policy 1: Prioritize infill and rehabilitation of the existing built environment over the addition of private property.
Objective C: Encourage building types and architectural design compatible with the scenic and natural attributes of the Mono Basin. (p.18)
Policy 1: Maintain a clear edge between developed areas and open space by ensuring future development outside existing communities is compatible with the scenic and natural attributes of the area.
Policy 2: Support design practices that protect scenic vistas, energy efficiency, and “green” building practices.
Action 2.1: Encourage the siting and design of buildings to preserve scenic vistas.
Action 2.2: Designate public view corridors that visually connect the community to the natural environment and establish development standards to avoid impacts.
Action 2.3: Explore potential incentives related to energy efficiency and “green” building practices.
Policy 3: Preserve the dark night sky of the Mono Basin.
Action 3.1: Require compliance with and enforce Dark Sky Regulations.
Policy 4: Support improving the visual appearance of Lee Vining.
Action 4.1: Use Mono County Design Guidelines to promote architecture, site planning, and uses compatible with the surrounding visual and scenic environment within the communities of Lee Vining and Mono City.
Objective D: Maintain, protect and enhance the natural, historical and recreational attributes of the Mono Basin. (p.19)
Policy 3: Support recreational activities and the ability to use and enjoy the land while also protecting the natural environment.
Action 3.3: Ensure new development does not impede, and preferentially enhances, existing recreation access and activities.
Policy 6: Work with government and private property owners to create recreational trail segments connecting population centers with attractions and recreation access points.
Action 6.1: Identify desired trail segments that are supported by the community, and implement trail development.
Action 6.2: Identify and consider impacts to historic lifestyles and existing uses of any potential trail, and consult with the Kutzadika Tribe in particular.
Objective E: Promote well-planned and functional community uses that retain small-town character and increase quality of life. (p.21)
Policy 1: Increase the housing supply available to the workforce, including rental units.
Policy 6: Provide safe and convenient pedestrian and biking facilities, working with Caltrans when applicable, to reduce vehicular traffic, increase local livability, and encourage visitors to explore town.
Action 6.1: Prioritize pedestrian safety facilities and improvements on Highway 395 over other facility improvements and as consistent with goals and policies in the Circulation Element of the General Plan, with an emphasis on the Livable Communities section, and Objectives A and D in the Mono Basin Policies. (See Appendix A.)
Action 6.2: Emphasize safe travel for pedestrians to community and activity centers, such as schools, parks, library, museums and visitor centers.
Action 6.4: Initiate community discussions to consider pedestrian and street lighting in appropriate locations for safety, connectivity, and comfort and ensure compliance with Dark Sky Regulations.
Action 6.5: Pursue the Livable Communities goals and policies in the Circulation Element of the General Plan.
Objective F: Provide appropriate public infrastructure and service capability expansion to support development, public safety, and quality of life. (p.24)
Policy 1: Future development should coincide with infrastructure and service capability expansion.
Action 1.1: Require development projects to obtain “will-serve” letters from applicable service agencies.
Policy 2: Support improvements to local service infrastructure, such as water, sewer, telecommunications, and electricity, that is compatible with the small-town character, aesthetic values, and the health and safety of the community.
Action 2.1: Inventory local infrastructure needs and provide support to service providers as appropriate.
Action 2.2: Require utility line upgrades and replacements to be undergrounded subject to the findings and analysis required for new utility lines in Chapter 11 – Utilities of the Land Use Element.
Action 2.3: Where feasible, require local utility providers to underground, relocate or visually screen power lines and other facilities in areas of high visual quality.
Policy 3: Provide for adequate emergency services, facilities, and access, and support emergency providers.
Compliance with the Mono County General Plan
When the Specific Plan was approved in 1993 there were different General Plan requirements. As part of the process going forward, both the Specific Plan and new project components need to be updated under the new General Plan requirements. A chart or table might be helpful to show the necessary changes.
Conclusion
Thank you for the opportunity to comment. MLC looks forward to working with Mono County and the proponent to ensure that revisions to the 1993 Specific Plan are in accordance with all state, federal, and local regulatory guidelines and requirements. MLC will also work to ensure that the final plan reflects recent changes in both the natural environment of the area and the needs of local residents and visitors.
Please contact me at (760) 647-6595 or [email protected] if you have any questions.
Sincerely,
Lisa Cutting Eastern Sierra Policy Director
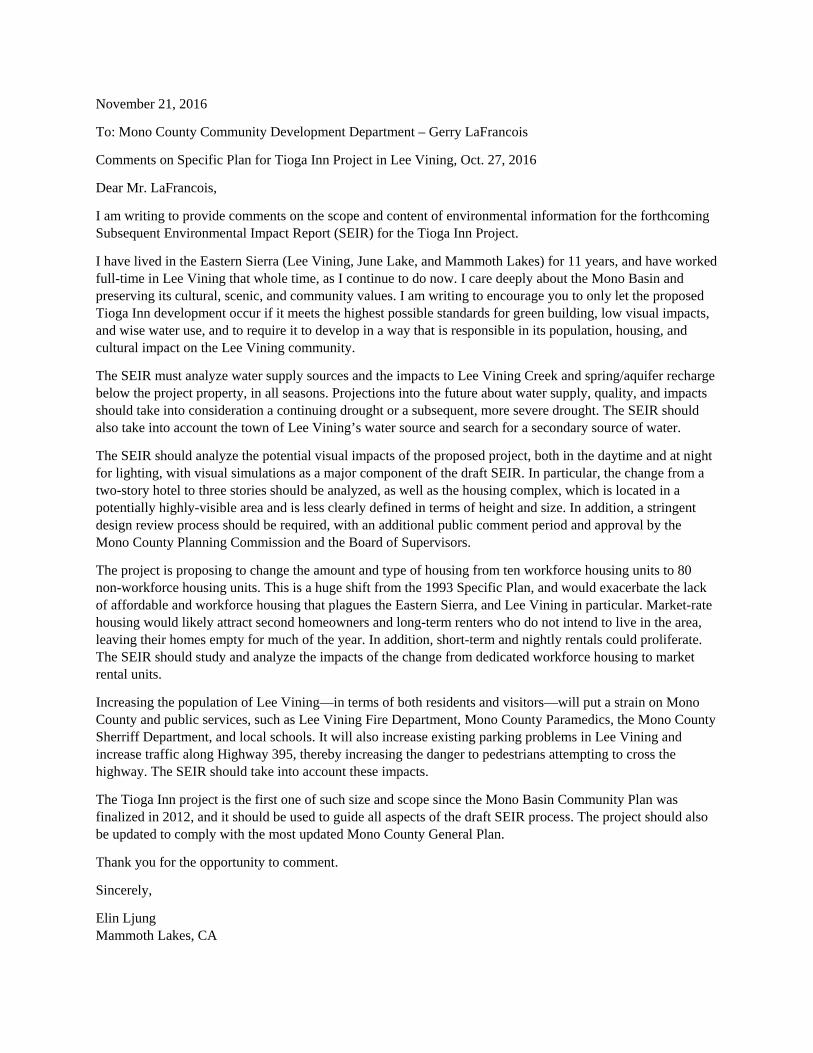
November 21, 2016
To: Mono County Community Development Department – Gerry LaFrancois
Comments on Specific Plan for Tioga Inn Project in Lee Vining, Oct. 27, 2016
Dear Mr. LaFrancois,
I am writing to provide comments on the scope and content of environmental information for the forthcoming Subsequent Environmental Impact Report (SEIR) for the Tioga Inn Project.
I have lived in the Eastern Sierra (Lee Vining, June Lake, and Mammoth Lakes) for 11 years, and have worked full-time in Lee Vining that whole time, as I continue to do now. I care deeply about the Mono Basin and preserving its cultural, scenic, and community values. I am writing to encourage you to only let the proposed Tioga Inn development occur if it meets the highest possible standards for green building, low visual impacts, and wise water use, and to require it to develop in a way that is responsible in its population, housing, and cultural impact on the Lee Vining community.
The SEIR must analyze water supply sources and the impacts to Lee Vining Creek and spring/aquifer recharge below the project property, in all seasons. Projections into the future about water supply, quality, and impacts should take into consideration a continuing drought or a subsequent, more severe drought. The SEIR should also take into account the town of Lee Vining’s water source and search for a secondary source of water.
The SEIR should analyze the potential visual impacts of the proposed project, both in the daytime and at night for lighting, with visual simulations as a major component of the draft SEIR. In particular, the change from a two-story hotel to three stories should be analyzed, as well as the housing complex, which is located in a potentially highly-visible area and is less clearly defined in terms of height and size. In addition, a stringent design review process should be required, with an additional public comment period and approval by the Mono County Planning Commission and the Board of Supervisors.
The project is proposing to change the amount and type of housing from ten workforce housing units to 80 non-workforce housing units. This is a huge shift from the 1993 Specific Plan, and would exacerbate the lack of affordable and workforce housing that plagues the Eastern Sierra, and Lee Vining in particular. Market-rate housing would likely attract second homeowners and long-term renters who do not intend to live in the area, leaving their homes empty for much of the year. In addition, short-term and nightly rentals could proliferate. The SEIR should study and analyze the impacts of the change from dedicated workforce housing to market rental units.
Increasing the population of Lee Vining—in terms of both residents and visitors—will put a strain on Mono County and public services, such as Lee Vining Fire Department, Mono County Paramedics, the Mono County Sherriff Department, and local schools. It will also increase existing parking problems in Lee Vining and increase traffic along Highway 395, thereby increasing the danger to pedestrians attempting to cross the highway. The SEIR should take into account these impacts.
The Tioga Inn project is the first one of such size and scope since the Mono Basin Community Plan was finalized in 2012, and it should be used to guide all aspects of the draft SEIR process. The project should also be updated to comply with the most updated Mono County General Plan.
Thank you for the opportunity to comment.
Sincerely,
Elin Ljung Mammoth Lakes, CA
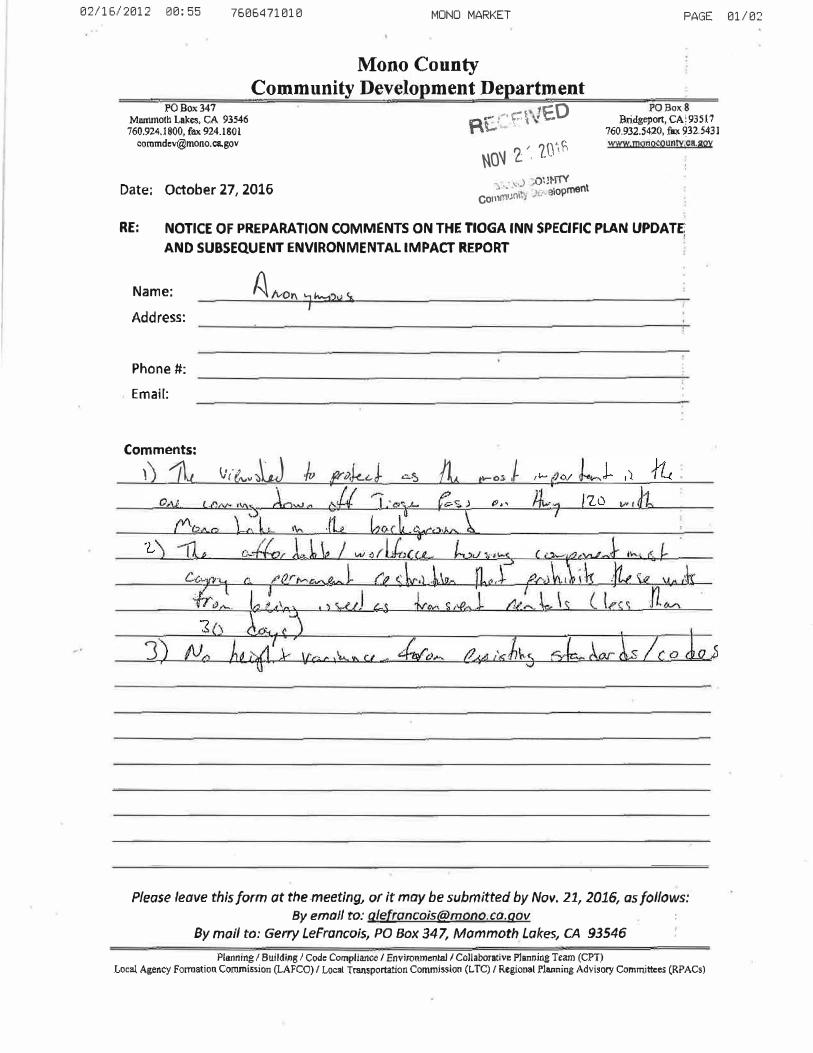
02/15/2012 00:55 7505471010 MONO MARKET
Mono County Community Development Department
J>0Box347 Mmrunoth Lakes, CA 93546 760.9Z4.l800, fllx 924.180l
Date; October 27, 2016
0 .... ,,. r::tJED
nt:.: ·, ' ()_ I ?IJ't�
�o� '-.
. ·-.:,) omm' ·.:;,Jnl J,;, • \opment
co11, .. ,
PAGE 01/02
POBox:8 Bridgeport, CA! 93 5 l 7
760.932.5420, f&ll �32.5431 WWWJilq,jOCOUnty;ca.goY
RE: NOTICE OF PREPARATION COMMENTS ON THE TIOGA INN SPECIFIC PLAN UPDATE;
AND SUBSEQUENT ENVIRONMENTAL IMPACT REPORT
Name:
Address:
Phone#:
Email:
A Ivon. 1 ½l'N �
Comments:
') 1l V('&,v�W }v f:tJk,t:.,� �� {Iv, t\-o!. ,t
J
Please leave this form at the meeting, or it may be submitted by Nov. 21, 2016, as follows: By email to: [email protected]
By mail to: Gerry Lefrancois, PO Box 347, Mammoth Lakes, CA 93546 Plwining/ Building/ Code Compliance/ Environmental/ Collaborative Planning Team (CPT)
Local, Agency Formation Cornmi5sion (LAFCO) I Local Tl"!lll5portation CommJssion (LTC) I Regional .Planning Advisory Committees (RPACs)

From: Scott BurnsSent: Monday, November 21, 2016 9:56 AMTo: Gerry LeFrancois <[email protected]>; Wendy Sugimura <[email protected]>Subject: Anonymous Oral Comment - Tioga
FYI:
Requests that PC and BOS conduct site visit during project consideration
Concern with number of housing units – density concerns due to traffic and deer use patterns
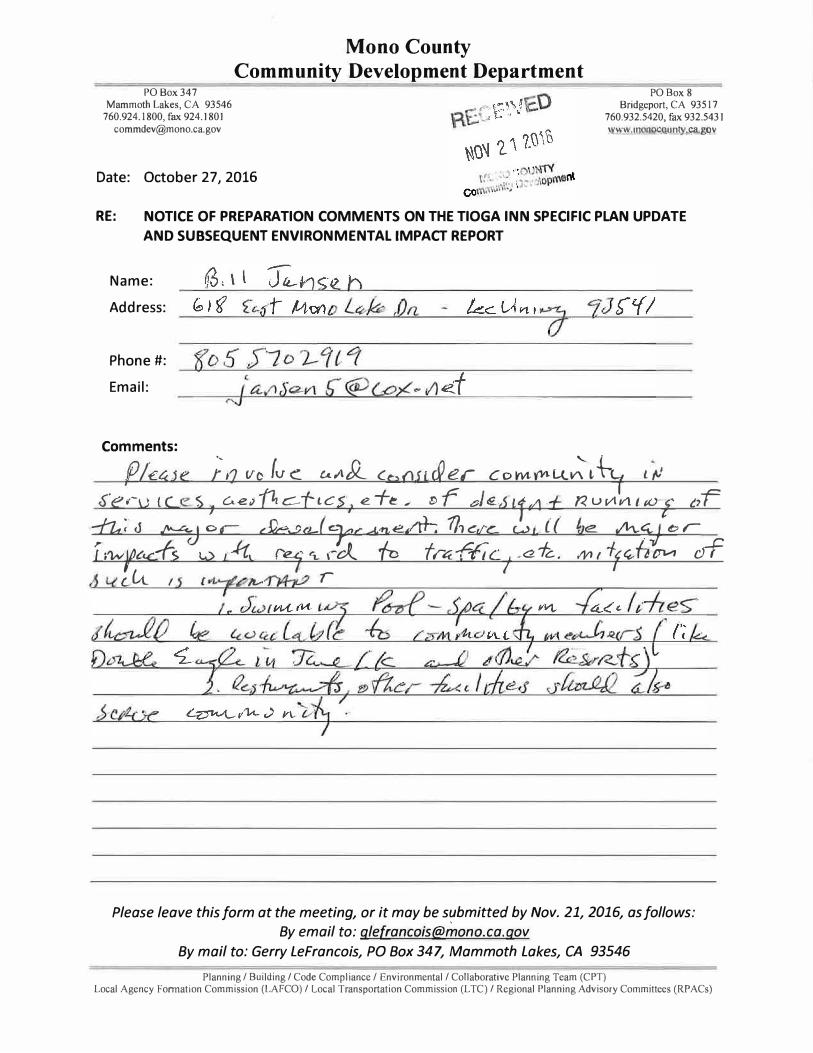
Mono County
Community Development Department PO Box 347
Mammoth Lakes, CA 93546 760.924.1800, fax 924.1801
Date: October 27, 2016
PO Box 8 Bridgeport, CA 93517
760.932.5420, fax 932.5431 �1WI .m [email protected] ,�()_)'
RE: NOTICE OF PREPARATION COMMENTS ON THE TIOGA INN SPECIFIC PLAN UPDATE
AND SUBSEQUENT ENVIRONMENTAL IMPACT REPORT
Name:
Address:
Phone#:
Email:
Comments:
Please t',1 Vo Ive Le.A� c_C>O,a&ec Con,1.y¾L{.�t't-7 Lµ
�-e ,-u { C,,, $ J
C.,e ,((} C-t t Cs , e. Tl! , D r �J �sit tLl ·+ l< u vt n t d) r {'/ fi
t
� ;· <l J\'-.Lc.-J o c &..20-Cc:y,
r: ,..,t'!tte/rl--: 1h e:ra:: w 1 { ( �e.. At::\. I or { vwp4G+s Ly { !ti '?If rl.. rol {o t r4-ff; cl ,a 1-c_, i1ll I ff� h � crf
c.,Lt_ I Jt.,,. I
Please leave this form at the meeting, or it may be s�bmitted by Nov. 21, 2016, as follows:
By email to: [email protected]
By mail to: Gerry LeFrancois, PO Box 347, Mammoth Lakes, CA 93546
Planning/ Building/ Code Compliance/ Environmental/ Collaborative Planning Team (CPT) Local Agency Formation Commission (LAFCO) / Local Transportation Commission (L TC)/ Regional Planning Advisory Committees (RPACs)

APPENDIX B
2012 Director Review 12-007
Tioga Inn Kitchen Expansion

Mono County
Community Development Department P.O. Box 347
Mammoth Lakes, CA 93546
(760) 924-1800, fax 924-1801
Planning Division P.O. Box 8 Bridgeport, CA 93517
(760) 932-5420, fax 932-5431
www.monocounty.ca.gov
Planning / Building / Code Compliance / Environmental / Collaborative Planning Team (CPT) Local Agency Formation Commission (LAFCO) / Local Transportation Commission (LTC) / Regional Planning Advisory Committees (RPACs)
NOTICE OF DECISION
DIRECTOR REVIEW 12-007/Tioga Inn Kitchen Expansion
APPLICANT: Dennis Domaille, Tioga Gas Mart
SUBJECT PROPERTY: APN 021-080-014, 22 Vista Point Drive, Lee Vining, CA
PROPOSAL FOR: A 316 square feet kitchen expansion at the Tioga Gas Mart. The property is part of the
Tioga Inn Specific Plan.
Pursuant to the Tioga Inn Specific Plan and Mono County General Plan Section 31.010, and based upon the
following findings, you are hereby notified that Director Review 12-007 has been:
Granted as requested.
XX Granted subject to the attached Conditions of Approval.
Denied.
BACKGROUND
Director Review permit 12-007 would permit the expansion of the kitchen by 316 square feet. The Specific
Plan allows for a hotel, full service restaurant, a residential area, and a convenience store and gas station.
The Tioga Inn Specific Plan was approved in 1993 and amended in 1995 and 1997. The 1997 Specific Plan
amendment permitted a 1,500 square foot apartment on the convenience store and gas station parcel, approved a
master sign program, a lighting plan, permitted a public restroom/shower/laundry facility on the Hotel parcel,
and clarified that any future restaurant is to be constructed on the flat area of restaurant parcel.
Hwy 395 & SR
120
to the Community of Lee
Vining
Project Location
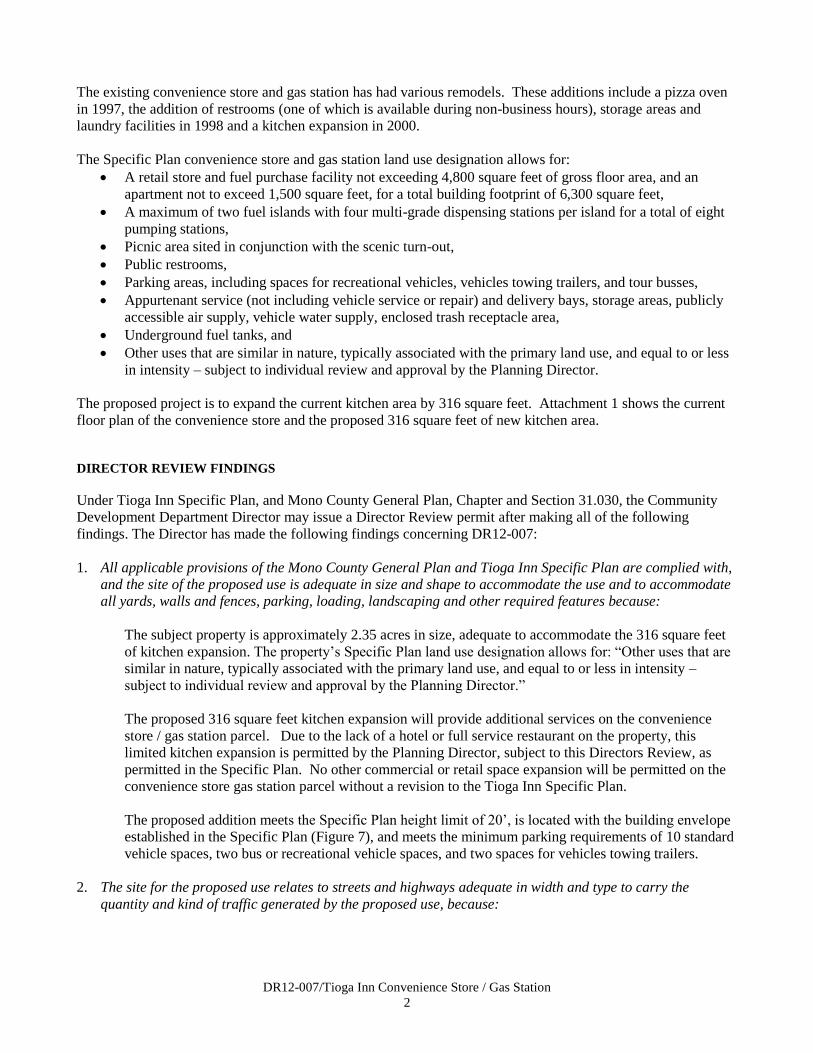
DR12-007/Tioga Inn Convenience Store / Gas Station
2
The existing convenience store and gas station has had various remodels. These additions include a pizza oven
in 1997, the addition of restrooms (one of which is available during non-business hours), storage areas and
laundry facilities in 1998 and a kitchen expansion in 2000.
The Specific Plan convenience store and gas station land use designation allows for:
A retail store and fuel purchase facility not exceeding 4,800 square feet of gross floor area, and an
apartment not to exceed 1,500 square feet, for a total building footprint of 6,300 square feet,
A maximum of two fuel islands with four multi-grade dispensing stations per island for a total of eight
pumping stations,
Picnic area sited in conjunction with the scenic turn-out,
Public restrooms,
Parking areas, including spaces for recreational vehicles, vehicles towing trailers, and tour busses,
Appurtenant service (not including vehicle service or repair) and delivery bays, storage areas, publicly
accessible air supply, vehicle water supply, enclosed trash receptacle area,
Underground fuel tanks, and
Other uses that are similar in nature, typically associated with the primary land use, and equal to or less
in intensity – subject to individual review and approval by the Planning Director.
The proposed project is to expand the current kitchen area by 316 square feet. Attachment 1 shows the current
floor plan of the convenience store and the proposed 316 square feet of new kitchen area.
DIRECTOR REVIEW FINDINGS
Under Tioga Inn Specific Plan, and Mono County General Plan, Chapter and Section 31.030, the Community
Development Department Director may issue a Director Review permit after making all of the following
findings. The Director has made the following findings concerning DR12-007:
1. All applicable provisions of the Mono County General Plan and Tioga Inn Specific Plan are complied with,
and the site of the proposed use is adequate in size and shape to accommodate the use and to accommodate
all yards, walls and fences, parking, loading, landscaping and other required features because:
The subject property is approximately 2.35 acres in size, adequate to accommodate the 316 square feet
of kitchen expansion. The property’s Specific Plan land use designation allows for: “Other uses that are
similar in nature, typically associated with the primary land use, and equal to or less in intensity –
subject to individual review and approval by the Planning Director.”
The proposed 316 square feet kitchen expansion will provide additional services on the convenience
store / gas station parcel. Due to the lack of a hotel or full service restaurant on the property, this
limited kitchen expansion is permitted by the Planning Director, subject to this Directors Review, as
permitted in the Specific Plan. No other commercial or retail space expansion will be permitted on the
convenience store gas station parcel without a revision to the Tioga Inn Specific Plan.
The proposed addition meets the Specific Plan height limit of 20’, is located with the building envelope
established in the Specific Plan (Figure 7), and meets the minimum parking requirements of 10 standard
vehicle spaces, two bus or recreational vehicle spaces, and two spaces for vehicles towing trailers.
2. The site for the proposed use relates to streets and highways adequate in width and type to carry the
quantity and kind of traffic generated by the proposed use, because:

DR12-007/Tioga Inn Convenience Store / Gas Station
3
The proposed project is located on Vista Point Drive with access to State Route 120 (Tioga Pass). The
proposed kitchen addition will not create impacts to surrounding streets or to Highway 120. The
project has existing encroachment permits with Caltrans District 9.
3. The proposed use will not be detrimental to the public welfare or injurious to property or improvements in
the area in which the property is located, because:
The Specific Plan allows for a hotel, full service restaurant, a residential area, and a convenience store
and gas station. The only two uses on the project site at this time are the convenience store / gas
station and the residential units. The hotel and full service restaurant have never been constructed.
The proposed 316 square foot kitchen expansion will provide additional services on the convenience
store / gas station parcel. Due to the lack of a full service restaurant on the project site, this limited
expansion will not be detrimental to the public welfare, and/or injurious to property or improvements
in the project area.
4. The proposed use is consistent with the map and text of the Mono County General Plan and Tioga Inn
Specific Plan, because:
The Tioga Inn Specific Plan designates this parcel as Convenience Store / Gas Station which provides
for a retail store and fuel purchase facility, an apartment, two fuel islands with four multi-grade
dispensing stations per island for a total of eight pumping stations, a picnic area sited in conjunction
with the scenic turn-out, public restrooms, and parking areas, including spaces for recreational
vehicles, vehicles towing trailers, and tour busses.
Mono County Land Use Element, Chapter 36 Specific Plans:
General Plan Section 36.60 Specific Plan Amendment states that amendments to a specific plan can
be handled through the Director Review process if no change in density results and no change in
conditions are necessary. See Attachment 1 Ground Floor Plan that shows existing uses and the
proposed kitchen expansion. With DR 2012-007, the expansion of 316 square feet to the kitchen does
not change the density of the project or change conditions.
This Specific Plan was adopted in 1993 and as of this date, only the Residential and Convenience
Store/Gas Station uses have been developed. In consideration of this and the fact that the Hotel and
other Restaurant uses are undeveloped, the increase in footprint of the Convenience Store/Gas Station
from 6,300 permitted square feet to 6,835 square feet (includes the 316 sf kitchen expansion) is
considered minor and allowed within the specific plan area.
5. Improvements as indicated on the development plan are consistent with all adopted standards and policies
as set forth in the Land Development Regulations, this General Plan and the Tioga Inn Specific Plan,
because:
The project is consistent with the Mono Basin Area Plan because it conforms to the policies
encouraging infill development within or adjacent Lee Vining.
Mono County Land Use Element, Mono Basin Area Plan:
Objective A: Direct future development to occur in and adjacent to Lee Vining.
Objective D, Policy 3: Focus commercial development within or adjacent to Lee Vining.
The project is consistent with the Tioga Inn Specific Plan because the project is consistent with the
Convenience Store / Gas Station parcel and the permitted uses allowed on this parcel. See finding 4.
above.
6. The project is exempt from CEQA, because:
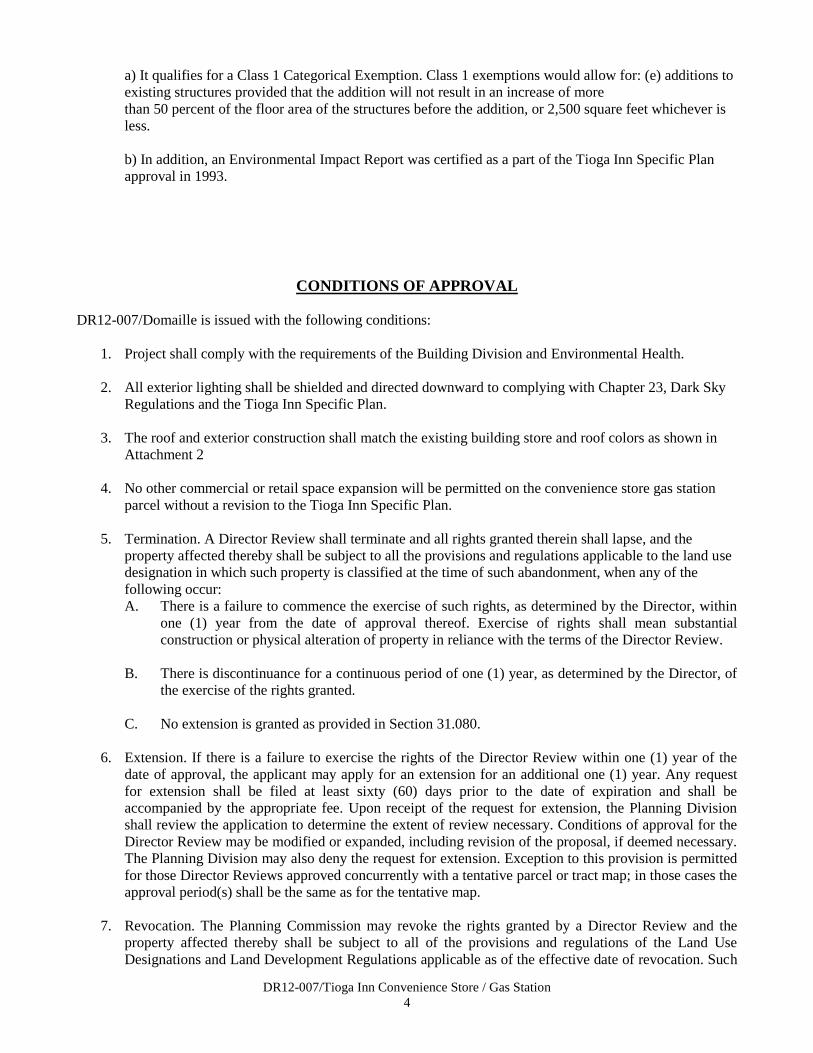
DR12-007/Tioga Inn Convenience Store / Gas Station
4
a) It qualifies for a Class 1 Categorical Exemption. Class 1 exemptions would allow for: (e) additions to
existing structures provided that the addition will not result in an increase of more
than 50 percent of the floor area of the structures before the addition, or 2,500 square feet whichever is
less.
b) In addition, an Environmental Impact Report was certified as a part of the Tioga Inn Specific Plan
approval in 1993.
CONDITIONS OF APPROVAL
DR12-007/Domaille is issued with the following conditions:
1. Project shall comply with the requirements of the Building Division and Environmental Health.
2. All exterior lighting shall be shielded and directed downward to complying with Chapter 23, Dark Sky
Regulations and the Tioga Inn Specific Plan.
3. The roof and exterior construction shall match the existing building store and roof colors as shown in
Attachment 2
4. No other commercial or retail space expansion will be permitted on the convenience store gas station
parcel without a revision to the Tioga Inn Specific Plan.
5. Termination. A Director Review shall terminate and all rights granted therein shall lapse, and the
property affected thereby shall be subject to all the provisions and regulations applicable to the land use
designation in which such property is classified at the time of such abandonment, when any of the
following occur:
A. There is a failure to commence the exercise of such rights, as determined by the Director, within
one (1) year from the date of approval thereof. Exercise of rights shall mean substantial
construction or physical alteration of property in reliance with the terms of the Director Review.
B. There is discontinuance for a continuous period of one (1) year, as determined by the Director, of
the exercise of the rights granted.
C. No extension is granted as provided in Section 31.080.
6. Extension. If there is a failure to exercise the rights of the Director Review within one (1) year of the
date of approval, the applicant may apply for an extension for an additional one (1) year. Any request
for extension shall be filed at least sixty (60) days prior to the date of expiration and shall be
accompanied by the appropriate fee. Upon receipt of the request for extension, the Planning Division
shall review the application to determine the extent of review necessary. Conditions of approval for the
Director Review may be modified or expanded, including revision of the proposal, if deemed necessary.
The Planning Division may also deny the request for extension. Exception to this provision is permitted
for those Director Reviews approved concurrently with a tentative parcel or tract map; in those cases the
approval period(s) shall be the same as for the tentative map.
7. Revocation. The Planning Commission may revoke the rights granted by a Director Review and the
property affected thereby shall be subject to all of the provisions and regulations of the Land Use
Designations and Land Development Regulations applicable as of the effective date of revocation. Such
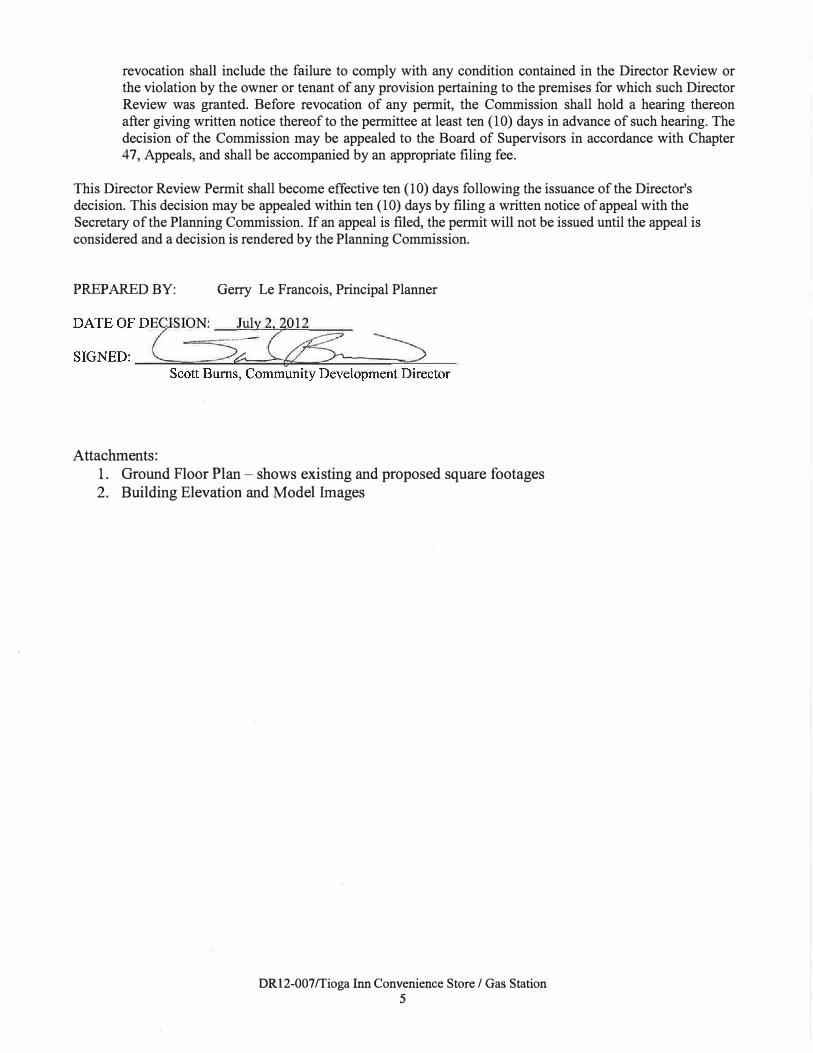
revocation shall include the failure to comply with any condition contained in the Director Review or the violation by the owner or tenant of any provision pertaining to the premises for which such Director Review was granted. Before revocation of any permit, the Commission shall hold a hearing thereon after giving written notice thereof to the permittee at least ten (10) days in advance of such hearing. The decision of the Commission may be appealed to the Board of Supervisors in accordance with Chapter 4 7, Appeals, and shall be accompanied by an appropriate filing fee.
This Director Review Permit shall become effective ten (10) days following the issuance of the Director's decision. This decision may be appealed within ten (10) days by filing a written notice of appeal with the Secretary of the Planning Commission. If an appeal is filed, the permit will not be issued until the appeal is considered and a decision is rendered by the Planning Commission.
PREPARED BY: Gerry Le Francois, Principal Planner
Attachments:
1. Ground Floor Plan - shows existing and proposed square footages
2. Building Elevation and Model Images
DR12-007/Tioga Inn Convenience Store/ Gas Station
5

APPENDIX C
1991 GeoSoils, Inc.
Geologic Investigation
PRELIMINARY GEOLOGIC INVESTIGATION
83±-ACRE PARCEL, TENTATIVE PARCEL MAP NO. 34
LEE VINING AREA, MONO COUNTY, CALIFORNIA
FOR
MR. DENNIS DOMAILLE
P. 0. BOX 2727
MAMMOTH LAKES, CALIFORNIA 93546
APRIL 4, 1991 W. 0. 431-A-RC
GeoSoils, Inc.
Geotechnical Engineering• Engineering Geology
24890 Jefferson Avenue • PO. Box 490 • Murrieta, California 92362 • (714) 677-9651 • FAX (714) 677-9301
April 4, 1991 W.O. 431-A-RC
Mr. Dennis Domaille P.O. Box 2727 Mammoth Lakes, California 93546
Subject:
Gentlemen:
Preliminary Geologic Investigation, 83±-Acre Parcel, Tentative Parcel Map No. 34, Lee Vining Area, Mono County, California
In accordance with your request and authorization, this report presents the results of our preliminary geologic investigation on the subject property. The primary purpose of this study was to evaluate the presence of previously-mapped faults within the Alquist-Priolo special studies zone. The secondary purpose of this study was to evaluate the onsite geologic conditions and their effects on the proposed site development from a geologic viewpoint. At the time of our study, the actual location of the proposed improvements was not known.
EXECUTIVE SUMMARY
As indicated above, the purpose of this study was to satisfy the provisions of the Alquist-Priolo special studies zone act, as well as provide a geologic evaluation of the site. Based on our study, the proposed improvements are suitable for their intended use, from a geologic viewpoint.
Active faulting was not encountered during our study. In addition, the site and the region as a whole is subject to strong seismic shaking, as well as the effects of volcanic processes. Mitigation of these conditions should include adherence to the latest edition of the Uniform Building Code.
In summary, adverse geologic features that would preclude the feasibility of development as proposed were not encountered. The recommendations presented in this report should be incorporated into the planning, design, earthwork, and construction considerations for the project.
Los Angeles Co. (818) 785-2158 • Orange Co. (711} 647-0277 • Son Diego Co. (619) 438-3155
Mr. Dennis Domaille Lee Vining Area, Mono County
SCOPE OF SERVICES
April 4, 1991 W.O. 431-A-RC Page 2
The scope of our services has included the following:
1. Review of readily available geologic data for the area(Appendix) , including stereoscopic aerial photographs, andphotolineament analysis and faulting evaluation.
2. Geologic and geomorphic site reconnaissance.
3. Subsurface exploration consisting of the excavation by backhoeof two overlapping fault locating and lineament evaluationtrenches.
4. Geologic analysis of the data collected.
5. Preparation of this report.
SITE DESCRIPTION
The site is a roughly rectangular-shaped parcel consisting of approximately 83 acres in the Lee Vining area of Mono County, California ( see the Site Location Map, Figure 1). The site is bounded to the north, east, west, and south by essentially natural and undeveloped property. The subject property is transected by U.S. Highway 395 diagonally along the eastern to northern property margins, and also diagonally by State Highway 120 along the western and northern property margins. Cuts and fills associated with those roadways also exist onsite. Continental telephone lines and Southern California Edison Company power lines also transect the eastern and northern property margins. An Alquist-Priolo special studies zone exists on the approximately western third of the property.
The majority of the site, with the exception of some dirt access roads and those areas mentioned above, is in an essentially natural condition. The site is characterized by a northeasterly descending flank and ridge of a hillside that has been locally terraced and incised with drainages. Slopes within this hillside area range from nearly flat to lpcally as steep as 1:1 (horizontal tovertical). The property flattens in a northerly direction near the �8r��-8e�trel portion of the site to an overall gradie�� of nhnut 13: l ( horizontal to vertical) and to nearly flat in the nor"ti1-easterly_ margin of the site. Overall relief across the site ranges from a high of about 6978 feet MSL to a low of about 6699 feet MSL. Vegetation is sparse to moderate, and consists of native brush with very few trees.
GeoSoils, Inc.
Mr. Dennis Domaille Lee Vining Area, Mono County
PROPOSED DEVELOPMENT
April 4, 1991 W.O. 431-A-RC Page 3
As indicated previously, at the time of our investigation, the proposed locations and types of structures were not known.
Subsequently, we were provided with plans that indicate that currently a 120-uni t hotel and restaurant is proposed near the northwesterly to central area of the property, southeasterly of State Highway 120. Associated appurtenant structures including a pool and spa, as well as associated interior roadways and parking, are also proposed. In addition, a single-family residence is also proposed in the future in the southwesterly portion of the property.
FIELD STUDIES
Field studies conducted during our geologic evaluation of the property consisted of the following:
1. Geologic and geomorphic reconnaissance and mapping.
2. Excavation of two overlapping exploratory backhoe trenches toevaluate the near-surface soil and geologic conditions withrespect to faulting. The trenches totaled about 1,500 feetand were about 10 to 15 feet deep.
The trenches were logged by a geologist from Sierra Geotechnical Services, Inc., and briefly viewed by the undersigned. The locations of the trenches are presented on Plate 1. Logs of the trenches are presented on Plates 2 through 6.
GEOLOGICAL SUMMARY
Regional Geologic Setting
The subject property is located at the transition of two prominent natural geomorphic provinces in California known as the "Sierra Nevada" and "Basin and Range. " These provinces have long and active geologic histories. The Basin and Range province is generally characterized by narrow, fault-bounded, northerlytrending mountain ranges ,separated by irregular-shaped, alluviumcovered valleys. The Sierra Nevada is generally a northnorthwesterly -i::r.e�dj_r_g, s:!..n�•1..l::>.!', asymmetric, tilted fault-block of great magnitude, which has b:coken free on the east along the Sierra Nevada frontal fault system. Some geologists consider the Sierra Nevada the highest and grandest of the Basin and Ranges mountains.
In general, the bedrock of the majority of the mountains in the site vicinity consists of Triassic to Cretaceous-age plutons
GeoSoils, Inc.
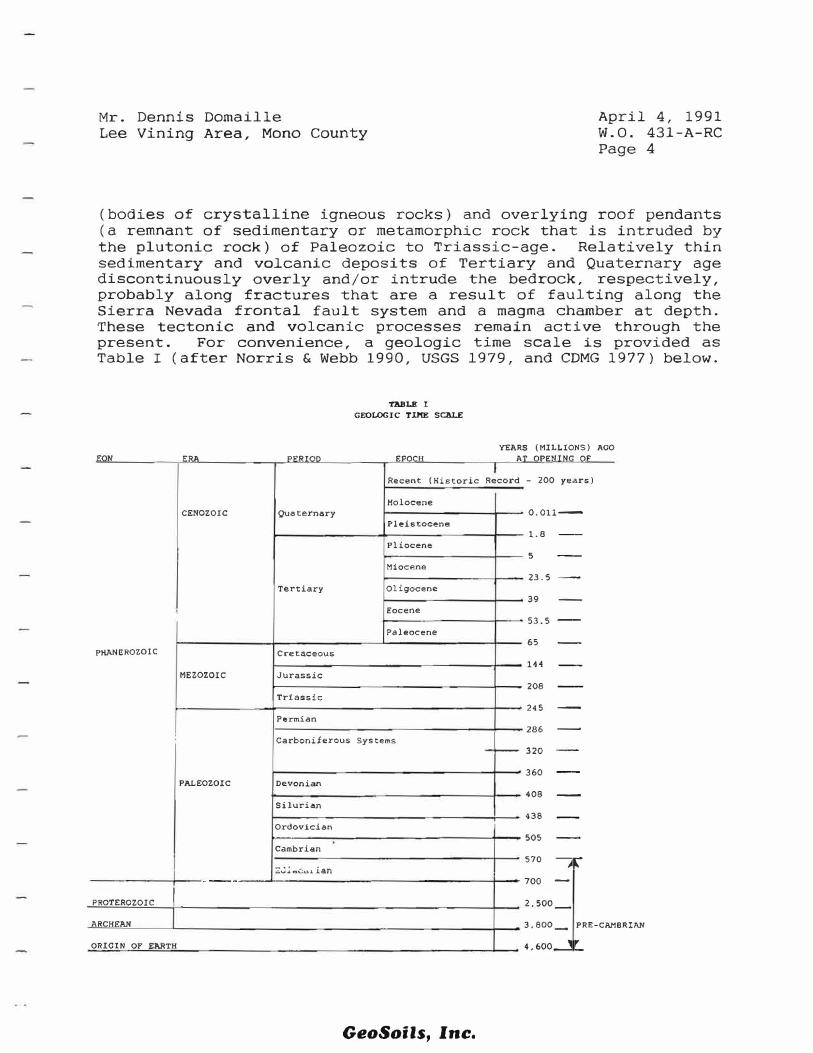
Mr. Dennis Domaille Lee Vining Area, Mono County
April 4, 1991 W.O. 431-A-RC Page 4
(bodies of crystalline igneous rocks) and overlying roof pendants (a remnant of sedimentary or metamorphic rock that is intruded by the plutonic rock) of Paleozoic to Triassic-age. Relatively thin sedimentary and volcanic deposits of Tertiary and Quaternary age discontinuously overly and/or intrude the bedrock, respectively, probably along fractures that are a result of faulting along the Sierra Nevada frontal fault system and a magma chamber at depth. These tectonic and volcanic processes remain active through the present. For convenience, a geologic time scale is provided as Table I (after Norris & Webb 1990, USGS 1979, and CDMG 1977) below.
EON .. ,,,.
CENOZOIC
!
PHANEROZOIC
MEZOZOIC
:
PALEOZOIC
----
PROTEROZOIC I ARCHEAN
ORIGIN OF EARTH
0.-1>um
Quaternary
Tertiary
Cretaceous
Jurassic
Triassic
Permian
Carboniferous
Devonian
Silurian
Ordovician
Cambrian
��.:..c:a...:-u.1 .ian
TABI.lt I
GEOLOGIC TINE SCALE
EPf"lr"
Recent (Historic
Holocene
Pleist.ocene
Pliocene
Miocene
Oligocene
Eocene
Paleocene
systems
GeoSoils, lne.
YEARS (MILLIONS) AGO A'!' t"lpplTNI"! n.-
Record - 200 years)
0.011-
1.8 --
5 --
23.5 -
39 -
53.5 --
65 --
144 --
208 --
24 5 -
286 -
->--- 320 --
360 --
408 -
438 --
505 --
570 ---.i r
700 -
2,500_
3,600_ PRE-CAM BRIAN
4,600___:! '.'_.
Mr. Dennis Domaille Lee Vining Area, Mono County
April 4, 1991 W.O. 431-A-RC
Page 5
During Quaternary time, glaciation has resulted in wide, U-shaped valleys, and upon glacial retreat, lateral and terminal moraine deposits, which have sometimes served as alpine lake confinements. Glacial deposits and fluvial deposits derived from glacial meltwaters have filled portions of the valleys and descend and coalesce from the mountainous areas. Geomorphic processes, together with Quaternary volcanism and faulting, have generated the present-day landforms.
A regional geologic map is provided as Figure 2. The regional geologic map indicates that the site is underlain by Quaternary till of the Tahoe Glaciation, and Quaternary alluvium. Faults within the till have been mapped on the property (Kistler, 1966; CDMG, 1985.) The absolute age of the Tahoe till has been reported as potentially as young as 9,800 years old to as old as 65,000 years old, with most studies indicating the older age as most probable.
Lineament Analysis
In order to identify possible unmapped faults and to evaluate topographic expressions of published fault traces, a lineament analysis was performed. Stereoscopic aerial photographs at a scale of approximately 1:24,000 and 1:2,400 were utilized in the lineament analysis.
Lineaments were classified as strong, moderate or weak. A strong lineament is a well-defined feature that can be continuously traced from several hundred feet to a few thousand feet. A moderate lineament is less well defined, somewhat discontinuous, and can be traced for only a few hundred feet. A weak lineament is discontinuous, poorly defined, and can be traced for a few hundred feet or less.
A weakly- to moderately-developed lineament transected the site in a northwesterly direction paralleling the faults previously mapped onsite (see Plate 1). The lineament was field checked during our reconnaissance mapping to evaluate possible origin. This lineament, as well as previously mapped onsite faults, was intercepted by our trencpes.
SITS �ECL08IC_UN!TS
The geologic units observed on the subject property consisted of manmade fill, colluvium (topsoil), fluvial-glacial deposits, and alluvium. Mappable units are shown on Plate 1 and are described as follows:
GeoSoils, Inc.
Mr. Dennis Domaille Lee Vining Area, Mono County
Fill (not mapped)
April 4, 1991 W.O. 431-A-RC Page 6
Manmade fill was observed during our field study on the subject property associated with the previously-mentioned highways, as well as the dirt roads that transect the site. These fill materials are considered potentially compressible in their existing state and unsuitable for the support of additional fill loadings or settlement-sensitive structures. In the absence of documentation of the methods of compaction, they will require complete removal and recompaction, if settlement-sensitive improvements are planned in those areas. These materials will typically have engineering properties similar to the parental uni ts from which they are derived.
Colluvium (not mapped)
Quaternary colluvium (topsoil) was observed on the site in both trenches. It is generally 1 to 2 feet thick; however, locally it ranges up to 10 feet thick, and should underlie other portions of the site. The observed colluvial soils are weathered fluvialglacial deposits. The colluvium logged in our trenches was light to medium to dark grayish brown, fine- to medium-grained, to fineto coarse-grained sands, with minor amounts of silt and very finegrained sand, and locally abundant pebbles and cobbles. Evidence of a calcic or argillic horizon was not observed. The materials were damp to moist and loose and contained abundant rootlets. Because of their potential compressibility, the colluvial soils are unsuitable for support of structures and/or settlementsensitive improvements, and will require removal and recompaction. These soils typically have a low to medium expansion potential. Based on the lack of a calcic or argillic horizon, this unit is judged to be a minimum of Holocene to recent in age.
Fluvial-Glacial Deposits (Map Symbol - Ofg)
Quaternary fluvial-glacial deposits were encountered in our trenches and underlie the majority of the site. These materials are deposits derived from glaciation and glacial meltwaters and were generally various shades of gray, brown, and rust brown and were dry to wet. Litholpgies generally ranged from fine-grained sands, and fine- to coarse-grained sands to sandy to gravelly conglomer�te, wi. ::h r:c�� si.l ��/ se�ds and silts. In areas, the upper 1 to 2 feet c= the fluvial-glacial deposits were loose and porous and may b� locally-derived colluvium. The fluvial-glacial deposits at depths lower than about 3 to 4 feet were medium dense. Owing to their potential compressibility, the near-surface fluvial--glacial materials are unsuitable for support of structures and/or settlement-sensitive improvements. Removal and recompaction of the near-surface fluvial-glacial deposits will be necessary. These
Geo Soils, J nc.
Mr. Dennis Dornaille Lee Vining Area, Mono County
April 4, 1991 W.O. 431-A-RC
Page 7
soils typically have a low to medium expansion potential. Since this unit is likely a result of a significant climate change, and since the last major climate change occurred during the Pleistocene to Holocene transition, this unit is judged to have a minimum relative age range of Pre-Holocene to Holocene, or about 15,000 to, perhaps, as young as 7,000 years old. This unit may be older than pre-Holocene; however, for conservatism the previously mentioned range is deemed appropriate.
Alluvium (Map Symbol - Qal)
Although not encountered during our field investigation, Quaternary alluvial deposits were observed along the extreme easterly margin of the property. These sediments likely consist of the products of weathering and erosion of parental rocks from the site vicinity as well as locally derived and undifferentiated effusive volcanic and lacustrine deposits. These materials were not evaluated, as the currently proposed development is not planned in this area. Based on the available data, as well as geomorphic and stratigraphic relationships, this unit is judged to be of Pleistocene to Recent in age, with the younger deposits occurring near the surface. Offsite, deposition is still occurring within this unit (i.e., Mono Lake).
GEOLOGIC STRUCTURE
The fluvial-glacial deposits on the site are generally medium to thickly bedded and are generally flat lying, and exhibit crossbedding, channeling, and lenticular bedding typical of such materials. However, cross-bedded lenses dipped as steeply as 21 degrees. Al though not encountered, the alluvial deposits are anticipated to be essentially flat-lying, and are not expected to be exposed during site development. Faulting and vulcanism are discussed later in this report.
FAULTING AND REGIONAL SEISMICITY
The site is situated in an area of active as well as potentially active faults. Major fault zones that could have a significant affect on the site shoulo they experience activity would include the following:
Fault Zone Mono Valley Parker Lake Hartley Springs Un-named Faults in Long Valley Owens Valley West Walker
GeoSoils, Inc.
Site (miles)_ 0.3 5 6
17 35 44
Mr. Dennis Domaille Lee Vining Area, Mono County
April 4, 1991 W.O. 431-A-RC Page 8
The relationship of the site location to the major mapped faults is indicated on Figure 3. Other significant faults have been mapped in the region. The nearest known active fault is the Mono Valley fault, which may be considered part of the Sierra Nevada frontal fault system. The pattern of faulting within this area is wide and complex, with numerous north to northwesterly branching and subsidiary faults, and is believed to have developed largely through extensional deformation and associated normal faulting. The Sierra Nevada Frontal fault zone is believed to have been formed in this manner. Volcanic processes and, to a lesser degree, tectonic processes are believed responsible for the east-west trending faults, as well as some of the minor north-northwesterly trending faults. This is discussed further later in this report.
The "design fault" for the project site is the Mono Valley fault, which is thought to be related to the Basin and Range fault system. Accordingly, this fault has the potential for a maximum credible earthquake of 8.0 M and a maximum probable earthquake of 6.5 M. Peak horizontal ground accelerations from a maximum credible event could exceed 1.0 g, and a maximum probable event may reach 0.75 g.
The repeatable high acceleration ( RHA), which is taken to be approximately 65 percent of the peak acceleration for sites less than 20+ miles from the epicenter (Ploessel & Slosson, 1974), is also used for design criteria. The estimated horizontal design criteria for repeatable acceleration, therefore, may be about 0.49 g. A relatively newly-recognized phenomenon, observed during the 1989 Loma Prieta earthquake, is "earthquake focussing,� and may also influence ground motion. However, as discussed below, a subsurface fault has been mapped at the site. Buried topography as a result of this fault may also occur at depth, below the site. Accordingly, we recommend that the full range of values for acceleration, 0.49 g, 0.75 g, and 1.0 g, should be considered for seismic design. The site period should be on the order of 0.35 seconds, and the duration of strong shaking may range from about 18 to 34 seconds. Recurrence intervals for large earthquakes in the Basin and Range province is anticipated to be on the order of 100,000 years (verbal communication, Shlemon, 1990).
As indicated previously, an area of the westerly portion of the site lies within an Alquist-Priolo special studies zone. The state has mapped a fault in this area ( see Figure 1). In addition, Kistler ( 1966) has also map;;.,2d. a fault on the property ( see Figure 2). These faults were parallel to the photolineament noted during our aerial-photograph review. The previously-mapped faults and photolineament were intercepted by our fault-finding trenches. Evidence for Holocene faulting (i.e., the geomorphic alignment of topographic saddles along the postulated fault traces; complete
GeoSoils, Inc.
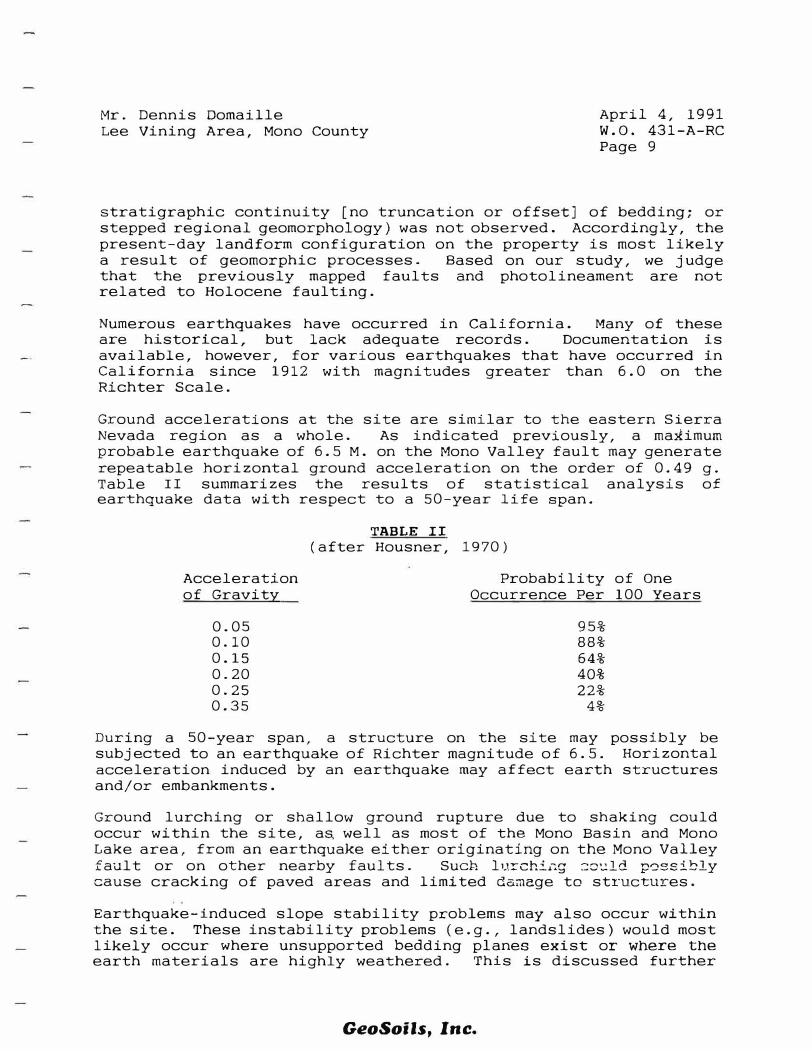
Mr. Dennis Domaille Lee Vining Area, Mono County
April 4, 1991 W.O. 431-A-RC
Page 9
stratigraphic continuity [no truncation or offset] of bedding; or stepped regional geomorphology) was not observed. Accordingly, the present-day landform configuration on the property is most likely a result of geomorphic processes. Based on our study, we judge that the previously mapped faults and photolineament are not related to Holocene faulting.
Numerous earthquakes have occurred in California. Many of these are historical, but lack adequate records. Documentation is available, however, for various earthquakes that have occurred in California since 1912 with magnitudes greater than 6.0 on the Richter Scale.
Ground accelerations at the site are similar to the eastern Sierra Nevada region as a whole. As indicated previously, a maJtimum probable earthquake of 6.5 M. on the Mono Valley fault may generate repeatable horizontal ground acceleration on the order of 0.49 g. Table II summarizes the results of statistical analysis of earthquake data with respect to a 50-year life span.
Acceleration of Gravity
0.05 0.10 0.15 0.20 0.25 0.35
TABLE II (after Housner, 1970)
Probability of One Occurrence Per 100 Years
95% 88% 64% 40% 22%
4%
During a 50-year span, a structure on the site may possibly be subjected to an earthquake of Richter magnitude of 6.5. Horizontal acceleration induced by an earthquake may affect earth structures and/or embankments.
Ground lurching or shallow ground rupture due to shaking could occur within the site, as well as most of the Mono Basin and Mono Lake area, from an earthquake either originating on the Mono Valley fault or on other nearby faults. Suen hi:::-ch.:..-:g :::o'..!ld p0ssibly cause cracking of paved areas and limited da�age to structures.
Earthquake-induced slope stability problems may also occur within the site. These instability problems (e.g., landslides) would most likely occur where unsupported bedding planes exist or where the earth materials are highly weathered. This is discussed further
GeoSoils, Inc.

Mr. Dennis Domaille Lee Vining Area, Mono County
April 4, 1991 W.O. 431-A-RC
Page 10
below. Experience has shown that wood-frame structures designed in accordance with the most recent edition of the Uniform Building Code tend to best resist earthquake effects.
MASS WASTING
Mass wasting refers to the various processes by which earth materials are moved downslope in response to the force of gravity. Examples of these processes include slope creep, and surficial failures. Creep is the lowest form of mass wasting, and generally involves the outer 5 to 10 feet of the slope surface. During heavy precipitation, creep-affected materials may become saturated, resulting in a more rapid form of downslope movement (i.e., landslides and/or surficial failures).
Indications of deep-seated landsliding, significant slope creep or surficial failures on the site were not observed during our review of stereoscopic photographs of the area (USDA, 1977, Triad Engineering, 1984b) or during our site reconnaissance. The potential for seismically induced landsliding is considered low. The potential for earth flows on the site is moderate, particularly in the areas of colluvium-filled swales. Possible mitigation measures are discussed later in this report.
GROUND WATER
Ground water was not observed during our investigation. In addition, seeps, springs, or other indications of a high regional ground water level were not noted on the subject property during the time of our field investigation. It is our understanding that a well drilled since our field investigation began encountered the regional water level at an elevation of about 6360 feet MSL, below the elevation of Mono Lake ( about 6380 feet MSL). However, seepage may occur locally (due to heavy precipitation or irrigation) in areas where fill soils overlie relatively impermeable sediments or soils. Such soils or sediments may be encountered in the materials that exist onsite.
LIQUEFACTION POTENTIAL
Liquefaction is a phenomenon in which cyclic stresses produced by earthquake-induced ground�ctj -=� c:::::-e�t::� exc9ss po!."'e pressures -in cohesionless (sandy) soils. Th8se soils moy thereby acquire a high degree of_ mobility that can lead to lateral movement and sliding, consolidation and settlement of loose sediments, sand boils, and other damaging deformations. This phenomenon occurs only below the water table; however, after liquefaction has developed, it can
GeoSoils, Inc.
Mr. Dennis Domaille Lee Vining Area, Mono County
April 4, 1991 W.O. 431-A-RC
Page 11
propagate upward into overlying, non-saturated soil as excess pore water escapes.
Liquefaction potential is related to numerous factors and the following conditions must exist for liquefaction to occur: 1) sediments must be relatively young in age and not have developed large amount of cementation; 2) sediments must consist mainly of fine-grained cohesionless sands; 3) the sediments must have low relative density; 4) free ground water must be present in the sediments; and 5) the site must experience seismic events of a magnitude large enough to induce straining of soil particles. At the subject site, discontinuous zones with four of these conditions exist: 1) the sediments consist of uncemented relatively young, sediments; 2) they have relatively low to moderate density; 3) they are sandy; and 4) it is anticipated that significant seismic events will occur that are capable of shaking the site.
One of the primary factors controlling the potential for liquefaction is the depth to ground water. Liquefaction susceptibility generally decreases with depth of the ground water table for two reasons: 1) the deeper the water table, the greater is the normal effective stress acting on saturated sediments at any given depth, and liquefaction susceptibility decreases with increased normal effective stress; 2) age, cementation, and relative density of sediments generally increase with depth. Thus, as the depth to the water table increases and as the saturated sediments become older, more cemented, have higher relative density, and confining normal stresses increase, the less likely they are to liquefy during an earthquake. Typically, liquefaction has a relatively low potential where ground water is greater than 30 feet deep and virtually unknown below 50 feet. Due to the depth of the regional ground water table, liquefaction potential should be considered low to nil in the site area, under the present conditions.
Should the water table rise to within 30 to 50 feet from the surface or should a perched water condition develop as a result of permeable materials overlying impermeable materials, liquefaction may occur. Due to the overall relative permeability and nature of the discontinuous bedding within the onsite sediments and soils, this is considered unlikely.
VOLCANIC DEVELOPMENTAL CONSIDERATIONS
As discussed, the site is also located in an area of active vulcanism. The last known eruption within this region occurred at Mono Lake around 1890. Volcanic areas that have erupted within the last 2000 years and that could have a significant affect on the
GeoSoils, Inc.

Mr. Dennis Domaille Lee Vining Area, Mono County
April 4, 1991 W.O. 431-A-RC
Page 12
site, should they experience renewed activity, include the following:
Volcanic Source
Mono Lake area Long Valley/Mammoth Lakes area
Distance from Site (miles)
4.4 to 5.6 14.5 to 22.7
The relationship of the site location to these recently active volcanic areas, as well as other Quaternary volcanic sites, is also shown on the Regional Fault Map, Figure 3.
Based on the available data, an eruptive episode in the Mono BasinLong Valley area may occur as follows:
Stage 1 - Earthquakes along the Sierra Nevada fault system that open fissures or lessen the horizontal confining pressure along faults reaching the magma chamber at depth.
Stage 2 - Viscous siliceous magma rises towards the surface along these weakened fractures; at the same time ground water may leak downward.
Stage 3 - When contact is made, a steam explosion displaces pre-existing volcanic and lacustrine (lake) sediments forming a crater.
Stage 4 - If magma continues to rise, eruptions continue, changing in character from phreatic (steam) to phreatomagmatic and eventually magmatic with the formation of a dome.
The time lag from precursory earthquakes to eruption would likely be on the order of 6 months to as much as 10 years (Kilbourne, R. T. , et al, 1980). The type of eruptions and their effects include ash falls, pyroclastic flows, pyroclastic surges, lava domes and flows, floods and mud flows, and volcanic gasses. These are briefly summarized below:
Ash falls - Volcanic ash and larger fragments are ejected upward above a volc9nic vent by gaseous explosive eruptions. Large hot rock fragments can extend as much as 6 miles or so from the source vent. The effects of GSh �re gr0 �+0 �+ where it is thickest near the volcanic scurse, and decrease with dist.ance.
Pyroclastic Flows - Pyroclastic flows are relatively high density masses of hot, dry rock fragments mixed with hot
GeoSoils, Inc.
Mr. Dennis Domaille Lee Vining Area, Mono County
April 4, 1991 W.O. 431-A-RC Page 13
gasses; the flows move like fluids, along the ground surface to great distances at a high speed, outward from the vent.
Pyroclastic Surges - Pyroclastic surges are relatively lowdensity, cloud-like mixtures of rock particles and gasses that move at high speed outward from volcanic vents.
Lava Domes and Flows - Lava domes are flows resulting from the relatively quiet eruption of molten rock that piles up over a volcanic vent, or flows away as a molten stream, typically along topographic lows, to as much as 30 miles from the source.
Floods and Mudflows - Eruptions at vents in snow may cause hot mudflows as hot rock snowmelt, or floods that may become incorporate rock debris.
areas covered with debris mixes with mudflow as they
Volcanic Gasses - Volcanic gasses are emitted without rock material from small vents called fumaroles, and they also generally accompany molten or solid rock fragments expelled during eruptions. Volcanic gasses are controlled by wind direction and generally consist of steam, accompanied by carbon dioxide and compounds of sulfur and ammonia.
Due to the sites topographic setting and location with respect to the known recently-active volcanic areas, as well as those volcanic areas of Quaternary-age, the site is subject to the effects of eruption of pyroclastic flows and clouds of hot ash and pyroclastic surges, and to a lesser extent lava flows and domes, and to an even lesser extent mud flows and floods (Miller, C. D. and others, 1980). Mitigation of these hazards is generally impractical; and thus, if such an event were to occur, evacuation of personnel in accordance with state and local guidelines should be performed. Structures, however, would likely be damaged. This should be considered during project planning and design. It is our opinion, however, that the most likely volcanic hazard to potentially impact the site would be ash falls, due to the site's elevation and distance to known volcanic sources. Accordingly, the potential for ash falls at the site s�ould not be any greater than nearby and already-developed properties.
SUBSIDENCE
Our review of readily available data did not indicate that the site specific area is currently subsiding as a result of down-faulting along bordering fault zones, ground water withdrawal, or hydrocompaction. The site, however, lies in a region that has a
GeoSoils, Inc.
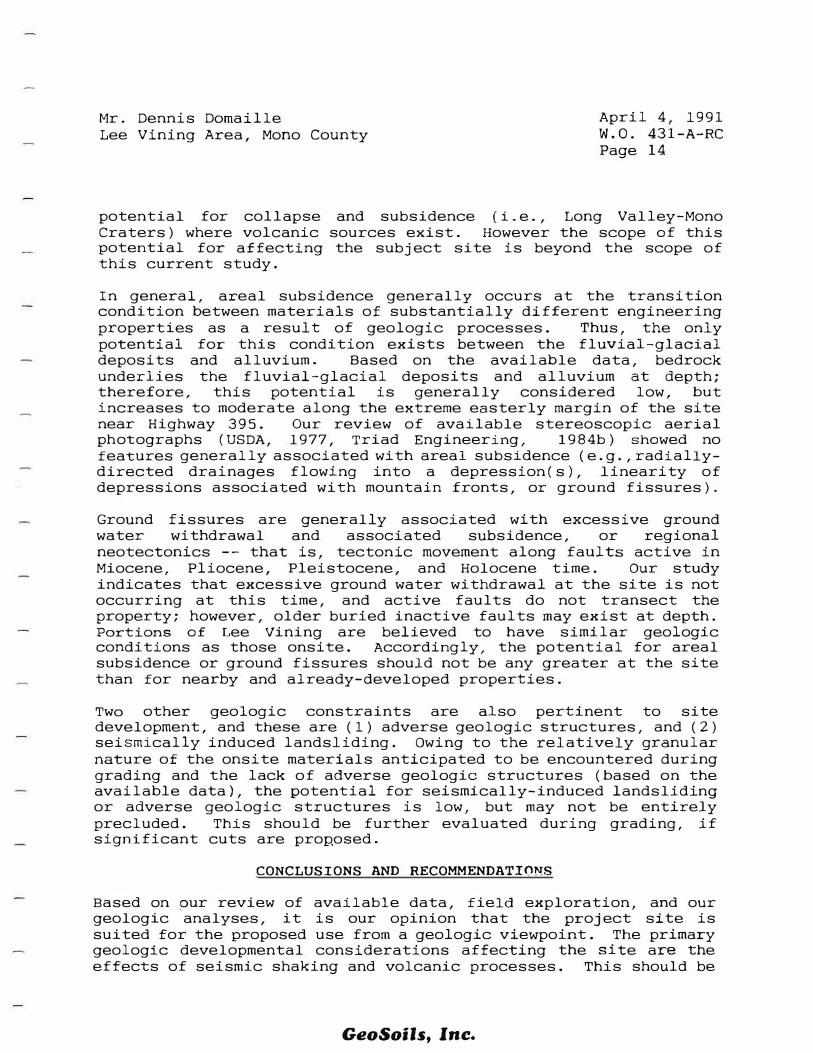
Mr. Dennis Domaille Lee Vining Area, Mono County
April 4, 1991 W.O. 431-A-RC Page 14
potential for collapse and subsidence (i.e., Long Valley-Mono Craters) where volcanic sources exist. However the scope of this potential for affecting the subject site is beyond the scope of this current study.
In general, areal subsidence generally occurs at the transition condition between materials of substantially different engineering properties as a result of geologic processes. Thus, the only potential for this condition exists between the fluvial-glacial deposits and alluvium. Based on the available data, bedrock underlies the fluvial-glacial deposits and alluvium at depth; therefore, this potential is generally considered low, but increases to moderate along the extreme easterly margin of the site near Highway 395. Our review of available stereoscopic aerial photographs (USDA, 1977, Triad Engineering, 1984b) showed no features generally associated with areal subsidence (e.g., radiallydirected drainages flowing into a depression( s), linearity of depressions associated with mountain fronts, or ground fissures).
Ground fissures are generally associated with excessive ground water withdrawal and associated subsidence, or regional neotectonics -- that is, tectonic movement along faults active in Miocene, Pliocene, Pleistocene, and Holocene time. Our study indicates that excessive ground water withdrawal at the site is not occurring at this time, and active faults do not transect the property; however, older buried inactive faults may exist at depth. Portions of Lee Vining are believed to have similar geologic conditions as those onsite. Accordingly, the potential for areal subsidence or ground fissures should not be any greater at the site than for nearby and already-developed properties.
Two other geologic constraints are also pertinent to site development, and these are (1) adverse geologic structures, and (2) seismically induced landsliding. Owing to the relatively granular nature of the onsite materials anticipated to be encountered during grading and the lack of adverse geologic structures (based on the available data), the potential for seismically-induced landsliding or adverse geologic structures is low, but may not be entirely precluded. This should be further evaluated during grading, if significant cuts are pro�osed.
CONCLUSIONS AND RECOMMENDATIONS
Based on 9ur review of available data, field exploration, and our geologic analyses, it is our opinion that the project site is suited for the proposed use from a geologic viewpoint. The primary geologic developmental considerations affecting the site are the effects of seismic shaking and volcanic processes. This should be
GeoSoils, Inc.

Mr. Dennis Domaille Lee Vining Area, Mono County
April 4, 1991 W.O. 431-A-RC Page 15
considered during project planning and design. The recommendations presented in this report should be incorporated into the planning, design, earthwork, and construction phases.
General
1. The recommendations presented below should be reviewed andrevised, if necessary, by the project engineering geologistwhen an approved grading or site plan becomes available.
2. Geotechnical engineering and compaction testing servicesshould be provided during grading to aid the contractor in removing unsuitable soils and in his effort to compact thefill. Geologic inspections should be performed during and cutslope excavation to further evaluate the presence of adversegeologic structures, if significant cuts are proposed. Basedon the exposed conditions, supplemental recommendations formitigation may be warranted.
3. Grading should conform to chapter 70 of the latest edition ofthe Uniform Building Code, as well as local ordinances.
4. Shallow ground water was not encountered during this study.Ground water, however, may vary with the seasons or otherfactors and may be encountered locally. Subdrain systems arerecommended for all proposed canyon fill areas on apreliminary basis.
5. If settlement-sensitive improvements are proposed within thezone of influence of our exploratory trenches, or if theexploratory trenches exist uphill within a zone of influencethat may impact proposed structures, mitigative measures, suchas removal and recompaction, debris/impact walls, etc, shouldbe provided by the soils engineer or design civil engineer, if warranted.
Debris Flow Mitigation
In consideration of the pqtential for prolonged rainfall, possible brush fires and vegetation denudation, we recommend that the projec"t-' s c.ivil cr;gi�cc:::- ::::c�sider using debris/desil ting/retention basins and/o= rip-rap or other mitigative devices in those areas where canyon or significant hillside gully areas intersect the proposed development. If structures are not proposed in those areas, then this would not be warranted from a geologic perspective; how�ver, this should be considered for personnel safety by the design civil engineer.
GeoSoils, Inc.

Mr. Dennis Domaille Lee Vining Area, Mono County
Fault Setback Zones
April 4, 1991 W.O. 431-A-RC
Page 16
Structural setbacks are not warranted for the site based on the available data. Undetected, potentially active faults may exist within the property outside of the area investigated. However, based on the available data, these would not meet the "sufficiently active" or ''well defined" criteria of the Alquist-Priolo special studies zone act. As potentially active faults may exist or new faults possibly occur in unpredictable locations, it is impractical to zone entire mountain front areas for setbacks, based on the physical nature of soil and sedimentary materials and the above criteria. Al though unlikely, it should be noted, however, that due to the project area's location in a zone of known active faulting, it is possible that removals and/or grading may expose fault traces that may warrant further study and/or structural setbacks. This should be considered during the planning and construction stages of the project.
INVESTIGATION LIMITATIONS
The materials encountered on the project site are believed representative of the total area; however, soils materials may vary in characteristics between test excavations.
Inasmuch as our investigation is based upon our review of available data, the site materials observed, and geologic analyses, the conclusions and recommendations are professional opinions. It is possible that variations in the subsurface conditions could exist beyond the points explored in this investigation. Also changes in ground water conditions could occur at some time in the near future due to variations in temperature, regional precipitation, and other factors.
These opinions have been derived in accordance with current standards of practice, and no warranty is expressed or implied. This report is subject to review by the controlling authorities.
GeoSoils, Inc.
Mr. Dennis Domaille Lee Vining Area, Mono County
April 4, 1991W.O. 431-A-RCPage 17
We sincerely appreciate this opportunity to be of service. If youhave any questions pertaining to this report, please contact us at( 714) 677-9651.
Respectfully submitted,
GeoSoils, Inc.
�f:!4 (fi�:�neering Geologist, CEG 1340
Enclosures: Figure 1 Site Location Map Figure 2 - Regional Geologic MapFigure 3 - Regional Fault Map Appendix - References Plate 1 - Geologic Map Plates 2 to 6 - Trench Logs
Distribution: (2) Addressee (5) Sierra Geotechnical Services, Inc.
Attention: Mr. Tom Platz
GeoSoils, Inc.
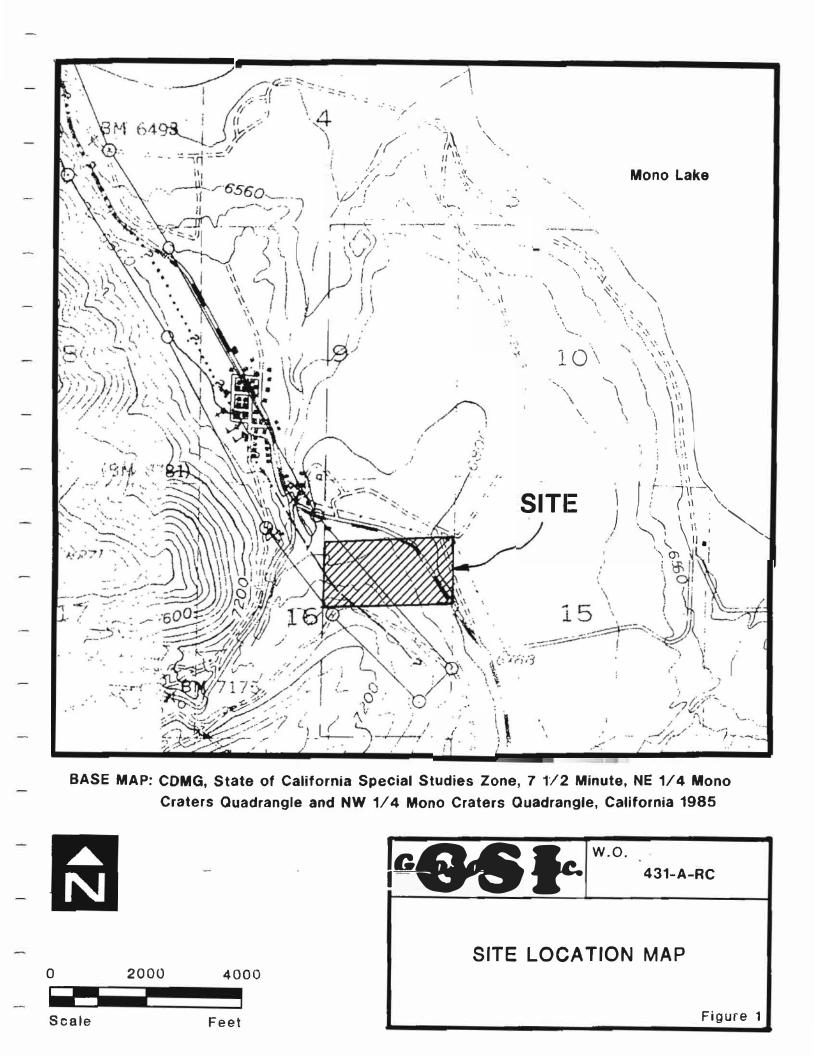
0
.: ·- / � :r ..
/f-�.-i --�-- /
./'/ _.,,,, v../(
I t·- ,· '
\ 1_
,,,.✓·'\
:-· . . .
7,.\: II'\,
If .,� ·-:�':'
\(• ,..__
/
\ ' "·
\ \ . ,\
--�
'
Mono Lake
'·, ..
' "-
..... >- ":-: \
\
,, � ., \ ·, .. \ \
\
\ ':,t
\ ·,_
\. �', '"' .. \ '�-- "
\ .. � \ \ . . \
.. _ :�-�- \\ \ \". -, o ·, ·, \\ I
� \ . \ ' ',\ \-.
-.._ I , 1\ •.
\ \ \\\ ;: i\ \
·,
\ ..
. : \
SITE \
)
! I ',\ " r ·7·1r-, / II ·\,
<�'; '\\\ : � ,. '- II•; \ CJ) I i U' I
BASE MAP: CDMG, State of California Special Studies Zone, 7 1/2 Minute, NE 1/ 4 Mono
Craters Quadrangle and NW 1/ 4 Mono Craters Quadrangle, California 1985
f c&5 fe. w.o. 431-A-Rc
SITE LOCATION MAP 2000 4000
Scale Feet Figure 1
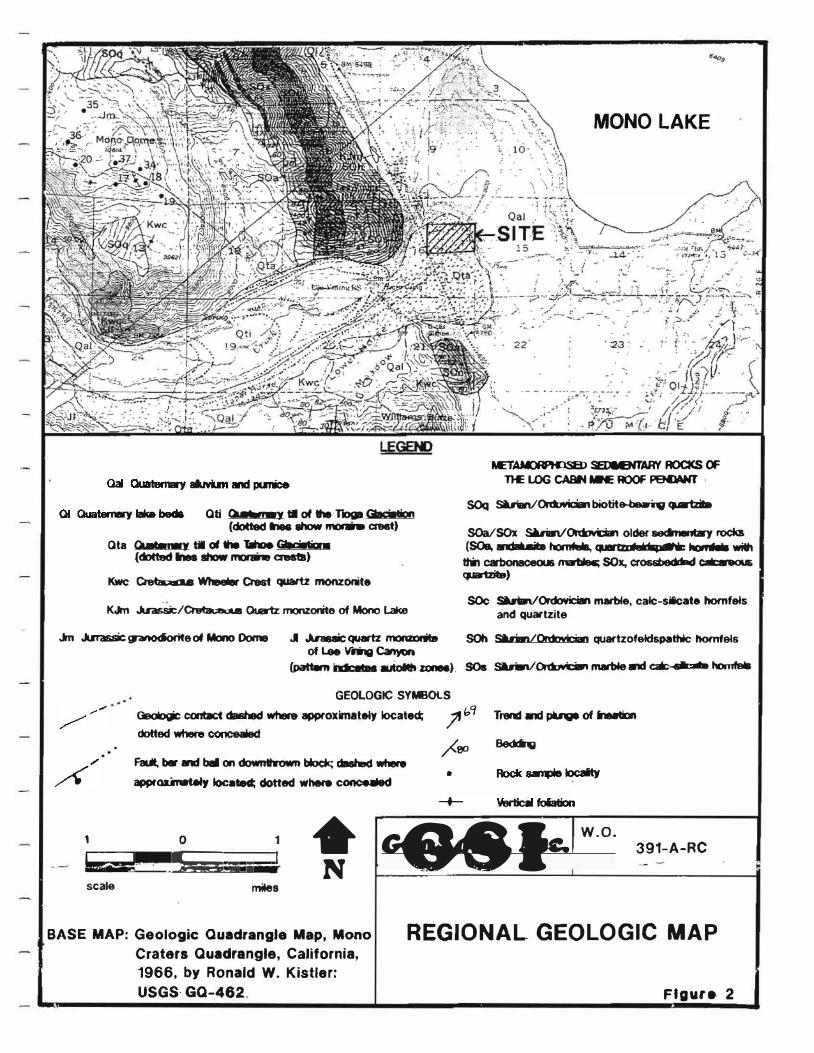
Qti 01awnmy ti ot W. T110g1 Gtacilllion (dotted ... ahow mcnm c:rest)
ata au..,., til ol th9 linoe Cilllciala■ {dottad 1nes show morane crests)
Kwc Cretaceous Whee6er' Crest quartz monzonite
KJm .uassic/Cretaceoua Quartz monzorite of Mono Lake
'. '· .. :. ·.. ·--� ; i;
•. . .. ·.�
MONO LAKE
IIETAMORPHOSED SEDM:NTARY ROCKS OF TIE LOG� MN: ROOF PBOUilT
SOq Sl.rian/Ordovician biotit&-beamg (Jatzite
SOa/SOx Suian/Ordovician oldet secfn•.tay rocks (SOa, ...... hOmfllla, q&a"� ....... wilh
tlWI cabonaceous mnlN; SOx, crossbedded eacareou& quaw1Zit&)
SOc Sibian/Ordovician matble, calc-siicate homf�s and quartzite
.kn .urassic granodiorite of Mono Dome .I ..uasaicquartz morm>rite SOh Sl.rian/Oidovician quartzofeldspathic homfels of Lee V"mg canyon
(J>attem inclcatN autolllt zonN). so. Sbilln/Ordoviciln marble a,d ealc-dcal9 homfea
1
GEOLOGIC SYMBOLS Geologic contact da&hecl where approximately located; J' h<f Trend ani � of nation
Faul, bar and bal on downlvown l>lodc; clallhed where approunat.iy located; dotted where concNled
0 1
,;<'eo Bedcq
•
bit#·· . .1-w:s. ;; ; I t a&Sfe-W.O.
scale miles
391-A-RC
BASE MAP: Geologic Quadrangle Map, Mono
Craters Quadrangle, California,
1966, by Ronald W. Kistler:
REGIONAL GEOLOGIC MAP
USGS· GQ-462. FIQul'• 2
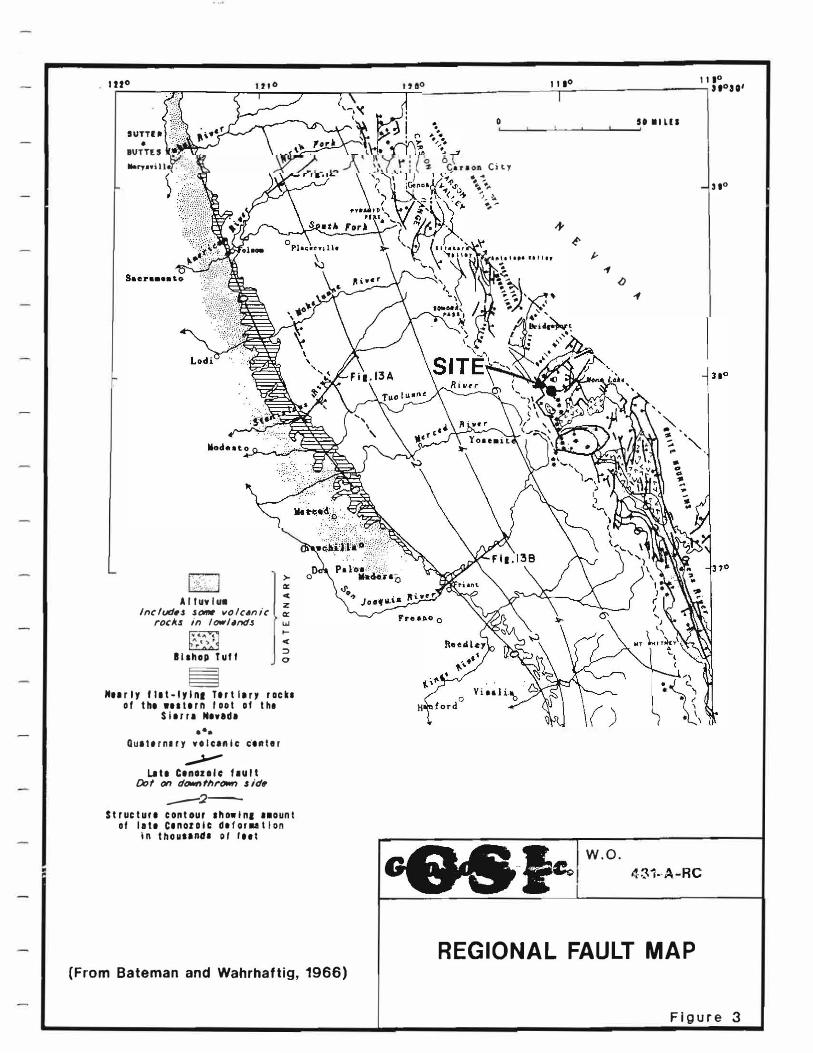
1u0
sunr• •
BUTTES
ller-,nill
A lluv lu• lnclvd,s s- 110/c,inie
roclt.s in lowllndJ
llIhop Tut f
§
>-0:: < ;i:: 0:: uJ.... < ::i 0
Hur IY f l1t-lylnI Ttrt l1r1 rocks of thI wI1tIrn loot of th•
Sl1rr1 N1vad1
••• Quaternary volcanic c·enter
_.J,--" Lita C1nozolo f■ult
Oof on duwnfllrown s idtf
___.:;;
Structur• contour ahowln1 a■ount
of latt C1nozolc defor■atlon In tho�11nd1 of fut
C
{From Bateman and Wahrhaftig, 1966)
H
111° 111°
,eo301
0 SO •ILU
City . �
-..,.;•� 310 ,, � 1:-�
...,, �
I,,
,f
()
,,
w.o.
REGIONAL FAULT MAP
Figure 3

APPENDIX
REFERENCES
APPENDIX
1. Alf ors, J. T., 1980, Regional Geology of the Mammoth Lakesregion, California, in California Division of Mines and Geology, Mammoth Lakes, California Earthquakes of May 1980, Special Report 150.
2. Atwater, B.F., Adam, D. P., Bradbury, J. P., Forrester, R. M.,Mark, R. K., Lettis, W. R., Fisher, G. R., Gobalet, K. W., and Robinson, S. w., 1986, A fan dam for Tulare Lake, California, and implications for the Wisconsin glacial history of the Sierra Nevada, in Geological Society of America Bulletin, January, Vol. 97.
3. Baily, R.A., 1982, Other potential eruption centers in California: Long Valley-Mono Lake, COSO, and Clear Lake volcanic fields, in Volcanic Hazard Zones of California, California Department of Conservation, Division of Mines and Geology Special Publication 63.
4. Baily, R.A., Huber, N.K., and Curry, R.R., 1990, The diamictonat Deadman Pass, central Sierra Nevada, California: A residual lag and colluvial deposit, not a 3 Ma glacial till, in Geological Society of America Bulletin, September, Vol. 102.
5. Bateman, P.C., and Wahrhaftig, 1966, Geology of the SierraNevada, in Geology of Northern California, Bulletin 190, California Division of Mines and Geology.
6. Birkeland, P.W., Berry, M.E., and Swanson, D.K., 1991, Use ofsoil catena field data for estimating relative ages of moraines, in Geology, March, Vol. 19.
7. California Division of Mines and Geology,California special studies zones, 7-1/2 Mono Craters Quadrangle and NW 1/4 Quadrangle, California.
1985, State of Minute, NE 1/4
Mono craters
8. Chesterman, c.w., 1982, Potentially active volcanic zones inCalifornia, in Status of Volcanic Prediction and Emergency response capabilities, in Volcanic Hazard Zones of California, California Department of Conservation, Division of Mines and Geology Special Publication 63.
9. S-eth, E.M., 1984, An overview of glacial chronology fn� t:h8
Mammoth Lakes region, Eastern Sierra Nevada, California, in Geology of the Long Valley Mono Craters Mam.moth Lakes area, Annual Field Trip Guide Book #12, by South Coast Geological Society, Inc.
GeoSoils, Inc.
Appendix, Page 2 W. 0. 431-A-RC
10. Gregory, J.L., 1984, Geological overview of the Mono BasinLong Valley region, in geology of the Long Valley Mono Craters Mammoth Lakes area. Annual Field Trip Guide Book #12, by South Coast Geological Society, Inc.
11. Greensfelder, R. W., 1974, Maximum credible rock accelerationfrom earthquakes in California, California Division of Mines and Geology, Map Sheet 23.
12. Hart, E.W., 1980, Planned zoning of active faults associatedwith the Mammoth Lakes earthquakes of May, 1980, in California Division of Mines and Geology, Mammoth Lakes, California Earthquakes of May 1980, Special Report 150.
13. Hermance, J. F., Neuman, G. A., and Slocum, W., 1988, theregional subsurface structure of Long Valley (California), caldera fill from gravity and magnetotelluric data, in Geological Society of America Bulletin, November, Vol. 100
14. Housner, G . W. ,engineering,
1970, Strong ground motion, in earthquake Robert Wiegel, editor, Prentice-Hall.
15. Kilbourne, R.T., Chestrman, C. W., and Wood, s. H., 1980,Recent volcanism in the Mono Basin-Long Valley region of Mono County, California in California Division of Mines and Geology, Mammoth Lakes, California earthquakes of May 1980, Special Report 150.
16. Kistler, R.W., 1966, Geologic Quadrangle Map, Mono CratersQuadrangle, California, in United States Geological Survey, Publication G.Q.-462.
17. Knuepfer, P.L.K., Lemiszi, P. J., Hauge, T. A., Brown, L. D.,Kaufman, S., and Oliver, J. E., 1987, crystal structure of the basin and range - Sierra Nevada transition from COCORP deep seismic-reflection profiling, in Geological Society of America Bulletin, April, Vol. 98.
18. Lord, M.L., 1991, Depositional record of a glacial-lakeoutburst: Glacial Lake Souris, North Dakota, in Geological Society of America Bulletin, February, Vol. 103.
19. Miller, C.D., Mullineaux, D. R., Crandell, D. R., and Baily,R. A., 198�, Potential hazards from future volcaniceruptions in the Long Valley-Mono Lakes area, East-CentralCalifornia and Southwest Nevada A preliminaryAssessment, in United States Geological Survey Circular877.
GeoSoils, Inc.
Appendix, Page 3 W. 0. 431-A-RC
20. Norris, R.M. and Webb, R.W., 1990, Geology of California,second edition, published by John Wiley and Sons, Inc.
21. Ploessel, M. R., and Slosson, J. E., 1974, Repeatable highground acceleration from earthquakes: California Geology, September.
22. Seed, H. B., and Idriss, I. M., 1982, Ground motions and soilliquefaction during earthquakes, Earthquakes Engineering Research Institute Monograph.
23. Slemmons, D.B., 1966, Cenozoic volcanism of the central SierraNevada, California, in Geology of Northern California, Bulletin 190, California Division of Mines and Geology.
24. Taylor, G.C., and Bryant, W.A., 1980, Surface ruptureassociated with the Mammoth Lakes earthquakes of 25 and 27 May, 1980, in California Division of Mines and Geology, Mammoth Lakes, California Earthquakes of May 1980, Special Report 150.
25. Triad Engineering, 1984a, Tentative parcel map no. 34, MonoCounty, California, Two undated revisions.
26. --�---,,..-----' 1984b, Aerial photographs, 200-scale, Nos.2, 3, 4, 5, A, B, and C, dated February 2.
27. Uniform Building Code, 1988 edition, International Conferenceof Building Officials.
28. United States Department of Agriculture, 1977, Aerialphotographs, 200-scale, Project BLM CAOl-77, Flight Line 7-12, photograph Nos. 7 and 8, and Flight Line 2-11,photograph Nos. 6, 7 and 8, dated October 16 and October1, respectively.
29. Wernicke, B., Axen, G. J., and Snow, J. K., 1988, Basin andrange extensional tectonics at the latitude of Las Vegas, Nevada, in Geological Society of America Bulletin, November Vol. 100
GeoSoils, Inc.
APPENDIX D
1992 Groundwater Assessment and GeoSoils Peer Review
By Kleinfelder

l"
1·
I
I
I
I
1·
I"
I
I
I
I
I
I
I
I
I . �
I
I
I
i I
I· II
I
I
I
I
I
I
'.I'
I
I
I
I
I
I
! I
I
GEOTECHNICAIJ
HYDROLOGICAL
REPORT
Il
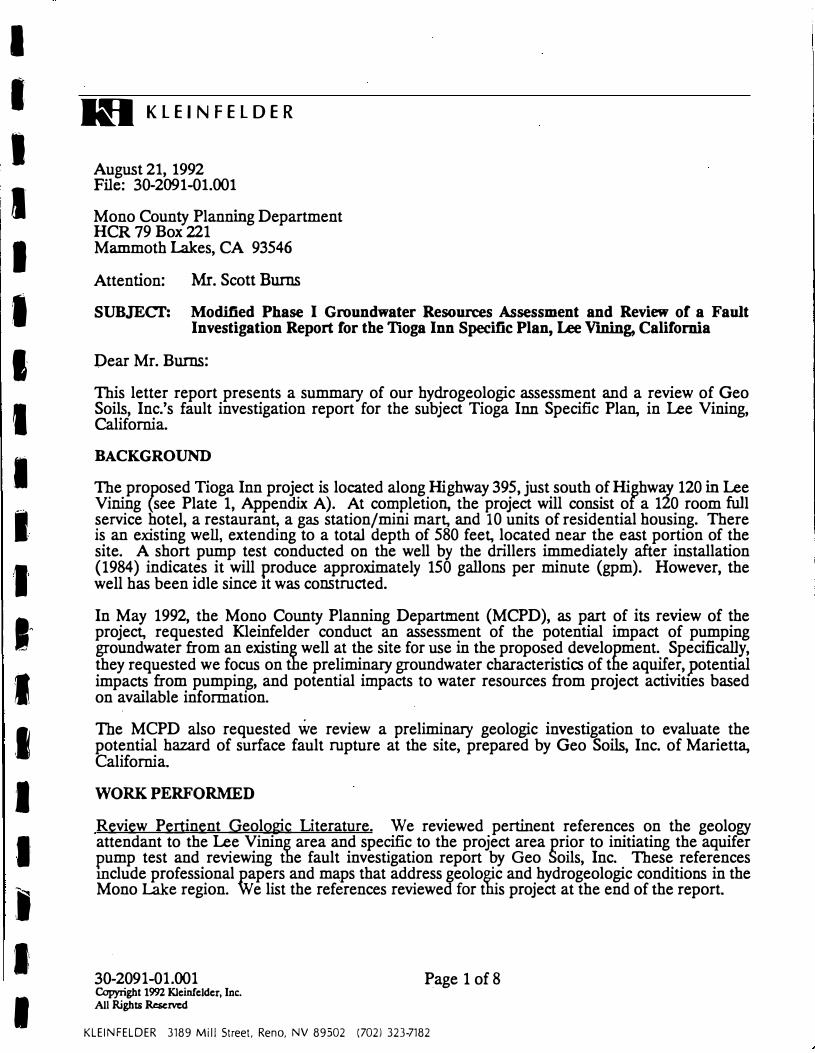
I
I
I
I
I
I
I
I
,I
I.
I'
1�
I
I
I
.1:
I
1,
I
k_� KLEINFELDER
August 21, 1992 File: 30-2091-01.001
Mono County Planning Department HCR 79 Box 221 Mammoth Lakes, CA 93546
Attention: Mr. Scott Burns
SUBJECT: Modified Phase I Groundwater Resources Assessment and Review of a Fault Investigation Report for the Tioga Inn Specific Plan, Lee Vming, California
Dear Mr. Burns:
This letter report presents a summary of our hydrogeologic assessment and a review of Geo Soils, Inc.'s fault investigation report for the subject Tioga Inn Specific Plan, in Lee Vining, California.
BACKGROUND
The proposed Tioga Inn project is located along Highway 395, just south of Highway 120 in Lee Vining (see Plate 1, Appendix A). At completion, the project will consist of a 120 room full service hotel, a restaurant, a gas station/mini mart, and 10 units of residential housing. There is an existing well, extending to a total depth of 580 feet, located near the east portion of the site. A short pump test conducted on the well by the drillers immediately after installation (1984) indicates it will produce approximately 150 gallons per minute (gpm). However, the well has been idle since 1t was constructed.
In May 1992, the Mono County Planning Department (MCPD), as part of its review of the project, requested Kleinfelder conduct an assessment of the potential impact of pumping groundwater from an existing well at the site for use in the proposed development. Specifically, they requested we focus on the preliminary groundwater characteristics of the aquifer, potential impacts from pumping, and potential impacts to water resources from project activities based on available information.
The MCPD also requested we review a preliminary geologic investigation to evaluate the potential hazard of surface fault rupture at the site, prepared by Geo Soils, Inc. of Marietta, California.
WORK PERFORMED
Review Pertinent Geologic Literature. We reviewed pertinent references on the geology attendant to the Lee Vining area and specific to the project area prior to initiating the aquifer pump test and reviewing the fault investigation report by Geo Soils, Inc. These references mclude professional papers and maps that address geologic and hydrogeologic conditions in the Mono Lake region. We list the references reviewed for this project at the end of the report.
30-2091-01.001Copyright 1992 Kleinfelder, Inc. All Rights Reserved
Page 1 of 8
KLEINFELDER 3189 Mill Street, Reno, NV 89502 (702) 323-7182
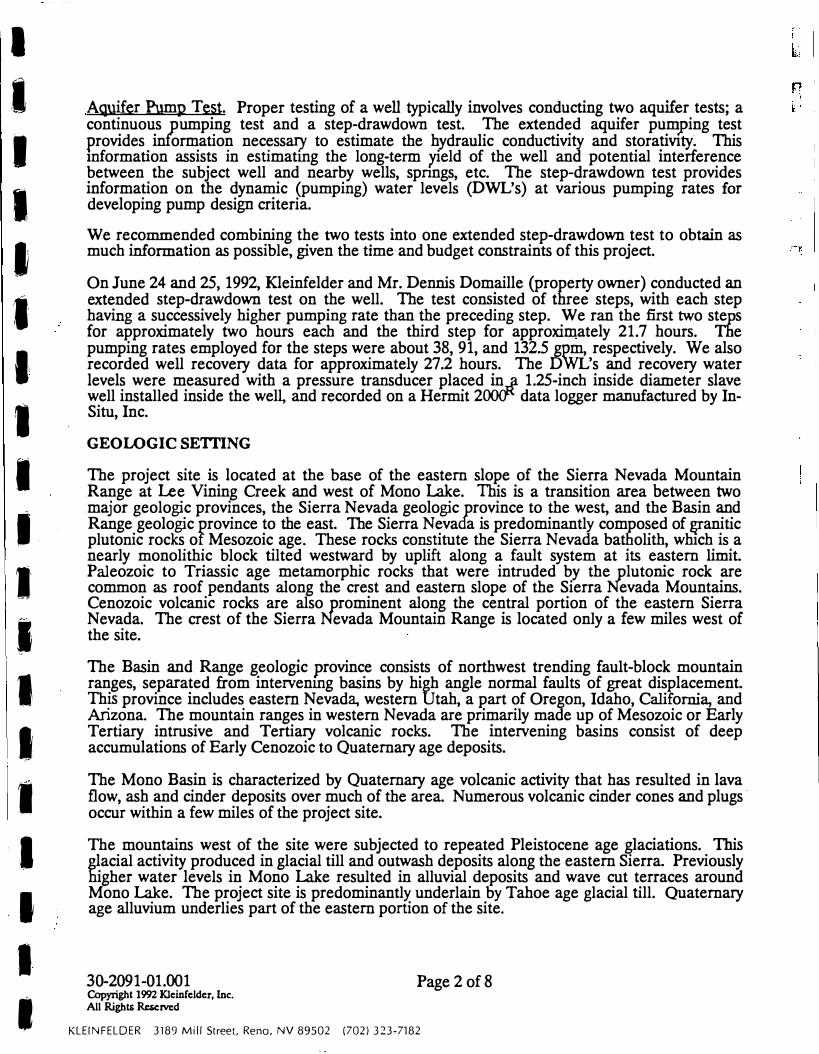
I
,I
I
I
I
:I
Ii
I
I
I
I
I
I
I
I
I
I
I
I
AQllifor Pump Test. Proper testing of a well typically involves conducting two aquifer tests; a continuous pumping test and a step-drawdown test. The extended aquifer pumping test provides information necessary to estimate the hydraulic conductivity and storatiVIty: This information assists in estimatmg the long-term yield of the well and potential interference between the subject well and nearby wells, spnngs, etc. The step-drawdown test provides information on the dynamic (pumping) water levels (DWL's) at various pumping rates for developing pump design criteria.
We recommended combining the two tests into one extended step-drawdown test to obtain as much information as possible, given the time· and budget constraints of this project.
On June 24 and 25, 1992, Kleinfelder and Mr. Dennis Domaille (property owner) conducted an extended step-drawdown test on the well. The test consisted of three steps, with each step having a successively higher pumping rate than the preceding step. We ran the first two steps for approximately two hours each and the third step for approximately 21.7 hours. The pumping rates employed for the steps were about 38, 91, and 132.5 gpm, respectively. We also recorded well recovery data for approximately 27.2 hours. The DWL's and recovery water levels were measured with a pressure transducer placed in,..il 1.25-inch inside diameter slave well installed inside the well, and recorded on a Hermit 2� data logger manufactured by InSitu, Inc.
GEOWGIC SETTING
The project site is located at the base of the eastern slope of the Sierra Nevada Mountain Range at Lee Vining Creek and west of Mono Lake. This is a transition area between two major geologic provinces, the Sierra Nevada geologic province to the west, and the Basin and Range geologic province to the east. The Sierra Nevada is predominantly composed of �anitic plutonic rocks of Mesozoic age. These rocks constitute the Sierra Nevada batholith, which is a nearly monolithic block tilted westward by uplift along a fault system at its eastern limit. Paleozoic to Triassic age metamorphic rocks that were intruded by the plutonic rock are common as roof pendants along the crest and eastern slope of the Sierra Nevada Mountains. Cenozoic volcanic rocks are also prominent along the central portion of the eastern Sierra Nevada. The crest of the Sierra Nevada Mountain Range is located only a few miles west of the site.
The Basin and Range geologic province consists of northwest trending fault-block mountain ranges, separated from intervenmg basins by high angle normal faults of great displacement. This province includes eastern Nevada, western Utah, a part of Oregon, Idaho, California, and Arizona. The mountain ranges in western Nevada are primarily made up of Mesozoic or Early Tertiary intrusive and Tertiary volcanic rocks. The intervening basins consist of deep accumulations of Early Cenozoic to Quaternary age deposits.
The Mono Basin is characterized by Quaternary age volcanic activity that has resulted in lava flow, ash and cinder deposits over much of the area. Numerous volcanic cinder cones and plugs · occur within a few miles of the project site.
The mountains west of the site were subjected to repeated Pleistocene age glaciations. This _glacial activity produced in glacial till and outwash deposits along the eastern Sierra. Previously higher water levels in Mono Lake resulted in alluvial deposits and wave cut terraces around Mono Lake. The project site is predominantly underlain by Tahoe age glacial till. Quaternary age alluvium underlies part of the eastern portion of the site.
30-2091-01.001Copyright 1992 Kleinfelder, Inc. All Rights Rc:&crvcd
Page 2 of 8
KLEINFELDER 3189 Mill Street, Reno, NV 89502 (702) 323-7182

I
I
I
I
-1
:I
I
'I
I
I
I
I
I
I
I
I
I
I
I.
FINDINGS AND DISCUSSION
Hydrogeologic ConditionsThe static water level (SWL) measured approximately 339 feet below ground surface before thestart of the test. Total drawdown at the end of the test (25.7 hours) was about 17.6 feet. Thewell recovered to about Qj' feet of the original SWL within 13.8 hours after terminating thepumping phase of the test. The �ecific capacity for the well ranged from approximately 11.1 gallons per minute per foot(gpm ft) at 38 �m to 7.5 gpm/ft at 132.5 gpm. Using the test data, we calculated drawdowns,speci c capacities, and well efficiencies for several pumping rates. In general, the calculatedwell efficiencies vary between 55.8% at 125 gpm to 28.3% at 400 gpm. These low efficienciesare not unusual considering the type of perforated casing (Mill Slot) installed in the well.Appendix B contains the step-drawdown calculations for this test. We used the recovery data to assess the hydrogeologic characteristics of the aquifer penetratedby the well. Usually, the recovery data is more reliable and accurate because there is nopotential electrical interference or turbulent flow from pumping. In addition, conducting thepumping phase in steps essentially renders the drawdown data useless in terms of estimatingthe hydrogeologic characteristics of the well. To calculate the average transmissivity {T) using the recovery data, we used a variation of theJacob straight-line method (Driscoll, 1989). The Tis the rate at which the aquifer can transmitwater through a unit width of an aquifer under a unit hydraulic gradient. We were not able tocalculate storativity because of the lack of monitoring wells for this test. The method of using recovery data involves plotting on semilog paper the residual drawdownsversus a ratio of time since the pump test began divided by the time since pumping stopped.We began collecting recovery data within 5 seconds after turning the pump off. In this time, thewell recovered approximately 8.7 feet. In addition, the pump was tu.med on for about 15minutes towards the end of the recovery phase. We do not believe the rapid initial recovery orthe brief pumping period adversely affects the data. The recovery plot usually gives a relatively straight line, from which we can calculate T. Theplot from this well indicates there is a recharge boundary encountered near the end of therecovery period, therefore, we calculated T values before and after the recharge boundary usingthe formula and assumptions as shown below:
T = 264Qds'
Where: T = transmissivity (gpd/ft)Q = pumping rate (gpm) ds' = recovery per log cycle of time {ft)Assumptions: Before Boundary
Q = 132.5 gpmds' = 2.25 ft For additional assumptions refer to Driscoll (1989).
After BoundaryQ = 132.5 gpmds' = 1.10 ft
30-2091-01.001Copyright 1992 Kleinfelder, Inc. All Rights Reserved
Page 3 of 8KLEINFELDER 3189 Mill Street, Reno, NV 89502 (702) 323-7182
Ii
I
I
11 I
-�
I
I I
'I
I
I
'I
1.
:1
I
·1
I
I
I
II
Then, the T of the aquifer(s) before boundary is apJ?roximately 15,600 gpd/ft. The T after the boundary condition increases to about 31,800 gpd/ft. These T values are probably typical of high yielding unconfined aquifers in this area (see Appendix B for the recovery data).
We calculated the potential sustained yield of the well by talcing 67% of the saturated thickness times the specific capacity. In other words, at 67% of the total potential drawdown, the well will produce 90% of its maximum yield (Driscoll, 1989). Although the subject well does not completely penetrate the unconfined aquifer, we believe this method gives a reasonable estimate of the sustained yield.
This well has 200 feet of perforations. Although the SWL is about 41 feet higher than the perforated interval, we must use that portion of the well open to the aquifer. Using thissaturated thickness, we calculated the sustained yield as follows:
Sustained Yield = (saturated thickness x 0.67) x specific capacity
Where: Saturated thickness = 200 feet Specific capacity @ 400 gpm = 3.95
Thus, the sustained yield for this well is approximately 530 gpm. We used the calculated specific capacity for a pumping rate of 400 gpm because the specific capacity will decrease as the pumping rate increases. This will give a more accurate calculated sustained yield.
Based on the calculations above, we believe the yield of this well is capable of exceeding 400 gpm. However, additional testing of this well in the form of an extended aquifer test with one or more monitoring wells, and quality analysis will be necessary before pumping at this rate. We understand the maximum production will be only about 150 gpm. The recovery data indicates that recharge into the well is quick, as is evidenced by the relatively hi_gb T for the aquifer. Actually, the aquifer probably has a much higher T than those calculatecf because we did not account for the inefficiency of the well. As discussed above, the well is not very efficient. Water level measurements taken from a more efficient well would likely have resulted in a much higher T value which woµld probably be nearer the actual T of the aquifer.
Because of the highly transmissive nature of the aquifer, and the presence of an apparent recharge boundary in the vicinity of the well, we believe there will be minimal impacts to the groundwater in terms of quantity or quality. The withdrawal of the quantity of water required for this project will likewise be minimal.
The nearest surface water source is the generally north trending Lee Vining Creek, located about 2,800 feet northwest of the site. Based on the topography in the area, the apparent groundwater flow direction is to the east-northeast. Considenng this, and the depth of the aquifer below ground surface, it is highly unlikely that the well will draw water from surface water sources. Rather, surface waters percolating into the subsurface, in addition to eastward groundwater flow from the Sierra Nevada, will serve to recharge the aquifer.
30-2091-01.001 Copyright 1992 Kleinfelder, Inc. All Rights Rc5crvcd
Page 4 of 8
KLEINFELDER 3189 Mill Street, Reno, NV 89502 (702) 323-7182
r
t.
I
I
I
II
I I I -
I
I
I
I
I'
I
I
I
I
I
I
I
I
I
Fault Investigation Report
The following presents the results of our review of a geologic investigation report entitled "Preliminary Geologic Investigation, 83± -acre Parcel, Tentative Parcel Map No. 34, Lee Vining Area, Mono County, California." The purpose of this report was to evaluate the hazard of primary surface rupture at the subject site. We did not assess other potential geologic hazards at the site. The subject report was prepared by Geo Soils, Inc. of Marietta, California, for Mr. Dennis Domaille of Mammoth Lake, California.
The purpose of our review was to evaluate the adequacy of the subject geologic report in terms of potential hazard of surface fault rupture at the site. Our review was based on Kleinfelder's previous experience in the site area and the. "Guidelines for Evaluating the Hazard of Surface Fault Rupture" presented in Appendix C of California Division of Mines and Geology (CDMG) Special Publication 42: "Fault-Rupture Hazard Zones in California," by E. W. Hart, (1990).
As discussed above, the subject site is located near the town of Lee Vining in Mono County, California. The Mono Lake fault was previously inferred by others to trend across the site. Consequently, the State of California required a geologic study of the fault under the AlquistPriolo Specral Studies Zones Act of 1972. An Alquist-Pnolo Special Studies Zone was designated along the Mono Lake fault in 1985 and is shown on the NEl/4 Mono Craters, California 7.5 Minute Quadrangle Map. The Mono Lake fault was included in a regional evaluation of faults by Associate Geologist William A Bryant with the CDMG. The results of this regional evaluation are contained in the CDMG Fault Evaluation Report FER-155, "Faults in Bridgeport Valley and Western Mono Basin, Mono County," by Bryant (1984).
Discussion The scope of services performed by Geo Soils included:
• Review of geologic literature and photolineament analysis of available aerialphotographs;
• Site reconnaissance by a geologist;
• Subsurface exploration consisting of about 1,500 feet of trenches excavated 10 to15 feet below existing grade;
• Geologic analysis of the data collected; and
• Preparation of the subject report.
The report contains a description of the proposed development, methods of study, regional �eologic setting, and several plates. In addition, the report was signed by a registered geologist m the State of California
The scope of services performed by Geo Soils is in general accordance with the CDMG guidelines and similar to the scope of other geologic studies for similar projects at the time the study was performed. In addition, the subsurface exploration performed for the project was relatively extensive. However, Geo Soils did not review CDMG FER-155 and other recent literature referenced in FER-155 pertaining specifically to faulting in the site area. CDMG FER-155 presents evidence of active fault displacement near the project site with locations of fault-related features shown on a regional fault map.
30-2091-01.001Copyright 1992 Kleinfelder, Inc. All Rights Reserved
Page 5 of 8
KLEINFELDER 3189 Mill Street, Reno, NV 89502 (702) 323-7182
I
I
I
I
I
I
I
I
I
I
I
I
,I
I
I
I
I
I
I
The Geo Soils report does not state specific conclusions concerning the location and existence ( or absence) of hazardous faults on or adjacent to the site, or the relative potential for future surface displacement. The likelihood of future ground rupture may be stated in semiquantitative terms such as low, moderate, or high, or in terms of slip rates estimated for specific fault segments.
In summary, based on our knowledge of the planned development and guidelines wven by. the State of California, the scope of services performed by Geo Soils, Inc. for the subJect geologic study was reasonably adequate to evaluate potential fault rupture at the subject site. However, a key reference (CDMG FER-155) for the Mono Lake fault was not stated in the references reviewed by Geo Soils for their study. In addition, the subject report does not state conclusions concerning the existence or absence of hazardous faults on the subject site, or the relative potential for future surface displacement.
CONCLUSIONS
We have based the following conclusions on the data collected during this investigation. Theseconclusions are subject to the limitations stated in this report, and may change if additional information becomes available. The following is a summary of our conclusions:
Aquifer Test:
• The results of the extended pump test indicate the well can produce a sustainedyield of approximately 530 gpm. The results also indicate there is a rechargeboundary encountered near the end of the test. The calculated T before and
• after the boundary is approximately 15,600 gpd/ft and 31,800 gpd/ft, respectively.
• Pumpin� woundwater at the proposed rate of no greater than 150 gpm shouldhave m1mmal impact on the quantity and quality of the groundwater or onsurface waters in the area.
Fault Investigation Report Review:
• The subject geologic study by Geo Soils, Inc. was reasonably adequate to evaluatepotential fault rupture at the site. However, a key reference (CDMG FER-155)was apparently not reviewed for the study.
• The subject report does not state conclusions concerning the existence or absenceof faults on the site, or relative potential for future surface displacement.
RECOMMENDATIONS
Based on our findings and conclusions above, we recommend the following:
• Request Geo Soils, Inc. review the CDMG Fault Evaluation Report FER-155;and
• Request Geo Soils, Inc. modify their report to include their review of FER-155and state their conclusions regarding the existence or absence of faulting on thesite.
30-2091-01.001 Copyright 1992 Kleinfelder, Inc. All Rights Reserved
Page 6 of 8
KLEINFELDER 3189 Mill Street, Reno, NV 89502 (702) 323-7182
r l. f.-
n
I:
•. I
I
I
I
I
I
I
I
I
I
I
I
I
I
I
I
I
I
I
I
REFERENCES
Bryant, W.A, (1984). Faults in Bridgeport Valley and Western Mono Basin, Mono County: California Division of Mines and Geology Fault Evaluation Report FER-155. California Division of Mines and Geology, 1985, Alquist-Priolo SJ?ecial Studies Zones - NE 1/4 Mono Craters, 7.5 Minute Quadrangle Series: California Division of Mines and Geology, 1:24,000. Driscoll, Fletcher G., 1989, Groundwater and Wells: Johnson Filtration Systems, Inc., St. Paul, Minn., 1089 p. Geo Soils, Inc., (April 4, 1991). Preliminary Geologic Investigation 83± Acre Parcel, Tentative Parcel Map No. 34, Lee Vining Area, Mono County, California. Unpublished Report, Geo Soils File No. W.O. 431-A-RC. Hart, E.W., (1990). Fault-Rupture Hazard Zones in California. California Division of Mines and Geology, SP-42. Kistler, R�j1
p966). Geologic Maps of the Mono Craters Quadrangle, Mono and TuolumneCounties, · ornia. United States Geological Survey, Map GQ-462. LIMITATIONS
The services provided under this contract, as described in this report, include professional opinions and judgments based on the data collected and analyzed. We performed these services accordin� to currently accepted engineering geology practices for water resources and geotechnical engrneering in Northern California. We base this report on information derived from the following:
•
•
•
•
Data from selected available literature; Extended step-drawdown aquifer test; Copy of the Fault Investigat10n Report by Geo Soils, Inc.; and Our knowledge of and experience m the local area .
We consider the information contained in this report to be valid for a period of one year from the date of the report. This report does not provide a warranty as to variable subsurface conditions which may actually exist. Do not assume this report applies outside the specific project area. In addition, one should recognize that definition and evaluation of geologic and bydrogeologic conditions is a difficult and inexact art. Geologists and hydrogeologists must occasionally make general judgments leading to conclusions with incomplete knowledge of the ieologic history, subsurface conditions, and hydraulic characteristics present. To reduce the inherent risk associated with evaluating water resources, the client should request that the geologists and hydrogeologists use more extensive studies including subsurface exploration.
30-2091-01.001Copyright 1992 Kleinfelder, Inc. All Rights Reserved
Page 7 of 8
KLEINFELDER 3189 Mill Street, Reno, NV 89502 (702) 323-7182
I
I
I
I
I
I
I
I
I
I
I
I
I
I
I
I
I
I
I
ff the client wishes to reduce the uncertainty beyond the level associated with this study, Kleinfelder should be notified for additional consultation.
Very truly yours,
KLEINFELDER, INC.
MWF:RHD:jhs
30-2091-01.001 Copyright 1992 Kleinfelder, Inc. All Rights Rc5crvcd
Page 8 of 8
KLEINFELDER 3189 Mill Street, Reno, NV 89502 (702) 323-7182
f
.. ' I
.. I
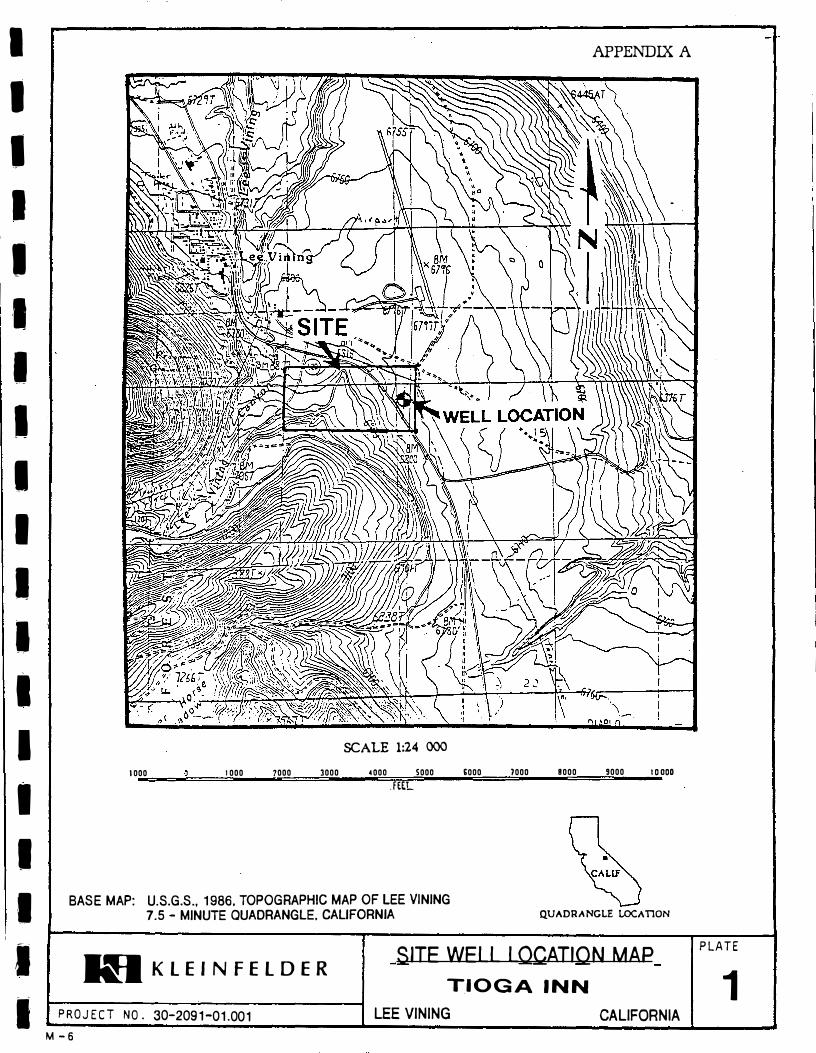
I
I
I
I
I
I
I
I
I
I
I
I
I
I
I
I
I
I
I
APPENDIX A
SCALE 1:24 000
1000 I 000 7000 3000 4000 5000 &000 7000 8000 9000 ID ODO
.FEEL
BASE MAP: U.S.G.S., 1986, TOPOGRAPHIC MAP OF LEE VINING
7.5 - MINUTE QUADRANGLE. CALIFORNIA QUADRANGLE LOCATION
k.,. KLEIN FELDERSITE WELL LOCATION MAP
TIOGA INN
PROJECT NO. 30-2091-01.001 LEE VINING CALIFORNIA
M -6
PLATE
1

I
I
I
I
I
I
I
I
I
I
I
I
I
I
I
I
I
I
I
APPENDIX B
STEP-DRAWDOWN TEST CALCULATIONS
PROJECT NO: 30-2091-QJ QQJJOB NAI\-IE: Tio a Inn
DATE OF TEST: June 24-25 1992
TEST LOCATION: Approx, 200 Ft, E, of Hwy 395. 2000 ft, s, of Junction with Hwy.120
WELL NO: ________ _ STATIC WATER LEVEL: - 340 +
CALCULATED BY: _...,:.M.;.;. w
....:.•:..,.._
F_i �es;.__
___ _ - 339
EXPU..'l'ATION OF SYMBOLS
TOC @
CL
Q = well discharge (gpm) s = to�) drawdown {rt)
B = Formation loss (s/Q) {from graph) C = Well loss (s/(1-) (from graph)
_As = drawdown at end of step (ft) E = Aquifer Efficiency
EQUATIONS:
Specific drawdown: Specific c:1pacity: Calculated drawdown: Aquifer Efficiency:
s/Q {ft/gpm) Q/s -{gpm/ft) Sc = BQ + cQ- (ft)
E = 1/[l + {C/B)Q] (%)
Total
HRS
Pump Step- Specific �ecific Rate Drawdown Drawdown D
/<awdown aP,acitY,.
Step Q (gpm) AS (ft) s (ft) s Q (ft/gpm) Q/s (gpmj'ft)
1 38 3;411 3.411 0.089.8
2 91 6,697 10,108 0,1111
3 132.5 7.502 17.610 0,1329.
Calculated Drawdown, Specific Capacity, Well Efficiency
Pump Formation Rate Loss Q (gpm) BQ (ft)
125 8.96
150 10.76
200 14.34
300 2L51
400 28.68
From graph: B = 0, 0717
C = 0. 000454
SDTCALC
Well Loss
cQ2 (ft)
7 ,09.
10 .22
18.16
40.86
72.64
s/Q
s/Q:-
falculated Calculated �ecific Drawdown apacity
sc(ft) Q/sc(gpm/ft)
16,05 ] ,]9.
20,98 7,15
32,50 6,15
62.37 4.81
101. 32 3,95
11.14
9.00
],52
Well Efficiency E (%)
55,8
5.1, 3
44,1
34.5
28,3
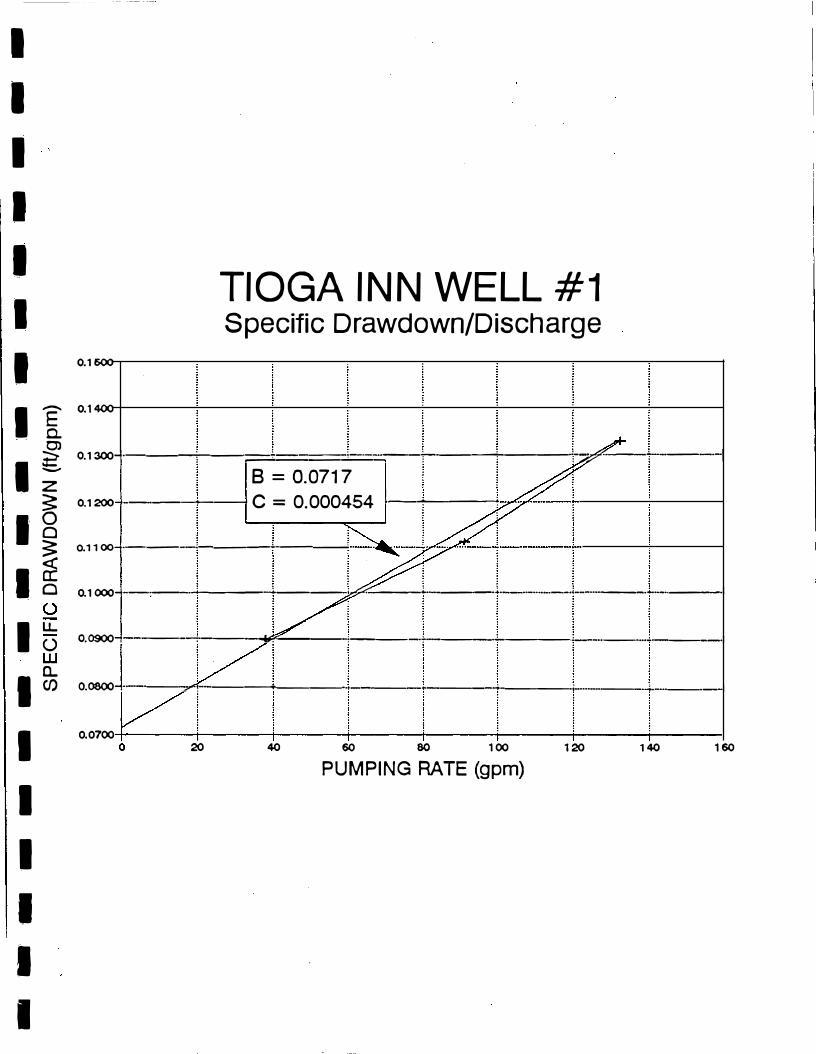
I
I
I
I
I
I
I
- ------ - --
0.1600
I I 0.1400
TIOGA INN WELL #1 Specific Drawdown/Discharge
.. 0) ? 0.1300-j---t---;=::========:;---t-----t---"i-�-.:;__-t---l
I � s = 0.0111 ·
� o.,200·-4--------lc = 0.000454 �....._ _ __.
18 � 0.1100-t-----'-------_____.
I� . 0.1000-1-�_.._ _ ___... ___ � _ _...__� __ .;__ _ _....__--J
I u..(.)
0.0900-;-----;--�:;._._--;----.,------'---"----_._---l
I a.(/) 0.0800-r---.r!-----...------.....--.;.....-----.---l
I0.0700
20 40 60 80 100 120 140 160
PUMPING RATE (gpm)
I
I
I
I
I
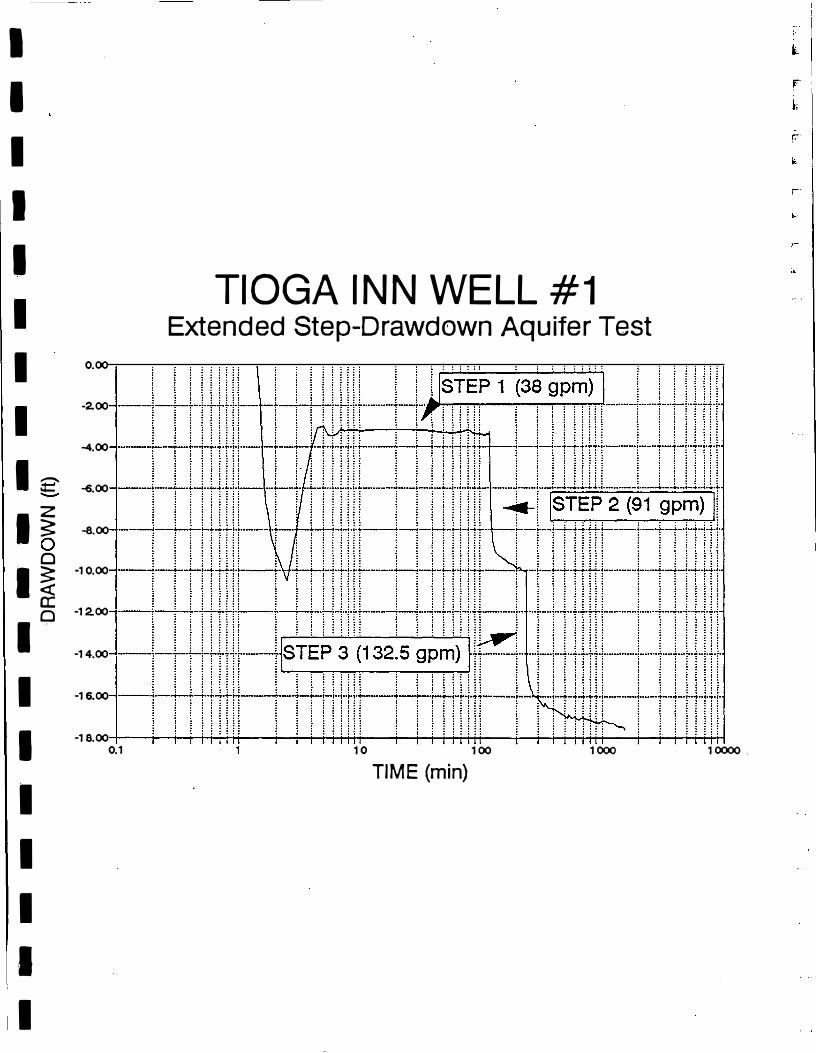
I I
:1
I
I
I
I TIOGA INN WELL #1
Extended Step-Drawdown Aquifer Test
I 0.00
I -2.00
-4.00
1£ -6.00
,� -8.00
0
. � -10.00
I< a:
-12.000
1· -14.00
I -16.00
I-18.00
0.1 10 100 1000 10000.
TIME (min)
I
I
I
I
I
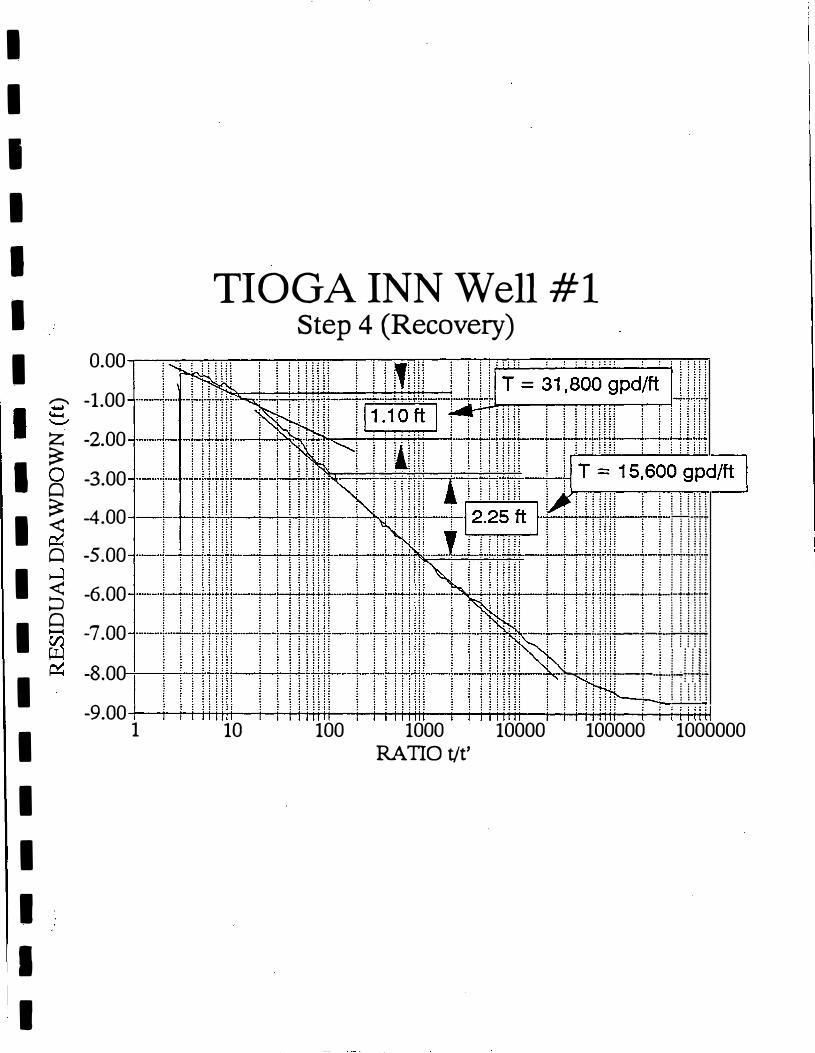
I
I
I
I
I
I
I
I
I
I
I
I
I
I
I
I
I
I
0.00
,,-.., -1.00
z -2.00 �
-3.00Q �
-4.00<
Q -5.00
< -6.00:::,Q
-7.00
-8.00
-9.001
TIOGA INN Well #1 Step 4 (Recovery)
� � � H �.. -·��,. : : : :: :: : : :: : : : : :: :
ii il-l-t l l i ! � !
..__..._......rrnn __ t} })))
·"-'-'--'-...,..__-----· i i i i i i
-��--;.-.+-+-+!U-IHIi! 11 i : : : :: :
10 100 1000 10000 100000 1000000
RATIO t/t'

---
I
.I VISUAL
I IMPACT
I ANALYSIS
I
I
I
I
I
I
I
I
I
I
I
I
I
I
I
- ----
I
I
I
I
I
I
I
I
I
I
I
I
I
I
I
I
I
I
I
-- - ---
DRAFT
VISUAL IMPACT ASSESSMENT
FOR
THE TIOGA INN SPECIFIC Pl.AN EIR
LEE VINING, CALIFORNIA
Prepared for:
MONO COUNTY
November 1992
Prepared by:
CERTIFIED/EARTH METRICS 7000 Marina Boulevard, 4th Floor
Brisbane, GA 94005 (415) 742-9900
Sl2046B
I
I
I
I
I
I
I
I
I
I
I
I
I
I
I
I
I
I
I
EXISTING SETTING
Visual Setting. Mono County offers some of the most diverse terrain features and scenic resources to be found in any area of the country. The proposed project site is situated in the Mono Basin at the intersection of U.S. Highway 395 (US 395) and State Route 120 (SR 120). The site borders the federally
· designated Mono Basin National Forest Scenic Area, a nationally recognizedvisual resource. The basin's visual resources include Mono Lake and a diversespectrum of dramatic landforms such as tufa towers, glacial moraines, andyoung volcanic features. Within a 20 mile radius of the site a number ofvisually significant resources attract the area's many visitors, includingYosemite National Park, Inyo National Forest, June Lake, Mammoth Lakes, Topaz
· Lake, and Devil's Postpile National Monument.
The proposed project site lies on the outskirts of Lee Vining, a small, rustic commu�ity. Many different architectural styles can be found in Lee Vining from trailer parks to "alpine lodge" and old west styles. Lee Vinin·g marks the southern gateway to the famous Bodie Ghost Town, an authentic old western gold mining town.
The project site consists of a gently sloping grade trending north to south with a ridgeline running through the center, forming two upper "plateaus" (see Plates A and B). The site's varied terrain is vegetated with a dense cover of sagebrush, whitethorn and other low lying shrubs, as well as a sparse covering of Jeffrey and Pinion pines. The site's barren, chaparral landscape is characteristic of the Mono Basin environment.
View Opportunities. View opportunities are those views available from the project site. The project site affords scenic vistas to Mono Lake, Paoha Island, and Mono Basin to the north (see Plate C); Williams Butte and the Ansel Adams Wilderness to the south (see Plate D); and Crater Mountain to the east. View opportunities are more dramatic from the site's upper elevations due to increased elevation of the viewer's vantage point.
View Corridors. A view corridor is a vantage point which offers aesthetically pleasing views or panoramas to a substantial number of people. The major view corridors of consideration in the impact analysis of the proposed project are the views from SR 120 looking north to Mono Lake and Mono Basin (SR 120 - Mono Basin corridor), and the views from the intersection of SR 120 and US 395 looking south up Tioga Pass (SR 395 - Tioga Pass corridor). The SR 120 - Mono Lake corridor is significant in that it marks an important first view to Mono Lake for motorists travellin·g down Tioga Pass. There is currently a scenic turnout with an interpretive information kiosk on SR 120 adjacent to the project site (see Plate E). The US 395 - Tioga Pass corridor is significant in that it marks the intersection of two highways which experience a high volume of vehicle traffic, and offers aesthetically pleasing views to the dramatic peaks of the eastern Sierra (see Plate F).
Other view corridors which would be potentially impacted by the proposed project are views from the community of Lee Vining, and views from across Mono Basin (Black Point, Mono County Park, lower Lee Vining Canyon). Views to the project site from these vantage points are illustrated in Plates G, H,, I and J. Due to the relative distance of the project site to any development, theproject site would not be readily perceptible from this vantage point.
i ,. i
. _)
I
I
I
I
I
I
I
I
I
I
I
I
I
I
I
I
I
I
I
Scenic Highways Management. There are no official State of California designated scenic highways in the vicinity of the project site. The sectio.n
of SR 120 that runs adjacent to the project site is one of several highway segments for which the State has completed Scenic Highway Reports, indicating possible future consideraiion for official state scenic highway designation.
In a mandate to manage the County's scenic resources, Mono County adopted a Scenic Highways Element in 1981. Mono County has designated the road segments of US 395 and SR 120 running adjacent to the project as part of the Mono County Scenic Highway system. These road segments are man�ged through the goals, policies and implementation measures of the Scenic Highways Element. Most of the goals, policies and implementation measures of this element have been reworked and incorporated into the Conservation/Open Space Element of the Mono County General Plan Update which is currently in draft form. The county has applied to the state for an extension to the time period required to certify the Draft General Plan. Therefore, the state has required that all projects currently under consideration be subject to the policies of the Draft General Plan Update.
The Scenic Highways Element (1981) and Draft General Plan define a "Scenic Highway" as:
Any freeway, highway, road, street, boulevard, or other public right-of-way which traverses an area of unusual scenic quality and has been designated as a scenic Highway by the County Board of Supervisors and/or the State of California.
Similarly, these planning documents define a "Scenic Highway Corridor" as:
The area of land generally adjacent to (within 1000 feet) and visible from the highway, which requires protective measures to insure perpetuation of its scenic qualities. Scenic Highway Routes consist of both the public right-of-way and the scenic corridor.
The following goals, objectives, policies and actions of the Conservation/Open Space Element of the Draft Mono County General Plan are particularly relevant to the proposed project (se� Appendix A for a complete list of visual resource policies and the existing Scenic Highways Element):
GOAL. Protect and enhance the visual resources and landscapes of Mono County.
OBJECTIVE A. Maintain and enhance visual resources in the county.
Policy 3: Preserve the visual identity of areas outside communities.
Action 3.1, Action 3.2, Action 3.4
Policy 4: Protect significant scenic areas by maintaining land in those areas in public ownership.
Action 4.2, Action 4.3, Action 4.4, Action 4.5
OBJECTIVE B. Maintain a countywide system of state and county designated scenic highways.
I
I
I
I
I
I
I
I
I
I
'I
I
I
I
I
I
I
OBJECTIVE C. Ensure that development is visually compatible with the surrounding community and/or natural environment.
Policy 1: Future development projects shall avoid potential significant visual impacts or mitigate impacts to a level of non-significance, unless a statement of overriding considerations is made through the EIR process.
Action 1.1
Policy 2: Future development shall be sited· and designed to be in scale and compatible with the surrounding community and/or natural environment.
Action 2.1, Action 2.2, Action 2.3, Action 2.4, Action 2.5, Action 2.9, Action 3.1, Action 3.2, Action 3.3
Policy 4: Promote revegetation and reforestation programs along county roads, including designated scenic highways.
Action 4.1
Policy 5. Minimize the visual impact of signs within designated scenic highway corridors.
Action 5.1, Action 5.3
OBJECTIVE D. Heighten awareness of Mono County's unique visual environment.
Policy 1: Tourist facilities should be located to take advantage of scenic views.
Action 1.1, Action 1.2
Policy 2: Provide roadside improvements for designated county and state scenic_ highways.
SR 120 up Lee Vining Canyon has been designated as a National Scenic Byway. This program designates highways that traverse scenic areas in public lands. These roads highlight an area's special scenic and recreational values and further serve to increase public awareness of those lands and resources. The byways further highlight a variety of resources, management opportunities, and activities. The U.S. Forest Service is currently in the process of developing an interpretive program for the SR 120 scenic byway.
Mono Basin National Forest Scenic Area. The proposed project site is adjacent to the Mono Basin National Forest Scenic Area (scenic area). The Inyo National Forest and U.S. Department of Agriculture have developed a
Comprehensive Management Plan for the scenic area which manages the area's natural resources. Although the project site is not within the scenic area's boundaries, development of the site may affect views to and from the scenic area. It would therefore be beneficial for the proposed project to conform with the scenic area's standards and management prescriptions. Areas adjacent to the project site that are within the scenic area boundary and along SR 120 and US 395 are mostly within the designated ''Developed Recreation Zone." This designation is designed to "maintain existing developments and provide for new services and/or facilities in support of visitor use needs." The following
� ' I I :< · . 1
-1:�1
-_ l
. j
I
I
I
I
I
I
I - I
I j
I
I l I I I I
I _J
,I
standards, guidelines, and management prescriptions of the scenic area Comprehensive Management Plan are particularly relevant to the proposed project:
Scenic Area Standards and Guidelines:
Do not allow new overhead lines outside of existing utility corridors, which are visible from sensitivity level 1 roads and trails. Sensitivity level 1 observation points include U.S. 395, and Highways 120, 167; Lundy Canyon Road; Cemetery Road (from 395 to County Park); the visitor center; and South Tufa, Panum Crater, Navy Beach, Old Marina, County Park, and Black Point visitor sites.
Management Prescriptions:
Developed Recreation Zone - Manage vegetative setting in and adjacent to the zone to meet the Visual Quality Objectives (VQO) of retenti?n within the foreground zohe.
Strive to meet the VQO of retention but do not exceed partial retention standards for all facilities and developments as seen from sensitivity level 1 travel routes or occupancy sites. For distances greater than 1.2 mile from the viewing location, meet retention standard.
Plant and maintain vegetation at developed sites to provide screening and a natural appearing setting. Favor native species, but historically introduced species and cultivated equivalents of native species may be used.
Facilities should borrow shape, color, and texture from the natural setting.
National Forest Visual Management System. The project site is adjacent to lands managed by the U.S. Forest Service. The Visual Management System (VMS) is applied to all management activities on National Forest Lands. The system establishes VQOs which are based on a combination of variety class and sensitivity level. The variety class is determined by classifying the landscape into one of three different degrees of variety: Distinctive, Common, or Minimal. The sensitivity level is determined by measuring viewers' concerns for visual quality and assigning a level of sensitivity: Level 1, highest sensitivity; Level 2, average sensitivity; and Level 3, lowest sensitivity. Based on these classifications, the land is assigned VQOs, describing the level of acceptable alteration of the natural environment. The objectives are as follows:
Preservation. Allows only ecological changes on the land. The only management impact allowed is very low visual impact recreation facilities.
Retention. Allows management act1v1t1es which repeat form, line and color already found in the natural landscape.
Partial Retention. Allows management activities to repeat the form, line, and color of the natural landscape; other changes can be made provided the visual impact is dominated by the natural landscape.
I
I
I
I
I
I
I
I
,I
I
I
I
Modification. Management activities may visually dominate the natural characteristics of the environment. The management activities must borrow from the natural characteristics of the environment.
Maximum Modification. Management activities of vegetative and landform alterations may dominate the natural characteristics of the environment.
Although the project site itself would not be subject the VMS, it should be noted that Forest Service lands may be subjected to changes in classification or visual quality upon completion of the proposed project.
IMPACTS
Standard of Significance. Based on CEQA Guidelines, the adverse visual impacts of a project will only be significant if they would have a "substantial, demonstrative negative visual or aesthetic impact." This determination is based on several criteria including observer position, views, view corridors, existing and proposed screening, backdrop, the characteristics and building materials of the proposed development, and the existing visual character of the surrounding area. As the determination of significance is often a subjective judgement, heavy emphasis is placed on the goals and policies of the Mono County General Plan and the Scenic Highways Element in the interpretation of impacts. The County has further defined its standard of significance in the Conservation/Open Space Element (see Visual Resources objective C, policy 1, action 1.1):
Examples of a substantial demonstrable negative aesthetic effect include:
1) Reflective materials2) Excessive height and/or bulk3) Standardized designs which are utilized to promote specific commercial
activities and which are not in harmony with the community atmosphere4) Architectural designs and features WQich are incongruous to the
community or area and/or which significantly detract from the naturalattractiveness of the community or its surroundings.
Visual Character. The proposed project would transform the existing natural landscape into a multi-use development (see Plate K). In considering whether the proposed project could be considered to have a "demonstrable neg�tive effect," the project can be evaluated by the standards of the Conservation/Open space element (objective C, policy 1, action 1.1. See "Standard of Significance" above).
REFLECTIVE MATERIALS. A complete list of proposed building materials was not provided as part of the application for the proposed project. Contact with the project applicant indicated that glare resistant glass and roofing materials would be used in project construction. Use of building materials which would cause excessive amounts of light and glare is identified as a potentially significant impact.
EXCESSIVE HEIGHT AND/OR BULK. The proposed hotel would not exceed the roof elevations of 30 feet from finished floor elevations. Preliminary hotel designs, with gabled roofs, wood beams, and stone columns would break up the northern facade of the hotel, thereby minimizing the perception of a
"bulky" design. Similarly the restaurant, service station/mini-mart, and
- ...
' '
f-
]
I
I
I
I
I
I
I
I
I
I
I
I
I
I
I
I
housing portions of the proposed project would not exceed 30 feet in height or be considered to have excessive bulk. No significant aesthetic impact would be expected relating to excessive height and bulk if the proposed project design were implemented.
STANDARDIZED DESIGNS. Although the hotel and restaurant portions of the proposed project call for similar basic design and building materials, it would not be considered a "standardized" design which promotes certain commercial activity. The proposed alpine style architecture would blend with the environment and be congruous with other structures in Lee Vining. As no standardized, commercialized designs are proposed, no significant aesthetic impacts would be expected.
ARCHITECTURAL DESIGNS. As stated above, the proposed architectural design and use of natural and naturally colored building materials (ie. stone walls, wood beams, green roof, etc.) would increase blending with the existing surrounding natural terrain. The proposed project design would not cause significant aesthetic impacts relating to its architectural design.
As no detailed landscape plans have been drawn for the proposed project, visual screening for the proposed project remains to be defined. Landscape vegetation and other visual buffers are of vital importance to provide an adequate transition from the manmade environment to the natural environment. Landscape designs have the potential to temper maruriade features on site and minimize their visual prominence. As cited in the Conservation/Open Space Element of the Draft Mono County General Plan, buildings must blend with the natural environment. Inadequate designs would reduce natural blending and cause potentially significant visual and aesthetic impacts.
The type and design of the proposed signage at the project site have not been included as part of the project application. Signs which do not blend with the natural environment or cause excessive ,light and glare would not be compatible with the stated goals, policies, and actions of the Conservation/ Open Space Element, or the Mono County Sign Ordinance. Improper sign design is identified as a potentially significant impact.
The type and design of nighttime lighting on the project site has not been defined as part of the project application. lighting fixtures and configurations which project excessive light and glare to its surroundings would be inconsistent with Objective C, policy 1, Action 2.1 h of the Conservation/Open Space element which calls for lighting to be shielded and direct. This is identified as a potentially significant impact·.
View Opportunities. The proposed project would allow privately owned land to become available for public use. Due to the richness of the view opportunities present on the project site, aesthetically pleasing views would become available to a larger number of people. Views would be particularly pleasing from the proposed restaurant due to its elevated position on the site. Enhanced public access to view opportunities can be considered a beneficial impact.
View Corridors. The proposed project would cause existing unobstructed view corridors to become partially obstructed. As the photo simulations in Plate H demonstrate, the foreground views of the US 395 - Tioga Pass corridor would be
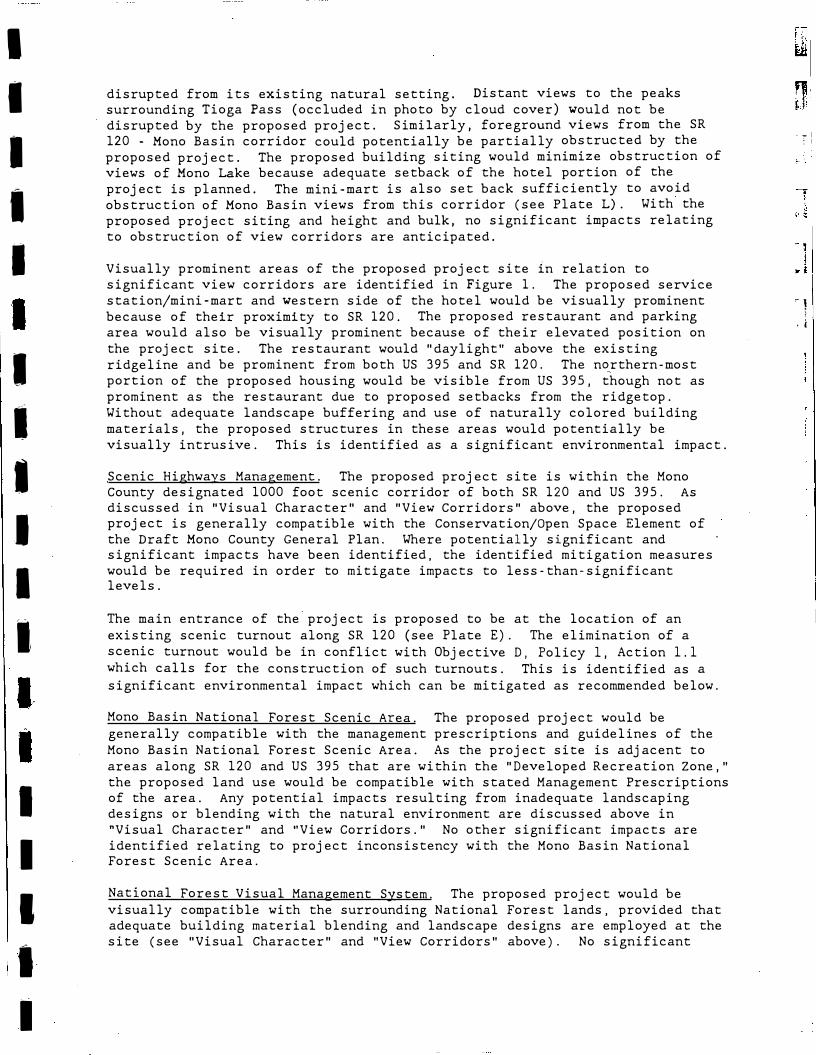
I
I
I
I
I
I
I
I
I
I
I
I
I
I
I
I
disrupted from its existing natural setting. Distant views to the peaks surrounding Tioga Pass (occluded in photo by cloud cover) would not be disrupted by the proposed project. Similarly, foreground views from the SR 120 - Mono Basin corridor could potentially be partially obstructed by the proposed project. The proposed building siting would minimize obstruction of views of Mono Lake because adequate setback of the hotel portion of the project is planned. The mini-mart is also set back sufficiently to avoid obstruction of Mono Basin views from this corridor (see Plate L). With the proposed project siting and height and bulk, no significant impacts relating to obstruction of view corridors are anticipated.
Visually prominent areas of the proposed project site in relation to significant view corridors are identified in Figure 1. The proposed service station/mini-mart and western side of the hotel would be visually prominent because of their proximity to SR 120. The proposed restaurant and parking area would also be visually prominent because of their elevated position on the project site. The restaurant would "daylight" above the existing ridgeline and be prominent from both US 395 and SR 120. The n�rthern-most portion of the proposed housing would be visible from US 395, though not as prominent as the restaurant due to proposed setbacks from the ridgetop. Without adequate landscape buffering and use of naturally colored building materials, the proposed structures in these areas would potentially be visually intrusive. This is identified as a significant environmental impact.
Scenic Highways Management. The proposed project site is within the Mono County designated 1000 foot scenic corridor of both SR 120 and US 395. As discussed in "Visual Character" and "View Corridors" above, the proposed project is generally compatible with the Conservation/Open Space Element of the Draft Mono County General Plan. Where potentially significant and significant impacts have been identified, the identified mitigation measures would be required in order to mitigate impacts to less-than-significant levels.
The main entrance of the-project is proposed to be at the location of an existing scenic turnout along SR 120 (see Plate E). The elimination of a scenic turnout would be in conflict with Objective D, Policy 1, Action 1.1 which calls for the construction of such turnouts. This is identified as a significant environmental impact which can be mitigated as recommended below.
Mono Basin National Forest Scenic Area. The proposed project would be generally compatible with the management prescriptions and guidelines of the Mono Basin National Forest Scenic Area. As the project site is adjacent to areas along SR 120 and US 395 that are within the "Developed Recreation Zone," the proposed land use would be compatible with stated Management Prescriptions of the area. Any potential impacts resulting from inadequate landscaping designs or blending with the natural environment are discussed above in "Visual Character" and "View Corridors." No other significant impacts are identified relating to project inconsistency with the Mono Basin National Forest Scenic Area.
National Forest Visual Management System. The proposed project would be visually compatible with the surrounding National Forest lands, provided that adequate building material blending and landscape designs are employed at the site (see "Visual Character" and "View Corridors" above). No significant
- - I '. I
" l . i

I
I
I
I
I
I
I
I
I
I
I
I
I
I
I
I
I
impacts relating to project inconsistency with the Forest Service's VMS are identified.
MITIGATION MEASURES
Unless otherwise noted, the following mitigation measures would mitigate significant and potentially significant impacts to less-than-significant levels:
Visual Character
The project applicant should fully comply with all pertinent objectives, policies, actions of the Draft Conservation/Open Space Element of the Mono County General Plan (draft May 1992).
Only glare resistant glass and building materials should be used in the construction of the proposed project. Prior to project approval, the applicant should submit a detailed list of proposed building materials and colors to the Mono County Planning Department. The planning director should approve building material list prior to project approval.
Nighttime lighting should be designed with low mounting heights, shielded and direct. Nighttime lighting should be minimized to that necessary for safety and security.
The project applicant should submit to the Mono County Planning Department a detailed landscape plan which specifies design, location, and species of vegetation. Existing trees on the project site should be maintained on site and incorporated into landscape plans. As required by County policy, landscape plans should be submitted and approved prior to issue of use permits.
View Corridors
In developing the landscape plan, the applicant should take the visually prominent areas identified in Figure 1 into special consideration. In these identified areas, mature, native, drought resistant species should be planted in a manner which maximizes visual screening quality. Landscape berms should be employed in the restaurant parking area and on the ridgeline where homes are proposed.
Scenic Highways Management.
If necessary, the existing Scenic Turnout and Kiosk near the proposed entrance of the project site should be moved at the developer's expense to a location agreed upon by the Mono County Planning Department and U.S. Forest Service.
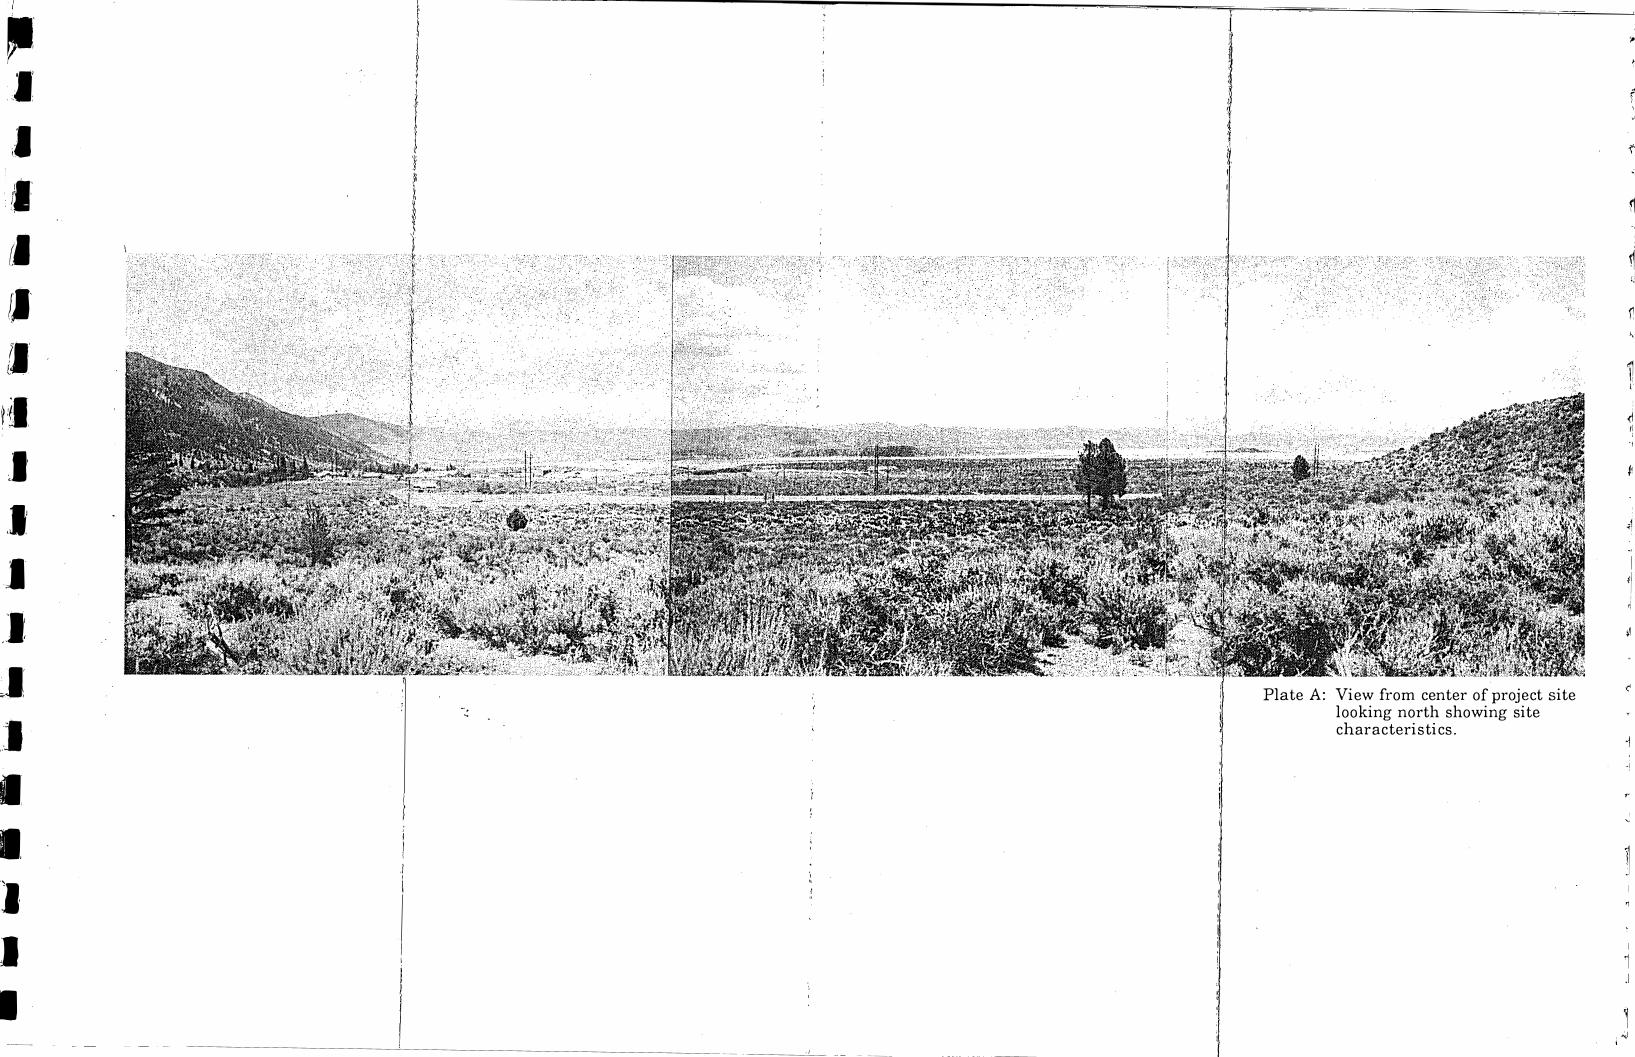
.1·: ,,, )
\I
.!1:(I
fl'
11.:(
HI
)'
,I
I
I
,.),
O?I
I
I. 1�)
�I
I
r
l l ,,
! ( I
l:
1 o):·
I
1
!
Plate A: View from center of project site looking north showing site characteristics.
;,,
�!
I
�
.�
�
� �
1\:
<1
�I
,.
'I

--- -r--·-
,'I< )
cl
(I
ii'(I
ll'
I�
1'.I:I
I
.I
.1·
.. I,
_I,
,I
I'
■:
I
�
I
I
III
l . .
'
,,
'
I
Plate B: View from north side of U.S. 395 at junction with S.R. 120 looking south across project site.
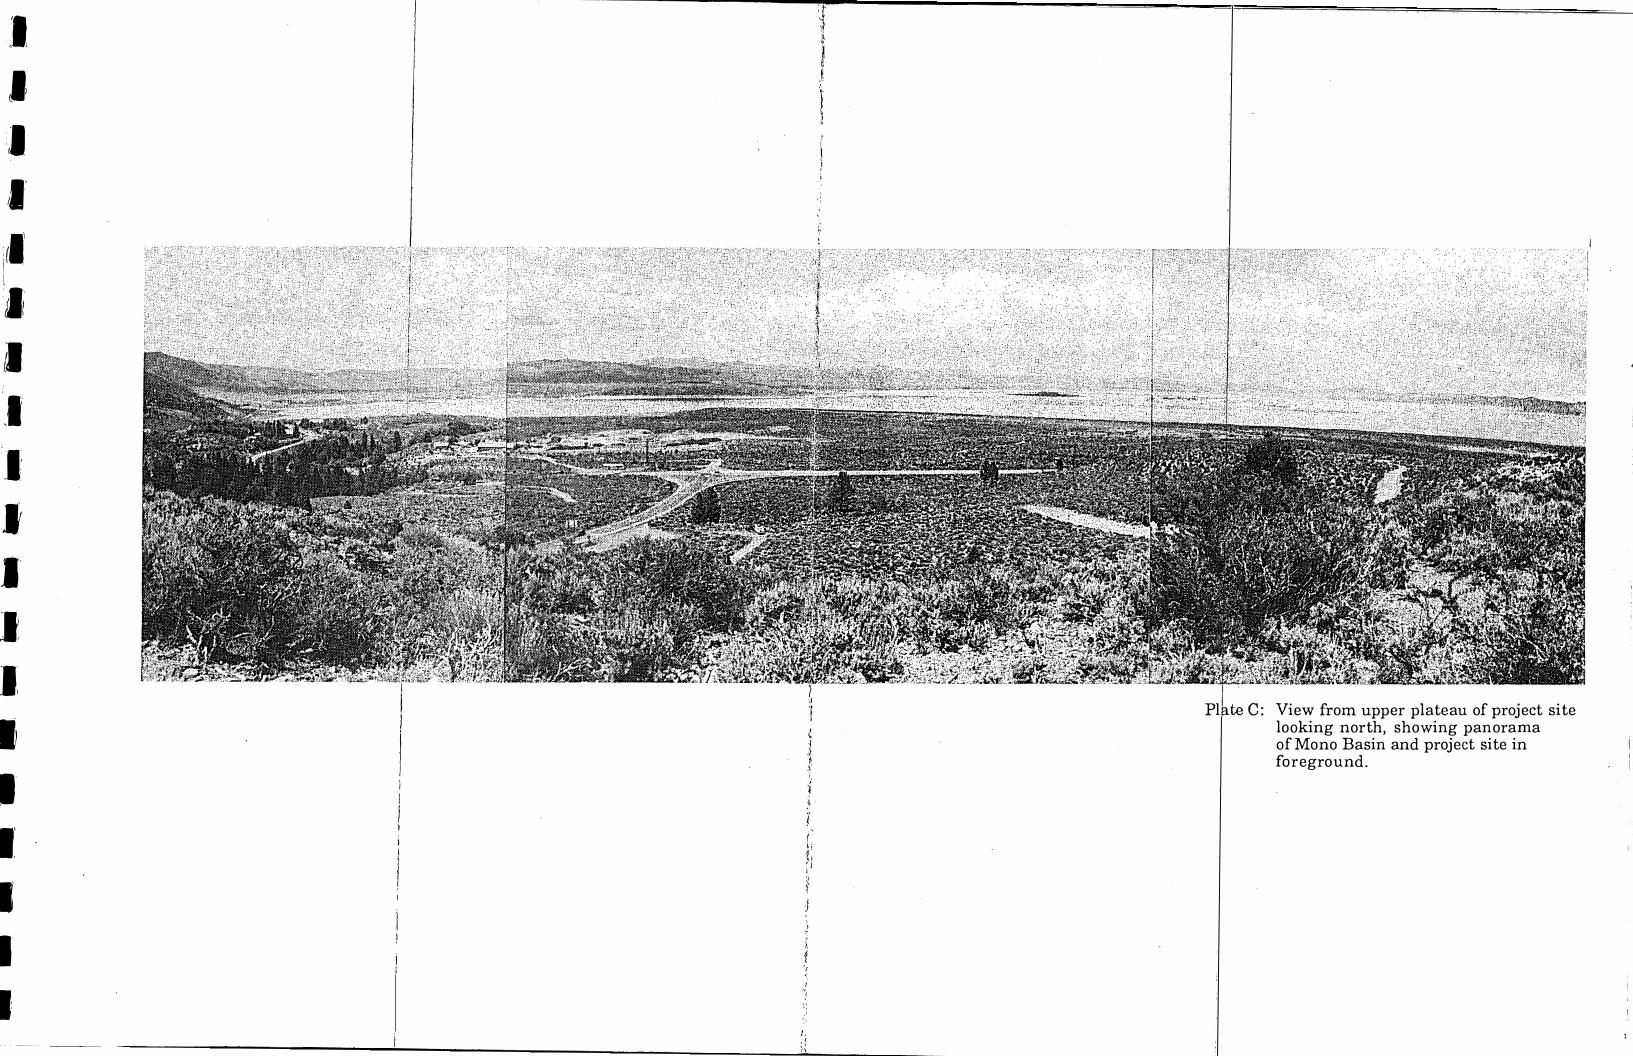
:1
l1: ·(I/I'
(I�
I; � i
I
_I;
.I I I' )'. _,: I
I 1: I I I
/, ·I ;, /\
_.·\
View from upper plateau of project site looking north, showing panorama of Mono Basin and project site in foreground.
I .I
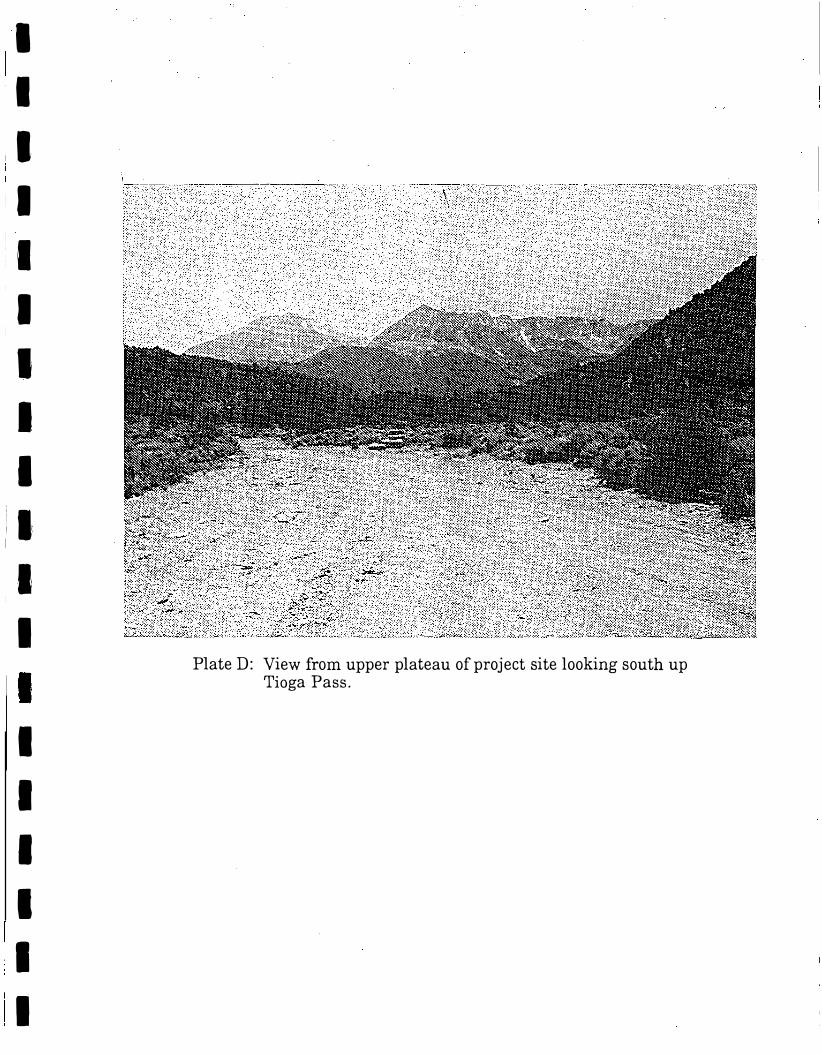
I
I
II
I
I
I
I
I.
I
ii I
I
I
I
I·
I
I
I
I
Plate D: View from upper plateau of project site looking south up Tioga Pass.
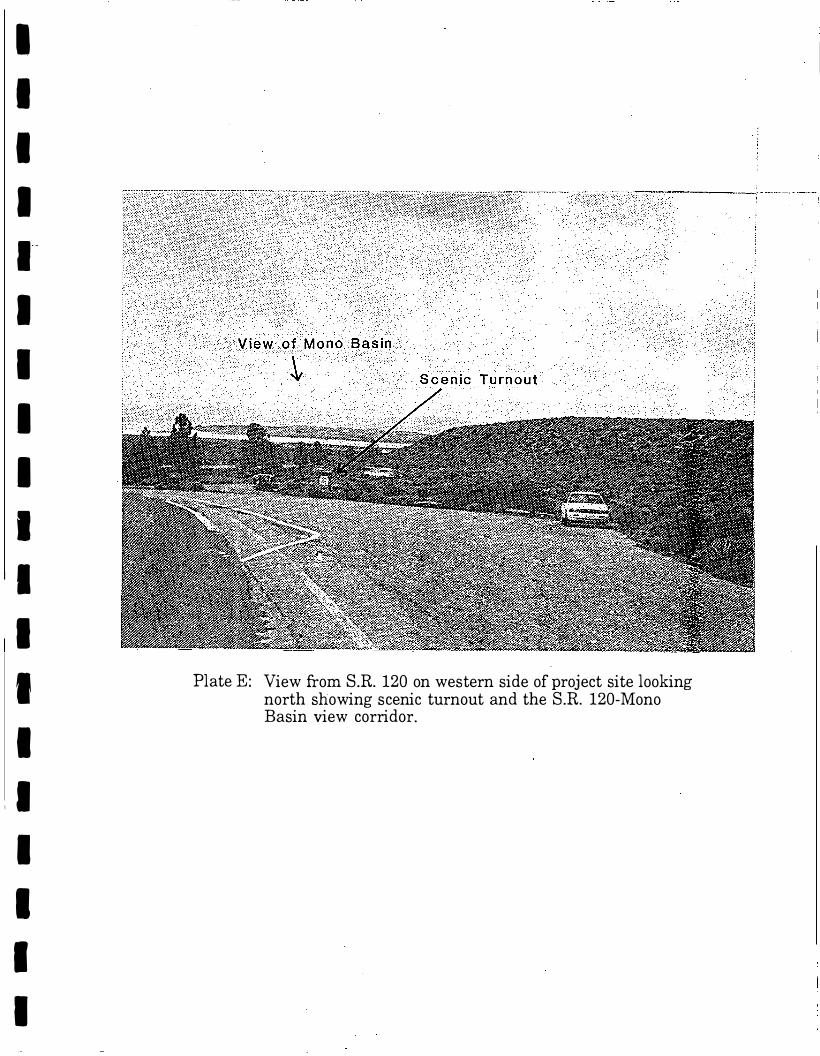
I
I
I
I
1-
I
I
I
I
I I I
I
I
I
,I
I
I
I
I
Plate E: View from S.R. 120 on western side of project site looking north showing scenic turnout and the S.R. 120-Mono Basin view corridor.
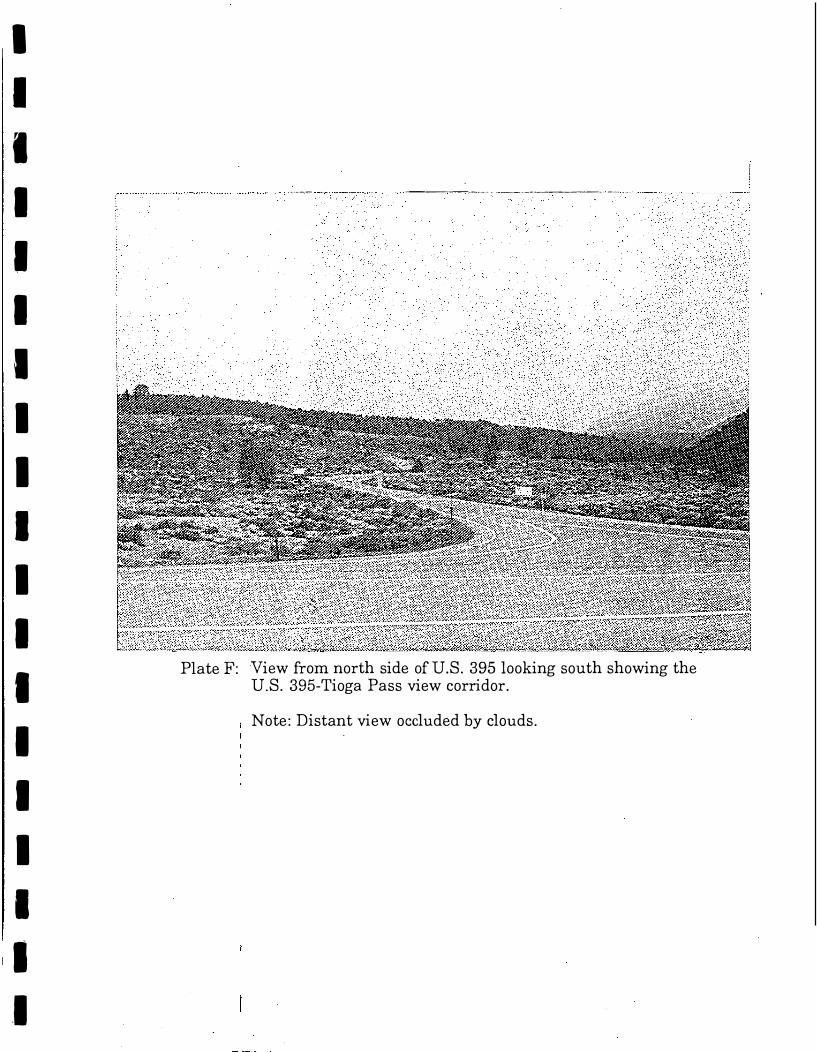
I
I
I
I
I
I
I
I
I
I
I
I
I
I
I
I
I
I
.I
·�•--.,..-. -·
. .· ,
--�.--.--··- · ·--····----- -·-. ·--· . · . .
Plate F: View from north side of U.S. 395 looking south showing the U.S. 395-Tioga Pass view corridor.
Note: Distant view occluded by clouds.
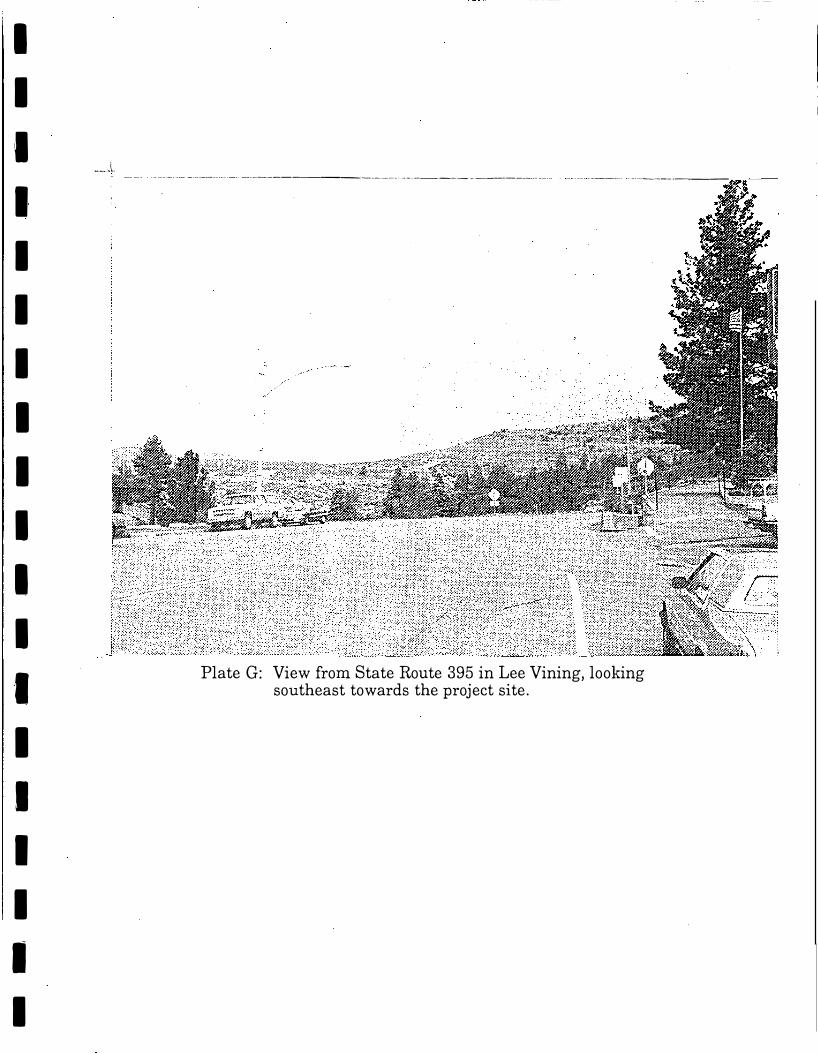
I
I
ii
I
I
I
I
I
I
I
I
I
I
I
I
I
I
I
I
___ J .. --··-------·------•----·---------------·-----------··--·--·· - - ·--· -··-------- ------------
Plate G: View from State Route 395 in Lee Vining, looking southeast towards the project site.
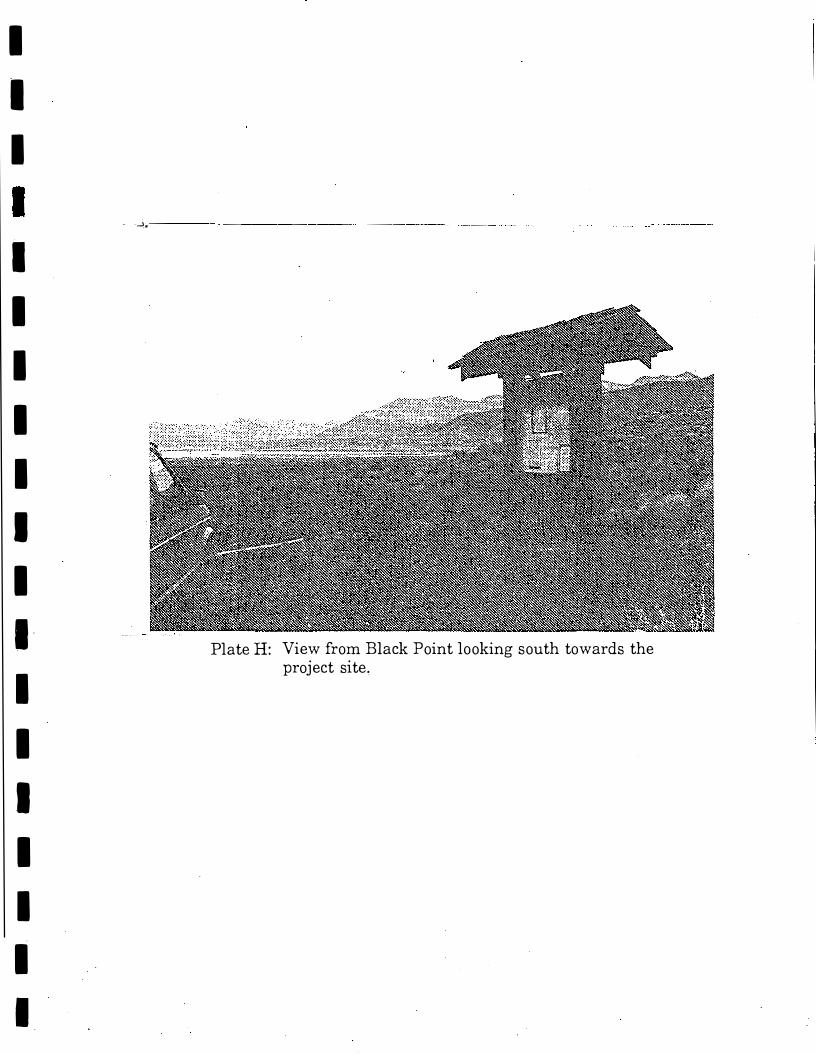
I
I
I
I
I
I
I
I
I
I
I·
I
I
I
I
I
I
I
-- -.J.,,
Plate H: View from Black Point looking south towards the project site,
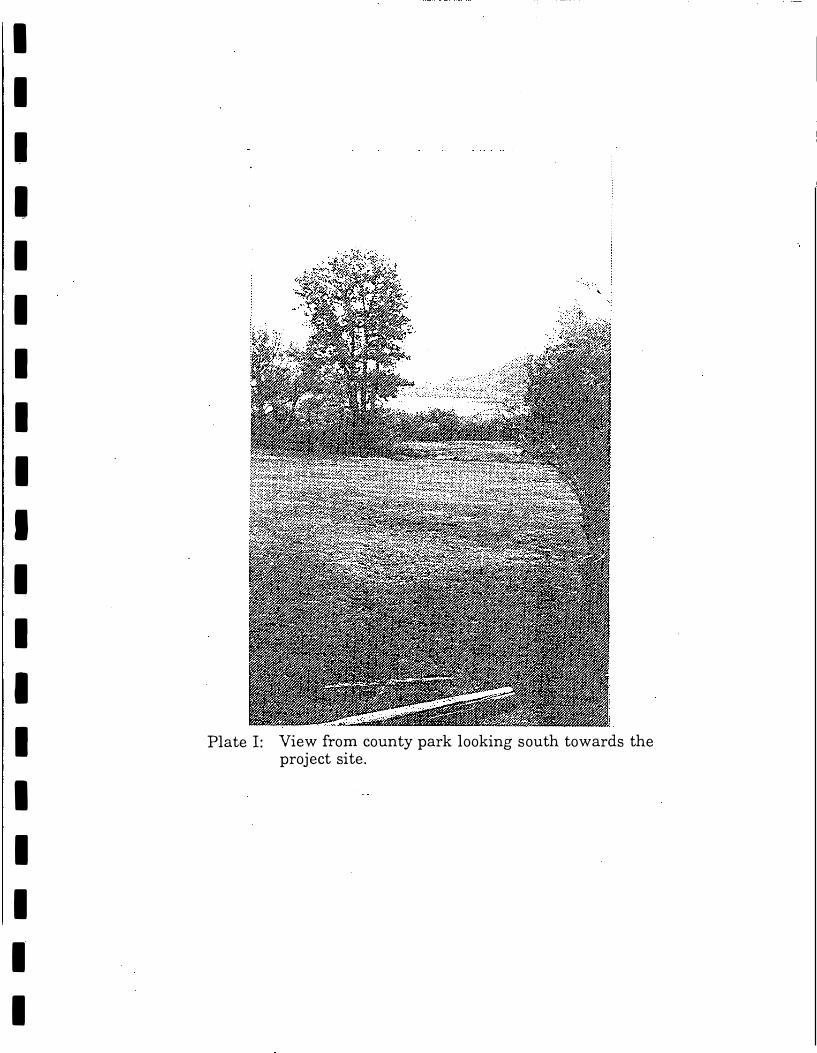
I
I
I
I
I
I
I
I
I
I
I
I
I
I
I
I
I
I
I
Plate I: View from county park looking south towards the project site.
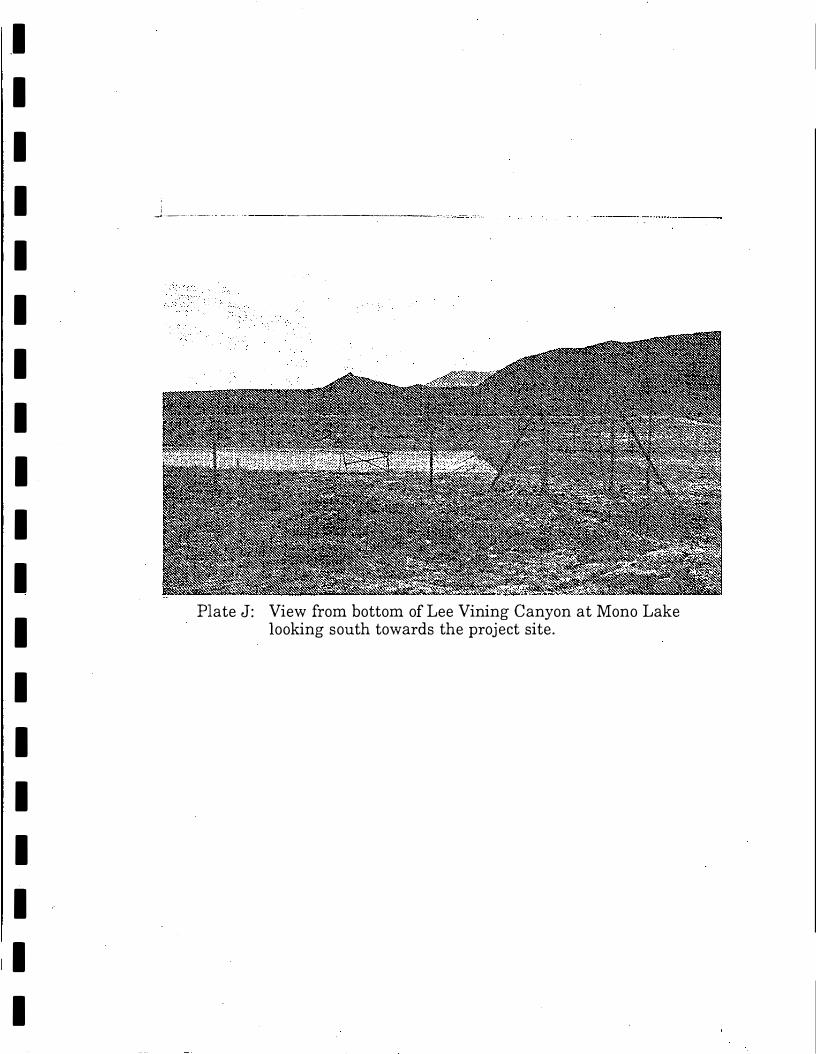
.I
I
I
I
I
I
I
I
I
I
I
I
I
I
I
I
I
I
I
J-.�--··-·--·- ----··. - ---------.... --.-··-- -- ·;· ..
Plate J: View from bottom of Lee Vining Canyon at Mono Lake looking south towards the project site.
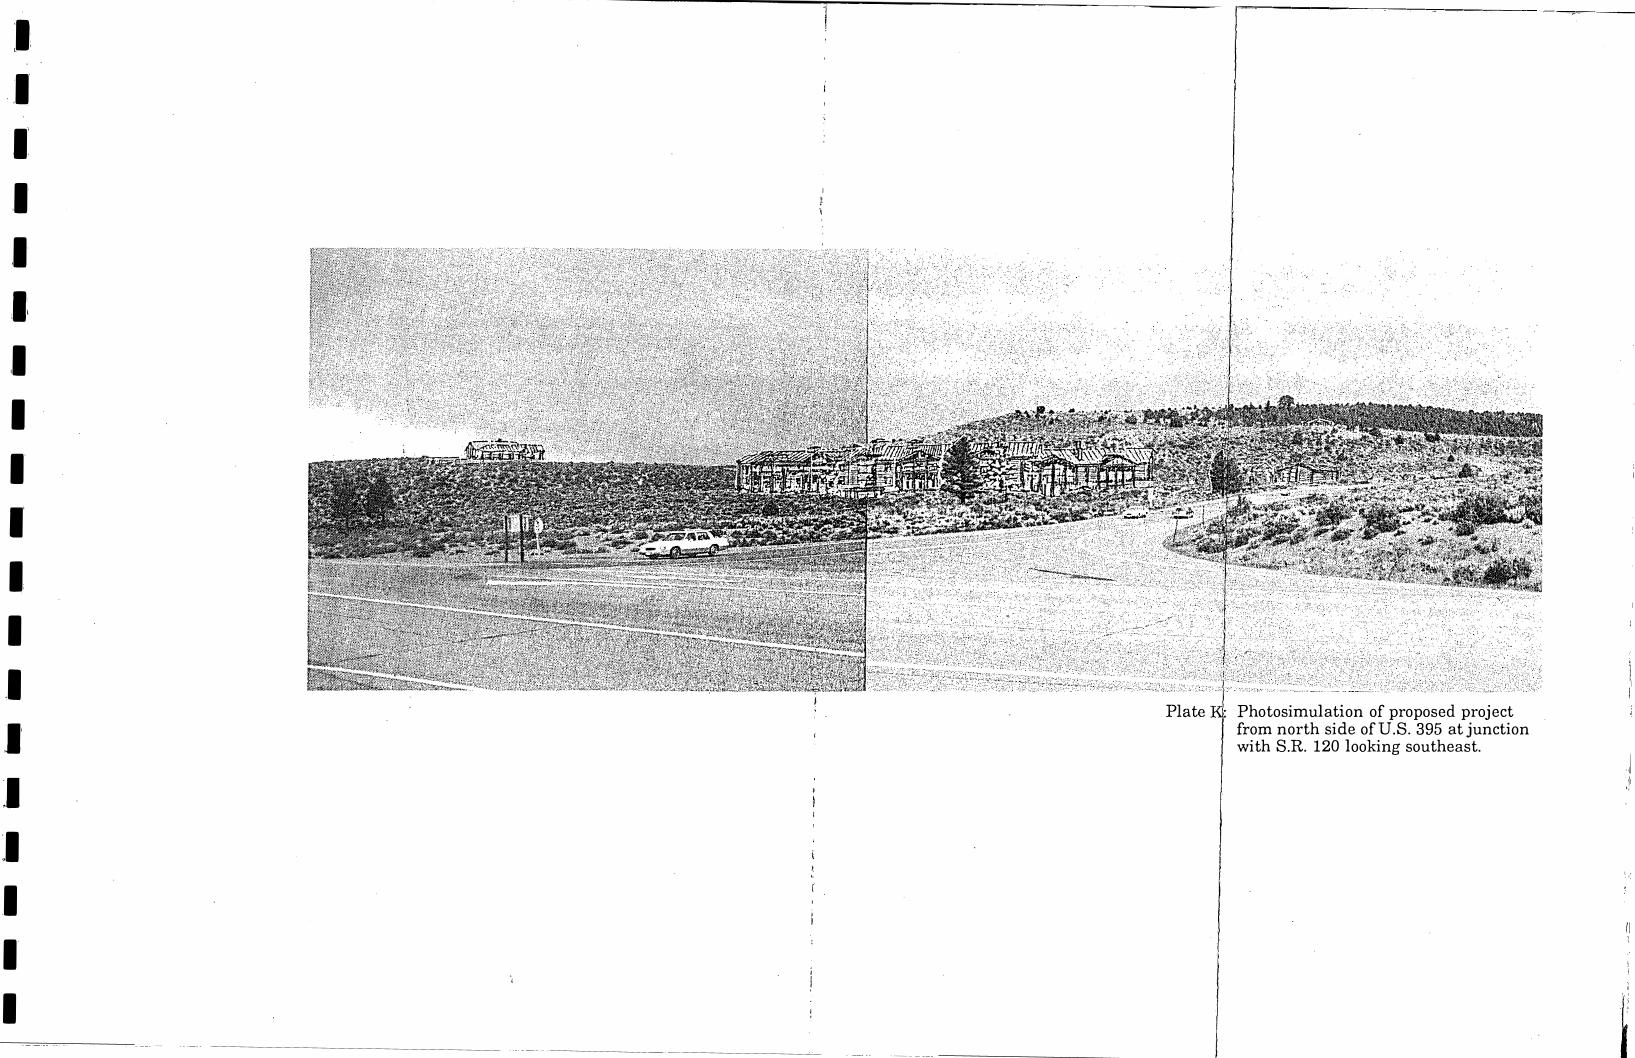
LI;
:I
I'
,I
,I
l1
,I
I
I
1·
I,
I
.I
,I'
I
�.I
I
I
I
'j r""'"'------�------------�-
Photosimulation of proposed project from north side of U.S. 395 at junction with S.R. 120 looking southeast.

·1
-I
I
I
I
I
I
I
I
I
I
I
I
I
I
I
I
I
I
Plate L: Photosimulation of proposed project from north side of U.S. 395 looking south at the U.S. 395-Tioga Pass view corridor.
Note: Distant view occluded bydouds.

I
I WILDLIFE and
I BOTANICAL
I REPORT
I
I
I
I
I
I
I
I
I
I
I
I
I
II
I
I
I
I
I
I
I
I
I
.I
I
I
I
I
I
I
I
I
I-
I
TIOGA INN
VEGETATION AND WILDLIFE ASSESSMENT STUDY
FINAL REPORT
June 1992
Prepared for:
Mono County Planning Department HCR 79 Box 221
Mammoth Lakes, CA 93546
Prepared by:
Timothy J. Taylor
Consulting Biologist
P.O. Box 191 June Lake, CA 93529
I
,I
I
I
I
I
I
I
:I,
I
:I
I
I
1:
I
TABLE OF CONTENTS
I. Introduction ......................................... 1
I I.
I I I.
IV.
v.
VI.
VI I .
Ac know 1 edgments. • • . . . . . . . • • • . . . . • . . . . . • . . . . . . . • • . • • . • 4
Study Area ........................................... 5
Methods.... . . . . . . . . . . . . . .. . . . . . . . . . . . . . . . . . . . . . . . . . . . . 8
A) Mule Deer ...................................... 8
1) Radio-telemetry •.•.•••.••.....•........•.... 8
2) Track Counts .....................•.......... 9 3) Ground Surveys ...........••..•....•.•. · •.••.. 12
B> Other Wildlife ....•...•........•....•.•.••..... 12 C) Rare Plant and Vegetation Surveys .•...•.••....• 12
Results ..•...•...•.....•................••..........• 13
A) Mule Deer .................•.....•........•...•. 13 1) Radio-telemetry ....................•....••.• 13
al Seasonal Movements .•....•..•............. 13 2) Herd Characteristics ........•••..•....•••.•• 17 3) Track count surveys •..•..••.•..•.•.•..•••.•• 18
a) Timing and intensity of migration ••..•.•• 18
b) Locations of deer activity ............... 21
B > 0th er W i I d I i f e ••••••••••••••••••••••••••••••••• 23 C) Vegetation Types .......•.....•.••.•......•....• 24
Discussion ........................................... 26
Environmental Impact Analysis ....•.••.••.•.•••..•.••. 30
A) Introduction .•....•....•..••••..•.•••.•••••••.. 30
B) Impacts to Biological Resources •.•.•..•.•..•.•• 31
C> Mitigation Measures ••••••••••••••••••..•••..•.. 40
VI I I. Review of Literature Relevant to the Project. ••..•••• 46
I X. Li t er at u re Ci t ed •.••.•..••.•..••••..••.••.•..•.•••••• 48
Appendix A ..•..•. · •.•...........••••..••.•.•..••.•..•. 53
I I ,._
, I,
I .'I
I
,1 I,
I
I
I
I.
I
I . INTRODUCTION
The proposal to develop the Tioga Inn near Lee Vining,
California, has raised concerns with respect to potential
deleterious impacts on local wildlife, especially migratory Rocky
Mountain mule deer (Odocoileus hemionus> which use the project
area and vicinity. A brief evaluation of biological resources on
the proposed project area was conducted by a private consultant
on October 28, 1984 (White 1984). This assessment was considered
by the California Department of Fish and Game <CDFG) and other
agencies to be lacking information on site-specific mule deer use
of the area. In addition, it did not address potential
significant impacts of the proposed development on mule deer and
other biological resources. In response to recognized concerns
and in order to initiate the environmental review process
pursuant to the California Environmental Quality Act <CEQA), �he
Mono County Planning Department <MCPD) contracted the present
investigator to allow an assessment of the importance of the area
to deer and other wildlife.
Deer which use the project area and vicinity are from the
Casa Diablo herd, a migratory mule deer herd consisting of
approximately 1,500 animals that winters at lower elevations near
Benton, California, some 35 airline miles east of the Project
Area (Figure 1). The herd summers primarily on the east slope of
the Sierra Nevada, from Mammoth Lakes, north to Lundy Canyon.
From January 1986-December 1988, an intensive ecological
-1-
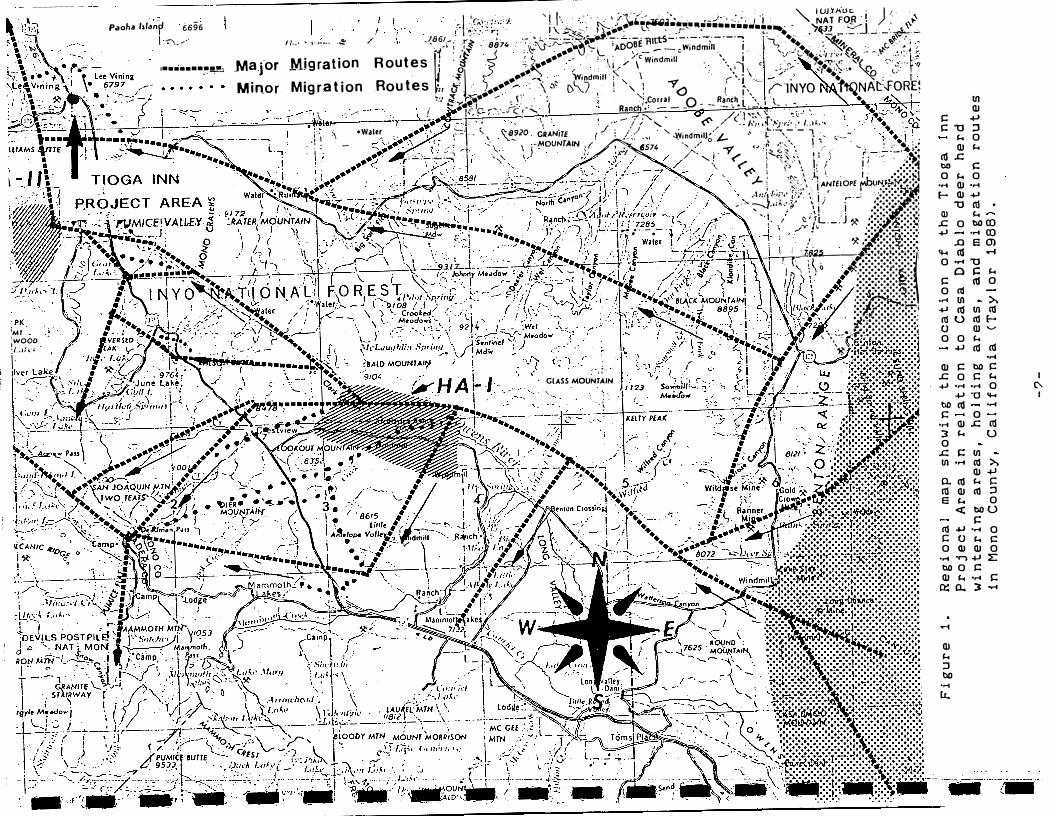
1Mf. :wooo . I .• ,: .. -�
Paoha hla�f 6696
I·"-/
, .........•. _ .. -:--
II .. ... ,._ ..... -«::! /
; . ,
-,.
, ,_:;.1.-,.-_ . ·, . _ .· •,, "'IU).¥Abt. .j )<· .\
·0.j p,:,,:,,; -J: ! -. • _· '·,. i-;.__., ---••�ii.,;-:■ll■i.;;,;,;._:,;,J■�■-.· _ --:'AT FO!-,j
· , �..,_t-,- ·•·.'.•.·· r; · I\_;-:,,_<--' l \---- I.:, • _r • •. ♦ • �3__,! ____ -'---�-'-7861 · -- · . . .. -- - · ·'---"�-�----'-·-·i:m:tS---------·-·� 1·--( •• · ,-,i;✓ • .. � .'· · . . :; r? 8874 .. i,.;."\J"-r�-:s,..,�.__. ;>.OOBE -.Windmill j. ·
. t♦ · .;_ -(1,.,._ · _,_c, .-·_•J;ii . :? t :., ---"\).·I._ ,.-- a • •• '-,r-:...•"•··:,.,,.:,�,s, ______ ,. --�•:---:·
.Ma1·or Migration Routes i· · � . �-1.--- · · '"\i ,,, ... twindmill \ � _' ,·n�-- -,;;.{_ '1
\p� �--.,-_. .. p, . -- . .
-¥ ,;- --�> -·· \vind,,;ill;( \ )�_.\ . _-:,,-_, '1•••··• "( · v I
Minor Migration Routes ·,, a-']-·_ i------.: ·. \ ,§ f>\.) ! ', : -Y0 i }-_-· f''INYO f1QNAf-FOREi
�:/ i!.,,._ r-;.i- � , 5. • : '/.Corral O ___ Ran�h. l ·-. 1 \ __ • _ ♦ , I
\. :-·- f .,,'.,�<�:--'Ci·.::..._\ l_ , ���;:_ -_- - ·-;{1�;,_�: .. :,=c-'' ·-•,J: ', "- j • • r• I / ' <.<"' / I� .. Ntf ,4' .�,.,•.�•-• /..JL,•,
;·. \. •Waler ,':--::.·i
•' C:-8920. GRANITE r ./ : // '-windmilJ/i •' t·-'-.,_,-·--"1. · •. -... -·
t I • ' �-
�--"
· 0 - , I• ' · ·,. _ •• ,·, \ 1-!"'DUNTAIN ,( , • 6574 ·, / "'S'
.,); ,'.·,,. . '_. _ �-
! ,--� .. :.• _·:-.:..=...:·.:..__..,_,_-�
r• .. ', \} 1'. ',\"'
"-/ /' .. ,,. / ·t�;�t�\ !i.'f f:--:::;-•-:- ·_,;:; • I
,.. ;..,_ . ,. CIASS MOUNTAIN
. ' \ :·. . -. - � .
(
' '< ' -.. -·, )·' I' · •. ,._ ·,«' I (> ._ .; \ - i •• ::::•;4
I ' ,,,__ ) 1, . . �h •••• '-l
-- i . \<;,', ·. i ANTflOPf r .... u�!l:��� --��:::r::J? \!j' _r-··' /)==�==!\. _1 C'
jL, __ J � ;.;,;�{:
•:� ,..,.,.,., ,.,. ::=:?,:::-0::::::· . •4,.,L.--" .... �
:,.
•!!:;
• •• _J._)s2s ��•==:::::,:-:::�· !_ \'c \I . . -� .;:::::::::•::::::·
I � \ ; 'Io .� .•••••••• ••❖t·· . . . �lllil;:"''�.---:-,�•�·-·-·-·-·-·-·-·-·· '�
Ill QJ
s:: -+-'
s:: 'U ;:J M 0 QJ M
(1j .c t>II s:: 0 M 0
..... QJ ..... E- QJ -+-'
'U (1j (I)
.c 0 -+-'
M bOa)
..... a) .0 E: 0)
<i-, (1j ..-f 0 ..... 'U
0 S:: M s:: 0 ct!
.,... Ill -+-' 111 nl u 0 0 0
-+-'
QJ s:: .c 0 -+-' .....
-+-' bl) 111 s::
111 0
� >. Ill Ill ro E-QI ...... M ro ro
..... bl) s:::: s:::: M ..... 0 'U 'I-I
.... 0
..... QJ .c 111 � M U 0
.c s:: Ill•.-<
a. 111 Ill QJ E M
�
Ill ct! >. QJ -+-' M S:::: Ill :,
0 bOU s::::
nl -+-' ..... 0 S:::: 0 M S:::: 0 OJ QJ 0
.,... ..-,-+,1 E bl) 0 s:: QJ M .,... S::::
0:: 0. :J ....
--i
QJ M :, t,o ..... I.I.
I
(', I
I
,
. I
I
I
I
I.
·I
I
I
I
I
·1
I
I
I
'I
investigation of the Casa Diablo deer herd was conducted by the
present investigator under contract with CDFG (Taylor 1988a).
This investigation revealed that approximately 26% of all deer
which winter near Benton, migrate west to summer range located
within and adjacent to the Lee Vining Canyon area.
A review of Laudenslayer Jr. et al. (1991) revealed that no
federal or state-listed or candidate rare, threatened-or
endangered amphibians, .reptiles, birds, or mammals are expected
to occur within the Project Area. However, the Project Area is
potential habitat for several "Special Animals" which refers to
al I vertebrate and invertebrate taxa of concern to the California
Department of Fish and Game Natural Diversity Data Base CNDDB),
regardless of their legal or protection status CCDFG 1988).
"Special Animals" which are known within the vicinity of the
Project Area include:
1) American Badger CTaxidea taxus)Status: CDFG species of special concern
2) Western White-tailed Hare <Lepus townsendii townsendii)Status: CDFG species of special concern
3) Golden eagle (Aguila chrysaetos)Status: CDFG species of special concern, California"fully protected" species, no federal status
4) Prairie falcon (Falco mexicanus)Status: CDFG species of special concern, no federalstatus
5) American Peregrine Falcon <Falco peregrinus anatum)Status: California-listed Endangered Species, Federallisted Endangered species, California Fully Protectedspecies.
-3-
I
I
I
I
I
I
I
I
I
I
I
I
I
I
I
I
I
I
I
A review of the NDDB revealed that the following sensitive
plants species are known to occur in the vicinity of the Project
Area:
Mono Buckwheat <Eriogonum ampullaceum)
Status: no state status, federal Category 2 candidate, California Native Plant Society List 1B (rare, threatened or endangered in California and elsewhere>
The objectives of the present investigation are to:
1) describe and quantify the amount, timing, and specific
locations of deer use of the Tioga Inn Project Area during the
spring migration of 1992; 2) determine the relative abundance and
habitats of Federal candidate, proposed or listed threatened or
endangered species, state-listed species, and locally sensitive
plant and animal species that are found at or near the Tioga Inn
Project Area; 3) provide a complete description of all vegetative
communities occurring within the Tioga Inn Project Area; 4)
assess and quantify direct, indirect, and cumulative potential
project-related impacts on wildlife and associated sensitive
habitats; and 5) provide a specific mitigation plan to offset
potential project-related impacts.
The information in this report will be incorporated into a
Draft Environmental Impact Report (EIR) prepared for the Tioga
Inn by the Mono County Planning Department.
II. ACKNOWLEDGMENTS
This investigation was conducted under a contract with the
Mono County Planning Department, the lead agency for this
-4-
I
I
I
I
I
I
I
I
I
I
I
I
I
I
I
I
I
I
I
project. Some of the data presented here is from a DFG funded
radio-telemetry study of the Casa Diablo herd which was conducted
from January 1986-December 1988. The information presented in
this report is to be used entirely for the purpose of assessing
the environmental effects of the proposed Tioga Inn, and are not
for publication, citation or other use without permission of the
author.
I II. STUDY AREA
The site of the proposed Tioga Inn, hereafter designated the
Project Area, is located approximately one-half mile south of Lee
Vining, California, southeast of the intersection of Highways 395
and 120 in the S 1/2 of the NE 1/4 of Section 16, T. 1 N., R. 26
E (Figure 2). It encompasses approximately 70 acres and is
bordered by Highway 120 on the north, Highway 395 on the east,
and USFS land on the south and west. Elevations on the project
area range from approximately 6,800 to 7,000 feet.
The proposed Tioga Inn wil I include a 120 room full service
motel, a 100 seat restaurant, a gas station/mini-mart, and 10
units of residential housing (Figure 3). The hotel wil I be
situated on Parcel 1 (30.3) about 800 feet south of the
intersection of Highways 120 and 395. The proposed restaurant
will be situated on Parcel 2 <36 acres), the gas station mini
mart on Parcel 3 (2.4 acres), and the 10 units of residential
housing on Parcel 4 (5.0 acres).
-5-
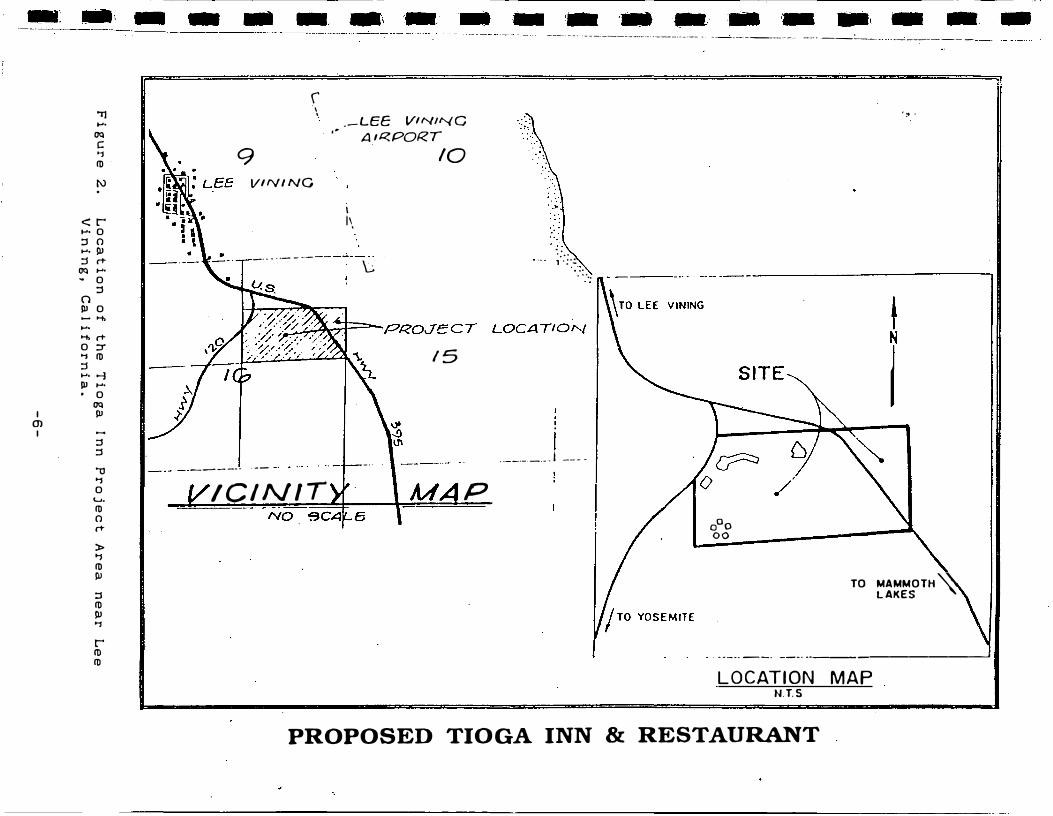
"Tl .....
(IQ
C: ..,
m
N .
<r ..... 0 ::i 0 ,... Ill ::i r+
(IQ .....� 0
::i (1 Ill 0 - '"I>
....
'"I> r+
0 ::r.., m ::i .... ---1 IU ..... . 0
(IQ
I IU m I -
::i ::i
'l:J ..,
0 �-
m 0 r+
)> ..,
m Ill
::i m Ill ..,
r m m
\ \
. -LEE VINl"(G
. ,, A11Z.POf<T
9
VINING
I
I\
-· ... ·- -· ··-\;.
----·- -- -
IC/NIT
10
IS
p
----·--- ·--- ----------·-
.. /":·;
. .. ··· ..
··--·-·-··. i --- .
-----·-·-- -· -··------------· ---- ----- - - ---------- -
a0
o 00
, :t .
TO MAMMOTH� LAKES
. ··-·· --· --·· __________ __,
LOCATION MAP N.T.S
PROPOSED TIOGA INN & RESTAURANT
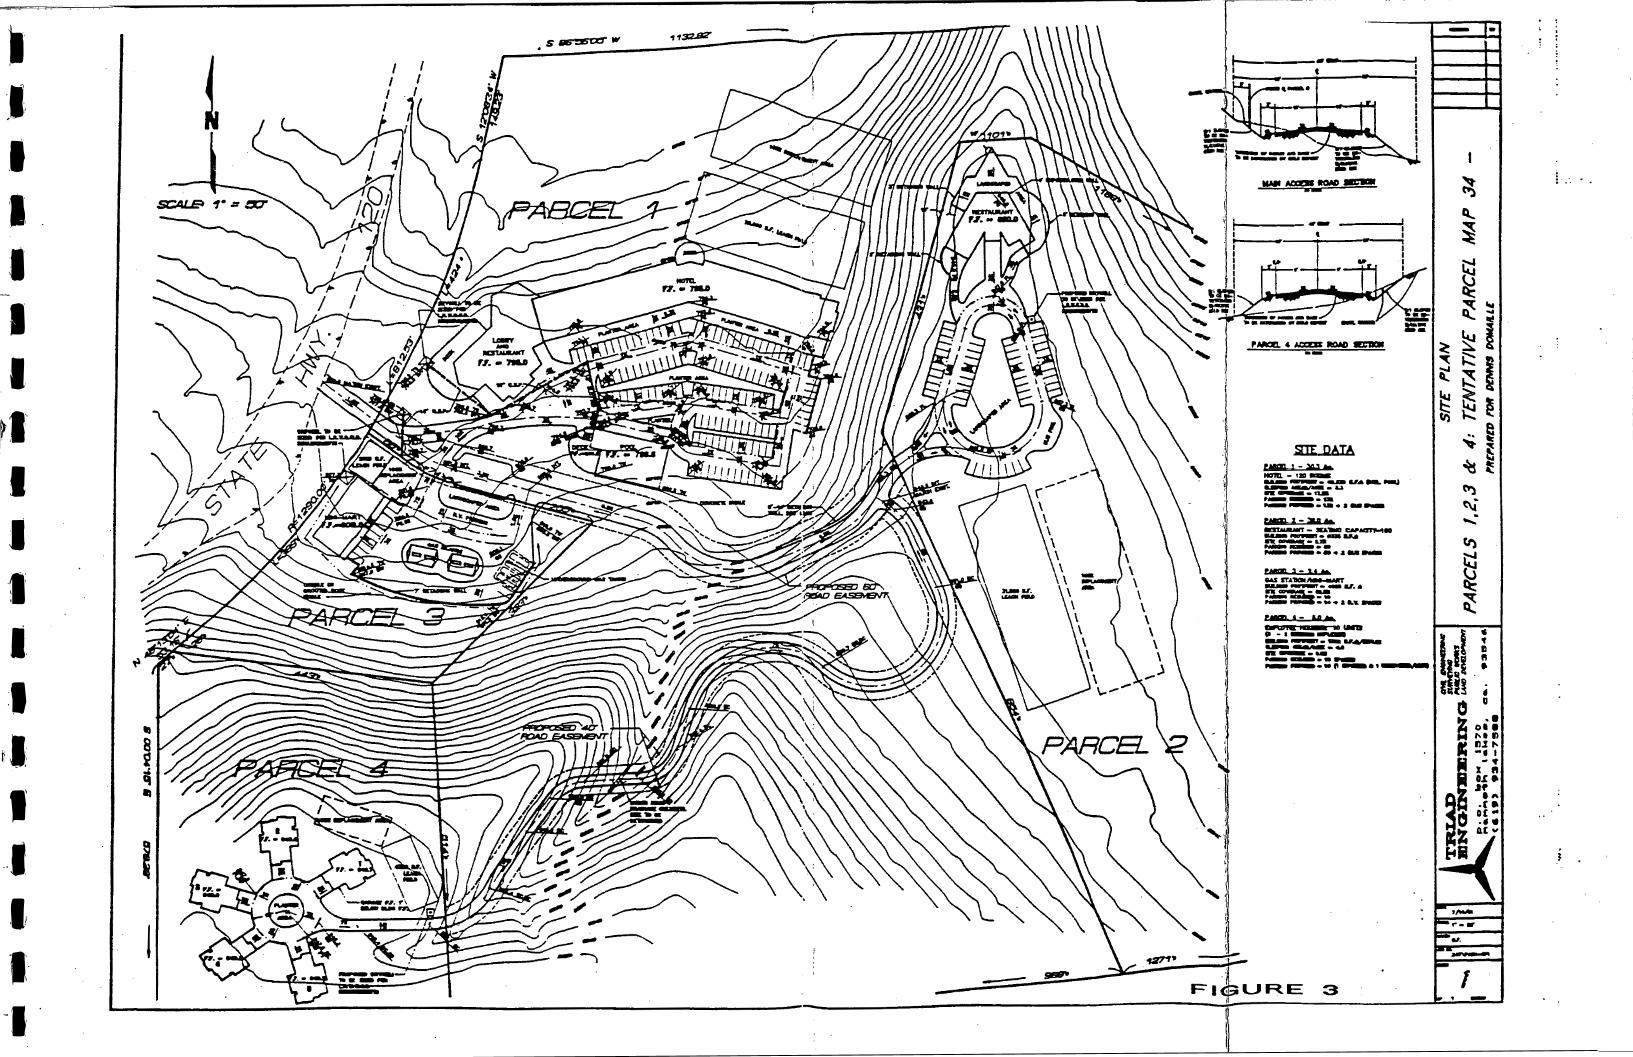
I
-1:!
,I
'I
:I
·I
I
�,,
I
I
.,:
I
:I
ti;
I --1
,,/ ·1:
-1, .
s•56W W
l -
,.._ _ _________ ...J
i .... • _____ _
,! 'i
SITE PATA
ewa ,-w11:r --•m................ u .. -..,-.J ..... ....,....u -----a.a ,,_ __ ..� .... ·--··---
rMCIJ Z-M4e,
PWI' f- M• ---•INII • -•--................ .,..,.... ..... ....,... ....------..._....., ...... --••fl-••-------..
- -
I
:·.·.

I
I
I
I
I
I
I
I
I
I
I
I
I
I
I
I
I
I
I
IV. METHODS
Mule deer use of the project vicinity during the spring of
1992 was determined from a DFG funded radio-telemetry study of
the Casa Diablo deer herd conducted from January 1986-December
1987, and track counts funded by the project proponent.
A) Mule Deer
1) Radio-telemetry
Deer were captured on Casa Diablo deer herd winter ranges
from January 1986-March 1986 and February 1987-March 1987 using
Clover traps <Clover 1956), drive nets and a Bell Jet Ranger III
helicopter <Beasom et al. 1980), and a hand-held net gun. All
captured deer were physically restrained and marked with large,
plastic, consecutively numbered cattle ear tags (7.5 x 11.5 cm;
Al !flex Tag Systems, Harbor City, Calif.), color coded to
wintering area. Twenty-four adult does were fitted with radio
collars. In addition, 1 adult male was instrumented with a radio
transmitter mounted on expandable collars to allow for neck swell
during the rut.
The locations of all radio-collared animals were obtained by
triangulation from the ground or from a fixed-wing aircraft.
Deer were located 3-4 times weekly during the spring and fall
migrations. During the summer and winter months deer were
located 1-2 times weekly. Initial ground locations were made
from a vehicle equipped with a Telonics TR-2 receiver with an
-8-
I
I
I
I
I
I
I
I
I
I
I
I
I
I
I 1,
I
I
I
attached program/scanner CTS-1) and a base loaded whip antenna.
Triangulation bearings were obtained using a hand-held, 2 element
antenna CRA-2A; Te Ionics, Inc., Mesa, Ariz.). Visual sightings
of radio-col Jared deer were made whenever possible. Radio
locations and visual sightings of radio-collared deer were marked
on U.S. Geological Survey 7.5 and 15 minute series topographic
maps.
Fixed-wing flights were conducted once weekly, weather
permitting, during the winter and summer months, usually between
0800 and 1000 hours. Flights were conducted from a Cessna 185 at
air speeds of 120-180 km/hr.
2) Track Counts
From radio-telemetry studies (Taylor 1988), it was
determined that deer migration through the project vicinity
occurs generally in a westerly and northwesterly direction.
Accordingly, the investigator selected a track count survey route
that incorporated dirt roads running in a generally north-south
direction through and adjacent to the Project Area, bisecting the
direction of spring migration (Figure 4). The route selected was
0.7 miles in length and began approximately 0.4 miles south of
the Project Area at the junction of Highway 120 and the Los
Angeles Department of Water and Power CLADWP) aqueduct road.
In order to increase specificity of data, the 0.7 mile survey
route was divided into even length segments recognizable by
-9-
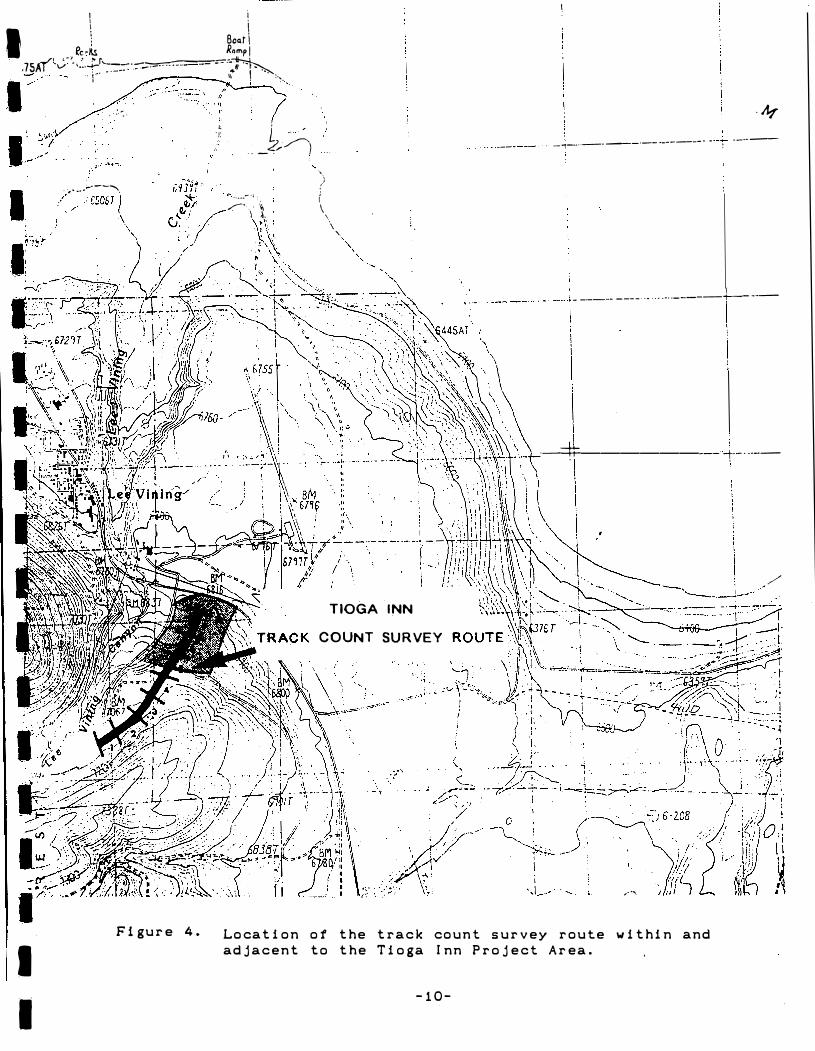
I i \ i I
' Bo�t\
fc7� Rnmpl _../' .-, _. "t-.. -----,.,,_:=-_:-=_:-:-.s-�, .. ·- -.75AI ·v ·, ... ....- ---:·::----·····-·-
•'' ;--,,.,.__ .. ( - --- ,, I ·-. ,.>
. , .-.- ..
·,·--------,.
I;
·,: L -· -
. . -Z>__,,..--)
..... -·: .
.,,,-- . . "' \ ..
·,:) i\\ \ '·
TIOGA INN
COUNT SURVEY
-�
. --r--·-------·---------- : ------·
- ----- ----··•····-··-----+-----
.___:=+j:.------- i•------
/
, ....
I
I
Figure 4. Location of the track count survey route within and
adjacent to the Tioga Inn Project Area.
-10-
I
I
I
I
I
I
I
I
I
I
I
I
I
I
I
I
I
'I
I
flagged local landmarks. Segments 1-4 were located along the
aqueduct road; segments 5-7 were located within the Project Area
(Figure 4).
On the evening prior to each track count survey, usually
around 1700 hours, the road surface of each transect was prepared
for counting by grading with a drag made of a 5 foot section of
chainlink fence. Dragging erased old tracks enough so that new
tracks were visible. During each track count survey, which was
conducted the following morning between 0700 and 0800 hours, both
transects were surveyed on foot and the number of all tracks
observed were recorded along with their direction of travel.
Thus, the elapsed time from road preparation to track counting
ranged from 14-15 hours. The direction of travel assigned to a
track was the actual compass direction in which it was headed,
e.g., northeast, southwest, etc. A track headed down the road
was fol lowed until it turned off the road; the direction in which
it turned was subsequently recorded as its direction of travel.
Recording tracks by road segment was designed for the
purpose of providing a quantitative representation of deer
movement through each parcel. Recording tracks by direction of
travel was designed to allow for separation of localized back
and-forth movements, performed by holdover and resident deer,
from migratory movements.
-11-
I
I
I
I
I
I
I
I
I
I
I
I
I
I
I
I
I
I
I
3) Ground Surveys
Ground surveys of the entire Project Area were conducted on
a weekly basis to identify any particular important travel routes
or feeding, fawning or resting areas. All deer observed during
field work were counted, classified by sex and age (adult or
fawn> and their locations recorded.
B> OTHER WILDLIFE
In order to determine the presence, relative abundance, and
locations of species other than mule deer, ground surveys were
conducted on a weekly basis throughout the entire Project Area.
Surveys were conducted in a non-systematic way by walking over
each parcel and recording the presence of all wildlife species
observed. Once an animal was detected, its numbers were
determined, and location and activity, e.g., feeding, perching,
roosting, etc., identified.
C) RARE PLANT AND VEGETATION SURVEYS
Because Eriogonum ampul laceum typically flowers toward the
latter part of July, field surveys for this smal I annual cannot
be conducted until that time. Surveys for Eriogonum ampul laceum
wil 1 be conducted by Mark Bagley, a local botanist familiar with
this species. Prior to surveys for Eriogonum ampullaceum, the
phenology of known populations of this species will be examined
to facilitate proper identification. Surveys for Eriogonum
-12-

I
I
I
I
I
I
I
I
I
I
I
I
I
I
I
I
I
I
I
ampul laceum will include systematic walking transects located at
� 50 foot intervals, providing an estimated 25-50% sample
coverage of the Project Area. In addition all plant species seen
on sight will be identified to at least genus and to the level
necessary to ensure that they too are not sensitive species.
Those species not readily identifiable in the field wil 1
be collected for later determination. A list of all plants
encountered on the site will be compiled by vegetation type.
A vegetation map of the entire area was prepared by the
investigator. All vegetative communities were identified, their
major components quantified, and locations mapped on U.S.
Geological Service 7.5 minute series topographic maps.
V. RESULTS
A. Mule Deer
1) Radio-telemetry
a) Seasonal Movements--The annual life-cycle of deer from
the Casa Diablo herd consists of four periods: spring migration,
summer, fall migration, and winter. The spring migration begins
in early April when deer leave the winter range and move in a
westerly direction, along the base of the southern escarpment of
the Glass Mountains, to a large spring holding area located on
the upper Owens River (Taylor 1988). Holding areas are bulbous
expansions of the migration corridor located at intermediate
elevations where deer congregate for 2-6 weeks during the spring
and fall migrations (Bertram and Remple 1977). These areas are
-13-
I
I
I
I
I
I
I
I
I
ii
I
I
I
I
I
I
11 I
I
I
typical of migratory mule deer <Leopold et al. 1951, Russel 1932)
and are recognized for their importance in providing nutritional
spring forage for does in their third trimester of pregnancy
<Bertram and Remple 1977, Bertram 1984, Loft et al. 1984, Kucera
1988). When deer increase their intake of easily and quickly
digested types of forage, metabolites are readily absorbed and
the net energy available to deer is greatly increased (Short
1981). As a result, deer are able to reverse the negative energy
balance acquired over the winter and improve their overall
physiological condition (Garrott et al. (1987).
Another reason for deer delaying spring migration on
the upper Owens River holding area may be the effects of weather
on plant phenology, which is paramount among factors that
influence forage availability <Nelson and Leege 1982).
Throughout the eastern Sierra, the availability of succulent
forage is related closely to snow conditions in the spring, and
these two factors appear to strongly influence the timing and
rate of migration from lower to higher elevations. Delaying
spring migration several weeks until snow conditions have
retreated allows Casa Diablo deer to move quickly through the
migration corridor to summer ranges where quality forage is
readily available. By arriving on summer ranges at a time when
the snowpack has receded and plant phenology is at a later stage,
pregnant does with increased energy demands can maintain the high
gross energy intake levels they experienced on lower elevation
-14-
I
I
I
I
i I
I
I I
I
I
I
I
I
I
I
I
I
.1
I
I
holding areas.
The timing of spring migration from the winter range was
similar in 1986 and 1987, despite extreme differences in snowfall
amounts recorded during the winters of 1985-86 and 1986-87. In
both years, deer began arriving on the upper Owens River holding
area in late March.
During the spring migrations of 1986 and 1987, 19- of 27
radio-collared deer from the Casa Diablo winter range migrated
west along the south slope of the Glass Mountains to the holding
area located near the upper Owens River <Figure 1) (Taylor
1988a). Of these 19 deer, 13 continued north from the upper
Owens River to summer range located in the June Lake, Lee
Vining and Lundy Canyon areas. After leaving the upper Owens
River, these deer migrated around the south end of the Mono
Craters and crossed Highway 395 near the Aeolian Buttes. They
then continued in a westerly direction around the north end of
Grant Lake to another spring holding area located in the Parker
Bench/Sawmil 1 Meadow areas. Deer remained on this holding area
for an average of eight days, after which time they dispersed to
their summer ranges. Six deer continued north, four of which
summered in Lee Vining Canyon, one in Lundy Canyon and one at
Lower Twin Lake near Bridgeport. Of the four deer which summered
in Lee Vining Canyon, two summered on the Burger Preserve located
on the north side of the canyon adjacent to the USFS Lee Vining
Ranger Station; one summered on upper Lee Vining Creek near the
-15-
I
I
I
I
I
I
I
I
I
I
I
I
I
I
I
I
I
I
I
Southern California Edison Pool Plant; and one summered on lower
Lee Vining Creek immediately adjacent to the Project Area. In
addition, 12 non-radioed ear-tagged deer were also observed in
Lee Vining Canyon during the summers of 1986 and 1987 (Taylor
1988a).
Assuming that the radioed sample was representative of the
entire population of deer wintering in the Casa Diab[o deer herd,
a reasonable assumption given the trapping methods, about 22% of
the Casa Diablo herd moved through or summered within the Lee
Vining area during the spring and summer of 1986 and 1987. At
that time, the Casa Diablo herd was estimated to have a winter
population of about 1500 animals. Thus, it can be estimated that
some 300 deer from the Casa Diablo deer herd summered within or
migrated through the vicinity of Lee Vining.
Deer arrive on the summer range in May and June, produce
fawns in July, and begin fall migration back to the winter range
in October. Fall migration is more rapid than that of spring and
is usually triggered by the first fall snow storm. The usual
pattern is for the first fall storm to deposit snow at the higher
elevations of the summer range during the first two weeks of
October. This causes many high elevation deer to move to the
upper Owens River holding area where they find adequate forage
and cover. Then there is often a dry period until late October
or early November when more severe storms move deer from the
holding area to the winter range.
-16-
I
I
I
I
I
I
I
-I
I
I
I
I
I
I
I
I
I
I
I
During the fall migration of 1986, 83% of radio-collared
deer migrated from the summer range between 3 October and 8
November. In 1987, 82% of radio-collared deer migrated from the
summer range between 11 October and 3 November. In both years,
radioed deer spent an average of 10 days (range 1-41 days) during
fall migrations on the Upper Owens River holding area (Timothy
Taylor, pers. files). Deer were frequent 1 y observed -on this
holding area until mid-November, after which time they moved
further east to the winter range. Radio-collared deer monitored
for >2 consecutive years (n = 16) displayed strong fidelity to
migration routes and holding areas. Deer arrive on the winter
range in November and December, breed in December and January,
and begin the annual life-cycle again.
2) Herd Characteristics and Management
The Casa Diablo deer herd has experienced extremely poor
recruitment rates over recent years. Since 1986, spring fawn:doe
ratios have averaged 22 fawns per 100 does. Reproductive studies
of the Casa Diablo deer herd conducted in 1987 and 1988 suggest
that poor fawn recruitment may be related to high neonatal losses
on the summer range. Several
to neonatal losses including:
factors are believed to contribute
1) conflicts with land uses (i.e.,
OHV's, livestock grazing, recreation activities, etc.) that are
either physically detrimental to deer habitat or decreasing the
use of potentially productive deer habitat; 2) increased
-17-

I
I
I
I
1-
1
I
I
I
I
I
I
I
I
I
I
I
predation from mountain lions (Felis concolor) and other
predators; and 3) the possible lack of adequate forage on spring
and summer ranges as a result of seasonal drought and overgrazing
by livestock, which may result in reduced maternal nutrition in
pregnant does prior to fawning <Thomas 1985, Taylor 1988b).
Buck to doe ratios have fluctuated over the years within the
Casa Diablo herd, and are currently low to due to lo�
recruitment. From 1985-1991, post season buck ratios averaged
9.3 bucks per 100 does <DFG files). The most recent population
estimate for the Casa Diablo herd based on the best available
information is about 1500 animals <Ron Thomas, DFG, pers. comm.)
The primary management goal of DFG for the Casa Diablo herd
is to restore deer numbers to levels compatible with existing
range conditions and uses <Thomas 1985). According to the Casa
Diablo deer herd management plan, this goal can be obtained by
maintaining a spring population that is within carrying capacity
of the range (2245 deer) (Thomas 1985). Therefore, current
objectives are to maintain spring fawn ratios at 50 fawns per 100
does during cycles when the herd population is lower than usual,
and to attain and maintain post season buck ratios of 20 bucks
per 100 does <Thomas 1985).
3) Track Count Surveys
a) Timing and intensity of migration--Track count surveys
were conducted between 17 April and 10 June 1992. A total of 16
-18-
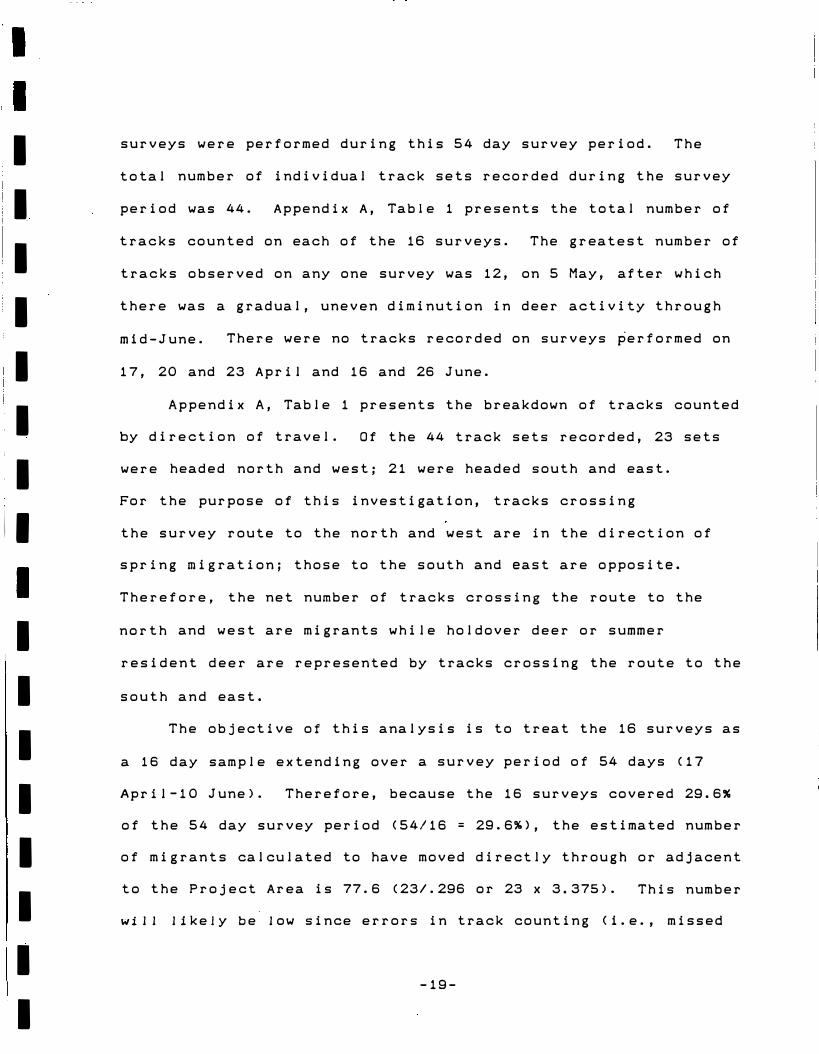
I
I
I
I
I
I
I
11
I
I
I
I
I
I
I
I
surveys were performed during this 54 day survey period. The
total number of individual track sets recorded during the survey
period was 44. Appendix A, Table 1 presents the total number of
tracks counted on each of the 16 surveys. The greatest number of
tracks observed on any one survey was 12, on 5 May, after which
there was a gradual, uneven diminution in deer activity through
mid-June. There were no tracks recorded on surveys performed on
17, 20 and 23 April and 16 and 26 June.
Appendix A, Table 1 presents the breakdown of tracks counted
by direction of travel. Of the 44 track sets recorded, 23 sets
were headed north and west; 21 were headed south and east.
For the purpose of this investigation, tracks crossing
the survey route to the north and west are in the direction of
spring migration; those to the south and east are opposite.
Therefore, the net number of tracks crossing the route to the
north and west are migrants while holdover deer or summer
resident deer are represented by tracks crossing the route to the
south and east.
The objective of this analysis is to treat the 16 surveys as
a 16 day sample extending over a survey period of 54 days (17
April-10 June). Therefore, because the 16 surveys covered 29.6%
of the 54 day survey period (54/16 = 29.6%), the estimated number
of migrants calculated to have moved directly through or adjacent
to the Project Area is 77.6 (23/.296 or 23 x 3.375). This number
will likely be low since errors in track counting (i.e., missed
-19-
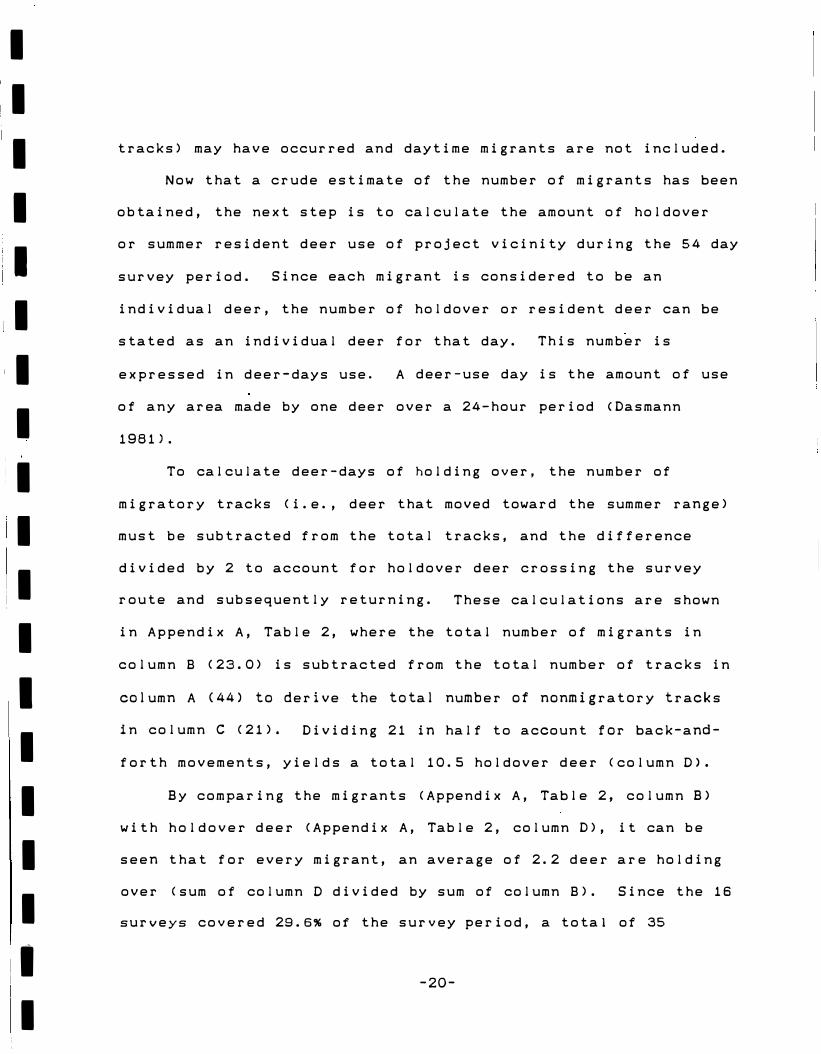
I
I
I
I
!I
I
I I
I
I
I
I
I
I
I
I
I
I
I
I
tracks) may have occurred and daytime migrants are not included.
Now that a crude estimate of the number of migrants has been
obtained, the next step is to calculate the amount of holdover
or summer resident deer use of project vicinity during the 54 day
survey period. Since each migrant is considered to be an
individual deer, the number of holdover or resident deer can be
stated as an individual deer for that day. This number is
expressed in deer-days use. A deer-use day is the amount of use
of any area made by one deer over a 24-hour period <Dasmann
1981).
To calculate deer-days of holding over, the number of
migratory tracks (i.e., deer that moved toward the summer range)
must be subtracted from the total tracks, and the difference
divided by 2 to account for holdover deer crossing the survey
route and subsequently returning. These calculations are shown
in Appendix A, Table 2, where the total number of migrants in
column 8 (23.0) is subtracted from the total number of tracks in
column A (44) to derive the total number of nonmigratory tracks
in column C (21). Dividing 21 in half to account for back-and-
forth movements, yields a total 10.5 holdover deer <column D>.
By comparing the migrants <Appendix A, Table 2, column B)
with holdover deer (Appendix A, Table 2, column D), it can be
seen that for every migrant, an average of 2.2 deer are holding
over <sum of column D divided by sum of column 8). Since the 16
surveys covered 29.6% of the survey period, a total of 35
-20-

I
I
ii
I
I
I
I
I
I
I
I I
I
I
I
I
I
I
I
I
(10.5/.279 or 10.5 x 3.375) deer days are represented by holdover
deer <Appendix A, Table 2, column D total). A quick check of
column D shows that 2.5 deer is the highest daily number of
nonmigratory deer, and this is the absolute minimum number of
deer holding over. Thus, each deer would have to remain in the
project vicinity for about 14 days to account for the 35 deer
days of holdover. At the other extreme, if each deer· remained in
the project vicinity for 1 day, then 35 deer would be involved.
The actual number deer holding over between these two extremes
cannot be determined.
Since one migrant is equivalent to one deer-use day, there
was an estimated total of 113 (sum of columns 8 + D) deer-use
days of the project during the spring survey period (sum of
column E).
b) Locations of deer activity--Appendix Table 3 presents the
total number of tracks sets counted in each of the seven survey
segments. Deer activity was most concentrated in segments 1-4,
located to the south of the Project Area. A total of 34 track
sets or 77% of all tracks observed, were recorded in these 4
segments. Nineteen (43%) of all track sets observed were
recorded in segment 4, located on the LADWP aqueduct road
immediately south of the southern border of Parcel 4.
Approximately 23% of deer activity was recorded within the
limits of the Project Area (segments 5-7). Most of this activity
-21-
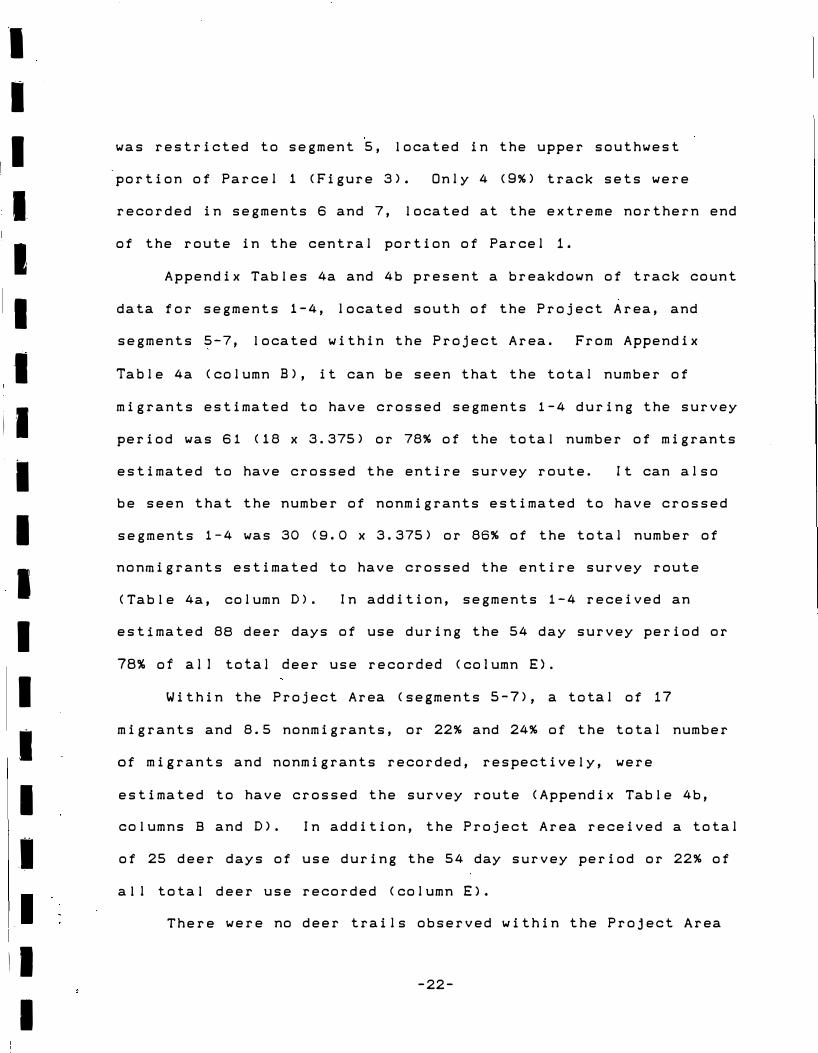
I
I
I
I
I
I
I
ii
I
I
I
I
I
I
I
I
II
I
was restricted to segment 5, located in the upper southwest
portion of Parcel 1 (Figure 3). Only 4 (9%) track sets were
recorded in segments 6 and 7, located at the extreme northern end
of the route in the central portion of Parcel 1.
Appendix Tables 4a and 4b present a breakdown of track count
data for segments 1-4, located south of the Project Area, and
segments 5-7, located within the Project Area. From Appendix
Table 4a (column B), it can be seen that the total number of
migrants estimated to have crossed segments 1-4 during the survey
period was 61 (18 x 3.375) or 78% of the total number of migrants
estimated to have crossed the entire survey route. It can also
be seen that the number of nonmigrants estimated to have crossed
segments 1-4 was 30 (9.0 x 3.375) or 86% of the total number of
nonmigrants estimated to have crossed the entire survey route
(Table 4a, column D>. In addition, segments 1-4 received an
estimated 88 deer days of use during the 54 day survey period or
78% of al I total deer use recorded (column E).
Within the Project Area (segments 5-7), a total of 17
migrants and 8.5 nonmigrants, or 22% and 24% of the total number
of migrants and nonmigrants recorded, respectively, were
estimated to have crossed the survey route (Appendix Table 4b,
columns B and D). In addition, the Project Area received a total
of 25 deer days of use during the 54 day survey period or 22% of
all total deer use recorded (column E).
There were no deer trails observed within the Project Area
-22-
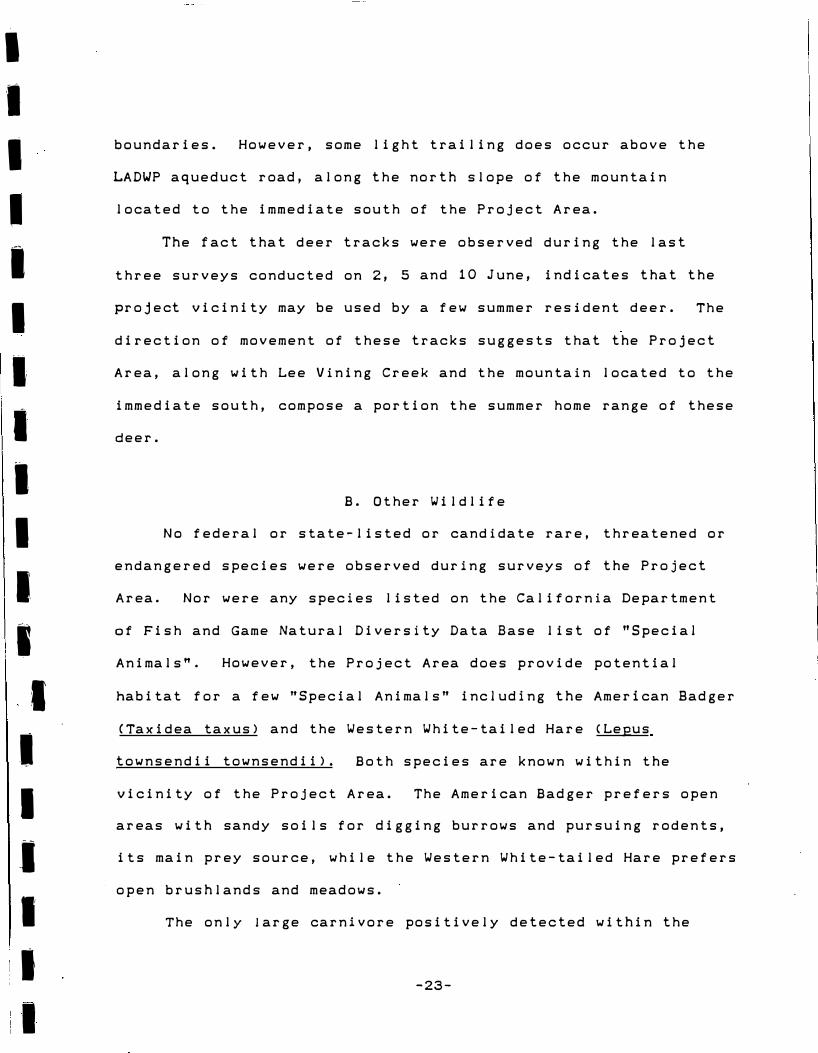
I� I 'I
I
I
I
I
I
I
·I
I
I.
I
. I
I
I
-1
I
I
I
boundaries. However, some light trailing does occur above the
LADWP aqueduct road, along the north slope of the mountain
located to the immediate south of the Project Area.
The fact that deer tracks were observed during the last
three surveys conducted on 2, 5 and 10 June, indicates that the
project vicinity may be used by a few summer resident deer. The
direction of movement of these tracks suggests that the Project
Area, along with Lee Vining Creek and the mountain located to the
immediate south, compose a portion the summer home range of these
deer.
B. Other Wildlife
No federal or state-listed or candidate rare, threatened or
endangered species were observed during surveys of the Project
Area. Nor were any species listed on the California Department
of Fish and Game Natural Diversity Data Base list of "Special
Animals" . However, the Project Area does provide potential
habitat for a few "Special Animals" including the American Badger
(Taxidea taxus) and the Western White-tailed Hare (Lepus
townsendii townsendii). Both species are known within the
vicinity of the Project Area. The American Badger prefers open
areas with sandy soils for digging burrows and pursuing rodents,
its main prey source, while the Western White-tailed Hare prefers
open brushlands and meadows.
The only large carnivore positively detected within the
-23-
I
I
I
I
I
I
I
I
I
I
I
I
I
I
I
I
I
I
I
project vicinity was the coyote <Canis latrans). Black-tailed
Jackrabbits (Lepus californicus), Chipmunks <Tamiaus sp. ),
Golden-mantled ground squirrels (Spermophilus lateralis) and
California ground squirrels (Spermophilus beecheyi) were all
commonly observed in the Project Area. A list of all mammal
species observed or expected to occur in the Project Area is
provided in Appendix Table 5.
The Prairie Falcon <Falco mexicanus), a California species
of special concern, and the Golden Eagle (Aguila chrysaetos), a
California Species of Special Concern and a Fully Protected
Species, may occasionally forage over the area. A list of all
birds observed or expected to occur within the Project Area is
presented in Appendix Table 6.
C. Vegetation Types
The entire Project Area is covered by a fairly uniform stand
of Great Basin Sagebrush Scrub <Figure 5). This was a fairly
ta! I stand (2-3 feet) and dense scrub (estimated at 50-70% shrub
cover) dominated by antelope bitterbrush CPurshia tridentata) and
scattered big sagebrush (Artemisia tridentata), desert peach
CPrunus andersonii), rubber rabbitbrush CChrysothamnus
nauseosus), and horsebrush CTetradymia comosa). A few scattered
Jeffrey pine (Pinus jeffreyi) (8 trees) and 2 lodgepole pine
(Pinus contorta) occur on the northwest corner of Parcel 1
(Figure 5). Additionally, a few Jeffrey pine and pinyon pine
-24-
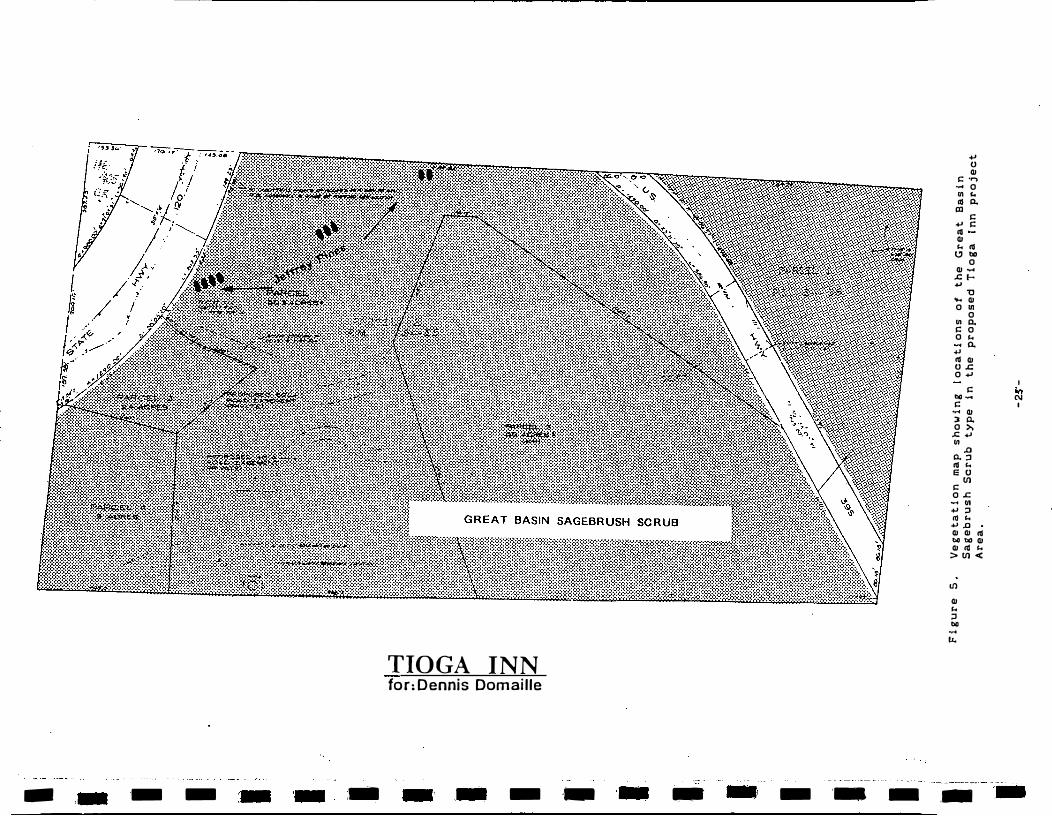
....
0 QI
s: . ...,
.... 0 Ill "'
al ll. III
s: .... s: al QI "' ol
t, bO 0
QI .... .s: I-....
"ti ... QI 0 Ill
0 Ill ll. s: 0 0 "'
ll. ....
ol QI 0.S: 0 ....
I
s: oo .... N s: I
..... QI :i Q.. 0 >,
.s: .... Ill
.a Q.. :i ol "' e o
en s: 0 .s: ..., Ill .... :i al "'.... .a QI QI ol 00 bO QI QI ol "' >en<
If)
QI "'
:i bO
.....
ti.
TIOGA INN for: Dennis Domaille
- - - ,_ - ·- - - ·- - ·-
I
.I
I
I
I
I
I
I
I
I
I
I
I
I
I
I
.1
I
I
(Pi nus monophyl la) occur on the steep northwest slope of Parcel
4. The most common of the scattered herbs include needlegrass
(Stipa sp. ), squirrel tail (Sitanion sp. ), and Indian ricegrass
(Oryzopsis hymenoides). Appendix Table 7 provides at least a
partial list of plant species occurring in the Project Area.
Other species may be added to this list during surveys conducted
for Eriogonum ampul laceum.
VI. DISCUSSION
Impending development of the Tioga Inn and associated loss
of habitat has created some concern for the future of mule deer
which migrate through the area. From track count data, it was
estimated that the Tioga Inn Project Area and adjacent vicinity
received 113 deer days of use during the spring migration period.
About 75¾ of this deer use, which equates to anywhere from 63 to
88 deer (61 migrants and 2-27 nonmigrants), is concentrated to
the immediate south of the Project Area. There was only an
estimated 25 deer days of use within the Project Area proper, the
equivalent of about 17 migrants and anywhere from 1-8
nonmigrants.
Habitual behavior, topographic features, security cover, and
human intrusion are factors_which likely govern deer distribution
within the Project Area and surrounding vicinity. The role that
habitual behavior plays in deer migration has been widely
-26-
I
I
I
I
I
I
I
I
I
I
I
I
I
I
I
I
documented in the eastern Sierra Nevada <Kucera 1988, Taylor.
1988a, Taylor 1991) and other areas of California (Bertram and
Remple 1977,· Loft et al. 1989). Radio-collared deer from the
Casa Diablo herd monitored for 2 or more successive years
displayed strong fidelity to individual summer ranges and
migration routes by returning to the same ranges year after year
<Taylor 1988a). This is largely due to topography an� landscape
and the existence of natural travel lanes that become established
trails.
Track counts and ground surveys indicate that as deer
migrate west toward Lee Vining Canyon, they contour the northern
side of the ridge located immediately south of the Project Area
<Figure 3). This east-west orientation along the base of the
slope is the likely reason deer intercept the track survey route
in the general vicinity of segment 4, which begins just south of
the Project Area's Parcel 4.
Hiding cover is a feature of habitat that provides an animal
security or a means to escape predators or harassment (Skovlin
1982). For mule deer, hiding cover is generally recognized as
some form of vegetation, such as a brushy thicket, but may also
be a drainage corridor. The pinyon pine CPinus monophylla)
forest which occupies the lower north and west slopes of the
ridge located just south of the Project Area (above the LADWP
aqueduct road), likely provides migrant deer with adequate
security cover as they move along the lower portion of the
-27-
ii
I
I
I
I
I
I
I
I
I
I
I
I
I
I
11
I
escarpment. With the exception of a few fragmented clumps of 3-5
foot high Sagebrush Scrub vegetation, the Project Area appears to
be lacking adequate security cover for deer.
In addition to security cover, the Pinyan Pine type also
provides habitat edge effect where it contacts the Sagebrush
Scrub type just south of segment 4. An abrupt ecotone such as
this likely furnishes deer with a greater variety of food and
cover along the contact zone.
Because of the location of the Project Area near the
intersections of Highways 120 and 395 <the gateway to Yosemite),
human intrusion is rampant. Tourists seeking an unobstructed
view of Mono Lake were often observed walking or driving roads
located within and adjacent to the Project Area, especially
within Parcel 1 which is adjacent to the Highway 120 pullout.
Tnis high level of human intrusion, when coupled with poor
security cover and lack of habitat edge effect, likely makes the
lower, more accessible portions of the Project Area unattractive
to, deer.
It is appropriate to emphasize that track counts provide a
very crude estimate to deer numbers and usage throughout the
Project area and surrounding vicinity. This is primarily due to
problems associated with weather and poor tracking substrate
which prevent track registration. According to Salwasser (1976)
and Connolly (1981), track counts may underestimate total numbers
of deer moving through an area for several reasons: rain, sleet,
-28
I
I
I
I
I
I
I
I
I
I
I
I
I
I
snow, or wind may prevent track registration; during periods of
heavier movement some tracks may obliterate others.
Conversely, track counts can also overestimate animal
numbers because a potential exists for multiple counts of the
same animals tracks. This source of error is impossible to
quantify especially for holdover and summer resident deer because
it may be the same individuals holding over for an unknown number
of days. For these reasons, estimates of deer abundance provided
in this ,report are meant only as approximations of relative deer
use within the Project Area and surrounding vicinity.
Furthermore, the precise number of deer using the project area at
one time is not important; what matters is the estimate of
magnitude. Track count data indicates that the Project Area and
vicinity was used by approximately 100 deer during the 1992
spring migration.
-29-
I
I
I
I
,,
I
I
I
'I
I
I
I
I
I
I
I
I
I
II
VI I. ENVIRONMENTAL IMPACT ANALYSIS
A. INTRODUCTION
Impending development of the Tioga Inn has initiated
concerns with respect to potential adverse impacts on
migratory mule deer and other wildlife. Concerns regarding
mule deer were based on knowledge obtained from a radio
telemetry studies of the Casa Diablo deer herd (Taylor 1988a)
which indicate that approximately 300 deer migrate through
the project vicinity. A site review of the Project Area
conducted by White (1984) was considered by CDFG and other
agencies to be deficient in data on the timing, amount and
specific locations of migratory deer use. In addition, the
White (1984) study did not address potential environmental
impacts of the proposed development or provide mitigation
measures to avoid or minimize impacts. The present
investigator was subsequently contracted to update previous
work and provide an assessment of migratory deer use of the
area.
This section describes the potential environmental
effects of the Tioga Inn on plant and animal communities
occurring within the Project Area. Impact assessment will
include an analysis of potential impacts of the project by
describing activities associated with each phase of the
proposed project description that may have a direct, and
indirect significant effect on biological resources.
-30-
I
I
I
I
I
I
I
I
I
I
I
I
I
I
I
I
Accompanying the impact assessment will be mitigation
measures which would avoid or minimize potentially adverse
impacts to insignificant or acceptable levels. This section
also identifies those significant environmental effects which
cannot be avoided if the project is implemented, including
those effects which can be mitigated but not to a level of
insignificance. The discussion of impacts to biolqgical
resources also include discussions pertaining to cumulative
impacts or the incremental impact of the project when added
to other past, present and reasonably foreseeable future
actions.
B. IMPACTS TO BIOLOGICAL RESOURCES
1. Loss of Native Vegetation and Wildlife Species
Construction of the proposed Tioga Inn will directly impact existing Great Basin Sagebrush Scrub vegetation, a significant environmental effect that cannot be avoided. However, the proportion of acreage taken out of production· compared to the remaining acreage of Great Basin Sagebrush Scrub vegetation in the Mono Basin is very low. Removal ot existing vegetation will result in decreased biomass production from replacement of vegetation by parking lots, roads and buildings. Vegetation removal would reduce the amount of suitable habitat for Sagebrush Scrub dependent species, since food and shelter resources provided by vegetation are no longer present. As a result, there would be a corresponding reduction in diversity and abundance of Sagebrush Scrub dependent species, both on the development site and in adjacent natural areas <Howald 1982). Most adversely effected would be animals having relatively small home ranges, such as small mammals and birds. Local abundance of common and typical wildlife species, e.g., chipmunk (Tamias sp.), ground squirrel (Spermophilus sp.) and Brewer's sparrow (Spizel la breweri), will decrease, since development results in loss of high quality habitat. In most cases, it ii not possible for displaced animals to successfully establish themselves in nearby natural areas, since these
-31-

I
I
I
I
I
I
I
I
I
I
I
I
I
I
I
I
I
I
I
areas already contain as many animals as they can support
( How a 1 d 1982). If the area impacted by deve 1 opmen t is relatively small, larger wide-ranging species such as mule deer, coyote and mountain lion, can often find resources on adjacent ranges. However, when animals attempt to move, greater competition for scarce resources occurs, and weaker individuals gradually die out, resulting in decreased
population size <Ingles 1965). Species diversity can also be
reduced by local extirpation of common and typical species.
This can occur when development eliminates or prevents the use of an essential resources in scarce supply, e.g., isolated thickets of vegetation required as hiding cover for mule deer fawns.
Natural plant revegetation within disturbed areas can be
expected to develop extremely slow due to severe climate and poor soils. Secondary succession in disturbed areas would
probably initially become dominated with a mixture of
herbaceous species (grasses and forbs) and weeds. It is
likely that shrub species would eventually reestablish on
these sites provided that the soil resources were left intact.
Increased erosion potential on steep slopes within the Project Area would likely occur as a result of vegetation removal. The intensity of erosion would depend on a number of factors including volume and intensity of precipitation, relative slope of terrain, and soil condition (Owen 1975).
The potential impacts to wildlife from vegetation removal associated with the proposed project include:
* Over utilization of adjacent habitats
* Decreased availability of forage and cover (e.g., lo�s
of Purshia as browse for mule deer>
* Adverse physiological effects and reduce reproductive
potential
* Interference or alteration of migration routes andmovement patterns
* Reduced wildlife numbers
2. Impacts From The Spread of Weeds
Natural areas characterized by low levels of disturbance and relatively harsh climates, such as the Mono Basin, typical1y support few weed species CHowald 1982). However, soil disturbance over large areas, in conjunction with overgrazing from domestic livestock and increased traffic, results in the decline of native plant species Cdecreasers) and encourages the spread of more tolerant �eed species (invaders) into the
-32-
I
1
,. I I
I
I
I
I
I
I
I
I
I
I
I
I
I
I
I
I
I
area. There are numerous plants from throughout the world that have been introduced into California. These plants have
the ability to survive without cultivation (Raven and Axelrod 1977). The presence of weeds can inhibit regrowth of native vegetation and also alter the availability of food supplies for herbivores (Howald 1982). In addition, some species of weeds also produce toxins that can be debilitating to some animals <Cronin et al. 1978).
3. Impacts From Free R0aming Pets
A typical problem associated with most development located in rural areas is harassment of wildlife by domestic pets. Free roaming domestic dogs can create an intolerable stress to deer (Reed 1981) and other wildlife, including rodents and small. mammals (Most 1981). Free roaming house cats can interfere with the courtship and feeding of birds and small mammals <Most 1980). Free roaming pets are a significant environmental effect which can be mitigated, but not reduced to a level of insignificance.
The potential impacts to wildlife from free roaming domestic pets associated with an increased population base include:
* Permanent decreased use or temporary desertion oftraditional habitat
* Shift of home range and change in distribution* Interference and alteration of migration routes* Reduced wildlife numbers* Reduced feeding efficiency* Use of more marginal habitats* Increased stress and energy expenditure* Decreased productivity
4. Impacts From Noise and Lights
Noise generated during construction activities and operatlonal phases of the project is a form of human intrusion that can adversely effect wildlife behavior <Howald 1982). Many animals respond to frequent noise disturbance by moving further from its source, resulting in lower wildlife diversity and abundance and crowding of adjacent natural areas (Howald 1982). Some species, however, which are less mobile or occupy smaller home ranges (e.g., small mammals) cannot readily vacate an area subjected to frequent noise disturbance. This can influence an individuals ability to forage efficiently and successfully rear young.
Night 1 ighting, 1 ike noise, typically accompanies
-33-
I
I
I
I
I
I
I
I
I
I
I
I
I
I
I
both construction and operation phases of development. The collective glow of lights associated with hotel, restaurant, mini-mart, and employee housing facilities will likely ii luminate areas well outside the Project Area boundaries. This will inhibit nocturnal use of these adjacent areas by some species, (e.g., mule deer and owls). With respect to impacts to wildlife resources, noise and lighting are significant environmental effects which can be mitigated to a level of insignificance.
Collectively, potential impacts to wildlife from noise and lights associated with the proposed development include:
* Permanent decreased use or temporary desertion of
traditional habitat* Shift of home range and change in distribution
* Interference and alteration of migration routes* Reduced wildlife numbers* Reduced feeding efficiency* Use of more marginal habitats* Increased stress and energy expenditure* Decreased productivity
5. Impacts to Mule Deer
There was an estimated 88 deer-days of use (75% of all deer use) of segments 1-4 during the 54 day survey period. As many as 60 migrants may have crossed this portion of the track survey route, illustrating its relative importance as a migration corridor.
The Project Area received an estimated 25 deer-days of use
during the 54 day survey period. This relatively light
amount of use indicates that the Project Area itself is of
little importance to the Casa Diablo herd as a migration corridor, at least during the spring migration period. It may, however, be an important foraging area for a small number of summer resident and holdover deer.
a. Direct and Indirect Impacts
The construction and operation of the Tioga Inn within the proposed Project Area could impact deer use of the project vicinity in a variety of ways. The following discussion categorizes potential direct (primary), indirect (secondary) and cumulative effects to mule deer resulting from human intrusion, habitat removal, habitat alteration, and direct mortality. For clarity, direct, or primary impacts, are environmental effects resulting from development due to
-34-
I
I
I
I
I
I
I
I
I
I
I
I
I
I
I
I
I
construction and operation activities (e.g., loss of foraging and fawning habitat fo� deer) (Comer 1982). Indirect (secondary) environmental effects typically occur outside the Project Area as the result of increased permanent or seasonal population growth within the community, and do not readily show a cause-effect relationship <Dodge 1992). Examples of indirect effect impacts include increased deer-vehicle collisions, increased physiological stress and lowered productivity in migratory and resident deer, and permanent decreased use or temporary desertion of traditional habitat due to human intrusion. Cumulative effects are the composite of al 1 environmental effects (direct and indirect) for the region resulting from past, present and reasonably _ foreseeable projects that are not related to the proposed project.
Direct and indirect impacts that would occur within and adjacent to the Project Area as a result of habitat removal, habitat alteration, human intrusion, and direct mortality, could adversely effect the herd segment which migrates through the area, particularly those animals <2-25 deer) which currently use the Project Area. Secondary impacts that would mostly be independent of the Tioga Inn and that would occur outside the proposed Project Area as a result of project generated human growth, e.g., dog harassment, increased deer-vehicle collisions, could adversely effect that portion of the Casa Diablo herd which migrates to the immediate south of the Project Area. Potential significant adverse impacts to this herd segment could have deleterious effects to overall herd productivity by contributing to the already poor recruitment rates currently experienced by the Casa Diablo deer herd.
1) Human Intrusion: Reflects disturbances to deer behaviorwhich would render undisturbed habitat immediatelyadjacent to the Project Area unsuitable for deer withoutphysically impacting habitat (indirect impact). Humanintrusion could result from construction and maintenanceactivities; and visual stimulus, noise, domestic dogs,increased human activity, and increased traffic associatedwith an increased permanent and seasonal (summertime>population.
Potential Impacts:
* Permanent decreased use or temporary desertion oftraditional habitat: Construction activities <e.g.,noise generated by heavy equipment), could displacemigrant, holdover and summer resident deer whichcurrently use the Project Area and immediate vicinityby forcing animals further upslope. This response
-35-
I
I
I
I
I
I
I
I
I
I
I
I
I
I
I
I
I
I
I
would constitute a significant environmental effect since as much as 3% of the Casa Diablo herd may be involved.
* Increased use of marginal habitat types: Migrant,holdover and summer resident deer which use habitatswithin and adjacent to the Project Area, could be
forced to use less suitable habitat for migration,
foraging and fawning <e.g., does which fawn near LeeVining Creek could be forced to more marginal fawninghabitats located further from Lee Vining Creek, an areawhich provides adequate food, cover and water).
* Alteration/interference of migration routes and shift
of home ranges: Deer which currently migrate throughthe Project Area vicinity could abandon traditionalhabitats due to construction related activities (e.g.,noise from heavy machinery) and operational phases<night 1 ighting, human activity, dogs, etc.)
* Increased energy expenditure and stress: Increasedphysiological stress could result from increased energyexpenditures associated with use of more nontraditionalhabitats for migration and summer range.
2) Habitat Removal: Reflects permanent physical reduction inthe amount of available habitat within the Project Areadue to the placement of facilities (primary effect), andoutside the Project Area due to increased community growth(secondary effect). Considered to be a significant
environmental effect.
Potential Impacts:
* Over utilization of adjacent habitat: Deer displaced
from the Project Area (direct impact) and adjacent
migration routes (indirect effect) could concentrate
activity outside the project's zone of influence. Thiscould create excessive crowding and increasedcompetition for resources, which could, over time,
result in over utilization of adjacent habitats. Thisresponse would constitute a significant environmentaleffect.
* Declines/elimination of forage and cover availability:Reductions in available deer habitat due to placementof facilities and increased community growth.
* Alteration/interference of migration routes and shiftof home ranges: Deer which currently migrate through orsummer within the project vicinity could abandontraditional habitats.
·-36-
I
I
I
I
I
I
I
I
I
I
I
I
I
I
I
I
I
I
I
* Adverse physiological effects and reduced reproductive
potential: Forage loss, alteration of migration routes,and over utilization of habitats could result inreduced productivity in migrant, holdover, and summerresident deer potentially displaced by the proposeddevelopment.
3) Habitat Alteration: Represents change in plant species
composition and structural characteristics due to thegrowth inducing effects of development.
Potential Impacts:
* Change in availability of forage and cover within the
Project Area and adjacent migration route.
* Change in utilization of adjacent habitats.
* Change in animal reproductive success: Increasedphysiological stress from habitat alteration from
placement of facilities (direct impact) and increasedcommunity growth (indirect impact) resulting in
decreased productivity.
4) Direct Mortality: Losses of deer due to constructionactivities as a result of increased deer-vehiclecollisions created by utilization of alternate migrationroutes, e.g., across Route 395 or Route 120. Considered tobe a significant environmental effect.
Potential Impacts:
* Decreased deer numbers.
* Decreased prey base for predators, mainly coyotes andmountain lions.
b. Cumulative Impacts
Comer (1982) defined cumulative effects as "the totality of interactive impacts over time; or the sum incremental synergistic effects on fish and wildlife habitats caused by al 1 reasonable future actions over time and space". Cumulative impacts for an individual project may be minor, but collectively significant.
There are several reasonably foreseeable projects proposed on Casa Diablo deer herd migration routes and seasonal ranges which could have cumulative impacts to the Casa Diablo deer
-37-
I
I
I
I
I
I
I
I
I
I
I
I
I
I
I
I
I
herd. These projects include:
* The Arcularius Ranch located on the upper Owens Riverholding area is planning a substantial expansion oftheir 1,080 guest ranch fadility. The upper Owens Riverholding area is used by approximately 70% of the CasaDiablo deer herd during annual spring and fa! Imigrations. For this reason, the holding area appearsto be an extremely important component of the CasaDiablo deer herd's year-round range and likely plays anintegral role in the productivity of this herd. Habitatdegradation and human intrusion within the ho_lding areacould contribute to declining recruitment rates bylowering the ability of deer to overcome nutritionalstress acquired over the winter.
* The California Department of Transportation (Caitrans)is proposing a highway expansion from 2-4 lanes withinthe vicinity of Sandhouse Hill, located between thesouth June Lake Junction and approximately two milessouth of Lee Vining. Telemetry data (Taylor 1988a) andtrack count data (Taylor 1990) indicates that between50% and 66% of the Casa Diabio herd crosses thissection of highway during annual spring and failmigrations. Therefore, the proposed highway expansioncould result in additional direct mortality of deer dueto the increased risk of deer-vehicle collisions.
* Mammoth Mountain Ski Area has proposed development ofthe Hartley Springs, White Wing Mountain and SanJoaquin Ridge areas for alpine skiing. These areasprovide important migration and summer range habitatfor the Casa Diablo herd.
Other considerations regarding migratory mule deer which should be addressed in the impact analysis include:
* The Casa Diablo deer herd is currently experiencing lowrecruitment rates primarily as a result of a prolongeddrought.
1) Human Intrusion: Reflects disturbances to deer behaviorwhich would render undisturbed habitat immediatelyadjacent to the Project Area unsuitable for deer (indirectimpact). Human intrusion could result from constructionand maintenance activities; and visual stimulus, ambientnoise, domestic dogs, increased human activity, andincreased traffic associated with an increased permanentand seasonal (summertime) population.
-38-
I
I
I
I
I
I
I
I
I
I
I
I
I
I
I
_I
I
I
I
2)
Potential Impacts:
* Permanent decreased use or temporary desertion oftraditional habitat: Construction activities coulddisplace migrant deer which currently use the areaimmediately south Project Area by forcing animalsfurther upslope. This response would constitute asignificant environmental effect since as much as 3% ofthe Casa Diablo herd may be involved.
* Increased use of marginal habitat types: Migrant,holdover and summer resident deer which use habitatssouth of the Project Area could be forced to use lesssuitable habitat for migration and foraging.
* Alteration of migration routes and shift of homeranges: Deer which currently migrate and summeradjacent to the Project Area could abandon traditionalhabitats.
* Increased stress and energy expenditure
Habitat Removal: Refl�ct� permanent physical reduction the amount of available habitat due to unrelated, reasonably foreseeable projects. Considered to be a significant environmental effect.
Potential Impacts:
in
* Declines/elimination of forage and cover availabilityand over utilization of adjacent habitats: Deerdisplaced from the increased growth could concentrateactivity outside the project's zone of influence. Thiscould create crowding and increased competition forresources, which could, over time, result inover utilization of adjacent habitats. This responsewould constitute a significant environmental effect.
* Interference to daily movement patterns of holdover andsummer resident deer: As proposed, the locations offacilities could alter movement patterns of summerresident and holdover deer.
* Adverse physiological effects and reduced reproductivepotential: Forage loss could result in reducedproductivity of summer resident deer potentiallydisplaced by the proposed development.
3) Habitat Alteration: Represents change in plant speciescomposition and structural characteristics due to the
-39-
I
I
II
I
I
II
,I
I
I
I
I
I
I
I
I
I
I
I
I
growth inducing effects of unrelated, reasonably foreseeable development projects.
Potential Impacts:
* Change in availability of forage and cover within themigration route.
* Change in utilization of adjacent habitats.
* Change in animal reproductive success: Increasedphysiological stress from increased community growthresulting in decreased productivity.
4) Direct Mortality: Losses of deer due increased deervehicle collisions on Mono County roadways.
Potential Impacts:
* Decreased deer numbers.
* Decreased prey base for predators, mainly coyotes andmountain lions.
C. MITIGATION MEASURES
Direct, indirect, and cumulative significant environmental effects to mule deer and other wildlife that would occur as a result of the proposed Tioga Inn development are attributed to human intrusion, permanent losses and alteration of existing habitat, and direct mortality. Mitigation measures designed to minimize the magnitude of a significant environmental effect or reduce impacts to a level of
insignificance are presented below.
1. Construction Activities
During spring migration, mule deer does in their third trimester of pregnancy are experiencing increased nutritional demands due to accelerated fetal development and migration to the summer range. Mule deer does from the
Casa Diablo herd typically breed in late October and early November and give birth to fawns in late June and early July (Taylor 1988b). Noise, lights and other forms of human intrusion associated with construction activities could disturb pregnant does migrating through the project vicinity in the spring, resulting in increased stress and reduced reproductive success.
-40-
I
I
I
I
11 I
I
I
I
I
I
I
I
I
I
Impacts from construction activities will be minimized through the fol lowing measures:
* Construction will be scheduled to minimize disturbance tomigratory deer during the spring and fallmigration/holding periods. Track count data indicatesthat in the spring deer arrive in the project vicinity asearly as late April. The fall migration period can extendfrom mid-September through mid-December depending on theseverity of weather. Therefore, construction activitieswithin Parcel 4 should be scheduled during the interimperiod between spring and fall migration periods (1 June-15 September).
The objective of this measure is to minimize disturbanceto migrant deer which use the project vicinity, especiallythe area south of Parcel 4, during the spring and fallholding/migration periods. Restricting the timing ofconstruction to the interim period between spring and fallmigrations wil 1 reduce, but not to a level ofinsignificance, direct human intrusion impacts associatedwith construction activities. However, this measure willnot minimize construction associated impacts to summerresident deer. Nor wil 1 it reduce impacts to migratorydeer in the event of an ea�ly migration (prior to 15September).
* Construction will be conducted during daytime hours inorder to reduce disturbance to nocturnal wildlife species,particularly migratory mule deer.
2. Control of Domestic Dogs
Many researchers have documented cases of deer mortalityfrom dog attacks (Lindsale and Tomich 1953, Boyles 1976,Moser 1975, Dasmann and Taber 1956). For this reasondomestic dogs would be controlled within the Project Areaduring both construction and operation phases. Mono Countyleash laws would be enforced to the greatest extentpossible through adequate signing and regular patrol.Hotel guests and all patrons will be provided an enclosedarea located away from the migration corridor to walkpets. Tioga Inn employees will be required to keep dogs inan enclosed area. A full-time project employee will likelybe needed to successfully e�force this measure.
Implementation of this measure will minimize direct andindirect significant adverse impacts associated with humanintrusion, and direct and indirect mortality, ,injury andharassment of deer and other wildlife from free roamingdomestic dogs.
-41-

I
I
I
I
I
I
I
I
I
I
I
I
I
I
I
I
I
I
I
3. Noise and Lights
* Vegetative Screening--Screening caver will be establishedon the south, west and east sides of Parcel 4 whereemployee housing is proposed. Screening caver should beplanted in a 20 foot wide band consisting of an innerstrip of native shrubs and an outer strip of trees. Thisdesign wil I effectively reduce illumination and noise intothe migration corridor, screen employee houses frommigrating deer, and provide additional wildlife habitat.Smith and Canner (1989) suggested that deer avoidance ofstructures declines with the amount of vegetation adjacentto them. Vegetative screening also has the function ofsound pol lutian abatement, because it is particularlyeffective in absorbing high frequency sounds (Owen 1975).Visual screening wil I not be effective until a number ofyears after its implementation, when plants are largeenough to provide a visual barrier. Therefore, the use oflarger planting stack is recommended in order toaccelerate thi.s process. Fast growing tree species thatmay work well as screening cover and provide migrating andholdover deer with additional forage once they becameestablished include; poplars <Populas sp. ), alder (Alnussp.), and willow (Salix sp.). Willow and alder arehydrophilic species that require copious amounts of waterin order to survive. For this reason, it wi 11 benecessary ta establish an irrigation system to ensure bothrapid growth and longevity of these species, Poplarsrequire less water than willows and alders, but stil 1 needmesic soils in order to survive. Slower growing endemicspecies requiring less water include: Jeffrey pine (Pinusjeffreyi), single-leaf pinyon pine (Pinus monophylla),western juniper (Juniperus occidentails)(Appendix. Figure 8).
Regardless of the tree species used as screening caver, it wil 1 be necessary to protect the terminal shoots of young individual trees from deer, rodents and domestic livestock. Several types of individual tree barriers have been designed to protect tree leaders, allowing them to grow quickly beyond the reach of deer. Wire cages have been widely used (Longhurst et al. 1962, Mealy 1969), but are expensive and must be removed as enclosed trees grow. Yawney and Johnson (1974) found that a 1.52 m (5 ft) wire fence surrounding seedlings worked wel I ta protect them from deer. Vexar tubing <E. I. DuPont de Nemours and Company, Inc. ) has been success f u I in protecting Doug I as fir seedlings (Campbell and Evans 1969) and oak seedlings (Lasher and HI 11 1977).
* Impacts from night lighting can also be minimized byavoiding unnecessary lights and unnecessarily bright
-42-
I
I
I
I
I
I
I
I
I
I
I
I
I
I
I
I
I
I I
I
lights. Lights which could potentially illuminate the migration corridor should be avoided or adequately
screened.
Implementation of these measures would minimize direct and indirect significant adverse impacts associated with human intrusion resulting from employee housing and commercial
lighting.
4. Fencing
Fencing, depending on the type and location, can have indirect significant adverse effects on deer by _ interfering with �igration and the use of seasonal habitats. Fencing can also result in direct mortality of deer (Urness 1976, Papez 1976). Therefore, any wire fences, except those required for retaining pets, will be prohibited. Any other impediments to deer movements such as spoil piles, open ditches, and excessive cut-fill slopes will be minimized to the greatest extent possible. For example, care must be taken to avoid leaving ditches or trenches open for a prolonged period of time since they can be hazardous to migrating deer and other wildlife.
5. Utilize Existing Dirt Roads
Access and maintenance roads will be designed to follow existing dirt road alignments whenever possible to avoid unnecessary removal of additional vegetation. This would minimize significant environmental effects associated with habitat loss and alteration.
6. Establish Driver Warning Signs
Establishing driver warning signs along Highway 395 and Highway 120 (west), would minimize significant environmental effects associated with direct mortality from deer-vehicle collisions.
7. Control ling Vehicle Access
Limiting vehicular access within the migration corridor immediately south of the Project Area would minimize significant environmental effects to deer resulting from
increased human intrusion.
8. Maintain Existing Native Vegetation
Vegetative disturbance due to construction activities would be confined only to those areas designated for development to protect surrounding vegetation. In this way, landscaping needs are minimized by retaining the
-43-
I
I
I
I
I
I
I
I
I
I
I
I
I
I
I
I
I
I
I
maximum amount of native vegetation possible. The pad cleared for ·a particular building usually alters more habitat then just the building itself. Development designers are encouraged to use techniques to reduce the area altered by pads and drives. This could minimize significant environmental effects to deer associated with habitat loss and alteration.
9. Revegetation with Native Plants
Revegetation of disturbed areas shall be conducted usingnative plants as soon as possible following construction.This could reduce significant environmental effects todeer associated with habitat loss and alteration. A listof native plants appropriate for revegetation are providedin Appendix Figure 8.
10.Control of Weeds
At the Tioga Inn project site, the spread of weeds can bedeterred by revegetating disturbed sites as soon aspossible, using mulches free of weed seeds, and coveringstockpi 1 ed topsoi 1 <Dodge 1992).
11.Control of Erosion
Unfortunately, many development projects are associatedwith extensive soil erosion largely because of either lackof planning or carelessness. For example, studies by theSoil Conservation Service (USDA 1970) have shown thaterosion of soils on land used for development projects(highways, buildings, homesites, etc.,) is 10 timesgreater than on land in pasture and 2,000 times greaterthan on land in timber. Erosion control measures thatmight be effectively implemented at the construction siteinclude:
* No more vegetation should be removed from the site than isabsolutely necessary for immediate con�truction purposes.
* Steep road cuts should be revegetated as soon as possibleafter construction.
* Disturbed areas should be reseeded as soon as possibleafter construction with native vegetation.
* Temporary catch basins may be constructed to interceptrun-off water and trap its sediment load. Afterconstruction has been completed and revegetated, thebasins may be removed and the area graded and blended intothe surrounding landscape.
-44-
I
I
I
I
I
I
I
I
I
I
I
I
I
I
I
I
I
I
I
* Boards can be arranged in rows across steep areas to serve
as temporary terraces, thus establishing soils andal lowing seeding (USDA 1970).
12.Mitigation Monitoring
Several mitigation measures will require monitoring.
California law (PRC 210801.6) requires that mitigation monitoring be conducted. A plan will be developed to
comply with measures outlined in the mitigation plan.
-45-
I
I
I
I
I
I
I
I
I
I
I
I
I
I
I
I
I
VIII. REVIEW OF LITERATURE RELEVANT TO THE PROPOSED PROJECT
According to Wal Imo et al. (1976) and Bormann (1976), rural housing developments in deer habitat with their accompanying increases in automobiles, snowmobiles, off-road vehicles,
dogs and human activity, affect large areas beyond the actual
boundaries of the development. As a result, the overall
effect of these encroachments on mule deer habitat is greater
than indicated by analysis of the actual area involved.
Disturbances associated with housing developments on and
adjacent to deer winter range significantly alter, reduce or eliminate deer use of an area (Mackie and Pac 1980). Smith and Conner (1989) reported that a one-acre loss in.habitat can equate to a 2.5 acre loss in deer habitat due to
significant reductions in deer use around the area developed.
Smith and Conner (1989) also suggested that when a house is
built on deer range, deer affected by the house redistribute
their use to just outside the zone of influence of the house. This could result in over utilization of more marginal
habitats outside the zone of influence through increased
interspecific competition for food and cover resources. Armstrong et al. (1983), indicated that cottage development
in Ontario reduced the quality of winter white-tailed deer habitat. Mann (1985), suggested that deer use of an area decreased with increased development of recreational lot and second home subdivisions, but the intensity of use is dependent upon location, year, season and human activity. Cornett et al. (1979), provided evidence that deer use of a
meadow near cabins received only 40 percent of the use of a
similar control meadow located in an undisturbed area.
Cornett et al. (1979) also reported that deer use was reduced
by 30 percent within a 30-50 yard distance to hiking trails.
Freedy et al. (1986) concluded that mule deer were more
disturbed by people afoot then by snowmobiles.
Reproduction and condition studies of several local deer
herds have shown that deer in the eastern Sierra exist on a
negative energy budget during the winter months (Kucera 1988,
Taylor 1988b). The energy required by activity is derived from products of digestion and stored fat reserves. In the
winter, deer rely heavily on fat stores accumulated over the summer and fall months to supplement digestible energy available from the winter range (Mackie and Pac 1980, Short
1981). Deer also attempt to conserve energy by lowering their
metabolic rate and by conducting energy-efficient activity
and range use patterns (Mackie and Pac 1980). When normal
activity patterns are disrupted due to development, drought, overgrazing, excessive snowfall, interaction with humans, or
other factors, digestible energy intake can be reduced severely and the rate at which fat reserves are used will increase. This wil I ultimately decrease an animals ability to
-46-

I
I
I
I
I
I
I
I
I
I
I
I
I
I
I
I
I
I
I
survive the winter and reproduce the following year (Mackie
and Pac 1980). This is especially true of deer with limited
fat reserves, such as fawns or animals from poor-quality summer or intermediate ranges. In severe winters, these
animals can tolerate little additional energy costs if they
are to survive. Under repeated harassment, they wi 11 rapidly
deplete stored fat and succumb to malnutrition when
sufficient energy is no longer present to maintain normal bodily functions (Short 1981). According to Mattfeld (1973) 1
the energy costs of running, especially in deep snow, is many times that of walking on bare ground.
'-47-
I
I
I
I
I
I
I
I
I
I
I
I
I
I
I
I
I
I
I
IX. LITERATURE CITED
Armstrong, E., D. Euler, and G. Racey. 1983. White-tailed deer habitat and cottage development in central Ontario. J. Wi ldl. Manage. 47(3) :605-612.
Beasom, S. L., W. Evans and L. Temple. 1980. The drive net for capturing western big game. J. Wild!. Manage. 44(2):478-480.
Bertram R.C., and R.D. Remple. 1977. Migration of the North Kings deer herd. Calif. Fish and Game. 63:157-179.
Bertram, R.C. 1884. North Kings deer herd study. Calif. Dept. of Fish and Game, 203 pp.
Bormann, F.H., 1976. An inseparable linkage; Conservation of natural ecosystems and the conservation of fossil energy. Bioscience 26:754-60.
Boyles, D.E. 1976. Dogs and deer don't mix. Colo. Outdoors 25(2)12-13.
Campbell, D.L., and J. Evans. Plastic fabric to protect seedlings from animal damage. l...!l wildlife and reforestation in the Pacific Northwest, Symp. Proc., ed. H.C. Black, pp. 87-88. Corval !is: Oregon StateUniversity. 92 pp.
Clover, M. R. 1956. Single-gate deer trap. Calif. Fish and Game 42:(3)199-201.
Comer, R.D. 1982. Understanding secondary effects of development on wildlife resources in mitigation planning. In Comer et al. (eds.). Proceedings of Nat. Symp. on Ussues and Tech. in Management of Impacted Western Wildlife. Thorne Ecol. Inst. pp 16-31.
Connelly, G.E. 1981. Assessing populations. Pp 287-345 in O.C. Wallmo (ed.) Mule and black-t�iled deer of North America. Univ. Nebraska Press, Lincoln. 605 pp.
Cornett. D.C., W.M. Longhurst, R.E. Hafenfeld, T.P. Hemker, and W.A. Williams. 1979. Presented at the Mitigation Symposium, Fort Collins, Colorado, July 16-20, 1979.
Cronin, E.H., P. Ogden, J.A. Young, and W. Laycock. 1978. The ecological niches of poisonous plants in range communities. J. Range Manage. 41:328-334.
-48-
I
I
I
I
I
I
I
I
I
I
I
I
I
I
I
I
I
Dasmann, W. 1981. Deer range improvement and management� McFarland and Co., Inc., Jefferson, N.C., and London.
168 pp.
Dasmann. R. F., and R. D. Taber. 1956. Behavior of Columbian black-tailed deer with a reference to population ecology. J. Mammal. 37:143-64.
Dodge, W.8. 1992. Sweetwater subdivision environmental impact report-biological resources. L.K. Johnston and Associates, Mammoth Lakes, Ca. 43pp.
Inge!, L.G. 1965. Mammals of the Pacific States. Stanford
Univ. Press, Stanford, Calif-0rnia.
Garrott, R. A., G. C. White, R. M. Bartmann, L. W. Carpenter,
and A. W. Alldredge. 1987. Movements of female mule deer in northeast Colorado. J. Wild!. Manage. 51:634-643.
Geist V. 1981. Behavior: adaptive strategies in mule deer. Pages 157-223 in O. C. Wallmo, ed. Mule and black-tailed deer of North America. Univ. Nebraska Press, Lincoln.
Howald, A.M. 1982. The Bluffs development site-Existing conditions and potential impacts to biological resources. Typescript, 23pp.
Kerr, R. M. 1979. Mule deer habitat guidelines. U.S. Dept. of the Interior - Bureau of Land Management, Technical Note. Denver Service Center. 60pp.
Kucera, T.E. 1988. Ecology and population dynamics of mule
deer in the Eastern Sierra Nevada, California. Ph.D.
thesis, University of California Berkeley. 205pp.
Laudenslayer, W.F., W.E. Grenfell, and D.C. Zeiner. 1991. A check-list of the amphibians, reptiles, birds, and
mammals of California. Calif. Fish and Game. 77(3): 109-141.
Lasher, D.N., and E.P. Hil 1. 1977. An evaluation of polypropylene mesh tubing as a deer browse deterrent for southern hardwood seedlings. Proc. Ann. Conf. Southeast Assoc. Game Fish Comm. 31:239-245.
Leopold, A. S., T. Riney, R. McCain, and L. Tevis. 1951. The Jawbone deer herd. Bull. No. 4. Sacramento: California Department of Fish and Game. 139pp.
-49-
I
I
I
I
I
I
I
I
I
I
I
I
I
I
I
I
I
I
I
Lindsdale, J.M., and P.Q. Tomich. 1953. A herd of mule deer: A record of observations made on Hastings Natural History Reservation. Berkeley: University of California Press. 567pp.
Loft, R, R., J. W. Menke, and T. S. Burton. 1987. Seasonal movements and summer habitats of female mule deer in the central Sierra Nevada. J. Wild!. Manage. 48(4):1317-1326.
Longhurst, W.M., M.B. Jones, R.R. Parks, L.W. Neubauer, and M. W. Cummings. 1962. Fences for control I ing deer damage. California Agricultural Experiment Station Extension Service Circular 514. 15pp.
Mann, D.K. 1985. The impact of mountain housing developments on mule deer habitat in Utah. Proceedings of the Third Utah Shrub and Ecology Workshop, Utah State Univ., Logan, UT. p 43-51.
Mackie, R.J., and D.E. Pac. 1980. Deer and subdivisions in the Bridger Mountains, Montana. Presented at the 60th Annual Conference of the Western Assoc. of Fish and
Wildlife Agencies, Kalispell, MT. p 517-526.
Mattfeld, G.F. 1973. The effect of snow on the energy expenditure of walking white-tailed deer. Proc. NE Fish and Wild!. Conf. 30:327-43.
Mealey, R.H. 1969. Nylon fencing to protect forest plantations. ln. Proceedings: Wildlife and reforestation in the Pacific Northwest symposium 1968. ed. H.C. Black,
pp. 89-90. Corval !is: Oregon State University 92pp.
Mono County. 1991. Arcularius Ranch Specific Plan Project Description. Haselton and Ass. Sept, 6, 1991. 9pp.
Moser, K. 1975. Developments at Vail. Colo. Outdoors 24 C 1 ) : 14-1 7.
Most, B.W. 1980. Free-roaming pets destroy wildlife; control efforts draw howls from owners. Defenders. 63:170-173.
Nelson, J. R. and T. A. Leege. 1982. Nutritional requirements and food habits. Pages 323-326 ln. J. W. Thomas and D. E.
Toweil l ed., Elk of North America: Ecology and Management. Stackpole Books. 870pp.
Owens, D.S. 1975. Natural resource conservation; An ecological approach. Second Edition. McMillian Publishing Co. Inc. 700pp.
-50-
I
I
I
I
I
I
I
I
I
I
I
I
I
I
I
Papaz, N. 1976. The Ruby-Butte deer herd. Biological Bui!.·
No. 5. Reno: Nevada Dept. of Fish and Game. 61pp.
Raven, P.H., and D. I. Axelrod.
of the California flora.
Botany. Vol. 72. 134pp.
1978. Origin and relationships
Univ. of Calif. Publications in
Russel I, C. P. 1932. Seasonal migration of mule deer. Ecol.
Monogr, 2:1-46.
Salwasser, H. 1976. Man, deer and time on the Devil's Garden.
Procesdings of the Western Association of Game and Fish Commissioners 56:295-318.
Short, H.L. 1981. Nutrition and metabolism. Pages 99-128 lr:!..
O.C. Wallmo edited, mule and black-tailed of North
America. University of Nebraska Press, Lincoln. 605pp.
Skovlin, J. M. 1982. Habitat requirements and evaluations.
Pages 369-414 in J. W. Thomas and D. E. Toweill Elk of
North America: ecology and management. Stackpole Books, Harrisburg, Pa.
Smith, D.O., and M. Conner. 1989. The distribution of winter
mule deer use around homesites. Draft Report. Presented at the Transactions of the Western Section of the
Wildlife Society. 15 pp.
Taylor, T. J. 1988a. Migration and seas9nal habitats of the
Casa Diablo deer herd. Casa Diablo deer herd study.
Calif. Dept. of Fish and Game, Bishop, California.
55pp.
___ . 1988b. The Casa Diablo deer herd reproduction and
condition-1987-1988. Calif. Dept. of Fish and Game,
Bishop, California. 23pp.
1990. Deer migration study: Highway 395 expansion
projects, Mono County, California. Final report, July
1990. California Dept. of Transportation. Bishop,
Ca Ii fornia, 106pp.
___ . 1991. Coleville Marine Corps Housing Center deer migration study. Final report, July 1991. California.
Dept. of Fish and Game, Bishop, California. 69pp.
Thomas, R. D. 1985. Casa Diablo deer herd management plan.
California Department of Fish and Game. 54pp.
-51-
I
I
I
I
I
I
I
I
I
I
I
I
I
I
I
I
I
I
I
Urness, P. J. 1976. Mule deer habitat changes resulting from livestock practices. ln. mule deer decline in the west: A symposium, ed. G. W. Workman and J. B. Low, pp. 21-35. Logan: Utah State University College of Natural Resources and Agricultural Experiment Station. 134pp.
U.S. Department of Agriculture. 1970. Control ling erosion on construction sites. Soil Conservation Service. Agri. Info. Bul I. No. 347.
Wallmo, 0.C., D.F. Reed, and L.H. Carpenter. 1976. Alteration, agriculture and housing developments. Presented at the Mule Deer Decline in the West Symposium, Utah State Univ. College of Natural Resources, Utah Agric. Exp. Stat., Logan, UT. p 37-46.
Watson, J. W., M. G. Garrett, and R. G. Anthony. 1991. Ecology of Bald eagles in the Columbia River Estuary. J. Wild!. Manage. 55(3):492-499.
Yawney, H.W., and E.P. Johnson. 1974. Protecting planted sugar maple seedlings from deer browsing. Hardwood Res. Coun. Ann. Hardwood Symp. 2:97-108.
-52-
I
I
I
I\
! I
I I
I .I
I i /' .
. I
!I
! 1·
: I
I
I
I
;1 I
I _:
I
I
APPENDIX A
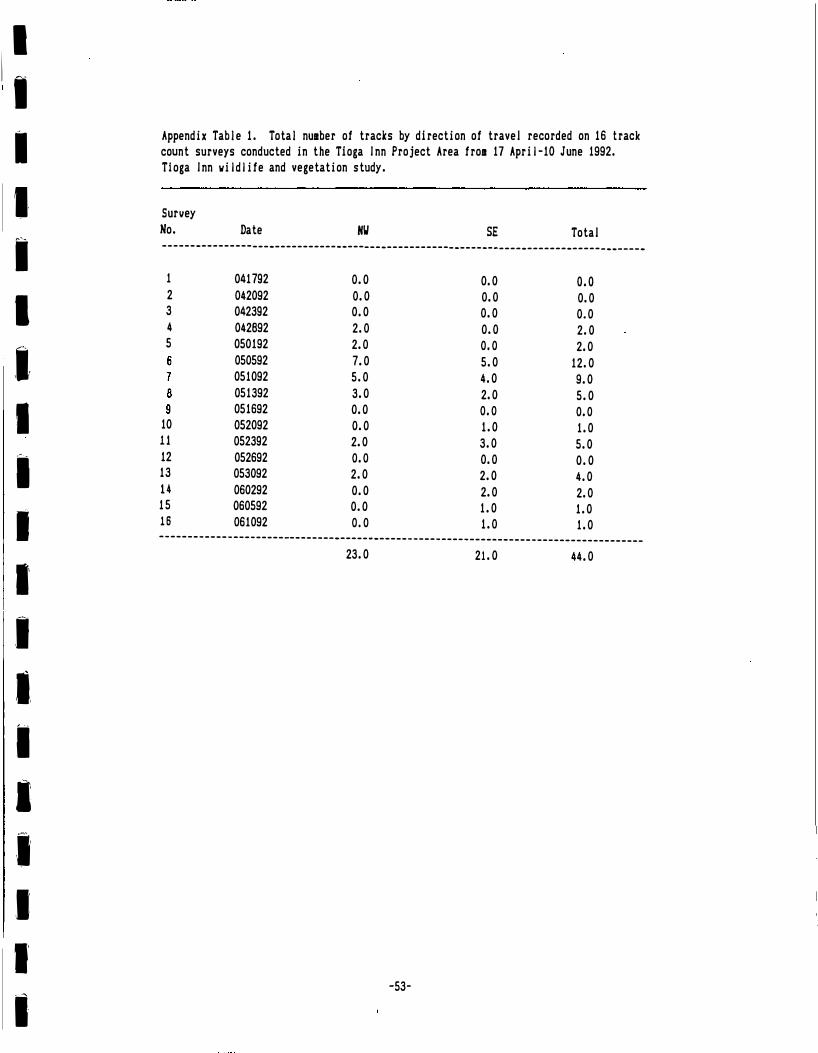
I 1,
I
I
I
I
,I
I
I
I
I'
.I
I,
I
I
I
I
1·
I
Appendix Table 1. Total number of tracks by direction of travel recorded on 16 track
count surveys conducted in the Tioga Inn Project Area from 17 April-10 June 1992.
Tioga Inn wildlife and vegetation study.
Survey
No. Date H\I SE Total --------------------------------------------------------------------------------------
1 041792 0.0 0.0 o.o
2 042092 0.0 0.0 0.0 3 042392 0.0 0.0 0.0 4 042892 2.0 0.0 2.0 5 050192 2.0 o.o 2.0
050592 7.0 5.0 12.0 051092 5.0 4.0 9.0 051392 3.0 2.0 5.0 051692 0.0 o.o o.o
10 052092 0.0 1.0 1.0 11 052392 2.0 3.0 5.0 12 052692 o.o 0.0 0.0 13 053092 2.0 2.0 4.0 14 060292 0.0 2.0 2.0 15 060592 0.0 1.0 1.0 16 061092 o.o 1.0 1.0 --------------------------------------------------------------------------------------
23.0 21. 0 44.0
-53-
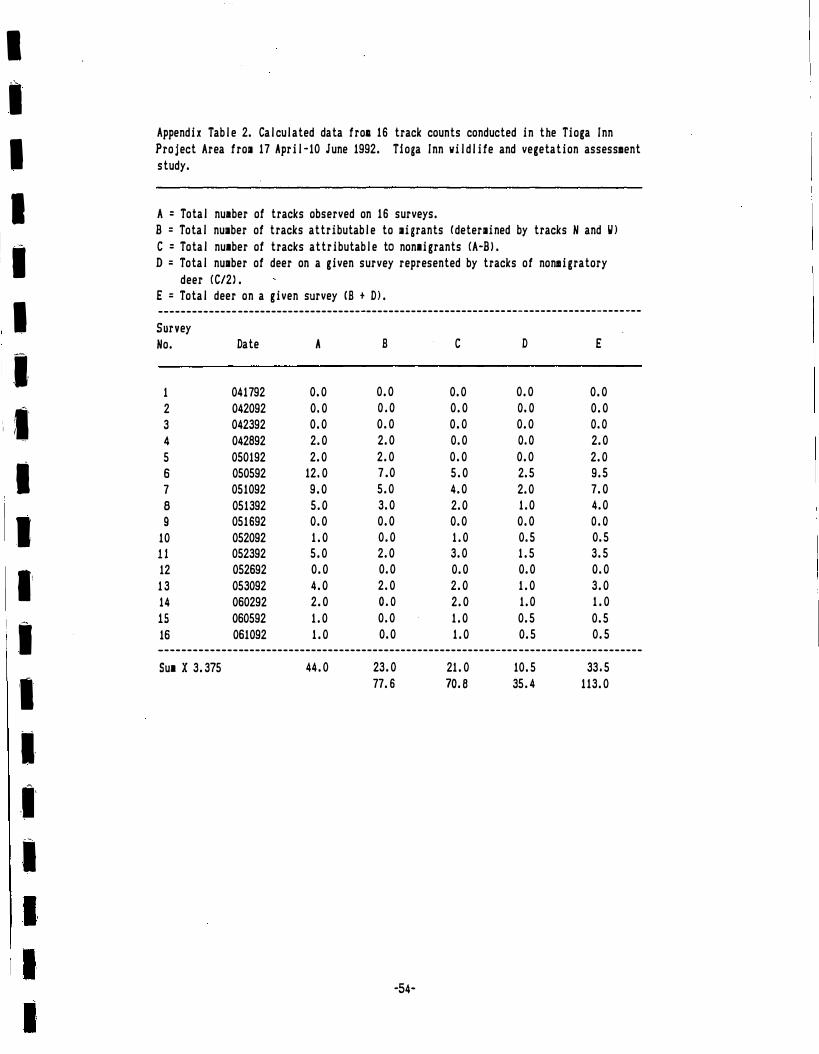
I
I
I
I 'I
-
'I
I
. I
I 1•
I
I
ll
I
'I
1.
_,,
I
Appendix Table 2. Calculated data fro1 16 track counts conducted in the Tioga Inn
Project Area from 17 April-10 June 1992. Tioga Inn wildlife and vegetation assessment
study.
A= Total nu1ber of tracks observed on 16 surveys.
B = Total number of tracks attributable to migrants (determined by tracks N and WJ
C = Total nu■ber of tracks attributable to non■igrants (A-Bl.
D = Total number of deer on a given survey represented by tracks of nonmigratory
deer (C/2). E = Total deer on a given survey CB+ DJ. --------------------------------------------------------------------------------------
Survey
No . Date A B C D E
1 041792 0.0 0.0 0.0 0.0 0.0
2 042092 0.0 o.o 0.0 o.o 0.0
3 042392 0.0 0.0 0.0 0.0 o.o
4 042892 2.0 2.0 0.0 o.o 2.0
5 050192 2.0 2.0 0.0 0.0 2.0
6 050592 12.0 7.0 5.0 2.5 9.5
7 051092 9.0 5.0 4.0 2.0 7.0
8 051392 5.0 3.0 2.0 1.0 4.0
9 051692 0.0 0.0 0.0 0.0 o.o
10 052092 1.0 0.0 1.0 0.5 0.5
11 052392 5.0 2.0 3.0 1.5 3.5
12 052692 0.0 0.0 0.0 0.0 0.0
13 053092 4.0 2.0 2.0 1.0 3.0
14 060292 2.0 o.o 2.0 1.0 1.0
15 060592 1.0 0.0 1.0 0.5 0.5
16 061092 1.0 0.0 1.0 0.5 0.5 --------------------------------------------------------------------------------------
Su■ X 3.375 44.0 23.0 21. 0 10.5 33,5
77.6 70.B 35.4 113.0
-54-
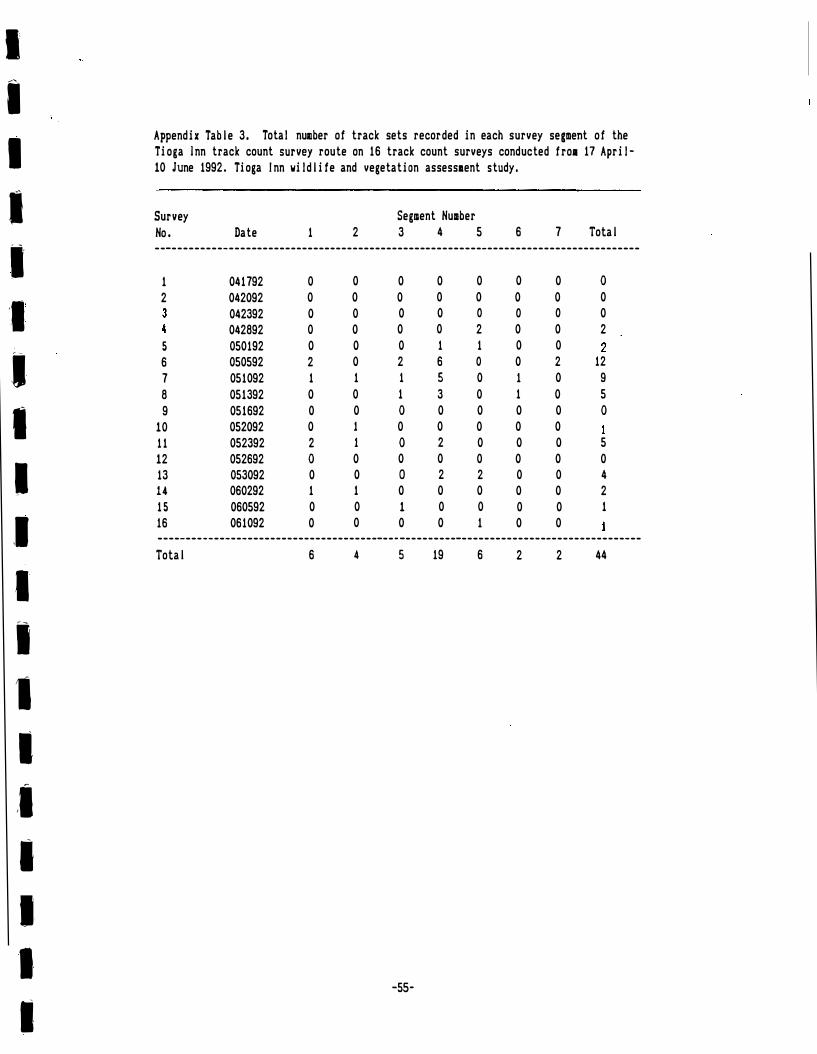
I
I
I
I
I ',I
I
,1
I ,I
I
I
I
I
,I
I
I
I
1·
Appendix Table 3. Total number of track sets recorded in each survey segment of the
Tioga Inn track count survey route on 16 track count surveys conducted fro■ 17 April-
10 June 1992. Tioga Inn wildlife and vegetation assess1ent study.
Survey Segment Number
No. Date 1 2 3 4 5 6 7 Total --------------------------------------------------------------------------------------
1 041792 0 0 0 0 0 0 0 0
2 042092 0 0 0 0 0 0 0 0
042392 0 0 0 0 0 0 0 0
042892 0 0 0 0 2 0 0 2
5 050192 0 0 0 1 1 0 0
6 050592 2 0 2 6 0 0 2 12
7 051092 1 1 1 5 0 1 0 9
8 051392 0 0 1 3 0 1 0 5
9 051692 0 0 0 0 0 0 0 0
10 052092 0 1 0 0 0 0 0
11 052392 2 1 0 2 0 0 0 5
12 052692 0 0 0 0 0 0 0 0
13 053092 0 0 0 2 2 0 0 4
14 060292 1 1 0 0 0 0 0 2
15 060592 0 0 1 0 0 0 0 1
16 061092 0 0 0 0 1 0 0 --------------------------------------------------------------------------------------
Total 6 4 5 19 6 2 2 44
-55-
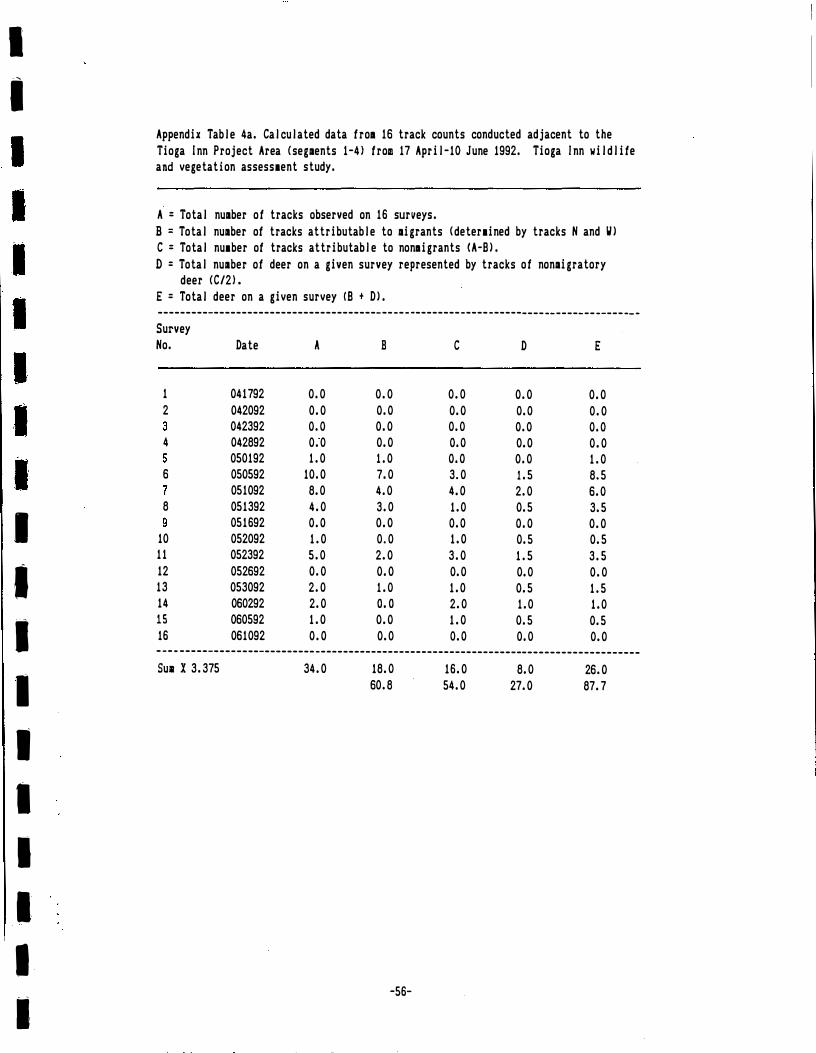
I
I
I
I
I
I
I
I
I
I
I
I
Appendix Table 4a. Calculated data fro■ 16 track counts conducted adjacent to the
Tioga Inn Project Area (segments 1-4) from 17 April-10 June 1992. Tioga Inn wildlife
and vegetation assess■ent study.
A= Total number of tracks observed on 16 surveys.
B = Total number of tracks attributable to migrants Cdeter■ined by tracks N and Wl
C = Total nu■ber of tracks attributable to non■igrants <A-Bl.
D = Total number of deer on a given survey represented by tracks of nonmigratory deer (C/2).
E = Total deer on a given survey CB+ Dl. --------------------------------------------------------------------------------------
Survey
No. Date A B C D E
1 041792 0.0 0.0 0.0 0.0 0.0 2 042092 0.0 o.o 0.0 o.o 0.0
042392 o.o 0.0 0.0 o.o o.o
4 042892 0.0 0.0 o.o 0.0 0.0 050192 1.0 1.0 o.o 0.0 1.0
6 050592 10.0 7.0 3.0 1.5 8.5 051092 8.0 4.0 4.0 2.0 6.0
8 051392 4.0 3.0 1.0 0.5 3.5 051692 o.o 0.0 o.o o.o 0.0
10 052092 1.0 0.0 1.0 0.5 0.5 11 052392 5.0 2.0 3.0 1.5 3.5 12 052692 0.0 0.0 0.0 0.0 0.0 13 053092 2.0 1.0 1.0 0.5 1.5 14 060292 2.0 o.o 2.0 1.0 1.0 15 060592 1.0 0.0 1.0 0.5 0.5 16 061092 o.o 0.0 o.o 0.0 0.0 --------------------------------------------------------------------------------------
Su■ X 3.375 34.0 18.0 16.0 8.0 26.0 60.8 54.0 27.0 87.7
-56-
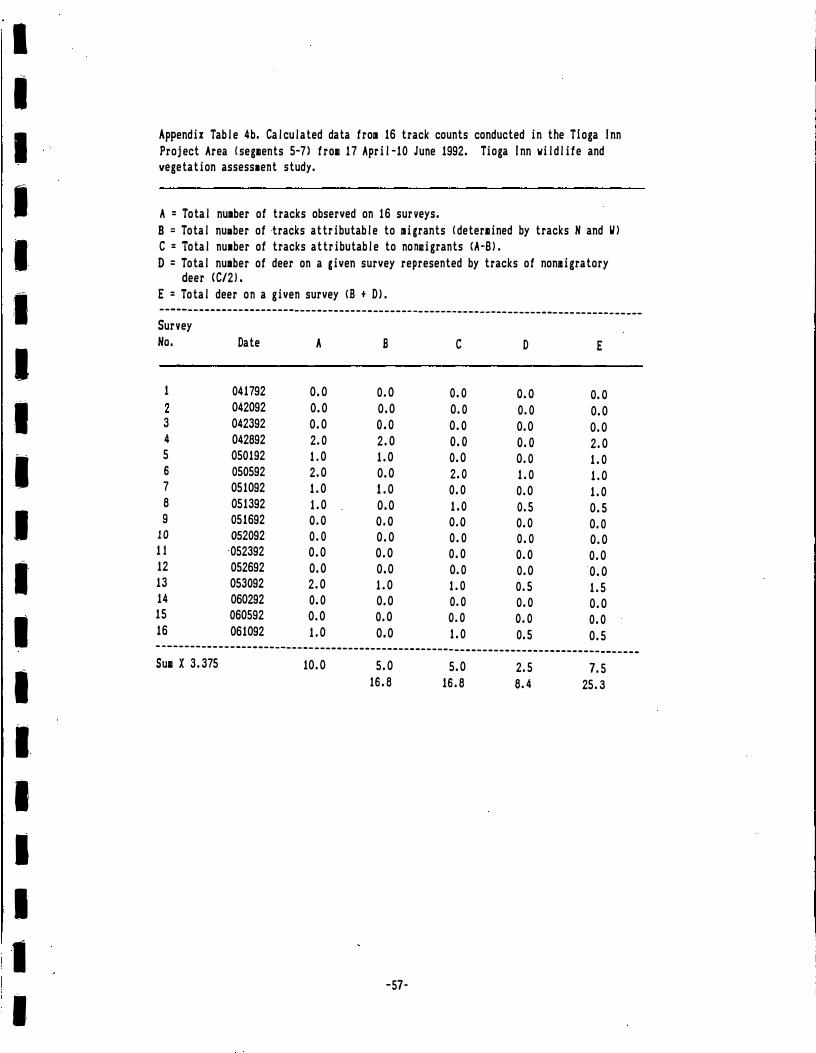
I
I
I
I
I
I
I
I
I
I
I
I
I
I
I
I
I
I
I
Appendix Table 4b, Calculated data from 16 track counts conducted in the Tioga Inn
Project Area !segments 5-7) from 17 April-10 June 1992. Tioga Inn wildlife and vegetation assessaent study.
A= Total nuaber of tracks observed on 16 surveys,
B = Total nuaber of tracks attributable to migrants !determined by tracks Hand Ill C = Total nu■ber of tracks attributable to nonmigrants IA-Bl.
D = Total nuaber of deer on a given survey represented by tracks of nonmigratory deer (C/2).
E = Total deer on a given survey 18 + DJ. --------------------------------------------------------------------------------------
Survey Ho, Date A B C D E
1 041792 0.0 0.0 0.0 o.o o.o
042092 0.0 0.0 0.0 0.0 0.0 3 042392 0.0 o.o 0.0 0.0 0.0 4 042892 2.0 2.0 o.o o.o 2.0 5 050192 1.0 1.0 0.0 0.0 1.0 6 050592 2.0 0.0 2.0 1.0 1.0 7 051092 1.0 1.0 0.0 0.0 1.0 8 051392 1.0 0.0 1.0 0.5 0.5 9 051692 o.o o.o o.o 0.0 0.0
10 052092 0.0 0.0 0.0 0.0 0.0 11 052392 0.0 0.0 0.0 0.0 0.0 12 052692 0.0 0.0 0.0 0.0 0.0 13 053092 2.0 1.0 1.0 0.5 1.5 14 060292 0.0 0.0 0.0 0.0 0.0 15 060592 0.0 0.0 0.0 0.0 0.0 16 061092 1.0 0.0 1.0 0.5 0.5 --------------------------------------------------------------------------------------
Sum X 3.375 10.0 5.0 5.0 2.5 7.5 16.8 16.8 8.4 25.3
-57-
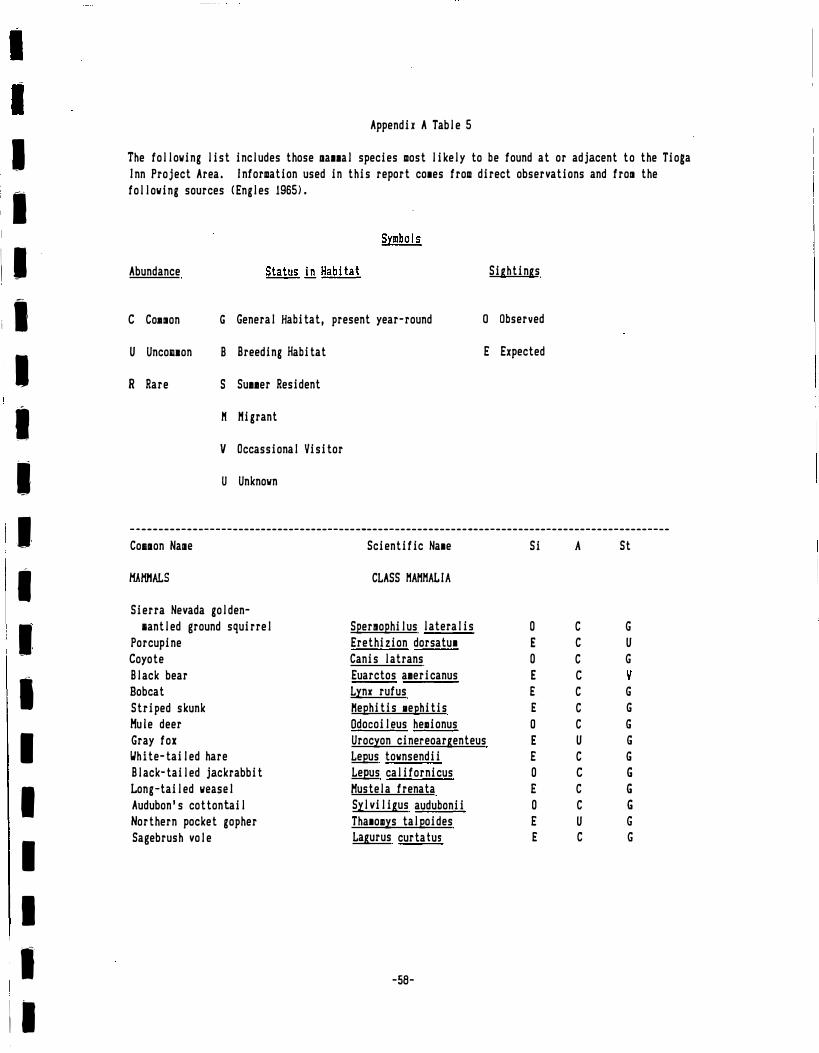
I
,I
II
i I
I
I
I
I
I
I
I
I
I
I
I
I
II
Appendix A Table 5
The following list includes those ma11al species most likely to be found at or adjacent to the Tioga Inn Project Area. Information used in this report co■es from direct observations and from the following sources <Engles 1965).
Abundance Sightings
C Coamon G General Habitat, present year-round 0 Observed
u Unco111on B Breeding Habitat E Expected
R Rare s Su■■er Resident
II Migrant
V Occassional Visitor
u Unknown
------------------------------------------------------------------------------------------------
Co111on Name
HAHHALS
Sierra Nevada golden-■antled ground squirrel
Porcupine Coyote Black bear Bobcat Striped skunk Huie deer Gray fox White-tailed hare Black-tailed jackrabbit Long-tailed weasel
Audubon's cottontail Northern pocket gopher Sagebrush vole
Scientific Na■e
CLASS HAMHALIA
Spermophilus lateralis Erethizion dorsatu■ Canis latrans Euarctos a■ericanus Lynx rufus Hephitis ■ephitis Odocoileus hemionus Urocyon cinereoargenteus Lepus tovnsendii Lepus californicus Hustela frenata Sylviligus audubonii Tha■omys talpoides Lagurus curtatus
-58-
Si A St
0 C G E C u
0 C G E C E C G
E C G
0 C G
E u G
E C G
0 C G
E C G
0 C G
E u GE C G
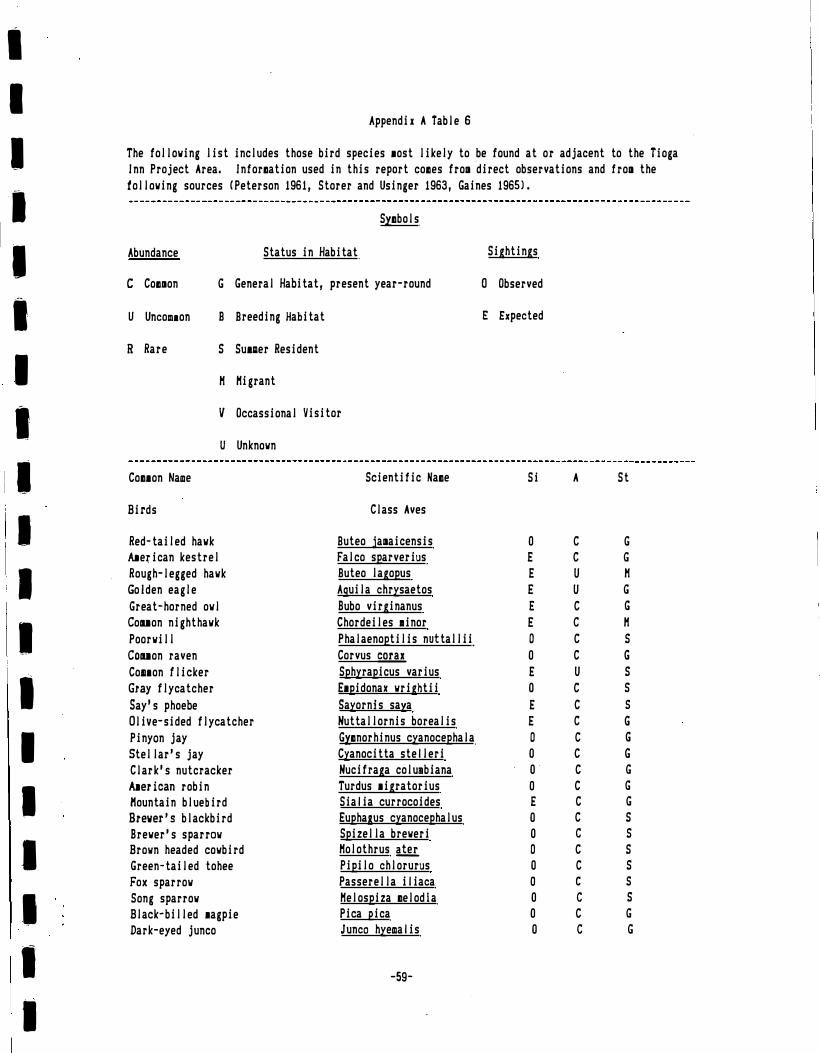
,I 1, I
I
I
I
I
I
I
I
I
I
I
I
I
I
I
I
I
I
Appendix A Table 6
The following list includes those bird species ■ost likely to be found at or adjacent to the Tioga Inn Project Area, Information used in this report comes from direct observations and from the following sources (Peterson 1961, Storer and Usinger 1963, Gaines 1965),
Symbols
Abundance Status in Habitat
C Common G General Habitat, present year-round
u Uncom■on B Breeding Habitat
R Rare s Su1111er Resident
H Hi grant
V Occassional Visitor
u
Co111on Name
Birds
Red-ta i 1 ed hawk Alerican kestrel Rough-legged hawk Go Iden eag 1 e Great-horned owl Couon nighthawk Poorwill Couon raven Co111on f 1 i cker Gray flycatcher
Unknown
Say's phoebe Olive-sided flycatcher Pinyan jay Stel lar's jay Clark's nutcracker A■erican robin Kountain bluebird Brewer's blackbird Brewer's sparrow Brown headed cowbird Green-tailed tohee Fox sparrow Song sparrow Black-billed ■agpie Dark-eyed junco
Scientific Name
Class Aves
Buteo jamaicensis Falco sparverius Buteo lagopus Aguila chrysaetos Bubo virginanus Chordeiles minor Phalaenoptilis nuttallii Corvus� Sphyrapicus varius E■pidonax wrightii Sayornis saya Nuttallornis borealis Gymnorhinus cyanocephala Cyanocitta stelleri Nucifraga columbiana Turdus ■igratorius Sialia currocoides Euphagus cyanocephalus Spizel la breweri Holothrus ill!. Pipilo chlorurus Passerel la iliaca Helospiza 11elodia Pica pica Junco hyemalis
-59-
Sightings
0 Observed
E Expected
Si
0
E
E
E E
E 0
0
E
0
E
E
0
0
0
0
E
0
0
0
0
0
0
0
0
A St
C G C G u Hu GC G
C H C s
C G
u s
C s
C s
C G
C G
C G
C G C G
C G C s
C s
C s
C s
C s
C s
C G C G
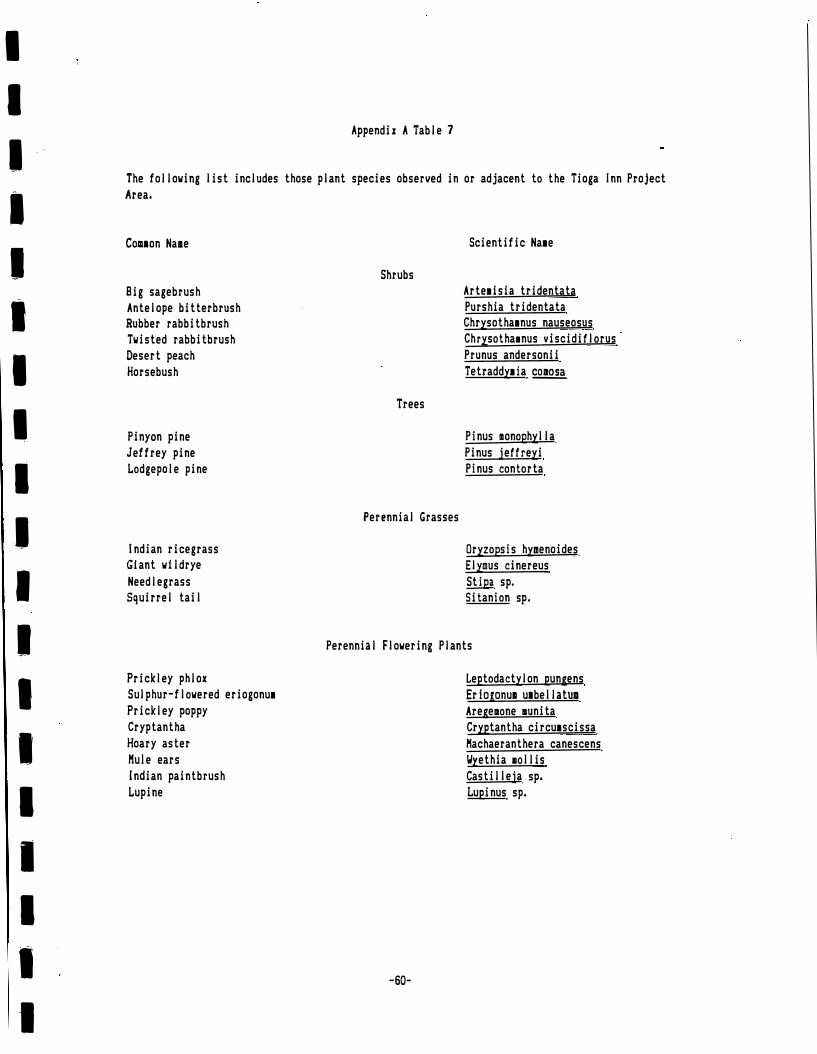
I
I
I
I
I
I
I
I
I
,,
I
I
I
I
I
I
I
I
-1
Appendix A Table 7
The following list includes those plant species observed in or adjacent to the Tioga Inn Project Area.
Comaon Name
Big sagebrush Antelope bitterbrush Rubber rabbitbrush Twisted rabbitbrush Desert peach Horsebush
Pinyan pine Jeffrey pine Lodgepole pine
Indian ricegrass Giant wildrye Needlegrass Squirrel tail
Prickley phlox Sulphur-flowered eriogonu■ Prickley poppy Cryptantha Hoary aster Huie ears Indian paintbrush Lupine
Shrubs
Trees
Perennial Grasses
Scientific Na■e
Arte■isia tridentata Purshia tridentata Chrysotha■nus nauseosus Chrysotha■nus viscidiflorus Prunus andersonii Tetraddy■ia �
Pi nus monophyl la Pinus jeffreyi Pinus contorta
Oryzopsis hymenoides Elymus cinereus Stipa sp. Sitanion sp.
Perennial Flowering Plants
-60-
Leptodactylon pungens Er!ogonu1 u1bellatum Aregemone munita Cryptantha circu■scissa Nachaeranthera canescens Wyethia 11ollis Castilleja sp. Lupi nus sp.
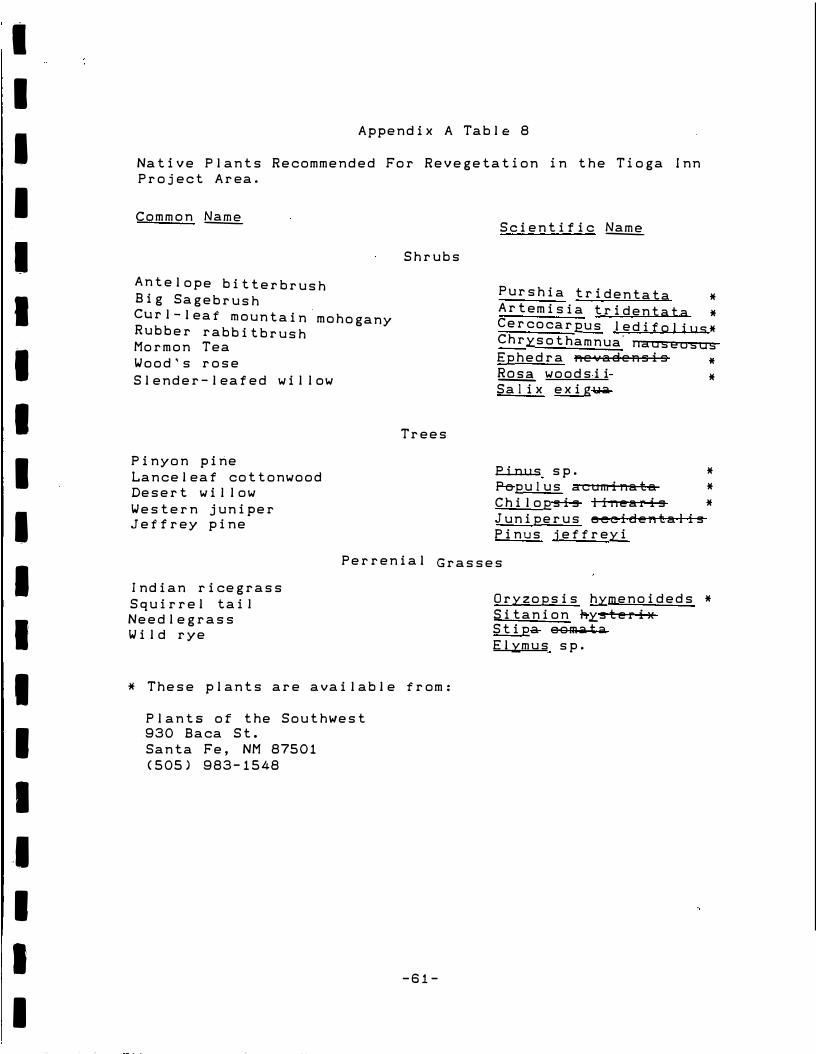
I
I
I
I
I
I
I
I
I
I
I
I
I
I
I
-1
I
I
I
Appendix A Table 8
Native Plants Recommended For Revegetation in the Tioga Inn Project Area.
Common�
Antelope bitterbrushBig Sagebrush Curl-leaf mountain mohoganyRubber rabbitbrushMormon Tea Wood's rose Slender-leafed willow
Pinyan pine Lanceleaf cottonwood Desert willow Western juniper Jeffrey pine
Shrubs
Trees
Scientific�
Purshia tridentata *Artemisia tridentata *Cercocarpus ledifolius*Chrysothamnua· nauseosusEphedra nevadensis R2g woodsii Salix exigua
*
*
Pinus sp. * Populus acuminata * Chilopsis linearis * Juniperus occidentalis Pinus jeffreyi
Perrenial Grasses
Indian ricegrass Squirrel tail Needlegrass Wild rye
* These plants are available from:
Plants of the Southwest930 Baca St.Santa Fe, NM 87501(505) 983-1548
-61-
0ryzopsis hymenoideds * Sitanion hysterix Stipa comata Elymus sp.

I
�I FISCAL I
i I IMPACT
I
I ANALYSIS
IIII :I I
I I I I
I
I
I
I I I I .:
�
I
I
I
I
I
I
I
I
I
I
I
I
I
I
'I
I
I
I
I
I
I
FINAL
ECONOMIC IMPACT
AND
FISCAL ANALYSIS
FOR
THE TIOGA INN
SPECIFIC PLAN AND EIR
PREPARED FOR:
MONO COUNTY PLANNING DEPARTMENT
DECEMBER 1992
I
I
I
I
I
I
I
I
I
I
I
I
I
I
I
I
FINAL
ECONOMIC IMPACT AND FISCAL ANALYSIS
FOR
THE TIOGA INN SPECIFIC PLAN AND EIR
Prepared for:
MONO COUNTY PLANNING DEPARTMENT
December 1992
Prepared by:
CERTIFIED/Earth Metrics 7000 Marina Boulevard, 4th Floor
Brisbane, CA 94005 (415) 742-9900
Sl2046B

I
I
I
I
I
I
I
I
I
I
I
I
I
I
I
I
I
I
I
TABLE OF CONTENTS
Section
1 • INTRODUCTION .•.....•••..•.•.•...........•...•....•.......
2.
3.
4.
5.
6.
7.
Purpose of Economic and Fiscal Analysis .•.•...•.........•. Study Approach ••..••..••..••.......•..••....•.•......•... Summary .••.••••..•.•.••••••..•••..•••••..•.•.••..•••.••.•
MARKET ANALYSIS •......•..........•..•..........••........
Local Setting •••••••••.•••.••.•••.•••••••.....••••.•...••. Market Area ••••••••••••••••••••••••.•••••••.••.••••••••..• Lodging Demand ••••••••.•••••••••••••••••••••••••••••••••••
Lodging Supply and Competition ••.•..•..•......•..••.••. Shift Share Analysis •••••••••••••••••.••.•••••...•..•.• Lodging Demand Conclusions .•••••••••••••.••••••••••••••
Restaurant Demand •.........•....•.•..••..•...•.•..•....•.. Restaurant Supply and Competition •••••••••••••••••••••• Shift Share Analysis •........•.•..•.••....•.•..•.•.•••• Restaurant Demand Conclusions .......•..•....•.•........
Service Station/Mini-Mart Demand ••••.••••.•••....•.•.•.•.. Service Station/Mini-Mart Supply and Competition •....•. Shift Share Analysis .•..•.....•.•.•.••........••..•.••• Service Station/Mini-Mart Demand Conclusions .•.•.••.•.•
FISCAL IMPACT ANALYSIS ..••••...•.••.••..•.••••••.•••••..•
Employment ••••..••••.••••••..••.••.•.•••••.•••••••••••••• Revenue Generation •.•••.........•.•..•...........•..•....
Property Tax ••.....••.•.•....•..••.•..•.•••..••..•.•.• Transient Occupancy Tax .......•.••.••.•.•.•..•.•....•• Sales Tax ..••.•.........•..•......••....••.•..•.•...•. Business License Fees ...........•.••.••.•••.•.•...•.•• Pool and Food Permit Fees ••...•...••.•.•••••..•••.•.•• Construction Permit Fees .•.••••••••.••.•.•.•.••.••••••. Well and Septic Permit Fees •••••••••.••••••.•.•••..•.•• School Impact Fees ......•..•..•.••••••••..•••.•••••.•. Fire Impact Fees .••..•.•••.•..••••.•.•••.••••...••••.•
Tax and Fee Summary ••••••••••...••••••••••••••••.•.•.••••
PUBLIC SERVICE COSTS •••••••••••.•••••.•••••.•••••.•••••••
Fire Department ••••••.•.•..•.••..•.•..•••••.••.•••••.•••• County Sheriff .•••••••••.•..••..•.•.•••..•.•.•.••.......• Schools •••••••••••••••.•••••••••.••••••••••.••••.•.•.•..• Other County Services ••••.••.•••.••••.•••••.••••••••.•.•• Cost Summary ••.••••••.••.•..•••.•....••••••••.••••••••.••
SHORT TERM BENEFITS VERSUS LONG TERM PRODUCTIVITY •.•....•
Short-Term Benefits ••••••••••.••••••••••••••••••••••••••• Long-Term Benefits •.•••••••••.••••..•....•.•.•.••••.•••••
SOCIOECONOMIC IMPACTS .•.•••.•.•.••..•••.•••.•.••••••••••.
ALTERNATIVE PROJECT PHASING •..•••••••••••••••••••••••••••
i
Page
1
1
2
2
9 10
10
14
15
15
16
16
17
17
17
17
19
19
19
20 21
22
25
25
25
25
25
25
26
27
27
27
27
28
28
29
29 29
30
31
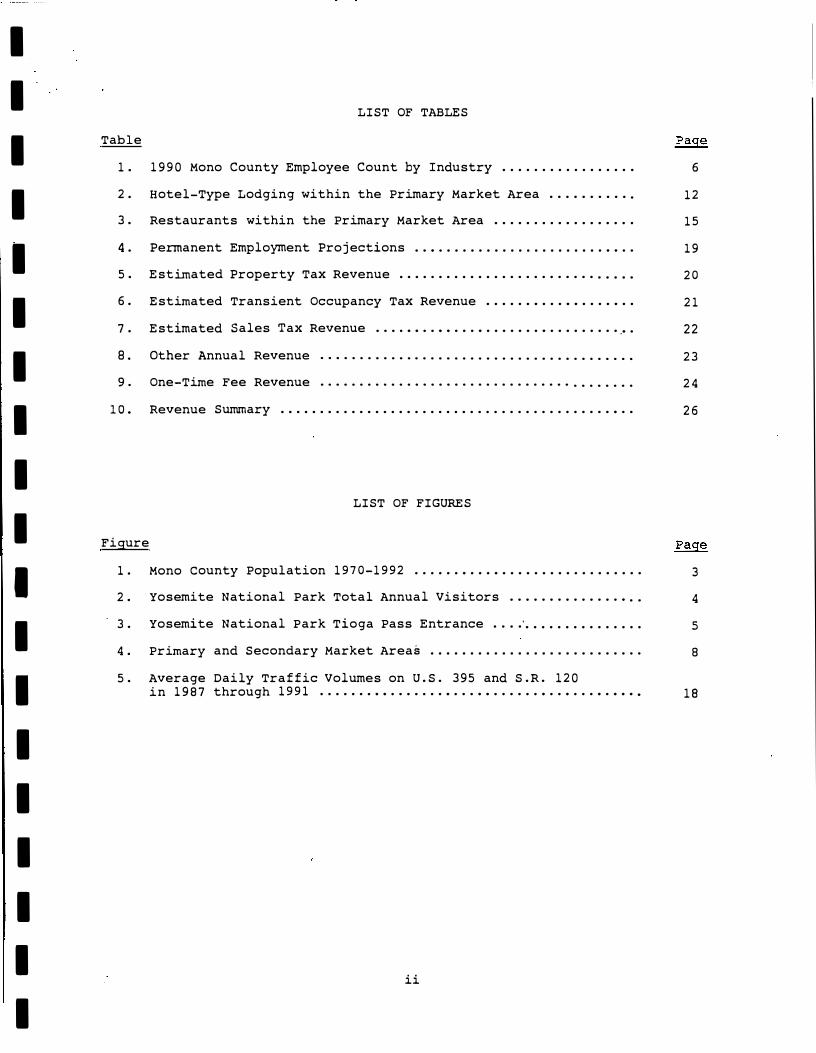
I
I
I
I
I
I
I
I
I
I
I
I
I
I
I
I
I
I
I
LIST OF TABLES
Table
1. 1990 Mono County Employee Count by Industry ................ .
2. Hotel-Type Lodging within the Primary Market Area .......... .
3. Restaurants within the Primary Market Area ................. .
4. Permanent Employment Projections ..•.....................••..
5. Estimated Property Tax Revenue ............................. .
6. Estimated Transient Occupancy Tax Revenue ......•...••....•..
7. Estimated Sales Tax Revenue ....••..••...•.......•.......... • .
8.
9.
Other Annual Revenue
One-Time Fee Revenue
. . . . . . . . . . . . . . . . . . . . . . . . . . . . . . . . . . . . . . . .
. . . . . . . . . . . . . . . . . . . . . . . . . . . . . . . . . . . . . . . .
l O • Revenue Summary ..........................................•..
LIST OF FIGURES
Figure
1. Mono County Population 1970-1992 ......•...•..................
2. Yosemite National Park Total Annual Visitors ..............•..
3. Yosemite National Park Tioga Pass Entrance .... · .............. .
4. Primary and Secondary Market Areas .......................... .
5. Average Daily Traffic Volumes on U.S. 395 and S.R. 120in 1987 through 1991 .......••.......•...••......•..•...•.••••
ii
6
12
15
19
20
21
22
23
24
26
3
4
5
8
18
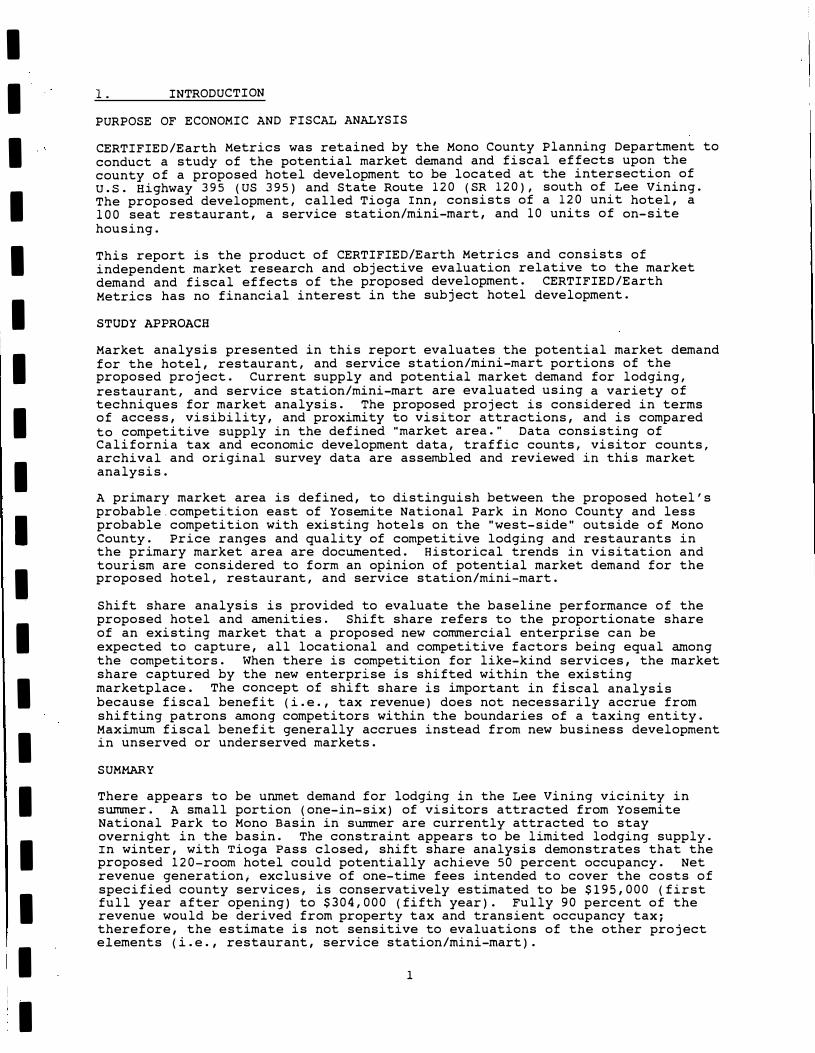
I
I
I
I
I
I
I
I
I
I
I
I
I
I
I
I
I
I
I
l. INTRODUCTION
PURPOSE OF ECONOMIC AND FISCAL ANALYSIS
CERTIFIED/Earth Metrics was retained by the Mono County Planning Department to conduct a study of the potential market demand and fiscal effects upon the county of a proposed hotel development to be located at the intersection of u.s. Highway 395 (US 395) and State Route 120 (SR 120), south of Lee Vining.The proposed development, called Tioga Inn, consists of a 120 unit hotel, a100 seat restaurant, a service station/mini-mart, and 10 units of on-sitehousing.
This report is the product of CERTIFIED/Earth Metrics and consists of independent market research and objective evaluation relative to the market demand and fiscal effects of the proposed development. CERTIFIED/Earth Metrics has no financial interest in the subject hotel development.
STUDY APPROACH
Market analysis presented in this report evaluates the potential market demand for the hotel, restaurant, and service station/mini-mart portions of the proposed project. Current supply and potential market demand for lodging, restaurant, and service station/mini-mart are evaluated using a variety of techniques for market analysis. The proposed project is considered in terms of access, visibility, and proximity to visitor attractions, and is compared to competitive supply in the defined "market area." Data consisting of California tax and economic development data, traffic counts, visitor counts, archival and original survey data are assembled and reviewed in this market analysis.
A primary market area is defined, to distinguish between the proposed hotel's probable.competition east of Yosemite National Park in Mono County and less probable competition with existing hotels on the "west-side" outside of Mono County. Price ranges and quality of competitive lodging and restaurants in the primary market area are documented. Historical trends in visitation and tourism are considered to form an opinion of potential market demand for the proposed hotel, restaurant, and service station/mini-mart.
Shift share analysis is provided to evaluate the baseline performance of the proposed hotel and amenities. Shift share refers to the proportionate share of an existing market that a proposed new commercial enterprise can be expected to capture, all locational and competitive factors being equal among the competitors. When there is competition for like-kind services, the market share captured by the new enterprise is shifted within the existing marketplace. The concept of shift share is important in fiscal analysis because fiscal benefit (i.e., tax revenue) does not necessarily accrue from shifting patrons among competitors within the boundaries of a taxing entity. Maximum fiscal benefit generally accrues instead from new business development in unserved or underserved markets.
SUMMARY
There appears to be unmet demand for lodging in the Lee Vining vicinity in summer. A small portion (one-in-six) of visitors attracted from Yosemite National Park to Mono Basin in surraner are currently attracted to stay overnight in the basin. The constraint appears to be limited lodging supply. In winter, with Tioga Pass closed, shift share analysis demonstrates that the proposed 120-room hotel could potentially achieve 50 percent occupancy. Net revenue generation; exclusive of one-time fees intended to cover the costs of specified county services, is conservatively estimated to be $195,000 (first full year after opening) to $304,000 (fifth year). Fully 90 percent of the revenue would be derived from property tax and transient occupancy tax; therefore, the estimate is not sensitive to evaluations of the other project elements (i.e., restaurant, service station/mini-mart).
1
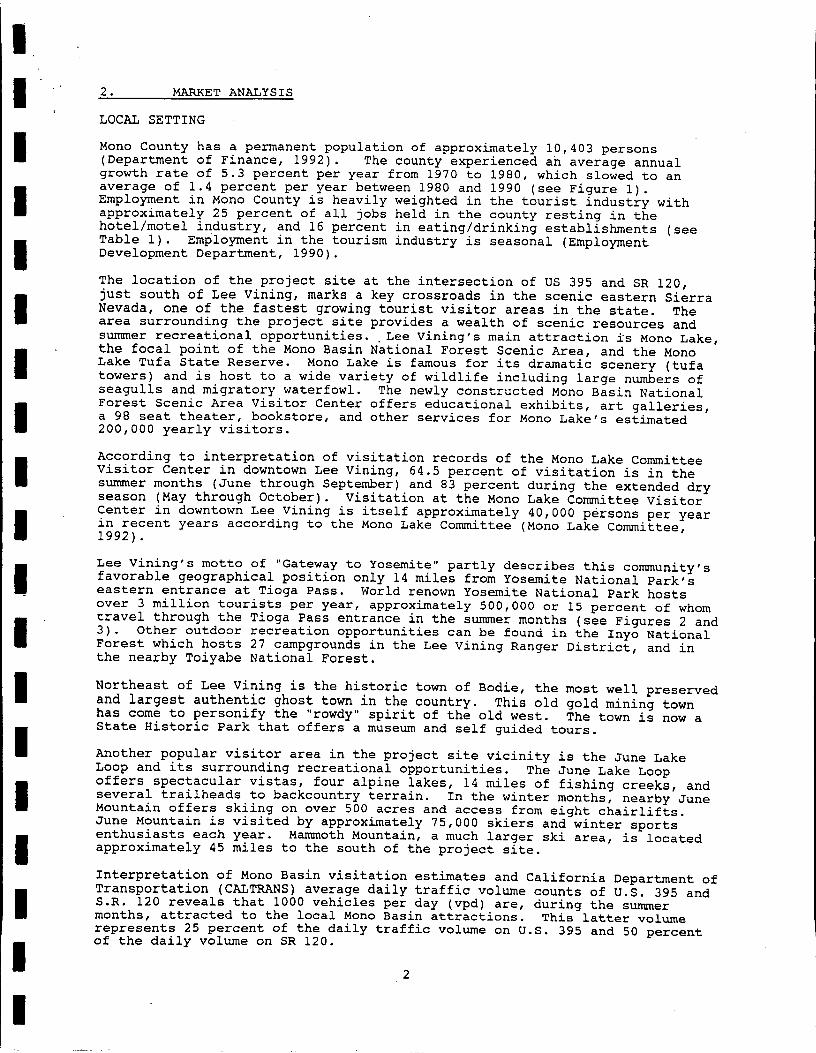
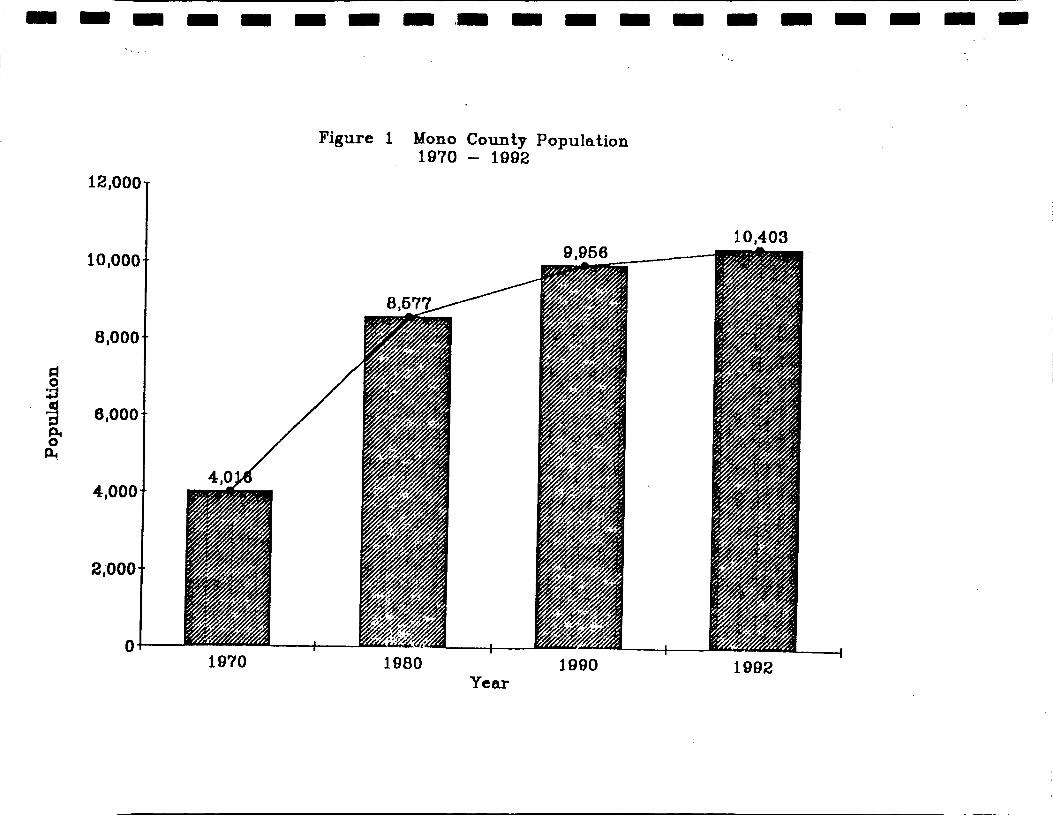
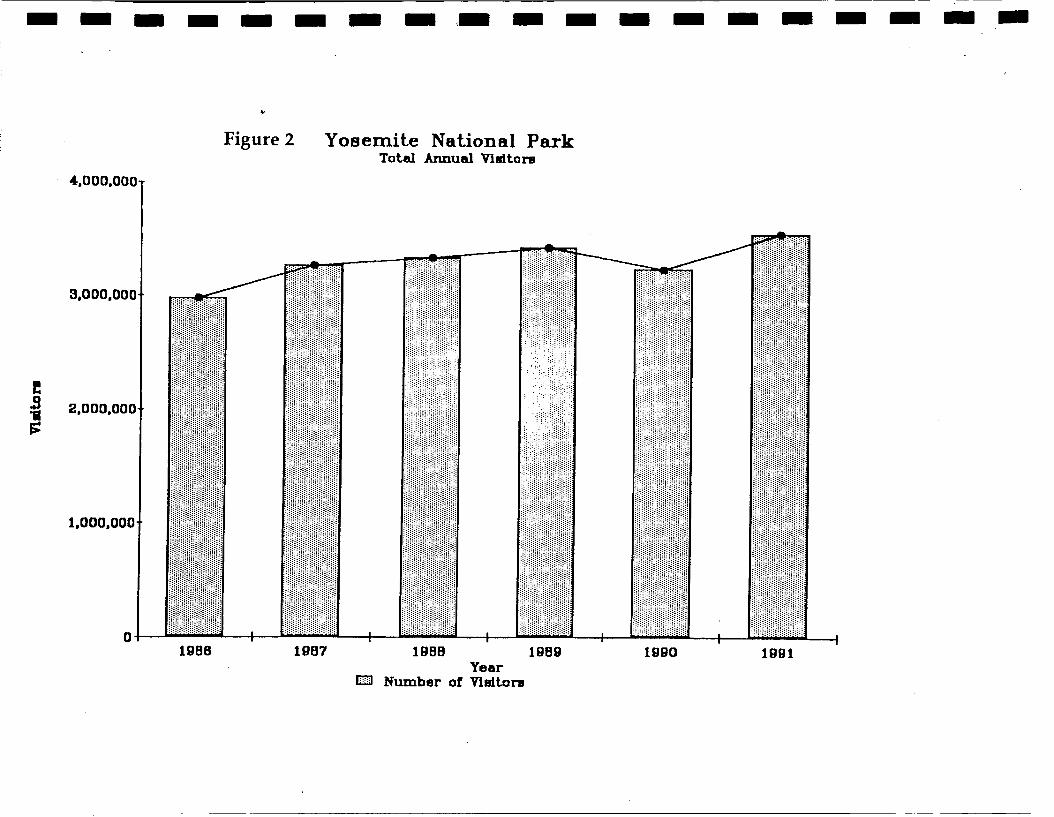

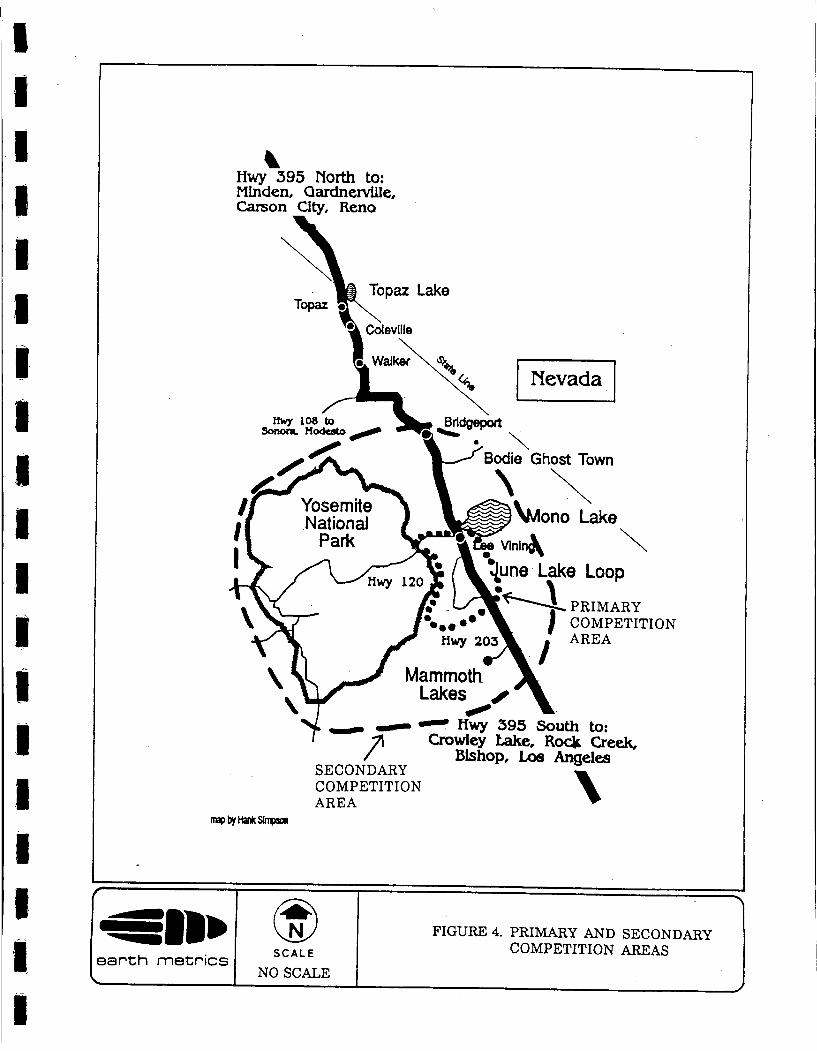


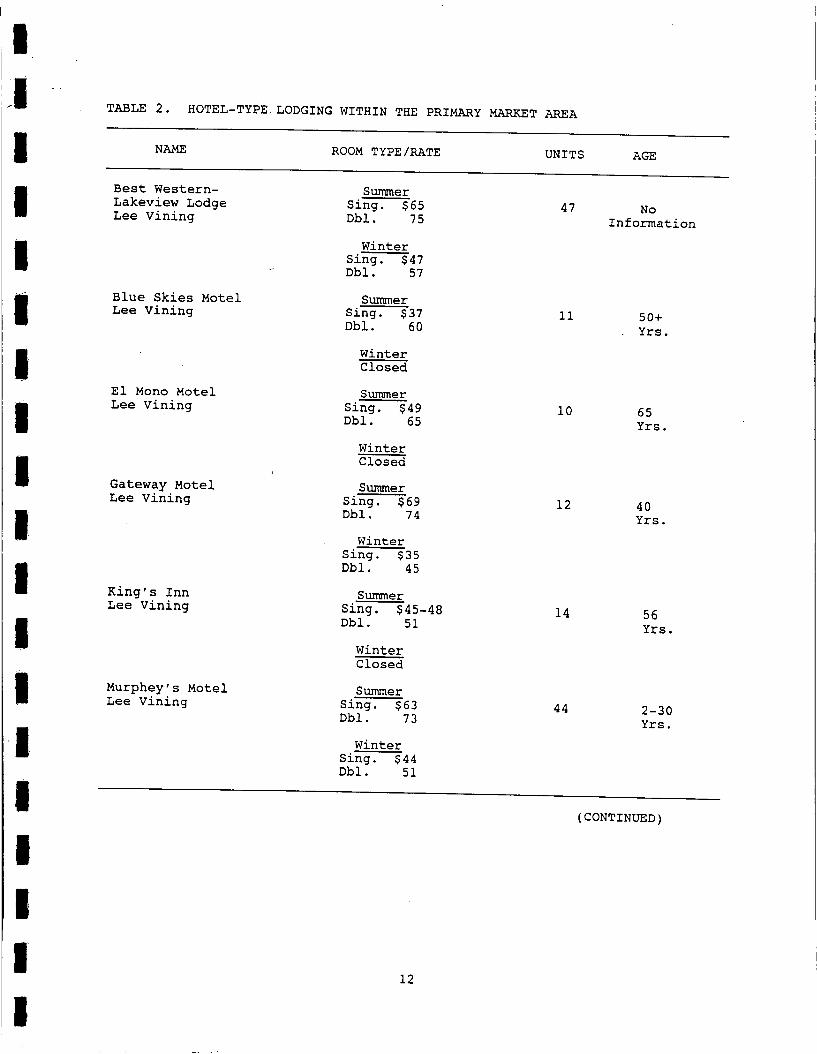


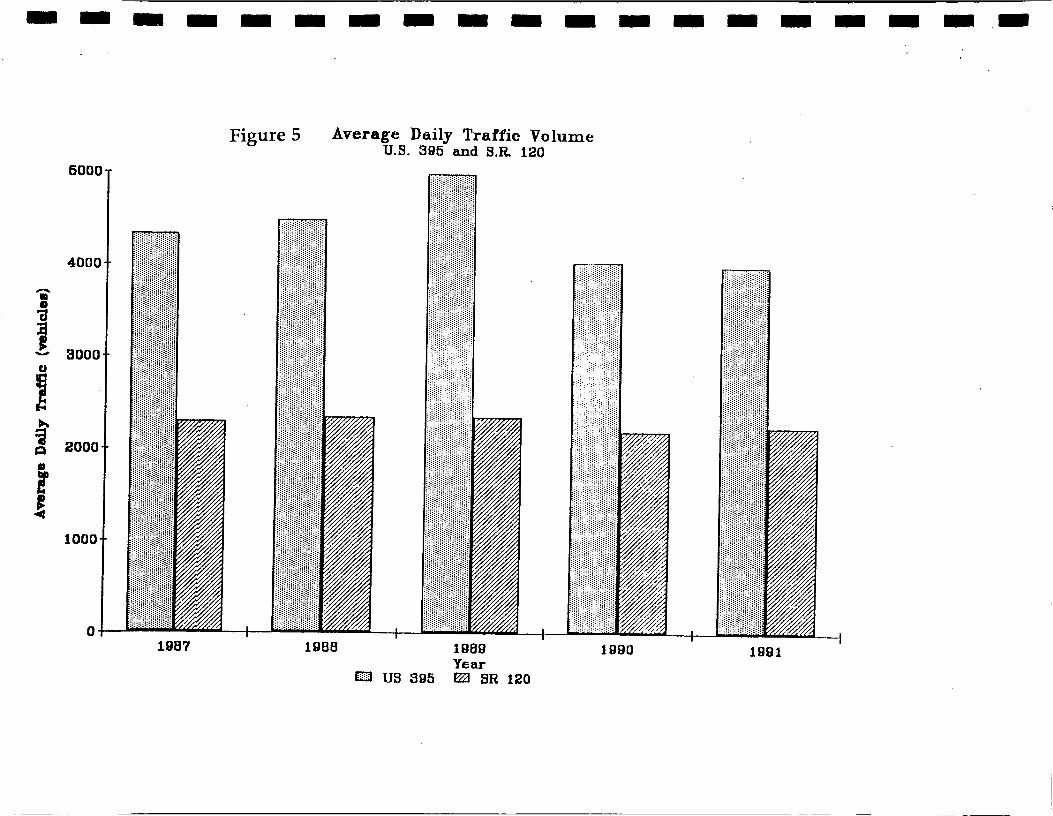
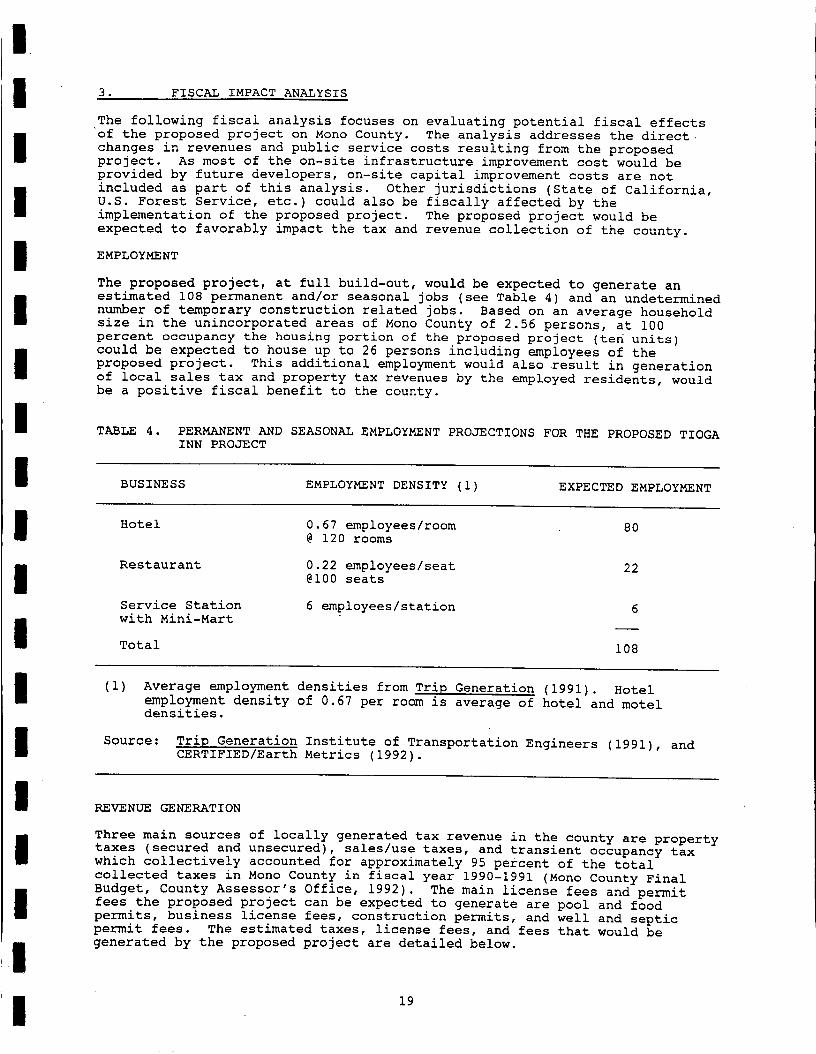
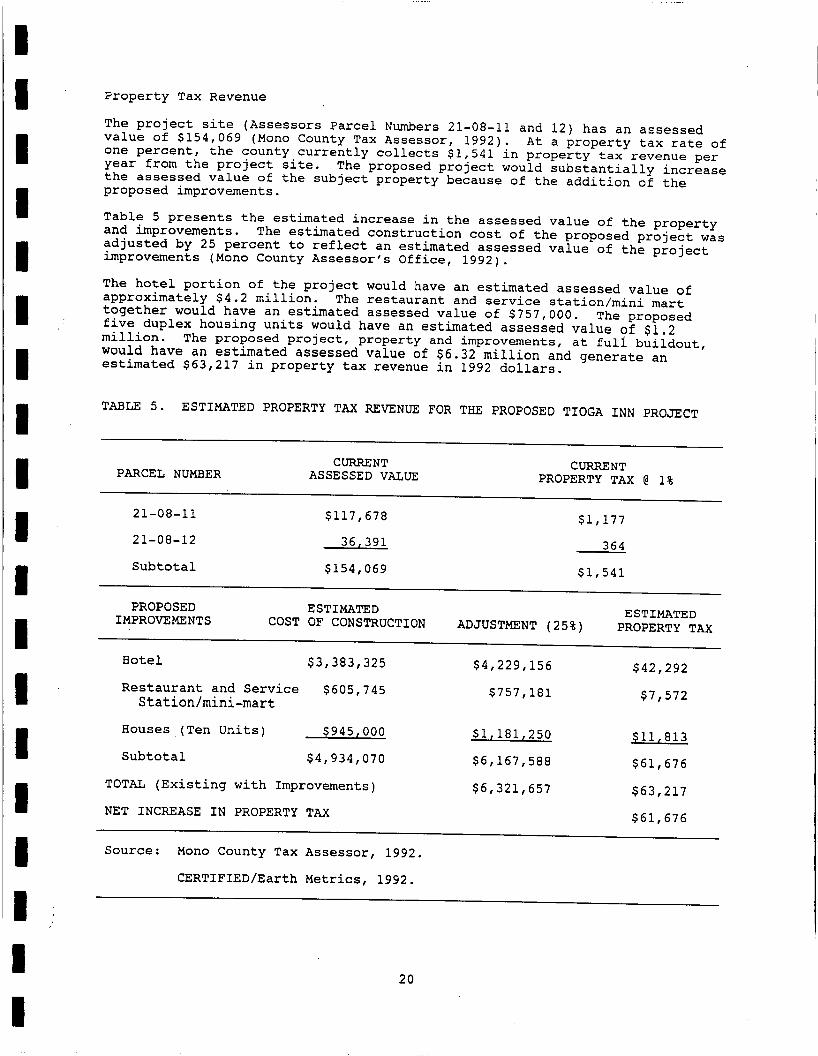

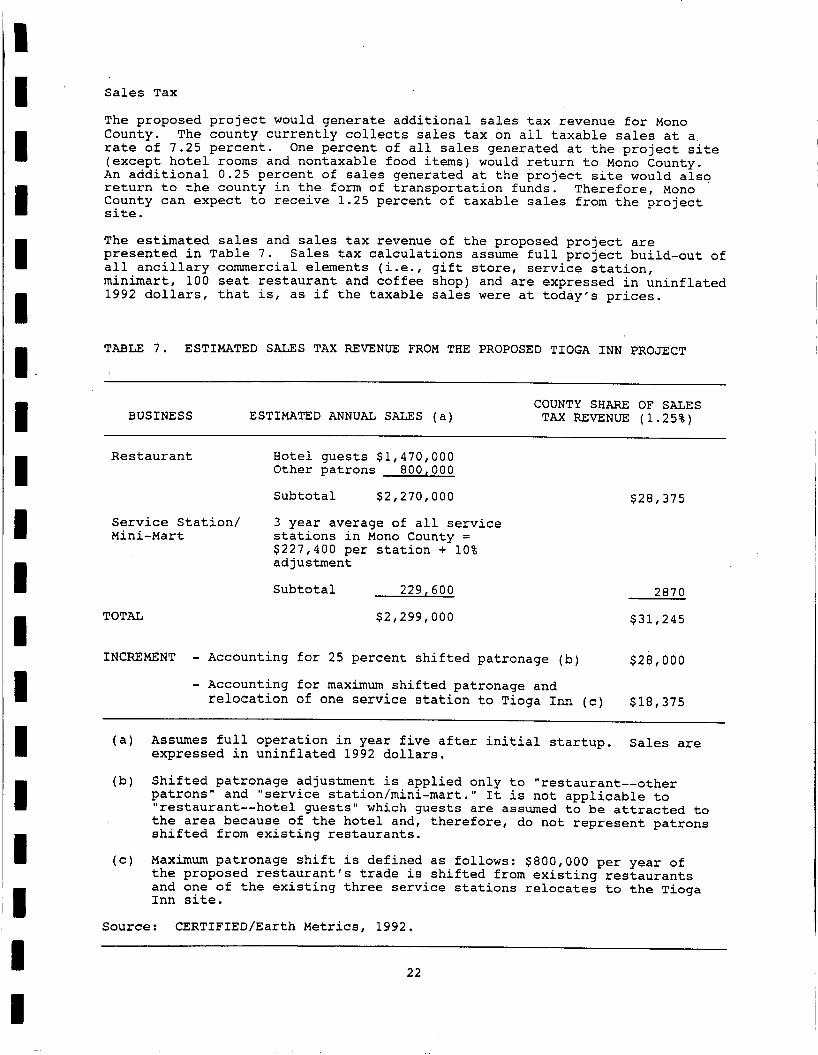
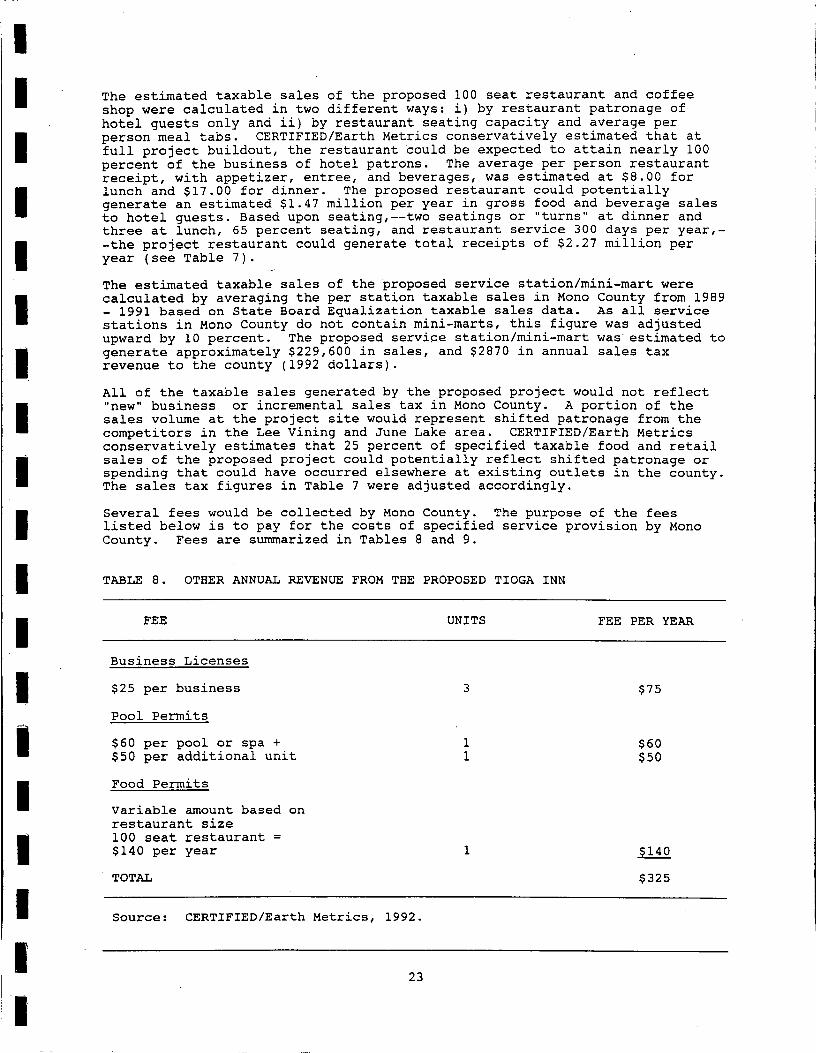


APPENDIX E1
2017 SGSI Well Test Technical Memorandum
ENVIRONMENTAL • GEOTECHNICAL • GEOLOGY • HYDROGEOLOGY • MATERIALS • MINING
BISHOP OFFICE: 873 NORTH MAIN ST., SUITE 150, BISHOP, CA 93514 • Phn: (760) 937-4789 Fax: (760) 873-8024 MAMMOTH OFFICE: PO Box 5024, MAMMOTH LAKES, CA 93546 • Phn: (760) 937-4608 Fax: (760) 934-5619 Web: www.sgsi.us Email: [email protected]
July 18, 2017 SGS Job No: 3.31393 Dennis Domaille Tioga Gas Mart 22 Vista Point Drive Lee Vining, CA 93541 Subject: TECHNICAL MEMORANDUM
Pumping Test Results Tioga Gas Mart Water-Supply Well Lee Vining, California 93541
Reference: Kleinfelder, 1992, “Modified Phase I Groundwater Resources Assessment and Review of a Fault Investigation Report for the Tioga Inn Specific Plan, Lee Vining, California, August 21.
Mr. Domaille:
Pursuant to your request, Sierra Geotechnical Services, Inc. (SGS) is pleased to present this
Memorandum regarding our pumping test of your existing domestic water well located at the Tioga
Gas Mart, Lee Vining, California.
Introduction Provided herein is a summary of the findings and results of a recent pumping test conducted by
Sierra Geotechnical Services, Inc (SGS) in an existing domestic water well at the Tioga Gas Mart
(TGM), which is located approximately 2,340 ft southeast of the intersection of Highway 120 and
Highway 395 near the town of Lee Vining in Mono County, California. Figure 1, “Well Location
Map,” illustrates the location of the subject well. In addition, and at the request of Mono County
Planning Department representatives, water levels in a nearby observation well were also
monitored during the pumping test of the subject water well; the location of this offsite well is also
shown on Figure 1. This offsite water well, the Winston Well, which is at the site of a former Union
76 fueling station, has reportedly never been placed into service; the SGS geologist observed
conditions that indicate this offsite well has not been used for many years.
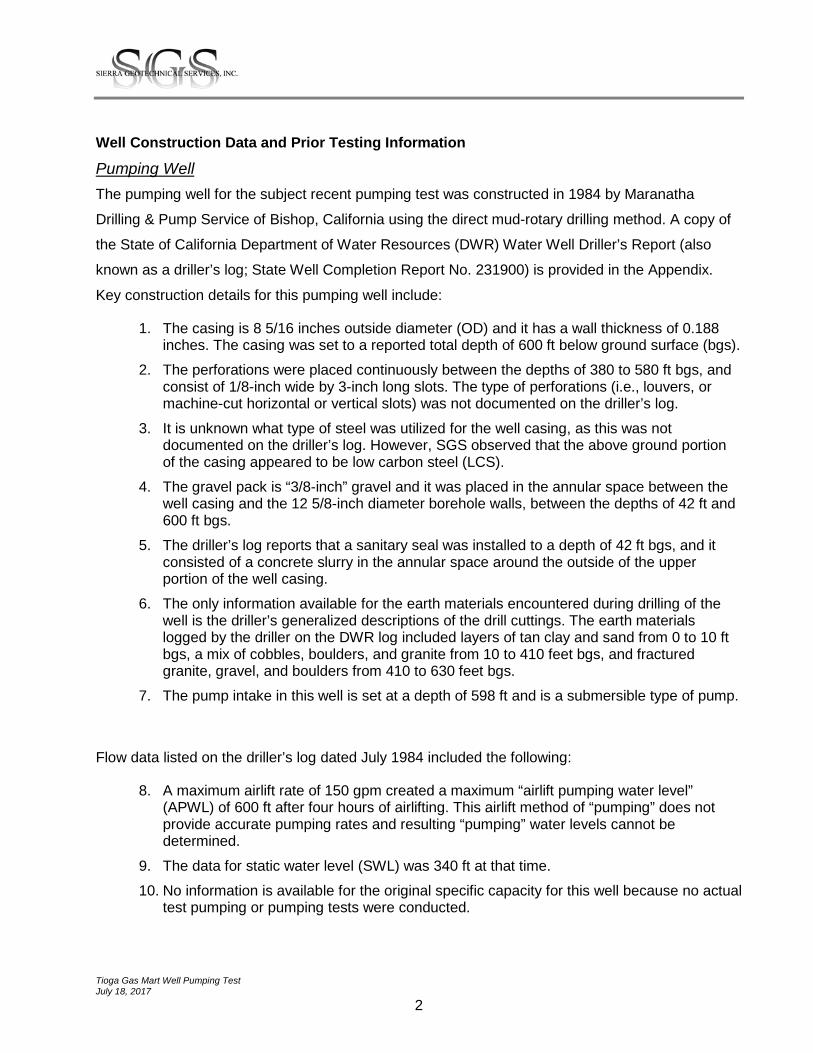
Tioga Gas Mart Well Pumping Test July 18, 2017
2
Well Construction Data and Prior Testing Information
Pumping Well The pumping well for the subject recent pumping test was constructed in 1984 by Maranatha
Drilling & Pump Service of Bishop, California using the direct mud-rotary drilling method. A copy of
the State of California Department of Water Resources (DWR) Water Well Driller’s Report (also
known as a driller’s log; State Well Completion Report No. 231900) is provided in the Appendix.
Key construction details for this pumping well include:
1. The casing is 8 5/16 inches outside diameter (OD) and it has a wall thickness of 0.188 inches. The casing was set to a reported total depth of 600 ft below ground surface (bgs).
2. The perforations were placed continuously between the depths of 380 to 580 ft bgs, and consist of 1/8-inch wide by 3-inch long slots. The type of perforations (i.e., louvers, or machine-cut horizontal or vertical slots) was not documented on the driller’s log.
3. It is unknown what type of steel was utilized for the well casing, as this was not documented on the driller’s log. However, SGS observed that the above ground portion of the casing appeared to be low carbon steel (LCS).
4. The gravel pack is “3/8-inch” gravel and it was placed in the annular space between the well casing and the 12 5/8-inch diameter borehole walls, between the depths of 42 ft and 600 ft bgs.
5. The driller’s log reports that a sanitary seal was installed to a depth of 42 ft bgs, and it consisted of a concrete slurry in the annular space around the outside of the upper portion of the well casing.
6. The only information available for the earth materials encountered during drilling of the well is the driller’s generalized descriptions of the drill cuttings. The earth materials logged by the driller on the DWR log included layers of tan clay and sand from 0 to 10 ft bgs, a mix of cobbles, boulders, and granite from 10 to 410 feet bgs, and fractured granite, gravel, and boulders from 410 to 630 feet bgs.
7. The pump intake in this well is set at a depth of 598 ft and is a submersible type of pump.
Flow data listed on the driller’s log dated July 1984 included the following:
8. A maximum airlift rate of 150 gpm created a maximum “airlift pumping water level” (APWL) of 600 ft after four hours of airlifting. This airlift method of “pumping” does not provide accurate pumping rates and resulting “pumping” water levels cannot be determined.
9. The data for static water level (SWL) was 340 ft at that time. 10. No information is available for the original specific capacity for this well because no actual
test pumping or pumping tests were conducted.
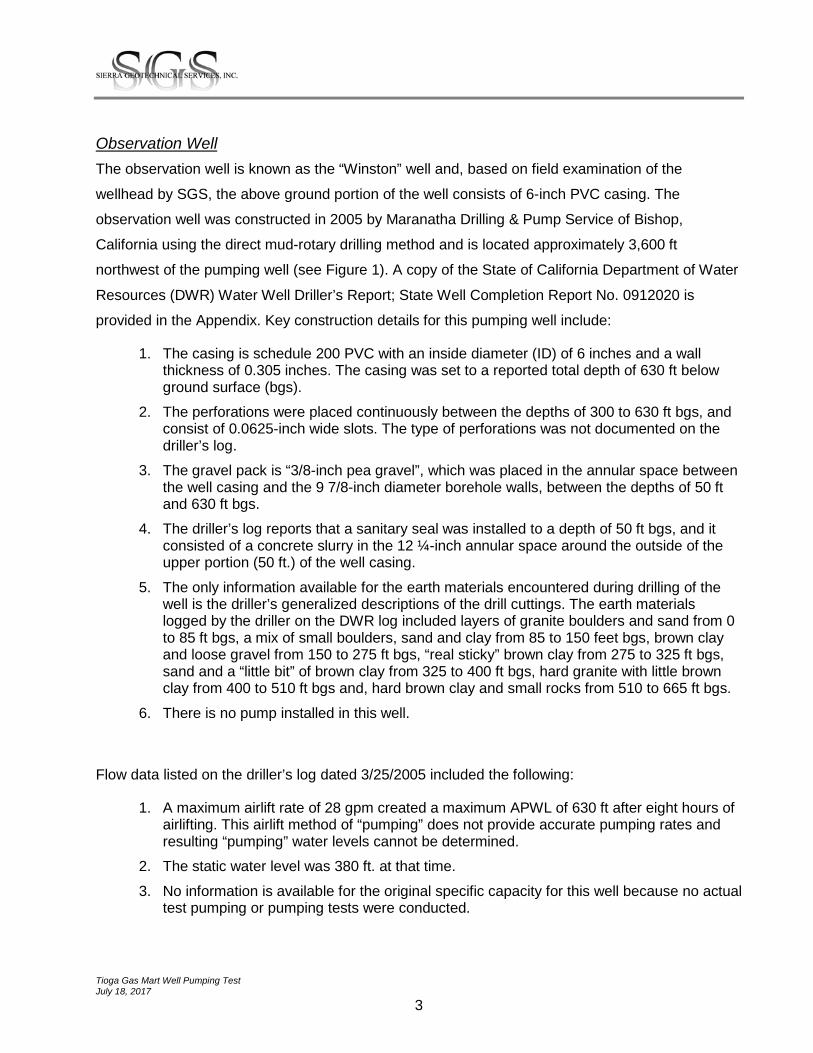
Tioga Gas Mart Well Pumping Test July 18, 2017
3
Observation Well The observation well is known as the “Winston” well and, based on field examination of the
wellhead by SGS, the above ground portion of the well consists of 6-inch PVC casing. The
observation well was constructed in 2005 by Maranatha Drilling & Pump Service of Bishop,
California using the direct mud-rotary drilling method and is located approximately 3,600 ft
northwest of the pumping well (see Figure 1). A copy of the State of California Department of Water
Resources (DWR) Water Well Driller’s Report; State Well Completion Report No. 0912020 is
provided in the Appendix. Key construction details for this pumping well include:
1. The casing is schedule 200 PVC with an inside diameter (ID) of 6 inches and a wall thickness of 0.305 inches. The casing was set to a reported total depth of 630 ft below ground surface (bgs).
2. The perforations were placed continuously between the depths of 300 to 630 ft bgs, and consist of 0.0625-inch wide slots. The type of perforations was not documented on the driller’s log.
3. The gravel pack is “3/8-inch pea gravel”, which was placed in the annular space between the well casing and the 9 7/8-inch diameter borehole walls, between the depths of 50 ft and 630 ft bgs.
4. The driller’s log reports that a sanitary seal was installed to a depth of 50 ft bgs, and it consisted of a concrete slurry in the 12 ¼-inch annular space around the outside of the upper portion (50 ft.) of the well casing.
5. The only information available for the earth materials encountered during drilling of the well is the driller’s generalized descriptions of the drill cuttings. The earth materials logged by the driller on the DWR log included layers of granite boulders and sand from 0 to 85 ft bgs, a mix of small boulders, sand and clay from 85 to 150 feet bgs, brown clay and loose gravel from 150 to 275 ft bgs, “real sticky” brown clay from 275 to 325 ft bgs, sand and a “little bit” of brown clay from 325 to 400 ft bgs, hard granite with little brown clay from 400 to 510 ft bgs and, hard brown clay and small rocks from 510 to 665 ft bgs.
6. There is no pump installed in this well.
Flow data listed on the driller’s log dated 3/25/2005 included the following:
1. A maximum airlift rate of 28 gpm created a maximum APWL of 630 ft after eight hours of airlifting. This airlift method of “pumping” does not provide accurate pumping rates and resulting “pumping” water levels cannot be determined.
2. The static water level was 380 ft. at that time. 3. No information is available for the original specific capacity for this well because no actual
test pumping or pumping tests were conducted.
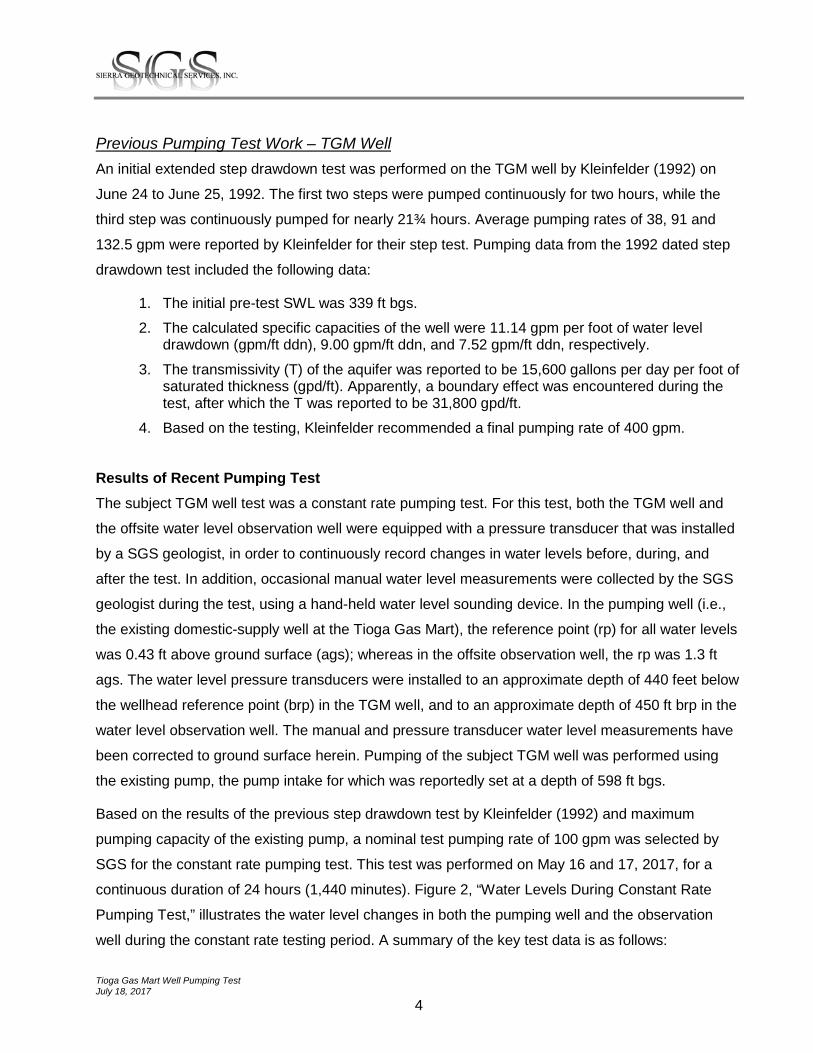
Tioga Gas Mart Well Pumping Test July 18, 2017
4
Previous Pumping Test Work – TGM Well An initial extended step drawdown test was performed on the TGM well by Kleinfelder (1992) on
June 24 to June 25, 1992. The first two steps were pumped continuously for two hours, while the
third step was continuously pumped for nearly 21¾ hours. Average pumping rates of 38, 91 and
132.5 gpm were reported by Kleinfelder for their step test. Pumping data from the 1992 dated step
drawdown test included the following data:
1. The initial pre-test SWL was 339 ft bgs. 2. The calculated specific capacities of the well were 11.14 gpm per foot of water level
drawdown (gpm/ft ddn), 9.00 gpm/ft ddn, and 7.52 gpm/ft ddn, respectively. 3. The transmissivity (T) of the aquifer was reported to be 15,600 gallons per day per foot of
saturated thickness (gpd/ft). Apparently, a boundary effect was encountered during the test, after which the T was reported to be 31,800 gpd/ft.
4. Based on the testing, Kleinfelder recommended a final pumping rate of 400 gpm.
Results of Recent Pumping Test The subject TGM well test was a constant rate pumping test. For this test, both the TGM well and
the offsite water level observation well were equipped with a pressure transducer that was installed
by a SGS geologist, in order to continuously record changes in water levels before, during, and
after the test. In addition, occasional manual water level measurements were collected by the SGS
geologist during the test, using a hand-held water level sounding device. In the pumping well (i.e.,
the existing domestic-supply well at the Tioga Gas Mart), the reference point (rp) for all water levels
was 0.43 ft above ground surface (ags); whereas in the offsite observation well, the rp was 1.3 ft
ags. The water level pressure transducers were installed to an approximate depth of 440 feet below
the wellhead reference point (brp) in the TGM well, and to an approximate depth of 450 ft brp in the
water level observation well. The manual and pressure transducer water level measurements have
been corrected to ground surface herein. Pumping of the subject TGM well was performed using
the existing pump, the pump intake for which was reportedly set at a depth of 598 ft bgs.
Based on the results of the previous step drawdown test by Kleinfelder (1992) and maximum
pumping capacity of the existing pump, a nominal test pumping rate of 100 gpm was selected by
SGS for the constant rate pumping test. This test was performed on May 16 and 17, 2017, for a
continuous duration of 24 hours (1,440 minutes). Figure 2, “Water Levels During Constant Rate
Pumping Test,” illustrates the water level changes in both the pumping well and the observation
well during the constant rate testing period. A summary of the key test data is as follows:
Tioga Gas Mart Well Pumping Test July 18, 2017
5
1. A pre-test SWL of 351.5 ft brp was measured in the TGM well by SGS prior to the startup of the test.
2. After 24 hours (1,440 minutes) of continuous pumping at an average rate of 102 gpm, a maximum PWL depth of 388.9 ft brp was recorded in the TGM well; this resulted in a maximum water level drawdown of 37.4 ft.
3. The current specific capacity of the well for this 24-hour constant rate test is calculated to be 2.73 gpm/ft ddn. This is significantly lower than the specific capacities calculated during the 3-point step drawdown test in this well by Kleinfelder in 1992 (11.14 gpm/ft ddn, 9.00 gpm/ft ddn, and 7.52 gpm/ft ddn), respectively.
4. The transducer installed in the observation well recorded no changes in water levels, i.e., no drawdown impacts were monitored/recorded by the pressure transducer in the offsite “Winston” well (see Figure 2). SWL was 349.5 ft brp.
No adverse field observations concerning water clarity, entrained air, and/or sand content were
noted in the TGM well by the SGS geologist during the constant rate test (i.e. pumped water was
clear and no entrained air or sand was observed during the pump test). The owner states that no
sand has been found in his water storage tanks from the pumping of this well. This was not
investigated by the SGS geologist.
A final water level recovery measurement was recorded by SGS on May 18, 2017, approximately
25 hours following the cessation of the pumping portion of this test. This final water level
measurement in the TGM well was reported to be 352.2 ft brp; this water level is 0.2 ft deeper than
the pre-test SWL.
Summary and Conclusions The TGM well is cased to a depth of 600 ft with a nominal 8-inch diameter steel casing. Perforations
were reportedly installed from depths of 380 to 580 ft bgs; a 20-foot section of blank cellar casing
lies below the perforated casing. A 42-foot deep cement sanitary seal was reportedly emplaced for
the existing well.
A constant rate pumping test was performed to determine the amount of water level drawdown that
would be induced in the TGM well, which was pumped at an average rate of 102 gpm for a
continuous pumping period of 1,440 minutes. Pumping at this rate yielded a PWL of 388.9 ft brp.
Based on a pre-test SWL of 351.5 ft bgs, a maximum drawdown of 37.4 ft was created in the TGM
well.
The current and long-term specific capacity of the TGM well for this 24-hour constant rate test is

Tioga Gas Mart Well Pumping Test July 18, 2017
6
calculated to be 2.73 gpm/ft ddn. This current value is significantly lower than the specific capacities
calculated during the short-term step drawdown tests by Kleinfelder in 1992.
Water levels were also measured in the offsite “Winston” observation well. During the 24-hour
constant rate pumping test of the TGM well, no water level drawdown interference was recorded in
Winston well.
The maximum PWL in the TGM well was at a depth of 388.9 ft bgs at the end of the 24-hour
pumping test. This maximum is slightly below the depth to the top of the uppermost perforation
interval in this well (the perforations begin at a depth of 380 ft bgs). Consequently, cascading water
conditions did occur during testing, and such conditions should be anticipated to occur again in the
future during normal operation of the well and, especially, during extended periods of pumping.
Cascading groundwater can and likely will become aerated (i.e., it will contain entrained air). As a
result, and over extended periods of time, cavitation of and damage to the pump could occur, and
there will be an increase in the amount of and frequency for well rehabilitation in the future. Aerated
water increases the opportunity for buildup of chemical precipitates and/or biological growths/slimes
on the perforations and gravel pack. When this buildup occurs, the resultant clogging of the
perforations and gravel pack will cause the specific capacity of the well to decline, the pumping
levels will decline, pump parts will wear, and pumping costs will increase.
The Tioga Gas Mart well presently has the capacity to pump at a sustained rate of 100 gpm, even
with the cascading effect. Over time the rate could diminish somewhat due to deterioration as
previously noted.
Recommendations Based on the foregoing, we recommend the following:
1. Measurement and recording of SWLs, PWLs, pumping rates and pumped volumes should
be performed monthly for the first year for baseline determination; quarterly monitoring can
be performed thereafter.
2. The pump should be removed and a video survey performed to determine the degree of
corrosion and the buildup of organic material and/or precipitates in the perforated intervals.
The video survey too, will help determine the current depth of the sediment fill in the bottom
of the casing.
3. Monitoring for possible pumping of sand should also be performed on a semi-annual basis.
Tioga Gas Mart Well Pumping Test July 18, 2017
7
Thank you for this opportunity to provide this service. If you have any questions regarding this
Technical Memorandum, please contact us.
Respectfully, SIERRA GEOTECHNICAL SERVICES, INC. Dean Dougherty,Vice President Roger Smith Environmental Professional, PG 6497 Senior Groundwater Geologist Attachments: Figures 1 & 2
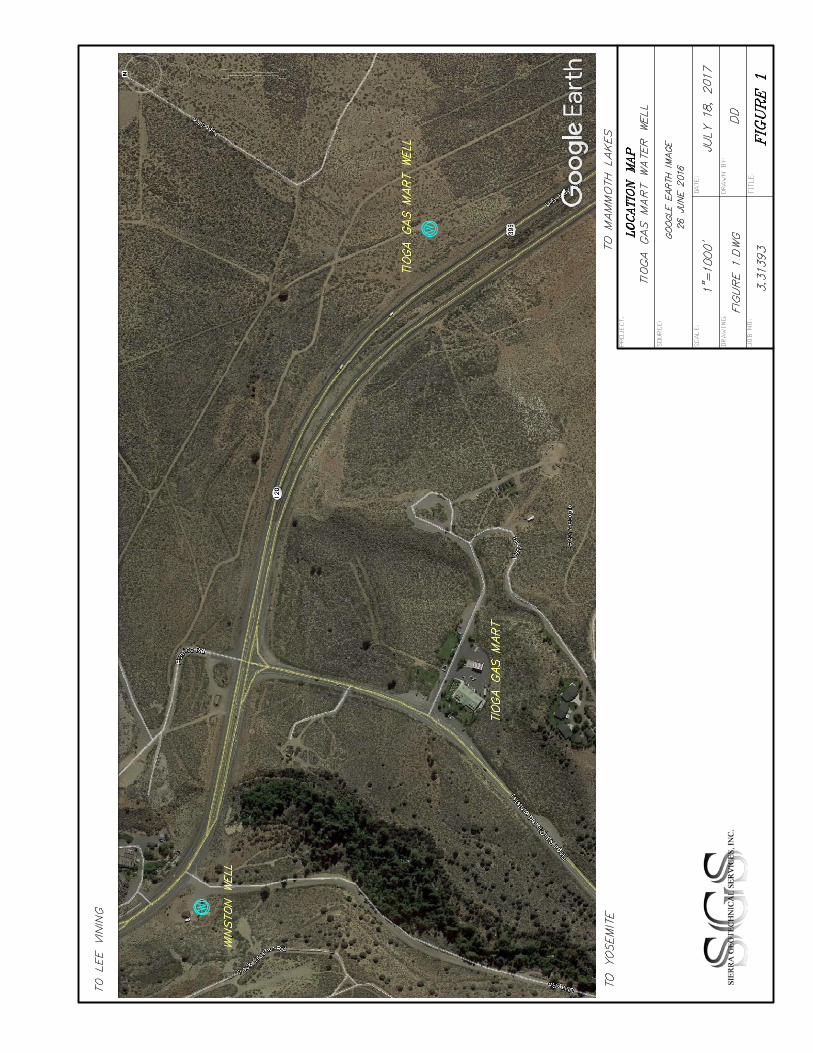
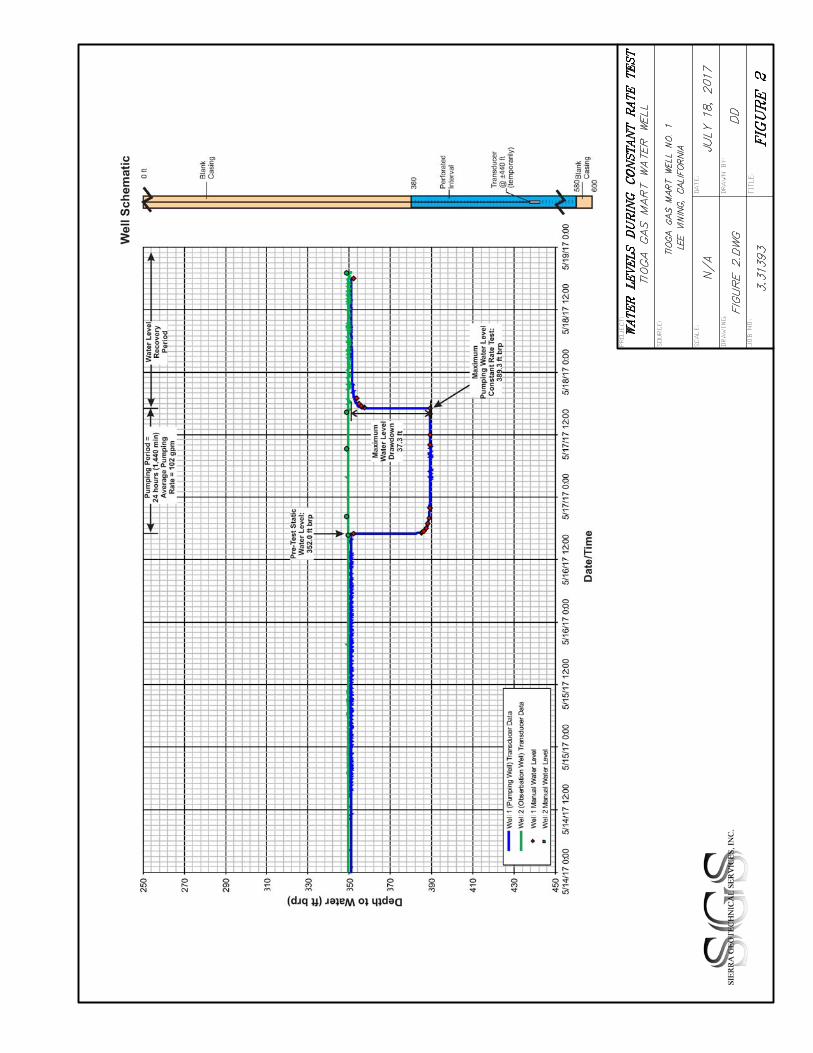

APPENDIX E2
2019 SGSI Supplemental Technical Memorandum
GEOTECHNICAL•GEOLOGY•HYDROGEOLOGY•MATERIALSTESTING•INSPECTION
MAMMOTHOFFICE:POBOX5024MAMMOTHLAKES,CA93546•Phn:(760)937‐4608BISHOPOFFICE:169WILLOWSTREET,BISHOP,CA93514•Phn:(760)937‐4789
www.sgsi.us
Dennis Domaille March 25, 2019 Tioga Gas Mart 22 Vista Point Drive Lee Vining, CA 93541 Subject: VIDEOMONITORINGRECOMMENDATIONSOFOLDERWELL
Tioga Gas Mart Water Well Lee Vining, California
Reference: TECHNICALMEMORANDUM Pumping Test Results Tioga Gas Mart Water-Supply Well SGSI Project Number 3.31393; Dated July 18, 2017
Within our 2017 memorandum, SGSI as part of a rehabilitation program, recommended that the pump within the existing well be removed and a video survey be performed to determine the degree of corrosion and the buildup of organic material and/or precipitates in the perforated intervals (Page 6, Recommendations Section, Bullet Point #2). At the time, this statement was intended as a mitigation measure. However, since issuance of the memorandum, a new well has been installed which relegates the subject well to a backup/redundancy position. Therefore, the statement may be considered as a recommendation and not a required measure. The owner shall be aware that without a survey, and/or rehabilitation the life span of the subject “older” well could be diminished. We appreciate the opportunity to be of service to you. Should you have any questions regarding this report, please do not hesitate to contact us. Respectfully, SIERRAGEOTECHNICALSERVICES,INC.
Joseph A. Adler Thomas A. Platz Principal Geologist Principal Engineer CEG 2198 (exp 3/31/2021) PE C41039 (exp 3/31/2021)
APPENDIX F
Peer Review of 2017 SGSI Well Test Memorandum
By Resource Concepts Inc.
2018-10-23 mmo Draper 18-632.1 Mono County
Memorandum
CARSON CITY OFFICE 340 N. Minnesota St. Carson City, NV 89703-4152
Ph: (775) 883-1600 Fax: (775) 883-1656
Engineering • Surveying • Water Rights
Resource & Environmental Services
www.rci-nv.com
DATE: November 1, 2018
TO: Michael Draper, Mono County Community Development
FROM: Reed A. Cozens, Resource Concepts, Inc.
PROJECT: Mono County Community Development
SUBJECT: Third Party Review- Aquifer Pump Test Technical Memo
Resource Concepts, Inc. (RCI) has reviewed the technical memorandum prepared by
Sierra Geotechnical Services, Inc. (SGS). This memo details an aquifer pump test
associated with the Tioga Gas Mart well (TGM well), located in Lee Vining, California. In
this review evaluations were made regarding the data and conclusions presented in SGS’s
memo.
This pumping test was carried out to determine:
1. The hydraulic properties of the aquifer.
2. Water level changes in the aquifer because of groundwater pumpage.
The data evaluated included, but were not limited to: aquifer transmissivity, storage
coefficient, confining layers, natural boundary conditions, well efficiency, and pumping
rates used during the test.
General Observations
The subject aquifer pump test was performed in May 2017 to evaluate potential impacts
of the Tioga Gas Mart’s expansion on the town of Lee Vining’s water supply wells, and/or
the springs that feed Mono Lake. An observation well (also known as the Winston well,
MEMORANDUM Michael Draper November 1, 2018 Page 2 of 4
2018-10-23 mmo Draper 18-632.1 Mono County CD RAC.docx
located approximately 3,600 feet to the northwest of the TGM well) was used to record
the static water level changes as a result of pumping from the TGM well.
Data Evaluation
Subject (Pumped Tioga Gas Mart) Well: The subject well is an 8-inch cased well,
drilled to a depth of 600 feet. In the spectrum of western state water wells, this is a small
to mid-sized well in diameter but drilled deeper than the average domestic or small-scale
commercial well.
Well capacity is governed by aquifer characteristics and pump performance. According to
the SGS memo the subject TGM well is capable of a sustained rate of pumping at 100
gallons per minute. Again, in the spectrum of western state water wells this discharge rate
is approximately three times greater than the average domestic well, but in-line with the
proposed commercial operation. If consistently pumped at 100 gpm the TGM would
extract approximately 160 acre-feet over the course of one year.
Observation well (Winston Well): The location of the observation well (Winston
well) is located approximately 3,600 feet to the northwest of the subject well. Based upon
the well information provided in the SGS memo, this well is similarly screened and
reaches the same water bearing formations within the aquifer as the TGM well. It would
have been preferable to have utilized an observation well at a closer radial distance to the
TGM well. However, there appears to be limited available wells in the area to choose from.
Pumping rates. During the SGS aquifer pump test a steady rate of 102 gallons per
minute was used. In our professional experience, this is a reasonable diversion rate for
aquifer evaluation at this location.
Length of test: The SGS constant rate test of the TGM well was performed for 24-hours.
This is a common duration for aquifer pumping tests, and 24-hours is considered
acceptable for a test of this type. As a rule, during a pump test drawdown equilibrium at
the pumping well should be sought, with test pumping continued for an equivalent
amount of time or greater. Data in the SGS memo indicates that these conditions were
met and exceeded.
MEMORANDUM Michael Draper November 1, 2018 Page 3 of 4
2018-10-23 mmo Draper 18-632.1 Mono County CD RAC.docx
Aquifer transmissivity. This unit is directly proportional to the aquifer’s capacity to
transmit water. A practical understanding dictates that the higher the transmissivity
value, the farther away the effects of the groundwater pumping will be observed.
Through a report completed in 1992 by Kleinfelder Engineering Company (Kleinfelder).
the SGS memo references the aquifer transmissivity of the subject well. The estimated
transmissivity value at this location is 15,600 gallons per day per foot of saturated
thickness (gpd/ft); and after an unidentified condition change, is calculated at 31,800
gpd/ft. These figures should be considered low on the regional scale, and reasonably
correspond with the gravel and coarse sand soil types likely to found in the alluvial fan of
the Mono Lake Basin.
Confining layers: Based upon the well information provided in the SGS report there
does not appear to be a significant confining layer formation at the TGM well location.
However, in the observation well (Winston well), the well log shows strata of clay and
granite, which are the primary confining materials in the region. As a result, this portion
of the observation aquifer may be partially confined. Additionally, Kleinfelder identified
a transmissivity change that further corroborates this assumption. Typically, confining
conditions result in greater impacts to nearby wells, if they intercept the same water
bearing formation(s).
Storage Coefficient (also known as Storativity): This unitless term was not
addressed in the SGS memo. However, as a general rule, this unit is more appropriate to
define conditions associated with confined aquifers, as opposed to unconfined aquifers.
RCI concurs that the calculation of a storage coefficient is not germane to this aquifer
pump test and that its absence does not affect the conclusions of this memo.
Natural Boundary Conditions: Lee Vining Creek is located approximately one-half
mile north of the subject well, and one-tenth of a mile south of the observation well. It is
likely that Lee Vining Creek interacts with the aquifer(s) underlying its channel. However,
the effects of this water feature were not discussed within the SGS memo. A more detailed
analysis would be necessary to determine how much, if any, stream depletion occurs from
MEMORANDUM Michael Draper November 1, 2018 Page 4 of 4
2018-10-23 mmo Draper 18-632.1 Mono County CD RAC.docx
Lee Vining Creek as a result of pumping the TGM well. Additional boundary conditions
include the Sierra to the west and Mono Lake to the east. Both of these features are outside
the radius of impact for this pump test.
Well Efficiency: The SGS memo did not report any well efficiency data.
Overall Evaluation
Overall the SGS memorandum was found to be reasonable and technically sound. The
Tioga Gas Mart well is not particularly large in either size or capacity; and appears to be
situated in a location without obvious conflicts. With this said, the Tioga Gas Mart well is
not expected to have a measurably significant impact on Lee Vining’s water supply wells
or on the springs that feed Mono Lake; however, the location of any specific feature of
concern was not identified within the SGS memo.
Of all the options available to evaluate an aquifers characteristic and/or the effects of
groundwater pumping, nothing can match the observational insights of a properly
performed aquifer pump test. However, if the goal is to manage a limited amount of water,
then the findings of these tests should be coupled with effective water use regulations and
administrative policies. With over forty years of experience in water rights and
environmental services, RCI would be happy to further discuss the solutions they have
seen work within the surrounding region. Please do not hesitate to contact us should you
have any questions or comments. Thank you.
APPENDIX G
SGSI Response to Peer Review
GEOTECHNICAL•GEOLOGY•HYDROGEOLOGY•MATERIALSTESTING•INSPECTION
MAMMOTHOFFICE:POBOX5024MAMMOTHLAKES,CA93546•Phn:(760)937‐4608BISHOPOFFICE:169WILLOWSTREET,BISHOP,CA93514•Phn:(760)937‐4789
www.sgsi.us
Dennis Domaille December 7, 2018 Tioga Gas Mart 22 Vista Point Drive Lee Vining, CA 93541 Subject: RESPONSETOREVIEWCOMMENTS
Tioga Gas Mart Water Well Lee Vining, California
Reference: RCITHIRDPARTYREVIEWMEMORANDUM Tioga Gas Mart Well
November 1, 2018 Included herein is our response to the third-party review comment regarding the potential loss of water from Lee Vining Creek, from groundwater well pumping at the project site. Comments are listed below, followed by our response. Comment:RCIMemo,Page3–NaturalBoundaryConditions:Lee Vining Creek is located approximately one-half mile north of the subject well, and one-tenth of a mile south of the observation well. It is likely that Lee Vining Creek interacts with the aquifer(s) underlying its channel. However, the effects of this water feature were not discussed within the SGS memo. A more detailed analysis would be necessary to determine how much, if any, stream depletion occurs from Lee Vining Creek as a result of pumping the TGM well. Response: Water flows in Lee Vining Creek are controlled mostly by Southern California Edison (SCE) and Los Angeles Department of Water and Power (LADWP) releases from the upstream reservoirs. Minimum water flows are legally required (Decision D1631; SWRCB Order 98-05) to be maintained in the Creek. At present, min-max flows are required between 25 to 35 cfs depending on time of year and snowpack. The following simple mathematical model expresses the potential effect on Lee Vining Creek from groundwater pumping at the site. Modeling does not consider variables such as distance from the creek, geology, transmissivity, or usage (which will be greatly reduced during winter months and at night) which would further reduce any potential impacts on the creek from pumping.

Decmeeber7,2018ResponsetoReviewComments
TiogaMartWell
AssumedFlowRates102 gpm constant rate flow from Tioga Well. 25 cfs daily required minimum flow. DailyEffect102 gpm x 60 min x 24 hours = 146,850 gpd. 146,850 gpd = 0.23 cfs 0.23cfs/25cfs = 0.9 percent daily usage AnnualEffect146,850 gpd X 365 days = 53,600,250 gpy. 25 cfs = 16,154,761 gpd = 5,896,487,765 gpy 53,600,250gpy/589,648,740gpy = 0.9 percent yearly usage Based on the values calculated, the potential for stream depletion on Lee Vining Creek from pumping of the well, is considered negligible (<1-percent). The values would be further reduced if distance, geology, transmissivity, and usage were considered. Referenceshttps://www.monobasinresearch.org/data/mbrtdframes.htm We appreciate the opportunity to be of service to you. Should you have any questions regarding this report, please do not hesitate to contact us. Respectfully, SIERRAGEOTECHNICALSERVICES,INC.
Joseph A. Adler Thomas A. Platz Principal Geologist Principal Engineer CEG 2198 (exp 3/31/2019) PE C41039 (exp 3/31/2019)
APPENDIX H
LRWQCB Withdrawal of NOP Request for a
Jurisdictional Delineation

LRWQCB WAIVER OF REQUIREMENT FOR JURISDICTION DELINEATION (25 May 2018)Tioga Workforce Housing Project
From: Zimmerman, Jan@Waterboards <[email protected]>Sent: Friday, May 25, 2018 11:18 AMTo: Gerry LeFrancois <[email protected]>Cc: Copeland, Patrice@Waterboards <[email protected]>; Steinert,Tiffany@Waterboards <[email protected]>Subject: RE: Tioga Inn Project SP amendment in Lee Vining
Gerry, I will leave that up to you. If you are confident that work will not occur in or disturb wetlands orother surface water resources, then that is your call. However, if we inspect and suspect that resourcesare onsite and being impacted by the project, then we will require a delineation at that time. Hope thathelps!
Jan Zimmerman, P.G. #8392Senior Engineering GeologistLahontan Regional Water Quality Control Board760/241-7376http://waterboards.ca.gov/lahontan/
From: Gerry LeFrancois [mailto:[email protected]]Sent: Tuesday, May 22, 2018 10:35 AMTo: Zimmerman, Jan@Waterboards <[email protected]>Cc: Copeland, Patrice@Waterboards <[email protected]>Subject: Tioga Inn Project SP amendment in Lee Vining
Hi Jan. I was wondering if there is any way to not do a wetlands determination study for thisproject. There is no surface water or meadow areas on the parcels involved for the Tioga Inn SpecificPlan amendment. The CEQA consultant feels time and effort would be better spent on other projectissues and/or concerns. Staff agrees.
I am happy to give you a project tour if you or someone from your office is up this way! Please let meknow your thoughts. Thank you.
Gerry L.
Gerry Le FrancoisPrincipal Planner Mono County CDD760.924.1810 (office)
APPENDIX I
Biological Resource Assessment by
James Paulus, Ph.D.
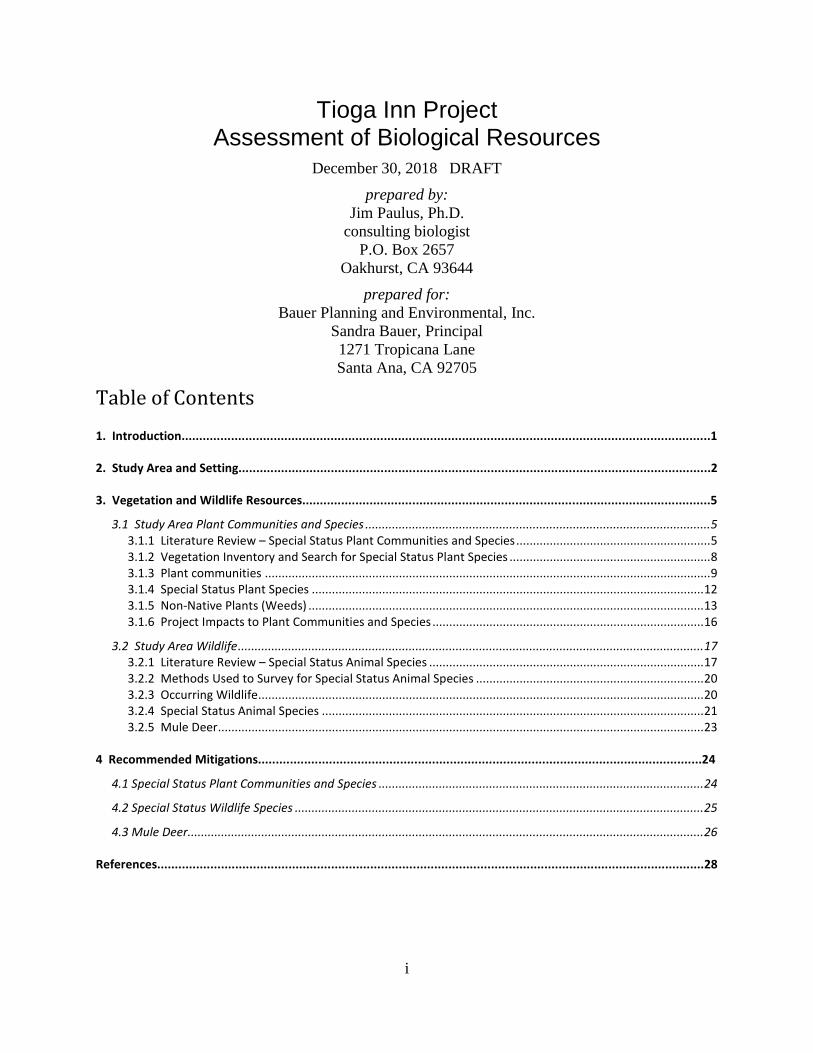
i
Tioga Inn ProjectAssessment of Biological Resources
December 30, 2018 DRAFT
prepared by:Jim Paulus, Ph.D.
consulting biologistP.O. Box 2657
Oakhurst, CA 93644
prepared for:Bauer Planning and Environmental, Inc.
Sandra Bauer, Principal1271 Tropicana LaneSanta Ana, CA 92705
Table of Contents
1. Introduction.....................................................................................................................................................1
2. Study Area and Setting.....................................................................................................................................2
3. Vegetation and Wildlife Resources...................................................................................................................5
3.1 Study Area Plant Communities and Species .......................................................................................................53.1.1 Literature Review – Special Status Plant Communities and Species..........................................................53.1.2 Vegetation Inventory and Search for Special Status Plant Species ............................................................83.1.3 Plant communities .....................................................................................................................................93.1.4 Special Status Plant Species .....................................................................................................................123.1.5 Non-Native Plants (Weeds) ......................................................................................................................133.1.6 Project Impacts to Plant Communities and Species .................................................................................16
3.2 Study Area Wildlife...........................................................................................................................................173.2.1 Literature Review – Special Status Animal Species ..................................................................................173.2.2 Methods Used to Survey for Special Status Animal Species ....................................................................203.2.3 Occurring Wildlife.....................................................................................................................................203.2.4 Special Status Animal Species ..................................................................................................................213.2.5 Mule Deer.................................................................................................................................................23
4 Recommended Mitigations.............................................................................................................................24
4.1 Special Status Plant Communities and Species .................................................................................................24
4.2 Special Status Wildlife Species ..........................................................................................................................25
4.3 Mule Deer..........................................................................................................................................................26
References..........................................................................................................................................................28
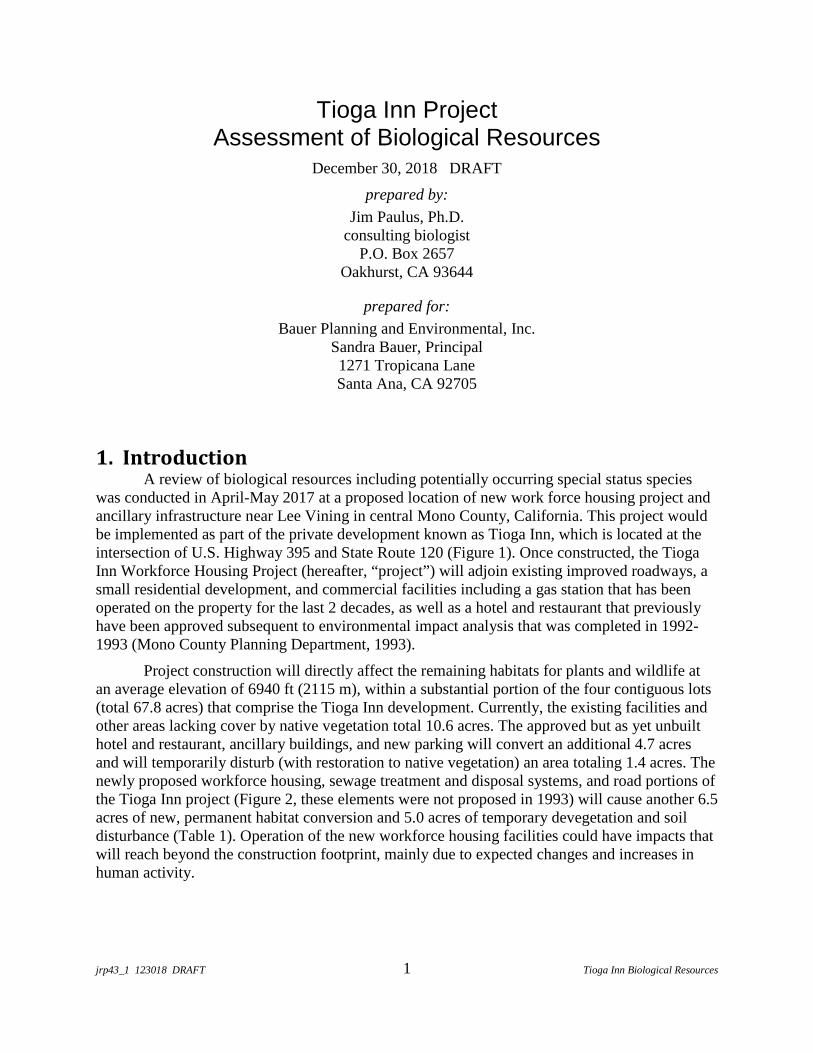
jrp43_1 123018 DRAFT 1 Tioga Inn Biological Resources
Tioga Inn ProjectAssessment of Biological Resources
December 30, 2018 DRAFT
prepared by:
Jim Paulus, Ph.D.consulting biologist
P.O. Box 2657Oakhurst, CA 93644
prepared for:
Bauer Planning and Environmental, Inc.Sandra Bauer, Principal1271 Tropicana LaneSanta Ana, CA 92705
1. IntroductionA review of biological resources including potentially occurring special status species
was conducted in April-May 2017 at a proposed location of new work force housing project andancillary infrastructure near Lee Vining in central Mono County, California. This project wouldbe implemented as part of the private development known as Tioga Inn, which is located at theintersection of U.S. Highway 395 and State Route 120 (Figure 1). Once constructed, the TiogaInn Workforce Housing Project (hereafter, “project”) will adjoin existing improved roadways, asmall residential development, and commercial facilities including a gas station that has beenoperated on the property for the last 2 decades, as well as a hotel and restaurant that previouslyhave been approved subsequent to environmental impact analysis that was completed in 1992-1993 (Mono County Planning Department, 1993).
Project construction will directly affect the remaining habitats for plants and wildlife atan average elevation of 6940 ft (2115 m), within a substantial portion of the four contiguous lots(total 67.8 acres) that comprise the Tioga Inn development. Currently, the existing facilities andother areas lacking cover by native vegetation total 10.6 acres. The approved but as yet unbuilthotel and restaurant, ancillary buildings, and new parking will convert an additional 4.7 acresand will temporarily disturb (with restoration to native vegetation) an area totaling 1.4 acres. Thenewly proposed workforce housing, sewage treatment and disposal systems, and road portions ofthe Tioga Inn project (Figure 2, these elements were not proposed in 1993) will cause another 6.5acres of new, permanent habitat conversion and 5.0 acres of temporary devegetation and soildisturbance (Table 1). Operation of the new workforce housing facilities could have impacts thatwill reach beyond the construction footprint, mainly due to expected changes and increases inhuman activity.
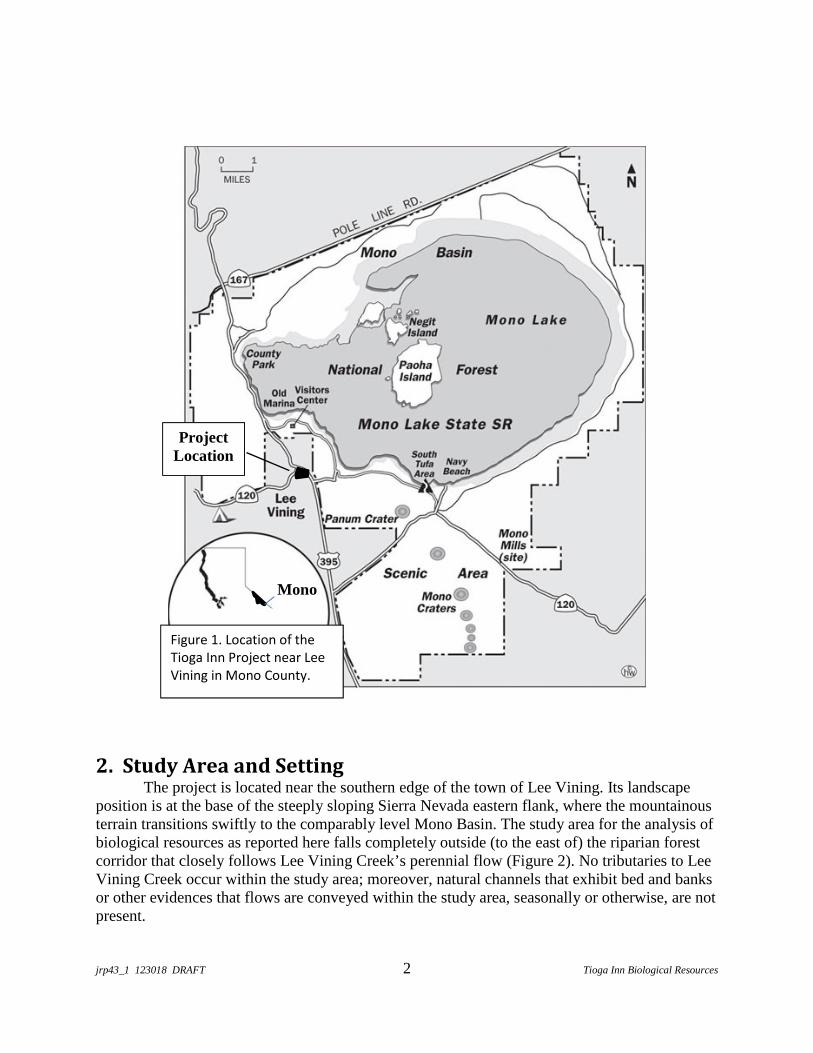
jrp43_1 123018 DRAFT 2 Tioga Inn Biological Resources
2. Study Area and SettingThe project is located near the southern edge of the town of Lee Vining. Its landscape
position is at the base of the steeply sloping Sierra Nevada eastern flank, where the mountainousterrain transitions swiftly to the comparably level Mono Basin. The study area for the analysis ofbiological resources as reported here falls completely outside (to the east of) the riparian forestcorridor that closely follows Lee Vining Creek’s perennial flow (Figure 2). No tributaries to LeeVining Creek occur within the study area; moreover, natural channels that exhibit bed and banksor other evidences that flows are conveyed within the study area, seasonally or otherwise, are notpresent.
.Figure 1. Location of theTioga Inn Project near LeeVining in Mono County.
Mono
ProjectLocation
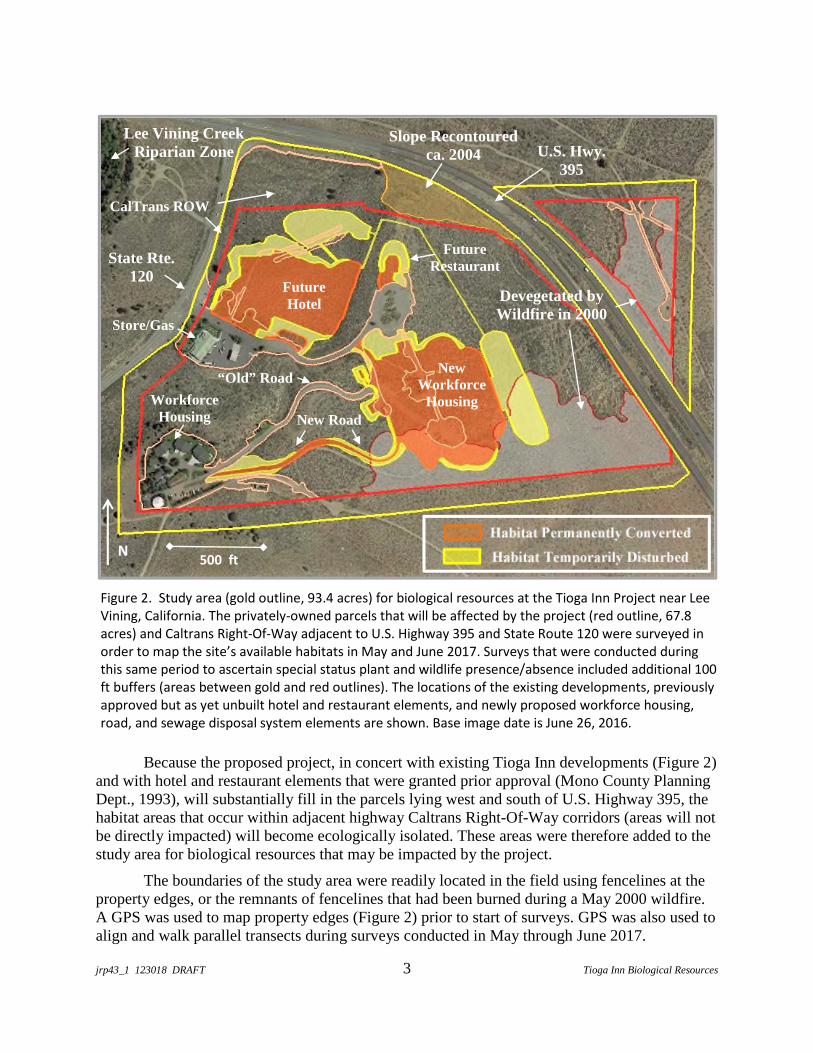
jrp43_1 123018 DRAFT 3 Tioga Inn Biological Resources
Figure 2. Study area (gold outline, 93.4 acres) for biological resources at the Tioga Inn Project near LeeVining, California. The privately-owned parcels that will be affected by the project (red outline, 67.8acres) and Caltrans Right-Of-Way adjacent to U.S. Highway 395 and State Route 120 were surveyed inorder to map the site’s available habitats in May and June 2017. Surveys that were conducted duringthis same period to ascertain special status plant and wildlife presence/absence included additional 100ft buffers (areas between gold and red outlines). The locations of the existing developments, previouslyapproved but as yet unbuilt hotel and restaurant elements, and newly proposed workforce housing,road, and sewage disposal system elements are shown. Base image date is June 26, 2016.
Because the proposed project, in concert with existing Tioga Inn developments (Figure 2)and with hotel and restaurant elements that were granted prior approval (Mono County PlanningDept., 1993), will substantially fill in the parcels lying west and south of U.S. Highway 395, thehabitat areas that occur within adjacent highway Caltrans Right-Of-Way corridors (areas will notbe directly impacted) will become ecologically isolated. These areas were therefore added to thestudy area for biological resources that may be impacted by the project.
The boundaries of the study area were readily located in the field using fencelines at theproperty edges, or the remnants of fencelines that had been burned during a May 2000 wildfire.A GPS was used to map property edges (Figure 2) prior to start of surveys. GPS was also used toalign and walk parallel transects during surveys conducted in May through June 2017.
N500 ft
U.S. Hwy.395
State Rte.120
Slope Recontouredca. 2004
Devegetated byWildfire in 2000
Lee Vining CreekRiparian Zone
FutureHotel
FutureRestaurant
NewWorkforce
Housing
“Old” Road
New Road
Habitat Permanently Converted
Habitat Temporarily Disturbed
CalTrans ROW
WorkforceHousing
Store/Gas
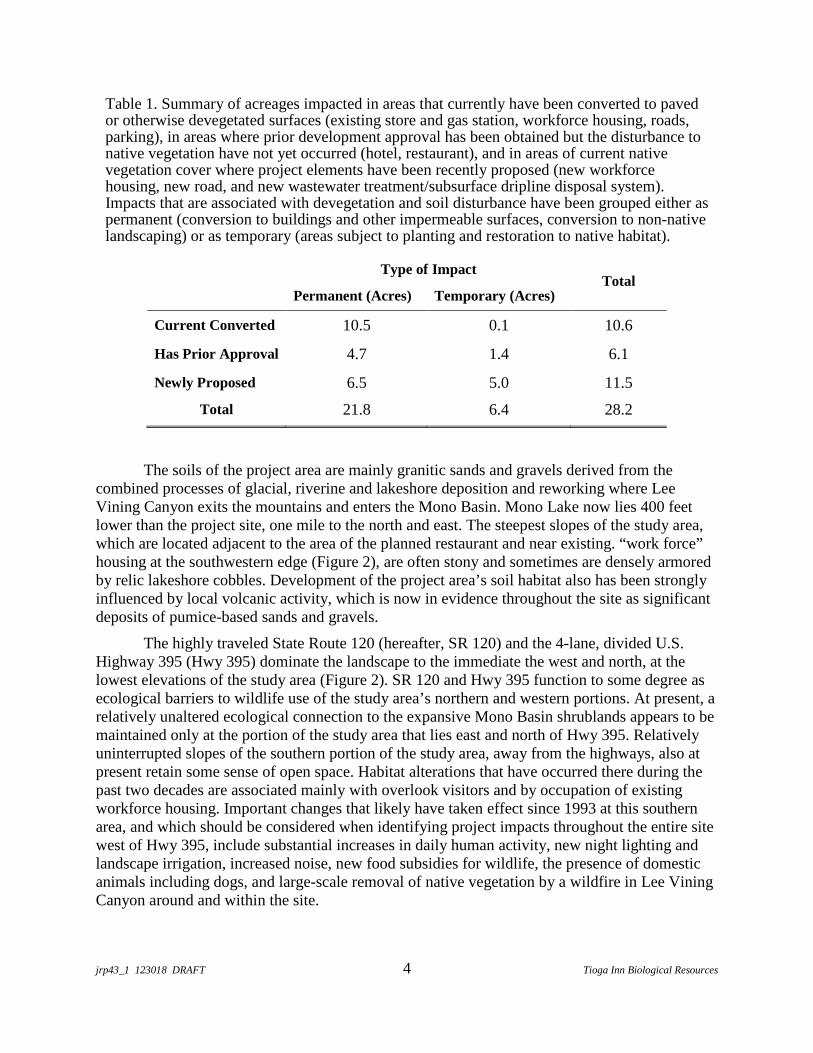
jrp43_1 123018 DRAFT 4 Tioga Inn Biological Resources
Table 1. Summary of acreages impacted in areas that currently have been converted to pavedor otherwise devegetated surfaces (existing store and gas station, workforce housing, roads,parking), in areas where prior development approval has been obtained but the disturbance tonative vegetation have not yet occurred (hotel, restaurant), and in areas of current nativevegetation cover where project elements have been recently proposed (new workforcehousing, new road, and new wastewater treatment/subsurface dripline disposal system).Impacts that are associated with devegetation and soil disturbance have been grouped either aspermanent (conversion to buildings and other impermeable surfaces, conversion to non-nativelandscaping) or as temporary (areas subject to planting and restoration to native habitat).
Type of ImpactTotal
Permanent (Acres) Temporary (Acres)
Current Converted 10.5 0.1 10.6
Has Prior Approval 4.7 1.4 6.1
Newly Proposed 6.5 5.0 11.5
Total 21.8 6.4 28.2
The soils of the project area are mainly granitic sands and gravels derived from thecombined processes of glacial, riverine and lakeshore deposition and reworking where LeeVining Canyon exits the mountains and enters the Mono Basin. Mono Lake now lies 400 feetlower than the project site, one mile to the north and east. The steepest slopes of the study area,which are located adjacent to the area of the planned restaurant and near existing. “work force”housing at the southwestern edge (Figure 2), are often stony and sometimes are densely armoredby relic lakeshore cobbles. Development of the project area’s soil habitat also has been stronglyinfluenced by local volcanic activity, which is now in evidence throughout the site as significantdeposits of pumice-based sands and gravels.
The highly traveled State Route 120 (hereafter, SR 120) and the 4-lane, divided U.S.Highway 395 (Hwy 395) dominate the landscape to the immediate the west and north, at thelowest elevations of the study area (Figure 2). SR 120 and Hwy 395 function to some degree asecological barriers to wildlife use of the study area’s northern and western portions. At present, arelatively unaltered ecological connection to the expansive Mono Basin shrublands appears to bemaintained only at the portion of the study area that lies east and north of Hwy 395. Relativelyuninterrupted slopes of the southern portion of the study area, away from the highways, also atpresent retain some sense of open space. Habitat alterations that have occurred there during thepast two decades are associated mainly with overlook visitors and by occupation of existingworkforce housing. Important changes that likely have taken effect since 1993 at this southernarea, and which should be considered when identifying project impacts throughout the entire sitewest of Hwy 395, include substantial increases in daily human activity, new night lighting andlandscape irrigation, increased noise, new food subsidies for wildlife, the presence of domesticanimals including dogs, and large-scale removal of native vegetation by a wildfire in Lee ViningCanyon around and within the site.
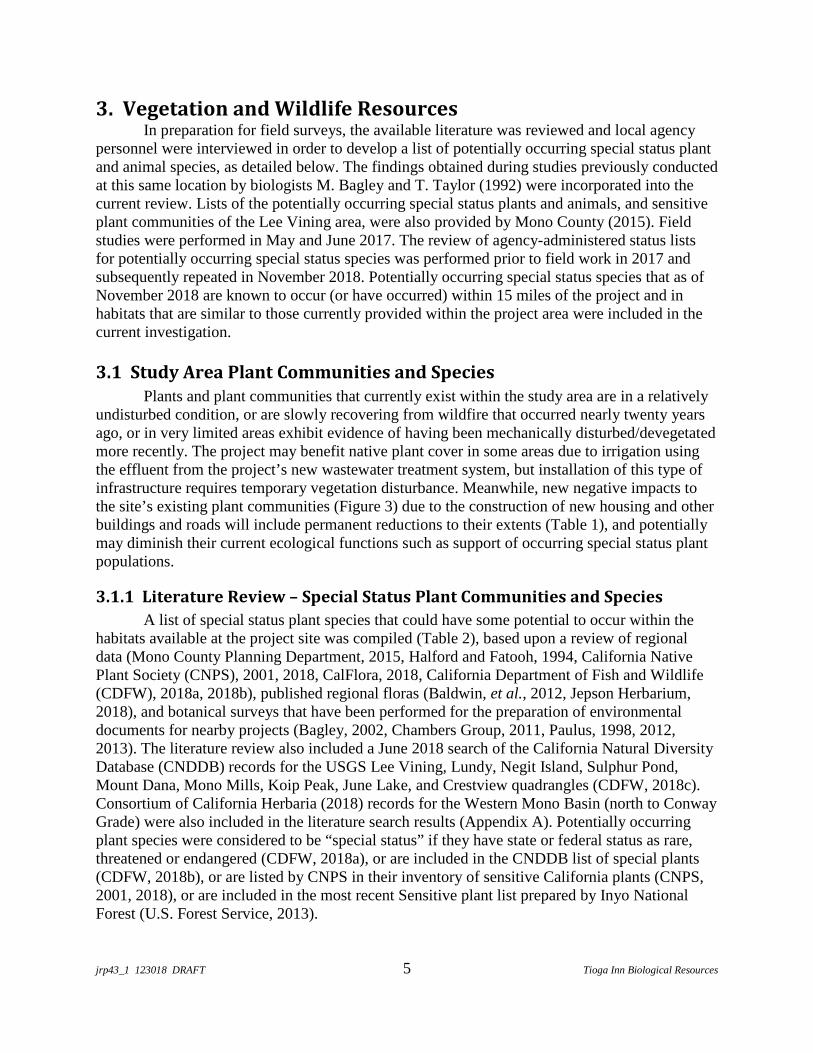
jrp43_1 123018 DRAFT 5 Tioga Inn Biological Resources
3. Vegetation and Wildlife ResourcesIn preparation for field surveys, the available literature was reviewed and local agency
personnel were interviewed in order to develop a list of potentially occurring special status plantand animal species, as detailed below. The findings obtained during studies previously conductedat this same location by biologists M. Bagley and T. Taylor (1992) were incorporated into thecurrent review. Lists of the potentially occurring special status plants and animals, and sensitiveplant communities of the Lee Vining area, were also provided by Mono County (2015). Fieldstudies were performed in May and June 2017. The review of agency-administered status listsfor potentially occurring special status species was performed prior to field work in 2017 andsubsequently repeated in November 2018. Potentially occurring special status species that as ofNovember 2018 are known to occur (or have occurred) within 15 miles of the project and inhabitats that are similar to those currently provided within the project area were included in thecurrent investigation.
3.1 Study Area Plant Communities and SpeciesPlants and plant communities that currently exist within the study area are in a relatively
undisturbed condition, or are slowly recovering from wildfire that occurred nearly twenty yearsago, or in very limited areas exhibit evidence of having been mechanically disturbed/devegetatedmore recently. The project may benefit native plant cover in some areas due to irrigation usingthe effluent from the project’s new wastewater treatment system, but installation of this type ofinfrastructure requires temporary vegetation disturbance. Meanwhile, new negative impacts tothe site’s existing plant communities (Figure 3) due to the construction of new housing and otherbuildings and roads will include permanent reductions to their extents (Table 1), and potentiallymay diminish their current ecological functions such as support of occurring special status plantpopulations.
3.1.1 Literature Review – Special Status Plant Communities and Species
A list of special status plant species that could have some potential to occur within thehabitats available at the project site was compiled (Table 2), based upon a review of regionaldata (Mono County Planning Department, 2015, Halford and Fatooh, 1994, California NativePlant Society (CNPS), 2001, 2018, CalFlora, 2018, California Department of Fish and Wildlife(CDFW), 2018a, 2018b), published regional floras (Baldwin, et al., 2012, Jepson Herbarium,2018), and botanical surveys that have been performed for the preparation of environmentaldocuments for nearby projects (Bagley, 2002, Chambers Group, 2011, Paulus, 1998, 2012,2013). The literature review also included a June 2018 search of the California Natural DiversityDatabase (CNDDB) records for the USGS Lee Vining, Lundy, Negit Island, Sulphur Pond,Mount Dana, Mono Mills, Koip Peak, June Lake, and Crestview quadrangles (CDFW, 2018c).Consortium of California Herbaria (2018) records for the Western Mono Basin (north to ConwayGrade) were also included in the literature search results (Appendix A). Potentially occurringplant species were considered to be “special status” if they have state or federal status as rare,threatened or endangered (CDFW, 2018a), or are included in the CNDDB list of special plants(CDFW, 2018b), or are listed by CNPS in their inventory of sensitive California plants (CNPS,2001, 2018), or are included in the most recent Sensitive plant list prepared by Inyo NationalForest (U.S. Forest Service, 2013).
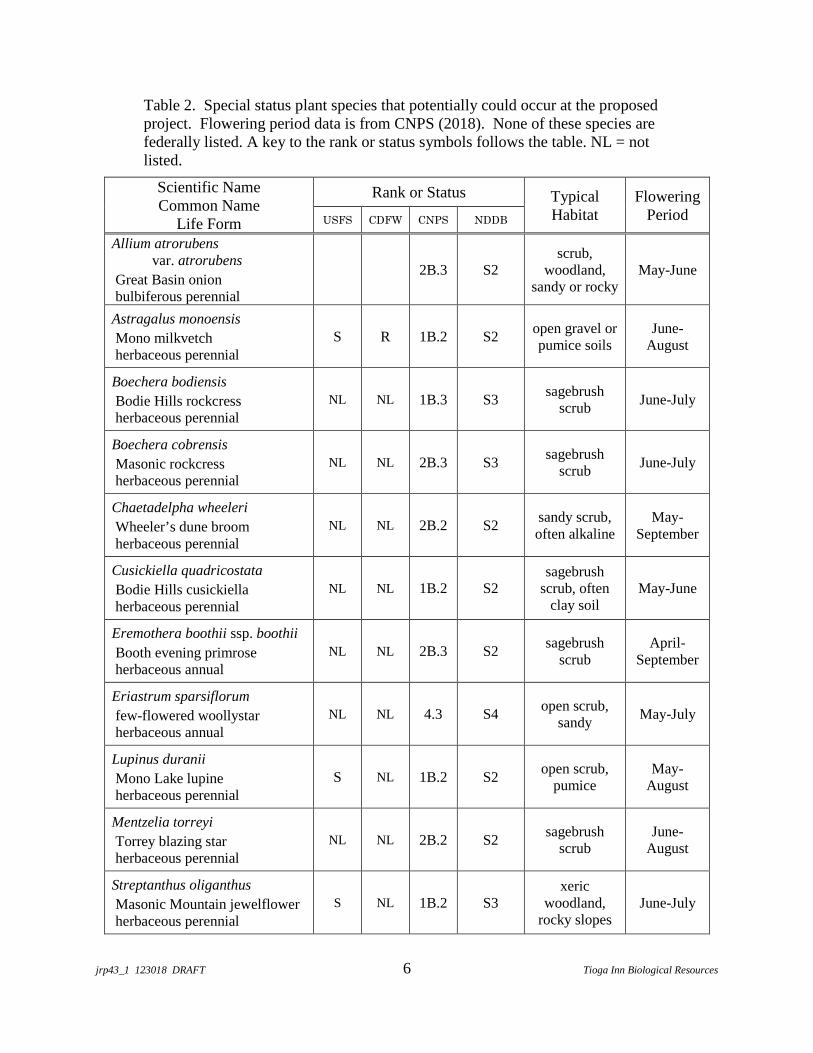
jrp43_1 123018 DRAFT 6 Tioga Inn Biological Resources
Table 2. Special status plant species that potentially could occur at the proposedproject. Flowering period data is from CNPS (2018). None of these species arefederally listed. A key to the rank or status symbols follows the table. NL = notlisted.
Scientific NameCommon Name
Life Form
Rank or Status TypicalHabitat
FloweringPeriodUSFS CDFW CNPS NDDB
Allium atrorubensvar. atrorubens
Great Basin onionbulbiferous perennial
2B.3 S2scrub,
woodland,sandy or rocky
May-June
Astragalus monoensis
Mono milkvetchherbaceous perennial
S R 1B.2 S2open gravel orpumice soils
June-August
Boechera bodiensis
Bodie Hills rockcressherbaceous perennial
NL NL 1B.3 S3sagebrush
scrubJune-July
Boechera cobrensis
Masonic rockcressherbaceous perennial
NL NL 2B.3 S3sagebrush
scrubJune-July
Chaetadelpha wheeleri
Wheeler’s dune broomherbaceous perennial
NL NL 2B.2 S2sandy scrub,often alkaline
May-September
Cusickiella quadricostata
Bodie Hills cusickiellaherbaceous perennial
NL NL 1B.2 S2sagebrush
scrub, oftenclay soil
May-June
Eremothera boothii ssp. boothii
Booth evening primroseherbaceous annual
NL NL 2B.3 S2sagebrush
scrubApril-
September
Eriastrum sparsiflorum
few-flowered woollystarherbaceous annual
NL NL 4.3 S4open scrub,
sandyMay-July
Lupinus duranii
Mono Lake lupineherbaceous perennial
S NL 1B.2 S2open scrub,
pumiceMay-
August
Mentzelia torreyi
Torrey blazing starherbaceous perennial
NL NL 2B.2 S2sagebrush
scrubJune-
August
Streptanthus oliganthus
Masonic Mountain jewelflowerherbaceous perennial
S NL 1B.2 S3xeric
woodland,rocky slopes
June-July

jrp43_1 123018 DRAFT 7 Tioga Inn Biological Resources
Scientific NameCommon Name
Life Form
Rank or Status TypicalHabitat
FloweringPeriodUSFS CDFW CNPS NDDB
Tetradymia tetrameres
dune horsebrushshrub
NL NL 2B.2 S2sagebrush
scrub, dunesMay-
September
Thelypodium integrifoliumssp. complanatum
foxtail thelypodiumherbaceous perennial
NL NL 2B.2 S2sagebrush
scrub, xericwoodland
June-August
Thelypodium milleflorum
many-flowered thelypodiumherbaceous perennial
NL NL 2B.2 S3?sagebrush
scrub, rockyApril-August
Viola purpurea ssp. aurea
golden violetherbaceous perennial
NL NL 2B.2 S2sandy
sagebrushscrub
April-June
Rank or status, by agency:
USFS = US Forest Service, Inyo National Forest, Bishop Office (2013):
S = Sensitive List.
CDFW = California Department of Fish and Wildlife listings under the California Endangered Species Actand Native Plant Protection Act (CDFW, 2018a):
R = Rare.
CNPS = California Native Plant Society listings (CNPS, 2001, 2018):
1B = rare and endangered in California and elsewhere,2B = rare, threatened or endangered in California, but more common elsewhere,
4 = plants of limited distribution in California – watchlist species.
Threat Code extensions:
.1 is Seriously endangered in California (over 80% of occurrences threatened / highdegree and immediacy of threat),
.2 is Fairly endangered in California (20-80% of occurrences threatened),
.3 is Not very endangered in California (< 20% of occ’s threatened or no currentthreats known.
NDDB = California Natural Diversity Data Base rankings (CDFW, 2018b):
S1 is < 6 occurrences or < 1000 individuals or < 1000 acres,
S2 is 6-20 occurrences or 1000-3000 individuals or 2000-10000 acres,
S3 is 21-100 occurrences or 3000-10000 individuals or 10000-50000 acres,
S4 is apparently secure in California.
? indicates CNDDB uncertainty in status.
jrp43_1 123018 DRAFT 8 Tioga Inn Biological Resources
This review was initially performed in April 2017 immediately prior to field surveys.When repeated in November 2018, two changes in status or known species distribution wereidentified resulting in the addition of few-flowered woollystar (Eriastrum sparsiflorum) andBodie Hills rockcress (Boechera bodiensis) to the search list (Table 2). The 2018 literaturereview and CNDDB records search results thus indicate that 15 special status plant species andthe sensitive plant community Mono Pumice Flats occur within 15 miles of the project and inhabitats that bear some resemblance to those available within the project area. Previouslydocumented occurrences of special status plant species or sensitive communities within the studyarea were not found in CNDDB records or other available literature (Appendix A), including the1993 review of the Tioga Inn project under CEQA. This does not signify special status speciesabsence; it merely is evidence that none have been reported.
Potentially occurring special status plant species (Table 2) exhibit an herbaceousperennial or shrub growth habit, except the annual herbs Booth’s evening primrose (Eremotheraboothii ssp. boothii) and few-flowered woollystar (Eriastrum sparsiflorum). The perennialswould be expected to be bear leaves and flowers at the time of the May-June 2017 surveys, andsome would be expected to be exhibit developing fruits. The expected phenologies of the annualsBooth’s evening primrose and few-flowered woollystar would be bearing leaves, flowers, andmature fruits (Table 2). These annuals are the only special status species that have somelikelihood to occur in mechanically disturbed habitats. None of the potentially occurring plantspecies is federally listed or a candidate for listing. Mono milkvetch (Astragalus monoensis) isstate listed as Rare. Mono milkvetch is endemic to the Mono Lake Basin and a few other nearbydepressions where vegetation is sparse and nutrient-poor, pumice gravel soil is present.
3.1.2 Vegetation Inventory and Search for Special Status Plant Species
An inventory of plant species and vegetation community types present within the entirestudy area was completed using transect-style field surveys conducted on May 17-21 and June 4-5, 2017. Buffer areas (Figure 2) were included in the search for special status populations. Allplant species encountered along wandering transects spaced at 50 feet intervals were identified tothe level of taxa that was sufficient to determine special-status species presence or absence. Anyspecies that were not at once recognized were keyed by the consulting botanist using The JepsonManual (Baldwin, et al., 2012). The methods that were employed comply with CDFW guidelinesfor floristic survey (CDFG, 2009). May and June fall within the potentially occurring species’anthesis periods (Table 2). The documented high diversity of occurring plant species, especiallyamong native annuals (Appendix B) that established high abundances, suggests that the completeflora was represented well at the time of survey, due to favorable climate during the early portionof the growing season in 2017. J. Paulus of Oakhurst, California, performed all botanical surveywork, totaling 40 hours.
Species composition including non-native presence was recorded along the transects.Plant communities were separated for mapping by using shifts in the frequencies of dominantspecies to define associations, which then were grouped within the upland shrublands Alliancetypes defined by Sawyer, et al., (2009). Boundaries mapped at burn scar edges were abrupt.Boundaries otherwise were clearly discernible in the field, but changes in the relative frequenciesof shrub dominants among the occurring associations were typically not abrupt. Each mappingunit was characterized based upon rapid belt transect counts to estimate the relative frequenciesof dominants, and ocular estimation (± 10%) of total cover and average height.
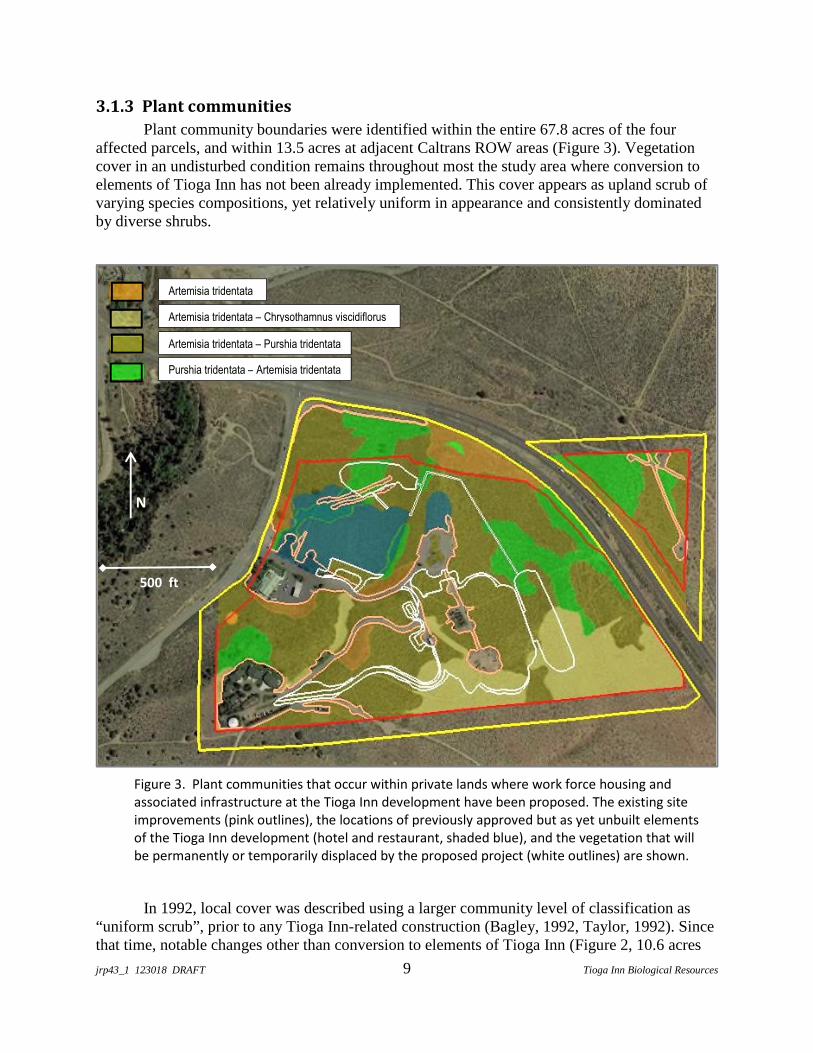
jrp43_1 123018 DRAFT 9 Tioga Inn Biological Resources
3.1.3 Plant communities
Plant community boundaries were identified within the entire 67.8 acres of the fouraffected parcels, and within 13.5 acres at adjacent Caltrans ROW areas (Figure 3). Vegetationcover in an undisturbed condition remains throughout most the study area where conversion toelements of Tioga Inn has not been already implemented. This cover appears as upland scrub ofvarying species compositions, yet relatively uniform in appearance and consistently dominatedby diverse shrubs.
Figure 3. Plant communities that occur within private lands where work force housing andassociated infrastructure at the Tioga Inn development have been proposed. The existing siteimprovements (pink outlines), the locations of previously approved but as yet unbuilt elementsof the Tioga Inn development (hotel and restaurant, shaded blue), and the vegetation that willbe permanently or temporarily displaced by the proposed project (white outlines) are shown.
In 1992, local cover was described using a larger community level of classification as“uniform scrub”, prior to any Tioga Inn-related construction (Bagley, 1992, Taylor, 1992). Sincethat time, notable changes other than conversion to elements of Tioga Inn (Figure 2, 10.6 acres
Artemisia tridentata
Artemisia tridentata – Chrysothamnus viscidiflorus
Artemisia tridentata – Purshia tridentata
Purshia tridentata – Artemisia tridentata
N
500 ft

jrp43_1 123018 DRAFT 10 Tioga Inn Biological Resources
permanently devegetated) are 1) widening of Hwy 395 to four lanes, which necessitated sloperecontouring within the Caltrans ROW (Figure 2, 2.2 acres), and 2) complete vegetation removaland change to weedy, early seral plant cover as mapped within the eastern margin of the site,which occurred when wildfire burned much of lower Lee Vining Canyon in May 2000 (Figure 2,14.8 acres). These areas currently support some native scrub species, but the recovering canopyis less uniform. As of 2017, most warrant classification as alliances that distinctly differ fromthose found within undisturbed portions of the site (Figure 3). In the burn zone especially, theslowly recovering vegetation now is of low diversity, and usually is dominated by invasive, non-native grasses. The created scar thus visibly persists. The contiguous fire scar extends 3000-4000feet southward and eastward, and about two miles westward into Lee Vining Canyon. Incomparison to the relatively uniform and undisturbed vegetation that was found in 1992, thescars represent the likely most significant change – nearly two decades of ongoing contrast at thelandscape level; the project area now has become isolated within a landscape where the alteredvegetation cover’s potential to provide resources and other ecological functions has becomesignificantly reduced.
Pumice-dominated soils were encountered frequently along vegetation survey transects.No strictly pumice-associated plant communities occur (these types are considered uncommon).There are no scrub canopy openings that feature flats or internally drained basins, nor are thereany species assemblages that are dominated by western needlegrass (Stipa occidentalis) or Parryrabbitbrush (Ericameria parryi), as would be expected if the Sensitive community Mono PumiceFlat occurs.
3.1.3.1 Big Sagebrush Scrub
Big sagebrush (Artemisia tridentata ssp. vaseyana) is dominant or co-dominant throughoutthe majority of the study area. Three Big Sagebrush Scrub alliances were mapped in June 2017(Table 3), distinguishing stands where big sagebrush was the only dominant shrub in the canopy(CDFW alliance code #35.110.02) from stands that are co-dominated by antelope bitterbrush(Purshia tridentata, alliance #35.110.07) or by yellow rabbitbrush (Chrysothamnus viscidiflorus,alliance #35.110.12) at somewhat lesser frequencies. Big Sagebrush Scrub canopies on averageare 2-3 feet tall and provide 20-30% absolute living cover. Absolute live cover provided wherethis community has re-established within the wildfire scar is a comparably patchier 1-10%. Thecommunity’s height also is reduced, averaging 1-2 ft within the wildfire scar mainly due to theincreased prevalence of low-statured yellow rabbitbrush. Big Sagebrush Scrub is a common andwidespread plant community that occurs throughout Mono County and the Great Basin.
Within the study area, yellow rabbitbrush distribution as a canopy co-dominant is restrictedto slopes that were devegetated by wildfire in 2000. Rubber rabbitbrush (Ericameria nauseosa)and desert peach (Prunus andersonii), which are typically minor shrub canopy components, alsohave become established at higher relative frequencies in burned areas. However, bitterbrushrecruitment subsequent to burning has been consistently low, and this shrub’s frequency withinthe wildfire scar is now consistently less than 1% of the total living shrub canopy.
Trees are a minor component of the native vegetation, occurring in Big Sagebrush Scrub asscattered Jeffrey pines (Pinus jeffreyi) or singleleaf pinyon (P. monophylla). The only other treesthat were noted within the study area are the numerous sapling to mature-sized quaking aspen(Populus tremuloides) that have been planted into irrigated landscape areas around existing roadsand buildings. Riparian zone dominant trees that are present within the nearby Lee Vining Creek
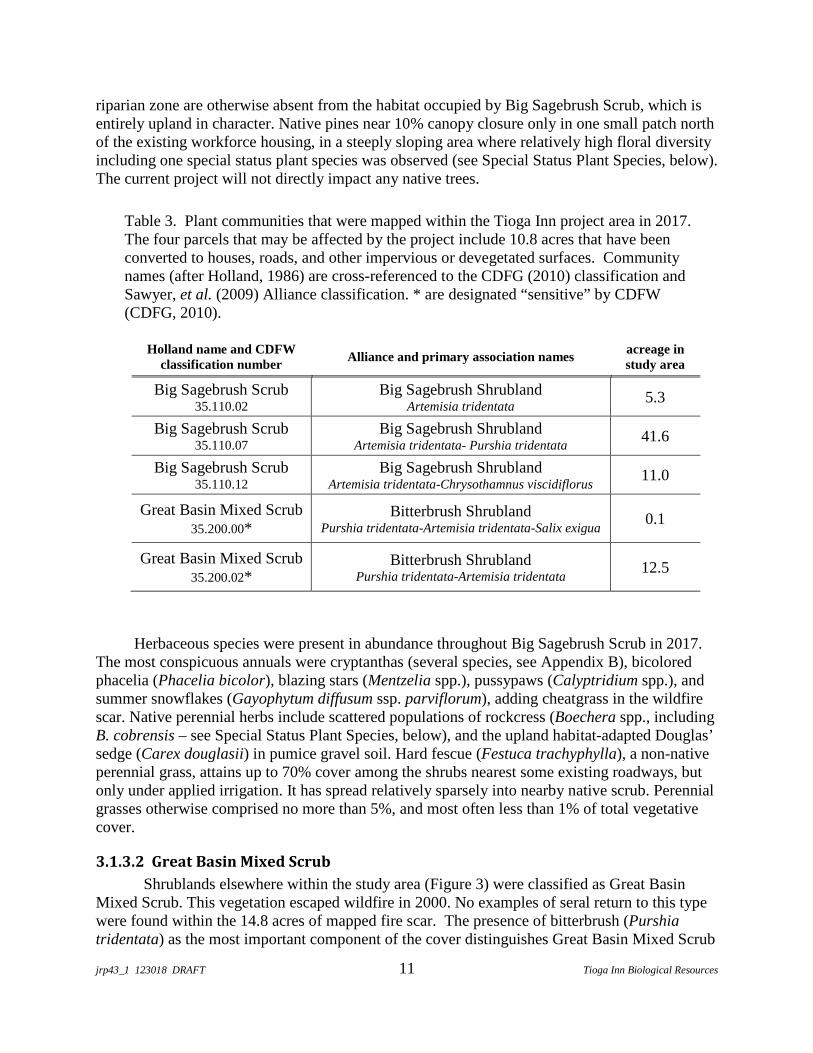
jrp43_1 123018 DRAFT 11 Tioga Inn Biological Resources
riparian zone are otherwise absent from the habitat occupied by Big Sagebrush Scrub, which isentirely upland in character. Native pines near 10% canopy closure only in one small patch northof the existing workforce housing, in a steeply sloping area where relatively high floral diversityincluding one special status plant species was observed (see Special Status Plant Species, below).The current project will not directly impact any native trees.
Table 3. Plant communities that were mapped within the Tioga Inn project area in 2017.The four parcels that may be affected by the project include 10.8 acres that have beenconverted to houses, roads, and other impervious or devegetated surfaces. Communitynames (after Holland, 1986) are cross-referenced to the CDFG (2010) classification andSawyer, et al. (2009) Alliance classification. * are designated “sensitive” by CDFW(CDFG, 2010).
Holland name and CDFWclassification number
Alliance and primary association namesacreage instudy area
Big Sagebrush Scrub35.110.02
Big Sagebrush ShrublandArtemisia tridentata
5.3
Big Sagebrush Scrub35.110.07
Big Sagebrush ShrublandArtemisia tridentata- Purshia tridentata
41.6
Big Sagebrush Scrub35.110.12
Big Sagebrush ShrublandArtemisia tridentata-Chrysothamnus viscidiflorus
11.0
Great Basin Mixed Scrub35.200.00*
Bitterbrush ShrublandPurshia tridentata-Artemisia tridentata-Salix exigua
0.1
Great Basin Mixed Scrub35.200.02*
Bitterbrush ShrublandPurshia tridentata-Artemisia tridentata
12.5
Herbaceous species were present in abundance throughout Big Sagebrush Scrub in 2017.The most conspicuous annuals were cryptanthas (several species, see Appendix B), bicoloredphacelia (Phacelia bicolor), blazing stars (Mentzelia spp.), pussypaws (Calyptridium spp.), andsummer snowflakes (Gayophytum diffusum ssp. parviflorum), adding cheatgrass in the wildfirescar. Native perennial herbs include scattered populations of rockcress (Boechera spp., includingB. cobrensis – see Special Status Plant Species, below), and the upland habitat-adapted Douglas’sedge (Carex douglasii) in pumice gravel soil. Hard fescue (Festuca trachyphylla), a non-nativeperennial grass, attains up to 70% cover among the shrubs nearest some existing roadways, butonly under applied irrigation. It has spread relatively sparsely into nearby native scrub. Perennialgrasses otherwise comprised no more than 5%, and most often less than 1% of total vegetativecover.
3.1.3.2 Great Basin Mixed Scrub
Shrublands elsewhere within the study area (Figure 3) were classified as Great BasinMixed Scrub. This vegetation escaped wildfire in 2000. No examples of seral return to this typewere found within the 14.8 acres of mapped fire scar. The presence of bitterbrush (Purshiatridentata) as the most important component of the cover distinguishes Great Basin Mixed Scrub
jrp43_1 123018 DRAFT 12 Tioga Inn Biological Resources
from the surrounding Big Sagebrush Scrub. In contrast to Big Sagebrush Scrub, it exhibits densercover, greater height, and more uniform stand maturity. Great Basin Mixed Scrub and areas thatare separated here as Big Sagebrush Scrub alliances were previously classified as Great BasinSagebrush Scrub using an older system (Taylor, 1992); differences in naming do not indicate aknown substantial change in stand characteristics since the 1993 EIR. Great Basin Mixed Scrubis considered Sensitive by CDFW (CDFG, 2010). There has been a regional trend toward loss ofthis community type due to wildfires within Mono County (Sawyer, et al., 2009, Mono County,2015).
Total living cover in Great Basin Mixed Scrub, which generally was classifiable as anantelope bitterbrush – big sagebrush alliance (#35.200.02) within the study area, was 30-40% inJune 2017. Average height was 3-4 feet. Bitterbrush distribution is uniform, appearing dense,with individuals occasionally reaching a height of 10 feet. Ecotones with Big Sagebrush Scrubare diffuse but visibly evident, becoming abrupt only at fire scar edges. In 2017, native annualand perennial herbs and grasses observed to be abundant in Big Sagebrush Scrub were equallyrepresented in the Great Basin Mixed Scrub understory, but the overall observed diversity waslower (Appendix B).
One isolated occurrence of Great Basin Mixed Scrub located between the site of therestaurant and the southern edge of Hwy 395 (Figure 3) is locally unusual due to the presence ofsandbar willow (Salix exigua) in the shrub canopy. Sandbar willow and big sagebrush are the co-dominant species with antelope bitterbrush. This alliance (#35.200.00) is not found elsewherewithin the study area. The occurrence is mid-slope within a large area (approximately 2.3 acres)that was devegetated and re-contoured to accommodate Hwy 395 widening in the early 2000’s.Sandbar willow is considered to be facultatively (i.e., not obligately) adapted to wetlands habitatconditions (U.S. Army Corps of Engineers, 2012). Its presence likely signals that an area ofgroundwater accumulation was intercepted during recontouring. The willow stems at thisoccurrence may represent a single, clonally reproducing individual, which in 2017 exhibited poorvigor and some dieback. There were no indications that would suggest this assemblage signalsthe presence of seasonal or even ephemeral artesian spring flow, as there were no surfacemoisture changes, ponding depressions, animal trails, or incised discharge and outflow areasindicating spring function, despite local precipitation prior to the survey that during October2017 through May 2018 neared 200% of the normal annual amount.
3.1.4 Special Status Plant Species
Few-flowered woollystar (Eriastrum sparsiflorum) were detected at two locations northof Hwy 395, among extensive annual woollystar populations that included spotted woollystar (E.signatum), and also diffuse woollystar (E. diffusum). Plants bearing the stalked glands expectedof E. sparsiflorum were not found among several that were checked south of Hwy 395. There issome possibility that the local population does not extend to the south of Hwy 395 in the studyarea. Recent separation of E. signatum from E. sparsiflorum has led to the formerly consideredcommon E. sparsiflorum being added to CNPS’ watchlist 4.3 (CNPS, 2018), meaning a speciesthat currently is considered limited in distribution at least within California, having no currentknown threats to its continued existence in the state. Few-flowered woollystar, which apparentlyis secure from extinction in California (CDFW, 2018b), has no additional legal status under thestate or federal Endangered Species Acts (Table 2).
jrp43_1 123018 DRAFT 13 Tioga Inn Biological Resources
One distinct population of Masonic rockcress (Boechera cobrensis) was found near thenorthern edge of the existing workforce housing, on the steep slope between the housing and theexisting gas station (Figure 4). Individuals were found in relatively open Big Sagebrush Scrub aswell as in partial shade cast by Jeffrey pines in denser Great Basin Mixed Scrub. It was possibleto map the extents of this population with good accuracy, as the plants’ rosettes are distinctiveand most individuals were blooming at the time of survey. A total of 132 individuals were foundin an area of 1.2 acres on May 19, 2018. Masonic rockcress identification and separation fromother rockcress species occurring within the study area was based in large part on the plantsexhibiting relatively small, white petals (consistently < 8 mm), and spreading-descending fruitsborne on glabrous pedicels, a combination of characteristics that is not expected of other locallyoccurring Boechera species.
No other populations of special status plant species were found. Other species observedin 2017 are considered locally and regionally common in uplands habitats. No members of thedistinctive genera Allium, Chaetadelpha, Cusickiella, Eremothera, Streptanthus, Tetradymia, orViola were found during the May-June survey. Newberry’s milkvetch (Astragalus newberryi var.newberryi) was separated from the potentially occurring Mono milkvetch (A. monoensis) by itsdensely cespitose growth form and cottonball-hairy fruits. Mono milkvetch would exhibit moreopen growth and fruits that appear much less hairy, as was observed at the reference populationeast of June Lake (blooming and setting fruit on June 4, 2017). The occurring silver lupines(Lupinus argenteus vars.) were readily separated from potentially occurring Mono Lake lupine(L. duranii) by growth form. Occurring lupines were invariably 2 dm or more in height, muchtaller than would be expected of Mono Lake lupine. Plants of the blazing star genus Mentzeliawere relatively abundant in 2017, but Torrey blazing star (M. torreyi) was not seen. Populationsseen within the study area were clearly annuals of relatively diminutive stature, not the relativelycoarse perennial plants that would be expected if Torrey blazing star was present. In all, 86species (Appendix B) including 8 non-native species (Table 4), representing 22 plant families,were encountered in 2017.
3.1.5 Non-Native Plants (Weeds)
Non-native plants (Table 4) are prominent within the study area, especially in areas thathave been recently mechanically disturbed and within the wildfire scar. Non-natives that arerestricted to roadsides and other highly disturbed areas are in the minority. Hard fescue (Festucatrachyphylla) is a perennial landscape grass that historically was applied near developed portionsof the study area, likely for slope stabilization. In recent decades, it has spread only slightly outbeyond the reach of overhead irrigation, and likely would not persist if irrigation ceased for oneor two growing seasons. Hornseed buttercup (Ranunculus testiculatus), and common knotweed(Polygonum aviculare ssp. depressum) populations are currently abundant but their distributionsare restricted to roadsides along SR 120 and Hwy 395. Except for hard fescue, these and all othernon-native species present in the study area are considered to have become firmly established allalong the alignment of Hwy 395 in the Lee Vining area and elsewhere in Mono County (MonoCo. Planning Dept., 2015). Because there is no foreseeable plan or method to control populationsassociated with the public transportation corridors that abut and cross through the study area, it isvery likely that any control efforts applied to seek eradication of the existing weed populationswithin the study area would be ultimately frustrated by a constant and unmanageable restockingof the weed seedbank.
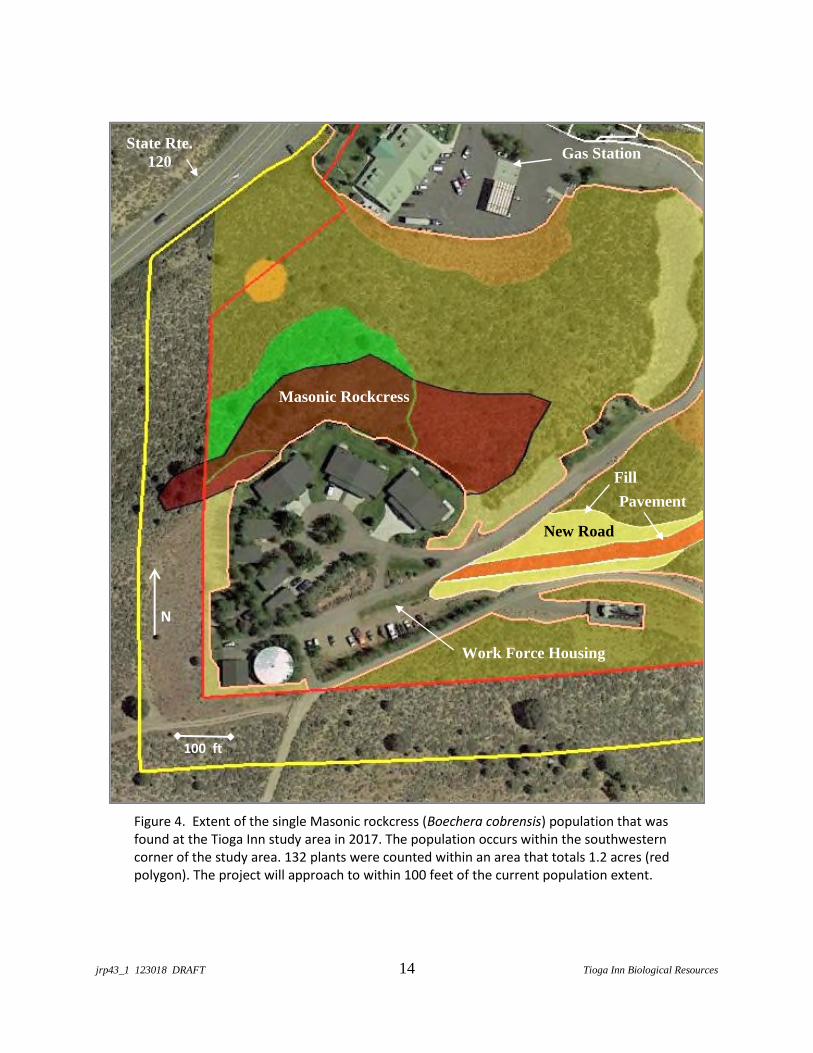
jrp43_1 123018 DRAFT 14 Tioga Inn Biological Resources
Figure 4. Extent of the single Masonic rockcress (Boechera cobrensis) population that wasfound at the Tioga Inn study area in 2017. The population occurs within the southwesterncorner of the study area. 132 plants were counted within an area that totals 1.2 acres (redpolygon). The project will approach to within 100 feet of the current population extent.
State Rte.120
Gas Station
Work Force Housing
Masonic Rockcress
N
100 ft
New Road
Fill
Pavement
jrp43_1 123018 DRAFT 15 Tioga Inn Biological Resources
Five of the eight non-native species that were found in 2017 have already invaded intoplant communities of the relatively less disturbed portions of the study area, and so are becomingmembers of the upland assemblage. The project has some potential to cause the further spread oftansy mustard (Descurainia sophia), Russian thistle (Salsola tragus), redstem filaree (Erodiumcicutarium), and tumble mustard (Sisymbrium altissimum), which currently are present in sparsenumbers generally near existing study area developments and the adjacent public transportationcorridors. All are annual species that produce abundant, easily transported seed. Some of thesespecies are considered noxious or invasive by the California Department of Food and Agriculture(USDA, 2010) or California Invasive Plant Council (2018). The naturalized annual cheat grass(Bromus tectorum) has invaded American West landscapes totaling millions of acres. This grassis associated with increased fire spread and frequency in native shrublands. Its abundance in thestudy area in 2017 was far greater than any other species, native or non-native, and it has locallyattained a distribution that encompasses the entire study area and the nearby landscape.
Table 4. Non-native species observed within the survey area in 2017. † indicates speciespresent only at roadsides and within other recently disturbed locations. Other species arefound throughout the study area in native upland habitats or in irrigated (landscaped)habitats. Weed rating is potential invasiveness as rated by the California Integrated PlantCouncil (Cal-IPC, 2018), and federally recognized noxious weed rating (USDA, 2010).
Non-Native Species Weed Rating
cheat grass Bromus tectorum Cal-IPC High
tansy mustard Descurainia sophia Cal-IPC Limited
redstem filaree Erodium cicutarium Cal-IPC Limited
† hard fescue Festuca trachyphylla
† hornseed buttercup Ranunculus testiculatus
† common knotweed Polygonum aviculare
Russian thistle Salsola tragusCal-IPC Limited
USDA Noxious list C
tumble mustard Sisymbrium altissimum
Vegetative return or succession to the condition of self-sustaining Big Sagebrush Scrub orGreat Basin Mixed Scrub appears to be delayed or patchily arrested in areas with the heaviestcheat grass infestation. This condition was observed within much of the study area mapped here(Figure 3) as seral Big Sagebrush Scrub, especially where Artemisia tridentata-Chrysothamnusviscidiflorus alliance stands have developed. This species was present in 1992 at relatively lowabundance (Taylor, 1992). In the 18th growing season following fire, the cheat grass populationnow remains far more robust than any other species that has colonized the burned area. The 2017survey found that cheat grass forms nearly pure stands of up to 2 acres within the wildfire scar,which are assumed to be (slowly) transitioning to native scrub (studies describing long-termresponse monitoring of this problem in the Mono Basin could not be found). Such patches wouldbe classifiable as Non-Native Annual Grassland in more permanent contexts in central California(Sawyer, et al., 2009). Because upland plant communities are made more susceptible to wildfire
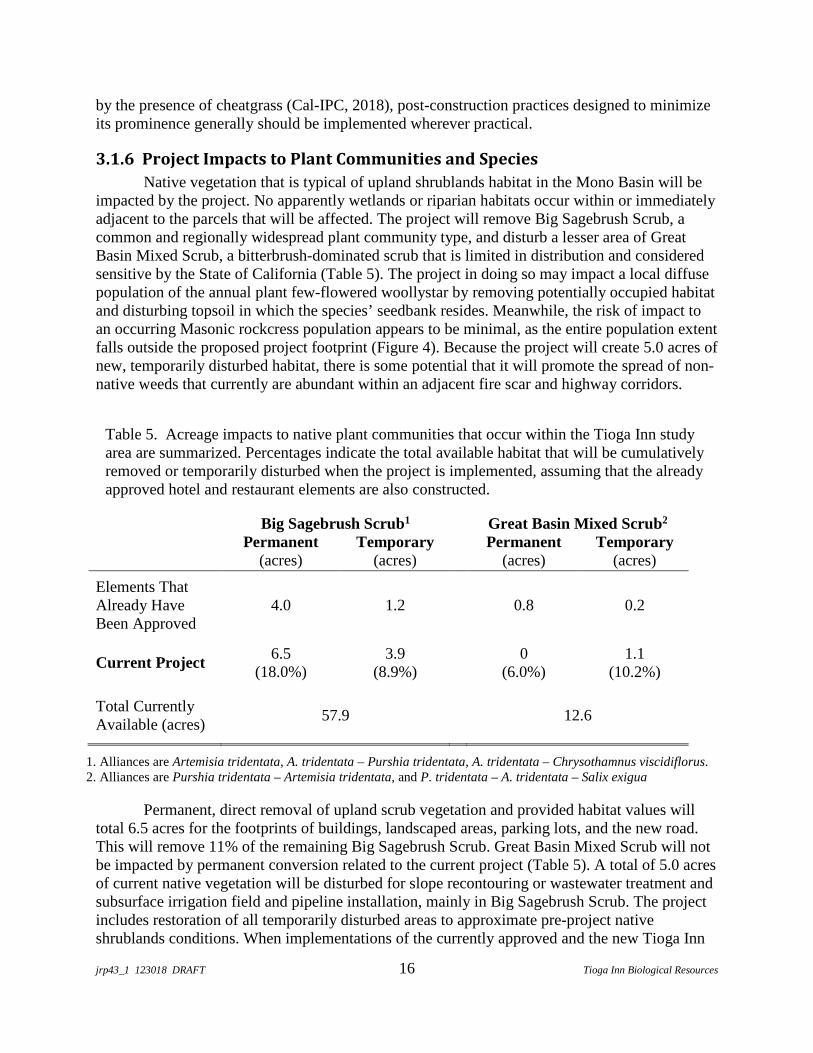
jrp43_1 123018 DRAFT 16 Tioga Inn Biological Resources
by the presence of cheatgrass (Cal-IPC, 2018), post-construction practices designed to minimizeits prominence generally should be implemented wherever practical.
3.1.6 Project Impacts to Plant Communities and Species
Native vegetation that is typical of upland shrublands habitat in the Mono Basin will beimpacted by the project. No apparently wetlands or riparian habitats occur within or immediatelyadjacent to the parcels that will be affected. The project will remove Big Sagebrush Scrub, acommon and regionally widespread plant community type, and disturb a lesser area of GreatBasin Mixed Scrub, a bitterbrush-dominated scrub that is limited in distribution and consideredsensitive by the State of California (Table 5). The project in doing so may impact a local diffusepopulation of the annual plant few-flowered woollystar by removing potentially occupied habitatand disturbing topsoil in which the species’ seedbank resides. Meanwhile, the risk of impact toan occurring Masonic rockcress population appears to be minimal, as the entire population extentfalls outside the proposed project footprint (Figure 4). Because the project will create 5.0 acres ofnew, temporarily disturbed habitat, there is some potential that it will promote the spread of non-native weeds that currently are abundant within an adjacent fire scar and highway corridors.
Table 5. Acreage impacts to native plant communities that occur within the Tioga Inn studyarea are summarized. Percentages indicate the total available habitat that will be cumulativelyremoved or temporarily disturbed when the project is implemented, assuming that the alreadyapproved hotel and restaurant elements are also constructed.
Big Sagebrush Scrub1 Great Basin Mixed Scrub2
Permanent(acres)
Temporary(acres)
Permanent(acres)
Temporary(acres)
Elements ThatAlready HaveBeen Approved
4.0 1.2 0.8 0.2
Current Project6.5
(18.0%)3.9
(8.9%)0
(6.0%)1.1
(10.2%)
Total CurrentlyAvailable (acres)
57.9 12.6
1. Alliances are Artemisia tridentata, A. tridentata – Purshia tridentata, A. tridentata – Chrysothamnus viscidiflorus.2. Alliances are Purshia tridentata – Artemisia tridentata, and P. tridentata – A. tridentata – Salix exigua
Permanent, direct removal of upland scrub vegetation and provided habitat values willtotal 6.5 acres for the footprints of buildings, landscaped areas, parking lots, and the new road.This will remove 11% of the remaining Big Sagebrush Scrub. Great Basin Mixed Scrub will notbe impacted by permanent conversion related to the current project (Table 5). A total of 5.0 acresof current native vegetation will be disturbed for slope recontouring or wastewater treatment andsubsurface irrigation field and pipeline installation, mainly in Big Sagebrush Scrub. The projectincludes restoration of all temporarily disturbed areas to approximate pre-project nativeshrublands conditions. When implementations of the currently approved and the new Tioga Inn
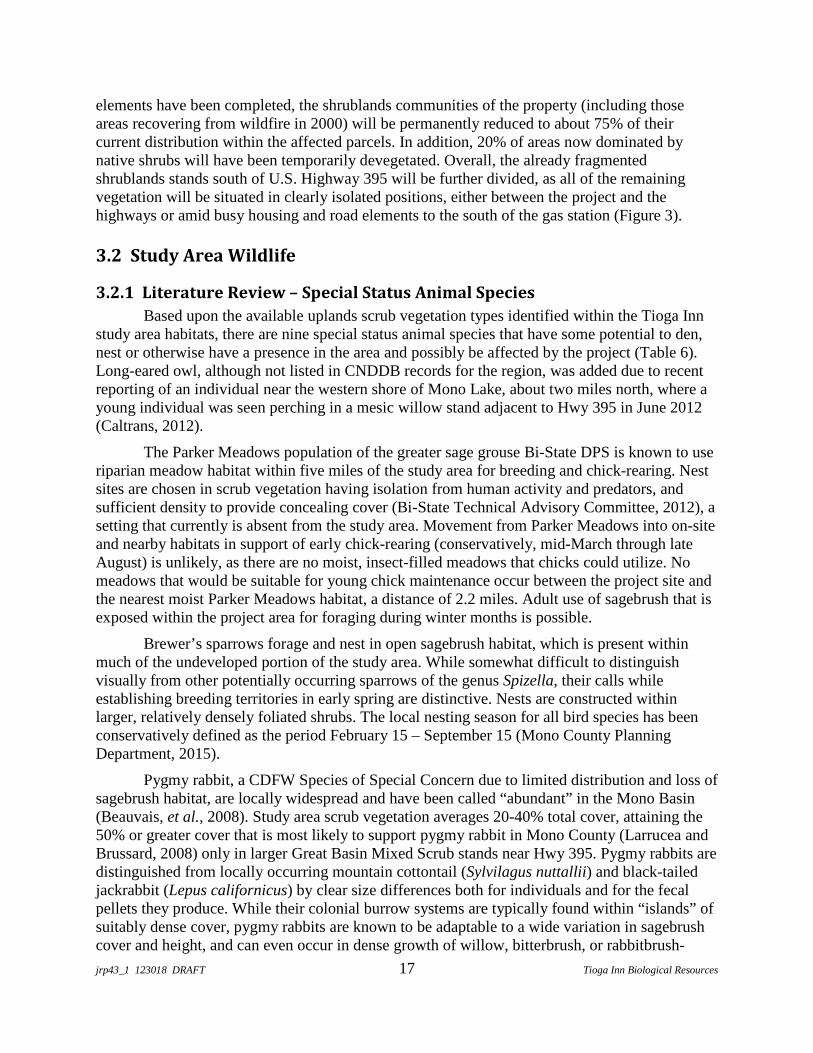
jrp43_1 123018 DRAFT 17 Tioga Inn Biological Resources
elements have been completed, the shrublands communities of the property (including thoseareas recovering from wildfire in 2000) will be permanently reduced to about 75% of theircurrent distribution within the affected parcels. In addition, 20% of areas now dominated bynative shrubs will have been temporarily devegetated. Overall, the already fragmentedshrublands stands south of U.S. Highway 395 will be further divided, as all of the remainingvegetation will be situated in clearly isolated positions, either between the project and thehighways or amid busy housing and road elements to the south of the gas station (Figure 3).
3.2 Study Area Wildlife
3.2.1 Literature Review – Special Status Animal Species
Based upon the available uplands scrub vegetation types identified within the Tioga Innstudy area habitats, there are nine special status animal species that have some potential to den,nest or otherwise have a presence in the area and possibly be affected by the project (Table 6).Long-eared owl, although not listed in CNDDB records for the region, was added due to recentreporting of an individual near the western shore of Mono Lake, about two miles north, where ayoung individual was seen perching in a mesic willow stand adjacent to Hwy 395 in June 2012(Caltrans, 2012).
The Parker Meadows population of the greater sage grouse Bi-State DPS is known to useriparian meadow habitat within five miles of the study area for breeding and chick-rearing. Nestsites are chosen in scrub vegetation having isolation from human activity and predators, andsufficient density to provide concealing cover (Bi-State Technical Advisory Committee, 2012), asetting that currently is absent from the study area. Movement from Parker Meadows into on-siteand nearby habitats in support of early chick-rearing (conservatively, mid-March through lateAugust) is unlikely, as there are no moist, insect-filled meadows that chicks could utilize. Nomeadows that would be suitable for young chick maintenance occur between the project site andthe nearest moist Parker Meadows habitat, a distance of 2.2 miles. Adult use of sagebrush that isexposed within the project area for foraging during winter months is possible.
Brewer’s sparrows forage and nest in open sagebrush habitat, which is present withinmuch of the undeveloped portion of the study area. While somewhat difficult to distinguishvisually from other potentially occurring sparrows of the genus Spizella, their calls whileestablishing breeding territories in early spring are distinctive. Nests are constructed withinlarger, relatively densely foliated shrubs. The local nesting season for all bird species has beenconservatively defined as the period February 15 – September 15 (Mono County PlanningDepartment, 2015).
Pygmy rabbit, a CDFW Species of Special Concern due to limited distribution and loss ofsagebrush habitat, are locally widespread and have been called “abundant” in the Mono Basin(Beauvais, et al., 2008). Study area scrub vegetation averages 20-40% total cover, attaining the50% or greater cover that is most likely to support pygmy rabbit in Mono County (Larrucea andBrussard, 2008) only in larger Great Basin Mixed Scrub stands near Hwy 395. Pygmy rabbits aredistinguished from locally occurring mountain cottontail (Sylvilagus nuttallii) and black-tailedjackrabbit (Lepus californicus) by clear size differences both for individuals and for the fecalpellets they produce. While their colonial burrow systems are typically found within “islands” ofsuitably dense cover, pygmy rabbits are known to be adaptable to a wide variation in sagebrushcover and height, and can even occur in dense growth of willow, bitterbrush, or rabbitbrush-
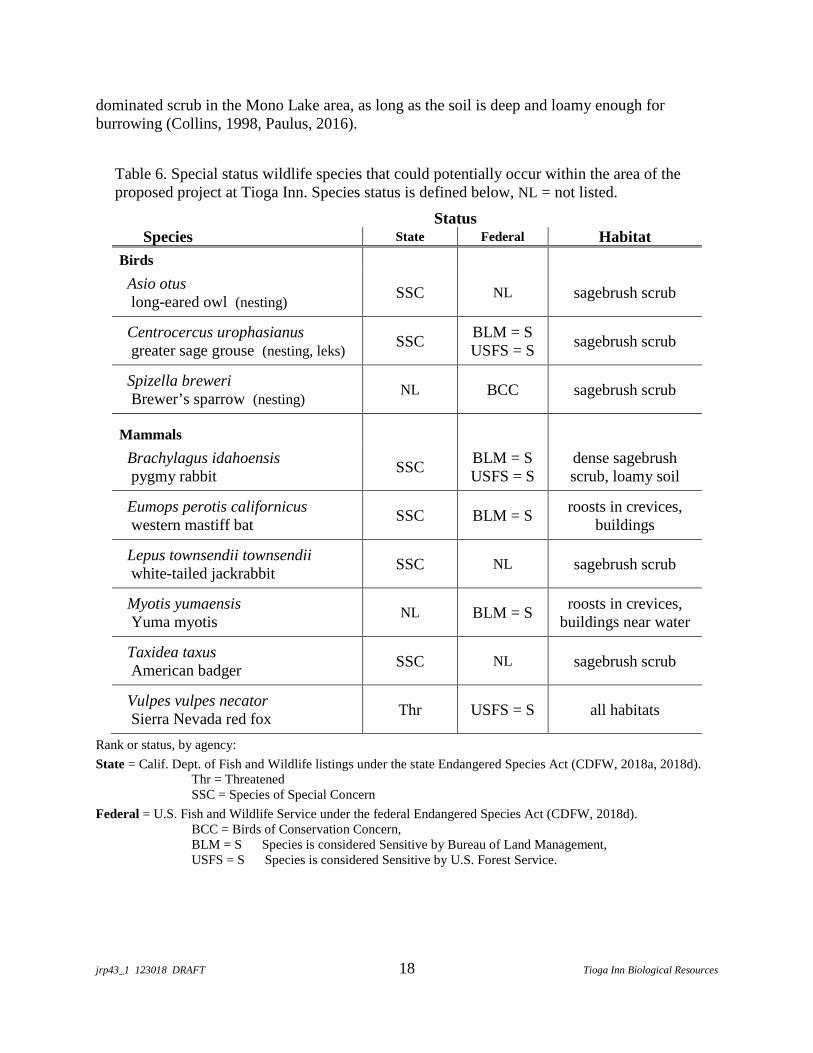
jrp43_1 123018 DRAFT 18 Tioga Inn Biological Resources
dominated scrub in the Mono Lake area, as long as the soil is deep and loamy enough forburrowing (Collins, 1998, Paulus, 2016).
Table 6. Special status wildlife species that could potentially occur within the area of theproposed project at Tioga Inn. Species status is defined below, NL = not listed.
StatusSpecies State Federal Habitat
Birds
Asio otuslong-eared owl (nesting)
SSC NL sagebrush scrub
Centrocercus urophasianusgreater sage grouse (nesting, leks)
SSCBLM = SUSFS = S
sagebrush scrub
Spizella breweriBrewer’s sparrow (nesting)
NL BCC sagebrush scrub
Mammals
Brachylagus idahoensispygmy rabbit
SSCBLM = SUSFS = S
dense sagebrushscrub, loamy soil
Eumops perotis californicuswestern mastiff bat
SSC BLM = Sroosts in crevices,
buildings
Lepus townsendii townsendiiwhite-tailed jackrabbit
SSC NL sagebrush scrub
Myotis yumaensisYuma myotis
NL BLM = Sroosts in crevices,
buildings near water
Taxidea taxusAmerican badger
SSC NL sagebrush scrub
Vulpes vulpes necatorSierra Nevada red fox
Thr USFS = S all habitats
Rank or status, by agency:
State = Calif. Dept. of Fish and Wildlife listings under the state Endangered Species Act (CDFW, 2018a, 2018d).Thr = ThreatenedSSC = Species of Special Concern
Federal = U.S. Fish and Wildlife Service under the federal Endangered Species Act (CDFW, 2018d).BCC = Birds of Conservation Concern,BLM = S Species is considered Sensitive by Bureau of Land Management,USFS = S Species is considered Sensitive by U.S. Forest Service.
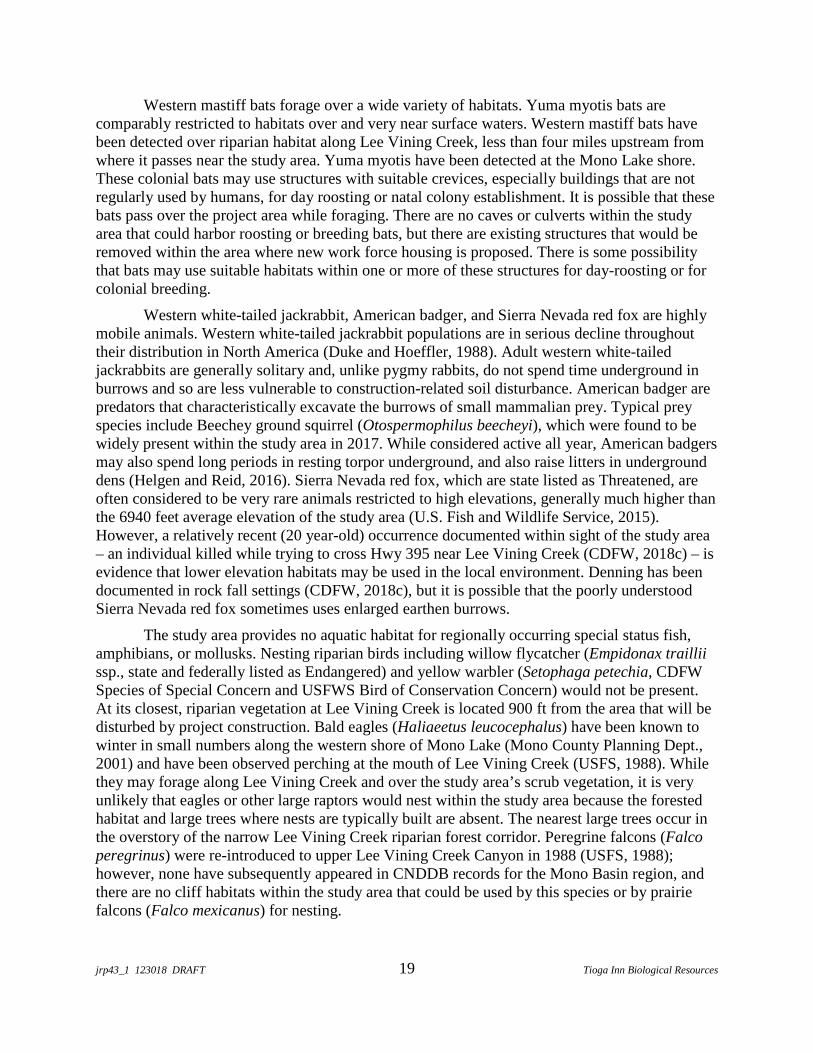
jrp43_1 123018 DRAFT 19 Tioga Inn Biological Resources
Western mastiff bats forage over a wide variety of habitats. Yuma myotis bats arecomparably restricted to habitats over and very near surface waters. Western mastiff bats havebeen detected over riparian habitat along Lee Vining Creek, less than four miles upstream fromwhere it passes near the study area. Yuma myotis have been detected at the Mono Lake shore.These colonial bats may use structures with suitable crevices, especially buildings that are notregularly used by humans, for day roosting or natal colony establishment. It is possible that thesebats pass over the project area while foraging. There are no caves or culverts within the studyarea that could harbor roosting or breeding bats, but there are existing structures that would beremoved within the area where new work force housing is proposed. There is some possibilitythat bats may use suitable habitats within one or more of these structures for day-roosting or forcolonial breeding.
Western white-tailed jackrabbit, American badger, and Sierra Nevada red fox are highlymobile animals. Western white-tailed jackrabbit populations are in serious decline throughouttheir distribution in North America (Duke and Hoeffler, 1988). Adult western white-tailedjackrabbits are generally solitary and, unlike pygmy rabbits, do not spend time underground inburrows and so are less vulnerable to construction-related soil disturbance. American badger arepredators that characteristically excavate the burrows of small mammalian prey. Typical preyspecies include Beechey ground squirrel (Otospermophilus beecheyi), which were found to bewidely present within the study area in 2017. While considered active all year, American badgersmay also spend long periods in resting torpor underground, and also raise litters in undergrounddens (Helgen and Reid, 2016). Sierra Nevada red fox, which are state listed as Threatened, areoften considered to be very rare animals restricted to high elevations, generally much higher thanthe 6940 feet average elevation of the study area (U.S. Fish and Wildlife Service, 2015).However, a relatively recent (20 year-old) occurrence documented within sight of the study area– an individual killed while trying to cross Hwy 395 near Lee Vining Creek (CDFW, 2018c) – isevidence that lower elevation habitats may be used in the local environment. Denning has beendocumented in rock fall settings (CDFW, 2018c), but it is possible that the poorly understoodSierra Nevada red fox sometimes uses enlarged earthen burrows.
The study area provides no aquatic habitat for regionally occurring special status fish,amphibians, or mollusks. Nesting riparian birds including willow flycatcher (Empidonax trailliissp., state and federally listed as Endangered) and yellow warbler (Setophaga petechia, CDFWSpecies of Special Concern and USFWS Bird of Conservation Concern) would not be present.At its closest, riparian vegetation at Lee Vining Creek is located 900 ft from the area that will bedisturbed by project construction. Bald eagles (Haliaeetus leucocephalus) have been known towinter in small numbers along the western shore of Mono Lake (Mono County Planning Dept.,2001) and have been observed perching at the mouth of Lee Vining Creek (USFS, 1988). Whilethey may forage along Lee Vining Creek and over the study area’s scrub vegetation, it is veryunlikely that eagles or other large raptors would nest within the study area because the forestedhabitat and large trees where nests are typically built are absent. The nearest large trees occur inthe overstory of the narrow Lee Vining Creek riparian forest corridor. Peregrine falcons (Falcoperegrinus) were re-introduced to upper Lee Vining Creek Canyon in 1988 (USFS, 1988);however, none have subsequently appeared in CNDDB records for the Mono Basin region, andthere are no cliff habitats within the study area that could be used by this species or by prairiefalcons (Falco mexicanus) for nesting.

jrp43_1 123018 DRAFT 20 Tioga Inn Biological Resources
3.2.2 Methods Used to Survey for Special Status Animal Species
Upland scrub throughout the survey area was surveyed for the presence of enlarged ornetworked (warren) burrows that potentially could be occupied by special status mammals. OnMay 17-21 and June 4-5, 2017, the GPS coordinates (± 1 meter) of all such burrows, apparentlyoccupied or not, were recorded while walking widely wandering survey transects. Transects werespaced at intervals of 50 feet across the entire study area (Figure 2). Areas of dense vegetationwere inspected closely for warrens and other sign of pygmy rabbit presence. Identifying signsand indications recent wildlife use were recorded at each burrow, wherever they were found. Allspecies that were identified through sightings or by studying sign while walking transects wererecorded.
Occurring birds were inventoried during plant and wildlife transect surveys. Directedsurveys were also performed in order to determine which populations were using project areahabitats for nesting. Beginning at dawn on the successive mornings of May 21- 24, 2017, on-sitebreeding populations were identified and mapped where possible, based upon observations ofterritorial display and calling, and repeated flight to a likely suitable nest site. All large trees, aswell as the existing wireless telecommunications tower and power transmission poles in the area,were checked during the 2017 field surveys for large stick nest structures attributable to raptors.Existing buildings (some with bird feeding stations) that are located within and near the projectarea were checked for bird nests or exhibitions of nesting behavior.
During the evening hours of May 21, the aerial habitat where new work force housing hasbeen proposed was surveyed for bat presence. Existing buildings in this area were subsequentlychecked for crevice habitat that could be occupied by day-roosting bats or used as natal sites, andguano accumulations that could signal current use.
3.2.3 Occurring Wildlife
A diverse assemblage of wildlife species was indicated by direct observation or inferredfrom sign found in native scrub habitats remaining within the study area (Appendix C). Highestnative diversity was found among the birds, with 25 species total and four identified as breedingincluding the special status taxon Brewer’s sparrow (Spizella breweri, see Special Status Species,below). Occurring lizards, which were consistently identified as the common species sagebrushlizard (Sceloporus graciosus), were abundant throughout the study area in 2017. Mammals wereidentified mainly through characteristic sign, and in the case of burrowing mammals by burrowsize and configuration. Tracks indicated that mule deer continue to frequent the area, as reportedby Taylor (1992) Mule deer have been regularly observed among the existing housing in springand summer months, foraging at irrigated lawns (D. Dormaille, pers. comm. May 19, 2017).
Birds in particular have become adapted to the current availability of foraging “habitat”and nesting opportunities provided by the existing Tioga Inn food vending and housing facilities.Common ravens (Corvus corax) and California gulls (Larus californicus) spend much time on-site, especially within the western portion of the study area. Potential nesting sites for ravensoccur within the study area in the form of scattered trees, a telecommunications tower with nodeterrents installed, and power transmission poles, but no raven or raptor nests were found in2017. House sparrow (Passer domesticus), a non-native species, was found only in the human-built environment, nesting there also in 2017 at both the store and the work force housing. Onekestrel (Falco sparverius) pair was observed foraging within the study area, later using a nestbox attached to a work force housing unit that overlooks the gas station.

jrp43_1 123018 DRAFT 21 Tioga Inn Biological Resources
3.2.4 Special Status Animal Species
The locally extensive destruction of sagebrush by wildfire, with only sparse re-growth ofsagebrush scrub during the last two decades, has altered much of the terrain abutting the studyarea with regard to utility for nesting birds in general, and for greater sage grouse in particular.Scattered pine trees, as well as relatively lofty buildings, light poles, and overhead power poles,are present in the western and northwestern portions of the affected parcels. They currentlyfunction to provide potential perch positions for birds (ravens, hawks and other raptors) that arepredators of small mammals, Brewer’s sparrows, and sage grouse. Brewer’s sparrows were theonly special status birds that were observed during biological resources surveys conducted inMay and June 2017. No owls were seen during evening surveys and no owl packets were seenupon searching structures and trees. Sage grouse were absent on all survey dates.
Brewer’s sparrows exhibited territorial behavior throughout the eastern and northeasternportions of the property, including the areas where new housing and a road have been proposed.Aggressively calling birds responded to recorded call playbacks by approaching or calling, andthe boundaries of individual territories could be roughly mapped (Figure 5) after observation of
Figure 5. Approximate arrangement of dense Brewer’s sparrow breeding territories detectedwithin the Tioga Inn study area on May 21-24, 2017. Green-tailed towhee were also observedexhibiting territorial breeding behaviors within this same general area, where the vegetation isdominated by sparse to dense sagebrush and other upland shrubs. Seven separate potentialBrewer’s sparrow nesting locations were mapped (blue polygons).
N
U.S. Highway395
200 ft
NewHousing
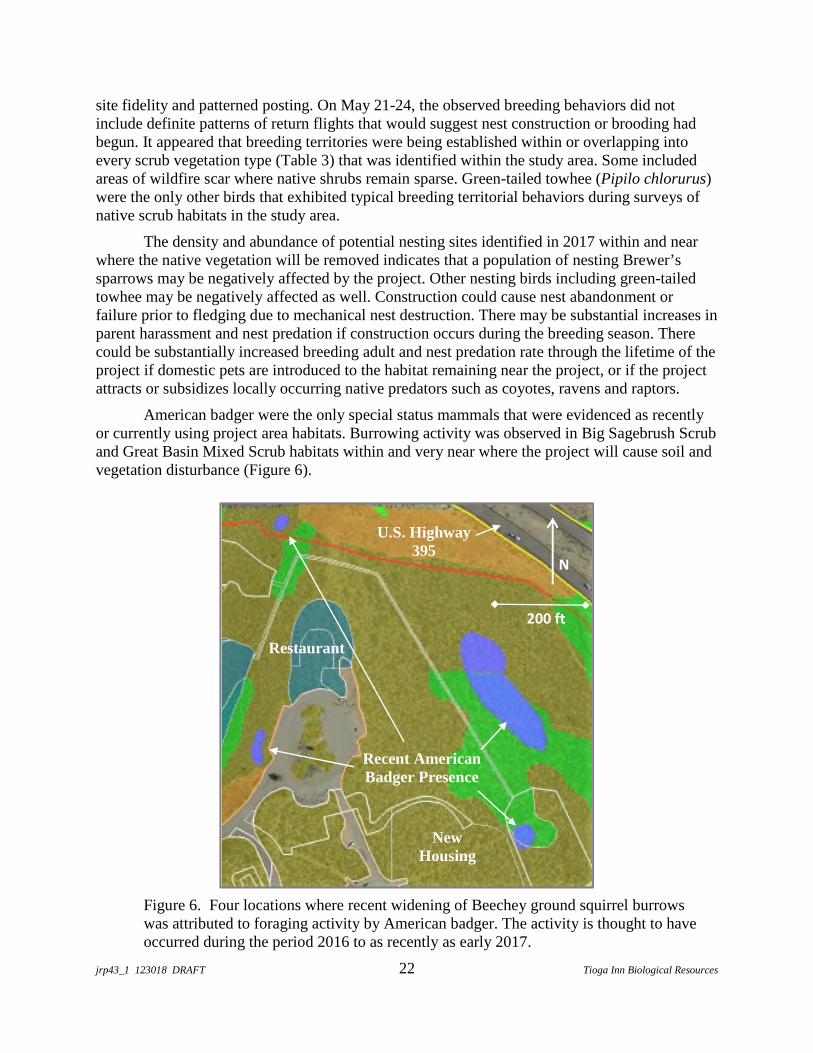
jrp43_1 123018 DRAFT 22 Tioga Inn Biological Resources
site fidelity and patterned posting. On May 21-24, the observed breeding behaviors did notinclude definite patterns of return flights that would suggest nest construction or brooding hadbegun. It appeared that breeding territories were being established within or overlapping intoevery scrub vegetation type (Table 3) that was identified within the study area. Some includedareas of wildfire scar where native shrubs remain sparse. Green-tailed towhee (Pipilo chlorurus)were the only other birds that exhibited typical breeding territorial behaviors during surveys ofnative scrub habitats in the study area.
The density and abundance of potential nesting sites identified in 2017 within and nearwhere the native vegetation will be removed indicates that a population of nesting Brewer’ssparrows may be negatively affected by the project. Other nesting birds including green-tailedtowhee may be negatively affected as well. Construction could cause nest abandonment orfailure prior to fledging due to mechanical nest destruction. There may be substantial increases inparent harassment and nest predation if construction occurs during the breeding season. Therecould be substantially increased breeding adult and nest predation rate through the lifetime of theproject if domestic pets are introduced to the habitat remaining near the project, or if the projectattracts or subsidizes locally occurring native predators such as coyotes, ravens and raptors.
American badger were the only special status mammals that were evidenced as recentlyor currently using project area habitats. Burrowing activity was observed in Big Sagebrush Scruband Great Basin Mixed Scrub habitats within and very near where the project will cause soil andvegetation disturbance (Figure 6).
Figure 6. Four locations where recent widening of Beechey ground squirrel burrowswas attributed to foraging activity by American badger. The activity is thought to haveoccurred during the period 2016 to as recently as early 2017.
N
200 ft
U.S. Highway395
Recent AmericanBadger Presence
Restaurant
NewHousing
jrp43_1 123018 DRAFT 23 Tioga Inn Biological Resources
Burrows found on the property with larger diameter openings were invariably ascribed toBeechey ground squirrel digging. A few had subsequently been widened by predatory digging,which likely had occurred during both 2016 and 2017. Due to the presence of large, parallel clawmarks made while widening squirrel burrow openings, the predatory activity was assigned toAmerican badger. Sign at these burrows did not include tracks, neonatal scat, or other indicationsof recent occupation for denning by larger mammalian predators such as badger or Sierra Nevadared fox. Rockfall habitat that may be more typical for special status fox denning does not occurwithin the study area or nearby.
Bats were commonly observed foraging over the project area during early morning andevening surveys. However, no evidence of bat colony roosting or the establishment of satelliteroosts was found when the existing structures within the project area were searched for habitablecrevices and guano accumulations. Very limited potential roosting habitat (currently unoccupied)was found at structures that the project will directly impact in order to construct new housing.
No rabbit warren areas that would indicate pygmy rabbit presence, or subcanopy formsthat would indicate larger lagomorph presence were detected during transect surveys. Friable,loamy soils that are generally present where warrens have been found locally (Larrucea andBrussard, 2008) are not present except the lowest elevations of the study area near Hwy 395.Large stands with greater than 50% cover are not present, and patch-sized areas of such densityare very uncommon, so searching each dense area thoroughly was possible. Rabbit pellets thatwere observed at accumulations in the study area were consistent with the presence of mountaincottontail rabbit (Sylvilagus nuttallii), a common species. The sizes of these pellets, measured asranging from 9 to 10 mm diameter on average at each of more than 20 sample sites, was notconsistent with the 4-6 mm diameter that would be expected if pygmy rabbit were present, orwith the 10-11 mm diameter that would be expected of western white-tailed jackrabbit(Ulmschneider, 2004).
American badger are highly mobile and adaptive animals. It is unlikely that the removalof a small area of potential foraging habitat will significantly affect the local population. Directimpact to a new residence burrows and to badgers that may be day-denning in enlarged rodentburrows can be avoided if the project footprint and corridors for construction equipment accessare checked for newer rodent burrows excavation or other signs of predatory digging. The holesand excavated dirt piles created by badgers are large and conspicuous, so impact to individualsdue to ground disturbance can be readily avoidable if the pre-survey is conducted immediatelyprior to the start of soil disturbance.
3.2.5 Mule Deer
Mule deer (Odocoileus hemionus) are considered important harvest species by theCDFW. Mule deer herds in Mono County are defined by their pattern of movement betweensummer and winter ranges. Lee Vining Canyon in the vicinity of the Tioga Inn project site isused for migration by a significant fraction of the Casa Diablo Herd (Taylor, 1988). Detailed,repeated-measures study of the magnitude and spatial patterns of deer movement both within andnear the project area has identified a traditional migration corridor that passes within one-halfmile to the south (Taylor, 1992). The project area and nearby slopes are not within an identifiedmigrational holding area, but it is known that summer residency is normal in lower Lee ViningCanyon. It is possible that some deer use the remaining habitat at Tioga Inn for spring and fallmigration during the periods April to June and October to November, and for foraging during
jrp43_1 123018 DRAFT 24 Tioga Inn Biological Resources
summer residency. Studies in support of the original environmental impacts analysis for TiogaInn found that the project area, in contrast to the identified migration corridor, is not highly usedand itself “is of little importance” as a migration corridor (Taylor, 1992). At that time, theperception of a diminished pattern of deer use within the project area was speculatively attributedto disturbance caused by on-site tourist visits and the site’s lack of required concealing cover.
It is reasonable to assume that deer use of the project area has not increased either formigratory passage or for summer residency in the interval since the prior on-site study. As in1992, deer trails were not found during thorough survey of the entire property in 2017. Deer signwas scattered, and only one individual was seen within the project area. More generally, negativeimpacts to the available habitat have brought about changes that do not favor deer use. Uniformscrub dominated by bitterbrush, as described on-site in 1992 (Bagley, 1992), has been displacedand has become highly fragmented due to prior phases of Tioga Inn development. Habitat thathas become degraded due to wildfire extends well off-site, and concealing cover provided by thepinyon woodland of upper slopes adjacent to the project has not recovered. The grouping ofoccupied residences located near Hwy 395 at a distance of 2500 ft outside of the study area hasexpanded, potentially creating new restrictions for wildlife access to the project site from thesouth. Hwy 395 has been expanded and widened, now presenting a divided, four-lane barrier towildlife movement to and from the study area. The disturbed and increasingly isolated habitatwithin and immediately adjacent to the project site appears now to only marginally provide forthe requirements of mule deer that reside in the area or that pass through during migration.
It is possible that the mortality of deer that enter the property could be increased as aresult of project effects that increase crossings of the highways, especially the 4-lane Hwy 395,where collisions can occur. Collision, especially along Hwy 395, is considered one of the maincauses of deer mortality in Mono County (Mono County Planning Dept., 2001). CDFW hasdeveloped specific plans for management of deer herds that emphasize the importance ofdesigning projects so that a minimum of new barriers to migration are emplaced. The proposedproject will create a significant new physical barrier to deer movement. Housing and tourism-based facility operations will increase daily human activity, and generate noise and new nightlighting. Domestic dogs off-leash will tend to harass wildlife and drive deer onto roadways.
4 Recommended Mitigations
4.1 Special Status Plant Communities and SpeciesThe project will temporarily disturb 1.1 acres of Great Basin Mixed Scrub shrublands
dominated by bitterbrush with a lesser presence by co-dominant big sagebrush, a plantcommunity type that is considered sensitive by the State of California. This disturbance will berequired in order to install a leach field for the proposed new housing. Permanent conversion ofnative vegetation (6.5 acres) will occur only where the regionally common community type BigSagebrush Scrub is dominant. In addition, 3.9 acres temporary disturbance will occur in BigSagebrush Scrub.
Recommendation 1: Direct impacts to the project area plant communities can beminimized if proponent prepares a revegetation plan for all areas that are temporarilydisturbed by the project. Mono County would review the plan for approval within 60days of the start of construction. The revegetation plan will, at a minimum, include aplanting palette that emulates remaining Great Basin Mixed Scrub on-site, methods andtiming for planting and supplemental inputs including plant protection and irrigation
jrp43_1 123018 DRAFT 25 Tioga Inn Biological Resources
using treated sewage effluent, success criteria that include a return to at least 50% of pre-project native vegetation cover within five years, and a monitoring and reporting programthat includes annually collected revegetation progress data, demonstrates and summarizestrends, and presents photographic evidence of such, for transmittal to Mono County priorto December 1 of each of the first five years following project construction (or until allsuccess criteria have been attained.)
Construction-related direct impacts to the occurring Masonic rockcress population arevery unlikely, but the emplacement of the new road will approach to within 100 feet. The annualfew-flowered woollystar population is very unlikely to be affected by the removal of a small areaof potential habitat (in 2017, plants were found near but not within the area where vegetation willbe displaced by the project).
Recommendation 2: Direct impact to Masonic rockcress during project construction ifthe construction contractor installs temporary fencing along the western edge of theexisting roadway where it approaches the Masonic rockcress population, in order toprevent accidental damage due to incursion by equipment.
4.2 Special Status Wildlife SpeciesThe project area currently supports nesting birds, very likely including a portion of a
locally dense nesting population of Brewer’s sparrows. Nesting birds are protected under CDFWcode and by Migratory Bird Treaty provisions, and construction can be routinely halted in orderto avoid nest destruction or abandonment if it is scheduled to occur during the locally recognizednesting period. Surveys that would be intended to minimize or avoid the potential for impacts tonesting birds would be effective only if they are performed immediately prior to the start of thedisturbance, by a biologist who is qualified and knowledgeable of local avifauna.
Recommendation 3: Negative impacts upon nesting success can be minimized ifoccurring nests are discovered and avoided during project construction. A pre-disturbance nesting bird survey would be scheduled and performed within seven daysprior to the start of vegetation and ground-disturbing project activities, by a qualifiedbiologist, if construction is scheduled to begin during the period March 15 – August 15.All potential nesting habitat within 200 feet (passerine birds) or 600 ft (raptors) from theproject-related disturbance limits would need to be included in the survey. Positiveindications of nesting will be reported to CDFW, Bishop Office, and to the constructionforeperson within 24 hours of survey completion, in order to formulate and implementavoidance measures. Appropriate measures (at a minimum including nest buffering andmonitoring) will be decided in consultation with CDFW on a nest-by-nest basis.
Domestic pets, especially dogs and cats, are expected with the new housing tenancy. It isunrealistic to expect that these animals will be restrained, and wandering pets potentially will bean important new predatory limitation that is imposed on the environment reaching for somedistance beyond the project footprint. Domestic cats, for example, could extirpate the breedingBrewer’s sparrow population that currently utilizes scrub just outside the project area to the northand east. Pet dogs could harass terrestrial wildlife including American badger and mule deer, andthereby cause increased crossings and potential for collision at U.S. Highway 395.
Recommendation 4: It will be possible to minimize negative impacts including avoidingpossible extirpation of the local breeding population of Brewer’s sparrow, and similarimpacts to other birds breeding near the project area, only if domestic pet predators are
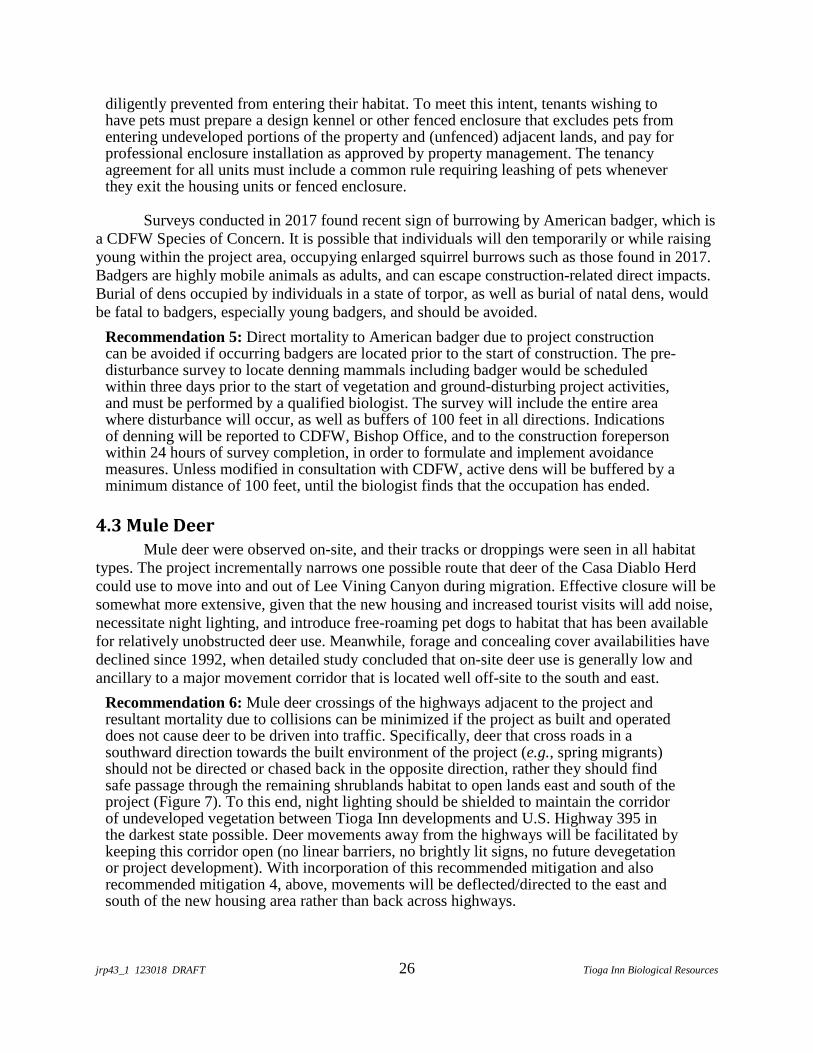
jrp43_1 123018 DRAFT 26 Tioga Inn Biological Resources
diligently prevented from entering their habitat. To meet this intent, tenants wishing tohave pets must prepare a design kennel or other fenced enclosure that excludes pets fromentering undeveloped portions of the property and (unfenced) adjacent lands, and pay forprofessional enclosure installation as approved by property management. The tenancyagreement for all units must include a common rule requiring leashing of pets wheneverthey exit the housing units or fenced enclosure.
Surveys conducted in 2017 found recent sign of burrowing by American badger, which isa CDFW Species of Concern. It is possible that individuals will den temporarily or while raisingyoung within the project area, occupying enlarged squirrel burrows such as those found in 2017.Badgers are highly mobile animals as adults, and can escape construction-related direct impacts.Burial of dens occupied by individuals in a state of torpor, as well as burial of natal dens, wouldbe fatal to badgers, especially young badgers, and should be avoided.
Recommendation 5: Direct mortality to American badger due to project constructioncan be avoided if occurring badgers are located prior to the start of construction. The pre-disturbance survey to locate denning mammals including badger would be scheduledwithin three days prior to the start of vegetation and ground-disturbing project activities,and must be performed by a qualified biologist. The survey will include the entire areawhere disturbance will occur, as well as buffers of 100 feet in all directions. Indicationsof denning will be reported to CDFW, Bishop Office, and to the construction forepersonwithin 24 hours of survey completion, in order to formulate and implement avoidancemeasures. Unless modified in consultation with CDFW, active dens will be buffered by aminimum distance of 100 feet, until the biologist finds that the occupation has ended.
4.3 Mule DeerMule deer were observed on-site, and their tracks or droppings were seen in all habitat
types. The project incrementally narrows one possible route that deer of the Casa Diablo Herdcould use to move into and out of Lee Vining Canyon during migration. Effective closure will besomewhat more extensive, given that the new housing and increased tourist visits will add noise,necessitate night lighting, and introduce free-roaming pet dogs to habitat that has been availablefor relatively unobstructed deer use. Meanwhile, forage and concealing cover availabilities havedeclined since 1992, when detailed study concluded that on-site deer use is generally low andancillary to a major movement corridor that is located well off-site to the south and east.
Recommendation 6: Mule deer crossings of the highways adjacent to the project andresultant mortality due to collisions can be minimized if the project as built and operateddoes not cause deer to be driven into traffic. Specifically, deer that cross roads in asouthward direction towards the built environment of the project (e.g., spring migrants)should not be directed or chased back in the opposite direction, rather they should findsafe passage through the remaining shrublands habitat to open lands east and south of theproject (Figure 7). To this end, night lighting should be shielded to maintain the corridorof undeveloped vegetation between Tioga Inn developments and U.S. Highway 395 inthe darkest state possible. Deer movements away from the highways will be facilitated bykeeping this corridor open (no linear barriers, no brightly lit signs, no future devegetationor project development). With incorporation of this recommended mitigation and alsorecommended mitigation 4, above, movements will be deflected/directed to the east andsouth of the new housing area rather than back across highways.
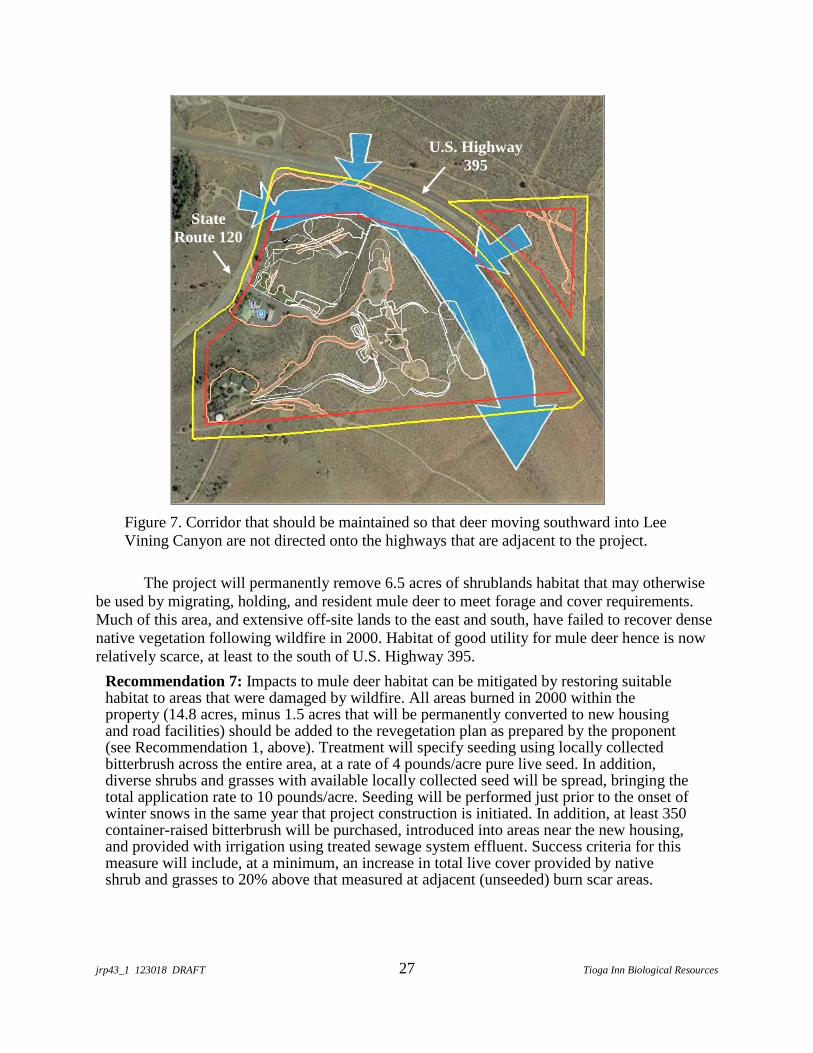
jrp43_1 123018 DRAFT 27 Tioga Inn Biological Resources
Figure 7. Corridor that should be maintained so that deer moving southward into LeeVining Canyon are not directed onto the highways that are adjacent to the project.
The project will permanently remove 6.5 acres of shrublands habitat that may otherwisebe used by migrating, holding, and resident mule deer to meet forage and cover requirements.Much of this area, and extensive off-site lands to the east and south, have failed to recover densenative vegetation following wildfire in 2000. Habitat of good utility for mule deer hence is nowrelatively scarce, at least to the south of U.S. Highway 395.
Recommendation 7: Impacts to mule deer habitat can be mitigated by restoring suitablehabitat to areas that were damaged by wildfire. All areas burned in 2000 within theproperty (14.8 acres, minus 1.5 acres that will be permanently converted to new housingand road facilities) should be added to the revegetation plan as prepared by the proponent(see Recommendation 1, above). Treatment will specify seeding using locally collectedbitterbrush across the entire area, at a rate of 4 pounds/acre pure live seed. In addition,diverse shrubs and grasses with available locally collected seed will be spread, bringing thetotal application rate to 10 pounds/acre. Seeding will be performed just prior to the onset ofwinter snows in the same year that project construction is initiated. In addition, at least 350container-raised bitterbrush will be purchased, introduced into areas near the new housing,and provided with irrigation using treated sewage system effluent. Success criteria for thismeasure will include, at a minimum, an increase in total live cover provided by nativeshrub and grasses to 20% above that measured at adjacent (unseeded) burn scar areas.
U.S. Highway395
StateRoute 120

jrp43_1 123018 DRAFT 28 Tioga Inn Biological Resources
ReferencesBagley, M, 1992. Rare plant and vegetation survey for the Tioga Inn project area. Report dated October
1992, prepared for Eric Jay Toll, Carson City.
Bagley, M, 2002. Botanical survey of proposed Benton Crossing Landfill and Pumice Valley Landfillexpansions, Mono County, California. Report prepared for Mono County Public WorksDepartment, Bridgeport.
Baldwin, BG, Goldman, DH, Keil, DJ, Patterson, R, Rosatti, TJ, and DH Wilken, (eds.), 2012. TheJepson Manual: Vascular Plants of California, 2nd Ed. University of California Press, Berkeley.
Beauvais, GP, Sequin, E, Rachlow, J, Dixon, R, Bosworth, B, Kozlowski, A, Carey,C, Bartels, P,Obradovitch, M, Forbes, T, and D Hays, 2008. Brachylagus idahoensis, in: The IUCN Red Listof Threatened Species, Version 2014-2.
Bi-State Technical Advisory Committee, 2012. Bi-State Action Plan: Past, Present and Future Actionsfor Conservation of the Greater Sage-Grouse Bi-State Distinct Population Segment. Bi-StateExecutive Oversight Committee for Conservation of Greater Sage-Grouse. Report date March 15,2012.
Calflora, 2018. The Calflora database: Information of California plants for education, research, andconservation. www.calflora.org, Berkeley.
California Department of Fish and Game, 2009. Protocols for Surveying and Evaluating Impacts toSpecial Status Native Plant Populations and Natural Communities. The Resources Agency, Stateof California, Sacramento.
California Department of Fish and Game, 2010. List of Vegetation Alliances and Associations.Vegetation Classification and Mapping Program, California Department of Fish and Game.Sacramento, CA. September 2010
California Department of Fish and Wildlife, Natural Diversity Database, 2018a. State and FederallyListed Endangered, Threatened, and Rare Plants of California (revised October 2018). ResourceManagement and Planning Division, Biogeographic Data Branch, Sacramento.
California Department of Fish and Wildlife, Natural Diversity Database, 2018b. Special Vascular Plants,Bryophytes and Lichens List (revised October 2018). The Resources Agency, State of California,Sacramento.
California Department of Fish and Wildlife, Natural Diversity Database, 2018c. Search results for the LeeVining, Lundy, Negit Island, Sulphur Pond, Mount Dana, Mono Mills, Koip Peak, June Lake,and Crestview quadrangles. CDFG Natural Heritage Division, Plant Conservation Program,Sacramento, November 24, 2018, Rarefind 5.
California Department of Fish and Wildlife, Natural Diversity Database, 2018d. State and Federally ListedEndangered, Threatened, and Rare Animals of California (revised October 2018). ResourceManagement and Planning Division, Biogeographic Data Branch, Sacramento.
California Department of Food and Agriculture, 2010. Pest Ratings of Noxious Weed Species andNoxious Weed Seed, January 2010 .Division of Plant Health & Pest Prevention Services,Sacramento.
California Invasive Plant Council, 2013. California Invasive Plant Inventory Database. Accessed August23, 2013. Cal-IPC, Berkeley.
California Native Plant Society, 2001. Inventory of Rare and Endangered Plants of California, 6th Edition.Special Publ. 1, California Native Plant Society, Sacramento.
jrp43_1 123018 DRAFT 29 Tioga Inn Biological Resources
California Native Plant Society, 2018. Inventory of Rare and Endangered Plants online edition,v7.California Native Plant Society. Sacramento, CA.
Caltrans, 2012. Natural Environment Study: Lee Vining Rockfall Safety Project, located north of thetown of Lee Vining. EA 09-33500, Caltrans, Bishop.
Chambers Group, Inc., 2011. Final Joint NEPA Environmental Assessment and CEQA InitialStudy/Mitigated Negative Declaration for the Digital 395 Middle Mile Project. Prepared forCalifornia Broadband Cooperative, Inc., Vallejo.
Collins, PW, 1998. Pygmy rabbit, Brachylagus idahoensis, pp. 77-80 in Bolster, BC (Ed.) “TerrestrialMammal Species of Special Concern in California”. California Department of Fish and Game,Sacramento.
Duke, R and Hoefler, G. 1988. White tailed jackrabbit. In: Zeiner, D.C., W.F.Laudenslayer, Jr., K.E.Mayer, and M. White, eds. 1988-1990. California's Wildlife. California Depart. of Fish andGame, Sacramento, California.
Halford, A, and Fatooh, J. 1994. Bishop Resource Area special status plant field guide. Bureau of LandManagement, Bishop Resource Area, Bishop.
Helgen, K. & Reid, F. 2016. Taxidea taxus. The IUCN Red List of Threatened Species 2016:http://dx.doi.org/10.2305/IUCN.UK.2016-1.RLTS.T41663A45215410.en. Accessed 03 Oct 2018.
Holland, RF, 1986. Preliminary Descriptions of the Terrestrial Natural Communities of California. Non-game Heritage Program, The Resources Agency, California Department of Fish and Game,Sacramento.
Jepson Herbarium, 2018. Index to California Plant Names. Jepson Online Interchange for CaliforniaFloristics. University of California, Berkeley.
Larrucea, ES, and PF Brussard, 2008. Habitat selection and current distribution of the pygmy rabbit inCalifornia and Nevada, USA. J. Mammology 89:691-699.
Mono County Planning Department. 1993. Final Specific Plan and Environmental Impact Assessment forTioga Inn. Final SP/EIR dated May 24, 1993. Prepared by Eric Jay Toll AICP, Inc., Carson City,for Mono County Planning Department, Bridgeport.
Mono County Planning Department. 2001. Master Environmental Assessment for Mono County. MonoCounty Planning Department, Bridgeport.
Mono County Community Development Department, 2015. Biological Assessment of UnincorporatedCommunities of Mono County. Report dated July 15, 2015, prepared for Mono County PlanningDept., Mammoth Lakes.
Paulus, J, 1998. Botanical survey for the proposed June Lake Highlands housing development. Reportdated November 1, 1998, prepared for L.K. Johnston and Associates, Mammoth Lakes,California.
Paulus, J, 2012. Botanical survey for the proposed Bell Diversion Pipeline completion. Report dated April4, 2012, prepared for County of Mono Economic Development Department, Mammoth Lakes,California.
Paulus, J, 2013. West Portal wireless telecommunications facility assessment of biological resources.Draft report dated June 28, 2013, prepared for County of Mono Community DevelopmentDepartment, Mammoth Lakes, California.
Paulus, J, 2016. Assessment of biological resources at the Cunningham Property near Lee Vining, MonoCounty, California. Report dated October 31, 2016, prepared for County of Mono CommunityDevelopment Department.

jrp43_1 123018 DRAFT 30 Tioga Inn Biological Resources
Sawyer, JO, Keeler-Wolf, T, and Evens, JM, 2009. A Manual of California Vegetation, 2nd Ed. CaliforniaNative Plant Society, Sacramento.
Taylor, TJ, 1992. Tioga Inn Vegetation and Wildlife Assessment Study Final Report. Dated June 1992,prepared for Eric Jay Toll, Carson City.
Ulmschneider, H, 2004. Surveying for pygmy rabbits (Brachylagus idahoensis). Prepared for Bureau ofLand Management, Boise District, Boise.
U.S. Army Corps of Engineers, 2012. The National Wetlands Plant List. Cold Regions Research andEngineering Laboratory, Hanover, New Hampshire.
U.S. Department of Agriculture, 2010. Introduced, Invasive, and Noxious Plants, updated March 21,2017. Natural Resources Conservation Service. https://plants.usda.gov
U.S. Fish and Wildlife Service, 2015. Sierra Nevada Red Fox (Vulpes vulpes necator). Species Report.Sacramento.
U.S. Forest Service, 1988. Draft Mono Basin National Forest Scenic Area Environmental ImpactStatement and Comprehensive Management Plan, Inyo National Forest, Bishop.
U.S. Forest Service, 2013. Region 5 Regional Forester’s 2013 Sensitive Plant Species List. RevisedSeptember 9, 2013. Inyo National Forest, Bishop.

jrp43._1 123018 A - 1 Tioga Inn Biological Resources
Appendix A. CNDDB search results for the USGS Lee Vining, Negit Island, Lundy, Mount Dana, Koip Peak, June Lake, Crestview,Mono Mills, and Sulphur Pond quadrangles conducted in November 2018. The Tioga Inn study area supports upland montane scrubhabitats. The average elevation of the project area is 2115 m (6940 ft). The elevation range is 2070-2160 m (6800-7080 feet). Statuscodes are defined following the table.
Species Federal State CNPSelevationrange (m)
habitat range nearest occurrencelikelihood of
occurrence at project
Plants
Federal Listedor
State Listed
Astragalusmonoensis
Mono milkvetch
BLMsensitive
USFSsensitive
Rare 1B.2 2100-3400
sagebrush scrub,roadsides, open flats,always with gravellypumice soils
open sagebrush scrub androadside, pumice soils nearJune Lake Junction7680 ft (2340 m),9.9 miles south
pumice flat openingsin the scrub canopyare not present, butsome likelihoodexists due to broadsoil and vegetationsimilarity
Plants
Not Federal orState Listed
Agrostishumilis
mountainbent grass
2B.3 2600-3200alpine slopes,subalpine coniferousforest, meadows
meadow-like on outcrops,near Upper Sardine Lakeat Mono Pass,10,350 ft (3140 m),6.5 miles southwest
very unlikely due tolack of suitablehabitat

jrp43._1 123018 A - 2 Tioga Inn Biological Resources
Species Federal State CNPSelevationrange (m)
habitat range nearest occurrencelikelihood of
occurrence at project
PlantsNot Federal or State Listed (cont.)
Allium atrorubensvar. atrorubens
Great Basin onion
2B.3 1200-2150
sandy or rocky uplandfans, washes, graniticor volcanic soils, scrubor woodland
juniper woodland andsagebrush scrub nearConway Summit,7600 ft (2320 m),9.1 miles north
some likelihoodexists due to soil andscrub vegetationsimilarity
Boecherabodiensis
Bodie Hillsrockcress
BLMsensitive
USFSsensitive
1B.3 2400-2900
Great Basin scrubor pinyon-juniperwoodland, rocky,crevices, often igneous
rocky near-stream riparian inLower Lee Vining Canyon,7085 ft (2160 m),less than 0.5 miles southwest
some likelihoodexists due to closeproximity of knownpopulation and soiland scrub vegetationsimilarity
Boecheracobrensis
Masonic Mtnrockcress
2B.3 1370-3100Great Basin scrub orpinyon-juniperwoodland, often sandy
sagebrush scrub near WestPortal, gravelly pumice soil,6980 ft (2130 m),5.0 miles south (Paulus,2013)
some likelihoodexists due to soil andscrub vegetationsimilarity
Boecheratiehmii
Tiehm’s rockcress
USFSsensitive
1B.3 2970-3590 alpine rocky slopes
rock crevices on open slopeabove Ellery Lake near TiogaPass, 9950 ft (3020 m),6.4 miles west
very unlikely due tolack of suitablehabitat
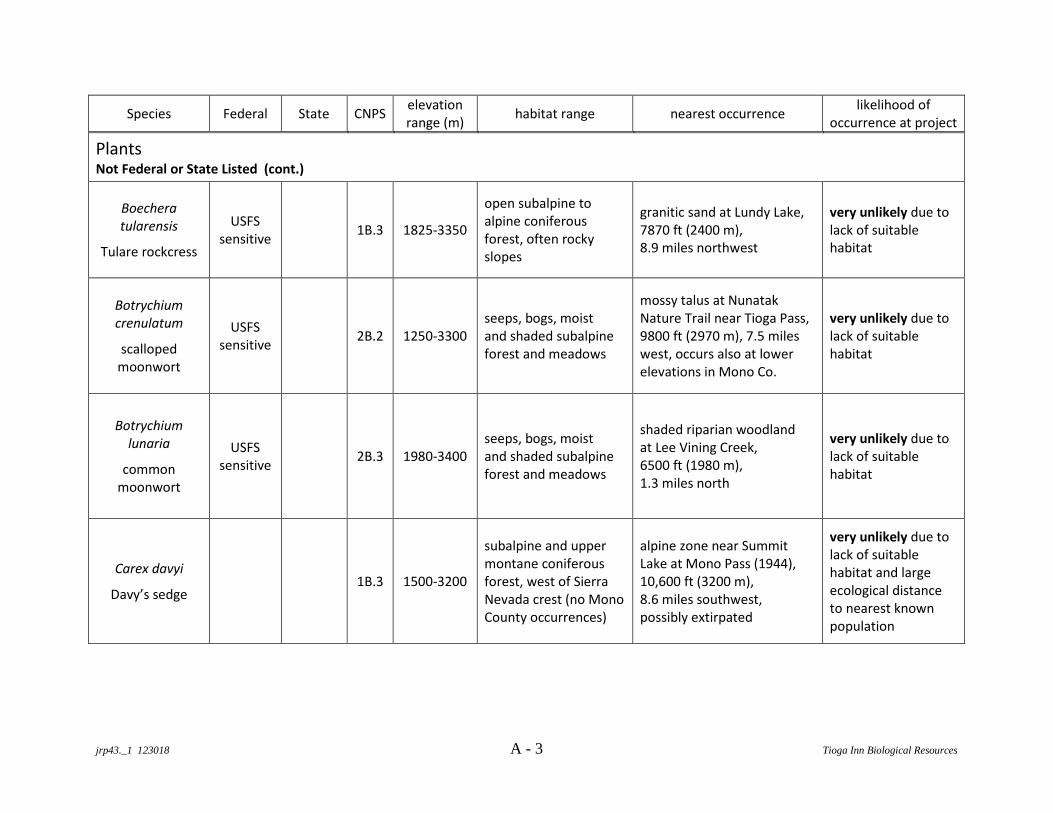
jrp43._1 123018 A - 3 Tioga Inn Biological Resources
Species Federal State CNPSelevationrange (m)
habitat range nearest occurrencelikelihood of
occurrence at project
PlantsNot Federal or State Listed (cont.)
Boecheratularensis
Tulare rockcress
USFSsensitive
1B.3 1825-3350
open subalpine toalpine coniferousforest, often rockyslopes
granitic sand at Lundy Lake,7870 ft (2400 m),8.9 miles northwest
very unlikely due tolack of suitablehabitat
Botrychiumcrenulatum
scallopedmoonwort
USFSsensitive
2B.2 1250-3300seeps, bogs, moistand shaded subalpineforest and meadows
mossy talus at NunatakNature Trail near Tioga Pass,9800 ft (2970 m), 7.5 mileswest, occurs also at lowerelevations in Mono Co.
very unlikely due tolack of suitablehabitat
Botrychiumlunaria
commonmoonwort
USFSsensitive
2B.3 1980-3400seeps, bogs, moistand shaded subalpineforest and meadows
shaded riparian woodlandat Lee Vining Creek,6500 ft (1980 m),1.3 miles north
very unlikely due tolack of suitablehabitat
Carex davyi
Davy’s sedge1B.3 1500-3200
subalpine and uppermontane coniferousforest, west of SierraNevada crest (no MonoCounty occurrences)
alpine zone near SummitLake at Mono Pass (1944),10,600 ft (3200 m),8.6 miles southwest,possibly extirpated
very unlikely due tolack of suitablehabitat and largeecological distanceto nearest knownpopulation
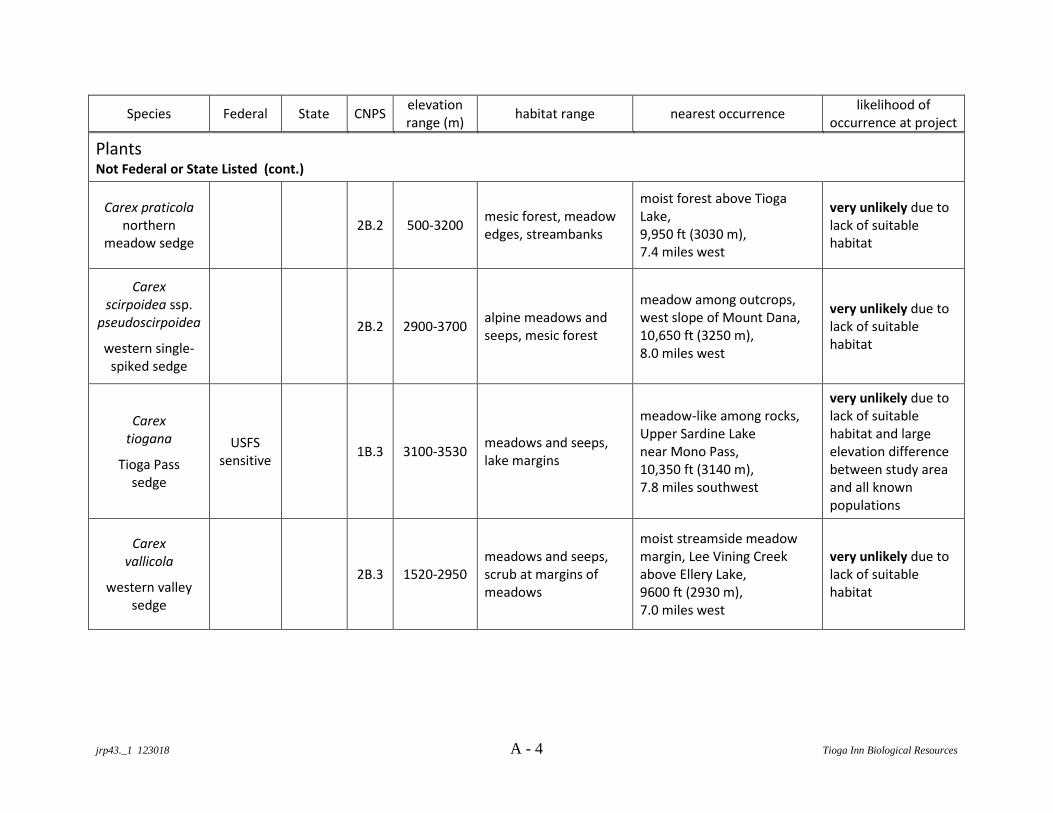
jrp43._1 123018 A - 4 Tioga Inn Biological Resources
Species Federal State CNPSelevationrange (m)
habitat range nearest occurrencelikelihood of
occurrence at project
PlantsNot Federal or State Listed (cont.)
Carex praticolanorthern
meadow sedge2B.2 500-3200
mesic forest, meadowedges, streambanks
moist forest above TiogaLake,9,950 ft (3030 m),7.4 miles west
very unlikely due tolack of suitablehabitat
Carexscirpoidea ssp.
pseudoscirpoidea
western single-spiked sedge
2B.2 2900-3700alpine meadows andseeps, mesic forest
meadow among outcrops,west slope of Mount Dana,10,650 ft (3250 m),8.0 miles west
very unlikely due tolack of suitablehabitat
Carextiogana
Tioga Passsedge
USFSsensitive
1B.3 3100-3530meadows and seeps,lake margins
meadow-like among rocks,Upper Sardine Lakenear Mono Pass,10,350 ft (3140 m),7.8 miles southwest
very unlikely due tolack of suitablehabitat and largeelevation differencebetween study areaand all knownpopulations
Carexvallicola
western valleysedge
2B.3 1520-2950meadows and seeps,scrub at margins ofmeadows
moist streamside meadowmargin, Lee Vining Creekabove Ellery Lake,9600 ft (2930 m),7.0 miles west
very unlikely due tolack of suitablehabitat
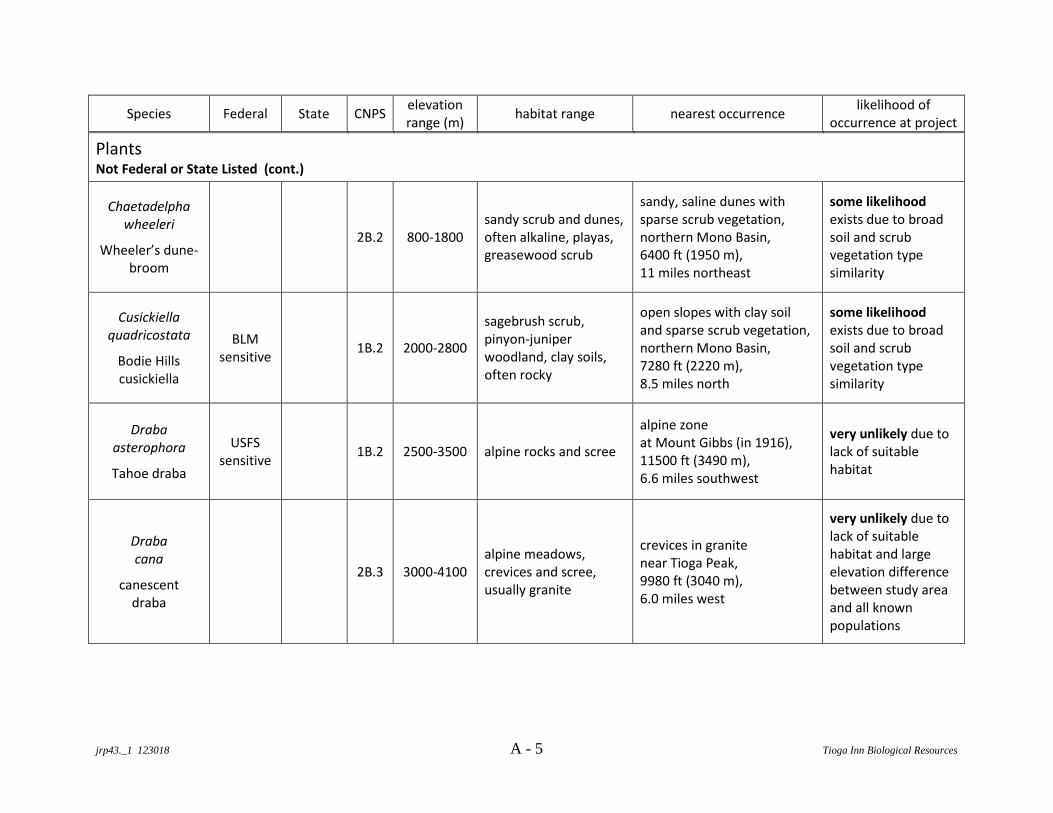
jrp43._1 123018 A - 5 Tioga Inn Biological Resources
Species Federal State CNPSelevationrange (m)
habitat range nearest occurrencelikelihood of
occurrence at project
PlantsNot Federal or State Listed (cont.)
Chaetadelphawheeleri
Wheeler’s dune-broom
2B.2 800-1800sandy scrub and dunes,often alkaline, playas,greasewood scrub
sandy, saline dunes withsparse scrub vegetation,northern Mono Basin,6400 ft (1950 m),11 miles northeast
some likelihoodexists due to broadsoil and scrubvegetation typesimilarity
Cusickiellaquadricostata
Bodie Hillscusickiella
BLMsensitive
1B.2 2000-2800
sagebrush scrub,pinyon-juniperwoodland, clay soils,often rocky
open slopes with clay soiland sparse scrub vegetation,northern Mono Basin,7280 ft (2220 m),8.5 miles north
some likelihoodexists due to broadsoil and scrubvegetation typesimilarity
Drabaasterophora
Tahoe draba
USFSsensitive
1B.2 2500-3500 alpine rocks and scree
alpine zoneat Mount Gibbs (in 1916),11500 ft (3490 m),6.6 miles southwest
very unlikely due tolack of suitablehabitat
Drabacana
canescentdraba
2B.3 3000-4100alpine meadows,crevices and scree,usually granite
crevices in granitenear Tioga Peak,9980 ft (3040 m),6.0 miles west
very unlikely due tolack of suitablehabitat and largeelevation differencebetween study areaand all knownpopulations
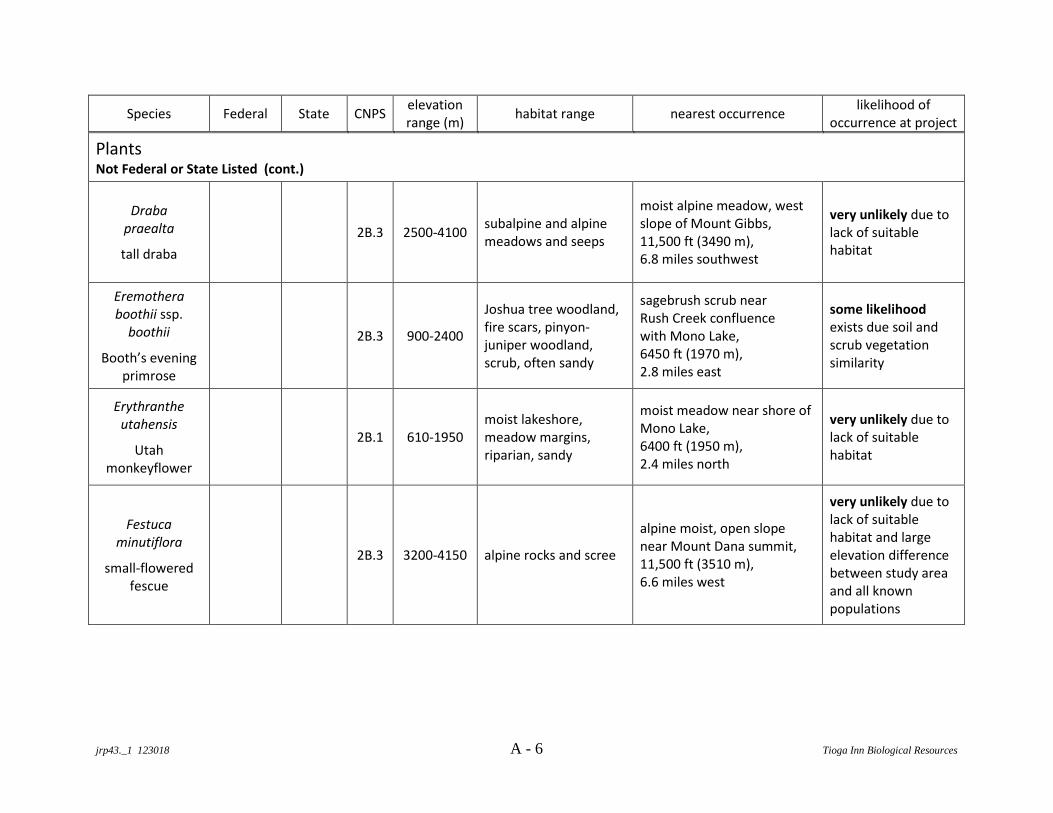
jrp43._1 123018 A - 6 Tioga Inn Biological Resources
Species Federal State CNPSelevationrange (m)
habitat range nearest occurrencelikelihood of
occurrence at project
PlantsNot Federal or State Listed (cont.)
Drabapraealta
tall draba
2B.3 2500-4100subalpine and alpinemeadows and seeps
moist alpine meadow, westslope of Mount Gibbs,11,500 ft (3490 m),6.8 miles southwest
very unlikely due tolack of suitablehabitat
Eremotheraboothii ssp.
boothii
Booth’s eveningprimrose
2B.3 900-2400
Joshua tree woodland,fire scars, pinyon-juniper woodland,scrub, often sandy
sagebrush scrub nearRush Creek confluencewith Mono Lake,6450 ft (1970 m),2.8 miles east
some likelihoodexists due soil andscrub vegetationsimilarity
Erythrantheutahensis
Utahmonkeyflower
2B.1 610-1950moist lakeshore,meadow margins,riparian, sandy
moist meadow near shore ofMono Lake,6400 ft (1950 m),2.4 miles north
very unlikely due tolack of suitablehabitat
Festucaminutiflora
small-floweredfescue
2B.3 3200-4150 alpine rocks and scree
alpine moist, open slopenear Mount Dana summit,11,500 ft (3510 m),6.6 miles west
very unlikely due tolack of suitablehabitat and largeelevation differencebetween study areaand all knownpopulations
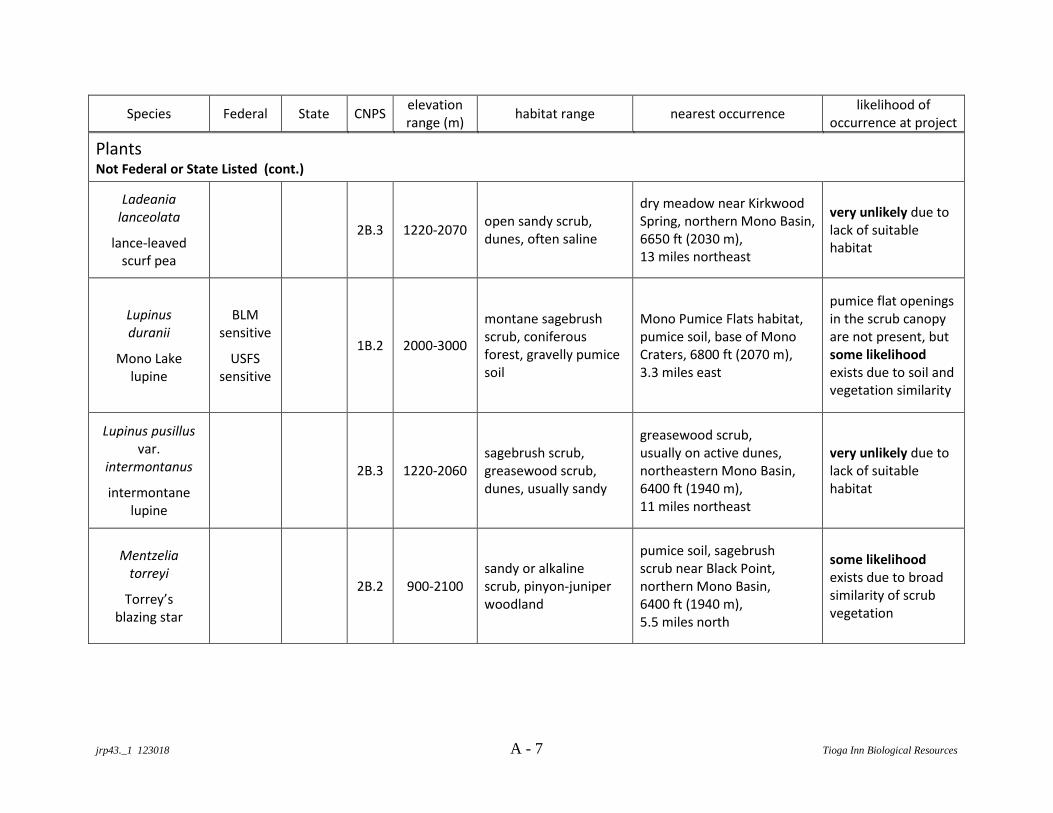
jrp43._1 123018 A - 7 Tioga Inn Biological Resources
Species Federal State CNPSelevationrange (m)
habitat range nearest occurrencelikelihood of
occurrence at project
PlantsNot Federal or State Listed (cont.)
Ladeanialanceolata
lance-leavedscurf pea
2B.3 1220-2070open sandy scrub,dunes, often saline
dry meadow near KirkwoodSpring, northern Mono Basin,6650 ft (2030 m),13 miles northeast
very unlikely due tolack of suitablehabitat
Lupinusduranii
Mono Lakelupine
BLMsensitive
USFSsensitive
1B.2 2000-3000
montane sagebrushscrub, coniferousforest, gravelly pumicesoil
Mono Pumice Flats habitat,pumice soil, base of MonoCraters, 6800 ft (2070 m),3.3 miles east
pumice flat openingsin the scrub canopyare not present, butsome likelihoodexists due to soil andvegetation similarity
Lupinus pusillusvar.
intermontanus
intermontanelupine
2B.3 1220-2060sagebrush scrub,greasewood scrub,dunes, usually sandy
greasewood scrub,usually on active dunes,northeastern Mono Basin,6400 ft (1940 m),11 miles northeast
very unlikely due tolack of suitablehabitat
Mentzeliatorreyi
Torrey’sblazing star
2B.2 900-2100sandy or alkalinescrub, pinyon-juniperwoodland
pumice soil, sagebrushscrub near Black Point,northern Mono Basin,6400 ft (1940 m),5.5 miles north
some likelihoodexists due to broadsimilarity of scrubvegetation

jrp43._1 123018 A - 8 Tioga Inn Biological Resources
Species Federal State CNPSelevationrange (m)
habitat range nearest occurrencelikelihood of
occurrence at project
PlantsNot Federal or State Listed (cont.)
Minuartiastricta1
bog sandwort2B.3 2450-3950
alpine, rocky or verycoarse soils, meadows
wet rock crevices at seepzone near Ellery Lake,10,380 ft (3160 m),6.0 miles west
very unlikely due tolack of suitablehabitat
Potamogetonrobbinsii
Robbins’pondweed
2B.3 1530-3300aquatic habitats,marshes, lake margins
shallow submergedmargin of Walker Lake,7930 ft (2400 m),5.8 miles southwest
very unlikely due tolack of suitablehabitat
Ranunculushydrocharoides
frog’s-bitbuttercup
2B.1 1200-2800
wet meadows andstreambed margins,emergent at pondedges, lakes
perennial streambedof Mill Creek,7440 ft (2270 m),7.1 miles northwest
very unlikely due tolack of suitablehabitat
Salix brachycarpavar. brachycarpa
short-fruitedwillow
2B.3 3200-3500meadows, seeps,alpine scrub, subalpinemesic coniferous forest
moist meadow habitatnear Gardisky Lake,10,500 ft (3200 m),7.2 miles west
very unlikely due tolack of suitablehabitat and largeelevation differencebetween study areaand all knownpopulations
1. syn. Sabulina stricta
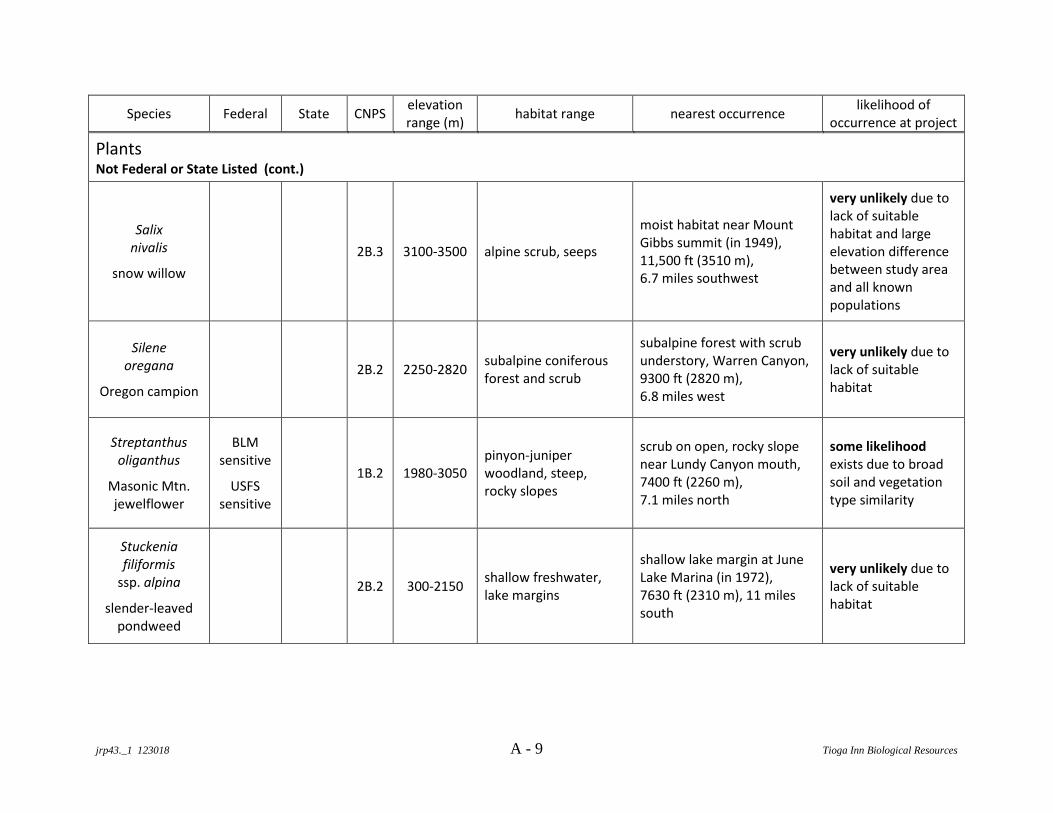
jrp43._1 123018 A - 9 Tioga Inn Biological Resources
Species Federal State CNPSelevationrange (m)
habitat range nearest occurrencelikelihood of
occurrence at project
PlantsNot Federal or State Listed (cont.)
Salixnivalis
snow willow
2B.3 3100-3500 alpine scrub, seeps
moist habitat near MountGibbs summit (in 1949),11,500 ft (3510 m),6.7 miles southwest
very unlikely due tolack of suitablehabitat and largeelevation differencebetween study areaand all knownpopulations
Sileneoregana
Oregon campion
2B.2 2250-2820subalpine coniferousforest and scrub
subalpine forest with scrubunderstory, Warren Canyon,9300 ft (2820 m),6.8 miles west
very unlikely due tolack of suitablehabitat
Streptanthusoliganthus
Masonic Mtn.jewelflower
BLMsensitive
USFSsensitive
1B.2 1980-3050pinyon-juniperwoodland, steep,rocky slopes
scrub on open, rocky slopenear Lundy Canyon mouth,7400 ft (2260 m),7.1 miles north
some likelihoodexists due to broadsoil and vegetationtype similarity
Stuckeniafiliformis
ssp. alpina
slender-leavedpondweed
2B.2 300-2150shallow freshwater,lake margins
shallow lake margin at JuneLake Marina (in 1972),7630 ft (2310 m), 11 milessouth
very unlikely due tolack of suitablehabitat
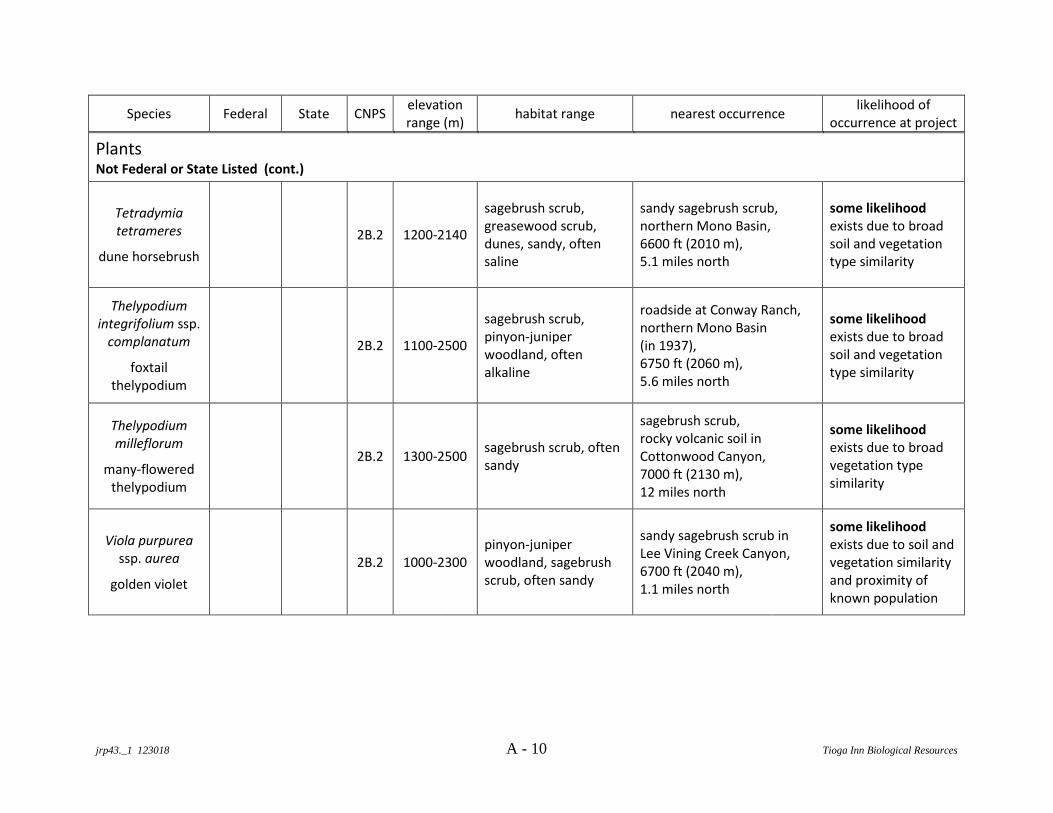
jrp43._1 123018 A - 10 Tioga Inn Biological Resources
Species Federal State CNPSelevationrange (m)
habitat range nearest occurrencelikelihood of
occurrence at project
PlantsNot Federal or State Listed (cont.)
Tetradymiatetrameres
dune horsebrush
2B.2 1200-2140
sagebrush scrub,greasewood scrub,dunes, sandy, oftensaline
sandy sagebrush scrub,northern Mono Basin,6600 ft (2010 m),5.1 miles north
some likelihoodexists due to broadsoil and vegetationtype similarity
Thelypodiumintegrifolium ssp.
complanatum
foxtailthelypodium
2B.2 1100-2500
sagebrush scrub,pinyon-juniperwoodland, oftenalkaline
roadside at Conway Ranch,northern Mono Basin(in 1937),6750 ft (2060 m),5.6 miles north
some likelihoodexists due to broadsoil and vegetationtype similarity
Thelypodiummilleflorum
many-floweredthelypodium
2B.2 1300-2500sagebrush scrub, oftensandy
sagebrush scrub,rocky volcanic soil inCottonwood Canyon,7000 ft (2130 m),12 miles north
some likelihoodexists due to broadvegetation typesimilarity
Viola purpureassp. aurea
golden violet
2B.2 1000-2300pinyon-juniperwoodland, sagebrushscrub, often sandy
sandy sagebrush scrub inLee Vining Creek Canyon,6700 ft (2040 m),1.1 miles north
some likelihoodexists due to soil andvegetation similarityand proximity ofknown population
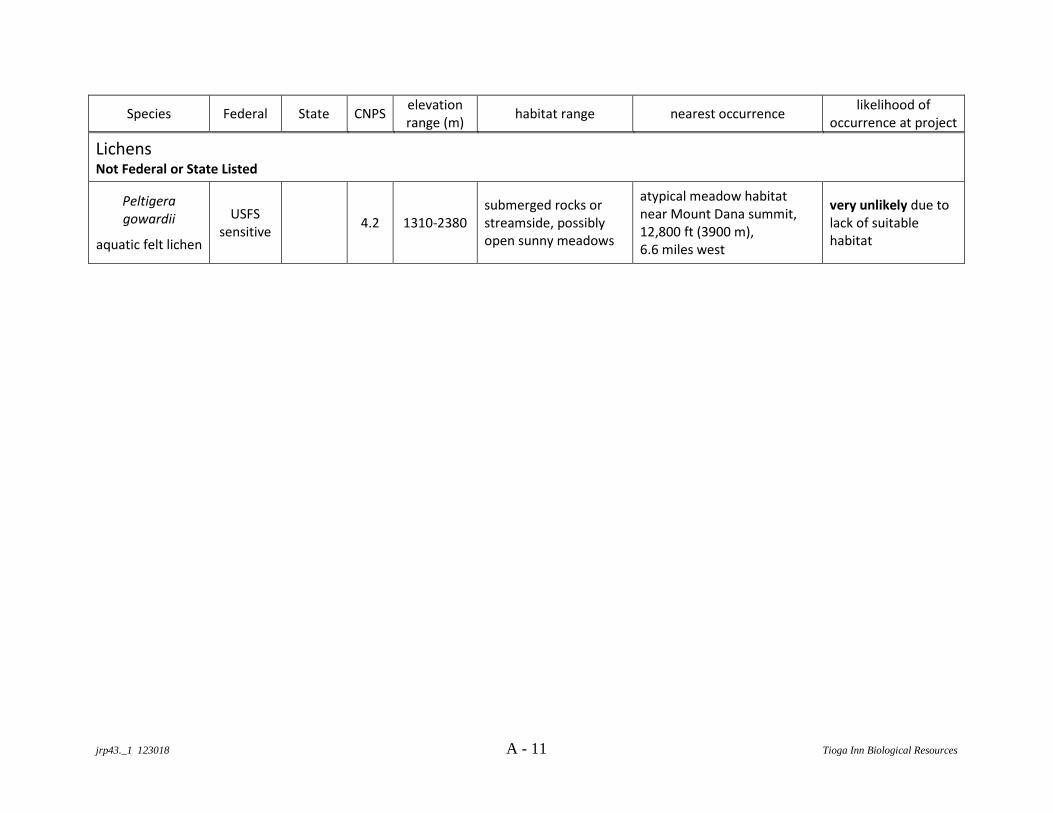
jrp43._1 123018 A - 11 Tioga Inn Biological Resources
Species Federal State CNPSelevationrange (m)
habitat range nearest occurrencelikelihood of
occurrence at project
LichensNot Federal or State Listed
Peltigeragowardii
aquatic felt lichen
USFSsensitive
4.2 1310-2380submerged rocks orstreamside, possiblyopen sunny meadows
atypical meadow habitatnear Mount Dana summit,12,800 ft (3900 m),6.6 miles west
very unlikely due tolack of suitablehabitat
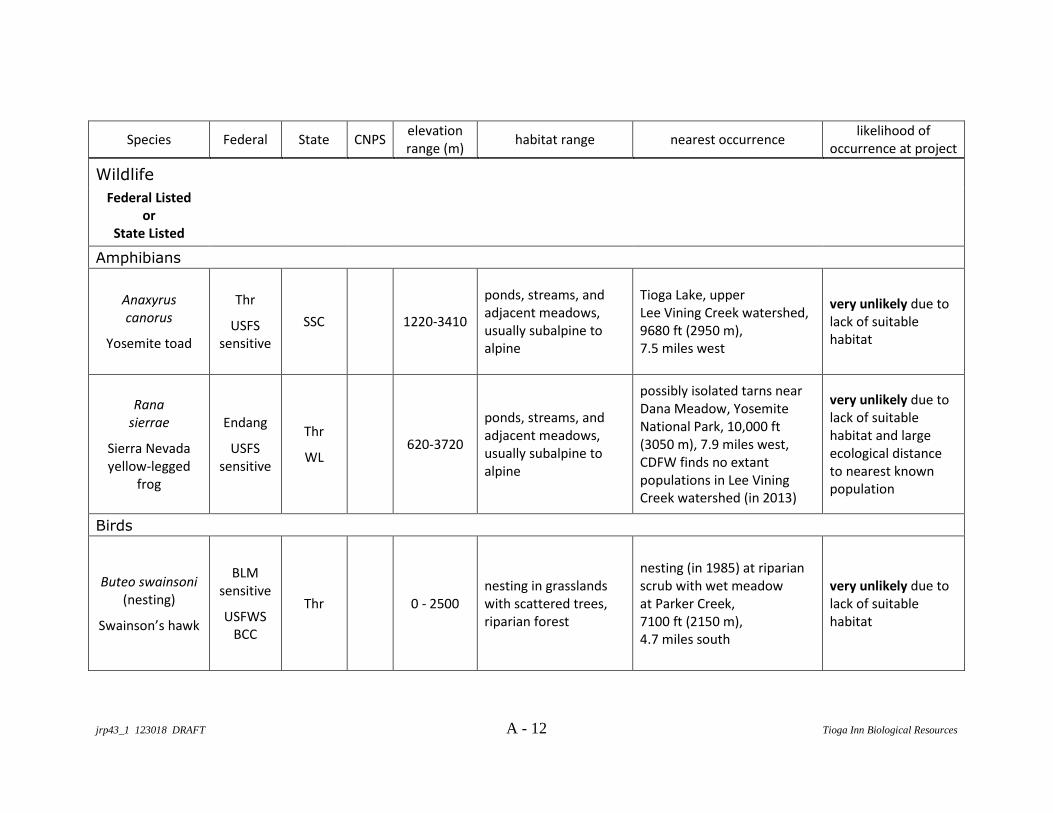
jrp43_1 123018 DRAFT A - 12 Tioga Inn Biological Resources
Species Federal State CNPSelevationrange (m)
habitat range nearest occurrencelikelihood of
occurrence at project
Wildlife
Federal Listedor
State Listed
Amphibians
Anaxyruscanorus
Yosemite toad
Thr
USFSsensitive
SSC 1220-3410
ponds, streams, andadjacent meadows,usually subalpine toalpine
Tioga Lake, upperLee Vining Creek watershed,9680 ft (2950 m),7.5 miles west
very unlikely due tolack of suitablehabitat
Ranasierrae
Sierra Nevadayellow-legged
frog
Endang
USFSsensitive
Thr
WL620-3720
ponds, streams, andadjacent meadows,usually subalpine toalpine
possibly isolated tarns nearDana Meadow, YosemiteNational Park, 10,000 ft(3050 m), 7.9 miles west,CDFW finds no extantpopulations in Lee ViningCreek watershed (in 2013)
very unlikely due tolack of suitablehabitat and largeecological distanceto nearest knownpopulation
Birds
Buteo swainsoni(nesting)
Swainson’s hawk
BLMsensitive
USFWSBCC
Thr 0 - 2500nesting in grasslandswith scattered trees,riparian forest
nesting (in 1985) at riparianscrub with wet meadowat Parker Creek,7100 ft (2150 m),4.7 miles south
very unlikely due tolack of suitablehabitat
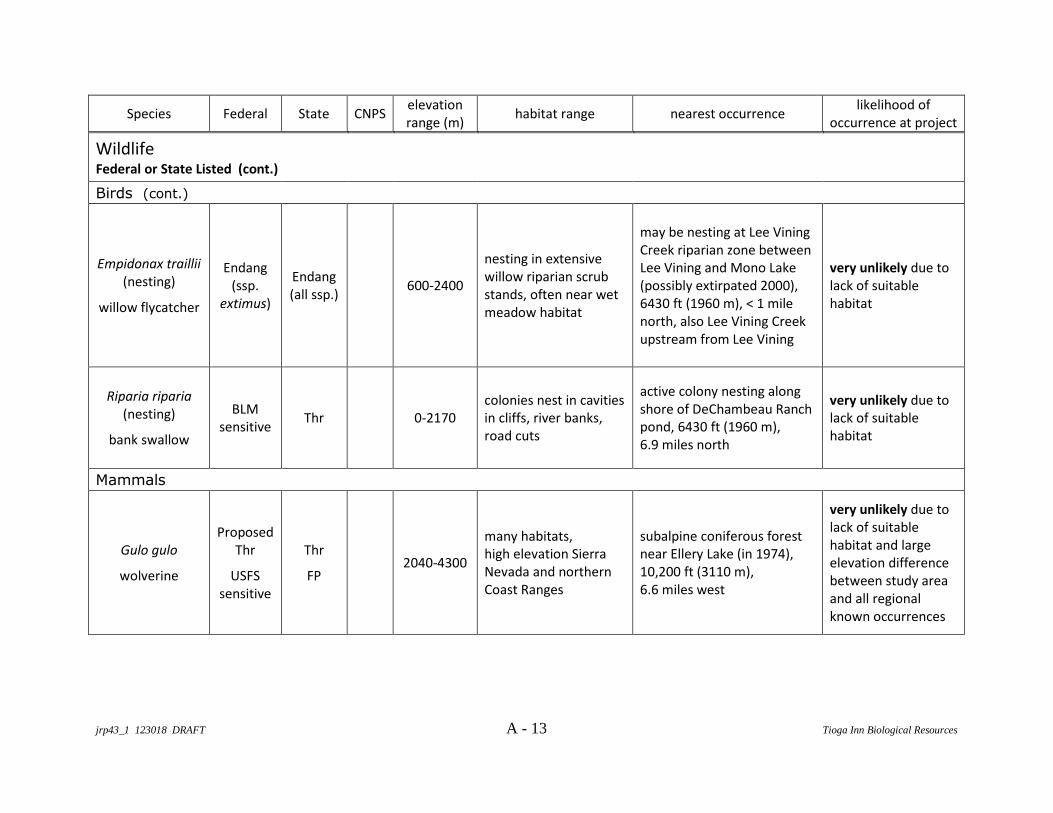
jrp43_1 123018 DRAFT A - 13 Tioga Inn Biological Resources
Species Federal State CNPSelevationrange (m)
habitat range nearest occurrencelikelihood of
occurrence at project
WildlifeFederal or State Listed (cont.)
Birds (cont.)
Empidonax traillii(nesting)
willow flycatcher
Endang(ssp.
extimus)
Endang(all ssp.)
600-2400
nesting in extensivewillow riparian scrubstands, often near wetmeadow habitat
may be nesting at Lee ViningCreek riparian zone betweenLee Vining and Mono Lake(possibly extirpated 2000),6430 ft (1960 m), < 1 milenorth, also Lee Vining Creekupstream from Lee Vining
very unlikely due tolack of suitablehabitat
Riparia riparia(nesting)
bank swallow
BLMsensitive
Thr 0-2170colonies nest in cavitiesin cliffs, river banks,road cuts
active colony nesting alongshore of DeChambeau Ranchpond, 6430 ft (1960 m),6.9 miles north
very unlikely due tolack of suitablehabitat
Mammals
Gulo gulo
wolverine
ProposedThr
USFSsensitive
Thr
FP2040-4300
many habitats,high elevation SierraNevada and northernCoast Ranges
subalpine coniferous forestnear Ellery Lake (in 1974),10,200 ft (3110 m),6.6 miles west
very unlikely due tolack of suitablehabitat and largeelevation differencebetween study areaand all regionalknown occurrences

jrp43_1 123018 DRAFT A - 14 Tioga Inn Biological Resources
Species Federal State CNPSelevationrange (m)
habitat range nearest occurrencelikelihood of
occurrence at project
WildlifeFederal or State Listed (cont.)
Mammals (cont.)
Pekania pennantiWest Coast DPS
fisher
BLMsensitive
USFSsensitive
Thr
SSC1500-3660
expansive mature anddense forest with snagsor downed logs andadjacent riparian area
subalpine coniferous forestand lakeshore near ElleryLake, 9800 ft (2990 m),6.5 miles west
very unlikely due tolack of suitablehabitat
Vulpes vulpesnecator
Sierra Nevadared fox
Candidate
(Thr orEndang)
USFSsensitive
Thr 1800-3170
forest and forest gaps,high elevation centralSierra Nevada, recentsightings indicate mayuse lower elevations inEastern Sierra Nevada
Lee Vining Creek Canyon atU.S. Hwy 395 (in 1989),6830 ft (2080 m), 0.3 milesnorthwest
some likelihoodexists due toproximity ofhistorical knownoccurrence
Wildlife
Not Federal Listedor
State Listed
Mollusks
Pyrgulopsiswongi
Wong’sspringsnail
USFSsensitive
450-2900freshwater perennialsprings and alongoutflow streams
spring outflow nearConway Summit,8130 ft (2480 m),10 miles north
very unlikely due tono records from LeeVining Creekdrainage
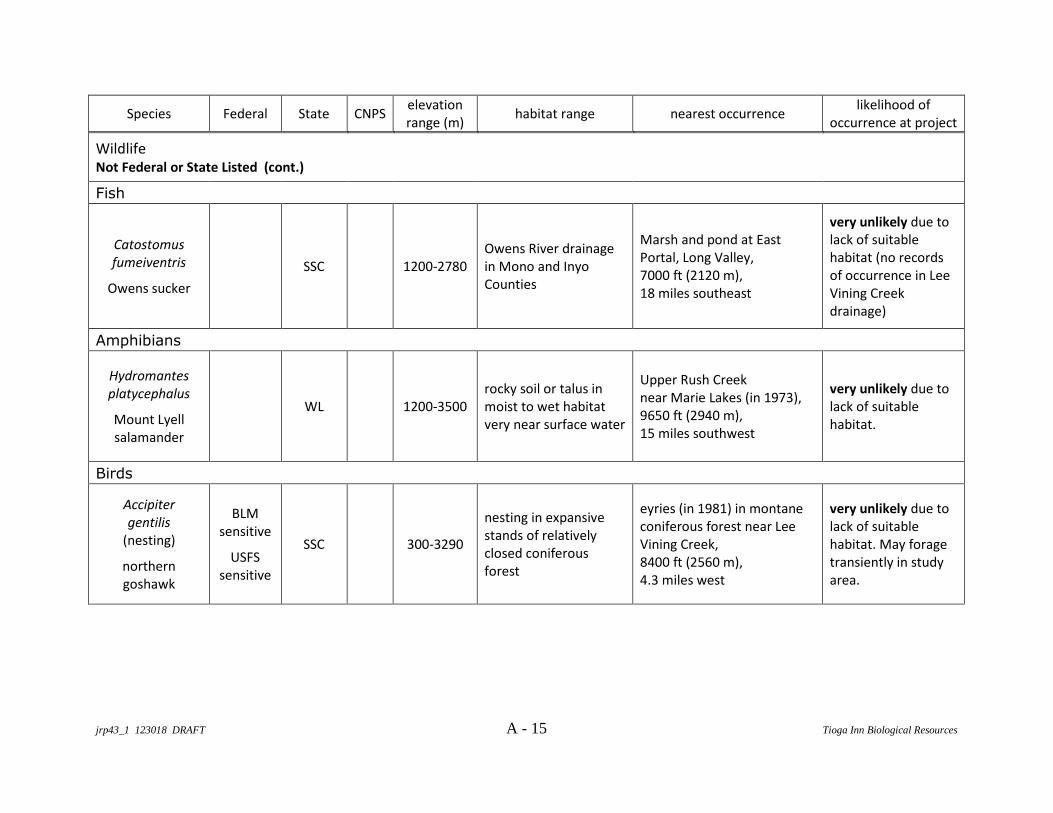
jrp43_1 123018 DRAFT A - 15 Tioga Inn Biological Resources
Species Federal State CNPSelevationrange (m)
habitat range nearest occurrencelikelihood of
occurrence at project
WildlifeNot Federal or State Listed (cont.)
Fish
Catostomusfumeiventris
Owens sucker
SSC 1200-2780Owens River drainagein Mono and InyoCounties
Marsh and pond at EastPortal, Long Valley,7000 ft (2120 m),18 miles southeast
very unlikely due tolack of suitablehabitat (no recordsof occurrence in LeeVining Creekdrainage)
Amphibians
Hydromantesplatycephalus
Mount Lyellsalamander
WL 1200-3500rocky soil or talus inmoist to wet habitatvery near surface water
Upper Rush Creeknear Marie Lakes (in 1973),9650 ft (2940 m),15 miles southwest
very unlikely due tolack of suitablehabitat.
Birds
Accipitergentilis
(nesting)
northerngoshawk
BLMsensitive
USFSsensitive
SSC 300-3290
nesting in expansivestands of relativelyclosed coniferousforest
eyries (in 1981) in montaneconiferous forest near LeeVining Creek,8400 ft (2560 m),4.3 miles west
very unlikely due tolack of suitablehabitat. May foragetransiently in studyarea.

jrp43_1 123018 DRAFT A - 16 Tioga Inn Biological Resources
Species Federal State CNPSelevationrange (m)
habitat range nearest occurrencelikelihood of
occurrence at project
WildlifeNot Federal or State Listed (cont.)
Birds (cont.)
CentrocercusurophasianusBi-State DPS
(nesting, leks)
greater sagegrouse
BLMsensitive
USFSsensitive
SSC 2100-3200
foraging, nesting insagebrush scrub, leksat openings in scrub,brood raising at fieldsand meadows withadjacent sagebrushscrub
active lek area at ParkerMeadows, 6900 ft (2100 m),4.8 miles south,year-long use of sagebrushscrub west of Grant Lake,7150 ft (2170 m),5.5 miles south
Some likelihood dueto proximity ofknown populationand broad similarityof sagebrush habitat
Circus hudsonius(nesting)
northern harrier
SSC <0 - 3050
nesting on ground inexpansive meadows,marshes, marshlandscrub, foraging samehabitats
nesting at lakeside meadowsnear riparian forest atlower Lee Vining Creek,6400 ft (1940 m),1.9 miles north
nesting and foragingvery unlikely due tolack of suitablehabitat
Coturnicopsnoveboracensis
(nesting)
yellow rail
USFWSBCC
SSC 0 - 2600nesting on ground inmarshes, meadows,foraging same habitats
nesting at lakeside meadownear shoreline of Mono Lake,6400 ft (1950 m),4.8 miles north
nesting and foragingvery unlikely due tolack of suitablehabitat
Falco mexicanus(nesting)
prairie falcon
USFWSBCC
WL 120-2870
nesting on verticalcliffs, foraging overopen grasslands, openscrublands
nesting 9-10 miles south ofstudy area (exact locationsare sensitive),8000-8160 ft (2440-2490 m)
very unlikely due tolack of suitablehabitat

jrp43_1 123018 DRAFT A - 17 Tioga Inn Biological Resources
Species Federal State CNPSelevationrange (m)
habitat range nearest occurrencelikelihood of
occurrence at project
WildlifeNot Federal or State Listed (cont.)
Birds (cont.)
Larus californicus(nesting)
California gull
WL 0-1980nesting on smallislands, freshwaterlakes
nesting colonies onislands in Mono Lake,6400 ft (1950 m),4.3 miles northeast
very unlikely due tolack of suitablehabitat.
Pandion haliaetus(nesting)
osprey
WL 0 - 2460nests in large trees,forages at aquatic andriverine habitats
nesting on tufa towersat Mono Lake,6400 ft (1950 m),1.6 miles northeast
very unlikely due tolack of suitablehabitat
Setophagapetechia(nesting)
yellow warbler
USFWSBCC
SSC 0 - 2600
nesting and foraging inriparian scrub/forest,may nest in shrubbymontane forest gaps
nesting population inriparian zone at lower LeeVining Creek,6400 ft (1940 m),1.1 miles north
very unlikely due tolack of suitablehabitat
Spizella breweri(nesting)
Brewer’s sparrow
USFWSBCC
1900-2000nesting and foraging insagebrush scrub
nesting in brushy riparianzone at Lee Vining Creek,6400 ft 1950 m),1.2 miles north
some likelihoodexists due to habitatsimilarity and localconnectivity, andproximity of knownpopulation
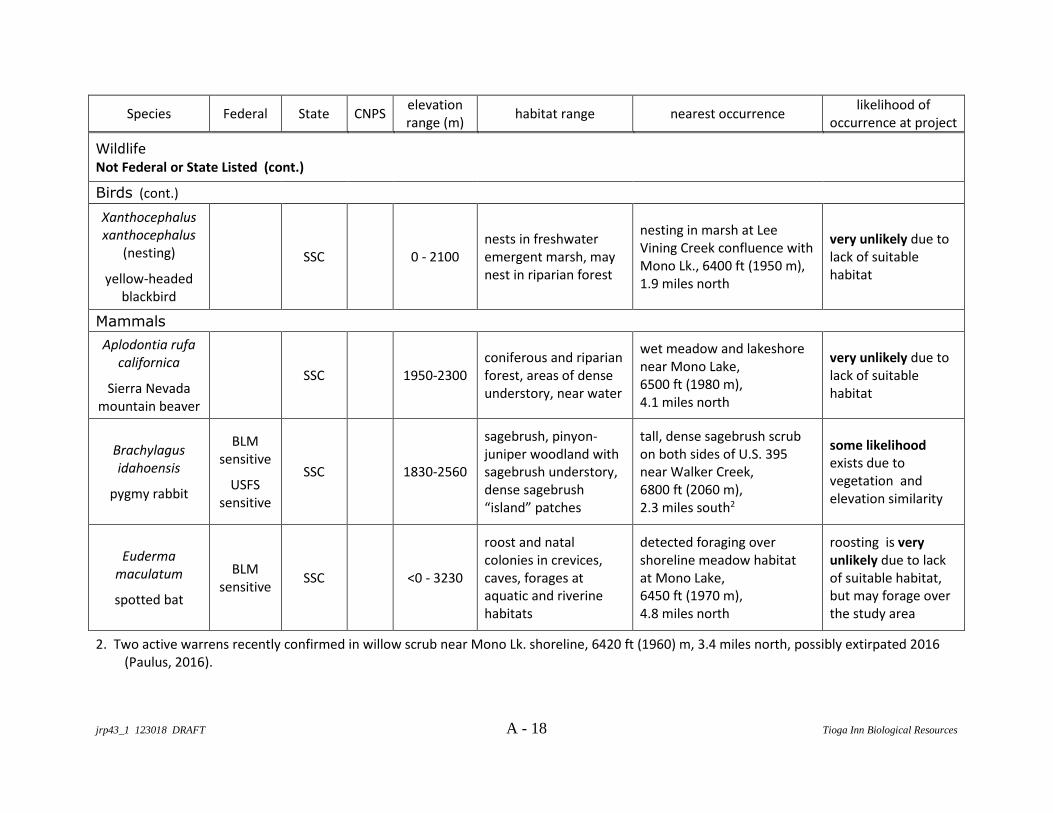
jrp43_1 123018 DRAFT A - 18 Tioga Inn Biological Resources
Species Federal State CNPSelevationrange (m)
habitat range nearest occurrencelikelihood of
occurrence at project
WildlifeNot Federal or State Listed (cont.)
Birds (cont.)
Xanthocephalusxanthocephalus
(nesting)
yellow-headedblackbird
SSC 0 - 2100nests in freshwateremergent marsh, maynest in riparian forest
nesting in marsh at LeeVining Creek confluence withMono Lk., 6400 ft (1950 m),1.9 miles north
very unlikely due tolack of suitablehabitat
Mammals
Aplodontia rufacalifornica
Sierra Nevadamountain beaver
SSC 1950-2300coniferous and riparianforest, areas of denseunderstory, near water
wet meadow and lakeshorenear Mono Lake,6500 ft (1980 m),4.1 miles north
very unlikely due tolack of suitablehabitat
Brachylagusidahoensis
pygmy rabbit
BLMsensitive
USFSsensitive
SSC 1830-2560
sagebrush, pinyon-juniper woodland withsagebrush understory,dense sagebrush“island” patches
tall, dense sagebrush scrubon both sides of U.S. 395near Walker Creek,6800 ft (2060 m),2.3 miles south2
some likelihoodexists due tovegetation andelevation similarity
Eudermamaculatum
spotted bat
BLMsensitive
SSC <0 - 3230
roost and natalcolonies in crevices,caves, forages ataquatic and riverinehabitats
detected foraging overshoreline meadow habitatat Mono Lake,6450 ft (1970 m),4.8 miles north
roosting is veryunlikely due to lackof suitable habitat,but may forage overthe study area
2. Two active warrens recently confirmed in willow scrub near Mono Lk. shoreline, 6420 ft (1960) m, 3.4 miles north, possibly extirpated 2016(Paulus, 2016).
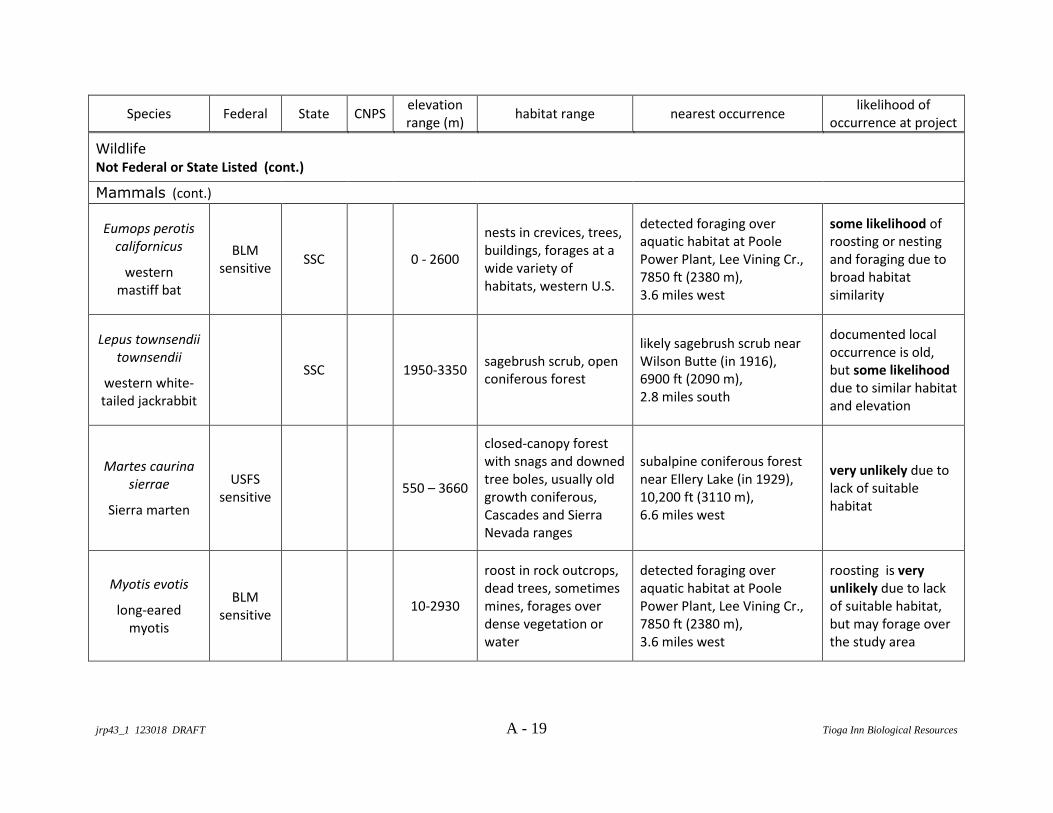
jrp43_1 123018 DRAFT A - 19 Tioga Inn Biological Resources
Species Federal State CNPSelevationrange (m)
habitat range nearest occurrencelikelihood of
occurrence at project
WildlifeNot Federal or State Listed (cont.)
Mammals (cont.)
Eumops perotiscalifornicus
westernmastiff bat
BLMsensitive
SSC 0 - 2600
nests in crevices, trees,buildings, forages at awide variety ofhabitats, western U.S.
detected foraging overaquatic habitat at PoolePower Plant, Lee Vining Cr.,7850 ft (2380 m),3.6 miles west
some likelihood ofroosting or nestingand foraging due tobroad habitatsimilarity
Lepus townsendiitownsendii
western white-tailed jackrabbit
SSC 1950-3350sagebrush scrub, openconiferous forest
likely sagebrush scrub nearWilson Butte (in 1916),6900 ft (2090 m),2.8 miles south
documented localoccurrence is old,but some likelihooddue to similar habitatand elevation
Martes caurinasierrae
Sierra marten
USFSsensitive
550 – 3660
closed-canopy forestwith snags and downedtree boles, usually oldgrowth coniferous,Cascades and SierraNevada ranges
subalpine coniferous forestnear Ellery Lake (in 1929),10,200 ft (3110 m),6.6 miles west
very unlikely due tolack of suitablehabitat
Myotis evotis
long-earedmyotis
BLMsensitive
10-2930
roost in rock outcrops,dead trees, sometimesmines, forages overdense vegetation orwater
detected foraging overaquatic habitat at PoolePower Plant, Lee Vining Cr.,7850 ft (2380 m),3.6 miles west
roosting is veryunlikely due to lackof suitable habitat,but may forage overthe study area
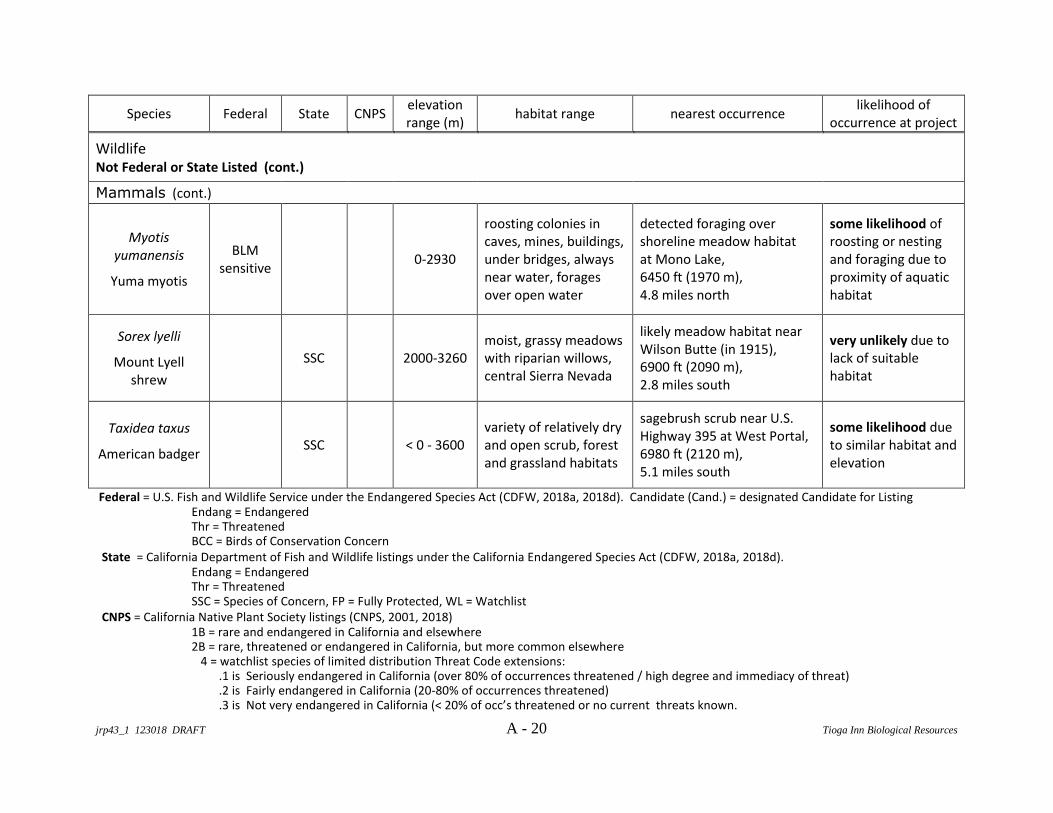
jrp43_1 123018 DRAFT A - 20 Tioga Inn Biological Resources
Species Federal State CNPSelevationrange (m)
habitat range nearest occurrencelikelihood of
occurrence at project
WildlifeNot Federal or State Listed (cont.)
Mammals (cont.)
Myotisyumanensis
Yuma myotis
BLMsensitive
0-2930
roosting colonies incaves, mines, buildings,under bridges, alwaysnear water, foragesover open water
detected foraging overshoreline meadow habitatat Mono Lake,6450 ft (1970 m),4.8 miles north
some likelihood ofroosting or nestingand foraging due toproximity of aquatichabitat
Sorex lyelli
Mount Lyellshrew
SSC 2000-3260moist, grassy meadowswith riparian willows,central Sierra Nevada
likely meadow habitat nearWilson Butte (in 1915),6900 ft (2090 m),2.8 miles south
very unlikely due tolack of suitablehabitat
Taxidea taxus
American badgerSSC < 0 - 3600
variety of relatively dryand open scrub, forestand grassland habitats
sagebrush scrub near U.S.Highway 395 at West Portal,6980 ft (2120 m),5.1 miles south
some likelihood dueto similar habitat andelevation
Federal = U.S. Fish and Wildlife Service under the Endangered Species Act (CDFW, 2018a, 2018d). Candidate (Cand.) = designated Candidate for ListingEndang = EndangeredThr = ThreatenedBCC = Birds of Conservation Concern
State = California Department of Fish and Wildlife listings under the California Endangered Species Act (CDFW, 2018a, 2018d).Endang = EndangeredThr = ThreatenedSSC = Species of Concern, FP = Fully Protected, WL = Watchlist
CNPS = California Native Plant Society listings (CNPS, 2001, 2018)1B = rare and endangered in California and elsewhere2B = rare, threatened or endangered in California, but more common elsewhere
4 = watchlist species of limited distribution Threat Code extensions:.1 is Seriously endangered in California (over 80% of occurrences threatened / high degree and immediacy of threat).2 is Fairly endangered in California (20-80% of occurrences threatened).3 is Not very endangered in California (< 20% of occ’s threatened or no current threats known.
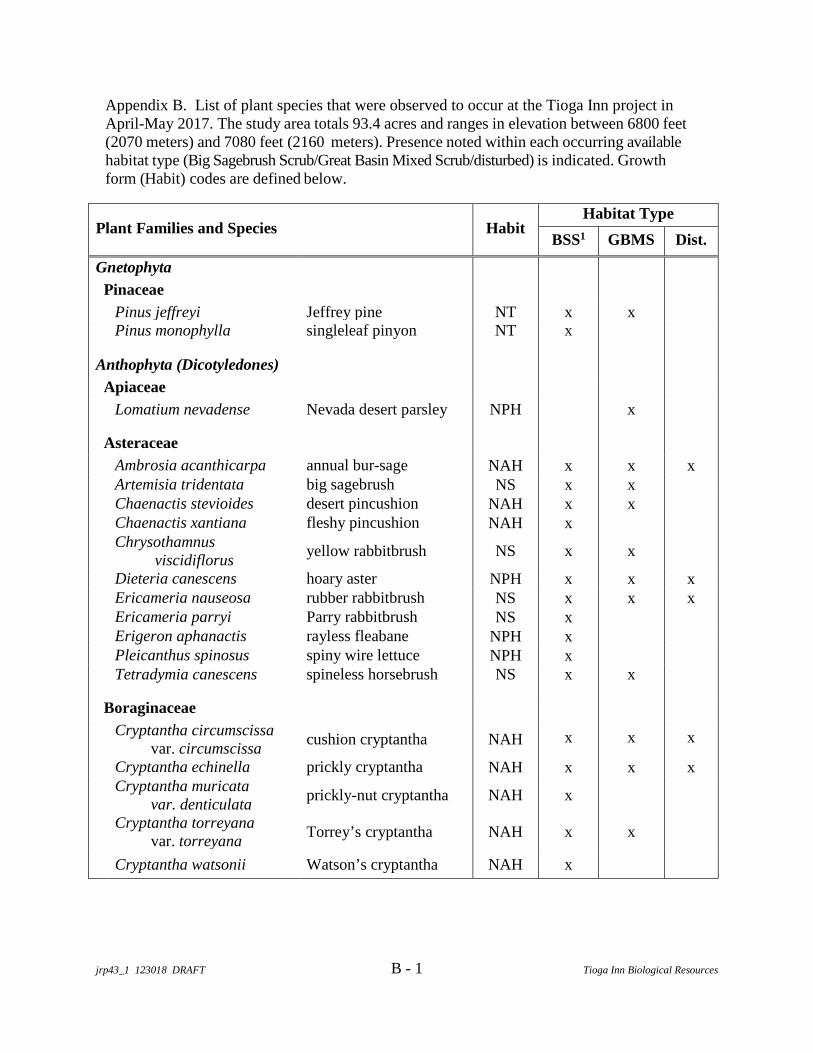
jrp43_1 123018 DRAFT B - 1 Tioga Inn Biological Resources
Appendix B. List of plant species that were observed to occur at the Tioga Inn project inApril-May 2017. The study area totals 93.4 acres and ranges in elevation between 6800 feet(2070 meters) and 7080 feet (2160 meters). Presence noted within each occurring availablehabitat type (Big Sagebrush Scrub/Great Basin Mixed Scrub/disturbed) is indicated. Growthform (Habit) codes are defined below.
Plant Families and Species HabitHabitat Type
BSS1 GBMS Dist.
Gnetophyta
Pinaceae
Pinus jeffreyi Jeffrey pine NT x xPinus monophylla singleleaf pinyon NT x
Anthophyta (Dicotyledones)
Apiaceae
Lomatium nevadense Nevada desert parsley NPH x
Asteraceae
Ambrosia acanthicarpa annual bur-sage NAH x x xArtemisia tridentata big sagebrush NS x xChaenactis stevioides desert pincushion NAH x xChaenactis xantiana fleshy pincushion NAH xChrysothamnus
viscidiflorusyellow rabbitbrush NS x x
Dieteria canescens hoary aster NPH x x xEricameria nauseosa rubber rabbitbrush NS x x xEricameria parryi Parry rabbitbrush NS xErigeron aphanactis rayless fleabane NPH xPleicanthus spinosus spiny wire lettuce NPH xTetradymia canescens spineless horsebrush NS x x
Boraginaceae
Cryptantha circumscissavar. circumscissa
cushion cryptantha NAH x x x
Cryptantha echinella prickly cryptantha NAH x x xCryptantha muricata
var. denticulataprickly-nut cryptantha NAH x
Cryptantha torreyanavar. torreyana
Torrey’s cryptantha NAH x x
Cryptantha watsonii Watson’s cryptantha NAH x

jrp43_1 123018 DRAFT B - 2 Tioga Inn Biological Resources
Plant Families and Species HabitHabitat Type
BSS1 GBMS Dist.
Boraginaceae (cont.)
Nama densa var. densa dense purple mat NAH x x
Phacelia ramosissima branching phacelia NPH xPhacelia vallis-mortae Death Valley phacelia NAH x xPlagiobothrys kingii
var. harknessiiNorthern Great Basinpopcorn flower NAH x x
Tiquilia nuttallii Nuttall’s tiquilia NAH x x x
Brassicaceae
Boechera cobrensis Masonic rockcress NPH xBoechera inyoensis Inyo rockcress NPH xBoechera pulchra beautiful rockcress NPH xBoechera retrofracta reflexed rockcress NPH xBoechera sparsiflora sicklepod rockcress NPH xCaulanthus pilosus chocolate drops NBH xDescurainia pinnata
ssp. brachycarpawestern tansy mustard NAH x x
Descurainia sophia flix-weed IAH x x xErysimum capitatum
var. capitatumDouglas’ wallflower NPH x x
Phacelia bicolor bicolored phacelia NAH x x xPhacelia vallis-mortae Death Valley phacelia NAH xPhacelia sp. phacelia NAH xSisymbrium altissimum tumble mustard IBH x x x
Chenopodiaceae
Chenopodium atrovirens dark goosefoot NAH x x xChenopodium sp. goosefoot NAH x xGrayia spinosa spiny hopsage NS x xSalsola tragus Russian thistle IAH x
Fabaceae
Astragalus newberryivar. newberryi
Newberry’s milkvetch NPH x
Lupinus argenteusvar. argenteus
silver lupine NPH x x
Lupinus argenteusvar. montigenus silver lupine NPH x
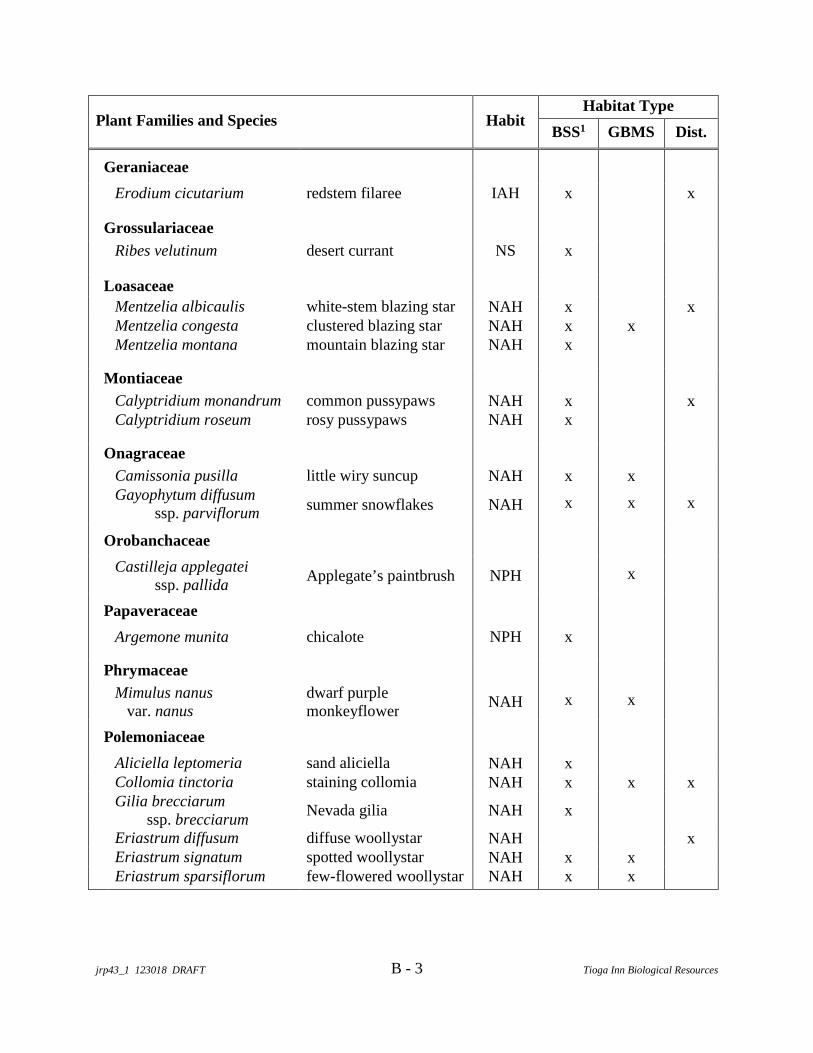
jrp43_1 123018 DRAFT B - 3 Tioga Inn Biological Resources
Plant Families and Species HabitHabitat Type
BSS1 GBMS Dist.
Geraniaceae
Erodium cicutarium redstem filaree IAH x x
Grossulariaceae
Ribes velutinum desert currant NS x
Loasaceae
Mentzelia albicaulis white-stem blazing star NAH x xMentzelia congesta clustered blazing star NAH x xMentzelia montana mountain blazing star NAH x
Montiaceae
Calyptridium monandrum common pussypaws NAH x xCalyptridium roseum rosy pussypaws NAH x
Onagraceae
Camissonia pusilla little wiry suncup NAH x xGayophytum diffusum
ssp. parviflorumsummer snowflakes NAH x x x
Orobanchaceae
Castilleja applegateissp. pallida
Applegate’s paintbrush NPH x
Papaveraceae
Argemone munita chicalote NPH x
Phrymaceae
Mimulus nanusvar. nanus
dwarf purplemonkeyflower
NAH x x
Polemoniaceae
Aliciella leptomeria sand aliciella NAH xCollomia tinctoria staining collomia NAH x x xGilia brecciarum
ssp. brecciarumNevada gilia NAH x
Eriastrum diffusum diffuse woollystar NAH xEriastrum signatum spotted woollystar NAH x xEriastrum sparsiflorum few-flowered woollystar NAH x x
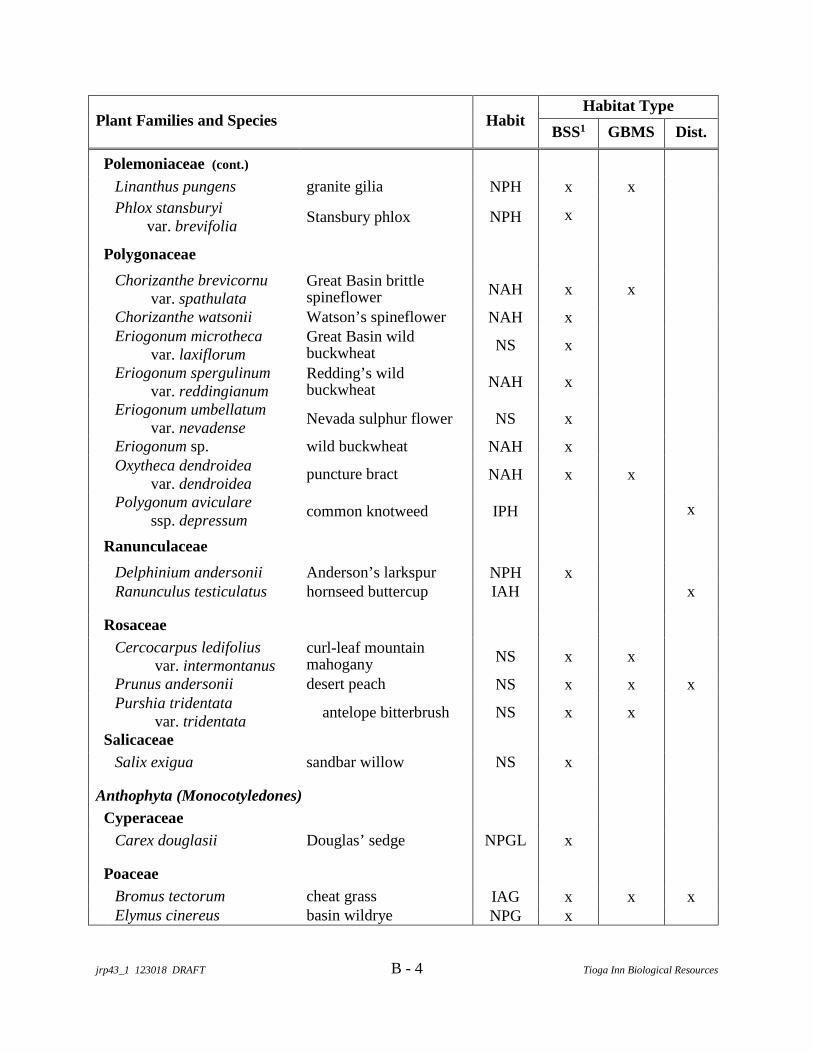
jrp43_1 123018 DRAFT B - 4 Tioga Inn Biological Resources
Plant Families and Species HabitHabitat Type
BSS1 GBMS Dist.
Polemoniaceae (cont.)
Linanthus pungens granite gilia NPH x x
Phlox stansburyivar. brevifolia
Stansbury phlox NPH x
Polygonaceae
Chorizanthe brevicornuvar. spathulata
Great Basin brittlespineflower NAH x x
Chorizanthe watsonii Watson’s spineflower NAH xEriogonum microtheca
var. laxiflorumGreat Basin wildbuckwheat NS x
Eriogonum spergulinumvar. reddingianum
Redding’s wildbuckwheat NAH x
Eriogonum umbellatumvar. nevadense
Nevada sulphur flower NS x
Eriogonum sp. wild buckwheat NAH xOxytheca dendroidea
var. dendroideapuncture bract NAH x x
Polygonum avicularessp. depressum
common knotweed IPH x
Ranunculaceae
Delphinium andersonii Anderson’s larkspur NPH xRanunculus testiculatus hornseed buttercup IAH x
Rosaceae
Cercocarpus ledifoliusvar. intermontanus
curl-leaf mountainmahogany NS x x
Prunus andersonii desert peach NS x x xPurshia tridentata
var. tridentataantelope bitterbrush NS x x
Salicaceae
Salix exigua sandbar willow NS x
Anthophyta (Monocotyledones)
Cyperaceae
Carex douglasii Douglas’ sedge NPGL x
Poaceae
Bromus tectorum cheat grass IAG x x xElymus cinereus basin wildrye NPG x
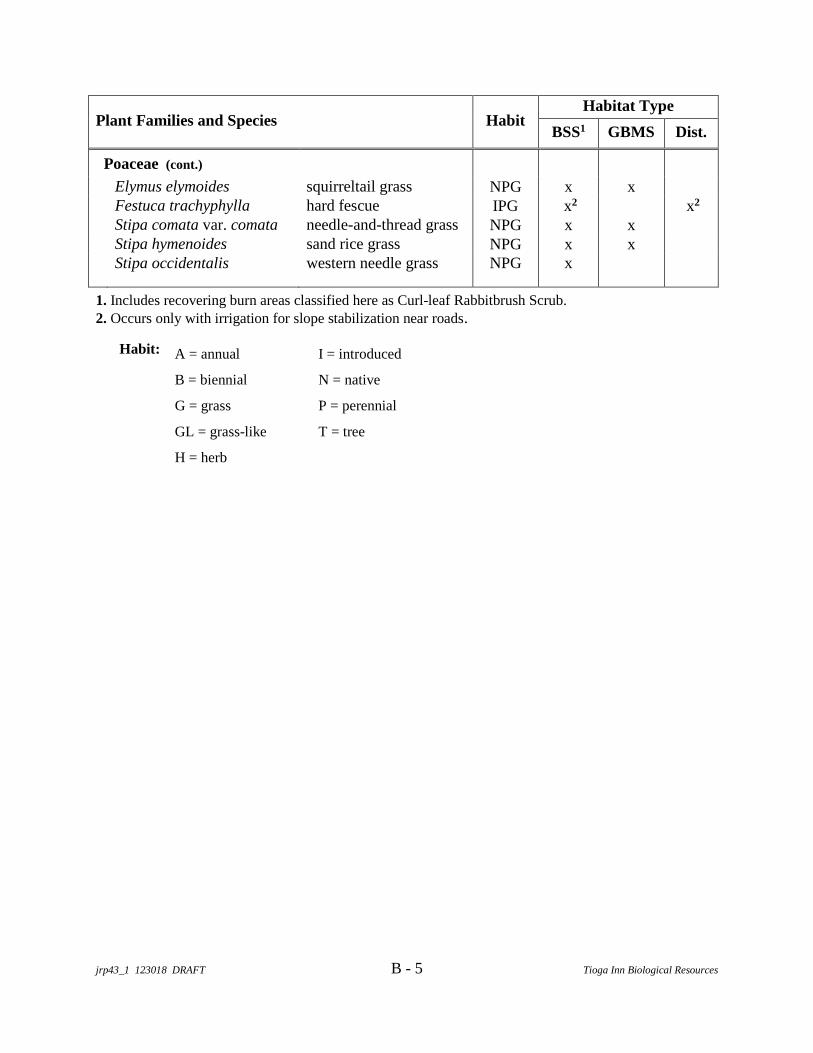
jrp43_1 123018 DRAFT B - 5 Tioga Inn Biological Resources
Plant Families and Species HabitHabitat Type
BSS1 GBMS Dist.
Poaceae (cont.)
Elymus elymoides squirreltail grass NPG x xFestuca trachyphylla hard fescue IPG x2 x2
Stipa comata var. comata needle-and-thread grass NPG x xStipa hymenoides sand rice grass NPG x xStipa occidentalis western needle grass NPG x
1. Includes recovering burn areas classified here as Curl-leaf Rabbitbrush Scrub.2. Occurs only with irrigation for slope stabilization near roads.
Habit: A = annual I = introduced
B = biennial N = native
G = grass P = perennial
GL = grass-like T = tree
H = herb
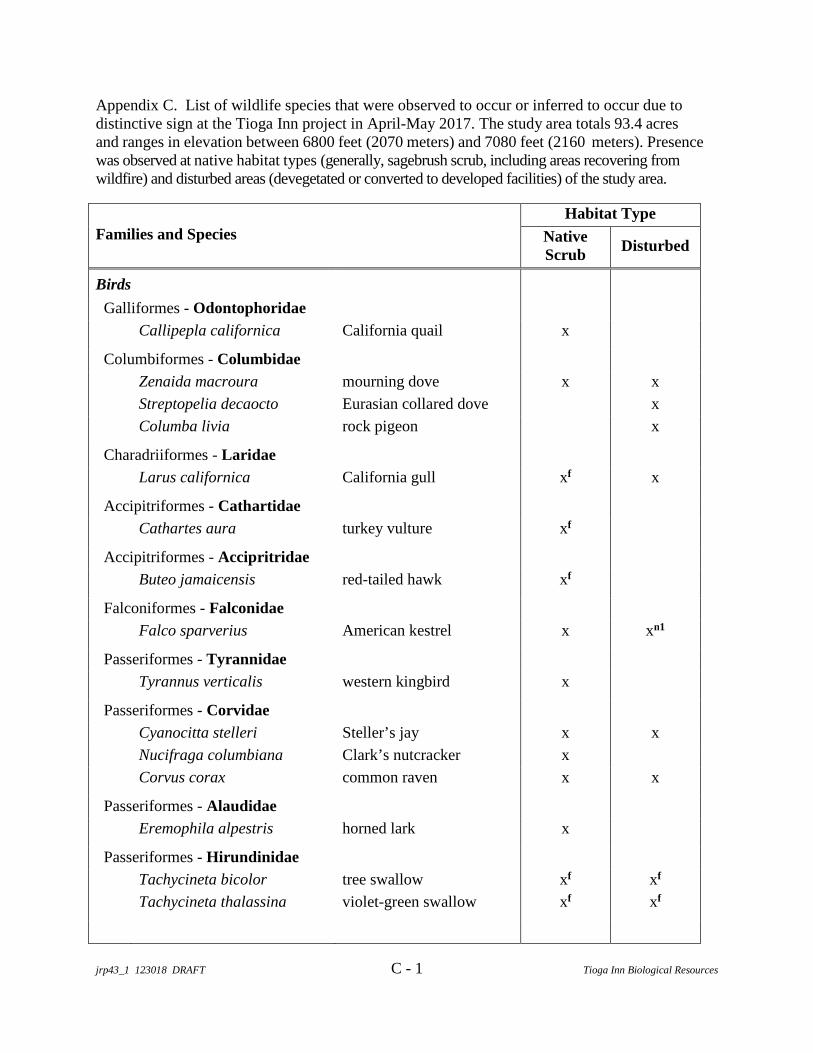
jrp43_1 123018 DRAFT C - 1 Tioga Inn Biological Resources
Appendix C. List of wildlife species that were observed to occur or inferred to occur due todistinctive sign at the Tioga Inn project in April-May 2017. The study area totals 93.4 acresand ranges in elevation between 6800 feet (2070 meters) and 7080 feet (2160 meters). Presencewas observed at native habitat types (generally, sagebrush scrub, including areas recovering fromwildfire) and disturbed areas (devegetated or converted to developed facilities) of the study area.
Families and Species
Habitat Type
NativeScrub
Disturbed
Birds
Galliformes - Odontophoridae
Callipepla californica California quail x
Columbiformes - Columbidae
Zenaida macroura mourning dove x x
Streptopelia decaocto Eurasian collared dove x
Columba livia rock pigeon x
Charadriiformes - Laridae
Larus californica California gull xf x
Accipitriformes - Cathartidae
Cathartes aura turkey vulture xf
Accipitriformes - Accipritridae
Buteo jamaicensis red-tailed hawk xf
Falconiformes - Falconidae
Falco sparverius American kestrel x xn1
Passeriformes - Tyrannidae
Tyrannus verticalis western kingbird x
Passeriformes - Corvidae
Cyanocitta stelleri Steller’s jay x x
Nucifraga columbiana Clark’s nutcracker x
Corvus corax common raven x x
Passeriformes - Alaudidae
Eremophila alpestris horned lark x
Passeriformes - Hirundinidae
Tachycineta bicolor tree swallow xf xf
Tachycineta thalassina violet-green swallow xf xf
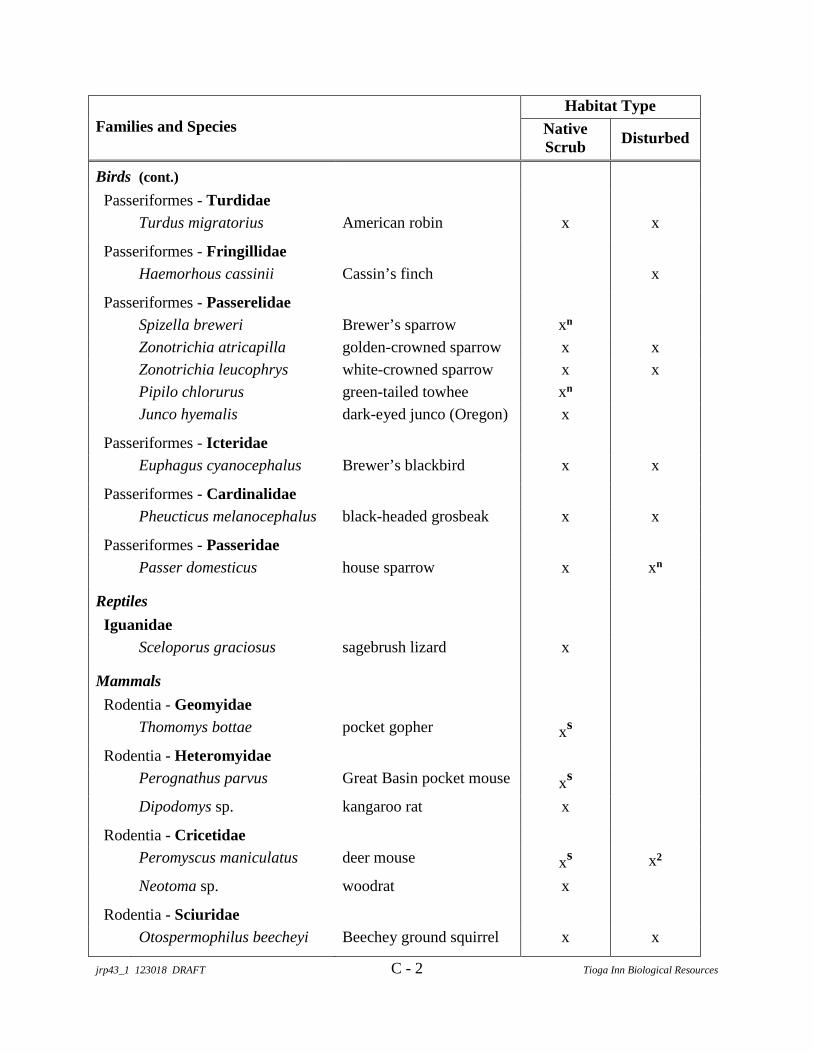
jrp43_1 123018 DRAFT C - 2 Tioga Inn Biological Resources
Families and Species
Habitat Type
NativeScrub
Disturbed
Birds (cont.)
Passeriformes - Turdidae
Turdus migratorius American robin x x
Passeriformes - Fringillidae
Haemorhous cassinii Cassin’s finch x
Passeriformes - Passerelidae
Spizella breweri Brewer’s sparrow xn
Zonotrichia atricapilla golden-crowned sparrow x x
Zonotrichia leucophrys white-crowned sparrow x x
Pipilo chlorurus green-tailed towhee xn
Junco hyemalis dark-eyed junco (Oregon) x
Passeriformes - Icteridae
Euphagus cyanocephalus Brewer’s blackbird x x
Passeriformes - Cardinalidae
Pheucticus melanocephalus black-headed grosbeak x x
Passeriformes - Passeridae
Passer domesticus house sparrow x xn
Reptiles
Iguanidae
Sceloporus graciosus sagebrush lizard x
Mammals
Rodentia - Geomyidae
Thomomys bottae pocket gopher xs
Rodentia - Heteromyidae
Perognathus parvus Great Basin pocket mouse xs
Dipodomys sp. kangaroo rat x
Rodentia - Cricetidae
Peromyscus maniculatus deer mouse xs x2
Neotoma sp. woodrat x
Rodentia - Sciuridae
Otospermophilus beecheyi Beechey ground squirrel x x
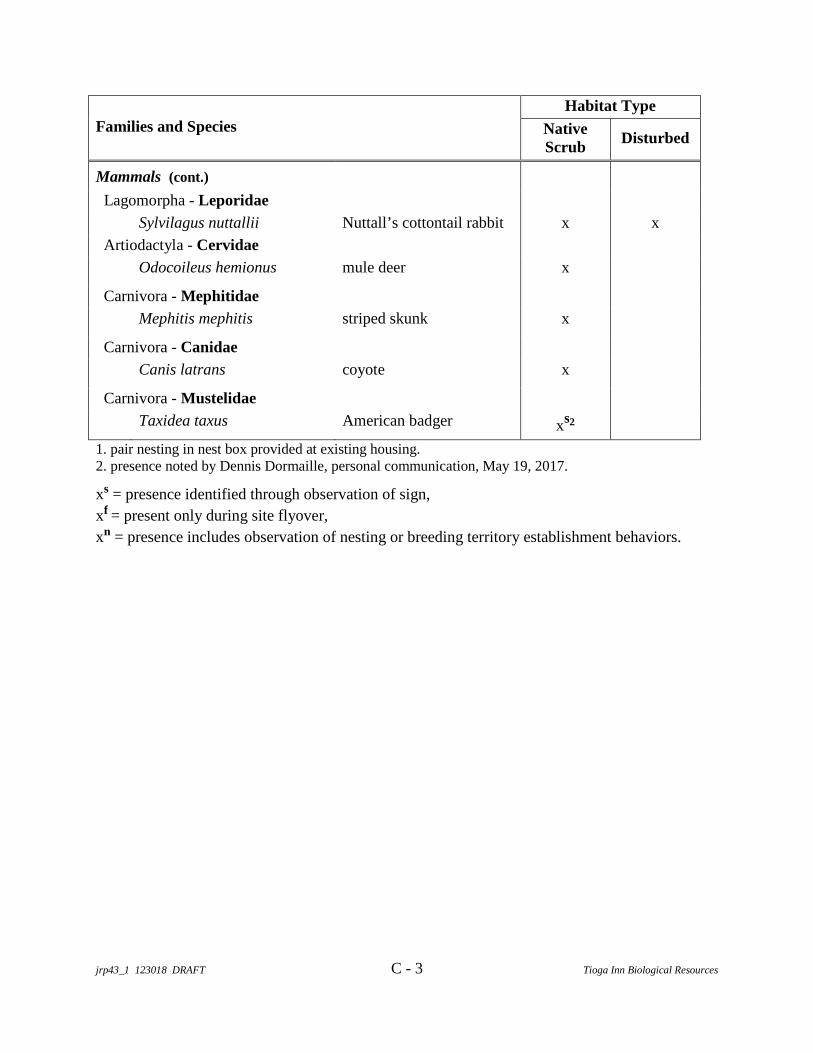
jrp43_1 123018 DRAFT C - 3 Tioga Inn Biological Resources
Families and Species
Habitat Type
NativeScrub
Disturbed
Mammals (cont.)
Lagomorpha - Leporidae
Sylvilagus nuttallii Nuttall’s cottontail rabbit x x
Artiodactyla - Cervidae
Odocoileus hemionus mule deer x
Carnivora - Mephitidae
Mephitis mephitis striped skunk x
Carnivora - Canidae
Canis latrans coyote x
Carnivora - Mustelidae
Taxidea taxus American badger xs2
1. pair nesting in nest box provided at existing housing.2. presence noted by Dennis Dormaille, personal communication, May 19, 2017.
xs = presence identified through observation of sign,
xf = present only during site flyover,
xn = presence includes observation of nesting or breeding territory establishment behaviors.

APPENDIX J1
Archaeological Report
By Trans Sierran Archaeological Research

An Archaeological Survey of the Tioga Workforce Housing Project Area, Lee Vining, California
Prepared by Mary Farrell Trans-Sierran Archaeological Research, with Bauer Planning and Environmental Services, Inc., for Mono County Community Development Department
June 4, 2019
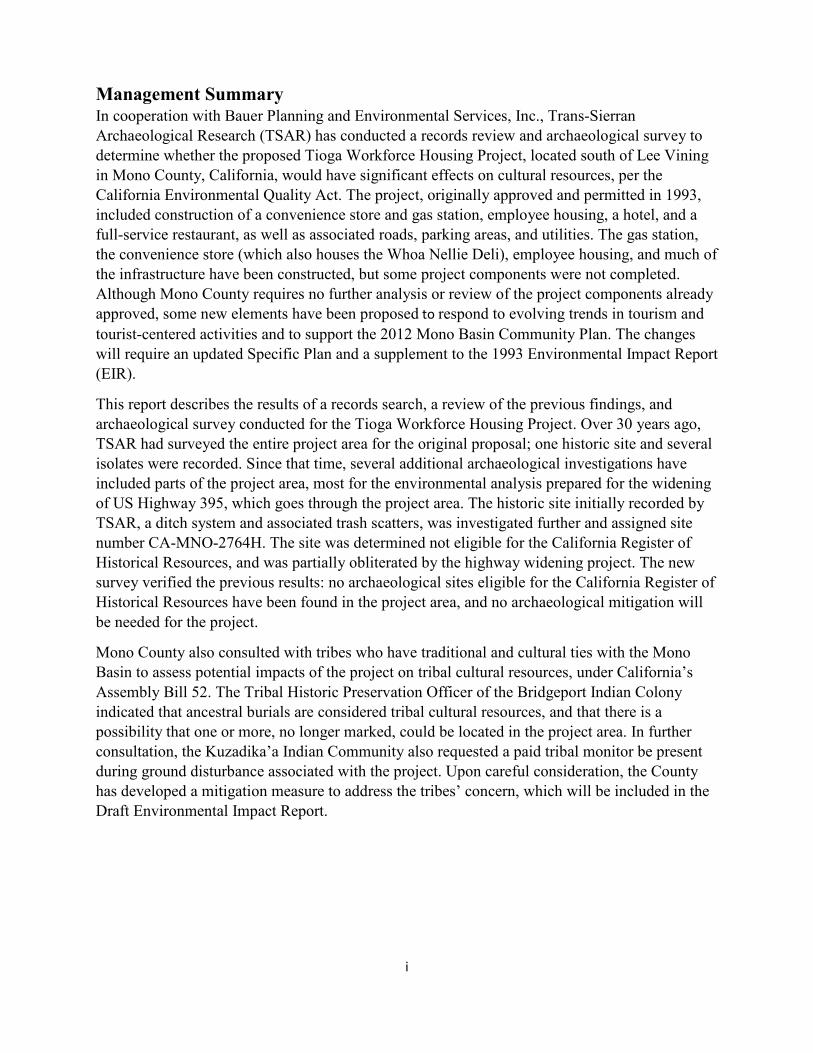
i
Management Summary In cooperation with Bauer Planning and Environmental Services, Inc., Trans-Sierran Archaeological Research (TSAR) has conducted a records review and archaeological survey to determine whether the proposed Tioga Workforce Housing Project, located south of Lee Vining in Mono County, California, would have significant effects on cultural resources, per the California Environmental Quality Act. The project, originally approved and permitted in 1993, included construction of a convenience store and gas station, employee housing, a hotel, and a full-service restaurant, as well as associated roads, parking areas, and utilities. The gas station, the convenience store (which also houses the Whoa Nellie Deli), employee housing, and much of the infrastructure have been constructed, but some project components were not completed. Although Mono County requires no further analysis or review of the project components already approved, some new elements have been proposed to respond to evolving trends in tourism and tourist-centered activities and to support the 2012 Mono Basin Community Plan. The changes will require an updated Specific Plan and a supplement to the 1993 Environmental Impact Report (EIR).
This report describes the results of a records search, a review of the previous findings, and archaeological survey conducted for the Tioga Workforce Housing Project. Over 30 years ago, TSAR had surveyed the entire project area for the original proposal; one historic site and several isolates were recorded. Since that time, several additional archaeological investigations have included parts of the project area, most for the environmental analysis prepared for the widening of US Highway 395, which goes through the project area. The historic site initially recorded by TSAR, a ditch system and associated trash scatters, was investigated further and assigned site number CA-MNO-2764H. The site was determined not eligible for the California Register of Historical Resources, and was partially obliterated by the highway widening project. The new survey verified the previous results: no archaeological sites eligible for the California Register of Historical Resources have been found in the project area, and no archaeological mitigation will be needed for the project.
Mono County also consulted with tribes who have traditional and cultural ties with the Mono Basin to assess potential impacts of the project on tribal cultural resources, under California’s Assembly Bill 52. The Tribal Historic Preservation Officer of the Bridgeport Indian Colony indicated that ancestral burials are considered tribal cultural resources, and that there is a possibility that one or more, no longer marked, could be located in the project area. In further consultation, the Kuzadika’a Indian Community also requested a paid tribal monitor be present during ground disturbance associated with the project. Upon careful consideration, the County has developed a mitigation measure to address the tribes’ concern, which will be included in the Draft Environmental Impact Report.
ii
Table of Contents Management Summary ................................................................................................................................. i
Introduction .................................................................................................................................................. 1
Project Location and Environmental Setting ................................................................................................ 4
Historical Background ................................................................................................................................... 5
Previous Investigations / Records Review .................................................................................................... 7
Survey Methods and Results....................................................................................................................... 10
Context for Evaluation and Significance ..................................................................................................... 14
Recommendations ...................................................................................................................................... 15
References .................................................................................................................................................. 17
Figures Figure 1. Regional location map………………………………………………………………………………………………………………2 Figure 2. Overview of project area………………………………………………………………………………………………………….3 Figure 3. Tioga Workforce Housing Project Area location……………………………………………………………………….5 Figure 4. Portion of the USGS 1901 Mt Lyell topo map…………………………………………………………………………..7 Figure 5. Portion of the USGS 1953 Mono Craters topo map………………………………………………………………….7 Figure 6. Alignment of Lee Vining Ditch System………………………………………………………………………………………9 Figure 7. Location of isolates …………………………..………………… REDACTED …………………………………………….. 11 Figure 8. Location of isolates, on Google Earth satellite photo……………REDACTED……………………………… 11 Figure 9. Isolate 1, Vernon Ware bowl………………………………………………………………………………………………… 13 Figure 10. Similar Vernon Ware bowl for sale on eBay………….……………………………………………………………...13 Figure 11. Isolate 13, Sun-Rise soda bottle……………………………………………………………………………………..……..14 Figure 12. Isolate 3, high-cut stump……………………………………………………………………………………………………….14
1
Introduction This report describes archaeological survey conducted as part of environmental studies to determine potential effects of the proposed Tioga Workforce Housing project, about ½ mile south of Lee Vining, California. The project area is located at 22 Vista Point Road, close to the intersection of SR 120 and US395. The project is in roughly the geographic center of Mono County, which covers an area of 3,132 square miles on the eastern slopes of the Sierra Nevada mountain range in east central California. The project parcel comprises the southeast quarter of the northwest quarter and the southwest quarter of the northeast quarter of Section 14, Township 1 North, Range 26 East (MDBM).
The Tioga Workforce Housing project proposal encompasses multiple elements, many of which were analyzed in a Final EIR and Specific Plan that was certified by the Mono County Board of Supervisors in 1993. The original concept, as reflected in the 1993 documents, was to provide a full range of services and facilities for tourists (visiting Yosemite National Park, the Mono National Scenic Recreation Area, the Lee Vining area, and the eastern Sierra Nevada generally), as well as meeting facilities, jobs and employee housing opportunities for area residents.
The current proposal retains the goals and concepts developed in 1993, with several newly added elements. Most significantly, the current proposal would provide up to 150 new workforce housing bedrooms. The current proposal also provides for a third gas pump island and overhead canopy, adds additional parking (to accommodate onsite guest vehicles as well as a general-use park-and-ride facility and bus parking for Yosemite transit vehicles), expands the existing onsite septic system to increase capacity and incorporate a subsurface irrigation system, replaces an existing water storage tank with a new tank on a nearby site, adds a new 30,000-gallon onsite propane tank (the new tank would eventually replace the existing five onsite tanks with a combined 2,500-gallon capacity), modifies the boundaries and acreage of designated open space, and modifies parcel boundaries.
Several of the uses approved in 1993 were constructed and placed into operation during the late 1990s. Construction of the hotel and restaurant elements was postponed due to a general economic downturn and other factors. The purpose of the current project proposal is to complement earlier-approved components with modifications and new elements that respond to evolving trends in tourism, resource conservation and employment.
Although Mono County requires no further analysis or review of the originally proposed project components, implementing the proposed changes to the previously approved project will require an updated Specific Plan and a supplement to the 1993 Environmental Impact Report (EIR). The Mono County Community Development Department has contracted with Bauer Planning and Environmental Services, Inc., to help prepare the Specific Plan and EIR supplement. This report describes the results of a cultural resources records search, a review of the previous findings, and archaeological survey to determine if there are historical resources that would be affected by the proposed project. The work was conducted for the EIR supplement by Trans-Sierran Archaeological Research, as part of the Bauer team.
2
Mono County also consulted with tribes who have traditional and cultural ties with the Mono Basin to assess potential impacts of the project on tribal cultural resources, under California’s Assembly Bill 52. AB 52 requires that tribal cultural resources be considered under the California Environmental Quality Act: tribal cultural resources often include archaeological sites, but they can also include places, objects, sites, or landscapes that are not discernible to, or adequately evaluated by, archaeologists. Indian communities may have additional information and concerns that should be considered in the environmental analyses.
Under the provisions of AB 52, the Washoe Tribe of Nevada and California requested to be consulted about any projects that might affect Washoe cultural resources. The Bridgeport Indian Colony also requested to be consulted about the Tioga Workforce Housing project. Because of their proximity to the project area and their historical ties to Mono Basin, the Kutzedika'a Indian Community of Lee Vining and the Utu Utu Gwaitu Tribe of the Benton Paiute Reservation were also contacted. A previous draft of this report was shared with those four Tribes to provide them with information about the results of the archaeological investigations.
Figure 1. Overview of project area. View from approved hotel site looking toward Whoa Nellie Deli and Mobil Gas Station.
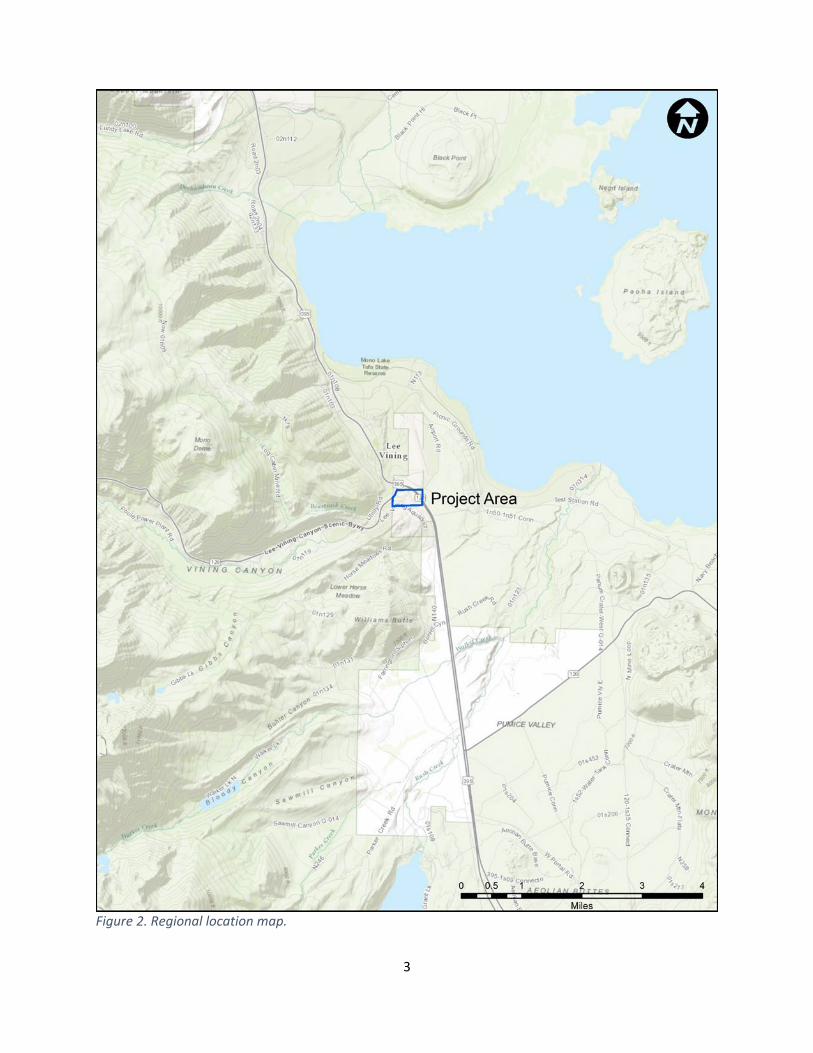
3
Figure 2. Regional location map.

4
Project Location and Environmental Setting The proposed project is located on the site of the existing Tioga Gas Mart and Whoa Nellie Deli near the town of Lee Vining in Mono County. The 74-acre parcel is located in the Mono Basin, just south of the intersection of State Route 120 and US Highway 395 (Figures 1-3). About 64 acres of the parcel lie west of US Highway 395, and 10 acres to the east. An archaeological survey was conducted of the entire project area (Burton 1984) as part of environmental studies undertaken to evaluate the potential effects of the original proposal, but a new survey was considered necessary for the current project for three reasons. First, archaeological site visibility can vary over the decades, due to erosion and sedimentation, changes in vegetative cover, or exposure from ground disturbance. Second, the original survey may have ignored cultural resources too young to be considered historic in 1984, but which now meet the age requirement for the California Register of Historical Resources. Third, changes to the California Environmental Quality Act that went into effect in 2016 require consultation with Tribes to determine if a proposed project could affect Tribal Cultural Resources, and consultation can benefit from a more-current archaeological survey.
Setting and background information is adapted from the previous survey report (Burton 1984), updated where there have been changes in the decades since that report was written. The project area is located just south of the small town of Lee Vining, California, and a little over a mile west of the present shore of saline Mono Lake, on the western margin of the Basin and Range province. The Sierra Nevada range rises steeply to the west, and the topography of the project area consists of a lateral glacial moraine and adjacent hillsides and flats. Elevations range from approximately 6800 to 6960 feet above sea level; soils are eroded glacial, lacustrine, and volcanic deposits.
In the rain shadow of the Sierra Nevada, the Lee Vining area receives an average of 15 inches of precipitation annually, with most of it falling as snow. Fresh water is available year-round in Lee Vining Creek just west of the project area, and a now-dry spring once flowed intermittently on the project’s east-facing slope, along a geological fault (Jim Palus, personal communication 2016). Vegetation within the project area includes bitterbrush (Purshia tridentata), sagebrush (Artemisia tridentata), rabbitbrush (Chrysothamnus nauseosus), desert peach (Prunus andersonii), aster (Aster sp.), and various grasses, including Indian rice grass (Oryzopsis hymenoides). In addition, there are several isolated pinyon pine trees (Pinus monophyla), Jeffrey pine (P. jeffreyii), lodgepole pine (P. murrayana), wild rose (Rosa sp.), and willow (Salix sp.). Lawns, ornamental shrubs, and aspen have been planted as landscaping around the residences and parking lots.
Fauna of the area include mule deer (Odocoileus hemionus), bear (Ursus americanus), numerous small rodents and migratory waterfowl, and other birds. Antelope (Antilocapra americana) and possibly mountain sheep (Ovis canadensis) may have been present in earlier times. More details of the environmental setting will be available in other reports prepared for the EIR supplement.
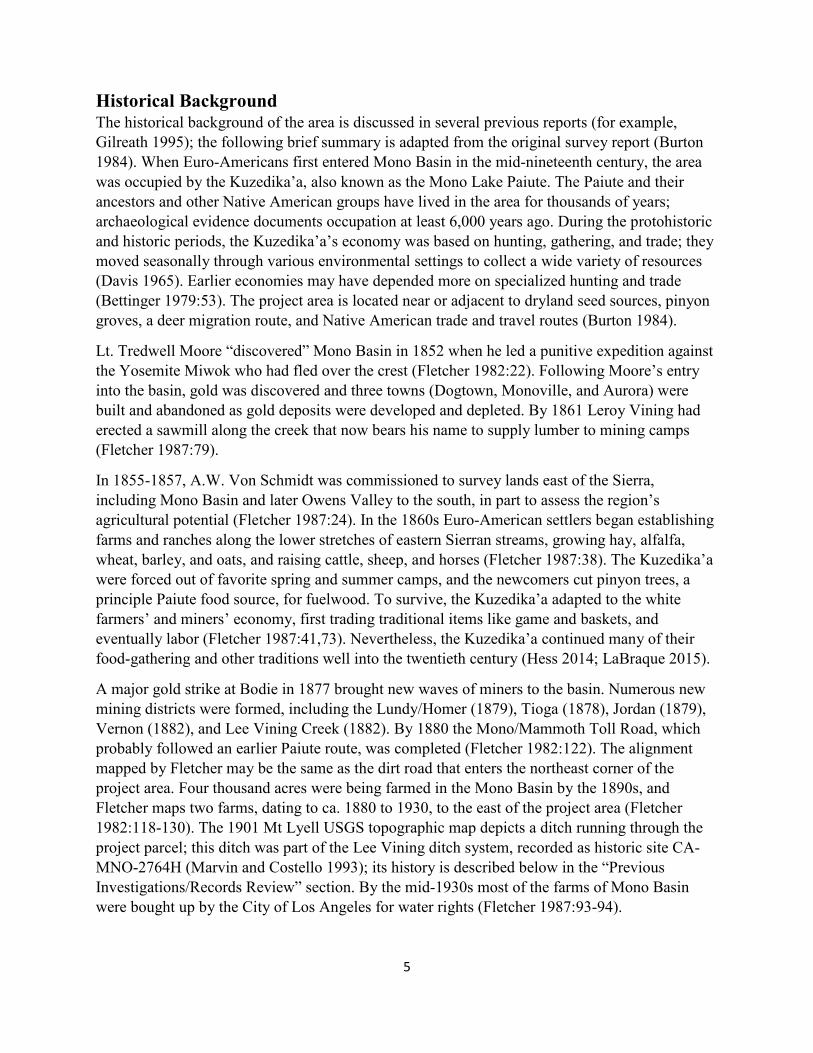
5
Historical Background The historical background of the area is discussed in several previous reports (for example, Gilreath 1995); the following brief summary is adapted from the original survey report (Burton 1984). When Euro-Americans first entered Mono Basin in the mid-nineteenth century, the area was occupied by the Kuzedika’a, also known as the Mono Lake Paiute. The Paiute and their ancestors and other Native American groups have lived in the area for thousands of years; archaeological evidence documents occupation at least 6,000 years ago. During the protohistoric and historic periods, the Kuzedika’a’s economy was based on hunting, gathering, and trade; they moved seasonally through various environmental settings to collect a wide variety of resources (Davis 1965). Earlier economies may have depended more on specialized hunting and trade (Bettinger 1979:53). The project area is located near or adjacent to dryland seed sources, pinyon groves, a deer migration route, and Native American trade and travel routes (Burton 1984).
Lt. Tredwell Moore “discovered” Mono Basin in 1852 when he led a punitive expedition against the Yosemite Miwok who had fled over the crest (Fletcher 1982:22). Following Moore’s entry into the basin, gold was discovered and three towns (Dogtown, Monoville, and Aurora) were built and abandoned as gold deposits were developed and depleted. By 1861 Leroy Vining had erected a sawmill along the creek that now bears his name to supply lumber to mining camps (Fletcher 1987:79).
In 1855-1857, A.W. Von Schmidt was commissioned to survey lands east of the Sierra, including Mono Basin and later Owens Valley to the south, in part to assess the region’s agricultural potential (Fletcher 1987:24). In the 1860s Euro-American settlers began establishing farms and ranches along the lower stretches of eastern Sierran streams, growing hay, alfalfa, wheat, barley, and oats, and raising cattle, sheep, and horses (Fletcher 1987:38). The Kuzedika’a were forced out of favorite spring and summer camps, and the newcomers cut pinyon trees, a principle Paiute food source, for fuelwood. To survive, the Kuzedika’a adapted to the white farmers’ and miners’ economy, first trading traditional items like game and baskets, and eventually labor (Fletcher 1987:41,73). Nevertheless, the Kuzedika’a continued many of their food-gathering and other traditions well into the twentieth century (Hess 2014; LaBraque 2015).
A major gold strike at Bodie in 1877 brought new waves of miners to the basin. Numerous new mining districts were formed, including the Lundy/Homer (1879), Tioga (1878), Jordan (1879), Vernon (1882), and Lee Vining Creek (1882). By 1880 the Mono/Mammoth Toll Road, which probably followed an earlier Paiute route, was completed (Fletcher 1982:122). The alignment mapped by Fletcher may be the same as the dirt road that enters the northeast corner of the project area. Four thousand acres were being farmed in the Mono Basin by the 1890s, and Fletcher maps two farms, dating to ca. 1880 to 1930, to the east of the project area (Fletcher 1982:118-130). The 1901 Mt Lyell USGS topographic map depicts a ditch running through the project parcel; this ditch was part of the Lee Vining ditch system, recorded as historic site CA-MNO-2764H (Marvin and Costello 1993); its history is described below in the “Previous Investigations/Records Review” section. By the mid-1930s most of the farms of Mono Basin were bought up by the City of Los Angeles for water rights (Fletcher 1987:93-94).
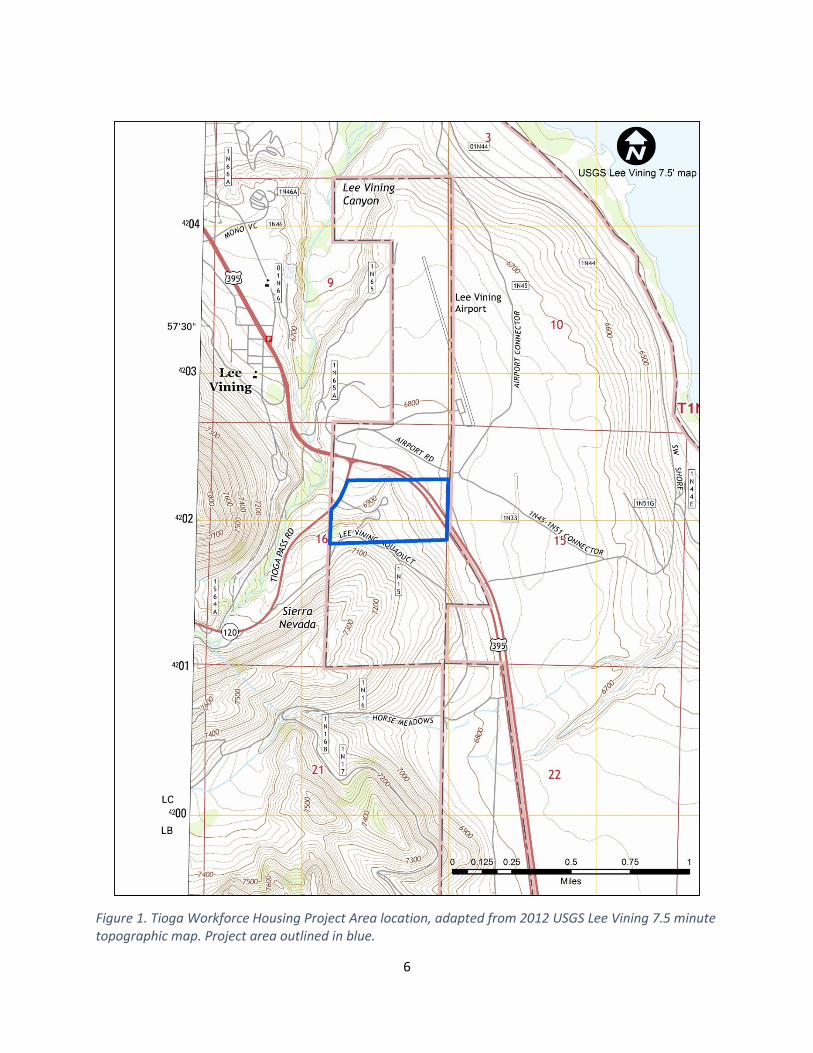
6
Figure 1. Tioga Workforce Housing Project Area location, adapted from 2012 USGS Lee Vining 7.5 minute topographic map. Project area outlined in blue.
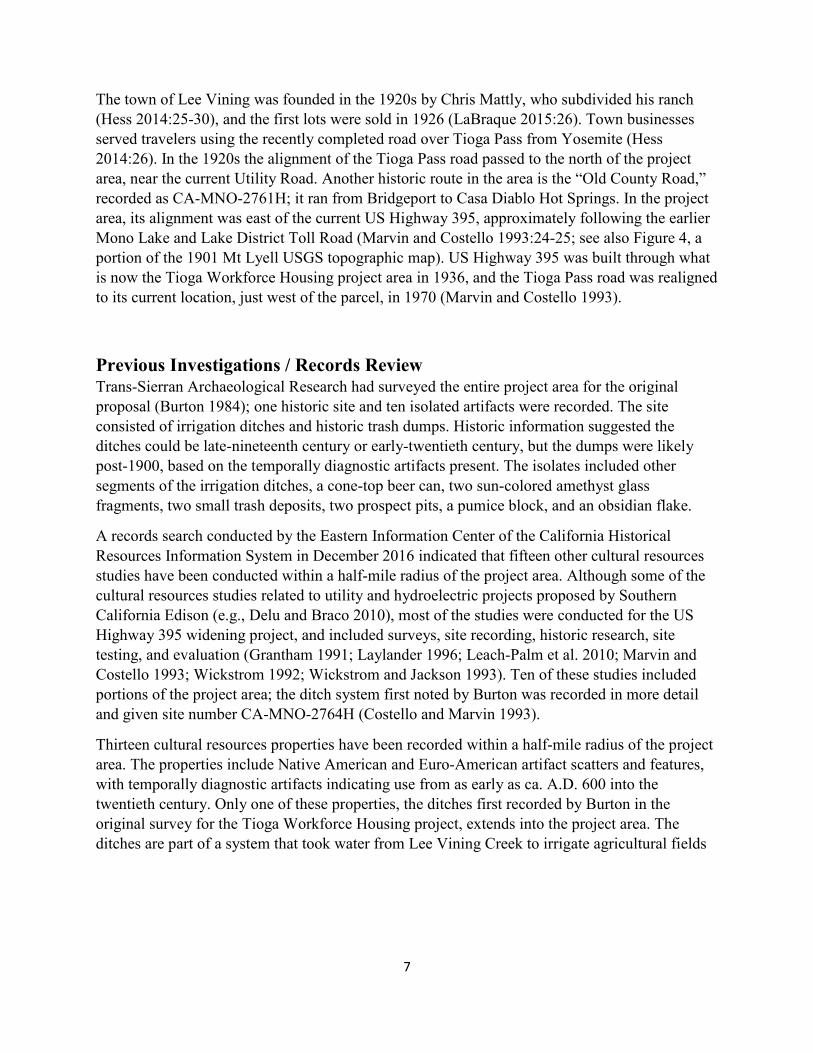
7
The town of Lee Vining was founded in the 1920s by Chris Mattly, who subdivided his ranch (Hess 2014:25-30), and the first lots were sold in 1926 (LaBraque 2015:26). Town businesses served travelers using the recently completed road over Tioga Pass from Yosemite (Hess 2014:26). In the 1920s the alignment of the Tioga Pass road passed to the north of the project area, near the current Utility Road. Another historic route in the area is the “Old County Road,” recorded as CA-MNO-2761H; it ran from Bridgeport to Casa Diablo Hot Springs. In the project area, its alignment was east of the current US Highway 395, approximately following the earlier Mono Lake and Lake District Toll Road (Marvin and Costello 1993:24-25; see also Figure 4, a portion of the 1901 Mt Lyell USGS topographic map). US Highway 395 was built through what is now the Tioga Workforce Housing project area in 1936, and the Tioga Pass road was realigned to its current location, just west of the parcel, in 1970 (Marvin and Costello 1993).
Previous Investigations / Records Review Trans-Sierran Archaeological Research had surveyed the entire project area for the original proposal (Burton 1984); one historic site and ten isolated artifacts were recorded. The site consisted of irrigation ditches and historic trash dumps. Historic information suggested the ditches could be late-nineteenth century or early-twentieth century, but the dumps were likely post-1900, based on the temporally diagnostic artifacts present. The isolates included other segments of the irrigation ditches, a cone-top beer can, two sun-colored amethyst glass fragments, two small trash deposits, two prospect pits, a pumice block, and an obsidian flake.
A records search conducted by the Eastern Information Center of the California Historical Resources Information System in December 2016 indicated that fifteen other cultural resources studies have been conducted within a half-mile radius of the project area. Although some of the cultural resources studies related to utility and hydroelectric projects proposed by Southern California Edison (e.g., Delu and Braco 2010), most of the studies were conducted for the US Highway 395 widening project, and included surveys, site recording, historic research, site testing, and evaluation (Grantham 1991; Laylander 1996; Leach-Palm et al. 2010; Marvin and Costello 1993; Wickstrom 1992; Wickstrom and Jackson 1993). Ten of these studies included portions of the project area; the ditch system first noted by Burton was recorded in more detail and given site number CA-MNO-2764H (Costello and Marvin 1993).
Thirteen cultural resources properties have been recorded within a half-mile radius of the project area. The properties include Native American and Euro-American artifact scatters and features, with temporally diagnostic artifacts indicating use from as early as ca. A.D. 600 into the twentieth century. Only one of these properties, the ditches first recorded by Burton in the original survey for the Tioga Workforce Housing project, extends into the project area. The ditches are part of a system that took water from Lee Vining Creek to irrigate agricultural fields
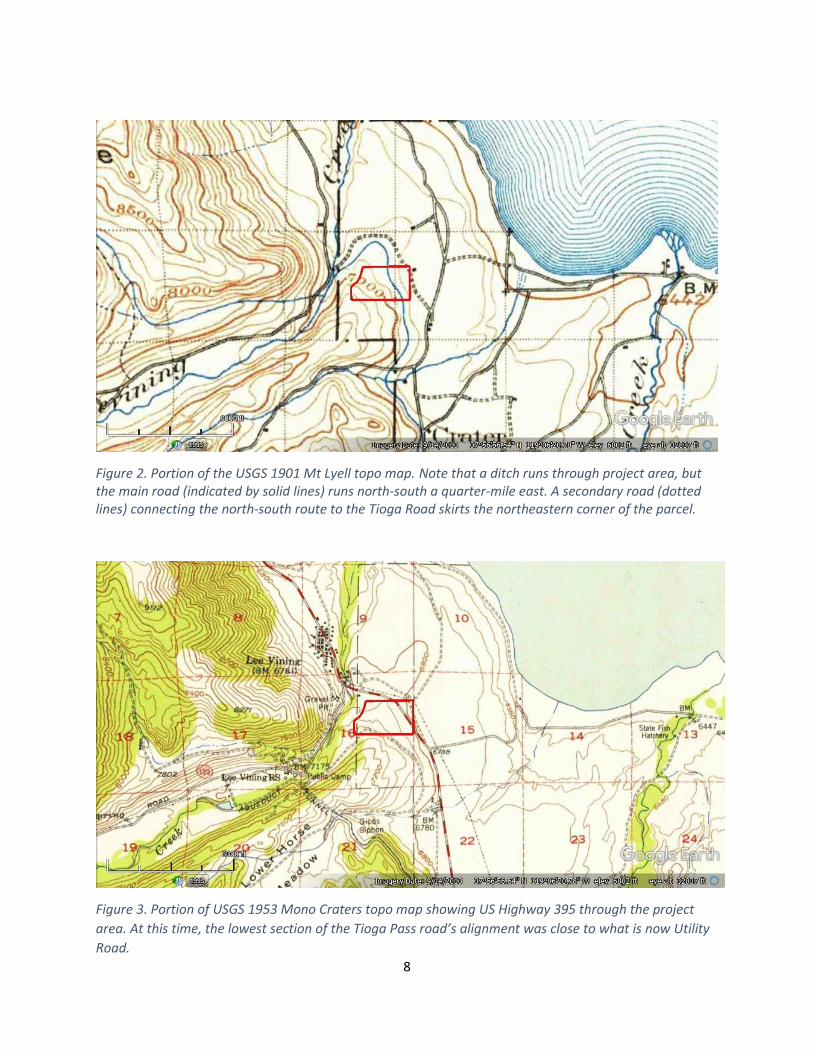
8
Figure 2. Portion of the USGS 1901 Mt Lyell topo map. Note that a ditch runs through project area, but the main road (indicated by solid lines) runs north-south a quarter-mile east. A secondary road (dotted lines) connecting the north-south route to the Tioga Road skirts the northeastern corner of the parcel.
Figure 3. Portion of USGS 1953 Mono Craters topo map showing US Highway 395 through the project area. At this time, the lowest section of the Tioga Pass road’s alignment was close to what is now Utility Road.
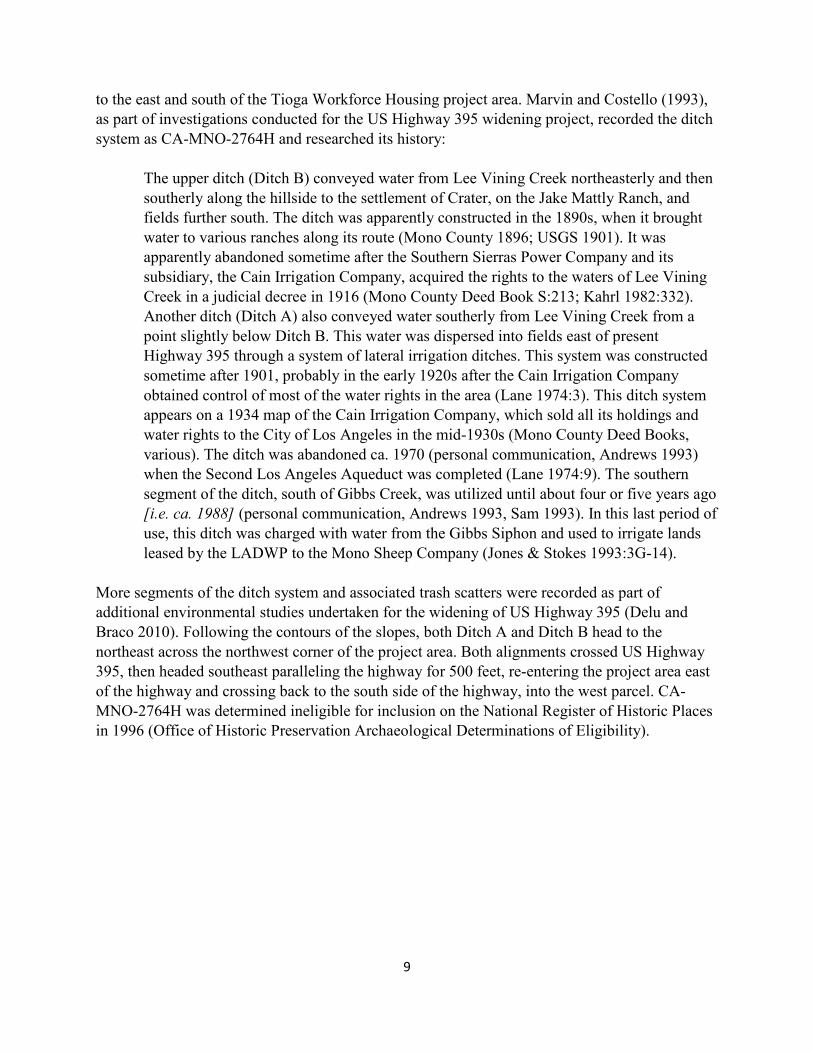
9
to the east and south of the Tioga Workforce Housing project area. Marvin and Costello (1993), as part of investigations conducted for the US Highway 395 widening project, recorded the ditch system as CA-MNO-2764H and researched its history:
The upper ditch (Ditch B) conveyed water from Lee Vining Creek northeasterly and then southerly along the hillside to the settlement of Crater, on the Jake Mattly Ranch, and fields further south. The ditch was apparently constructed in the 1890s, when it brought water to various ranches along its route (Mono County 1896; USGS 1901). It was apparently abandoned sometime after the Southern Sierras Power Company and its subsidiary, the Cain Irrigation Company, acquired the rights to the waters of Lee Vining Creek in a judicial decree in 1916 (Mono County Deed Book S:213; Kahrl 1982:332). Another ditch (Ditch A) also conveyed water southerly from Lee Vining Creek from a point slightly below Ditch B. This water was dispersed into fields east of present Highway 395 through a system of lateral irrigation ditches. This system was constructed sometime after 1901, probably in the early 1920s after the Cain Irrigation Company obtained control of most of the water rights in the area (Lane 1974:3). This ditch system appears on a 1934 map of the Cain Irrigation Company, which sold all its holdings and water rights to the City of Los Angeles in the mid-1930s (Mono County Deed Books, various). The ditch was abandoned ca. 1970 (personal communication, Andrews 1993) when the Second Los Angeles Aqueduct was completed (Lane 1974:9). The southern segment of the ditch, south of Gibbs Creek, was utilized until about four or five years ago [i.e. ca. 1988] (personal communication, Andrews 1993, Sam 1993). In this last period of use, this ditch was charged with water from the Gibbs Siphon and used to irrigate lands leased by the LADWP to the Mono Sheep Company (Jones & Stokes 1993:3G-14).
More segments of the ditch system and associated trash scatters were recorded as part of additional environmental studies undertaken for the widening of US Highway 395 (Delu and Braco 2010). Following the contours of the slopes, both Ditch A and Ditch B head to the northeast across the northwest corner of the project area. Both alignments crossed US Highway 395, then headed southeast paralleling the highway for 500 feet, re-entering the project area east of the highway and crossing back to the south side of the highway, into the west parcel. CA- MNO-2764H was determined ineligible for inclusion on the National Register of Historic Places in 1996 (Office of Historic Preservation Archaeological Determinations of Eligibility).
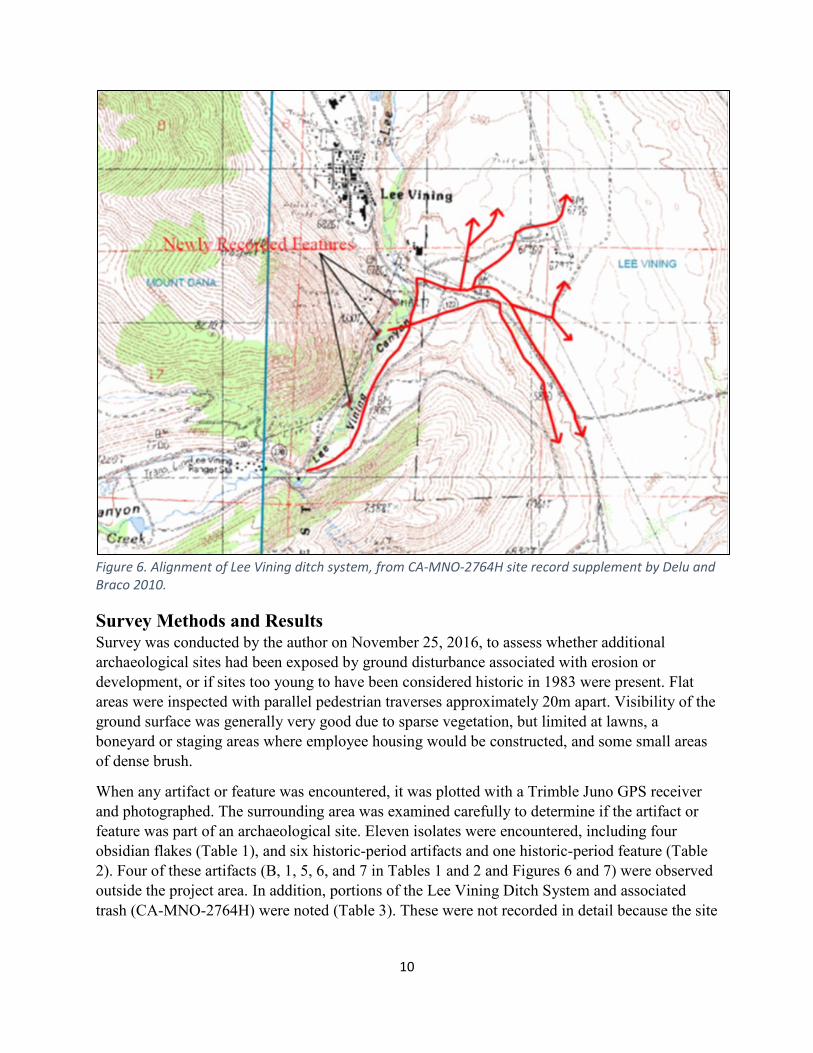
10
Figure 6. Alignment of Lee Vining ditch system, from CA-MNO-2764H site record supplement by Delu and Braco 2010.
Survey Methods and Results Survey was conducted by the author on November 25, 2016, to assess whether additional archaeological sites had been exposed by ground disturbance associated with erosion or development, or if sites too young to have been considered historic in 1983 were present. Flat areas were inspected with parallel pedestrian traverses approximately 20m apart. Visibility of the ground surface was generally very good due to sparse vegetation, but limited at lawns, a boneyard or staging areas where employee housing would be constructed, and some small areas of dense brush.
When any artifact or feature was encountered, it was plotted with a Trimble Juno GPS receiver and photographed. The surrounding area was examined carefully to determine if the artifact or feature was part of an archaeological site. Eleven isolates were encountered, including four obsidian flakes (Table 1), and six historic-period artifacts and one historic-period feature (Table 2). Four of these artifacts (B, 1, 5, 6, and 7 in Tables 1 and 2 and Figures 6 and 7) were observed outside the project area. In addition, portions of the Lee Vining Ditch System and associated trash (CA-MNO-2764H) were noted (Table 3). These were not recorded in detail because the site
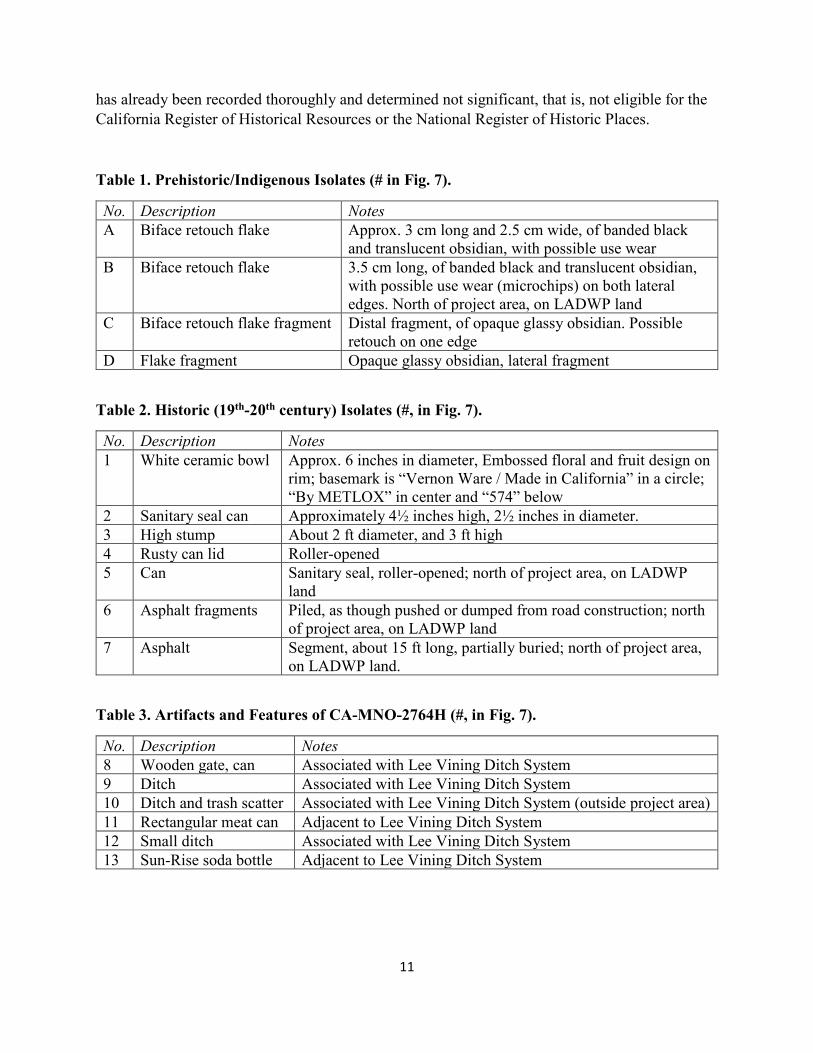
11
has already been recorded thoroughly and determined not significant, that is, not eligible for the California Register of Historical Resources or the National Register of Historic Places.
Table 1. Prehistoric/Indigenous Isolates (# in Fig. 7).
No. Description Notes A Biface retouch flake Approx. 3 cm long and 2.5 cm wide, of banded black
and translucent obsidian, with possible use wear B Biface retouch flake 3.5 cm long, of banded black and translucent obsidian,
with possible use wear (microchips) on both lateral edges. North of project area, on LADWP land
C Biface retouch flake fragment Distal fragment, of opaque glassy obsidian. Possible retouch on one edge
D Flake fragment Opaque glassy obsidian, lateral fragment
Table 2. Historic (19th-20th century) Isolates (#, in Fig. 7).
No. Description Notes 1 White ceramic bowl Approx. 6 inches in diameter, Embossed floral and fruit design on
rim; basemark is “Vernon Ware / Made in California” in a circle; “By METLOX” in center and “574” below
2 Sanitary seal can Approximately 4½ inches high, 2½ inches in diameter. 3 High stump About 2 ft diameter, and 3 ft high 4 Rusty can lid Roller-opened 5 Can Sanitary seal, roller-opened; north of project area, on LADWP
land 6 Asphalt fragments Piled, as though pushed or dumped from road construction; north
of project area, on LADWP land 7 Asphalt Segment, about 15 ft long, partially buried; north of project area,
on LADWP land.
Table 3. Artifacts and Features of CA-MNO-2764H (#, in Fig. 7).
No. Description Notes 8 Wooden gate, can Associated with Lee Vining Ditch System 9 Ditch Associated with Lee Vining Ditch System 10 Ditch and trash scatter Associated with Lee Vining Ditch System (outside project area) 11 Rectangular meat can Adjacent to Lee Vining Ditch System 12 Small ditch Associated with Lee Vining Ditch System 13 Sun-Rise soda bottle Adjacent to Lee Vining Ditch System

12
Figures 7 and 8 are redacted from the public version of this document
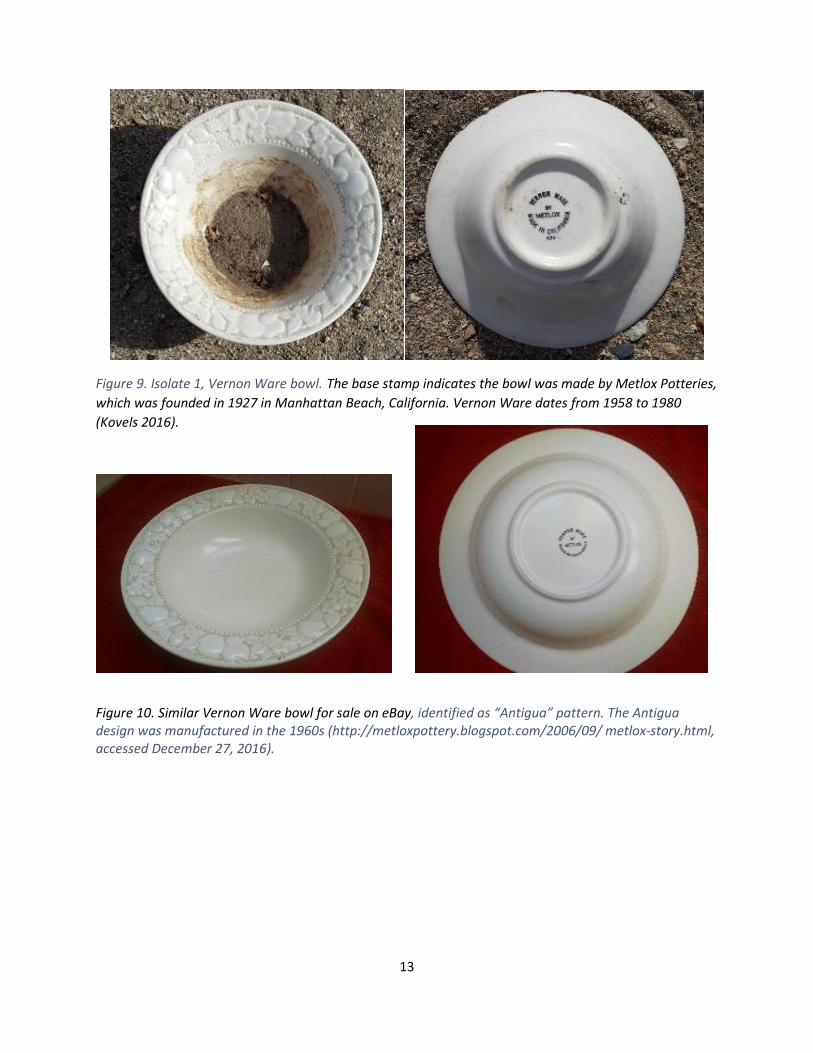
13
Figure 9. Isolate 1, Vernon Ware bowl. The base stamp indicates the bowl was made by Metlox Potteries, which was founded in 1927 in Manhattan Beach, California. Vernon Ware dates from 1958 to 1980 (Kovels 2016).
Figure 10. Similar Vernon Ware bowl for sale on eBay, identified as “Antigua” pattern. The Antigua design was manufactured in the 1960s (http://metloxpottery.blogspot.com/2006/09/ metlox-story.html, accessed December 27, 2016).
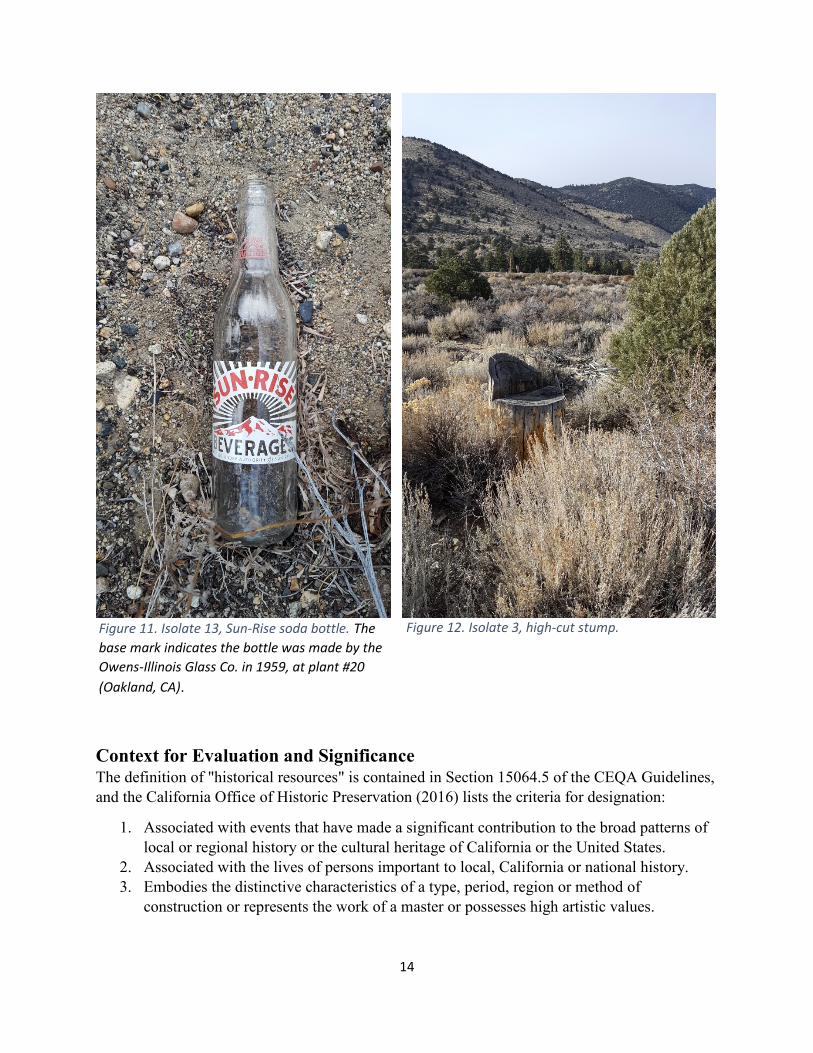
14
Figure 12. Isolate 3, high-cut stump.
Context for Evaluation and Significance The definition of "historical resources" is contained in Section 15064.5 of the CEQA Guidelines, and the California Office of Historic Preservation (2016) lists the criteria for designation:
1. Associated with events that have made a significant contribution to the broad patterns of local or regional history or the cultural heritage of California or the United States.
2. Associated with the lives of persons important to local, California or national history. 3. Embodies the distinctive characteristics of a type, period, region or method of
construction or represents the work of a master or possesses high artistic values.
Figure 11. Isolate 13, Sun-Rise soda bottle. The base mark indicates the bottle was made by the Owens-Illinois Glass Co. in 1959, at plant #20 (Oakland, CA).
15
4. Has yielded, or has the potential to yield, information important to the prehistory or history of the local area, California or the nation.
In addition, any resource that is eligible for the National Register of Historic Places, which has very similar criteria, would be considered a historic resource under CEQA.
The Lee Vining ditch system (CA-MNO-2764H, which crosses the project area, has been determined not eligible for the California Register of Historic Places. None of the isolates meets the criteria for eligibility for listing on the California Register of Historic Resources, nor the criteria for the National Register of Historic Places.
In recognition of California Native American tribal sovereignty and the unique relationship of California local governments and public agencies with California Native American tribal governments, Assembly Bill 52 requires special consideration of tribal cultural resources in CEQA analyses. Public Resources Code Section 21074 defines “Tribal cultural resources” as either of the following:
1. Sites, features, places, cultural landscapes, sacred places, and objects with cultural value to a California Native American tribe that are either of the following:
a. Included or determined to be eligible for inclusion in the California Register of Historical Resources.
b. Included in a local register of historical resources as defined in subdivision (k) of §5020.1.
2. A resource determined by the lead agency, in its discretion and supported by substantial evidence, to be significant pursuant to criteria set forth in subdivision (c) of §5024.1. In this instance, the lead agency must determine that the resource meets the criteria for listing in the state register of historic resources.
Tribes are recognized as having the expertise to identify tribal cultural resources. In preliminary discussions, Joseph Lent, the Tribal Historic Preservation Officer of the Bridgeport Indian Colony, indicated that ancestral burials are considered tribal cultural resources. Burials were generally located away from villages and camps, and after many decades or centuries, they are no longer marked. Mr. Lent noted that there is a possibility that one or more burials could be in the project area. Such burials, if present, would not be discernible in a pedestrian archaeological survey, but could be encountered during ground disturbance and excavation.
Recommendations There are no significant archaeological sites within the proposed Tioga Workforce Housing Project area. Neither previously recorded site CA-MNO-2764H nor the isolates are significant resources that would require further consideration under the California Environmental Quality Act. No further archaeological work is recommended.
Because there is a possibility that one or more undocumented Native American burials could be encountered during grading and excavation, Bridgeport Indian Colony Tribal Historic Preservation Officer Joseph Lent recommended that initial excavation in the project area be

16
monitored by a trained tribal representative. In a meeting on January 22, 2019, the Kutzadika’a Indian Community also requested this mitigation measure.
Upon consideration, the County determined that to require tribal monitoring would be inconsistent with the treatment of other resources under CEQA, where monitoring is not required if a protected resource is not known to occur within the area of potential effect. It is expected that California laws regarding the treatment of human remains discovered during construction would provide adequate protection, if any are present. Health and Safety Code Section 7050.5 stipulates that if human remains are discovered during project work, the specific area must be protected, with no further disturbance, until the county coroner has determined whether an investigation of the cause of death is required. If the human remains are determined to be those of a Native American, the coroner must contact the Native American Heritage Commission by telephone within 24 hours. Per Public Resources Code Section 5097.98, the Native American Heritage Commission then notifies the most likely descendant community, who then inspects the find and makes recommendations to the landowner how to treat the remains. Both laws have proscribed time frames, and PRC 5097.98 outlines some potential treatment options. Both California Health and Safety Code Section 7050.5 and California Public Resources Code Section 5097.98 are included as an Appendix to this report, for ease of reference.
To respect the identified concerns, however, the County developed mitigation measures that will ensure that interested Tribes are notified before grading or earthwork occurs. Further, all construction plans that require ground disturbance and excavation will contain an advisory statement that (1) there is potential for encountering human burials, (2) the Indian communities have been invited to observe the work at any time without compensation, (3) if human remains are encountered, all work shall stop immediately and the County shall be notified, and (4) that human remains must be treated with respect and in accordance with State laws and regulations.
17
References Bettinger, Robert L. 1979 Archaeology East of the Range of Light: Aboriginal Human Ecology of the Inyo/Mono Region
of California. Manuscript on file at the Inyo National Forest, Bishop, California. Burton, Jeffery 1984 An Archaeological Survey of 80 Acres near Lee Vining, Mono County, California. Prepared for
Triad Engineering Corporation, Mammoth Lakes, CA. One site and 10 isolates. Cites Fletcher 1982 re historical resources in the vicinity, which include the Vernon Placer Mining District, the Lee Vining Creek Hydraulic Mining Association 1882, the LV Sawmill, Farms (1880-1900), and Mono Indian Trail / Mono-Mammoth Toll Road.
California Office of Historic Preservation 2016 California Register of Historical Resources. Accessed December 31, 2016, at:
http://ohp.parks.ca.gov/?page_id=21238 Chou, Christopher 2014 AB 52 Amends CEQA by Creating a New Category of Cultural Resources and New
Requirements for Consultation with Native American Tribes. Posted in CEQA, Perkins Coie's California Land Use & Development Law Report. Accessed online December 21, 2016, at: https://www.californialandusedevelopmentlaw.com/2014/09/30/ab-52-amends-ceqa-by-creating-a-new-category-of-cultural-resources-and-new-requirements-for-consultation-with-native-american-tribes/
Davis, Emma Lou 1965 An Ethnography of the Kuzedika Paiute of Mono Lake, Mono County, California. University of
Utah Anthropological Papers 8:1-55. Salt Lake City, Utah. Davis-King, Shelly 2010 Amid the Sagebrush Plain, Atop the Lofty Peak: Native American History in Mono County,
California. Prepared by Davis-King and Associates and Far Western Anthropological Research Group, Inc., Davis, California. Submitted to Caltrans District 9, Bishop.
Delu, Antonina, and Rachel Braco 2010 Site record update for CA-MNO-2764H. LSA Associates, Inc., Irvine, CA. Eastern Information Center 2016 Tioga Inn Revised Specific Plan Cultural Resources Records Search. Compiled by the Eastern
Information Center, California Historical Resources Information System, Department of Anthropology, University of California, Riverside.
Fletcher, Thomas Christopher 1982 The Mono Basin in the Nineteenth Century: Discovery, Settlement, Land Use. M.A. Thesis,
University of California, Berkeley.
18
Fletcher, Thomas Christopher 1987 Paiute, Prospector, Pioneer: a History of the Bodie Mono Lake Area in the Nineteenth Century.
Artemisia Press, Lee Vining. Gilreath, Amy J. 1995 Cultural Resources Inventory of Four Tributaries to Mono Lake, and an Evaluation Plan for the
Mono Streams Restoration Project. Far Western Anthropological Research Group, Davis, CA. Report on file, Inyo National Forest, Bishop, CA.
Glover, Leslie 1995 CA-MNO-2764H Site Record Update. Far Western, Davis, CA. Governor’s Office of Planning and Research, State of California 2015 Discussion Draft Technical Advisory: AB 52 and Tribal Cultural Resources in CEQA. Accessed
December 31, 2016, at https://www.opr.ca.gov/docs/DRAFT_AB_52_Technical_Advisory.pdf Grantham, Steven D. 1991 Archaeological Survey report for the Rush Creek Four-Lane Widening of a Portion of Highway
395 in Mono County, CA. Report prepared for CALTRANS District 9, Bishop, CA. Hess, August 2014 The Kid from Mono Mills: Augie’s Century. Self-published. Printed by CreateSpace, Charleston. Jones & Stokes Associates 1993 Draft Environmental Impact Report for the Review of the Mono Basin Water Rights of the City
of Los Angeles. Submitted to the California State Water Resources Control Board, Division of Water Rights, Sacramento, California. Jones & Stokes Associates, Sacramento (cited in Marvin and Costello 1993).
Kahrl, William 1983 Water and Power: the Conflict over Los Angeles Water Supply in the Owens Valley. University
of California Press, Berkeley. Kovels’ Antiques, Inc. 2016 Kovels.com, accessed December 27, 2016, at https://www.kovels.com/price-guide/pottery-
porcelain-price-guide/metlox.html La Braque, Lily Mathieu 2015 Man from Mono. Mono Basin Historical Society, Lee Vining, California. Lane, Paul H. 1974 Los Angeles Water Rights in the Mono Basin and the Impact of the Department’s Operations on
Mono Lake. Los Angeles Department of Water and Power, Los Angeles (cited in Marvin and Costello 1993).
19
Laylander, Don 1996 Negative Archaeological Survey Report, Third Supplement, Rush Creek four-Lane Upgrade
Project. Leach-Palm, Laura, Paul Brandy, Jay King, Pat Mikkelsen, Libby Seil, Lindsay Hartman, Jill Bradeen, Bryan Larson, and Joseph Freeman 2010 Caltrans District 9 Rural Conventional Highways in Inyo, Eastern Kern, Mono, and Northern
San Bernadino Counties. Summary of Methods and Findings. Far Western Anthropological Research Group, Inc., Davis, CA. Submitted to Central California Cultural Resources Branch, CALTRANS, Fresno, and CALTRANS District 9, Bishop.
Marvin, Judith, and Julia Costello 1993 Supplemental Archaeological Survey Report and Historic Study Report for the Rush Creek
Four-Lane Project near Lee Vining, Mono County, California. Prepared for Caltrans District 9, Bishop. Foothill Resources, Mokelumne Hill, California.
1993 Archaeological Site Record, CA-MNO-2764H. Foothill Resources, Ltd., Mokelumne Hill, CA,
On file at the Eastern Information Center, California Historical Resources Information System, University of California Riverside.
Society for Historical Archaeology Historic Glass Bottle Identification & Information Website, at https://sha.org/bottle/index.htm.
Accessed December 27, 2016. White, David R. M. 1985 Results of the 1984 Field Season, Cultural Resources Survey for the Historic and Archaeological
Preservation Plan for Eastern Sierra Hydroelectric Projects in Mono and Inyo Counties, California: Lundy (FERC Project 1390), Lee Vining Creek (FERC Project 1388), Rush Creek (FERC Project 1389), and Bishop Creek (FERC Project 1394). Southern California Edison Company, Rosemead, CA. (site 2416)
Wickstrom, Brian 1992 Supplement to the Archaeological Survey Report for the Rush Creek Four-Lane Widening of a
Portion of Highway 395 in Mono County, CA. Report submitted to CALTRANS District 9, Bishop, CA.
Wickstrom, Brian, and Robert Jackson 1993 Final Report, Archaeological Resources Evaluation at CA-MNO-891, CAMNO-2678, and CA-
MNO-2679, Mono County, CA. Report prepared for CALTRANS District 9, Bishop, CA. (my copy missing the description of the ditch site)
APPENDIX J2
Correspondence from Native American Heritage
Commission (NAHC)

STATE OF CALIFORNIA Gavin Newsom, Governor
NATIVE AMERICAN HERITAGE COMMISSION Cultural and Environmental Department 1550 Harbor Blvd., Suite 100 West Sacramento, CA 95691 Phone: (916) 373-3710 Email: [email protected] Website: http://www.nahc.ca.gov February 26, 2019
Michael Draper Mono County Planning Analyst II Community Development Department Mammoth Lakes, CA 93546 Dear Mr. Draper, Thank you for your follow up correspondence dated February 6, 2019. We appreciate your due diligence in respecting tribal cultural heritage and the protection of cultural resources. Since the Bridgeport Indian Colony requested tribal monitoring during consultation for the project, Mono County is required to consider that option in the evaluation of the potential impacts. The Kuzedika’a Paiute Tribe is not on our consultation list, but nothing precludes the County from taking their concerns into consideration as public stakeholders. The decision to include a Native American monitor on the project is wholly within the prevue of the lead agency and can be based on all the information you have about the potential impacts to cultural resources. The Native American Heritage Commission does not get involved in monitoring decisions. If you have any questions or need additional information, please contact me at my email address: [email protected]. Sincerely, Gayle Totton, B.S., M.A., Ph.D. Associate Governmental Program Analyst
Attachment
Gayle Totton

APPENDIX J3
Tribal Consultation Letters
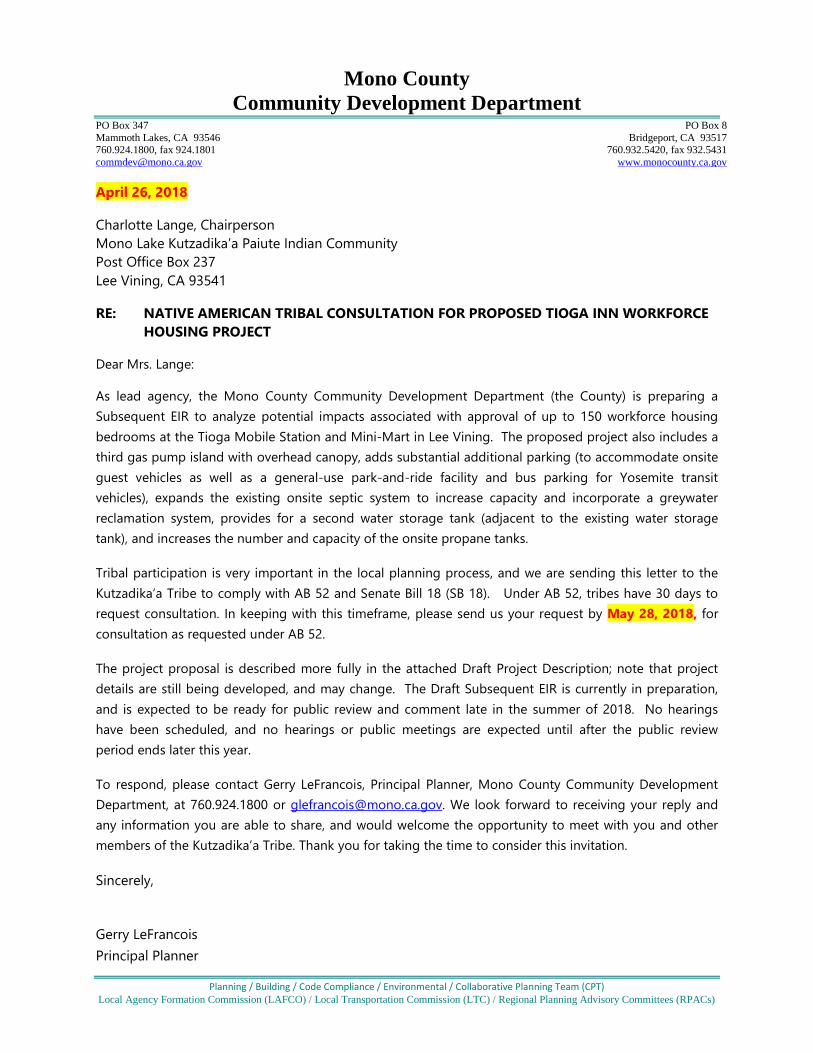
Planning / Building / Code Compliance / Environmental / Collaborative Planning Team (CPT)Local Agency Formation Commission (LAFCO) / Local Transportation Commission (LTC) / Regional Planning Advisory Committees (RPACs)
Mono CountyCommunity Development Department
PO Box 347Mammoth Lakes, CA 93546760.924.1800, fax [email protected]
PO Box 8Bridgeport, CA 93517
760.932.5420, fax 932.5431www.monocounty.ca.gov
April 26, 2018
Charlotte Lange, Chairperson
Mono Lake Kutzadika’a Paiute Indian Community
Post Office Box 237
Lee Vining, CA 93541
RE: NATIVE AMERICAN TRIBAL CONSULTATION FOR PROPOSED TIOGA INN WORKFORCE
HOUSING PROJECT
Dear Mrs. Lange:
As lead agency, the Mono County Community Development Department (the County) is preparing a
Subsequent EIR to analyze potential impacts associated with approval of up to 150 workforce housing
bedrooms at the Tioga Mobile Station and Mini-Mart in Lee Vining. The proposed project also includes a
third gas pump island with overhead canopy, adds substantial additional parking (to accommodate onsite
guest vehicles as well as a general-use park-and-ride facility and bus parking for Yosemite transit
vehicles), expands the existing onsite septic system to increase capacity and incorporate a greywater
reclamation system, provides for a second water storage tank (adjacent to the existing water storage
tank), and increases the number and capacity of the onsite propane tanks.
Tribal participation is very important in the local planning process, and we are sending this letter to the
Kutzadika’a Tribe to comply with AB 52 and Senate Bill 18 (SB 18). Under AB 52, tribes have 30 days to
request consultation. In keeping with this timeframe, please send us your request by May 28, 2018, for
consultation as requested under AB 52.
The project proposal is described more fully in the attached Draft Project Description; note that project
details are still being developed, and may change. The Draft Subsequent EIR is currently in preparation,
and is expected to be ready for public review and comment late in the summer of 2018. No hearings
have been scheduled, and no hearings or public meetings are expected until after the public review
period ends later this year.
To respond, please contact Gerry LeFrancois, Principal Planner, Mono County Community Development
Department, at 760.924.1800 or [email protected]. We look forward to receiving your reply and
any information you are able to share, and would welcome the opportunity to meet with you and other
members of the Kutzadika’a Tribe. Thank you for taking the time to consider this invitation.
Sincerely,
Gerry LeFrancois
Principal Planner
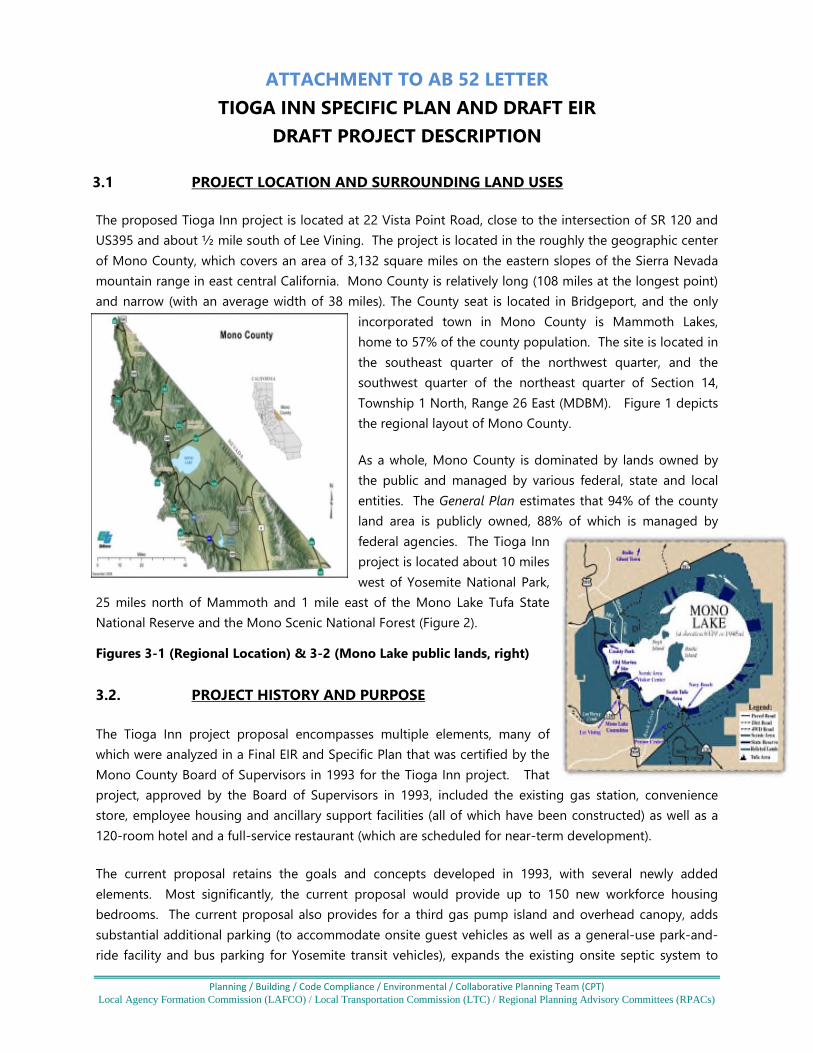
Planning / Building / Code Compliance / Environmental / Collaborative Planning Team (CPT)Local Agency Formation Commission (LAFCO) / Local Transportation Commission (LTC) / Regional Planning Advisory Committees (RPACs)
ATTACHMENT TO AB 52 LETTER
TIOGA INN SPECIFIC PLAN AND DRAFT EIR
DRAFT PROJECT DESCRIPTION
3.1 PROJECT LOCATION AND SURROUNDING LAND USES
The proposed Tioga Inn project is located at 22 Vista Point Road, close to the intersection of SR 120 and
US395 and about ½ mile south of Lee Vining. The project is located in the roughly the geographic center
of Mono County, which covers an area of 3,132 square miles on the eastern slopes of the Sierra Nevada
mountain range in east central California. Mono County is relatively long (108 miles at the longest point)
and narrow (with an average width of 38 miles). The County seat is located in Bridgeport, and the only
incorporated town in Mono County is Mammoth Lakes,
home to 57% of the county population. The site is located in
the southeast quarter of the northwest quarter, and the
southwest quarter of the northeast quarter of Section 14,
Township 1 North, Range 26 East (MDBM). Figure 1 depicts
the regional layout of Mono County.
As a whole, Mono County is dominated by lands owned by
the public and managed by various federal, state and local
entities. The General Plan estimates that 94% of the county
land area is publicly owned, 88% of which is managed by
federal agencies. The Tioga Inn
project is located about 10 miles
west of Yosemite National Park,
25 miles north of Mammoth and 1 mile east of the Mono Lake Tufa State
National Reserve and the Mono Scenic National Forest (Figure 2).
Figures 3-1 (Regional Location) & 3-2 (Mono Lake public lands, right)
3.2. PROJECT HISTORY AND PURPOSE
The Tioga Inn project proposal encompasses multiple elements, many of
which were analyzed in a Final EIR and Specific Plan that was certified by the
Mono County Board of Supervisors in 1993 for the Tioga Inn project. That
project, approved by the Board of Supervisors in 1993, included the existing gas station, convenience
store, employee housing and ancillary support facilities (all of which have been constructed) as well as a
120-room hotel and a full-service restaurant (which are scheduled for near-term development).
The current proposal retains the goals and concepts developed in 1993, with several newly added
elements. Most significantly, the current proposal would provide up to 150 new workforce housing
bedrooms. The current proposal also provides for a third gas pump island and overhead canopy, adds
substantial additional parking (to accommodate onsite guest vehicles as well as a general-use park-and-
ride facility and bus parking for Yosemite transit vehicles), expands the existing onsite septic system to
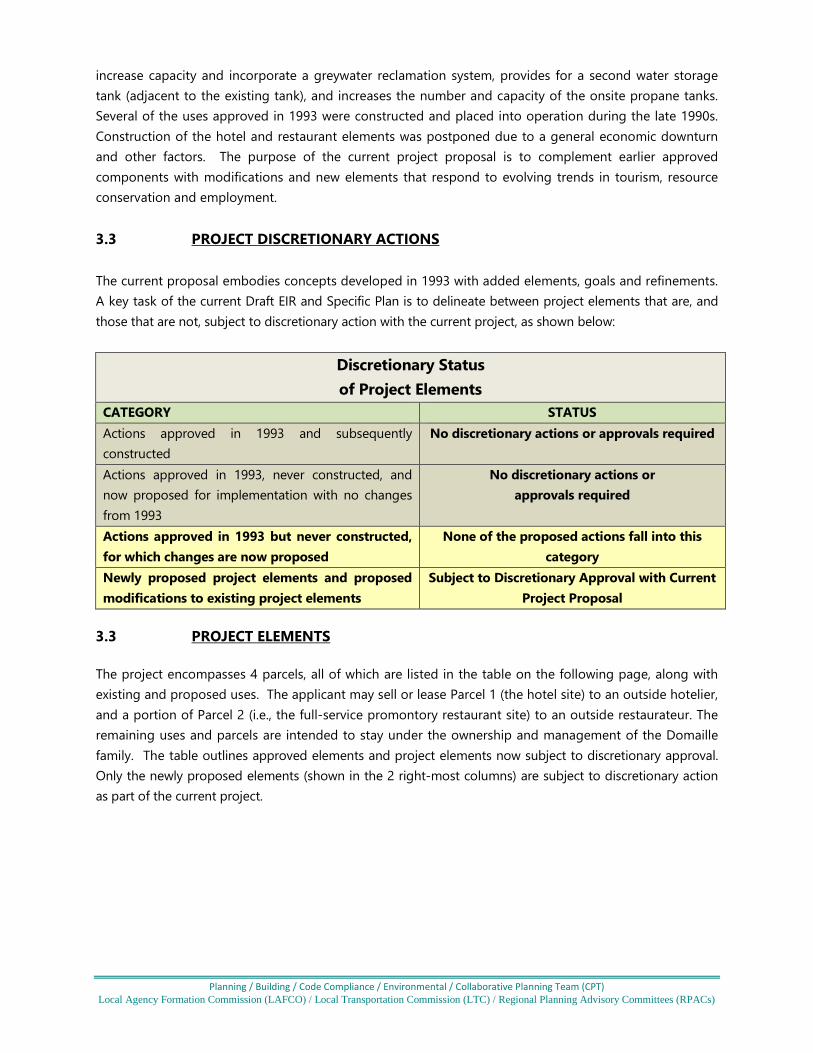
Planning / Building / Code Compliance / Environmental / Collaborative Planning Team (CPT)Local Agency Formation Commission (LAFCO) / Local Transportation Commission (LTC) / Regional Planning Advisory Committees (RPACs)
increase capacity and incorporate a greywater reclamation system, provides for a second water storage
tank (adjacent to the existing tank), and increases the number and capacity of the onsite propane tanks.
Several of the uses approved in 1993 were constructed and placed into operation during the late 1990s.
Construction of the hotel and restaurant elements was postponed due to a general economic downturn
and other factors. The purpose of the current project proposal is to complement earlier approved
components with modifications and new elements that respond to evolving trends in tourism, resource
conservation and employment.
3.3 PROJECT DISCRETIONARY ACTIONS
The current proposal embodies concepts developed in 1993 with added elements, goals and refinements.
A key task of the current Draft EIR and Specific Plan is to delineate between project elements that are, and
those that are not, subject to discretionary action with the current project, as shown below:
Discretionary Status
of Project Elements
CATEGORY STATUS
Actions approved in 1993 and subsequently
constructed
No discretionary actions or approvals required
Actions approved in 1993, never constructed, and
now proposed for implementation with no changes
from 1993
No discretionary actions or
approvals required
Actions approved in 1993 but never constructed,
for which changes are now proposed
None of the proposed actions fall into this
category
Newly proposed project elements and proposed
modifications to existing project elements
Subject to Discretionary Approval with Current
Project Proposal
3.3 PROJECT ELEMENTS
The project encompasses 4 parcels, all of which are listed in the table on the following page, along with
existing and proposed uses. The applicant may sell or lease Parcel 1 (the hotel site) to an outside hotelier,
and a portion of Parcel 2 (i.e., the full-service promontory restaurant site) to an outside restaurateur. The
remaining uses and parcels are intended to stay under the ownership and management of the Domaille
family. The table outlines approved elements and project elements now subject to discretionary approval.
Only the newly proposed elements (shown in the 2 right-most columns) are subject to discretionary action
as part of the current project.
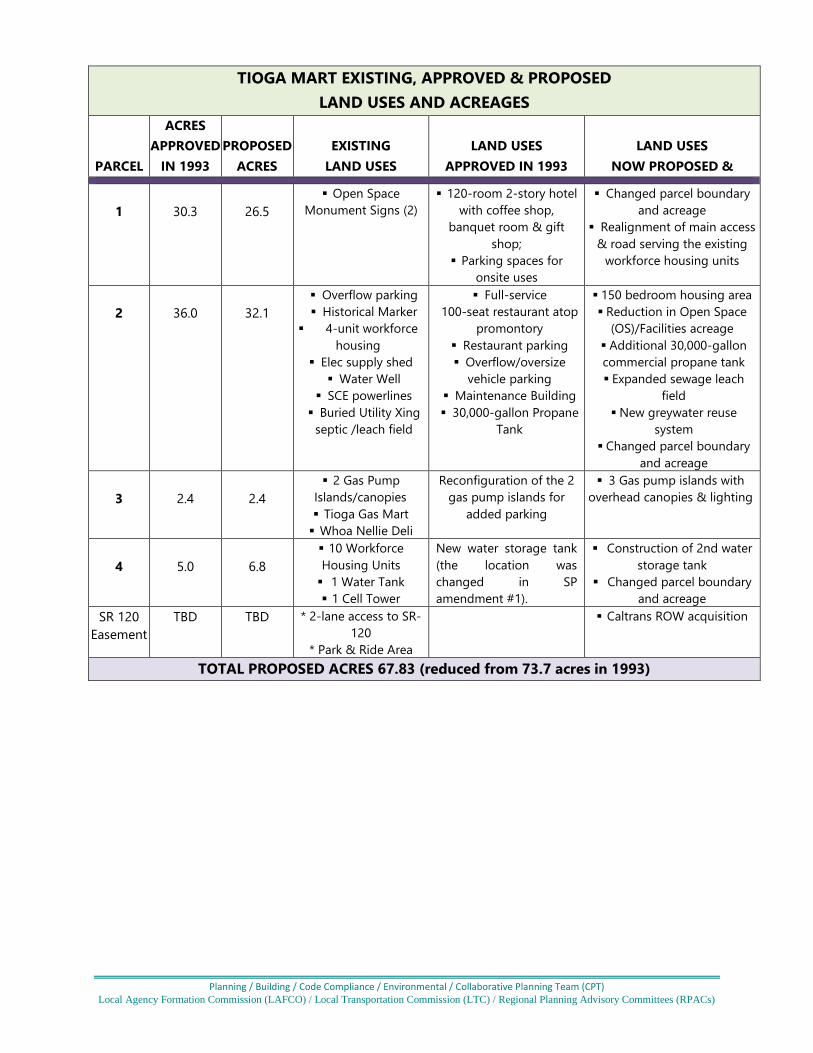
Planning / Building / Code Compliance / Environmental / Collaborative Planning Team (CPT)Local Agency Formation Commission (LAFCO) / Local Transportation Commission (LTC) / Regional Planning Advisory Committees (RPACs)
TIOGA MART EXISTING, APPROVED & PROPOSED
LAND USES AND ACREAGES
PARCEL
ACRES
APPROVED
IN 1993
PROPOSED
ACRES
EXISTING
LAND USES
LAND USES
APPROVED IN 1993
LAND USES
NOW PROPOSED &
1 30.3 26.5
Open Space
Monument Signs (2)
120-room 2-story hotel
with coffee shop,
banquet room & gift
shop;
Parking spaces for
onsite uses
Changed parcel boundary
and acreage
Realignment of main access
& road serving the existing
workforce housing units
2 36.0 32.1
Overflow parking
Historical Marker
4-unit workforce
housing
Elec supply shed
Water Well
SCE powerlines
Buried Utility Xing
septic /leach field
Full-service
100-seat restaurant atop
promontory
Restaurant parking
Overflow/oversize
vehicle parking
Maintenance Building
30,000-gallon Propane
Tank
150 bedroom housing area
Reduction in Open Space
(OS)/Facilities acreage
Additional 30,000-gallon
commercial propane tank
Expanded sewage leach
field
New greywater reuse
system
Changed parcel boundary
and acreage
3 2.4 2.4
2 Gas Pump
Islands/canopies
Tioga Gas Mart
Whoa Nellie Deli
Reconfiguration of the 2
gas pump islands for
added parking
3 Gas pump islands with
overhead canopies & lighting
4 5.0 6.8
10 Workforce
Housing Units
1 Water Tank
1 Cell Tower
New water storage tank
(the location was
changed in SP
amendment #1).
Construction of 2nd water
storage tank
Changed parcel boundary
and acreage
SR 120
Easement
TBD TBD * 2-lane access to SR-
120
* Park & Ride Area
Caltrans ROW acquisition
TOTAL PROPOSED ACRES 67.83 (reduced from 73.7 acres in 1993)
APPENDIX K
Federal Aviation Administration
Letter of Determination

Mail Processing CenterFederal Aviation AdministrationSouthwest Regional OfficeObstruction Evaluation Group10101 Hillwood ParkwayFort Worth, TX 76177
Aeronautical Study No.2018-AWP-15708-OE
Page 1 of 3
Issued Date: 12/07/2018
DennisDennis DomaillePO Box 2727Mammoth Lakes, CA 93546
** DETERMINATION OF NO HAZARD TO AIR NAVIGATION **
The Federal Aviation Administration has conducted an aeronautical study under the provisions of 49 U.S.C.,Section 44718 and if applicable Title 14 of the Code of Federal Regulations, part 77, concerning:
Structure: Building Restaurant - NE CornerLocation: Lee Vining, CALatitude: 37-56-54.89N NAD 83Longitude: 119-06-37.53WHeights: 6945 feet site elevation (SE)
20 feet above ground level (AGL)6965 feet above mean sea level (AMSL)
This aeronautical study revealed that the structure does exceed obstruction standards but would not be a hazardto air navigation provided the following condition(s), if any, is(are) met:
It is required that FAA Form 7460-2, Notice of Actual Construction or Alteration, be e-filed any time theproject is abandoned or:
_____ At least 10 days prior to start of construction (7460-2, Part 1)__X__ Within 5 days after the construction reaches its greatest height (7460-2, Part 2)
Based on this evaluation, marking and lighting are not necessary for aviation safety. However, if marking/lighting are accomplished on a voluntary basis, we recommend it be installed in accordance with FAA Advisorycircular 70/7460-1 L Change 2.
The structure considered under this study lies in proximity to an airport and occupants may be subjected tonoise from aircraft operating to and from the airport.
This determination expires on 06/07/2020 unless:
(a) the construction is started (not necessarily completed) and FAA Form 7460-2, Notice of ActualConstruction or Alteration, is received by this office.
(b) extended, revised, or terminated by the issuing office.(c) the construction is subject to the licensing authority of the Federal Communications Commission
(FCC) and an application for a construction permit has been filed, as required by the FCC, within
Page 2 of 3
6 months of the date of this determination. In such case, the determination expires on the dateprescribed by the FCC for completion of construction, or the date the FCC denies the application.
NOTE: REQUEST FOR EXTENSION OF THE EFFECTIVE PERIOD OF THIS DETERMINATION MUSTBE E-FILED AT LEAST 15 DAYS PRIOR TO THE EXPIRATION DATE. AFTER RE-EVALUATIONOF CURRENT OPERATIONS IN THE AREA OF THE STRUCTURE TO DETERMINE THAT NOSIGNIFICANT AERONAUTICAL CHANGES HAVE OCCURRED, YOUR DETERMINATION MAY BEELIGIBLE FOR ONE EXTENSION OF THE EFFECTIVE PERIOD.
This determination is based, in part, on the foregoing description which includes specific coordinates, heights,frequency(ies) and power. Any changes in coordinates, heights, and frequencies or use of greater power exceptthose frequencies specified in the Colo Void Clause Coalition; Antenna System Co-Location; Voluntary BestPractices, effective 21 Nov 2007, will void this determination. Any future construction or alteration includingincrease to heights, power, or the addition of other transmitters, requires separate notice to the FAA. Thisdetermination includes all previously filed frequencies and power for this structure.
If construction or alteration is dismantled or destroyed, you must submit notice to the FAA within 5 days afterthe construction or alteration is dismantled or destroyed.
This determination does include temporary construction equipment such as cranes, derricks, etc., which may beused during actual construction of the structure. However, this equipment shall not exceed the overall heights asindicated above. Equipment which has a height greater than the studied structure requires separate notice to theFAA.
This determination concerns the effect of this structure on the safe and efficient use of navigable airspaceby aircraft and does not relieve the sponsor of compliance responsibilities relating to any law, ordinance, orregulation of any Federal, State, or local government body.
If we can be of further assistance, please contact our office at (424) 405-7643, or [email protected] any future correspondence concerning this matter, please refer to Aeronautical Study Number 2018-AWP-15708-OE.
Signature Control No: 387392054-391752378 ( EBO )Karen McDonaldSpecialist
Attachment(s)Map(s)
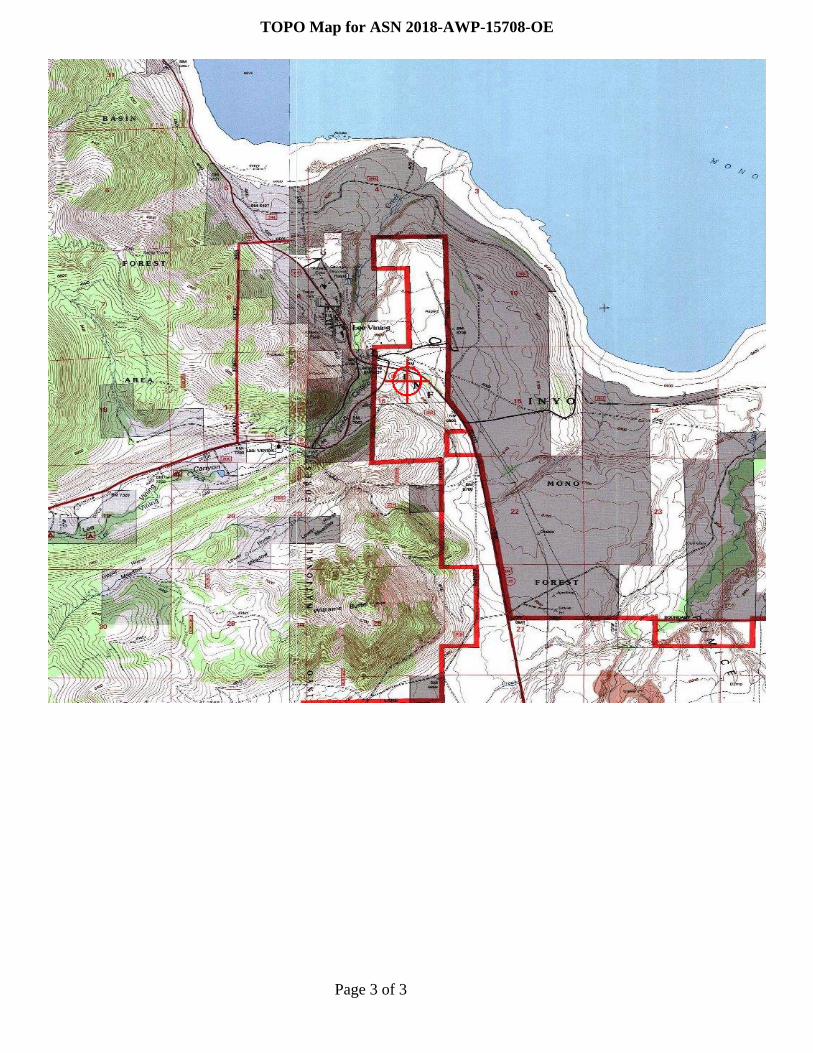
Page 3 of 3
TOPO Map for ASN 2018-AWP-15708-OE
APPENDIX L
Traffic Impact Analysis
By MAT Engineering
TIOGA INN WORKFORCE HOUSING PROJECT TRAFFIC IMPACT ANALYSIS
Mono County
Prepared for:
BAUER PLANNING & ENVIRONMENTAL SERVICES, INC.
Prepared by:
Mohammad A. Tabrizi, PE, TE
March 13, 2019
TABLE OF CONTENTS Section Page 1.0 Introduction ........................................................................................................... 1-1
1.1 Study Area 1-2
2.0 Analysis Methodologies, Performance Criteria, & Thresholds of Significance .................................................................................. 2-1 2.1 Intersection Analysis Methodology 2-1
2.2 Study Intersection Peak Hour Performance Criteria 2-2
2.3 Study Intersection Thresholds of Significance 2-3
3.0 Existing Traffic Volumes & Circulation System ................................................. 3-1 3.1 Roadway Description 3-1
3.2 Existing Traffic Controls & Intersection Geometrics 3-2
3.3 Existing Conditions Traffic Volumes 3-2
4.0 Projected & Future Traffic Volumes .................................................................... 4-1 4.1 Project Traffic Conditions 4-1
4.1.1 Project Trip Generation 4-1
4.1.2 Project Trip Distribution 4-5
4.1.3 Modal Split 4-5
4.1.4 Project Traffic Volumes/Assignment 4-5
4.2 Existing Plus Project Conditions Traffic Volumes 4-6
4.3 Background Traffic 4-6
4.3.1 Ambient Growth Method of Projection 4-6
4.3.2 Cumulative Projects Traffic 4-6
4.4 Forecast Opening year (2023) Without Project Conditions Traffic Volumes 4-8
4.5 Forecast Opening year (2023) With Project Conditions Traffic Volumes 4-8
5.0 MUTCD Traffic Signal Warrant Analysis ............................................................. 5-1 6.0 Peak Hour Level of Service Analysis .................................................................. 6-1
6.1 Existing Conditions Level of Service Analysis 6-1
6.2 Existing Plus Project Conditions Level of Service Analysis 6-2
6.3 Forecast Opening Year (2023) Without Project Conditions Level of Service
Analysis 6-3
6.4 Forecast Opening Year (2023) With Project Conditions Level of Service
Analysis 6-4
7.0 Peak Hour Vehicular Queue Analysis ................................................................. 7-1
TABLE OF CONTENTS (CONTINUED) Section Page 8.0 Evaluation of Other Elements .............................................................................. 8-1
8.1 Highway 395 / Tioga Road (SR-120) Collision History 8-1
8.2 Pedestrian & Bicycle Circulation System 8-3
8.3 Caltrans Right-of-Way Acquisition 8-3
8.4 Transportation Demand Management (TDM) Recommendations 8-4
8.5 Vehicles Miles Traveled (VMT) Analysis 8-4
9.0 Findings, Conclusions & Recommendations ..................................................... 9-1 9.1 Level of Service & Impact Analysis Summary 9-1
9.2 Peak Hour Vehicular Queue Analysis Summary 9-3
9.3 Evaluation of Other Elements Summary 9-3
LIST OF TABLES
Table Page 2-1 Intersection LOS & Delay Ranges 2-1
4-1 ITE Trip Generation Rates for Proposed Project Land Uses 4-3
4-2 Trip Generation Summary for Proposed Project 4-1
4-3 ITE Trip Generation Rates for Cumulative Project Land Uses 4-5
4-4 Trip Generation Summary for Cumulative Projects 4-5
5-1 Highway 395 / Tioga Road (SR-120) MUTCD Traffic Signal Warrant Analysis Summary 5-1
6-1 Existing Conditions Study Intersection Level of Service Analysis Summary 6-1
6-2 Existing Plus Project Conditions Study Intersection Level of Service Analysis Summary 6-2
6-3 Forecast Opening Year (2023) Without Project Conditions Study Intersection Level of Service Analysis Summary 6-3
6-4 Forecast Opening Year (2023) With Project Conditions Study Intersection Level of Service Analysis Summary 6-4
7-1 Forecast Opening Year (2023) With Project Conditions HCM 95th Percentile Vehicular Queue Analysis Summary 7-2
8-1 Highway 395 / Tioga Road (SR-120) Collision History 8-2
8-2 Vehicles Miles Traveled (VMT) 8-5
LIST OF EXHIBITS Exhibit Title Exhibit 1-1 Regional Project Location
Exhibit 1-2 Project Site Location
Exhibit 1-3 Project Conceptual Site Plan
Exhibit 1-4 Study Intersection Location
Exhibit 3-1 Existing Study Intersection Geometry & Controls
Exhibit 3-2 Existing Conditions Traffic Volumes
Exhibit 4-1 Project Trip Distribution (Workforce Housing)
Exhibit 4-2 Project Trip Distribution (Gas Station)
Exhibit 4-3 Project Traffic Volumes
Exhibit 4-4 Existing Plus Project Conditions Traffic Volumes
Exhibit 4-5 Cumulative Projects Traffic Volumes
Exhibit 4-6 Forecast Opening Year (2023) Without Project Conditions Traffic Volumes
Exhibit 4-7 Forecast Opening Year (2023) With Project Conditions Traffic Volumes
LIST OF APPENDICES Appendix Title
Appendix A Existing Traffic Count Worksheets
Appendix B MUTCD Traffic Signal Analysis Worksheets
Appendix C Existing Conditions LOS Analysis Worksheets
Appendix D Existing Plus Project Conditions LOS Analysis Worksheets
Appendix E Forecast Opening Year (2023) Without Project Conditions LOS Analysis Worksheets
Appendix F Forecast Opening Year (2023) With Project Conditions LOS Analysis Worksheets
Appendix G Forecast Opening Year (2023) With Project Conditions With Traffic Signal LOS Analysis Worksheets
Appendix H Forecast Opening Year (2023) With Project Conditions With Single-Lane Roundabout LOS Analysis Worksheets
Tioga Inn Workforce Housing Project Traffic Study Page 1-1
1.0 Introduction
This study analyzes the forecast traffic conditions associated with the proposed Tioga Inn Workforce Housing project.
The proposed Tioga Workforce Housing project is located at 22 Vista Point Road, close to the intersection of Tioga Road (State Route 120 or SR-120) and Highway 395 (US-395). The project is located in the geographic center of Mono County, which covers an area of 3,132 square miles on the eastern slopes of the Sierra Nevada mountain range in east central California.
The project site is located about half a mile south of Lee Vining, 10 miles west of Yosemite National Park, 25 miles north of Mammoth and 1 mile east of the Mono Lake Tufa State National Reserve and Scenic National Forest.
Exhibit 1-1 shows the regional location of the project site. Exhibit 1-2 shows the project site location.
Access for the project site will continue to be provided via one unsignalized driveway located on Tioga Road (SR-120) approximately 950 feet west of the Highway 395 / Tioga Road (SR-120) intersection.
The existing bus stop serving the Yosemite Area Rapid Transit System (YARTS) located along the project site frontage on Tioga Road (SR-120) will remain in place.
The project site currently contains the following land uses:
• Approximately 16 units of workforce housing;
• Existing Whoa Nelli Deli; and
• Gasoline Station with Convenience Store and 8 vehicle fueling positions (4 two-sided fuel pumps).
Additionally, during summer Thursday evenings, concert-type events are held in the lawn area of the site.
Aside from the existing uses located on the project site, the site is currently approved for addition of the following traffic-generating land uses:
• 120-room hotel; and
Tioga Inn Workforce Housing Project Traffic Study Page 1-2
• Restaurant use with 100 seats and a seating area of approximately 5,000 square feet (gross area of approximately 10,000 square feet).
The proposed project consists of the following additional traffic-generating land uses:
• Workforce housing with 100 units, which includes approximately 150 bedrooms with a total capacity of 300 residents; and
• An additional island to the existing gas station, adding a total of 4 vehicle fueling positions (2 two-sided fuel pumps).
Under current conditions, approximately 6 of the 37 total employees live on the project site; the remaining employees commute to and from the site.
Exhibit 1-3 shows the conceptual site plan.
The project is planned to open in 2023.
1.1 Study Area
The study area consists of the following study intersections in the vicinity of the project site:
1. Highway 395 (US-395) / Tioga Road (SR-120); and
2. Project Site Access / Tioga Road (SR-120).
Both of the study intersections are a part of the California State Highway system and are in the jurisdiction of Caltrans District 9 which holds jurisdiction over the State Highway system in the central-east portion of the State of California including Inyo, Mono, and eastern Kern Counties.
Study area traffic conditions are very seasonal in this area and vary by the time of the year. Tioga Road (SR-120) is generally closed during winter and peak traffic conditions generally occur in the summer time.
Hence, this study evaluates traffic conditions during the month of July, for the following time periods:
• AM: 8:00 AM to 10:00 AM;
• Mid-Day 12:00 PM to 2:00 PM; and
• PM: 4:00 PM to 6:00 PM.

Tioga Inn Workforce Housing Project Traffic Study Page 1-3
Exhibit 1-4 shows the location of the study intersections which are analyzed for the following study scenarios:
• Existing Conditions;
• Existing Plus Project Conditions;
• Forecast Opening Year (2023) Without Project Conditions; and
• Forecast Opening Year (2023) With Project Conditions.
The analysis also evaluates vehicular queuing at the study intersections as requested by Caltrans.
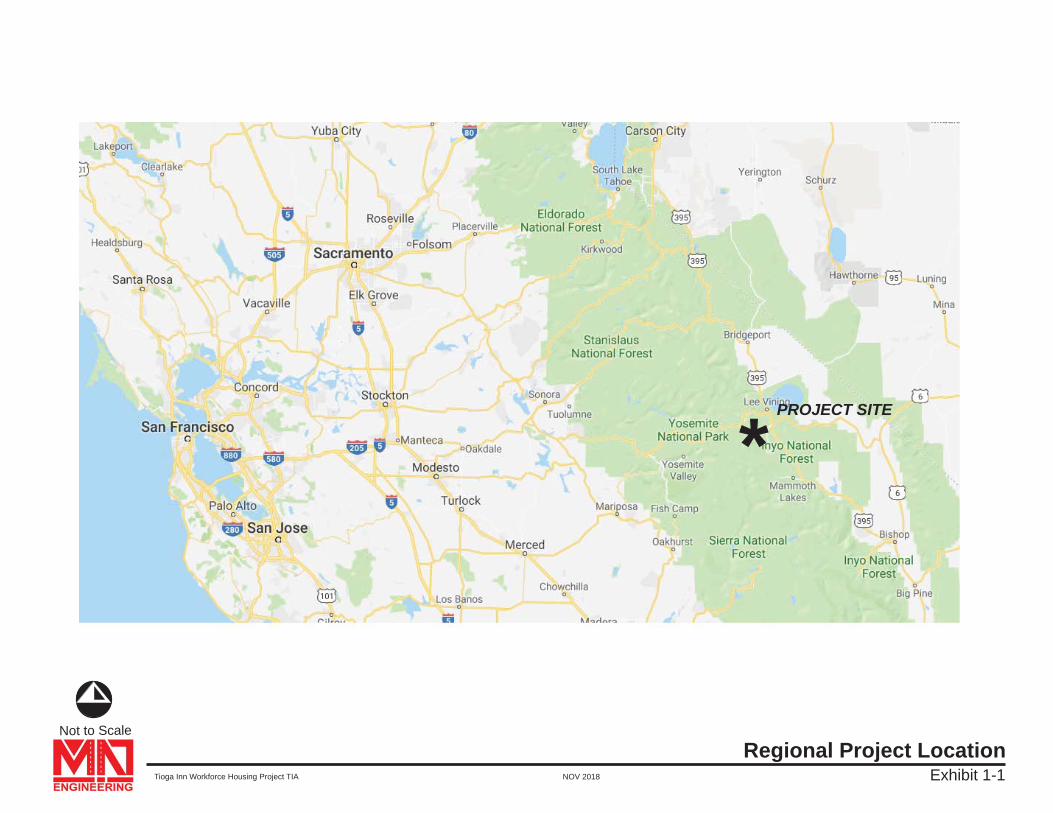
Exhibit 1-1Regional Project Location
Not to Scale
Tioga Inn Workforce Housing Project TIA NOV 2018
PROJECT SITE
*
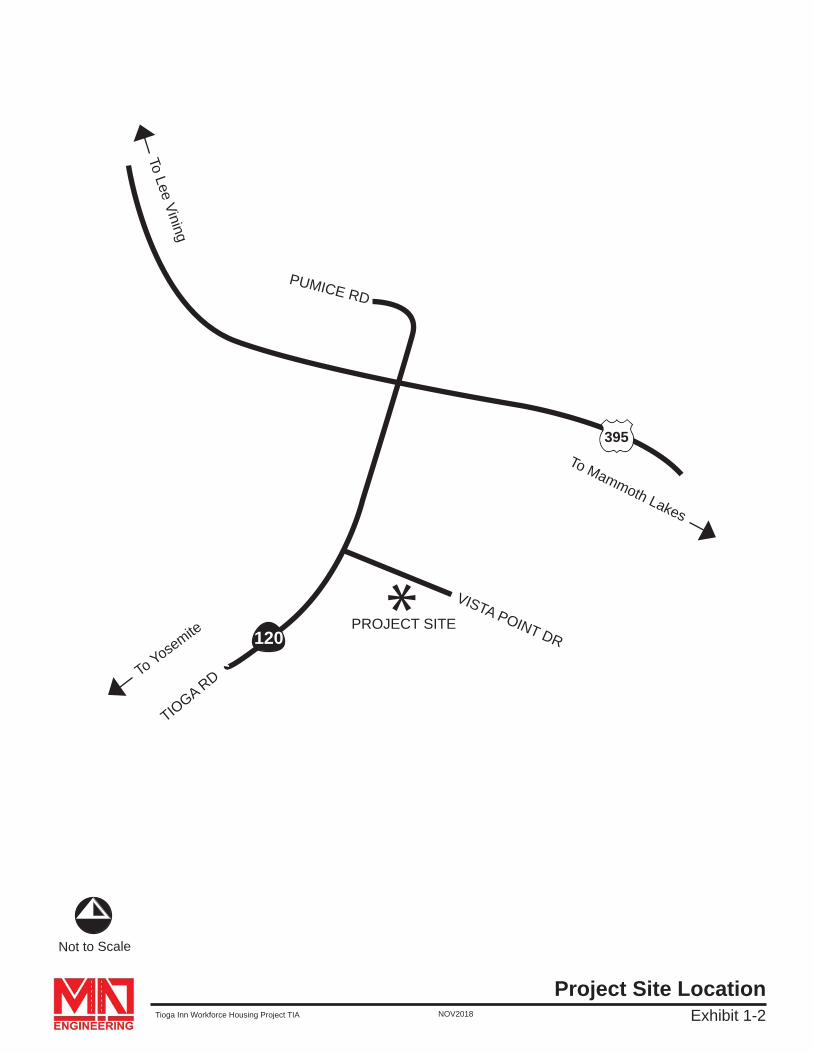
NOV 2018
Not to Scale
Tioga Inn Workforce Housing Project TIA
VISTA POINT DR
395
120
PUMICE RD
*PROJECT SITE
TIOGA RD
To Lee Vining
To Yosemite
To Mammoth Lakes
Exhibit 1-2Project Site Location
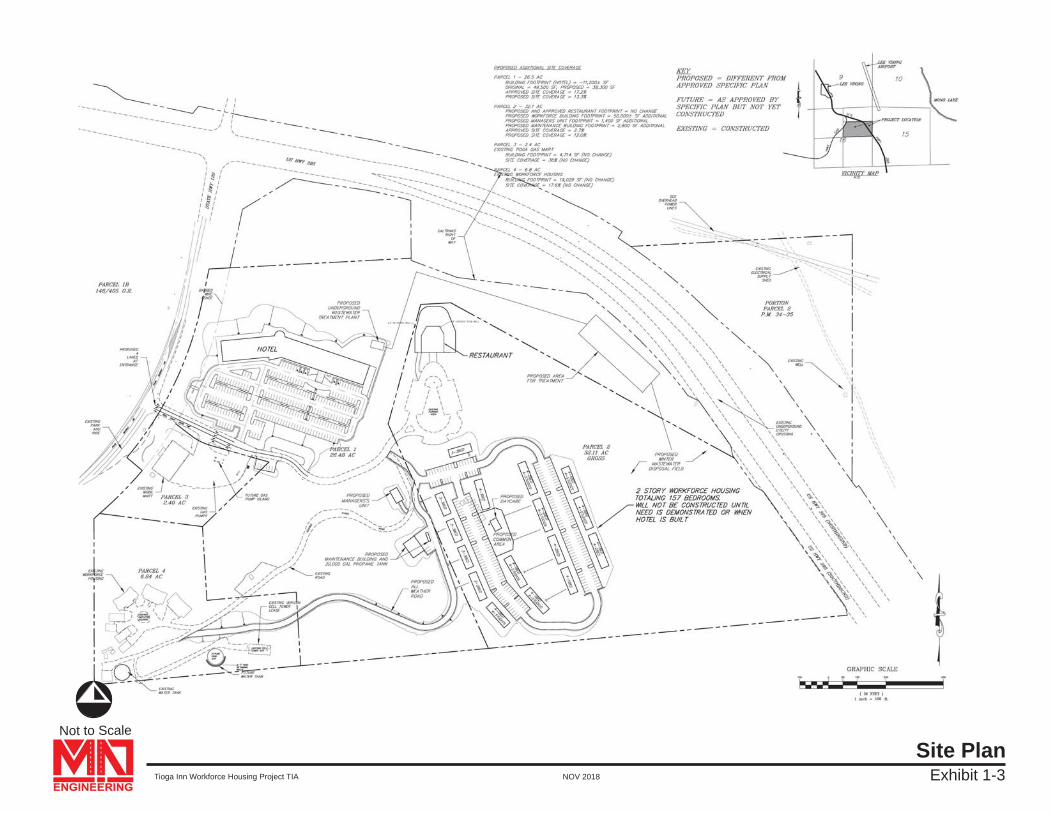
Exhibit 1-3Site Plan
Not to Scale
Tioga Inn Workforce Housing Project TIA NOV 2018
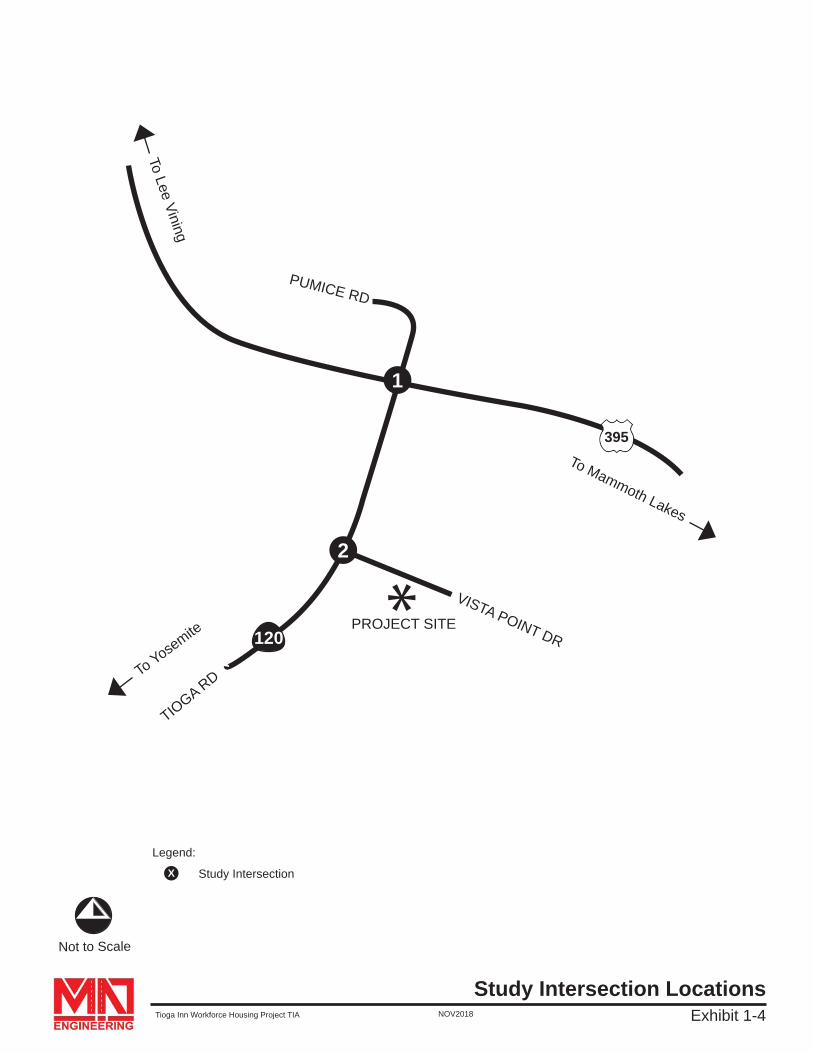
NOV 2018
Not to Scale
Tioga Inn Workforce Housing Project TIA
VISTA POINT DR
395
120
PUMICE RD
*PROJECT SITE
TIOGA RD
To Lee Vining
To Yosemite
To Mammoth Lakes
1
2
Study Intersection
Legend:
Exhibit 1-4Study Intersection Locations
X
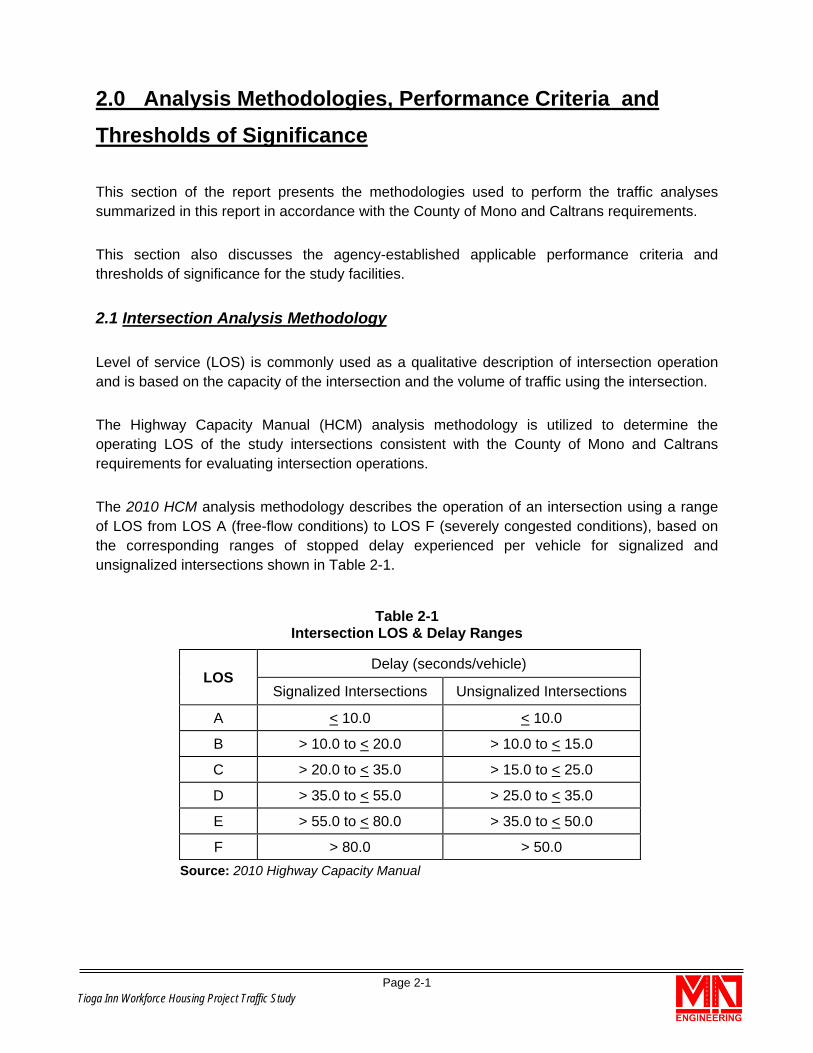
Tioga Inn Workforce Housing Project Traffic Study Page 2-1
2.0 Analysis Methodologies, Performance Criteria and Thresholds of Significance
This section of the report presents the methodologies used to perform the traffic analyses summarized in this report in accordance with the County of Mono and Caltrans requirements.
This section also discusses the agency-established applicable performance criteria and thresholds of significance for the study facilities.
2.1 Intersection Analysis Methodology
Level of service (LOS) is commonly used as a qualitative description of intersection operation and is based on the capacity of the intersection and the volume of traffic using the intersection.
The Highway Capacity Manual (HCM) analysis methodology is utilized to determine the operating LOS of the study intersections consistent with the County of Mono and Caltrans requirements for evaluating intersection operations.
The 2010 HCM analysis methodology describes the operation of an intersection using a range of LOS from LOS A (free-flow conditions) to LOS F (severely congested conditions), based on the corresponding ranges of stopped delay experienced per vehicle for signalized and unsignalized intersections shown in Table 2-1.
Table 2-1 Intersection LOS & Delay Ranges
LOS Delay (seconds/vehicle)
Signalized Intersections Unsignalized Intersections
A < 10.0 < 10.0
B > 10.0 to < 20.0 > 10.0 to < 15.0
C > 20.0 to < 35.0 > 15.0 to < 25.0
D > 35.0 to < 55.0 > 25.0 to < 35.0
E > 55.0 to < 80.0 > 35.0 to < 50.0
F > 80.0 > 50.0 Source: 2010 Highway Capacity Manual
Tioga Inn Workforce Housing Project Traffic Study Page 2-2
The definitions of level of service for uninterrupted flow (flow unrestrained by the existence of traffic control devices) are:
• LOS A represents free flow. Individual users are virtually unaffected by the presence of others in the traffic stream.
• LOS B is in the range of stable flow, but the presence of other users in the traffic stream begins to be noticeable. Freedom to select desired speeds is relatively unaffected, but there is a slight decline in the freedom to maneuver.
• LOS C is in the range of stable flow, but marks the beginning of the range of flow in which the operation of individual users becomes significantly affected by interactions with others in the traffic stream.
• LOS D represents high-density but stable flow. Speed and freedom to maneuver are severely restricted, and the driver experiences a generally poor level of comfort and convenience.
• LOS E represents operating conditions at or near the capacity level. All speeds are reduced to a low, but relatively uniform value. Small increases in flow will cause breakdowns in traffic movement.
• LOS F is used to define forced or breakdown flow. This condition exists wherever the amount of traffic approaching a point exceeds the amount which can traverse the point. Queues form behind such locations.
Level of service is based on the average stopped delay per vehicle for all movements of signalized intersections and all-way stop-controlled intersections; for one-way or two-way stop-controlled intersections, LOS is based on the worst stop-controlled approach.
2.2 Study Intersection Peak Hour Performance Criteria
The study intersections are all part of the State of California Highway System and under the jurisdiction and control of Caltrans.
In accordance with the Caltrans Guide for the Preparation of Traffic Impact Studies (State of California Department of Transportation, December 2002), Caltrans endeavors to maintain a target LOS at the transition between LOS C and LOS D on State Highway facilities.
Hence, consistent with the Tioga Inn Draft Specific Plan Environmental Impact Report (The Company of Eric Jay Toll, AICP, Inc., May 24, 1993), this analysis assumes LOS D is the acceptable LOS for the study intersections evaluated in this study. Any study intersections operating at LOS E, or F will be considered deficient.
Tioga Inn Workforce Housing Project Traffic Study Page 2-3
2.3 Study Intersection Thresholds of Significance
As previously noted, the study intersections are all part of the State of California Highway System and under the jurisdiction and control of Caltrans.
While Caltrans has not established traffic thresholds of significance, this traffic analysis utilizes the following traffic thresholds of significance:
• Any intersection operating at a deficient LOS (LOS E, or F) will be considered impacted and would require mitigation measures to achieve acceptable LOS operations (LOS A, B, C, or D).
Tioga Inn Workforce Housing Project Traffic Study Page 3-1
3.0 Existing Traffic Volumes & Circulation System
This section provides a discussion of existing study area conditions and traffic volumes.
3.1 Roadway Description
The characteristics of the roadway system in the vicinity of the project site are described below:
Highway 395 (U.S. Route 395 or US-395) is a U.S. Route in the western United States. The southern terminus of the route is in the Mojave Desert at Interstate 15 near Hesperia. The northern terminus is at the Canada–US border near Laurier, where the road becomes Highway 395 upon entering British Columbia, Canada. At one time, the route extended south to San Diego. I-15 and I-215 replaced the stretch of 395 that ran from San Diego to Hesperia through Riverside and San Bernardino. "Old Highway 395" can be seen along or near I-15 in many locations before it branches off at Hesperia to head north.
US 395 runs along the Eastern Sierra in the Owens Valley and crosses through the Modoc Plateau along its route.
In the project vicinity, US-395 is a four-lane divided roadway (2 lanes in each direction of travel) traversing in the north-south direction.
Tioga Road (State Route 120 or SR-120) is located in central California. It runs from the San Joaquin Valley near Lathrop through Yosemite National Park, to its end at U.S. Route 6 in Mono County, eastern California. While the route is signed as a contiguous route through Yosemite National Park, the portion in park boundaries is federally maintained, and is not included in the state route logs. The portion at Tioga Pass is the highest paved through road in the California State Route system. This part is not maintained in the winter and is usually closed during the winter season. The road is a toll road through Yosemite National Park between the Big Oak Flats entrance and the Tioga Pass entrance. The National Park Service implemented the tolls along CA-120, along with the Central Yosemite Highway and Wawona Road to help restore funding after significant losses due to the Ferguson Fire and the construction of the rockshed underneath the site of the Ferguson Slide, which reopened the original alignment of the Central Yosemite Highway that had been closed since 2006.
In the project vicinity, SR-120 is a two-lane undivided roadway (1 lane in each direction of travel) traversing in the east-west direction.
Tioga Inn Workforce Housing Project Traffic Study Page 3-2
3.2 Existing Traffic Controls & Intersection Geometrics
Exhibit 3-1 identifies existing roadway conditions for the study area roadways. The number of through traffic lanes for existing roadways and the existing intersection controls are identified.
3.3 Existing Conditions Traffic Volumes
As previously noted, study area traffic conditions are very seasonal by time of day, month and vary by the time of the year. Tioga Road (SR-120) is generally closed during winter and peak traffic conditions generally occur in the summer time.
As also previously noted, during summer Thursday evenings, concert-type events are held in the lawn area of the site.
To evaluate and capture existing traffic conditions and volumes during peak traffic conditions of the study area, traffic counts were collected on Thursday July 12, 2018 and Thursday August 9, 2018 when concert-type events were being held at the project site.
The counts were collected during the following time periods:
• AM: 8:00 AM to 10:00 AM;
• Mid-Day 12:00 PM to 2:00 PM
• PM: 4:00 PM to 6:00 PM.
The counts used in this analysis were taken from the highest hour within the peak period counted.
Exhibit 3-2 show existing conditions traffic volumes at the study intersections; detailed traffic count data is contained in Appendix A.
The analysis also utilizes the truck percentage mix of vehicles on Highway 395 and State Route 120 based on truck traffic information published by Caltrans.
Based on the Caltrans data, on a daily basis, the traffic volume on State Route 120 in the study area vicinity consists of 14 trucks and heavy vehicles. Similarly, the traffic volume on Highway 395 in the study area vicinity consists of 19 trucks and heavy vehicles.
The level of service analysis accounts for this parameter.
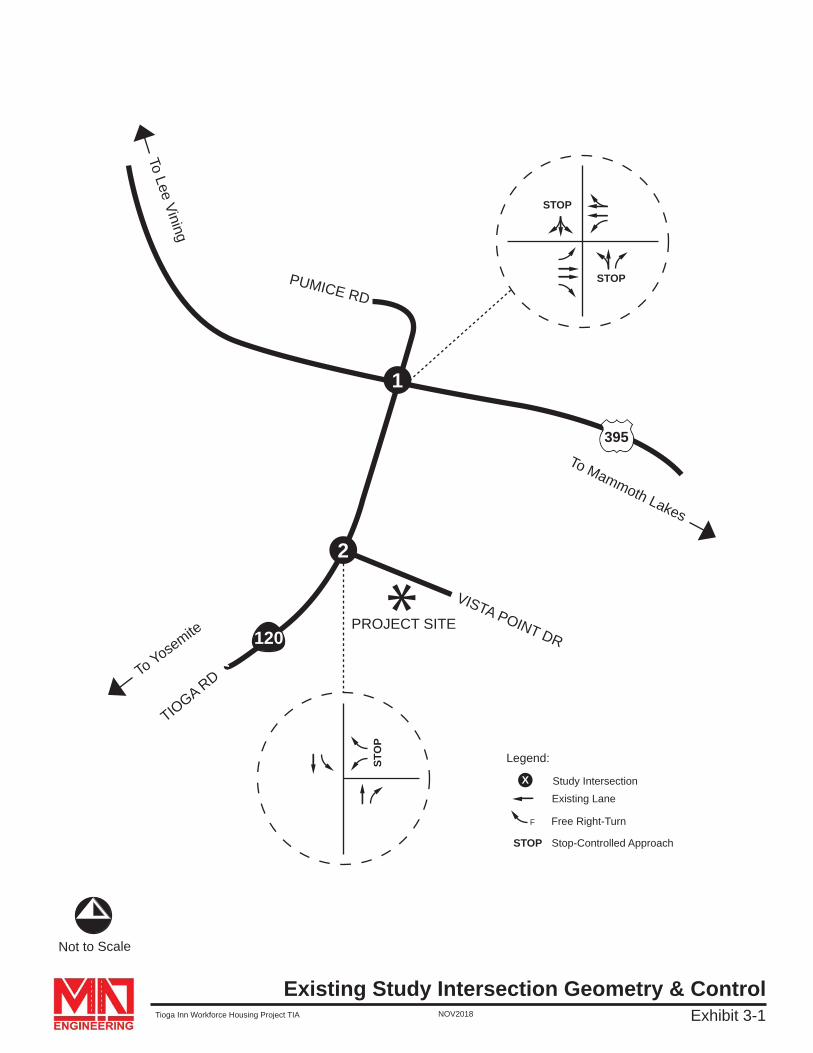
NOV 2018
Not to Scale
Tioga Inn Workforce Housing Project TIA
VISTA POINT DR
395
120
PUMICE RD
*PROJECT SITE
TIOGA RD
To Lee Vining
To Yosemite
To Mammoth Lakes
1
2
Free Right-Turn
Existing Lane
F
Exhibit 3-1Existing Study Intersection Geometry & Control
Stop-Controlled ApproachSTOP
Study Intersection
Legend:
X
STOP
STOP
STO
P
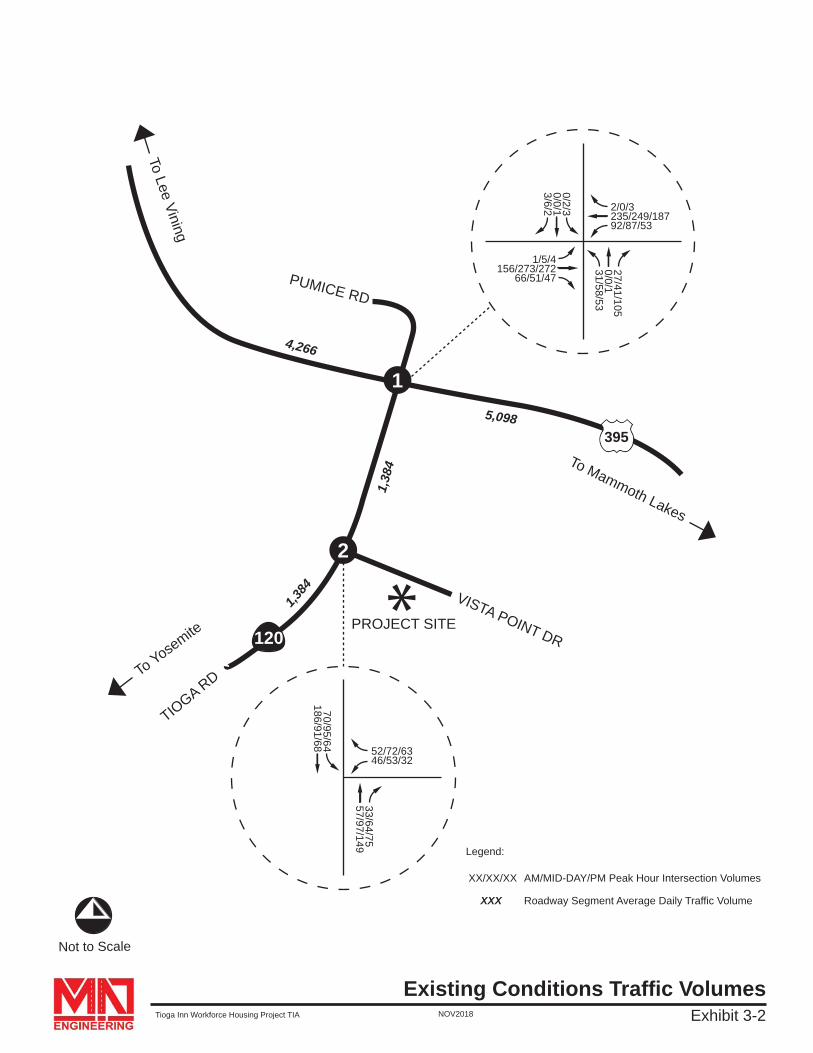
NOV 2018
Not to Scale
Tioga Inn Workforce Housing Project TIA
VISTA POINT DR
395
120
PUMICE RD
*PROJECT SITE
TIOGA RD
To Lee Vining
To Yosemite
To Mammoth Lakes
1
2
1/5/4156/273/272
66/51/47
2/0/3235/249/18792/87/53
0/2/30/0/13/6/2
27/41/1050/0/131/58/53
Exhibit 3-2
AM/MID-DAY/PM Peak Hour Intersection Volumes
Legend:
XX/XX/XX
Roadway Segment Average Daily Traffic VolumeXXX
Existing Conditions Traffic Volumes
52/72/6346/53/32
70/95/64186/91/68
33/64/7557/97/149
5,098
4,266
1,38
4
1,384
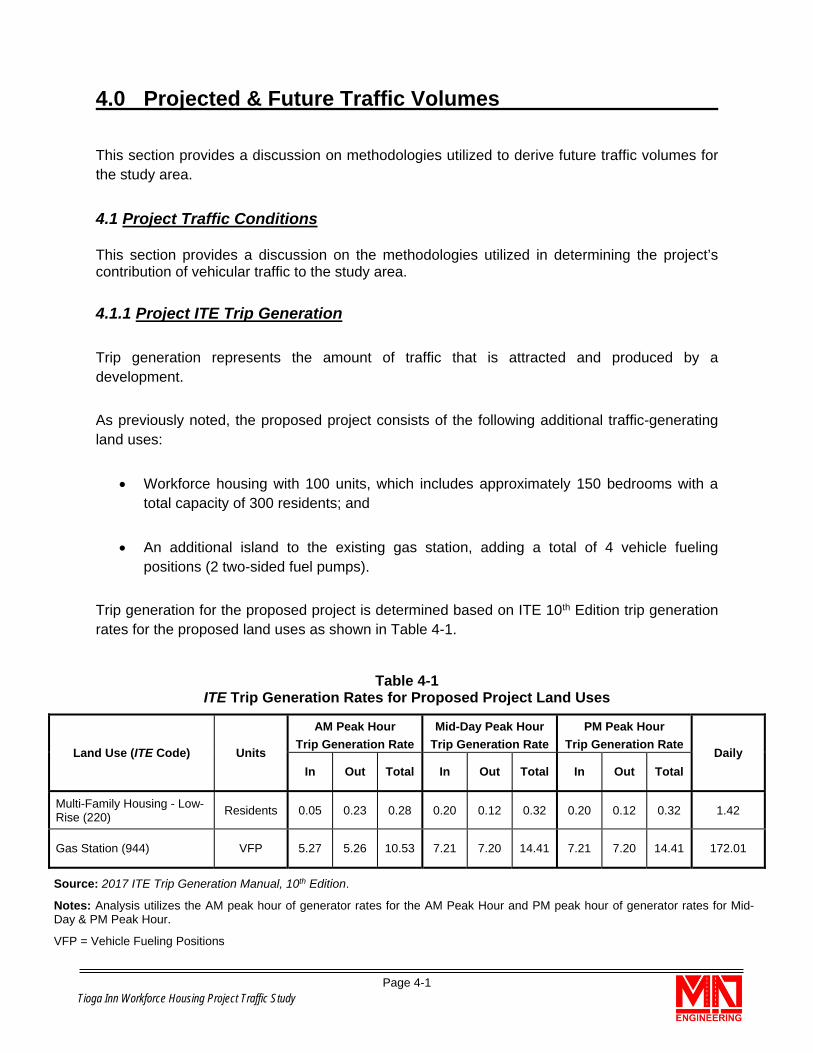
Tioga Inn Workforce Housing Project Traffic Study Page 4-1
4.0 Projected & Future Traffic Volumes
This section provides a discussion on methodologies utilized to derive future traffic volumes for the study area.
4.1 Project Traffic Conditions
This section provides a discussion on the methodologies utilized in determining the project’s contribution of vehicular traffic to the study area.
4.1.1 Project ITE Trip Generation
Trip generation represents the amount of traffic that is attracted and produced by a development.
As previously noted, the proposed project consists of the following additional traffic-generating land uses:
• Workforce housing with 100 units, which includes approximately 150 bedrooms with a total capacity of 300 residents; and
• An additional island to the existing gas station, adding a total of 4 vehicle fueling positions (2 two-sided fuel pumps).
Trip generation for the proposed project is determined based on ITE 10th Edition trip generation rates for the proposed land uses as shown in Table 4-1.
Table 4-1 ITE Trip Generation Rates for Proposed Project Land Uses
Land Use (ITE Code) Units AM Peak Hour
Trip Generation RateMid-Day Peak Hour
Trip Generation RatePM Peak Hour
Trip Generation RateDaily
In Out Total In Out Total In Out Total
Multi-Family Housing - Low-Rise (220) Residents 0.05 0.23 0.28 0.20 0.12 0.32 0.20 0.12 0.32 1.42
Gas Station (944) VFP 5.27 5.26 10.53 7.21 7.20 14.41 7.21 7.20 14.41 172.01
Source: 2017 ITE Trip Generation Manual, 10th Edition.
Notes: Analysis utilizes the AM peak hour of generator rates for the AM Peak Hour and PM peak hour of generator rates for Mid-Day & PM Peak Hour.
VFP = Vehicle Fueling Positions
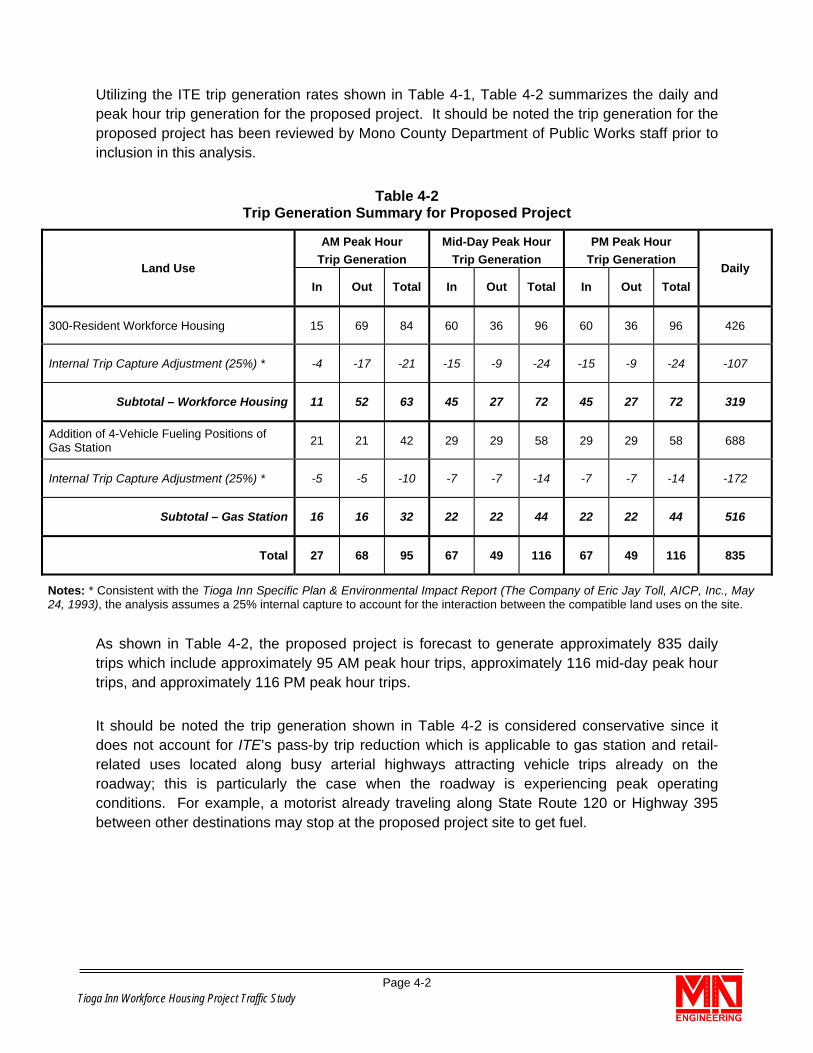
Tioga Inn Workforce Housing Project Traffic Study Page 4-2
Utilizing the ITE trip generation rates shown in Table 4-1, Table 4-2 summarizes the daily and peak hour trip generation for the proposed project. It should be noted the trip generation for the proposed project has been reviewed by Mono County Department of Public Works staff prior to inclusion in this analysis.
Table 4-2 Trip Generation Summary for Proposed Project
Land Use AM Peak Hour
Trip Generation Mid-Day Peak Hour
Trip Generation PM Peak Hour
Trip Generation Daily
In Out Total In Out Total In Out Total
300-Resident Workforce Housing 15 69 84 60 36 96 60 36 96 426
Internal Trip Capture Adjustment (25%) * -4 -17 -21 -15 -9 -24 -15 -9 -24 -107
Subtotal – Workforce Housing 11 52 63 45 27 72 45 27 72 319
Addition of 4-Vehicle Fueling Positions of Gas Station 21 21 42 29 29 58 29 29 58 688
Internal Trip Capture Adjustment (25%) * -5 -5 -10 -7 -7 -14 -7 -7 -14 -172
Subtotal – Gas Station 16 16 32 22 22 44 22 22 44 516
Total 27 68 95 67 49 116 67 49 116 835
Notes: * Consistent with the Tioga Inn Specific Plan & Environmental Impact Report (The Company of Eric Jay Toll, AICP, Inc., May 24, 1993), the analysis assumes a 25% internal capture to account for the interaction between the compatible land uses on the site.
As shown in Table 4-2, the proposed project is forecast to generate approximately 835 daily trips which include approximately 95 AM peak hour trips, approximately 116 mid-day peak hour trips, and approximately 116 PM peak hour trips.
It should be noted the trip generation shown in Table 4-2 is considered conservative since it does not account for ITE’s pass-by trip reduction which is applicable to gas station and retail-related uses located along busy arterial highways attracting vehicle trips already on the roadway; this is particularly the case when the roadway is experiencing peak operating conditions. For example, a motorist already traveling along State Route 120 or Highway 395 between other destinations may stop at the proposed project site to get fuel.
Tioga Inn Workforce Housing Project Traffic Study Page 4-3
4.1.2 Project Trip Distribution
Trip distribution represents the directional orientation of traffic to and from the project. Trip distribution is heavily influenced by the geographical location of the site, the location of retail, employment, recreational opportunities, and the proximity to the regional freeway system.
The project’s trip distribution has been developed through discussions and review by Mono County Department of Public Works staff and is based on review of existing land uses and roadway circulation system in the project site vicinity.
Exhibit 4-1 shows the trip distribution for the project’s workforce housing element.
Exhibit 4-2 shows the trip distribution for the project’s gas station element.
4.1.3 Modal Split
The site currently sits adjacent to an existing bus stop serving the Yosemite Area Rapid Transit System (YARTS) located along the project site frontage on Tioga Road (SR-120). Additionally, the Eastern Sierra Transit Authority (ESTA) provides weekday service between Lone Pine and Reno (1 trip each way) with regular stops in Bishop, Mammoth Lakes and Lee Vining (the bus drop-off in Lee Vining is located about 1 miles north of the project site).
Modal split denotes the proportion of traffic generated by a project that would use any of the transportation modes, namely buses, cars, bicycles, motorcycles, trains, carpools, etc. The traffic reducing potential of public transit and other modes is significant. However, the traffic projections in this study are conservative in that public transit and alternative transportation may be able to reduce the traffic volumes, but, no modal split reduction is applied to the projections since precise quantification of the reduction is not feasible. With the implementation of additional transit service and provision of alternative transportation ideas and incentives, such as the ones discussed later in Section 8.4 of this report under Transportation Demand Management (TDM), the automobile traffic demand can be reduced significantly.
4.1.4 Project Traffic Volumes/Assignment
The assignment of traffic from the project site to the adjoining roadway system has been based upon the project's trip generation, trip distribution, and arterial highway and local street systems that are in place.
Project traffic volumes are shown on Exhibit 4-3.
Tioga Inn Workforce Housing Project Traffic Study Page 4-4
4.2 Existing Plus Project Conditions traffic Volumes
Existing Plus Project Conditions traffic volumes are derived by adding the project traffic volumes shown in Exhibit 4-3 to the existing traffic volumes shown in Exhibit 3-2.
Existing Plus Project Conditions traffic volumes are shown in Exhibit 4-4. The exhibit shows the project traffic added on top of the existing traffic volumes.
4.3 Background Traffic
4.3.1 Ambient Growth Method of Projection
To assess future conditions, project traffic is combined with existing traffic, area-wide growth, and cumulative projects’ traffic.
For opening year (2023) conditions, to account for area wide/ambient growth in the study area, an annual growth rate of two percent (2%) has been applied to existing traffic volumes over a five-year period. This growth rate is based on review of past and present traffic volume data and traffic growth patterns in the study area as published by Caltrans through their annual traffic volume data and information for this area.
4.3.2 Cumulative Projects Traffic
The cumulative projects which are expected to affect the traffic conditions of the study area for project opening year (2023) consist of the currently approved but not yet constructed land uses on the project site which are as follows:
• 120-room hotel; and
• Restaurant use with 100 seats and a seating area of approximately 5,000 square feet (gross area of approximately 10,000 square feet).
Trip generation for the cumulative projects is determined based on ITE 10th Edition trip generation rates for the proposed land uses as shown in Table 4-3.
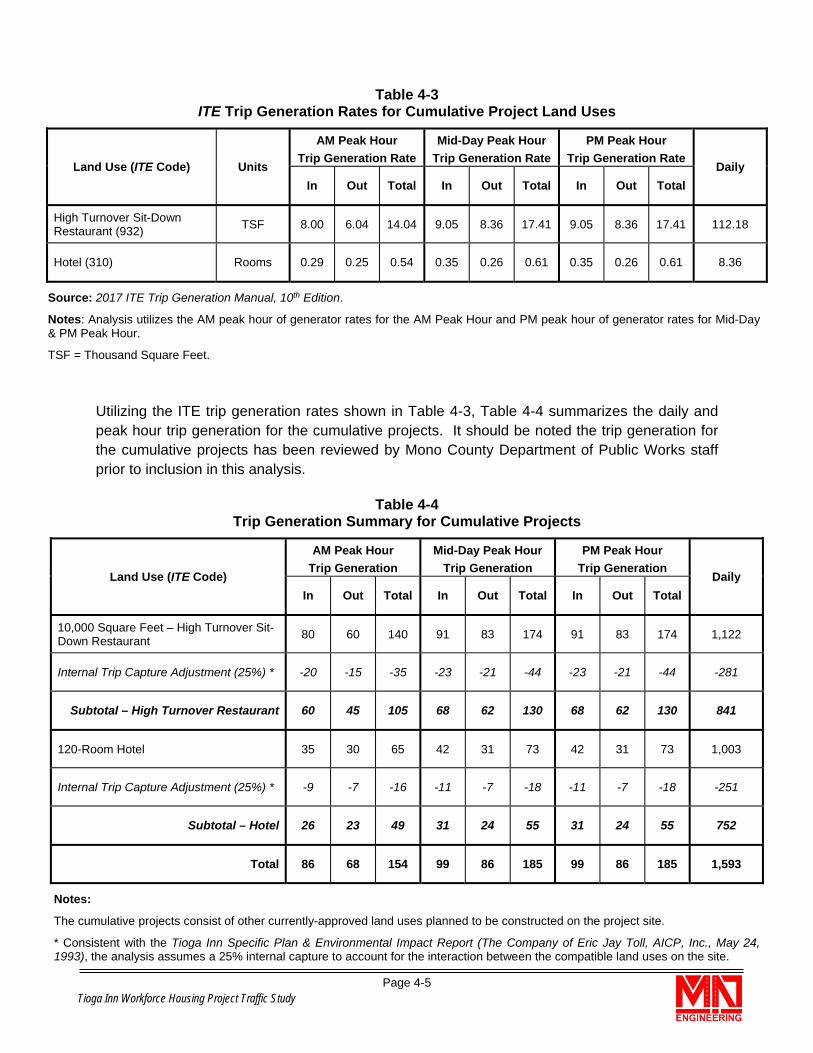
Tioga Inn Workforce Housing Project Traffic Study Page 4-5
Table 4-3 ITE Trip Generation Rates for Cumulative Project Land Uses
Land Use (ITE Code) Units AM Peak Hour
Trip Generation RateMid-Day Peak Hour
Trip Generation RatePM Peak Hour
Trip Generation RateDaily
In Out Total In Out Total In Out Total
High Turnover Sit-Down Restaurant (932) TSF 8.00 6.04 14.04 9.05 8.36 17.41 9.05 8.36 17.41 112.18
Hotel (310) Rooms 0.29 0.25 0.54 0.35 0.26 0.61 0.35 0.26 0.61 8.36
Source: 2017 ITE Trip Generation Manual, 10th Edition.
Notes: Analysis utilizes the AM peak hour of generator rates for the AM Peak Hour and PM peak hour of generator rates for Mid-Day & PM Peak Hour.
TSF = Thousand Square Feet.
Utilizing the ITE trip generation rates shown in Table 4-3, Table 4-4 summarizes the daily and peak hour trip generation for the cumulative projects. It should be noted the trip generation for the cumulative projects has been reviewed by Mono County Department of Public Works staff prior to inclusion in this analysis.
Table 4-4 Trip Generation Summary for Cumulative Projects
Land Use (ITE Code)
AM Peak Hour Trip Generation
Mid-Day Peak Hour Trip Generation
PM Peak Hour Trip Generation
Daily In Out Total In Out Total In Out Total
10,000 Square Feet – High Turnover Sit-Down Restaurant 80 60 140 91 83 174 91 83 174 1,122
Internal Trip Capture Adjustment (25%) * -20 -15 -35 -23 -21 -44 -23 -21 -44 -281
Subtotal – High Turnover Restaurant 60 45 105 68 62 130 68 62 130 841
120-Room Hotel 35 30 65 42 31 73 42 31 73 1,003
Internal Trip Capture Adjustment (25%) * -9 -7 -16 -11 -7 -18 -11 -7 -18 -251
Subtotal – Hotel 26 23 49 31 24 55 31 24 55 752
Total 86 68 154 99 86 185 99 86 185 1,593
Notes:
The cumulative projects consist of other currently-approved land uses planned to be constructed on the project site.
* Consistent with the Tioga Inn Specific Plan & Environmental Impact Report (The Company of Eric Jay Toll, AICP, Inc., May 24, 1993), the analysis assumes a 25% internal capture to account for the interaction between the compatible land uses on the site.
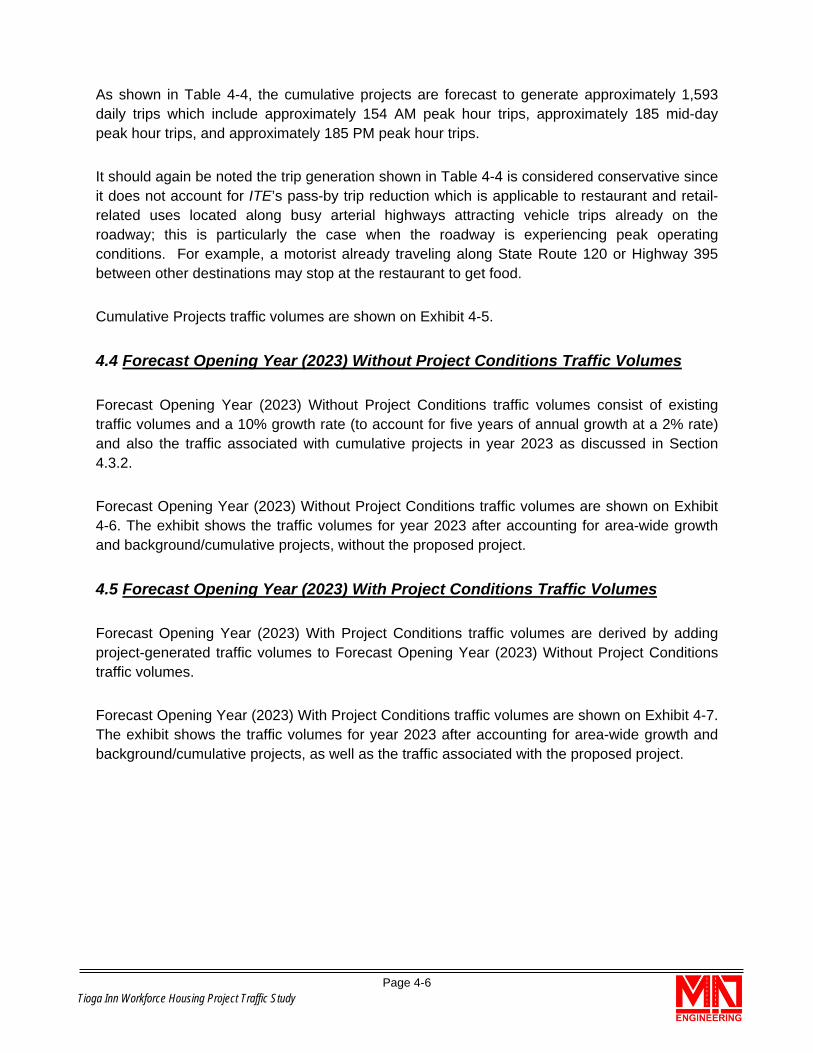
Tioga Inn Workforce Housing Project Traffic Study Page 4-6
As shown in Table 4-4, the cumulative projects are forecast to generate approximately 1,593 daily trips which include approximately 154 AM peak hour trips, approximately 185 mid-day peak hour trips, and approximately 185 PM peak hour trips.
It should again be noted the trip generation shown in Table 4-4 is considered conservative since it does not account for ITE’s pass-by trip reduction which is applicable to restaurant and retail-related uses located along busy arterial highways attracting vehicle trips already on the roadway; this is particularly the case when the roadway is experiencing peak operating conditions. For example, a motorist already traveling along State Route 120 or Highway 395 between other destinations may stop at the restaurant to get food.
Cumulative Projects traffic volumes are shown on Exhibit 4-5.
4.4 Forecast Opening Year (2023) Without Project Conditions Traffic Volumes
Forecast Opening Year (2023) Without Project Conditions traffic volumes consist of existing traffic volumes and a 10% growth rate (to account for five years of annual growth at a 2% rate) and also the traffic associated with cumulative projects in year 2023 as discussed in Section 4.3.2.
Forecast Opening Year (2023) Without Project Conditions traffic volumes are shown on Exhibit 4-6. The exhibit shows the traffic volumes for year 2023 after accounting for area-wide growth and background/cumulative projects, without the proposed project.
4.5 Forecast Opening Year (2023) With Project Conditions Traffic Volumes
Forecast Opening Year (2023) With Project Conditions traffic volumes are derived by adding project-generated traffic volumes to Forecast Opening Year (2023) Without Project Conditions traffic volumes.
Forecast Opening Year (2023) With Project Conditions traffic volumes are shown on Exhibit 4-7. The exhibit shows the traffic volumes for year 2023 after accounting for area-wide growth and background/cumulative projects, as well as the traffic associated with the proposed project.

NOV 2018
Not to Scale
Tioga Inn Workforce Housing Project TIA
VISTA POINT DR
395
120
PUMICE RD
*PROJECT SITE
TIOGA RD
To Lee Vining
To Yosemite
To Mammoth Lakes
1
2
XX% Percent Trip Distribution
Legend:
30%
Exhibit 4-1
Forecast Trip Percent Distribution of Proposed Project
65%
5%
(Workforce Housing Element)
95%
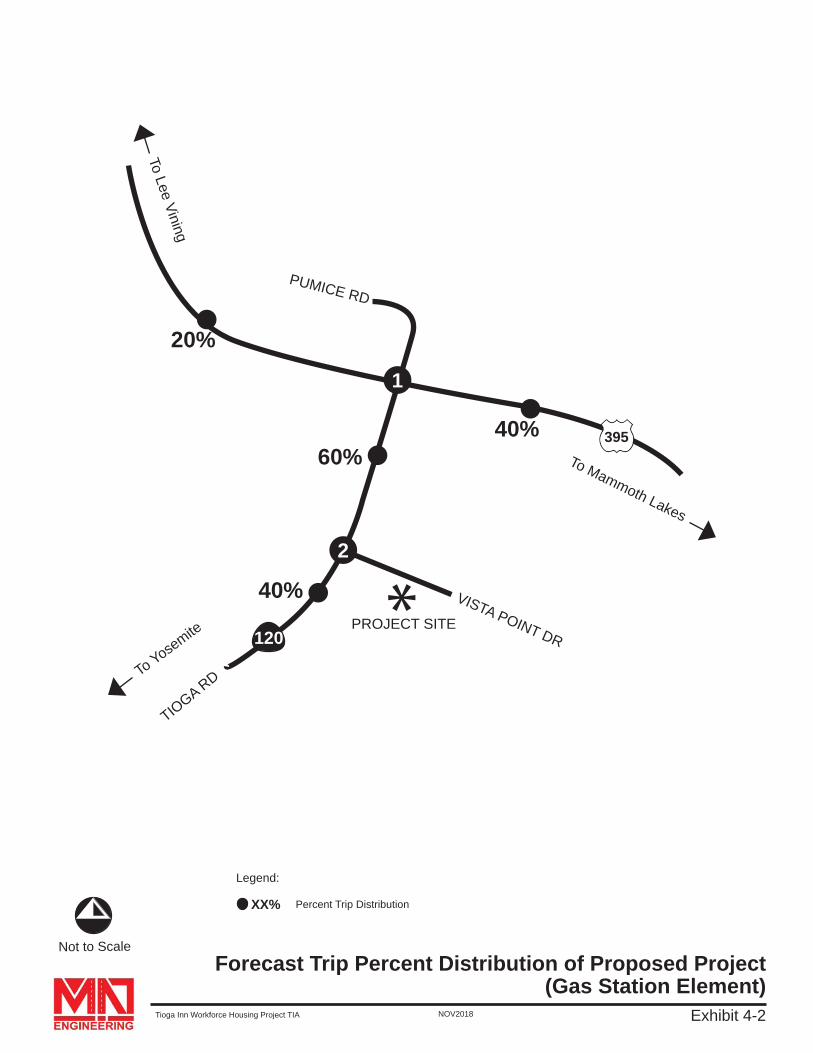
NOV 2018
Not to Scale
Tioga Inn Workforce Housing Project TIA
VISTA POINT DR
395
120
PUMICE RD
*PROJECT SITE
TIOGA RD
To Lee Vining
To Yosemite
To Mammoth Lakes
1
2
XX% Percent Trip Distribution
Legend:
20%
Exhibit 4-2
Forecast Trip Percent Distribution of Proposed Project
40%
40%
(Gas Station Element)
60%
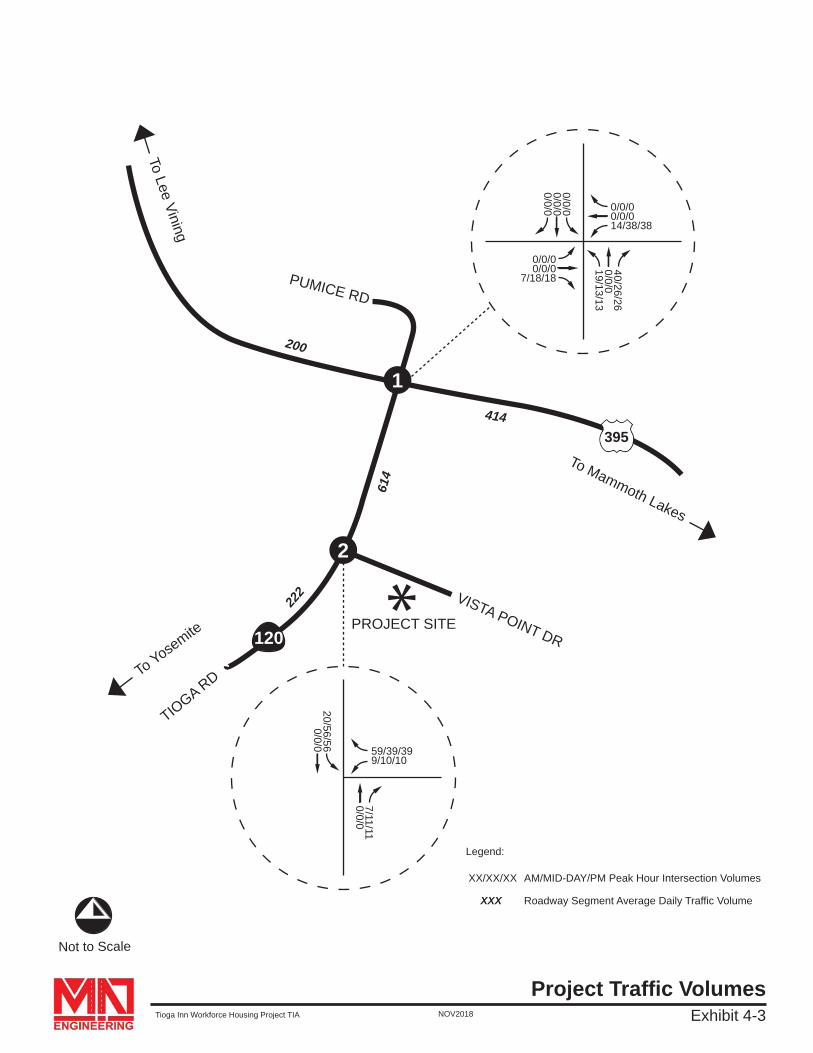
NOV 2018
Not to Scale
Tioga Inn Workforce Housing Project TIA
VISTA POINT DR
395
120
PUMICE RD
*PROJECT SITE
TIOGA RD
To Lee Vining
To Yosemite
To Mammoth Lakes
1
2
0/0/00/0/0
7/18/18
0/0/00/0/014/38/38
0/0/00/0/00/0/0
40/26/260/0/019/13/13
Exhibit 4-3
AM/MID-DAY/PM Peak Hour Intersection Volumes
Legend:
XX/XX/XX
Roadway Segment Average Daily Traffic VolumeXXX
Project Traffic Volumes
414
200
614
222
59/39/399/10/10
20/56/560/0/0
7/11/110/0/0
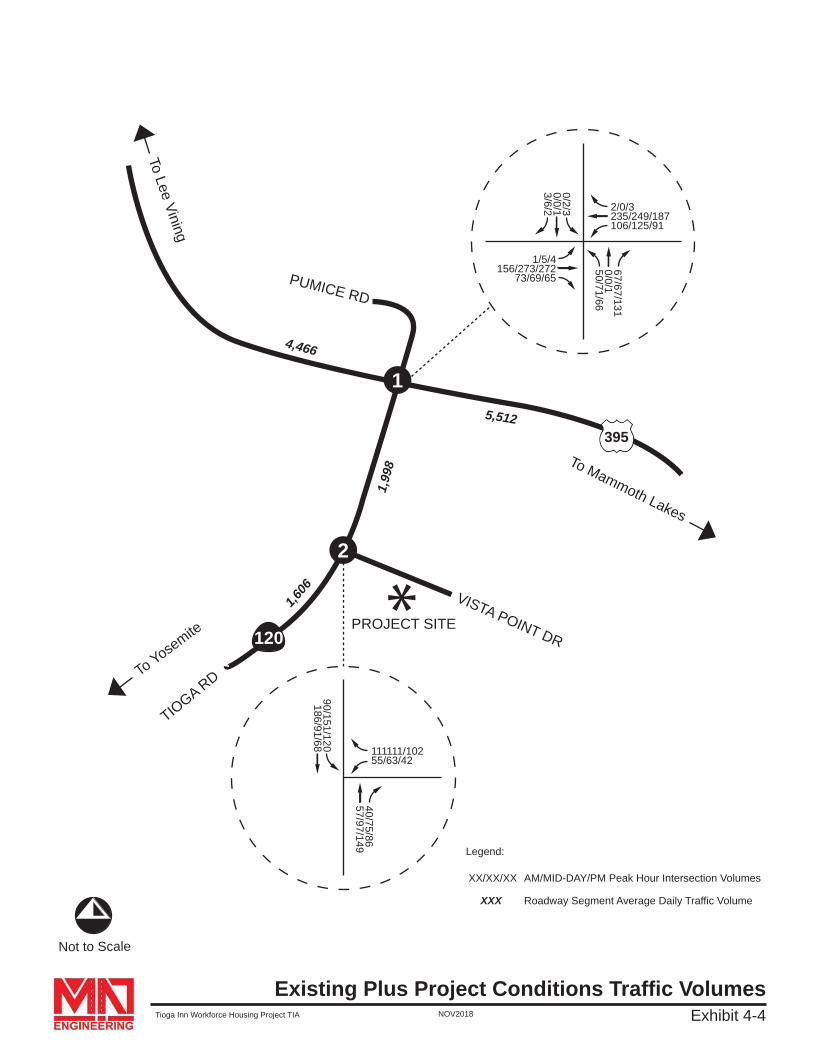
NOV 2018
Not to Scale
Tioga Inn Workforce Housing Project TIA
VISTA POINT DR
395
120
PUMICE RD
*PROJECT SITE
TIOGA RD
To Lee Vining
To Yosemite
To Mammoth Lakes
1
2
1/5/4156/273/272
73/69/65
2/0/3235/249/187106/125/91
0/2/30/0/13/6/2
67/67/1310/0/150/71/66
Exhibit 4-4
AM/MID-DAY/PM Peak Hour Intersection Volumes
Legend:
XX/XX/XX
Roadway Segment Average Daily Traffic VolumeXXX
Existing Plus Project Conditions Traffic Volumes
5,512
4,466
1,99
8
1,606
111111/10255/63/42
90/151/120186/91/68
40/75/8657/97/149

NOV 2018
Not to Scale
Tioga Inn Workforce Housing Project TIA
VISTA POINT DR
395
120
PUMICE RD
*PROJECT SITE
TIOGA RD
To Lee Vining
To Yosemite
To Mammoth Lakes
1
2
0/0/00/0/0
17/20/20
0/0/00/0/040/46/46
0/0/00/0/00/0/0
32/41/410/0/014/17/17
Exhibit 4-5
AM/MID-DAY/PM Peak Hour Intersection Volumes
Legend:
XX/XX/XX
Roadway Segment Average Daily Traffic VolumeXXX
Cumulative Projects Traffic Volumes
722
318
1,04
0
554
45/58/5823/28/28
58/66/660/0/0
28/33/330/0/0
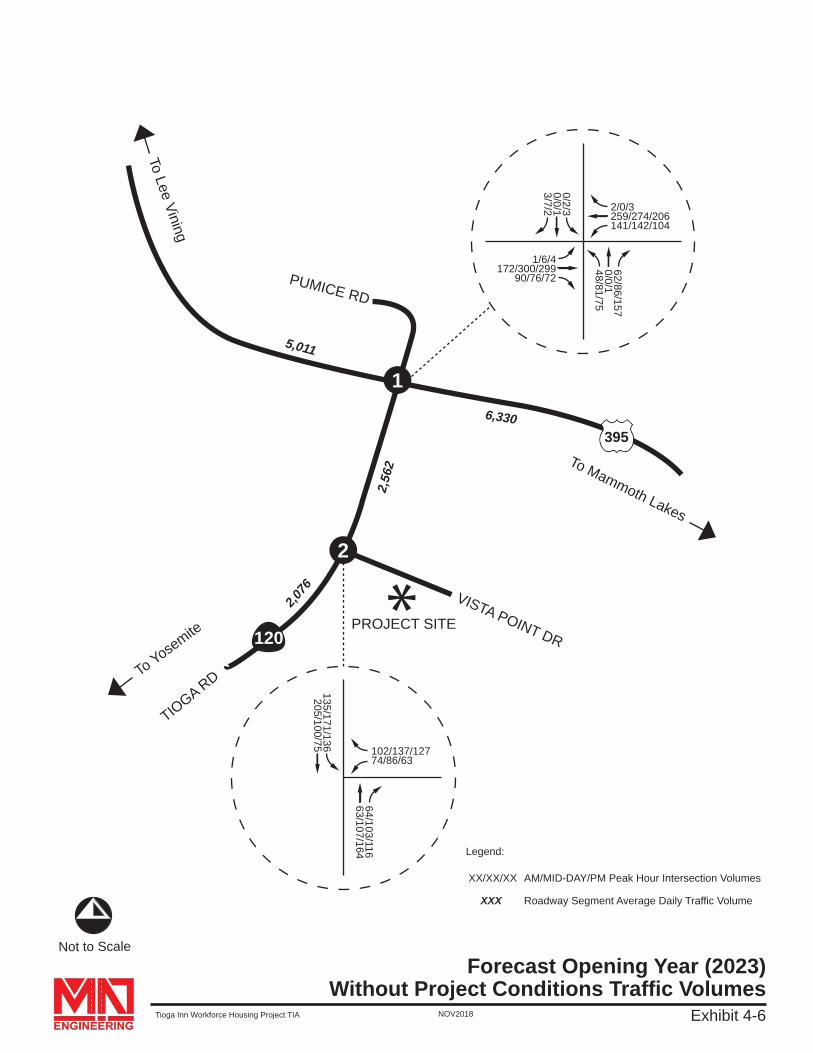
NOV 2018
Not to Scale
Tioga Inn Workforce Housing Project TIA
VISTA POINT DR
395
120
PUMICE RD
*PROJECT SITE
TIOGA RD
To Lee Vining
To Yosemite
To Mammoth Lakes
1
2
1/6/4172/300/299
90/76/72
2/0/3259/274/206141/142/104
0/2/30/0/13/7/2
62/86/1570/0/148/81/75
Exhibit 4-6
AM/MID-DAY/PM Peak Hour Intersection Volumes
Legend:
XX/XX/XX
Roadway Segment Average Daily Traffic VolumeXXX
Without Project Conditions Traffic Volumes
6,330
5,011
2,56
2
2,076
Forecast Opening Year (2023)
102/137/12774/86/63
135/171/136205/100/75
64/103/11663/107/164

NOV 2018
Not to Scale
Tioga Inn Workforce Housing Project TIA
VISTA POINT DR
395
120
PUMICE RD
*PROJECT SITE
TIOGA RD
To Lee Vining
To Yosemite
To Mammoth Lakes
1
2
1/6/4172/300/299
97/94/90
2/0/3259/274/206155/180/142
0/2/30/0/13/7/2
102/112/1830/0/167/94/88
Exhibit 4-7
AM/MID-DAY/PM Peak Hour Intersection Volumes
Legend:
XX/XX/XX
Roadway Segment Average Daily Traffic VolumeXXX
With Project Conditions Traffic Volumes
6,744
5,211
3,17
6
2,298
Forecast Opening Year (2023)
161/176/16683/96/73
155/227/192205/100/75
71/114/12763/107/164

Tioga Inn Workforce Housing Project Traffic Study Page 5-1
5.0 MUTCD Traffic Signal Warrant Analysis
The existing Highway 395 / Tioga Road (SR-120) unsignalized study intersection has been evaluated for signalization based on the peak hour and daily warrants and procedures contained in the California Manual on Uniform Traffic Control Devices (CA MUTCD). The MUTCD is utilized by Caltrans.
The California Manual on Uniform Traffic Control Devices (CA MUTCD) peak hour methodology for evaluation of signal warrants determines if a traffic signal is warranted based on the magnitude of the traffic entering the intersection during a single hour.
Table 5-1 summarizes the results of the MUTCD peak hour and daily signal warrant analysis at the Highway 395 / Tioga Road (SR-120) unsignalized study intersection for the analysis scenarios evaluated as part of this report; detailed MUTCD signal warrant analysis sheets are contained in Appendix B.
Table 5-1 Highway 395 / Tioga Road (SR-120) MUTCD Traffic Signal Warrant Analysis Summary
Analysis Scenario
Signal Warrant Satisfied?
AM Peak Hour
Mid-Day Peak Hour
PM Peak Hour Daily
Existing Conditions NO NO NO NO
Existing Plus Project Conditions NO NO NO NO
Forecast Opening Year (2023) Without Project Conditions NO YES YES NO
Forecast Opening year (2023) With Project Conditions NO YES YES NO
As shown in Table 5-1, the Highway 395 / Tioga Road (SR-120) unsignalized study intersection is forecast to satisfy the MUTCD traffic signal warrants for the following conditions:
• Forecast Opening Year (2023) Without Project Conditions (Mid-Day Peak Hour and PM Peak Hour); and
• Forecast Opening Year (2023) With Project Conditions (Mid-Day Peak Hour and PM Peak Hour).
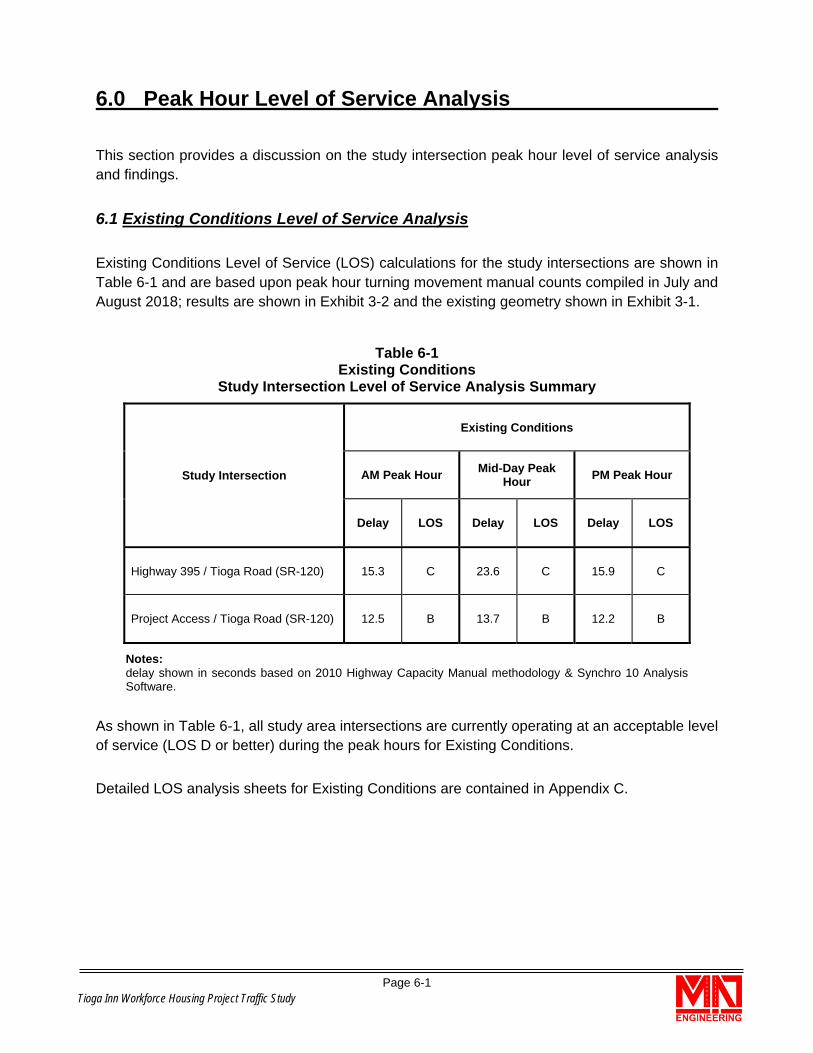
Tioga Inn Workforce Housing Project Traffic Study Page 6-1
6.0 Peak Hour Level of Service Analysis
This section provides a discussion on the study intersection peak hour level of service analysis and findings.
6.1 Existing Conditions Level of Service Analysis
Existing Conditions Level of Service (LOS) calculations for the study intersections are shown in Table 6-1 and are based upon peak hour turning movement manual counts compiled in July and August 2018; results are shown in Exhibit 3-2 and the existing geometry shown in Exhibit 3-1.
Table 6-1 Existing Conditions
Study Intersection Level of Service Analysis Summary
Study Intersection
Existing Conditions
AM Peak Hour Mid-Day Peak Hour PM Peak Hour
Delay LOS Delay LOS Delay LOS
Highway 395 / Tioga Road (SR-120) 15.3 C 23.6 C 15.9 C
Project Access / Tioga Road (SR-120) 12.5 B 13.7 B 12.2 B
Notes: delay shown in seconds based on 2010 Highway Capacity Manual methodology & Synchro 10 Analysis Software.
As shown in Table 6-1, all study area intersections are currently operating at an acceptable level of service (LOS D or better) during the peak hours for Existing Conditions.
Detailed LOS analysis sheets for Existing Conditions are contained in Appendix C.
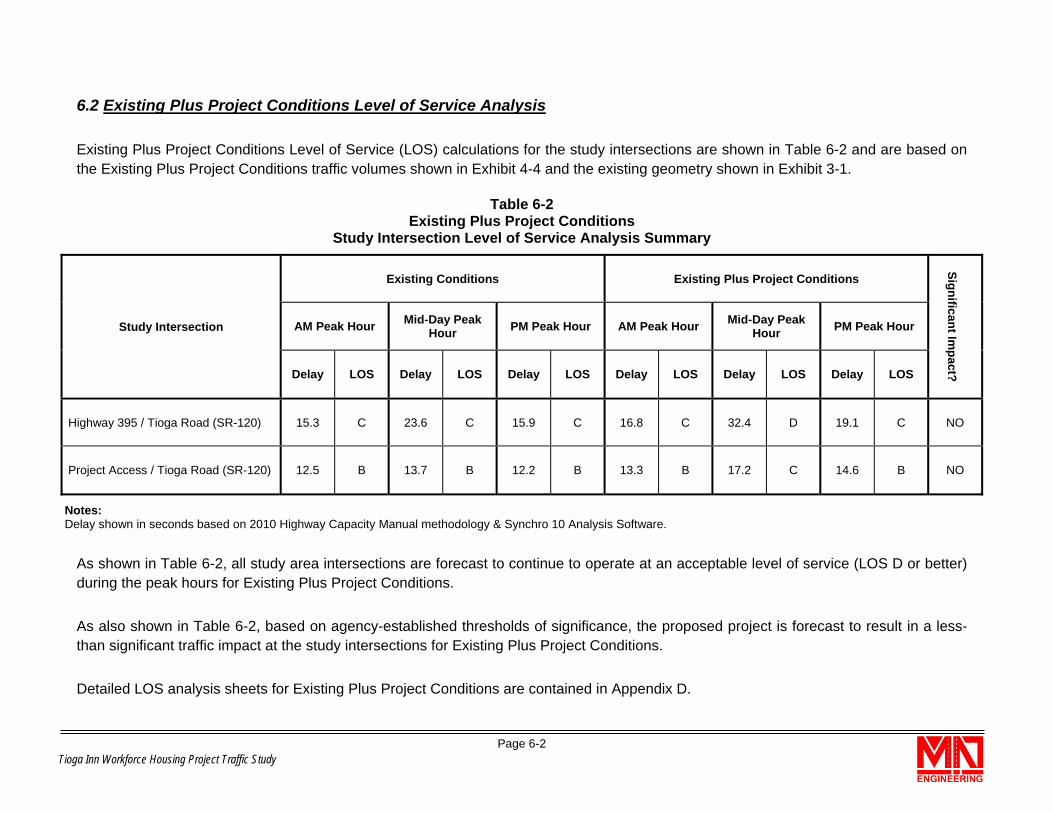
Tioga Inn Workforce Housing Project Traffic Study Page 6-2
6.2 Existing Plus Project Conditions Level of Service Analysis
Existing Plus Project Conditions Level of Service (LOS) calculations for the study intersections are shown in Table 6-2 and are based on the Existing Plus Project Conditions traffic volumes shown in Exhibit 4-4 and the existing geometry shown in Exhibit 3-1.
Table 6-2 Existing Plus Project Conditions
Study Intersection Level of Service Analysis Summary
Study Intersection
Existing Conditions Existing Plus Project Conditions
Significant Impact?
AM Peak Hour Mid-Day Peak Hour PM Peak Hour AM Peak Hour Mid-Day Peak
Hour PM Peak Hour
Delay LOS Delay LOS Delay LOS Delay LOS Delay LOS Delay LOS
Highway 395 / Tioga Road (SR-120) 15.3 C 23.6 C 15.9 C 16.8 C 32.4 D 19.1 C NO
Project Access / Tioga Road (SR-120) 12.5 B 13.7 B 12.2 B 13.3 B 17.2 C 14.6 B NO
Notes: Delay shown in seconds based on 2010 Highway Capacity Manual methodology & Synchro 10 Analysis Software.
As shown in Table 6-2, all study area intersections are forecast to continue to operate at an acceptable level of service (LOS D or better) during the peak hours for Existing Plus Project Conditions.
As also shown in Table 6-2, based on agency-established thresholds of significance, the proposed project is forecast to result in a less-than significant traffic impact at the study intersections for Existing Plus Project Conditions.
Detailed LOS analysis sheets for Existing Plus Project Conditions are contained in Appendix D.
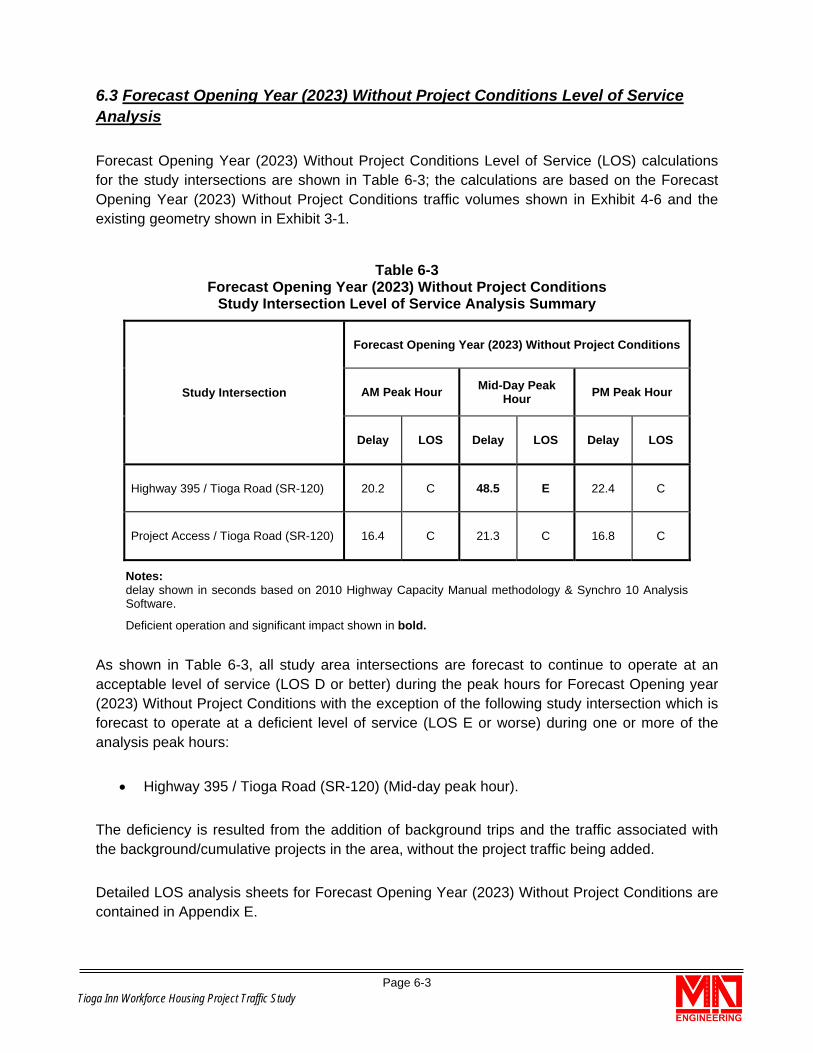
Tioga Inn Workforce Housing Project Traffic Study Page 6-3
6.3 Forecast Opening Year (2023) Without Project Conditions Level of Service Analysis
Forecast Opening Year (2023) Without Project Conditions Level of Service (LOS) calculations for the study intersections are shown in Table 6-3; the calculations are based on the Forecast Opening Year (2023) Without Project Conditions traffic volumes shown in Exhibit 4-6 and the existing geometry shown in Exhibit 3-1.
Table 6-3 Forecast Opening Year (2023) Without Project Conditions
Study Intersection Level of Service Analysis Summary
Study Intersection
Forecast Opening Year (2023) Without Project Conditions
AM Peak Hour Mid-Day Peak Hour PM Peak Hour
Delay LOS Delay LOS Delay LOS
Highway 395 / Tioga Road (SR-120) 20.2 C 48.5 E 22.4 C
Project Access / Tioga Road (SR-120) 16.4 C 21.3 C 16.8 C
Notes: delay shown in seconds based on 2010 Highway Capacity Manual methodology & Synchro 10 Analysis Software.
Deficient operation and significant impact shown in bold.
As shown in Table 6-3, all study area intersections are forecast to continue to operate at an acceptable level of service (LOS D or better) during the peak hours for Forecast Opening year (2023) Without Project Conditions with the exception of the following study intersection which is forecast to operate at a deficient level of service (LOS E or worse) during one or more of the analysis peak hours:
• Highway 395 / Tioga Road (SR-120) (Mid-day peak hour).
The deficiency is resulted from the addition of background trips and the traffic associated with the background/cumulative projects in the area, without the project traffic being added.
Detailed LOS analysis sheets for Forecast Opening Year (2023) Without Project Conditions are contained in Appendix E.
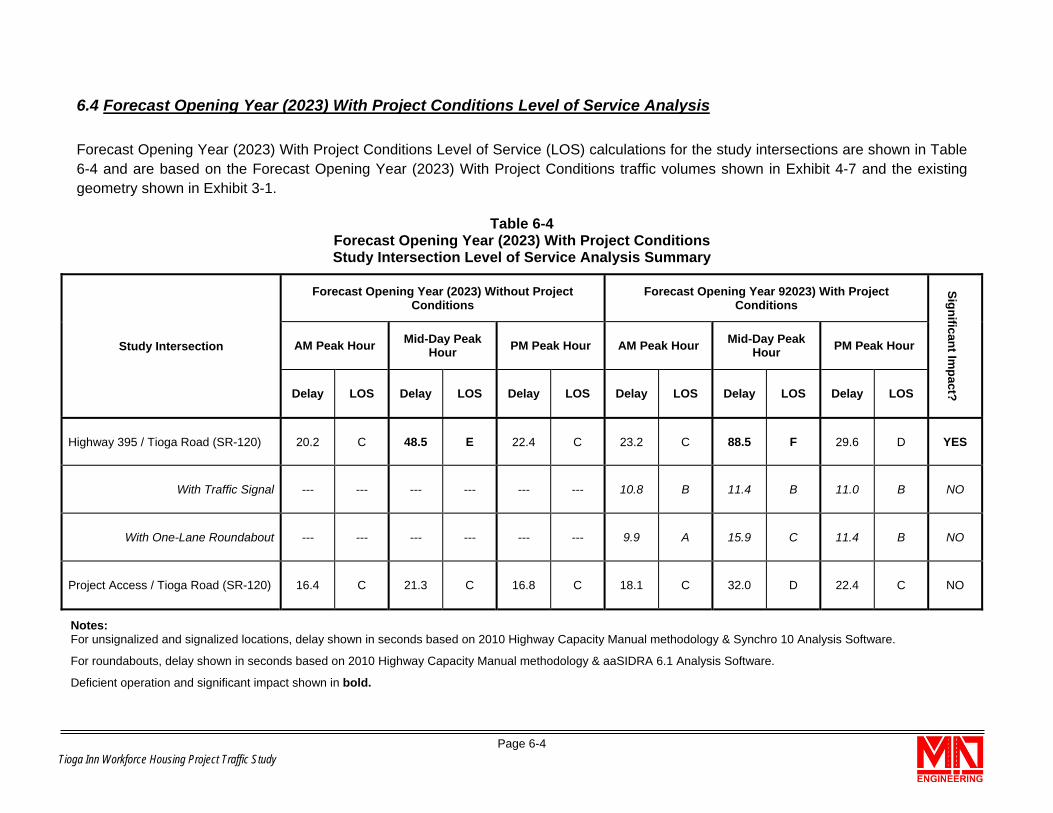
Tioga Inn Workforce Housing Project Traffic Study Page 6-4
6.4 Forecast Opening Year (2023) With Project Conditions Level of Service Analysis
Forecast Opening Year (2023) With Project Conditions Level of Service (LOS) calculations for the study intersections are shown in Table 6-4 and are based on the Forecast Opening Year (2023) With Project Conditions traffic volumes shown in Exhibit 4-7 and the existing geometry shown in Exhibit 3-1.
Table 6-4 Forecast Opening Year (2023) With Project Conditions Study Intersection Level of Service Analysis Summary
Study Intersection
Forecast Opening Year (2023) Without Project Conditions
Forecast Opening Year 92023) With Project Conditions
Significant Impact?
AM Peak Hour Mid-Day Peak Hour PM Peak Hour AM Peak Hour Mid-Day Peak
Hour PM Peak Hour
Delay LOS Delay LOS Delay LOS Delay LOS Delay LOS Delay LOS
Highway 395 / Tioga Road (SR-120) 20.2 C 48.5 E 22.4 C 23.2 C 88.5 F 29.6 D YES
With Traffic Signal --- --- --- --- --- --- 10.8 B 11.4 B 11.0 B NO
With One-Lane Roundabout --- --- --- --- --- --- 9.9 A 15.9 C 11.4 B NO
Project Access / Tioga Road (SR-120) 16.4 C 21.3 C 16.8 C 18.1 C 32.0 D 22.4 C NO
Notes: For unsignalized and signalized locations, delay shown in seconds based on 2010 Highway Capacity Manual methodology & Synchro 10 Analysis Software.
For roundabouts, delay shown in seconds based on 2010 Highway Capacity Manual methodology & aaSIDRA 6.1 Analysis Software.
Deficient operation and significant impact shown in bold.
Tioga Inn Workforce Housing Project Traffic Study Page 6-5
As shown in Table 6-4, all study area intersections are forecast to continue to operate at an acceptable level of service (LOS D or better) during the peak hours for Forecast Opening year (2023) With Project Conditions with the exception of the following study intersection which is forecast to continue to operate at a deficient level of service (LOS E or worse) during one or more of the analysis peak hours:
• Highway 395 / Tioga Road (SR-120) (Mid-day peak hour).
As also shown in Table 6-4, based on agency-established thresholds of significance, the proposed project is forecast to result in a significant traffic impact at the following study intersection for Forecast Opening Year (2023) With Project Conditions:
• Highway 395 / Tioga Road (SR-120) (Mid-day peak hour).
It should be noted in accordance with the HCM methodology, for one-way or two-way stop-controlled intersections, LOS is based on the worst stop-controlled approach.
Hence, the identified deficient operation and excess delay at the Highway 395 / Tioga Road (SR-120) intersection is experienced only by vehicles on the minor street (stop controlled Tioga Road approach) of the intersection which are performing a left-turn maneuver onto northbound Highway 395. Vehicles traveling along the major roadway (Highway 395) have free flow movement with minimal delay and the overall average delay of the intersection is 10.6 seconds (equivalent to LOS B).
Detailed LOS analysis sheets for Forecast Opening Year (2023) With Project Conditions are contained in Appendix F.
As previously shown in Section 5.0 of this report, the Highway 395 / Tioga Road (SR-120) unsignalized study intersection is forecast to satisfy the minimum traffic volumes criteria to satisfy the MUTCD traffic signal warrants for the following conditions:
• Forecast Opening Year (2023) Without Project Conditions (Mid-Day Peak Hour and PM Peak Hour); and
• Forecast Opening Year (2023) With Project Conditions (Mid-Day Peak Hour and PM Peak Hour).
Tioga Inn Workforce Housing Project Traffic Study Page 6-6
The following two alternatives are identified to improve the operation of the intersection to an acceptable level (LOS D or better). The options are presented as alternatives for consideration by Caltrans for this intersection since both are forecast to achieve acceptable level of service:
• Highway 395 / Tioga Rd (SR-120) Improvement Alternative A: Signalize the intersection.
As shown in Table 6-4, installation of a traffic signal is forecast to achieve acceptable level of service (LOS D or better) at the study intersection for Forecast Opening Year (2023) With Project Conditions and the project’s identified significant impact would be reduced to a level considered less than significant.
Detailed LOS analysis sheets for Forecast Opening Year (2023) With Project Conditions with traffic signal are contained in Appendix G.
• Highway 395 / Tioga Rd (SR-120) Improvement Alternative B: Convert to a Single-Lane Roundabout.
As shown in Table 6-4, conversion of the intersection to a single-lane roundabout is forecast to achieve acceptable level of service (LOS D or better) at the study intersection for Forecast Opening Year (2023) With Project Conditions and the project’s identified significant impact would be reduced to a level considered less than significant.
Detailed LOS analysis sheets for Forecast Opening Year (2023) With Project Conditions with single-lane roundabout are contained in Appendix H.
If a two-lane roundabout is installed, it is expected to provide even further increased capacity compared to a single-lane roundabout.
When compared to the traffic signal alternative, the roundabout alternative would allow for continuous flow of traffic without vehicles having to stop at a red light. However, the roundabout alternative would require a well prepared design and potentially greater right-of-way to work effectively.
Since at this time Caltrans does not have any plans to signalize or modify the intersection, the two improvement alternatives which are required to achieve acceptable level of service could be considered infeasible. Hence, the project’s traffic impact on the Highway 395 / Tioga Road (SR-120) study intersection is considered significant and unavoidable.
Tioga Inn Workforce Housing Project Traffic Study Page 7-1
7.0 Peak Hour Vehicular Queue Analysis
Caltrans has previously reviewed the Notice of Preparation for the proposed project and has provided comments which were contained in a comment letter dated November 17, 2016.
As requested by Caltrans in the comment letter, a peak hour 95th percentile vehicular queue evaluation has been prepared to determine the required turn lane storage to accommodate the forecast traffic volumes at the study intersections. The queue analysis has been prepared for Forecast Opening Year (2023) With Project Conditions, which is the most trip-intensive scenario evaluated as part of this report.
The analysis utilizes the Highway Capacity Manual (HCM) 95th percentile methodology which estimates the vehicular queues with a probability of five percent or less of being exceeded. This methodology is commonly utilized for design of storage lanes and determination of turn lane pocket lengths.
It should be noted, Caltrans does not have established and adopted performance criteria and significant impact thresholds for vehicular queuing. Hence, the vehicular queuing analysis presented in this report is strictly for informational purposes.
Table 7-1 summarizes the results of the HCM 95th percentile vehicular queue evaluation.
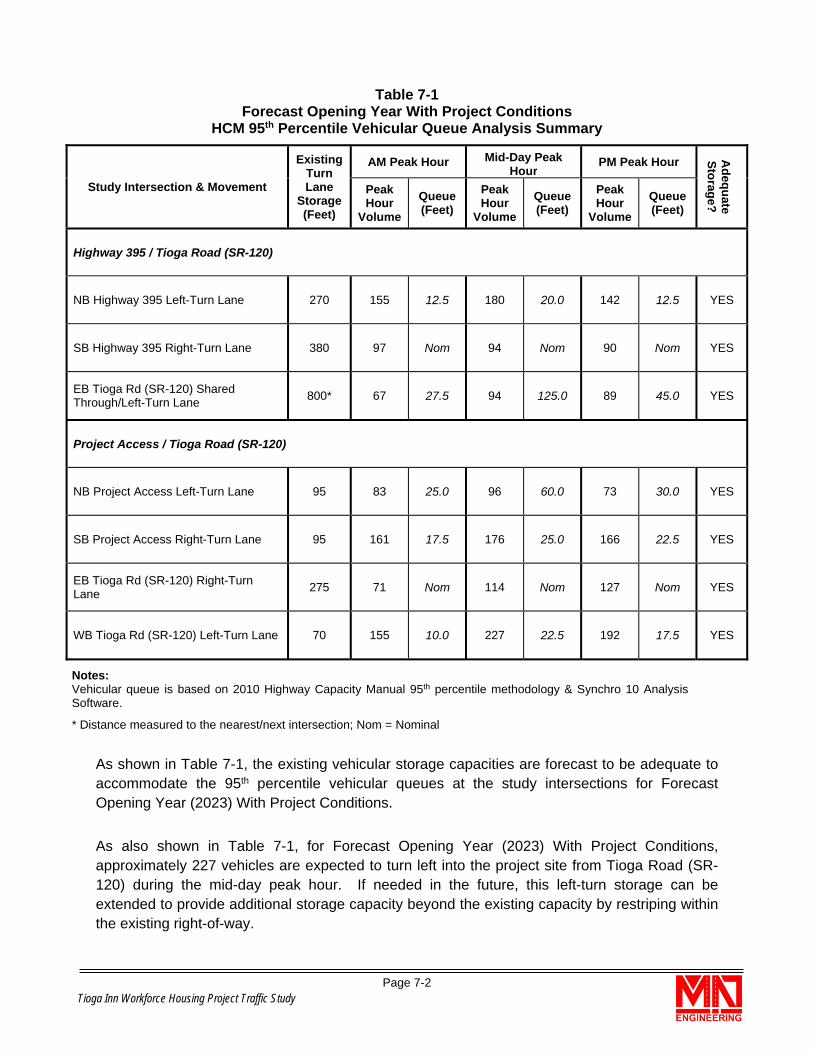
Tioga Inn Workforce Housing Project Traffic Study Page 7-2
Table 7-1 Forecast Opening Year With Project Conditions
HCM 95th Percentile Vehicular Queue Analysis Summary
Study Intersection & Movement Existing
Turn Lane
Storage (Feet)
AM Peak Hour Mid-Day Peak Hour
PM Peak Hour Adequate
Storage?
Peak Hour
Volume
Queue (Feet)
Peak Hour
VolumeQueue (Feet)
Peak Hour
Volume Queue (Feet)
Highway 395 / Tioga Road (SR-120)
NB Highway 395 Left-Turn Lane 270 155 12.5 180 20.0 142 12.5 YES
SB Highway 395 Right-Turn Lane 380 97 Nom 94 Nom 90 Nom YES
EB Tioga Rd (SR-120) Shared Through/Left-Turn Lane 800* 67 27.5 94 125.0 89 45.0 YES
Project Access / Tioga Road (SR-120)
NB Project Access Left-Turn Lane 95 83 25.0 96 60.0 73 30.0 YES
SB Project Access Right-Turn Lane 95 161 17.5 176 25.0 166 22.5 YES
EB Tioga Rd (SR-120) Right-Turn Lane 275 71 Nom 114 Nom 127 Nom YES
WB Tioga Rd (SR-120) Left-Turn Lane 70 155 10.0 227 22.5 192 17.5 YES
Notes: Vehicular queue is based on 2010 Highway Capacity Manual 95th percentile methodology & Synchro 10 Analysis Software.
* Distance measured to the nearest/next intersection; Nom = Nominal
As shown in Table 7-1, the existing vehicular storage capacities are forecast to be adequate to accommodate the 95th percentile vehicular queues at the study intersections for Forecast Opening Year (2023) With Project Conditions.
As also shown in Table 7-1, for Forecast Opening Year (2023) With Project Conditions, approximately 227 vehicles are expected to turn left into the project site from Tioga Road (SR-120) during the mid-day peak hour. If needed in the future, this left-turn storage can be extended to provide additional storage capacity beyond the existing capacity by restriping within the existing right-of-way.

Tioga Inn Workforce Housing Project Traffic Study Page 8-1
8.0 Evaluation of Other Elements
This section provides a discussion and recommendations on the following elements related to the study area and circulation system:
• Collision History and Patterns at the Highway 395 / Tioga Road (SR-120) study intersection;
• Pedestrian & Bicycle Circulation System;
• Caltrans Right-of-Way Acquisition and parking along the Tioga Road frontage; and
• Transportation Demand Management (TDM) recommendations.
8.1 Highway 395 / Tioga Road (SR-120) Collision History
To determine the frequency and patterns of collisions at the Highway 395 / Tioga Road (SR-120) intersection, MAT Engineering reviewed the collision history at the intersection through the California Highway Patrol Statewide Integrated Traffic Records System (SWITRS) database.
The database contains collision history for all jurisdictions reported through local police department and also the Highway Patrol. Data was reviewed for years 2010 through present (2018).
Table 8-1 summarizes the collision history for the intersection.

Tioga Inn Workforce Housing Project Traffic Study Page 8-2
Table 8-1 Highway 395 / Tioga Road (SR-120) Collision History
Year
Collisions by Category
Improper Turn
Unsafe Speed
Right of Way
Travel on Wrong Side
Lane Change Other * Total
2010 1 2 1 1 1 1 7
2011 1 2 3 0 1 5 12
2012 3 5 0 0 0 3 11
2013 0 1 1 0 0 1 3
2014 1 1 1 0 0 3 6
2015 2 3 2 0 0 0 7
2016 1 4 0 0 0 0 5
2017 2 0 1 0 0 1 4
2018 0 2 1 0 0 2 5
Total 11 20 10 1 2 16 60
Notes: Source: Statewide Integrated Traffic Records System (SWITRS) for Mono County region accessed in October 2018.
* Mostly consists of collisions of vehicles with wildlife.
As shown in Table 8-1, based on the SWITRS database, there are a total of 60 reported collisions at the Highway 395 / Tioga Road (SR-120) intersection from 2010 to present (2018).
Twenty of the 60 collisions are attributed to high travel speeds.
A substantial number of the collisions are suspected to be a result of high rates of travel speed on Highway 395 near the Tioga Road intersection in addition to limited visibility and sight distance for vehicles approaching the Highway 395 / Tioga Road (SR-120) intersection.
Based on the review of the SWITRS data, there are not a substantial number of collisions reported at the Project Site Access / Tioga Road (SR-120) intersection.
Tioga Inn Workforce Housing Project Traffic Study Page 8-3
However, based on field observations, drivers traveling eastbound on Tioga Road and approaching the project site access from the Yosemite Park area, appear to sometimes mistakenly shift into the existing right-turn lane into the project site access as they are looking to turn right and southbound onto Highway 395.
Caltrans is considering plans to integrate ‘Traffic Calming’ improvements on US 395 through Lee Vining, and enhanced safety upgrades at the intersection of Highway 395/ Tioga Road (SR-120) as well as along the apron on both sides of the entry to Tioga Mart, and pedestrian access along 395. Other relevant improvements may also be considered.
Based on the foregoing analysis, it is recommended as part of the improvement project for the State Highway system in this area, that Caltrans consider the following:
• Reduce travel speeds on Highway 395 by implementation of effective traffic calming measures such as narrowing of travel lanes, etc.,
• Provide additional advanced warning signs and/or flashing beacons for vehicles approaching the Highway 395 / Tioga Road (SR-120) intersection;
• Provide additional advanced warning signs and lane assignment information for vehicles approaching the Project Site Access / Tioga Road (SR-120) intersection;
• Consider alternative lane striping options to better and more clearly delineate the right-turn lane entering the project site access from Tioga Road; and
• Increase law enforcement presence.
8.2 Pedestrian & Bicycle Circulation System
To improve the pedestrian and bicycle circulation between the project site and Lee Vining, it is recommended a pedestrian link between the project site and Lee Vining be provided by Caltrans to increase walkability, reduce parking demand in town, and enhance the visitor experience.
Caltrans might want to consider a pedestrian connection across Tioga Road (SR-120), and work with applicable agencies to identify additional alternatives and options for improving pedestrian and bicycle connectivity and circulation.
8.3 Caltrans Right-of-Way Acquisition
Another project element pertains to Caltrans’ sale of a 70-foot wide portion of the Tioga Road (SR-120) right-of-way easement to the project applicant. The easement extends for a distance of 1,170-feet adjacent to the Tioga site. A portion of this easement (west of the entry) has long
Tioga Inn Workforce Housing Project Traffic Study Page 8-4
been used informally by Tioga Mart customers as a picnic and play area. The ownership transfer will facilitate long-term use of the picnic area by customers, and provide greater flexibility in design of the land adjacent to and north of the hotel.
Caltrans will continue to own the remaining SR120 right of way, which includes an apron (east and west of the entry) that is used heavily by motorists as a Mono Lake vista point, and also used as an overflow parking area by Tioga Mart patrons.
The following is recommended for implementation by Caltrans and the project applicant:
Improve and maintain the area to continue to provide parking for patrons and visitors;
To reduce conflicts between vehicles traveling along Tioga Road (SR-120) and vehicles accessing the parking area, consider implementing a designated point of ingress and egress for this parking area.
Provide a parking arrangement that maintains adequate sight distance at the project site access on Tioga Road (SR-120); and
Relocate the existing YARTS bus stop in a manner to maintain adequate sight distance for the Project Site Access / Tioga Road (SR-120) intersection and also minimize conflicts between the busses and vehicles parking in this area or accessing the project site.
8.4 Transportation Demand Management (TDM) Recommendations
TDM is a program of information, encouragement and incentives provided by local or regional organizations to help people know about and use all their transportation options to optimize all modes in the system – and to counterbalance the incentives to drive that are so prevalent in subsidies of parking and roads. These are both traditional and innovative technology-based services to help people use transit, ridesharing, walking, biking, and telework.
8.5 Vehicle Miles Traveled (VMT) Analysis
The County of Mono and Caltrans do not currently have adopted and established threshold of significance for vehicles miles traveled (VMT) analysis and impact. An analysis of VMT has been included in this report for informational purposes.
Table 8-2 summarizes the project’s weekday, Saturday, Sunday and overall VMT based on data from the air quality model analysis. The table shows the VMT for both the proposed project as well as the cumulative projects (currently approved hotel and restaurant).
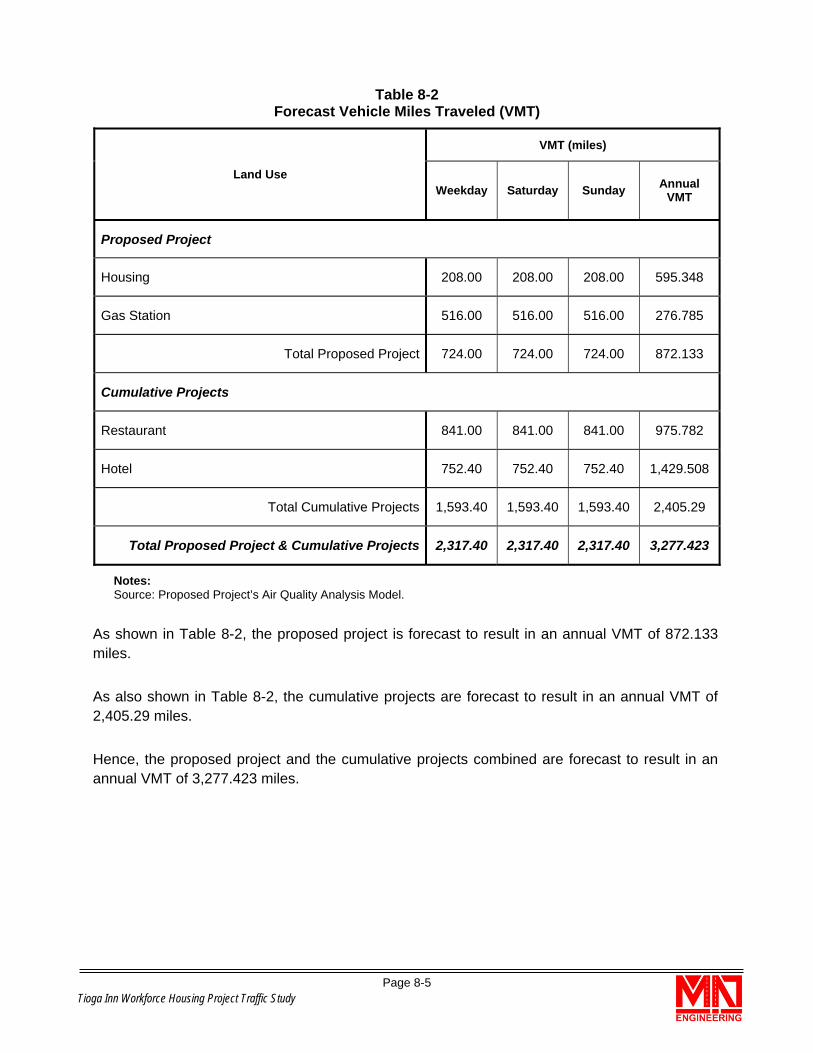
Tioga Inn Workforce Housing Project Traffic Study Page 8-5
Table 8-2 Forecast Vehicle Miles Traveled (VMT)
Land Use
VMT (miles)
Weekday Saturday Sunday Annual VMT
Proposed Project
Housing 208.00 208.00 208.00 595.348
Gas Station 516.00 516.00 516.00 276.785
Total Proposed Project 724.00 724.00 724.00 872.133
Cumulative Projects
Restaurant 841.00 841.00 841.00 975.782
Hotel 752.40 752.40 752.40 1,429.508
Total Cumulative Projects 1,593.40 1,593.40 1,593.40 2,405.29
Total Proposed Project & Cumulative Projects 2,317.40 2,317.40 2,317.40 3,277.423
Notes: Source: Proposed Project’s Air Quality Analysis Model.
As shown in Table 8-2, the proposed project is forecast to result in an annual VMT of 872.133 miles.
As also shown in Table 8-2, the cumulative projects are forecast to result in an annual VMT of 2,405.29 miles.
Hence, the proposed project and the cumulative projects combined are forecast to result in an annual VMT of 3,277.423 miles.

Tioga Inn Workforce Housing Project Traffic Study Page 9-1
9.0 Findings, Conclusions & Recommendations
Provided below is a summary of key findings, conclusions and recommendation of this traffic impact assessment:
9.1 Level of Service & Impact Analysis Summary
Existing Conditions
All study area intersections are currently operating at an acceptable level of service (LOS D or better) during the peak hours for Existing Conditions.
Existing Plus Project Conditions
All study area intersections are forecast to continue to operate at an acceptable level of service (LOS D or better) during the peak hours for Existing Plus Project Conditions.
Based on agency-established thresholds of significance, the proposed project is forecast to not result in a significant traffic impact at the study intersections for Existing Plus Project Conditions.
Forecast Opening Year (2023) Without Project Conditions
All study area intersections are forecast to continue to operate at an acceptable level of service (LOS D or better) during the peak hours for Forecast Opening year Without Project Conditions with the exception of the following study intersection which is forecast to operate at a deficient level of service (LOS E or worse) during one or more of the analysis peak hours:
• Highway 395 / Tioga Road (SR-120) (Mid-day peak hour).
Forecast Opening Year (2023) With Project Conditions
All study area intersections are forecast to continue to operate at an acceptable level of service (LOS D or better) during the peak hours for Forecast Opening year (2023) With Project Conditions with the exception of the following study intersection which is forecast to continue to operate at a deficient level of service (LOS E or worse) during one or more of the analysis peak hours:
• Highway 395 / Tioga Road (SR-120) (Mid-day peak hour).

Tioga Inn Workforce Housing Project Traffic Study Page 9-2
Based on agency-established thresholds of significance, the proposed project is forecast to result in a significant traffic impact at the following study intersection for Forecast Opening Year (2023) With Project Conditions:
• Highway 395 / Tioga Road (SR-120) (Mid-day peak hour).
It should be noted in accordance with the HCM methodology, for one-way or two-way stop-controlled intersections, LOS is based on the worst stop-controlled approach.
Hence, the identified deficient operation and excess delay at the Highway 395 / Tioga Road (SR-120) intersection is experienced only by vehicles on the minor street (stop controlled Tioga Road approach) of the intersection which are performing a left-turn maneuver onto northbound Highway 395. Vehicles traveling along the major roadway (Highway 395) have free flow movement with minimal delay and the overall average delay of the intersection is 10.6 seconds (equivalent to LOS B).
As previously shown in Section 5.0 of this report, the Highway 395 / Tioga Road (SR-120) unsignalized study intersection is forecast to satisfy the minimum traffic volumes criteria to satisfy the MUTCD traffic signal warrants for the following conditions:
• Forecast Opening Year (2023) Without Project Conditions (Mid-Day Peak Hour and PM Peak Hour); and
• Forecast Opening Year (2023) With Project Conditions (Mid-Day Peak Hour and PM Peak Hour).
The following two alternatives are identified to improve the operation of the intersection to an acceptable level (LOS D or better). The options are presented as alternatives for consideration by Caltrans for this intersection since both are forecast to achieve acceptable level of service:
• Highway 395 / Tioga Rd (SR-120) Improvement Alternative A: Signalize the intersection.
As shown in Table 6-4, installation of a traffic signal is forecast to achieve acceptable level of service (LOS D or better) at the study intersection for Forecast Opening Year (2023) With Project Conditions and the project’s identified significant impact would be reduced to a level considered less than significant.
Tioga Inn Workforce Housing Project Traffic Study Page 9-3
• Highway 395 / Tioga Rd (SR-120) Improvement Alternative B: Convert to a Single-Lane Roundabout.
As shown in Table 6-4, conversion of the intersection to a single-lane roundabout is forecast to achieve acceptable level of service (LOS D or better) at the study intersection for Forecast Opening Year (2023) With Project Conditions and the project’s identified significant impact would be reduced to a level considered less than significant.
If a two-lane roundabout is installed, it is expected to provide even further increased capacity compared to a single-lane roundabout.
When compared to the traffic signal alternative, the roundabout alternative would allow for continuous flow of traffic without vehicles having to stop at a red light. However, the roundabout alternative would require a well prepared design and potentially greater right-of-way to work effectively.
Since at this time Caltrans does not have any plans to signalize or modify the intersection, the two improvement alternatives which are required to achieve acceptable level of service could be considered infeasible. Hence, the project’s traffic impact on the Highway 395 / Tioga Road (SR-120) study intersection is considered significant and unavoidable.
9.2 Peak Hour Vehicular Queue Analysis Summary
The existing vehicular storage capacities are forecast to be adequate to accommodate the 95th percentile vehicular queues at the study intersections for Forecast Opening Year (2023) With Project Conditions.
For Forecast Opening Year (2023) With Project Conditions, approximately 227 vehicles are expected to turn left into the project site from Tioga Road (SR-120) during the mid-day peak hour. If needed in the future, this left-turn storage can be extended to provide additional storage capacity beyond the existing capacity by restriping within the existing right-of-way.
9.3 Evaluation of Other Elements Summary
Highway 395 / Tioga Road (SR-120) Collision History
Based on the SWITRS database, there are a total of 60 reported collisions at the Highway 395 / Tioga Road (SR-120) intersection from 2010 to present (2018).
Twenty of the 60 collisions are attributed to high travel speeds.

Tioga Inn Workforce Housing Project Traffic Study Page 9-4
A substantial number of the collisions are suspected to be a result of high rates of travel speed on Highway 395 near the Tioga Road intersection in addition to limited visibility and sight distance for vehicles approaching the Highway 395 / Tioga Road (SR-120) intersection.
Based on the review of the SWITRS data, there are not a substantial number of collisions reported at the Project Site Access / Tioga Road (SR-120) intersection.
However, based on field observations, drivers traveling eastbound on Tioga Road and approaching the project site access from the Yosemite Park area, appear to sometimes mistakenly shift into the existing right-turn lane into the project site access as they are looking to turn right and southbound onto Highway 395.
Caltrans is considering plans to integrate ‘Traffic Calming’ improvements on US 395 through Lee Vining, and enhanced safety upgrades at the intersection of Highway 395/ Tioga Road (SR-120) as well as along the apron on both sides of the entry to Tioga Mart, and pedestrian access along 395. Other relevant improvements may also be considered.
Based on the foregoing analysis, it is recommended as part of the improvement project for the State Highway system in this area, that Caltrans consider the following:
• Reduce travel speeds on Highway 395 by implementation of effective traffic calming measures such as narrowing of travel lanes, etc.,
• Provide additional advanced warning signs and/or flashing beacons for vehicles approaching the Highway 395 / Tioga Road (SR-120) intersection;
• Provide additional advanced warning signs and lane assignment information for vehicles approaching the Project Site Access / Tioga Road (SR-120) intersection;
• Consider alternative lane striping options to better and more clearly delineate the right-turn lane entering the project site access from Tioga Road; and
• Increase law enforcement presence.
Pedestrian & Bicycle Circulation System
To improve the pedestrian and bicycle circulation between the project site and Lee Vining, it is recommended a pedestrian link between the project site and Lee Vining be provided by Caltrans to increase walkability, reduce parking demand in town, and enhance the visitor experience.
Caltrans might want to consider a pedestrian connection across Tioga Road (SR-120), and work with applicable agencies to identify additional alternatives and options for improving pedestrian and bicycle connectivity and circulation.
Tioga Inn Workforce Housing Project Traffic Study Page 9-5
Caltrans Right-of-Way Acquisition
Another project element pertains to Caltrans’ sale of a 70-foot wide portion of the Tioga Road (SR-120) right-of-way easement to the project applicant. The easement extends for a distance of 1,170-feet adjacent to the Tioga site. A portion of this easement (west of the entry) has long been used informally by Tioga Mart customers as a picnic and play area. The ownership transfer will facilitate long-term use of the picnic area by customers, and provide greater flexibility in design of the land adjacent to and north of the hotel.
Caltrans will continue to own the remaining SR120 right of way, which includes an apron (east and west of the entry) that is used heavily by motorists as a Mono Lake vista point, and also used as an overflow parking area by Tioga Mart patrons.
The following is recommended for implementation by Caltrans and the project applicant:
Improve and maintain the area to continue to provide parking for patrons and visitors;
To reduce conflicts between vehicles traveling along Tioga Road (SR-120) and vehicles accessing the parking area, consider implementing a designated point of ingress and egress for this parking area.
Provide a parking arrangement that maintains adequate sight distance at the project site access on Tioga Road (SR-120); and
Relocate the existing YARTS bus stop in a manner to maintain adequate sight distance for the Project Site Access / Tioga Road (SR-120) intersection and also minimize conflicts between the busses and vehicles parking in this area or accessing the project
Transportation Demand Management (TDM)
TDM is a program of information, encouragement and incentives provided by local or regional organizations to help people know about and use all their transportation options to optimize all modes in the system – and to counterbalance the incentives to drive that are so prevalent in subsidies of parking and roads. These are both traditional and innovative technology-based services to help people use transit, ridesharing, walking, biking, and telework.
Vehicles Miles Traveled (VMT)
The County of Mono and Caltrans do not currently have adopted and established threshold of significance for vehicles miles traveled (VMT) analysis and impact. An analysis of VMT has been included in this report for informational purposes.
The proposed project is forecast to result in an annual VMT of 872.133 miles.

Tioga Inn Workforce Housing Project Traffic Study Page 9-6
The cumulative projects are forecast to result in an annual VMT of 2,405.29 miles.
Hence, the proposed project and the cumulative projects combined are forecast to result in an annual VMT of 3,277,423 miles.
APPENDIX A Existing Traffic Count Worksheets

Location:�Day:Time:
NBL NBT NBR SBL SBT SBR EBL EBT EBR WBL WBT WBR8:00���8:15 14 26 0 3 21 9 7 0 1 0 0 0 818:15�8:30 3 31 0 1 19 9 1 0 2 1 0 2 698:30�8:45 22 41 0 0 36 10 5 0 12 0 0 1 1278:45�9:00 24 40 1 0 26 12 6 0 10 0 0 1 120Hour�Total 63 138 1 4 102 40 19 0 25 1 0 4 3979:00�9:15 26 45 1 0 27 8 10 0 4 0 0 1 1229:15�9:30 20 69 1 1 50 20 4 0 8 0 0 1 1749:30�9:45 22 57 0 0 36 17 8 0 4 0 0 1 1459:45�10:00 24 64 0 0 43 21 9 0 11 0 0 0 172Hour�Total 92 235 2 1 156 66 31 0 27 0 0 3 613
Total 155 373 3 5 258 106 50 0 52 1 0 7 1010
NBL NBT NBR SBL SBT SBR EBL EBT EBR WBL WBT WBR8:00���9:00 63 138 1 4 102 40 19 0 25 1 0 4 3978:15���9:15 75 157 2 1 108 39 22 0 28 1 0 5 4388:30���9:30 92 195 3 1 139 50 25 0 34 0 0 4 5438:45���9:45 92 211 3 1 139 57 28 0 26 0 0 4 5619:00���10:00 92 235 2 1 156 66 31 0 27 0 0 3 613
NBL NBT NBR SBL SBT SBR EBL EBT EBR WBL WBT WBR9:00���10:00 92 235 2 1 156 66 31 0 27 0 0 3 613
0.88
Total
Time
15�Minute�Counts
Thursday�8/9/2018State�Highway�395�/�State�Route�120
8:00�AM�to�10:00�AM
60�Minute�Counts
Northbound�Highway�395 Southbound�Highway�395 Eastbound�SR�120 Westbound�Pumice�RoadTotal
TimeNorthbound�Highway�395 Southbound�Highway�395 Eastbound�SR�120 Westbound�Pumice�Road
Peak�Hour�Factor:
Peak�Hour
TimeNorthbound�Highway�395 Southbound�Highway�395 Eastbound�SR�120 ���
Total
Location:�Day:Time:
NBL NBT NBR SBL SBT SBR EBL EBT EBR WBL WBT WBR12:00���12:15 26 85 0 2 93 11 12 0 8 1 0 2 24012:15���12:30 29 55 0 0 61 12 15 0 6 1 0 1 18012:30���12:45 20 54 0 0 54 12 15 0 12 0 0 2 16912:45���1:00 12 55 0 3 65 16 16 0 15 0 0 1 183Hour�Total 87 249 0 5 273 51 58 0 41 2 0 6 7721:00���1:15 8 71 0 0 60 14 18 0 13 1 0 0 1851:15���1:30 11 58 0 0 62 21 23 0 21 0 0 1 1971:30���1:45 13 39 0 0 51 20 13 4 20 0 0 1 1611:45���2:00 17 66 0 0 73 8 20 0 9 0 0 0 193Hour�Total 49 234 0 0 246 63 74 4 63 1 0 2 736
Total 136 483 0 5 519 114 132 4 104 3 0 8 1508
NBL NBT NBR SBL SBT SBR EBL EBT EBR WBL WBT WBR12:00���1:00 87 249 0 5 273 51 58 0 41 2 0 6 77212:15���1:15 69 235 0 3 240 54 64 0 46 2 0 4 71712:30���1:30 51 238 0 3 241 63 72 0 61 1 0 4 73412:45���1:45 44 223 0 3 238 71 70 4 69 1 0 3 7261:00���2:00 49 234 0 0 246 63 74 4 63 1 0 2 736
NBL NBT NBR SBL SBT SBR EBL EBT EBR WBL WBT WBR12:00���1:00 87 249 0 5 273 51 58 0 41 2 0 6 772
0.8
State�Highway�395�/�State�Route�120Thursday�8/9/201812:00�PM�to�2:00�PM
15�Minute�Counts
TimeNorthbound�Highway�395 Southbound�Highway�395 Eastbound�SR�120 Westbound�Pumice�Road
Total
60�Minute�Counts
TimeNorthbound�Highway�395 Southbound�Highway�395 Eastbound�SR�120 Westbound�Pumice�Road
Total
Peak�Hour�Factor:
Peak�Hour
TimeNorthbound�Highway�395 Southbound�Highway�395 Eastbound�SR�120 ���
Total
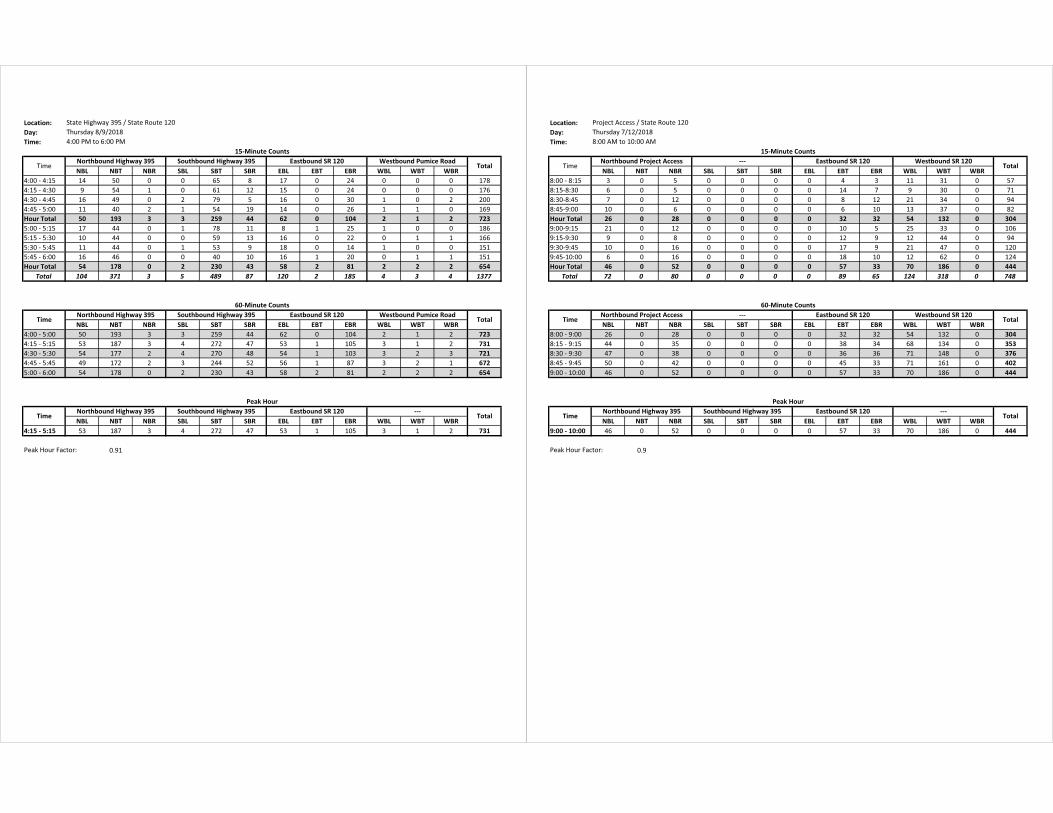
Location:�Day:Time:
NBL NBT NBR SBL SBT SBR EBL EBT EBR WBL WBT WBR4:00���4:15 14 50 0 0 65 8 17 0 24 0 0 0 1784:15���4:30 9 54 1 0 61 12 15 0 24 0 0 0 1764:30���4:45 16 49 0 2 79 5 16 0 30 1 0 2 2004:45���5:00 11 40 2 1 54 19 14 0 26 1 1 0 169Hour�Total 50 193 3 3 259 44 62 0 104 2 1 2 7235:00���5:15 17 44 0 1 78 11 8 1 25 1 0 0 1865:15���5:30 10 44 0 0 59 13 16 0 22 0 1 1 1665:30���5:45 11 44 0 1 53 9 18 0 14 1 0 0 1515:45���6:00 16 46 0 0 40 10 16 1 20 0 1 1 151Hour�Total 54 178 0 2 230 43 58 2 81 2 2 2 654
Total 104 371 3 5 489 87 120 2 185 4 3 4 1377
NBL NBT NBR SBL SBT SBR EBL EBT EBR WBL WBT WBR4:00���5:00 50 193 3 3 259 44 62 0 104 2 1 2 7234:15���5:15 53 187 3 4 272 47 53 1 105 3 1 2 7314:30���5:30 54 177 2 4 270 48 54 1 103 3 2 3 7214:45���5:45 49 172 2 3 244 52 56 1 87 3 2 1 6725:00���6:00 54 178 0 2 230 43 58 2 81 2 2 2 654
NBL NBT NBR SBL SBT SBR EBL EBT EBR WBL WBT WBR4:15���5:15 53 187 3 4 272 47 53 1 105 3 1 2 731
0.91
State�Highway�395�/�State�Route�120Thursday�8/9/20184:00�PM�to�6:00�PM
15�Minute�Counts
TimeNorthbound�Highway�395 Southbound�Highway�395 Eastbound�SR�120 Westbound�Pumice�Road
Total
60�Minute�Counts
TimeNorthbound�Highway�395 Southbound�Highway�395 Eastbound�SR�120 Westbound�Pumice�Road
Total
Peak�Hour�Factor:
Peak�Hour
TimeNorthbound�Highway�395 Southbound�Highway�395 Eastbound�SR�120 ���
Total
Location:�Day:Time:
NBL NBT NBR SBL SBT SBR EBL EBT EBR WBL WBT WBR8:00���8:15 3 0 5 0 0 0 0 4 3 11 31 0 578:15�8:30 6 0 5 0 0 0 0 14 7 9 30 0 718:30�8:45 7 0 12 0 0 0 0 8 12 21 34 0 948:45�9:00 10 0 6 0 0 0 0 6 10 13 37 0 82Hour�Total 26 0 28 0 0 0 0 32 32 54 132 0 3049:00�9:15 21 0 12 0 0 0 0 10 5 25 33 0 1069:15�9:30 9 0 8 0 0 0 0 12 9 12 44 0 949:30�9:45 10 0 16 0 0 0 0 17 9 21 47 0 1209:45�10:00 6 0 16 0 0 0 0 18 10 12 62 0 124Hour�Total 46 0 52 0 0 0 0 57 33 70 186 0 444
Total 72 0 80 0 0 0 0 89 65 124 318 0 748
NBL NBT NBR SBL SBT SBR EBL EBT EBR WBL WBT WBR8:00���9:00 26 0 28 0 0 0 0 32 32 54 132 0 3048:15���9:15 44 0 35 0 0 0 0 38 34 68 134 0 3538:30���9:30 47 0 38 0 0 0 0 36 36 71 148 0 3768:45���9:45 50 0 42 0 0 0 0 45 33 71 161 0 4029:00���10:00 46 0 52 0 0 0 0 57 33 70 186 0 444
NBL NBT NBR SBL SBT SBR EBL EBT EBR WBL WBT WBR9:00���10:00 46 0 52 0 0 0 0 57 33 70 186 0 444
0.9
Project�Access�/�State�Route�120Thursday�7/12/20188:00�AM�to�10:00�AM
15�Minute�Counts
TimeNorthbound�Project�Access ��� Eastbound�SR�120 Westbound�SR�120
Total
60�Minute�Counts
TimeNorthbound�Project�Access ��� Eastbound�SR�120 Westbound�SR�120
Total
Peak�Hour�Factor:
Peak�Hour
TimeNorthbound�Highway�395 Southbound�Highway�395 Eastbound�SR�120 ���
Total
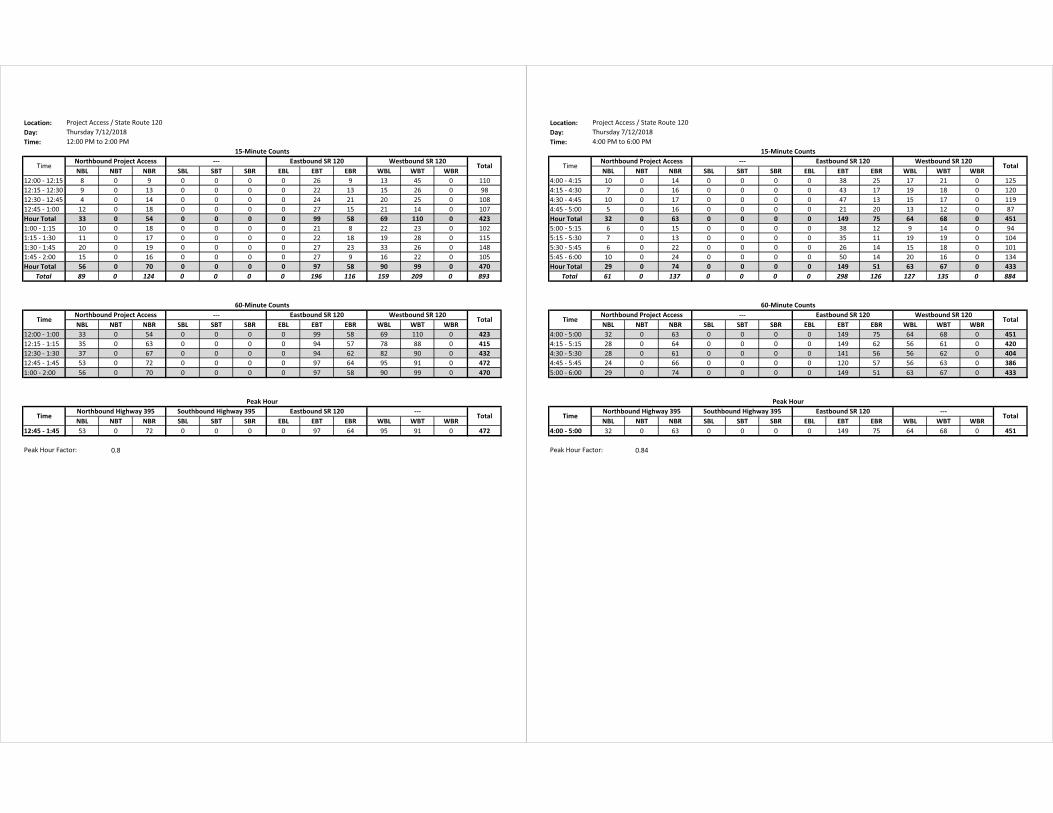
Location:�Day:Time:
NBL NBT NBR SBL SBT SBR EBL EBT EBR WBL WBT WBR12:00���12:15 8 0 9 0 0 0 0 26 9 13 45 0 11012:15���12:30 9 0 13 0 0 0 0 22 13 15 26 0 9812:30���12:45 4 0 14 0 0 0 0 24 21 20 25 0 10812:45���1:00 12 0 18 0 0 0 0 27 15 21 14 0 107Hour�Total 33 0 54 0 0 0 0 99 58 69 110 0 4231:00���1:15 10 0 18 0 0 0 0 21 8 22 23 0 1021:15���1:30 11 0 17 0 0 0 0 22 18 19 28 0 1151:30���1:45 20 0 19 0 0 0 0 27 23 33 26 0 1481:45���2:00 15 0 16 0 0 0 0 27 9 16 22 0 105Hour�Total 56 0 70 0 0 0 0 97 58 90 99 0 470
Total 89 0 124 0 0 0 0 196 116 159 209 0 893
NBL NBT NBR SBL SBT SBR EBL EBT EBR WBL WBT WBR12:00���1:00 33 0 54 0 0 0 0 99 58 69 110 0 42312:15���1:15 35 0 63 0 0 0 0 94 57 78 88 0 41512:30���1:30 37 0 67 0 0 0 0 94 62 82 90 0 43212:45���1:45 53 0 72 0 0 0 0 97 64 95 91 0 4721:00���2:00 56 0 70 0 0 0 0 97 58 90 99 0 470
NBL NBT NBR SBL SBT SBR EBL EBT EBR WBL WBT WBR12:45���1:45 53 0 72 0 0 0 0 97 64 95 91 0 472
0.8
Project�Access�/�State�Route�120Thursday�7/12/201812:00�PM�to�2:00�PM
15�Minute�Counts
TimeNorthbound�Project�Access ��� Eastbound�SR�120 Westbound�SR�120
Total
60�Minute�Counts
TimeNorthbound�Project�Access ��� Eastbound�SR�120 Westbound�SR�120
Total
Peak�Hour�Factor:
Peak�Hour
TimeNorthbound�Highway�395 Southbound�Highway�395 Eastbound�SR�120 ���
Total
Location:�Day:Time:
NBL NBT NBR SBL SBT SBR EBL EBT EBR WBL WBT WBR4:00���4:15 10 0 14 0 0 0 0 38 25 17 21 0 1254:15���4:30 7 0 16 0 0 0 0 43 17 19 18 0 1204:30���4:45 10 0 17 0 0 0 0 47 13 15 17 0 1194:45���5:00 5 0 16 0 0 0 0 21 20 13 12 0 87Hour�Total 32 0 63 0 0 0 0 149 75 64 68 0 4515:00���5:15 6 0 15 0 0 0 0 38 12 9 14 0 945:15���5:30 7 0 13 0 0 0 0 35 11 19 19 0 1045:30���5:45 6 0 22 0 0 0 0 26 14 15 18 0 1015:45���6:00 10 0 24 0 0 0 0 50 14 20 16 0 134Hour�Total 29 0 74 0 0 0 0 149 51 63 67 0 433
Total 61 0 137 0 0 0 0 298 126 127 135 0 884
NBL NBT NBR SBL SBT SBR EBL EBT EBR WBL WBT WBR4:00���5:00 32 0 63 0 0 0 0 149 75 64 68 0 4514:15���5:15 28 0 64 0 0 0 0 149 62 56 61 0 4204:30���5:30 28 0 61 0 0 0 0 141 56 56 62 0 4044:45���5:45 24 0 66 0 0 0 0 120 57 56 63 0 3865:00���6:00 29 0 74 0 0 0 0 149 51 63 67 0 433
NBL NBT NBR SBL SBT SBR EBL EBT EBR WBL WBT WBR4:00���5:00 32 0 63 0 0 0 0 149 75 64 68 0 451
0.84
Project�Access�/�State�Route�120Thursday�7/12/20184:00�PM�to�6:00�PM
15�Minute�Counts
TimeNorthbound�Project�Access ��� Eastbound�SR�120 Westbound�SR�120
Total
60�Minute�Counts
TimeNorthbound�Project�Access ��� Eastbound�SR�120 Westbound�SR�120
Total
Peak�Hour�Factor:
Peak�Hour
TimeNorthbound�Highway�395 Southbound�Highway�395 Eastbound�SR�120 ���
Total

APPENDIX B MUTCD Traffic Signal Analysis Worksheets

2014 Edition
WARRANT 3, PEAK HOUR (70% FACTOR)(Rural Areas)
(COMMUNITY LESS THAN 10,000 POPULATION OR ABOVE 70 km/h OR ABOVE 40 mph ON MAJOR STREET)
Traffic Conditions =
Major Street Name = Total of Both Approaches (VPH) = 552Number of Approach Lanes Major Street = 2
Minor Street Name = High Volume Approach (VPH) = 58Number of Approach Lanes Minor Street = 1
SIGNAL WARRANT NOT SATISFIED
* Note: 100 vph applies as the lower threshold volume for a minor-street approach with two or more lanes and 75 vph applies as the lower threshold volume for a minor-street approach with one lane.
Highway 395
Tioga Rd (SR-120)
Min
or S
tree
t - H
ighe
r-Vo
lum
e A
ppro
ach
- VPH
Existing Conditions - AM Peak Hour
552
58
0
100
200
300
400
500
300 400 500 600 700 800 900 1000 1100 1200 1300
Major Street - Total of Both Approaches - Vehicles Per Hour (VPH)
1 Lane (Major) & 1 Lane (Minor)
2+ Lanes (Major) & 1 Lane (Minor) OR 1 Lane (Major) & 2+ Lanes (Minor)
2+ Lanes (Major) & 2+ Lanes (Minor)
Major Street Approaches
Minor Street Approaches
*10*75
November 2014
01_395 at 120_EX_AM.XLS Sect. 4C.06
2014 Edition
WARRANT 3, PEAK HOUR (70% FACTOR)(Rural Areas)
(COMMUNITY LESS THAN 10,000 POPULATION OR ABOVE 70 km/h OR ABOVE 40 mph ON MAJOR STREET)
Traffic Conditions =
Major Street Name = Total of Both Approaches (VPH) = 665Number of Approach Lanes Major Street = 2
Minor Street Name = High Volume Approach (VPH) = 99Number of Approach Lanes Minor Street = 1
SIGNAL WARRANT NOT SATISFIED
* Note: 100 vph applies as the lower threshold volume for a minor-street approach with two or more lanes and 75 vph applies as the lower threshold volume for a minor-street approach with one lane.
Highway 395
Tioga Rd (SR-120)
Min
or S
tree
t - H
ighe
r-Vo
lum
e A
ppro
ach
- VPH
Existing Conditions - Mid-Day Peak Hour
665
99
0
100
200
300
400
500
300 400 500 600 700 800 900 1000 1100 1200 1300
Major Street - Total of Both Approaches - Vehicles Per Hour (VPH)
1 Lane (Major) & 1 Lane (Minor)
2+ Lanes (Major) & 1 Lane (Minor) OR 1 Lane (Major) & 2+ Lanes (Minor)
2+ Lanes (Major) & 2+ Lanes (Minor)
Major Street Approaches
Minor Street Approaches
*10*75
November 2014
01_395 at 120_EX_MD.XLS Sect. 4C.06
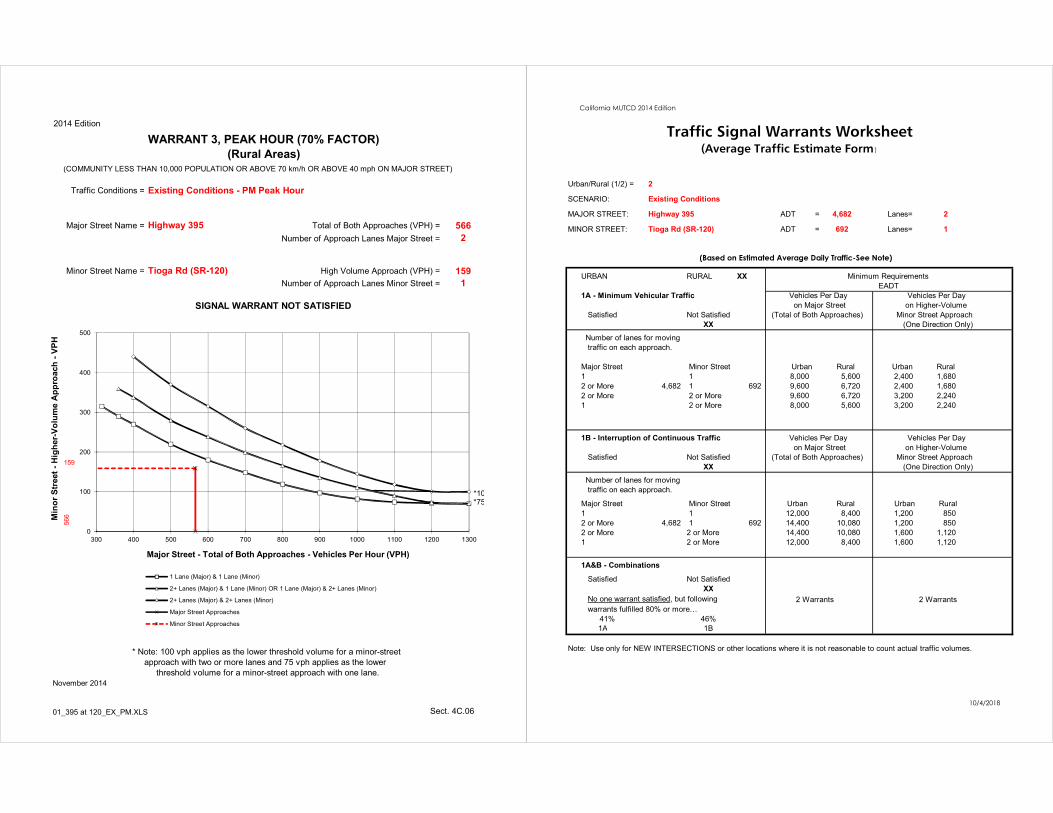
2014 Edition
WARRANT 3, PEAK HOUR (70% FACTOR)(Rural Areas)
(COMMUNITY LESS THAN 10,000 POPULATION OR ABOVE 70 km/h OR ABOVE 40 mph ON MAJOR STREET)
Traffic Conditions =
Major Street Name = Total of Both Approaches (VPH) = 566Number of Approach Lanes Major Street = 2
Minor Street Name = High Volume Approach (VPH) = 159Number of Approach Lanes Minor Street = 1
SIGNAL WARRANT NOT SATISFIED
* Note: 100 vph applies as the lower threshold volume for a minor-street approach with two or more lanes and 75 vph applies as the lower threshold volume for a minor-street approach with one lane.
Highway 395
Tioga Rd (SR-120)
Min
or S
tree
t - H
ighe
r-Vo
lum
e A
ppro
ach
- VPH
Existing Conditions - PM Peak Hour
566
159
0
100
200
300
400
500
300 400 500 600 700 800 900 1000 1100 1200 1300
Major Street - Total of Both Approaches - Vehicles Per Hour (VPH)
1 Lane (Major) & 1 Lane (Minor)
2+ Lanes (Major) & 1 Lane (Minor) OR 1 Lane (Major) & 2+ Lanes (Minor)
2+ Lanes (Major) & 2+ Lanes (Minor)
Major Street Approaches
Minor Street Approaches
*10*75
November 2014
01_395 at 120_EX_PM.XLS Sect. 4C.06
California MUTCD 2014 Edition
Traffic Signal Warrants Worksheet(Average Traffic Estimate Form)
ADT = 4,682 Lanes= 2
ADT = 692 Lanes= 1
(Based on Estimated Average Daily Traffic-See Note)
URBAN RURAL XX Minimum Requirements EADT
1A - Minimum Vehicular Traffic Vehicles Per Day Vehicles Per Day on Major Street on Higher-Volume
Satisfied Not Satisfied (Total of Both Approaches) Minor Street ApproachXX (One Direction Only)
Number of lanes for moving traffic on each approach.
Major Street Minor Street Urban Rural Urban Rural1 1 8,000 5,600 2,400 1,6802 or More 4,682 1 692 9,600 6,720 2,400 1,6802 or More 2 or More 9,600 6,720 3,200 2,2401 2 or More 8,000 5,600 3,200 2,240
1B - Interruption of Continuous Traffic Vehicles Per Day Vehicles Per Day on Major Street on Higher-Volume
Satisfied Not Satisfied (Total of Both Approaches) Minor Street ApproachXX (One Direction Only)
Number of lanes for moving traffic on each approach.
Major Street Minor Street Urban Rural Urban Rural1 1 12,000 8,400 1,200 8502 or More 4,682 1 692 14,400 10,080 1,200 8502 or More 2 or More 14,400 10,080 1,600 1,1201 2 or More 12,000 8,400 1,600 1,120
1A&B - Combinations
Satisfied Not SatisfiedXX
No one warrant satisfied, but following 2 Warrants 2 Warrants warrants fulfilled 80% or more…
41% 46% 1A 1B
Note: Use only for NEW INTERSECTIONS or other locations where it is not reasonable to count actual traffic volumes.
MAJOR STREET:
MINOR STREET:
SCENARIO: Existing Conditions
Highway 395
Tioga Rd (SR-120)
2Urban/Rural (1/2) =
10/4/2018
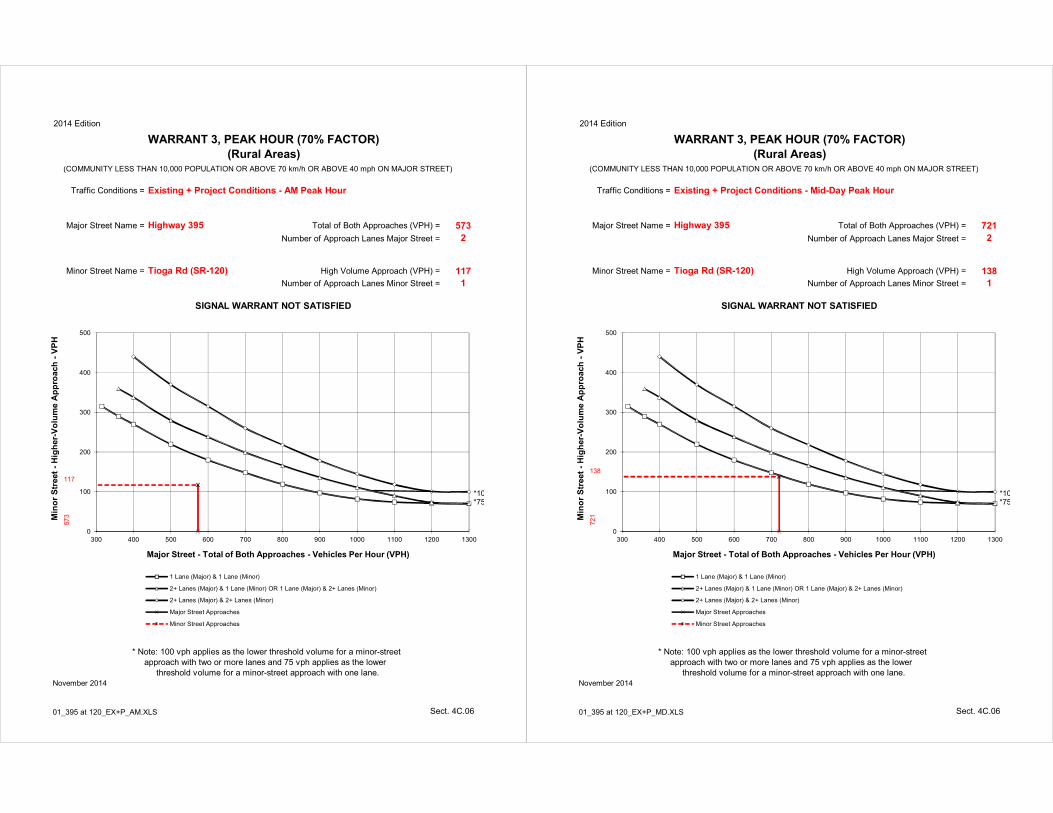
2014 Edition
WARRANT 3, PEAK HOUR (70% FACTOR)(Rural Areas)
(COMMUNITY LESS THAN 10,000 POPULATION OR ABOVE 70 km/h OR ABOVE 40 mph ON MAJOR STREET)
Traffic Conditions =
Major Street Name = Total of Both Approaches (VPH) = 573Number of Approach Lanes Major Street = 2
Minor Street Name = High Volume Approach (VPH) = 117Number of Approach Lanes Minor Street = 1
SIGNAL WARRANT NOT SATISFIED
* Note: 100 vph applies as the lower threshold volume for a minor-street approach with two or more lanes and 75 vph applies as the lower threshold volume for a minor-street approach with one lane.
Highway 395
Tioga Rd (SR-120)
Min
or S
tree
t - H
ighe
r-Vo
lum
e A
ppro
ach
- VPH
Existing + Project Conditions - AM Peak Hour
573
117
0
100
200
300
400
500
300 400 500 600 700 800 900 1000 1100 1200 1300
Major Street - Total of Both Approaches - Vehicles Per Hour (VPH)
1 Lane (Major) & 1 Lane (Minor)
2+ Lanes (Major) & 1 Lane (Minor) OR 1 Lane (Major) & 2+ Lanes (Minor)
2+ Lanes (Major) & 2+ Lanes (Minor)
Major Street Approaches
Minor Street Approaches
*10*75
November 2014
01_395 at 120_EX+P_AM.XLS Sect. 4C.06
2014 Edition
WARRANT 3, PEAK HOUR (70% FACTOR)(Rural Areas)
(COMMUNITY LESS THAN 10,000 POPULATION OR ABOVE 70 km/h OR ABOVE 40 mph ON MAJOR STREET)
Traffic Conditions =
Major Street Name = Total of Both Approaches (VPH) = 721Number of Approach Lanes Major Street = 2
Minor Street Name = High Volume Approach (VPH) = 138Number of Approach Lanes Minor Street = 1
SIGNAL WARRANT NOT SATISFIED
* Note: 100 vph applies as the lower threshold volume for a minor-street approach with two or more lanes and 75 vph applies as the lower threshold volume for a minor-street approach with one lane.
Highway 395
Tioga Rd (SR-120)
Min
or S
tree
t - H
ighe
r-Vo
lum
e A
ppro
ach
- VPH
Existing + Project Conditions - Mid-Day Peak Hour
721
138
0
100
200
300
400
500
300 400 500 600 700 800 900 1000 1100 1200 1300
Major Street - Total of Both Approaches - Vehicles Per Hour (VPH)
1 Lane (Major) & 1 Lane (Minor)
2+ Lanes (Major) & 1 Lane (Minor) OR 1 Lane (Major) & 2+ Lanes (Minor)
2+ Lanes (Major) & 2+ Lanes (Minor)
Major Street Approaches
Minor Street Approaches
*10*75
November 2014
01_395 at 120_EX+P_MD.XLS Sect. 4C.06

2014 Edition
WARRANT 3, PEAK HOUR (70% FACTOR)(Rural Areas)
(COMMUNITY LESS THAN 10,000 POPULATION OR ABOVE 70 km/h OR ABOVE 40 mph ON MAJOR STREET)
Traffic Conditions =
Major Street Name = Total of Both Approaches (VPH) = 622Number of Approach Lanes Major Street = 2
Minor Street Name = High Volume Approach (VPH) = 198Number of Approach Lanes Minor Street = 1
SIGNAL WARRANT NOT SATISFIED
* Note: 100 vph applies as the lower threshold volume for a minor-street approach with two or more lanes and 75 vph applies as the lower threshold volume for a minor-street approach with one lane.
Highway 395
Tioga Rd (SR-120)
Min
or S
tree
t - H
ighe
r-Vo
lum
e A
ppro
ach
- VPH
Existing + Project Conditions - PM Peak Hour
622
198
0
100
200
300
400
500
300 400 500 600 700 800 900 1000 1100 1200 1300
Major Street - Total of Both Approaches - Vehicles Per Hour (VPH)
1 Lane (Major) & 1 Lane (Minor)
2+ Lanes (Major) & 1 Lane (Minor) OR 1 Lane (Major) & 2+ Lanes (Minor)
2+ Lanes (Major) & 2+ Lanes (Minor)
Major Street Approaches
Minor Street Approaches
*10*75
November 2014
01_395 at 120_EX+P_PM.XLS Sect. 4C.06
California MUTCD 2014 Edition
Traffic Signal Warrants Worksheet(Average Traffic Estimate Form)
ADT = 4,989 Lanes= 2
ADT = 999 Lanes= 1
(Based on Estimated Average Daily Traffic-See Note)
URBAN RURAL XX Minimum Requirements EADT
1A - Minimum Vehicular Traffic Vehicles Per Day Vehicles Per Day on Major Street on Higher-Volume
Satisfied Not Satisfied (Total of Both Approaches) Minor Street ApproachXX (One Direction Only)
Number of lanes for moving traffic on each approach.
Major Street Minor Street Urban Rural Urban Rural1 1 8,000 5,600 2,400 1,6802 or More 4,989 1 999 9,600 6,720 2,400 1,6802 or More 2 or More 9,600 6,720 3,200 2,2401 2 or More 8,000 5,600 3,200 2,240
1B - Interruption of Continuous Traffic Vehicles Per Day Vehicles Per Day on Major Street on Higher-Volume
Satisfied Not Satisfied (Total of Both Approaches) Minor Street ApproachXX (One Direction Only)
Number of lanes for moving traffic on each approach.
Major Street Minor Street Urban Rural Urban Rural1 1 12,000 8,400 1,200 8502 or More 4,989 1 999 14,400 10,080 1,200 850 *2 or More 2 or More 14,400 10,080 1,600 1,1201 2 or More 12,000 8,400 1,600 1,120
1A&B - Combinations
Satisfied Not SatisfiedXX
No one warrant satisfied, but following 2 Warrants 2 Warrants warrants fulfilled 80% or more…
59% 49% 1A 1B
Note: Use only for NEW INTERSECTIONS or other locations where it is not reasonable to count actual traffic volumes.
MAJOR STREET:
MINOR STREET:
SCENARIO: Existing + Project Conditions
Highway 395
Tioga Rd (SR-120)
2Urban/Rural (1/2) =
10/4/2018
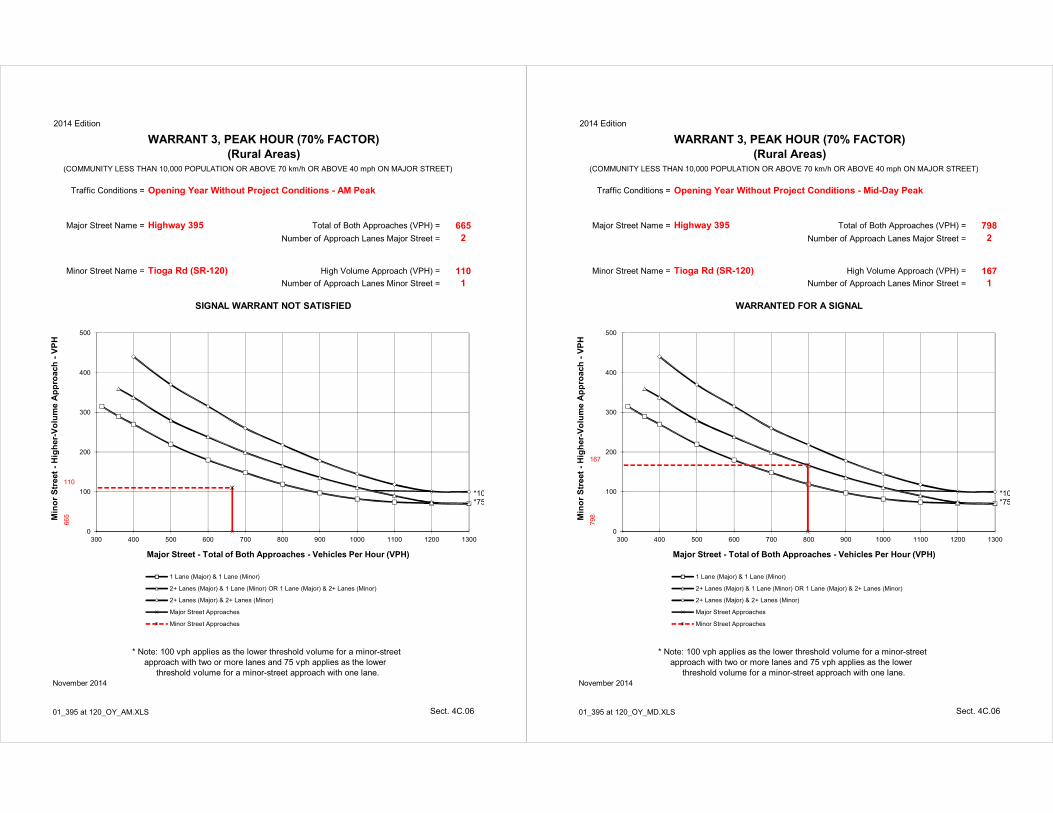
2014 Edition
WARRANT 3, PEAK HOUR (70% FACTOR)(Rural Areas)
(COMMUNITY LESS THAN 10,000 POPULATION OR ABOVE 70 km/h OR ABOVE 40 mph ON MAJOR STREET)
Traffic Conditions =
Major Street Name = Total of Both Approaches (VPH) = 665Number of Approach Lanes Major Street = 2
Minor Street Name = High Volume Approach (VPH) = 110Number of Approach Lanes Minor Street = 1
SIGNAL WARRANT NOT SATISFIED
* Note: 100 vph applies as the lower threshold volume for a minor-street approach with two or more lanes and 75 vph applies as the lower threshold volume for a minor-street approach with one lane.
Highway 395
Tioga Rd (SR-120)
Min
or S
tree
t - H
ighe
r-Vo
lum
e A
ppro
ach
- VPH
Opening Year Without Project Conditions - AM Peak
665
110
0
100
200
300
400
500
300 400 500 600 700 800 900 1000 1100 1200 1300
Major Street - Total of Both Approaches - Vehicles Per Hour (VPH)
1 Lane (Major) & 1 Lane (Minor)
2+ Lanes (Major) & 1 Lane (Minor) OR 1 Lane (Major) & 2+ Lanes (Minor)
2+ Lanes (Major) & 2+ Lanes (Minor)
Major Street Approaches
Minor Street Approaches
*10*75
November 2014
01_395 at 120_OY_AM.XLS Sect. 4C.06
2014 Edition
WARRANT 3, PEAK HOUR (70% FACTOR)(Rural Areas)
(COMMUNITY LESS THAN 10,000 POPULATION OR ABOVE 70 km/h OR ABOVE 40 mph ON MAJOR STREET)
Traffic Conditions =
Major Street Name = Total of Both Approaches (VPH) = 798Number of Approach Lanes Major Street = 2
Minor Street Name = High Volume Approach (VPH) = 167Number of Approach Lanes Minor Street = 1
WARRANTED FOR A SIGNAL
* Note: 100 vph applies as the lower threshold volume for a minor-street approach with two or more lanes and 75 vph applies as the lower threshold volume for a minor-street approach with one lane.
Highway 395
Tioga Rd (SR-120)
Min
or S
tree
t - H
ighe
r-Vo
lum
e A
ppro
ach
- VPH
Opening Year Without Project Conditions - Mid-Day Peak
798
167
0
100
200
300
400
500
300 400 500 600 700 800 900 1000 1100 1200 1300
Major Street - Total of Both Approaches - Vehicles Per Hour (VPH)
1 Lane (Major) & 1 Lane (Minor)
2+ Lanes (Major) & 1 Lane (Minor) OR 1 Lane (Major) & 2+ Lanes (Minor)
2+ Lanes (Major) & 2+ Lanes (Minor)
Major Street Approaches
Minor Street Approaches
*10*75
November 2014
01_395 at 120_OY_MD.XLS Sect. 4C.06
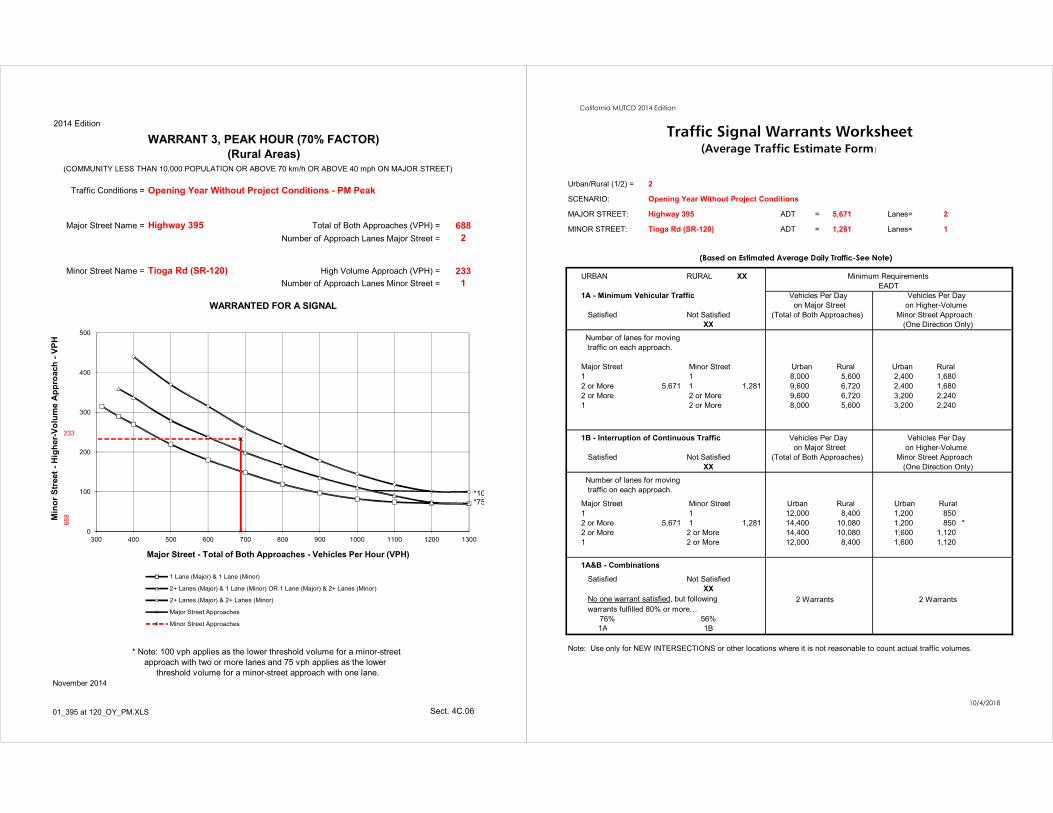
2014 Edition
WARRANT 3, PEAK HOUR (70% FACTOR)(Rural Areas)
(COMMUNITY LESS THAN 10,000 POPULATION OR ABOVE 70 km/h OR ABOVE 40 mph ON MAJOR STREET)
Traffic Conditions =
Major Street Name = Total of Both Approaches (VPH) = 688Number of Approach Lanes Major Street = 2
Minor Street Name = High Volume Approach (VPH) = 233Number of Approach Lanes Minor Street = 1
WARRANTED FOR A SIGNAL
* Note: 100 vph applies as the lower threshold volume for a minor-street approach with two or more lanes and 75 vph applies as the lower threshold volume for a minor-street approach with one lane.
Highway 395
Tioga Rd (SR-120)
Min
or S
tree
t - H
ighe
r-Vo
lum
e A
ppro
ach
- VPH
Opening Year Without Project Conditions - PM Peak
688
233
0
100
200
300
400
500
300 400 500 600 700 800 900 1000 1100 1200 1300
Major Street - Total of Both Approaches - Vehicles Per Hour (VPH)
1 Lane (Major) & 1 Lane (Minor)
2+ Lanes (Major) & 1 Lane (Minor) OR 1 Lane (Major) & 2+ Lanes (Minor)
2+ Lanes (Major) & 2+ Lanes (Minor)
Major Street Approaches
Minor Street Approaches
*10*75
November 2014
01_395 at 120_OY_PM.XLS Sect. 4C.06
California MUTCD 2014 Edition
Traffic Signal Warrants Worksheet(Average Traffic Estimate Form)
ADT = 5,671 Lanes= 2
ADT = 1,281 Lanes= 1
(Based on Estimated Average Daily Traffic-See Note)
URBAN RURAL XX Minimum Requirements EADT
1A - Minimum Vehicular Traffic Vehicles Per Day Vehicles Per Day on Major Street on Higher-Volume
Satisfied Not Satisfied (Total of Both Approaches) Minor Street ApproachXX (One Direction Only)
Number of lanes for moving traffic on each approach.
Major Street Minor Street Urban Rural Urban Rural1 1 8,000 5,600 2,400 1,6802 or More 5,671 1 1,281 9,600 6,720 2,400 1,6802 or More 2 or More 9,600 6,720 3,200 2,2401 2 or More 8,000 5,600 3,200 2,240
1B - Interruption of Continuous Traffic Vehicles Per Day Vehicles Per Day on Major Street on Higher-Volume
Satisfied Not Satisfied (Total of Both Approaches) Minor Street ApproachXX (One Direction Only)
Number of lanes for moving traffic on each approach.
Major Street Minor Street Urban Rural Urban Rural1 1 12,000 8,400 1,200 8502 or More 5,671 1 1,281 14,400 10,080 1,200 850 *2 or More 2 or More 14,400 10,080 1,600 1,1201 2 or More 12,000 8,400 1,600 1,120
1A&B - Combinations
Satisfied Not SatisfiedXX
No one warrant satisfied, but following 2 Warrants 2 Warrants warrants fulfilled 80% or more…
76% 56% 1A 1B
Note: Use only for NEW INTERSECTIONS or other locations where it is not reasonable to count actual traffic volumes.
Urban/Rural (1/2) =
MAJOR STREET:
MINOR STREET:
SCENARIO: Opening Year Without Project Conditions
Highway 395
Tioga Rd (SR-120)
2
10/4/2018
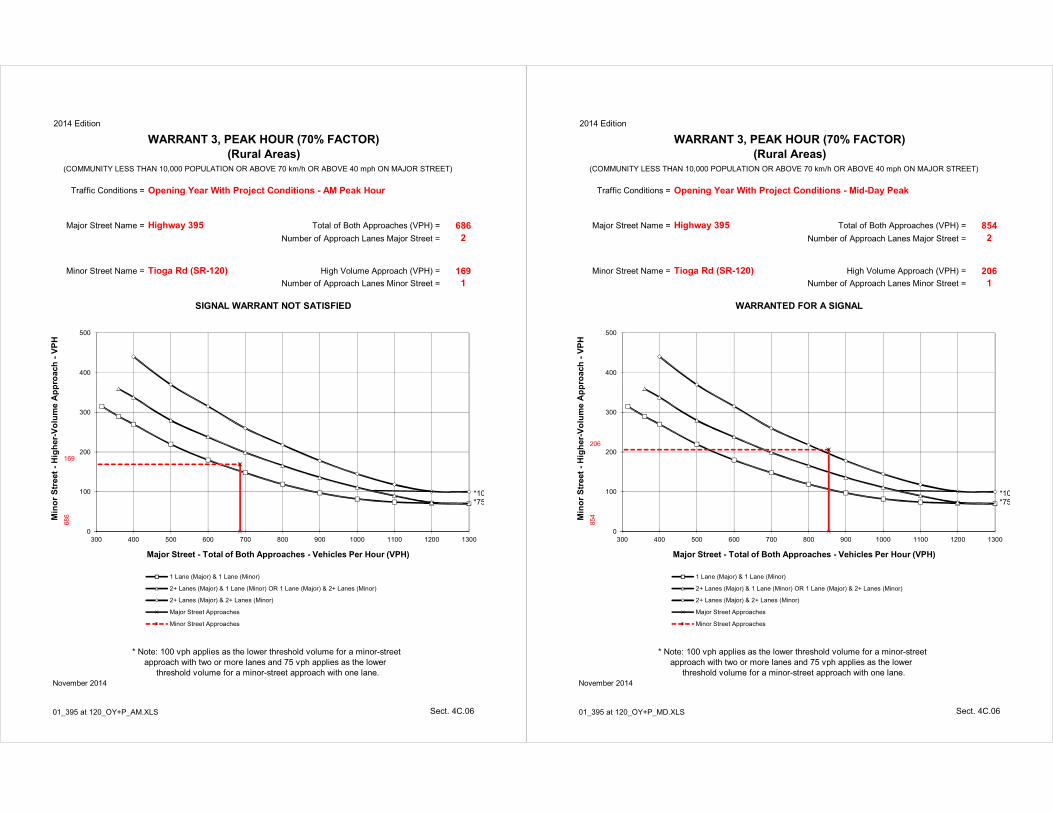
2014 Edition
WARRANT 3, PEAK HOUR (70% FACTOR)(Rural Areas)
(COMMUNITY LESS THAN 10,000 POPULATION OR ABOVE 70 km/h OR ABOVE 40 mph ON MAJOR STREET)
Traffic Conditions =
Major Street Name = Total of Both Approaches (VPH) = 686Number of Approach Lanes Major Street = 2
Minor Street Name = High Volume Approach (VPH) = 169Number of Approach Lanes Minor Street = 1
SIGNAL WARRANT NOT SATISFIED
* Note: 100 vph applies as the lower threshold volume for a minor-street approach with two or more lanes and 75 vph applies as the lower threshold volume for a minor-street approach with one lane.
Highway 395
Tioga Rd (SR-120)
Min
or S
tree
t - H
ighe
r-Vo
lum
e A
ppro
ach
- VPH
Opening Year With Project Conditions - AM Peak Hour
686
169
0
100
200
300
400
500
300 400 500 600 700 800 900 1000 1100 1200 1300
Major Street - Total of Both Approaches - Vehicles Per Hour (VPH)
1 Lane (Major) & 1 Lane (Minor)
2+ Lanes (Major) & 1 Lane (Minor) OR 1 Lane (Major) & 2+ Lanes (Minor)
2+ Lanes (Major) & 2+ Lanes (Minor)
Major Street Approaches
Minor Street Approaches
*10*75
November 2014
01_395 at 120_OY+P_AM.XLS Sect. 4C.06
2014 Edition
WARRANT 3, PEAK HOUR (70% FACTOR)(Rural Areas)
(COMMUNITY LESS THAN 10,000 POPULATION OR ABOVE 70 km/h OR ABOVE 40 mph ON MAJOR STREET)
Traffic Conditions =
Major Street Name = Total of Both Approaches (VPH) = 854Number of Approach Lanes Major Street = 2
Minor Street Name = High Volume Approach (VPH) = 206Number of Approach Lanes Minor Street = 1
WARRANTED FOR A SIGNAL
* Note: 100 vph applies as the lower threshold volume for a minor-street approach with two or more lanes and 75 vph applies as the lower threshold volume for a minor-street approach with one lane.
Highway 395
Tioga Rd (SR-120)
Min
or S
tree
t - H
ighe
r-Vo
lum
e A
ppro
ach
- VPH
Opening Year With Project Conditions - Mid-Day Peak
854
206
0
100
200
300
400
500
300 400 500 600 700 800 900 1000 1100 1200 1300
Major Street - Total of Both Approaches - Vehicles Per Hour (VPH)
1 Lane (Major) & 1 Lane (Minor)
2+ Lanes (Major) & 1 Lane (Minor) OR 1 Lane (Major) & 2+ Lanes (Minor)
2+ Lanes (Major) & 2+ Lanes (Minor)
Major Street Approaches
Minor Street Approaches
*10*75
November 2014
01_395 at 120_OY+P_MD.XLS Sect. 4C.06
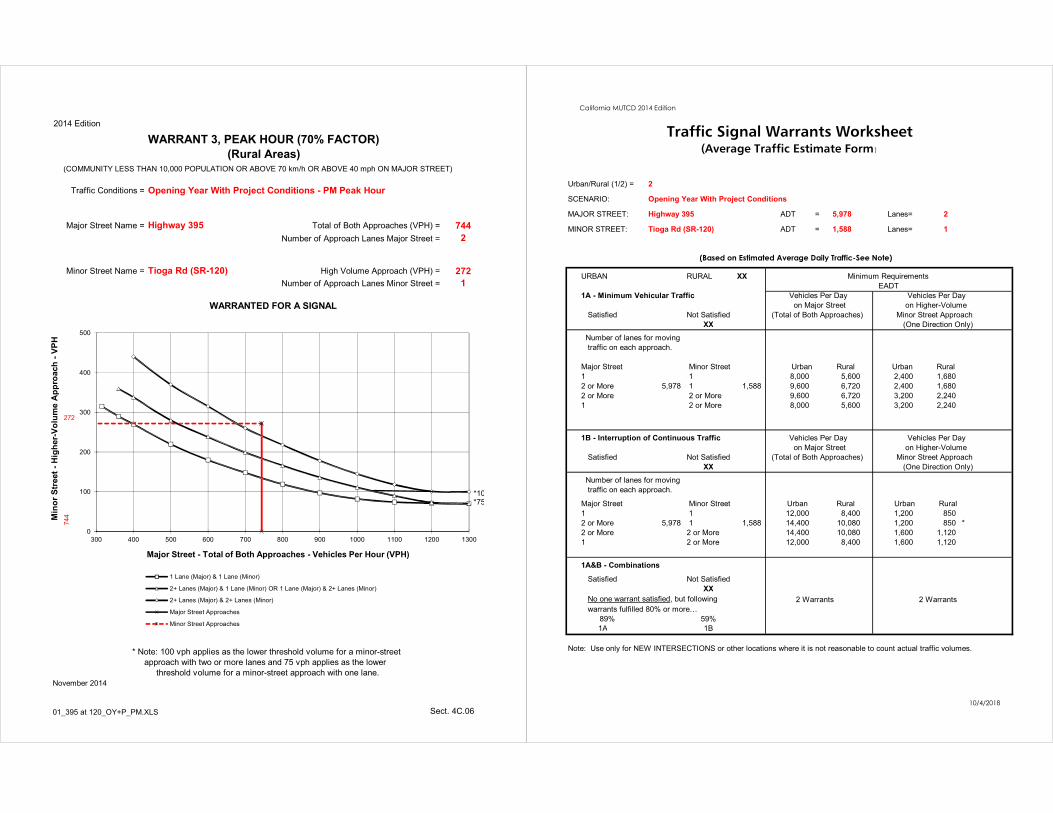
2014 Edition
WARRANT 3, PEAK HOUR (70% FACTOR)(Rural Areas)
(COMMUNITY LESS THAN 10,000 POPULATION OR ABOVE 70 km/h OR ABOVE 40 mph ON MAJOR STREET)
Traffic Conditions =
Major Street Name = Total of Both Approaches (VPH) = 744Number of Approach Lanes Major Street = 2
Minor Street Name = High Volume Approach (VPH) = 272Number of Approach Lanes Minor Street = 1
WARRANTED FOR A SIGNAL
* Note: 100 vph applies as the lower threshold volume for a minor-street approach with two or more lanes and 75 vph applies as the lower threshold volume for a minor-street approach with one lane.
Highway 395
Tioga Rd (SR-120)
Min
or S
tree
t - H
ighe
r-Vo
lum
e A
ppro
ach
- VPH
Opening Year With Project Conditions - PM Peak Hour
744
272
0
100
200
300
400
500
300 400 500 600 700 800 900 1000 1100 1200 1300
Major Street - Total of Both Approaches - Vehicles Per Hour (VPH)
1 Lane (Major) & 1 Lane (Minor)
2+ Lanes (Major) & 1 Lane (Minor) OR 1 Lane (Major) & 2+ Lanes (Minor)
2+ Lanes (Major) & 2+ Lanes (Minor)
Major Street Approaches
Minor Street Approaches
*10*75
November 2014
01_395 at 120_OY+P_PM.XLS Sect. 4C.06
California MUTCD 2014 Edition
Traffic Signal Warrants Worksheet(Average Traffic Estimate Form)
ADT = 5,978 Lanes= 2
ADT = 1,588 Lanes= 1
(Based on Estimated Average Daily Traffic-See Note)
URBAN RURAL XX Minimum Requirements EADT
1A - Minimum Vehicular Traffic Vehicles Per Day Vehicles Per Day on Major Street on Higher-Volume
Satisfied Not Satisfied (Total of Both Approaches) Minor Street ApproachXX (One Direction Only)
Number of lanes for moving traffic on each approach.
Major Street Minor Street Urban Rural Urban Rural1 1 8,000 5,600 2,400 1,6802 or More 5,978 1 1,588 9,600 6,720 2,400 1,6802 or More 2 or More 9,600 6,720 3,200 2,2401 2 or More 8,000 5,600 3,200 2,240
1B - Interruption of Continuous Traffic Vehicles Per Day Vehicles Per Day on Major Street on Higher-Volume
Satisfied Not Satisfied (Total of Both Approaches) Minor Street ApproachXX (One Direction Only)
Number of lanes for moving traffic on each approach.
Major Street Minor Street Urban Rural Urban Rural1 1 12,000 8,400 1,200 8502 or More 5,978 1 1,588 14,400 10,080 1,200 850 *2 or More 2 or More 14,400 10,080 1,600 1,1201 2 or More 12,000 8,400 1,600 1,120
1A&B - Combinations
Satisfied Not SatisfiedXX
No one warrant satisfied, but following 2 Warrants 2 Warrants warrants fulfilled 80% or more…
89% 59% 1A 1B
Note: Use only for NEW INTERSECTIONS or other locations where it is not reasonable to count actual traffic volumes.
2Urban/Rural (1/2) =
MAJOR STREET:
MINOR STREET:
SCENARIO: Opening Year With Project Conditions
Highway 395
Tioga Rd (SR-120)
10/4/2018

APPENDIX C Existing Conditions LOS Analysis Worksheets

Lanes and Geometrics TIOGA INN TIA1: TIOGA RD (SR-120)/PUMICE RD & HIGHWAY 395 09/27/2018
EXISTING CONDITIONS (2018) Synchro 10 ReportAM PEAK HOUR
Lane Group EBL EBT EBR WBL WBT WBR NBL NBT NBR SBL SBT SBRLane ConfigurationsIdeal Flow (vphpl) 1900 1900 1900 1900 1900 1900 1900 1900 1900 1900 1900 1900Lane Width (ft) 12 12 12 12 12 12 12 12 12 12 12 12Grade (%) 0% 0% 0% 0%Storage Length (ft) 400 400 270 0 0 50 0 0Storage Lanes 1 1 1 0 0 1 0 0Taper Length (ft) 25 25 25 25Lane Util. Factor 1.00 0.95 1.00 1.00 0.95 0.95 1.00 1.00 1.00 1.00 1.00 1.00Ped Bike FactorFrt 0.850 0.999 0.850 0.865Flt Protected 0.950 0.950 0.950Satd. Flow (prot) 1583 3034 1417 1583 3032 0 0 1583 1417 0 1442 0Flt Permitted 0.950 0.950 0.950Satd. Flow (perm) 1583 3034 1417 1583 3032 0 0 1583 1417 0 1442 0Link Speed (mph) 30 30 30 30Link Distance (ft) 1553 1621 921 296Travel Time (s) 35.3 36.8 20.9 6.7
Intersection SummaryArea Type: Other
Volume TIOGA INN TIA1: TIOGA RD (SR-120)/PUMICE RD & HIGHWAY 395 09/27/2018
EXISTING CONDITIONS (2018) Synchro 10 ReportAM PEAK HOUR
Lane Group EBL EBT EBR WBL WBT WBR NBL NBT NBR SBL SBT SBRTraffic Volume (vph) 1 156 66 92 235 2 31 0 27 0 0 3Future Volume (vph) 1 156 66 92 235 2 31 0 27 0 0 3Confl. Peds. (#/hr)Confl. Bikes (#/hr)Peak Hour Factor 0.88 0.88 0.88 0.88 0.88 0.88 0.88 0.88 0.88 0.88 0.88 0.88Growth Factor 100% 100% 100% 100% 100% 100% 100% 100% 100% 100% 100% 100%Heavy Vehicles (%) 14% 19% 14% 14% 19% 14% 14% 14% 14% 14% 14% 14%Bus Blockages (#/hr) 0 0 0 0 0 0 0 0 0 0 0 0Parking (#/hr)Mid-Block Traffic (%) 0% 0% 0% 0%Adj. Flow (vph) 1 177 75 105 267 2 35 0 31 0 0 3Shared Lane Traffic (%)Lane Group Flow (vph) 1 177 75 105 269 0 0 35 31 0 3 0
Intersection Summary
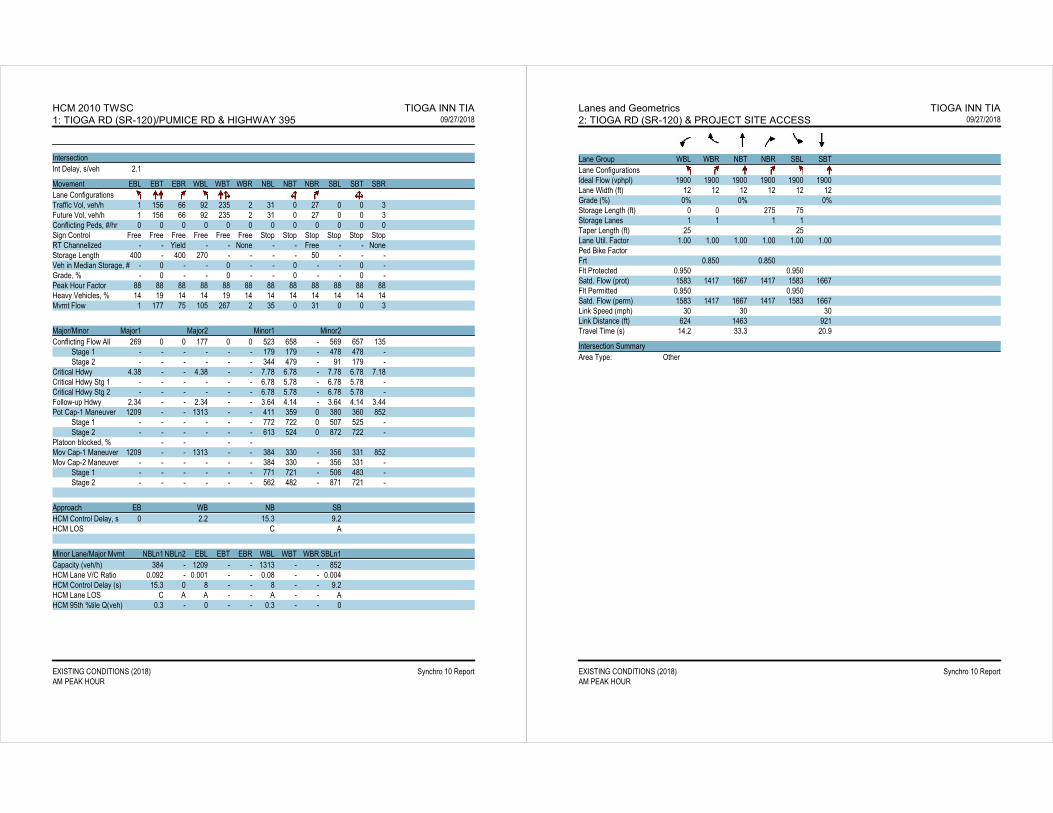
HCM 2010 TWSC TIOGA INN TIA1: TIOGA RD (SR-120)/PUMICE RD & HIGHWAY 395 09/27/2018
EXISTING CONDITIONS (2018) Synchro 10 ReportAM PEAK HOUR
IntersectionInt Delay, s/veh 2.1
Movement EBL EBT EBR WBL WBT WBR NBL NBT NBR SBL SBT SBRLane ConfigurationsTraffic Vol, veh/h 1 156 66 92 235 2 31 0 27 0 0 3Future Vol, veh/h 1 156 66 92 235 2 31 0 27 0 0 3Conflicting Peds, #/hr 0 0 0 0 0 0 0 0 0 0 0 0Sign Control Free Free Free Free Free Free Stop Stop Stop Stop Stop StopRT Channelized - - Yield - - None - - Free - - NoneStorage Length 400 - 400 270 - - - - 50 - - -Veh in Median Storage, # - 0 - - 0 - - 0 - - 0 -Grade, % - 0 - - 0 - - 0 - - 0 -Peak Hour Factor 88 88 88 88 88 88 88 88 88 88 88 88Heavy Vehicles, % 14 19 14 14 19 14 14 14 14 14 14 14Mvmt Flow 1 177 75 105 267 2 35 0 31 0 0 3
Major/Minor Major1 Major2 Minor1 Minor2Conflicting Flow All 269 0 0 177 0 0 523 658 - 569 657 135 Stage 1 - - - - - - 179 179 - 478 478 - Stage 2 - - - - - - 344 479 - 91 179 -Critical Hdwy 4.38 - - 4.38 - - 7.78 6.78 - 7.78 6.78 7.18Critical Hdwy Stg 1 - - - - - - 6.78 5.78 - 6.78 5.78 -Critical Hdwy Stg 2 - - - - - - 6.78 5.78 - 6.78 5.78 -Follow-up Hdwy 2.34 - - 2.34 - - 3.64 4.14 - 3.64 4.14 3.44Pot Cap-1 Maneuver 1209 - - 1313 - - 411 359 0 380 360 852 Stage 1 - - - - - - 772 722 0 507 525 - Stage 2 - - - - - - 613 524 0 872 722 -Platoon blocked, % - - - -Mov Cap-1 Maneuver 1209 - - 1313 - - 384 330 - 356 331 852Mov Cap-2 Maneuver - - - - - - 384 330 - 356 331 - Stage 1 - - - - - - 771 721 - 506 483 - Stage 2 - - - - - - 562 482 - 871 721 -
Approach EB WB NB SBHCM Control Delay, s 0 2.2 15.3 9.2HCM LOS C A
Minor Lane/Major Mvmt NBLn1 NBLn2 EBL EBT EBR WBL WBT WBR SBLn1Capacity (veh/h) 384 - 1209 - - 1313 - - 852HCM Lane V/C Ratio 0.092 - 0.001 - - 0.08 - - 0.004HCM Control Delay (s) 15.3 0 8 - - 8 - - 9.2HCM Lane LOS C A A - - A - - AHCM 95th %tile Q(veh) 0.3 - 0 - - 0.3 - - 0
Lanes and Geometrics TIOGA INN TIA2: TIOGA RD (SR-120) & PROJECT SITE ACCESS 09/27/2018
EXISTING CONDITIONS (2018) Synchro 10 ReportAM PEAK HOUR
Lane Group WBL WBR NBT NBR SBL SBTLane ConfigurationsIdeal Flow (vphpl) 1900 1900 1900 1900 1900 1900Lane Width (ft) 12 12 12 12 12 12Grade (%) 0% 0% 0%Storage Length (ft) 0 0 275 75Storage Lanes 1 1 1 1Taper Length (ft) 25 25Lane Util. Factor 1.00 1.00 1.00 1.00 1.00 1.00Ped Bike FactorFrt 0.850 0.850Flt Protected 0.950 0.950Satd. Flow (prot) 1583 1417 1667 1417 1583 1667Flt Permitted 0.950 0.950Satd. Flow (perm) 1583 1417 1667 1417 1583 1667Link Speed (mph) 30 30 30Link Distance (ft) 624 1463 921Travel Time (s) 14.2 33.3 20.9
Intersection SummaryArea Type: Other
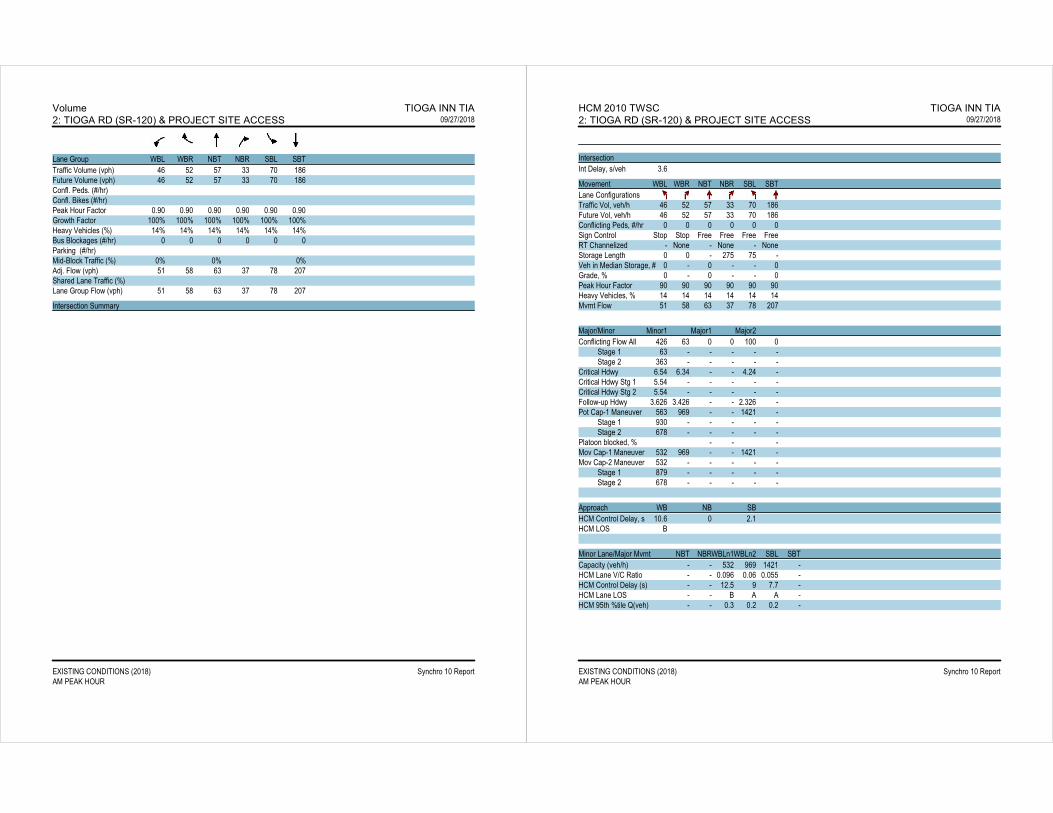
Volume TIOGA INN TIA2: TIOGA RD (SR-120) & PROJECT SITE ACCESS 09/27/2018
EXISTING CONDITIONS (2018) Synchro 10 ReportAM PEAK HOUR
Lane Group WBL WBR NBT NBR SBL SBTTraffic Volume (vph) 46 52 57 33 70 186Future Volume (vph) 46 52 57 33 70 186Confl. Peds. (#/hr)Confl. Bikes (#/hr)Peak Hour Factor 0.90 0.90 0.90 0.90 0.90 0.90Growth Factor 100% 100% 100% 100% 100% 100%Heavy Vehicles (%) 14% 14% 14% 14% 14% 14%Bus Blockages (#/hr) 0 0 0 0 0 0Parking (#/hr)Mid-Block Traffic (%) 0% 0% 0%Adj. Flow (vph) 51 58 63 37 78 207Shared Lane Traffic (%)Lane Group Flow (vph) 51 58 63 37 78 207
Intersection Summary
HCM 2010 TWSC TIOGA INN TIA2: TIOGA RD (SR-120) & PROJECT SITE ACCESS 09/27/2018
EXISTING CONDITIONS (2018) Synchro 10 ReportAM PEAK HOUR
IntersectionInt Delay, s/veh 3.6
Movement WBL WBR NBT NBR SBL SBTLane ConfigurationsTraffic Vol, veh/h 46 52 57 33 70 186Future Vol, veh/h 46 52 57 33 70 186Conflicting Peds, #/hr 0 0 0 0 0 0Sign Control Stop Stop Free Free Free FreeRT Channelized - None - None - NoneStorage Length 0 0 - 275 75 -Veh in Median Storage, # 0 - 0 - - 0Grade, % 0 - 0 - - 0Peak Hour Factor 90 90 90 90 90 90Heavy Vehicles, % 14 14 14 14 14 14Mvmt Flow 51 58 63 37 78 207
Major/Minor Minor1 Major1 Major2Conflicting Flow All 426 63 0 0 100 0 Stage 1 63 - - - - - Stage 2 363 - - - - -Critical Hdwy 6.54 6.34 - - 4.24 -Critical Hdwy Stg 1 5.54 - - - - -Critical Hdwy Stg 2 5.54 - - - - -Follow-up Hdwy 3.626 3.426 - - 2.326 -Pot Cap-1 Maneuver 563 969 - - 1421 - Stage 1 930 - - - - - Stage 2 678 - - - - -Platoon blocked, % - - -Mov Cap-1 Maneuver 532 969 - - 1421 -Mov Cap-2 Maneuver 532 - - - - - Stage 1 879 - - - - - Stage 2 678 - - - - -
Approach WB NB SBHCM Control Delay, s 10.6 0 2.1HCM LOS B
Minor Lane/Major Mvmt NBT NBRWBLn1WBLn2 SBL SBTCapacity (veh/h) - - 532 969 1421 -HCM Lane V/C Ratio - - 0.096 0.06 0.055 -HCM Control Delay (s) - - 12.5 9 7.7 -HCM Lane LOS - - B A A -HCM 95th %tile Q(veh) - - 0.3 0.2 0.2 -

Lanes and Geometrics TIOGA INN TIA1: TIOGA RD (SR-120)/PUMICE RD & HIGHWAY 395 09/27/2018
EXISTING CONDITIONS (2018) Synchro 10 ReportMID-DAY PEAK HOUR
Lane Group EBL EBT EBR WBL WBT WBR NBL NBT NBR SBL SBT SBRLane ConfigurationsIdeal Flow (vphpl) 1900 1900 1900 1900 1900 1900 1900 1900 1900 1900 1900 1900Lane Width (ft) 12 12 12 12 12 12 12 12 12 12 12 12Grade (%) 0% 0% 0% 0%Storage Length (ft) 400 400 270 0 0 50 0 0Storage Lanes 1 1 1 0 0 1 0 0Taper Length (ft) 25 25 25 25Lane Util. Factor 1.00 0.95 1.00 1.00 0.95 0.95 1.00 1.00 1.00 1.00 1.00 1.00Ped Bike FactorFrt 0.850 0.850 0.902Flt Protected 0.950 0.950 0.950 0.987Satd. Flow (prot) 1583 3034 1417 1583 3034 0 0 1583 1417 0 1484 0Flt Permitted 0.950 0.950 0.950 0.987Satd. Flow (perm) 1583 3034 1417 1583 3034 0 0 1583 1417 0 1484 0Link Speed (mph) 30 30 30 30Link Distance (ft) 1553 1621 921 296Travel Time (s) 35.3 36.8 20.9 6.7
Intersection SummaryArea Type: Other
Volume TIOGA INN TIA1: TIOGA RD (SR-120)/PUMICE RD & HIGHWAY 395 09/27/2018
EXISTING CONDITIONS (2018) Synchro 10 ReportMID-DAY PEAK HOUR
Lane Group EBL EBT EBR WBL WBT WBR NBL NBT NBR SBL SBT SBRTraffic Volume (vph) 5 273 51 87 249 0 58 0 41 2 0 6Future Volume (vph) 5 273 51 87 249 0 58 0 41 2 0 6Confl. Peds. (#/hr)Confl. Bikes (#/hr)Peak Hour Factor 0.80 0.80 0.80 0.80 0.80 0.80 0.80 0.80 0.80 0.80 0.80 0.80Growth Factor 100% 100% 100% 100% 100% 100% 100% 100% 100% 100% 100% 100%Heavy Vehicles (%) 14% 19% 14% 14% 19% 14% 14% 14% 14% 14% 14% 14%Bus Blockages (#/hr) 0 0 0 0 0 0 0 0 0 0 0 0Parking (#/hr)Mid-Block Traffic (%) 0% 0% 0% 0%Adj. Flow (vph) 6 341 64 109 311 0 73 0 51 3 0 8Shared Lane Traffic (%)Lane Group Flow (vph) 6 341 64 109 311 0 0 73 51 0 11 0
Intersection Summary

HCM 2010 TWSC TIOGA INN TIA1: TIOGA RD (SR-120)/PUMICE RD & HIGHWAY 395 09/27/2018
EXISTING CONDITIONS (2018) Synchro 10 ReportMID-DAY PEAK HOUR
IntersectionInt Delay, s/veh 3.1
Movement EBL EBT EBR WBL WBT WBR NBL NBT NBR SBL SBT SBRLane ConfigurationsTraffic Vol, veh/h 5 273 51 87 249 0 58 0 41 2 0 6Future Vol, veh/h 5 273 51 87 249 0 58 0 41 2 0 6Conflicting Peds, #/hr 0 0 0 0 0 0 0 0 0 0 0 0Sign Control Free Free Free Free Free Free Stop Stop Stop Stop Stop StopRT Channelized - - Yield - - None - - Free - - NoneStorage Length 400 - 400 270 - - - - 50 - - -Veh in Median Storage, # - 0 - - 0 - - 0 - - 0 -Grade, % - 0 - - 0 - - 0 - - 0 -Peak Hour Factor 80 80 80 80 80 80 80 80 80 80 80 80Heavy Vehicles, % 14 19 14 14 19 14 14 14 14 14 14 14Mvmt Flow 6 341 64 109 311 0 73 0 51 3 0 8
Major/Minor Major1 Major2 Minor1 Minor2Conflicting Flow All 311 0 0 341 0 0 727 882 - 712 882 156 Stage 1 - - - - - - 353 353 - 529 529 - Stage 2 - - - - - - 374 529 - 183 353 -Critical Hdwy 4.38 - - 4.38 - - 7.78 6.78 - 7.78 6.78 7.18Critical Hdwy Stg 1 - - - - - - 6.78 5.78 - 6.78 5.78 -Critical Hdwy Stg 2 - - - - - - 6.78 5.78 - 6.78 5.78 -Follow-up Hdwy 2.34 - - 2.34 - - 3.64 4.14 - 3.64 4.14 3.44Pot Cap-1 Maneuver 1164 - - 1133 - - 290 263 0 298 263 825 Stage 1 - - - - - - 605 600 0 472 496 - Stage 2 - - - - - - 587 496 0 768 600 -Platoon blocked, % - - - -Mov Cap-1 Maneuver 1164 - - 1133 - - 265 236 - 275 236 825Mov Cap-2 Maneuver - - - - - - 265 236 - 275 236 - Stage 1 - - - - - - 602 597 - 470 448 - Stage 2 - - - - - - 526 448 - 764 597 -
Approach EB WB NB SBHCM Control Delay, s 0.1 2.2 23.6 11.7HCM LOS C B
Minor Lane/Major Mvmt NBLn1 NBLn2 EBL EBT EBR WBL WBT WBR SBLn1Capacity (veh/h) 265 - 1164 - - 1133 - - 550HCM Lane V/C Ratio 0.274 - 0.005 - - 0.096 - - 0.018HCM Control Delay (s) 23.6 0 8.1 - - 8.5 - - 11.7HCM Lane LOS C A A - - A - - BHCM 95th %tile Q(veh) 1.1 - 0 - - 0.3 - - 0.1
Lanes and Geometrics TIOGA INN TIA2: TIOGA RD (SR-120) & PROJECT SITE ACCESS 09/27/2018
EXISTING CONDITIONS (2018) Synchro 10 ReportMID-DAY PEAK HOUR
Lane Group WBL WBR NBT NBR SBL SBTLane ConfigurationsIdeal Flow (vphpl) 1900 1900 1900 1900 1900 1900Lane Width (ft) 12 12 12 12 12 12Grade (%) 0% 0% 0%Storage Length (ft) 0 0 275 75Storage Lanes 1 1 1 1Taper Length (ft) 25 25Lane Util. Factor 1.00 1.00 1.00 1.00 1.00 1.00Ped Bike FactorFrt 0.850 0.850Flt Protected 0.950 0.950Satd. Flow (prot) 1583 1417 1667 1417 1583 1667Flt Permitted 0.950 0.950Satd. Flow (perm) 1583 1417 1667 1417 1583 1667Link Speed (mph) 30 30 30Link Distance (ft) 624 1463 921Travel Time (s) 14.2 33.3 20.9
Intersection SummaryArea Type: Other

Volume TIOGA INN TIA2: TIOGA RD (SR-120) & PROJECT SITE ACCESS 09/27/2018
EXISTING CONDITIONS (2018) Synchro 10 ReportMID-DAY PEAK HOUR
Lane Group WBL WBR NBT NBR SBL SBTTraffic Volume (vph) 53 72 97 64 95 91Future Volume (vph) 53 72 97 64 95 91Confl. Peds. (#/hr)Confl. Bikes (#/hr)Peak Hour Factor 0.80 0.80 0.80 0.80 0.80 0.80Growth Factor 100% 100% 100% 100% 100% 100%Heavy Vehicles (%) 14% 14% 14% 14% 14% 14%Bus Blockages (#/hr) 0 0 0 0 0 0Parking (#/hr)Mid-Block Traffic (%) 0% 0% 0%Adj. Flow (vph) 66 90 121 80 119 114Shared Lane Traffic (%)Lane Group Flow (vph) 66 90 121 80 119 114
Intersection Summary
HCM 2010 TWSC TIOGA INN TIA2: TIOGA RD (SR-120) & PROJECT SITE ACCESS 09/27/2018
EXISTING CONDITIONS (2018) Synchro 10 ReportMID-DAY PEAK HOUR
IntersectionInt Delay, s/veh 4.6
Movement WBL WBR NBT NBR SBL SBTLane ConfigurationsTraffic Vol, veh/h 53 72 97 64 95 91Future Vol, veh/h 53 72 97 64 95 91Conflicting Peds, #/hr 0 0 0 0 0 0Sign Control Stop Stop Free Free Free FreeRT Channelized - None - None - NoneStorage Length 0 0 - 275 75 -Veh in Median Storage, # 0 - 0 - - 0Grade, % 0 - 0 - - 0Peak Hour Factor 80 80 80 80 80 80Heavy Vehicles, % 14 14 14 14 14 14Mvmt Flow 66 90 121 80 119 114
Major/Minor Minor1 Major1 Major2Conflicting Flow All 473 121 0 0 201 0 Stage 1 121 - - - - - Stage 2 352 - - - - -Critical Hdwy 6.54 6.34 - - 4.24 -Critical Hdwy Stg 1 5.54 - - - - -Critical Hdwy Stg 2 5.54 - - - - -Follow-up Hdwy 3.626 3.426 - - 2.326 -Pot Cap-1 Maneuver 529 899 - - 1302 - Stage 1 875 - - - - - Stage 2 686 - - - - -Platoon blocked, % - - -Mov Cap-1 Maneuver 481 899 - - 1302 -Mov Cap-2 Maneuver 481 - - - - - Stage 1 795 - - - - - Stage 2 686 - - - - -
Approach WB NB SBHCM Control Delay, s 11.2 0 4.1HCM LOS B
Minor Lane/Major Mvmt NBT NBRWBLn1WBLn2 SBL SBTCapacity (veh/h) - - 481 899 1302 -HCM Lane V/C Ratio - - 0.138 0.1 0.091 -HCM Control Delay (s) - - 13.7 9.4 8 -HCM Lane LOS - - B A A -HCM 95th %tile Q(veh) - - 0.5 0.3 0.3 -
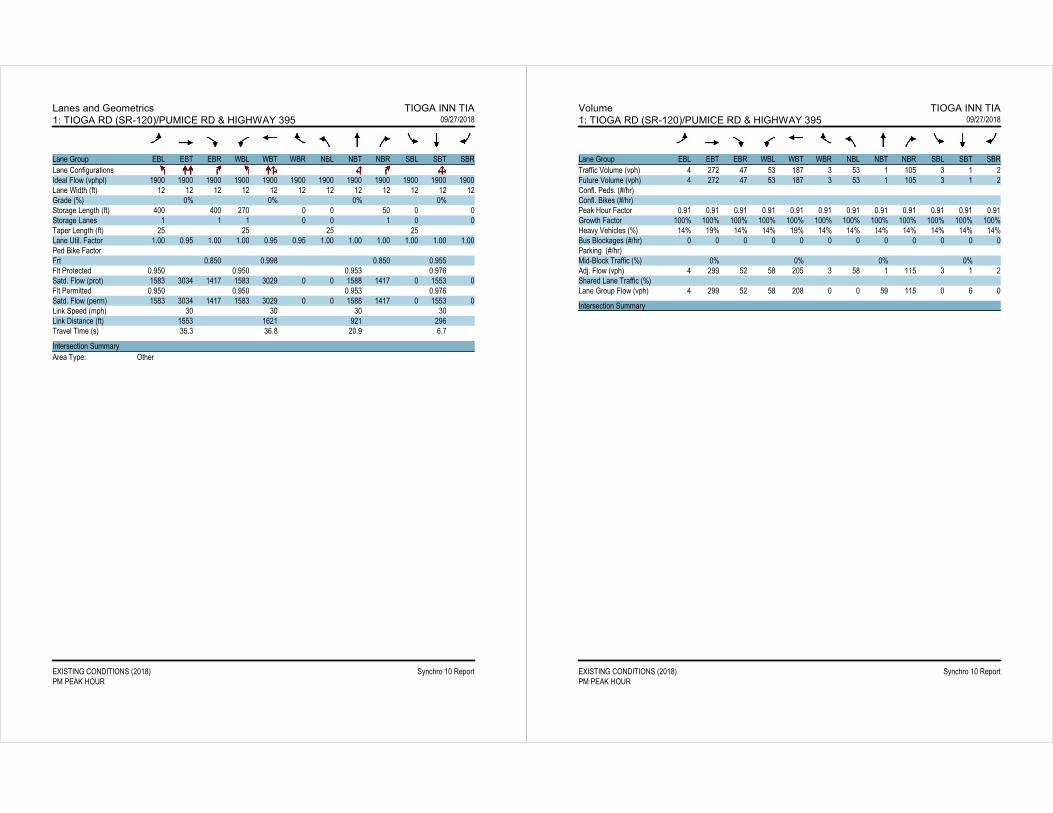
Lanes and Geometrics TIOGA INN TIA1: TIOGA RD (SR-120)/PUMICE RD & HIGHWAY 395 09/27/2018
EXISTING CONDITIONS (2018) Synchro 10 ReportPM PEAK HOUR
Lane Group EBL EBT EBR WBL WBT WBR NBL NBT NBR SBL SBT SBRLane ConfigurationsIdeal Flow (vphpl) 1900 1900 1900 1900 1900 1900 1900 1900 1900 1900 1900 1900Lane Width (ft) 12 12 12 12 12 12 12 12 12 12 12 12Grade (%) 0% 0% 0% 0%Storage Length (ft) 400 400 270 0 0 50 0 0Storage Lanes 1 1 1 0 0 1 0 0Taper Length (ft) 25 25 25 25Lane Util. Factor 1.00 0.95 1.00 1.00 0.95 0.95 1.00 1.00 1.00 1.00 1.00 1.00Ped Bike FactorFrt 0.850 0.998 0.850 0.955Flt Protected 0.950 0.950 0.953 0.976Satd. Flow (prot) 1583 3034 1417 1583 3029 0 0 1588 1417 0 1553 0Flt Permitted 0.950 0.950 0.953 0.976Satd. Flow (perm) 1583 3034 1417 1583 3029 0 0 1588 1417 0 1553 0Link Speed (mph) 30 30 30 30Link Distance (ft) 1553 1621 921 296Travel Time (s) 35.3 36.8 20.9 6.7
Intersection SummaryArea Type: Other
Volume TIOGA INN TIA1: TIOGA RD (SR-120)/PUMICE RD & HIGHWAY 395 09/27/2018
EXISTING CONDITIONS (2018) Synchro 10 ReportPM PEAK HOUR
Lane Group EBL EBT EBR WBL WBT WBR NBL NBT NBR SBL SBT SBRTraffic Volume (vph) 4 272 47 53 187 3 53 1 105 3 1 2Future Volume (vph) 4 272 47 53 187 3 53 1 105 3 1 2Confl. Peds. (#/hr)Confl. Bikes (#/hr)Peak Hour Factor 0.91 0.91 0.91 0.91 0.91 0.91 0.91 0.91 0.91 0.91 0.91 0.91Growth Factor 100% 100% 100% 100% 100% 100% 100% 100% 100% 100% 100% 100%Heavy Vehicles (%) 14% 19% 14% 14% 19% 14% 14% 14% 14% 14% 14% 14%Bus Blockages (#/hr) 0 0 0 0 0 0 0 0 0 0 0 0Parking (#/hr)Mid-Block Traffic (%) 0% 0% 0% 0%Adj. Flow (vph) 4 299 52 58 205 3 58 1 115 3 1 2Shared Lane Traffic (%)Lane Group Flow (vph) 4 299 52 58 208 0 0 59 115 0 6 0
Intersection Summary

HCM 2010 TWSC TIOGA INN TIA1: TIOGA RD (SR-120)/PUMICE RD & HIGHWAY 395 09/27/2018
EXISTING CONDITIONS (2018) Synchro 10 ReportPM PEAK HOUR
IntersectionInt Delay, s/veh 2.2
Movement EBL EBT EBR WBL WBT WBR NBL NBT NBR SBL SBT SBRLane ConfigurationsTraffic Vol, veh/h 4 272 47 53 187 3 53 1 105 3 1 2Future Vol, veh/h 4 272 47 53 187 3 53 1 105 3 1 2Conflicting Peds, #/hr 0 0 0 0 0 0 0 0 0 0 0 0Sign Control Free Free Free Free Free Free Stop Stop Stop Stop Stop StopRT Channelized - - Yield - - None - - Free - - NoneStorage Length 400 - 400 270 - - - - 50 - - -Veh in Median Storage, # - 0 - - 0 - - 0 - - 0 -Grade, % - 0 - - 0 - - 0 - - 0 -Peak Hour Factor 91 91 91 91 91 91 91 91 91 91 91 91Heavy Vehicles, % 14 19 14 14 19 14 14 14 14 14 14 14Mvmt Flow 4 299 52 58 205 3 58 1 115 3 1 2
Major/Minor Major1 Major2 Minor1 Minor2Conflicting Flow All 208 0 0 299 0 0 526 631 - 481 630 104 Stage 1 - - - - - - 307 307 - 323 323 - Stage 2 - - - - - - 219 324 - 158 307 -Critical Hdwy 4.38 - - 4.38 - - 7.78 6.78 - 7.78 6.78 7.18Critical Hdwy Stg 1 - - - - - - 6.78 5.78 - 6.78 5.78 -Critical Hdwy Stg 2 - - - - - - 6.78 5.78 - 6.78 5.78 -Follow-up Hdwy 2.34 - - 2.34 - - 3.64 4.14 - 3.64 4.14 3.44Pot Cap-1 Maneuver 1277 - - 1177 - - 409 373 0 442 373 893 Stage 1 - - - - - - 645 630 0 631 620 - Stage 2 - - - - - - 730 619 0 795 630 -Platoon blocked, % - - - -Mov Cap-1 Maneuver 1277 - - 1177 - - 391 354 - 423 354 893Mov Cap-2 Maneuver - - - - - - 391 354 - 423 354 - Stage 1 - - - - - - 643 628 - 629 590 - Stage 2 - - - - - - 691 589 - 791 628 -
Approach EB WB NB SBHCM Control Delay, s 0.1 1.8 15.9 12.4HCM LOS C B
Minor Lane/Major Mvmt NBLn1 NBLn2 EBL EBT EBR WBL WBT WBR SBLn1Capacity (veh/h) 390 - 1277 - - 1177 - - 494HCM Lane V/C Ratio 0.152 - 0.003 - - 0.049 - - 0.013HCM Control Delay (s) 15.9 0 7.8 - - 8.2 - - 12.4HCM Lane LOS C A A - - A - - BHCM 95th %tile Q(veh) 0.5 - 0 - - 0.2 - - 0
Lanes and Geometrics TIOGA INN TIA2: TIOGA RD (SR-120) & PROJECT SITE ACCESS 09/27/2018
EXISTING CONDITIONS (2018) Synchro 10 ReportPM PEAK HOUR
Lane Group WBL WBR NBT NBR SBL SBTLane ConfigurationsIdeal Flow (vphpl) 1900 1900 1900 1900 1900 1900Lane Width (ft) 12 12 12 12 12 12Grade (%) 0% 0% 0%Storage Length (ft) 0 0 275 75Storage Lanes 1 1 1 1Taper Length (ft) 25 25Lane Util. Factor 1.00 1.00 1.00 1.00 1.00 1.00Ped Bike FactorFrt 0.850 0.850Flt Protected 0.950 0.950Satd. Flow (prot) 1583 1417 1667 1417 1583 1667Flt Permitted 0.950 0.950Satd. Flow (perm) 1583 1417 1667 1417 1583 1667Link Speed (mph) 30 30 30Link Distance (ft) 624 1463 921Travel Time (s) 14.2 33.3 20.9
Intersection SummaryArea Type: Other

Volume TIOGA INN TIA2: TIOGA RD (SR-120) & PROJECT SITE ACCESS 09/27/2018
EXISTING CONDITIONS (2018) Synchro 10 ReportPM PEAK HOUR
Lane Group WBL WBR NBT NBR SBL SBTTraffic Volume (vph) 32 63 149 75 64 68Future Volume (vph) 32 63 149 75 64 68Confl. Peds. (#/hr)Confl. Bikes (#/hr)Peak Hour Factor 0.84 0.84 0.84 0.84 0.84 0.84Growth Factor 100% 100% 100% 100% 100% 100%Heavy Vehicles (%) 14% 14% 14% 14% 14% 14%Bus Blockages (#/hr) 0 0 0 0 0 0Parking (#/hr)Mid-Block Traffic (%) 0% 0% 0%Adj. Flow (vph) 38 75 177 89 76 81Shared Lane Traffic (%)Lane Group Flow (vph) 38 75 177 89 76 81
Intersection Summary
HCM 2010 TWSC TIOGA INN TIA2: TIOGA RD (SR-120) & PROJECT SITE ACCESS 09/27/2018
EXISTING CONDITIONS (2018) Synchro 10 ReportPM PEAK HOUR
IntersectionInt Delay, s/veh 3.4
Movement WBL WBR NBT NBR SBL SBTLane ConfigurationsTraffic Vol, veh/h 32 63 149 75 64 68Future Vol, veh/h 32 63 149 75 64 68Conflicting Peds, #/hr 0 0 0 0 0 0Sign Control Stop Stop Free Free Free FreeRT Channelized - None - None - NoneStorage Length 0 0 - 275 75 -Veh in Median Storage, # 0 - 0 - - 0Grade, % 0 - 0 - - 0Peak Hour Factor 84 84 84 84 84 84Heavy Vehicles, % 14 14 14 14 14 14Mvmt Flow 38 75 177 89 76 81
Major/Minor Minor1 Major1 Major2Conflicting Flow All 410 177 0 0 266 0 Stage 1 177 - - - - - Stage 2 233 - - - - -Critical Hdwy 6.54 6.34 - - 4.24 -Critical Hdwy Stg 1 5.54 - - - - -Critical Hdwy Stg 2 5.54 - - - - -Follow-up Hdwy 3.626 3.426 - - 2.326 -Pot Cap-1 Maneuver 575 836 - - 1231 - Stage 1 826 - - - - - Stage 2 778 - - - - -Platoon blocked, % - - -Mov Cap-1 Maneuver 539 836 - - 1231 -Mov Cap-2 Maneuver 539 - - - - - Stage 1 775 - - - - - Stage 2 778 - - - - -
Approach WB NB SBHCM Control Delay, s 10.5 0 3.9HCM LOS B
Minor Lane/Major Mvmt NBT NBRWBLn1WBLn2 SBL SBTCapacity (veh/h) - - 539 836 1231 -HCM Lane V/C Ratio - - 0.071 0.09 0.062 -HCM Control Delay (s) - - 12.2 9.7 8.1 -HCM Lane LOS - - B A A -HCM 95th %tile Q(veh) - - 0.2 0.3 0.2 -
APPENDIX D Existing Plus Project Conditions LOS Analysis Worksheets

Lanes and Geometrics TIOGA INN TIA1: TIOGA RD (SR-120)/PUMICE RD & HIGHWAY 395 10/04/2018
EXISTING PLUS PROJECT CONDITIONS Synchro 10 ReportAM PEAK HOUR
Lane Group EBL EBT EBR WBL WBT WBR NBL NBT NBR SBL SBT SBRLane ConfigurationsIdeal Flow (vphpl) 1900 1900 1900 1900 1900 1900 1900 1900 1900 1900 1900 1900Lane Width (ft) 12 12 12 12 12 12 12 12 12 12 12 12Grade (%) 0% 0% 0% 0%Storage Length (ft) 400 400 270 0 0 50 0 0Storage Lanes 1 1 1 0 0 1 0 0Taper Length (ft) 25 25 25 25Lane Util. Factor 1.00 0.95 1.00 1.00 0.95 0.95 1.00 1.00 1.00 1.00 1.00 1.00Ped Bike FactorFrt 0.850 0.999 0.850 0.865Flt Protected 0.950 0.950 0.950Satd. Flow (prot) 1583 3034 1417 1583 3032 0 0 1583 1417 0 1442 0Flt Permitted 0.950 0.950 0.950Satd. Flow (perm) 1583 3034 1417 1583 3032 0 0 1583 1417 0 1442 0Link Speed (mph) 30 30 30 30Link Distance (ft) 1553 1621 921 296Travel Time (s) 35.3 36.8 20.9 6.7
Intersection SummaryArea Type: Other
Volume TIOGA INN TIA1: TIOGA RD (SR-120)/PUMICE RD & HIGHWAY 395 10/04/2018
EXISTING PLUS PROJECT CONDITIONS Synchro 10 ReportAM PEAK HOUR
Lane Group EBL EBT EBR WBL WBT WBR NBL NBT NBR SBL SBT SBRTraffic Volume (vph) 1 156 73 106 235 2 50 0 67 0 0 3Future Volume (vph) 1 156 73 106 235 2 50 0 67 0 0 3Confl. Peds. (#/hr)Confl. Bikes (#/hr)Peak Hour Factor 0.88 0.88 0.88 0.88 0.88 0.88 0.88 0.88 0.88 0.88 0.88 0.88Growth Factor 100% 100% 100% 100% 100% 100% 100% 100% 100% 100% 100% 100%Heavy Vehicles (%) 14% 19% 14% 14% 19% 14% 14% 14% 14% 14% 14% 14%Bus Blockages (#/hr) 0 0 0 0 0 0 0 0 0 0 0 0Parking (#/hr)Mid-Block Traffic (%) 0% 0% 0% 0%Adj. Flow (vph) 1 177 83 120 267 2 57 0 76 0 0 3Shared Lane Traffic (%)Lane Group Flow (vph) 1 177 83 120 269 0 0 57 76 0 3 0
Intersection Summary

HCM 2010 TWSC TIOGA INN TIA1: TIOGA RD (SR-120)/PUMICE RD & HIGHWAY 395 10/04/2018
EXISTING PLUS PROJECT CONDITIONS Synchro 10 ReportAM PEAK HOUR
IntersectionInt Delay, s/veh 2.8
Movement EBL EBT EBR WBL WBT WBR NBL NBT NBR SBL SBT SBRLane ConfigurationsTraffic Vol, veh/h 1 156 73 106 235 2 50 0 67 0 0 3Future Vol, veh/h 1 156 73 106 235 2 50 0 67 0 0 3Conflicting Peds, #/hr 0 0 0 0 0 0 0 0 0 0 0 0Sign Control Free Free Free Free Free Free Stop Stop Stop Stop Stop StopRT Channelized - - Yield - - None - - Free - - NoneStorage Length 400 - 400 270 - - - - 50 - - -Veh in Median Storage, # - 0 - - 0 - - 0 - - 0 -Grade, % - 0 - - 0 - - 0 - - 0 -Peak Hour Factor 88 88 88 88 88 88 88 88 88 88 88 88Heavy Vehicles, % 14 19 14 14 19 14 14 14 14 14 14 14Mvmt Flow 1 177 83 120 267 2 57 0 76 0 0 3
Major/Minor Major1 Major2 Minor1 Minor2Conflicting Flow All 269 0 0 177 0 0 553 688 - 599 687 135 Stage 1 - - - - - - 179 179 - 508 508 - Stage 2 - - - - - - 374 509 - 91 179 -Critical Hdwy 4.38 - - 4.38 - - 7.78 6.78 - 7.78 6.78 7.18Critical Hdwy Stg 1 - - - - - - 6.78 5.78 - 6.78 5.78 -Critical Hdwy Stg 2 - - - - - - 6.78 5.78 - 6.78 5.78 -Follow-up Hdwy 2.34 - - 2.34 - - 3.64 4.14 - 3.64 4.14 3.44Pot Cap-1 Maneuver 1209 - - 1313 - - 391 344 0 361 345 852 Stage 1 - - - - - - 772 722 0 486 508 - Stage 2 - - - - - - 587 507 0 872 722 -Platoon blocked, % - - - -Mov Cap-1 Maneuver 1209 - - 1313 - - 362 312 - 335 313 852Mov Cap-2 Maneuver - - - - - - 362 312 - 335 313 - Stage 1 - - - - - - 771 721 - 486 462 - Stage 2 - - - - - - 531 461 - 871 721 -
Approach EB WB NB SBHCM Control Delay, s 0 2.5 16.8 9.2HCM LOS C A
Minor Lane/Major Mvmt NBLn1 NBLn2 EBL EBT EBR WBL WBT WBR SBLn1Capacity (veh/h) 362 - 1209 - - 1313 - - 852HCM Lane V/C Ratio 0.157 - 0.001 - - 0.092 - - 0.004HCM Control Delay (s) 16.8 0 8 - - 8 - - 9.2HCM Lane LOS C A A - - A - - AHCM 95th %tile Q(veh) 0.6 - 0 - - 0.3 - - 0
Lanes and Geometrics TIOGA INN TIA2: TIOGA RD (SR-120) & PROJECT SITE ACCESS 10/04/2018
EXISTING PLUS PROJECT CONDITIONS Synchro 10 ReportAM PEAK HOUR
Lane Group WBL WBR NBT NBR SBL SBTLane ConfigurationsIdeal Flow (vphpl) 1900 1900 1900 1900 1900 1900Lane Width (ft) 12 12 12 12 12 12Grade (%) 0% 0% 0%Storage Length (ft) 0 0 275 75Storage Lanes 1 1 1 1Taper Length (ft) 25 25Lane Util. Factor 1.00 1.00 1.00 1.00 1.00 1.00Ped Bike FactorFrt 0.850 0.850Flt Protected 0.950 0.950Satd. Flow (prot) 1583 1417 1667 1417 1583 1667Flt Permitted 0.950 0.950Satd. Flow (perm) 1583 1417 1667 1417 1583 1667Link Speed (mph) 30 30 30Link Distance (ft) 624 1463 921Travel Time (s) 14.2 33.3 20.9
Intersection SummaryArea Type: Other

Volume TIOGA INN TIA2: TIOGA RD (SR-120) & PROJECT SITE ACCESS 10/04/2018
EXISTING PLUS PROJECT CONDITIONS Synchro 10 ReportAM PEAK HOUR
Lane Group WBL WBR NBT NBR SBL SBTTraffic Volume (vph) 55 111 57 40 90 186Future Volume (vph) 55 111 57 40 90 186Confl. Peds. (#/hr)Confl. Bikes (#/hr)Peak Hour Factor 0.90 0.90 0.90 0.90 0.90 0.90Growth Factor 100% 100% 100% 100% 100% 100%Heavy Vehicles (%) 14% 14% 14% 14% 14% 14%Bus Blockages (#/hr) 0 0 0 0 0 0Parking (#/hr)Mid-Block Traffic (%) 0% 0% 0%Adj. Flow (vph) 61 123 63 44 100 207Shared Lane Traffic (%)Lane Group Flow (vph) 61 123 63 44 100 207
Intersection Summary
HCM 2010 TWSC TIOGA INN TIA2: TIOGA RD (SR-120) & PROJECT SITE ACCESS 10/04/2018
EXISTING PLUS PROJECT CONDITIONS Synchro 10 ReportAM PEAK HOUR
IntersectionInt Delay, s/veh 4.5
Movement WBL WBR NBT NBR SBL SBTLane ConfigurationsTraffic Vol, veh/h 55 111 57 40 90 186Future Vol, veh/h 55 111 57 40 90 186Conflicting Peds, #/hr 0 0 0 0 0 0Sign Control Stop Stop Free Free Free FreeRT Channelized - None - None - NoneStorage Length 0 0 - 275 75 -Veh in Median Storage, # 0 - 0 - - 0Grade, % 0 - 0 - - 0Peak Hour Factor 90 90 90 90 90 90Heavy Vehicles, % 14 14 14 14 14 14Mvmt Flow 61 123 63 44 100 207
Major/Minor Minor1 Major1 Major2Conflicting Flow All 470 63 0 0 107 0 Stage 1 63 - - - - - Stage 2 407 - - - - -Critical Hdwy 6.54 6.34 - - 4.24 -Critical Hdwy Stg 1 5.54 - - - - -Critical Hdwy Stg 2 5.54 - - - - -Follow-up Hdwy 3.626 3.426 - - 2.326 -Pot Cap-1 Maneuver 531 969 - - 1412 - Stage 1 930 - - - - - Stage 2 647 - - - - -Platoon blocked, % - - -Mov Cap-1 Maneuver 493 969 - - 1412 -Mov Cap-2 Maneuver 493 - - - - - Stage 1 864 - - - - - Stage 2 647 - - - - -
Approach WB NB SBHCM Control Delay, s 10.6 0 2.5HCM LOS B
Minor Lane/Major Mvmt NBT NBRWBLn1WBLn2 SBL SBTCapacity (veh/h) - - 493 969 1412 -HCM Lane V/C Ratio - - 0.124 0.127 0.071 -HCM Control Delay (s) - - 13.3 9.3 7.7 -HCM Lane LOS - - B A A -HCM 95th %tile Q(veh) - - 0.4 0.4 0.2 -

Lanes and Geometrics TIOGA INN TIA1: TIOGA RD (SR-120)/PUMICE RD & HIGHWAY 395 10/04/2018
EXISTING PLUS PROJECT CONDITIONS Synchro 10 ReportMID-DAY PEAK HOUR
Lane Group EBL EBT EBR WBL WBT WBR NBL NBT NBR SBL SBT SBRLane ConfigurationsIdeal Flow (vphpl) 1900 1900 1900 1900 1900 1900 1900 1900 1900 1900 1900 1900Lane Width (ft) 12 12 12 12 12 12 12 12 12 12 12 12Grade (%) 0% 0% 0% 0%Storage Length (ft) 400 400 270 0 0 50 0 0Storage Lanes 1 1 1 0 0 1 0 0Taper Length (ft) 25 25 25 25Lane Util. Factor 1.00 0.95 1.00 1.00 0.95 0.95 1.00 1.00 1.00 1.00 1.00 1.00Ped Bike FactorFrt 0.850 0.850 0.902Flt Protected 0.950 0.950 0.950 0.987Satd. Flow (prot) 1583 3034 1417 1583 3034 0 0 1583 1417 0 1484 0Flt Permitted 0.950 0.950 0.950 0.987Satd. Flow (perm) 1583 3034 1417 1583 3034 0 0 1583 1417 0 1484 0Link Speed (mph) 30 30 30 30Link Distance (ft) 1553 1621 921 296Travel Time (s) 35.3 36.8 20.9 6.7
Intersection SummaryArea Type: Other
Volume TIOGA INN TIA1: TIOGA RD (SR-120)/PUMICE RD & HIGHWAY 395 10/04/2018
EXISTING PLUS PROJECT CONDITIONS Synchro 10 ReportMID-DAY PEAK HOUR
Lane Group EBL EBT EBR WBL WBT WBR NBL NBT NBR SBL SBT SBRTraffic Volume (vph) 5 273 69 125 249 0 71 0 67 2 0 6Future Volume (vph) 5 273 69 125 249 0 71 0 67 2 0 6Confl. Peds. (#/hr)Confl. Bikes (#/hr)Peak Hour Factor 0.80 0.80 0.80 0.80 0.80 0.80 0.80 0.80 0.80 0.80 0.80 0.80Growth Factor 100% 100% 100% 100% 100% 100% 100% 100% 100% 100% 100% 100%Heavy Vehicles (%) 14% 19% 14% 14% 19% 14% 14% 14% 14% 14% 14% 14%Bus Blockages (#/hr) 0 0 0 0 0 0 0 0 0 0 0 0Parking (#/hr)Mid-Block Traffic (%) 0% 0% 0% 0%Adj. Flow (vph) 6 341 86 156 311 0 89 0 84 3 0 8Shared Lane Traffic (%)Lane Group Flow (vph) 6 341 86 156 311 0 0 89 84 0 11 0
Intersection Summary

HCM 2010 TWSC TIOGA INN TIA1: TIOGA RD (SR-120)/PUMICE RD & HIGHWAY 395 10/04/2018
EXISTING PLUS PROJECT CONDITIONS Synchro 10 ReportMID-DAY PEAK HOUR
IntersectionInt Delay, s/veh 4.4
Movement EBL EBT EBR WBL WBT WBR NBL NBT NBR SBL SBT SBRLane ConfigurationsTraffic Vol, veh/h 5 273 69 125 249 0 71 0 67 2 0 6Future Vol, veh/h 5 273 69 125 249 0 71 0 67 2 0 6Conflicting Peds, #/hr 0 0 0 0 0 0 0 0 0 0 0 0Sign Control Free Free Free Free Free Free Stop Stop Stop Stop Stop StopRT Channelized - - Yield - - None - - Free - - NoneStorage Length 400 - 400 270 - - - - 50 - - -Veh in Median Storage, # - 0 - - 0 - - 0 - - 0 -Grade, % - 0 - - 0 - - 0 - - 0 -Peak Hour Factor 80 80 80 80 80 80 80 80 80 80 80 80Heavy Vehicles, % 14 19 14 14 19 14 14 14 14 14 14 14Mvmt Flow 6 341 86 156 311 0 89 0 84 3 0 8
Major/Minor Major1 Major2 Minor1 Minor2Conflicting Flow All 311 0 0 341 0 0 821 976 - 806 976 156 Stage 1 - - - - - - 353 353 - 623 623 - Stage 2 - - - - - - 468 623 - 183 353 -Critical Hdwy 4.38 - - 4.38 - - 7.78 6.78 - 7.78 6.78 7.18Critical Hdwy Stg 1 - - - - - - 6.78 5.78 - 6.78 5.78 -Critical Hdwy Stg 2 - - - - - - 6.78 5.78 - 6.78 5.78 -Follow-up Hdwy 2.34 - - 2.34 - - 3.64 4.14 - 3.64 4.14 3.44Pot Cap-1 Maneuver 1164 - - 1133 - - 247 230 0 253 230 825 Stage 1 - - - - - - 605 600 0 412 448 - Stage 2 - - - - - - 514 448 0 768 600 -Platoon blocked, % - - - -Mov Cap-1 Maneuver 1164 - - 1133 - - 218 197 - 225 197 825Mov Cap-2 Maneuver - - - - - - 218 197 - 225 197 - Stage 1 - - - - - - 602 597 - 410 386 - Stage 2 - - - - - - 439 386 - 764 597 -
Approach EB WB NB SBHCM Control Delay, s 0.1 2.9 32.4 12.4HCM LOS D B
Minor Lane/Major Mvmt NBLn1 NBLn2 EBL EBT EBR WBL WBT WBR SBLn1Capacity (veh/h) 218 - 1164 - - 1133 - - 495HCM Lane V/C Ratio 0.407 - 0.005 - - 0.138 - - 0.02HCM Control Delay (s) 32.4 0 8.1 - - 8.7 - - 12.4HCM Lane LOS D A A - - A - - BHCM 95th %tile Q(veh) 1.8 - 0 - - 0.5 - - 0.1
Lanes and Geometrics TIOGA INN TIA2: TIOGA RD (SR-120) & PROJECT SITE ACCESS 10/04/2018
EXISTING PLUS PROJECT CONDITIONS Synchro 10 ReportMID-DAY PEAK HOUR
Lane Group WBL WBR NBT NBR SBL SBTLane ConfigurationsIdeal Flow (vphpl) 1900 1900 1900 1900 1900 1900Lane Width (ft) 12 12 12 12 12 12Grade (%) 0% 0% 0%Storage Length (ft) 0 0 275 75Storage Lanes 1 1 1 1Taper Length (ft) 25 25Lane Util. Factor 1.00 1.00 1.00 1.00 1.00 1.00Ped Bike FactorFrt 0.850 0.850Flt Protected 0.950 0.950Satd. Flow (prot) 1583 1417 1667 1417 1583 1667Flt Permitted 0.950 0.950Satd. Flow (perm) 1583 1417 1667 1417 1583 1667Link Speed (mph) 30 30 30Link Distance (ft) 624 1463 921Travel Time (s) 14.2 33.3 20.9
Intersection SummaryArea Type: Other
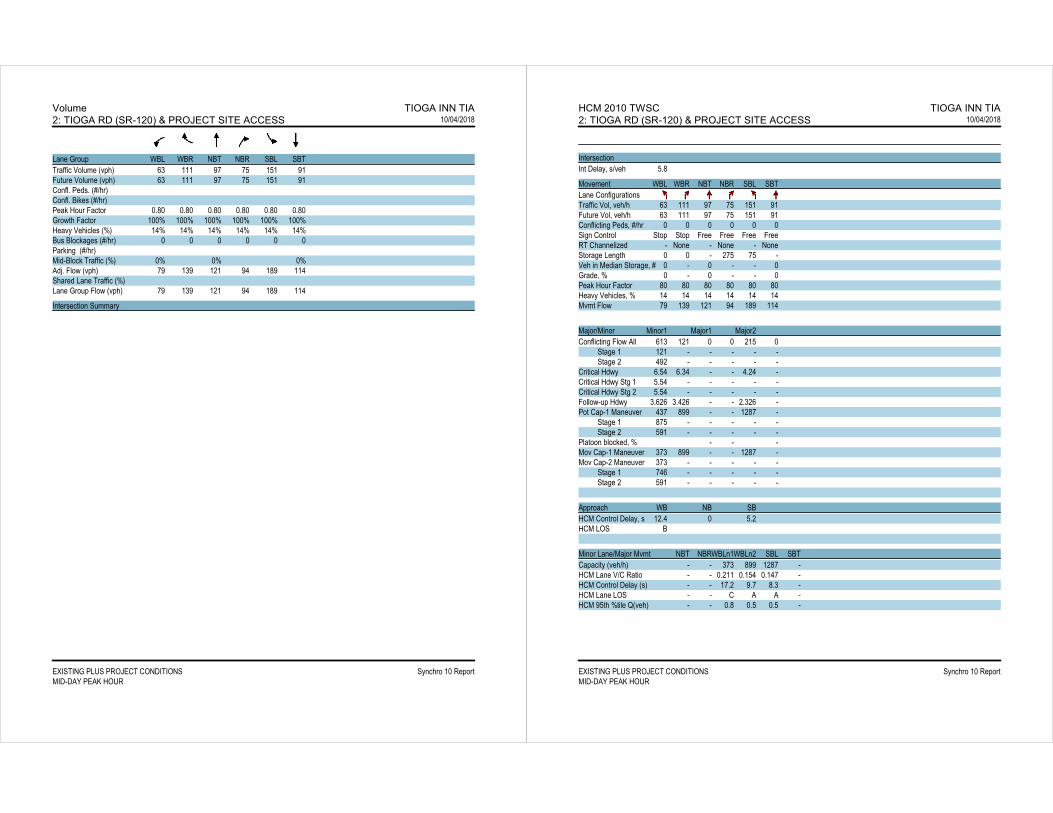
Volume TIOGA INN TIA2: TIOGA RD (SR-120) & PROJECT SITE ACCESS 10/04/2018
EXISTING PLUS PROJECT CONDITIONS Synchro 10 ReportMID-DAY PEAK HOUR
Lane Group WBL WBR NBT NBR SBL SBTTraffic Volume (vph) 63 111 97 75 151 91Future Volume (vph) 63 111 97 75 151 91Confl. Peds. (#/hr)Confl. Bikes (#/hr)Peak Hour Factor 0.80 0.80 0.80 0.80 0.80 0.80Growth Factor 100% 100% 100% 100% 100% 100%Heavy Vehicles (%) 14% 14% 14% 14% 14% 14%Bus Blockages (#/hr) 0 0 0 0 0 0Parking (#/hr)Mid-Block Traffic (%) 0% 0% 0%Adj. Flow (vph) 79 139 121 94 189 114Shared Lane Traffic (%)Lane Group Flow (vph) 79 139 121 94 189 114
Intersection Summary
HCM 2010 TWSC TIOGA INN TIA2: TIOGA RD (SR-120) & PROJECT SITE ACCESS 10/04/2018
EXISTING PLUS PROJECT CONDITIONS Synchro 10 ReportMID-DAY PEAK HOUR
IntersectionInt Delay, s/veh 5.8
Movement WBL WBR NBT NBR SBL SBTLane ConfigurationsTraffic Vol, veh/h 63 111 97 75 151 91Future Vol, veh/h 63 111 97 75 151 91Conflicting Peds, #/hr 0 0 0 0 0 0Sign Control Stop Stop Free Free Free FreeRT Channelized - None - None - NoneStorage Length 0 0 - 275 75 -Veh in Median Storage, # 0 - 0 - - 0Grade, % 0 - 0 - - 0Peak Hour Factor 80 80 80 80 80 80Heavy Vehicles, % 14 14 14 14 14 14Mvmt Flow 79 139 121 94 189 114
Major/Minor Minor1 Major1 Major2Conflicting Flow All 613 121 0 0 215 0 Stage 1 121 - - - - - Stage 2 492 - - - - -Critical Hdwy 6.54 6.34 - - 4.24 -Critical Hdwy Stg 1 5.54 - - - - -Critical Hdwy Stg 2 5.54 - - - - -Follow-up Hdwy 3.626 3.426 - - 2.326 -Pot Cap-1 Maneuver 437 899 - - 1287 - Stage 1 875 - - - - - Stage 2 591 - - - - -Platoon blocked, % - - -Mov Cap-1 Maneuver 373 899 - - 1287 -Mov Cap-2 Maneuver 373 - - - - - Stage 1 746 - - - - - Stage 2 591 - - - - -
Approach WB NB SBHCM Control Delay, s 12.4 0 5.2HCM LOS B
Minor Lane/Major Mvmt NBT NBRWBLn1WBLn2 SBL SBTCapacity (veh/h) - - 373 899 1287 -HCM Lane V/C Ratio - - 0.211 0.154 0.147 -HCM Control Delay (s) - - 17.2 9.7 8.3 -HCM Lane LOS - - C A A -HCM 95th %tile Q(veh) - - 0.8 0.5 0.5 -
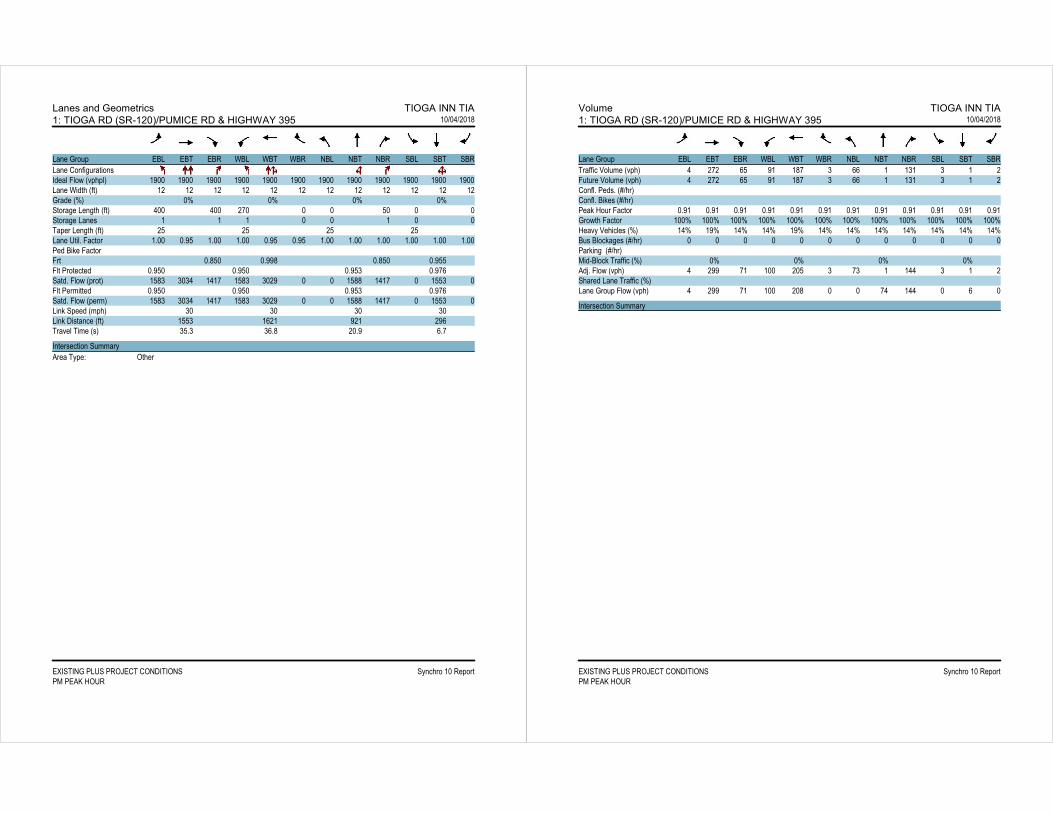
Lanes and Geometrics TIOGA INN TIA1: TIOGA RD (SR-120)/PUMICE RD & HIGHWAY 395 10/04/2018
EXISTING PLUS PROJECT CONDITIONS Synchro 10 ReportPM PEAK HOUR
Lane Group EBL EBT EBR WBL WBT WBR NBL NBT NBR SBL SBT SBRLane ConfigurationsIdeal Flow (vphpl) 1900 1900 1900 1900 1900 1900 1900 1900 1900 1900 1900 1900Lane Width (ft) 12 12 12 12 12 12 12 12 12 12 12 12Grade (%) 0% 0% 0% 0%Storage Length (ft) 400 400 270 0 0 50 0 0Storage Lanes 1 1 1 0 0 1 0 0Taper Length (ft) 25 25 25 25Lane Util. Factor 1.00 0.95 1.00 1.00 0.95 0.95 1.00 1.00 1.00 1.00 1.00 1.00Ped Bike FactorFrt 0.850 0.998 0.850 0.955Flt Protected 0.950 0.950 0.953 0.976Satd. Flow (prot) 1583 3034 1417 1583 3029 0 0 1588 1417 0 1553 0Flt Permitted 0.950 0.950 0.953 0.976Satd. Flow (perm) 1583 3034 1417 1583 3029 0 0 1588 1417 0 1553 0Link Speed (mph) 30 30 30 30Link Distance (ft) 1553 1621 921 296Travel Time (s) 35.3 36.8 20.9 6.7
Intersection SummaryArea Type: Other
Volume TIOGA INN TIA1: TIOGA RD (SR-120)/PUMICE RD & HIGHWAY 395 10/04/2018
EXISTING PLUS PROJECT CONDITIONS Synchro 10 ReportPM PEAK HOUR
Lane Group EBL EBT EBR WBL WBT WBR NBL NBT NBR SBL SBT SBRTraffic Volume (vph) 4 272 65 91 187 3 66 1 131 3 1 2Future Volume (vph) 4 272 65 91 187 3 66 1 131 3 1 2Confl. Peds. (#/hr)Confl. Bikes (#/hr)Peak Hour Factor 0.91 0.91 0.91 0.91 0.91 0.91 0.91 0.91 0.91 0.91 0.91 0.91Growth Factor 100% 100% 100% 100% 100% 100% 100% 100% 100% 100% 100% 100%Heavy Vehicles (%) 14% 19% 14% 14% 19% 14% 14% 14% 14% 14% 14% 14%Bus Blockages (#/hr) 0 0 0 0 0 0 0 0 0 0 0 0Parking (#/hr)Mid-Block Traffic (%) 0% 0% 0% 0%Adj. Flow (vph) 4 299 71 100 205 3 73 1 144 3 1 2Shared Lane Traffic (%)Lane Group Flow (vph) 4 299 71 100 208 0 0 74 144 0 6 0
Intersection Summary
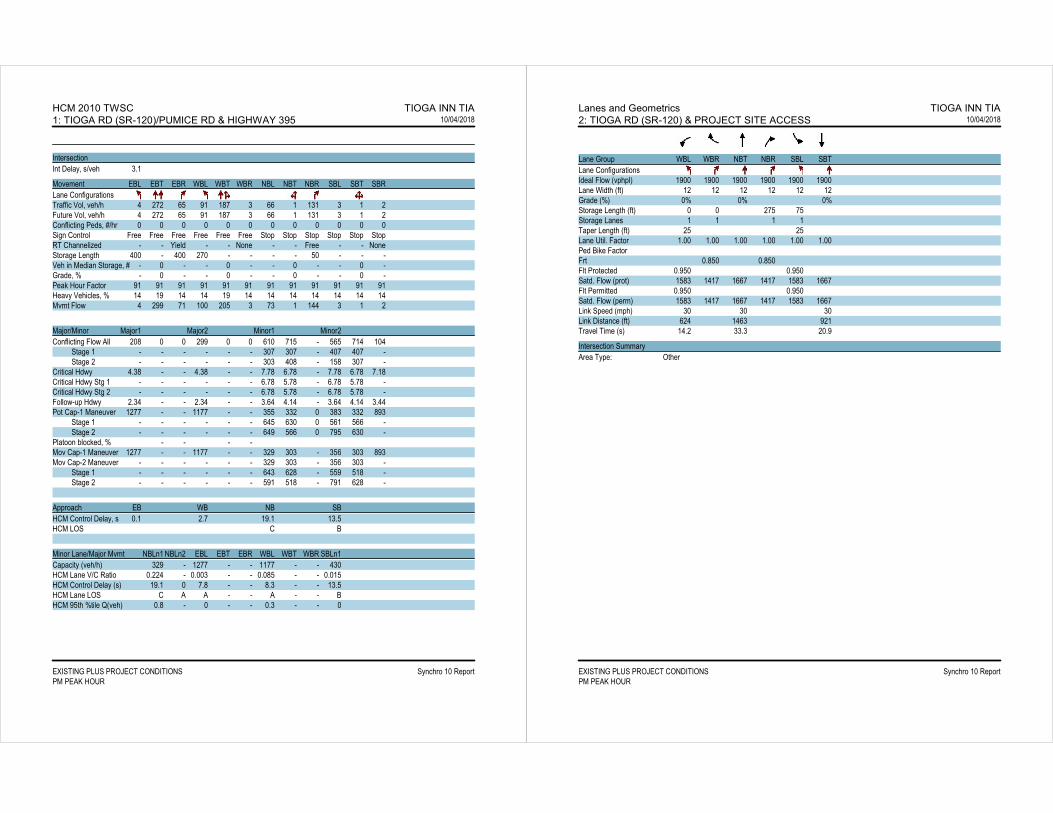
HCM 2010 TWSC TIOGA INN TIA1: TIOGA RD (SR-120)/PUMICE RD & HIGHWAY 395 10/04/2018
EXISTING PLUS PROJECT CONDITIONS Synchro 10 ReportPM PEAK HOUR
IntersectionInt Delay, s/veh 3.1
Movement EBL EBT EBR WBL WBT WBR NBL NBT NBR SBL SBT SBRLane ConfigurationsTraffic Vol, veh/h 4 272 65 91 187 3 66 1 131 3 1 2Future Vol, veh/h 4 272 65 91 187 3 66 1 131 3 1 2Conflicting Peds, #/hr 0 0 0 0 0 0 0 0 0 0 0 0Sign Control Free Free Free Free Free Free Stop Stop Stop Stop Stop StopRT Channelized - - Yield - - None - - Free - - NoneStorage Length 400 - 400 270 - - - - 50 - - -Veh in Median Storage, # - 0 - - 0 - - 0 - - 0 -Grade, % - 0 - - 0 - - 0 - - 0 -Peak Hour Factor 91 91 91 91 91 91 91 91 91 91 91 91Heavy Vehicles, % 14 19 14 14 19 14 14 14 14 14 14 14Mvmt Flow 4 299 71 100 205 3 73 1 144 3 1 2
Major/Minor Major1 Major2 Minor1 Minor2Conflicting Flow All 208 0 0 299 0 0 610 715 - 565 714 104 Stage 1 - - - - - - 307 307 - 407 407 - Stage 2 - - - - - - 303 408 - 158 307 -Critical Hdwy 4.38 - - 4.38 - - 7.78 6.78 - 7.78 6.78 7.18Critical Hdwy Stg 1 - - - - - - 6.78 5.78 - 6.78 5.78 -Critical Hdwy Stg 2 - - - - - - 6.78 5.78 - 6.78 5.78 -Follow-up Hdwy 2.34 - - 2.34 - - 3.64 4.14 - 3.64 4.14 3.44Pot Cap-1 Maneuver 1277 - - 1177 - - 355 332 0 383 332 893 Stage 1 - - - - - - 645 630 0 561 566 - Stage 2 - - - - - - 649 566 0 795 630 -Platoon blocked, % - - - -Mov Cap-1 Maneuver 1277 - - 1177 - - 329 303 - 356 303 893Mov Cap-2 Maneuver - - - - - - 329 303 - 356 303 - Stage 1 - - - - - - 643 628 - 559 518 - Stage 2 - - - - - - 591 518 - 791 628 -
Approach EB WB NB SBHCM Control Delay, s 0.1 2.7 19.1 13.5HCM LOS C B
Minor Lane/Major Mvmt NBLn1 NBLn2 EBL EBT EBR WBL WBT WBR SBLn1Capacity (veh/h) 329 - 1277 - - 1177 - - 430HCM Lane V/C Ratio 0.224 - 0.003 - - 0.085 - - 0.015HCM Control Delay (s) 19.1 0 7.8 - - 8.3 - - 13.5HCM Lane LOS C A A - - A - - BHCM 95th %tile Q(veh) 0.8 - 0 - - 0.3 - - 0
Lanes and Geometrics TIOGA INN TIA2: TIOGA RD (SR-120) & PROJECT SITE ACCESS 10/04/2018
EXISTING PLUS PROJECT CONDITIONS Synchro 10 ReportPM PEAK HOUR
Lane Group WBL WBR NBT NBR SBL SBTLane ConfigurationsIdeal Flow (vphpl) 1900 1900 1900 1900 1900 1900Lane Width (ft) 12 12 12 12 12 12Grade (%) 0% 0% 0%Storage Length (ft) 0 0 275 75Storage Lanes 1 1 1 1Taper Length (ft) 25 25Lane Util. Factor 1.00 1.00 1.00 1.00 1.00 1.00Ped Bike FactorFrt 0.850 0.850Flt Protected 0.950 0.950Satd. Flow (prot) 1583 1417 1667 1417 1583 1667Flt Permitted 0.950 0.950Satd. Flow (perm) 1583 1417 1667 1417 1583 1667Link Speed (mph) 30 30 30Link Distance (ft) 624 1463 921Travel Time (s) 14.2 33.3 20.9
Intersection SummaryArea Type: Other

Volume TIOGA INN TIA2: TIOGA RD (SR-120) & PROJECT SITE ACCESS 10/04/2018
EXISTING PLUS PROJECT CONDITIONS Synchro 10 ReportPM PEAK HOUR
Lane Group WBL WBR NBT NBR SBL SBTTraffic Volume (vph) 42 102 149 86 120 68Future Volume (vph) 42 102 149 86 120 68Confl. Peds. (#/hr)Confl. Bikes (#/hr)Peak Hour Factor 0.84 0.84 0.84 0.84 0.84 0.84Growth Factor 100% 100% 100% 100% 100% 100%Heavy Vehicles (%) 14% 14% 14% 14% 14% 14%Bus Blockages (#/hr) 0 0 0 0 0 0Parking (#/hr)Mid-Block Traffic (%) 0% 0% 0%Adj. Flow (vph) 50 121 177 102 143 81Shared Lane Traffic (%)Lane Group Flow (vph) 50 121 177 102 143 81
Intersection Summary
HCM 2010 TWSC TIOGA INN TIA2: TIOGA RD (SR-120) & PROJECT SITE ACCESS 10/04/2018
EXISTING PLUS PROJECT CONDITIONS Synchro 10 ReportPM PEAK HOUR
IntersectionInt Delay, s/veh 4.6
Movement WBL WBR NBT NBR SBL SBTLane ConfigurationsTraffic Vol, veh/h 42 102 149 86 120 68Future Vol, veh/h 42 102 149 86 120 68Conflicting Peds, #/hr 0 0 0 0 0 0Sign Control Stop Stop Free Free Free FreeRT Channelized - None - None - NoneStorage Length 0 0 - 275 75 -Veh in Median Storage, # 0 - 0 - - 0Grade, % 0 - 0 - - 0Peak Hour Factor 84 84 84 84 84 84Heavy Vehicles, % 14 14 14 14 14 14Mvmt Flow 50 121 177 102 143 81
Major/Minor Minor1 Major1 Major2Conflicting Flow All 544 177 0 0 279 0 Stage 1 177 - - - - - Stage 2 367 - - - - -Critical Hdwy 6.54 6.34 - - 4.24 -Critical Hdwy Stg 1 5.54 - - - - -Critical Hdwy Stg 2 5.54 - - - - -Follow-up Hdwy 3.626 3.426 - - 2.326 -Pot Cap-1 Maneuver 480 836 - - 1218 - Stage 1 826 - - - - - Stage 2 675 - - - - -Platoon blocked, % - - -Mov Cap-1 Maneuver 424 836 - - 1218 -Mov Cap-2 Maneuver 424 - - - - - Stage 1 729 - - - - - Stage 2 675 - - - - -
Approach WB NB SBHCM Control Delay, s 11.3 0 5.3HCM LOS B
Minor Lane/Major Mvmt NBT NBRWBLn1WBLn2 SBL SBTCapacity (veh/h) - - 424 836 1218 -HCM Lane V/C Ratio - - 0.118 0.145 0.117 -HCM Control Delay (s) - - 14.6 10 8.3 -HCM Lane LOS - - B B A -HCM 95th %tile Q(veh) - - 0.4 0.5 0.4 -

APPENDIX E Forecast Opening Year (2023) Without Project Conditions
LOS Analysis Worksheets

Lanes and Geometrics TIOGA INN TIA1: TIOGA RD (SR-120)/PUMICE RD & HIGHWAY 395 10/04/2018
OPENING YEAR WITHOUT PROJECT CONDITIONS Synchro 10 ReportAM PEAK HOUR
Lane Group EBL EBT EBR WBL WBT WBR NBL NBT NBR SBL SBT SBRLane ConfigurationsIdeal Flow (vphpl) 1900 1900 1900 1900 1900 1900 1900 1900 1900 1900 1900 1900Lane Width (ft) 12 12 12 12 12 12 12 12 12 12 12 12Grade (%) 0% 0% 0% 0%Storage Length (ft) 400 400 270 0 0 50 0 0Storage Lanes 1 1 1 0 0 1 0 0Taper Length (ft) 25 25 25 25Lane Util. Factor 1.00 0.95 1.00 1.00 0.95 0.95 1.00 1.00 1.00 1.00 1.00 1.00Ped Bike FactorFrt 0.850 0.999 0.850 0.865Flt Protected 0.950 0.950 0.950Satd. Flow (prot) 1583 3034 1417 1583 3031 0 0 1583 1417 0 1442 0Flt Permitted 0.950 0.950 0.950Satd. Flow (perm) 1583 3034 1417 1583 3031 0 0 1583 1417 0 1442 0Link Speed (mph) 30 30 30 30Link Distance (ft) 1553 1621 921 296Travel Time (s) 35.3 36.8 20.9 6.7
Intersection SummaryArea Type: Other
Volume TIOGA INN TIA1: TIOGA RD (SR-120)/PUMICE RD & HIGHWAY 395 10/04/2018
OPENING YEAR WITHOUT PROJECT CONDITIONS Synchro 10 ReportAM PEAK HOUR
Lane Group EBL EBT EBR WBL WBT WBR NBL NBT NBR SBL SBT SBRTraffic Volume (vph) 1 172 90 141 259 2 48 0 62 0 0 3Future Volume (vph) 1 172 90 141 259 2 48 0 62 0 0 3Confl. Peds. (#/hr)Confl. Bikes (#/hr)Peak Hour Factor 0.88 0.88 0.88 0.88 0.88 0.88 0.88 0.88 0.88 0.88 0.88 0.88Growth Factor 100% 100% 100% 100% 100% 100% 100% 100% 100% 100% 100% 100%Heavy Vehicles (%) 14% 19% 14% 14% 19% 14% 14% 14% 14% 14% 14% 14%Bus Blockages (#/hr) 0 0 0 0 0 0 0 0 0 0 0 0Parking (#/hr)Mid-Block Traffic (%) 0% 0% 0% 0%Adj. Flow (vph) 1 195 102 160 294 2 55 0 70 0 0 3Shared Lane Traffic (%)Lane Group Flow (vph) 1 195 102 160 296 0 0 55 70 0 3 0
Intersection Summary

HCM 2010 TWSC TIOGA INN TIA1: TIOGA RD (SR-120)/PUMICE RD & HIGHWAY 395 10/04/2018
OPENING YEAR WITHOUT PROJECT CONDITIONS Synchro 10 ReportAM PEAK HOUR
IntersectionInt Delay, s/veh 3
Movement EBL EBT EBR WBL WBT WBR NBL NBT NBR SBL SBT SBRLane ConfigurationsTraffic Vol, veh/h 1 172 90 141 259 2 48 0 62 0 0 3Future Vol, veh/h 1 172 90 141 259 2 48 0 62 0 0 3Conflicting Peds, #/hr 0 0 0 0 0 0 0 0 0 0 0 0Sign Control Free Free Free Free Free Free Stop Stop Stop Stop Stop StopRT Channelized - - Yield - - None - - Free - - NoneStorage Length 400 - 400 270 - - - - 50 - - -Veh in Median Storage, # - 0 - - 0 - - 0 - - 0 -Grade, % - 0 - - 0 - - 0 - - 0 -Peak Hour Factor 88 88 88 88 88 88 88 88 88 88 88 88Heavy Vehicles, % 14 19 14 14 19 14 14 14 14 14 14 14Mvmt Flow 1 195 102 160 294 2 55 0 70 0 0 3
Major/Minor Major1 Major2 Minor1 Minor2Conflicting Flow All 296 0 0 195 0 0 664 813 - 715 812 148 Stage 1 - - - - - - 197 197 - 615 615 - Stage 2 - - - - - - 467 616 - 100 197 -Critical Hdwy 4.38 - - 4.38 - - 7.78 6.78 - 7.78 6.78 7.18Critical Hdwy Stg 1 - - - - - - 6.78 5.78 - 6.78 5.78 -Critical Hdwy Stg 2 - - - - - - 6.78 5.78 - 6.78 5.78 -Follow-up Hdwy 2.34 - - 2.34 - - 3.64 4.14 - 3.64 4.14 3.44Pot Cap-1 Maneuver 1180 - - 1292 - - 323 290 0 296 290 835 Stage 1 - - - - - - 753 708 0 417 452 - Stage 2 - - - - - - 515 451 0 861 708 -Platoon blocked, % - - - -Mov Cap-1 Maneuver 1180 - - 1292 - - 291 254 - 268 254 835Mov Cap-2 Maneuver - - - - - - 291 254 - 268 254 - Stage 1 - - - - - - 752 707 - 417 396 - Stage 2 - - - - - - 449 395 - 860 707 -
Approach EB WB NB SBHCM Control Delay, s 0 2.9 20.2 9.3HCM LOS C A
Minor Lane/Major Mvmt NBLn1 NBLn2 EBL EBT EBR WBL WBT WBR SBLn1Capacity (veh/h) 291 - 1180 - - 1292 - - 835HCM Lane V/C Ratio 0.187 - 0.001 - - 0.124 - - 0.004HCM Control Delay (s) 20.2 0 8.1 - - 8.2 - - 9.3HCM Lane LOS C A A - - A - - AHCM 95th %tile Q(veh) 0.7 - 0 - - 0.4 - - 0
Lanes and Geometrics TIOGA INN TIA2: TIOGA RD (SR-120) & PROJECT SITE ACCESS 10/04/2018
OPENING YEAR WITHOUT PROJECT CONDITIONS Synchro 10 ReportAM PEAK HOUR
Lane Group WBL WBR NBT NBR SBL SBTLane ConfigurationsIdeal Flow (vphpl) 1900 1900 1900 1900 1900 1900Lane Width (ft) 12 12 12 12 12 12Grade (%) 0% 0% 0%Storage Length (ft) 0 0 275 75Storage Lanes 1 1 1 1Taper Length (ft) 25 25Lane Util. Factor 1.00 1.00 1.00 1.00 1.00 1.00Ped Bike FactorFrt 0.850 0.850Flt Protected 0.950 0.950Satd. Flow (prot) 1583 1417 1667 1417 1583 1667Flt Permitted 0.950 0.950Satd. Flow (perm) 1583 1417 1667 1417 1583 1667Link Speed (mph) 30 30 30Link Distance (ft) 624 1463 921Travel Time (s) 14.2 33.3 20.9
Intersection SummaryArea Type: Other

Volume TIOGA INN TIA2: TIOGA RD (SR-120) & PROJECT SITE ACCESS 10/04/2018
OPENING YEAR WITHOUT PROJECT CONDITIONS Synchro 10 ReportAM PEAK HOUR
Lane Group WBL WBR NBT NBR SBL SBTTraffic Volume (vph) 74 102 63 64 135 205Future Volume (vph) 74 102 63 64 135 205Confl. Peds. (#/hr)Confl. Bikes (#/hr)Peak Hour Factor 0.90 0.90 0.90 0.90 0.90 0.90Growth Factor 100% 100% 100% 100% 100% 100%Heavy Vehicles (%) 14% 14% 14% 14% 14% 14%Bus Blockages (#/hr) 0 0 0 0 0 0Parking (#/hr)Mid-Block Traffic (%) 0% 0% 0%Adj. Flow (vph) 82 113 70 71 150 228Shared Lane Traffic (%)Lane Group Flow (vph) 82 113 70 71 150 228
Intersection Summary
HCM 2010 TWSC TIOGA INN TIA2: TIOGA RD (SR-120) & PROJECT SITE ACCESS 10/04/2018
OPENING YEAR WITHOUT PROJECT CONDITIONS Synchro 10 ReportAM PEAK HOUR
IntersectionInt Delay, s/veh 5.1
Movement WBL WBR NBT NBR SBL SBTLane ConfigurationsTraffic Vol, veh/h 74 102 63 64 135 205Future Vol, veh/h 74 102 63 64 135 205Conflicting Peds, #/hr 0 0 0 0 0 0Sign Control Stop Stop Free Free Free FreeRT Channelized - None - None - NoneStorage Length 0 0 - 275 75 -Veh in Median Storage, # 0 - 0 - - 0Grade, % 0 - 0 - - 0Peak Hour Factor 90 90 90 90 90 90Heavy Vehicles, % 14 14 14 14 14 14Mvmt Flow 82 113 70 71 150 228
Major/Minor Minor1 Major1 Major2Conflicting Flow All 598 70 0 0 141 0 Stage 1 70 - - - - - Stage 2 528 - - - - -Critical Hdwy 6.54 6.34 - - 4.24 -Critical Hdwy Stg 1 5.54 - - - - -Critical Hdwy Stg 2 5.54 - - - - -Follow-up Hdwy 3.626 3.426 - - 2.326 -Pot Cap-1 Maneuver 446 960 - - 1372 - Stage 1 923 - - - - - Stage 2 568 - - - - -Platoon blocked, % - - -Mov Cap-1 Maneuver 397 960 - - 1372 -Mov Cap-2 Maneuver 397 - - - - - Stage 1 822 - - - - - Stage 2 568 - - - - -
Approach WB NB SBHCM Control Delay, s 12.3 0 3.2HCM LOS B
Minor Lane/Major Mvmt NBT NBRWBLn1WBLn2 SBL SBTCapacity (veh/h) - - 397 960 1372 -HCM Lane V/C Ratio - - 0.207 0.118 0.109 -HCM Control Delay (s) - - 16.4 9.3 7.9 -HCM Lane LOS - - C A A -HCM 95th %tile Q(veh) - - 0.8 0.4 0.4 -

Lanes and Geometrics TIOGA INN TIA1: TIOGA RD (SR-120)/PUMICE RD & HIGHWAY 395 10/04/2018
OPENING YEAR WITHOUT PROJECT CONDITIONS Synchro 10 ReportMID-DAY PEAK HOUR
Lane Group EBL EBT EBR WBL WBT WBR NBL NBT NBR SBL SBT SBRLane ConfigurationsIdeal Flow (vphpl) 1900 1900 1900 1900 1900 1900 1900 1900 1900 1900 1900 1900Lane Width (ft) 12 12 12 12 12 12 12 12 12 12 12 12Grade (%) 0% 0% 0% 0%Storage Length (ft) 400 400 270 0 0 50 0 0Storage Lanes 1 1 1 0 0 1 0 0Taper Length (ft) 25 25 25 25Lane Util. Factor 1.00 0.95 1.00 1.00 0.95 0.95 1.00 1.00 1.00 1.00 1.00 1.00Ped Bike FactorFrt 0.850 0.850 0.899Flt Protected 0.950 0.950 0.950 0.988Satd. Flow (prot) 1583 3034 1417 1583 3034 0 0 1583 1417 0 1480 0Flt Permitted 0.950 0.950 0.950 0.988Satd. Flow (perm) 1583 3034 1417 1583 3034 0 0 1583 1417 0 1480 0Link Speed (mph) 30 30 30 30Link Distance (ft) 1553 1621 921 296Travel Time (s) 35.3 36.8 20.9 6.7
Intersection SummaryArea Type: Other
Volume TIOGA INN TIA1: TIOGA RD (SR-120)/PUMICE RD & HIGHWAY 395 10/04/2018
OPENING YEAR WITHOUT PROJECT CONDITIONS Synchro 10 ReportMID-DAY PEAK HOUR
Lane Group EBL EBT EBR WBL WBT WBR NBL NBT NBR SBL SBT SBRTraffic Volume (vph) 6 300 76 142 274 0 81 0 86 2 0 7Future Volume (vph) 6 300 76 142 274 0 81 0 86 2 0 7Confl. Peds. (#/hr)Confl. Bikes (#/hr)Peak Hour Factor 0.80 0.80 0.80 0.80 0.80 0.80 0.80 0.80 0.80 0.80 0.80 0.80Growth Factor 100% 100% 100% 100% 100% 100% 100% 100% 100% 100% 100% 100%Heavy Vehicles (%) 14% 19% 14% 14% 19% 14% 14% 14% 14% 14% 14% 14%Bus Blockages (#/hr) 0 0 0 0 0 0 0 0 0 0 0 0Parking (#/hr)Mid-Block Traffic (%) 0% 0% 0% 0%Adj. Flow (vph) 8 375 95 178 343 0 101 0 108 3 0 9Shared Lane Traffic (%)Lane Group Flow (vph) 8 375 95 178 343 0 0 101 108 0 12 0
Intersection Summary

HCM 2010 TWSC TIOGA INN TIA1: TIOGA RD (SR-120)/PUMICE RD & HIGHWAY 395 10/04/2018
OPENING YEAR WITHOUT PROJECT CONDITIONS Synchro 10 ReportMID-DAY PEAK HOUR
IntersectionInt Delay, s/veh 6
Movement EBL EBT EBR WBL WBT WBR NBL NBT NBR SBL SBT SBRLane ConfigurationsTraffic Vol, veh/h 6 300 76 142 274 0 81 0 86 2 0 7Future Vol, veh/h 6 300 76 142 274 0 81 0 86 2 0 7Conflicting Peds, #/hr 0 0 0 0 0 0 0 0 0 0 0 0Sign Control Free Free Free Free Free Free Stop Stop Stop Stop Stop StopRT Channelized - - Yield - - None - - Free - - NoneStorage Length 400 - 400 270 - - - - 50 - - -Veh in Median Storage, # - 0 - - 0 - - 0 - - 0 -Grade, % - 0 - - 0 - - 0 - - 0 -Peak Hour Factor 80 80 80 80 80 80 80 80 80 80 80 80Heavy Vehicles, % 14 19 14 14 19 14 14 14 14 14 14 14Mvmt Flow 8 375 95 178 343 0 101 0 108 3 0 9
Major/Minor Major1 Major2 Minor1 Minor2Conflicting Flow All 343 0 0 375 0 0 919 1090 - 903 1090 172 Stage 1 - - - - - - 391 391 - 699 699 - Stage 2 - - - - - - 528 699 - 204 391 -Critical Hdwy 4.38 - - 4.38 - - 7.78 6.78 - 7.78 6.78 7.18Critical Hdwy Stg 1 - - - - - - 6.78 5.78 - 6.78 5.78 -Critical Hdwy Stg 2 - - - - - - 6.78 5.78 - 6.78 5.78 -Follow-up Hdwy 2.34 - - 2.34 - - 3.64 4.14 - 3.64 4.14 3.44Pot Cap-1 Maneuver 1131 - - 1098 - - 208 196 0 214 196 805 Stage 1 - - - - - - 573 576 0 370 412 - Stage 2 - - - - - - 472 412 0 745 576 -Platoon blocked, % - - - -Mov Cap-1 Maneuver 1131 - - 1098 - - 179 163 - 186 163 805Mov Cap-2 Maneuver - - - - - - 179 163 - 186 163 - Stage 1 - - - - - - 569 572 - 367 345 - Stage 2 - - - - - - 391 345 - 740 572 -
Approach EB WB NB SBHCM Control Delay, s 0.1 3 48.5 13HCM LOS E B
Minor Lane/Major Mvmt NBLn1 NBLn2 EBL EBT EBR WBL WBT WBR SBLn1Capacity (veh/h) 179 - 1131 - - 1098 - - 463HCM Lane V/C Ratio 0.566 - 0.007 - - 0.162 - - 0.024HCM Control Delay (s) 48.5 0 8.2 - - 8.9 - - 13HCM Lane LOS E A A - - A - - BHCM 95th %tile Q(veh) 3 - 0 - - 0.6 - - 0.1
Lanes and Geometrics TIOGA INN TIA2: TIOGA RD (SR-120) & PROJECT SITE ACCESS 10/04/2018
OPENING YEAR WITHOUT PROJECT CONDITIONS Synchro 10 ReportMID-DAY PEAK HOUR
Lane Group WBL WBR NBT NBR SBL SBTLane ConfigurationsIdeal Flow (vphpl) 1900 1900 1900 1900 1900 1900Lane Width (ft) 12 12 12 12 12 12Grade (%) 0% 0% 0%Storage Length (ft) 0 0 275 75Storage Lanes 1 1 1 1Taper Length (ft) 25 25Lane Util. Factor 1.00 1.00 1.00 1.00 1.00 1.00Ped Bike FactorFrt 0.850 0.850Flt Protected 0.950 0.950Satd. Flow (prot) 1583 1417 1667 1417 1583 1667Flt Permitted 0.950 0.950Satd. Flow (perm) 1583 1417 1667 1417 1583 1667Link Speed (mph) 30 30 30Link Distance (ft) 624 1463 921Travel Time (s) 14.2 33.3 20.9
Intersection SummaryArea Type: Other

Volume TIOGA INN TIA2: TIOGA RD (SR-120) & PROJECT SITE ACCESS 10/04/2018
OPENING YEAR WITHOUT PROJECT CONDITIONS Synchro 10 ReportMID-DAY PEAK HOUR
Lane Group WBL WBR NBT NBR SBL SBTTraffic Volume (vph) 86 137 107 103 171 100Future Volume (vph) 86 137 107 103 171 100Confl. Peds. (#/hr)Confl. Bikes (#/hr)Peak Hour Factor 0.80 0.80 0.80 0.80 0.80 0.80Growth Factor 100% 100% 100% 100% 100% 100%Heavy Vehicles (%) 14% 14% 14% 14% 14% 14%Bus Blockages (#/hr) 0 0 0 0 0 0Parking (#/hr)Mid-Block Traffic (%) 0% 0% 0%Adj. Flow (vph) 108 171 134 129 214 125Shared Lane Traffic (%)Lane Group Flow (vph) 108 171 134 129 214 125
Intersection Summary
HCM 2010 TWSC TIOGA INN TIA2: TIOGA RD (SR-120) & PROJECT SITE ACCESS 10/04/2018
OPENING YEAR WITHOUT PROJECT CONDITIONS Synchro 10 ReportMID-DAY PEAK HOUR
IntersectionInt Delay, s/veh 6.6
Movement WBL WBR NBT NBR SBL SBTLane ConfigurationsTraffic Vol, veh/h 86 137 107 103 171 100Future Vol, veh/h 86 137 107 103 171 100Conflicting Peds, #/hr 0 0 0 0 0 0Sign Control Stop Stop Free Free Free FreeRT Channelized - None - None - NoneStorage Length 0 0 - 275 75 -Veh in Median Storage, # 0 - 0 - - 0Grade, % 0 - 0 - - 0Peak Hour Factor 80 80 80 80 80 80Heavy Vehicles, % 14 14 14 14 14 14Mvmt Flow 108 171 134 129 214 125
Major/Minor Minor1 Major1 Major2Conflicting Flow All 687 134 0 0 263 0 Stage 1 134 - - - - - Stage 2 553 - - - - -Critical Hdwy 6.54 6.34 - - 4.24 -Critical Hdwy Stg 1 5.54 - - - - -Critical Hdwy Stg 2 5.54 - - - - -Follow-up Hdwy 3.626 3.426 - - 2.326 -Pot Cap-1 Maneuver 395 884 - - 1235 - Stage 1 864 - - - - - Stage 2 553 - - - - -Platoon blocked, % - - -Mov Cap-1 Maneuver 327 884 - - 1235 -Mov Cap-2 Maneuver 327 - - - - - Stage 1 715 - - - - - Stage 2 553 - - - - -
Approach WB NB SBHCM Control Delay, s 14.4 0 5.4HCM LOS B
Minor Lane/Major Mvmt NBT NBRWBLn1WBLn2 SBL SBTCapacity (veh/h) - - 327 884 1235 -HCM Lane V/C Ratio - - 0.329 0.194 0.173 -HCM Control Delay (s) - - 21.3 10 8.5 -HCM Lane LOS - - C B A -HCM 95th %tile Q(veh) - - 1.4 0.7 0.6 -

Lanes and Geometrics TIOGA INN TIA1: TIOGA RD (SR-120)/PUMICE RD & HIGHWAY 395 10/04/2018
OPENING YEAR WITHOUT PROJECT CONDITIONS Synchro 10 ReportPM PEAK HOUR
Lane Group EBL EBT EBR WBL WBT WBR NBL NBT NBR SBL SBT SBRLane ConfigurationsIdeal Flow (vphpl) 1900 1900 1900 1900 1900 1900 1900 1900 1900 1900 1900 1900Lane Width (ft) 12 12 12 12 12 12 12 12 12 12 12 12Grade (%) 0% 0% 0% 0%Storage Length (ft) 400 400 270 0 0 50 0 0Storage Lanes 1 1 1 0 0 1 0 0Taper Length (ft) 25 25 25 25Lane Util. Factor 1.00 0.95 1.00 1.00 0.95 0.95 1.00 1.00 1.00 1.00 1.00 1.00Ped Bike FactorFrt 0.850 0.998 0.850 0.955Flt Protected 0.950 0.950 0.953 0.976Satd. Flow (prot) 1583 3034 1417 1583 3029 0 0 1588 1417 0 1553 0Flt Permitted 0.950 0.950 0.953 0.976Satd. Flow (perm) 1583 3034 1417 1583 3029 0 0 1588 1417 0 1553 0Link Speed (mph) 30 30 30 30Link Distance (ft) 1553 1621 921 296Travel Time (s) 35.3 36.8 20.9 6.7
Intersection SummaryArea Type: Other
Volume TIOGA INN TIA1: TIOGA RD (SR-120)/PUMICE RD & HIGHWAY 395 10/04/2018
OPENING YEAR WITHOUT PROJECT CONDITIONS Synchro 10 ReportPM PEAK HOUR
Lane Group EBL EBT EBR WBL WBT WBR NBL NBT NBR SBL SBT SBRTraffic Volume (vph) 4 299 72 104 206 3 75 1 157 3 1 2Future Volume (vph) 4 299 72 104 206 3 75 1 157 3 1 2Confl. Peds. (#/hr)Confl. Bikes (#/hr)Peak Hour Factor 0.91 0.91 0.91 0.91 0.91 0.91 0.91 0.91 0.91 0.91 0.91 0.91Growth Factor 100% 100% 100% 100% 100% 100% 100% 100% 100% 100% 100% 100%Heavy Vehicles (%) 14% 19% 14% 14% 19% 14% 14% 14% 14% 14% 14% 14%Bus Blockages (#/hr) 0 0 0 0 0 0 0 0 0 0 0 0Parking (#/hr)Mid-Block Traffic (%) 0% 0% 0% 0%Adj. Flow (vph) 4 329 79 114 226 3 82 1 173 3 1 2Shared Lane Traffic (%)Lane Group Flow (vph) 4 329 79 114 229 0 0 83 173 0 6 0
Intersection Summary

HCM 2010 TWSC TIOGA INN TIA1: TIOGA RD (SR-120)/PUMICE RD & HIGHWAY 395 10/04/2018
OPENING YEAR WITHOUT PROJECT CONDITIONS Synchro 10 ReportPM PEAK HOUR
IntersectionInt Delay, s/veh 3.5
Movement EBL EBT EBR WBL WBT WBR NBL NBT NBR SBL SBT SBRLane ConfigurationsTraffic Vol, veh/h 4 299 72 104 206 3 75 1 157 3 1 2Future Vol, veh/h 4 299 72 104 206 3 75 1 157 3 1 2Conflicting Peds, #/hr 0 0 0 0 0 0 0 0 0 0 0 0Sign Control Free Free Free Free Free Free Stop Stop Stop Stop Stop StopRT Channelized - - Yield - - None - - Free - - NoneStorage Length 400 - 400 270 - - - - 50 - - -Veh in Median Storage, # - 0 - - 0 - - 0 - - 0 -Grade, % - 0 - - 0 - - 0 - - 0 -Peak Hour Factor 91 91 91 91 91 91 91 91 91 91 91 91Heavy Vehicles, % 14 19 14 14 19 14 14 14 14 14 14 14Mvmt Flow 4 329 79 114 226 3 82 1 173 3 1 2
Major/Minor Major1 Major2 Minor1 Minor2Conflicting Flow All 229 0 0 329 0 0 679 794 - 629 793 115 Stage 1 - - - - - - 337 337 - 456 456 - Stage 2 - - - - - - 342 457 - 173 337 -Critical Hdwy 4.38 - - 4.38 - - 7.78 6.78 - 7.78 6.78 7.18Critical Hdwy Stg 1 - - - - - - 6.78 5.78 - 6.78 5.78 -Critical Hdwy Stg 2 - - - - - - 6.78 5.78 - 6.78 5.78 -Follow-up Hdwy 2.34 - - 2.34 - - 3.64 4.14 - 3.64 4.14 3.44Pot Cap-1 Maneuver 1253 - - 1145 - - 315 297 0 343 298 879 Stage 1 - - - - - - 619 611 0 523 537 - Stage 2 - - - - - - 614 537 0 778 611 -Platoon blocked, % - - - -Mov Cap-1 Maneuver 1253 - - 1145 - - 289 266 - 315 267 879Mov Cap-2 Maneuver - - - - - - 289 266 - 315 267 - Stage 1 - - - - - - 617 609 - 521 483 - Stage 2 - - - - - - 550 483 - 774 609 -
Approach EB WB NB SBHCM Control Delay, s 0.1 2.8 22.4 14.5HCM LOS C B
Minor Lane/Major Mvmt NBLn1 NBLn2 EBL EBT EBR WBL WBT WBR SBLn1Capacity (veh/h) 289 - 1253 - - 1145 - - 386HCM Lane V/C Ratio 0.289 - 0.004 - - 0.1 - - 0.017HCM Control Delay (s) 22.4 0 7.9 - - 8.5 - - 14.5HCM Lane LOS C A A - - A - - BHCM 95th %tile Q(veh) 1.2 - 0 - - 0.3 - - 0.1
Lanes and Geometrics TIOGA INN TIA2: TIOGA RD (SR-120) & PROJECT SITE ACCESS 10/04/2018
OPENING YEAR WITHOUT PROJECT CONDITIONS Synchro 10 ReportPM PEAK HOUR
Lane Group WBL WBR NBT NBR SBL SBTLane ConfigurationsIdeal Flow (vphpl) 1900 1900 1900 1900 1900 1900Lane Width (ft) 12 12 12 12 12 12Grade (%) 0% 0% 0%Storage Length (ft) 0 0 275 75Storage Lanes 1 1 1 1Taper Length (ft) 25 25Lane Util. Factor 1.00 1.00 1.00 1.00 1.00 1.00Ped Bike FactorFrt 0.850 0.850Flt Protected 0.950 0.950Satd. Flow (prot) 1583 1417 1667 1417 1583 1667Flt Permitted 0.950 0.950Satd. Flow (perm) 1583 1417 1667 1417 1583 1667Link Speed (mph) 30 30 30Link Distance (ft) 624 1463 921Travel Time (s) 14.2 33.3 20.9
Intersection SummaryArea Type: Other

Volume TIOGA INN TIA2: TIOGA RD (SR-120) & PROJECT SITE ACCESS 10/04/2018
OPENING YEAR WITHOUT PROJECT CONDITIONS Synchro 10 ReportPM PEAK HOUR
Lane Group WBL WBR NBT NBR SBL SBTTraffic Volume (vph) 63 127 164 116 136 75Future Volume (vph) 63 127 164 116 136 75Confl. Peds. (#/hr)Confl. Bikes (#/hr)Peak Hour Factor 0.84 0.84 0.84 0.84 0.84 0.84Growth Factor 100% 100% 100% 100% 100% 100%Heavy Vehicles (%) 14% 14% 14% 14% 14% 14%Bus Blockages (#/hr) 0 0 0 0 0 0Parking (#/hr)Mid-Block Traffic (%) 0% 0% 0%Adj. Flow (vph) 75 151 195 138 162 89Shared Lane Traffic (%)Lane Group Flow (vph) 75 151 195 138 162 89
Intersection Summary
HCM 2010 TWSC TIOGA INN TIA2: TIOGA RD (SR-120) & PROJECT SITE ACCESS 10/04/2018
OPENING YEAR WITHOUT PROJECT CONDITIONS Synchro 10 ReportPM PEAK HOUR
IntersectionInt Delay, s/veh 5.2
Movement WBL WBR NBT NBR SBL SBTLane ConfigurationsTraffic Vol, veh/h 63 127 164 116 136 75Future Vol, veh/h 63 127 164 116 136 75Conflicting Peds, #/hr 0 0 0 0 0 0Sign Control Stop Stop Free Free Free FreeRT Channelized - None - None - NoneStorage Length 0 0 - 275 75 -Veh in Median Storage, # 0 - 0 - - 0Grade, % 0 - 0 - - 0Peak Hour Factor 84 84 84 84 84 84Heavy Vehicles, % 14 14 14 14 14 14Mvmt Flow 75 151 195 138 162 89
Major/Minor Minor1 Major1 Major2Conflicting Flow All 608 195 0 0 333 0 Stage 1 195 - - - - - Stage 2 413 - - - - -Critical Hdwy 6.54 6.34 - - 4.24 -Critical Hdwy Stg 1 5.54 - - - - -Critical Hdwy Stg 2 5.54 - - - - -Follow-up Hdwy 3.626 3.426 - - 2.326 -Pot Cap-1 Maneuver 440 817 - - 1162 - Stage 1 810 - - - - - Stage 2 643 - - - - -Platoon blocked, % - - -Mov Cap-1 Maneuver 379 817 - - 1162 -Mov Cap-2 Maneuver 379 - - - - - Stage 1 697 - - - - - Stage 2 643 - - - - -
Approach WB NB SBHCM Control Delay, s 12.5 0 5.5HCM LOS B
Minor Lane/Major Mvmt NBT NBRWBLn1WBLn2 SBL SBTCapacity (veh/h) - - 379 817 1162 -HCM Lane V/C Ratio - - 0.198 0.185 0.139 -HCM Control Delay (s) - - 16.8 10.4 8.6 -HCM Lane LOS - - C B A -HCM 95th %tile Q(veh) - - 0.7 0.7 0.5 -

APPENDIX F Forecast Opening Year (2023) With Project Conditions LOS
Analysis Worksheets

Lanes and Geometrics TIOGA INN TIA1: TIOGA RD (SR-120)/PUMICE RD & HIGHWAY 395 10/04/2018
OPENING YEAR WITH PROJECT CONDITIONS Synchro 10 ReportAM PEAK HOUR
Lane Group EBL EBT EBR WBL WBT WBR NBL NBT NBR SBL SBT SBRLane ConfigurationsIdeal Flow (vphpl) 1900 1900 1900 1900 1900 1900 1900 1900 1900 1900 1900 1900Lane Width (ft) 12 12 12 12 12 12 12 12 12 12 12 12Grade (%) 0% 0% 0% 0%Storage Length (ft) 400 400 270 0 0 50 0 0Storage Lanes 1 1 1 0 0 1 0 0Taper Length (ft) 25 25 25 25Lane Util. Factor 1.00 0.95 1.00 1.00 0.95 0.95 1.00 1.00 1.00 1.00 1.00 1.00Ped Bike FactorFrt 0.850 0.999 0.850 0.865Flt Protected 0.950 0.950 0.950Satd. Flow (prot) 1583 3034 1417 1583 3031 0 0 1583 1417 0 1442 0Flt Permitted 0.950 0.950 0.950Satd. Flow (perm) 1583 3034 1417 1583 3031 0 0 1583 1417 0 1442 0Link Speed (mph) 30 30 30 30Link Distance (ft) 1553 1621 921 296Travel Time (s) 35.3 36.8 20.9 6.7
Intersection SummaryArea Type: Other
Volume TIOGA INN TIA1: TIOGA RD (SR-120)/PUMICE RD & HIGHWAY 395 10/04/2018
OPENING YEAR WITH PROJECT CONDITIONS Synchro 10 ReportAM PEAK HOUR
Lane Group EBL EBT EBR WBL WBT WBR NBL NBT NBR SBL SBT SBRTraffic Volume (vph) 1 172 97 155 259 2 67 0 102 0 0 3Future Volume (vph) 1 172 97 155 259 2 67 0 102 0 0 3Confl. Peds. (#/hr)Confl. Bikes (#/hr)Peak Hour Factor 0.88 0.88 0.88 0.88 0.88 0.88 0.88 0.88 0.88 0.88 0.88 0.88Growth Factor 100% 100% 100% 100% 100% 100% 100% 100% 100% 100% 100% 100%Heavy Vehicles (%) 14% 19% 14% 14% 19% 14% 14% 14% 14% 14% 14% 14%Bus Blockages (#/hr) 0 0 0 0 0 0 0 0 0 0 0 0Parking (#/hr)Mid-Block Traffic (%) 0% 0% 0% 0%Adj. Flow (vph) 1 195 110 176 294 2 76 0 116 0 0 3Shared Lane Traffic (%)Lane Group Flow (vph) 1 195 110 176 296 0 0 76 116 0 3 0
Intersection Summary
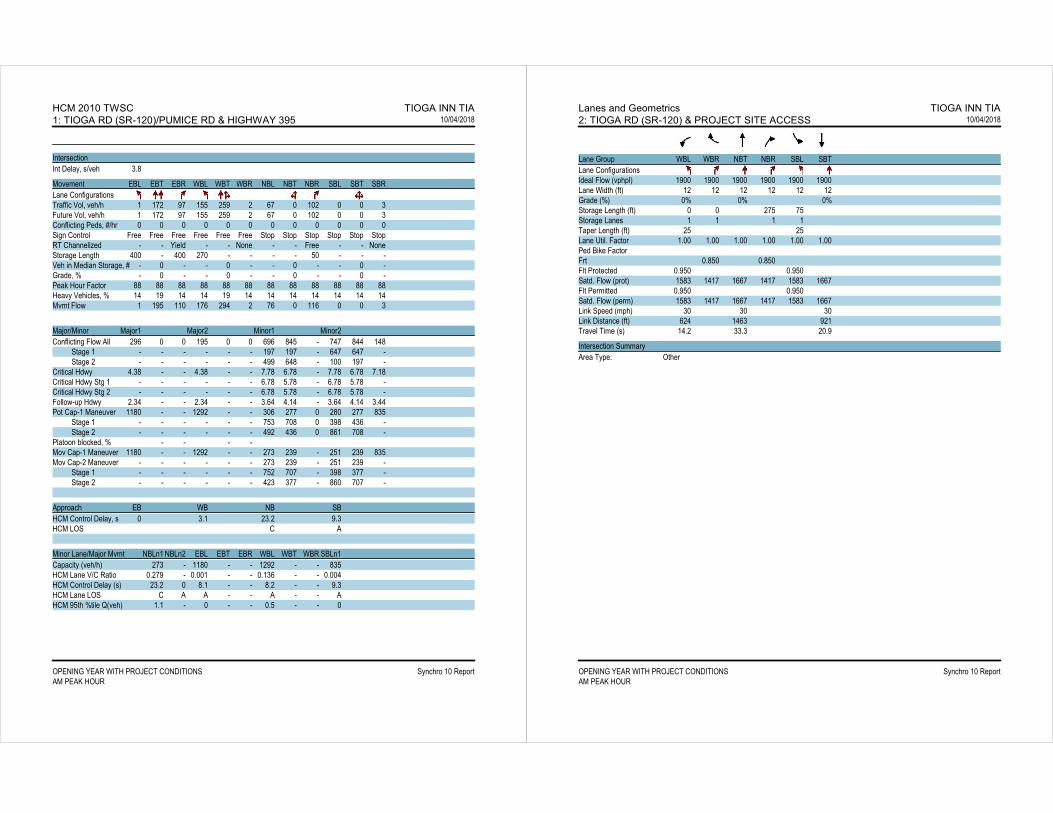
HCM 2010 TWSC TIOGA INN TIA1: TIOGA RD (SR-120)/PUMICE RD & HIGHWAY 395 10/04/2018
OPENING YEAR WITH PROJECT CONDITIONS Synchro 10 ReportAM PEAK HOUR
IntersectionInt Delay, s/veh 3.8
Movement EBL EBT EBR WBL WBT WBR NBL NBT NBR SBL SBT SBRLane ConfigurationsTraffic Vol, veh/h 1 172 97 155 259 2 67 0 102 0 0 3Future Vol, veh/h 1 172 97 155 259 2 67 0 102 0 0 3Conflicting Peds, #/hr 0 0 0 0 0 0 0 0 0 0 0 0Sign Control Free Free Free Free Free Free Stop Stop Stop Stop Stop StopRT Channelized - - Yield - - None - - Free - - NoneStorage Length 400 - 400 270 - - - - 50 - - -Veh in Median Storage, # - 0 - - 0 - - 0 - - 0 -Grade, % - 0 - - 0 - - 0 - - 0 -Peak Hour Factor 88 88 88 88 88 88 88 88 88 88 88 88Heavy Vehicles, % 14 19 14 14 19 14 14 14 14 14 14 14Mvmt Flow 1 195 110 176 294 2 76 0 116 0 0 3
Major/Minor Major1 Major2 Minor1 Minor2Conflicting Flow All 296 0 0 195 0 0 696 845 - 747 844 148 Stage 1 - - - - - - 197 197 - 647 647 - Stage 2 - - - - - - 499 648 - 100 197 -Critical Hdwy 4.38 - - 4.38 - - 7.78 6.78 - 7.78 6.78 7.18Critical Hdwy Stg 1 - - - - - - 6.78 5.78 - 6.78 5.78 -Critical Hdwy Stg 2 - - - - - - 6.78 5.78 - 6.78 5.78 -Follow-up Hdwy 2.34 - - 2.34 - - 3.64 4.14 - 3.64 4.14 3.44Pot Cap-1 Maneuver 1180 - - 1292 - - 306 277 0 280 277 835 Stage 1 - - - - - - 753 708 0 398 436 - Stage 2 - - - - - - 492 436 0 861 708 -Platoon blocked, % - - - -Mov Cap-1 Maneuver 1180 - - 1292 - - 273 239 - 251 239 835Mov Cap-2 Maneuver - - - - - - 273 239 - 251 239 - Stage 1 - - - - - - 752 707 - 398 377 - Stage 2 - - - - - - 423 377 - 860 707 -
Approach EB WB NB SBHCM Control Delay, s 0 3.1 23.2 9.3HCM LOS C A
Minor Lane/Major Mvmt NBLn1 NBLn2 EBL EBT EBR WBL WBT WBR SBLn1Capacity (veh/h) 273 - 1180 - - 1292 - - 835HCM Lane V/C Ratio 0.279 - 0.001 - - 0.136 - - 0.004HCM Control Delay (s) 23.2 0 8.1 - - 8.2 - - 9.3HCM Lane LOS C A A - - A - - AHCM 95th %tile Q(veh) 1.1 - 0 - - 0.5 - - 0
Lanes and Geometrics TIOGA INN TIA2: TIOGA RD (SR-120) & PROJECT SITE ACCESS 10/04/2018
OPENING YEAR WITH PROJECT CONDITIONS Synchro 10 ReportAM PEAK HOUR
Lane Group WBL WBR NBT NBR SBL SBTLane ConfigurationsIdeal Flow (vphpl) 1900 1900 1900 1900 1900 1900Lane Width (ft) 12 12 12 12 12 12Grade (%) 0% 0% 0%Storage Length (ft) 0 0 275 75Storage Lanes 1 1 1 1Taper Length (ft) 25 25Lane Util. Factor 1.00 1.00 1.00 1.00 1.00 1.00Ped Bike FactorFrt 0.850 0.850Flt Protected 0.950 0.950Satd. Flow (prot) 1583 1417 1667 1417 1583 1667Flt Permitted 0.950 0.950Satd. Flow (perm) 1583 1417 1667 1417 1583 1667Link Speed (mph) 30 30 30Link Distance (ft) 624 1463 921Travel Time (s) 14.2 33.3 20.9
Intersection SummaryArea Type: Other

Volume TIOGA INN TIA2: TIOGA RD (SR-120) & PROJECT SITE ACCESS 10/04/2018
OPENING YEAR WITH PROJECT CONDITIONS Synchro 10 ReportAM PEAK HOUR
Lane Group WBL WBR NBT NBR SBL SBTTraffic Volume (vph) 83 161 63 71 155 205Future Volume (vph) 83 161 63 71 155 205Confl. Peds. (#/hr)Confl. Bikes (#/hr)Peak Hour Factor 0.90 0.90 0.90 0.90 0.90 0.90Growth Factor 100% 100% 100% 100% 100% 100%Heavy Vehicles (%) 14% 14% 14% 14% 14% 14%Bus Blockages (#/hr) 0 0 0 0 0 0Parking (#/hr)Mid-Block Traffic (%) 0% 0% 0%Adj. Flow (vph) 92 179 70 79 172 228Shared Lane Traffic (%)Lane Group Flow (vph) 92 179 70 79 172 228
Intersection Summary
HCM 2010 TWSC TIOGA INN TIA2: TIOGA RD (SR-120) & PROJECT SITE ACCESS 10/04/2018
OPENING YEAR WITH PROJECT CONDITIONS Synchro 10 ReportAM PEAK HOUR
IntersectionInt Delay, s/veh 5.8
Movement WBL WBR NBT NBR SBL SBTLane ConfigurationsTraffic Vol, veh/h 83 161 63 71 155 205Future Vol, veh/h 83 161 63 71 155 205Conflicting Peds, #/hr 0 0 0 0 0 0Sign Control Stop Stop Free Free Free FreeRT Channelized - None - None - NoneStorage Length 0 0 - 275 75 -Veh in Median Storage, # 0 - 0 - - 0Grade, % 0 - 0 - - 0Peak Hour Factor 90 90 90 90 90 90Heavy Vehicles, % 14 14 14 14 14 14Mvmt Flow 92 179 70 79 172 228
Major/Minor Minor1 Major1 Major2Conflicting Flow All 642 70 0 0 149 0 Stage 1 70 - - - - - Stage 2 572 - - - - -Critical Hdwy 6.54 6.34 - - 4.24 -Critical Hdwy Stg 1 5.54 - - - - -Critical Hdwy Stg 2 5.54 - - - - -Follow-up Hdwy 3.626 3.426 - - 2.326 -Pot Cap-1 Maneuver 420 960 - - 1362 - Stage 1 923 - - - - - Stage 2 542 - - - - -Platoon blocked, % - - -Mov Cap-1 Maneuver 367 960 - - 1362 -Mov Cap-2 Maneuver 367 - - - - - Stage 1 807 - - - - - Stage 2 542 - - - - -
Approach WB NB SBHCM Control Delay, s 12.5 0 3.5HCM LOS B
Minor Lane/Major Mvmt NBT NBRWBLn1WBLn2 SBL SBTCapacity (veh/h) - - 367 960 1362 -HCM Lane V/C Ratio - - 0.251 0.186 0.126 -HCM Control Delay (s) - - 18.1 9.6 8 -HCM Lane LOS - - C A A -HCM 95th %tile Q(veh) - - 1 0.7 0.4 -

Lanes and Geometrics TIOGA INN TIA1: TIOGA RD (SR-120)/PUMICE RD & HIGHWAY 395 09/27/2018
OPENING YEAR WITH PROJECT CONDITIONS Synchro 10 ReportMID-DAY PEAK HOUR
Lane Group EBL EBT EBR WBL WBT WBR NBL NBT NBR SBL SBT SBRLane ConfigurationsIdeal Flow (vphpl) 1900 1900 1900 1900 1900 1900 1900 1900 1900 1900 1900 1900Lane Width (ft) 12 12 12 12 12 12 12 12 12 12 12 12Grade (%) 0% 0% 0% 0%Storage Length (ft) 400 400 270 0 0 50 0 0Storage Lanes 1 1 1 0 0 1 0 0Taper Length (ft) 25 25 25 25Lane Util. Factor 1.00 0.95 1.00 1.00 0.95 0.95 1.00 1.00 1.00 1.00 1.00 1.00Ped Bike FactorFrt 0.850 0.850 0.899Flt Protected 0.950 0.950 0.950 0.988Satd. Flow (prot) 1583 3034 1417 1583 3034 0 0 1583 1417 0 1480 0Flt Permitted 0.950 0.950 0.950 0.988Satd. Flow (perm) 1583 3034 1417 1583 3034 0 0 1583 1417 0 1480 0Link Speed (mph) 30 30 30 30Link Distance (ft) 1553 1621 921 296Travel Time (s) 35.3 36.8 20.9 6.7
Intersection SummaryArea Type: Other
Volume TIOGA INN TIA1: TIOGA RD (SR-120)/PUMICE RD & HIGHWAY 395 09/27/2018
OPENING YEAR WITH PROJECT CONDITIONS Synchro 10 ReportMID-DAY PEAK HOUR
Lane Group EBL EBT EBR WBL WBT WBR NBL NBT NBR SBL SBT SBRTraffic Volume (vph) 6 300 94 180 274 0 94 0 112 2 0 7Future Volume (vph) 6 300 94 180 274 0 94 0 112 2 0 7Confl. Peds. (#/hr)Confl. Bikes (#/hr)Peak Hour Factor 0.80 0.80 0.80 0.80 0.80 0.80 0.80 0.80 0.80 0.80 0.80 0.80Growth Factor 100% 100% 100% 100% 100% 100% 100% 100% 100% 100% 100% 100%Heavy Vehicles (%) 14% 19% 14% 14% 19% 14% 14% 14% 14% 14% 14% 14%Bus Blockages (#/hr) 0 0 0 0 0 0 0 0 0 0 0 0Parking (#/hr)Mid-Block Traffic (%) 0% 0% 0% 0%Adj. Flow (vph) 8 375 118 225 343 0 118 0 140 3 0 9Shared Lane Traffic (%)Lane Group Flow (vph) 8 375 118 225 343 0 0 118 140 0 12 0
Intersection Summary

HCM 2010 TWSC TIOGA INN TIA1: TIOGA RD (SR-120)/PUMICE RD & HIGHWAY 395 09/27/2018
OPENING YEAR WITH PROJECT CONDITIONS Synchro 10 ReportMID-DAY PEAK HOUR
IntersectionInt Delay, s/veh 10.6
Movement EBL EBT EBR WBL WBT WBR NBL NBT NBR SBL SBT SBRLane ConfigurationsTraffic Vol, veh/h 6 300 94 180 274 0 94 0 112 2 0 7Future Vol, veh/h 6 300 94 180 274 0 94 0 112 2 0 7Conflicting Peds, #/hr 0 0 0 0 0 0 0 0 0 0 0 0Sign Control Free Free Free Free Free Free Stop Stop Stop Stop Stop StopRT Channelized - - Yield - - None - - Free - - NoneStorage Length 400 - 400 270 - - - - 50 - - -Veh in Median Storage, # - 0 - - 0 - - 0 - - 0 -Grade, % - 0 - - 0 - - 0 - - 0 -Peak Hour Factor 80 80 80 80 80 80 80 80 80 80 80 80Heavy Vehicles, % 14 19 14 14 19 14 14 14 14 14 14 14Mvmt Flow 8 375 118 225 343 0 118 0 140 3 0 9
Major/Minor Major1 Major2 Minor1 Minor2Conflicting Flow All 343 0 0 375 0 0 1013 1184 - 997 1184 172 Stage 1 - - - - - - 391 391 - 793 793 - Stage 2 - - - - - - 622 793 - 204 391 -Critical Hdwy 4.38 - - 4.38 - - 7.78 6.78 - 7.78 6.78 7.18Critical Hdwy Stg 1 - - - - - - 6.78 5.78 - 6.78 5.78 -Critical Hdwy Stg 2 - - - - - - 6.78 5.78 - 6.78 5.78 -Follow-up Hdwy 2.34 - - 2.34 - - 3.64 4.14 - 3.64 4.14 3.44Pot Cap-1 Maneuver 1131 - - 1098 - - 177 171 0 182 171 805 Stage 1 - - - - - - 573 576 0 323 371 - Stage 2 - - - - - - 413 371 0 745 576 -Platoon blocked, % - - - -Mov Cap-1 Maneuver 1131 - - 1098 - - 147 135 - 153 135 805Mov Cap-2 Maneuver - - - - - - 147 135 - 153 135 - Stage 1 - - - - - - 569 572 - 321 295 - Stage 2 - - - - - - 325 295 - 740 572 -
Approach EB WB NB SBHCM Control Delay, s 0.1 3.6 88.5 14HCM LOS F B
Minor Lane/Major Mvmt NBLn1 NBLn2 EBL EBT EBR WBL WBT WBR SBLn1Capacity (veh/h) 147 - 1131 - - 1098 - - 413HCM Lane V/C Ratio 0.799 - 0.007 - - 0.205 - - 0.027HCM Control Delay (s) 88.5 0 8.2 - - 9.1 - - 14HCM Lane LOS F A A - - A - - BHCM 95th %tile Q(veh) 5 - 0 - - 0.8 - - 0.1
Lanes and Geometrics TIOGA INN TIA2: TIOGA RD (SR-120) & PROJECT SITE ACCESS 09/27/2018
OPENING YEAR WITH PROJECT CONDITIONS Synchro 10 ReportMID-DAY PEAK HOUR
Lane Group WBL WBR NBT NBR SBL SBTLane ConfigurationsIdeal Flow (vphpl) 1900 1900 1900 1900 1900 1900Lane Width (ft) 12 12 12 12 12 12Grade (%) 0% 0% 0%Storage Length (ft) 0 0 275 75Storage Lanes 1 1 1 1Taper Length (ft) 25 25Lane Util. Factor 1.00 1.00 1.00 1.00 1.00 1.00Ped Bike FactorFrt 0.850 0.850Flt Protected 0.950 0.950Satd. Flow (prot) 1583 1417 1667 1417 1583 1667Flt Permitted 0.950 0.950Satd. Flow (perm) 1583 1417 1667 1417 1583 1667Link Speed (mph) 30 30 30Link Distance (ft) 624 1463 921Travel Time (s) 14.2 33.3 20.9
Intersection SummaryArea Type: Other

Volume TIOGA INN TIA2: TIOGA RD (SR-120) & PROJECT SITE ACCESS 09/27/2018
OPENING YEAR WITH PROJECT CONDITIONS Synchro 10 ReportMID-DAY PEAK HOUR
Lane Group WBL WBR NBT NBR SBL SBTTraffic Volume (vph) 96 176 107 114 227 100Future Volume (vph) 96 176 107 114 227 100Confl. Peds. (#/hr)Confl. Bikes (#/hr)Peak Hour Factor 0.80 0.80 0.80 0.80 0.80 0.80Growth Factor 100% 100% 100% 100% 100% 100%Heavy Vehicles (%) 14% 14% 14% 14% 14% 14%Bus Blockages (#/hr) 0 0 0 0 0 0Parking (#/hr)Mid-Block Traffic (%) 0% 0% 0%Adj. Flow (vph) 120 220 134 143 284 125Shared Lane Traffic (%)Lane Group Flow (vph) 120 220 134 143 284 125
Intersection Summary
HCM 2010 TWSC TIOGA INN TIA2: TIOGA RD (SR-120) & PROJECT SITE ACCESS 09/27/2018
OPENING YEAR WITH PROJECT CONDITIONS Synchro 10 ReportMID-DAY PEAK HOUR
IntersectionInt Delay, s/veh 8.4
Movement WBL WBR NBT NBR SBL SBTLane ConfigurationsTraffic Vol, veh/h 96 176 107 114 227 100Future Vol, veh/h 96 176 107 114 227 100Conflicting Peds, #/hr 0 0 0 0 0 0Sign Control Stop Stop Free Free Free FreeRT Channelized - None - None - NoneStorage Length 0 0 - 275 75 -Veh in Median Storage, # 0 - 0 - - 0Grade, % 0 - 0 - - 0Peak Hour Factor 80 80 80 80 80 80Heavy Vehicles, % 14 14 14 14 14 14Mvmt Flow 120 220 134 143 284 125
Major/Minor Minor1 Major1 Major2Conflicting Flow All 827 134 0 0 277 0 Stage 1 134 - - - - - Stage 2 693 - - - - -Critical Hdwy 6.54 6.34 - - 4.24 -Critical Hdwy Stg 1 5.54 - - - - -Critical Hdwy Stg 2 5.54 - - - - -Follow-up Hdwy 3.626 3.426 - - 2.326 -Pot Cap-1 Maneuver 326 884 - - 1220 - Stage 1 864 - - - - - Stage 2 475 - - - - -Platoon blocked, % - - -Mov Cap-1 Maneuver 250 884 - - 1220 -Mov Cap-2 Maneuver 250 - - - - - Stage 1 663 - - - - - Stage 2 475 - - - - -
Approach WB NB SBHCM Control Delay, s 18 0 6.1HCM LOS C
Minor Lane/Major Mvmt NBT NBRWBLn1WBLn2 SBL SBTCapacity (veh/h) - - 250 884 1220 -HCM Lane V/C Ratio - - 0.48 0.249 0.233 -HCM Control Delay (s) - - 32 10.4 8.8 -HCM Lane LOS - - D B A -HCM 95th %tile Q(veh) - - 2.4 1 0.9 -
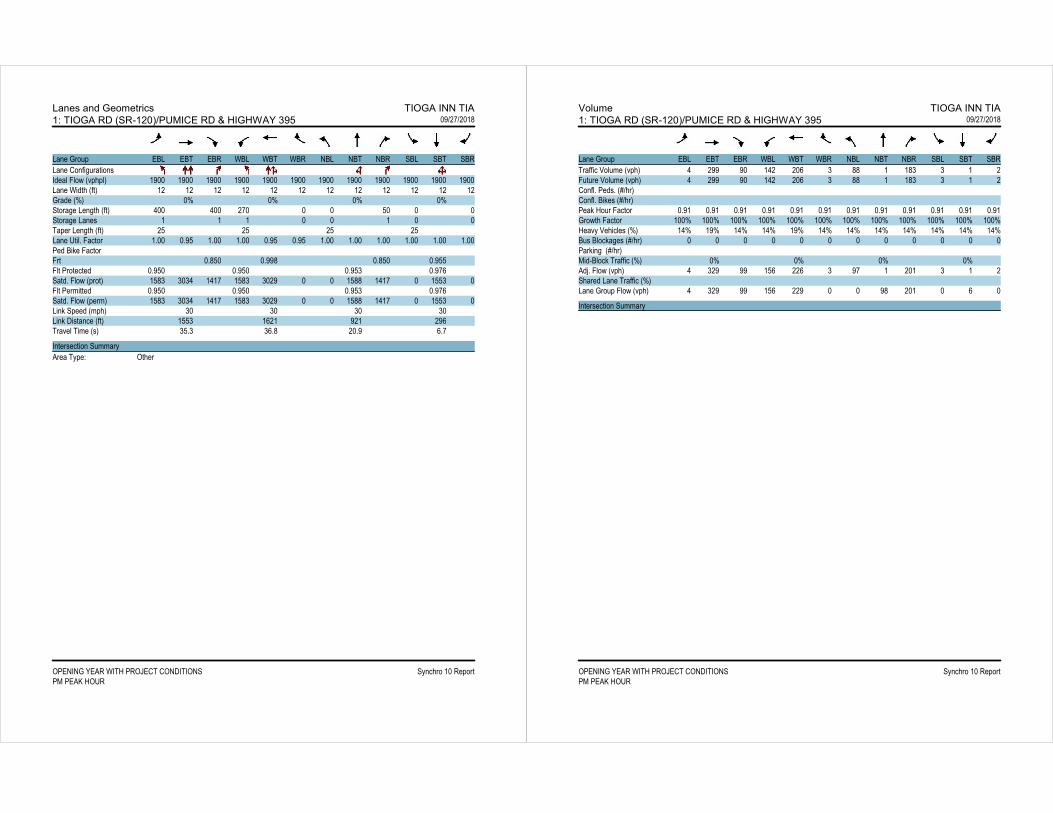
Lanes and Geometrics TIOGA INN TIA1: TIOGA RD (SR-120)/PUMICE RD & HIGHWAY 395 09/27/2018
OPENING YEAR WITH PROJECT CONDITIONS Synchro 10 ReportPM PEAK HOUR
Lane Group EBL EBT EBR WBL WBT WBR NBL NBT NBR SBL SBT SBRLane ConfigurationsIdeal Flow (vphpl) 1900 1900 1900 1900 1900 1900 1900 1900 1900 1900 1900 1900Lane Width (ft) 12 12 12 12 12 12 12 12 12 12 12 12Grade (%) 0% 0% 0% 0%Storage Length (ft) 400 400 270 0 0 50 0 0Storage Lanes 1 1 1 0 0 1 0 0Taper Length (ft) 25 25 25 25Lane Util. Factor 1.00 0.95 1.00 1.00 0.95 0.95 1.00 1.00 1.00 1.00 1.00 1.00Ped Bike FactorFrt 0.850 0.998 0.850 0.955Flt Protected 0.950 0.950 0.953 0.976Satd. Flow (prot) 1583 3034 1417 1583 3029 0 0 1588 1417 0 1553 0Flt Permitted 0.950 0.950 0.953 0.976Satd. Flow (perm) 1583 3034 1417 1583 3029 0 0 1588 1417 0 1553 0Link Speed (mph) 30 30 30 30Link Distance (ft) 1553 1621 921 296Travel Time (s) 35.3 36.8 20.9 6.7
Intersection SummaryArea Type: Other
Volume TIOGA INN TIA1: TIOGA RD (SR-120)/PUMICE RD & HIGHWAY 395 09/27/2018
OPENING YEAR WITH PROJECT CONDITIONS Synchro 10 ReportPM PEAK HOUR
Lane Group EBL EBT EBR WBL WBT WBR NBL NBT NBR SBL SBT SBRTraffic Volume (vph) 4 299 90 142 206 3 88 1 183 3 1 2Future Volume (vph) 4 299 90 142 206 3 88 1 183 3 1 2Confl. Peds. (#/hr)Confl. Bikes (#/hr)Peak Hour Factor 0.91 0.91 0.91 0.91 0.91 0.91 0.91 0.91 0.91 0.91 0.91 0.91Growth Factor 100% 100% 100% 100% 100% 100% 100% 100% 100% 100% 100% 100%Heavy Vehicles (%) 14% 19% 14% 14% 19% 14% 14% 14% 14% 14% 14% 14%Bus Blockages (#/hr) 0 0 0 0 0 0 0 0 0 0 0 0Parking (#/hr)Mid-Block Traffic (%) 0% 0% 0% 0%Adj. Flow (vph) 4 329 99 156 226 3 97 1 201 3 1 2Shared Lane Traffic (%)Lane Group Flow (vph) 4 329 99 156 229 0 0 98 201 0 6 0
Intersection Summary

HCM 2010 TWSC TIOGA INN TIA1: TIOGA RD (SR-120)/PUMICE RD & HIGHWAY 395 09/27/2018
OPENING YEAR WITH PROJECT CONDITIONS Synchro 10 ReportPM PEAK HOUR
IntersectionInt Delay, s/veh 4.8
Movement EBL EBT EBR WBL WBT WBR NBL NBT NBR SBL SBT SBRLane ConfigurationsTraffic Vol, veh/h 4 299 90 142 206 3 88 1 183 3 1 2Future Vol, veh/h 4 299 90 142 206 3 88 1 183 3 1 2Conflicting Peds, #/hr 0 0 0 0 0 0 0 0 0 0 0 0Sign Control Free Free Free Free Free Free Stop Stop Stop Stop Stop StopRT Channelized - - Yield - - None - - Free - - NoneStorage Length 400 - 400 270 - - - - 50 - - -Veh in Median Storage, # - 0 - - 0 - - 0 - - 0 -Grade, % - 0 - - 0 - - 0 - - 0 -Peak Hour Factor 91 91 91 91 91 91 91 91 91 91 91 91Heavy Vehicles, % 14 19 14 14 19 14 14 14 14 14 14 14Mvmt Flow 4 329 99 156 226 3 97 1 201 3 1 2
Major/Minor Major1 Major2 Minor1 Minor2Conflicting Flow All 229 0 0 329 0 0 763 878 - 713 877 115 Stage 1 - - - - - - 337 337 - 540 540 - Stage 2 - - - - - - 426 541 - 173 337 -Critical Hdwy 4.38 - - 4.38 - - 7.78 6.78 - 7.78 6.78 7.18Critical Hdwy Stg 1 - - - - - - 6.78 5.78 - 6.78 5.78 -Critical Hdwy Stg 2 - - - - - - 6.78 5.78 - 6.78 5.78 -Follow-up Hdwy 2.34 - - 2.34 - - 3.64 4.14 - 3.64 4.14 3.44Pot Cap-1 Maneuver 1253 - - 1145 - - 273 264 0 297 265 879 Stage 1 - - - - - - 619 611 0 464 491 - Stage 2 - - - - - - 546 490 0 778 611 -Platoon blocked, % - - - -Mov Cap-1 Maneuver 1253 - - 1145 - - 242 227 - 264 228 879Mov Cap-2 Maneuver - - - - - - 242 227 - 264 228 - Stage 1 - - - - - - 617 609 - 463 424 - Stage 2 - - - - - - 469 423 - 774 609 -
Approach EB WB NB SBHCM Control Delay, s 0.1 3.5 29.6 16HCM LOS D C
Minor Lane/Major Mvmt NBLn1 NBLn2 EBL EBT EBR WBL WBT WBR SBLn1Capacity (veh/h) 242 - 1253 - - 1145 - - 333HCM Lane V/C Ratio 0.404 - 0.004 - - 0.136 - - 0.02HCM Control Delay (s) 29.6 0 7.9 - - 8.6 - - 16HCM Lane LOS D A A - - A - - CHCM 95th %tile Q(veh) 1.8 - 0 - - 0.5 - - 0.1
Lanes and Geometrics TIOGA INN TIA2: TIOGA RD (SR-120) & PROJECT SITE ACCESS 09/27/2018
OPENING YEAR WITH PROJECT CONDITIONS Synchro 10 ReportPM PEAK HOUR
Lane Group WBL WBR NBT NBR SBL SBTLane ConfigurationsIdeal Flow (vphpl) 1900 1900 1900 1900 1900 1900Lane Width (ft) 12 12 12 12 12 12Grade (%) 0% 0% 0%Storage Length (ft) 0 0 275 75Storage Lanes 1 1 1 1Taper Length (ft) 25 25Lane Util. Factor 1.00 1.00 1.00 1.00 1.00 1.00Ped Bike FactorFrt 0.850 0.850Flt Protected 0.950 0.950Satd. Flow (prot) 1583 1417 1667 1417 1583 1667Flt Permitted 0.950 0.950Satd. Flow (perm) 1583 1417 1667 1417 1583 1667Link Speed (mph) 30 30 30Link Distance (ft) 624 1463 921Travel Time (s) 14.2 33.3 20.9
Intersection SummaryArea Type: Other

Volume TIOGA INN TIA2: TIOGA RD (SR-120) & PROJECT SITE ACCESS 09/27/2018
OPENING YEAR WITH PROJECT CONDITIONS Synchro 10 ReportPM PEAK HOUR
Lane Group WBL WBR NBT NBR SBL SBTTraffic Volume (vph) 73 166 164 127 192 75Future Volume (vph) 73 166 164 127 192 75Confl. Peds. (#/hr)Confl. Bikes (#/hr)Peak Hour Factor 0.84 0.84 0.84 0.84 0.84 0.84Growth Factor 100% 100% 100% 100% 100% 100%Heavy Vehicles (%) 14% 14% 14% 14% 14% 14%Bus Blockages (#/hr) 0 0 0 0 0 0Parking (#/hr)Mid-Block Traffic (%) 0% 0% 0%Adj. Flow (vph) 87 198 195 151 229 89Shared Lane Traffic (%)Lane Group Flow (vph) 87 198 195 151 229 89
Intersection Summary
HCM 2010 TWSC TIOGA INN TIA2: TIOGA RD (SR-120) & PROJECT SITE ACCESS 09/27/2018
OPENING YEAR WITH PROJECT CONDITIONS Synchro 10 ReportPM PEAK HOUR
IntersectionInt Delay, s/veh 6.4
Movement WBL WBR NBT NBR SBL SBTLane ConfigurationsTraffic Vol, veh/h 73 166 164 127 192 75Future Vol, veh/h 73 166 164 127 192 75Conflicting Peds, #/hr 0 0 0 0 0 0Sign Control Stop Stop Free Free Free FreeRT Channelized - None - None - NoneStorage Length 0 0 - 275 75 -Veh in Median Storage, # 0 - 0 - - 0Grade, % 0 - 0 - - 0Peak Hour Factor 84 84 84 84 84 84Heavy Vehicles, % 14 14 14 14 14 14Mvmt Flow 87 198 195 151 229 89
Major/Minor Minor1 Major1 Major2Conflicting Flow All 742 195 0 0 346 0 Stage 1 195 - - - - - Stage 2 547 - - - - -Critical Hdwy 6.54 6.34 - - 4.24 -Critical Hdwy Stg 1 5.54 - - - - -Critical Hdwy Stg 2 5.54 - - - - -Follow-up Hdwy 3.626 3.426 - - 2.326 -Pot Cap-1 Maneuver 366 817 - - 1149 - Stage 1 810 - - - - - Stage 2 556 - - - - -Platoon blocked, % - - -Mov Cap-1 Maneuver 293 817 - - 1149 -Mov Cap-2 Maneuver 293 - - - - - Stage 1 649 - - - - - Stage 2 556 - - - - -
Approach WB NB SBHCM Control Delay, s 14.3 0 6.4HCM LOS B
Minor Lane/Major Mvmt NBT NBRWBLn1WBLn2 SBL SBTCapacity (veh/h) - - 293 817 1149 -HCM Lane V/C Ratio - - 0.297 0.242 0.199 -HCM Control Delay (s) - - 22.4 10.8 8.9 -HCM Lane LOS - - C B A -HCM 95th %tile Q(veh) - - 1.2 0.9 0.7 -

APPENDIX G Forecast Opening Year (2023) With Project Conditions With
Traffic Signal LOS Analysis Worksheets
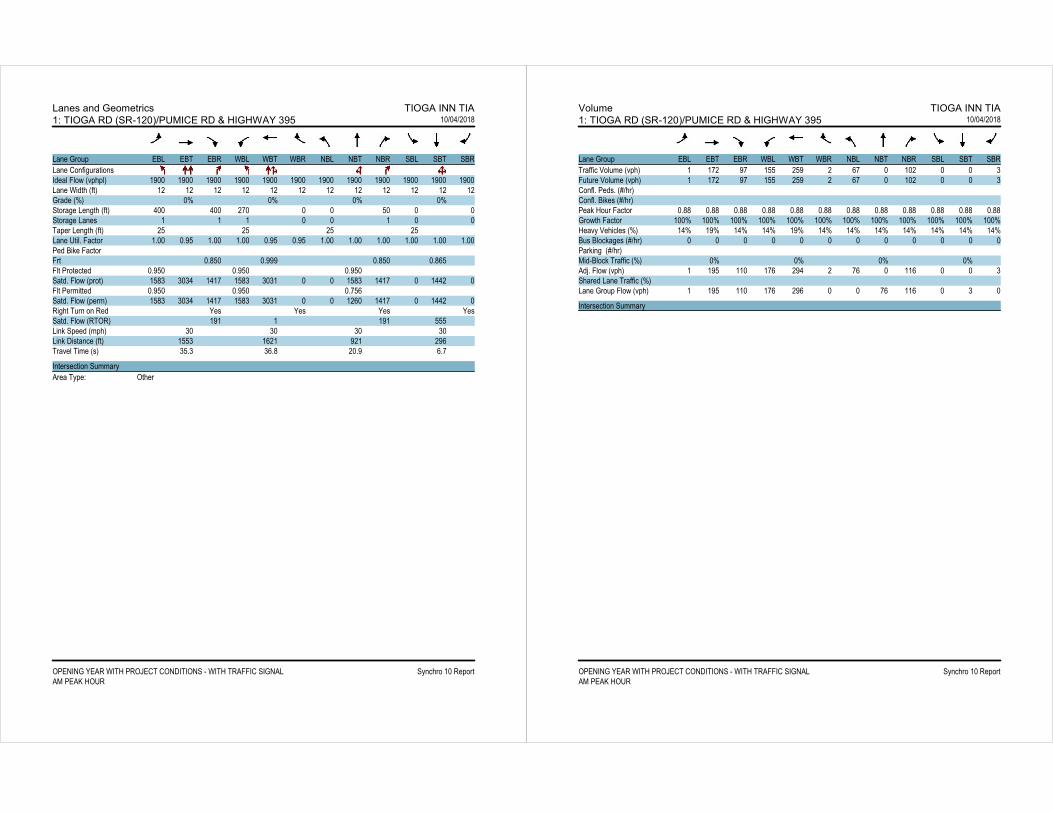
Lanes and Geometrics TIOGA INN TIA1: TIOGA RD (SR-120)/PUMICE RD & HIGHWAY 395 10/04/2018
OPENING YEAR WITH PROJECT CONDITIONS - WITH TRAFFIC SIGNAL Synchro 10 ReportAM PEAK HOUR
Lane Group EBL EBT EBR WBL WBT WBR NBL NBT NBR SBL SBT SBRLane ConfigurationsIdeal Flow (vphpl) 1900 1900 1900 1900 1900 1900 1900 1900 1900 1900 1900 1900Lane Width (ft) 12 12 12 12 12 12 12 12 12 12 12 12Grade (%) 0% 0% 0% 0%Storage Length (ft) 400 400 270 0 0 50 0 0Storage Lanes 1 1 1 0 0 1 0 0Taper Length (ft) 25 25 25 25Lane Util. Factor 1.00 0.95 1.00 1.00 0.95 0.95 1.00 1.00 1.00 1.00 1.00 1.00Ped Bike FactorFrt 0.850 0.999 0.850 0.865Flt Protected 0.950 0.950 0.950Satd. Flow (prot) 1583 3034 1417 1583 3031 0 0 1583 1417 0 1442 0Flt Permitted 0.950 0.950 0.756Satd. Flow (perm) 1583 3034 1417 1583 3031 0 0 1260 1417 0 1442 0Right Turn on Red Yes Yes Yes YesSatd. Flow (RTOR) 191 1 191 555Link Speed (mph) 30 30 30 30Link Distance (ft) 1553 1621 921 296Travel Time (s) 35.3 36.8 20.9 6.7
Intersection SummaryArea Type: Other
Volume TIOGA INN TIA1: TIOGA RD (SR-120)/PUMICE RD & HIGHWAY 395 10/04/2018
OPENING YEAR WITH PROJECT CONDITIONS - WITH TRAFFIC SIGNAL Synchro 10 ReportAM PEAK HOUR
Lane Group EBL EBT EBR WBL WBT WBR NBL NBT NBR SBL SBT SBRTraffic Volume (vph) 1 172 97 155 259 2 67 0 102 0 0 3Future Volume (vph) 1 172 97 155 259 2 67 0 102 0 0 3Confl. Peds. (#/hr)Confl. Bikes (#/hr)Peak Hour Factor 0.88 0.88 0.88 0.88 0.88 0.88 0.88 0.88 0.88 0.88 0.88 0.88Growth Factor 100% 100% 100% 100% 100% 100% 100% 100% 100% 100% 100% 100%Heavy Vehicles (%) 14% 19% 14% 14% 19% 14% 14% 14% 14% 14% 14% 14%Bus Blockages (#/hr) 0 0 0 0 0 0 0 0 0 0 0 0Parking (#/hr)Mid-Block Traffic (%) 0% 0% 0% 0%Adj. Flow (vph) 1 195 110 176 294 2 76 0 116 0 0 3Shared Lane Traffic (%)Lane Group Flow (vph) 1 195 110 176 296 0 0 76 116 0 3 0
Intersection Summary
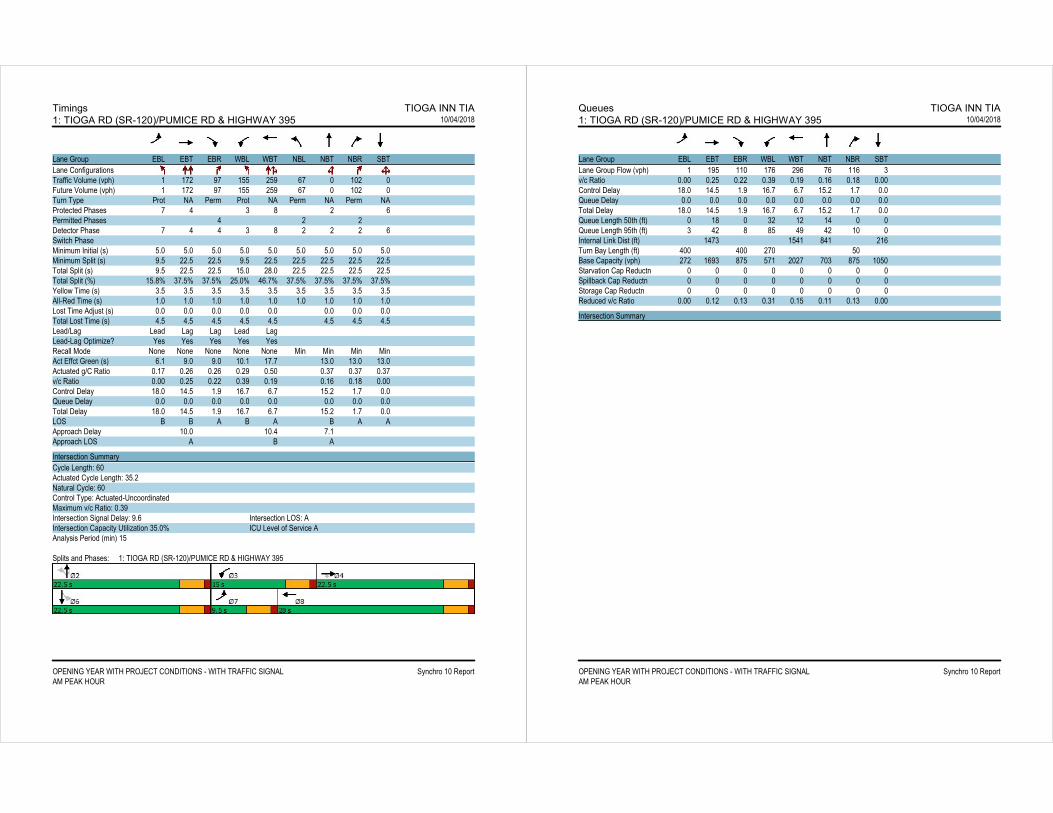
Timings TIOGA INN TIA1: TIOGA RD (SR-120)/PUMICE RD & HIGHWAY 395 10/04/2018
OPENING YEAR WITH PROJECT CONDITIONS - WITH TRAFFIC SIGNAL Synchro 10 ReportAM PEAK HOUR
Lane Group EBL EBT EBR WBL WBT NBL NBT NBR SBTLane ConfigurationsTraffic Volume (vph) 1 172 97 155 259 67 0 102 0Future Volume (vph) 1 172 97 155 259 67 0 102 0Turn Type Prot NA Perm Prot NA Perm NA Perm NAProtected Phases 7 4 3 8 2 6Permitted Phases 4 2 2Detector Phase 7 4 4 3 8 2 2 2 6Switch PhaseMinimum Initial (s) 5.0 5.0 5.0 5.0 5.0 5.0 5.0 5.0 5.0Minimum Split (s) 9.5 22.5 22.5 9.5 22.5 22.5 22.5 22.5 22.5Total Split (s) 9.5 22.5 22.5 15.0 28.0 22.5 22.5 22.5 22.5Total Split (%) 15.8% 37.5% 37.5% 25.0% 46.7% 37.5% 37.5% 37.5% 37.5%Yellow Time (s) 3.5 3.5 3.5 3.5 3.5 3.5 3.5 3.5 3.5All-Red Time (s) 1.0 1.0 1.0 1.0 1.0 1.0 1.0 1.0 1.0Lost Time Adjust (s) 0.0 0.0 0.0 0.0 0.0 0.0 0.0 0.0Total Lost Time (s) 4.5 4.5 4.5 4.5 4.5 4.5 4.5 4.5Lead/Lag Lead Lag Lag Lead LagLead-Lag Optimize? Yes Yes Yes Yes YesRecall Mode None None None None None Min Min Min MinAct Effct Green (s) 6.1 9.0 9.0 10.1 17.7 13.0 13.0 13.0Actuated g/C Ratio 0.17 0.26 0.26 0.29 0.50 0.37 0.37 0.37v/c Ratio 0.00 0.25 0.22 0.39 0.19 0.16 0.18 0.00Control Delay 18.0 14.5 1.9 16.7 6.7 15.2 1.7 0.0Queue Delay 0.0 0.0 0.0 0.0 0.0 0.0 0.0 0.0Total Delay 18.0 14.5 1.9 16.7 6.7 15.2 1.7 0.0LOS B B A B A B A AApproach Delay 10.0 10.4 7.1Approach LOS A B A
Intersection SummaryCycle Length: 60Actuated Cycle Length: 35.2Natural Cycle: 60Control Type: Actuated-UncoordinatedMaximum v/c Ratio: 0.39Intersection Signal Delay: 9.6 Intersection LOS: AIntersection Capacity Utilization 35.0% ICU Level of Service AAnalysis Period (min) 15
Splits and Phases: 1: TIOGA RD (SR-120)/PUMICE RD & HIGHWAY 395
Queues TIOGA INN TIA1: TIOGA RD (SR-120)/PUMICE RD & HIGHWAY 395 10/04/2018
OPENING YEAR WITH PROJECT CONDITIONS - WITH TRAFFIC SIGNAL Synchro 10 ReportAM PEAK HOUR
Lane Group EBL EBT EBR WBL WBT NBT NBR SBTLane Group Flow (vph) 1 195 110 176 296 76 116 3v/c Ratio 0.00 0.25 0.22 0.39 0.19 0.16 0.18 0.00Control Delay 18.0 14.5 1.9 16.7 6.7 15.2 1.7 0.0Queue Delay 0.0 0.0 0.0 0.0 0.0 0.0 0.0 0.0Total Delay 18.0 14.5 1.9 16.7 6.7 15.2 1.7 0.0Queue Length 50th (ft) 0 18 0 32 12 14 0 0Queue Length 95th (ft) 3 42 8 85 49 42 10 0Internal Link Dist (ft) 1473 1541 841 216Turn Bay Length (ft) 400 400 270 50Base Capacity (vph) 272 1693 875 571 2027 703 875 1050Starvation Cap Reductn 0 0 0 0 0 0 0 0Spillback Cap Reductn 0 0 0 0 0 0 0 0Storage Cap Reductn 0 0 0 0 0 0 0 0Reduced v/c Ratio 0.00 0.12 0.13 0.31 0.15 0.11 0.13 0.00
Intersection Summary
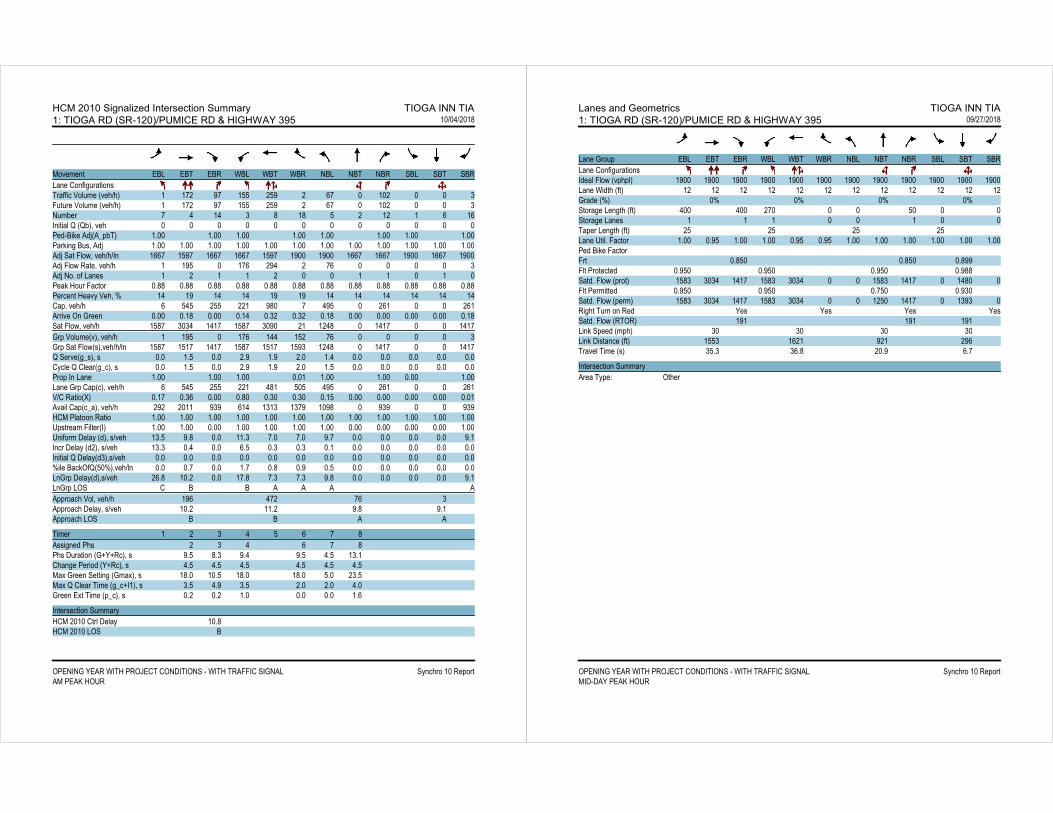
HCM 2010 Signalized Intersection Summary TIOGA INN TIA1: TIOGA RD (SR-120)/PUMICE RD & HIGHWAY 395 10/04/2018
OPENING YEAR WITH PROJECT CONDITIONS - WITH TRAFFIC SIGNAL Synchro 10 ReportAM PEAK HOUR
Movement EBL EBT EBR WBL WBT WBR NBL NBT NBR SBL SBT SBRLane ConfigurationsTraffic Volume (veh/h) 1 172 97 155 259 2 67 0 102 0 0 3Future Volume (veh/h) 1 172 97 155 259 2 67 0 102 0 0 3Number 7 4 14 3 8 18 5 2 12 1 6 16Initial Q (Qb), veh 0 0 0 0 0 0 0 0 0 0 0 0Ped-Bike Adj(A_pbT) 1.00 1.00 1.00 1.00 1.00 1.00 1.00 1.00Parking Bus, Adj 1.00 1.00 1.00 1.00 1.00 1.00 1.00 1.00 1.00 1.00 1.00 1.00Adj Sat Flow, veh/h/ln 1667 1597 1667 1667 1597 1900 1900 1667 1667 1900 1667 1900Adj Flow Rate, veh/h 1 195 0 176 294 2 76 0 0 0 0 3Adj No. of Lanes 1 2 1 1 2 0 0 1 1 0 1 0Peak Hour Factor 0.88 0.88 0.88 0.88 0.88 0.88 0.88 0.88 0.88 0.88 0.88 0.88Percent Heavy Veh, % 14 19 14 14 19 19 14 14 14 14 14 14Cap, veh/h 6 545 255 221 980 7 495 0 261 0 0 261Arrive On Green 0.00 0.18 0.00 0.14 0.32 0.32 0.18 0.00 0.00 0.00 0.00 0.18Sat Flow, veh/h 1587 3034 1417 1587 3090 21 1248 0 1417 0 0 1417Grp Volume(v), veh/h 1 195 0 176 144 152 76 0 0 0 0 3Grp Sat Flow(s),veh/h/ln 1587 1517 1417 1587 1517 1593 1248 0 1417 0 0 1417Q Serve(g_s), s 0.0 1.5 0.0 2.9 1.9 2.0 1.4 0.0 0.0 0.0 0.0 0.0Cycle Q Clear(g_c), s 0.0 1.5 0.0 2.9 1.9 2.0 1.5 0.0 0.0 0.0 0.0 0.0Prop In Lane 1.00 1.00 1.00 0.01 1.00 1.00 0.00 1.00Lane Grp Cap(c), veh/h 6 545 255 221 481 505 495 0 261 0 0 261V/C Ratio(X) 0.17 0.36 0.00 0.80 0.30 0.30 0.15 0.00 0.00 0.00 0.00 0.01Avail Cap(c_a), veh/h 292 2011 939 614 1313 1379 1098 0 939 0 0 939HCM Platoon Ratio 1.00 1.00 1.00 1.00 1.00 1.00 1.00 1.00 1.00 1.00 1.00 1.00Upstream Filter(I) 1.00 1.00 0.00 1.00 1.00 1.00 1.00 0.00 0.00 0.00 0.00 1.00Uniform Delay (d), s/veh 13.5 9.8 0.0 11.3 7.0 7.0 9.7 0.0 0.0 0.0 0.0 9.1Incr Delay (d2), s/veh 13.3 0.4 0.0 6.5 0.3 0.3 0.1 0.0 0.0 0.0 0.0 0.0Initial Q Delay(d3),s/veh 0.0 0.0 0.0 0.0 0.0 0.0 0.0 0.0 0.0 0.0 0.0 0.0%ile BackOfQ(50%),veh/ln 0.0 0.7 0.0 1.7 0.8 0.9 0.5 0.0 0.0 0.0 0.0 0.0LnGrp Delay(d),s/veh 26.8 10.2 0.0 17.8 7.3 7.3 9.8 0.0 0.0 0.0 0.0 9.1LnGrp LOS C B B A A A AApproach Vol, veh/h 196 472 76 3Approach Delay, s/veh 10.2 11.2 9.8 9.1Approach LOS B B A A
Timer 1 2 3 4 5 6 7 8Assigned Phs 2 3 4 6 7 8Phs Duration (G+Y+Rc), s 9.5 8.3 9.4 9.5 4.5 13.1Change Period (Y+Rc), s 4.5 4.5 4.5 4.5 4.5 4.5Max Green Setting (Gmax), s 18.0 10.5 18.0 18.0 5.0 23.5Max Q Clear Time (g_c+I1), s 3.5 4.9 3.5 2.0 2.0 4.0Green Ext Time (p_c), s 0.2 0.2 1.0 0.0 0.0 1.6
Intersection SummaryHCM 2010 Ctrl Delay 10.8HCM 2010 LOS B
Lanes and Geometrics TIOGA INN TIA1: TIOGA RD (SR-120)/PUMICE RD & HIGHWAY 395 09/27/2018
OPENING YEAR WITH PROJECT CONDITIONS - WITH TRAFFIC SIGNAL Synchro 10 ReportMID-DAY PEAK HOUR
Lane Group EBL EBT EBR WBL WBT WBR NBL NBT NBR SBL SBT SBRLane ConfigurationsIdeal Flow (vphpl) 1900 1900 1900 1900 1900 1900 1900 1900 1900 1900 1900 1900Lane Width (ft) 12 12 12 12 12 12 12 12 12 12 12 12Grade (%) 0% 0% 0% 0%Storage Length (ft) 400 400 270 0 0 50 0 0Storage Lanes 1 1 1 0 0 1 0 0Taper Length (ft) 25 25 25 25Lane Util. Factor 1.00 0.95 1.00 1.00 0.95 0.95 1.00 1.00 1.00 1.00 1.00 1.00Ped Bike FactorFrt 0.850 0.850 0.899Flt Protected 0.950 0.950 0.950 0.988Satd. Flow (prot) 1583 3034 1417 1583 3034 0 0 1583 1417 0 1480 0Flt Permitted 0.950 0.950 0.750 0.930Satd. Flow (perm) 1583 3034 1417 1583 3034 0 0 1250 1417 0 1393 0Right Turn on Red Yes Yes Yes YesSatd. Flow (RTOR) 191 191 191Link Speed (mph) 30 30 30 30Link Distance (ft) 1553 1621 921 296Travel Time (s) 35.3 36.8 20.9 6.7
Intersection SummaryArea Type: Other

Volume TIOGA INN TIA1: TIOGA RD (SR-120)/PUMICE RD & HIGHWAY 395 09/27/2018
OPENING YEAR WITH PROJECT CONDITIONS - WITH TRAFFIC SIGNAL Synchro 10 ReportMID-DAY PEAK HOUR
Lane Group EBL EBT EBR WBL WBT WBR NBL NBT NBR SBL SBT SBRTraffic Volume (vph) 6 300 94 180 274 0 94 0 112 2 0 7Future Volume (vph) 6 300 94 180 274 0 94 0 112 2 0 7Confl. Peds. (#/hr)Confl. Bikes (#/hr)Peak Hour Factor 0.80 0.80 0.80 0.80 0.80 0.80 0.80 0.80 0.80 0.80 0.80 0.80Growth Factor 100% 100% 100% 100% 100% 100% 100% 100% 100% 100% 100% 100%Heavy Vehicles (%) 14% 19% 14% 14% 19% 14% 14% 14% 14% 14% 14% 14%Bus Blockages (#/hr) 0 0 0 0 0 0 0 0 0 0 0 0Parking (#/hr)Mid-Block Traffic (%) 0% 0% 0% 0%Adj. Flow (vph) 8 375 118 225 343 0 118 0 140 3 0 9Shared Lane Traffic (%)Lane Group Flow (vph) 8 375 118 225 343 0 0 118 140 0 12 0
Intersection Summary
Timings TIOGA INN TIA1: TIOGA RD (SR-120)/PUMICE RD & HIGHWAY 395 09/27/2018
OPENING YEAR WITH PROJECT CONDITIONS - WITH TRAFFIC SIGNAL Synchro 10 ReportMID-DAY PEAK HOUR
Lane Group EBL EBT EBR WBL WBT NBL NBT NBR SBL SBTLane ConfigurationsTraffic Volume (vph) 6 300 94 180 274 94 0 112 2 0Future Volume (vph) 6 300 94 180 274 94 0 112 2 0Turn Type Prot NA Perm Prot NA Perm NA Perm Perm NAProtected Phases 7 4 3 8 2 6Permitted Phases 4 2 2 6Detector Phase 7 4 4 3 8 2 2 2 6 6Switch PhaseMinimum Initial (s) 5.0 5.0 5.0 5.0 5.0 5.0 5.0 5.0 5.0 5.0Minimum Split (s) 9.5 22.5 22.5 9.5 22.5 22.5 22.5 22.5 22.5 22.5Total Split (s) 9.5 22.5 22.5 15.0 28.0 22.5 22.5 22.5 22.5 22.5Total Split (%) 15.8% 37.5% 37.5% 25.0% 46.7% 37.5% 37.5% 37.5% 37.5% 37.5%Yellow Time (s) 3.5 3.5 3.5 3.5 3.5 3.5 3.5 3.5 3.5 3.5All-Red Time (s) 1.0 1.0 1.0 1.0 1.0 1.0 1.0 1.0 1.0 1.0Lost Time Adjust (s) 0.0 0.0 0.0 0.0 0.0 0.0 0.0 0.0Total Lost Time (s) 4.5 4.5 4.5 4.5 4.5 4.5 4.5 4.5Lead/Lag Lead Lag Lag Lead LagLead-Lag Optimize? Yes Yes Yes Yes YesRecall Mode None None None None None Min Min Min Min MinAct Effct Green (s) 5.1 11.6 11.6 10.3 25.0 9.8 9.8 9.8Actuated g/C Ratio 0.11 0.25 0.25 0.23 0.55 0.21 0.21 0.21v/c Ratio 0.04 0.49 0.23 0.63 0.21 0.44 0.31 0.03Control Delay 22.8 17.2 2.0 29.9 7.2 21.9 3.4 0.1Queue Delay 0.0 0.0 0.0 0.0 0.0 0.0 0.0 0.0Total Delay 22.8 17.2 2.0 29.9 7.2 21.9 3.4 0.1LOS C B A C A C A AApproach Delay 13.7 16.2 11.9 0.1Approach LOS B B B A
Intersection SummaryCycle Length: 60Actuated Cycle Length: 45.6Natural Cycle: 60Control Type: Actuated-UncoordinatedMaximum v/c Ratio: 0.63Intersection Signal Delay: 14.3 Intersection LOS: BIntersection Capacity Utilization 41.4% ICU Level of Service AAnalysis Period (min) 15
Splits and Phases: 1: TIOGA RD (SR-120)/PUMICE RD & HIGHWAY 395
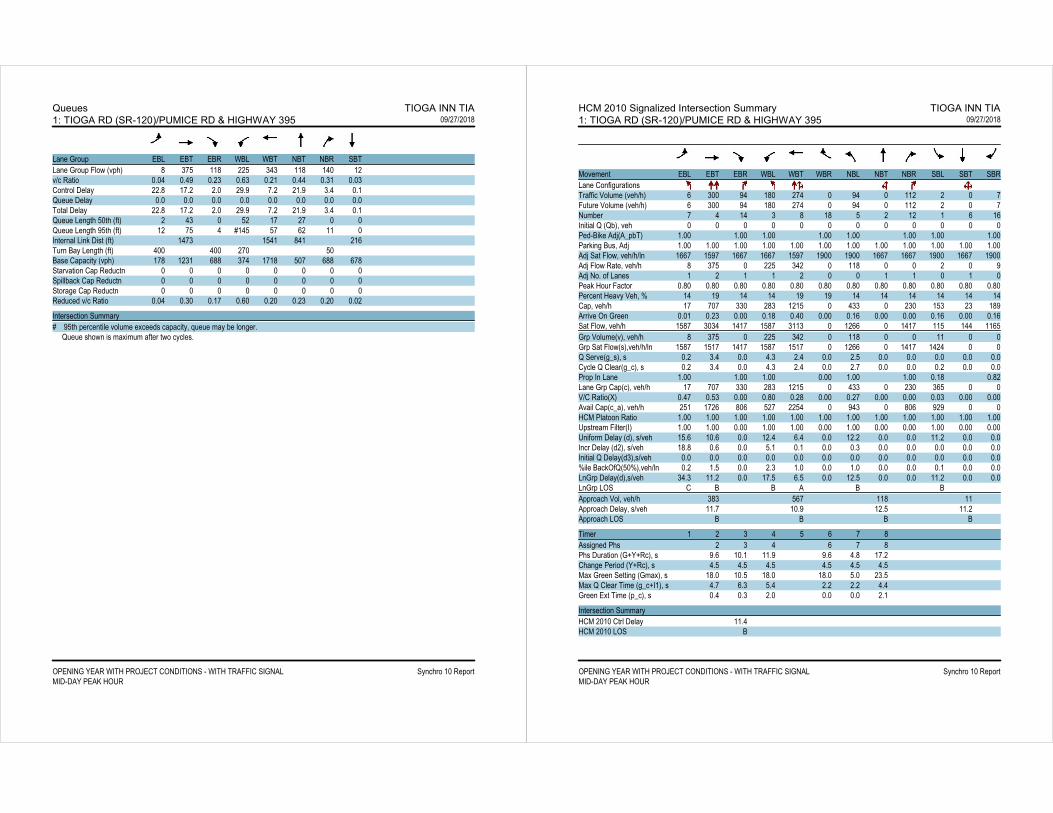
Queues TIOGA INN TIA1: TIOGA RD (SR-120)/PUMICE RD & HIGHWAY 395 09/27/2018
OPENING YEAR WITH PROJECT CONDITIONS - WITH TRAFFIC SIGNAL Synchro 10 ReportMID-DAY PEAK HOUR
Lane Group EBL EBT EBR WBL WBT NBT NBR SBTLane Group Flow (vph) 8 375 118 225 343 118 140 12v/c Ratio 0.04 0.49 0.23 0.63 0.21 0.44 0.31 0.03Control Delay 22.8 17.2 2.0 29.9 7.2 21.9 3.4 0.1Queue Delay 0.0 0.0 0.0 0.0 0.0 0.0 0.0 0.0Total Delay 22.8 17.2 2.0 29.9 7.2 21.9 3.4 0.1Queue Length 50th (ft) 2 43 0 52 17 27 0 0Queue Length 95th (ft) 12 75 4 #145 57 62 11 0Internal Link Dist (ft) 1473 1541 841 216Turn Bay Length (ft) 400 400 270 50Base Capacity (vph) 178 1231 688 374 1718 507 688 678Starvation Cap Reductn 0 0 0 0 0 0 0 0Spillback Cap Reductn 0 0 0 0 0 0 0 0Storage Cap Reductn 0 0 0 0 0 0 0 0Reduced v/c Ratio 0.04 0.30 0.17 0.60 0.20 0.23 0.20 0.02
Intersection Summary# 95th percentile volume exceeds capacity, queue may be longer. Queue shown is maximum after two cycles.
HCM 2010 Signalized Intersection Summary TIOGA INN TIA1: TIOGA RD (SR-120)/PUMICE RD & HIGHWAY 395 09/27/2018
OPENING YEAR WITH PROJECT CONDITIONS - WITH TRAFFIC SIGNAL Synchro 10 ReportMID-DAY PEAK HOUR
Movement EBL EBT EBR WBL WBT WBR NBL NBT NBR SBL SBT SBRLane ConfigurationsTraffic Volume (veh/h) 6 300 94 180 274 0 94 0 112 2 0 7Future Volume (veh/h) 6 300 94 180 274 0 94 0 112 2 0 7Number 7 4 14 3 8 18 5 2 12 1 6 16Initial Q (Qb), veh 0 0 0 0 0 0 0 0 0 0 0 0Ped-Bike Adj(A_pbT) 1.00 1.00 1.00 1.00 1.00 1.00 1.00 1.00Parking Bus, Adj 1.00 1.00 1.00 1.00 1.00 1.00 1.00 1.00 1.00 1.00 1.00 1.00Adj Sat Flow, veh/h/ln 1667 1597 1667 1667 1597 1900 1900 1667 1667 1900 1667 1900Adj Flow Rate, veh/h 8 375 0 225 342 0 118 0 0 2 0 9Adj No. of Lanes 1 2 1 1 2 0 0 1 1 0 1 0Peak Hour Factor 0.80 0.80 0.80 0.80 0.80 0.80 0.80 0.80 0.80 0.80 0.80 0.80Percent Heavy Veh, % 14 19 14 14 19 19 14 14 14 14 14 14Cap, veh/h 17 707 330 283 1215 0 433 0 230 153 23 189Arrive On Green 0.01 0.23 0.00 0.18 0.40 0.00 0.16 0.00 0.00 0.16 0.00 0.16Sat Flow, veh/h 1587 3034 1417 1587 3113 0 1266 0 1417 115 144 1165Grp Volume(v), veh/h 8 375 0 225 342 0 118 0 0 11 0 0Grp Sat Flow(s),veh/h/ln 1587 1517 1417 1587 1517 0 1266 0 1417 1424 0 0Q Serve(g_s), s 0.2 3.4 0.0 4.3 2.4 0.0 2.5 0.0 0.0 0.0 0.0 0.0Cycle Q Clear(g_c), s 0.2 3.4 0.0 4.3 2.4 0.0 2.7 0.0 0.0 0.2 0.0 0.0Prop In Lane 1.00 1.00 1.00 0.00 1.00 1.00 0.18 0.82Lane Grp Cap(c), veh/h 17 707 330 283 1215 0 433 0 230 365 0 0V/C Ratio(X) 0.47 0.53 0.00 0.80 0.28 0.00 0.27 0.00 0.00 0.03 0.00 0.00Avail Cap(c_a), veh/h 251 1726 806 527 2254 0 943 0 806 929 0 0HCM Platoon Ratio 1.00 1.00 1.00 1.00 1.00 1.00 1.00 1.00 1.00 1.00 1.00 1.00Upstream Filter(I) 1.00 1.00 0.00 1.00 1.00 0.00 1.00 0.00 0.00 1.00 0.00 0.00Uniform Delay (d), s/veh 15.6 10.6 0.0 12.4 6.4 0.0 12.2 0.0 0.0 11.2 0.0 0.0Incr Delay (d2), s/veh 18.8 0.6 0.0 5.1 0.1 0.0 0.3 0.0 0.0 0.0 0.0 0.0Initial Q Delay(d3),s/veh 0.0 0.0 0.0 0.0 0.0 0.0 0.0 0.0 0.0 0.0 0.0 0.0%ile BackOfQ(50%),veh/ln 0.2 1.5 0.0 2.3 1.0 0.0 1.0 0.0 0.0 0.1 0.0 0.0LnGrp Delay(d),s/veh 34.3 11.2 0.0 17.5 6.5 0.0 12.5 0.0 0.0 11.2 0.0 0.0LnGrp LOS C B B A B BApproach Vol, veh/h 383 567 118 11Approach Delay, s/veh 11.7 10.9 12.5 11.2Approach LOS B B B B
Timer 1 2 3 4 5 6 7 8Assigned Phs 2 3 4 6 7 8Phs Duration (G+Y+Rc), s 9.6 10.1 11.9 9.6 4.8 17.2Change Period (Y+Rc), s 4.5 4.5 4.5 4.5 4.5 4.5Max Green Setting (Gmax), s 18.0 10.5 18.0 18.0 5.0 23.5Max Q Clear Time (g_c+I1), s 4.7 6.3 5.4 2.2 2.2 4.4Green Ext Time (p_c), s 0.4 0.3 2.0 0.0 0.0 2.1
Intersection SummaryHCM 2010 Ctrl Delay 11.4HCM 2010 LOS B

Lanes and Geometrics TIOGA INN TIA1: TIOGA RD (SR-120)/PUMICE RD & HIGHWAY 395 09/27/2018
OPENING YEAR WITH PROJECT CONDITIONS - WITH TRAFFIC SIGNAL Synchro 10 ReportPM PEAK HOUR
Lane Group EBL EBT EBR WBL WBT WBR NBL NBT NBR SBL SBT SBRLane ConfigurationsIdeal Flow (vphpl) 1900 1900 1900 1900 1900 1900 1900 1900 1900 1900 1900 1900Lane Width (ft) 12 12 12 12 12 12 12 12 12 12 12 12Grade (%) 0% 0% 0% 0%Storage Length (ft) 400 400 270 0 0 50 0 0Storage Lanes 1 1 1 0 0 1 0 0Taper Length (ft) 25 25 25 25Lane Util. Factor 1.00 0.95 1.00 1.00 0.95 0.95 1.00 1.00 1.00 1.00 1.00 1.00Ped Bike FactorFrt 0.850 0.998 0.850 0.955Flt Protected 0.950 0.950 0.953 0.976Satd. Flow (prot) 1583 3034 1417 1583 3029 0 0 1588 1417 0 1553 0Flt Permitted 0.950 0.950 0.725 0.878Satd. Flow (perm) 1583 3034 1417 1583 3029 0 0 1208 1417 0 1397 0Right Turn on Red Yes Yes Yes YesSatd. Flow (RTOR) 191 3 201 2Link Speed (mph) 30 30 30 30Link Distance (ft) 1553 1621 921 296Travel Time (s) 35.3 36.8 20.9 6.7
Intersection SummaryArea Type: Other
Volume TIOGA INN TIA1: TIOGA RD (SR-120)/PUMICE RD & HIGHWAY 395 09/27/2018
OPENING YEAR WITH PROJECT CONDITIONS - WITH TRAFFIC SIGNAL Synchro 10 ReportPM PEAK HOUR
Lane Group EBL EBT EBR WBL WBT WBR NBL NBT NBR SBL SBT SBRTraffic Volume (vph) 4 299 90 142 206 3 88 1 183 3 1 2Future Volume (vph) 4 299 90 142 206 3 88 1 183 3 1 2Confl. Peds. (#/hr)Confl. Bikes (#/hr)Peak Hour Factor 0.91 0.91 0.91 0.91 0.91 0.91 0.91 0.91 0.91 0.91 0.91 0.91Growth Factor 100% 100% 100% 100% 100% 100% 100% 100% 100% 100% 100% 100%Heavy Vehicles (%) 14% 19% 14% 14% 19% 14% 14% 14% 14% 14% 14% 14%Bus Blockages (#/hr) 0 0 0 0 0 0 0 0 0 0 0 0Parking (#/hr)Mid-Block Traffic (%) 0% 0% 0% 0%Adj. Flow (vph) 4 329 99 156 226 3 97 1 201 3 1 2Shared Lane Traffic (%)Lane Group Flow (vph) 4 329 99 156 229 0 0 98 201 0 6 0
Intersection Summary
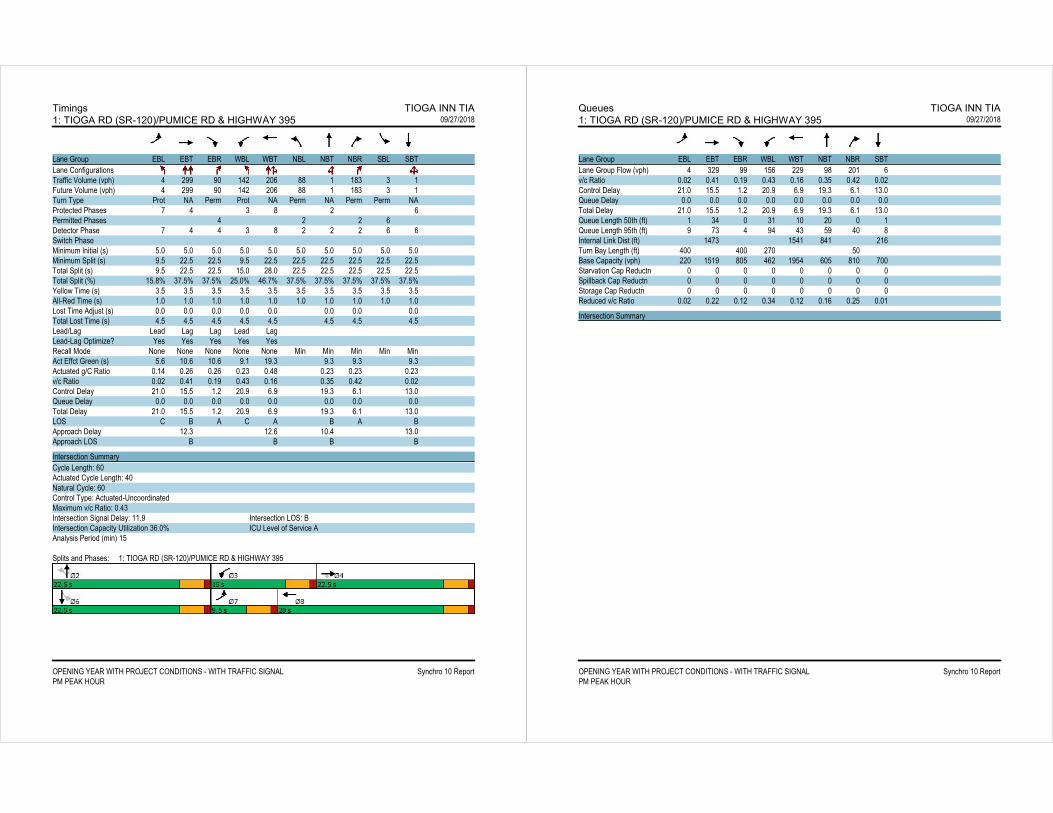
Timings TIOGA INN TIA1: TIOGA RD (SR-120)/PUMICE RD & HIGHWAY 395 09/27/2018
OPENING YEAR WITH PROJECT CONDITIONS - WITH TRAFFIC SIGNAL Synchro 10 ReportPM PEAK HOUR
Lane Group EBL EBT EBR WBL WBT NBL NBT NBR SBL SBTLane ConfigurationsTraffic Volume (vph) 4 299 90 142 206 88 1 183 3 1Future Volume (vph) 4 299 90 142 206 88 1 183 3 1Turn Type Prot NA Perm Prot NA Perm NA Perm Perm NAProtected Phases 7 4 3 8 2 6Permitted Phases 4 2 2 6Detector Phase 7 4 4 3 8 2 2 2 6 6Switch PhaseMinimum Initial (s) 5.0 5.0 5.0 5.0 5.0 5.0 5.0 5.0 5.0 5.0Minimum Split (s) 9.5 22.5 22.5 9.5 22.5 22.5 22.5 22.5 22.5 22.5Total Split (s) 9.5 22.5 22.5 15.0 28.0 22.5 22.5 22.5 22.5 22.5Total Split (%) 15.8% 37.5% 37.5% 25.0% 46.7% 37.5% 37.5% 37.5% 37.5% 37.5%Yellow Time (s) 3.5 3.5 3.5 3.5 3.5 3.5 3.5 3.5 3.5 3.5All-Red Time (s) 1.0 1.0 1.0 1.0 1.0 1.0 1.0 1.0 1.0 1.0Lost Time Adjust (s) 0.0 0.0 0.0 0.0 0.0 0.0 0.0 0.0Total Lost Time (s) 4.5 4.5 4.5 4.5 4.5 4.5 4.5 4.5Lead/Lag Lead Lag Lag Lead LagLead-Lag Optimize? Yes Yes Yes Yes YesRecall Mode None None None None None Min Min Min Min MinAct Effct Green (s) 5.6 10.6 10.6 9.1 19.3 9.3 9.3 9.3Actuated g/C Ratio 0.14 0.26 0.26 0.23 0.48 0.23 0.23 0.23v/c Ratio 0.02 0.41 0.19 0.43 0.16 0.35 0.42 0.02Control Delay 21.0 15.5 1.2 20.9 6.9 19.3 6.1 13.0Queue Delay 0.0 0.0 0.0 0.0 0.0 0.0 0.0 0.0Total Delay 21.0 15.5 1.2 20.9 6.9 19.3 6.1 13.0LOS C B A C A B A BApproach Delay 12.3 12.6 10.4 13.0Approach LOS B B B B
Intersection SummaryCycle Length: 60Actuated Cycle Length: 40Natural Cycle: 60Control Type: Actuated-UncoordinatedMaximum v/c Ratio: 0.43Intersection Signal Delay: 11.9 Intersection LOS: BIntersection Capacity Utilization 36.0% ICU Level of Service AAnalysis Period (min) 15
Splits and Phases: 1: TIOGA RD (SR-120)/PUMICE RD & HIGHWAY 395
Queues TIOGA INN TIA1: TIOGA RD (SR-120)/PUMICE RD & HIGHWAY 395 09/27/2018
OPENING YEAR WITH PROJECT CONDITIONS - WITH TRAFFIC SIGNAL Synchro 10 ReportPM PEAK HOUR
Lane Group EBL EBT EBR WBL WBT NBT NBR SBTLane Group Flow (vph) 4 329 99 156 229 98 201 6v/c Ratio 0.02 0.41 0.19 0.43 0.16 0.35 0.42 0.02Control Delay 21.0 15.5 1.2 20.9 6.9 19.3 6.1 13.0Queue Delay 0.0 0.0 0.0 0.0 0.0 0.0 0.0 0.0Total Delay 21.0 15.5 1.2 20.9 6.9 19.3 6.1 13.0Queue Length 50th (ft) 1 34 0 31 10 20 0 1Queue Length 95th (ft) 9 73 4 94 43 59 40 8Internal Link Dist (ft) 1473 1541 841 216Turn Bay Length (ft) 400 400 270 50Base Capacity (vph) 220 1519 805 462 1954 605 810 700Starvation Cap Reductn 0 0 0 0 0 0 0 0Spillback Cap Reductn 0 0 0 0 0 0 0 0Storage Cap Reductn 0 0 0 0 0 0 0 0Reduced v/c Ratio 0.02 0.22 0.12 0.34 0.12 0.16 0.25 0.01
Intersection Summary

HCM 6th Signalized Intersection Summary TIOGA INN TIA1: TIOGA RD (SR-120)/PUMICE RD & HIGHWAY 395 09/27/2018
OPENING YEAR WITH PROJECT CONDITIONS - WITH TRAFFIC SIGNAL Synchro 10 ReportPM PEAK HOUR
Movement EBL EBT EBR WBL WBT WBR NBL NBT NBR SBL SBT SBRLane ConfigurationsTraffic Volume (veh/h) 4 299 90 142 206 3 88 1 183 3 1 2Future Volume (veh/h) 4 299 90 142 206 3 88 1 183 3 1 2Initial Q (Qb), veh 0 0 0 0 0 0 0 0 0 0 0 0Ped-Bike Adj(A_pbT) 1.00 1.00 1.00 1.00 1.00 1.00 1.00 1.00Parking Bus, Adj 1.00 1.00 1.00 1.00 1.00 1.00 1.00 1.00 1.00 1.00 1.00 1.00Work Zone On Approach No No No NoAdj Sat Flow, veh/h/ln 1693 1618 1693 1693 1618 1618 1693 1693 1693 1693 1693 1693Adj Flow Rate, veh/h 4 329 0 156 226 3 97 1 0 3 1 2Peak Hour Factor 0.91 0.91 0.91 0.91 0.91 0.91 0.91 0.91 0.91 0.91 0.91 0.91Percent Heavy Veh, % 14 19 14 14 19 19 14 14 14 14 14 14Cap, veh/h 9 683 201 1061 14 477 4 274 90 86Arrive On Green 0.01 0.22 0.00 0.12 0.34 0.34 0.18 0.18 0.00 0.18 0.18 0.18Sat Flow, veh/h 1612 3075 1434 1612 3107 41 1269 20 1434 472 508 490Grp Volume(v), veh/h 4 329 0 156 112 117 98 0 0 6 0 0Grp Sat Flow(s),veh/h/ln1612 1537 1434 1612 1537 1611 1289 0 1434 1470 0 0Q Serve(g_s), s 0.1 2.6 0.0 2.7 1.5 1.5 1.8 0.0 0.0 0.0 0.0 0.0Cycle Q Clear(g_c), s 0.1 2.6 0.0 2.7 1.5 1.5 1.9 0.0 0.0 0.1 0.0 0.0Prop In Lane 1.00 1.00 1.00 0.03 0.99 1.00 0.50 0.33Lane Grp Cap(c), veh/h 9 683 201 525 550 480 0 450 0 0V/C Ratio(X) 0.45 0.48 0.78 0.21 0.21 0.20 0.00 0.01 0.00 0.00Avail Cap(c_a), veh/h 284 1954 597 1275 1336 1069 0 1086 0 0HCM Platoon Ratio 1.00 1.00 1.00 1.00 1.00 1.00 1.00 1.00 1.00 1.00 1.00 1.00Upstream Filter(I) 1.00 1.00 0.00 1.00 1.00 1.00 1.00 0.00 0.00 1.00 0.00 0.00Uniform Delay (d), s/veh 14.0 9.6 0.0 12.0 6.6 6.6 10.4 0.0 0.0 9.6 0.0 0.0Incr Delay (d2), s/veh 32.4 0.5 0.0 6.3 0.2 0.2 0.2 0.0 0.0 0.0 0.0 0.0Initial Q Delay(d3),s/veh 0.0 0.0 0.0 0.0 0.0 0.0 0.0 0.0 0.0 0.0 0.0 0.0%ile BackOfQ(50%),veh/ln0.1 0.6 0.0 1.0 0.3 0.3 0.4 0.0 0.0 0.0 0.0 0.0Unsig. Movement Delay, s/vehLnGrp Delay(d),s/veh 46.4 10.1 0.0 18.3 6.8 6.8 10.6 0.0 0.0 9.7 0.0 0.0LnGrp LOS D B B A A B A A A AApproach Vol, veh/h 333 A 385 98 A 6Approach Delay, s/veh 10.6 11.5 10.6 9.7Approach LOS B B B A
Timer - Assigned Phs 2 3 4 6 7 8Phs Duration (G+Y+Rc), s 9.5 8.0 10.8 9.5 4.7 14.2Change Period (Y+Rc), s 4.5 4.5 4.5 4.5 4.5 4.5Max Green Setting (Gmax), s 18.0 10.5 18.0 18.0 5.0 23.5Max Q Clear Time (g_c+I1), s 3.9 4.7 4.6 2.1 2.1 3.5Green Ext Time (p_c), s 0.3 0.2 1.7 0.0 0.0 1.2
Intersection SummaryHCM 6th Ctrl Delay 11.0HCM 6th LOS B
NotesUnsignalized Delay for [NBR, EBR] is excluded from calculations of the approach delay and intersection delay.
APPENDIX H Forecast Opening Year (2023) With Project Conditions With
Single-Lane Roundabout LOS Analysis Worksheets

INTERSECTION SUMMARYSite: OY+P (AM)
HIGHWAY 395 (NS) at TIOGA ROAD (SR-120) (EW)Roundabout
Intersection Performance - Hourly ValuesPerformance Measure Vehicles PersonsTravel Speed (Average) 30.7 mph 30.7 mphTravel Distance (Total) 612.0 veh-mi/h 734.4 pers-mi/hTravel Time (Total) 19.9 veh-h/h 23.9 pers-h/h
Demand Flows (Total) 978 veh/h 1174 pers/hPercent Heavy Vehicles (Demand) 16.5 %Degree of Saturation 0.536Practical Spare Capacity 58.7 %Effective Intersection Capacity 1826 veh/h
Control Delay (Total) 2.70 veh-h/h 3.24 pers-h/hControl Delay (Average) 9.9 sec 9.9 secControl Delay (Worst Lane) 11.4 secControl Delay (Worst Movement) 11.4 sec 11.4 secGeometric Delay (Average) 0.0 secStop-Line Delay (Average) 9.9 secIdling Time (Average) 8.2 secIntersection Level of Service (LOS) LOS A
95% Back of Queue - Vehicles (Worst Lane) 2.6 veh95% Back of Queue - Distance (Worst Lane) 74.9 ftQueue Storage Ratio (Worst Lane) 0.06Total Effective Stops 241 veh/h 290 pers/hEffective Stop Rate 0.25 per veh 0.25 per persProportion Queued 0.36 0.36Performance Index 31.5 31.5
Cost (Total) 411.60 $/h 411.60 $/hFuel Consumption (Total) 41.2 gal/hCarbon Dioxide (Total) 377.7 kg/hHydrocarbons (Total) 0.029 kg/hCarbon Monoxide (Total) 0.372 kg/hNOx (Total) 1.670 kg/h
Level of Service (LOS) Method: Delay & v/c (HCM 2010). Roundabout LOS Method: Same as Sign Control.Intersection LOS value for Vehicles is based on average delay for all vehicle movements.Roundabout Capacity Model: US HCM 2010.HCM Delay Formula option is used. Control Delay does not include Geometric Delay since Exclude Geometric Delay option applies.
Intersection Performance - Annual ValuesPerformance Measure Vehicles PersonsDemand Flows (Total) 469,636 veh/y 563,564 pers/yDelay 1,296 veh-h/y 1,555 pers-h/yEffective Stops 115,916 veh/y 139,099 pers/yTravel Distance 293,769 veh-mi/y 352,523 pers-mi/yTravel Time 9,557 veh-h/y 11,468 pers-h/y
Cost 197,568 $/y 197,568 $/yFuel Consumption 19,757 gal/yCarbon Dioxide 181,293 kg/yHydrocarbons 14 kg/yCarbon Monoxide 179 kg/yNOx 801 kg/y
SIDRA INTERSECTION 6.1 | Copyright © 2000-2015 Akcelik and Associates Pty Ltd | sidrasolutions.comOrganisation: RK ENGINEERING GROUP INC | Processed: Thursday, October 4, 2018 7:46:10 PMProject: J:\Alex\10.04.2018\Sidra.sip6.sip6
LEVEL OF SERVICESite: OY+P (AM)
HIGHWAY 395 (NS) at TIOGA ROAD (SR-120) (EW)Roundabout
All Movement Classes
South East North West IntersectionLOS B A A A A
Level of Service (LOS) Method: Delay & v/c (HCM 2010). Roundabout LOS Method: Same as Sign Control.Lane LOS values are based on average delay and v/c ratio (degree of saturation) per lane.LOS F will result if v/c > irrespective of lane delay value (does not apply for approaches and intersection).Intersection and Approach LOS values are based on average delay for all lanes (v/c not used as specified in HCM 2010).HCM Delay Formula option is used. Control Delay does not include Geometric Delay since Exclude Geometric Delay option applies.
SIDRA INTERSECTION 6.1 | Copyright © 2000-2015 Akcelik and Associates Pty Ltd | sidrasolutions.comOrganisation: RK ENGINEERING GROUP INC | Processed: Thursday, October 4, 2018 7:46:10 PMProject: J:\Alex\10.04.2018\Sidra.sip6.sip6

INTERSECTION SUMMARYSite: OY+P (MD)
HIGHWAY 395 (NS) at TIOGA ROAD (SR-120) (EW)Roundabout
Intersection Performance - Hourly ValuesPerformance Measure Vehicles PersonsTravel Speed (Average) 28.4 mph 28.4 mphTravel Distance (Total) 838.8 veh-mi/h 1006.6 pers-mi/hTravel Time (Total) 29.5 veh-h/h 35.4 pers-h/h
Demand Flows (Total) 1340 veh/h 1608 pers/hPercent Heavy Vehicles (Demand) 16.7 %Degree of Saturation 0.680Practical Spare Capacity 25.0 %Effective Intersection Capacity 1970 veh/h
Control Delay (Total) 5.93 veh-h/h 7.11 pers-h/hControl Delay (Average) 15.9 sec 15.9 secControl Delay (Worst Lane) 17.8 secControl Delay (Worst Movement) 17.8 sec 17.8 secGeometric Delay (Average) 0.0 secStop-Line Delay (Average) 15.9 secIdling Time (Average) 12.9 secIntersection Level of Service (LOS) LOS C
95% Back of Queue - Vehicles (Worst Lane) 4.3 veh95% Back of Queue - Distance (Worst Lane) 121.8 ftQueue Storage Ratio (Worst Lane) 0.10Total Effective Stops 654 veh/h 785 pers/hEffective Stop Rate 0.49 per veh 0.49 per persProportion Queued 0.55 0.55Performance Index 54.9 54.9
Cost (Total) 608.37 $/h 608.37 $/hFuel Consumption (Total) 58.4 gal/hCarbon Dioxide (Total) 536.1 kg/hHydrocarbons (Total) 0.043 kg/hCarbon Monoxide (Total) 0.531 kg/hNOx (Total) 2.380 kg/h
Level of Service (LOS) Method: Delay & v/c (HCM 2010). Roundabout LOS Method: Same as Sign Control.Intersection LOS value for Vehicles is based on average delay for all vehicle movements.Roundabout Capacity Model: US HCM 2010.HCM Delay Formula option is used. Control Delay does not include Geometric Delay since Exclude Geometric Delay option applies.
Intersection Performance - Annual ValuesPerformance Measure Vehicles PersonsDemand Flows (Total) 643,200 veh/y 771,840 pers/yDelay 2,846 veh-h/y 3,415 pers-h/yEffective Stops 314,125 veh/y 376,950 pers/yTravel Distance 402,629 veh-mi/y 483,155 pers-mi/yTravel Time 14,162 veh-h/y 16,995 pers-h/y
Cost 292,019 $/y 292,019 $/yFuel Consumption 28,048 gal/yCarbon Dioxide 257,348 kg/yHydrocarbons 21 kg/yCarbon Monoxide 255 kg/yNOx 1,142 kg/y
SIDRA INTERSECTION 6.1 | Copyright © 2000-2015 Akcelik and Associates Pty Ltd | sidrasolutions.comOrganisation: RK ENGINEERING GROUP INC | Processed: Thursday, September 27, 2018 4:05:21 PMProject: J:\Alex\SIDRA\Sidra.sip6.sip6
LEVEL OF SERVICESite: OY+P (MD)
HIGHWAY 395 (NS) at TIOGA ROAD (SR-120) (EW)Roundabout
All Movement Classes
South East North West IntersectionLOS C A C B C
Level of Service (LOS) Method: Delay & v/c (HCM 2010). Roundabout LOS Method: Same as Sign Control.Lane LOS values are based on average delay and v/c ratio (degree of saturation) per lane.LOS F will result if v/c > irrespective of lane delay value (does not apply for approaches and intersection).Intersection and Approach LOS values are based on average delay for all lanes (v/c not used as specified in HCM 2010).HCM Delay Formula option is used. Control Delay does not include Geometric Delay since Exclude Geometric Delay option applies.
SIDRA INTERSECTION 6.1 | Copyright © 2000-2015 Akcelik and Associates Pty Ltd | sidrasolutions.comOrganisation: RK ENGINEERING GROUP INC | Processed: Thursday, September 27, 2018 4:05:21 PMProject: J:\Alex\SIDRA\Sidra.sip6.sip6
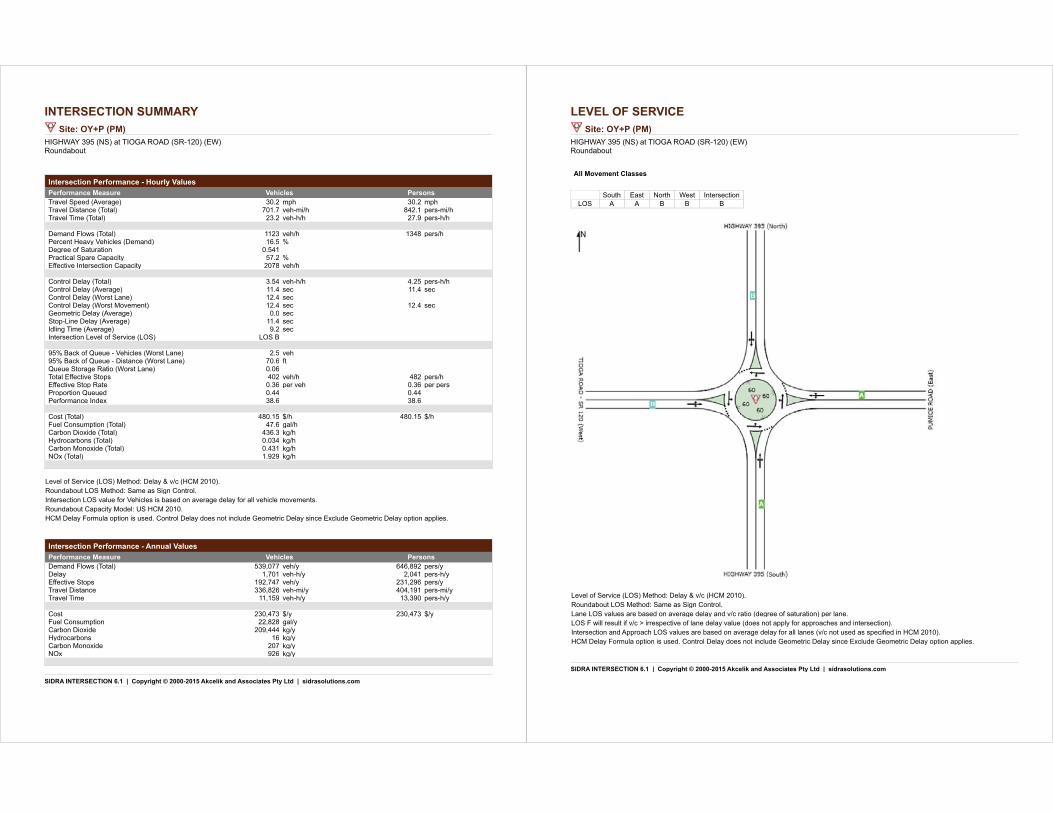
INTERSECTION SUMMARYSite: OY+P (PM)
HIGHWAY 395 (NS) at TIOGA ROAD (SR-120) (EW)Roundabout
Intersection Performance - Hourly ValuesPerformance Measure Vehicles PersonsTravel Speed (Average) 30.2 mph 30.2 mphTravel Distance (Total) 701.7 veh-mi/h 842.1 pers-mi/hTravel Time (Total) 23.2 veh-h/h 27.9 pers-h/h
Demand Flows (Total) 1123 veh/h 1348 pers/hPercent Heavy Vehicles (Demand) 16.5 %Degree of Saturation 0.541Practical Spare Capacity 57.2 %Effective Intersection Capacity 2078 veh/h
Control Delay (Total) 3.54 veh-h/h 4.25 pers-h/hControl Delay (Average) 11.4 sec 11.4 secControl Delay (Worst Lane) 12.4 secControl Delay (Worst Movement) 12.4 sec 12.4 secGeometric Delay (Average) 0.0 secStop-Line Delay (Average) 11.4 secIdling Time (Average) 9.2 secIntersection Level of Service (LOS) LOS B
95% Back of Queue - Vehicles (Worst Lane) 2.5 veh95% Back of Queue - Distance (Worst Lane) 70.6 ftQueue Storage Ratio (Worst Lane) 0.06Total Effective Stops 402 veh/h 482 pers/hEffective Stop Rate 0.36 per veh 0.36 per persProportion Queued 0.44 0.44Performance Index 38.6 38.6
Cost (Total) 480.15 $/h 480.15 $/hFuel Consumption (Total) 47.6 gal/hCarbon Dioxide (Total) 436.3 kg/hHydrocarbons (Total) 0.034 kg/hCarbon Monoxide (Total) 0.431 kg/hNOx (Total) 1.929 kg/h
Level of Service (LOS) Method: Delay & v/c (HCM 2010). Roundabout LOS Method: Same as Sign Control.Intersection LOS value for Vehicles is based on average delay for all vehicle movements.Roundabout Capacity Model: US HCM 2010.HCM Delay Formula option is used. Control Delay does not include Geometric Delay since Exclude Geometric Delay option applies.
Intersection Performance - Annual ValuesPerformance Measure Vehicles PersonsDemand Flows (Total) 539,077 veh/y 646,892 pers/yDelay 1,701 veh-h/y 2,041 pers-h/yEffective Stops 192,747 veh/y 231,296 pers/yTravel Distance 336,826 veh-mi/y 404,191 pers-mi/yTravel Time 11,159 veh-h/y 13,390 pers-h/y
Cost 230,473 $/y 230,473 $/yFuel Consumption 22,828 gal/yCarbon Dioxide 209,444 kg/yHydrocarbons 16 kg/yCarbon Monoxide 207 kg/yNOx 926 kg/y
SIDRA INTERSECTION 6.1 | Copyright © 2000-2015 Akcelik and Associates Pty Ltd | sidrasolutions.comOrganisation: RK ENGINEERING GROUP INC | Processed: Thursday, September 27, 2018 4:06:19 PMProject: J:\Alex\SIDRA\Sidra.sip6.sip6
LEVEL OF SERVICESite: OY+P (PM)
HIGHWAY 395 (NS) at TIOGA ROAD (SR-120) (EW)Roundabout
All Movement Classes
South East North West IntersectionLOS A A B B B
Level of Service (LOS) Method: Delay & v/c (HCM 2010). Roundabout LOS Method: Same as Sign Control.Lane LOS values are based on average delay and v/c ratio (degree of saturation) per lane.LOS F will result if v/c > irrespective of lane delay value (does not apply for approaches and intersection).Intersection and Approach LOS values are based on average delay for all lanes (v/c not used as specified in HCM 2010).HCM Delay Formula option is used. Control Delay does not include Geometric Delay since Exclude Geometric Delay option applies.
SIDRA INTERSECTION 6.1 | Copyright © 2000-2015 Akcelik and Associates Pty Ltd | sidrasolutions.comOrganisation: RK ENGINEERING GROUP INC | Processed: Thursday, September 27, 2018 4:06:19 PMProject: J:\Alex\SIDRA\Sidra.sip6.sip6
APPENDIX M
Air Quality and Greenhouse Gases Impact Analysis
By Giroux & Associates
AIR QUALITY and GHG IMPACT ANALYSES
TIOGA INN WORKFORCE HOUSING PROJECT
MONO COUNTY, CALIFORNIA
Prepared for:
Bauer Environmental & Planning ServicesAttn: Sandra Bauer
1271 Tropicana LaneSanta Ana, CA 92705
Date:
November 29, 2018
Project No.: P18-023 AQ
Tioga Workforce AQ- 1 -
AIR QUALITY IMPACT
STANDARDS OF SIGNIFICANCE
Air quality impacts are considered “significant” if they cause clean air standards to be violatedwhere they are currently met, or if they “substantially” contribute to an existing violation ofstandards. Any substantial emissions of air contaminants for which there is no safe exposure, ornuisance emissions such as dust or odors, would also be considered a significant impact.
Appendix G of the California CEQA Guidelines offers the following five tests of air qualityimpact significance. A project would have a potentially significant impact if it:
a. Conflicts with or obstructs implementation of the applicable air quality plan.
b. Violates any air quality standard or contributes substantially to an existing or projected airquality violation.
c. Results in a cumulatively considerable net increase of any criteria pollutants for which theproject region is non-attainment under an applicable federal or state ambient air qualitystandard (including releasing emissions which exceed quantitative thresholds for ozoneprecursors).
d. Exposes sensitive receptors to substantial pollutant concentrations.
e. Creates objectionable odors affecting a substantial number of people.
Primary Pollutants
Air quality impacts generally occur on two scales of motion. Near an individual source ofemissions or a collection of sources such as a crowded intersection or parking lot, levels of thosepollutants that are emitted in their already unhealthful form will be highest. Carbon monoxide(CO) is an example of such a pollutant. Primary pollutant impacts can generally be evaluateddirectly in comparison to appropriate clean air standards. Violations of these standards wherethey are currently met, or a measurable worsening of an existing or future violation, would beconsidered a significant impact. Many particulates, especially fugitive dust emissions, are alsoprimary pollutants.
Secondary Pollutants
Many pollutants, however, require time to transform from a more benign form to a moreunhealthful contaminant. Their impact occurs regionally far from the source. Their incrementalregional impact is minute on an individual basis and cannot be quantified except throughcomplex photochemical computer models. Analysis of significance of such emissions is basedupon a specified amount of emissions (pounds, tons, etc.) even though there is no way totranslate those emissions directly into a corresponding ambient air quality impact.
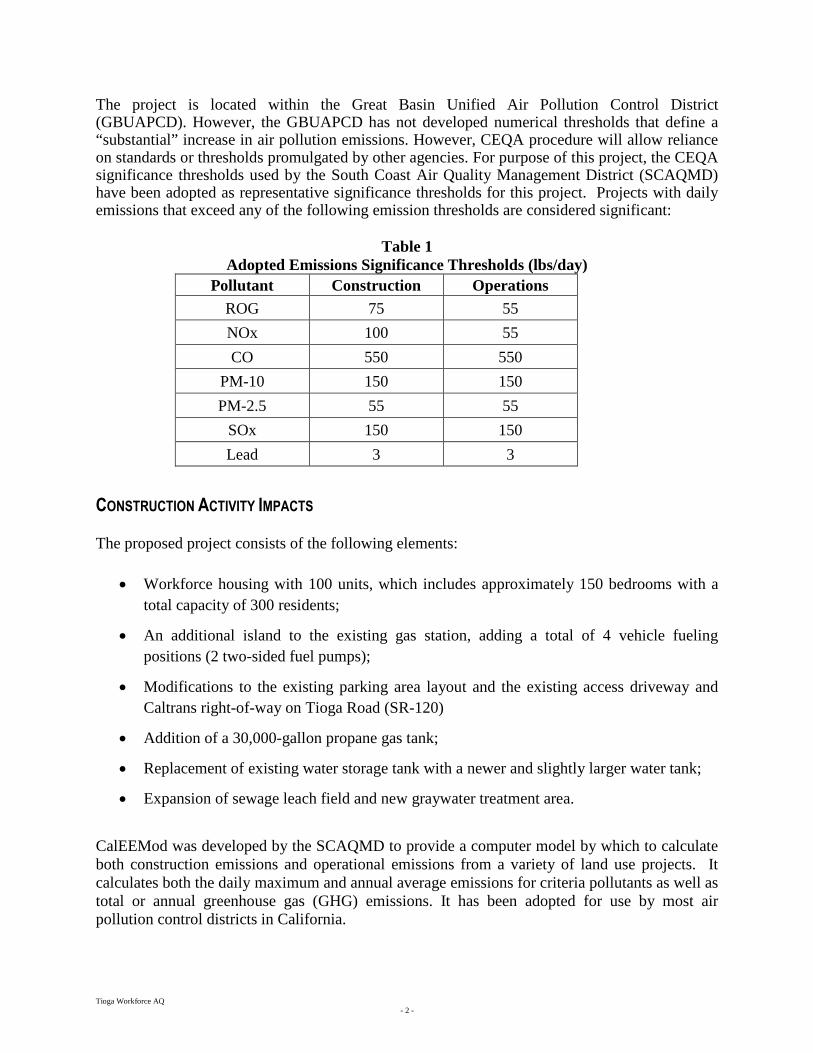
Tioga Workforce AQ- 2 -
The project is located within the Great Basin Unified Air Pollution Control District(GBUAPCD). However, the GBUAPCD has not developed numerical thresholds that define a“substantial” increase in air pollution emissions. However, CEQA procedure will allow relianceon standards or thresholds promulgated by other agencies. For purpose of this project, the CEQAsignificance thresholds used by the South Coast Air Quality Management District (SCAQMD)have been adopted as representative significance thresholds for this project. Projects with dailyemissions that exceed any of the following emission thresholds are considered significant:
Table 1Adopted Emissions Significance Thresholds (lbs/day)
CONSTRUCTION ACTIVITY IMPACTS
The proposed project consists of the following elements:
Workforce housing with 100 units, which includes approximately 150 bedrooms with a
total capacity of 300 residents;
An additional island to the existing gas station, adding a total of 4 vehicle fueling
positions (2 two-sided fuel pumps);
Modifications to the existing parking area layout and the existing access driveway and
Caltrans right-of-way on Tioga Road (SR-120)
Addition of a 30,000-gallon propane gas tank;
Replacement of existing water storage tank with a newer and slightly larger water tank;
Expansion of sewage leach field and new graywater treatment area.
CalEEMod was developed by the SCAQMD to provide a computer model by which to calculateboth construction emissions and operational emissions from a variety of land use projects. Itcalculates both the daily maximum and annual average emissions for criteria pollutants as well astotal or annual greenhouse gas (GHG) emissions. It has been adopted for use by most airpollution control districts in California.
Pollutant Construction Operations
ROG 75 55
NOx 100 55
CO 550 550
PM-10 150 150
PM-2.5 55 55
SOx 150 150
Lead 3 3
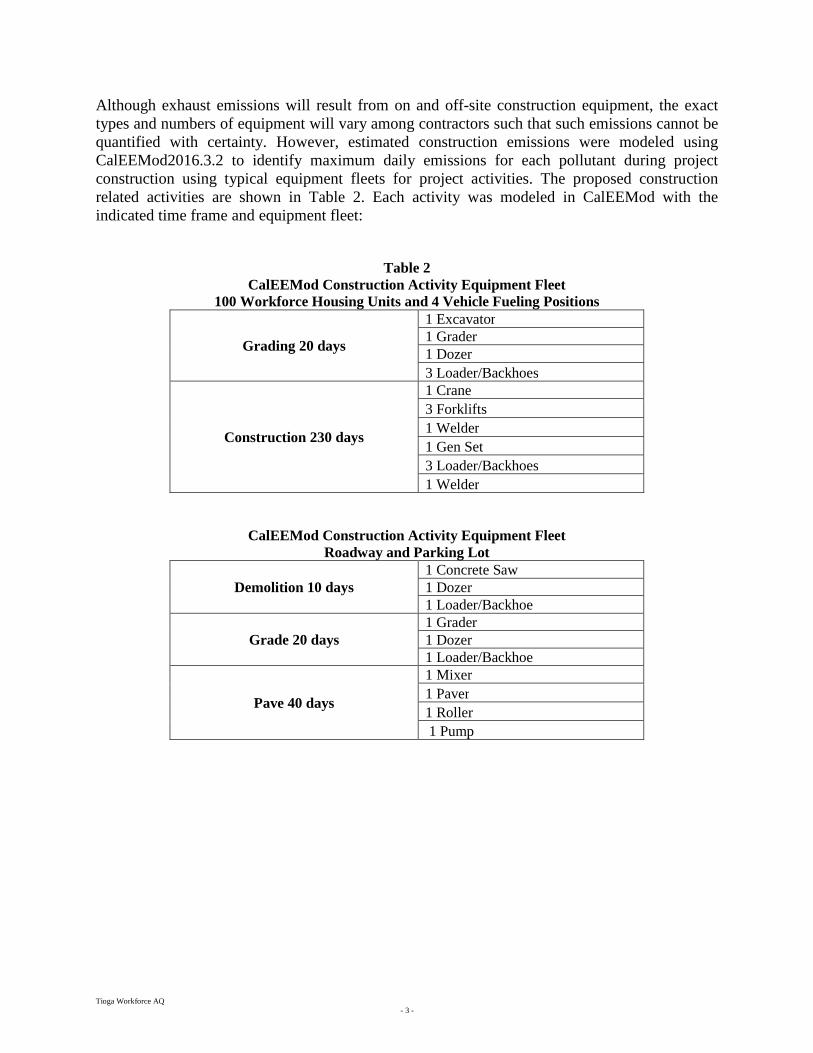
Tioga Workforce AQ- 3 -
Although exhaust emissions will result from on and off-site construction equipment, the exacttypes and numbers of equipment will vary among contractors such that such emissions cannot bequantified with certainty. However, estimated construction emissions were modeled usingCalEEMod2016.3.2 to identify maximum daily emissions for each pollutant during projectconstruction using typical equipment fleets for project activities. The proposed constructionrelated activities are shown in Table 2. Each activity was modeled in CalEEMod with theindicated time frame and equipment fleet:
Table 2CalEEMod Construction Activity Equipment Fleet
100 Workforce Housing Units and 4 Vehicle Fueling Positions
Grading 20 days
1 Excavator1 Grader1 Dozer
3 Loader/Backhoes
Construction 230 days
1 Crane
3 Forklifts
1 Welder
1 Gen Set
3 Loader/Backhoes
1 Welder
CalEEMod Construction Activity Equipment FleetRoadway and Parking Lot
Demolition 10 days1 Concrete Saw1 Dozer1 Loader/Backhoe
Grade 20 days1 Grader1 Dozer1 Loader/Backhoe
Pave 40 days
1 Mixer
1 Paver
1 Roller
1 Pump
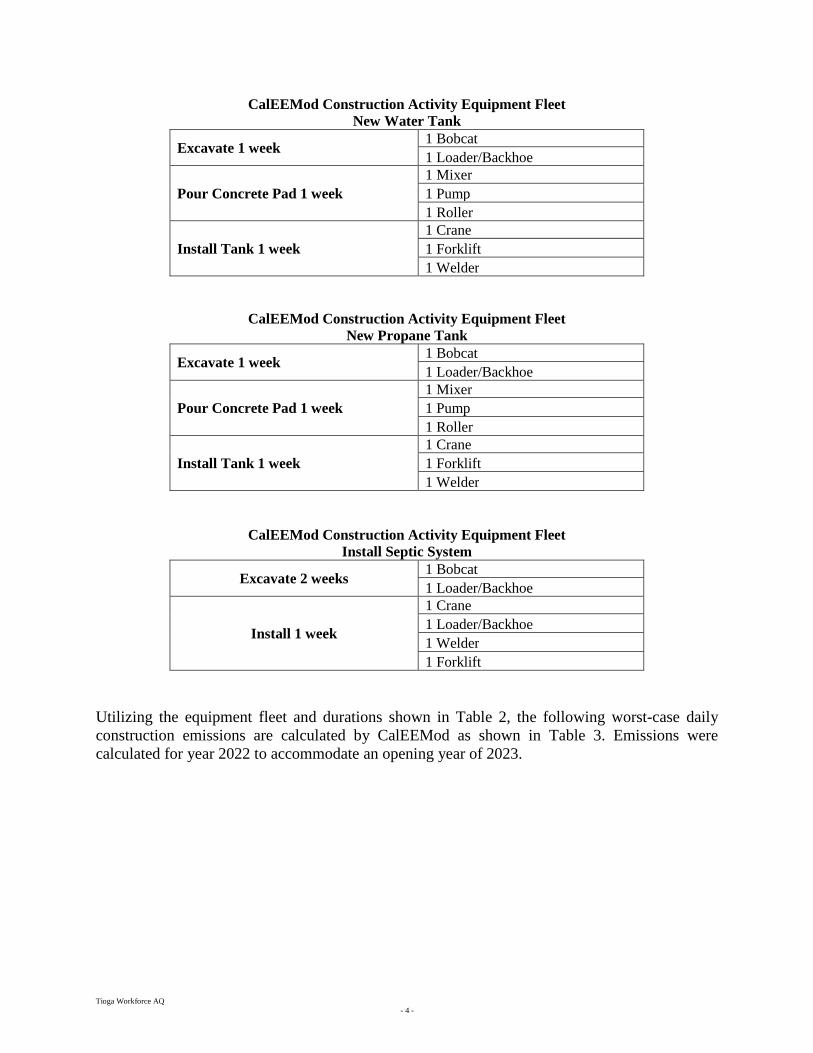
Tioga Workforce AQ- 4 -
CalEEMod Construction Activity Equipment FleetNew Water Tank
Excavate 1 week1 Bobcat
1 Loader/Backhoe
Pour Concrete Pad 1 week
1 Mixer
1 Pump
1 Roller
Install Tank 1 week
1 Crane
1 Forklift
1 Welder
CalEEMod Construction Activity Equipment FleetNew Propane Tank
Excavate 1 week1 Bobcat
1 Loader/Backhoe
Pour Concrete Pad 1 week
1 Mixer
1 Pump
1 Roller
Install Tank 1 week
1 Crane
1 Forklift
1 Welder
CalEEMod Construction Activity Equipment FleetInstall Septic System
Excavate 2 weeks1 Bobcat
1 Loader/Backhoe
Install 1 week
1 Crane
1 Loader/Backhoe
1 Welder
1 Forklift
Utilizing the equipment fleet and durations shown in Table 2, the following worst-case dailyconstruction emissions are calculated by CalEEMod as shown in Table 3. Emissions werecalculated for year 2022 to accommodate an opening year of 2023.

Tioga Workforce AQ- 5 -
Table 3Construction Activity Emissions
Maximum Daily Emissions (pounds/day) 2022
Maximal Construction Emissions ROG NOx CO SO2 PM-10 PM-2.5
Housing and Gas Pumps 16.0 20.9 21.0 0.0 7.6 4.3
Roadways and Parking 1.4 15.5 10.3 0.0 6.9 4.0
New Water Tank 0.5 4.0 4.9 0.0 0.9 0.5
New Propane Tank 0.5 4.0 4.9 0.0 0.9 0.5
Septic System 0.6 5.6 5.3 0.0 0.9 0.5
Total 2022 19.0 50.0 46.4 <0.1 17.2 9.8
Significance Thresholds 75 100 550 150 150 55
Peak daily construction activity emissions are estimated to be well below SCAQMD CEQAthresholds without the need for added mitigation even if all activities occurred simultaneously.No additional adjustments were used.
Construction equipment exhaust contains carcinogenic compounds within the diesel exhaustparticulates. The toxicity of diesel exhaust is evaluated relative to a 24-hour per day, 365 daysper year, 70-year lifetime exposure. Air pollution agencies do not generally require the analysisof construction-related diesel emissions relative to health risk due to the short period for whichthe majority of diesel exhaust would occur. Health risk analyses are typically assessed over a 9-,30-, or 70-year timeframe and not over a relatively brief construction period due to the lack ofhealth risk associated with such a brief exposure.
OPERATIONAL IMPACTS
Operational emissions are primarily attributed to mobile sources. Trip generation estimates usedin modeling were obtained from the project traffic report. The traffic report anticipates thatproject housing will generate 208 daily trips and the additional fueling positions will generate516 daily trips.
In addition to mobile sources from vehicles, general development causes smaller amounts of“area source” air pollution to be generated from on-site energy consumption (primarilylandscaping) and from off-site electrical generation (lighting). These sources represent a minimalpercentage of the total project NOx and CO burdens, and a few percent other pollutants. Theinclusion of such emissions adds negligibly to the total significant project-related emissionsburden as shown in Table 4.
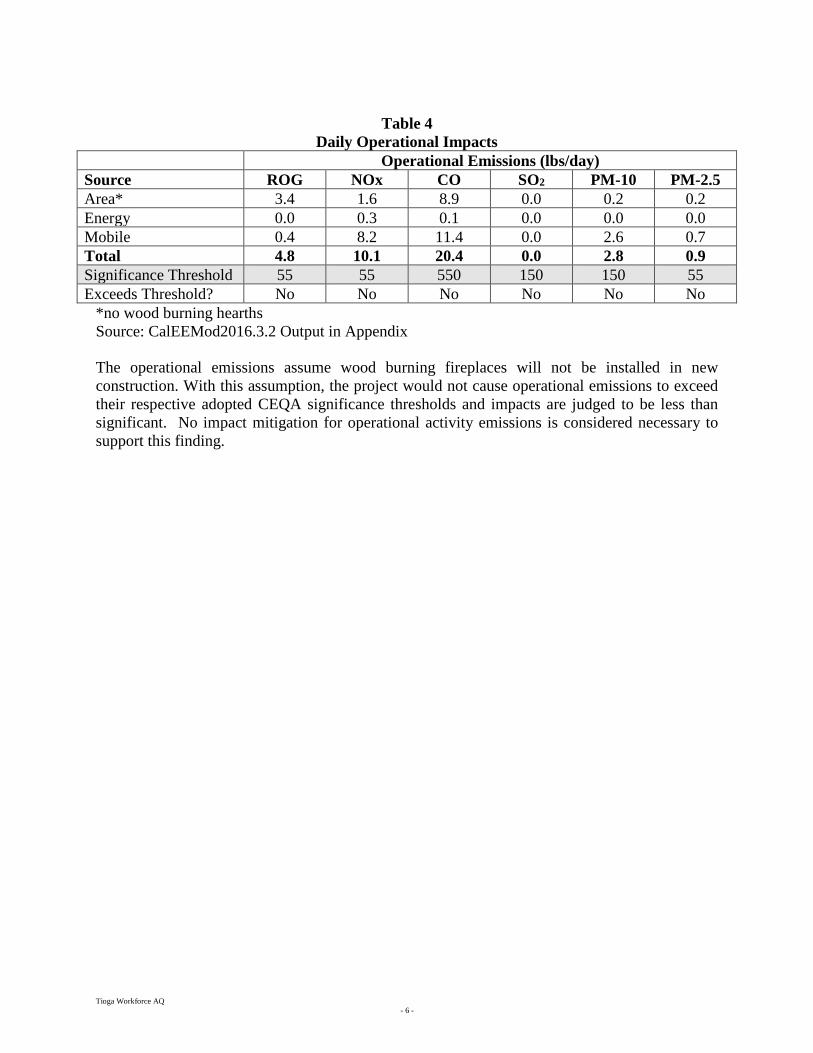
Tioga Workforce AQ- 6 -
Table 4Daily Operational Impacts
Operational Emissions (lbs/day)Source ROG NOx CO SO2 PM-10 PM-2.5Area* 3.4 1.6 8.9 0.0 0.2 0.2Energy 0.0 0.3 0.1 0.0 0.0 0.0Mobile 0.4 8.2 11.4 0.0 2.6 0.7Total 4.8 10.1 20.4 0.0 2.8 0.9Significance Threshold 55 55 550 150 150 55Exceeds Threshold? No No No No No No
*no wood burning hearthsSource: CalEEMod2016.3.2 Output in Appendix
The operational emissions assume wood burning fireplaces will not be installed in newconstruction. With this assumption, the project would not cause operational emissions to exceedtheir respective adopted CEQA significance thresholds and impacts are judged to be less thansignificant. No impact mitigation for operational activity emissions is considered necessary tosupport this finding.
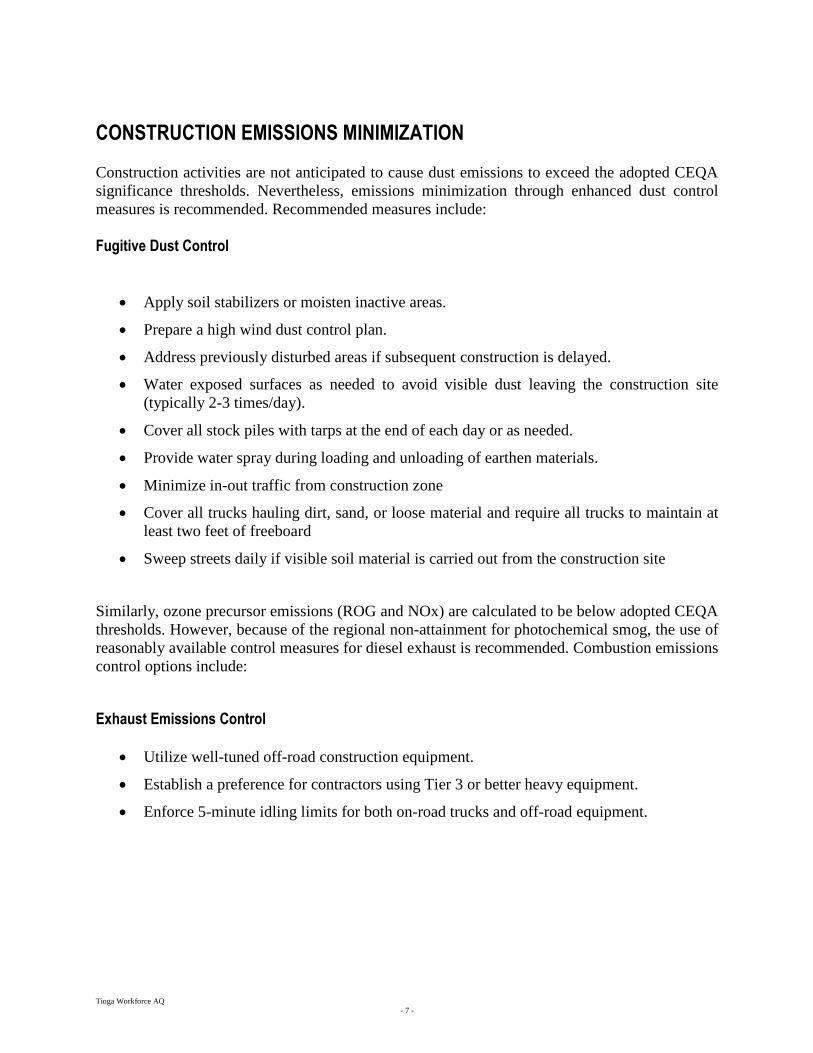
Tioga Workforce AQ- 7 -
CONSTRUCTION EMISSIONS MINIMIZATION
Construction activities are not anticipated to cause dust emissions to exceed the adopted CEQAsignificance thresholds. Nevertheless, emissions minimization through enhanced dust controlmeasures is recommended. Recommended measures include:
Fugitive Dust Control
Apply soil stabilizers or moisten inactive areas.
Prepare a high wind dust control plan.
Address previously disturbed areas if subsequent construction is delayed.
Water exposed surfaces as needed to avoid visible dust leaving the construction site(typically 2-3 times/day).
Cover all stock piles with tarps at the end of each day or as needed.
Provide water spray during loading and unloading of earthen materials.
Minimize in-out traffic from construction zone
Cover all trucks hauling dirt, sand, or loose material and require all trucks to maintain atleast two feet of freeboard
Sweep streets daily if visible soil material is carried out from the construction site
Similarly, ozone precursor emissions (ROG and NOx) are calculated to be below adopted CEQAthresholds. However, because of the regional non-attainment for photochemical smog, the use ofreasonably available control measures for diesel exhaust is recommended. Combustion emissionscontrol options include:
Exhaust Emissions Control
Utilize well-tuned off-road construction equipment.
Establish a preference for contractors using Tier 3 or better heavy equipment.
Enforce 5-minute idling limits for both on-road trucks and off-road equipment.
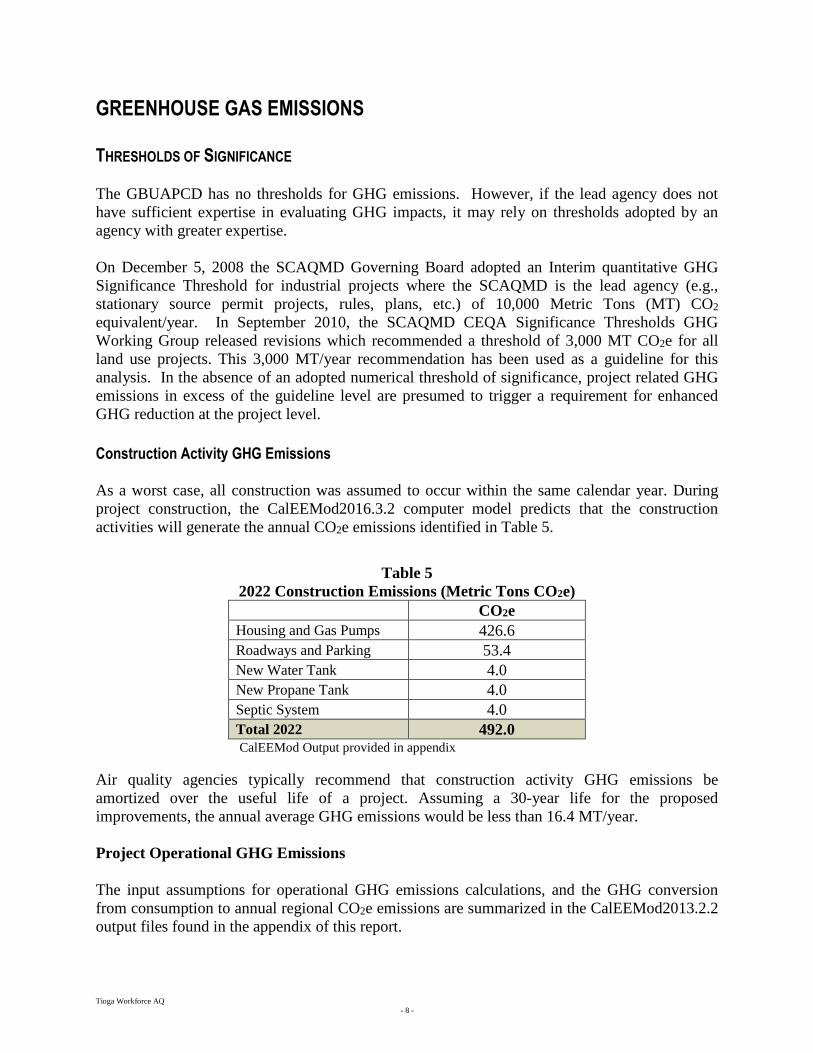
Tioga Workforce AQ- 8 -
GREENHOUSE GAS EMISSIONS
THRESHOLDS OF SIGNIFICANCE
The GBUAPCD has no thresholds for GHG emissions. However, if the lead agency does nothave sufficient expertise in evaluating GHG impacts, it may rely on thresholds adopted by anagency with greater expertise.
On December 5, 2008 the SCAQMD Governing Board adopted an Interim quantitative GHGSignificance Threshold for industrial projects where the SCAQMD is the lead agency (e.g.,stationary source permit projects, rules, plans, etc.) of 10,000 Metric Tons (MT) CO2
equivalent/year. In September 2010, the SCAQMD CEQA Significance Thresholds GHGWorking Group released revisions which recommended a threshold of 3,000 MT CO2e for allland use projects. This 3,000 MT/year recommendation has been used as a guideline for thisanalysis. In the absence of an adopted numerical threshold of significance, project related GHGemissions in excess of the guideline level are presumed to trigger a requirement for enhancedGHG reduction at the project level.
Construction Activity GHG Emissions
As a worst case, all construction was assumed to occur within the same calendar year. Duringproject construction, the CalEEMod2016.3.2 computer model predicts that the constructionactivities will generate the annual CO2e emissions identified in Table 5.
Table 52022 Construction Emissions (Metric Tons CO2e)
CO2eHousing and Gas Pumps 426.6Roadways and Parking 53.4New Water Tank 4.0New Propane Tank 4.0Septic System 4.0Total 2022 492.0CalEEMod Output provided in appendix
Air quality agencies typically recommend that construction activity GHG emissions beamortized over the useful life of a project. Assuming a 30-year life for the proposedimprovements, the annual average GHG emissions would be less than 16.4 MT/year.
Project Operational GHG Emissions
The input assumptions for operational GHG emissions calculations, and the GHG conversionfrom consumption to annual regional CO2e emissions are summarized in the CalEEMod2013.2.2output files found in the appendix of this report.
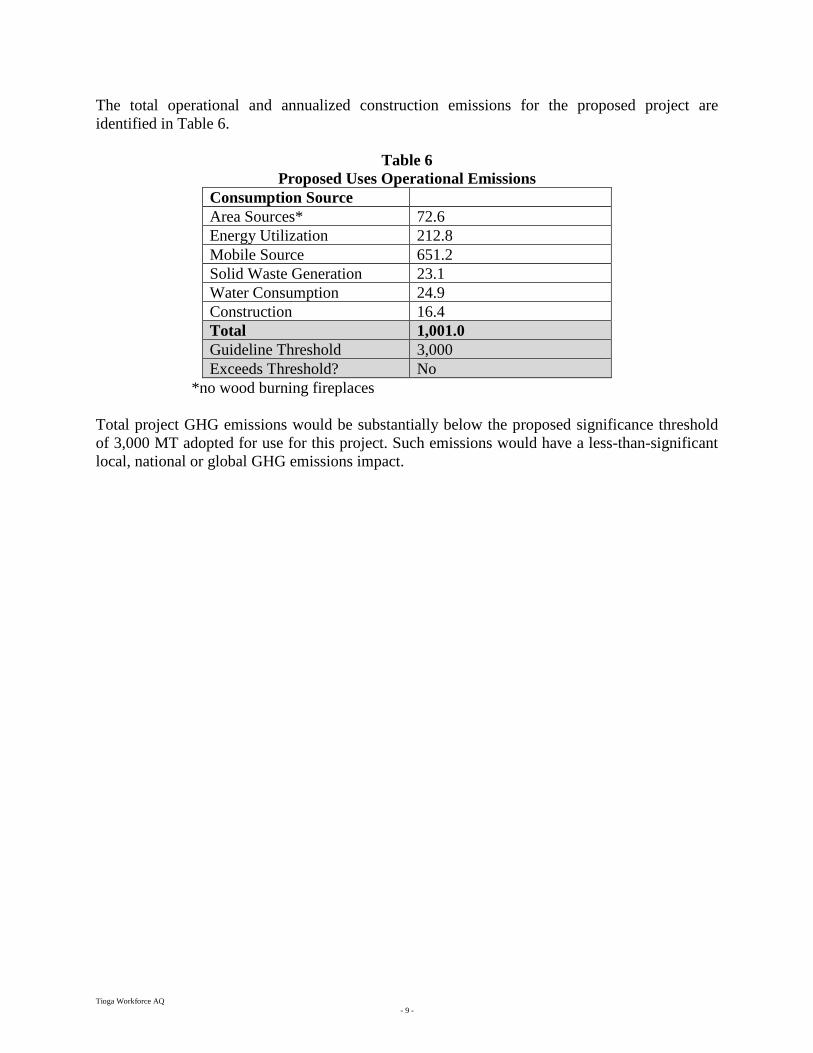
Tioga Workforce AQ- 9 -
The total operational and annualized construction emissions for the proposed project areidentified in Table 6.
Table 6Proposed Uses Operational Emissions
Consumption SourceArea Sources* 72.6Energy Utilization 212.8Mobile Source 651.2Solid Waste Generation 23.1Water Consumption 24.9Construction 16.4Total 1,001.0Guideline Threshold 3,000Exceeds Threshold? No
*no wood burning fireplaces
Total project GHG emissions would be substantially below the proposed significance thresholdof 3,000 MT adopted for use for this project. Such emissions would have a less-than-significantlocal, national or global GHG emissions impact.
Tioga Workforce AQ- 10 -
CALEEMOD2016.3.2 COMPUTER MODEL OUTPUT **
DAILY EMISISONS
ANNUAL EMISSIONS
** THE MODEL OUTPUT DATA ARE AVAILABLE ON REQUEST FROM MONO COUNTY COMMUNITYDEVELOPMENT DEPARTMENT, AND ON THE COUNTY WEBSITE:
https://www.monocounty.ca.gov/planning/page/tioga-inn-specific-plan-seir
APPENDIX N
Noise Assessment
By Giroux & Associates
NOISE IMPACT ANALYSIS
TIOGA INN WORKFORCE HOUSING PROJECT
MONO COUNTY, CALIFORNIA
Prepared for:
Bauer Environmental & Planning ServicesAttn: Sandra Bauer
1271 Tropicana LaneSanta Ana, CA 92705
Prepared by:
Hans GirouxSenior AnalystGiroux & Associates1800 E Garry St., #205Santa Ana, CA 92705
Date:
December 7, 2018
Project No.: P18-023 AQ
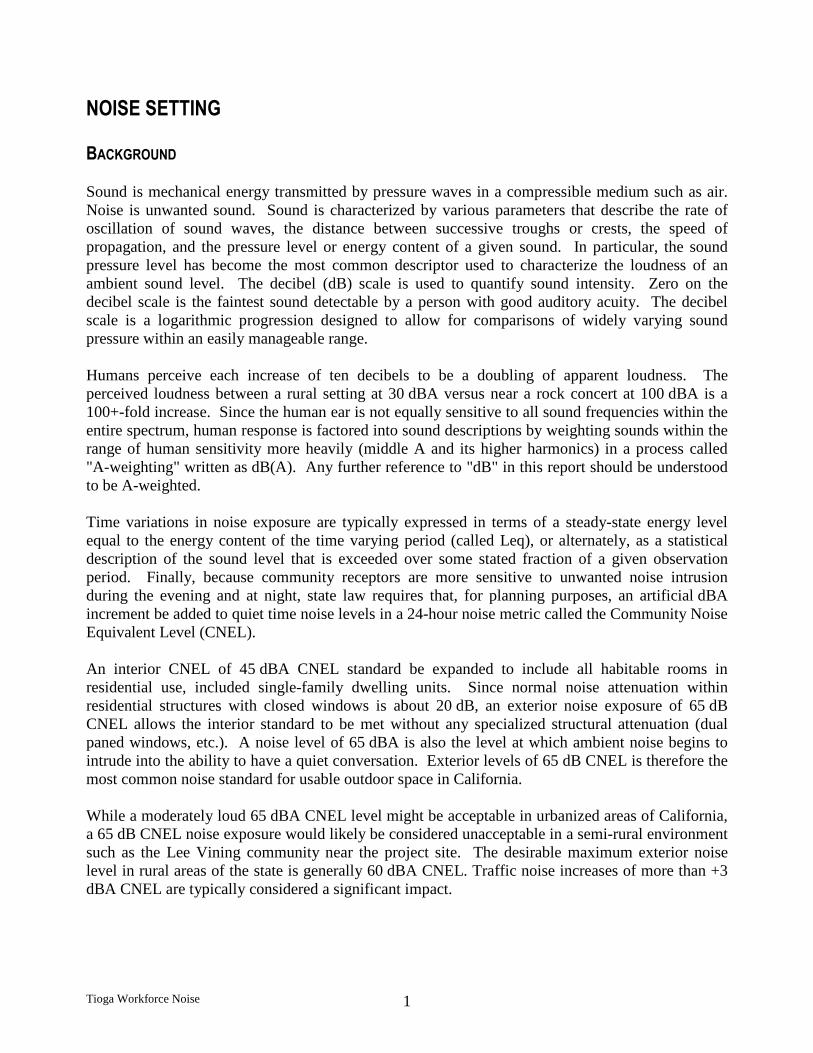
Tioga Workforce Noise 1
NOISE SETTING
BACKGROUND
Sound is mechanical energy transmitted by pressure waves in a compressible medium such as air.Noise is unwanted sound. Sound is characterized by various parameters that describe the rate ofoscillation of sound waves, the distance between successive troughs or crests, the speed ofpropagation, and the pressure level or energy content of a given sound. In particular, the soundpressure level has become the most common descriptor used to characterize the loudness of anambient sound level. The decibel (dB) scale is used to quantify sound intensity. Zero on thedecibel scale is the faintest sound detectable by a person with good auditory acuity. The decibelscale is a logarithmic progression designed to allow for comparisons of widely varying soundpressure within an easily manageable range.
Humans perceive each increase of ten decibels to be a doubling of apparent loudness. Theperceived loudness between a rural setting at 30 dBA versus near a rock concert at 100 dBA is a100+-fold increase. Since the human ear is not equally sensitive to all sound frequencies within theentire spectrum, human response is factored into sound descriptions by weighting sounds within therange of human sensitivity more heavily (middle A and its higher harmonics) in a process called"A-weighting" written as dB(A). Any further reference to "dB" in this report should be understoodto be A-weighted.
Time variations in noise exposure are typically expressed in terms of a steady-state energy levelequal to the energy content of the time varying period (called Leq), or alternately, as a statisticaldescription of the sound level that is exceeded over some stated fraction of a given observationperiod. Finally, because community receptors are more sensitive to unwanted noise intrusionduring the evening and at night, state law requires that, for planning purposes, an artificial dBAincrement be added to quiet time noise levels in a 24-hour noise metric called the Community NoiseEquivalent Level (CNEL).
An interior CNEL of 45 dBA CNEL standard be expanded to include all habitable rooms inresidential use, included single-family dwelling units. Since normal noise attenuation withinresidential structures with closed windows is about 20 dB, an exterior noise exposure of 65 dBCNEL allows the interior standard to be met without any specialized structural attenuation (dualpaned windows, etc.). A noise level of 65 dBA is also the level at which ambient noise begins tointrude into the ability to have a quiet conversation. Exterior levels of 65 dB CNEL is therefore themost common noise standard for usable outdoor space in California.
While a moderately loud 65 dBA CNEL level might be acceptable in urbanized areas of California,a 65 dB CNEL noise exposure would likely be considered unacceptable in a semi-rural environmentsuch as the Lee Vining community near the project site. The desirable maximum exterior noiselevel in rural areas of the state is generally 60 dBA CNEL. Traffic noise increases of more than +3dBA CNEL are typically considered a significant impact.
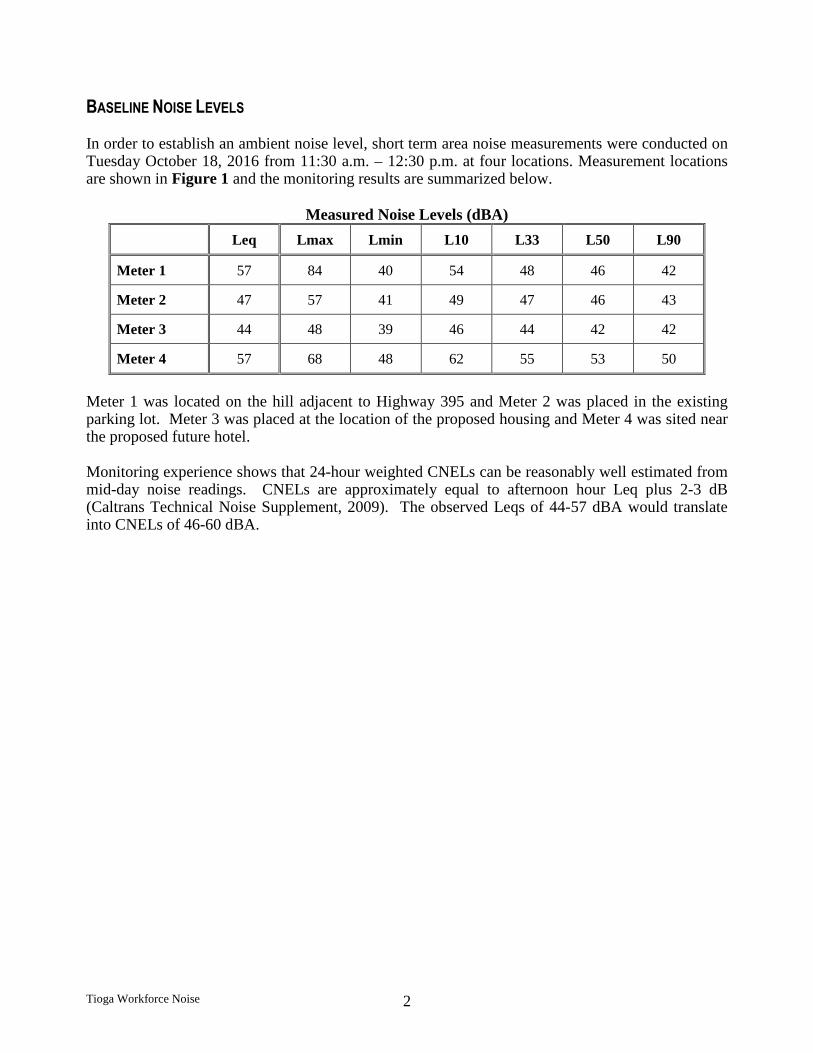
Tioga Workforce Noise 2
BASELINE NOISE LEVELS
In order to establish an ambient noise level, short term area noise measurements were conducted onTuesday October 18, 2016 from 11:30 a.m. – 12:30 p.m. at four locations. Measurement locationsare shown in Figure 1 and the monitoring results are summarized below.
Measured Noise Levels (dBA)
Leq Lmax Lmin L10 L33 L50 L90
Meter 1 57 84 40 54 48 46 42
Meter 2 47 57 41 49 47 46 43
Meter 3 44 48 39 46 44 42 42
Meter 4 57 68 48 62 55 53 50
Meter 1 was located on the hill adjacent to Highway 395 and Meter 2 was placed in the existingparking lot. Meter 3 was placed at the location of the proposed housing and Meter 4 was sited nearthe proposed future hotel.
Monitoring experience shows that 24-hour weighted CNELs can be reasonably well estimated frommid-day noise readings. CNELs are approximately equal to afternoon hour Leq plus 2-3 dB(Caltrans Technical Noise Supplement, 2009). The observed Leqs of 44-57 dBA would translateinto CNELs of 46-60 dBA.
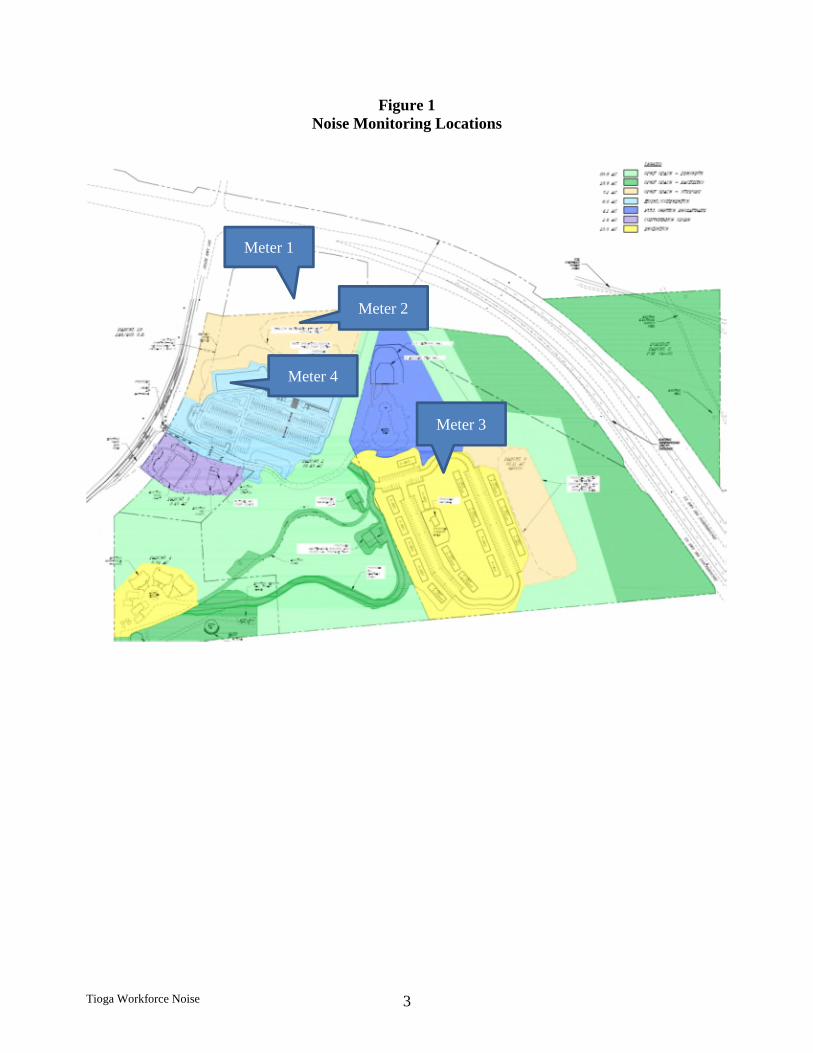
Tioga Workforce Noise 3
Figure 1Noise Monitoring Locations
Meter 2
Meter 3
Meter 1
Meter 4

Tioga Workforce Noise 4
NOISE IMPACTS
Sensitive uses will be subject to incremental increased noise levels from project related traffic andoperations. Short-term construction activities may be audible. Because construction is more likelyto be performed during warmer months rather than in winter, people are more likely to be outside orto have their windows open when construction is in progress.
The closest residences to the site are the existing hilltop residential units. The closest activities thatmay impact these uses is construction of the new water tank and paving the new access roadway.The closest off-site sensitive use to the project site, a residence, is in Lee Vining and isapproximately 0.5 miles to the northwest with access from Lee Vining Avenue.
THRESHOLDS OF SIGNIFICANCE
Noise impacts are significant if they create a substantial temporary or permanent increase in noiselevels, or if they cause a violation of adopted noise/land use compatibility standards in general plansor noise ordinances. Noise from one land use crossing the property line of an adjacent property, areregulated by Section 10.16.060 of the Mono County Code as shown below.
Maximum Allowable Exterior Noise Levels (excluding construction noise)Land Use Allowable Time Noise Level
(dBA)
Residential Single FamilyDaytime (7 a.m.-10 p.m.) 55Nighttime (10 p.m.-7 a.m.) 50
Residential Multi-FamilyDaytime (7 a.m.-10 p.m.) 55Nighttime (10 p.m.-7 a.m.) 50
Public Uses-Schools, Libraries,Hospitals
Daytime (7 a.m.-10 p.m.) 55Nighttime (10 p.m.-7 a.m.) 50
Passive Recreational AreasDaytime (7 a.m.-10 p.m.) 55Nighttime (10 p.m.-7 a.m.) 50
Community Parks and Athletic FieldsDaytime (7 a.m.-10 p.m.) 55Nighttime (10 p.m.-7 a.m.) 50
These noise limits apply to activities occurring on private property. Mono County is pre-emptedfrom regulating on-road traffic noise because such sources are exempt from local ordinance control.However, for new construction, when traffic noise exceeds the planning standard for an affectedland use the County can use discretion regarding compatibility of that use.
Transportation noise impacts may be significant if they create either a substantial permanent ortemporary increase. The term "substantial" is not quantified in CEQA guidelines. In mostenvironmental analyses, "substantial" is taken to mean a level that is clearly perceptible to humans.In practice, this is at least a +3 dBA increase. Under ambient conditions, people generally do notperceive that noise has clearly changed until there is a 3 dBA difference.
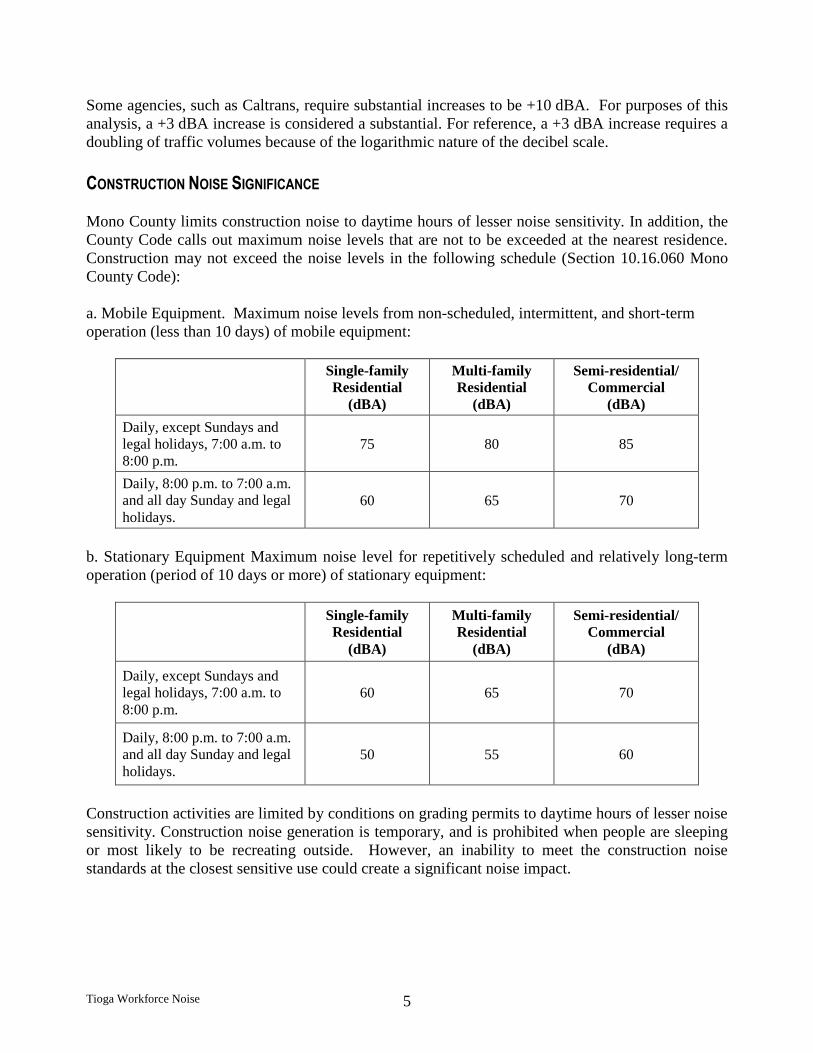
Tioga Workforce Noise 5
Some agencies, such as Caltrans, require substantial increases to be +10 dBA. For purposes of thisanalysis, a +3 dBA increase is considered a substantial. For reference, a +3 dBA increase requires adoubling of traffic volumes because of the logarithmic nature of the decibel scale.
CONSTRUCTION NOISE SIGNIFICANCE
Mono County limits construction noise to daytime hours of lesser noise sensitivity. In addition, theCounty Code calls out maximum noise levels that are not to be exceeded at the nearest residence.Construction may not exceed the noise levels in the following schedule (Section 10.16.060 MonoCounty Code):
a. Mobile Equipment. Maximum noise levels from non-scheduled, intermittent, and short-termoperation (less than 10 days) of mobile equipment:
Single-familyResidential
(dBA)
Multi-familyResidential
(dBA)
Semi-residential/Commercial
(dBA)
Daily, except Sundays andlegal holidays, 7:00 a.m. to8:00 p.m.
75 80 85
Daily, 8:00 p.m. to 7:00 a.m.and all day Sunday and legalholidays.
60 65 70
b. Stationary Equipment Maximum noise level for repetitively scheduled and relatively long-termoperation (period of 10 days or more) of stationary equipment:
Single-familyResidential
(dBA)
Multi-familyResidential
(dBA)
Semi-residential/Commercial
(dBA)
Daily, except Sundays andlegal holidays, 7:00 a.m. to8:00 p.m.
60 65 70
Daily, 8:00 p.m. to 7:00 a.m.and all day Sunday and legalholidays.
50 55 60
Construction activities are limited by conditions on grading permits to daytime hours of lesser noisesensitivity. Construction noise generation is temporary, and is prohibited when people are sleepingor most likely to be recreating outside. However, an inability to meet the construction noisestandards at the closest sensitive use could create a significant noise impact.
Tioga Workforce Noise 6
CONSTRUCTION ANALYSIS
Noise levels of construction equipment anticipated for use in this project were analyzed. In 2006,the Federal Highway Administration (FHWA) published the Roadway Construction Noise Modelthat includes a national database of construction equipment reference noise emissions levels. Inaddition, the database provides an acoustical usage factor to estimate the fraction of time each pieceof construction equipment is operating at full power during a construction phase. The usage factor isa key input variable that is used to calculate the average Leq noise levels.
Table 1 identifies highest (Lmax) noise levels associated with each type of equipment identified foruse, then adjusts this noise level for distance to the closest sensitive receptor and the extent ofequipment usage (usage factor), which is represented as Leq. The table is organized by activity andassociated equipment.
Quantitatively, the primary noise prediction equation is expressed as follows for the hourly averagenoise level (Leq) at distance D between the source and receiver (dBA):
Leq = Lmax @ 50’ – 20 log (D/50’) + 10log (U.F%/100) – I.L.(bar)
Where:
Lmax @ 50’ is the published reference noise level at 50 feetU.F.% is the usage factor for full power operation per hourI.L.(bar) is the insertion loss for intervening barriers
For the proposed project, the construction fleet could include equipment such as shown in Table 1which describes the noise level for each individual piece of equipment.
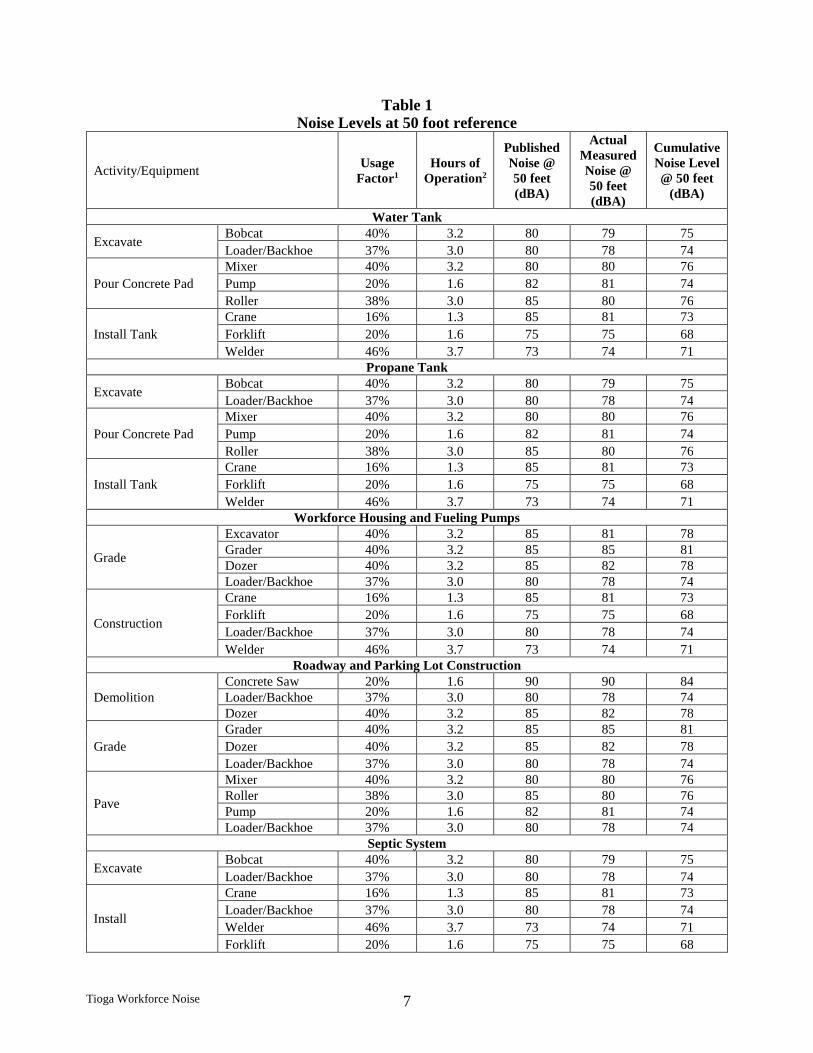
Tioga Workforce Noise 7
Table 1Noise Levels at 50 foot reference
Activity/EquipmentUsage
Factor1Hours of
Operation2
PublishedNoise @50 feet(dBA)
ActualMeasuredNoise @50 feet(dBA)
CumulativeNoise Level@ 50 feet
(dBA)
Water Tank
ExcavateBobcat 40% 3.2 80 79 75
Loader/Backhoe 37% 3.0 80 78 74
Pour Concrete Pad
Mixer 40% 3.2 80 80 76
Pump 20% 1.6 82 81 74
Roller 38% 3.0 85 80 76
Install Tank
Crane 16% 1.3 85 81 73
Forklift 20% 1.6 75 75 68
Welder 46% 3.7 73 74 71Propane Tank
ExcavateBobcat 40% 3.2 80 79 75
Loader/Backhoe 37% 3.0 80 78 74
Pour Concrete Pad
Mixer 40% 3.2 80 80 76
Pump 20% 1.6 82 81 74
Roller 38% 3.0 85 80 76
Install Tank
Crane 16% 1.3 85 81 73
Forklift 20% 1.6 75 75 68
Welder 46% 3.7 73 74 71Workforce Housing and Fueling Pumps
Grade
Excavator 40% 3.2 85 81 78Grader 40% 3.2 85 85 81Dozer 40% 3.2 85 82 78Loader/Backhoe 37% 3.0 80 78 74
Construction
Crane 16% 1.3 85 81 73
Forklift 20% 1.6 75 75 68
Loader/Backhoe 37% 3.0 80 78 74
Welder 46% 3.7 73 74 71Roadway and Parking Lot Construction
DemolitionConcrete Saw 20% 1.6 90 90 84Loader/Backhoe 37% 3.0 80 78 74Dozer 40% 3.2 85 82 78
Grade
Grader 40% 3.2 85 85 81
Dozer 40% 3.2 85 82 78
Loader/Backhoe 37% 3.0 80 78 74
Pave
Mixer 40% 3.2 80 80 76Roller 38% 3.0 85 80 76Pump 20% 1.6 82 81 74Loader/Backhoe 37% 3.0 80 78 74
Septic System
ExcavateBobcat 40% 3.2 80 79 75
Loader/Backhoe 37% 3.0 80 78 74
Install
Crane 16% 1.3 85 81 73
Loader/Backhoe 37% 3.0 80 78 74
Welder 46% 3.7 73 74 71
Forklift 20% 1.6 75 75 68
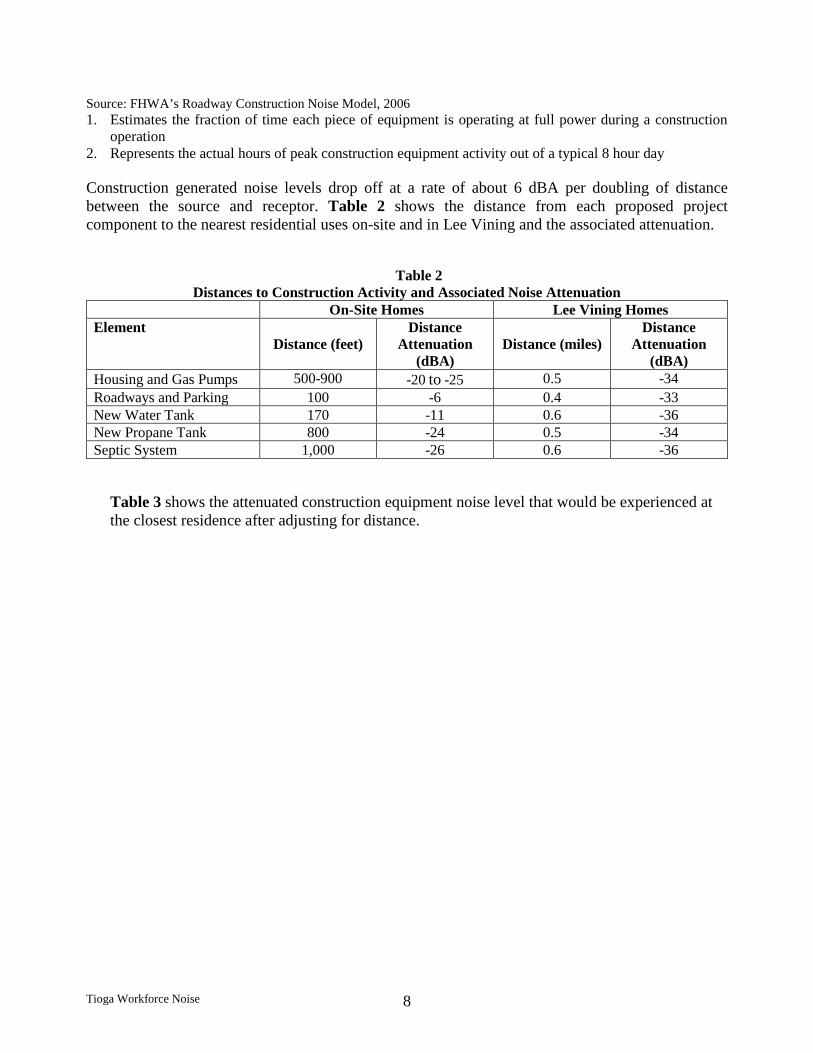
Tioga Workforce Noise 8
Source: FHWA’s Roadway Construction Noise Model, 20061. Estimates the fraction of time each piece of equipment is operating at full power during a construction
operation2. Represents the actual hours of peak construction equipment activity out of a typical 8 hour day
Construction generated noise levels drop off at a rate of about 6 dBA per doubling of distancebetween the source and receptor. Table 2 shows the distance from each proposed projectcomponent to the nearest residential uses on-site and in Lee Vining and the associated attenuation.
Table 2Distances to Construction Activity and Associated Noise Attenuation
On-Site Homes Lee Vining HomesElement
Distance (feet)Distance
Attenuation(dBA)
Distance (miles)Distance
Attenuation(dBA)
Housing and Gas Pumps 500-900 -20 to -25 0.5 -34
Roadways and Parking 100 -6 0.4 -33New Water Tank 170 -11 0.6 -36New Propane Tank 800 -24 0.5 -34Septic System 1,000 -26 0.6 -36
Table 3 shows the attenuated construction equipment noise level that would be experienced atthe closest residence after adjusting for distance.
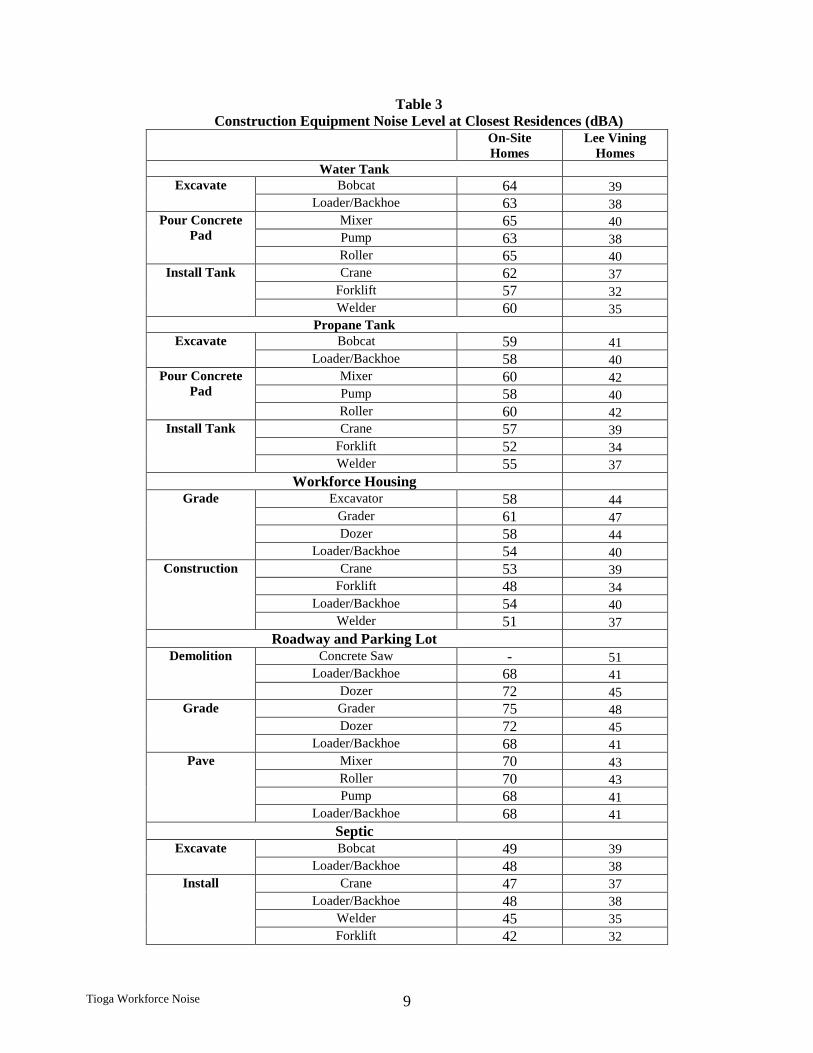
Tioga Workforce Noise 9
Table 3Construction Equipment Noise Level at Closest Residences (dBA)
On-SiteHomes
Lee ViningHomes
Water TankExcavate Bobcat 64 39
Loader/Backhoe 63 38Pour Concrete
PadMixer 65 40Pump 63 38Roller 65 40
Install Tank Crane 62 37Forklift 57 32Welder 60 35
Propane TankExcavate Bobcat 59 41
Loader/Backhoe 58 40Pour Concrete
PadMixer 60 42Pump 58 40Roller 60 42
Install Tank Crane 57 39Forklift 52 34Welder 55 37
Workforce HousingGrade Excavator 58 44
Grader 61 47Dozer 58 44
Loader/Backhoe 54 40Construction Crane 53 39
Forklift 48 34Loader/Backhoe 54 40
Welder 51 37
Roadway and Parking LotDemolition Concrete Saw - 51
Loader/Backhoe 68 41Dozer 72 45
Grade Grader 75 48Dozer 72 45
Loader/Backhoe 68 41Pave Mixer 70 43
Roller 70 43Pump 68 41
Loader/Backhoe 68 41
SepticExcavate Bobcat 49 39
Loader/Backhoe 48 38
Install Crane 47 37
Loader/Backhoe 48 38
Welder 45 35
Forklift 42 32
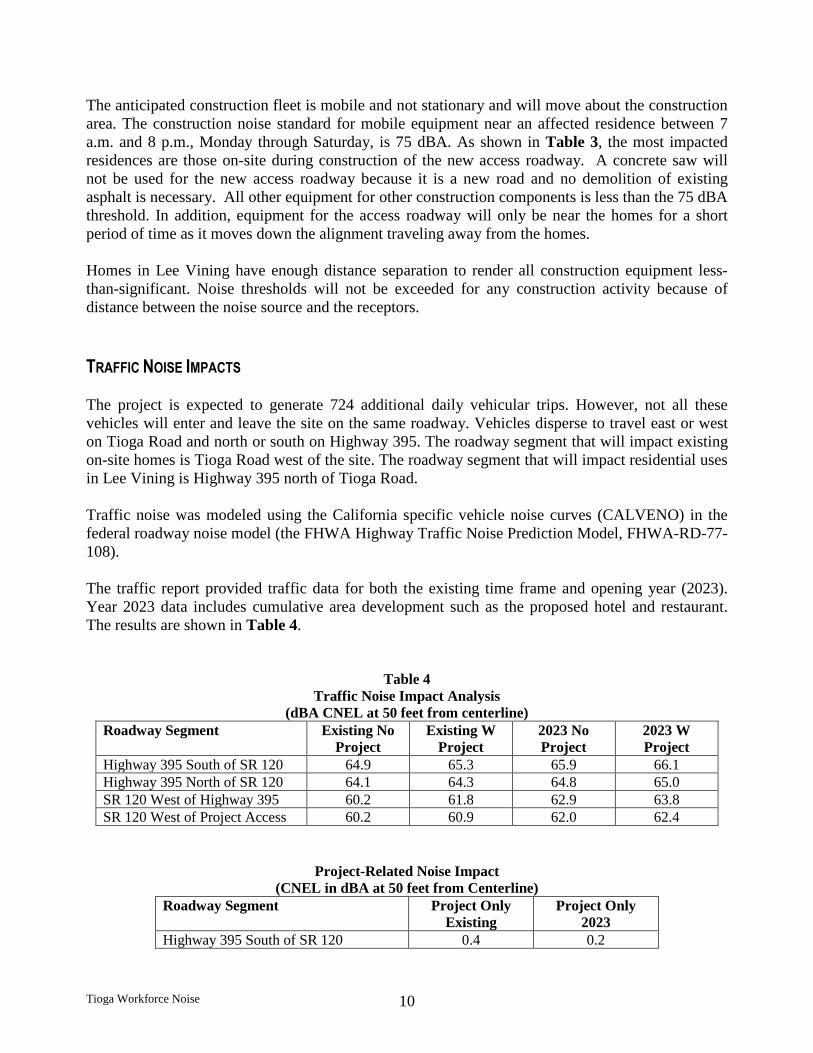
Tioga Workforce Noise 10
The anticipated construction fleet is mobile and not stationary and will move about the constructionarea. The construction noise standard for mobile equipment near an affected residence between 7a.m. and 8 p.m., Monday through Saturday, is 75 dBA. As shown in Table 3, the most impactedresidences are those on-site during construction of the new access roadway. A concrete saw willnot be used for the new access roadway because it is a new road and no demolition of existingasphalt is necessary. All other equipment for other construction components is less than the 75 dBAthreshold. In addition, equipment for the access roadway will only be near the homes for a shortperiod of time as it moves down the alignment traveling away from the homes.
Homes in Lee Vining have enough distance separation to render all construction equipment less-than-significant. Noise thresholds will not be exceeded for any construction activity because ofdistance between the noise source and the receptors.
TRAFFIC NOISE IMPACTS
The project is expected to generate 724 additional daily vehicular trips. However, not all thesevehicles will enter and leave the site on the same roadway. Vehicles disperse to travel east or weston Tioga Road and north or south on Highway 395. The roadway segment that will impact existingon-site homes is Tioga Road west of the site. The roadway segment that will impact residential usesin Lee Vining is Highway 395 north of Tioga Road.
Traffic noise was modeled using the California specific vehicle noise curves (CALVENO) in thefederal roadway noise model (the FHWA Highway Traffic Noise Prediction Model, FHWA-RD-77-108).
The traffic report provided traffic data for both the existing time frame and opening year (2023).Year 2023 data includes cumulative area development such as the proposed hotel and restaurant.The results are shown in Table 4.
Table 4Traffic Noise Impact Analysis
(dBA CNEL at 50 feet from centerline)Roadway Segment Existing No
ProjectExisting W
Project2023 NoProject
2023 WProject
Highway 395 South of SR 120 64.9 65.3 65.9 66.1Highway 395 North of SR 120 64.1 64.3 64.8 65.0SR 120 West of Highway 395 60.2 61.8 62.9 63.8SR 120 West of Project Access 60.2 60.9 62.0 62.4
Project-Related Noise Impact(CNEL in dBA at 50 feet from Centerline)
Roadway Segment Project OnlyExisting
Project Only2023
Highway 395 South of SR 120 0.4 0.2
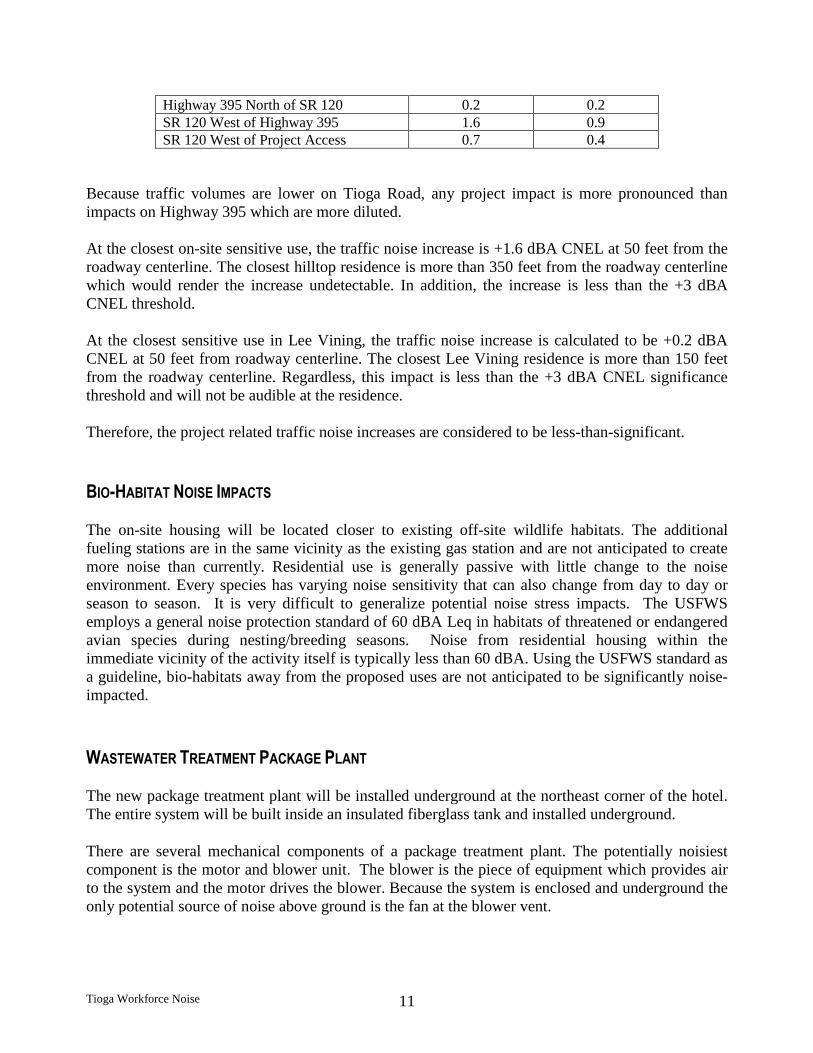
Tioga Workforce Noise 11
Highway 395 North of SR 120 0.2 0.2SR 120 West of Highway 395 1.6 0.9SR 120 West of Project Access 0.7 0.4
Because traffic volumes are lower on Tioga Road, any project impact is more pronounced thanimpacts on Highway 395 which are more diluted.
At the closest on-site sensitive use, the traffic noise increase is +1.6 dBA CNEL at 50 feet from theroadway centerline. The closest hilltop residence is more than 350 feet from the roadway centerlinewhich would render the increase undetectable. In addition, the increase is less than the +3 dBACNEL threshold.
At the closest sensitive use in Lee Vining, the traffic noise increase is calculated to be +0.2 dBACNEL at 50 feet from roadway centerline. The closest Lee Vining residence is more than 150 feetfrom the roadway centerline. Regardless, this impact is less than the +3 dBA CNEL significancethreshold and will not be audible at the residence.
Therefore, the project related traffic noise increases are considered to be less-than-significant.
BIO-HABITAT NOISE IMPACTS
The on-site housing will be located closer to existing off-site wildlife habitats. The additionalfueling stations are in the same vicinity as the existing gas station and are not anticipated to createmore noise than currently. Residential use is generally passive with little change to the noiseenvironment. Every species has varying noise sensitivity that can also change from day to day orseason to season. It is very difficult to generalize potential noise stress impacts. The USFWSemploys a general noise protection standard of 60 dBA Leq in habitats of threatened or endangeredavian species during nesting/breeding seasons. Noise from residential housing within theimmediate vicinity of the activity itself is typically less than 60 dBA. Using the USFWS standard asa guideline, bio-habitats away from the proposed uses are not anticipated to be significantly noise-impacted.
WASTEWATER TREATMENT PACKAGE PLANT
The new package treatment plant will be installed underground at the northeast corner of the hotel.The entire system will be built inside an insulated fiberglass tank and installed underground.
There are several mechanical components of a package treatment plant. The potentially noisiestcomponent is the motor and blower unit. The blower is the piece of equipment which provides airto the system and the motor drives the blower. Because the system is enclosed and underground theonly potential source of noise above ground is the fan at the blower vent.
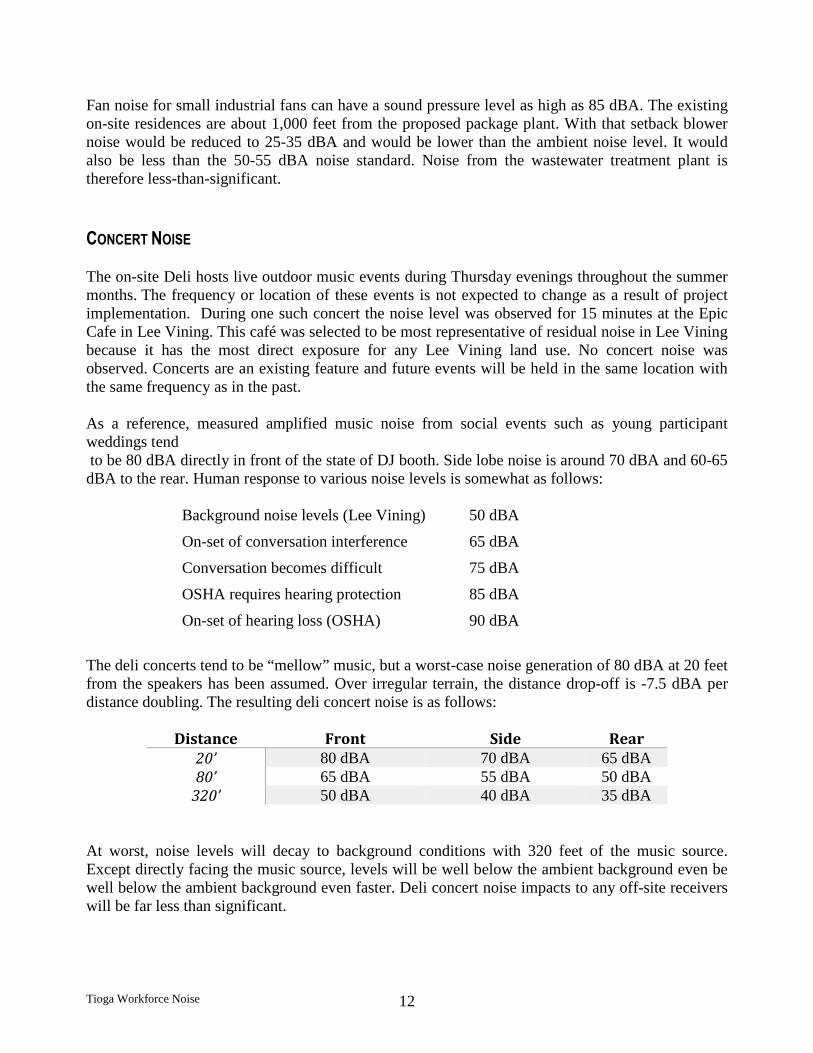
Tioga Workforce Noise 12
Fan noise for small industrial fans can have a sound pressure level as high as 85 dBA. The existingon-site residences are about 1,000 feet from the proposed package plant. With that setback blowernoise would be reduced to 25-35 dBA and would be lower than the ambient noise level. It wouldalso be less than the 50-55 dBA noise standard. Noise from the wastewater treatment plant istherefore less-than-significant.
CONCERT NOISE
The on-site Deli hosts live outdoor music events during Thursday evenings throughout the summermonths. The frequency or location of these events is not expected to change as a result of projectimplementation. During one such concert the noise level was observed for 15 minutes at the EpicCafe in Lee Vining. This café was selected to be most representative of residual noise in Lee Viningbecause it has the most direct exposure for any Lee Vining land use. No concert noise wasobserved. Concerts are an existing feature and future events will be held in the same location withthe same frequency as in the past.
As a reference, measured amplified music noise from social events such as young participantweddings tendto be 80 dBA directly in front of the state of DJ booth. Side lobe noise is around 70 dBA and 60-65dBA to the rear. Human response to various noise levels is somewhat as follows:
Background noise levels (Lee Vining) 50 dBA
On-set of conversation interference 65 dBA
Conversation becomes difficult 75 dBA
OSHA requires hearing protection 85 dBA
On-set of hearing loss (OSHA) 90 dBA
The deli concerts tend to be “mellow” music, but a worst-case noise generation of 80 dBA at 20 feetfrom the speakers has been assumed. Over irregular terrain, the distance drop-off is -7.5 dBA perdistance doubling. The resulting deli concert noise is as follows:
Distance Front Side Rear20’ 80 dBA 70 dBA 65 dBA80’ 65 dBA 55 dBA 50 dBA
320’ 50 dBA 40 dBA 35 dBA
At worst, noise levels will decay to background conditions with 320 feet of the music source.Except directly facing the music source, levels will be well below the ambient background even bewell below the ambient background even faster. Deli concert noise impacts to any off-site receiverswill be far less than significant.
Tioga Workforce Noise 13
SUMMARY AND MITIGATION
Noise impact mitigation recommendations include:
Performing construction activities during times of lesser noise sensitivity regulated byordinance.
With adherence to these the time of day guidelines, construction noise at on and off-site uses is notexpected to exceed the Mono County noise thresholds.
Project-related traffic noise changes on existing roadways are less than significant.
Operational noise from the proposed package treatment plan will be undetectable at on and off-sitesensitive uses.

APPENDIX O
Minor Level Visual Analysis

MINOR LEVEL VISUAL IMPACT ASSESSMENTTioga Workforce Housing Project
Prepared by:Bauer Planning and Environmental Services, Inc.
Date Prepared:14 June 2018
PURPOSE OF STUDY AND ASSESSMENT METHODThe purpose of this visual impact assessment (VIA) is to document potential visual impacts caused by theproposed project and propose measures to lessen any detrimental impacts that are identified. Visual impacts aredemonstrated by identifying visual resources in the project area, measuring the amount of change that wouldoccur as a result of the project, and predicting how the affected public would respond to or perceive thosechanges. This visual impact assessment follows the guidance outlined in the publication Visual Impact Assessmentfor Highway Projects published by the Federal Highway Administration (FHWA) in March 1981.
PROJECT DESCRIPTIONThe Tioga Inn project proposal encompasses multiple elements, many of which were analyzed in a Final EIR andSpecific Plan that was certified by the Mono County Board of Supervisors in 1993. The original concept, asreflected in the 1993 documents, was to provide a full range of services and facilities (hotel, full service restaurant,deli, convenience store, gas station, picnic area, oversize parking, air and water, public restrooms etc.) for tourists,and meeting facilities, jobs and employee housing opportunities for area residents.
The current proposal retains the goals and concepts developed in 1993, with several newly added elements. Mostsignificantly, the current proposal would provide up to 150 new workforce housing bedrooms. The currentproposal also provides for a third gas pump island and overhead canopy, expands the existing onsite septic systemto increase capacity and incorporate a greywater reclamation system, replaces an existing water storage tankwith a new and slightly larger tank on a nearby site, increases the number and capacity of the onsite propanetanks, modifies the acreage and boundaries of designated open space, and modifies the acreage and boundariesof project parcels.
Several of the uses approved in 1993 were constructed and placed into operation during the late 1990s.Construction of the hotel and restaurant elements was postponed due to a general economic downturn and otherfactors. The purpose of the current project proposal is to incorporate modifications and new elements to theapproved Specific Plan to better respond to evolving trends in tourism, resource conservation and employment.
The proposed project elements are expected to have limited visibility or no visibility from surrounding scenichighways (including US 395-a State Scenic Highway, and SR120-a County Scenic Highway). The proposedworkforce housing (including preparatory grading and permanent lighting and vegetation) will be visible from ashort segment of US395 south of the project site, and the new water storage tank will be visible from SR 120,though less visible than the existing water storage tank (which is about 100’ closer to SR120 and will bedemolished). Other proposed new elements will be location out of the view from (or only nominally visible from)US395 and SR120, including the third gas pump island and overhead canopy, the expanded septic and greywaterreclamation system, the new 30,000 gallon propane tank, and the open space and parcel boundary modifications.
The existing Mobile Mart and Whoa Nellie Deli development is widely acknowledged for its quality of food andviews1 and the proposed Specific Plan amendments will retain all but 2 project design guidelines: landscapingstandards will be updated to reflect results of a recent biological survey of the site and incorporate enhancedhabitat conservation features; and the specific measures to reduce glare will be replaced by compliance with allapplicable standards from the Mono County Scenic Combining Element and Dark Skies Ordinance.
Project features designed to avoid or minimize adverse effects include the proposed graywater system(developed to provide a nonpotable source of irrigation supply for landscaping), use of solar panels on south-facing roofing slopes (to offset new energy demands from the workforce housing component), excavation of theworkforce housing pad to lower the pad elevation reduce housing visibility), an updated landscape plan thatrequires use of native or native-compatible species and optimizes bitterbrush habitat to offset prior (unrelated)sage scrub habitat losses from fire, retention of the existing Specific Plan requirement for an earthtone colorpalette and use of wood and stone materials (to echo the form and color and materials of the naturalenvironment), landscape screening (to minimize visibility and enhance blending of project element with thesurroundings, and limited signage consistent with Specific Plan provisions.
PROJECT LOCATION AND SETTINGThe project is located on the land directly southwest of the intersection of US395 and SR120, about 1 mile fromthe community of Lee Vining in Mono County. Site access is taken from SR 120 (SR 120 is the sole eastern accessinto Yosemite) about 600’ south of the US395/SR120 intersection. Site elevations vary, but the existing projectfeatures (gas station, deli, convenience store) are about 200’ higher than the Mono Lake level.
Mono Lake is a soda saline lake with strongly alkaline waters and high concentrations of carbonate salts, sodiumchloride and other dissolved salts. Soda saline environments are among the most extreme of aquaticenvironments on earth, supporting highly productive ecosystems. Soda lakes are found in arid and semi-aridareas around the world, often associated with tectonic rifts such as occur in the East African and in Owens Valleywhich supports two soda saline lakes (Mono Lake and Owens Dry Lake).2 3 These natural conditions frequentlyresult in highly unique, expansive and generally austere aesthetic conditions, such as occur in the largelyundeveloped Mono basin. In combination with the dramatic Sierra escarpment leading into Yosemite NationalPark, the otherworldly beauty of Mono Lake is among the outstanding scenic vistas of the world. Tourism ishighest during summer months, when SR120 (the only eastern access into Yosemite National Park) is open. Bothhighways that serve the project site are designated scenic highways: US395 is a State Scenic Highway, and sr120is a County Scenic Highway (eligible for designation as a State Scenic Highway).
VISUAL RESOURCES AND RESOURCE CHANGEVisual resources of the project setting are defined and identified below by assessing visual character and visualquality in the project corridor. Resource change is assessed by evaluating the visual character and the visualquality of the visual resources that comprise the project corridor before and after the construction of the proposedproject.
The visual character of the proposed project will be compatible with the existing visual character of the corridor.The proposed project elements will conform to the style, color palette, building materials, and character of theexisting project elements, with very limited visibility from off-site populated areas. The workforce housingdevelopment will be the most prominent of the newly proposed elements. Located on the land ‘saddle’ directlysouth of the existing ‘flagpole,’ this development will be higher than the adjoining slopes to the north and south.To minimize visibility, the workforce housing pad will be excavated near the ridgeline from its present elevation of
1 http://www.latimes.com/travel/la-tr-california-bucket-list-updates-1502840908-htmlstory.html (LA Times, August 2017);https://www.cntraveler.com/stories/2016-02-01/gas-stations-where-youll-want-to-fill-up-on-food (Conde Nast, February2016) http://www.sacbee.com/entertainment/living/travel/sam-mcmanis/article2578395.html (Sacramento Bee, August 2013).2 USGS, Geologic Map of Long Valley Caldera, E. California, Roy Bailey: https://pubs.usgs.gov/dds/dds-81/GeologicalMaps/ScannedMap/Bailey_1989.pdf3 Wikipedia: https://en.wikipedia.org/wiki/Soda_lake.
approximately 6,950-6,955’ to a future elevation of 6,936’-6945’, removing an estimated 60,800 cubic yards ofmaterial; a majority of the excess cut materials will be used as fill during construction of the hotel. The excavation,in combination with screening landscape materials (ornamental landscaping along the housing perimeter, andnative landscaping on the slopes), will minimize the visual profile of the workforce housing structures. Interveninglandforms will further reduce visibility of the area within which the workforce housing will be visible, with theresult that direct proximate views of the new housing will be visible from roughly ¼-mile segment of US 395extending south and north of the Picnic Grounds Road turnoff. The visual change in this location is depicted inSchematic Rendering 5.12-6. The housing will not be visible from any part of SR120 due to intervening ridgelinesthat exceed 7,200’ in elevation and are higher than both the housing and SR 120 in this area.
VIEWERS AND VIEWER RESPONSEAs described above, the visual impact of project development on highway motorists will be limited to thesouthern-most workforce housing units which will be visible from a roughly ¼ mile segment of US395. Thehousing area will also be directly visible from South Tufa Beach, and also from Panum Crater. However, the site isa very minor element when seen from these locations due to distance (the site is about 4 miles from PanumCrater, and 5 miles from South Tufa Beach) and due to the dominant Sierra Nevada backdrop, as shown in Exhibit5.12-5.
Due to intervening topography, none of the newly proposed elements will be visible from Lee Vining or fromCounty Park, or from the Epic Cafe (as shown in Exhibit 5.12-7), and none would be visible from SR120. It isanticipated that the average response of all viewer groups will be moderate to low.
VISUAL IMPACTVisual impacts will include construction of project elements. The workforce housing development will involve themost extensive earthwork due to its size (the 150-bedroom complex will cover an area of roughly 30 acres), anddue to the amount of excavation planned in order to minimize visibility (about 60,800 cy). Associated with theworkforce housing new construction will be the demolition of 6 small housing units currently located south of theflagpole (the occupants will be relocated to the new units when completed). Other project elements that willinvolve varying degrees of earthwork include the hotel (with an estimated 6,100 cy of cut and 45,030 cy of fill,relocated from the housing excavation), and the restaurant (with an estimated 40 cubic yards of cut and 1,370 cyof fill). Minimal earthwork will be required for the addition of a third gas pump island, installation of the newwastewater treatment plan and construction of a new subsurface irrigation system, installation of the newpropane tank, and demolition/replacement of the existing water tank. Most construction tasks will be completedduring the low season (November to mid-May), with exclusions as needed for protection of sensitive andmigrating species. Construction during the low season will minimize the loss of business and also minimize thevisual impact of construction on a primary viewer group (tourists).
Changes proposed as part of Specific Plan Amendment #3 include replacement of the existing measures toreduce light and glare with a new requirement that the project will comply fully with the Mono County ScenicCombining Element and the Dark Sky Ordinance. This change is expected to reduce unwanted light and glaremore effectively than the current Specific Plan provisions, even with the planned addition of solar panels onsouth-facing building roofs.
AVOIDANCE AND MINIMIZATION MEASURESAll visual impact avoidance and minimization measures to date have taken the form of design modifications andproposed changes to the Specific Plan implementation measures. Project features designed to avoid or minimizeadverse effects include the proposed subsurface irrigation system (developed to provide a nonpotable source ofirrigation supply for landscaping), use of solar panels on southfacing roofing slopes (to offset new energydemands from the workforce housing component), excavation of the workforce housing pad (to reduce housingvisibility), an updated landscape plan that requires use of native or native-compatible species to offset prior(unrelated) sage scrub habitat losses from fire, use of the existing Specific Plan color palette and materials,landscape screening (to minimize visibility and enhance blending of project element with the surroundings), and
limited signage consistent with Specific Plan provisions. Mono County Community Development Departmentand the project applicant also intend to collaborate on submittal of a grant application to support construction ofa safe access between the site and Lee Vining, as well as a new wildlife passageway under US 395 for migratoryspecies, and improvements at the SR120/US395 intersection to reduce significant turning movement hazards; it isintended that this grant, if successful, will be used to augment future recommendations of Caltrans’ ongoingtraffic calming studies for US 395 in Lee Vining and environs.
CONCLUSIONSThe considerations outlined in this Minor Level Visual Impact Assessment, in combination with additionalinformation provided in the Caltrans Visual Impact Assessment Questionnaire and Responses, provided in SEIR§5.12, indicate that visual impacts of the proposed Tioga Workforce Housing project will be noticeable and theaverage response of all viewer groups will be moderate to low.