
Unclassified ENV/JM/MONO(2015)50 - ONE
86
Unclassified ENV/JM/MONO(2015)50 Organisation de Coopération et de Développement Économiques Organisation for Economic Co-operation and Development 01-Feb-2017 ___________________________________________________________________________________________ _____________ English - Or. English ENVIRONMENT DIRECTORATE JOINT MEETING OF THE CHEMICALS COMMITTEE AND THE WORKING PARTY ON CHEMICALS, PESTICIDES AND BIOTECHNOLOGY Emission Scenario Document (ESD) on the Use of Textile Dyes Series No. 36 JT03408409 Complete document available on OLIS in its original format This document and any map included herein are without prejudice to the status of or sovereignty over any territory, to the delimitation of international frontiers and boundaries and to the name of any territory, city or area. ENV/JM/MONO(2015)50 Unclassified English - Or. English Cancels & replaces the same document of 21 December 2015
-
Upload
khangminh22 -
Category
Documents
-
view
1 -
download
0
Transcript of Unclassified ENV/JM/MONO(2015)50 - ONE

Unclassified ENV/JM/MONO(2015)50 Organisation de Coopération et de Développement Économiques Organisation for Economic Co-operation and Development 01-Feb-2017
___________________________________________________________________________________________
_____________ English - Or. English ENVIRONMENT DIRECTORATE
JOINT MEETING OF THE CHEMICALS COMMITTEE AND
THE WORKING PARTY ON CHEMICALS, PESTICIDES AND BIOTECHNOLOGY
Emission Scenario Document (ESD) on the Use of Textile Dyes
Series No. 36
JT03408409
Complete document available on OLIS in its original format
This document and any map included herein are without prejudice to the status of or sovereignty over any territory, to the delimitation of
international frontiers and boundaries and to the name of any territory, city or area.
EN
V/JM
/MO
NO
(20
15
)50
Un
classified
En
glish
- Or. E
ng
lish
Cancels & replaces the same document of 21 December 2015

ENV/JM/MONO(2015)50
2

ENV/JM/MONO(2015)50
3
OECD Environment, Health and Safety Publications
Series on Emission Scenario Documents
No. 36
EMISSION SCENARIO DOCUMENT (ESD) ON THE USE OF TEXTILE DYES
Environment Directorate
ORGANISATION FOR ECONOMIC CO-OPERATION AND DEVELOPMENT
Paris 2015

ENV/JM/MONO(2015)50
4
Also published in the Series on Emission Scenario Documents:
No. 1, Guidance Document on Emission Scenario Documents (2000)
No. 2, Emission Scenario Document for Wood preservatives (2000)
No. 3, Emission Scenario Document on Plastic Additives
(2004; revised in 2009)
No. 4, Emission Scenario Document on Water Treatment Chemicals (2004)
No. 5, Emission Scenario Document on Photographic Industry (2004)
No. 6, Emission Scenario Document on Rubber Additives (2004)
No. 7, Emission Scenario Document on Textile Finishing (2004)
No. 8, Emission Scenario Document on Leather Processing (2004)
No. 9, Emission Scenario Document on Photoresist Use in Semiconductor
Manufacturing (2004; revised in 2010)
No. 10, Emission Scenario Document on Lubricants and Lubricant Additives (2004)
No. 11, Emission Scenario Document on Automotive spray application (2004)
No. 12, Emission Scenario Document on Metal finishing (2004)
No. 13, Emission Scenario Document on Antifoulants main document (2005)
No. 14, Emission Scenario Document on Insecticides for Stables and Manure Storage
Systems (2006)
No. 15, Emission Scenario Document on Kraft Pulp Mills (2006)
No. 16, Emission Scenario Document on Non-Integrated Paper Mills (2006)
No. 17, Emission Scenario Document on Recovered Paper Mills (2006)
No. 18, Emission Scenario Document for Insecticides, Acaricides and Products to
Control Other Arthropods for Household and Professional Uses (2008)
No. 19, Complementing Guideline for Writing Emission Scenario Documents: The
Life-Cycle Step “service-life”(2009)
No. 20, Emission Scenario Document on Adhesive Formulation (2009)
No. 21, Emission Scenario Document on the Formulation of Radiation Curable
Coating, Inks, and Adhesives (2009, revised 2010)
No. 22, Emission Scenario Document on Coating Industry (Paints, Lacquers and

ENV/JM/MONO(2015)50
5
Varnishes) (2009)
No. 23, Emission Scenario Document on Pulp, Paper and Board Industry (2009)
No. 24, Emission Scenario Document on Transport and Storage of Chemicals (2009)
No. 25, Emission Scenario Document for Chemicals Used in the Electronics
Industry (2010)
No. 26, Emission Scenario Document on the Blending of Fragrance Oils into Commercial and Consumer
Products (2010)
No. 27, Emission Scenario Document on Radiation Curable Coating, Inks and Adhesives (2011)
No. 28, Emission Scenario Document on the Use of Metalworking Fluids (2011)
No. 29, Emission Scenario Document on the Chemicals Used in Water Based Washing Operations at
Industrial and Institutional Laundries (2011)
No. 30, Emission Scenario Document on the Chemical Industry (2011)
No. 31, Emission Scenario Document on the Chemicals used in oil well production (2012)
No. 32, Emission Scenario Document on Formulation and Application of Thermal and Carbonless Copy
Paper
No. 33, Emission Scenario Document on Industrial use of industrial cleaners
No. 34, Emission Scenario Document on Use Of Adhesives
No. 35, Emission Scenario Document on Chemical Vapour Deposition In The Semiconductor Industry
No. 36, Emission Scenario Documents on the Use of Textile Dyes

ENV/JM/MONO(2015)50
6
ABOUT THE OECD
The Organisation for Economic Co-operation and Development (OECD) is an intergovernmental
organisation in which representatives of 34 industrialised countries in North and South America, Europe
and the Asia and Pacific region, as well as the European Commission, meet to co-ordinate and harmonise
policies, discuss issues of mutual concern, and work together to respond to international problems. Most of
the OECD’s work is carried out by more than 200 specialised committees and working groups composed
of member country delegates. Observers from several countries with special status at the OECD, and from
interested international organisations, attend many of the OECD’s workshops and other meetings.
Committees and working groups are served by the OECD Secretariat, located in Paris, France, which is
organised into directorates and divisions.
The Environment, Health and Safety Division publishes free-of-charge documents in 11 different series:
Testing and Assessment; Good Laboratory Practice and Compliance Monitoring; Pesticides;
Biocides; Risk Management; Harmonisation of Regulatory Oversight in Biotechnology; Safety of
Novel Foods and Feeds; Chemical Accidents; Pollutant Release and Transfer Registers; Emission
Scenario Documents; and Safety of Manufactured Nanomaterials. More information about the
Environment, Health and Safety Programme and EHS publications is available on the OECD’s World
Wide Web site (www.oecd.org/chemicalsafety/).
This publication was developed in the IOMC context. The contents do not necessarily reflect the views or
stated policies of individual IOMC Participating Organisations.
The Inter-Organisation Programme for the Sound Management of Chemicals (IOMC) was established in
1995 following recommendations made by the 1992 UN Conference on Environment and Development to
strengthen co-operation and increase international co-ordination in the field of chemical safety. The
Participating Organisations are FAO, ILO, UNDP, UNEP, UNIDO, UNITAR, WHO, World Bank and
OECD. The purpose of the IOMC is to promote co-ordination of the policies and activities pursued by the
Participating Organisations, jointly or separately, to achieve the sound management of chemicals in
relation to human health and the environment.

ENV/JM/MONO(2015)50
7
This publication is available electronically, at no charge.
For this and many other Environment,
Health and Safety publications, consult the OECD’s
World Wide Web site (www.oecd.org/chemicalsafety/)
or contact:
OECD Environment Directorate,
Environment, Health and Safety Division
2 rue André-Pascal
75775 Paris Cedex 16
France
Fax: (33-1) 44 30 61 80
E-mail: [email protected]
© OECD 2015
Applications for permission to reproduce or translate all or part of this material should
be made to: Head of Publications Service, [email protected], OECD, 2 rue André-
Pascal, 75775 Paris Cedex 16, France

ENV/JM/MONO(2015)50
8
EXPLANATORY NOTES
Purpose and background
This OECD Emission Scenario Document (ESD) is intended to provide information on the sources,
use patterns, and potential release pathways of non-volatile chemicals used in textile dyes. The document
focuses primarily on the application of dyes to fibers, yarns and fabrics by batch or continuous processes.
The document presents standard approaches for estimating the environmental releases of and occupational
exposures to non-volatile chemicals used in dye formulations.
This ESD may be periodically updated to reflect changes in the industry and new information
available, and extended to cover the industry area in countries other than the lead (the United States). Users
of the document are encouraged to submit comments, corrections, updates, and new information to the
OECD Environment, Health and Safety Division ([email protected]). The comments received
will be forwarded to the OECD Task Force on Exposure Assessment (TFEA), which will review the
comments every two years so that the lead country can update the document. Submitted information will
also be made available to users within the OECD web site (http://www.oecd.org/env/riskassessment).
How to use this document
This document may be used to provide conservative, screening-level estimates of environmental
releases of and occupational exposures to non-volatile chemical components contained in dye
formulations. Such estimates might result in release and exposure amounts that are likely to be higher, or
at least higher than average, than amounts that might actually occur in real world practice.
The users of this ESD should consider how the information contained in the document emulates the
specific scenario being assessed. Where specific information is available, it should be used in lieu of the
defaults presented in this document, as appropriate. All input values (default or ESD-specific) and the
estimated results should be critically reviewed to assure their validity and appropriateness.
Coverage and methodology
The U.S. Environmental Protection Agency (EPA) developed this ESD using relevant data1 and
information on the use of textile dyes in the textile industry, including process descriptions, operating
information, types of dyes used, wastes generated, waste treatment, worker activities, and exposure
information. EPA supplemented the data collected with standard models2 to develop the environmental
release and occupational exposure estimating approaches presented in this ESD. Non-occupational
exposures and environmental releases during consumer use are outside the scope of this document.
The primary sources of information cited in this ESD include information published by the U.S.
Census Bureau’s Economic Census and various EPA and other government sources (e.g. OECD and
regional or state pollution prevention organizations). Additionally, industry experts such as Dr. Warren
Jasper (North Carolina State University College of Textiles) and the Ecological and Toxicological
1 Please refer to Section 8 for a list of the specific references used in developing this ESD.
2 EPA has developed a series of “standard” models for use in performing conservative release and exposure
assessments in the absence of chemical- or industry-specific data. Several of these standard models are described in
Appendix B to the ESD.

ENV/JM/MONO(2015)50
9
Association of Dyes and Organic Pigments (ETAD) provided input for this ESD. Additional information
on the sources investigated and the references cited in this document are presented in Section 8.
The information in this document is based on U.S. data. Certain aspects of the application process of
dye products may differ in other countries; therefore, alternate assumptions and parameters may be
necessary in some applications of this emission scenario.
This ESD includes methods for estimating the environmental releases of and associated occupational
exposures to non-volatile chemical components used during the use of dye products in batch and
continuous processes. The scope of the ESD will only cover the industrial end use of textile dyes. The
manufacturing of the dyes, the formulation of dyestuffs, the use of the product manufactured with the dye
(e.g. use of textiles, fabrics), and end of life considerations are outside the scope of the ESD. Note that for
the purposes of the ESD, the use of dye in the textiles dyeing process is considered to be the dye
application to yarn, textile or fabric, and does not assess releases from subsequent finishing steps, which
may involve washing steps. Figure 1 provides an illustration of the scope of the ESD within the lifecycle of
a chemical of interest.
Figure 1. Textile Dye Chemical Life-Cycle Diagram
To estimate environmental releases for the dyeing process, this ESD assumes that chemicals used in
textile dyes are nonvolatile. EPA often assumes chemicals are nonvolatile if the vapor pressure is less than
0.001 torr (0.133 Pa). Nonvolatile chemicals result in negligible releases to air from volatilization and
negligible associated inhalation exposures (CEB, 1991). However, other air releases (e.g. dust generation)
from process operations may occur.
The methods for estimating the following facility operating parameters and the releases and exposures
to chemicals used during the application of dye products onto fibers, yarns, or fabrics are discussed in this
ESD, including:
Number of sites in the United States applying dyes containing the chemical of interest onto
various substrates;
Industrial Use of
Dye Chemical in
Textiles Dyeing
Manufacture of
Dye Chemical
Scope of the Scenario
Blending of
Chemical into
Dye Formulation
Fabric Finishing
Commercial /
Consumer Use
Disposal/Recycle

ENV/JM/MONO(2015)50
10
Releases of chemicals during transfer from the container into the process (storage or mixing
vessel);
Releases from transport container residue (via container cleaning or direct disposal of empty
containers);
Releases from disposal of spent dye bath;
Releases from equipment cleaning operations;
Number of workers that may come into contact with the dye product during the textile dyeing
process;
Inhalation and dermal exposures during container unloading;
Inhalation and dermal exposures during container cleaning and disposal;
Dermal exposures during dye machine operation;
Dermal exposures during disposal of spent dyebath.
The estimation methods in this ESD apply to any dye component, regardless of its function within the
dye formulation.
How this document was developed
EPA, with support from Eastern Research Group, Inc. (ERG), has developed this ESD on the use of
textile dyes. The scope of the ESD is designed to serve the needs of both OECD programs as well as EPA.
In the United States, the Risk Assessment Division (RAD) of EPA’s Office of Pollution Prevention and
Toxics (OPPT) is responsible for preparing occupational exposure and environmental release assessments
of chemicals for a variety of programs under the Toxic Substances Control Act (TSCA), including
Premanufacture Notice (PMN) reviews. While OECD ESDs traditionally focus on the potential releases of
chemicals from industrial processes, this document also describes approaches for estimating potential
occupational exposures to chemicals used in the use of textile dyes. The occupational exposure methods
are included so that the ESD may be used to fully support EPA’s chemical review programs.
This ESD supersedes EPA’s 1992 Use of Textile Dyes Generic Scenario. This ESD is considered an
additional ESD that covers a portion of the textile finishing industry and is not meant to supersede the 2004
OECD ESD on the Textile Finishing Industry. This ESD has been revised and expanded to meet EPA’s
revised quality standards for generic scenarios (EPA, 2014). Differences between the previous and
updated scenario include:
General facility estimates (e.g. daily use rate, number of sites, operating days);
Degree of fixation or exhaustion for each dye;
Occupational exposure and environmental release estimates.

ENV/JM/MONO(2015)50
11
A Draft ESD was developed in June 2011 and has been revised multiple times based on internal CEB
comments. The July 2011 revision applied the mass fraction of main dyestuff used per day to the daily dye
formulation use rate, based on information in OECD’s 2004 Emission Scenario Document on Textile
Finishing Industry (OECD, 2004). The July 2012 revision updated the number of exposure days from 250
to 148, based on information reported in PMN submissions from 2006 through 2011, specified default
fixation/exhaustion rates for unknown dye types, and added exposure estimates from container cleaning.
The March 2013 version characterized the U.S. textile production of 9,100 kg/site-day as a typical value
(range of 3,520-50,000 kg/site-day). The June 2013 version was a minor update that provided a summary
of updates from EPA’s 1992 scenario. This update includes further information from O’Neill et al. (1999)
for dye fixation ranges (Table 1-2). The April 2015 revision updated the number of exposure days from
148 to 157, and also provided a range of operating days based on information reported in PMN
submissions from 2006 through 2014.
This document is published under the responsibility of the Joint Meeting of the Chemicals Committee
and the Working Party on Chemicals, Pesticides and Biotechnology of the OECD.

ENV/JM/MONO(2015)50
12
TABLE OF CONTENTS
EXPLANATORY NOTES .............................................................................................................................. 8
Purpose and background .............................................................................................................................. 8 How to use this document ............................................................................................................................ 8 Coverage and methodology ......................................................................................................................... 8 How this document was developed ............................................................................................................ 10
1 INDUSTRY SUMMARY AND BACKGROUND ............................................................................... 15
1.1 Textiles Dyeing Process within the Textile Industry ...................................................................... 15 1.2 Types of Dyes ................................................................................................................................. 16
1.2.1 Acid Dyes .................................................................................................................................. 16 1.2.2 Azoic Dyes (Napthol Dyes) ....................................................................................................... 17 1.2.3 Basic (Cationic) Dyes ................................................................................................................ 17 1.2.4 Direct Dyes ................................................................................................................................ 17 1.2.5 Disperse Dyes ............................................................................................................................ 18 1.2.6 Reactive or Fiber-Reactive Dyes ............................................................................................... 18 1.2.7 Mordant Dyes (Chrome Dyes) .................................................................................................. 18 1.2.8 Sulfur Dyes ................................................................................................................................ 19 1.2.9 Vat Dyes .................................................................................................................................... 19 1.2.10 Pigments ................................................................................................................................ 20
2 PROCESS DESCRIPTION .................................................................................................................... 22
2.1 Batch Processing ............................................................................................................................. 24 2.1.1 Fiber Dyeing .............................................................................................................................. 25 2.1.2 Yarn Dyeing .............................................................................................................................. 25 2.1.3 Fabric Dyeing ............................................................................................................................ 26 2.1.4 Garment Dyeing ........................................................................................................................ 30
2.2 Continuous Dyeing ......................................................................................................................... 31
3 OVERALL APPROACH AND GENERAL FACILITY ESTIMATES ................................................ 32
3.1 Introduction to the General Facility Estimates ................................................................................ 32 3.2 Days of Operation (TIMEoperating_days) .............................................................................................. 33 3.3 Mass Fraction of the Chemical of Interest in the Dye Formulation (Fchem_dye) ................................ 33 3.4 Daily Use Rate of Dye Formulation (Qdye_formulation_day) ................................................................... 34 3.5 Daily Use Rate of the Chemical of Interest (Qchem_site_day) ............................................................... 34 3.6 Number of Sites (Nsites) ................................................................................................................... 35 3.7 Number of Dye Formulation Containers Emptied per Facility (Ncontainer_unload_site_yr)....................... 36 3.8 Mass Fraction of Chemical of Interest in the Dye Bath (Fchem_dyebath) ............................................. 37
4 ENVIRONMENTAL RELEASE ASSESSMENTS .............................................................................. 38
4.1 Control Technologies ...................................................................................................................... 39

ENV/JM/MONO(2015)50
13
4.2 Transfer Operations Losses to POTW, Air, Incineration or Landfill from Unloading the Dye
Formulation (Release 1) ............................................................................................................................. 39 4.3 Container Residue Losses to POTW, Incineration, or Landfill (Release 2) ................................... 41 4.4 Disposal of Spent Dyebath to POTW (Release 3) .......................................................................... 43 4.5 Equipment Cleaning to POTW (Release 4) .................................................................................... 43
5 OCCUPATIONAL EXPOSURE ASSESSMENTS............................................................................... 45
5.1 Personal Protective Equipment ....................................................................................................... 47 5.2 Number of Workers Exposed Per Site and Days per Year of Exposure ......................................... 47 5.3 Exposure from Unloading and Transferring Dye Product (Exposure A) ........................................ 47
5.3.1 Inhalation Exposure ................................................................................................................... 47 5.3.2 Dermal Exposure: ...................................................................................................................... 49
5.4 Exposure During Transport Container Cleaning (Exposure B) ...................................................... 50 5.4.1 Inhalation Exposure: .................................................................................................................. 50 5.4.2 Dermal Exposure: ...................................................................................................................... 52
5.5 Exposure from Machine Operation (Exposure C)........................................................................... 53 5.5.1 Inhalation Exposure: .................................................................................................................. 53 5.5.2 Dermal Exposure: ...................................................................................................................... 53
6 SAMPLE CALCULATIONS................................................................................................................. 55
6.1 General Facility Information for Application of Dye Products ...................................................... 55 6.1.1 Days of Operation (TIMEoperating_days) ......................................................................................... 55 6.1.2 Mass Fraction of the Chemical of Interest in the Dye Formulation (Fchem_dye) .......................... 55 6.1.3 Daily Use Rate of Dye Formulation (Qdye_formulation_day) .............................................................. 55 6.1.4 Daily Use Rate of Chemical of Interest (Qchem_site_day) ............................................................... 56 6.1.5 Number of Sites (Nsites) .............................................................................................................. 56 6.1.6 Number of Transport Containers Unloaded per Site (Ncontainer_unload_site_yr) ................................. 57 6.1.7 Mass Fraction of Chemical of Interest in the Dye Bath (Fchem_dyebath) ........................................ 57
6.2 Environmental Releases .................................................................................................................. 58 6.2.1 Release to POTW, Air, Incineration or Landfill from Unloading Solid Dye Formulation
(Release 1) .............................................................................................................................................. 58 6.2.2 Release to POTW, Incineration, or Landfill from Container Residue (Release 2) .................... 58 6.2.3 Release to POTW from Disposal of Spent Dyebath (Release 3) ............................................... 58 6.2.4 Equipment Cleaning .................................................................................................................. 59
6.3 Occupational Exposures .................................................................................................................. 59 6.3.1 Exposure from Unloading and Transferring Dye Product (Exposure A) .................................. 59 6.3.2 Exposure During Transport Container Cleaning (Exposure B) ................................................. 60 6.3.3 Exposure from Dye Machine Operation (Exposure C) ............................................................. 61
7 DATA GAPS/UNCERTAINTIES AND FUTURE WORK .................................................................. 63
8 REFERENCES ....................................................................................................................................... 63
APPENDIX A: ESTIMATION EQUATION SUMMARY AND DEFAULT PARAMETER VALUES ... 65
A.1 Summary of Release and Exposure Estimation Equations for Textile Dyeing Sites ...................... 65
APPENDIX B BACKGROUND INFORMATION AND EQUATIONS/DEFAULTS FOR THE
STANDARD EPA ENVIRONMENTAL RELEASE AND WORKER EXPOSURE MODELS ................ 71
B.1 Introduction ..................................................................................................................................... 71 B.2 Container Residue Release Models (non-air) ................................................................................. 71
B.2.1 Model Description and Rationale: ............................................................................................. 71 B.3 Process Equipment Residue Release Models (non-air) ................................................................... 74

ENV/JM/MONO(2015)50
14
B.3.1 Model Description and Rationale .............................................................................................. 74 B.3.2 Model Equation ......................................................................................................................... 74
B.4 Dust Emissions from Transferring Solids Model ............................................................................ 76 B.4.1 Model Description and Rationale: ............................................................................................. 76 B.4.2 Model Equation: ........................................................................................................................ 78
B.5 Chemical Particle Inhalation Exposure Models .............................................................................. 79 B.5.1 EPA/OPPT Small Volume Solids Handling Inhalation Model ................................................. 80 B.5.2 OSHA Total PNOR PEL-Limiting Model ................................................................................ 81
B.6 Dermal Exposure Models ................................................................................................................ 83 B.6.1 Model Description and Rationale: ............................................................................................. 83 B.6.2 Model Equation: ........................................................................................................................ 83

ENV/JM/MONO(2015)50
15
1 INDUSTRY SUMMARY AND BACKGROUND
1. The textile industry is comprised of a diverse, fragmented group of establishments that produce
or process textile-related products (fiber, yarn, fabric) for further processing into apparel, home
furnishings, and industrial goods. Textile establishments receive and prepare fibers; transform fibers into
yarn, thread, or webbing; convert the yarn into fabric or related products; and dye and finish these
materials at various stages of production. The process of converting raw fibers into finished apparel and
nonapparel textile products is complex; thus, most textile mills specialize in specific products. Little
overlap occurs between knitting and weaving, or among production of manmade, cotton, and wool fabrics
(OECA, 1997).
2. Textiles are manufactured beginning with raw fibers. Textile fibers can be harvested from natural
sources (e.g. wool, cotton) or manufactured from regenerative cellulose materials (e.g. rayon, acetate), or it
can be entirely synthetic (e.g. polyester, nylon). After the raw natural or manufactured fibers are shipped
from the farm or the chemical plant, they pass through four main stages of processing (OECA, 1997):
Yarn production;
Fabric production;
Wet processing; and
Garment Manufacturing.
3. Dyeing may occur in several of these stages, but is primarily completed during the Wet
Processing (also called Finishing) stage. This is described in more detail in Section 2.
1.1 Textiles Dyeing Process within the Textile Industry
4. The textiles dyeing process falls under two North American Industrial Classification System
(NAICS) industries: Broadwoven Fabric Finishing Mills (NAICS Code 313311) and Textile and Fabric
Finishing (except Broadwoven Fabric Mills) (NAICS Code 313312). Table 1-1 presents the number of
establishments and production workers reported in the 2011 Economic Census for each of these industries.
The majority of these establishments are geographically concentrated in the state of California, followed by
New York and North Carolina. The sales of all textiles generated 5.2 billion dollars revenue in 2011, which
represents a market decline of 21% domestically since 2007 (USCB, 2007).

ENV/JM/MONO(2015)50
16
Table 1-1. Number of Sites and Production Workers in the Textile Finishing Industry
NAICS
Code Description
Number of
Establishments
Number of
Employees
313311 Broadwoven Fabric Finishing Facilities 480 11,289
313312 Textile and Fabric Finishing (except Broadwoven Fabric)
Mills 438 12,264
Source: USCB, 2011
1.2 Types of Dyes
5. Dyes may be classified in several ways (e.g. according to chemical constitution, application class,
or end-use). The primary classification of dyes is based on the fibers to which they can be applied and the
chemical nature of each dye (OECA 1997).
6. Reactive and direct dyes are most commonly used for cotton dyeing; disperse dyes are used
typically for polyester dyeing. Reactive dyes react with fiber molecules to form chemical bonds. Direct
dyes can color fabric directly without the aid of an affixing agent. Direct dyes are the simplest dyes to
apply and the cheapest in their initial and application costs, although there are tradeoffs in the dyes’ shade
range and wetfastness. A variety of auxiliary chemicals may be used during dyeing to assist in dye
absorption and fixation into the fibers. Disperse dyes require additional factors, such as dye carriers,
pressure, and heat, to penetrate synthetic fibers. Disperse dyes are dispersed in water where the dyes are
dissolved into fibers. Vat dyes, such as indigo, are also commonly used for cotton and other cellulosic
fibers (OECA, 1997). Each dye has a certain fixation rate which determines the percentage of dye that
adheres to the substrate. Fixation rates for various dyes are summarized in Table 1-2 at the end of this
section.
7. In the United States, it is estimated that reactive dyes account for 20-25% of all dyes consumed in
the textile industry, followed by disperse at 20%, acid dyes at 15-20%, and fluorescent whitening agents at
10-15%. Cotton/rayon accounts for 60% of all dye consumption, followed by polyester at 15-20% and
nylon at 15-20% (IHS, 2014).
8. The following subsections discuss the different types of dyes in more detail. Table 1-2 at the end
of this section lists the major dye classes, fixation rates, and the types of fibers for which they have an
affinity. Factors that companies consider when selecting a dye include: the type of fibers being dyed,
desired shade, dyeing uniformity, and fastness (desired stability or resistance of stock or colorants to
influences such as light, alkali, etc.) (OECA, 1997).
1.2.1 Acid Dyes
9. Acid dyes are water-soluble anionic compounds applied to nylon, wool, silk, and some modified
acrylic textiles in an acidic medium. Some acid dyes are also used for coloring food and paper. However,
they exhibit little affinity for cellulosic or polyester fiber. Colors generally are bright, and the material
exhibits good to excellent fastness properties. Acid dyes have one or more sulfonic or carboxylic acid
groups in their molecular structure. The dye-fiber affinity is the result of ionic bonds between the sulfonic
acid part of the dye and the basic amino groups in wool, silk, and nylon fibers (ORD, 1996).

ENV/JM/MONO(2015)50
17
10. Mordants can be used to improve wetfastness and perspiration fastness of acid dyes, although
shades tend to be duller. Mordants include Cr, Sn, Cu, and Al. Because of environmental concerns
surrounding mordants, their use in acid dyeing in the United States has essentially ceased (ORD, 1996).
1.2.2 Azoic Dyes (Napthol Dyes)
11. Azoic dyes, also known as naphthol dyes, are used on cellulosic fibers (particularly cotton) but
may also be applied to rayon, cellulose acetate, linen, jute, hemp, and sometimes polyester. Azoic dyes are
made up of two chemically reactive compounds, which are applied to the fabric in a two-stage process. The
reaction of the two compounds in the fiber produces the colored azo chromophore. During dyeing, the
azoic dye forms inside the fibers (ORD, 1996).
12. The Colour Index (CI) refers to the components used in azoic dyeing as CI Azoic Coupling
Components and CI Azoic Diazo Components. The coupling components are mostly derived from beta-
naphthol and are available in powder or liquid form, while the diazo components are available as free bases
(fast color bases) and diazonium salts (fast color salts). The depth of shade is determined by the extent to
which the coupling component is absorbed when the diazo component is applied to the fiber (ORD, 1996).
13. Azoic dyes produce bright and dark shades of yellow, orange, red, maroon, navy blue, brown,
and black. The dyes exhibit good lightfastness and fastness to peroxide and other bleaches. They can be
applied in a variety of ways (e.g. continuously or using yarn, jet, beck, or jig dyeing processes). Use of
azoic dyes has declined over the years, however, because of application costs and concerns about the
possible presence of carcinogenic naphthylamines in wastewater effluents (ORD, 1996).
1.2.3 Basic (Cationic) Dyes
14. Basic dyes were the first synthetically manufactured dye class. They were initially used to dye
silk and wool (using a mordant), but they exhibited poor fastness properties. Modified basic dyes were
developed and are now used exclusively to color synthetic fibers such as acrylic, modacrylic, and modified
nylons and polyesters, in which their fastness is acceptable. Basic dyes are rarely used on natural fibers,
both because of their poor light-and washfastness and because of the need for mordants (ORD, 1996).
15. Basic dyes have limited water solubility and are applied in weakly acidic dyebaths. Ionic bonds
are formed between the action in the dye and the anionic site on the fiber. As a class, basic dyes are among
the brightest dyes available. In addition, they have unlimited color range and good fastness properties
(except in natural fibers, as noted above). Good preparation (scouring) is necessary to remove the surface
additives applied for knitting and weaving. Basic dyes are strongly bound and do not migrate easily;
therefore, temperature must be used to carefully control exhaustion to ensure level dyeing (ORD, 1996).
1.2.4 Direct Dyes
16. Direct dyes are water-soluble, anionic compounds used extensively for coloring paper but also
for dyeing cotton, rayon, linen, jute, hemp, silk, and nylon fibers, as well as mixtures of fibers and leather.
The term “direct dye” refers to the fact that these dyes can be applied directly to cellulosics without
mordants. The dyes are absorbed into hydrophilic fibers as the fibers expand in the water solution. Sodium
chloride or sodium sulfate salts are added to the dyebath to counteract the slightly negative charge
cellulosics have in aqueous solution. The molecular structure of direct dyes is narrow and flat, permitting
these molecules to align with flat cellulose fibrils, where the dye molecules are held in place through Van
der Waals forces and hydrogen bonds (ORD, 1996).
17. Although direct dyes yield bright, deep colors, they vary greatly in light fastness. They are widely
used to color cellulosic materials including those that need high fastness (e.g. upholstery and drapery

ENV/JM/MONO(2015)50
18
fabrics). Also, they are limited in washfastness and their ability to withstand exposure to moisture (e.g.
perspiration) unless the fabric is after treated with a chemical fixative in a common procedure called after
fixing. These fixatives react with the dye, holding the dye molecules in place. Direct dyes are more
economical than reactive or vat dyes, but their use has declined in recent years as reactives with superior
end use properties have gained popularity (ORD, 1996).
1.2.5 Disperse Dyes
18. Because of the growing world dominance of polyester fibers in textile use, disperse dyes are the
largest volume dye class used today (IHS, 2014). Disperse dyes have a very low water solubility, and are
applied as a dispersion of finely ground powders in the dyebath. The particles dissolve at low
concentrations in the aqueous dyeing medium but transfer into the synthetic fiber polymer because of their
higher solubility in the substrate. High temperatures and superatmospheric pressures are sometimes used
for application. This reduces the need for chemical accelerants (e.g. dye carriers), which are required at
lower temperatures (ORD, 1996).
19. Disperse dyes are used for oleophilic fibers (polyester and other synthetics) that do not accept
water-soluble dyes. They are used largely for synthetic fibers, mainly polyester but also cellulose acetate
rayon (also called regenerated cellulose fibers), nylon, and acrylic fibers. For polyesters, disperse dyes
offer a full shade range. Because of the limited buildup properties and poor washfastness in dark shades,
however, disperse dyes are used mostly to obtain pastel shades in nylons and acrylics. Disperse dyes tend
to have good fastness to light, perspiration, laundering, and dry cleaning. They also have good resistance to
color transfer by contact or rubbing (crocking) (ORD, 1996).
1.2.6 Reactive or Fiber-Reactive Dyes
20. Fiber reactive dyes are water-soluble, anionic dyes that provide high wetfastness and require
relatively simple dyeing methods. In terms of volume, they are currently the second-largest dye class in the
world just behind disperse dyes (IHS, 2014). They are mainly used for dyeing cellulosic fibers such as
cotton and rayon but are also sometimes used for wool, silk, nylon, and leather. Fiber reactive dyes have
largely replaced direct, azoic, and vat dyes and are the largest dye class (in commercial value) in the United
States. Because of the bright shades available, particularly orange, scarlet, and turquoise, they are popular
choices for color fashion apparel (ORD, 1996).
21. Fiber reactive dyes form covalent chemical bonds with the fiber and become part of the fiber,
giving excellent fastness properties. Because of their solubility, leveling takes place rapidly before fixation,
which provides flexibility in dye application methods. To exhaust the dyes, however, large amounts of salt
are generally necessary, and substantial amounts of dye can remain unfixed at the end of the process. After
dyeing, the fabric is afterwashed with an anionic surfactant to remove unreacted dye (ORD, 1996).
22. Some improvements in fixation of fiber reactive dyes have been made, particularly with the
introduction of bifunctional reactive dyes. Bifunctional dyes have two reactive groups, which increases the
efficiency of dye fixation. Low-bath-ratio equipment can also be used to reduce salt requirements, and pad-
batch dyeing using cold reactive dyes that require no salt is a viable alternative (ORD, 1996).
1.2.7 Mordant Dyes (Chrome Dyes)
23. Mordant dyes are used mainly in wool dyeing, although they also are used to dye silk and nylon
and to print wool, silk, and cellulosic fibers. In general, mordant dyes have fair to good fastness properties.
These dyes usually contain a ligand functionality capable of reacting strongly with salts of aluminum,
chromium, cobalt, copper, nickel, or iron to give differently colored metal complexes. Mordants are now

ENV/JM/MONO(2015)50
19
used infrequently in the United States because of concern about toxic metal salts in the wastewater effluent
(ORD, 1996).
1.2.8 Sulfur Dyes
24. Sulfur dyes are mainly used for dyeing cotton and rayon substrates. They may also be used for
dyeing blends of cellulosic and synthetic fibers, including nylons and polyesters, and are occasionally used
for dyeing silk (ORD, 1996).
25. The synthesis of sulfur dyes is based on the reaction at high temperature of organic compounds
containing nitro and amino groups with sulfur or sodium sulfide. The dyes contain sulfur both as an
integral part of the chromophore and in polysulfide pendant chains (ORD, 1996).
26. Sulfur dyes are reduced with sodium sulfide to a water soluble form before application to the
fiber. In their reduced form, sulfur dyes are soluble and have an affinity for cellulose. Sulfur dyes color by
absorption, like direct dyes, but with exposure to air they oxidize to re-form the original insoluble dye
inside the fiber. This makes them very resistant to oxidizing bleaches (e.g., peroxide) and resistant to
removal by washing (ORD, 1996).
27. Sulfur dyes have good to excellent washfastness and moderate to good light fastness. They are
relatively inexpensive compared with other dyes. Although they encompass a broad shade range, sulfur
dyes are mostly used for dark shades because lighter shades have poorer resistance to light and laundering.
The shade range for sulfur dyes includes brick reds, browns, burnt oranges, and blacks. Sulfur dyes tend to
be dull compared with other dye classes. Deep indigo denim colors are often obtained by applying indigo
dyes over a sulfur “bottom” (ORD, 1996).
28. Sulfur dyes have decreased popularity in the United States, Western Europe and Japan because of
environmental concerns associated with the dye manufacturing process; however, sulfur dyes are still
popular in other parts of the world where environmental regulations are less stringent (IHS, 2014).
1.2.9 Vat Dyes
29. Vat dyes are the oldest and among the more chemically complex dyestuffs. They are used most
often for dyeing and printing cotton and cellulosic fibers, and for end uses that require good fastness
properties, such as toweling, industrial uniforms, military uniforms, and tenting. Although most commonly
used for cottons and cellulosics, they can also be applied to nylon and polyester/cellulosic blends and are
sometimes used for dyeing wool and acetate (ORD, 1996).
30. Vat dyes have excellent fastness properties when properly selected, and are often used on cotton
and cellulosic fabrics that will be subjected to severe conditions of washing and bleaching (e.g. sewing
threads). Vat dyes can be used on all fibers except those sensitive to alkalis (ORD, 1996).
31. Vat dyes are applied by exhaust or continuous methods. They are either supplied in water soluble
reduced “leuco” form or reduced with a reducing agent such as sodium hydrosulfite. Then they are allowed
to migrate into the fiber by an exhaustion process (for batch dying) or by steaming (for continuous dyeing).
When this migration into the fiber is complete, the substrate is rinsed to remove surface dye, then the dye is
oxidized back to its water insoluble form within the fiber. The result is a dyeing of very high fastness to
washing (ORD, 1996).
32. Vat dyes offer a good range of colors, but shade ranges are generally dull. Because of this,
preparation, including bleaching and mercerizing, is important. Mercerizing helps the dyer achieve deeper
shades and produce adequate cover on raw cotton. Vat dyes are insoluble in water but are readily soluble in

ENV/JM/MONO(2015)50
20
alkaline solution. Vat dyes can be applied by continuous methods or by exhaust dyeing procedures (ORD,
1996).
1.2.10 Pigments
33. Pigments differ from dyes in that they:
Remain insoluble during application;
Have no affinity for the fibers;
Require binders; and
Do not react with the fibers.
34. Little penetration of the color into the substrate occurs with pigments. Instead, pigments are
usually mixed with a vehicle that hardens upon drying, forming an opaque coating. Pigments are used
extensively in textile printing (ORD, 1996).

ENV/JM/MONO(2015)50
21
Table 1-2. Textile Dye Classes and Associated Key Information
Dye Class
Descriptiona
Method
a
Fibers
Typically
Applied toa
Range
of
Fixation
(%)
Average
Fixation (%)
= default
valuec
Acid
water- soluble anionic
compounds
Exhaust/
Beck/Continu
ous (carpet)
wool
nylon 85-98
a,c
90 (1 SO3
group)
95 (> 1 SO3
group) Azoic
naphthol, reactive dyes
Exhaust/Pack
age
cellulose
76-95a,c
84
(continuous) Basic
water-soluble, applied in
weakly
acidic dyebaths; very bright
dyes
Exhaust/
Beck
acrylic
some
polyesters
a
95-
100a,c,d
99 (batch)
Direct
water- soluble, anionic
compounds; can be applied
directly to cellulosics without
mordants (or metals like
chromium and copper)
Exhaust/
Beck/
Continuous
cotton
rayon
other
cellulosics
64-96
a,b,c 88 (batch)
Disperse
not water- soluble
High
temperature
exhaust
Continuous
polyester
acetate
other
synthetics
80-
100a,c,d
95
(continuous)
97 (batch)
Premetalliz
ed or
Metal-
Containing
description not available
Exhaust/
Beck
Wool, nylon
82-98
a,c 94 (batch)
Reactive
water- soluble, anionic
compounds;
largest dye class
Exhaust/
Beck
Cold pad
batch/
Continuous
cotton
other
cellulosics
wool
50-97
a,b,d
95 (batch,
wool)
75 (batch,
cotton)
80 (continuous,
cotton) Sulfur
organic compounds
containing
sulfur or sodium sulfide
Continuous
cotton
other
cellulosics
60-95
a,c
70
(continuous) Vat
oldest dyes; more chemically
complex; water- insoluble
Exhaust/
Package/
Continuous
cotton
other
cellulosics
70-95
a,b,c
85
(continuous)
Sources: a – OECA, 1997, b – Jasper, 2011, c – OECD, 2004. These default values are to be associated with release model for disposal of spent dye bath (Section 4.4). d – O’Neill et al., 1999

ENV/JM/MONO(2015)50
22
2 PROCESS DESCRIPTION
35. Woven and knit fabrics cannot be processed into apparel and other finished goods until the
fabrics have passed through several water-intensive wet processing stages. Wet processing enhances the
appearance, durability, and serviceability of fabrics by converting undyed and unfinished goods, known as
“gray” or “greige” goods, into finished consumers’ goods. Also known as finishing, wet processing has
been broken down into four stages in this section for simplification: fabric preparation, dyeing, printing,
and finishing. These stages, shown in Figure 2-1, involve treating gray goods with chemical baths and
often require additional washing, rinsing, and drying steps. Note that some of these steps may be optional
depending on the style of fabric being manufactured (OECA, 1997).
36. Most manufactured textiles are shipped from textile mills to commission dyeing and finishing
shops (for further processing in integrated mills) for final coloring or finishing. Alternatively, dyers and
finishers may purchase gray goods from mills for conversion to finished textiles. The finisher then sells the
finished piece to apparel, furnishing, and industrial textile product manufacturers. A wide range of
equipment is used for textile dyeing and finishing (OECA, 1997).

ENV/JM/MONO(2015)50
23
Figure 2-1. Typical Wet Processing Steps for Fabrics (OECA, 1997)

ENV/JM/MONO(2015)50
24
37. Textiles are dyed using both continuous and batch processes, and dyeing may take place at any of
several stages of the manufacturing process. Figure 2-2 illustrates the general use of textile dyes and the
associated release sources and worker exposure activities.
38. Liquid and solid dye formulations are typically unloaded from transport containers (e.g. drums)
directly into the dyeing machine. Although dye products may be supplied using feed lines, this ESD
assumes they are poured or weighed manually (Release 2, Exposure B) to present more conservative
exposure estimates. Unloading is considered to be the main exposure point, because exposure occurs at the
highest chemical concentration and because of potential inhalation of powder dyes.
39. ETAD states that the receiving application facility typically rinses container residuals into the
dyeing process, or the empty container is landfilled or incinerated (Release 1, Exposure A) (ETAD, 2011).
Release of spent dye bath to wastewater is expected to be the main release source, depending on the dye
exhaustion rate.
Figure 2-2. General Textile Dyeing Process
2.1 Batch Processing
40. For the most part, dyeing is accomplished in batch processes. While the details of each type batch
process may be different, the basic batch dyeing follows this process: a textile substrate is immersed in a
bath of (usually) water in which dye is dispersed or dissolved. With agitation and heat, the dyestuff
diffuses through the solution (b), is sorbed at the fiber surface (c), and then diffuses into the fiber (d). This
process can be done for fibers, yarns or fabrics (Kirk-Othmer, 2004).
= Environmental Releases:
1. Transfer operation losses of dust emissions (release to POTW, air, incineration, or landfill).
2. Container residues from dye transport container (release to POTW, incineration or landfill).
3. Disposal of spent dyebath (release to POTW).
4. Equipment cleaning (release to POTW)
= Occupational Exposures:
A. Inhalation (solid particulate dyes only) and dermal exposure during equipment loading/container unloading.
B. Inhalation (solid particulate dyes only) and dermal exposure during container cleaning.
C. Dermal exposure during dyeing operation.
Unloading from
Tank Cars, Totes,
Drums
Fiber, yarn or fabric
Dyeing via Batch or
Continuous Process
Dye Formulation A
Container
Residue
Cleaning and/or
Disposal
2
1
3
Dust Emissions
during Unloading
Disposal of Spent
Dyebath
C
C
Worker Exposure
During Dyeing
Operation
4
3
Equipment Cleaning
B
C

ENV/JM/MONO(2015)50
25
2.1.1 Fiber Dyeing
41. Fibers may be dyed before they are spun into yarns or woven or knit into textile fabrics. Fiber
dyeing is usually accomplished by pumping dye liquor through a stationary mass of fibers. Fiber is
prepacked into some form of perforated basket, which is then loaded into the kettle or kier containing the
dyebath. Packing must be even to avoid the creation of channels and tight spots and consequently unlevel
dyeing. Although since the fiber is later to be thoroughly mixed in yarn formation, unlevelness is more
tolerable in fiber dyeing than in yarn or fabric dyeing. During dyeing the kettle is usually enclosed (Kirk-
Othmer, 2004).
2.1.2 Yarn Dyeing
42. Less than 10% of the textile dyeing is done in the yarn stage (IHS, 2014). Textiles may be dyed
in yarn form before they are used to weave or knit a pattern or design into the cloth. Yarn is dyed in one of
two forms: skein or package. While obsolete methods of skein dyeing involved moving skeins through a
stationary bath, in both cases today the dyebath is moved through yarn that is held in place (Kirk-Othmer,
2004). Figure 2-3 shows an example of a skein dyeing apparatus and a package dyeing apparatus.
43. Skeins (or hanks) are hung from poles: The use of two poles per skein keeps the skein extended
during dyeing. A frame with many poles is suspended in the dyebath, and the liquor is circulated (usually
upward to float the skeins off the poles and avoid ‘‘stick marks’’) through the mass of yarn. Since the yarn
is only partly constrained, the method allows the yarn to achieve bulkiness, and the method is useful for
knitting and carpet yarns. Skein dyeing involves winding the skeins from cones, and backwinding onto
cones after dyeing. Together with the loading and unloading onto the poles, the overall process tends to be
labor intensive (Kirk-Othmer, 2004).
44. In package dyeing, yarn is wound onto perforated metal or plastic formers the form of conical or
parallel sided cylinders, called cones or cheeses, respectively. Several packages are placed on perforated
spindles of a carrier: depending on the diameter of the packages, different carriers might be used in a given
kettle. Horizontal spindle machines including those consisting of multiple single-spindle kettles have been
developed, but usually multiple spindle carriers arranged vertically are used. The whole carrier, with many
spindles carrying packages, is placed in the kettle where dye liquor is pumped through the spindles and
through the yarn. Generally, the flow is from inside to outside of the package, but periodic reversal
increases levelness (Kirk-Othmer, 2004).
Figure 2-3. Yarn Dyeing Methods (ORD, 1996)

ENV/JM/MONO(2015)50
26
2.1.3 Fabric Dyeing
45. The majority of textile material is dyed in the form of fabric; in the United States,
approximately 80% of textile dyeing is done in the fabric stage (IHS, 2014).3 There are four different
machine types for such processes: Beam Dyeing; Jig Dyeing; Winch or Beck Dyeing; and Jet Dyeing
(Kirk-Othmer, 2004).
2.1.3.1 Beam Dyeing
46. This method is similar to package dyeing of yarn: flat fabric is wound onto a perforated steel
cylinder and placed in a kettle through which dye liquor is pumped, as shown in Figure 2-4. The method is
good for lightweight synthetic-fiber fabrics through which liquid flows easily. Since the fabric is
constrained and flat, it is also useful for materials that might crease (Kirk-Othmer, 2004).
Figure 2-4. Beam Dyeing Method (ORD, 1996)
3 Includes apparel fabrics, carpeting, draperies, furniture covering, bedding, and other fabrics.

ENV/JM/MONO(2015)50
27
2.1.3.2 Jig Dyeing
47. Fabric is also dyed in flat form in a jig dyeing machine (or jigger). However, in this machine the
liquor is stationary while the fabric is run through it. Several hundred meters of cloth are wound around a
roller on one side of a jig. The goods are run off the beam through a small-volume, V-shaped dyebath and
wound on to a second beam. Figure 2-5 illustrates an older jig dyeing machine, with a larger dyebath.
When the entire cloth has been wound on the opposite beam, the clutch is reversed and the cloth travels
back in the opposite direction. The fabric is in contact with the dyebath for the very short time as it passes
through the bath, therefore diffusion processes occur as the fabric is turning on the beam. Because of low
temperature and liquor ratios, the jig is especially suitable for cotton fabrics: The flat form is also helpful in
avoiding creases in filament acetate and nylon fabrics (Kirk-Othmer, 2004).
Figure 2-5. Jig Dyeing Method (end view) (ORD, 1996)

ENV/JM/MONO(2015)50
28
2.1.3.3 Winch or Beck Dyeing
48. Winch or beck dyeing is one of the oldest mechanized forms of dyeing fabric. Like the jig, the
bath is stationary while the fabric moves to provide the relative motion. Machines can run fabrics in either
open-width or rope forms. The beck is usually considered a rope-form machine. The machine in its basic
form consists of a shallow box (the beck) which has a gradual low curvature in the back and a rather high
vertical rise in the front, as seen in Figure 2-6. One end is passed over the top of this reel and sewn to the
back end to form an endless loop. The tub is filled with the dye liquor and the fabric is immersed in it. A
driven elliptical reel (the winch) lifts fabric from the front of the dyebath, over the top of the reel, and
redeposits it at the back of the bath. The fabric then slowly moves forward through the dye liquor from the
back of the winch, where it is again lifted by the reel. Becks and winches are generally enclosed machines.
The gentle action makes it suitable for delicate fabrics (Kirk-Othmer, 2004).
Figure 2-6. Beck Dyeing Method (end view) (ORD, 1996)

ENV/JM/MONO(2015)50
29
2.1.3.4 Jet dyeing
49. Jet dyeing machines have become the most popular batch dyeing machine: most new machines
installed are of this type. Like the beck machine, fabrics are processed as end-joined loops in rope form.
The jet machine replaces the winch as the means of moving the fabric with a narrow orifice into which dye
liquor is pumped. This forms a venturi, and drives the fabric at speeds of 200 m/min or more (Kirk-
Othmer, 2004).
50. While becks and jigs each tend to have a fairly uniform layout, jet dyeing machines come in a
variety of styles. Two main types exist: the long horizontal cylindrical machines ideally suited for synthetic
fabrics where the fabric travels along the length of the cylinder; or cylindrical, upright pear, bell-shaped, or
J-box autoclaves where the fabric moves around the circumference of the apparatus, as seen in Figure 2-7.
These autoclave types can have more than one fabric rope per autoclave and are suitable for most fabrics
(Kirk-Othmer, 2004).
Figure 2-7. Long cylindrical jet drying machine (left); Upright cylindrical jet drying machine (right)
(Kirk-Othmer, 2004)

ENV/JM/MONO(2015)50
30
2.1.4 Garment Dyeing
51. Garment dyeing involves the dyeing of woven or knit cloth and may be accomplished by batch or
continuous processes. The choice between batch and continuous dyeing usually depends on such factors as
fabric construction, cost considerations, the dye classes chosen (and their applicability to batch or
continuous equipment), the minimum lot size required for economical running, and the availability of
equipment. Generally, except for dye jobs involving less than 1,000 meters of cloth, most woven material
is dyed by continuous processes. Most knit cloth, on the other hand, is dyed by batch methods because it
cannot withstand the tension of the continuous range (Kirk-Othmer, 2004).
52. Among the older machines are paddle machines in which a bath is circulated by a paddle. The
bath may be an annular oval, with the axle holding the paddle blades just above the liquor surface. As the
paddle rotates it moves liquor and goods around the annulus. Alternatively a V-shaped bath is used in
which the paddle forces liquor and goods downward. For hosiery dyeing, a widely used machine used a
perforated drum, divided into compartments, rotating in the dyebath. These machines are shown in Figure
2-8. Newer machines tend to be based on front-loading commercial washers/dry cleaning machines. Again,
a rotating perforated compartmentalized drum revolves in the dyebath, although the garments are not
continuously submerged (Kirk-Othmer, 2004).
Figure 2-8. Garment Dyeing Methods (ORD, 1996)

ENV/JM/MONO(2015)50
31
2.2 Continuous Dyeing
53. When large amounts of a single color are required, continuous processing is more efficient.
Uncolored material is fed into the system and colored material is withdrawn continuously. Continuous
dyeing is most suited to fabric, and most woven goods. Continuous yarn dyeing is most commonly used in
the application of indigo to warp yarns to be woven into denim (Kirk-Othmer, 2004).
54. Dye application may be via a spray or by foam, but is most often done by padding, in which the
material is immersed in dye solution, then squeezed between rollers to reduce and control the uptake to a
consistent level (dip and nip). The feed of dye solution must be controlled to maintain a constant volume in
the trough. The dwell time in the solution is very short, and fabric must be prepared to allow for rapid
wetting. In addition, padding solutions typically include a wetting agent. Some systems use two dips and
two nips to achieve more thorough wetting (Kirk-Othmer, 2004).
55. The expression of excess dye is accomplished by squeeze rollers, referred to as bowls. Most
bowls consist of a medium density rubber roller across the width of which pressure can be applied. This
roller presses against a stainless steel or a hard rubber roller. These rollers may be mounted either vertically
or horizontally between the squeeze rollers, as seen in Figure 2-9 (Kirk-Othmer, 2004).
Figure 2-9. Typical Pad Mangle Configuration: (a) inclined vertical pad mangle with V-shaped
trough; (b) horizontal wedge-nip pad mangle. (Kirk-Othmer, 2004)
ENV/JM/MONO(2015)50
32
3 OVERALL APPROACH AND GENERAL FACILITY ESTIMATES
56. This ESD presents EPA’s standard approach for estimating environmental releases of and worker
exposures to chemicals of interest during the industrial textile dyeing process.
57. The estimation methods described in this document utilize available industry-specific information
and data to the greatest extent possible; however, EPA acknowledges several areas in which additional
textile industry data are needed. These data needs are summarized in Section 7 of this ESD. It should be
noted that the default values cited throughout this ESD are intended to be used only when appropriate site-
specific or industry-specific information is not available. Because this ESD presents several alternative
default assumptions or values for some estimation parameters, one must consider carefully how the
selection of these defaults will affect the final assessment results.
58. This section of the ESD presents general facility calculations for application sites, which estimate
daily use rates of dyes, the number of textile dyeing sites, and the number of days that the dye is expected
to be used in the textile dyeing process.
59. Section 4 of the ESD presents the environmental release assessments for the general textile
dyeing process, which use the general facility estimates to estimate the quantity of chemical released from
various points in the application process and the most likely media of release for each release source.
60. Section 5 of the ESD presents the occupational exposure assessments for the textile dyeing
process, which use both the general facility estimates and release estimates to estimate the number of
workers potentially exposed while performing various process activities and the corresponding potential
level (quantity) and routes of those exposures.
3.1 Introduction to the General Facility Estimates
61. Through the remainder of this section, a method utilizing available dye products industry data is
described to determine daily use rate of the chemical of interest for a textile dyeing site. The chemical daily
use rate (Qchem_site_day) can be estimated using the daily dye formulation use rates (Qdye_formulation_day) and the
concentration of the chemical of interest in the dye formulation. The number of textile dyeing (Nsites) may
then be determined from the daily use rate, days of operation (TIMEoperating_days) and the annual production
of the chemical for this use (Qchem_yr).
62. The general facility estimates described in this section are summarized with their associated
inputs/bases and corresponding ESD section number in Table 3-1. In addition, Table A-2 in Appendix A
presents a detailed summary of the default values used as inputs to each of the general facility estimates,
accompanied by their references.

ENV/JM/MONO(2015)50
33
Table 3-1. Summary of General Facility Parameters for Textile Dyeing Sites
63. The method described in the remaining sections incorporates certain assumptions in cases where
industry-specific data were not found. These key assumptions are presented throughout this section and are
accompanied by a discussion of their uncertainties and potential effects on the estimates.
3.2 Days of Operation (TIMEoperating_days)
64. Textile dyeing facilities typically operate between 5 to 7 days per week (Jasper, 2011a) over 50
weeks per year (ETAD, 2011), resulting between 250 to 350 operating days per year. However, the facility
would likely not use the same dye formulation for the entire operating time. If the number of operating
days using the chemical of interest is known, that value should be used. A search of 31 past PMN
submissions from 2006 through 2014 revealed an approximate average of 157 operating days per year,
over a range of 31 (5th percentile) to 295 (95
th percentile) days per year (EPA, 2015). If site-specific
information about the number of operating days using the chemical of interest is not known, EPA
recommends assuming 157 days per site-year. Alternative values can also be selected depending on the
assessment needs. For example, if environmental releases are a concern, 31 days per site-year may be
assumed to maximize daily release estimates. Alternatively, if occupational exposures are a concern, the
number of days may be increased.
TIMEoperating_days = Number of operating days per site-year (Default: 157 days/year)
3.3 Mass Fraction of the Chemical of Interest in the Dye Formulation (Fchem_dye)
65. The chemical of interest may only be a fraction of the dye formulation. Powder dyes typically
contain 50 to 75% active chemical of interest and liquids contain 10 to 25% active chemical of interest
(ETAD, 2011). If specific information about the chemical-containing dye is not known, EPA recommends
assuming the high end of the chemical of interest when performing the calculations in this assessment, in
order to provide more conservative exposure assessments:
Fchem_dye = Mass fraction of the chemical of interest in the dye formulation
(Defaults: solid: 0.75 kg chemical/kg dye formulation; liquid:
0.25 kg chemical/kg dye formulation)
Parameter Description ESD Section
TIMEoperating_days Annual number of days the formulation product is applied at each
facility (days/yr). 3.2
Fchem_dye Mass fraction of the chemical of interest in the dye formulation (kg
chemical/kg dye formulation). 3.3
Qdye_formulation_day Daily use rate for the dye formulation at each facility (kg of dye
formulation/site-day). 3.4
Qchem_site_day Daily use rate for the chemical of interest at each facility (kg of
chemical/site-day). 3.5
Nsites Number of facilities using the chemical of interest in textile dyeing
processes (sites). 3.6
Ncontainer_unload_site_yr Number of transport containers unloaded at each site per year
(containers/site-yr) 3.7
Fchem_dyebath Mass fraction of the chemical of interest in the dyebath 3.8

ENV/JM/MONO(2015)50
34
3.4 Daily Use Rate of Dye Formulation (Qdye_formulation_day)
66. EPA’s 1994 Fabric Finishing Generic Scenario (EPA, 1994) estimates a typical U.S. production
of 9,100 kg/site-day of finished textiles (range of 3,520-50,000 kg/site-day), based on data provided in
fabric finishing PMNs during 1993 and 1994. If no submission-specific information is available EPA
recommends assuming a textile production rate of 9,100 kg/site-day; however, the user may choose the
high- or low-end of the range depending on specific assessment needs. OECD indicates that a facility
typically uses multiple dyestuffs per day, but suggests that a primary dyestuff may be used more frequently
than others. OECD estimates that the median share of textiles processed per day using the primary dyestuff
is 30%. EPA suggests that this percentage be used to estimate the daily use rate for the dyestuff containing
the chemical of interest. Additionally, OECD estimates that as a “realistic worst case,” powder dye
formulations are used in an amount of 5% of the textile (0.05 kg dye formulation/kg textile), and liquid dye
formulations in an amount of 10% (0.10 kg dye formulation/kg textile) (OECD, 2004).
dye_fabricfabricfabrication_daydye_formul F FVQ
(3-1)
Qdye_formulation_day = Daily use rate of the dye formulations (kg dye formulation /site-
day)
Vfabric = Amount of textile dyed per site-day (default = 9,100 kg textile
processed/site-day)
Ffabric = Mass fraction of textile treated with the dyestuff (default = 0.3 kg
textiles dyed/kg textile processed)
Fdye_fabric = Mass fraction of dye used per textile dyed (defaults: powder dyes
= 0.05 kg dye formulation/kg textile dyed; liquid dyes = 0.10 kg
dye formulation/kg textile dyed)
3.5 Daily Use Rate of the Chemical of Interest (Qchem_site_day)
67. The daily use rate of the chemical of interest during textile dyeing is estimated using
Equation 3-2, based on the daily dye formulation use rate and the concentration of the chemical of interest.
As a default, it is assumed that only the dye formulation containing the chemical of interest is used (Fdye =
1), Section 3.4 above assumed as a default that 30% of the textiles at a facility are dyed with the primary
dyestuff, resulting in an overall estimated usage rate of 30%. Ffabric (Section 3.4) and Fdye (Section 3.5) can
both be adjusted based on submission information to account for the use of multiple dyes and fabrics at a
facility.
dy echem_dy eation_daydy e_formuldaychem_site_ FF QQ (3-2)
Where:
Qchem_site_day = Daily use rate of the chemical of interest contained in the dye
formulation (kg chemical used/site-day)
Qdye_formulation_day = Daily use rate of the dye formulation (kg dye formulation /site-
day) (see Section 3.4)
Fchem_dye = Mass fraction of the chemical of interest in the dye formulation
(kg chemical of interest/kg dye formulation; see Section 3.3)
Fdye Mass fraction of the dye formulation containing the chemical
interest used per the total amount of dye formulation used (kg dye
formulation with chemical of interest/kg dye formulation used;
default = 1).

ENV/JM/MONO(2015)50
35
3.6 Number of Sites (Nsites)
68. The number of facilities using the chemical of interest (Nsites) depends on the total annual
production of the chemical of interest for this use (Qchem_yr), the daily use rate of the chemical of interest
(Qchem_site_day), and the annual operating days (TIMEoperating_days). Equation 3-3 demonstrates how the number
of textile dyeing facilities using a chemical of interest could be determined:
day soperating_daysite_chem_
chem_y r
sitesTIMEQ
QN
(3-3)
Where:
Nsites4 = Number of textiles dyeing sites using the dye formulation (sites)
Qchem_yr = Annual production volume of the chemical of interest for this use
(kg chemical/yr)
Qchem_site_day = Daily use rate of the chemical of interest contained in dye
formulations (kg chemical used/site-day; see Section 3.5)
TIMEoperating_days = Number of operating days at textile dyeing sites (days/yr)
(Default: 157 days/yr; see Section 3.2)
69. Note that the calculated value of Nsites should not exceed the total number of textile finishing
facilities known to operate in the United States. According to the U.S. Census Bureau’s 2011 County
Business Patterns (CBP), there are 918 textile finishing facilities in the United States, employing a total of
23,553 people (USCB, 2011).
4The value for Nsites, calculated using Equation 3-3 should be rounded to the nearest non-zero integer value.
TIMEoperating_days should then be adjusted for the Nsites integer value (to avoid errors due to rounding) while
maintaining the same value of Qchem_site_day calculated in Section 3.5.
_day chem_siteQN
QTIME
sites
chem_yr
ys daoperating_
TIMEoperating_days is rounded to the nearest non-zero integer.

ENV/JM/MONO(2015)50
36
3.7 Number of Dye Formulation Containers Emptied per Facility (Ncontainer_unload_site_yr)
70. The number of dye product containers unloaded annually per site can be estimated based on the
daily use rate, container size, and concentration of the chemical of interest in the formulation. Dyes can be
transported in containers ranging from 25 kg through 1,000 kg (ETAD, 2011) but according
correspondence with Dr. Warren Jasper (NC State University College of Textiles), most are shipped in 35-
gallon drums (Jasper, 2011). EPA suggests that a default transportation container size of a 35-gallon drum
could be used in the absence of site-specific information. Engineering judgment should be used to
determine if another container type or size is more appropriate. If the density of the formulation is not
known, the density for water can be used as a default (1 kg/L).
formcontainerchem
day soperating_daychem_site_
e_y runload_sitcontainer_RHOVF
TIMEQN
(3-4)
Where:
Ncontainer_unload_site_yr = Number of transport containers unloaded at each site per year
(containers/site-yr)
Qchem_site_day = Daily use rate of the chemical of interest per site (kg chemical
used/site-yr) (see Section 3.5)
TIMEoperating_days = Number of operating days (Default: 157 days/yr; See Section 3.2)
Fchem_dye = Mass fraction of the chemical of interest in the dye formulation
(kg chemical/kg dye formulation) (See Section 3.3)
Vcontainer = Volume of transport container (Default: 132.5 L
formulation/container (35-gallon drum); See Table B-1 in
Appendix B for alternative default container volumes)
RHOform = Density of dye formulation (kg/L formulation; Default: 1 kg/L)
Summary of the Relationship of General Facility Parameters
The values for days of operation (TIMEoperating_days), daily use rate of the chemical of interest (Qchem_site_day),
and number of manufacturing sites (Nsites) are related. This ESD presents one method for estimating Nsites
using estimated default values for: 1) the annual production quantity of the chemical of interest for this use; 2)
the total number of operating days per year at the end use site(s); and 3) the daily use rate of the chemical at a
single site.
If Nsites and TIMEoperating_days are known, Qchem_site_day can be calculated directly without using Equation 3-2.
This alternative calculation is:
daysoperating_sites
chem_yr
daychem_site_TIMEN
If Nsites is known and TIMEoperating_days is unknown, EPA recommends that using the default assumption that
textile dyeing operations occur 157 days per year and Qchem_site_day be calculated using the above equation.
EPA recommends calculating the chemical of interest throughput based on the methodology presented in
Section 3.5, and compare it to the throughput based on number of sites and operating days, as calculated
above.

ENV/JM/MONO(2015)50
37
3.8 Mass Fraction of Chemical of Interest in the Dye Bath (Fchem_dyebath)
71. ETAD states that the bath concentrations may vary depending on the desired shade of the fiber,
yarn, or fabric. Typical dye concentrations may range from 1.5-2.5%. Lighter shades may be as low as 0.2-
0.3% and heavier shades may be between 4-6% (ETAD, 2011). In the absence of site specific data, EPA
recommends assuming the high end of the range to generate more conservative worker exposures.
hdye_dyebatchem_dyethchem_dyeba FFF (3-5)
Where:
Fchem_dyebath = Mass fraction of the chemical of interest in the dyebath (kg
chemical/kg dyebath)
Fchem_dye = Mass fraction of the chemical of interest in the dye formulation
(kg chemical/kg dye formulation) (See Section 3.3)
Fdye_dyebath = Mass fraction of the dye formulation in the dyebath (default: 0.06
kg dye formulation/kg dyebath)

ENV/JM/MONO(2015)50
38
4 ENVIRONMENTAL RELEASE ASSESSMENTS
72. This section presents approaches for estimating the amount of the chemical of interest released
during the textile dyeing process. The release sources are presented in the order discussed in Section 2 (see
Figure 2-2) and include the most likely receiving media (e.g. air, water, landfill, or incineration). The
primary sources of release include dust releases from solid powder transfer, container residue, disposal of
spent dyebath and process equipment cleaning. Key default values used for the release estimates,
accompanied by their respective references, are provided in Table A-1 of Appendix A.
73. It is generally assumed that during the use of dye products, losses of the chemical of interest are
minimized in actual practice; however, some pre-process or other upstream releases will occur. Because
losses are assumed to be minimized, the methodology presented in this section for estimating releases of
the chemical of interest from the dyeing process does not include adjustments to account for pre-process or
other upstream releases of the chemical (e.g. while some material may remain in the transport container,
the entire volume received in the container is assumed when estimating equipment cleaning releases).
These omissions of mass balance adjustments should not result in a negative throughput of the chemical of
interest in these calculations (e.g. the total amount of chemical released from the process should not exceed
the amount that enters the process).
74. All release equations estimate daily rates for a given site. To estimate annual releases for all sites
for a given source, the release rates must be multiplied by the number of days of release and by the total
number of sites using the chemical of interest (Nsites) (See Equation 3-3).
75. Some of the process releases are expected to be released to the same receiving medium on the
same days. Therefore, daily and annual releases to a given medium may be summed to yield total amounts.
76. Many of the environmental release estimates presented in this document are based on standard
EPA release models, with the exception of the methodology described in Section 4.4 for estimating the
amount of the chemical of interest released from the spent dyebath, which assumes that the dye not affixed
to the substrate is released to water. Table 4-1 summarizes the release estimation methods used in this
ESD.
77. Note that the standard model default values cited are current as of the date of this ESD; however,
EPA may update these models as additional data become available. It is recommended that the most
current version of the models be used in these calculations.
78. EPA has developed a software package (ChemSTEER) containing the standard EPA models
(except the EPA/OPPT Dust Emissions from Solid Transfers Model) as well as all current EPA defaults.
Appendix B provides additional information on ChemSTEER, including instructions for obtaining the
program, as well as background information, model equations, and default values for several parameters
for all standard EPA models.

ENV/JM/MONO(2015)50
39
Table 4-1. Summary of Use of Textile Dyes Scenario Release Models
Release
Source # Description Model Name or Description
a
Standard
EPA Model
()
1 Transfer operation dust emissions
of solid powder chemical to air,
landfill, POTW, or incineration
during unloading
EPA/OPPT Dust Emissions from Solid
Transfers Model
2 Container residue losses to
POTW, incineration or landfill
Specific model used is based on the type
and size of the containers, and on the
physical state of the formulation:
EPA/OPPT Bulk Transport Residual
Model
EPA/OPPT Drum Residual Model
EPA/OPPT Small Container Residual
Model
3 Disposal of spent dye batch to
POTW.
Loss rate is based on available industry-
specific data.
4 Equipment cleaning residue
losses to POTW
EPA/OPPT Single Process Vessel
Residual Model
OPPT – Office of Pollution Prevention and Toxics.
79. All release equations below estimate daily release rates for a given site. To estimate annual
releases for all sites for a given source, the daily release rates must be multiplied by the number of days of
release and by the total number of sites using the textile dye (Nsites).
4.1 Control Technologies
80. Water is used extensively for the textile dyeing process. Pollution may be controlled via sludge
ponds, water treatment and recovery (Jasper, 2011). EPA recommends that as a default, it should be
assumed all aqueous wastes are discharged to a publicly owned treatment works (POTW) for pretreatment
prior to discharge to surface waters.
4.2 Transfer Operations Losses to POTW, Air, Incineration or Landfill from Unloading the Dye
Formulation (Release 1)
81. For nonvolatile liquid dye formulations, this release is negligible. When solid powders are
unloaded, dust may be generated from transfer operations. The EPA/OPPT Dust Emissions from
Transferring Solids Model may be used to estimate dust releases generated during the transfer of solid dye
formulations. This model assumes that up to 0.5 percent of the transferred quantity may be released to the
environment. The rationale, defaults, and limitations of these models are further explained in Appendix B.
82. Most facilities utilize some type of control technology to collect fugitive emissions. Many
facilities collect fugitive dust emissions from these operations in filters and dispose of the filters in landfills
or by incineration. Wet scrubbers may also be utilized by industry. In some cases, uncontrolled/uncollected
particulate may be small enough to travel several miles from the facility, resulting in environmental and
human exposures to the chemical of interest beyond the boundaries of the site. Some amount of the dust
particles may alternately settle on the floor or equipment within the workspace and are disposed of during
facility cleaning (water if the floors are rinsed or land or incineration if the floors are swept). Therefore, if

ENV/JM/MONO(2015)50
40
additional site specific information is not available, this release is conservatively assumed released to air,
water, incineration, or land.
83. The daily release of fugitive dust emissions can be estimated using the daily use rate
(Qchem_site_day).
84. If the facility-specific information states a control technology is employed, the release may be
partitioned to the appropriate media. Table 4-2 provides estimated efficiencies for more common control
technologies that may be used in the radiation curable products industry.
Table 4-2. Estimated Control Technology Efficiencies
Control Technology Estimated Efficiency
(%) Notes
Default Media of
Release for Controlled
Release
Filter (such as a
baghouse)
>99 For particles >1 μm Incineration or Land
Cyclone/Mechanical
Collectors
80-99 For particles >15 μm Incineration or Land
85. The portion of release that may be captured by the control technology may be disposed to
incineration or land or may be recycled. If the control technology is not known, it can be assumed that
none of the dust generated is captured. If the control technology is known, the quantity captured may be
estimated using the following equation:
oldust_contrationdust_generdaychem_site_reddust_captu FFQElocal (4-1)
Where:
Elocaldust_captured = Daily amount captured by control technology from
transfers or unloading (kg/site-day)
Qchem_site_day = Daily use rate of chemical per site-day (kg/site-day; see
Section 3.5)
Fdust_generation = Loss fraction of chemical lost during transfer/unloading of
solid powders (Default = 0.005 kg of released/kg handled; EPA, 2007)
Fdust_control = Control technology capture efficiency (kg captured/kg
processed) (Default: If the control technology is unknown, assume capture
efficiency = 0 kg captured/kg processed, see Table 4-2 for alternative
efficiencies).
86. The portion of the release that will not be captured by the control technology and may be released
to air or settle onto the facility floor may be estimated using the following equation:
oldust_contrationdust_generdaychem_site_ivedust_fugit F1FQElocal (4-2)
Where:
Elocaldust_fugitive = Daily amount not captured by control technology from
transfers or unloading (kg/site-day)
Qchem_site_day = Daily use rate of chemical per site-day (kg/site-day; see

ENV/JM/MONO(2015)50
41
Section 3.5)
Fdust_generation = Loss fraction of chemical lost during transfer/unloading of solid powders
(Default = 0.005 kg of released/kg handled; EPA, 2007)
Fdust_control = Control technology capture efficiency (kg captured/kg processed) (Default: If
the control technology is unknown, assume capture efficiency = 0 kg
captured/kg processed, see Table 4-2 for alternative efficiencies).
87. This approach is designed for screening-level estimates where appropriate industry-specific or
chemical specific information is not available. If the site provided a loss fraction from dust releases, then
the site-specific number should be used.
4.3 Container Residue Losses to POTW, Incineration, or Landfill (Release 2)
88. Containers that are used to transport dye formulations contain residuals that may be released into
the environment. ETAD indicates that the residuals may be handled in several different ways. The
container residual may be rinsed out and used in the dyeing process, containers may be returned to the
manufacturer or formulator for reuse, or transport boxes may be landfilled or incinerated (ETAD, 2011).
Because these media of release are facility-dependent, EPA recommends assessing releases to POTW,
incineration or landfill if site-specific information is not known. Note that while containers may be shipped
back to the manufacturer or formulator, EPA assumes that containers are cleaned or disposed at the use site
in order to generate conservative release estimates.
89. Container sizes range from 25 kg through 1,000 kg (ETAD, 2011; Jasper, 2011). EPA suggests
that a default transportation container size of a 35-gallon drum should be used if no information is
provided. Engineering judgment should be used to determine if another container type or size is more
appropriate (e.g. a 50-pound bag may be more appropriate for a solid component).
90. The amount of dye remaining in transport containers will likely depend on the size of the
transport container and the physical form of the component product. Therefore, the following standard
EPA models may be used to estimate container residue releases:
EPA/OPPT Bulk Transport Residual Model may be used for large containers (e.g. totes, tank
trucks, rail cars) containing greater than or equal to 100 gallons of liquid;
EPA/OPPT Drum Residual Model may be used for drums containing between 20 and 100 gallons
of liquid;
EPA/OPPT Small Container Residual Model may be used for liquid containers containing less
than 20 gallons;
EPA/OPPT Solid Residuals in Transport Containers Model may be used for containers of all
sizes containing solids.
91. Note that these models estimate between 0.2 (bulk containers) and 3 percent (drums) of the
received material may be released to the environment. The rationale, defaults, and limitations of these
models are further explained in Appendix B. The release estimates are based on the current version of the
models. Standard EPA/OPPT models are subject to change; therefore, the current version of the standard
EPA/OPPT model should be used.

ENV/JM/MONO(2015)50
42
92. Dyes may be received as liquids or solids. If the physical state of the component is not known,
EPA suggests using engineering judgment to determine if the chemical of interest should be assumed a
solid or liquid for the purposes of the assessment.
93. The annual number of containers used per year (Ncontainer_unload_site_yr) is estimated based on the
daily use rate of the component and the container size (see Section 3.7). EPA recommends assuming 35-
gallon (132.5 L) drums as default. If the fraction of the chemical in the dye formulation is unknown,
assume 75 percent concentration for solid dye formulations or 25 percent concentration for liquid dye
formulations (see Section 3.3).
94. If the Ncontainer_unload_site_yr value is fewer than the days of operation (TIMEoperating_days), the days of
release equal Ncontainer_unload_site_yr and the daily release is calculated based on the following equation:
e_dayunload_sitcontainer_residuecontainer_chem_dyenformulatiocontainerspresidue_dicontainer_ N FFRHOVElocal (4-3a)
This release will occur over [Ncontainer_unload_site_yr] days/year from [Nsites] sites
Where:
Elocalcontainer_residue_disp = Daily release of chemical of interest from container residue (kg
chemical/site-day)
Vcontainer = Volume of transport container (Default: 132.5 L
formulation/container (35-gallon drum; see Table B-1 in
Appendix B for alternative default container volumes)
RHOformulation = Density of dye formulation (kg/L formulation; Default: 1 kg/L for
the density of water)
Fchem_dye = Mass fraction of the chemical of interest in the dye formulation
(kg chemical/kg dye formulation) (See Section 3.3)
Fcontainer_residue = Fraction of dye component remaining in the container as residue
(Default: liquid - 0.03 kg dye formulation remaining/kg shipped
for drums (EPA, 2002); see Appendix B for defaults used for
other container types)
Ncontainer_unload_site_day5 = Number of containers unloaded per site, per day (Default: 1
container/site-day)
95. If Ncontainer_unload_site_yr is greater than TIMEoperating_days (See Section 3.2), more than one container is
unloaded per day (e.g., Ncontainer_unload_site_day > 1). The days of release should equal the days of operation,
and the average daily release can be estimated based on Equation 4-3b:
5 The daily number of containers unloaded per site may be estimated as (consistent with Section 3.7):
day soperating_
_y rempty _sitecontainer_
e_dayunload_sitcontainer_TIME
NN
(Ncontainer_unload_site_day should be rounded up to the nearest integer.)
Where:
Ncontainer_unload_site_yr = Annual number of containers emptied containing chemical of interest per site
(containers/site-yr) (See Section 3.7 )
TIMEoperating_days = Annual number of days the dye product is formulated (days/yr) (See Section 3.2)

ENV/JM/MONO(2015)50
43
residuecontainer_daychem_site_spresidue_dicontainer_ FQElocal (4-3b)
This release will occur over [TIMEoperating_days] days/year from [Nsites] sites
Where:
Elocalcontainer_residue_disp = Daily release of chemical of interest from container residue (kg
chemical/site-day)
Qchem_site_day = Daily use rate of the chemical of interest (kg chemical/site-day)
(See Section 3.5)
Fcontainer_residue = Fraction of dye formulation remaining in the container as residue
(Default: 0.03 kg dye formulation remaining/kg shipped for drums
(EPA, 2002); see Appendix B for defaults used for other container
types)
4.4 Disposal of Spent Dyebath to POTW (Release 3)
96. Because of the large amounts of water used in textile dyeing processes, aqueous wastes are often
treated or recovered (Jasper, 2011). As stated in Section 4.1, EPA recommends that as a default, it should
be assumed all aqueous wastes are discharged directly POTW prior to discharge to surface waters.
Disposal of spent dyebath is assumed to occur at the end of each dyeing operation to POTW. The daily
release of spent dyebath is assumed to be the amount of chemical that is not affixed to the textile. Table 1-2
lists typical fixation rates for various types of dyes and process types. If the type of dye is listed in the
table, use the fixation rate available. If the type of dye and process are unknown, EPA recommends
choosing the lowest average fixation rate of 70% (sulfur dye, continuous process), to generate more
conservative release estimates. For an unknown dye type in a batch process, EPA recommends 75%
fixation (reactive dye, cotton, batch process). Daily releases are calculated using the following equation:
fixationdaychem_site_athspent_dyeb F1QElocal (4-4)
This release will occur over [TIMEoperating_days] days/year from [Nsites] sites
Where:
Elocalspent_dyebath = Daily release of chemical of interest from disposal of spent
dyebath (kg chemical/site-day)
Qchem_site_day = Daily use rate of the chemical of interest (kg chemical/site-day)
(See Section 3.5)
Ffixation = Fraction of dye product affixed on to textile during dyeing process
substrate (Default: see Table 1-2; 70% for unknown dye and
process type)
4.5 Equipment Cleaning to POTW (Release 4)
97. Equipment used to dye textiles may contain residues that need to be rinsed before starting a new
textile batch. The amount of residual dye formulation chemical remaining in the process equipment may be
estimated using the EPA/OPPT Single Process Vessel Residual Model. The model assumes that no more
than one percent of the batch size or capacity of the process remains in the equipment as residue that is
released as equipment cleaning waste. As a conservative estimate, EPA assumes that cleaning residuals are
disposed with the spent dyebath to POTW after each batch.

ENV/JM/MONO(2015)50
44
98. The daily release of chemical residue in the process equipment is calculated using the following
equation:
cleaningequipment_daychem_site_cleaningequipment_ FQElocal (4-5)
This release will occur over [TIMEoperating_days] days/year from [Nsites] sites.
Where:
Elocalequipment_cleaning = Daily release of chemical of interest from equipment cleaning (kg
chemical/site-day)
Qchem_site_day = Daily use rate of the chemical of interest in the dye formulation
(kg chemical/site-day) (See Section 3.5)
Fequipment_cleaning = Fraction of dye product released as residual in process equipment
(Default: 0.01 kg product released/kg batch holding capacity
(EPA, 1992))

ENV/JM/MONO(2015)50
45
5 OCCUPATIONAL EXPOSURE ASSESSMENTS
99. The following section presents estimation methods for worker exposures to the chemical of
interest during the application process. Figure 2-2 illustrates the occupational activities performed within
the application process that have the greatest potential for worker exposure to the chemical. Table 5-1
summarizes the exposure estimation methods used in this ESD.
100. Note that the standard model default values cited are current as of the date of this ESD; however,
EPA may update these models as additional data become available. It is recommended that the most
current version of the models be used in these calculations.
101. EPA has developed a software package (ChemSTEER) containing these models as well as all
current EPA defaults. Inhalation and dermal exposures are presented in terms of quantity per day;
absorption and toxicity are outside the scope of the ESD. Appendix B provides additional information on
ChemSTEER, including EPA models.

ENV/JM/MONO(2015)50
46
Table 5-1. Summary of Dye Application Scenario Exposure Models
Exposure
Activity Description
Route of Exposure /
Physical Form Model Name or Descriptiona
Standard
EPA
Model
()
A Exposure to liquid or
solid dye product
during unloading or
transferring
Inhalation of solid
powder dust
emissions
Specific model is based on the
volume of total material handled:
EPA Small Volume Handling
Model (Based on data from dye
weighing operations)
OSHA PNOR PEL-Limiting
Model
Dermal exposure to
liquid chemical or
solid chemical
Specific model is based on the
physical form of the material:
EPA/OPPT 2-Hand Dermal
Contact with Liquids Model
EPA/OPPT Direct 2-Hand
Dermal Contact with Solids
Model
B Exposure to liquid or
solid dye product
during container
cleaning
Inhalation of solid
powder dust
emissions
Specific model is based on the
volume of total material handled:
EPA Small Volume Handling
Model
OSHA PNOR PEL-Limiting
Model
Dermal exposure to
liquid chemical or
solid chemical
Specific model is based on the
physical form of the material:
EPA/OPPT 2-Hand Dermal
Contact with Liquids Model
EPA/OPPT Direct 2-Hand
Dermal Contact with Solids
Model
C Exposure to liquid
dye product during
machine operation
Dermal exposure to
liquid chemical
EPA/OPPT 2-Hand Dermal
Contact with Liquids Model
a – Additional detailed descriptions for each of the models presented in this section are provided in Appendix B to this ESD.

ENV/JM/MONO(2015)50
47
5.1 Personal Protective Equipment
102. Textile dye workers typically wear safety glasses, goggles, aprons, respirators, and/or masks
(ETAD, 2001; Jasper, 2011). However, exposure mitigation by PPE is affected by many factors including:
availability, cost, worker compliance, impact on job performance, chemical and physical properties of the
substance and protective clothing, and the use, decontamination, maintenance, storage, and disposal
practices applicable to the industrial operation (EPA, 1997). The effectiveness of PPE are analyzed
separately from this ESD. Therefore, the conservative, screening-level occupational exposure estimates
presented do not account for PPE. Actual occupational exposure may be significantly less than the
estimates presented in this ESD.
5.2 Number of Workers Exposed Per Site and Days per Year of Exposure
103. ETAD estimated that there would be one worker exposed during weighing and one worker during
dyeing and disposal (ETAD, 2011). The Textile Dye Weighing Monitoring Study (TDWMS) revealed that
on average 1 to 2 workers are exposed per shift, over typically 3 shifts per day (EPA, 1990). A search of
recent PMN submissions revealed company estimates of between 1 to 6 workers. EPA recommends
estimating between 3 to 6 workers exposed per day, with 1 to 2 workers exposed during dye weighing, 1 to
2 workers exposed during container cleaning, and 1 to 2 exposed during dyeing and disposal. As discussed
in Section 3.2, EPA recommends assuming 157 operating days per year. The reader should note that the
exposure days per site, per year should be consistent with the release days, but EPA assumes a maximum
of 250 days per year. These exposure duration maximum defaults are based on fulltime employment and
considers an individual worker’s vacation, sick, and weekend time (i.e., a 40-hour work week over 50
weeks per year).
5.3 Exposure from Unloading and Transferring Dye Product (Exposure A)
104. Workers may connect transfer lines or manually unload chemicals from transport containers into
dyeing equipment or storage. If the concentration of the chemical in the dye formulation (Fchem_dye) is
unknown, default concentrations may be assumed as a conservative default, as previously discussed in
Section 3.3. As stated in Section 5.2, EPA recommends assuming between 1 to 2 workers exposed per site-
day for this activity.
5.3.1 Inhalation Exposure
5.3.1.1 Liquids
105. Inhalation exposure is expected to be negligible for non-volatile chemicals (VP < 0.001 torr).
5.3.1.2 Solids:
106. The transfer of solid dye product from containers to storage or the dyeing equipment generates
particulates. The degree of inhalation exposure to particulates depends on the concentration of the chemical
of interest in the dye (Fchem_dye), the potential concentration of the dye in the worker’s breathing zone
(Cparticulate), and the total amount of dye formulation the worker is exposed to per day in performing this
activity (Qdye_formulation_day).
107. Two equations can be used to determine worker exposure. Selection of the appropriate equation
should be based on the amount of dye formulation the worker is exposed to per day (Qdye_formulation_day), not
the amount of chemical of interest the worker is exposed to (Qchem_site_day). Additional explanation of the
two standard EPA models used to estimate inhalation exposure to solid powder is presented in Appendix
B.

ENV/JM/MONO(2015)50
48
108. If the transfer rate of the solid dye formulation containing the chemical of interest
(Qdye_formulation_day) is greater than 54 kg/site-day, EPA recommends using the OSHA Total Particulates Not
Otherwise Regulated (PNOR) PEL-Limiting Model:
chemexposurebreathingeparticulatinhalation FTIMERATECEXP (5-1a)
109. This exposure will occur over TIMEoperating_days, up to 250 days/year.
Where:
EXPinhalation = Inhalation exposure to the chemical of interest per day (mg
chemical of interest/day)
Cparticulate = Concentration of particulate dye product component in the
workers breathing zone (Default: 15 mg component/m3; based on
OSHA Total PNOR PEL (8-hr TWA*) (29 CFR 1910.1000))
RATEbreathing = Typical worker breathing rate (Default: 1.25 m3/hr (EPA, 1991))
TIMEexposure = Duration of exposure (Default: 8 hrs/day; Note: because the
default value for Cparticulate is an 8-hr TWA*, the 8 hrs/day value
must be used)
Fchem_dye = Mass fraction of the chemical of interest in the dye product (mg
chemical/mg dye product) (See Section 3.3)
*TWA = Time-weighted average
110. The accuracy of solid component inhalation estimates are limited by the estimated airborne
concentration of the chemical of interest and the assumed breathing rate.
111. If the transfer rate of the solid powder dye containing the chemical of interest (Qdye_formulation_day) is
less than or equal to 54 kg/site-day, EPA recommends using the EPA/OPPT Small Volume Solids
Handling Inhalation Model. This model was derived from the 1990 study of textile dye weighing
operations (TDWMS), which conducted exposure monitoring for dye weighing rooms at 24 textiles wet
processing plants. The study was intended to estimate the distribution of dye concentrations in the dye
weigher’s breathing zone. The typical weight fraction of the total particulate in the dye product component
in the worker’s breathing zone was calculated based on the arithmetic mean of the data collected (0.0477
mg exposure/kg dye). The worst case scenario was based on the point where there was 95% confidence
that no more than 10% of the data were greater than the value (EPA, 1990). These values are used in the
following equation:
exposurechem_dyeation_daydye_formulinhalation FFQEXP (5-1b)
112. This exposure will occur over TIMEoperating_days, up to 250 days/year.
Where:
EXPinhalation = Inhalation exposure to the chemical of interest per day (mg
chemical of interest/day)
Qdye_formulation_day = Daily amount of dye formulation transferred into the process (kg
dye/site-day) (See Section 3.4)
Fchem_dye = Mass fraction of the chemical of interest in the dye formulation
(mg chemical/mg dye formulation) (See Section 3.3)

ENV/JM/MONO(2015)50
49
Fexposure = Weight fraction of the total particulate dye product component in
the workers breathing zone (Default: 0.0477 (typical) to 0.161
(worst) mg component exposure/kg of dye handled (EPA, 1992))
5.3.2 Dermal Exposure:
113. Dermal exposure is expected for both automated and manual unloading activities. Automated
systems may limit the extent of dermal exposure more than manual unloading; however, workers may still
be exposed when connecting transfer lines or transferring liquid chemicals from transport containers to
mixing vessels. Workers may manually scoop or pour solid or liquid dye product chemicals into the
process equipment.
114. For a liquid dye formulation the EPA recommends the EPA/OPPT 2-Hand Dermal Contact with
Liquid Model to estimate dermal exposure to the chemical of interest. For solid dye formulation, EPA
recommends the EPA/OPPT Direct 2-Hand Dermal Contact with Solids Model to estimate dermal
exposure to the chemical of interest in a solid powder formulation. The rationale, defaults, and limitations
of these models are further explained in Appendix B. Both models are discussed below.
5.3.2.1 Liquid
115. To estimate the potential worker exposure to the chemical of interest in a liquid dye product for
this activity, EPA recommends the EPA/OPPT 2-Hand Dermal Contact with Liquid Model:
chem_dy entexp_incidesurfacenliquid_skidermal FNAREAQEXP (5-2a)
116. This exposure will occur over TIMEoperating_days up to 250 days per year.
Where:
EXPdermal = Potential dermal exposure to the chemical of interest per day (mg
chemical/day)
Qliquid_skin = Quantity of liquid dye product component remaining on skin
(Defaults: 2.1 mg component/cm2-incident (high-end) and 0.7 mg
component/cm2-incident (low-end) for routine or incidental
contact (EPA, 2000))
AREAsurface = Surface area of contact (Default: 1070 cm2 for 2 hands (EPA,
2013))
Nexp_incident6 = Number of exposure incidents per day (Default: 1 incident/day)
Fchem_dye = Mass fraction of the chemical of interest in the dye formulation
(mg chemical/mg dye formulation) (See Section 3.3)
6Only one contact per day (Nexp_incident = 1 event/worker-day) is assumed because Qliquid_skin, with few exceptions, is
not expected to be significantly affected either by wiping excess chemical material from skin or by
repeated contacts with additional chemical material (e.g., wiping excess from the skin does not remove a
significant fraction of the small layer of chemical material adhering to the skin and additional contacts with
the chemical material do not add a significant fraction to the layer). Exceptions to this assumption may be
considered for chemicals with high volatility and/or with very high rates of absorption into the skin.

ENV/JM/MONO(2015)50
50
5.3.2.2 Solids
117. To estimate the potential worker exposure to the chemical of interest in a solid dye product for
this activity, EPA recommends the EPA/OPPT Direct 2-Hand Dermal Contact with Solids Model:
chem_dty entexp_incidedermal FNincidentcomponent/ mg 3,100 toupEXP (5-2b)
118. This exposure will occur over TIMEoperating_days up to 250 days per year.
Where:
EXPdermal = Potential dermal exposure to the chemical of interest per day (mg
chemical/day)
Nexp_incident = Number of exposure incidents per day (Default: 1 incident/day)
(see Equation 5-2a)
Fchem_dye = Mass fraction of the chemical of interest in the dye product (mg
chemical/mg dye product) (See Section 3.3)
5.4 Exposure During Transport Container Cleaning (Exposure B)
119. Workers may be exposed while rinsing containers used to transport textile dyes. If the
concentration of the chemical in the component (Fchem) is unknown, 75% percent concentration for powder
dyes and 25% for liquid dyes may be assumed as a conservative default, as previously discussed in Section
3.3. As stated in Section 5.2, EPA recommends assuming between 1 to 2 workers exposed per site-day for
this activity.
5.4.1 Inhalation Exposure:
5.4.1.1 Liquids
120. Inhalation exposure is expected to be negligible for non-volatile chemicals (VP < 0.001 torr).
5.4.1.2 Solids
121. The cleaning of solid powders from transport containers may generate dust particulates. The
degree of inhalation exposure to particulates depends on the concentration of the chemical of interest in the
dye (Fchem_dye), the potential concentration of the dye in the worker’s breathing zone (Cparticulate), and the
total amount of dye formulation residual removed from the containers (Qdye_formulation_residue). The following
equation may be used to estimate the amount of dye formulation residual handled by a worker during
container cleaning:
chem_dye
spresidue_dicontainer_
dueation_residye_formulF
ElocalQ (5-3)
Where:
Qdye_formulation_residue = Quantity of dye formulation handled during container cleaning
(kg dye formulation/site-day)
Elocalcontainer_residue_disp = Daily release of chemical of interest from container residue (kg
chemical of interest/site-day; see Section 4.3)

ENV/JM/MONO(2015)50
51
Fchem_dye = Weight fraction of the chemical of interest in the dye formulation
(Defaults: solid: 0.75 kg chemical/kg dye formulation; liquid:
0.25 kg chemical/kg dye formulation; See Section 3.3)
122. Two equations can be used to determine worker exposure. Selection of the appropriate equation
(Equation 5-4a or Equation 5-4b) should be based on the amount of dye formulation residue the worker is
exposed to per day (Qdye_formulation_residue), not the amount of chemical of interest disposed from container
cleaning per day (Elocalcontainer_residue_disp). A further explanation, including the background and model
defaults, of the two standard EPA/OPPT models used to estimate inhalation exposure to solid powder is
presented in Appendix B.
123. If the quantity of solid dye formulation residue containing the chemical of interest handled per
day (Qdye_formulation_residue) is greater than 54 kg/site-day, EPA recommends using the OSHA Total
Particulates Not Otherwise Regulated (PNOR) PEL-Limiting Model:
chemexposurebreathingeparticulatinhalation FTIMERATECEXP (5-4a)
124. This exposure will occur over [the lesser of Ncontainer_unload_site_yr or TIMEoperating_days (consistent with
Section 4.3), up to 250] days/year.
Where:
EXPinhalation = Inhalation exposure to the chemical of interest per day (mg
chemical of interest/day)
Cparticulate = Concentration of particulate dye product component in the
workers breathing zone (Default: 15 mg component/m3; based on
OSHA Total PNOR PEL (8-hr TWA*) (29 CFR 1910.1000))
RATEbreathing = Typical worker breathing rate (Default: 1.25 m3/hr (EPA, 1991))
TIMEexposure = Duration of exposure (Default: 8 hrs/day; Note: because the
default value for Cparticulate is an 8-hr TWA*, the 8 hrs/day value
must be used)
Fchem_dye = Mass fraction of the chemical of interest in the dye product (mg
chemical/mg dye product) (See Section 3.3)
*TWA = Time-weighted average
125. The accuracy of solid component inhalation estimates are limited by the estimated airborne
concentration of the chemical of interest and the assumed breathing rate.
126. If the quantity of the solid powder dye formulation residue containing the chemical of interest
(Qdye_formulation_residue) is less than or equal to 54 kg/site-day, EPA recommends using the EPA/OPPT Small
Volume Solids Handling Inhalation Model:
exposurechem_dyedueation_residye_formulinhalation FFQEXP (5-4b)
127. This exposure will occur over [the lesser of Ncontainer_unload_site_yr or TIMEoperating_days (consistent with
Section 4.3), up to 250] days/year.

ENV/JM/MONO(2015)50
52
Where:
EXPinhalation = Inhalation exposure to the chemical of interest per day (mg
chemical of interest/day)
Qdye_formulation_residue = Daily amount of dye formulation transferred into the process (kg
dye/site-day) (See Section 3.4)
Fchem_dye = Mass fraction of the chemical of interest in the dye formulation
(kg chemical/kg dye formulation) (See Section 3.3)
Fexposure = Weight fraction of the total particulate dye product component in
the workers breathing zone (Default: 0.0477 (typical) to 0.161
(worst) mg component exposure/kg of dye handled (EPA, 1992))
5.4.2 Dermal Exposure:
128. Dermal exposure is expected for both automated and manual unloading activities. Automated
systems may limit the extent of dermal exposure more than manual unloading; however, workers may still
be exposed when connecting transfer lines or transferring liquid chemicals from transport containers to
mixing vessels. Workers may manually scoop or pour solid or liquid dye product chemicals into the
process equipment.
129. For a liquid dye formulation the EPA recommends the EPA/OPPT 2-Hand Dermal Contact with
Liquid Model to estimate dermal exposure to the chemical of interest. For solid dye formulation, EPA
recommends the EPA/OPPT Direct 2-Hand Dermal Contact with Solids Model to estimate dermal
exposure to the chemical of interest in a solid powder formulation. The rationale, defaults, and limitations
of these models are further explained in Appendix B. Both models are discussed below.
5.4.2.1 Liquids
130. To estimate the potential worker exposure to the chemical of interest in a liquid dye product for
this activity, EPA recommends using the following equation:
chem_dy entexp_incidesurfacenliquid_skidermal FNAREAQEXP (5-5a)
131. This exposure will occur over [the lesser of Ncontainer_unload_site_yr or TIMEoperating_days (consistent with
Section 4.3), up to 250] days/year.
Where:
EXPdermal = Potential dermal exposure to the chemical of interest per day (mg
chemical/day)
Qliquid_skin = Quantity of liquid dye product component remaining on skin
(Defaults: 2.1 mg component/cm2-incident (high-end) and 0.7 mg
component/cm2-incident (low-end) for routine or incidental
contact (EPA, 2000))
AREAsurface = Surface area of contact (Default: 1070 cm2 for 2 hands (EPA,
2013))
Nexp_incident7 = Number of exposure incidents per day (Default: 1 incident/day)
7Only one contact per day (Nexp_incident = 1 event/worker-day) is assumed because Qliquid_skin, with few exceptions, is
not expected to be significantly affected either by wiping excess chemical material from skin or by
repeated contacts with additional chemical material (i.e., wiping excess from the skin does not remove a

ENV/JM/MONO(2015)50
53
Fchem_dye = Mass fraction of the chemical of interest in the dye formulation
(mg chemical/mg dye formulation) (See Section 3.3)
5.4.2.2 Solids:
132. To estimate the potential worker exposure to the chemical of interest in a solid dye product for
this activity, EPA recommends using the following equation (EPA, 2000):
chem_dty entexp_incidedermal FNincidentcomponent/ mg 3,100 toupEXP (5-5b)
133. This exposure will occur over [the lesser of Ncontainer_unload_site_yr or TIMEoperating_days (consistent with
Section 4.3), up to 250] days/year.
Where:
EXPdermal = Potential dermal exposure to the chemical of interest per day (mg
chemical/day)
Nexp_incident = Number of exposure incidents per day (Default: 1 incident/day)
(see Equation 5-5a)
Fchem_dye = Mass fraction of the chemical of interest in the dye product (mg
chemical/mg dye product) (See Section 3.3)
5.5 Exposure from Machine Operation (Exposure C)
134. Workers may be exposed to the chemical of interest in the liquid dyebath during removal of dyed
goods after batch processes or during handling of dyed rolls of material. The concentration of the chemical
in the dyebath was discussed previously in Section 3.8. As stated in Section 5.2, EPA recommends
assuming between 1 to 2 workers exposed per site-day for this activity.
5.5.1 Inhalation Exposure:
135. Inhalation exposure is expected to be negligible for non-volatile chemicals (VP < 0.001 torr).
5.5.2 Dermal Exposure:
136. The EPA/OPPT 2-Hand Dermal Contact with Liquid Model may be used to estimate dermal
exposure to the chemical of interest in a liquid formulation during these activities. The rationale, defaults,
and limitations of this model is further explained in Appendix B.
137. To estimate the potential worker exposure to the chemical of interest in a liquid dye product for
this activity, EPA recommends using the following equation:
thchem_dyebantexp_incidesurfacenliquid_skidermal FNAREAQEXP (5-6)
This exposure will occur over TIMEoperating_days up to 250 days per year.
significant fraction of the small layer of chemical material adhering to the skin and additional contacts with
the chemical material do not add a significant fraction to the layer). Exceptions to this assumption may be
considered for chemicals with high volatility and/or with very high rates of absorption into the skin.

ENV/JM/MONO(2015)50
54
Where:
EXPdermal = Potential dermal exposure to the chemical of interest per day (mg
chemical/day)
Qliquid_skin = Quantity of liquid dye product component remaining on skin
(Default: 0.7 mg component/cm2-incident (low-end) for routine or
incidental contact (EPA, 2000))
AREAsurface = Surface area of contact (Default: 1070 cm2 for 2 hands (EPA,
2013))
Nexp_incident8 = Number of exposure incidents per day (Default: 1 incident/day)
Fchem_dyebath = Mass fraction of the chemical of interest in the dyebath (mg
chemical/mg dye formulation) (See Section 3.8)
8Only one contact per day (Nexp_incident = 1 event/worker-day) is assumed because Qliquid_skin, with few exceptions, is
not expected to be significantly affected either by wiping excess chemical material from skin or by
repeated contacts with additional chemical material (i.e., wiping excess from the skin does not remove a
significant fraction of the small layer of chemical material adhering to the skin and additional contacts with
the chemical material do not add a significant fraction to the layer). Exceptions to this assumption may be
considered for chemicals with high volatility and/or with very high rates of absorption into the skin.

ENV/JM/MONO(2015)50
55
6 SAMPLE CALCULATIONS
138. This section presents an example of how the equations introduced in Sections 3, 4, and 5 might
be used to estimate releases of and exposures to a volatile chemical present in a liquid component of an
dye product that is spray applied onto a substrate. The default values used in these calculations are
presented in Sections 3 through 5 and should be used only in the absence of site-specific information. The
following data are used in the example calculations:
1. Chemical of interest production volume (Qchem_yr) is 10,000 kg chemical/yr.
2. Chemical of interest is part of a solid dye formulation at an unknown percentage.
3. Chemical of interest is a reactive dye with an unknown fixation rate.
4. Dyeing application process and textile type is unknown.
6.1 General Facility Information for Application of Dye Products
6.1.1 Days of Operation (TIMEoperating_days)
139. If specific information is not available to estimate the days of operation using the chemical of
interest (TIMEoperating_days) at a textile dyeing manufacturing site, a default value of 157 days per year should
be assumed.
6.1.2 Mass Fraction of the Chemical of Interest in the Dye Formulation (Fchem_dye)
140. The mass fraction (Fchem_dye) of the solid chemical in the dye formulation is unknown; therefore a
default value of 0.75 is assumed.
Fchem_dye = Mass fraction of the chemical of interest in the dye formulation
(Defaults: solid: 0.75 kg chemical/kg dye formulation; liquid:
0.25 kg chemical/kg dye formulation)
6.1.3 Daily Use Rate of Dye Formulation (Qdye_formulation_day)
141. The daily dye formulation use rate is not specified; therefore the default fabric use rate and mass
fractions result in a dye use rate of 136.5 kg/day for powder dye formulations.
dy e_fabricfabricfabrication_daydy e_formul F FVQ
(3-1)

ENV/JM/MONO(2015)50
56
daysite
nformulatio dye kg 136.5
dyed textilekg
nformulatio dye kg 0.05
processed textilekg
dyed textilekg 0.3
daysite
processed textilekg 9,100
Qdye_formulation_day = Daily use rate of the dye formulations (kg dye formulation /site-
day)
Vfabric = Amount of textile dyed per site-day (default = 9,100 kg fabric
processed /site-day)
Ffabric = Mass fraction of textile treated with the dyestuff (default = 0.3 kg
textile dyed/kg textile processed)
Fdye_fabric = Mass fraction of dye used per textile dyed (defaults: powder dyes
= 0.05 kg dye formulation/kg textile dyed; liquid dyes = 0.10 kg
dye formulation/kg textile dyed)
6.1.4 Daily Use Rate of Chemical of Interest (Qchem_site_day)
142. The daily use rate of the chemical of interest during textile dyeing can be estimated using
Equation 3-1:
dy echem_dy eation_daydy e_formuldaychem_site_ FF QQ (3-2)
daysite
chemical kg 102.410.75
daysite
nformulatio dye kg 136.5Q daychem_site_
Where:
Qchem_site_day = Daily use rate of the chemical of interest contained in the dye
formulation (kg chemical used/site-day)
Qdye_formulation_day = Daily use rate of the dye formulation (kg dye formulation /site-
day) (see Section 6.1.3)
Fchem_dye = Mass fraction of the chemical of interest in the dye formulation
(see Section 6.1.2)
Fdye Mass fraction of the dye formulation containing the chemical
interest per the amount of dye formulation used (Default = 1).
6.1.5 Number of Sites (Nsites)
143. The number of textile dyeing facilities using the chemical of interest (Nsites) can be estimated
using Equation 3-2:
day soperating_daysite_chem_
rchem_y
sitesTIMEQ
QN
(3-3)
site 1site 62.0days 148
yr
chemical kg 02.41
day-site
yr
chemical kg 000,10
sitesN
Where:
Nsites = Number of sites using the precursor chemical (sites)
Qchem_yr = Annual production volume of chemical of interest (kg
chemical/yr)

ENV/JM/MONO(2015)50
57
Qchem_site_day = Daily use rate of chemical (kg chemical/site-day; see Section
6.1.4)
144. Because the number of sites is rounded to 1, Equation 3-3 is rearranged and the number of use
days is back-calculated using the number of sites:
daysite_chem_Q
sitesN
chem_yrQ
daysoperating_TIME
days 98 days7.97 kg 102.4 site 1
rchemical/y kg 10,000
daysoperating_TIME
6.1.6 Number of Transport Containers Unloaded per Site (Ncontainer_unload_site_yr)
145. The number of transport containers unloaded annually per site can be estimated based on the
daily chemical use rate, container size, operating days, container volume, and the concentration of the dye
formulation. Because the transport container size is unknown, 35-gallon drums were chosen as default:
yr-site
container101
nformulatio kg 1
L
L 132.5
container
chemical kg 0.75
nformulatio kg 1
yr
sday 89
day-site
chemical kg 102.4
RHOVF
TIMEQN
nformulatiocontainerchem_dye
daysoperating_daychem_site_
e_y runload_sitcontainer_
(3-4)
Where:
Ncontainer_unload_site_yr = Number of transport containers unloaded at each site per year
(containers/site-yr)
Qchem_site_day = Daily use rate of chemical per site (kg chemical/site-yr)
TIMEoperating_days = Number of operating days (days/yr)
Fchem_dye = Mass fraction of the chemical of interest in the dye formulation
(kg chemical/kg dye formulation) (See Section 6.1.2)
Vcontainer = Volume of transport container (Default: 35 gallon drum = 132.5
L)
RHOformulation = Density of chemical formulation (assumed 1 kg/L for liquids)
6.1.7 Mass Fraction of Chemical of Interest in the Dye Bath (Fchem_dyebath)
146. Because the concentration of dye formulation in the dyebath is unknown, the default values are
used:
hdy e_dy ebatchem_dy ethchem_dy eba FFF (3-5)
045.00.0675.0 Where:
Fchem_dyebath = Mass fraction of the chemical of interest in the dyebath (%) (kg
chemical/kg dyebath)
Fchem_dye = Mass fraction of the chemical of interest in the dye formulation
(kg chemical/kg dye formulation) (See Section 6.1.2)

ENV/JM/MONO(2015)50
58
Fdye_dyebath = Mass fraction of the dye formulation in the dyebath (default: 0.06
kg dye formulation/kg dyebath)
6.2 Environmental Releases
6.2.1 Release to POTW, Air, Incineration or Landfill from Unloading Solid Dye Formulation
(Release 1)
147. Release from transfer operations is shown in Equation 4-2, assuming no control technology:
oldust_contrationdust_generdaychem_site_ivedust_fugit F1FQElocal
day-kg/site 5.0
01handled kg
released kg 0.005
day-site
chemical kg 102.4
(4-2)
This release will occur over 98 days/yr at 1 use site.
6.2.2 Release to POTW, Incineration, or Landfill from Container Residue (Release 2)
148. Since the number of containers used per site per year (Ncontainer_unload_site_yr, Section 6.1.6 is greater
than the days of operation (TIMEoperating_days; Section 6.1.1), the days of release equals the number of days or
operation and the daily release is calculated based on the following equation:
residuecontainer_daychem_site_spresidue_dicontainer_ FQElocal (4-3b)
daysite
chemical kg 3 0.03
daysite
chemical 102.4kg
spresidue_dicontainer_Elocal
This release will occur over 98 days/year from 1 site.
Where:
Elocalcontainer_residue_disp = Daily release of chemical of interest from container residue (kg
chemical/site-day)
Qchem_site_day = Daily use rate of the chemical of interest (kg chemical/site-day)
(See Section 6.1.4)
Fcontainer_residue = Fraction of dye formulation remaining in the container as residue
(Default: 0.03 kg dye formulation remaining/kg shipped for drums
(EPA, 2002); see Appendix B for defaults used for other container
types)
6.2.3 Release to POTW from Disposal of Spent Dyebath (Release 3)
149. Because the chemical of interest is a reactive dye with unknown fabric and type of process, the
fixation rate was conservatively assumed to be 75%, based on the values provided in Table 1-2.
fixationdaychem_site_athspent_dy eb F1QElocal (4-4)

ENV/JM/MONO(2015)50
59
day-site
chemical kg 25.6)75.01(
day-site
chemical kg 102.4
This release will occur over 98 days/year from 1 site.
Where:
Elocalspent_dyebath = Daily release of chemical of interest from disposal of spent
dyebath (kg chemical/site-day)
Qchem_site-day = Daily use rate of the chemical of interest (kg chemical/site-day)
(See Section 6.1.4)
Ffixation = Fraction of dye product affixed on to textile during dyeing process
substrate (Default: 0.75; Table 1-2 - lowest typical reactive dye
fixation rate)
This release will occur over 98 days/year from 1 site.
6.2.4 Equipment Cleaning
150. The daily release of chemical residue in the process equipment is calculated using the following
equation:
cleaningequipment_daychem_site_cleaningequipment_ FQElocal (4-5)
daysite
chem kg 101.0
daysite
chem kg 102.4
This release will occur over 98 days/year from 1 site.
Where:
Elocalequipment_cleaning = Daily release of chemical of interest from equipment cleaning (kg
chemical/site-day)
Qchem_site_day = Daily use rate of the chemical of interest in the dye product (kg
chemical/site-day) (See Section 6.1.4)
Fequipment_cleaning = Fraction of dye product released as residual in process equipment
(Default: 0.01 kg product released/kg batch holding capacity
(EPA, 1992))
6.3 Occupational Exposures
6.3.1 Exposure from Unloading and Transferring Dye Product (Exposure A)
6.3.1.1 Inhalation
151. Transfer rate of the solid dye formulation containing the chemical of interest (Qdye_formulation_day) is
greater than 54 kg/site-day (136.5 kg dye formulation/site-day). EPA recommends using the OSHA Total
Particulates Not Otherwise Regulated (PNOR) PEL-Limiting Model:
chem_dyeexposurebreathingeparticulatinhalation FTIMERATECEXP (5-1a)
aychemical/d mg 5.11275.0
day
hr8
hr
3m 25.1
3m
component15

ENV/JM/MONO(2015)50
60
This exposure will occur over 98 days/year.
Where:
EXPinhalation = Inhalation exposure to the chemical of interest per day (mg
chemical of interest/day)
Cparticulate = Concentration of particulate dye product component in the
workers breathing zone (Default: 15 mg component/m3; based on
OSHA Total PNOR PEL (8-hr TWA*) (29 CFR 1910.1000))
RATEbreathing = Typical worker breathing rate (Default: 1.25 m3/hr (EPA, 1991))
TIMEexposure = Duration of exposure (Default: 8 hrs/day; Note: because the
default value for Cparticulate is an 8-hr TWA*, the 8 hrs/day value
must be used)
Fchem_dye = Mass fraction of the chemical of interest in the dye product (mg
chemical/mg dye product) (See Section 6.1.2)
*TWA = Time-weighted average
6.3.1.2 Dermal
chem_dye
Fntexp_incide
Nincidentcomponent/ mg 3,100 toupdermal
EXP (5-2b)
mg/day 2,3250.751incident/ component mg 3,100
This exposure will occur over 98 days per year
Where:
EXPdermal = Potential dermal exposure to the chemical of interest per day (mg
chemical/day)
Nexp_incident = Number of exposure incidents per day (Default: 1 incident/day)
(see Equation 5-2a)
Fchem_dye = Mass fraction of the chemical of interest in the dye product (mg
chemical/mg dye product) (See Section 6.1.2)
6.3.2 Exposure During Transport Container Cleaning (Exposure B)
6.3.2.1 Inhalation:
chem_dye
spresidue_dicontainer_
dueation_residye_formulF
ElocalQ (5-3)
day-site
nformulatio dye kg
nformulatio dye kg
chemical kg0.75
day-site
chemical kg 3
4
Where:
Qdye_formulation_residue = Quantity of dye formulation handled during container cleaning
(kg dye formulation/site-day)
Elocalcontainer_residue_disp = Daily release of chemical of interest from container residue (kg
chemical of interest/site-day; see Section 4.3)

ENV/JM/MONO(2015)50
61
Fchem_dye = Weight fraction of the chemical of interest in the dye formulation
(Defaults: solid: 0.75 kg chemical/kg dye formulation; liquid:
0.25 kg chemical/kg dye formulation; See Section 3.3)
152. Transfer rate of the solid dye formulation containing the chemical of interest (Qdye_formulation_day) is
less than 54 kg/site-day. EPA recommends using the EPA/OPPT Small Volume Solids Handling
Inhalation Model:
exposurechem_dyedueation_residye_formulinhalation FFQEXP (5-4b)
aychemical/d mg 0.490.11handled dye kg
exposure mg0.1610.0477
nformulatio dye kg
chemical kg0.75
day-site
nformulatio dye kg4
This exposure will occur over 98 days/year.
Where:
EXPinhalation = Inhalation exposure to the chemical of interest per day (mg
chemical of interest/day)
Qdye_formulation_residue = Daily amount of dye formulation transferred into the process (kg
dye/site-day) (See Section 3.4)
Fchem_dye = Mass fraction of the chemical of interest in the dye formulation
(kg chemical/kg dye formulation) (See Section 3.3)
Fexposure = Weight fraction of the total particulate dye product component in
the workers breathing zone (Default: 0.0477 (typical) to 0.161
(worst) mg component exposure/kg of dye handled (EPA, 1992))
6.3.2.2 Dermal:
chem_dye
Fntexp_incide
Nincidentcomponent/ mg 3,100 toupdermal
EXP (5-5b)
mg/day 325,275.01incidentcomponent/ mg ,1003
This exposure will occur over 98 days per year.
Where:
EXPdermal = Potential dermal exposure to the chemical of interest per day (mg
chemical/day)
Nexp_incident = Number of exposure incidents per day (Default: 1 incident/day)
(see Equation 5-5a)
Fchem_dye = Mass fraction of the chemical of interest in the dye product (mg
chemical/mg dye product) (See Section 6.1.2)
6.3.3 Exposure from Dye Machine Operation (Exposure C)
153. To estimate the potential worker exposure to the chemical of interest in a liquid dye product for
this activity, EPA recommends using the following equation:

ENV/JM/MONO(2015)50
62
thchem_dyebantexp_incidesurfacenliquid_skidermal FNAREAQEXP (5-6)
aychemical/d mg 7.33
dye chem/mg mg 0.045ayincident/d 12cm0701incident-2cmcomponent/ mg 0.7
This exposure will occur over 98 days per year.
Where:
EXPdermal = Potential dermal exposure to the chemical of interest per day (mg
chemical/day)
Qliquid_skin = Quantity of liquid dye product component remaining on skin
(Default: 0.7 mg component/cm2-incident (low-end) for routine or
incidental contact (EPA, 2000))
AREAsurface = Surface area of contact (Default: 1070 cm2 for 2 hands (EPA,
2013))
Nexp_incident = Number of exposure incidents per day (Default: 1 incident/day)
Fchem_dyebath = Mass fraction of the chemical of interest in the dyebath
(Default: 0.045 mg chemical/mg dye formulation; see Section 6.1.7)

ENV/JM/MONO(2015)50
63
7 DATA GAPS/UNCERTAINTIES AND FUTURE WORK
154. This ESD relies on industry data and information gathered from various sources to generate
general facility estimates, release estimates, and exposure estimates. EPA wishes to make this ESD as
detailed and up-to-date as possible, such that the risk-screening assessments reflect current industrial
practices. This ESD could be improved by collecting measured data and associated information to verify or
supersede the anecdotal data and information.
155. EPA is most interested in obtaining information about the dye products use industry that is
characterized as “typical” or “conservative” (e.g. worse case), and is applicable to an industrial use site.
While EPA welcomes site-specific information as valuable to this ESD, additional qualifiers of how
reflective it is to the industry are needed to ensure its transparency if used in the ESD. Reviewers should
also feel free to recommend additional resources that may be useful to the development of this ESD.
156. The key data gaps are summarized below. Note that the data gaps are listed in order of
importance (the first being most important):
1. No updated information was found on the annual or daily chemical dye rates. Industry contacts
have indicated that the range of use rates is very wide and it would be very difficult to choose an
average or typical use rate. An annual dye use rate for this ESD was estimated using a fabric use
rate and dye use rates for the amount of fabric from the 2004 OECD ESD on Textile Finishing
(OECD, 2004).
2. No specific information was found on the specific types of PPE used in the textiles dyeing
process. Information on the specific PPE (materials, specification) and the prevalence of their use
would further improve this ESD.
3. Industry-specific dermal monitoring data for all operations involving workers manually handling
the dye formulations products would enhance the estimates.
8 REFERENCES
IHS (2008), IHS Chemical. Chemical Economics Handbook. Dyes (520.5000). December 2014.1
1 This material includes data or information derived from IHS Products provided to the US Environmental Protection
Agency. IHS Products have been provided to the US Environmental Protection Agency for its internal use and in the
context of a license agreement. By receiving and accessing this material you agree that IHS is not liable to you or any
third party for your use of and/or reliance on the IHS data and information contained in this document, and any such
use shall be at your own risk.
ENV/JM/MONO(2015)50
64
Kirk-Othmer (2004), “Encyclopedia of Chemical Technology”, John Wiley & Sons, Inc.
http://mrw.interscience.wiley.com/emrw/9780471238966/kirk/article/dyesglov.a01/current/pdf
OECA (1997), “Sector Notebook Project, Profile of the Textile Industry” EPA/310-R-97-009
OECD (2004), “Emission Scenario Document on Textile Finishing Industry”
O’Neill et al (2004), “Colour in Textile Effluents – Sources, Measurement, Discharge Consents and
Simulation: A Review”, Journal of Chemical Technology and Biotechnology 74:1009-1018.
EPA (1990), “Textile Dye Weighing Monitoring Study (TDWMS)”, 560/5-90-009.
EPA (1991), “CEB Manual for the Preparation of Engineering Assessment”, Volume 1. Contract No. 68-
D8-0112
EPA (1992), “Memorandum: Standard Assumptions for PMN Assessments. From the Chemical
Engineering Branch (CEB) Quality Panel to CEB Staff and Management”
EPA (1994), “Generic Scenario: Fabric Finishing”. September 22, 1994.
EPA (1996), “Best Management Practices for Pollution Prevention in the Textile Industry” EPA/625/R-
96/004.
EPA (1997), “Guidance for Characterizing Assessments of Occupational Exposure and Environmental
Release”
EPA (2000), “Memorandum: Revision to Chemical Engineering Branch’s Method for Screening Level
Assessments for Dermal Exposure from Greg Macek of CEB to CEB staff and contractors” June 1,
2000.
EPA (2007), “Generic Model to Estimate Dust Releases from Transfer/Unloading Operations of Solid
Powders” July 2007.
EPA (2011), “Generic Scenarios Development Process” U.S. Environmental Protection Agency, Office of
Pollution Prevention and Toxics, Washington DC. Revised May 22, 2014.
EPA (2013), “Memorandum: Updating CEB’s Method for Screening-Level Estimates of Dermal
Exposure” September 16, 2013.
EPA (2015), PMN submission past case search (submissions 2006 through 2014). March 2015.
U.S. Census Bureau (2011), “Economic Census. Manufacturing: Industry Series: Detailed Statistics by
Industry for the United States”
http://factfinder.census.gov/faces/nav/jsf/pages/searchresults.xhtml?refresh=t

ENV/JM/MONO(2015)50
65
APPENDIX A: ESTIMATION EQUATION SUMMARY AND DEFAULT PARAMETER VALUES
A.1 Summary of Release and Exposure Estimation Equations for Textile Dyeing Sites
Table A-1 summarizes the equations introduced in Sections 3, 4, and 5 of this document. These
equations may be used in evaluating releases of and exposures to chemicals used in the textile dyeing
process. A description of each input variable and associated default is provided in Table A-2.
Table A-1. Textile Dye Release and Exposure Calculation Summary
General Facility Estimates
Daily Use Rate of Dye Formulation (Qdye_formulation_day)
dye_fabricfabricfabrication_daydye_formul F FVQ
( Eqn. 3-1)
Daily Use Rate of the Chemical of Interest (Qchem_site_day):
dyechem_dy eation_daydye_formuldaychem_site_ F F QQ (Eqn. 3-2)
Number of Sites (Nsites)
day soperating_daysite_chem_
chem_y r
sitesTIMEQ
QN
(Eqn. 3-3)
The value for Nsites, calculated using Equation 3-3, should be rounded up to the nearest integer value.
TIMEoperating_days should then be adjusted for the Nsites integer value (to avoid errors due to rounding):
daychem_site_sites
chem_yr
daysoperating_QN
QTIME
Number of Dye Formulation Containers Emptied per Facility (Ncontainer_unload_site_yr)
formcontainerchem
day soperating_daychem_site_
e_y runload_sitcontainer_RHOVF
TIMEQN
(Eqn. 3-4)
Mass Fraction of Chemical of Interest in the Dye Bath (Fchem_dyebath)
hdye_dyebatchem_dyethchem_dyeba FFF (Eqn. 3-5)

ENV/JM/MONO(2015)50
66
Table A-2. Environmental Release Calculation Summary
Source
Possi
ble
Medi
um Daily Release Rates (kg/site-day), Elocal (for Given Sources)
Transfer of
Dye
Formulatio
n (solid
powder
only)
Air
POT
W
Land
Incine
ration
oldust_contrationdust_generdaychem_site_ivedust_fugit F1FQElocal (Eqn. 4-2)
Container
Residue
POT
W
Land
Incine
ration
If Ncontainer_unload_site_yr is fewer than TIMEoperating_days:
e_dayunload_sitcontainer_residuecontainer_chem_dyenformulatiocontainer
spresidue_dicontainer_
N FFRHOV
Elocal
(Eqn. 4-
3a)
This release will occur over [Ncontainer_unload_site_yr] days/year from [Nsites] sites.
If Ncontainer_unload_site_yr is greater than TIMEoperating_days:
residuecontainer_daychem_site_spresidue_dicontainer_ FQElocal (Eqn. 4-3b)
This release will occur over [TIMEoperating_days] days/year from [Nsites] sites.
Disposal of
Spent
Dyebath
POT
W
fixationdaychem_site_athspent_dyeb F1QElocal (Eqn. 4-4)
This release will occur over [TIMEoperating_days] days/year from [Nsites] sites.
Equipment
Cleaning
POT
W cleaningequipment_daychem_site_cleaningequipment_ FQElocal (Eqn. 4-5)
This release will occur over [TIMEoperating_days] days/year from [Nsites] sites.
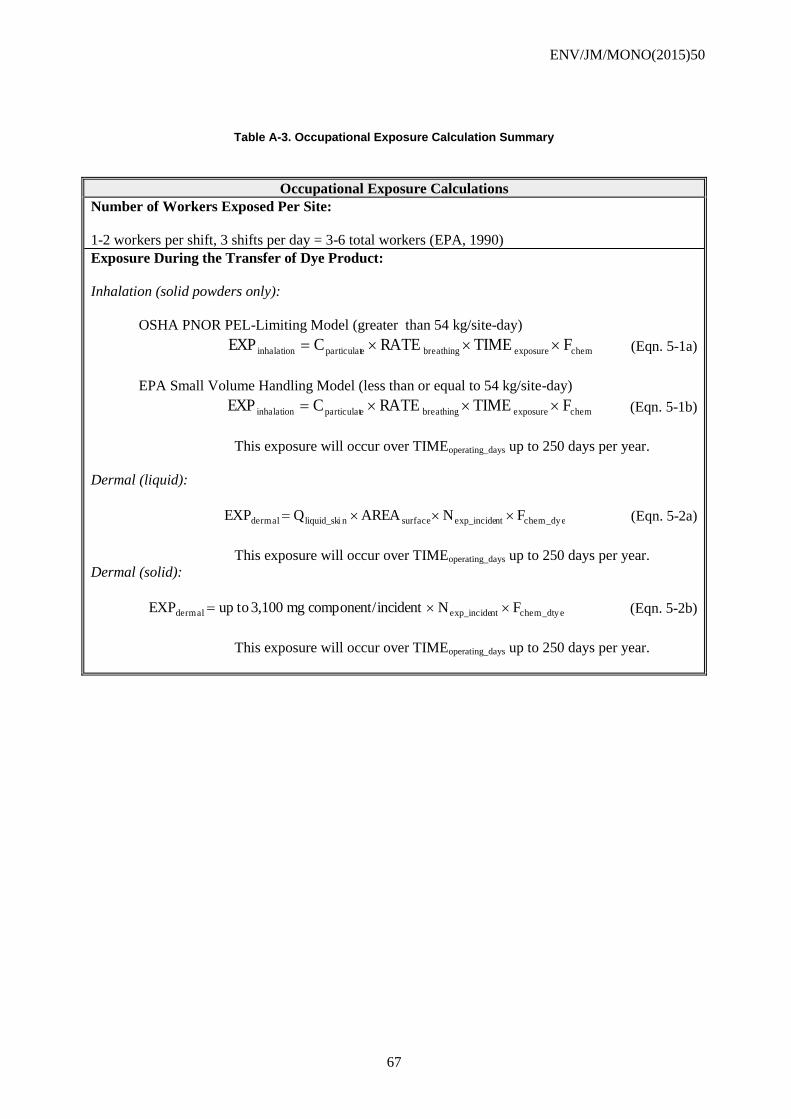
ENV/JM/MONO(2015)50
67
Table A-3. Occupational Exposure Calculation Summary
Occupational Exposure Calculations
Number of Workers Exposed Per Site:
1-2 workers per shift, 3 shifts per day = 3-6 total workers (EPA, 1990)
Exposure During the Transfer of Dye Product:
Inhalation (solid powders only):
OSHA PNOR PEL-Limiting Model (greater than 54 kg/site-day)
chemexposurebreathingeparticulatinhalation FTIMERATECEXP
(Eqn. 5-1a)
EPA Small Volume Handling Model (less than or equal to 54 kg/site-day)
chemexposurebreathingeparticulatinhalation FTIMERATECEXP
(Eqn. 5-1b)
This exposure will occur over TIMEoperating_days up to 250 days per year.
Dermal (liquid):
chem_dyentexp_incidesurfacenliquid_skidermal FNAREAQEXP (Eqn. 5-2a)
This exposure will occur over TIMEoperating_days up to 250 days per year.
Dermal (solid):
chem_dtyentexp_incidedermal FNincidentcomponent/ mg 3,100 toupEXP (Eqn. 5-2b)
This exposure will occur over TIMEoperating_days up to 250 days per year.

ENV/JM/MONO(2015)50
68
Occupational Exposure Calculations
Exposure During Container Cleaning:
Inhalation (solid powders only):
Amount of Dye Residual Handled During Container Cleaning
chem_dye
spresidue_dicontainer_
dueation_residye_formulF
ElocalQ
(Eqn.
5-3)
OSHA PNOR PEL-Limiting Model (greater than 54 kg/site-day)
chemexposurebreathingeparticulatinhalation FTIMERATECEXP
(Eqn. 5-4a)
EPA Small Volume Handling Model (less than or equal to 54 kg/site-day)
chemexposurebreathingeparticulatinhalation FTIMERATECEXP
(Eqn. 5-4b)
This exposure will occur over TIMEoperating_days up to 250 days per year.
Dermal (liquid):
chem_dyentexp_incidesurfacenliquid_skidermal FNAREAQEXP (Eqn. 5-5a)
This exposure will occur over TIMEoperating_days up to 250 days per year.
Dermal (solid):
chem_dtyentexp_incidedermal FNincidentcomponent/ mg 3,100 toupEXP (Eqn. 5-5b)
This exposure will occur over TIMEoperating_days up to 250 days per year.
Exposures During Machine Operation:
Dermal:
thchem_dyebantexp_incidesurfacenliquid_skidermal FNAREAQEXP (Eqn. 5-6)
This exposure will occur over TIMEoperating_days up to 250 days per year.

ENV/JM/MONO(2015)50
69
Table A-4. Parameter Declaration and Documentation Summary
Variable Variable Description Default Value Data Source
AREAsurface Surface area of contact (cm2) 1070 (2 hands) EPA, 2013
Cparticulate Concentration of particulate dye product
component in the workers
breathing zone (mg
component/m3)
15 Appendix B
Elocalcontainer_residue_disp Daily release of chemical from container
residue (kg chemical/site-day) Calculated Section 4.3
Elocaldust_generation Daily release of dust from
transfers/unloading (kg/site-day) Calculated Section 4.2
Elocalequipment_cleaning Daily release of chemical of interest from
equipment cleaning (kg chemical/site-
day)
Calculated Section 4.5
Elocalprocess_disp Daily release of the chemical to the
environment, after control technology (kg
chemical/site-day)
Calculated Section 4.4
Elocalspent_dyebath Daily release of chemical of interest from
disposal of spent dyebath (kg
chemical/site-day)
Calculated Section 4.4
EXPinhalation Inhalation exposure to the chemical of
interest per day (mg chemical of
interest/day)
Calculated Section 5.3
EXPdermal Potential dermal exposure to the
chemical of interest per day (mg
chemical/day)
Calculated Section 5.3 & 5.4
Fchem_dye
Mass fraction of the chemical of interest
in the dye formulation (kg chemical/kg
dye formulation).
solid: 0.75;
liquid 0.25 ETAD, 2011
Fchem_dyebath Mass fraction of the chemical of interest
in the dyebath (kg chemical/kg dyebath) Calculated Section 3.8
Fcontainer_residue Fraction of dye component remaining in
the container as residue 0.03 EPA 2002
Fdust_generation Fraction of chemical lost during
transfers/unloading of solid powders 0.005 EPA, 2007
Fdye_dyebath Mass fraction of the dye formulation in
the dyebath (default: 0.06 kg dye
formulation/kg dyebath)
0.06 ETAD, 2011

ENV/JM/MONO(2015)50
70
Variable Variable Description Default Value Data Source
Fequipment_cleaning Fraction of dye chemical released as
residual in process equipment 0.01 EPA, 1992
Fexposure Weight fraction of the total particulate
dye product component in the workers
breathing zone.
0.0477
(typical)
0.161 (worst
case)
EPA, 1992
Ffixation
Fraction of dye product affixed on to
textile during dyeing process substrate
(Default: see)
See Table 1-2
OECA, 1997
OECD, 2004
Jasper, 2011
Ncontainer_unload_site_yr Number of transport containers unloaded
at each site per year (containers/site-yr) Calculated Section 3.7
Nexp_incident Number of exposure incidents per day
(incident/day) 1 EPA, 2000
Nsites
Number of facilities using the chemical
of interest in textile dyeing processes
(sites).
Calculated Section 3.6
Qchem_site_day Daily use rate for the chemical of interest
at each facility (kg of chemical/site-day). Calculated Section 3.5
Qchem_yr Annual production volume of the
chemical of interest for this use (kg
chemical/yr)
Chemical
Specific Manufacturer
Qdye_formulation_day
Daily use rate for the dye formulation at
each facility (kg of dye formulation/site-
day).
Calculated Section 3.4
Qdye_formulation_residue
Quantity of dye formulation handled
during container cleaning (kg of dye
formulation/site-day).
Calculated Section 5.4
Qliquid_skin Quantity of liquid dye product
component remaining on skin (mg/cm2-
incident)
0.7 (low end)
2.1 (high end) EPA, 2000
RATEbreathing Typical worker breathing rate (m3/hr) 1.25 EPA, 1991
RHOform Density of the dye formulation (kg/L) 1 EPA assumption
TIMEexposure Duration of exposure (hr/day) 8 Appendix B
TIMEoperating_days
Annual number of days the formulation
product is applied at each facility
(days/yr).
Calculated Section 3.2
Vcontainer Volume of transport container
(L/container) 132.5 Jasper, 2011

ENV/JM/MONO(2015)50
71
APPENDIX B BACKGROUND INFORMATION AND EQUATIONS/DEFAULTS FOR THE
STANDARD EPA ENVIRONMENTAL RELEASE AND WORKER EXPOSURE MODELS
B.1 Introduction
This appendix provides background information and a discussion of the equations, variables, and
default assumptions for each of the standard release and exposure models used by EPA in estimating
environmental releases and worker exposures. The models described in this appendix are organized into
the following five sections:
Section B.2: Container Residue Release Models (non-air);
Section B.3: Process Equipment Residue Release Models (non-air);
Section B.4: Dust Emissions from Transferring Solids Model;
Section B.5: Chemical Particle Inhalation Exposure Models; and
Section B.6: Dermal Exposure Models.
Please refer to the guidance provided in the ESD for estimating environmental releases and worker
exposures using these standard models, as it may suggest the use of certain overriding default assumptions
to be used in place of those described for each model within this appendix.
This appendix includes a list of the key reference documents that provide the background and
rationale for each of the models discussed. These references may be viewed in their entirety through the
ChemSTEER Help System, except for the EPA/OPPT Dust Emissions from Solid Transfers Model. To
download and install the latest version of the ChemSTEER software and Help System, please visit the
following EPA web site:
http://www.epa.gov/opptintr/exposure/docs/chemsteer.htm
B.2 Container Residue Release Models (non-air)
B.2.1 Model Description and Rationale:
EPA has developed a series of standard models for estimating the quantity of residual chemical
remaining in emptied shipping containers that is released to non-air media (e.g., water, incineration, or
landfill) when the container is either rinsed or disposed. All of the residue models assume a certain portion
or fraction of the chemical remains in the emptied container to be later rinsed or discarded with the empty
container.
The default parameters of model are defined based upon the particular size/type of container (e.g.,
small containers, drums, or large bulk), as well as the physical form of the chemical residue (e.g., liquid or
solid). These defaults are based upon data collected during a 1988 EPA-sponsored study of residuals in
containers from which materials have been poured or pumped.

ENV/JM/MONO(2015)50
72
Model Equation:
All of the models discussed in this section utilize the following common equation for calculating the
amount of chemical residue:
container_daily_totalresidue_containerdisp_residue_container QFElocal [B-1]
Where:
Elocalcontainer_residue_disp = Daily release of the chemical residue to water, incineration, or
landfill from the cleaning or disposal of empty shipping
containers (kg/site-day)
Fcontainer_residue = Fraction of the amount of the total chemical in the shipping
container remaining in the emptied container (dimensionless; see
Table B-1 for appropriate EPA default values)
Qtotal_daily_container = Total (daily) quantity of the chemical contained in the shipping
containers prior to emptying (kg of chemical/site-day; see Table
B-2 for appropriate EPA default values)
Each model, however, utilizes unique default values within that equation based upon the relative size
of the container and the physical form of the chemical residue. These default values are summarized in
Table B-1 and Table B-2. The following models are the standard EPA models for estimating container
residues:
EPA/OPPT Small Container Residual Model;
EPA/OPPT Drum Residual Model;
EPA/OPPT Bulk Transport Residual Model; and
EPA/OPPT Solid Residuals in Transport Containers Model.
The default frequency with which the container residues are released (TIMEdays_container_residue, days/site-
year) must be appropriately “paired” with the total daily quantity of chemical contained in the containers
(Qtotal_daily_container) used in calculating the daily release. Thus, Table B-2 also contains the appropriate EPA
default values for TIMEdays_container_residue.
References:
EPA (1992) “Memorandum: Standard Assumptions for PMN Assessments. From the CEB Quality Panel
to CEB Staff and Management”, October 1992.
EPA (1988), “Releases During Cleaning of Equipment”, July 1988.
Table B-1. Standard EPA Default Values for Use in the Container Residual Release Models
Chemical
Form
Container
Type
Vcont_empty
(gallons) Model Title
Liquid Bottle 1
Range: <5
EPA/OPPT Small Container Residual Model Central Tendency: 0.003
Small
Container
5
Range: 5 to <20

ENV/JM/MONO(2015)50
73
Drum 55
Range: 20 to <100
EPA/OPPT Drum Residual Model Central Tendency: 0.025
Central Tendency: 0.003
Tote 550
Range: 100 to <1,000
EPA/OPPT Bulk Transport Residual Model
Tank Truck 5,000
Range: 1,000 to
<10,000
Rail Car 20,000
Range: 10,000 and up
Solid Any Any EPA/OPPT Solid Residuals in Transport Containers
Model a - These defaults are based on the 1988 EPA study investigating container residue and summarized in the 1992 internal EPA memorandum (see References in this section for the citations of these sources).
b - The 1992 EPA memorandum reference document contains the previous default of 0.04 for the high-end loss fraction (Fcontainer_residue) for the Drum Residual Model; however, this value was superseded by an internal policy decision in 2002. Per 40 CFR 261.7(b)(1) of the Resource Conservation and Recovery Act (RCRA), “a container or an inner liner removed from a container that has held any hazardous wastes, except waste that is a compressed gas or that is identified as an acute hazardous waste…is empty if…(ii) no more than 2.5 centimeters (1 inch) remain on the bottom of the container or liner or (iii)(A) no more than 3 percent by weight of the total capacity of the container remains in the container or inner liner if the container is equal to or less than 110 gallons in size…”. The 3 percent high-end default is consistent with the range of experimental results documented in the 1988 EPA study (see References in this section for a citation of this study).

ENV/JM/MONO(2015)50
74
Table B-2. Standard EPA Methodology for Calculating Default Qtotal_daily_container and TIMEdays_container_residue
Values for Use in the Container Residual Models
Number of
Containers
Emptied per Day
Qtotal_daily_container
(kg/site-day)
TIMEdays_container_residue
(days/year)
1 or more (Mass quantity of chemical in each
container (kg/container)) × (Number
of containers emptied per day)
Total number of operating days for
the facility/operation
Less than 1 Mass quantity of chemical in each
container (kg/container)
Total number of containers emptied
per site-year
B.3 Process Equipment Residue Release Models (non-air)
B.3.1 Model Description and Rationale
EPA has developed two standard models for estimating the quantity of residual chemical remaining in
emptied process equipment that is released to non-air media (e.g., water, incineration, or landfill) when the
equipment is periodically cleaned and rinsed. The residue models assume a certain portion or fraction of
the chemical remains in the emptied vessels, transfer lines, and/or other equipment and is later rinsed from
the equipment during cleaning operations and discharged with the waste cleaning materials to an
environmental medium.
The default parameters of the model are defined based upon whether the residues are being cleaned
from a single vessel or from multiple pieces of equipment. These defaults are based upon data collected
during an EPA-sponsored study of residuals in process equipment from which materials have pumped or
gravity-drained.
B.3.2 Model Equation
The models discussed in this section utilize the following common equation for calculating the
amount of chemical residue:
capacity_chem_totalresidue_equipcleaning_equip QFElocal [B-2]
Where:
Elocalequip_cleaning = Daily release of the chemical residue to water, incineration, or
landfill from cleaning of empty process equipment (kg/site-day)
Fequip_residue = Fraction of the amount of the total chemical in the process
equipment remaining in the emptied vessels, transfer lines, and/or
other pieces (dimensionless; see Table B-3 for appropriate EPA
default values)
Qequip_chem_capacity = Total capacity of the process equipment to contain the chemical in
question, prior to emptying (kg of chemical/site-day; see Table B-
4 for appropriate EPA default values)
Each model, however, utilizes unique default values within that equation based upon whether the
residues are cleaned from a single vessel or from multiple equipment pieces. These default values are
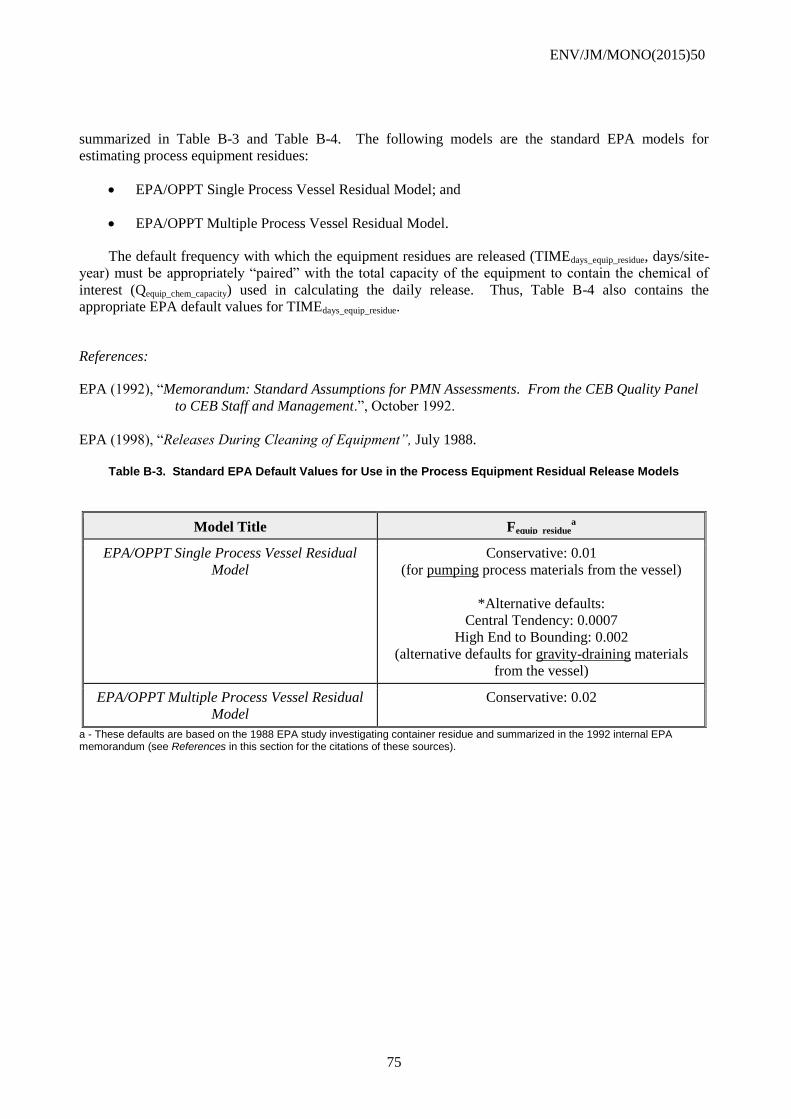
ENV/JM/MONO(2015)50
75
summarized in Table B-3 and Table B-4. The following models are the standard EPA models for
estimating process equipment residues:
EPA/OPPT Single Process Vessel Residual Model; and
EPA/OPPT Multiple Process Vessel Residual Model.
The default frequency with which the equipment residues are released (TIMEdays_equip_residue, days/site-
year) must be appropriately “paired” with the total capacity of the equipment to contain the chemical of
interest (Qequip_chem_capacity) used in calculating the daily release. Thus, Table B-4 also contains the
appropriate EPA default values for TIMEdays_equip_residue.
References:
EPA (1992), “Memorandum: Standard Assumptions for PMN Assessments. From the CEB Quality Panel
to CEB Staff and Management.”, October 1992.
EPA (1998), “Releases During Cleaning of Equipment”, July 1988.
Table B-3. Standard EPA Default Values for Use in the Process Equipment Residual Release Models
Model Title Fequip_residuea
EPA/OPPT Single Process Vessel Residual
Model
Conservative: 0.01
(for pumping process materials from the vessel)
*Alternative defaults:
Central Tendency: 0.0007
High End to Bounding: 0.002
(alternative defaults for gravity-draining materials
from the vessel)
EPA/OPPT Multiple Process Vessel Residual
Model
Conservative: 0.02
a - These defaults are based on the 1988 EPA study investigating container residue and summarized in the 1992 internal EPA memorandum (see References in this section for the citations of these sources).

ENV/JM/MONO(2015)50
76
Table B-4. Standard EPA Methodology for Calculating Default Qequip_chem_capacity and TIMEdays_equip_residue Values for Use in the Process Equipment Residual Models
Process
Type
Number of
Batches per Day
Qequip_chem._capacity
(kg/site-day)
TIMEdays_equip_residue
(days/year)
Batch 1 or more (Mass quantity of chemical in
each batch (kg/batch)) ×
(Number of batches run per
day)
Total number of operating days
for the facility/operation
Less than 1 Mass quantity of chemical in
each batch (kg/batch)
Total number of batches run per
site-year
Continuous Not applicable Daily quantity of the chemical
processed in the equipment
(kg/site-day)
Total number of operating days
for the facility/operation
Note: Please refer to the ESD for any overriding default assumptions to those summarized above. Equipment cleaning may be performed periodically throughout the year, as opposed to the default daily or batch-wise cleaning frequencies shown above. For example, facilities may run dedicated equipment for several weeks, months, etc., within a single campaign before performing equipment-cleaning activities, such that residuals remaining in the emptied are released less frequently than the standard default TIMEdays_equip_residue summarized above in Table B-4. Care should be given in defining the appropriate Qtotal_daily_container and TIMEdays_container_residue to be used in either of the standard EPA process equipment residue models.
B.4 Dust Emissions from Transferring Solids Model
EPA has developed the EPA/OPPT Dust Emissions from Transferring Solids Model to estimate the
releases from dust generation during the unloading/transferring of solid powders. While there are multiple
potential industrial sources of dust (e.g., grinding, crushing), the scope of this model is limited to
transferring/unloading of solids. Specifically, this can be defined as activities where packaging/transport
materials are opened and contents are emptied either into a feed system and conveyed or directly added
into a process tank (e.g., reactor, mixing tank).
B.4.1 Model Description and Rationale:
The EPA/OPPT Dust Emissions from Transferring Solids Model estimates that 0.5% of the solid
powder transferred may be released from dust generation. This model is based on 13 sources, including
site visit reports, Organisation for Economic Co-operation and Development (OECD) Emission Scenario
Documents (ESD), EPA’s AP-42 Emission Factors, and Premanufacture Notice (PMN) submissions
(EPA’s new chemicals review program). Each source contained estimates of the quantity of solid powder
that may be lost during transfers for a specific industry. The different sources contained dust loss data or
loss fraction estimates from a variety of industries including paint and varnish formulation, plastic
manufacturing, printing ink formulation, rubber manufacturing, and chemical manufacturing. These
estimates ranged from negligible to 3% of the transferred volume. The mean of the upper bound from each
data set was 0.5%.
Additionally, dust generation test data were reviewed. A study by Plinke, et al. investigated key
parameters for developing a theoretical approach for estimating dust losses based on moisture content,
particle size, drop height, and material flow (Plinke, 1995). Dust generation rates during unloading and

ENV/JM/MONO(2015)50
77
transfers were measured for four materials. The highest measured dust generation rate was 0.5%. These
data further justified the adoption of a 0.5% loss fraction as a conservative estimate.
For the media of release of the dust generated, most facilities utilize some type of control device(s) to
collect fugitive emissions. Many facilities collect fugitive dust emissions from these operations in filters
and dispose of the filters in landfills or by incineration. Wet scrubbers may also be utilized by industry.
However, in some cases, uncontrolled/uncollected particulates may be small enough to travel several miles
from the facility, resulting in environmental and human exposures to the chemical of interest beyond the
boundaries of the site. Fugitive dust emissions may also settle to facility floors and are disposed of when
floors are cleaned (water if the floors are rinsed or land or incineration if the floors are swept). Therefore,
as a conservative assumption the model assumes an uncontrolled release to air, water, incineration, or
landfill.
If facility-specific information states a control technology is employed, the release may be partitioned
to the appropriate media. If the control technology efficiency information is not available, the CEB
Engineering Manual may be utilized for control technology efficiencies. Table B-5 provides estimated
efficiencies for common control technologies.

ENV/JM/MONO(2015)50
78
Table B-5. Default Control Technology Efficiencies
Control Technology
Default Control
Technology Capture
Efficiency (%) Notes/Source
Default Media of
Release for Controlled
Release
None (default) 0 No control technology
should be assumed as
conservative.
N/A
Filter (such as a
baghouse)
99 For particles > 1 um.
CEB Engineering
Manual.
Incineration or Land
Cyclone/Mechanical
Collectors
80 For particles > 15 um
CEB Engineering
Manual.
Incineration or Land
Scrubber Varies
95 may be assumed
Consult Table 7-1 of the
CEB Engineering
Manual.
Water
B.4.2 Model Equation:
Based on these data, the model estimates the portion of the release that is not captured or the
uncontrolled release using the following equation. As a default this material is assumed released to air,
water, incineration, or land.
)F1(FQElocal oldust_contrationdust_generdtransferreivedust_fugit [B-3]
Where:
Elocaldust_fugitive = Daily amount not captured by control technology from transfers
or unloading (kg/site-day)
Qtransferred = Quantity of chemical transferred per day (kg chemical/site-day)
Fdust_generation = Loss fraction of chemical during transfer/unloading of solid
powders (Default: 0.005 kg released/kg handled)
Fdust_control = Control technology capture efficiency (kg captured/kg processed)
(Default: If the control technology is unknown, assume capture
efficiency = 0 kg captured/kg processed, see Table B-5).
The following equation estimates the portion of dust release captured by the control technology. The
default media of release for this material should be selected based on the information presented in Table B-
5.
oldust_contrationdust_generdtransferrereddust_captu FFQElocal [B-4]
Where:
Elocaldust_captured = Daily amount captured by control technology from transfers or
unloading (kg/site-day)
Qtransferred = Quantity of chemical transferred per day (kg chemical/site-day)

ENV/JM/MONO(2015)50
79
Fdust_generation = Loss fraction of chemical during transfer/unloading of solid
powders (Default: 0.005 kg released/kg handled)
Fdust_control = Control technology capture efficiency (kg captured/kg processed)
(Default: If the control technology is unknown, assume capture
efficiency = 0 kg captured/kg processed, see Table B-5).
References:
EPA (2007), “Generic Model to Estimate Dust Releases from Transfer/Unloading Operations of Solid
Powders”. July 2007.
EPA (1991), “CEB Manual for the Preparation of Engineering Assessment”, Volume 1 (page 4-11).
Contract No. 68-D8-0112. February 1991.
Plinke, Marc A.E., et al. (1995), “Dust Generation from Handling Powders in Industry”, American
Industrial Hygiene Association Journal. Vol. 56: 251-257, March 1995.
B.5 Chemical Particle Inhalation Exposure Models
The following EPA standard models may be used to estimate worker inhalation exposures to particles
containing the chemical of interest:
EPA/OPPT Small Volume Solids Handling Inhalation Model; and
OSHA Total Particulates Not Otherwise Regulated (PNOR) Permissible Exposure Limit (PEL)-
Limiting Model.
Each of these models is an alternative default for calculating worker inhalation exposures during the
following particulate-handling activities, based upon the relative daily amount of particulate material being
handled:
Unloading and cleaning solid residuals from transport containers/vessels;
Loading solids into transport containers/vessels; and
Cleaning solid residuals from process equipment.
For amounts up to (and including) 54 kg/worker-shift, the EPA/OPPT Small Volume Solids Handling
Inhalation Model is used, as it more accurately predicts worker exposures to particulates within this range
than the OSHA Total PNOR PEL-Limiting Model. The Small Volume Solids Handing Inhalation Model is
based on exposure monitoring data obtained for workers handling up to 54 kg of powdered material.
Beyond this data-supported limit, EPA assumes that exposures within occupational work areas are
maintained below the regulation-based exposure limit for “particulates, not otherwise regulated”.
The EPA/OPPT Small Volume Solids Handling Model is also the exclusive model used for any solids
sampling activity. Each of these models is described in detail in the following sections.

ENV/JM/MONO(2015)50
80
B.5.1 EPA/OPPT Small Volume Solids Handling Inhalation Model
B.5.1.1 Model Description and Rationale:
The EPA/OPPT Small Volume Solids Handling Inhalation Model utilizes worst case and typical
exposure factors to estimate the amount of chemical inhaled by a worker during handling of small volumes1
(e.g., <54 kg/worker-shift) of solid/powdered materials containing the chemical of interest. The handling
of these small volumes is presumed to include scooping, weighing, and pouring of the solid materials.
The worst case and typical exposure factor data were derived from a study of dye weighing and
adapted for use in situations where workers are presumed to handle small volumes of solids in a manner
similar to the handling in the study. The maximum amount of dye handled in the study was 54 kg/worker-
shift, so the Small Volume Solids Handling Inhalation Model is presumed to be valid for quantities up to
and including this amount. In the absence of more specific exposure data for the particular activity, EPA
uses these data to estimate inhalation exposures to solids transferred at a rate up to and including 54
kg/worker-shift. This model assumes that the exposure concentration is the same as the concentration of
the chemical of interest in the airborne particulate mixture.
Note that the amount handled per worker per shift is typically unknown, because while the throughput
may be known, the number of workers and the breakdown of their activities are typically unknown. For
example, while two workers may together handle 100 kg of material/day, one worker may handle 90 kg of
material/day and the other may only handle 10 kg of material/day. Therefore, as a conservative estimate
EPA assumes that the total throughput (Qfacility_day; kg/site-day) is equal to the amount handled per worker
(Qshift_handled; kg/worker-shift), if site-specific information is not available.
B.5.1.2 Model Equation:
The model calculates the inhalation exposure to the airborne particulate chemical using the following
equation:
exposurechemshiftshandled_shiftinhalation FF)NQ(EXP [B-5]
Where:
EXPinhalation = Inhalation exposure to the particulate chemical per day (mg
chemical/worker-day)
Qshift_handled = Quantity of the solid/particulate material containing the chemical
of interest that is handled by workers each shift (kg/worker-shift;
see Table B-6 for appropriate EPA default values; must be ≤ 54
kg/worker-shift for this model to be valid)
Nshifts2 = Number of shifts worked by each worker per day (EPA default =
1 shift/day)
Fchem = Weight fraction of the chemical of interest in the particulate
material being handled in the activity (dimensionless; refer to the
ESD discussion for guidance on appropriate default value)
1Worker inhalation exposures to particulates handled in amounts greater than 54 kg/worker-shift are calculated using
the OSHA Total PNOR PEL-Limiting Model (see the description provided in this section of Appendix B).
2Note that this value is the number of shifts worked by each worker per day. This value would only be greater than
one if a worker worked for over eight hours in a given day.

ENV/JM/MONO(2015)50
81
Fexposure = Exposure factor; amount of total particulate handled that is
expected to be inhaled (EPA defaults: 0.0477 mg/kg (typical) and
0.161 mg/kg (worst case))
Table B-6. Standard EPA Default Values for Qdaily_handled in the EPA/OPPT Small Volume Solids Handling
Inhalation Model
Activity Type
Default Qshift_handled 1
(kg/worker-day)
Loading and Unloading Containers Quantity of material in each container (kg/container)
× Number of containers/worker-shift
Container Cleaning Quantity of residue in each container (kg/container) ×
Number of container/worker-shift
Process-Related Activity
(equipment cleaning, sampling):
Continuous process:
Batch process (<1 batch per day):
Batch process (>1 batch per day):
Daily throughput of material / Number of shifts per day
Quantity of material per batch
Quantity of material per batch × Number of batches per
shift
References:
EPA (1992), “Generic Scenario: Textile Dyeing”, October 15, 1992.
EPA (1991) “CEB Manual for the Preparation of Engineering Assessment”, Volume 1 (page 4-11).
Contract No. 68-D8-0112. February 1991.
EPA (1990) “Textile Dye Weighing Monitoring Study”, EPA 560/5-90-009. April 1990.
B.5.2 OSHA Total PNOR PEL-Limiting Model
B.5.2.1 Model Description and Rationale:
The OSHA Total Particulates Not Otherwise Regulated (PNOR) Permissible Exposure Limit (PEL)-
Limiting Model estimates the amount of chemical inhaled by a worker during handling of solid/powdered
materials containing the chemical of interest. The estimate assumes that the worker is exposed at a level
no greater than the OSHA PEL for Particulate, Not Otherwise Regulated, total particulate. Operations are
generally expected to comply with OSHA’s federal regulation regarding total particulate exposures. This
model assumes that the exposure concentration is the same as the concentration of the chemical of interest
in the airborne particulate mixture.
The OSHA Total PNOR PEL-Limiting Model is used in cases where workers are handling quantities
of solid/powdered materials in excess of 54 kg/worker-shift1. As stated in Section B.5.1, the Small Volume
1The appropriate quantity of material handled by each worker on each day may vary from these standard CEB
defaults, per the particular scenario. Be sure to consult the discussion presented in the ESD activity
description in determining the most appropriate default value for Qdaily_handled.

ENV/JM/MONO(2015)50
82
Solids Handling Model, based on monitoring data, provides a more realistic estimate of worker inhalation
exposures to smaller quantities particulate material. The data used by the Small Volume Solids Handling
Model are supported up to and including 54 kg solid material handled per worker-shift. Beyond this
amount, EPA assumes the occupational exposures are maintained below the regulatory exposure limit
contained in the OSHA Total PNOR PEL-Limiting Model, although the exposures provided by this model
are considered to be worst-case, upper-bounding estimates.
Refer to Table B-6 for the standard EPA assumptions used in determining the appropriate quantity of
particulate material handled to determine the applicability of this model to a given activity.
NOTE: The OSHA Total PNOR PEL (used as the basis for the model calculations) is an 8-hour time-
weighted average (TWA); therefore, worker exposures must be assumed to occur over an 8-hour period
for the OSHA Total PNOR PEL-Limiting Model estimate to be valid basis for the calculated inhalation
exposure estimate.
B.5.2.2 Model Equations:
The model first calculates the mass concentration of the airborne particulate chemical using the
following equation:
chemtotal_masschem_mass FCC [B-6]
Where:
Cchem_mass = Mass concentration of the chemical in air (mg/m3)
Ctotal_mass = Mass concentration of total particulate (containing the chemical)
in air (EPA default = 15 mg/m3, based on the OSHA Total PNOR
PEL, 8-hr TWA)
Fchem = Weight fraction of the chemical of interest in the particulate
material being handled in the activity (dimensionless; refer to the
ESD discussion for guidance on appropriate default value)
The OSHA Total PNOR PEL-Limiting Model then uses the mass airborne concentration of the
chemical (Cmass_chem) in Equation B-6, to calculate the inhalation exposure to the particulate chemical using
the following equation:
exposurebreathingchem_massinhalation TIMERATECEXP [B-7]
Where:
EXPinhalation = Inhalation exposure to the airborne particulate chemical per day
(mg chemical/worker-day)
Cchem_mass = Mass concentration of the particulate chemical in air (mg/m3; see
Equation B-17)
RATEbreathing = Typical worker breathing rate (EPA default = 1.25 m3/hr)
1Worker inhalation exposures to particulates handled in amounts up to and including 54 kg/worker-shift are calculated
using the EPA/OPPT Small Volume Handling Inhalation Model (see the description provided in this
section of Appendix B).

ENV/JM/MONO(2015)50
83
TIMEexposure = Duration of exposure for the activity (EPA default = 8
hours/worker-day1)
References:
EPA (1991), “CEB Manual for the Preparation of Engineering Assessment”, Volume 1 (Equations 4-1 and
4-11). Contract No. 68-D8-0112. February 1991.
B.6 Dermal Exposure Models
B.6.1 Model Description and Rationale:
EPA has developed a series of standard models for estimating worker dermal exposures to liquid and
solid chemicals during various types of activities. All of these dermal exposure models assume a specific
surface area of the skin that is contacted by a material containing the chemical of interest, as well as a
specific surface density of that material in estimating the dermal exposure. The models also assume no use
of controls or gloves to reduce the exposure. These assumptions and default parameters are defined based
on the nature of the exposure (e.g., one hand or two hand, immersion in material, contact with surfaces)
and are documented in the references listed in this section.
In the absence of data, the EPA/OPPT standard models for estimating dermal exposures from
industrial activities described in this section can be used. The models for exposures to liquid materials are
based on experimental data with liquids of varying viscosity and the amount of exposure to hands was
measured for various types of contact. Similar assessments were made based on experimental data from
exposure to solids.
B.6.2 Model Equation:
All of the standard EPA models utilize the following common equation for calculating worker dermal
exposures:
eventchemnremain_skisurfacedermal NFQAREAEXP [B-8]
Where:
EXPdermal = Dermal exposure to the liquid or solid chemical per day (mg
chemical/worker-day)
AREAsurface = Surface area of the skin that is in contact with liquid or solid
material containing the chemical (cm2; see Table B-7 for
appropriate EPA default values)
Qremain_skin = Quantity of the liquid or solid material containing the chemical
that remains on the skin after contact (mg/cm2-event; see Table B-
7 for appropriate EPA default values)
Fchem = Weight fraction of the chemical of interest in the material being
handled in the activity (dimensionless; refer to the ESD discussion
for guidance on appropriate default value)
Nevent2 = Frequency of events for the activity (EPA default = 1
event/worker-day)
1Since the OSHA Total PNOR PEL is an 8-hr TWA, the exposure duration must be assumed as 8 hours/worker-day
for the model defaults to apply.
2Only one contact per day (Nevent = 1 event/worker-day) is assumed because Qremain_skin, with few exceptions, is not
expected to be significantly affected either by wiping excess chemical material from skin or by repeated

ENV/JM/MONO(2015)50
84
Each model, however, utilizes unique default values within that equation based upon the nature of the
contact and the physical form of the chemical material. These default values are summarized in Table B-9.
The following models are the standard EPA models for estimating worker dermal exposures:
EPA/OPPT 1-Hand Dermal Contact with Liquid Model;
EPA/OPPT 2-Hand Dermal Contact with Liquid Model;
EPA/OPPT 2-Hand Dermal Immersion in Liquid Model;
EPA/OPPT 2-Hand Dermal Contact with Container Surfaces Model; and
EPA/OPPT 2-Hand Dermal Contact with Solids Model.
For several categories of exposure, EPA uses qualitative assessments to estimate dermal exposure.
Table B-8 summarizes these categories and the resulting qualitative dermal exposure assessments.
References:
EPA (2000), “Options for Revising CEB’s Method for Screening-Level Estimates of Dermal Exposure –
Final Report”. June 2000.
EPA (1991), “CEB Manual for the Preparation of Engineering Assessment, Volume 1”, Contract No. 68-
D8-0112. February 1991.
contacts with additional chemical material (e.g., wiping excess from the skin does not remove a significant
fraction of the small layer of chemical material adhering to the skin and additional contacts with the
chemical material do not add a significant fraction to the layer). Exceptions to this assumption may be
considered for chemicals with high volatility and/or with very high rates of absorption into the skin.

ENV/JM/MONO(2015)50
85
Table B-7. Standard EPA Default Values for Use in the Worker Dermal Exposure Models
Default Model Example Activities
AREAsurfacea
(cm2)
Qremain_skinb
(mg/cm2-
event)
Resulting Contact
AREAsurface × Qremain_skin
(mg/event)
Physical Form: Liquids
EPA/OPPT 1-Hand Dermal Contact
with Liquid Model
Liquid sampling activities
Ladling liquid/bench-scale liquid transfer
420
(1 hand mean)
Low: 0.7
High: 2.1
Low: 290
High: 880
EPA/OPPT 2-Hand Dermal Contact
with Liquid Model
Maintenance
Manual cleaning of equipment and
containers
Filling drum with liquid
Connecting transfer line
1070
(2 hand mean)
Low: 0.7
High: 2.1
Low: 590
High: 1,800
EPA/OPPT 2-Hand Dermal
Immersion in Liquid Model
Handling wet surfaces
Spray painting
1070
(2 hand mean)
Low: 1.3
High: 10.3
Low: 1,100
High: 8,650
Physical Form: Solids
EPA/OPPT 2-Hand Dermal Contact
with Container Surfaces Model
Handling bags of solid materials (closed or
empty)
No defaults No defaults < 1,100c
EPA/OPPT 2-Hand Dermal Contact
with Solids Model
Solid sampling activities
Filling/dumping containers of powders,
flakes, granules
Weighing powder/scooping/mixing (e.g.,
dye weighing)
Cleaning solid residues from process
equipment
Handling wet or dried material in a
filtration and drying process
No defaults No defaults < 3,10023
a - These default values were adopted in the 2000 EPA report on screening-level dermal exposure estimates (see References in this section for the citations of this sources) and are the mean values for men taken from the EPA Exposure Factors Handbook, 1997.
b - These default values were adopted in the 2000 EPA report on screening-level dermal exposure estimates (see References in this section for the citation of this source). The report derived the selected ranges of values for liquid handling activities from: EPA. A Laboratory Method to Determine the Retention of Liquids on the Surface of Hands. U.S. Environmental Protection Agency, Office of Pollution Prevention and Toxics, Exposure Evaluation Division. EPA 747-R-92-003. September 1992.
c - These default values were adopted in the 2000 EPA report on screening-level dermal exposure estimates (see References in this section for the citation of this source). The report derived values for dermal contact for solids handling activities from: Lansink, C.J.M., M.S.C. Breelen, J. Marquart, and J.J. van Hemmen: Skin Exposure to Calcium Carbonate in the Paint Industry. Preliminary Modeling of Skin Exposure Levels to Powders Based on Field Data (TNO Report V 96.064). Rijswijk, The Netherlands: TNO Nutrition and Food Research Institute, 1996.

ENV/JM/MONO(2015)50
86
Table B-8. EPA Default Qualitative Assessments for Screening-Level Estimates of Dermal Exposure
Category Dermal Assessment
Corrosive substances (pH>12, pH<2) Negligible
Materials at temperatures >140F (60C) Negligible
Cast Solids (e.g., molded plastic parts,
extruded pellets
Non-Quantifiable (Some surface contact may occur if
manually transferred)
“Dry” surface coatings (e.g., fiber spin
finishes, dried paint)
Non-Quantifiable (If manual handling is necessary and
there is an indication that the material may abrade
from the surface, quantify contact with fingers/palms
as appropriate)
Gases/Vapors Non-Quantifiable (Some contact may occur in the
absence of protective clothing)
Source: EPA Chemical Engineering Branch. CEB Manual for the Preparation of Engineering Assessment, Volume 1. U.S. Environmental Protection Agency, Office of Pollution Prevention and Toxics, Washington DC. Contract No. 68-D8-0112. February 1991.