Asphaltenes and Waxes Do Not Interact Synergistically and Coprecipitate in Solid Organic Deposits
16
Asphaltenes and Waxes Do Not Interact Synergistically and Coprecipitate in Solid Organic Deposits Xiaoli Yang ‡ and Peter Kilpatrick* Department of Chemical Engineering, North Carolina State University, Raleigh, North Carolina 27695-7905 Received January 20, 2005. Revised Manuscript Received May 12, 2005 Waxes and asphaltenes are the major components in organic deposits from petroleum fluids. A key unresolved issue is whether there are significant intermolecular interactions between wax and asphaltene molecules during precipitation that would lead to synergy and coprecipitation, i.e., the phase change of one class inducing the precipitation of the other class. To address this, we studied six organic deposits in great chemical and physical detail: three that we categorized as predominantly wax deposits, two that were asphaltenic deposits, and one that seemed to be an organic acid deposit. Chemical analyses included elemental analysis, Fourier transform infrared (FTIR) spectroscopy, high-temperature simulated distillation, melting range measure- ment, and solubility experiments, performed on both parent crude oils and their corresponding deposits. The wax deposits contain in excess of 44 wt % waxes, and the complement of the deposits was occluded oil, water, and inorganic solids. Less than 6.2% (w/w) of these deposits were asphaltenes. Waxy-deposit waxes have higher melting points, longer straight-chain methylene, higher carbon number distributions, and higher molecular weights than their parent crude waxes. Asphaltenic-deposit waxes have properties that are almost identical to their parent crude oil waxes. Asphaltenic deposits contained >27 wt % asphaltenes. The properties of asphaltenes isolated from asphaltenic deposits were compared with the properties of asphaltenes isolated from their parent crude oils. The metal content and apparent VPO molecular weight of asphaltenic-deposit asphaltenes are significantly higher than those of corresponding crude-oil asphaltenes. The solubility of asphaltenic-deposit asphaltenes is much lower than the solubility of asphaltenes from their parent crude oils. The results indicate that the asphaltenes in the wax deposits are likely a component of the occluded oil in the deposit. A key conclusion of our work is that there is no evidence for any intermolecular interaction between waxes and asphaltenes to suggest synergy in precipitation. In fact, the evidence very much points to only one of these components undergoing a phase change and precipitating in an organic deposit and the other component simply being a portion of the crude oil occluded in the deposit. 1. Introduction Precipitation and deposition of organic solidsspri- marily asphaltenes and waxessduring the production, transportation, and processing of petroleum is common and poses a serious challenge to efficient operation. 1-5 Waxes are a mixture of linear, branched, and cyclic aliphatic hydrocarbons isolated from petroleum. Most crude oils contain 1-30 wt % high-molecular-weight paraffin and microcrystalline waxes, which, at low temperatures, precipitate as a component in organic deposits. 6,7 Asphaltenes are a solubility class typically defined as the heptane-insoluble, toluene-soluble frac- tion of petroleum. 8 Asphaltenes possess a high degree of polynuclear aromatic rings that have alkyl side chains and incorporate heteroatoms (such as O, N and S). The heteroatomic polar functional groups confer a limited molecular solubility of asphaltenes in hydrocarbon solvents that are partially or fully aliphatic. In organic solvents, asphaltenes associate to form discoidal ag- gregates 3-15 nm in diameter. In petroleum, these aggregates are solvated by resins. Oxygen and nitrogen functional groups are likely the major cause of the Presented at the 5th International Conference on Petroleum Phase Behavior and Fouling. * Author to whom correspondence should be addressed. Telephone: (919) 515-7121. E-mail address: [email protected]. ‡ Current address: Champion Technologies, 2300 Premier Way, Sherwood Park, AB, T8H 2L2, Canada. (1) Mansoori, G. A. Deposition and Fouling of Heavy Organic Oils and Other Compounds. In Proceedings of the 9th International Confer- ence on Properties and Phase Equilibria for Product and Process Design, Kurashiki, Okayama, Japan, May 20-25, 2001. (Invited paper.) (2) Misra, S.; Baruah, S.; Singh, K. Paraffin Problems in Crude oil Production and Transportation: A Review. SPE Prod. Facil. 1995, (February), 50-54. (3) Thawer, R.; Nicoll, D. C. A; Dick, G. Asphaltene Deposition in Production Facilities. SPE Prod. Facil. 1990, (November), 475-480. (4) Rassamdana, H.; Dabir, B.; Nematy, M.; Farhani, M.; Sahimi, M. Asphalt Flocculation and Deposition: I. The Onset of Precipitation. AIChE J. 1996, 42, 10-22. (5) Rassamdana, H.; Sahimi, M. Asphalt Flocculation and Deposi- tion: II. Formation and Growth of Fractal Aggregates. AIChE J. 1996, 42, 3318-3332. (6) Agrawal, K. M.; Khan, H. U.; Surianarayanan, M.; Joshi, G. C. Waxy-deposition of Bombay High Crude Oil under Flowing Conditions. Fuel 1990, 69, 794-796. (7) Nelson, W. L. Petroleum Refinery Engineering; McGraw-Hill: New York, 1958. (8) Pfeiffer, J. P.; Saal, R. N. J. Asphaltic Bitumen as Colloid System. J. Phys. Chem. 1940, 44, 139-149. 1360 Energy & Fuels 2005, 19, 1360-1375 10.1021/ef050022c CCC: $30.25 © 2005 American Chemical Society Published on Web 07/06/2005
Transcript of Asphaltenes and Waxes Do Not Interact Synergistically and Coprecipitate in Solid Organic Deposits
Asphaltenes and Waxes Do Not Interact Synergisticallyand Coprecipitate in Solid Organic Deposits†
Xiaoli Yang‡ and Peter Kilpatrick*
Department of Chemical Engineering, North Carolina State University,Raleigh, North Carolina 27695-7905
Received January 20, 2005. Revised Manuscript Received May 12, 2005
Waxes and asphaltenes are the major components in organic deposits from petroleum fluids.A key unresolved issue is whether there are significant intermolecular interactions between waxand asphaltene molecules during precipitation that would lead to synergy and coprecipitation,i.e., the phase change of one class inducing the precipitation of the other class. To address this,we studied six organic deposits in great chemical and physical detail: three that we categorizedas predominantly wax deposits, two that were asphaltenic deposits, and one that seemed to bean organic acid deposit. Chemical analyses included elemental analysis, Fourier transforminfrared (FTIR) spectroscopy, high-temperature simulated distillation, melting range measure-ment, and solubility experiments, performed on both parent crude oils and their correspondingdeposits. The wax deposits contain in excess of 44 wt % waxes, and the complement of the depositswas occluded oil, water, and inorganic solids. Less than 6.2% (w/w) of these deposits wereasphaltenes. Waxy-deposit waxes have higher melting points, longer straight-chain methylene,higher carbon number distributions, and higher molecular weights than their parent crude waxes.Asphaltenic-deposit waxes have properties that are almost identical to their parent crude oilwaxes. Asphaltenic deposits contained >27 wt % asphaltenes. The properties of asphaltenesisolated from asphaltenic deposits were compared with the properties of asphaltenes isolatedfrom their parent crude oils. The metal content and apparent VPO molecular weight ofasphaltenic-deposit asphaltenes are significantly higher than those of corresponding crude-oilasphaltenes. The solubility of asphaltenic-deposit asphaltenes is much lower than the solubilityof asphaltenes from their parent crude oils. The results indicate that the asphaltenes in the waxdeposits are likely a component of the occluded oil in the deposit. A key conclusion of our workis that there is no evidence for any intermolecular interaction between waxes and asphaltenesto suggest synergy in precipitation. In fact, the evidence very much points to only one of thesecomponents undergoing a phase change and precipitating in an organic deposit and the othercomponent simply being a portion of the crude oil occluded in the deposit.
1. Introduction
Precipitation and deposition of organic solidsspri-marily asphaltenes and waxessduring the production,transportation, and processing of petroleum is commonand poses a serious challenge to efficient operation.1-5
Waxes are a mixture of linear, branched, and cyclicaliphatic hydrocarbons isolated from petroleum. Mostcrude oils contain 1-30 wt % high-molecular-weightparaffin and microcrystalline waxes, which, at lowtemperatures, precipitate as a component in organicdeposits.6,7 Asphaltenes are a solubility class typicallydefined as the heptane-insoluble, toluene-soluble frac-tion of petroleum.8 Asphaltenes possess a high degreeof polynuclear aromatic rings that have alkyl side chainsand incorporate heteroatoms (such as O, N and S). Theheteroatomic polar functional groups confer a limitedmolecular solubility of asphaltenes in hydrocarbonsolvents that are partially or fully aliphatic. In organicsolvents, asphaltenes associate to form discoidal ag-gregates 3-15 nm in diameter. In petroleum, theseaggregates are solvated by resins. Oxygen and nitrogenfunctional groups are likely the major cause of the
† Presented at the 5th International Conference on Petroleum PhaseBehavior and Fouling.
* Author to whom correspondence should be addressed. Telephone:(919) 515-7121. E-mail address: [email protected].
‡ Current address: Champion Technologies, 2300 Premier Way,Sherwood Park, AB, T8H 2L2, Canada.
(1) Mansoori, G. A. Deposition and Fouling of Heavy Organic Oilsand Other Compounds. In Proceedings of the 9th International Confer-ence on Properties and Phase Equilibria for Product and ProcessDesign, Kurashiki, Okayama, Japan, May 20-25, 2001. (Invitedpaper.)
(2) Misra, S.; Baruah, S.; Singh, K. Paraffin Problems in Crude oilProduction and Transportation: A Review. SPE Prod. Facil. 1995,(February), 50-54.
(3) Thawer, R.; Nicoll, D. C. A; Dick, G. Asphaltene Deposition inProduction Facilities. SPE Prod. Facil. 1990, (November), 475-480.
(4) Rassamdana, H.; Dabir, B.; Nematy, M.; Farhani, M.; Sahimi,M. Asphalt Flocculation and Deposition: I. The Onset of Precipitation.AIChE J. 1996, 42, 10-22.
(5) Rassamdana, H.; Sahimi, M. Asphalt Flocculation and Deposi-tion: II. Formation and Growth of Fractal Aggregates. AIChE J. 1996,42, 3318-3332.
(6) Agrawal, K. M.; Khan, H. U.; Surianarayanan, M.; Joshi, G. C.Waxy-deposition of Bombay High Crude Oil under Flowing Conditions.Fuel 1990, 69, 794-796.
(7) Nelson, W. L. Petroleum Refinery Engineering; McGraw-Hill:New York, 1958.
(8) Pfeiffer, J. P.; Saal, R. N. J. Asphaltic Bitumen as Colloid System.J. Phys. Chem. 1940, 44, 139-149.
1360 Energy & Fuels 2005, 19, 1360-1375
10.1021/ef050022c CCC: $30.25 © 2005 American Chemical SocietyPublished on Web 07/06/2005

interfacial activity of asphaltenes. These polar moieties,along with p-bonding among aromatic moieties, are alsoprobably responsible for the aggregation of asphal-tenes.9-12
During the recovery and transportation of petroleum,asphaltenes or waxes can precipitate when the thermo-dynamic stability of the colloidal solution is perturbedby changes in pressure, temperature, and/or composi-tion.13-33 A key unresolved issue is whether these two
classes of compounds interact synergistically in thatprecipitation process, i.e., whether the intermolecularinteractions of some subset of the wax molecules withthe precipitating asphaltene molecules (or vice versa)induces coprecipitation. If this were indeed the case, onewould expect both the precipitated asphaltenes andwaxes to differ significantly in chemical and physicalproperties from the corresponding asphaltenes andwaxes in the parent crude oil.
Despite many years of research that has been focusedon waxes and asphaltene precipitation,18-33 there is stillneither a consensus nor a fundamental understandingof the chemical identity of the solids that precipitateand deposit nor of the molecular species initially re-sponsible for the phase change. Much of this uncertaintyis attributable to the complex characterschemically andphysicallysof the asphaltenes and waxes.34-39 What isintriguing about this complexity is that these twofractions probably differ the most in chemical andcolloidal properties of all crude fractions: i.e., asphalt-enes are the most aromatic and polar fraction and waxesare the most aliphatic and nonpolar fraction. Despitethese strong chemical differences, these two fractionsare similar in that both can be very high in molecularweight, both can aggregate or associate in solution, andboth have marginal solubilities in crude oil. Thus, bothare frequently involved in organic solid precipitation anddeposition.1,2 Yet, understanding the chemistry of pre-cipitation and deposition is important both for economicand environmental reasons.
This paper describes, in a detailed chemical andphysical fashion, the asphaltene and wax fractions of aseries of parent crude oils and the organic deposits thathave precipitated and have been isolated from thesecrudes as solid deposits. In addition, we attempt toresolve the issue of synergistic coprecipitation of waxesand asphaltenes. Based on what we present here, weconclude that waxes and asphaltenes do not interactmolecularly to yield a synergistic coprecipitate; rather,one species precipitates because a thermodynamic solid-liquid phase boundary is crossed and the other speciesbecomes entrained in the precipitating solid.
Waxes, asphaltenes, resins, and inorganic solids wereisolated from five crude oils and the five correspondingorganic deposits were subjected to detailed chemicalanalysissincluding elemental analysis, Fourier trans-form infrared (FTIR) spectroscopy, 1H and 13C nuclearmagnetic resonance (NMR) spectroscopy, high-temper-ature simulated distillation, and vapor pressure os-
(9) Moschopedis, S. E.; Speight, J. G. Investigation of hydrogenbonding by oxygen functions in Athabasca bitumen. Fuel 1976, 55,187-192.
(10) Ignasiak, T.; Strausz, O. P.; Montgomery, D. S. Oxygendistribution and hydrogen bonding in Athabasca asphaltene. Fuel 1977,56, 359-365.
(11) Acevedo, S.; Mendez, B.; Rojas, A.; Layrissr, L; Rivas, H.Asphaltenes and Resins from the Orinoco Basin. Fuel 1985, 64 (12),1741-1748.
(12) Kilpatrick, P. K.; Spiecker, P. M. Asphaltene Emulsions. InEncyclopedic Handbook of Emulsion Technology; Sjoblom, J., Ed.;Marcel Dekker: New York, 2001; Vol. 3, pp 707-730.
(13) Monger, T. G.; Fu, J. C. The nature of CO2-induced OrganicDeposition. Presented at the SPE Annual Technology Conference andExhibition, Dallas, TX, September 27-30, 1987, SPE Paper No. 16713.
(14) Hirschberg, A.; deJong, L. N. J.; Schipper, B. A; Meijer, J. G.Influence of Temperature and Pressure on Asphaltene Flocculation.Soc. Pet. Eng. J. 1984, (6), 283-293.
(15) Sheu, E. Y.; Tar, M. M. De; Strom, D. A. Structure andInteraction of Asphaltene Colloids in Organic Solvents. In AsphalteneParticles in Fossil Fuel Exploration, Recovery, Refining, and ProductionProcesses; Sharma, M. K., Yen, T. F., Eds.; Plenum Press: New York,1994.
(16) Sheu, E. Y; Storm, D. A. Colloidal Properties of Asphaltenes inOrganic Solvents. In Asphaltenes: Fundamentals and Applications;Sheu, E. Y., Mullins, O. C., Eds.; Plenum Press: New York, 1995; pp1-52, 115-143.
(17) Sheu, E. Y. Self-Association of Asphaltenes: Structure andMolecular Parking. In Structures and Dynamics of Asphaltene; Mullins,O. C., Sheu, E. Y., Eds.; 1998, Plenum Press: New York; pp 115-143.
(18) Park, S. J.; Mansoori, G. A. Aggregation and Deposition ofHeavy Organics in Petroleum Crudes. Energy Source 1988, 10, 109-125.
(19) Hansen, J. H.; Fredenslund, A.; Pedersen, K. S.; Ronningsen,H. P. A thermodynamic Model for Predicting Wax Formation in CrudeOils. AIChE J. 1988, 34 (12), 1937-1942.
(20) Fuhr, B. J.; Cathrea, C.; Coates, L.; Kalra, H.; Majeed, A. I.Properties of Asphaltenes from a waxes crude. Fuel 1991, 70, 1293-1297.
(21) Chung, F.; Sarathi, P; Jones, R. Modelling of Asphaltene andWax Precipitation, U. S. Department of Energy Report No. NIPER-498 (DE 91002217), January 1991.
(22) Chung, T. H. Thermodynamic Modelling for Organic SolidDeposition. U.S. Department of Energy Report No. NIPER-623 (DE93000104), December 1992.
(23) Boer, R. B.; Leerlooyer, K.; Eigner, M. R. P.; van Bergen, A. R.D. Screening of Crude Oils for Asphalt Precipitation: Theory, Practice,and the Selection of Inhibitors. SPE Prod. Facil. 1995, (2), 55-61.
(24) Thomas, D. C.; Becker, H. L.; Del Real Soria, R. A. ControlAsphaltene Deposition in Oil Wells. SPE Prod. Facil. 1995, (5), 119-123.
(25) Ferworn, K. A. Thermodynamic and Kinetic Modelling ofAsphlatene Precipitation From Heavy Oils and Bitumens, Ph.D.Thesis, The University of Calgary, Calgary, Alberta, Canada, April1995.
(26) Mansoori, G. A.; Jiang, T. S.; Kawanaka, S. Asphaltene deposi-tion and its role in petroleum production and processing. Arabian J.Sci. Eng. 1988, 13 (1), 17.
(27) Mansoori, G. A. Modeling of Asphaltene and other heavy organicdeposition. J. Pet. Sci. Eng. 1997, 17, 101-111.
(28) Buckley, J. S.; Hirasaki, G. J.; Drasek, S. V.; Wang, J.-X.; Gill,B. S. Asphaltene Precipitation and Solvent Properties of Crude oils.In 2nd International Symposium on Thermodynamics of Heavy Oilsand Asphaltenes, Session II, Spring National Meeting Houston, TX,March 9-13, 1997, 61f.
(29) Carbognani, L.; Duarte, D.; Rosales, J.; Villalobos, J. Isolationand characterization of Paraffinic components from Venezuelan as-phalts. Effects of paraffin dopants on rheological properties of someasphalts. Pet. Sci. Technol. 1998, 16 (9&10), 1085-1111.
(30) Carbognani, L.; Orea, M.; Fonseca, M. Complex Nature ofSeparated Solid Phases from Crude Oils. Energy Fuels 1999, 13, 351-358.
(31) Carbognani, L.; DeLima, L.; Orea, M.; Ehrmann, U. Studieson Large Crude Oil Alkanes: II. Isolation and characterization ofAromatic Waxes and Waxy asphaltenes. Pet. Sci. Technol. 2000, 18(5&6), 607-634.
(32) Garcia, M. d. C. Crude Oil Wax Crystallization. The Effect ofHeavy n-paraffins and Flocculated Asphaltenes, Energy Fuels 2000,14, 1043-1048.
(33) Bennett, H. Industrial Waxes, Part 1: Natural Waxes; ChemicalPublishing Company: New York, 1963; p 1.
(34) Musser, J. B.; Kilpatrick, P. K. Molecular Characterization ofWax Isolated from a Variety of Crude Oils. Energy Fuels 1998, 12 (4),715-725.
(35) Dickie, J. P.; Yen, T. F. Macrostructures of the AsphalticFractions by Various Instrumental Methods. Anal. Chem. 1967, 39 (14),1847-1852.
(36) Yen, T. F. Structure of Petroleum Asphaltene and its Signifi-cance. Energy Sources 1974, 1 (4), 447-463.
(37) Speight, J. G. Latest Thoughts on the Molecular Nature ofPetroleum Asphaltenes. Prepr. Pap.sAm. Chem. Soc., Div. Pet. Chem.1989, 34 (2), 321-328.
(38) Rogel, E. Simulation of Interactions in Asphaltene Aggregates.Energy Fuels 2000, 14, 566-574.
(39) McLean, J. D.; Kilpatrick, P. K. “Effects of Asphaltene Ag-gregation in Model Heptane-Toluene Mixtures on Stability of Water-in-Oil Emulsions. J. Colloid Interface Sci. 1997, 196, 23-34.
Asphaltenes and Waxes in Solid Organic Deposits Energy & Fuels, Vol. 19, No. 4, 2005 1361

mometry (VPO). In addition, a sixth deposit was alsostudied. Elemental analysis provides structural infor-mation regarding relative aromatic (H/C ratio) andheteroatomic distribution (N, S, and O percentages) inthe waxes, asphaltenes, crude oils, and deposits. Thepresence of functional moietiessincluding carbonyls/carboxylic acids, phenols, sulfonyls, amide carbonyls,and pyrroles and the aromatic carbon content in thesepolar fractionsswere evaluated by means of FTIRspectroscopy. The straight-chain methylene content inthe waxes was semiquantified by the rocking-modevibration at 720-730 cm-1. Proton and 13C NMRspectroscopy were used to provide structural informa-tion on aliphatic and aromatic hydrocarbon groups inwaxes. Based on these results, the chemistry of waxesand asphaltenes from the original crude oils and theircorresponding deposits were compared and contrasted.In addition, differential solubility tests and VPO mea-surements were performed to probe the chemistry of theasphaltenes by dissolving them in mixtures of heptaneand toluene, varying the aliphatic-aromatic balance ofthe mixtures and monitoring the saturation solubilityand the precipitation percentage of the asphaltenefractions.
2. Experimental Section
2.1. Materials. Five crude oils (designated as A, B, D, C,and E), five corresponding deposits (designated as δA, δB, δD,δC, and δE), and another deposit (denoted as δF) were collectedand supplied by Shell International E&P TAR and Equilon.Table 1 lists the sources of these crudes oils and deposits.
n-Heptane, toluene, methylene chloride, petroleum ether,cyclohexanes, and acetone (all high-performance liquid chro-matography (HPLC) grade) were acquired from Fisher Scien-tific. Petroleum ether was optimum grade. The silica gel wasfrom Fisher Scientific (chromatographic grade, 35-60 mesh,Davisil). The filter paper used for isolating crude asphalteneswas Whatman 934 AH glass microfiber filter. For isolatingwax, the filter paper was 542 hardened ashless filter paper(pore size of 2.7 µm).
2.2. Procedures for Isolating Asphaltenes, Waxes, andInorganic Fractions from Crude Oils and Their Corre-sponding Deposits. Asphaltenes, saturates, aromatics, andresins were separated from crude oils by the IP 143 standard.The asphaltenes were precipitated by heptane, and resins wereobtained by sequential elution chromatography of maltenesadsorbed to silica gel. The asphaltenes from deposits wereseparated by a modified IP 143 procedure (provided by ShellOil Company). A schematic of the separation procedure isshown in Figure 1.
Wax fractions in the crude oils were isolated from thesaturated hydrocarbon fractions. using a method proposed byBurger in 198140 and subsequently modified by other research-ers.34 Five grams of saturates from crude oils were dissolvedin 35 mL of petroleum ether, and then 105 mL of acetone wereadded. Saturates, petroleum ether, and acetone mixtures, allof the filtration apparatus, and a wash solvent composed ofacetone and petroleum ether (3:1 v/v) were cooled for 2 h at-20 °C. The mixture was filtered through a Buchner funnelinto a 100-mL flask and a vacuum was applied. The retentatewas washed with cold wash solvent until clear solvent flowed.The retentate was transferred to a tared vial and dried in anitrogen-flushed vacuum oven at 60 °C for 48 h.
Asphaltenes and maltenes were obtained from deposits bythe modified IP 143 method. The deposits were extracted at a1:40 hot heptane (70 °C) ratio in a Soxhlet extractor for aminimum of 12 h. Heptane was removed in a rotary evapora-tor, and the residual maltenes were obtained. After extractionof maltenes, asphaltenes were then extracted from depositswith a 10-fold excess of methylene chloride. Methylene chloridewas removed in a rotary evaporator from the asphaltenesolution. Residual maltenes and the asphaltene were dried ina nitrogen-flushed vacuum oven at 60 °C for 48 h. Waxfractions were obtained from the maltenes separated usingSoxhlet extraction. A mixture of petroleum ether and acetone(1:3 v/v) was added in 7-fold excess to the maltenes. Thesubsequent wax precipitation method was the same as thatused to isolate waxes from the crude.
2.3. Elemental Analysis. Elemental analysis (carbon,hydrogen, nitrogen, sulfur, and oxygen) of crude oils, deposits,waxes, asphaltenes, and metals analysis of asphaltenes wereperformed by Galbraith Laboratories, Inc. A combustionmethod was used to determine the carbon, hydrogen, nitrogen,and sulfur content to within (0.55%, according to the meth-odologies described in ASTM D5373 and ASTM D5291. Thesamples were pyrolyzed in a helium/hydrogen mixture todetermine the oxygen content.
2.4. High-Temperature Simulated Distillation (HTSD).High-temperature simulated distillation (HTSD)41 is a rela-tively new method that extends ASTM Method D 2887 (IP4060) for the determination of the boiling range distribution
(40) Burger, E. D.; Perkins, T. K.; Striegler, J. H. Studies of Waxy-deposition in the Trans Alaska Pipeline. J. Pet. Technol. 1981, 1075-1086.
(41) Villalanti, D.; Janson, D.; Colle, P. Distillation Session, Distil-lation Column Design and Operation-IV: Advances in DistillationModeling and Simulations. Presented at the AIChE Spring NationalMeeting, Houston, TX.; March 1995; pp 19-23. (Paper No. B (pre-print).)
Table 1. Crude Oil and Deposit Source and Designation
sample
symbolused in
this paper resource
Crude Oilcrude A A Gannetcrude B B GOMcrude C C Betacrude D D Fulmarcrude E E Venezuela
Depositdeposit A δA Gannet, no descriptiondeposit B δB GOM, associated pigged pipeline depositdeposit C δC Beta, pipeline depositdeposit D δD Fulmar, separator depositdeposit E δE Venezuela, asphaltenic depositdeposit F δF GOM, associated pigged pipeline deposit
Figure 1. Schematic illustration of method for separatingfractions from deposits.
1362 Energy & Fuels, Vol. 19, No. 4, 2005 Yang and Kilpatrick

of hydrocarbons up to a final boiling point of 760 °C. Recentadvances in capillary gas chromatography (GC) columns andstationary phases, together with programmed temperaturevaporization (PTV) and on-column injection techniques, enableseparation of C5-C120 normal paraffins and permits charac-terization of petroleum products from 36.1 °C to 748.9 °C.Triton Analytic Corporation provided the HTSD analysis. Theboiling range distributions of hydrocarbons in the crude oils,deposits, and waxes were all determined using this technique.
2.5. Measurement of Wax Melting Region. The temper-ature range of melting and the optical textures of phases ofthe crude and deposit waxes were observed using an OlympusBH-2 polarizing microscope that was equipped with a Phys-itemp TS-4ER temperature-controlled hot stage (-20 °C to 100°C). The temperatures corresponding to the initial melting ofwax crystals until all of the visible wax crystals disappearedwas observed and reported as the melting range. Waxes werefirst heated to 35 °C and maintained at this temperature for5 min to determine if wax crystals had begun to melt. Thetemperature was then increased by an additional incrementof 5 °C for each 5 min interval. This step was repeated untilall of the wax crystals completely melted. Because waxes werea mixture of hydrocarbon compounds, some deposit waxesmelted over a large region with an uncertainty of (5 °C.
2.6. Fourier Transform Infrared Spectroscopy. AnRFX-65 spectrometer that was equipped with a liquid nitrogen-cooled mercury cadmium telluride (MCT) detector was usedto obtain FTIR spectra of asphaltene and wax solutions. Cyclo-hexane was used to dissolve the waxes (5-15 g/L), and spectrawere obtained in a KCl cell with a 0.25-mm spacer. Methylenechloride was used to dissolve the asphaltenes (5-15 g/L), andspectra were obtained in a CaF2 cell with a 0.2008-mm spacer.Background spectra of pure cyclohexane or methylene chloridewere integrated and subtracted from sample spectra. Two
hundred fifty-six scans were taken of each sample recordedfrom 4000 cm-1 to 400 cm-1 at a resolution of 4 cm-1. Peakpositions and areas were determined using available softwarepackages. Areas under absorption bands of interest wereconverted to functional group concentrations via Beer’s law.
2.7. Solubilities of Asphaltenes in Toluene-HeptaneMixtures with Different Ratio. A series of various concen-trations (0.001%-0.008%, w/w) of asphaltene-toluene solu-tions were prepared, and their ultraviolet (UV)-visible spectrawere obtained in the wavelength range of 200-800 nm, usinga Shimadzu UV-Vis scanning spectrophotometer. The absor-bance at 450 nm was used to obtain asphaltene concentrations,being sufficiently high to be uninfluenced by the Soret bandor by any modest attenuation of light, because of scattering ofany residual undissolved material. The absorbance range was0.2-1.2. Toluene-heptane (T/H) mixtures of various volumeproportions were prepared, to which asphaltenes were added.These solutions/dispersions were shaken for more than 48 hto ensure saturation. The asphaltene solutions were filteredthrough a 1.6-µm filtering syringe tip; the saturated filtratesolutions were weighed and dried under N2 gas, and the driedasphaltenes were redissolved in toluene as accurate concentra-tions to measure their UV-visible spectra and to obtain thesaturation concentration. The saturation concentrations ofasphaltene in different T/H mixtures were obtained by meansof their absorbance in the 450-nm wavelength and the corre-sponding calibration.
3. Results and Discussion
3.1. Categorizing Crude and Deposits. The proper-ties and compositions of the five parent crude oils (A-E)and their corresponding deposits (δA-δE) are listed in
Table 2. Elemental Compositions and Properties of Crude Oils and Their Deposits
H/C C (%) H (%) N (%) S (%) O (%) asphaltene (%) wax (%) API gravity type of crude oil
crude oilA 1.85 86.32 13.26 <0.5 0.15 0.86 0.1 11.6 41.5 lightB 1.82 86.22 13.03 <0.5 0.2 1.17 NMa 2.7 34.6 lightC 1.66 82.74 11.47 0.81 3.69 1.27 12.1 4.2 15.5 heavyD 1.90 85.78 13.54 <0.5 <0.5 <0.5 0.6 8.0 39.0 lightE 1.79 84.77 12.45 <0.5 1.89 0.76 6.5 2.8 25.9 heavy
H/C C H N S O asphaltene (%) wax (%) inorganic + solid (%) type of deposit
depositδA 2.03 83.01 13.9 <0.5 <0.5 1.02 0.2 75.7 0.8 waxδB 1.88 84.19 13.19 <0.5 0.18 1.82 NMa 43.7 1.5δC 1.88 83.46 13.06 <0.5 1.98 1.49 6.1 55.7 2.8δD 0.91 86.82 9.12 <0.5 1.25 1.55 55.7 4.0 NMa asphaltenicδE 1.48 81.11 10.02 0.73 4.01 2.51 27.4 4.3 7.0δF 2.05 62.81 10.74 2.13 0.28 19.66 63.6 1.8 neither asphaltenic nor wax
a Not measured.
Table 3. Weight Percentages of SARA Fractions of Crude Oils
fraction sample A sample B sample C sample D sample E
nonvolatile saturates + aromatics + resins (%) 49.9 76.4 77.6 67.8 70.2wax (%) 11.6 2.7 4.2 8.0 2.8asphaltenes (%) 0.1 NM 12.1 0.6 6.5water (%) 0.04 0.06 0.21 0.70 0.71pretreatment volatiles (%) 38.5 20.8 6.0 23.5 19.8
Table 4. Weight Percentages of SARA Fractions of Deposits
fraction sample δA sample δB sample δC sample δD sample δE sample δF
saturates + aromatics + resin (%) 10.3 34.5 27.6 35.1 40.6 11.3wax (%) 75.7 43.7 55.7 4.0 4.3 63.6a
asphaltene (%) 0.2 NM 6.1 55.7 27.4inorganic + solid (%) 0.8 1.5 2.8 NM 7.0 1.8pretreatment volatiles (%) 10.9 19.6 7.2 5.07 16.2 19.9water (%) 2.12 0.85 0.58 0.13 4.1 3.4entrained oil/wax + asphaltene (%) 27.9 123.7 54.2 67.38 179.0 49.0a Neither asphaltene nor wax; see Table 15 for a detailed description.
Asphaltenes and Waxes in Solid Organic Deposits Energy & Fuels, Vol. 19, No. 4, 2005 1363

Tables 2-4. Crude oils A and B contain virtually noasphaltenes, whereas crude oil D contains a low con-centration of asphaltenes (0.55% w/w). The HTSDresults of crude oils A, B, and D indicated that theirfractions with a boiling point of e350 °C were close to100% (97%-98%; see Table 5). The API of these threecrude oils was >35, indicating that these are light,paraffinic crudes. Crude oils C and E contain higherasphaltene amounts (6%-12%, w/w). The HTSD resultsof crude oils C and E showed that 20%-40% of thesecrudes boils at >350 °C and there was still ca. 10% thatdid not distill, even at temperatures of >550 °C. TheirAPI gravities were 12 and 25 respectively, correspond-ing to relatively heavy asphaltenic crudes.
Table 3 presents wax or asphaltene contents in thedeposits, which are clearly higher than other constitu-ents (e.g., occluded oil, water, inorganic materials). Thedeposits fall into two groups: waxy deposits and as-phaltenic deposits (see Table 2). The wax contents indeposits δA, δB, and δC are >40 wt %, and thesesamples are classified as waxy deposits. The asphaltenecontents in δD and δE are >27 wt %, and they aretherefore classified as asphaltenic deposits. With bothwaxy deposits and asphaltenic deposits, 10%-120%hydrocarbons coprecipitated with them to form organicdeposits. A comparison of the properties of waxy depos-its to those of their parent oils shows that the H/C ratiosof waxy deposits are greater than the H/C ratios of theparent crude oils, indicative of a greater degree ofparaffinic aliphaticity in the deposits. Conversely, theH/C ratios of asphaltenic deposits were much less thanthe H/C ratios of their parent crude oils. Tables 3 and4 show the relatively low content of maltenes (saturates,aromatics, and resins) in deposits, in comparison to theirparent crude oils. Their elemental analyses showed thatthe oxygen content clearly increased in deposits, indi-cating perhaps the origin of reduced solubility or
increased tendency to precipitate and adsorb. Thefraction of material with boiling points of <350 °C inthe deposits was much smaller than that in the crudeoils (see Table 5), whereas the fractions of the materialwith boiling points in the range of 350-550 °C wereincreased significantly, compared to the parent crudeoils. The fractions with a boiling point of >550 °C werealso expected to be a higher percentage of the depositsthan in the parent crude oils. HTSD yields for depositswere much lower than their corresponding crudes. It iseasy to understand the low yields for deposits δC andδD, because of the relatively high concentration ofasphaltenes in them. With deposit δA, the yield of HTSDwas ca. 50%, much lower than that of deposit δB, bothof which have low asphaltene contents. Plausible ex-planations for the lower HTSD yields are that some ofthe δA fraction could not be totally dissolved in CS2 orthat there are higher carbon number species that cannotelute from the column.
Regarding the appearance of the waxy deposits,deposit δA is a brown sandy solid, whereas deposits δBand δC are dark brown and greasy in appearance.Almost no asphaltenes could be measured in depositsδA and δB, whereas in deposit δC, 6% asphaltenescoprecipitated with the wax.
The asphaltenic deposits had a markedly differentappearance. Two forms of asphaltenic deposits areobserved in the field:42 hard, shiny, solid deposits anddark sludge. The appearance of deposit δD was theformer, whereas that of deposit δE seemed to be the
(42) Leontaritis, K. J.; Amaefule, J. O.; Charles, R. E. A SystemicApproach for the Prevention and Treatment of Formation DamageCaused by Asphaltene Deposition. SPE Prod. Facil. 1994, (August),157.
Table 5. Weight Percentages of HTSD Fractions inWhole Crude Oils and Deposits
HTSD Fraction (wt %)
sample <350 °C 350-550 °C >550 °C sum
Crude OilsA 97.0 2.1 0.4 99.5B 98.0 1.5 99.5C 47.6 33.1 9.6 90.3D 97.1 2.0 0.4 99.5E 72.5 15.1 4.4 92.0
DepositsδA 5.1 20.7 25.8 51.6δB 69.4 18.6 4.7 92.7δC 5.2 55.4 19.6 80.2δD 23.5 27.3 4.3 55.1δE 17.2 39.4 9.1 65.7
Table 6. Melting Ranges of Crude Oil Waxes andAssociated Deposit Waxes
wax H/C ratio appearance melting range (°C)
Crude OilA 1.94 white yellow 50-53B 2.00 yellow 45-75C 1.85 orange 40-45D 2.01 white yellow 60-65E 1.95 white yellow 40-50
DepositδA 2.00 brown, solid 75-95δB 1.96 brown, solid 85-95δC 1.92 brown, solid 85-95δD 1.96 orange 55-85δE 1.89 yellow 40-50
Figure 2. Carbon number distribution of crude oil waxes fromflame ionization detection (FID) response in high-temperaturesimulated distillation (HTSD) analysis.
Figure 3. Carbon number distribution of deposit waxes fromFID response in HTSD analysis.
1364 Energy & Fuels, Vol. 19, No. 4, 2005 Yang and Kilpatrick

latter. Based on the considerably higher amount ofasphaltenes in deposit δD compared to deposit δE(55.7% vs 27.4%), and considering the polar, high-molecular-weight, highly aromatic character of δD as-phaltenes, this is not surprising. In the followingsection, we focus our attention on comparing andcontrasting the properties of waxes and asphaltenesthat were isolated from both crude oils and theirrespective deposits.
3.2. Wax Fraction Analyses. Three categories ofwaxesscrude, waxy deposit, and asphaltenic depositswere classified according to their sources. The rangesof melting, H/C ratios, and appearances of the threeclasses of waxes are listed in Table 6. The carbonnumber distributions of waxes are shown in Figures 2and 3. Parts a and b of Table 7 compare the elementaldistribution of crudes and their respective depositwaxes.
In FTIR spectra of long straight-chain alkanes, thepeak at 720 cm-1, as a finger peak, has long beenassociated with long, straight-chain methylene that isat least four units long.43 Table 8 lists the absorbancepeak location between 715 and 735 cm-1 in the FTIRspectra of straight-chain alkanes.44 With n-alkanesranging in carbon number from C5 to C44, the absor-
bance peak exhibits a blue shift to ca. 720 cm-1 as thecarbon number increases. 2,6,10,14-Tetramethylpenta-decane, which is a C19 alkane with four methyl branches,had no vibrational mode at 720 cm-1 but does exhibitone at 736 cm-1. Table 8 shows that, as the weightpercentage of straight-chain methylene content in-creases in alkanes, the absorbance peak shifts closelyto 720 cm-1.
Figures 4 and 5 are FTIR spectra of all the waxes.The spectra clearly illustrate that (i) all crude anddeposit waxes have significant peaks in the range 720-730 cm-1 and (ii) these peaks in deposit wax areconsiderably more intense than those in their respectiveparent crude waxes. Table 9 lists the weight percentagesof the straight-chain methylene contents in both crudeand deposit waxes. The apparent integrated absorptionintensities used to determine long, straight-chain me-thylene concentrations in this study was 94.9 L mol-1
cm-1).35 Although the low molar apparent integratedabsorption intensity could result in relatively largeuncertainties in this measurement, the values in Table9 are still plausible and provide useful clues aboutdifferences among waxes from crude versus organicdeposits. The results in Table 9 show that deposit waxescontain more paraffinic waxes, with less apparent chainbranching and cyclic character, than crude waxes.
3.2.1. Properties and Compositions of Crude Waxes.Most crude waxes melted in the range of 40-55 °C; theD and B waxes had higher melting ranges (60-65 °C
(43) Bellamy, L. J. Alkanes. In Advances in Infrared Group Fre-quencies: The Infrared Spectra of Complex Molecules; Wiley: NewYork, 1964; Chapter 2.
(44) FTIR data from Spectral Database for Organic Compounds(SDBS), http://www.aist.go.jp/RIODB/SDBS/menu-e.html.
Table 7. Properties of Crude Oil Waxes and Associated Deposit Waxes (a) in Wax Deposits and (b) in AsphaltenicDeposits
sampleweight in
sample (%)H/Cratio
S/Cratio
O/Cratio C (%) H (%) S (%) O (%) sum (%) appearance
(a) Wax DepositsA 8.14 1.94 0.0003 0.0048 85.34 13.78 0.057 0.54 99.72 white yellowδA 75.7 2.00 85.25 14.14 99.39 tan, light brownB 1.59 2.00 0.0168 86.03 14.35 <0.16 1.93 102.31 white yellowδB 43.6 1.96 0.009 84.41 13.8 <0.32 1.01 99.39 tan, light brownC 3.48 1.85 0.0062 0.0085 84.92 13.09 1.4 0.96 99.83 yellowδC 55.72 1.92 0.0046 0.0087 84.3 13.51 1.04 0.98 100.37 tan, light brown
(b) Asphaltenic DepositsD 7.97 2.01 85.67 14.37 <0.1 <0.5 100.04 white yellowδD 3.95 1.96 85.18 13.87 <0.5 <0.5 99.05 yellowE 2.80 1.95 0.0021 85.21 13.81 0.47 <0.5 99.99 white yellowδE 4.33 1.89 0.0035 0.006 85.71 13.52 0.81 0.68 100.72 yellow
Table 8. Fourier Transform Infrared (FTIR) Absorbance Maxima of Straight-Chain Alkanes at 735-700 cm-1a
compoundmolecularformula
number of-(CH2)- unitsb
absorbancepeak (cm-1)
-(CH2)4- in entiremolecule (wt %)
n-pentane C5H12 3 732n-hexane C6H14 4 726 65.12n-heptane C7H16 5 723 70.00n-decane C10H22 8 721 78.872,6-dimethyloctane C10H22 3 7343,3-dimethyloctane C10H22 4 725 39.442,2-dimethyloctane C10H22 5 724 49.295-methylnonane C10H22 3 7294-methylnonane C10H22 4 725 39.443-methylnonane C10H22 5 724 49.292-methylnonane C10H22 6 723 59.15n-dodecane C12H26 10 721 82.35n-hexadecane C16H34 14 721 86.73octadecane C18H38 16 718 88.19nonadecane C19H40 17 720 88.812,6,10,14-tetramethyl pentadecance C19H40 3 736n-triacotane C30H62 28 720 92.89n-tetracontane C40H82 38 720 94.66
a The data were arranged based on ref 44. b The number of connected methylene functional groups in the molecule.
Asphaltenes and Waxes in Solid Organic Deposits Energy & Fuels, Vol. 19, No. 4, 2005 1365

and 45-75 °C, respectively; see Table 6). Microscopicobservations show that there are fine crystalline struc-tures in the D waxes, which may result in an increase
in the melting range.34 B wax exhibited two meltingregions (45-55 °C and 65-75 °C) and also containedpart of a fine crystalline structure. The HTSD results
Figure 4. FTIR spectra of waxes isolated from crude oils: 1, E wax; 2, D wax; 3, B wax; 4, C wax; and 5, A wax.
Figure 5. FTIR spectra of waxes isolated from deposits: 1, δE wax; 2, δD wax; 3, δC wax; 4, δB wax; and 5, δA wax.
1366 Energy & Fuels, Vol. 19, No. 4, 2005 Yang and Kilpatrick

in Figure 2 suggest a very broad distribution of carbonnumbers (C11-C108) in all crude waxes. The primaryconstituents were in the C20-C40 range (40%-55%),with other components being 5% C11-C20, 15% C41-C50,5%-10% C51-C70, and ca. 15% C>71 alkanes. Theirelemental analyses indicate very low nitrogen (<0.1%)contents (see Table 7a and 7b). The sulfur and oxygencontents in crude waxes show some relationship to thecontent of sulfur and oxygen in their parent crude oils.The sulfur content in A, B and D waxes was <0.1%, andthe parent crudes also have a very low sulfur content(see Table 2). Crude oils C and E contain a higher sulfurcontent, and their waxes also show a higher sulfurpercentage (1.4% and 0.47%, respectively). The obvi-ously lower H/C ratio of C wax is partially attributedto its higher sulfur content. Proton NMR spectra ofcrude waxes evidenced a small region of aromaticprotons, although 13C NMR and FTIR spectra show thatthere were no measurable aromatic groups in the crude
waxes. The small amount of aromatic carbon presentin the crudes waxes could be present in thiophenic rings,as the literature reports.35 From 13C NMR spectra (seeFigure 6), most crude waxes exhibit methyl, methylene,methine, and quaternary carbon structures, indicativeof considerable branching.
Based on the H/C ratios, melting points, and HTSDresults, crude A, B, D, and E waxes are primarilyparaffinic waxes; the C wax is a mixed paraffinic andfine crystalline wax with substantial chain branchingand heteroatomic functionality.
3.2.2. Properties and Compositions of Waxy-DepositWaxes. The waxes isolated from deposits δA, δB, andδC as similar to clay in appearance. The melting pointsof these waxes fall in the range of 75-95 °C (see Table6), which is much higher than the melting ranges oftheir respective crude waxes. When they are heated to>85 °C, their color changes to dark brown. These waxesbecome very hard (similar to plastics). The fine crystalstructures exhibited in the photomicrographs in Figure7a and b were smaller than the crystals of the corre-sponding crude waxes.
Table 7a sums the carbon, hydrogen, sulfur, andoxygen analyses of the waxes of deposits δA, δB, andδC. Their H/C ratios are 1.92-2.00 and are greater thanthose of their parent crude waxes (except for the δBwax). There was negligent nitrogen present (<0.1%) inthese waxes, similar to their parent crude waxes. Thesulfur and oxygen contents in the δA wax were less thanthose of other waxes. There was a higher sulfur contentin δB wax comparable to its parent crude wax. This maypartially explain the reason for its lower H/C ratio thanthe H/C ratio of its crude wax. δC wax contains both
Figure 6. 13C NMR spectra of waxes isolated from crude oils.
Table 9. Weight Percentages of Straight-ChainMethylene in Waxes Based on FTIR Analysis
sample -(CH2)4- (wt %) notes
Crude OilsA 63.8 } crude waxesB 42.5C 18.8D 69.9E 48.6
DepositsδA 80.5 } wax-deposit waxesδB 66.5δC 40.3δD 80.9 } asphaltenic-deposit waxesδE 59.3
Asphaltenes and Waxes in Solid Organic Deposits Energy & Fuels, Vol. 19, No. 4, 2005 1367

higher S% (>1%) and higher O% (∼1%) in three waxy-deposit waxes. However, its sulfur content is lower thanin its parent crude wax, and its H/C ratio is higher thanthe H/C ratio of its parent crude wax. Based on FTIRspectra, the waxy-deposit waxes contain ∼20% greaterstraight-chain methylene content than do their parentcrude waxes (see Table 9 and Figures 4 and 5). Thesestructural differences are confirmed by the 13C NMRspectra (Figure 8). The fact that few peaks are observedin their 13C NMR spectra implies that less-branchedchains exist in the structure of waxy-deposit waxes.
Figures 9-11 present HTSD chromatograms of bothwaxy-deposit waxes and their parent crude waxes, andthese show the differences in carbon number distribu-tion. Waxy-deposit waxes contain very little materialwith a chain length of less than C30, with the majorityof components falling in the C31-C60 range. The C37-C48 chains were particularly prominent, typically con-stituting >30% of the waxes. In contrast, the carbonnumber range of C18-C32 dominates the distribution inall the crude waxes. Paraffin and so-called fine crystal-line waxes are both predominantly long-chain n-al-
Figure 7. Micrographs of waxes isolated from crude oils (a) and associated deposits (b) (20× magnification).
1368 Energy & Fuels, Vol. 19, No. 4, 2005 Yang and Kilpatrick

kanes; however, fine crystalline waxes have much-greater molecular weights. The common commercialparaffin waxes have molecular weights of 360-420(carbon number of 26-30 (C26-C30)). The paraffin waxes
also can be of a greater molecular weight (∼600) withhigher melting ranges. The molecular weight of com-mercial microcrystalline waxes is 580-700 (carbonnumber of 41-50 (C41-C50)).34 The waxy-deposit waxesin this study were relatively long, straight-chain, finecrystalline waxes that possess higher melting points andgreater molecular weights than their parent crudewaxes. Undoubtedly, their high molecular weights andmelting points confer a reduced solubility on them asthe temperature is reduced, thus making them precipi-tate to form deposits. When heated, they changed colorand became plastic waxes, which implies that they willbe difficult to remove from pipelines through heattreatments.
3.2.3. Properties of Compositions of Asphaltenic-Deposit Waxes. Unlike the waxes isolated from waxydeposits, the two waxes from asphaltenic deposits arelight yellow, similar to pure paraffin wax. The meltingrange of δE wax is in the range of 40-50 °C, similar to
Figure 8. 13C NMR spectra of waxes isolated from wax deposits.
Figure 9. Carbon number distribution from HTSD of A andδA waxes.
Figure 10. Carbon number distribution from HTSD of B andδB waxes.
Figure 11. Carbon number distribution from HTSD of C andδC waxes.
Asphaltenes and Waxes in Solid Organic Deposits Energy & Fuels, Vol. 19, No. 4, 2005 1369
its parent E wax (see Table 6). No clear crystal structurecan be observed in the δE wax. The melting range ofwax from δD alkanes is similar to that of its parentcrude D wax. In δD wax, some fine crystal structurewas observed, which probably results in its broad andhigh melting points.34 When heated, these two waxesmelt but do not become discolored. The carbon, hydro-gen, sulfur, and oxygen analyses of δD and δE waxesare given in Table 7b. The H/C ratio of asphaltenic-deposit waxes was lower than that of their parent crudewaxes. δD wax contains relatively lower heteroatomiccontent, whereas δE wax contained ∼1%-5% heteroa-
toms. Both asphaltenic-deposit waxes also showed ca.10% greater straight-chain methylene content thantheir parent crude waxes; this difference is considerablyless than the difference between waxy-deposit waxesand their crude waxes.
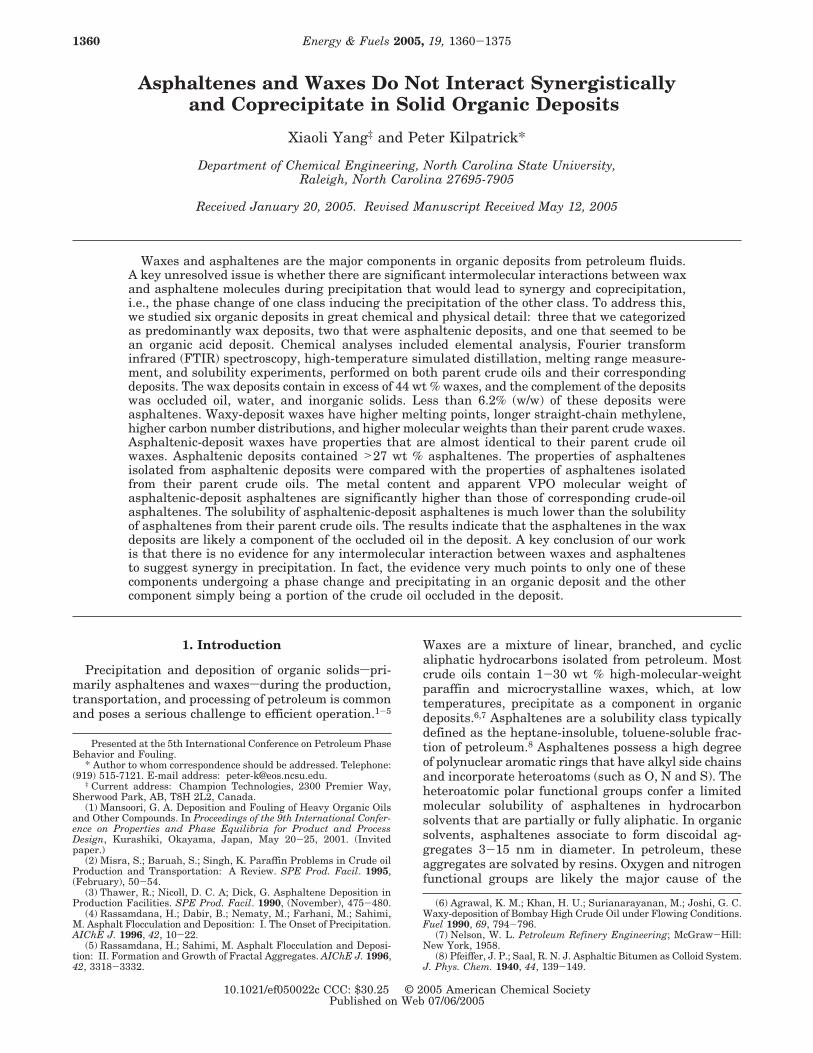
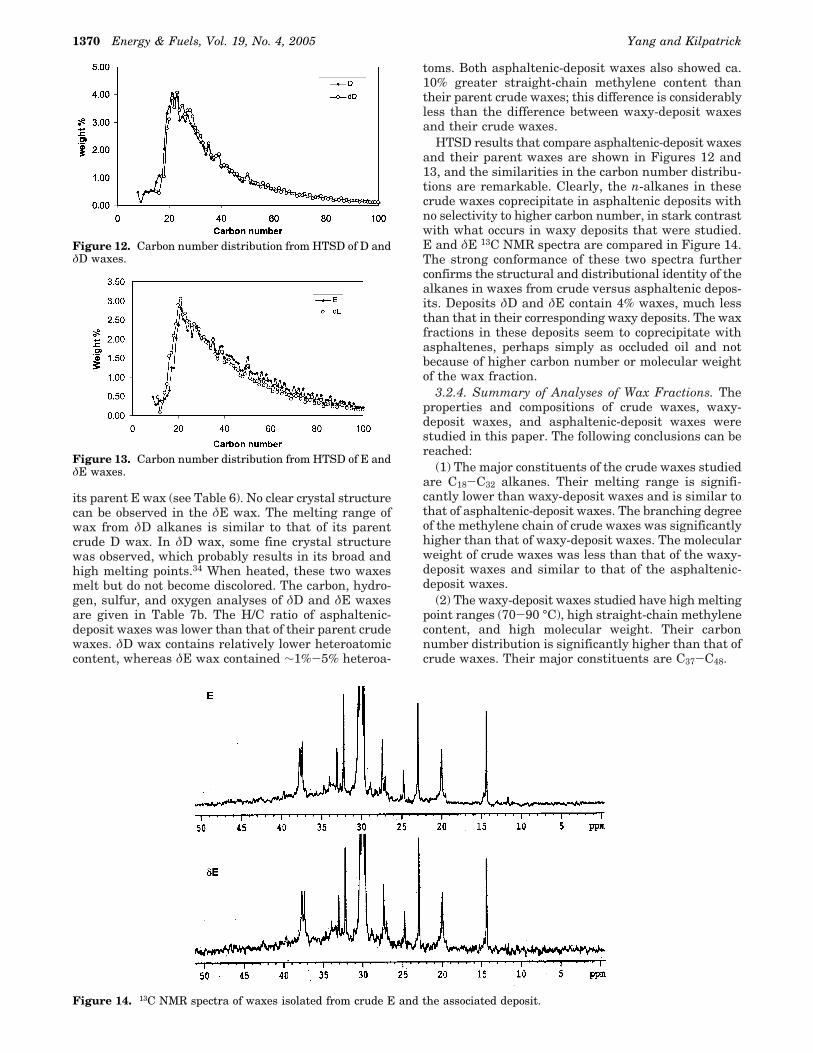
HTSD results that compare asphaltenic-deposit waxesand their parent waxes are shown in Figures 12 and13, and the similarities in the carbon number distribu-tions are remarkable. Clearly, the n-alkanes in thesecrude waxes coprecipitate in asphaltenic deposits withno selectivity to higher carbon number, in stark contrastwith what occurs in waxy deposits that were studied.E and δE 13C NMR spectra are compared in Figure 14.The strong conformance of these two spectra furtherconfirms the structural and distributional identity of thealkanes in waxes from crude versus asphaltenic depos-its. Deposits δD and δE contain 4% waxes, much lessthan that in their corresponding waxy deposits. The waxfractions in these deposits seem to coprecipitate withasphaltenes, perhaps simply as occluded oil and notbecause of higher carbon number or molecular weightof the wax fraction.
3.2.4. Summary of Analyses of Wax Fractions. Theproperties and compositions of crude waxes, waxy-deposit waxes, and asphaltenic-deposit waxes werestudied in this paper. The following conclusions can bereached:
(1) The major constituents of the crude waxes studiedare C18-C32 alkanes. Their melting range is signifi-cantly lower than waxy-deposit waxes and is similar tothat of asphaltenic-deposit waxes. The branching degreeof the methylene chain of crude waxes was significantlyhigher than that of waxy-deposit waxes. The molecularweight of crude waxes was less than that of the waxy-deposit waxes and similar to that of the asphaltenic-deposit waxes.
(2) The waxy-deposit waxes studied have high meltingpoint ranges (70-90 °C), high straight-chain methylenecontent, and high molecular weight. Their carbonnumber distribution is significantly higher than that ofcrude waxes. Their major constituents are C37-C48.
Figure 12. Carbon number distribution from HTSD of D andδD waxes.
Figure 13. Carbon number distribution from HTSD of E andδE waxes.
Figure 14. 13C NMR spectra of waxes isolated from crude E and the associated deposit.
1370 Energy & Fuels, Vol. 19, No. 4, 2005 Yang and Kilpatrick

(3) The asphaltenic-deposit waxes have melting pointranges and carbon number distributions similar to theirparent crude waxes. Asphaltenic-deposit waxes perhapsare one of the fractions in the occluded oil compositionsthat are simply coprecipitated with asphaltenes.
(4) With all wax fractions studied, the heteroatomcontent in waxes was related with the heteroatomcontent in the original crude oils. The H/C ratio of thewaxes shows a correlation with the amount of hetero-atom content in the waxes (Figure 15).
3.3. Asphaltene Fraction Analysis. It is widelyreported that asphaltene precipitation is closely relatedto asphaltene aggregation.1,4,5,8,18,45 The aggregation ofasphaltenes is typically attributed to their fused and
polynuclear aromatic character and to their polarfunctional groups, which impart their amphiphiliccharacter.9-11,13,36-38 Sulfur in asphaltenes exists pre-dominantly as thiophenic heterocycles (65%-85%) andsulfidic groups,46 which are only slightly polar and arenot likely to contribute to intermolecular associations.However, a small amount of sulfur speciates as sulfoxide
(45) Cimino, R.; Correra, S.; Bianco, A. D.; Lockhart, T. P. Solubilityand Phase Behavior of Asphaltenes in Hydrocarbon Media. In As-phaltenes: Fundamentals and Applications; Sheu, E. Y., Mullins, O.C., Eds.; Plenum Press: New York, 1995; p 97.
Table 10. Properties of Asphaltenes from Parent Crude Oils and Associated Deposit Asphaltenes (a) in Wax Depositsand (b) in Asphaltenic Deposits
property sample C sample δC sample D sample δD sample E sample δE
(a) Wax Depositsweight in sample (%) 13.29 6.12molecular weight (da) 2693 3367H/C ratio 1.26 1.37N/C ratio 0.024 0.021S/C ratio 0.021 0.019O/C ratio 0.024 0.023C (%) 81.98 81.41H (%) 8.60 9.3N (%) 2.30 2.03S (%) 4.54 4.07O (%) 2.64 2.48Ni (%) 0.047 0.077V (%) 0.072 0.11Fe (%) 0.034 0.081sum (%) 100.06 99.29appearance particles, shiny particles, dull
(b) Asphaltenic Depositsweight in sample (%) 0.50 55.71 6.49 27.41molecular weight (da) 1171 3673 2886 4253H/C 1.38 0.90 1.1 1.04N/C 0.007 0.017 0.020S/C 0.005 0.007 0.022 0.027O/C 0.015 0.022 0.013 0.019C (%) 84.97 87.82 83.31 81.50H (%) 9.75 6.55 7.64 7.025N (%) <0.5 0.72 1.65 1.87S (%) 1.2 1.73 4.85 5.98O (%) 1.7 2.57 1.4 2.01Ni (ppm) <60 84 0.034 0.043V (%) 0.016 0.032 0.36 0.47Fe (ppm)a <60 <129 <59 0.31%sum (%) 97.62 99.39 98.85 98.38appearance particles, some shiny particles, shiny particles, shiny particles, shiny
a Values expressed in units of parts per million (ppm), unless noted otherwise.
Figure 15. Sulfur and oxygen content in waxes from depositsas a function of the H/C ratio of the waxes. Figure 16. Nickel, vanadium, and iron content in asphaltenes
as a function of heteroatom content in asphaltenes.
Table 11. Weight Percentages of Aromatic Carbon andPolar Functional Groups of Asphaltenes in Crudes and
Deposits, Based on FTIR Analysis
Functional Groups (wt %)
sample C/H ratio O-H N-H CdO CdC
C 1.27 0.029 0.266 0.36 65.6δC 1.37 0.040 0.166 0.31 56.1D 1.38 0.009 0.099 0.07 45.2δD 0.91 0.036 0.108 0.20 81.0E 1.10 0.045 0.139 0.17 66.3δE 1.04 0.026 0.141 0.12 67.1
Asphaltenes and Waxes in Solid Organic Deposits Energy & Fuels, Vol. 19, No. 4, 2005 1371

and are strongly polar. Nitrogen in asphaltenes existsin pyrrolic, pyridinic, and quinolinic groups, whereasoxygen is present primarily in phenolic, carbonyl, car-boxylic, and ether. The oxygen- and nitrogen-containinggroups are believed to be those moieties primarilyresponsible for strong intermolecular associations throughhydrogen bonding. The precise structures and mecha-nisms associated with aggregation and precipitation inpetroleum has eluded petroleum researchers for manyyears.17-20,36-39
Six asphaltene samples were isolated from crude oilsand their respective deposits. Parts a and b in Table 10summarize the C, H, N, O, and S elemental analyses,heavy metal analyses, and molecular weight (deter-mined by VPO) of crude and deposit asphaltenes. δCasphaltenes were isolated from a waxy deposit, whereasδD and δE asphaltenes were isolated from asphaltenic
deposits. From Table 10a, it is found that the H/C ratioof δC asphaltenes was higher than the correspondingH/C of C asphaltenes, whereas the nitrogen, sulfur, andoxygen contents of δC asphaltenes were all lower thanthose of the parent asphaltenes. In contrast, the H/Cratio of δE asphaltenes was less than that of its parentasphaltenes, and the H/C ratio of δD asphaltene wasmuch lower than that of its corresponding crude as-phaltene, whereas all heteroatom contents were higherfor both asphaltenes. Thus, the waxy-deposit (δC)asphaltenes were more aliphatic and less polar thantheir corresponding crude asphaltenes, whereas theasphaltenic-deposit (δD, δE) asphaltenes were more
(46) Mullins, O. C. Sulfur and Nitrogen Molecular Structures inAsphaltenes and Related Materials Quantified by XANES Spectros-copy. In Asphaltene: Fundamentals and Applications; Sheu, E. Y.,Mullins, O. C., Eds.; Plenum Press: New York, 1995; pp 53-96.
Table 12. Apparent FTIR Integrated Absorption Intensities of Selected Functional Groups from Model Compoundsa
compound group typefrequency
(cm-1)absorption intensity,
ε (L mol-1 cm-1)
O-H Functional Group1-naphthol phenol 3580 13200di-tert-butylphenol phenol 3580 16700
N-H Functional Groupcarbazole pyrrole 3462 11900
CdO Functional Groupcyclohexaneacetic acid carboxyl (sym + asym) 1707, 1750 26900cyclohexanecarboxylic acid carboxyl (sym + asym) 1704, 1750 27900
Aromatic CdC Functional Groupbenzoic acid carboxyl carboxyl 1600 800benzoyl BA 1600 800
a From ref 47.
Figure 17. Fourier transform infrared (FTIR) spectrum of asphaltenes isolated from crude oil D.
1372 Energy & Fuels, Vol. 19, No. 4, 2005 Yang and Kilpatrick

aromatic and polar than their crude asphaltenes. Themetal contents both in waxy-deposit (δC) asphaltenesand in asphaltenic-deposit (δD and δE) asphalteneswere greater than those in their original crude asphalt-enes. Figure 16 shows that metal contents in asphalt-enes correlate well with their heteroatom contents.Finally, VPO data in chlorobenzene indicated thatasphaltenic-deposit asphaltenes possess 1.5-3 timeshigher apparent molecular weights than their respectivecrude asphaltenes. Compared with asphaltenic-depositasphaltene, waxy-deposit asphaltene (δC) has an ap-parent molecular weight that is 1.2 times greater thanits parent asphaltene.
Apparent functional group concentrations for theasphaltene fractions from FTIR analysis are given inTable 11. The weight percentages of these functionalgroups were obtained from apparent integrated molarabsorptivities (ε) of these functional groups in modelcompounds47 (see Table 12). The FTIR spectra of D andδD asphaltenes are shown in Figures 17 and 18,respectively. The concentrations of aromatic carbon(1600 cm-1), carboxyl (1690 cm-1), and phenolic OH(3600 cm-1) groups in δD asphaltene are all clearlygreater than those in the parent D asphaltenes. This isreflected in Table 11, where the carboxyl concentrationis 3 times higher, and the phenolic OH concentration is4 times higher, in δD asphaltenes, compared to itsparent crude D asphaltenes. All of these functionalgroups are strongly hydrogen bound, and it seemsplausible that hydrogen-bond interactions may driveaggregation and precipitation, producing an asphaltenicdeposit that is much richer in these functional groups.
The remaining oxygen in both δD and D likely speciatesas ether oxygen, possibly reflected in the absorbance at1010 cm-1, which is relatively nonpolar, compared tothe groups discussed previously. With crude E and itscorresponding deposit δE, the concentrations of polargroups were not significantly different. Noting that thisasphaltenic deposit (δE) had a different appearancethan δD, one wonders if, based on the chemical infor-mation, the mechanism of precipitation and depositionmay be somewhat different.
Asphaltene solubility in T/H mixtures was determinedby UV-visible spectra. Typical UV-visible spectra ofasphaltenes are shown in Figure 19. There is a notice-able absorbance peak near 408 nm, and this Soret bandis attributed to metalloporphyrin.48 To minimize theinfluence of the UV absorbance of toluene, the molarabsorptivity at 450 nm was chosen to determine theconcentration of asphaltenes solutions.49 Table 13 pre-
(47) McLean, J. D.; Kilpatrick, P. K. Comparison of Precipitationand Extrography in the Fractionation of Crude Oil Residua. EnergyFuels 1997, 11 (3), 570-585. (48) Sugihara, J. M.; Bean, R. M. J. Chem. Eng. Data 1962, 7, 269.
Figure 18. FTIR spectrum of asphaltenes isolated from deposit δD.
Figure 19. UV absorbance versus wavelength of asphaltenesisolated from crude oil C and dissolved in toluene as functionof concentration.
Asphaltenes and Waxes in Solid Organic Deposits Energy & Fuels, Vol. 19, No. 4, 2005 1373

sents the formulas and coefficients of the calibrationcurves for crude and deposit asphaltenes. The UV-visible absorbance of diluted asphaltene-toluene solu-tions are well described by the Beer-Lambert law. Thelinear correlation coefficients of these calibrations were>0.993 (with the exception of a value of 0.97 in the caseof δD), thus providing an accurate method to quantifythe concentrations of asphaltenes in toluene. Saturatedsolutions of asphaltenes dissolved in T/H mixtures wereprepared, filtered, and then diluted into the Beer’s lawregion. The asphaltene concentrations of these saturatedsolutions were then obtained according to a calibrationcurve. Table 14 summarizes the solubility results forcrude and deposit asphaltenes. Comparing three as-phaltenes (δC, δD, and δE), the solubility of waxy-deposit asphaltene (δC) was higher than the solubilityof asphaltenic-deposit asphaltenes δD and δE. The
solubility of all deposit asphaltenes was much lowerthan the solubility of their respective crude asphaltenesin T/H mixtures. Deposit δD showed very low solubilityin T/H mixture, presumably because of its high aroma-ticity and high polarity, resulting in strong associationand aggregation. Lower solubilities of δC and δE as-phaltenes, as compared to their respective crude as-phaltenes, also demonstrate that these deposit asphalt-enes possess a stronger tendency toward association/aggregation than their respective crude asphaltenes.This suggests that deposit asphaltenes cannot easilyredissolve in solvents or crude oil, because of the sizeof aggregates and particles resulting from the precipita-tion from crude oils.
According to the aforementioned results, we concludethe following in this study:
Table 13. Beer-Lambert Calibration of Ultraviolet (UV) Spectra for Crude-Oil and Deposit Asphaltenes
sample factioncorrelation
coefficient, R2 slope resource
C Y ) 50.635x - 0.0048 0.9979 50.635 crudeδC Y ) 64.799x - 0.0198 0.9959 64.799 wax depositD Y ) 85.563x - 0.0014 0.9933 85.563 crudeδD Y ) 73.416x - 0.017 0.9799 73.416 asphaltenic depositE Y ) 92.016x - 0.0114 0.9947 92.016 crudeδE Y ) 46.185x - 0.0181 0.9978 46.185 asphaltenic deposit
Table 14. Solubility of Asphaltenes inToluene-n-Heptane Mixtures
Solubility (%)
sample70%
toluene60%
toluene50%
toluene40%
toluene30%
toluene
C 10.71 3.04 1.62 0.60 0.27δC 4.00 1.99 0.83 0.40 0.06D 10.88 7.68 4.61 2.93 0.79δD 0.17 0.11 0.07 0.04 0.01E 10.14 3.06 1.69 0.72 0.32δE 1.86 1.52 0.65 0.11 0.02
Figure 20. FTIR spectrum of deposit isolated from deposit δF.
Table 15. Elemental Analysis of Fractions Isolated fromDeposit δF
fraction heptane dissolved methylene chloride
C (%) 67.94 64.79H (%) 10.41 9.63N (%) 2.66 2.8S (%) 2.84 0.31O (%) 16.12 19.77H/C ratio 1.84 1.78N/C ratio 0.033 0.037S/C ratio 0.015 0.001O/C ratio 0.178 0.229appearance dark orange liquid dark stick solid
1374 Energy & Fuels, Vol. 19, No. 4, 2005 Yang and Kilpatrick

(1) Asphaltenic-deposit asphaltenes have a lower H/Cratio and higher aromaticity than their respective crudeasphaltenes.
(2) Deposit asphaltenes showed higher molecularweights, which are indicative of larger aggregate sizesin chlorotoluene, than their parent crude asphaltenes.
(3) Deposit asphaltenes have lower solubility in T/Hmixtures than their respective parent crude asphalt-enes.
(4) Some properties of waxy-deposit asphaltenes showdifferent trends than asphaltenic-deposit asphaltenes.This difference perhaps implies that asphaltenes iso-lated from the waxy deposit also as occluded oil copre-cipitated with the waxy deposit, although they haverelative higher molecular weight or lower solubility.
3.4. Properties and Composition of Deposit δF.In the crude and deposit samples collected, δF was avery unusual deposit that was obtained from a pipelinepigging. Its elemental analysis yielded a higher H/Cratio (2.05) and higher oxygen content of 19.66% (seeTable 2), compared to those of other deposits (Table 15).Approximately 63 wt % of the constituents in δF couldnot be dissolved in hot heptane in a Soxhlet extractor(Table 4); however, they did subsequently dissolve inmethylene chloride. Unlike higher-molecular-weightwaxes discussed previously, these results demonstratethat the fraction dissolved in methylene chloride is notasphaltenic, because of its high H/C ratio (1.78). Theheptane-soluble fraction also contained 16.12% oxygen.Figure 20 presents the FTIR spectrum of the fractionin δF, which did not dissolve in hot heptane. The largecarbonyl absorption at 1702 cm-1 and the phenolic peakat 3450 cm-1 were integrated to give 0.40% OH and2.88% CdO, the highest such values in all of thefractions isolated from either crudes or deposits. All thevalues may be somewhat low, because of the large valueof the integrated molar absorbance intensity utilized forphenolic and carboxyl moieties; values obtained fromfused aromatic ring carboxylic functional groups maybe lower and yield a truer measure of the acid andphenol content in these samples. These results indicatethat the majority fraction in δF contains a significantamount of carboxylic acid and aliphatic acid, which isdifferent from that observed for waxy-deposit waxes andasphaltenic-deposit waxes.
4. ConclusionIn this study, we have carefully analyzed the chemical
compositions and molecular properties of five crude oils
and their corresponding deposits, to discern the natureof the deposition process and determine whether thereis evidence of coprecipitation of (or synergy between)paraffin waxes and asphaltenes. Three of the depositssthose from crudes A, B, and Cswere clearly paraffinwax deposits. The evidence clearly indicates that theprecipitation and deposit was induced by the phaseseparation of a wax component that is more paraffinicand has a higher average carbon number than that ofthe parent crude oil wax. This was verified in a varietyof chemical and physical ways, including elementalanalysis, high-temperature simulated distillation (HTSD),polarizing microscopy, and Fourier transform infrared(FTIR) spectroscopy. The remaining components inthese wax depositssentrained oil, asphaltenes, andsome minor amount of inorganic solidssseemed to havethe same chemical composition and molecular distribu-tion of these same components in the parent crude oil,i.e., there is no evidence for synergy in precipitation.Similarly, the other two organic deposits studiedsthosefrom crudes D and Eswere clearly asphaltenic deposits.There was clear evidence that the asphaltenes isolatedfrom these deposits had a much lower solubility inmixtures of toluene and heptane than the correspondingasphaltenes from the parent crude oils, indicating thatthe mechanism of deposition was related to a phaseseparation of these more sparingly soluble fractions ofthe original asphaltenes. Detailed chemical and physicalanalyses suggested that the origins of these decreasedsolubilities were some combination of increased aroma-ticity and polarity of these fractions. A sixth depositstudied was quite unusual and seemed to be a naph-thenic acid deposit (sample δF). In summary, asphalt-enes and waxes do not interact synergistically andcoprecipitate in solid organic deposits.
Acknowledgment. This work was supported by acontract from Shell International Exploration and Pro-duction Technology and Research Company. We expressour appreciation to Dr. Nick Fuex, Dr. Matthew Flan-nery, Dr. Sheila Dubey, Dr. Artur Stankiewicz, and Dr.George Broze for providing many good suggestions andassisting with much of the data generation. We alsothank Dr. Hanna Gracz for her assistance in performingthe 13C and 1H NMR spectroscopy measurements, andwe thank our two undergraduate researchers BojanProkic and Karen Lu, who contributed to this study.
EF050022C(49) Yang, X. L.; Hamza, H.; Czarnecki, J. Energy Fuels 2004, 18,
770-777.
Asphaltenes and Waxes in Solid Organic Deposits Energy & Fuels, Vol. 19, No. 4, 2005 1375