
Modular Instrumentation for Controlling and Monitoring In-Vitro ...
150
Citation Kattipparambil Rajan, Dhanesh (2020). Modular Instrumentation for Controlling and Monitoring In-Vitro Cultivation Environment and Image-based Functionality Measurements of Human Stem Cells. (Tampere University. Publication; Vol. 256). Doctor of Science (Technology) thesis, Faculty of Medicine and Health Technology, Tampere University, Finland. Direct download link https://trepo.tuni.fi/handle/10024/121636
-
Upload
khangminh22 -
Category
Documents
-
view
2 -
download
0
Transcript of Modular Instrumentation for Controlling and Monitoring In-Vitro ...

Citation Kattipparambil Rajan, Dhanesh (2020). Modular Instrumentation for Controlling and Monitoring In-Vitro Cultivation Environment and Image-based Functionality Measurements of Human Stem Cells. (Tampere University. Publication; Vol. 256). Doctor of Science (Technology) thesis, Faculty of Medicine and Health Technology, Tampere University, Finland. Direct download link https://trepo.tuni.fi/handle/10024/121636

Tampere University Dissertations 256
DHANESH KATTIPPARAMBIL RAJAN
Modular Instrumentation for Controlling and Monitoring In-Vitro Cultivation Environment and
Image-based Functionality Measurements of Human Stem Cells
ACADEMIC DISSERTATION To be presented, with the permission of
the Faculty of Medicine and Health Technology of Tampere University,
for public defence at Tampere University, on 27 May 2020, at 12 o’clock.

ACADEMIC DISSERTATION Tampere University, BioMediTech, Faculty of Medicine and Health Technology Finland
Responsible supervisor and Custos
Professor Dr. Jukka Lekkala Faculty of Medicine and Health Technology Tampere University Finland
Pre-examiners Professor Dr. Gabriel J G Martins Advanced Imaging Facility University of Lisbon Portugal
Professor Dr. Tapio Fabritius Electronics and Communications Engineering University of Oulu Finland
Opponent Professor Dr. Heinzle Elmar Department of Biochemical Engineering Saarland University Germany
The originality of this thesis has been checked using the Turnitin OriginalityCheck service.
Copyright ©2020 author
Cover design: Roihu Inc.
ISBN 978-952-03-1568-9 (print) ISBN 978-952-03-1569-6 (pdf) ISSN 2489-9860 (print) ISSN 2490-0028 (pdf) http://urn.fi/URN:ISBN:978-952-03-1569-6
PunaMusta Oy – Yliopistopaino Tampere 2020
i
PREFACE
This thesis embodies application of engineering expertise with cell biology research.
I am extremely grateful to my supervisor Professor Dr. Jukka Lekkala for his
guidance and endless support. I still cherish the day I joined his ‘Sensor Technology
and Biomeasurements group’ several years ago which was a turning point in my life.
I am very thankful for the unwavering support and opportunities I got during these
years at the BioMediTech - Institute of Biosciences and Medical Technology and the
Faculty of Medicine and Health Technology, Tampere University, and its
predecessor, Department of Automation Science and Engineering, at Tampere
University of Technology. I would also like to thank ‘Business Finland’ (former
TEKES), for funding the Human Spare Parts 1, 2 and Academy of Finland for
funding the ‘Centre-of-excellence Body on chip’ projects all of which I have worked
in. This multidisciplinary research could not have been completed without the
efficient cooperation with our biology collaborators. I acknowledge the efforts of
Katriina Aalto-Setälä (Group leader, Physiology, Heart Group, Heart Hospital,
Tampere University Hospital) and Susanna Miettinen (Group leader, Regenerative
Medicine and Adult Stem Cell Group) for organising the projects where I was
allowed to carry out the research. I am extremely thankful to my thesis pre-examiners
Professor Dr. Gabriel J G Martins, Instituto Gulbenkian de Ciencia, University of
Lisbon and Professor Dr. Tapio Fabritius, Electronics and Communications
Engineering, University of Oulu, whose positive feedback and valuable comments
enabled me to modify the thesis efficiently. I would also like to thank Dr. Heinzle
Elmar, Senior Professor of Biochemical Engineering at the Saarland University,
Germany for accepting the request to act as an opponent in the public examination
of my thesis
I am indebted to Professor Dr. Pasi Kallio for providing me continual
opportunities, freedom and guidance for completing the thesis. I want to express my
sincere gratitude to Heimo Ihalainen who every so often guided me with
encouragements and thought provoking arguments. Many times this has challenged
me to push myself to explore new areas. I specially thank Jarmo Verho and Joose
Kreutzer for their contributions to the thesis. I am grateful to Hannu Välimäki for
ii
his strong collaboration, and also to all the co-authors of my publications. Special
acknowledgements are due to Jouni Niemelä for his huge assistance in system
assemblies, and Timo Peltola for his continuous IT support.
I have no words to express the gratitude for the amazing relationship I have with
Heikki Jokinen, the interesting conversations we have, the times we share and above
all the acceptance I got into his big-hearted family. I also want to thank Markus
Karjalainen for his warm friendship, helpfulness and our various travels together and
Professor Dr. Jouko Halttunen for his support in the early years of my research. In
addition, I am so thankful to my wonderful wife Aveline Meyn for her unconditional
support, encouragements and love throughout this journey. My uncle Mohanan PV
has played an instrumental role in my life and I am extremely grateful for his
companionship. I am blessed to have had great friends and well-wishers throughout
my life and would like to extend special thanks to Sudeep, Santhosh, Mathew,
Melbin, Bobin, Rahul and Pertti for all the fun times together. I would like to thank
my parents, sister and Sobha chitta for their spiritual assistance, all my teachers
especially Elisua Benedict and Jessy Sajan for their blessings and last but not the least
everyone else in the department for all the support, discussions, banters and
conversations that at times inspired me to think out of the box.
Dhanesh Rajan,
17.04.2020, Tampere

iii
ABSTRACT
Artificial animal cell culture was successfully developed by Ross Harrison in 1907.
But it was not until the 1940’s and 1950’s that several developments occurred, which
expedited the cell culturing in-vitro (C-Vitro) to be a consistent and reproducible
technique to study isolated living-cells in a controlled environment. Currently, C-
Vitro is one of the major tools in cellular and molecular biology both in the academia
and industry. They are extensively utilised to study the cellular
physiology/biochemistry, to screen drugs/therapeutic compounds, to understand
the effects of drugs/toxic compounds and also to identify the pathways of
carcinogenesis/mutagenesis. It is also used in large scale manufacturing of vaccines
and therapeutic proteins. In any experimental setup, it is important that the C-Vitro
model should represent the physiological phenomena of interest with reasonable
accuracy so that all experimental results are statistically consistent and reproducible.
In this direction, sensors and measurement systems play important roles in in-situ
detection and/or control/manipulation of cells/tissues/environment. This thesis
aimed to develop new technology for tailored cell culturing and integrated
measurements. Firstly, design and assembly of a portable Invert-upright microscope
interchangeable modular cell culturing platform (iuCMP) was envisioned. In contrast
to conventional methods, micro-scaled systems mimic the cells' natural
microenvironment more precisely, facilitating accurate and tractable models. The
iuCMP integrates modular measurement schemes with a mini culture chamber using
biocompatible cell-friendly materials, automated environment-control (temperature
and gas concentrations), oxygen sensing and simultaneous functional measurements
(electrophysiological and image-based). Time lapse microscopy is very useful in cell
biology, but integration of advanced in-vitro/device based biological systems (e.g.
lab/organ/body-on-chips, or mini-bioreactors/microfluidic systems) into
conventional microscopes can be challenging in several circumstances due to
multiple reasons. But in iuCMP the main advantage is, the microscope can be
switched either as an inverted or as an upright system and therefore can
accommodate virtually any in-vitro device. It can capture images from regions that
are otherwise inaccessible by conventional microscopes, for example, cells cultured
on physical or biochemical sensor systems. The modular design also allows
iv
accommodating more sensor or measurement systems quite freely. We have
demonstrated the system for video-based beating analysis of cardiomyocytes, cell
orientation analysis on nanocellulose, and simultaneous long-term in-situ microscopy
with oxygen and temperature sensing in hypoxia.
In an example application, the system was utilised for long-term temperature
stressing and simultaneous mechanobiological analysis of human induced
pluripotent stem cell-derived cardiomyocytes (hiPSC-CMs). For this the iuCMP
together with a temperature sensor plate (TSP) and a novel non-invasive beating
analysis software (CMaN—cardiomyocyte function analysis tool, scripted as a sub-
part of this thesis), was applied for automated temperature response studies in
hiPSC-CM cultures. In-situ temperature sensing is usually challenging with bulky
external sensors, but TSPs solved this issue. In the temperature response study, we
showed that the relationship between hiPSC-CM beating frequency and temperature
is non-linear and measured the Q10 temperature coefficients. Moreover, we observed
the hiPSC-CM contractile networking, including propagation of the action potential
signal between dissociated clusters and their non-invasive measurements. It was the
first case where these events were reported in hiPSC-CM clusters and their non-
invasive measurements by image processing.
The software CMaN comes with a user-friendly interface and, is equipped with
features for batch processing, movement centre detection and cluster finding. It can
extract six different signals of the contractile motion of cardiomyocytes (clusters or
single cells) per processing. This ensures a minimum of one useful beating signal
even in the cases of complex beating videos. On the processing end, compared to
similar tools, CMaN is faster, more sensitive, and computationally less expensive and
allows ROI based processing. In the case of healthy cells, the waveform of the signal
from the CMaN resembles an ECG signal with positive and negative segments,
allowing the computation of contraction and relaxation features separately.
In addition to iuCMP, a Modular optical pH measurement system (MO-pH) for
24/7 non-contact cell culture measurements was also developed. The MO-pH
incorporates modular sterilisable optical parts and is used in phenol-red medium cell
cultures. The modular assembly of MO-pH cassettes is unique and reusable.
Measurements are carried out in a closed flow system without wasting any culture
medium and requires no special manual attention or recalibrations during culture.
Furthermore, a new absorption correction model was put forward that minimised
errors caused e.g. by biolayers in spectrometric pH measurement, which improved
the pH measurement accuracy. MO-pH has been applied in long-term human
adipose stem cells (hASC) expansion cultures in CO2 dependent and independent
v
media. Additionally, the MO-pH was also utilised to comprehend the behaviour of
pH, temperature and humidity in water jacked incubators as well as to record the pH
response as a function of temperature in the presence and absence of CO2 in the
context of stem cell cultures. The resulting plots clearly showed the interplay
between measured parameters indicating a few stress sources present all through the
culture. Additionally, it provided an overall picture of behaviour of critical control
parameters in an incubator and pointed out the need for bioprocess systems with
automatic process monitoring and smart control for maximum yield, optimal growth
and maintenance of the cells. Besides, we also integrated MO-pH into flasks with re-
closable lids (RL-F) and tested its applicability in stem cell cultures. A standalone
system around an RL-F flask was built by combining the cell culture, medium
perfusion and optical measurements. The developed RL-F system has been
successfully tested in ASC-differentiation cultures.
Finally, a few trial experiments for image-based pH estimation aimed for iuCMP
have also been carried out. This includes tests with LCD illumination, optical
projection tomography, and webcam systems. In reality, the pH is not distributed
uniformly in tissues, and has shown a gradient of up to 1.0 pH unit within 1 cm
distance. Therefore, producing reliable pH maps also in in-vitro can be important in
understanding various common pathologies and location of lesions. A reliable and
adequately developed long-term pH mapping method will be an important addition
into the iuCMP.

vi
vii
CONTENTS
Preface ...........................................................................................................................................i
Abstract ....................................................................................................................................... iii
Contents ..................................................................................................................................... vii
Abbreviations ............................................................................................................................. ix
Symbols ...................................................................................................................................... xi
Original publications ............................................................................................................... xiii
The author’s role in the publications and the manuscript ................................................ xiv
1. Introduction........................................................................................................................ 1
1.1. Motivation ................................................................................................................... 1
1.2. Objectives and Research Questions ........................................................................ 4
1.3. Thesis Organisation .................................................................................................. 5
2. Background........................................................................................................................ 6
2.1. Cell Culturing In-vitro and In-situ Imaging ................................................................ 6
2.2. Invert-Upright Interchangeable System for In-vitro Studies .................................... 9
2.3. Video-Based Cardiomyocyte Non-invasive Contractile Function Analysis .......... 10
2.4. Cardiomyocytes and Temperature ......................................................................... 11
2.5. Cell Culturing Environment and pH Measurement ................................................ 12
2.6. Spectroscopic pH Measurements .......................................................................... 13
3. Portable system for controlling and monitoring in-vitro cultivation environment
and image-based functionality measurements ................................................................... 15
3.1. Optical Simulations and 3D Design. ....................................................................... 17
3.2. Digital Imaging Schemes with Programmable Magnifications .............................. 21
3.3. Invert-upright Interchangeable Modular System.................................................... 22
3.4. Results and Discussion ........................................................................................... 25
3.4.1. CMaN - A New Software for Cardiomyocyte Non-invasive Function Analysis 26
3.4.1.1. Optical Flow and Affine Optical Flow ....................................................... 26
viii
3.4.1.2. Movement Centre Detection and Cluster Finding ................................... 32
3.4.2. Response of hiPSC-CM to Temperature Stimuli .............................................. 38
3.4.3. Oxygen Sensing in In-vitro Cell Models ............................................................ 40
3.4.4. Real-Time Closed-Loop Control of hiPSC-CM Beating Frequency................. 42
3.4.5. Orientation of Fibroblasts on Nano Cellulose Surface ..................................... 43
4. Non-contact optical pH measurement system with sterilisable, modular parts .. 45
4.1. Two Colour pH Measurement System. Working Principle and Hardware
Assembly ................................................................................................................................ 45
4.2. Temperature Compensation, Calibration and Humidity Monitoring ..................... 48
4.3. Absorption Correction Model .................................................................................. 49
4.4. Results and Discussion ........................................................................................... 52
4.4.1. System Calibration and Real Time pH Measurements .................................... 52
4.4.2. Re-closable Lid System ..................................................................................... 55
4.5. Discussion on Spectroscopic pH Measurements .................................................. 57
4.6. Image Based pH Estimation: Experimental Trials ................................................. 58
4.6.1. Measurements with Liquid Crystal Display (LCD) Illumination, Optical
Projection Tomography (OPT) and Webcam Arrangement ........................................... 58
4.6.2. Discussion on Image-Based pH Measurements .............................................. 62
5. Conclusions ..................................................................................................................... 65
5.1. Main Results ............................................................................................................ 65
5.2. Answering the Research Questions ....................................................................... 66
5.3. Limitations of the Study ........................................................................................... 70
References ................................................................................................................................. 72
Publications ............................................................................................................................... 87
ix
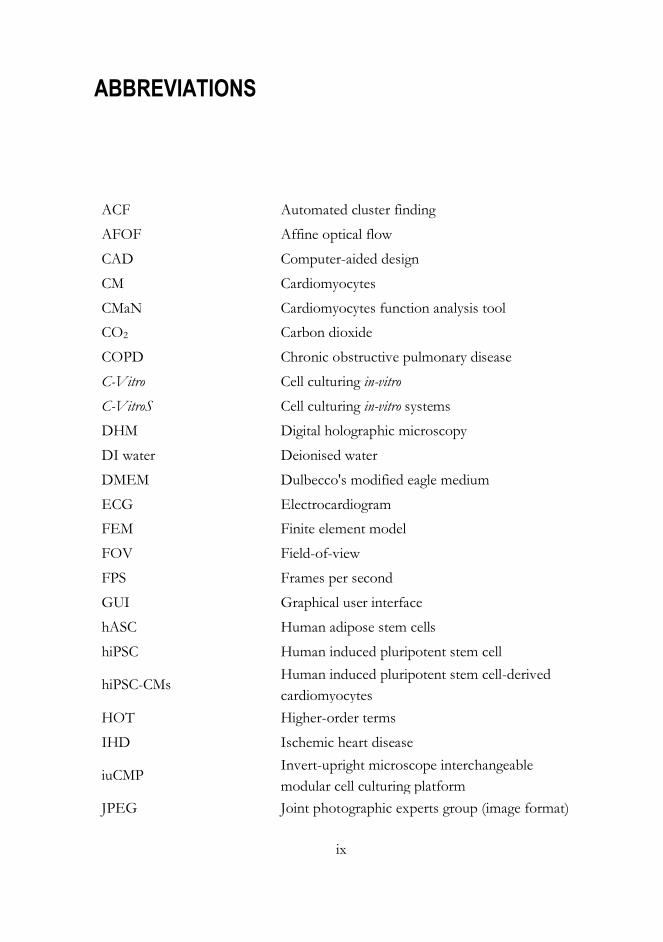
ABBREVIATIONS
ACF Automated cluster finding
AFOF Affine optical flow
CAD Computer-aided design
CM Cardiomyocytes
CMaN Cardiomyocytes function analysis tool
CO2 Carbon dioxide
COPD Chronic obstructive pulmonary disease
C-Vitro Cell culturing in-vitro
C-VitroS Cell culturing in-vitro systems
DHM Digital holographic microscopy
DI water Deionised water
DMEM Dulbecco's modified eagle medium
ECG Electrocardiogram
FEM Finite element model
FOV Field-of-view
FPS Frames per second
GUI Graphical user interface
hASC Human adipose stem cells
hiPSC Human induced pluripotent stem cell
hiPSC-CMs Human induced pluripotent stem cell-derived
cardiomyocytes
HOT Higher-order terms
IHD Ischemic heart disease
iuCMP Invert-upright microscope interchangeable
modular cell culturing platform
JPEG Joint photographic experts group (image format)
x
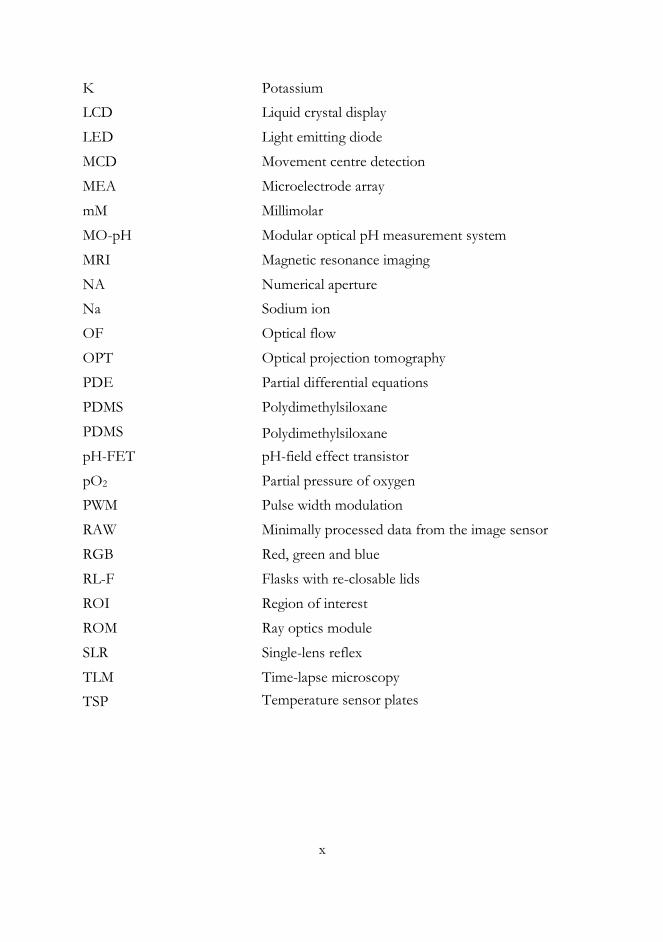
K Potassium
LCD Liquid crystal display
LED Light emitting diode
MCD Movement centre detection
MEA Microelectrode array
mM Millimolar
MO-pH Modular optical pH measurement system
MRI Magnetic resonance imaging
NA Numerical aperture
Na Sodium ion
OF Optical flow
OPT Optical projection tomography
PDE Partial differential equations
PDMS Polydimethylsiloxane
PDMS Polydimethylsiloxane
pH-FET pH-field effect transistor
pO2 Partial pressure of oxygen
PWM Pulse width modulation
RAW Minimally processed data from the image sensor
RGB Red, green and blue
RL-F Flasks with re-closable lids
ROI Region of interest
ROM Ray optics module
SLR Single-lens reflex
TLM Time-lapse microscopy
TSP Temperature sensor plates
xi
SYMBOLS
a Translation constant along x axis
𝐴430 Absorption at 430 nm
𝐴560 Absorption at 560 nm
𝐴𝑚𝑥 Phenol red maximum absorption at 560 nm
𝐴𝑑𝑚545 Fouling layer absorption at 545 nm
𝐴𝑑𝑚680 Fouling layer absorption at 680 nm
𝐴𝑖𝑛𝑑𝑖𝑐𝑎𝑡𝑜𝑟545 Phenol red absorption at 545 nm
𝐴𝑖𝑛𝑑𝑖𝑐𝑎𝑡𝑜𝑟680 Phenol red absorption at 680 nm
𝐴𝑡𝑜𝑡𝑎𝑙 Total absorption
𝐴𝑡𝑜𝑡𝑎𝑙545 Total absorption at 545 nm
𝐴𝑡𝑜𝑡𝑎𝑙680 Total absorption at 680 nm
b Translation constant along y axis
𝑏𝑥 Path length
CAS Chemical abstracts service number
𝐶19𝐻14𝑂5𝑆 Phenol red chemical formula
𝐶𝑡 Total sum of phenol red concentration in acidic and alkaline form
dm Fouling layer concentration
𝜀𝐻𝐼𝑛 Molar absorptivity of phenol red in acid form
𝜀𝐼𝑛 Molar absorptivity of phenol red in alkaline form
𝜀545 Fouling layer molar absorptivity at 545 nm
𝜀680 Fouling layer molar absorptivity at 680 nm
GR model Absorption compensation model
𝐻𝐼𝑛 Phenol red in acidic form
xii
In- Phenol red in alkaline form
𝐼𝑥 Intensity x derivative
𝐼𝑦 Intensity y derivative
𝐼𝑡 Intensity temporal derivative
𝐼(𝑥, 𝑦, 𝑡) Pixel intensity at location (x,y) at time t
𝑘545 Light loss constant for the fouling layer at 545 nm
𝑘680 Light loss constant for the fouling layer at 680 nm
𝑚𝑥 Scaling constant along x axis
𝑚𝑦 Scaling constant along y axis
pH Measure of hydrogen ion concentration
𝑝𝐾𝑎𝐼𝑛 Dissociation constant
𝑝𝐾𝑎𝑇𝐼𝑛 Dissociation constant at temperature T
𝑄10 Temperature coefficient
𝑠1 Shear constant along x axis
𝑠2 Shear constant along y axis
𝑡545 Fouling layer optical thickness at 545 nm
𝑡680 Fouling layer optical thickness at 680 nm
∆𝑡 Time difference
T Temperature
t Time
𝑉𝑥 Optical flow along x axis
𝑉𝑦 Optical flow along y axis
∆𝑥 Displacement along x axis
∆𝑦 Displacement along y axis
θ Angle of rotation about the x axis
xiii
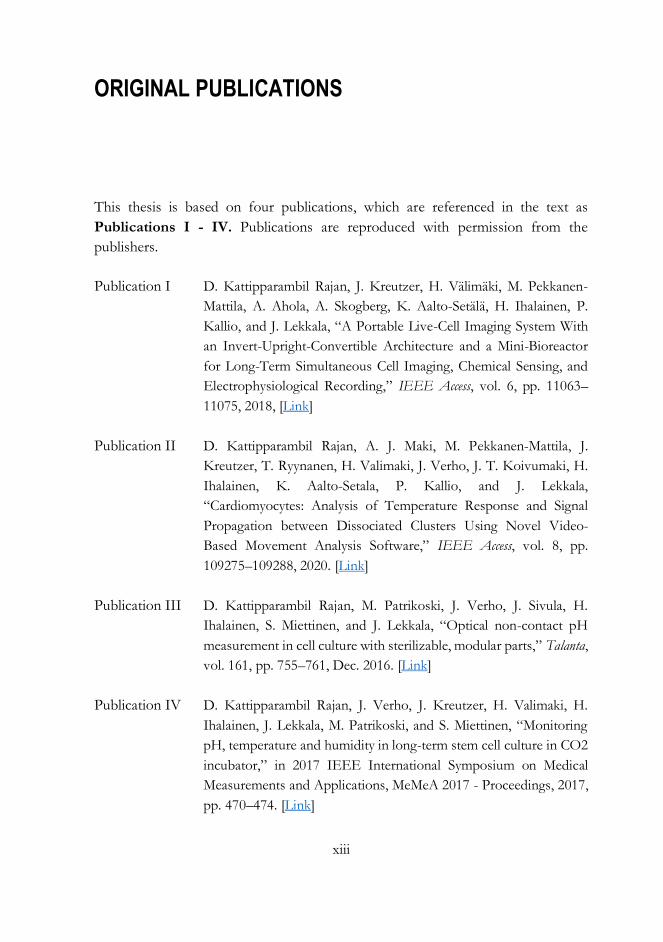
ORIGINAL PUBLICATIONS
This thesis is based on four publications, which are referenced in the text as
Publications I - IV. Publications are reproduced with permission from the
publishers.
Publication I D. Kattipparambil Rajan, J. Kreutzer, H. Välimäki, M. Pekkanen-
Mattila, A. Ahola, A. Skogberg, K. Aalto-Setälä, H. Ihalainen, P.
Kallio, and J. Lekkala, “A Portable Live-Cell Imaging System With
an Invert-Upright-Convertible Architecture and a Mini-Bioreactor
for Long-Term Simultaneous Cell Imaging, Chemical Sensing, and
Electrophysiological Recording,” IEEE Access, vol. 6, pp. 11063–
11075, 2018, [Link]
Publication II D. Kattipparambil Rajan, A. J. Maki, M. Pekkanen-Mattila, J.
Kreutzer, T. Ryynanen, H. Valimaki, J. Verho, J. T. Koivumaki, H.
Ihalainen, K. Aalto-Setala, P. Kallio, and J. Lekkala,
“Cardiomyocytes: Analysis of Temperature Response and Signal
Propagation between Dissociated Clusters Using Novel Video-
Based Movement Analysis Software,” IEEE Access, vol. 8, pp.
109275–109288, 2020. [Link]
Publication III D. Kattipparambil Rajan, M. Patrikoski, J. Verho, J. Sivula, H.
Ihalainen, S. Miettinen, and J. Lekkala, “Optical non-contact pH
measurement in cell culture with sterilizable, modular parts,” Talanta,
vol. 161, pp. 755–761, Dec. 2016. [Link]
Publication IV D. Kattipparambil Rajan, J. Verho, J. Kreutzer, H. Valimaki, H.
Ihalainen, J. Lekkala, M. Patrikoski, and S. Miettinen, “Monitoring
pH, temperature and humidity in long-term stem cell culture in CO2
incubator,” in 2017 IEEE International Symposium on Medical
Measurements and Applications, MeMeA 2017 - Proceedings, 2017,
pp. 470–474. [Link]
xiv
THE AUTHOR’S ROLE IN THE PUBLICATIONS AND THE MANUSCRIPT
The author of this thesis is the main author in all the listed publications.
Furthermore, the author drafted major parts in each publication. Jukka Lekkala
contributed as the supervising author in all the publications. Katriina Aalto-Setälä,
Susanna Miettinen and Heimo Ihalainen occasionally acted as supervisors in cellular
experiments, experimental planning and software development. The author’s own
contributions in each publication are described below in more detail.
In Publication I, the author designed and assembled the compact microscope,
modular system and the control software. Co-authors developed the PDMS mini-
incubator, pO2 sensor and were responsible for cell culturing and image-based
analytical measurements. The author carried out microscopy characterisation, long-
term performance measurements and cellular experiments. The manuscript was
revised and improved with the co-authors.
In Publication II, the author designed the experimental protocol and scripted the
software for automated measurement as well as for video-based movement analysis.
The author drafted the first version of the manuscript which was revised by all the
co-authors.
The author designed the pH measurement system and developed the absorption
correction model presented in Publication III. Long-term pH measurements during
hASC culture were carried out under the supervision of Mimmi Patrikoski and Jyrki
Sivula. All the authors contributed to the manuscript.
In Publication IV, the author conducted the experiments and drafted the
manuscript. The manuscript was improved with the help of all the co-authors.
1
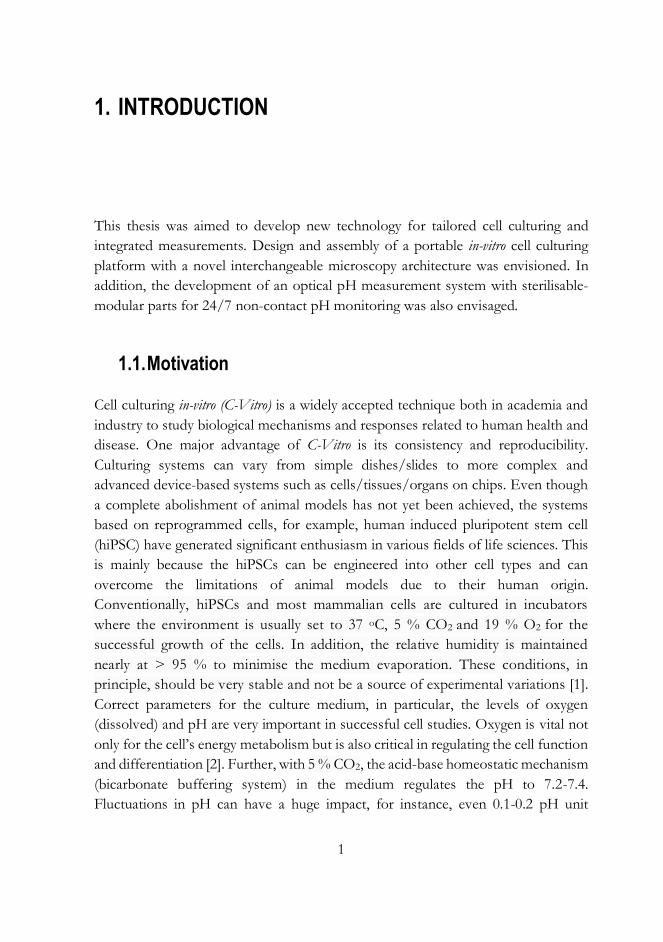
1. INTRODUCTION
This thesis was aimed to develop new technology for tailored cell culturing and
integrated measurements. Design and assembly of a portable in-vitro cell culturing
platform with a novel interchangeable microscopy architecture was envisioned. In
addition, the development of an optical pH measurement system with sterilisable-
modular parts for 24/7 non-contact pH monitoring was also envisaged.
1.1. Motivation
Cell culturing in-vitro (C-Vitro) is a widely accepted technique both in academia and
industry to study biological mechanisms and responses related to human health and
disease. One major advantage of C-Vitro is its consistency and reproducibility.
Culturing systems can vary from simple dishes/slides to more complex and
advanced device-based systems such as cells/tissues/organs on chips. Even though
a complete abolishment of animal models has not yet been achieved, the systems
based on reprogrammed cells, for example, human induced pluripotent stem cell
(hiPSC) have generated significant enthusiasm in various fields of life sciences. This
is mainly because the hiPSCs can be engineered into other cell types and can
overcome the limitations of animal models due to their human origin.
Conventionally, hiPSCs and most mammalian cells are cultured in incubators
where the environment is usually set to 37 oC, 5 % CO2 and 19 % O2 for the
successful growth of the cells. In addition, the relative humidity is maintained
nearly at > 95 % to minimise the medium evaporation. These conditions, in
principle, should be very stable and not be a source of experimental variations [1].
Correct parameters for the culture medium, in particular, the levels of oxygen
(dissolved) and pH are very important in successful cell studies. Oxygen is vital not
only for the cell’s energy metabolism but is also critical in regulating the cell function
and differentiation [2]. Further, with 5 % CO2, the acid-base homeostatic mechanism
(bicarbonate buffering system) in the medium regulates the pH to 7.2-7.4.
Fluctuations in pH can have a huge impact, for instance, even 0.1-0.2 pH unit
2
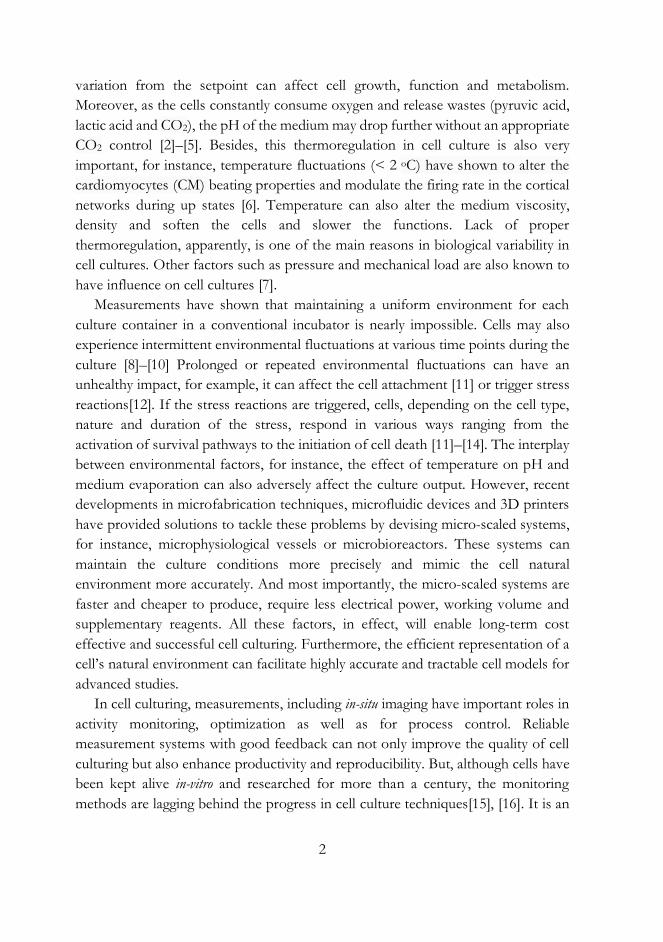
variation from the setpoint can affect cell growth, function and metabolism.
Moreover, as the cells constantly consume oxygen and release wastes (pyruvic acid,
lactic acid and CO2), the pH of the medium may drop further without an appropriate
CO2 control [2]–[5]. Besides, this thermoregulation in cell culture is also very
important, for instance, temperature fluctuations (< 2 oC) have shown to alter the
cardiomyocytes (CM) beating properties and modulate the firing rate in the cortical
networks during up states [6]. Temperature can also alter the medium viscosity,
density and soften the cells and slower the functions. Lack of proper
thermoregulation, apparently, is one of the main reasons in biological variability in
cell cultures. Other factors such as pressure and mechanical load are also known to
have influence on cell cultures [7].
Measurements have shown that maintaining a uniform environment for each
culture container in a conventional incubator is nearly impossible. Cells may also
experience intermittent environmental fluctuations at various time points during the
culture [8]–[10] Prolonged or repeated environmental fluctuations can have an
unhealthy impact, for example, it can affect the cell attachment [11] or trigger stress
reactions[12]. If the stress reactions are triggered, cells, depending on the cell type,
nature and duration of the stress, respond in various ways ranging from the
activation of survival pathways to the initiation of cell death [11]–[14]. The interplay
between environmental factors, for instance, the effect of temperature on pH and
medium evaporation can also adversely affect the culture output. However, recent
developments in microfabrication techniques, microfluidic devices and 3D printers
have provided solutions to tackle these problems by devising micro-scaled systems,
for instance, microphysiological vessels or microbioreactors. These systems can
maintain the culture conditions more precisely and mimic the cell natural
environment more accurately. And most importantly, the micro-scaled systems are
faster and cheaper to produce, require less electrical power, working volume and
supplementary reagents. All these factors, in effect, will enable long-term cost
effective and successful cell culturing. Furthermore, the efficient representation of a
cell’s natural environment can facilitate highly accurate and tractable cell models for
advanced studies.
In cell culturing, measurements, including in-situ imaging have important roles in
activity monitoring, optimization as well as for process control. Reliable
measurement systems with good feedback can not only improve the quality of cell
culturing but also enhance productivity and reproducibility. But, although cells have
been kept alive in-vitro and researched for more than a century, the monitoring
methods are lagging behind the progress in cell culture techniques[15], [16]. It is an

3
important issue that needs to be addressed. Not only that, even though several
miniaturized bioreactors and device-based biological systems are constantly
reported, integration of physiological or chemical sensing systems into them can be
challenging in many cases. This can be due to concerns in mechanical incompatibility
and practical issues with connectivity (optical, electrical, fluid flow). In this context,
we have conceptualised an Invert-upright microscope interchangeable modular cell
culturing platform (iuCMP) with a PDMS mini-incubator, a compact digital
microscope and an automated environmental control (temperature, oxygen and
other gas concentrations). Furthermore, the platform has integrated sensors
(fluorometric pO2 sensor and micro temperature sensor), a microelectrode array
amplifier (MEA) and a video-based cardiomyocytes (CM) function analysis software
(CMaN-CM function analysis tool). The platform can be used for long-term tabletop
cell culturing, cellular response studies and simultaneous functionality assessment
(electrophysiological analysis and non-invasive video-based mechanobiological
analysis). In addition to the iuCMP, a non-contact modular optical pH measurement
system (MO-pH) using sterilisable parts for phenol red (phenolsulfonphthalein) cell
culturing medium for 24/7 real-time spectroscopic pH monitoring is also
envisioned.
An ideal modular culture platform will be a multifunctional platform that
integrates independently created plug and play modules, such as perfusion module,
sensor modules, imaging module (3D, fluorescent), MEA module, control module
(gas exchange, temperature, pH), stimulation module etc. with the option that the
modules can be configured-reconfigured with minimum effort for different
biological studies. In addition, it is expected to accommodate various miniaturized
in-vitro constructs and monitoring devices quite freely. Cultured cells have
applications in many areas, for example, in tissue engineering (repair, enhance, or
replace biological tissues), in the pharmaceutical industry (drug-dosage screening,
side effects-toxicity testing) and in the cosmetic industry (product validation).
Furthermore, they are widely used in immunology (antibody, vaccine and therapeutic
protein production) and in life sciences’ research (future regenerative medicine,
cytotoxicity, tissue and organ development). Integrating smart features into culturing
systems, for instance, real-time automated image analysis, decision making, tracking,
intelligent medium exchange etc. are not typically possible with traditional culture
systems without costly, specialised arrangements [17]–[23]. But those can be
materialised with modular culturing systems. However, smart systems even with
their high potential, are still in the developmental phase, lacking standardised
techniques and having still many hurdles to overcome. The research in this area is

4
fascinating because successful developments can not only boost the academic
science but also impact the society, for instance, contribute to reducing the cost of
drugs, provide more mechanistic insight into diseases (carcinogenesis, mutagenesis
and cancer) and diseases pathogenesis (cardiovascular, epileptic seizures).
As a side note:- Since the focus of this thesis is on methods/technical
development with more leverage to engineering aspects, the issues related to
intracellular functions, cell-to-cell interactions and stimulation (by chemical,
mechanical, optical, and electrical factors) are not considered in detail here.
1.2. Objectives and Research Questions
This thesis has two goals. The first goal is to develop a standalone digital imaging
module (compact microscope) for unstained live-cell microscopy together with
iuCMP and the CM functionality analysis software CMaN. The iuCMP is intended
to enable a highly stable, cell-friendly environment for long-term cellular studies and,
if desired, to generate timely environment control to study biological responses.
Multiple monitoring and measurement schemes are integrated into iuCMP. The
second goal is to develop a non-contact spectroscopic pH measurement system with
sterilisable - modular parts. Both the intended goals have been accomplished, and
the developed hardware and software are continually being used in different
experimental studies. The details of the automated temperature stressing
experiments with hiPSC cardiomyocytes (hiPSC-CMs), are also presented in this
thesis. To summarise, this work combines 3D modelling and design, ray optics
simulations, instrumental assembly and cellular experiments (demonstrative and
applied). The specific research questions of the thesis are defined as follows:
1. How can measurement systems with minimal disturbance to cells and
suitable for long-term studies outside a traditional incubator be
created?
2. Can a mini phase contrast microscope with invert-upright
convertibility be developed for good quality imaging of unstained live-
cells in-vitro?
3. Can affine-optical flow be used to reliably analyse multiple beating
signals from cardiomyocyte beating videos? If so, does the waveform,
5
speed and sensitivity allow the computation of relaxation and
contraction features separately? Can it be applied for movement
centre detection, batch mode processing and real-time analysis?
4. Can we carry out long-term automated assessments of the hiPSC-CM
contractions to temperature stimuli outside a conventional incubator?
5. Can we reliably measure pH, based simply on non-contact optical
methods during long-term observations?
1.3. Thesis Organisation
This thesis comprises of four scientific papers and is divided into five chapters.
Chapter 1 presents the motivation, objectives and research questions, and provides
a summary of main results. Chapter 2 explains the relevant background for the study
and highlights current challenges on the two measurement systems that this thesis
aims to develop. Chapter 3 and Chapter 4 present the research work related to this
thesis. Chapter 3 details the Measurement system1: Compact digital
microscope, iuCMP and CMaN. Optical simulations, 3D system design, digital
imaging schemes, invert-upright interchangeable system and the theory related to
CMaN are outlined in this chapter. The Measurement system1 was applied to
multiple studies and four application examples are also included in Chapter 3.
Chapter 4 presents the Measurement System 2: the non-contact optical pH
measurement system, MO-pH. The MO-pH is based on two colour pH
measurement whose theory, temperature compensation and absorption correction
scheme, as well as the summary of hardware design, are presented in Chapter 4.
Measurement results from long term stem cell culture measurements are provided
in the Results and discussion section in Chapter 4. Further, a novel pH measurement
method using re-closable lid flasks and preliminary ideas for a few image-based pH
estimation schemes are also included in Chapter 4. Finally, Chapter 5 concludes the
thesis with summarising the results, providing answers to the research questions and
discussing the limitations of the study.
6
2. BACKGROUND
In this chapter, a short overview and the significance of the research in relation to
the current knowledge is provided. The purpose is to recall previous studies in the
context of the author’s work, specifically in the areas of C-Vitro in-situ imaging,
compact microscopy, iuCMP, CMaN and MO-pH.
2.1. Cell Culturing In-vitro and In-situ Imaging
Cell culturing in-vitro is a well-known technique where the cells are transferred from
an organism and placed in a fluid in an artificial in-vitro construct/system. Under
appropriate conditions, the cells can live, grow, divide (mitosis) or even differentiate
into other cell types. Today, cell culturing is widely used in biotechnology, clinical
diagnostics, tissue engineering as well as in various areas in life sciences to develop
cell and disease models, drug screening, cell-based manufacturing and toxicity
testing. Small-scale upstream cell culturing traditionally occurs often in Petri dishes,
culture flasks or multi-well plates stored in an incubator. Advances in technology
and organotypic cell/tissues models have facilitated microphysiological in-vitro
systems that can mimic human physiology with great precision [24]–[26]. An in-vitro
system is usually more complex with a 2D or 3D platform with substrates, fluids
(with essential nutrients, growth factors), thermoregulation and usually with an acid-
base homeostatic mechanism (eg. by CO2-bicarbonate buffering). A functional
micro-scaled system, compared to conventional methods, emulates the cells’ natural
environment more exactly where the cells function analogous to their tissues or
organs in the whole organism. A broad list of advantages of various in-vitro cell
techniques have been extensively described elsewhere [27]–[31], but in all cases, it is
important that the in-vitro model should represent the physiological phenomena of
interest with reasonable accuracy so that all experimental results are statistically
consistent and reproducible [32]. Sensors and actuators have great potential in in-
vitro systems for in-situ detection and/or manipulation of relevant cells or tissues [33].
Biomarker quantification or methods such as viability assays are frequently used to
assess cellular functionalities or cytotoxicity but usually, they are performed off-the-
7
chip in an endpoint manner. On the other hand, real-time sensing would allow one
to avail of the complete advantage of in-vitro systems, for example, for efficient
control and manipulation. Integrating sensors into in-vitro systems usually enables
higher sensitivity, temporal and even spatial resolution via integration. Continuous
24/7 real-time measurements have invaluable potential for recapitulating various
aspects of human physiology and makes more accurate and tractable models for
advanced studies. This can also enhance the efficiency of experiments in human
disease modelling, molecular signalling, gene expression and cell-based
manufacturing. Besides, this may also help to improve the culturing systems and its
environment regulation schemes more effectively. Most importantly, it can further
aid in developing miniaturized non-conventional cell culturing systems such as
microfluidics cell chips, microphysiological scaffolds and organ/body-on-chips.
However, integration of sensors to a culturing systems may not always be easy due
to various reasons including issues with sensor physical dimensions (and
connectivity), measurement volume requirements, sterilisability, biocompatibility,
signal drift and long-term stability. Therefore, not all commercially available sensors
can be directly useful for cell culturing applications and development of totally new
sensor/measurement systems may be the only alternative in numerous cases. In
addition, the measurement location, whether it is for onsite (at the area where the
cells grow) or offsite (slightly away from the cell location) monitoring also needs to
be sorted out. For offsite measurements, a sampling/flow system may be
unavoidable. To sum up, integration of sensors into in-vitro systems, in general,
requires critical planning, careful studies, including biocompatible tests, and
iterations.
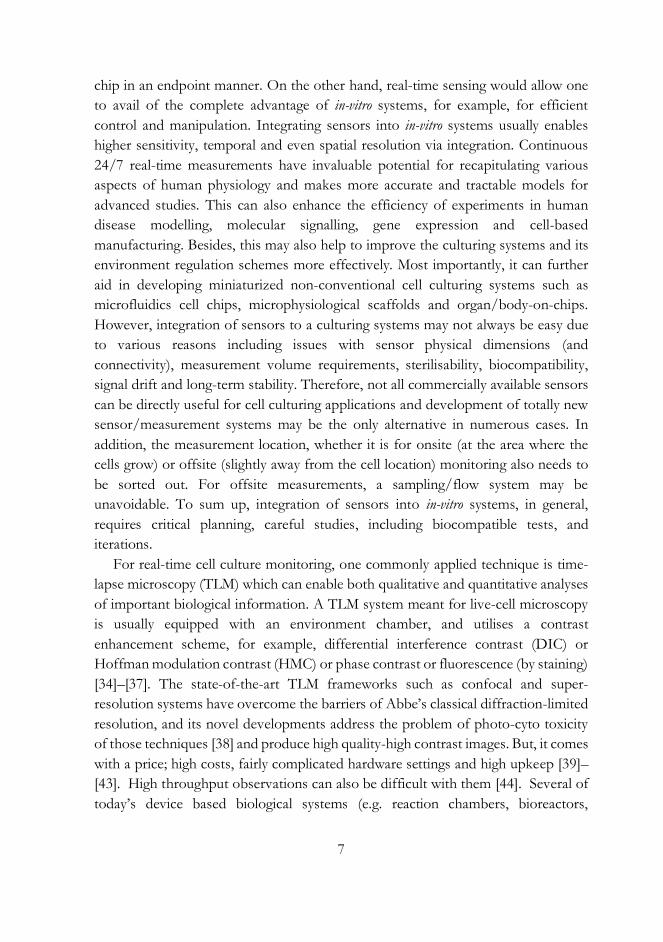
For real-time cell culture monitoring, one commonly applied technique is time-
lapse microscopy (TLM) which can enable both qualitative and quantitative analyses
of important biological information. A TLM system meant for live-cell microscopy
is usually equipped with an environment chamber, and utilises a contrast
enhancement scheme, for example, differential interference contrast (DIC) or
Hoffman modulation contrast (HMC) or phase contrast or fluorescence (by staining)
[34]–[37]. The state-of-the-art TLM frameworks such as confocal and super-
resolution systems have overcome the barriers of Abbe’s classical diffraction-limited
resolution, and its novel developments address the problem of photo-cyto toxicity
of those techniques [38] and produce high quality-high contrast images. But, it comes
with a price; high costs, fairly complicated hardware settings and high upkeep [39]–
[43]. High throughput observations can also be difficult with them [44]. Several of
today’s device based biological systems (e.g. reaction chambers, bioreactors,
8
microfluidic culture systems, lab/organ/body-on-chips), also require TLM in-situ.
But integrating them into an off-the-shelf TLM system can be tricky and challenging
in many cases due to a multitude of reasons [45]–[54]. Several of recently developed
sensor systems [55]–[57] are efficient candidates for accurate process monitoring and
environment regulation, however, most of them, unfortunately, are not directly
compatible for a conventional TLM system. Research for better/achievable spatial
resolution in microscopy is definitely important, but concurrently, the demand for
miniaturised case-specific live-cell microscopes with good imaging quality is also
constantly increasing. Compact microscopes instead of high-end, large-form-factor
systems, are inevitable for obvious reasons, for example, for in-situ TLM in a
conventional incubator. Several compact microscopes have been reported over the
last few years from both academic and commercial endeavours [58], [59]. As new
microscope modalities emerge, a trend to miniaturise them can also be seen. For
example, the on-chip bright field - fluorescent microscopes offer high resolution,
large field-of-view (FOV) and incubator compatibility, but inherently the cells need
to be plated on the imaging chip, which makes them somewhat inconvenient for
conventional cell culturing workflow [60]–[63]. On the contrary, compact
microscopes based on digital holographic microscopy (DHM) facilitate lensless and
widefield 2D or 3D imaging. But since it is computational microscopy, numerical
image reconstruction from the diffraction pattern of the specimen is inevitable which
restricts the immediate visualisation (live-view) of the cells [64]–[68]. On the other
hand, Optical projection tomography (OPT), an interesting imaging modality which
progressed notably in the last decade can produce 3D cell images, but the cells must
be immobilised, which can be problematic for live-cell imaging of certain cell types.
The light guide microscopy, for instance, fibre optic endoscopic microscope [69]–
[71] has notable advantages, but fibre integration into the cell chamber can be
oftentimes cumbersome, in addition to their calibration difficulties [72]–[77].
Alongside the miniaturisation of aforementioned and other emerging microscope
modalities, case-specific miniaturisation of conventional modalities can be very
useful, especially when they are equipped with features like smart phone
compatibility, wireless connectivity, web interfacing, decision making and cloud
integration. They can have applications in remote cell microscopy, mobile healthcare,
e-health and on-field medical diagnosis [78], [79]. To this end, several mini cost-
effective microscopes have been reported recently, but most of them, except for a
few employ basic bright-field or fluorescent imaging schemes [60]–[63], [78]–[80].
As live-cells are naturally very transparent for visible wavelengths, the imaging
contrast can be a problem in basic bright-field schemes. The contrast is better in
9
fluorescent systems, but it comes at the cost of fluorescent staining and related
photo-toxic limitations in long-term TLM. In some systems, chromatic aberration is
noticeable [44]. The webcam-based systems are inexpensive but their lossy image
compression schemes and default auto settings limit their applicability in analytical
quantifications [44], [81], [82]. Further, the typical webcam frame rates (20-30 frames
per second (fps)) are insufficient for certain dynamic studies. To that end, we have
also tested two USB 2 microscopes which had several useful features such as a large
adjustable magnification, portability and easy computer connectivity [83], [84]. They
produced good images of dry surfaces and electrodes, but the performance was not
acceptable for wet and transparent samples. In the end, we realised that we need to
depend on a microscopy with a contrast enhancement scheme for live-cell imaging
in our intended system. The DIC and phase contrast ones were the top priorities,
but we were not able to find their miniaturised versions suitable for our systems
from any commercial vendor. At this stage, we decided to develop a compact and
flexible digital imaging unit suitable for our in-vitro systems. The details of the
developed system are discussed in Chapter 3. The cost of the system including the
invert-upright optomechanics can be around 600-800 Euros.
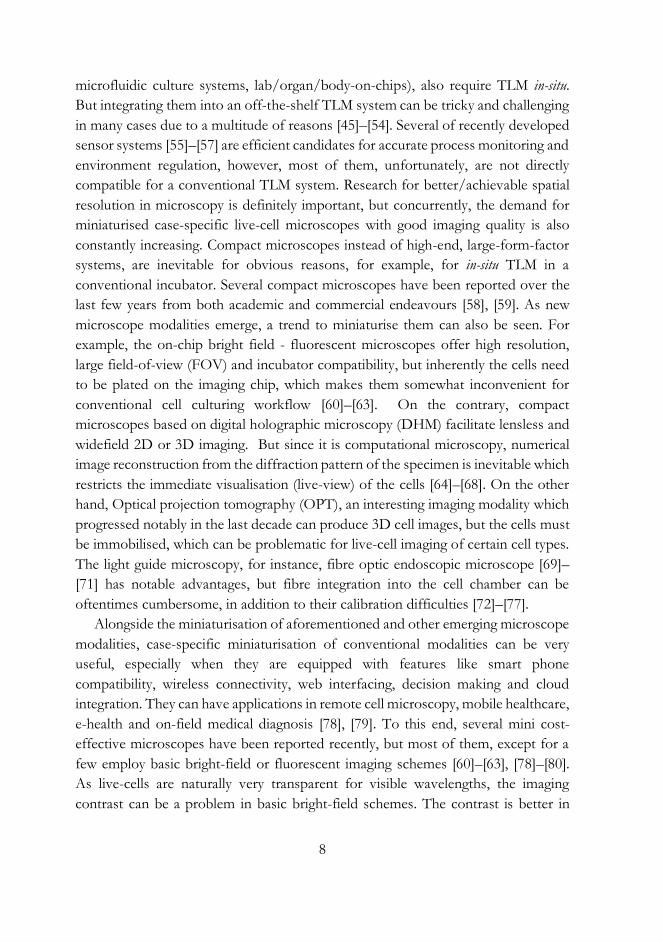
2.2. Invert-Upright Interchangeable System for In-vitro Studies
Recently reported miniaturised microscopes have been developed for a specific
application or a system and not necessarily modular or multipurpose for extended
applications. They have been explicitly designed to be used either as an inverted or
upright system and are mutually exclusive. For most in-situ studies, a standard
inverted TLM works fine, but in some instances, the room under the cell-substrate
may be reserved by other measurement systems (e.g. pH/pO2 opto-chemical
sensors, glucose/lactate biosensors, electrochemical ion sensors), therefore a
simultaneous inverted TLM becomes impossible. So after our compact microscope
was successfully materialised, we extended the research to devising an invert-upright
microscope interchangeable architecture. This lead to the development of the
iuCMP. In iuCMP, the microscope can be easily swapped between invert-upright
configurations, therefore it is very flexible to integrate additional measurement
systems. The iuCMP details and its four possible convertible options (Figure 9) are
provided in Chapter 3.3.

10
While we were designing the iuCMP, no similar system was commercially
available. However, a commercial hybrid invert-upright system (Revolve 3/Revolve
4, Echo Laboratories) is currently available [85]. This system has a touch interface,
app connectivity as well as accelerometer controlled anti-shake control. But as the
commercial one is solely a microscope, the cell culturing incubator chamber, heater
stage etc. need to be separately built in order for them to be applied in long-term
TLM applications. In addition, a system titled ‘The Flexiscope’ has been reported
very recently in Biorxiv (not peer-reviewed) with multiple claims [86]. The Flexiscope
appears to be an interesting system for advanced neurobiology experiments with
features for multi-channel fluorescent imaging, 3D scanning and oblique infrared
illumination. The system, however, is not very compact or portable due to a large
number of optical and opto-mechanical components. But in any case, these recent
developments indicate, there is an ever-growing interest in engineering flexible,
modular and multipurpose systems to meet diverse needs and the arising new
challenges [87]–[94].
The microscopy schemes in iuCMP are not solely for qualitative TLM but also
for image-based quantification of cell functionalities, for example, online or offline
movement analysis of cardiomyocytes. Image-based or spectroscopic techniques can
be implemented as a non-invasive measurement method which is advantageous over
traditional invasive analytical methods such as patch-clamp, voltage-sensitive dyes,
and Ca transient/sarcomere length profiling [95]–[98]. When traditional methods
can be laborious, and occasionally suffer from chemical crosstalk (interplay), the
image-based measurements can facilitate label-free, highly localised as well as
multipoint measurements.
2.3. Video-Based Cardiomyocyte Non-invasive Contractile Function Analysis
For cardiomyocytes function analysis, methods, such as electrophysiology,
fluorescent labelling, Ca2+ transient or impedance measurements or sarcomere
length profiling [98] are conventionally used. Advances in digital imaging and image
processing methods have facilitated new methods for function analysis. Video-based
function analysis is one among them which can be implemented as a fully non-
invasive method when the stream of images have enough spatial resolution,
magnification and sufficient frame rate matching the CM’s contractile timing for
lossless movement capture. A number of video-based function analysis software
11
have recently been reported [99]–[104] with various features. To this end, we have
developed an advanced movement analysis software CMaN for offline and online
video-based beating analysis. Basic properties of several similar software programs
have been compared elsewhere [105]. CMaN was tested against three important
programs ([103], [104], [106]) and has been found to have several notable advantages
which are summarised in the last paragraph of Chapter 3.4.1. CMaN is an easy-to-
use robust tool and available for download with the Publication II. The working
principle and algorithm implementations are provided in detail in Chapter 3.4.1.
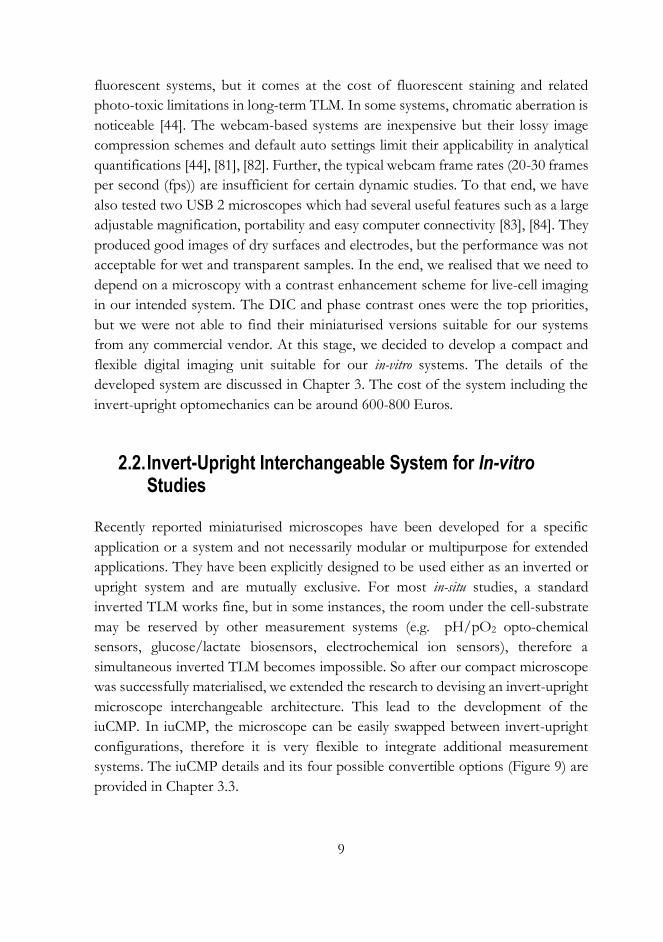
2.4. Cardiomyocytes and Temperature
Primary CMs are difficult to obtain but the hiPSC-CMs can be produced in
laboratories by the differentiation of human iPSC cells. As hiPSC-CM can overcome
the limitations of animal models due to their human origin [107], they have been
increasingly used in heart research, disease modelling, regenerative medicine, cardiac
drug discovery and toxicology [108], [109]. In all these applications, precise control
of the experimental environment of O2, CO2, pH, osmolarity, temperature are highly
important in order to maintain normal cell function and to avoid unexpected
experimental variations [1], [56], [110]. In the case of temperature, it can have a mild
to acute effect on the cell function. The effect of temperature on cardiomyocyte
function is briefly discussed in Publication II. Unfortunately, a complete picture of
the underlying mechanism of temperature-induced abnormalities in hiPSC-CM
function is still elusive [111]. So it is important to recognise the stress response of
hiPSC-CMs to temperature stimuli and quantitatively evaluate it. The acute effect
of temperature on hiPSC-CM function has previously been reported, but an
automated systematic temperature stressing study has not been reported before. We
utilized iuCMP and CMaN together with calibrated temperature sensor plates (TSP,
[112]) for this purpose. Measuring temperature from the location where cells grow
is usually challenging with traditional methods. But the TSPs have microfabricated
meander-type temperature sensors on its surface, so when the CMs are cultured
directly on the TSP, the temperature from the exact cell area can be measured
precisely. The introduction part of Publication II briefly describes the relevance of
hiPSC-CM temperature response study. Our study aimed to precisely understand
how the mechanobiology parameters such as, the beating frequency, relaxation time,
contraction time, and the beating amplitude respond to temperature stimuli in long-
term measurements. Additionally, we reported the Q10 temperature coefficients and

12
the novel results of action potential signal propagation between dissociated hiPSC-
CM clusters in Publication II.
2.5. Cell Culturing Environment and pH Measurement
A successful human cell culturing requires a sterile, biocompatible, cell-friendly
medium chamber and well regulated gaseous environment. The cell culturing fluid,
throughout the culture, should also supply nutrients (e.g. glucose, vitamins, amino
acids and hormones), maintain the acid-base homeostatic balance and remove the
metabolic waste. Reliable monitoring of culturing environment and metabolic
parameters can ensure reproducibility and also give insight into the transient nature
of several intra and extracellular processes researched. To this end, there is growing
interest in multi-parameter sensing for faster, cheaper, more efficient and less labour-
intensive [15], [33], [113], [114] process monitoring. Of all the sensors/monitoring
schemes reported, the pH, temperature and dissolved oxygen are the most frequently
monitored parameters where the growing interest is perhaps best evidenced by the
dramatic increase in the number of papers reported in the last decade. We have also
realised how critical these parameters are in our cell culturing applications and
therefore quite regularly look for still better sensors. Our own Sensor Technology
and Bio-measurement research team actively work for developing various in-vitro
sensor/measurement systems [115]–[120]. In this context, one of the main focuses
of this thesis was to develop the optical pH measurement system the MO-pH.
Being a critical control parameter, pH can have a crucial impact on cell
metabolism and proliferation unless it is maintained in a specific narrow range.
Tissue functions in-vivo and cell viability are a strong function of pH, and a similar
pH dependence has been observed in in-vitro cell cultures [3], [121], [122]. Most
mammalian cells grow at the very narrow range, pH 7.2-7.4 [4], [5], [123], [124]. As
cells proliferate and metabolise nutrients during culture, the secreted byproducts (e.g.
CO2, pyruvic acid, lactic acid) tend to lower the pH [3]–[5]. But, the bicarbonate
acid-base homeostatic mechanism (bicarbonate- CO2 buffering system), counteracts
to nullify the pH fluctuations. However, the buffering action may not be perfect,
especially in prolonged cultures due to reasons including cell confluence (extremely
dense/sparse plating), evaporation, environmental fluctuations and lack of periodic
medium exchange [125]–[127]. A real-time reliable pH monitoring can probe these
changes, as well as provide valuable information on metabolic processes, cell
functions and the overall growth[3], [121], [122], [128]. A detailed comparison of
13
various pH sensors are available elsewhere [129] but of all available systems, the
electrochemical and pH-FET (field-effect transistor) sensors [121], [125], [129], [130]
are the most commonly applied ones for reliable pH sensing. Both of them are
excellent candidates for pH sensing but require frequent calibration, sample physical
contact and are prone to significant signal drift in long-term operations[125], [129],
[131]–[134]. Frequent sensor calibration always challenges the sterility and increases
the risk of contamination. Moreover, they, like any other chemical/biosensors, are
extremely difficult to be sterilised [135]. Furthermore, the biofouling and membrane
cell clogging are also problematic unless the sensors are coated with antifouling
biocompatible materials. In contrast to electrochemical sensors, there is a growing
interest in optical pH sensors because they can enable non-contact measurements
with very good resolution and accuracy. Moreover, they exhibit very little calibration
drift and require minimum maintenance[136]–[140]. Some optical pH sensors are
already commercially available (e.g. iTube pH Bioreactor from PreSens, Wavepod
II-pHOPT from GE Healthcare, TruFluor®pH from Finesse and OptiSens pH
from Sartorius), and a few of them have already been tested in cell cultures.
2.6. Spectroscopic pH Measurements
Optical pH sensors can be of two types, contact sensors and non-contact sensors. A
contact sensor, basically, is an optode that consists typically of three components; a
chemical transducer (pH dye), a polymer matrix (to embed the dye molecules) and
the instrumentation (waveguide such as optical fibre or micropatterned glass plate,
light source, detector and measurement electronics). With physical liquid contact,
the H+ ions modify the dye’s molecular structure or then the orbital energy levels.
This change can be measured spectroscopically, for instance by measuring the light
absorption/reflection/luminescence/fluorescence [129][139][140]. A contact
optical sensor can measure the pH from extremely small volumes, but the sample
physical contact is inevitable. The dye decay (by photobleaching/leaching),
associated signal drifts and cytotoxicity/phototoxicity are also other concerns [129],
[140]–[142]. On the other hand, a non-contact pH sensor avoids the sample physical
contact (partially/fully) with a semi/fully detached chemical transducer and an
appropriate optical measurement scheme. One good example is a reflective pH
sensor (IDIL non-intrusive sensor from Fibres Optiques and REFLECT-PH-KIT
from Ocean optics) that utilises ion-permeable pH membranes. The Smart pH
cuvettes (PMMA/quartz, Ocean optics) is another attractive choice, where the inner
14
walls of the cuvette are sol gel coated with a sensor material (bromocresol green).
Smart cuvettes are excellent candidates for many applications but intended for clear-
non-turbid media and require a specific spectrometer for pH calibration and
measurement. Another interesting possibility is dissolving a biocompatible dye, for
instance, a calorimetric pH dye, at a given concentration in a medium of interest and
measuring the colour changes qualitatively or quantitatively using a spectroscope or
a colour camera [129]. Qualitative pH assessment is very common in cell biology,
therefore a wide variety of culture media with phenol red (phenolsulfonphthalein,
pH dye) is commercially available these days. Culture medium with phenol red
exhibits a gradual colour transition from yellow to red when the pH changes from
6.8 to 8.2. The colour change intrinsically is driven by molecular changes, which is
measurable also by spectroscopic means, enabling a quantitative pH estimation. In
spectral measurements, phenol red attributes to two characteristic pH-dependent
absorptions. This, with appropriate calibration, can be translated into absolute pH
[143]. Hence, technically a standalone pH sensor becomes possible by measuring
light intensity at one of the characteristic absorption wavelengths and at a neutral
(reference) wavelength. This way a true non-contact pH sensor can be materialised,
and a few schemes have already been tested elsewhere [121], [136], [138], [141], [144].
However, adapting the previously reported schemes directly into device-based
biological systems have some challenges from the hardware integration and
calibration perspective. Further, the formulations in previous approaches lack
parameters to compensate for the effect of biofouling (biolayer). Also the effect of
temperature needed to be corrected in real-time. In this context, we devised the non-
contact pH measurement system MO-pH, using 3D printed sterilisable-modular
components. For MO-pH, an improvised pH translational model was also
developed that accounted for the effect of temperature and non-specific absorptions
(eg. by biolayers), resultantly, the measurement accuracy improved notably.

15
3. PORTABLE SYSTEM FOR CONTROLLING AND
MONITORING IN-VITRO CULTIVATION
ENVIRONMENT AND IMAGE-BASED
FUNCTIONALITY MEASUREMENTS
The design details of the compact digital microscope, iuCMP and CMaN (as an-add
on tool for iuCMP) are briefly described in this chapter. The imaging module was
constructed for both the conventional TLM and image-based analytical
measurements. Although this may appear a simple task, our preliminary studies
showed, for good quality in-vitro live-cell microscopy, the chosen imaging modality
and its implementation are important. Otherwise, the imaging contrast and spatial
resolution may not be acceptable especially for analytical computations.
Our experiments started with a couple of commercially available portable USB 2
microscopes [83], [84].These devices were rated for their broad adjustable
magnification and easy computer connectivity. But, their performance was found
not to be sufficient for live-cells and transparent specimens. So we started testing
custom microscopy schemes, and at first, tested simple bright-field and dark-field
strategies using inexpensive short focal length lenses (ACC-01-4000:4003, f=4 mm:8
mm, M12 microlens) and bare white LED lighting. See Figure 1a-c, for example
images of hASCs and hiPSC-CMs, where one can see that the imaging quality and
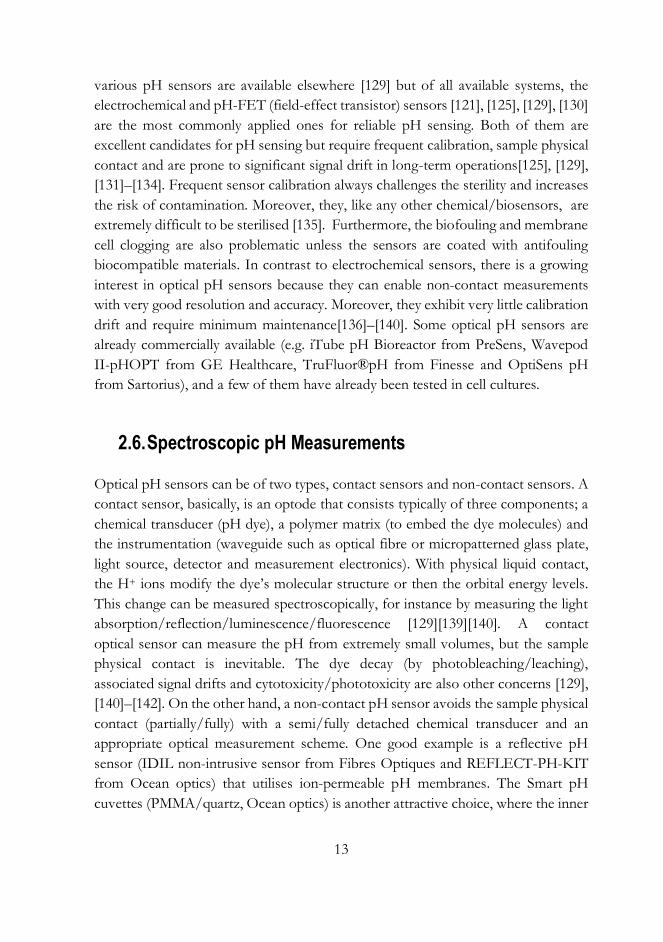
contrast are extremely poor compared to the reference images (AxioCam MRc5).
Though these schemes are easy to implement, their performance with live-cells was
not adequate mainly because the live-cells are highly transparent and absorb/scatter
very little light.
In the next stage, we tested a few custom compact microscopy options, and three
feasible digital microscopy schemes are provided in Figure 2.
16
Figure 1. Basic bright and dark-field cell images using inexpensive short focal length lenses, machine vision camera and white LED lighting. (a-b) Human adipose stem cells (c) hiPSC cardiomyocytes. (d) Reference image with a standard microscope (AxioCam MRc 5). Here one can see the image quality and contrast in (a-c) are extremely poor, compared to (d).
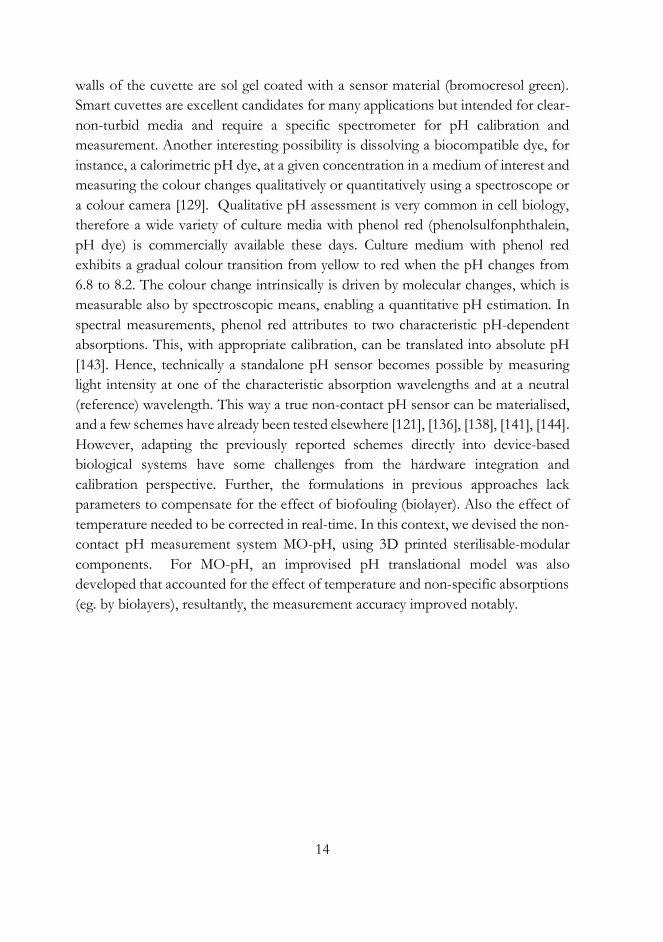
Figure 2. Three compact digital imaging schemes tested. (a) The most compact option (for live-cells) tested so far using an inverted fixed short focal length lens. (b) The option with a conventional objective lens and an extension tube. (c) A further miniaturised scheme using a mirror cube.
Each scheme in Figure 2 has inherent advantages and disadvantages. Figure 2a shows
the most compact scheme tested so far that utilises a fixed short focal length lens
(e.g. Lyx1.19, Lyxoptics, f=1.19 mm, M12 megapixel fisheye lens) in an inverted
manner mounted to a machine vision camera (PointGray, BFLY-U3-13S2M-CS, 1.3
MP, pixel size =3.75 µm in 1/3" sensor) using a 3D printed adapter. Figure 2b shows
the option of using a good quality conventional microscope objective lens and
extension tubes. An advanced version of this scheme using a mirror cube is shown
in Figure 2c. Scheme 1 doesn’t allow changing the magnification (or FOV) plus the
working distance is very short (4.2 -7.75 mm/EFL=1.19-2.1 mm). But in scheme 2
17
and 3, the magnification can be adjusted up to a certain extent using various
extension tubes. Scheme 3 is the final approved and validated scheme for the iuCMP
(Figure 9). In Scheme 3, the objective lens and the camera are implemented at 900 to
each other through a mirror cube (CCM1-E02/M, Thorlabs). This makes the overall
system very compact and, further, facilitates the possibility for installation of
additional optics without unmounting the objective lens. Particulars of the Scheme
3 design, as well as results from microscopy characterisation, validation and long-
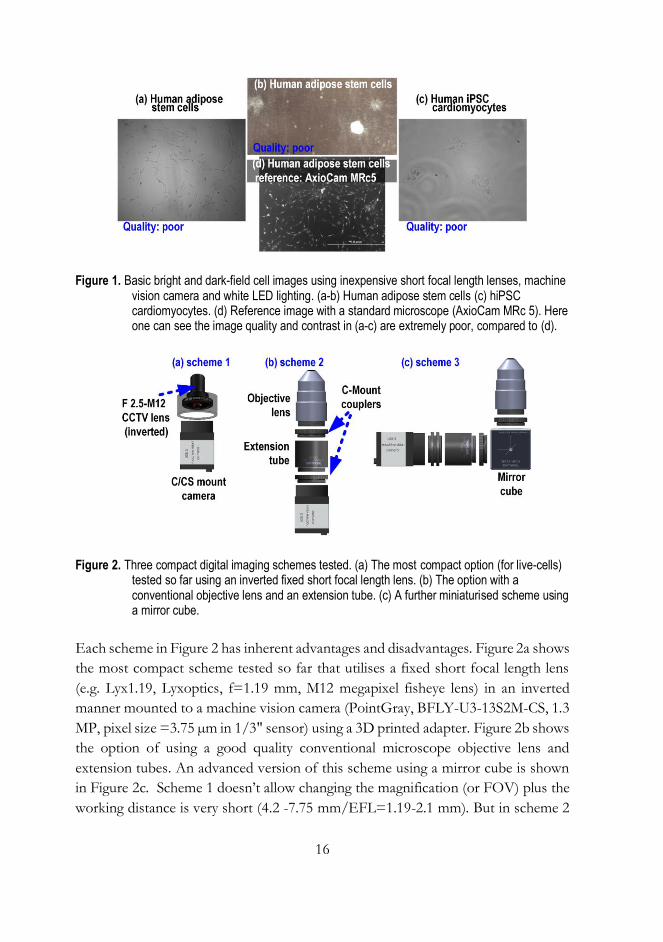
term stability measurements, were presented in Publication I. An illustration together
with the required illumination-scheme is shown in Figure 3.
Figure 3. Anatomy of the digital imaging module used in Publication I. Section view of (a) camera module, (b) illumination module. The illumination module has a variable NA of 0.08 - 0.27. In the system, the magnification can be adjusted by changing objectives and/or with extension tubes.
3.1. Optical Simulations and 3D Design.
For the scheme shown in Figure 3, a 3D ray-tracing simulation has also been carried
out, mainly to understand the magnifications limits, aberrations and to fine-tune the
required illumination and its components. The simulations were solved using Ray
optics module [ROM] in COMSOL Multiphysics (Version 4.3b, COMSOL, Inc.,
Burlington, MA, USA). For the 3D design and assembly, the SolidWorks (Version
2017) computer-aided design (CAD) platform was solely used. Once the suitable
optical parts (commercially available) were identified, their 3D models were
imported into the SolidWorks assembly and all additional parts were custom
designed. The COMSOL-SolidWorks LiveLink delivers efficient interconnectivity
for the design, ray-tracing simulations and optimisation. The ROM simulation allows
modelling the electromagnetic wave propagation in finite element model (FEM) if
the geometry is large compared to ray wavelength. In FEM solving, COMSOL

18
subdivides the large geometry into smaller parts (finite elements) and partial
differential equations (PDE) describing optical propagations (e.g. reflection,
refraction and absorption at boundaries) are solved on the generic element using a
numerical solver (linear/nonlinear, stationary/time-dependent). PDE can have
multiple solutions, so boundary conditions are necessary to constrain the solution.
The results from generic elements are then combined to model the whole geometry.
ROM-FEM model, therefore, can be used to optimise the geometry for a specific
optical application. However, as the model usually represents just a simplified picture
of the system, the results should be carefully considered as guidelines to evaluate the
effect of multiple parameters [145]. A more meaningful model can be accomplished
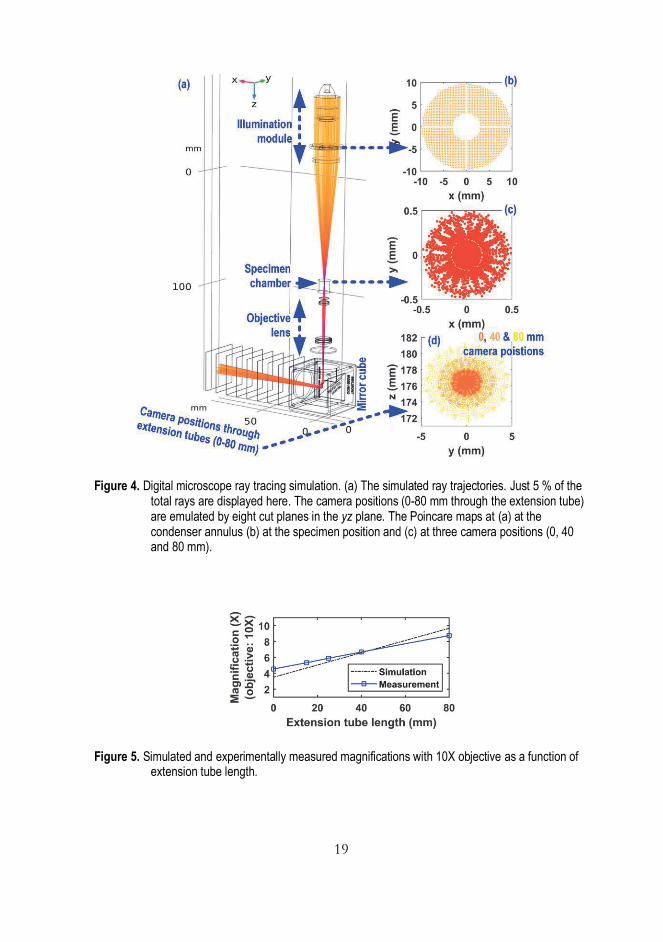
with appropriate validation typically through experimental investigation. Figure 4a
shows the simulated ray trajectories of the digital imaging scheme (Figure 3) with a
10X equivalent objective lens. Here, a total of 2500 unpolarised rays per release were
used in the ray tracing, but only just 5 % of them are displayed. The camera position
(0-80 mm through the extension tube) is emulated by eight screens (cut planes) in
the yz plane. Poincare maps at three selected positions; 1) at the condenser annulus,
2) the specimen and 3) camera locations (0, 40 and 80 mm) are shown in the Figure
4b, c, d. The magnifications simulated as well as experimentally measured (Table 1,
Publication I) for a selected objective (10X) are given in Figure 5. The reason the
measured and simulated values slightly differ could mainly be due to the difference
in the lens train in the model and the actual objective.
In the final assembly, we use machine vision cameras (C or CS mount) and highly
corrected objectives (Nikon CFI Achromat ADL 10XF, 20XF and 40XF) to
produce good quality live-cell images with a negligibly little halo. The whole optical
train is built around Ø1" optics and for a given objective, the FOV is a function of
the extension tube length. The microscopy technical specifications are detailed in
(Table 1, Publication I). Typical imaging when infinity corrected objectives are used
requires the specimen to be at the exact focal point, which sets the image distance
to infinity and a tube lens is used to produce the image at the camera. We avoid the
tube lens to keep the system very compact but the trade-off is a reduction in the
overall magnification but this on the other hand provides some extra working
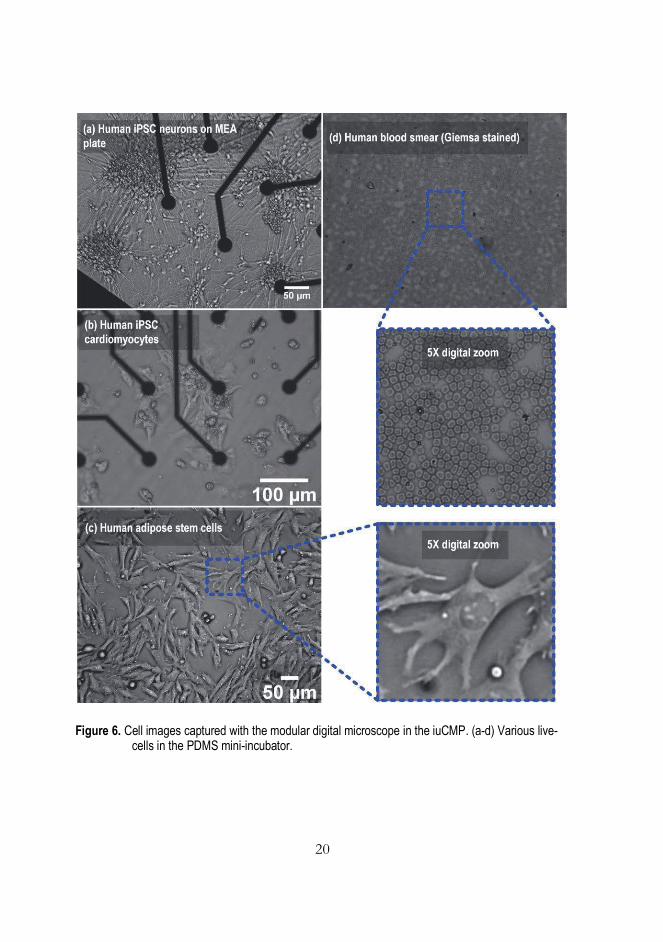
distance. Figure 6 shows a few example images of various cells (hiPSC neurons,
hiPSC-CMs, hASCs, MEFs and Giemsa stained human blood smear) imaged with
our digital microscope. A few additional cell images captured in different in-vitro
studies can be seen [55], [112], [146], [147]. See also some example videos captured
with our device in Publication I (Supplementary Video 1 and 2) and Publication II
(Supplementary material 2 and 3).
19
Figure 4. Digital microscope ray tracing simulation. (a) The simulated ray trajectories. Just 5 % of the total rays are displayed here. The camera positions (0-80 mm through the extension tube) are emulated by eight cut planes in the yz plane. The Poincare maps at (a) at the condenser annulus (b) at the specimen position and (c) at three camera positions (0, 40 and 80 mm).
Figure 5. Simulated and experimentally measured magnifications with 10X objective as a function of extension tube length.
20
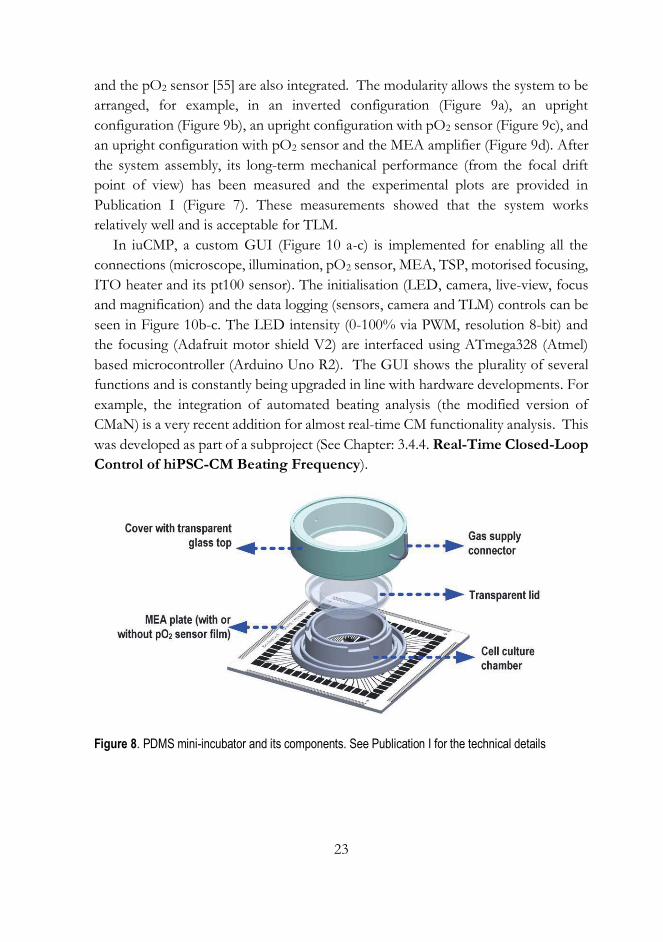
Figure 6. Cell images captured with the modular digital microscope in the iuCMP. (a-d) Various live-cells in the PDMS mini-incubator.

21
3.2. Digital Imaging Schemes with Programmable Magnifications
In addition to the three schemes presented in Figure 2, two advanced options (see
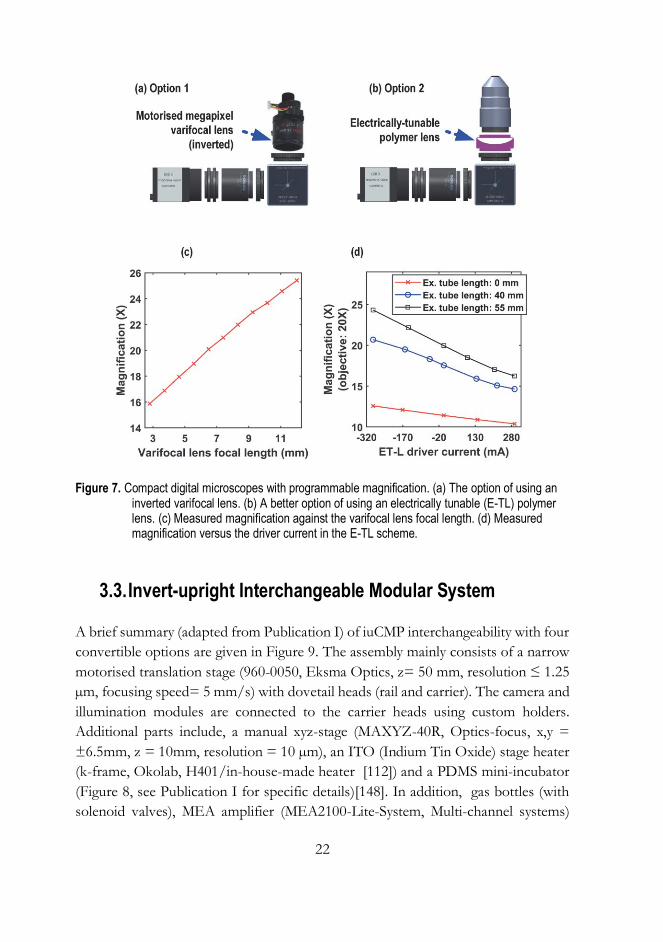
Figure 7) with programmable (via software) magnifications have also been tested. In
option 1 (Figure 7a) an inverted motorised varifocal lens (QM-D14-02812IR(3MP)-
C-EE, Quanmin) with variable focus, f = 2.8-12 mm is utilised. This lens has two
integrated micro-stepper motors to control respectively the focal length and iris. For
this lens, the magnification as a function of the focal length measured in the iuCMP
is shown in Figure 7c. Here, since the varifocal lens is implemented in an inverted
manner, the back focal length (7.1 to 13.6 mm) determines the ultimate NA and
spatial resolution. These type of lenses are very compact, customisable and highly
cost-effective. Further, the motorised iris can be used to control the amount of light
transmitted, thereby the fine focusing. However, tests showed the cell images
produced with this lens is somewhat soft (less sharp edges). The second option
(Figure 7b) utilises an electrically tunable lens (E-TL, EL-16-40-TC-VIS-5D-1-C-
Optotune, f=-50:33 cm, response time = 5 ms) which allows very fast adjustments
of the focal length. In its very basic implementation, the magnification measured in
our system as a function of E-TL current is shown in Figure 7d. Here, the total
change in magnification is not huge, but compared to the varifocal lens scheme, the
E-TL can change the magnification very rapidly, hence it can be a good candidate,
for example, for high-speed z-stack acquisition, automated focal drift correction and
maybe also for CM force characterisation studies. We plan to integrate the E-TL lens
(with additional optics), as a standalone module in the near future.
For most in-vitro cell experiments, the traditional spatio-temporal inverted TLM
is sufficient. But when upright microscopy is to be applied, a long-working distance
objective is essential as the cells need to be imaged, for example, from the top of the
mini-incubator (7-12 mm tall). For highly corrected optics (e.g. plan fluorite, plan
apochromatic), typically, long working distances are seen only with low
magnification (and NA) objectives. So for the upright imaging in iuCMP, a low
magnification objective is utilised, but, the magnification can be further improved
using extension tubes as shown in Table 1, Publication I. The interchangeable
architecture in the system enables easy switching between the invert and upright
schemes. This is briefly described in the next chapter.
22
Figure 7. Compact digital microscopes with programmable magnification. (a) The option of using an inverted varifocal lens. (b) A better option of using an electrically tunable (E-TL) polymer lens. (c) Measured magnification against the varifocal lens focal length. (d) Measured magnification versus the driver current in the E-TL scheme.
3.3. Invert-upright Interchangeable Modular System
A brief summary (adapted from Publication I) of iuCMP interchangeability with four
convertible options are given in Figure 9. The assembly mainly consists of a narrow
motorised translation stage (960-0050, Eksma Optics, z= 50 mm, resolution ≤ 1.25
µm, focusing speed= 5 mm/s) with dovetail heads (rail and carrier). The camera and
illumination modules are connected to the carrier heads using custom holders.
Additional parts include, a manual xyz-stage (MAXYZ-40R, Optics-focus, x,y =
±6.5mm, z = 10mm, resolution = 10 µm), an ITO (Indium Tin Oxide) stage heater
(k-frame, Okolab, H401/in-house-made heater [112]) and a PDMS mini-incubator
(Figure 8, see Publication I for specific details)[148]. In addition, gas bottles (with
solenoid valves), MEA amplifier (MEA2100-Lite-System, Multi-channel systems)
23
and the pO2 sensor [55] are also integrated. The modularity allows the system to be
arranged, for example, in an inverted configuration (Figure 9a), an upright
configuration (Figure 9b), an upright configuration with pO2 sensor (Figure 9c), and
an upright configuration with pO2 sensor and the MEA amplifier (Figure 9d). After
the system assembly, its long-term mechanical performance (from the focal drift
point of view) has been measured and the experimental plots are provided in
Publication I (Figure 7). These measurements showed that the system works
relatively well and is acceptable for TLM.
In iuCMP, a custom GUI (Figure 10 a-c) is implemented for enabling all the
connections (microscope, illumination, pO2 sensor, MEA, TSP, motorised focusing,
ITO heater and its pt100 sensor). The initialisation (LED, camera, live-view, focus
and magnification) and the data logging (sensors, camera and TLM) controls can be
seen in Figure 10b-c. The LED intensity (0-100% via PWM, resolution 8-bit) and
the focusing (Adafruit motor shield V2) are interfaced using ATmega328 (Atmel)
based microcontroller (Arduino Uno R2). The GUI shows the plurality of several
functions and is constantly being upgraded in line with hardware developments. For
example, the integration of automated beating analysis (the modified version of
CMaN) is a very recent addition for almost real-time CM functionality analysis. This
was developed as part of a subproject (See Chapter: 3.4.4. Real-Time Closed-Loop
Control of hiPSC-CM Beating Frequency).
Figure 8. PDMS mini-incubator and its components. See Publication I for the technical details
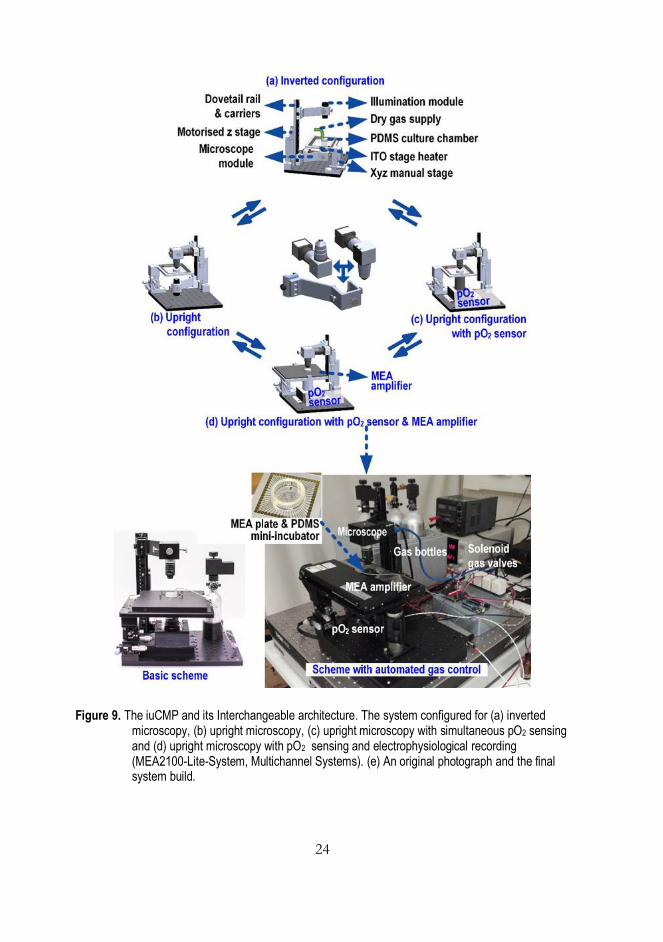
24
Figure 9. The iuCMP and its Interchangeable architecture. The system configured for (a) inverted microscopy, (b) upright microscopy, (c) upright microscopy with simultaneous pO2 sensing and (d) upright microscopy with pO2 sensing and electrophysiological recording (MEA2100-Lite-System, Multichannel Systems). (e) An original photograph and the final system build.

25
Figure 10. The GUI for iuCMP control. Windows for (a) hardware connections, (b) system initialisation and (c) data logging.
3.4. Results and Discussion
The main results with the iuCMP and CMaN are provided in the following
subchapters. Brief discussions are included with each subchapter instead of a
common discussion covering all the subchapters in the end.

26
3.4.1. CMaN - A New Software for Cardiomyocyte Non-invasive Function Analysis
CMaN was scripted (as a GUI software), evaluated and released as part of
Publication II. Initially, it was developed as an offline tool, but lately, has been
further scripted for almost real-time automated analysis. Figure 11 (adapted from
Publication II) shows the user interface of the software. Figure 11b shows the best
beating signal automatically selected out of the six signals extracted from a
representative single cell cardiomyocyte. The table (Figure 11c) shows the estimated
mechanobiological parameters: beating frequency, relaxation time, contraction time,
relaxation amplitude, contraction amplitude and beat-to-beat interval. The software
details are discussed below.
Figure 11. An advanced cardiomyocyte movement analysis software-CMaN. (a) Software user interface. The green rectangle (ROI) shows the region selected around a single cell cardiomyocyte for the beating movement analysis. (b) The best beating signal automatically detected out the six beating signals extracted. (c) The mechanobiological parameters estimated. See also Figure 14.
3.4.1.1. Optical Flow and Affine Optical Flow
In CMaN, the contractile movement is analysed by computing the affine optical
flow (AFOF) which is an advanced version of the classical optical flow (OF) [149],
[150]. The OF describes the pattern of apparent physical movement of objects in a

27
scene (eg. digital image) relative to an observer. In the OF computation, the
movement is quantified in terms of apparent pixel velocities (magnitude and
direction). Computationally, the OF relies on first-order spatiotemporal derivatives
of image intensities, as long as the intensity spatial gradient is not too small and varies
from point to point [149]. The velocity in OF is parameterised by a two-dimensional
flow vector Vx and Vy, representing the translations of image features in x, y
directions. The theoretical formulations of OF are based on the ‘brightness
constancy assumption’ [149]. This assumes the local intensity structure of a time-
varying image feature is approximately constant for at least a short duration. This is
a reasonable assumption in good fps imaging and the mathematical formulations are
discussed below [149].
Let’s assume 𝐼 is the intensity of a pixel at a given location (x,y) of a feature in an
image captured at time t,
𝐼(𝑥, 𝑦, 𝑡) (1)
If the feature moves dx (along the x-axis) and dy (along the y-axis) in the next frame
captured at t+dt, the new intensity can be written as,
𝐼(𝑥 + ∆𝑥, 𝑦 + ∆𝑦, 𝑡 + ∆𝑡) (2)
If the movement is not very huge and the frames are taken at a very short time apart
(e.g. 10 ms in a 100 fps video), with the ‘brightness constancy assumption’ these two
intensities can be treated to be the same, i.e.
𝐼(𝑥, 𝑦, 𝑡) = 𝐼(𝑥 + ∆𝑥, 𝑦 + ∆𝑦, 𝑡 + ∆𝑡) (3)
By applying Taylor series expansion to the right hand side, the Equation (3) can be
rewritten as,
𝐼(𝑥, 𝑦, 𝑡) = 𝐼(𝑥, 𝑦, 𝑡) +
𝜕𝐼
𝜕𝑥∆𝑥 +
𝜕𝐼
𝜕𝑦∆𝑦 +
𝜕𝐼
𝜕𝑡∆𝑡 + 𝐻. 𝑂. 𝑇.
(4)
If H.O.T are neglected, the above equation can be rearranged as,

28
𝜕𝐼
𝜕𝑥∆𝑥 +
𝜕𝐼
𝜕𝑦∆𝑦 +
𝜕𝐼
𝜕𝑡∆𝑡 = 0
(5)
Now differentiating Equation (5) with respect to dt,
𝜕𝐼
𝜕𝑥
∆𝑥
∆𝑡+
𝜕𝐼
𝜕𝑦
∆𝑦
∆𝑡+
𝜕𝐼
𝜕𝑡
∆𝑡
∆𝑡= 0
(6)
𝜕𝐼
𝜕𝑥𝑉𝑥 +
𝜕𝐼
𝜕𝑦𝑉𝑦 +
𝜕𝐼
𝜕𝑡= 0
(7)
Where Vx and Vy are termed as the optical flow in x and y directions.
If substituting for intensity and temporal derivatives as,
𝜕𝐼
𝜕𝑥= 𝐼𝑥 ,
𝜕𝐼
𝜕𝑦= 𝐼𝑦 𝑎𝑛𝑑
𝜕𝐼
𝜕𝑡= 𝐼𝑡
Now Equation (7) can be rearranged as
𝐼𝑥𝑉𝑥 + 𝐼𝑦𝑉𝑦 = −𝐼𝑡 (8)
Equation (8) is the optical flow constraint equation (OFEq). If we have two images
taken at a short time apart, the image x-y derivatives (Ix and Iy) and temporal derivative
(It) can be computed for each pixel. Still, the flow vectors Vx and Vy cannot be
solved from Equation (8) since it is under-constrained, i.e. one equation with two
unknowns (see Figure 12, the Vx and Vy can be anywhere on the constraint line).
Figure 12. A graphical representation of optical flow constrained equation (Equation (8). The flow vectors Vx and Vy can be anywhere on the constraint line.
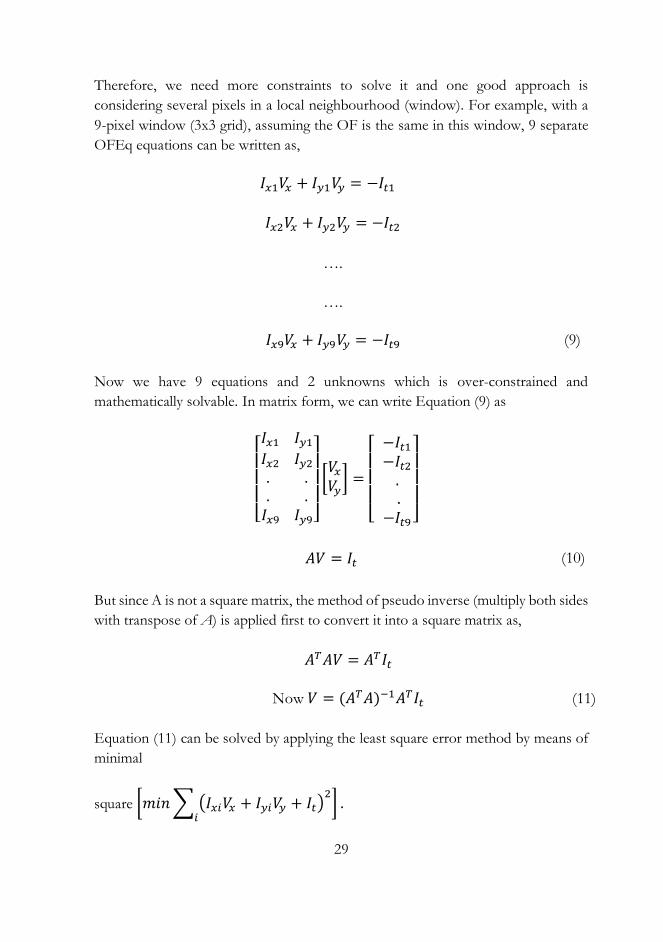
29
Therefore, we need more constraints to solve it and one good approach is
considering several pixels in a local neighbourhood (window). For example, with a
9-pixel window (3x3 grid), assuming the OF is the same in this window, 9 separate
OFEq equations can be written as,
𝐼𝑥1𝑉𝑥 + 𝐼𝑦1𝑉𝑦 = −𝐼𝑡1
𝐼𝑥2𝑉𝑥 + 𝐼𝑦2𝑉𝑦 = −𝐼𝑡2
….
….
𝐼𝑥9𝑉𝑥 + 𝐼𝑦9𝑉𝑦 = −𝐼𝑡9
(9)
Now we have 9 equations and 2 unknowns which is over-constrained and
mathematically solvable. In matrix form, we can write Equation (9) as
[ 𝐼𝑥1 𝐼𝑦1
𝐼𝑥2 𝐼𝑦2
. .
. .𝐼𝑥9 𝐼𝑦9]
[𝑉𝑥𝑉𝑦
] =
[
−𝐼𝑡1−𝐼𝑡2 . . −𝐼𝑡9 ]
𝐴𝑉 = 𝐼𝑡 (10)
But since A is not a square matrix, the method of pseudo inverse (multiply both sides
with transpose of A) is applied first to convert it into a square matrix as,
𝐴𝑇𝐴𝑉 = 𝐴𝑇𝐼𝑡
Now 𝑉 = (𝐴𝑇𝐴)−1𝐴𝑇𝐼𝑡
(11)
Equation (11) can be solved by applying the least square error method by means of
minimal
square [𝑚𝑖𝑛 ∑ (𝐼𝑥𝑖𝑉𝑥 + 𝐼𝑦𝑖𝑉𝑦 + 𝐼𝑡)2
𝑖] .
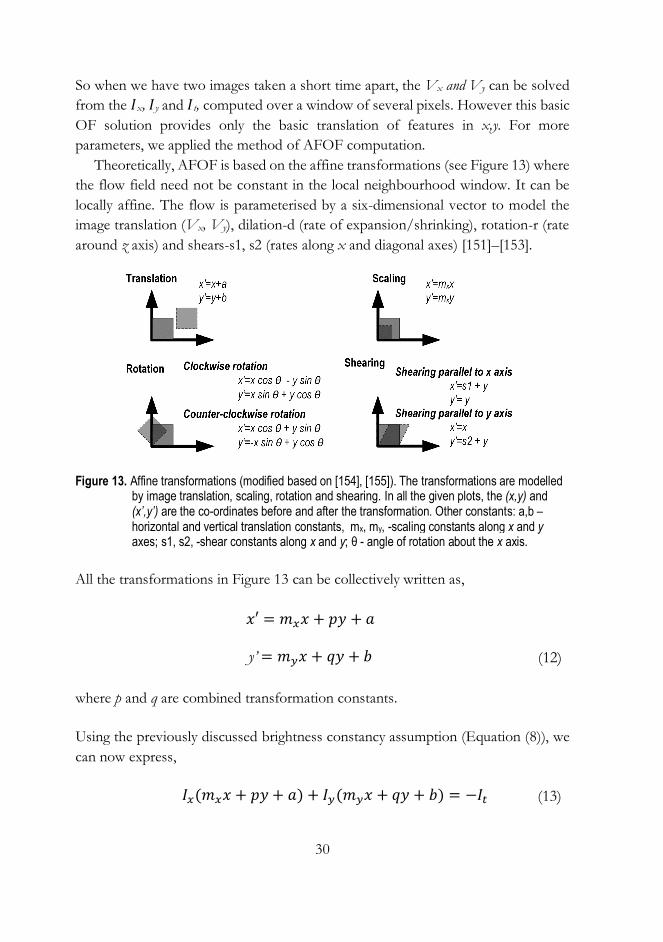
30
So when we have two images taken a short time apart, the Vx and Vy can be solved
from the 𝐼x, 𝐼y and 𝐼t, computed over a window of several pixels. However this basic
OF solution provides only the basic translation of features in x,y. For more
parameters, we applied the method of AFOF computation.
Theoretically, AFOF is based on the affine transformations (see Figure 13) where
the flow field need not be constant in the local neighbourhood window. It can be
locally affine. The flow is parameterised by a six-dimensional vector to model the
image translation (Vx, Vy), dilation-d (rate of expansion/shrinking), rotation-r (rate
around z axis) and shears-s1, s2 (rates along x and diagonal axes) [151]–[153].
Figure 13. Affine transformations (modified based on [154], [155]). The transformations are modelled by image translation, scaling, rotation and shearing. In all the given plots, the (x,y) and (x’,y’) are the co-ordinates before and after the transformation. Other constants: a,b –horizontal and vertical translation constants, mx, my, -scaling constants along x and y axes; s1, s2, -shear constants along x and y; θ - angle of rotation about the x axis.
All the transformations in Figure 13 can be collectively written as,
𝑥′ = 𝑚𝑥𝑥 + 𝑝𝑦 + 𝑎
y’ = 𝑚𝑦𝑥 + 𝑞𝑦 + 𝑏
(12)
where p and q are combined transformation constants.
Using the previously discussed brightness constancy assumption (Equation (8)), we
can now express,
𝐼𝑥(𝑚𝑥𝑥 + 𝑝𝑦 + 𝑎) + 𝐼𝑦(𝑚𝑦𝑥 + 𝑞𝑦 + 𝑏) = −𝐼𝑡 (13)
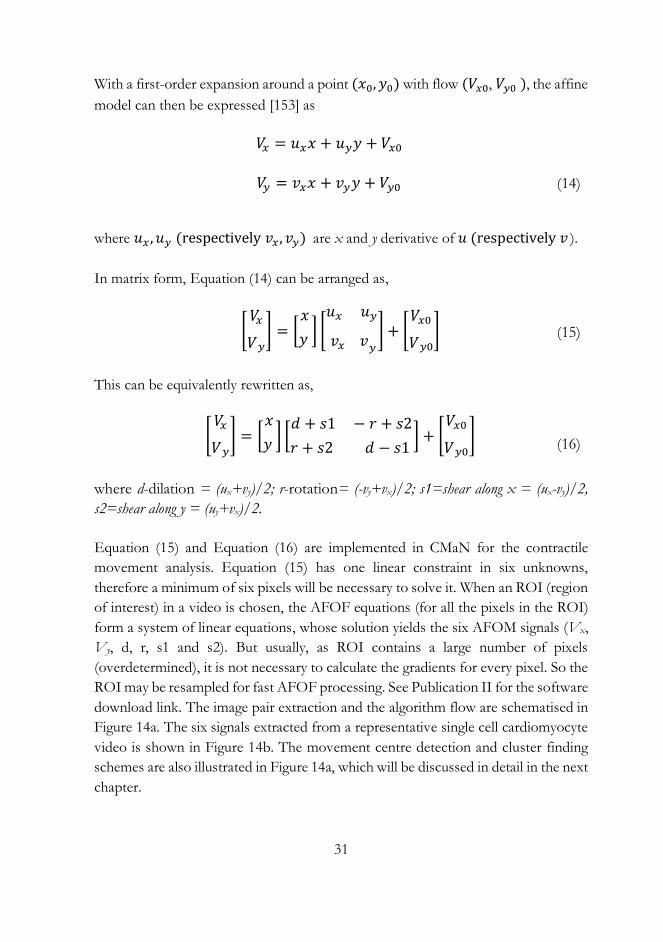
31
With a first-order expansion around a point (𝑥0, 𝑦0) with flow (𝑉𝑥0, 𝑉𝑦0 ), the affine
model can then be expressed [153] as
𝑉𝑥 = 𝑢𝑥𝑥 + 𝑢𝑦𝑦 + 𝑉𝑥0
𝑉𝑦 = 𝑣𝑥𝑥 + 𝑣𝑦𝑦 + 𝑉𝑦0
(14)
where 𝑢𝑥 , 𝑢𝑦 (respectively 𝑣𝑥 , 𝑣𝑦) are x and y derivative of 𝑢 (respectively 𝑣 ).
In matrix form, Equation (14) can be arranged as,
[𝑉𝑥 𝑉𝑦
] = [𝑥 𝑦
] [𝑢𝑥 𝑢𝑦 𝑣𝑥 𝑣𝑦
] + [𝑉𝑥0 𝑉𝑦0
] (15)
This can be equivalently rewritten as,
[
𝑉𝑥 𝑉𝑦
] = [𝑥 𝑦
] [𝑑 + 𝑠1 − 𝑟 + 𝑠2 𝑟 + 𝑠2 𝑑 − 𝑠1
] + [𝑉𝑥0 𝑉𝑦0
]
(16)
where d-dilation = (ux+vy)/2; r-rotation= (-vy+vx)/2; s1=shear along x = (ux-vy)/2,
s2=shear along y = (uy+vx)/2.
Equation (15) and Equation (16) are implemented in CMaN for the contractile
movement analysis. Equation (15) has one linear constraint in six unknowns,
therefore a minimum of six pixels will be necessary to solve it. When an ROI (region
of interest) in a video is chosen, the AFOF equations (for all the pixels in the ROI)
form a system of linear equations, whose solution yields the six AFOM signals (Vx,
Vy, d, r, s1 and s2). But usually, as ROI contains a large number of pixels
(overdetermined), it is not necessary to calculate the gradients for every pixel. So the
ROI may be resampled for fast AFOF processing. See Publication II for the software
download link. The image pair extraction and the algorithm flow are schematised in
Figure 14a. The six signals extracted from a representative single cell cardiomyocyte
video is shown in Figure 14b. The movement centre detection and cluster finding
schemes are also illustrated in Figure 14a, which will be discussed in detail in the next
chapter.

32
Figure 14. A schematic overview of the CMaN algorithm flow. (a) Extraction of successive image pairs from a beating movie and the principle of affine optical flow computation. The schemes of optional features (movement centre detection and cluster finding) are also shown. (b) The six contractile signal components extracted from a representative single cell beating video.
3.4.1.2. Movement Centre Detection and Cluster Finding
In CMaN, the movement centre detection (MCD) feature identifies the locations of
the most energetic movement area by detecting the regions of the highest affine flow
amplitude. The process steps are illustrated in Figure 15. Firstly, the AFOF beating
signal is analysed from a selected ROI. Secondly, a small portion of the analysed
signal containing at least one contraction-relaxation region is selected (see Figure
15a) for the MCD. For processing, the ROI is divided into M-by-N tiles as shown
in Figure 15b-c. Then the AFOF signal is computed sequentially in all the tiles and
the tile with the highest signal amplitude (movement centre) is identified. Once the
movement centre is identified, a better beating signal can be re-analysed by defining
a new ROI around it. This feature is illustrated in Figure 16 where the signal from
the ROI, and separately from the identified movement centre and its neighbourhood
are shown. Here one can see the signal from the region of movement centre is
distinctively better than one from its surroundings.

33
Figure 15. Movement centre detection (MCD) in CMaN. (a) The AFOF-Vy signal and a portion of the signal selected (with the draggable lines) for the MCD. (b-c) The ROI and segmented M-by-N tiles. The identified movement centre is marked with the blue rectangle.
Figure 16. Beating signals at different locations of a contracting hiPSC-CM. (a) The ROI and the segmented tiles for MCD. The AFOF signal (b) from the ROI and (c) from the identified movement centre and in its neighbourhood.
Another added feature is the automated cluster finding (ACF) which is useful
especially when the CM movement analysis is implemented with the online

34
microscopy where the analysis needs to start automatically without human
intervention. The ACF is based on identifying the locations of the highest textures
(high-frequency components), allowing one to recognise the CM clusters from its
surroundings [156]. Usually, the cluster regions (imaged with a good microscope)
have textures of high-frequency contents differing from its surrounding. The ACF
in two example cases is shown in Figure 17 and Figure 18. After the initial processing
(gamma enhancement, smoothing and absolute difference computation to reveal the
cluster borders), an image convolution with a template is applied to identify the
potential clusters (possible movement area). The histogram plots in Figure 17 and
Figure 18 describe the image transformations in each stage. In Figure 17, there are
only 3 clusters which are identified correctly with a 50 x 50 pixel template in a 3 stage
convolution. But in Figure 18, with a similar 50 x 50 pixel template, an 8 stage
convolution was needed to successfully identify all the clusters. But here one can see
that instead of six clusters, eight locations (see the red cross marks) were identified.
One of the located points (the top most-right hand side blue box) is not actually a
cluster but possibly cell debris which happens to be moving with the CM. However,
the signals from similar unwanted regions can be discarded later. In short, the ACF
feature can be helpful in tracking the clusters for automated analysis even if they
would have moved across the FOV during long-term TLM.
CMaN was tested against a tool based on digital image correlation [106] in the
development phase, but later was critically tested against [103] and [104]. Table 2 and
Figure 19, both adapted from Publication II, show the test summaries. In addition,
a comparison of RGB and grayscale video processing times at three ROI sizes is
provided in Table 1 . The robustness of automated signal analysis was measured with
114 consecutive TLM videos and found to be 99.12 % successful where 0.88 %
failure was due to movement of the cluster outside the ROI (measurement area) over
~ 45 hours of TLM acquisition. See also the software instruction file in Publication
II (Supplementary material 1). Based on these tests, CMaN has the following
capabilities and notable advantages;
1. Several times faster, more sensitive, computationally less expensive and
allows ROI selection.
2. Extracts six separate signal components of contractile motion per
processing. This yields a minimum of one useful beating signal even in cases
of complex beating videos.
3. Signals correspond to the contractile phenomena more exactly like an ECG
signal with both positive (upstroke) and negative (downstroke) segments,
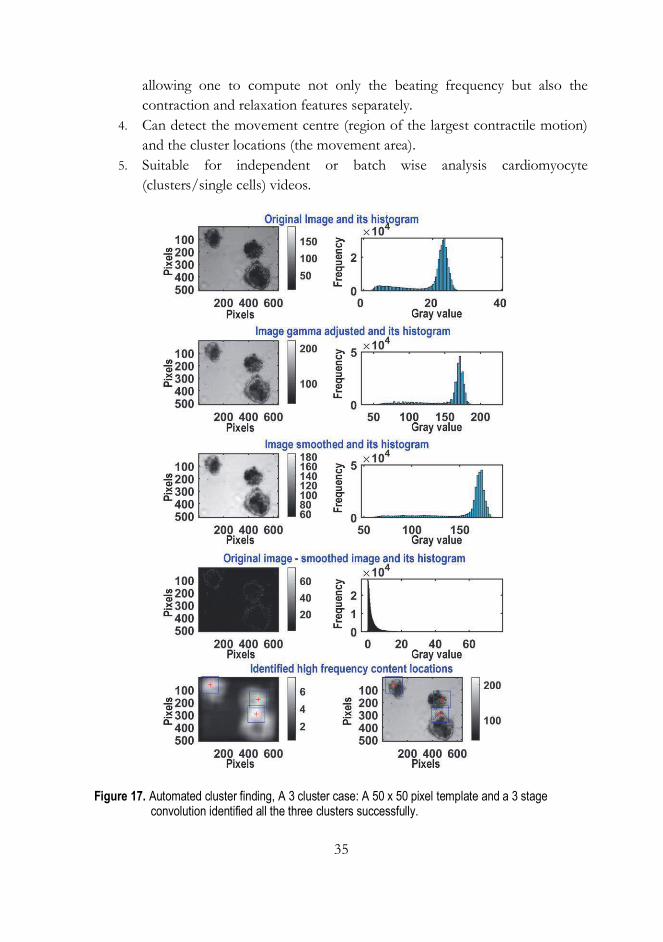
35
allowing one to compute not only the beating frequency but also the
contraction and relaxation features separately.
4. Can detect the movement centre (region of the largest contractile motion)
and the cluster locations (the movement area).
5. Suitable for independent or batch wise analysis cardiomyocyte
(clusters/single cells) videos.
Figure 17. Automated cluster finding, A 3 cluster case: A 50 x 50 pixel template and a 3 stage convolution identified all the three clusters successfully.
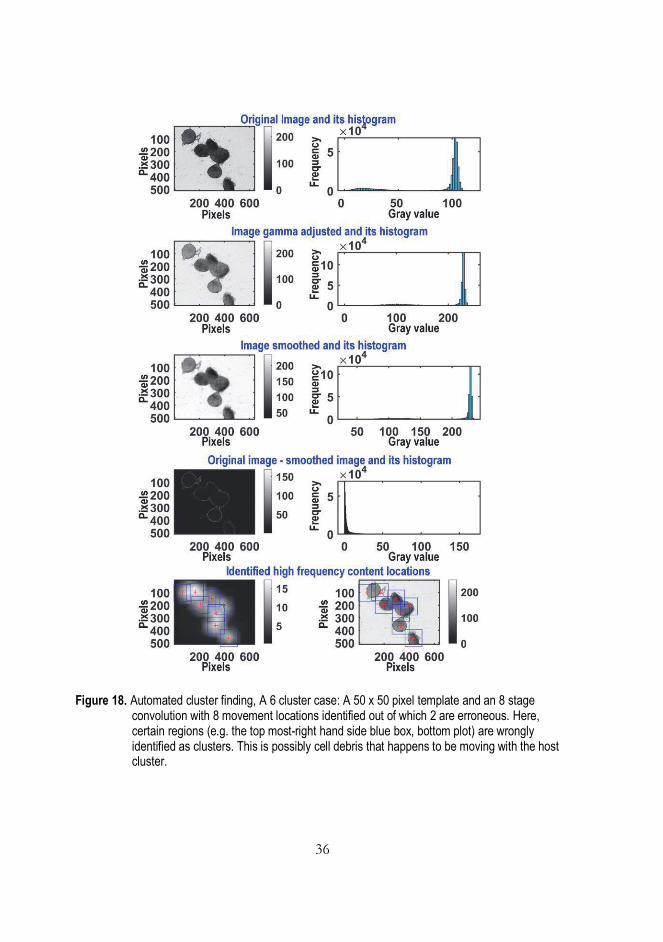
36
Figure 18. Automated cluster finding, A 6 cluster case: A 50 x 50 pixel template and an 8 stage convolution with 8 movement locations identified out of which 2 are erroneous. Here, certain regions (e.g. the top most-right hand side blue box, bottom plot) are wrongly identified as clusters. This is possibly cell debris that happens to be moving with the host cluster.
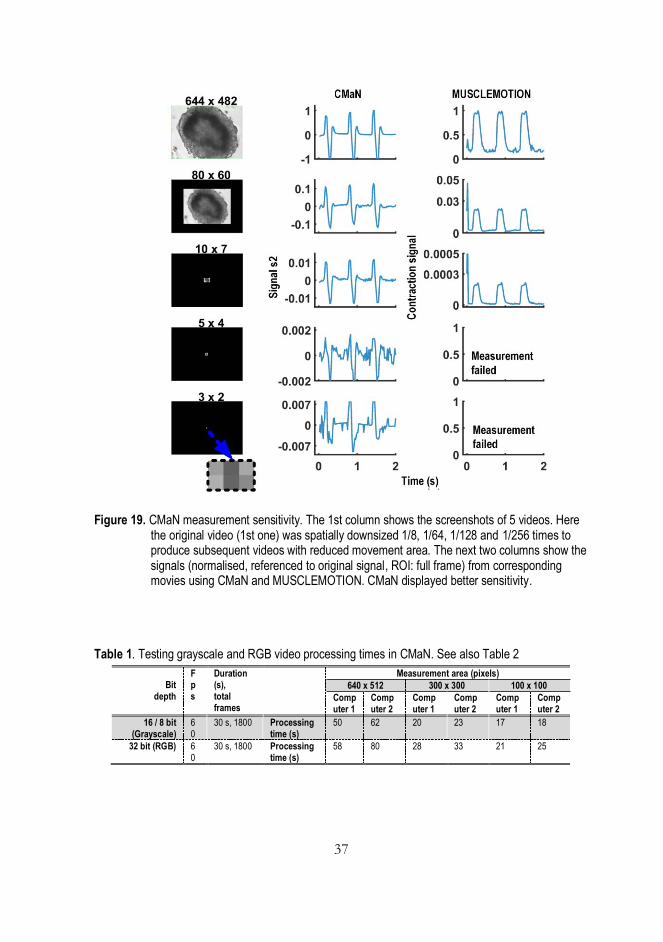
37
Figure 19. CMaN measurement sensitivity. The 1st column shows the screenshots of 5 videos. Here the original video (1st one) was spatially downsized 1/8, 1/64, 1/128 and 1/256 times to produce subsequent videos with reduced movement area. The next two columns show the signals (normalised, referenced to original signal, ROI: full frame) from corresponding movies using CMaN and MUSCLEMOTION. CMaN displayed better sensitivity.
Table 1. Testing grayscale and RGB video processing times in CMaN. See also Table 2
Bit
depth
F p s
Duration (s), total frames
Measurement area (pixels)
640 x 512 300 x 300 100 x 100
Computer 1
Computer 2
Computer 1
Computer 2
Computer 1
Computer 2
16 / 8 bit (Grayscale)
60
30 s, 1800 Processing time (s)
50 62 20 23 17 18
32 bit (RGB) 60
30 s, 1800 Processing time (s)
58 80 28 33 21 25

38
Table 2. CMaN performance comparison against MUSCLEMOTION and SarcTrack using two computers (Computer 1: 2.6 GHz processor and 32 GB RAM, Computer 2: 2.7 GHz
processor and 8GB RAM). ✝30 s long avi (60 fps, 640 x 512 pixels, 32 bit RGB, 1.64
GB size on SSD hard drive). 󠆼*20 avi files (33 GB size on external SSD drive)
3.4.2. Response of hiPSC-CM to Temperature Stimuli
In hiPSC-CM studies, accurate control of the environment, including the
experimental temperature is very important to maintain normal cardiac activity and
to avoid stress responses such as hyper/hypothermia shock reactions [157]–[161].
We utilised iuCMP and CMaN together with a TSP (glass plate, several micro-
patterned resistive sensors) to study the temperature response in hiPSC-CM cultures.
Automated temperature stressing and measurements were conducted and the results
were reported in Publication II. For the measurements, the CMs were directly
cultured on the TSP. This way, accurate temperature sensing from the exact location
of cells, which is usually challenging with traditional bulky sensors, became possible.
The TSP is coated with 250 nm of Si3N4 [112] which is the same insulator material
on the commercial MEAs, so the surface properties of a finished TSP guarantees
cell viability and harmless measurements. The experimental arrangement is shown
in Figure 20 (adapted from Publication II).
MUSCLEMOTION SarcTrack CMaN
Platform Image J MATLAB MATLAB
Algorithm principle pixel intensity difference
fluorescent tag tracking
affine flow
User defined ROI no no yes
Minimum ROI (pixels) NA NA 78 x 78
Number of signals per processing
1 1 6
Sensitivity see Figure 19 NA see Figure 19
Computer 1 Computer 1 Computer 1 Computer 2
1 movie✝ processing time
(~minutes)
3 (6 in dynamic mode)
350 1 1.3
Batch* of movies processing time (~ minutes)
129 7390 25 28
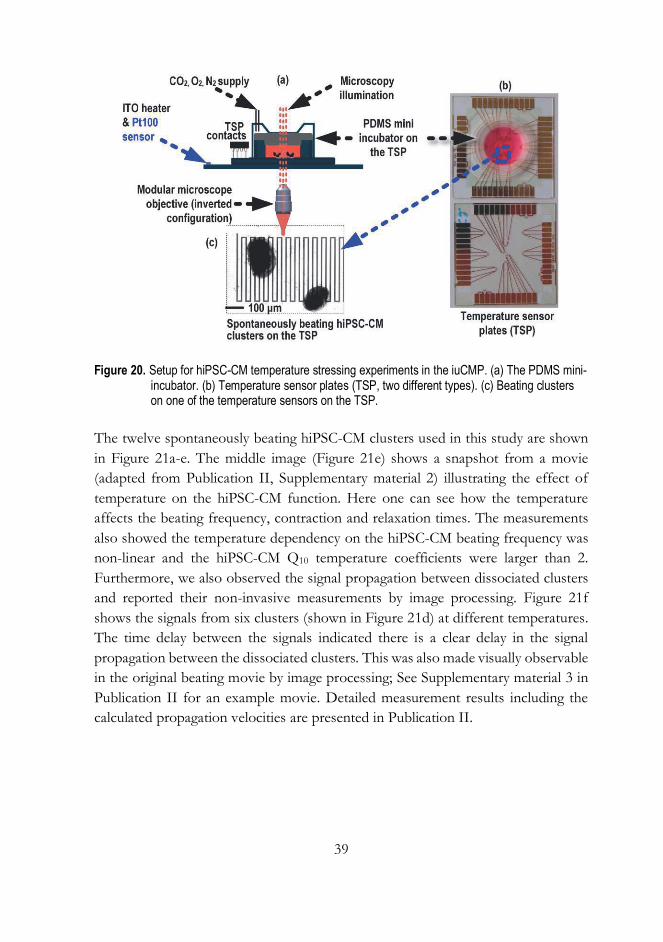
39
Figure 20. Setup for hiPSC-CM temperature stressing experiments in the iuCMP. (a) The PDMS mini-incubator. (b) Temperature sensor plates (TSP, two different types). (c) Beating clusters on one of the temperature sensors on the TSP.
The twelve spontaneously beating hiPSC-CM clusters used in this study are shown
in Figure 21a-e. The middle image (Figure 21e) shows a snapshot from a movie
(adapted from Publication II, Supplementary material 2) illustrating the effect of
temperature on the hiPSC-CM function. Here one can see how the temperature
affects the beating frequency, contraction and relaxation times. The measurements
also showed the temperature dependency on the hiPSC-CM beating frequency was
non-linear and the hiPSC-CM Q10 temperature coefficients were larger than 2.
Furthermore, we also observed the signal propagation between dissociated clusters
and reported their non-invasive measurements by image processing. Figure 21f
shows the signals from six clusters (shown in Figure 21d) at different temperatures.
The time delay between the signals indicated there is a clear delay in the signal
propagation between the dissociated clusters. This was also made visually observable
in the original beating movie by image processing; See Supplementary material 3 in
Publication II for an example movie. Detailed measurement results including the
calculated propagation velocities are presented in Publication II.
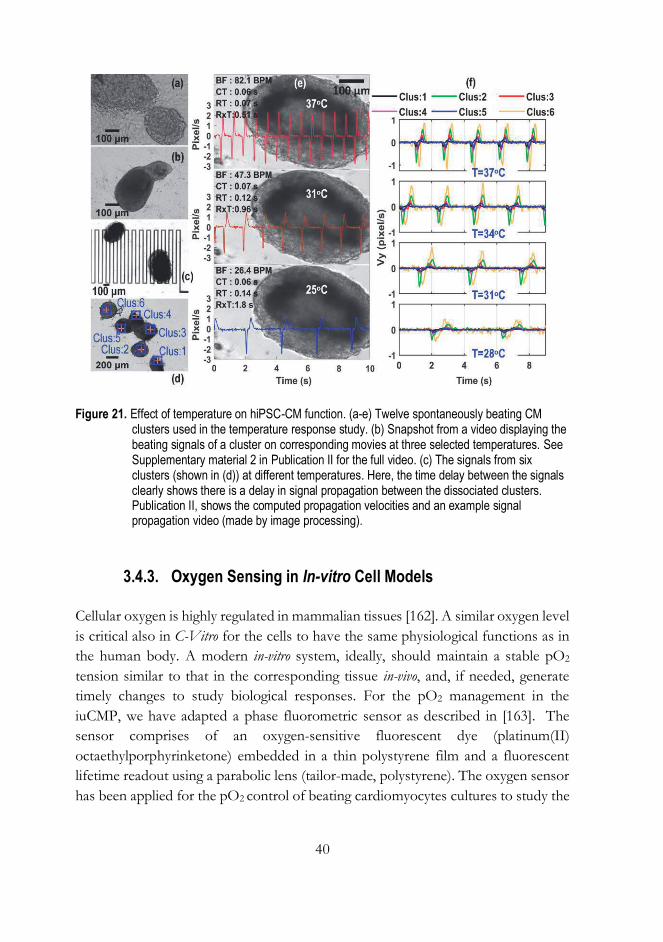
40
Figure 21. Effect of temperature on hiPSC-CM function. (a-e) Twelve spontaneously beating CM clusters used in the temperature response study. (b) Snapshot from a video displaying the beating signals of a cluster on corresponding movies at three selected temperatures. See Supplementary material 2 in Publication II for the full video. (c) The signals from six clusters (shown in (d)) at different temperatures. Here, the time delay between the signals clearly shows there is a delay in signal propagation between the dissociated clusters. Publication II, shows the computed propagation velocities and an example signal propagation video (made by image processing).
3.4.3. Oxygen Sensing in In-vitro Cell Models
Cellular oxygen is highly regulated in mammalian tissues [162]. A similar oxygen level
is critical also in C-Vitro for the cells to have the same physiological functions as in
the human body. A modern in-vitro system, ideally, should maintain a stable pO2
tension similar to that in the corresponding tissue in-vivo, and, if needed, generate
timely changes to study biological responses. For the pO2 management in the
iuCMP, we have adapted a phase fluorometric sensor as described in [163]. The
sensor comprises of an oxygen-sensitive fluorescent dye (platinum(II)
octaethylporphyrinketone) embedded in a thin polystyrene film and a fluorescent
lifetime readout using a parabolic lens (tailor-made, polystyrene). The oxygen sensor
has been applied for the pO2 control of beating cardiomyocytes cultures to study the
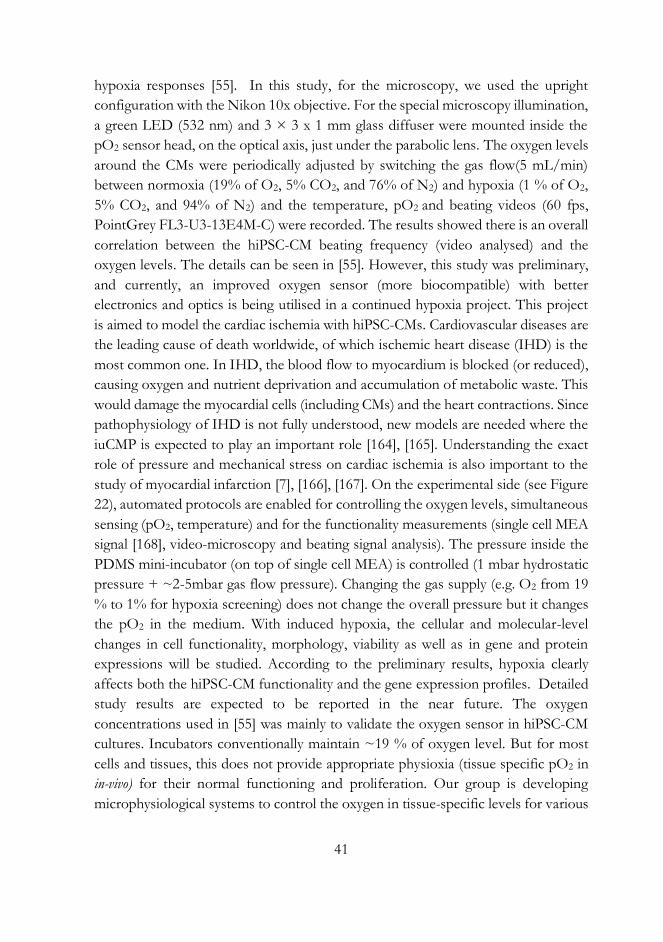
41
hypoxia responses [55]. In this study, for the microscopy, we used the upright
configuration with the Nikon 10x objective. For the special microscopy illumination,
a green LED (532 nm) and 3 × 3 x 1 mm glass diffuser were mounted inside the
pO2 sensor head, on the optical axis, just under the parabolic lens. The oxygen levels
around the CMs were periodically adjusted by switching the gas flow(5 mL/min)
between normoxia (19% of O2, 5% CO2, and 76% of N2) and hypoxia (1 % of O2,
5% CO2, and 94% of N2) and the temperature, pO2 and beating videos (60 fps,
PointGrey FL3-U3-13E4M-C) were recorded. The results showed there is an overall
correlation between the hiPSC-CM beating frequency (video analysed) and the
oxygen levels. The details can be seen in [55]. However, this study was preliminary,
and currently, an improved oxygen sensor (more biocompatible) with better
electronics and optics is being utilised in a continued hypoxia project. This project
is aimed to model the cardiac ischemia with hiPSC-CMs. Cardiovascular diseases are
the leading cause of death worldwide, of which ischemic heart disease (IHD) is the
most common one. In IHD, the blood flow to myocardium is blocked (or reduced),
causing oxygen and nutrient deprivation and accumulation of metabolic waste. This
would damage the myocardial cells (including CMs) and the heart contractions. Since
pathophysiology of IHD is not fully understood, new models are needed where the
iuCMP is expected to play an important role [164], [165]. Understanding the exact
role of pressure and mechanical stress on cardiac ischemia is also important to the
study of myocardial infarction [7], [166], [167]. On the experimental side (see Figure
22), automated protocols are enabled for controlling the oxygen levels, simultaneous
sensing (pO2, temperature) and for the functionality measurements (single cell MEA
signal [168], video-microscopy and beating signal analysis). The pressure inside the
PDMS mini-incubator (on top of single cell MEA) is controlled (1 mbar hydrostatic
pressure + ~2-5mbar gas flow pressure). Changing the gas supply (e.g. O2 from 19
% to 1% for hypoxia screening) does not change the overall pressure but it changes
the pO2 in the medium. With induced hypoxia, the cellular and molecular-level
changes in cell functionality, morphology, viability as well as in gene and protein
expressions will be studied. According to the preliminary results, hypoxia clearly
affects both the hiPSC-CM functionality and the gene expression profiles. Detailed
study results are expected to be reported in the near future. The oxygen
concentrations used in [55] was mainly to validate the oxygen sensor in hiPSC-CM
cultures. Incubators conventionally maintain ~19 % of oxygen level. But for most
cells and tissues, this does not provide appropriate physioxia (tissue specific pO2 in
in-vivo) for their normal functioning and proliferation. Our group is developing
microphysiological systems to control the oxygen in tissue-specific levels for various
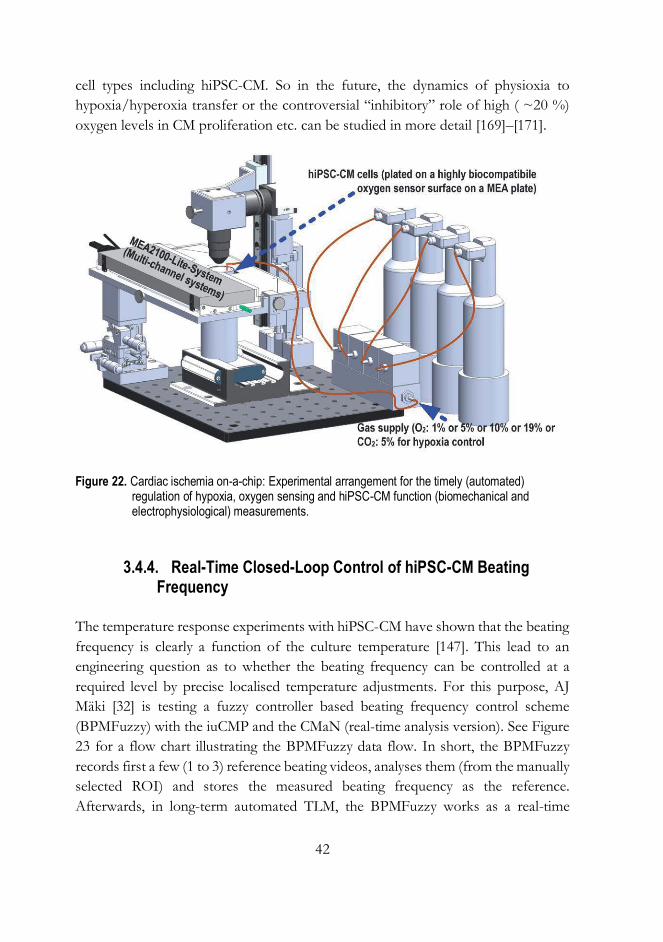
42
cell types including hiPSC-CM. So in the future, the dynamics of physioxia to
hypoxia/hyperoxia transfer or the controversial “inhibitory” role of high ( ~20 %)
oxygen levels in CM proliferation etc. can be studied in more detail [169]–[171].
Figure 22. Cardiac ischemia on-a-chip: Experimental arrangement for the timely (automated) regulation of hypoxia, oxygen sensing and hiPSC-CM function (biomechanical and electrophysiological) measurements.
3.4.4. Real-Time Closed-Loop Control of hiPSC-CM Beating Frequency
The temperature response experiments with hiPSC-CM have shown that the beating
frequency is clearly a function of the culture temperature [147]. This lead to an
engineering question as to whether the beating frequency can be controlled at a
required level by precise localised temperature adjustments. For this purpose, AJ
Mäki [32] is testing a fuzzy controller based beating frequency control scheme
(BPMFuzzy) with the iuCMP and the CMaN (real-time analysis version). See Figure
23 for a flow chart illustrating the BPMFuzzy data flow. In short, the BPMFuzzy
records first a few (1 to 3) reference beating videos, analyses them (from the manually
selected ROI) and stores the measured beating frequency as the reference.
Afterwards, in long-term automated TLM, the BPMFuzzy works as a real-time

43
closed-loop controller which records videos, analyses them and compares the
beating frequency with the reference. If there is a frequency variation, the controller
then modulates the cell area temperature in order to adjust the beating frequency,
with the frequency difference as a perturbing factor to the controller. For this
purpose, we have completed the software editing and preliminary trials (without
cells). Technically, BPMFuzzy works nicely but the studies with cells are yet to be
scheduled.
3.4.5. Orientation of Fibroblasts on Nano Cellulose Surface
For demonstration purposes, iuCMP has been tested for the orientation analysis of
mouse embryonic fibroblasts (MEF, obtained from Hannover medical school,
Hannover, Germany) on cationic cellulose nanofibres (c-CNF on glass plate, [172]).
The experimental details are presented in Publication I. The expansion of MEF (in
DMEM high glucose medium) on the c-CNF surface was imaged in iuCMP for
several days to study their orientation outside a traditional incubator. In the captured
images, both the cells and cellulose fibres were equally visible with clear cell
boundaries which confirmed the applicability of iuCMP also for relatively complex
imaging requirements. Later, the degree of MEF orientation (alignment) was
computed from TLM images using an orientation analysis tool (CytoSpectre, [173]).
Resulting plots exhibited isotropy, indicating a good alignment of all oriented
structures along a single line. See Publication I (also Supplementary Video 1 in it) for
more details.

44
Figure 23. Flow chart illustrating the fuzzy controller based closed-loop control scheme for hiPSC-CM beating frequency.

45
4. NON-CONTACT OPTICAL pH MEASUREMENT
SYSTEM WITH STERILISABLE, MODULAR PARTS
Our pH measurement system, MO-pH quantifies the pH changes of the phenol red
(phenolsulfonphthalein -C19H14O5S, CAS number 34487-61-1, ~8 mg/L) culture
medium using a novel modular read-out scheme. The details of the system and a few
application examples are presented in Publication III. This chapter briefly describes
the working principle and main components of the MO-pH.
4.1. Two Colour pH Measurement System. Working Principle and Hardware Assembly
Phenol red medium responds to changes in the pH from 6.8 to 8.2 (~ 1.5 pH units)
by displaying a gradual colour transition from yellow to red. Spectroscopically, these
changes are measurable with absorption spectra (See Figure 1a in Publication III).
In the absorption spectrum, an isosbestic point (~470 nm) and two characteristic
absorption peaks: one at ~430 nm and the other one at ~560 nm, are visible. The
characteristic peaks are due to structural isomerism accounting for the existence of
phenol red in two forms: the acidic ([HIn] – yellow) and alkaline ([In-]- red) forms.
Consequently, the colour of the bulk medium (at a given temperature) is decided by
the [In-]/ [HIn] concentration ratio. This ratio can be translated into the absolute
pH using the Henderson–Hasselbalch equation[174] as follows,
𝑝𝐻 = 𝑝𝐾𝑎𝐼𝑛 + 𝑙𝑜𝑔10(
[𝐼𝑛−]
[𝐻𝐼𝑛])
(17)
where pKaIn - phenol red dissociation constant [175][176] .
In Equation 17, pH will linearly change with concentration ratio, 𝑙𝑜𝑔10([𝐼𝑛−]
[𝐻𝐼𝑛])
Using Beer-Lambert’s law, Equation 17 can be rewritten as,
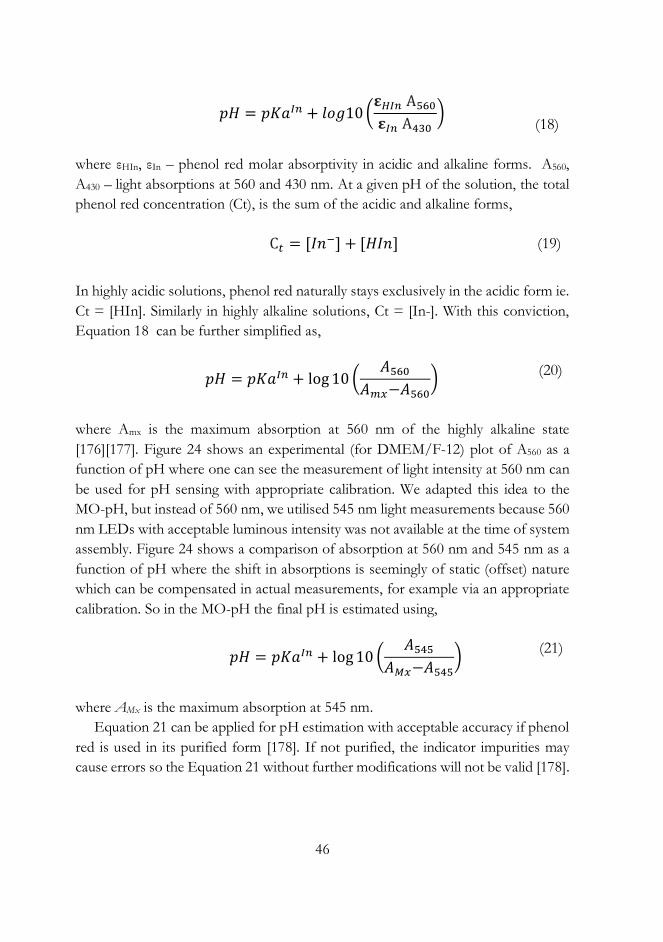
46
𝑝𝐻 = 𝑝𝐾𝑎𝐼𝑛 + 𝑙𝑜𝑔10(
𝛆𝐻𝐼𝑛 A560
𝛆𝐼𝑛 A430)
(18)
where εHIn, εIn – phenol red molar absorptivity in acidic and alkaline forms. A560,
A430 – light absorptions at 560 and 430 nm. At a given pH of the solution, the total
phenol red concentration (Ct), is the sum of the acidic and alkaline forms,
C𝑡 = [𝐼𝑛−] + [𝐻𝐼𝑛] (19)
In highly acidic solutions, phenol red naturally stays exclusively in the acidic form ie.
Ct = [HIn]. Similarly in highly alkaline solutions, Ct = [In-]. With this conviction,
Equation 18 can be further simplified as,
𝑝𝐻 = 𝑝𝐾𝑎𝐼𝑛 + log10 (
𝐴560
𝐴𝑚𝑥−𝐴560)
(20)
where Amx is the maximum absorption at 560 nm of the highly alkaline state
[176][177]. Figure 24 shows an experimental (for DMEM/F-12) plot of A560 as a
function of pH where one can see the measurement of light intensity at 560 nm can
be used for pH sensing with appropriate calibration. We adapted this idea to the
MO-pH, but instead of 560 nm, we utilised 545 nm light measurements because 560
nm LEDs with acceptable luminous intensity was not available at the time of system
assembly. Figure 24 shows a comparison of absorption at 560 nm and 545 nm as a
function of pH where the shift in absorptions is seemingly of static (offset) nature
which can be compensated in actual measurements, for example via an appropriate
calibration. So in the MO-pH the final pH is estimated using,
𝑝𝐻 = 𝑝𝐾𝑎𝐼𝑛 + log10 (
𝐴545
𝐴𝑀𝑥−𝐴545)
(21)
where AMx is the maximum absorption at 545 nm.
Equation 21 can be applied for pH estimation with acceptable accuracy if phenol
red is used in its purified form [178]. If not purified, the indicator impurities may
cause errors so the Equation 21 without further modifications will not be valid [178].
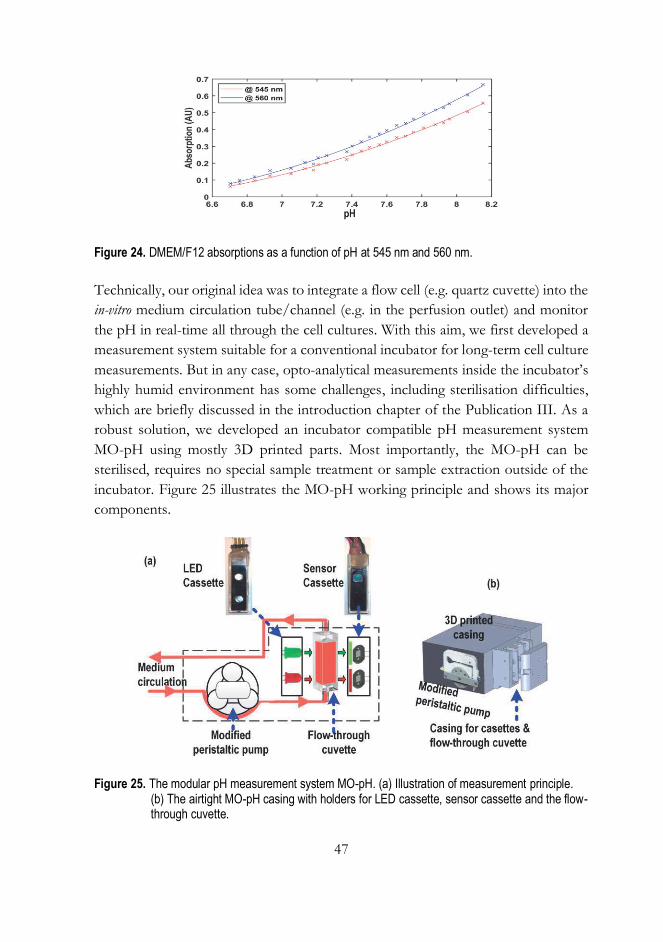
47
Figure 24. DMEM/F12 absorptions as a function of pH at 545 nm and 560 nm.
Technically, our original idea was to integrate a flow cell (e.g. quartz cuvette) into the
in-vitro medium circulation tube/channel (e.g. in the perfusion outlet) and monitor
the pH in real-time all through the cell cultures. With this aim, we first developed a
measurement system suitable for a conventional incubator for long-term cell culture
measurements. But in any case, opto-analytical measurements inside the incubator’s
highly humid environment has some challenges, including sterilisation difficulties,
which are briefly discussed in the introduction chapter of the Publication III. As a
robust solution, we developed an incubator compatible pH measurement system
MO-pH using mostly 3D printed parts. Most importantly, the MO-pH can be
sterilised, requires no special sample treatment or sample extraction outside of the
incubator. Figure 25 illustrates the MO-pH working principle and shows its major
components.
Figure 25. The modular pH measurement system MO-pH. (a) Illustration of measurement principle. (b) The airtight MO-pH casing with holders for LED cassette, sensor cassette and the flow-through cuvette.
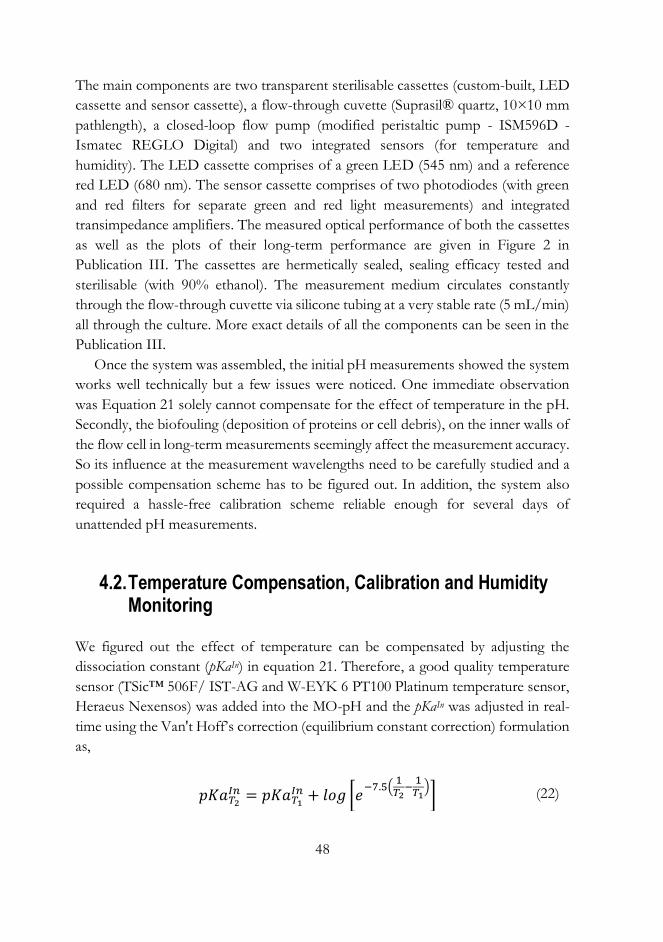
48
The main components are two transparent sterilisable cassettes (custom-built, LED
cassette and sensor cassette), a flow-through cuvette (Suprasil® quartz, 10×10 mm
pathlength), a closed-loop flow pump (modified peristaltic pump - ISM596D -
Ismatec REGLO Digital) and two integrated sensors (for temperature and
humidity). The LED cassette comprises of a green LED (545 nm) and a reference
red LED (680 nm). The sensor cassette comprises of two photodiodes (with green
and red filters for separate green and red light measurements) and integrated
transimpedance amplifiers. The measured optical performance of both the cassettes
as well as the plots of their long-term performance are given in Figure 2 in
Publication III. The cassettes are hermetically sealed, sealing efficacy tested and
sterilisable (with 90% ethanol). The measurement medium circulates constantly
through the flow-through cuvette via silicone tubing at a very stable rate (5 mL/min)
all through the culture. More exact details of all the components can be seen in the
Publication III.
Once the system was assembled, the initial pH measurements showed the system
works well technically but a few issues were noticed. One immediate observation
was Equation 21 solely cannot compensate for the effect of temperature in the pH.
Secondly, the biofouling (deposition of proteins or cell debris), on the inner walls of
the flow cell in long-term measurements seemingly affect the measurement accuracy.
So its influence at the measurement wavelengths need to be carefully studied and a
possible compensation scheme has to be figured out. In addition, the system also
required a hassle-free calibration scheme reliable enough for several days of
unattended pH measurements.
4.2. Temperature Compensation, Calibration and Humidity Monitoring
We figured out the effect of temperature can be compensated by adjusting the
dissociation constant (pKaIn) in equation 21. Therefore, a good quality temperature
sensor (TSic™ 506F/ IST-AG and W-EYK 6 PT100 Platinum temperature sensor,
Heraeus Nexensos) was added into the MO-pH and the pKaIn was adjusted in real-
time using the Van't Hoff’s correction (equilibrium constant correction) formulation
as,
𝑝𝐾𝑎𝑇2
𝐼𝑛 = 𝑝𝐾𝑎𝑇1
𝐼𝑛 + 𝑙𝑜𝑔 [𝑒−7.5(
1𝑇2
−1𝑇1
)] (22)
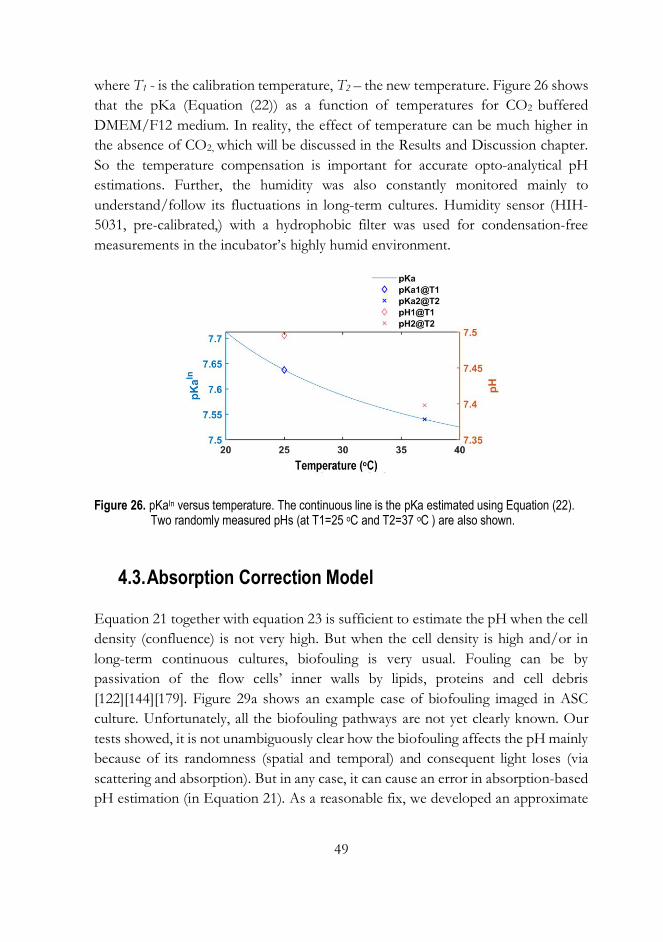
49
where T1 - is the calibration temperature, T2 – the new temperature. Figure 26 shows
that the pKa (Equation (22)) as a function of temperatures for CO2 buffered
DMEM/F12 medium. In reality, the effect of temperature can be much higher in
the absence of CO2, which will be discussed in the Results and Discussion chapter.
So the temperature compensation is important for accurate opto-analytical pH
estimations. Further, the humidity was also constantly monitored mainly to
understand/follow its fluctuations in long-term cultures. Humidity sensor (HIH-
5031, pre-calibrated,) with a hydrophobic filter was used for condensation-free
measurements in the incubator’s highly humid environment.
Figure 26. pKaIn versus temperature. The continuous line is the pKa estimated using Equation (22). Two randomly measured pHs (at T1=25 oC and T2=37 oC ) are also shown.
4.3. Absorption Correction Model
Equation 21 together with equation 23 is sufficient to estimate the pH when the cell
density (confluence) is not very high. But when the cell density is high and/or in
long-term continuous cultures, biofouling is very usual. Fouling can be by
passivation of the flow cells’ inner walls by lipids, proteins and cell debris
[122][144][179]. Figure 29a shows an example case of biofouling imaged in ASC
culture. Unfortunately, all the biofouling pathways are not yet clearly known. Our
tests showed, it is not unambiguously clear how the biofouling affects the pH mainly
because of its randomness (spatial and temporal) and consequent light loses (via
scattering and absorption). But in any case, it can cause an error in absorption-based
pH estimation (in Equation 21). As a reasonable fix, we developed an approximate
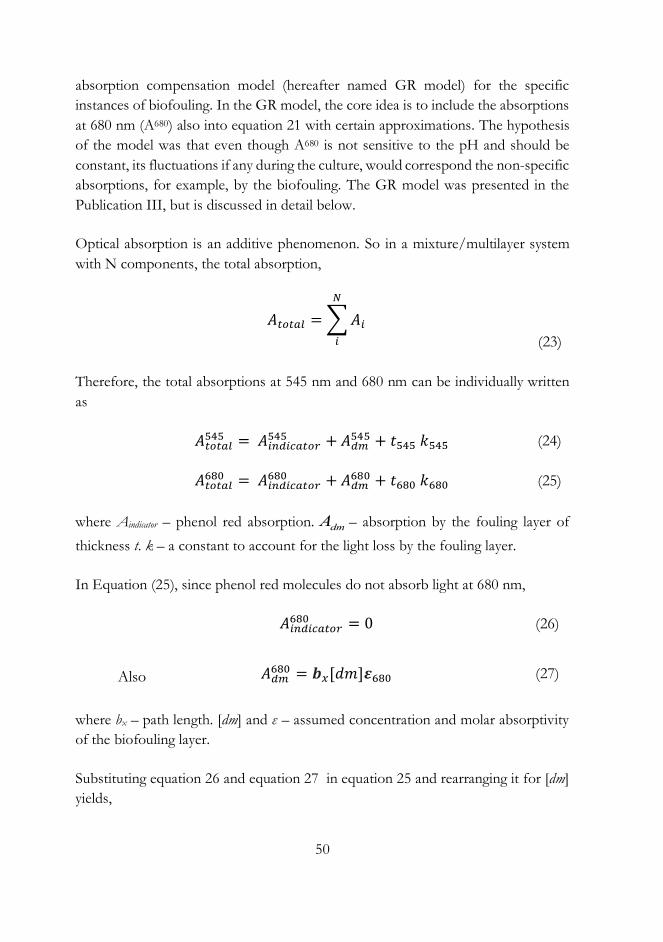
50
absorption compensation model (hereafter named GR model) for the specific
instances of biofouling. In the GR model, the core idea is to include the absorptions
at 680 nm (A680) also into equation 21 with certain approximations. The hypothesis
of the model was that even though A680 is not sensitive to the pH and should be
constant, its fluctuations if any during the culture, would correspond the non-specific
absorptions, for example, by the biofouling. The GR model was presented in the
Publication III, but is discussed in detail below.
Optical absorption is an additive phenomenon. So in a mixture/multilayer system
with N components, the total absorption,
𝐴𝑡𝑜𝑡𝑎𝑙 = ∑ 𝐴𝑖
𝑁
𝑖
(23)
Therefore, the total absorptions at 545 nm and 680 nm can be individually written
as
𝐴𝑡𝑜𝑡𝑎𝑙545 = 𝐴𝑖𝑛𝑑𝑖𝑐𝑎𝑡𝑜𝑟
545 + 𝐴𝑑𝑚545 + 𝑡545 𝑘545 (24)
𝐴𝑡𝑜𝑡𝑎𝑙680 = 𝐴𝑖𝑛𝑑𝑖𝑐𝑎𝑡𝑜𝑟
680 + 𝐴𝑑𝑚680 + 𝑡680 𝑘680 (25)
where Aindicator – phenol red absorption. dmA – absorption by the fouling layer of
thickness t. k – a constant to account for the light loss by the fouling layer.
In Equation (25), since phenol red molecules do not absorb light at 680 nm,
𝐴𝑖𝑛𝑑𝑖𝑐𝑎𝑡𝑜𝑟680 = 0 (26)
Also 𝐴𝑑𝑚680 = 𝒃𝑥[𝑑𝑚]𝜺680 (27)
where bx – path length. [dm] and ε – assumed concentration and molar absorptivity
of the biofouling layer.
Substituting equation 26 and equation 27 in equation 25 and rearranging it for [dm]
yields,
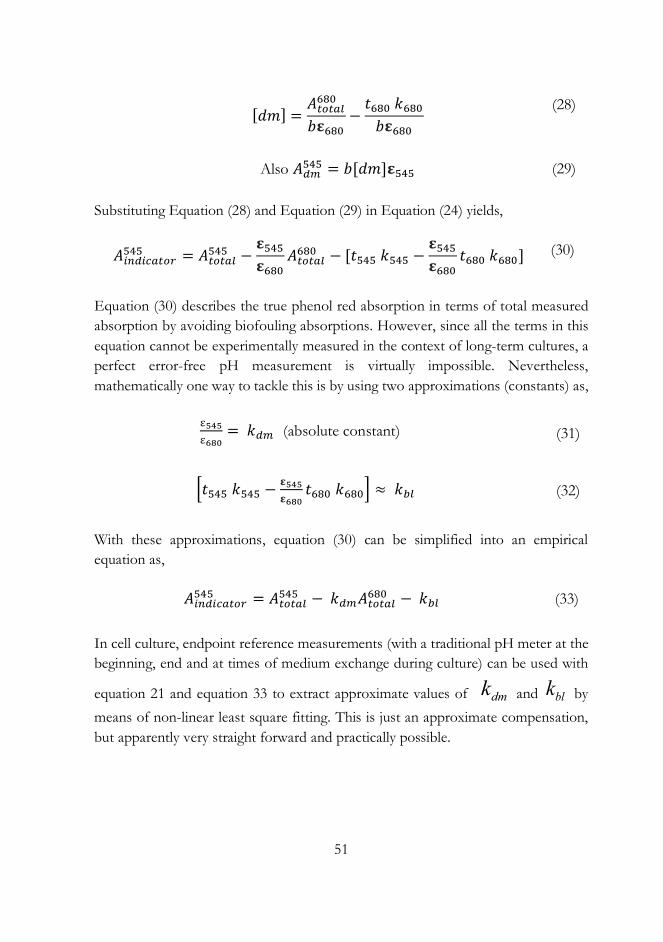
51
[𝑑𝑚] =
𝐴𝑡𝑜𝑡𝑎𝑙680
𝑏𝛆680−
𝑡680 𝑘680
𝑏𝛆680
(28)
Also 𝐴𝑑𝑚545 = 𝑏[𝑑𝑚]𝛆545
(29)
Substituting Equation (28) and Equation (29) in Equation (24) yields,
𝐴𝑖𝑛𝑑𝑖𝑐𝑎𝑡𝑜𝑟545 = 𝐴𝑡𝑜𝑡𝑎𝑙
545 −𝛆545
𝛆680𝐴𝑡𝑜𝑡𝑎𝑙
680 − [𝑡545 𝑘545 −𝛆545
𝛆680𝑡680 𝑘680] (30)
Equation (30) describes the true phenol red absorption in terms of total measured
absorption by avoiding biofouling absorptions. However, since all the terms in this
equation cannot be experimentally measured in the context of long-term cultures, a
perfect error-free pH measurement is virtually impossible. Nevertheless,
mathematically one way to tackle this is by using two approximations (constants) as,
ε545
ε680= 𝑘𝑑𝑚 (absolute constant) (31)
[𝑡545 𝑘545 −𝛆545
𝛆680𝑡680 𝑘680] ≈ 𝑘𝑏𝑙 (32)
With these approximations, equation (30) can be simplified into an empirical
equation as,
𝐴𝑖𝑛𝑑𝑖𝑐𝑎𝑡𝑜𝑟545 = 𝐴𝑡𝑜𝑡𝑎𝑙
545 − 𝑘𝑑𝑚𝐴𝑡𝑜𝑡𝑎𝑙680 − 𝑘𝑏𝑙 (33)
In cell culture, endpoint reference measurements (with a traditional pH meter at the
beginning, end and at times of medium exchange during culture) can be used with
equation 21 and equation 33 to extract approximate values of dmk and blk by
means of non-linear least square fitting. This is just an approximate compensation,
but apparently very straight forward and practically possible.

52
4.4. Results and Discussion
4.4.1. System Calibration and Real Time pH Measurements
The LED timings (on-off cycles), and data acquisitions (16 bit, @ 500Hz sampling
rate, 5 second average once in every 60 s) are controlled with a microcontroller
(Arduino Uno-R2, a custom GUI). A screenshot of the GUI is shown in Figure 27
where the raw signals and the real-time pH plot can be seen. The ’Direct Green(nA)’
and ‘Direct Red(nA)’ are the measured photocurrents corresponding to the
absorptions in the 545 nm and 680 nm channels. Additionally, an extra sensor
cassette is also included to measure the light scattered at 90o with respect to incident
light. The purpose of this measurement was to test whether the scattered light
intensity can be used to estimate (roughly) the detached components (cells, debris,
and particles). The signals from the 90o channels are labelled as ‘Scatter Green (nA)’
and ‘Scatter Red (nA)’). The results from these channels are inconclusive and not
covered in the scope of this thesis.
Figure 27. Screenshot of GUI of MO-pH system. The signals marked with ‘Direct’ are the absorption signals while the ones marked with ‘Scatter’ are the scatter signals measured at 90o C of the incident light. The real-time pH plot is shown in the bottom axis.
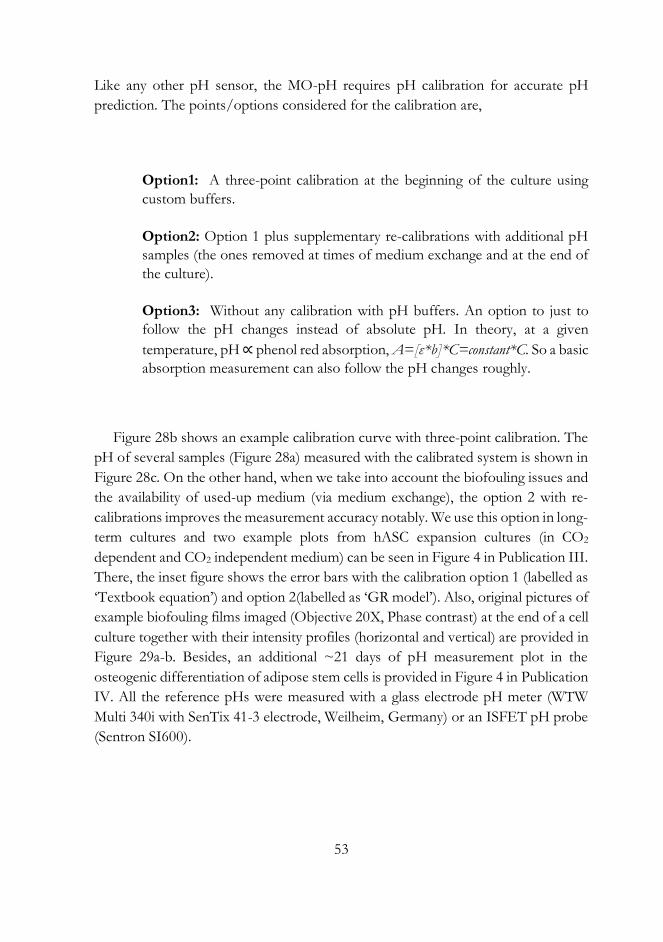
53
Like any other pH sensor, the MO-pH requires pH calibration for accurate pH
prediction. The points/options considered for the calibration are,
Option1: A three-point calibration at the beginning of the culture using
custom buffers.
Option2: Option 1 plus supplementary re-calibrations with additional pH
samples (the ones removed at times of medium exchange and at the end of
the culture).
Option3: Without any calibration with pH buffers. An option to just to
follow the pH changes instead of absolute pH. In theory, at a given
temperature, pH ∝ phenol red absorption, A=[ε*b]*C=constant*C. So a basic
absorption measurement can also follow the pH changes roughly.
Figure 28b shows an example calibration curve with three-point calibration. The
pH of several samples (Figure 28a) measured with the calibrated system is shown in
Figure 28c. On the other hand, when we take into account the biofouling issues and
the availability of used-up medium (via medium exchange), the option 2 with re-
calibrations improves the measurement accuracy notably. We use this option in long-
term cultures and two example plots from hASC expansion cultures (in CO2
dependent and CO2 independent medium) can be seen in Figure 4 in Publication III.
There, the inset figure shows the error bars with the calibration option 1 (labelled as
‘Textbook equation’) and option 2(labelled as ‘GR model’). Also, original pictures of
example biofouling films imaged (Objective 20X, Phase contrast) at the end of a cell
culture together with their intensity profiles (horizontal and vertical) are provided in
Figure 29a-b. Besides, an additional ~21 days of pH measurement plot in the
osteogenic differentiation of adipose stem cells is provided in Figure 4 in Publication
IV. All the reference pHs were measured with a glass electrode pH meter (WTW
Multi 340i with SenTix 41-3 electrode, Weilheim, Germany) or an ISFET pH probe
(Sentron SI600).

54
Figure 28. Optical pH measurements. (a) DMEM samples at various pH levels. (b) A three-point pH calibration curve. (c) Optical pH measurements with the calibrated MO-pH.
Figure 29. Biofouling in cell culture. (a-b) Original images of biolayer films on the inner wall of the flow-through cuvette after long-term adipose stem cell expansion cultures. The right-hand side images are the horizontal and vertical intensity profiles of the film across the green and blue lines on the left images.
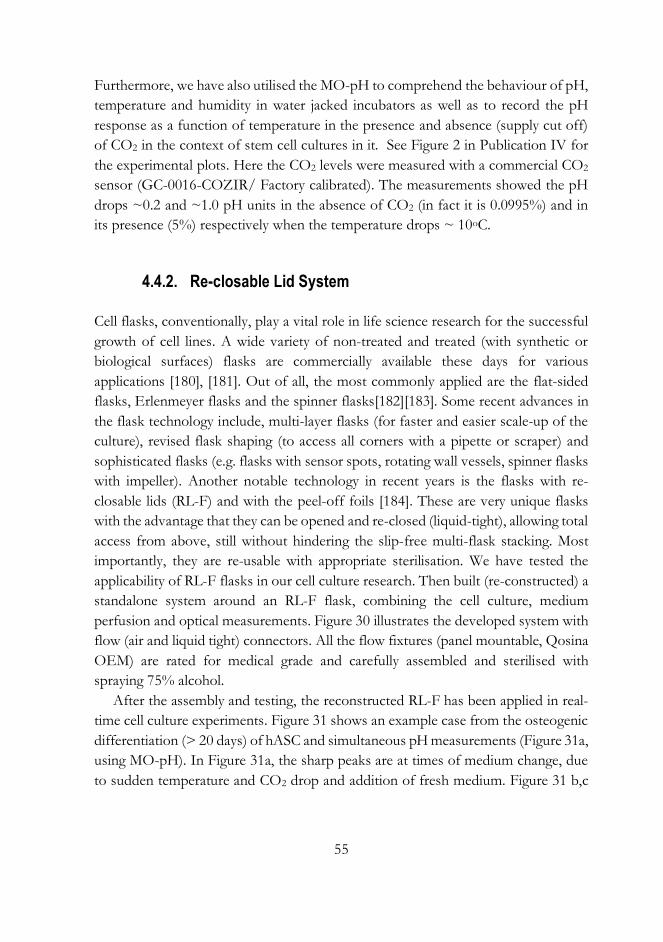
55
Furthermore, we have also utilised the MO-pH to comprehend the behaviour of pH,
temperature and humidity in water jacked incubators as well as to record the pH
response as a function of temperature in the presence and absence (supply cut off)
of CO2 in the context of stem cell cultures in it. See Figure 2 in Publication IV for
the experimental plots. Here the CO2 levels were measured with a commercial CO2
sensor (GC-0016-COZIR/ Factory calibrated). The measurements showed the pH
drops ~0.2 and ~1.0 pH units in the absence of CO2 (in fact it is 0.0995%) and in
its presence (5%) respectively when the temperature drops ~ 10oC.
4.4.2. Re-closable Lid System
Cell flasks, conventionally, play a vital role in life science research for the successful
growth of cell lines. A wide variety of non-treated and treated (with synthetic or
biological surfaces) flasks are commercially available these days for various
applications [180], [181]. Out of all, the most commonly applied are the flat-sided
flasks, Erlenmeyer flasks and the spinner flasks[182][183]. Some recent advances in
the flask technology include, multi-layer flasks (for faster and easier scale-up of the
culture), revised flask shaping (to access all corners with a pipette or scraper) and
sophisticated flasks (e.g. flasks with sensor spots, rotating wall vessels, spinner flasks
with impeller). Another notable technology in recent years is the flasks with re-
closable lids (RL-F) and with the peel-off foils [184]. These are very unique flasks
with the advantage that they can be opened and re-closed (liquid-tight), allowing total
access from above, still without hindering the slip-free multi-flask stacking. Most
importantly, they are re-usable with appropriate sterilisation. We have tested the
applicability of RL-F flasks in our cell culture research. Then built (re-constructed) a
standalone system around an RL-F flask, combining the cell culture, medium
perfusion and optical measurements. Figure 30 illustrates the developed system with
flow (air and liquid tight) connectors. All the flow fixtures (panel mountable, Qosina
OEM) are rated for medical grade and carefully assembled and sterilised with
spraying 75% alcohol.
After the assembly and testing, the reconstructed RL-F has been applied in real-
time cell culture experiments. Figure 31 shows an example case from the osteogenic
differentiation (> 20 days) of hASC and simultaneous pH measurements (Figure 31a,
using MO-pH). In Figure 31a, the sharp peaks are at times of medium change, due
to sudden temperature and CO2 drop and addition of fresh medium. Figure 31 b,c
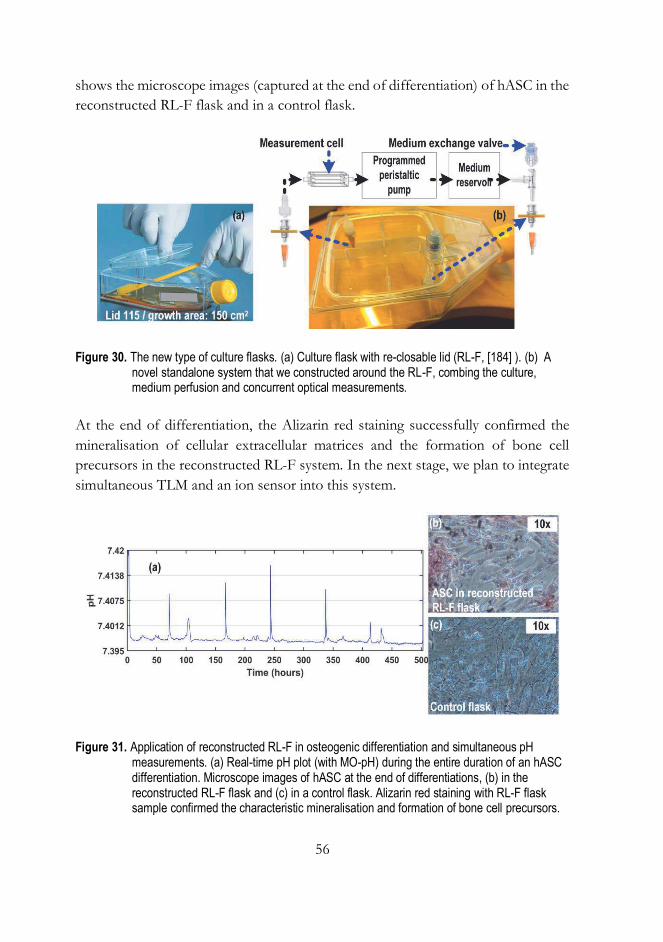
56
shows the microscope images (captured at the end of differentiation) of hASC in the
reconstructed RL-F flask and in a control flask.
Figure 30. The new type of culture flasks. (a) Culture flask with re-closable lid (RL-F, [184] ). (b) A novel standalone system that we constructed around the RL-F, combing the culture, medium perfusion and concurrent optical measurements.
At the end of differentiation, the Alizarin red staining successfully confirmed the
mineralisation of cellular extracellular matrices and the formation of bone cell
precursors in the reconstructed RL-F system. In the next stage, we plan to integrate
simultaneous TLM and an ion sensor into this system.
Figure 31. Application of reconstructed RL-F in osteogenic differentiation and simultaneous pH measurements. (a) Real-time pH plot (with MO-pH) during the entire duration of an hASC differentiation. Microscope images of hASC at the end of differentiations, (b) in the reconstructed RL-F flask and (c) in a control flask. Alizarin red staining with RL-F flask sample confirmed the characteristic mineralisation and formation of bone cell precursors.
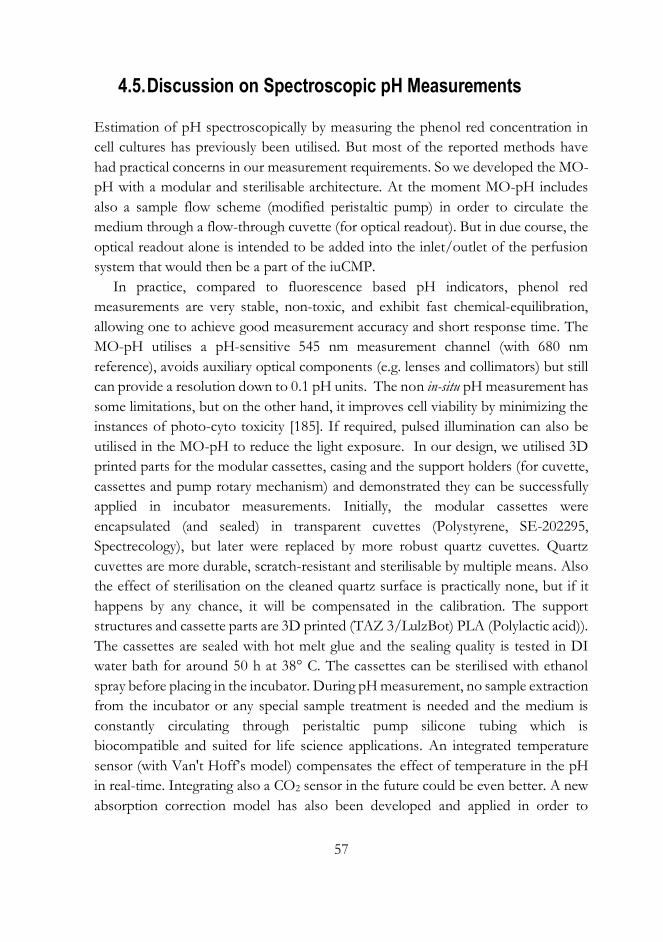
57
4.5. Discussion on Spectroscopic pH Measurements
Estimation of pH spectroscopically by measuring the phenol red concentration in
cell cultures has previously been utilised. But most of the reported methods have
had practical concerns in our measurement requirements. So we developed the MO-
pH with a modular and sterilisable architecture. At the moment MO-pH includes
also a sample flow scheme (modified peristaltic pump) in order to circulate the
medium through a flow-through cuvette (for optical readout). But in due course, the
optical readout alone is intended to be added into the inlet/outlet of the perfusion
system that would then be a part of the iuCMP.
In practice, compared to fluorescence based pH indicators, phenol red
measurements are very stable, non-toxic, and exhibit fast chemical-equilibration,
allowing one to achieve good measurement accuracy and short response time. The
MO-pH utilises a pH-sensitive 545 nm measurement channel (with 680 nm
reference), avoids auxiliary optical components (e.g. lenses and collimators) but still
can provide a resolution down to 0.1 pH units. The non in-situ pH measurement has
some limitations, but on the other hand, it improves cell viability by minimizing the
instances of photo-cyto toxicity [185]. If required, pulsed illumination can also be
utilised in the MO-pH to reduce the light exposure. In our design, we utilised 3D
printed parts for the modular cassettes, casing and the support holders (for cuvette,
cassettes and pump rotary mechanism) and demonstrated they can be successfully
applied in incubator measurements. Initially, the modular cassettes were
encapsulated (and sealed) in transparent cuvettes (Polystyrene, SE-202295,
Spectrecology), but later were replaced by more robust quartz cuvettes. Quartz
cuvettes are more durable, scratch-resistant and sterilisable by multiple means. Also
the effect of sterilisation on the cleaned quartz surface is practically none, but if it
happens by any chance, it will be compensated in the calibration. The support
structures and cassette parts are 3D printed (TAZ 3/LulzBot) PLA (Polylactic acid)).
The cassettes are sealed with hot melt glue and the sealing quality is tested in DI
water bath for around 50 h at 38° C. The cassettes can be sterilised with ethanol
spray before placing in the incubator. During pH measurement, no sample extraction
from the incubator or any special sample treatment is needed and the medium is
constantly circulating through peristaltic pump silicone tubing which is
biocompatible and suited for life science applications. An integrated temperature
sensor (with Van't Hoff’s model) compensates the effect of temperature in the pH
in real-time. Integrating also a CO2 sensor in the future could be even better. A new
absorption correction model has also been developed and applied in order to

58
minimise the errors caused by biofouling in long-term cell cultures. Nevertheless,
the colorimetric pH measurements, in general, are also prone to salt error (mild
displacement of indicator equilibrium by ionic strength, [175], [178]), protein error
(by indicator-protein binding [186], [187]) and alcohol error (equilibrium shift in
methanolic/ethanolic aqueous system, [188], [189]). But as the concentration of
neutral salts in typical stem cell cultures is fairly low (< 150 mM), the salt error
correction is unnecessary if it is below 2000 mM. Also, alcohol error is not a concern
in an alcohol-free culture. But, the protein error (depending on the type and quantity
of proteins present) may have some effect on the measurements. In general, the
simpler the protein structure the lesser the error can be [190]. But it can be difficult
to address directly in long-term cultures but our absorption correction model
indirectly addresses it reasonably well. Needless to say, contamination and microbial
growth, for example, bacterial or yeast colonies, can produce huge measurement
errors as they usually make the medium very turbid and cause erroneous absorptions
[191].
As a future perspective, the possibility of measurement of turbidity without using
complex illumination (e.g. laser diodes) is also being considered. With this focus, an
additional sensor cassette for 90o scatter measurements at two wavelengths is in
operation but the results so far are inconclusive. Another future direction is applying
a good quality camera for both turbidity imaging as well as for 2D pH mapping. In
this direction, a few image-based schemes have been tested which will be briefly
discussed in the next chapter.
4.6. Image Based pH Estimation: Experimental Trials
4.6.1. Measurements with Liquid Crystal Display (LCD) Illumination, Optical Projection Tomography (OPT) and Webcam Arrangement
The distribution of pH in tissue in-vivo is not always constant and a pH gradient of
up to 1.0 pH unit within 1 cm distance have been verified with MRI images [192].
Static pH measurements can point out systemic problems, but on the other hand, a
multipoint pH measurement (e.g. 2D pH map) can pinpoint, for example, the
location of a lesion in a tissue or the magnitude of excursion from the normal pH
[192]. 2D pH maps can also be helpful to understand a variety of common
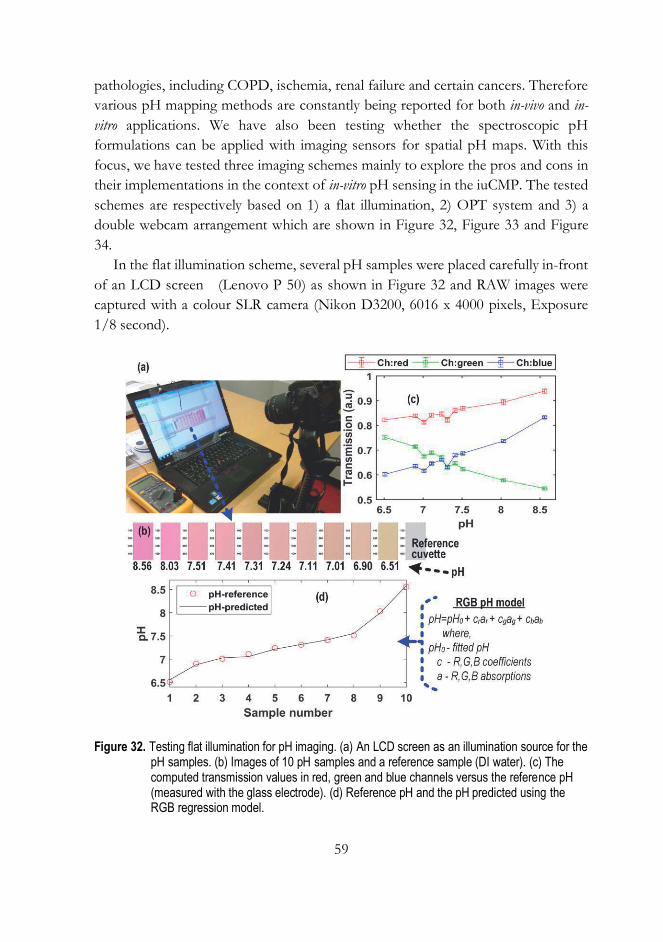
59
pathologies, including COPD, ischemia, renal failure and certain cancers. Therefore
various pH mapping methods are constantly being reported for both in-vivo and in-
vitro applications. We have also been testing whether the spectroscopic pH
formulations can be applied with imaging sensors for spatial pH maps. With this
focus, we have tested three imaging schemes mainly to explore the pros and cons in
their implementations in the context of in-vitro pH sensing in the iuCMP. The tested
schemes are respectively based on 1) a flat illumination, 2) OPT system and 3) a
double webcam arrangement which are shown in Figure 32, Figure 33 and Figure
34.
In the flat illumination scheme, several pH samples were placed carefully in-front
of an LCD screen (Lenovo P 50) as shown in Figure 32 and RAW images were
captured with a colour SLR camera (Nikon D3200, 6016 x 4000 pixels, Exposure
1/8 second).
Figure 32. Testing flat illumination for pH imaging. (a) An LCD screen as an illumination source for the pH samples. (b) Images of 10 pH samples and a reference sample (DI water). (c) The computed transmission values in red, green and blue channels versus the reference pH (measured with the glass electrode). (d) Reference pH and the pH predicted using the RGB regression model.

60
A tiny thermocouple was also attached onto the LCD screen near the cuvettes for
the temperature data. The main goal in LCD based imaging was to understand how
well the RGB levels with a flat (uniform) background illumination would correspond
to the pH changes. Figure 32b shows images of the 10 pH samples (650 x 250 pixels
each) and a reference sample (cuvette with DI water, for transmission reference).
The computed transmission values in red, green and blue channels are shown in
Figure 32c where one can see that the transmissions especially in the green and blue
channel change quite proportionally with the pH. Nevertheless, the transmission
changes in the red channel were unexpected. A linear regression RGB model with
the transmission values from all the three colour channels was applied to predict the
pH. Figure 32d shows the pH reference (measured with the glass electrode) and the
pH predicted of all the 10 samples with the RGB model.
The second imaging scheme was tested as part of a sophisticated OPT instrument
(Figure 33a) with the objective of 2D/3D pH imaging in 3D scaffolds.
Figure 33. Testing pH imaging in an optical tomographic system. (a) The OPT arrangement. (b) OPT captured images of 10 pH samples and 2 reference samples (empty, DI water) in green, red and blue illuminations. (c) The computed optical transmissions in the three illuminations: Here one can see the green and blue channels show a clear pH dependence.
The OPT instrument comprises of, mainly a monochrome camera (2048 x 2048
pixels, FOV 3 x 3 mm), a telecentric illumination and a small sample holder (typically

61
a hollow transparent plastic tube) in a water bath. For our pH tests, the OTP’s light
source was replaced with specific LEDs: green (525 nm-LC503FPG1-15Q-A3,
Cree), blue (LED435nm-12-30, Roithner LaserTechnik) and red (630 nm-HLMP-
EG1B-Z10DD - Avago). In Figure 33b, the OPT images of 10 pH samples and two
reference samples (empty, DI water filled) with green, red and blue illuminations are
provided. The computed transmission plots are shown in Figure 33c. As expected,
the transmissions with green and blue channels show a clear pH dependence while
the red illumination remained insensitive to the pH changes.
The third scheme tested was a direct culture flask imaging scheme with two
cameras. In Figure 34a, the constructed arrangement for a T25 type culture flask is
shown.
Figure 34. Testing a double webcam system for pH imaging. (a) The imaging arrangement for a T25 type culture flask with two cameras: one for sideway imaging the other one for inverted imaging. A 3D printed closable casing (painted white inside) blocks the background light. For illumination, a LED array with a diffuser glass was used. (b) Images of four pH samples captured with the side camera. (c) Computed mean intensities in red, green and blue channels in the captured images.
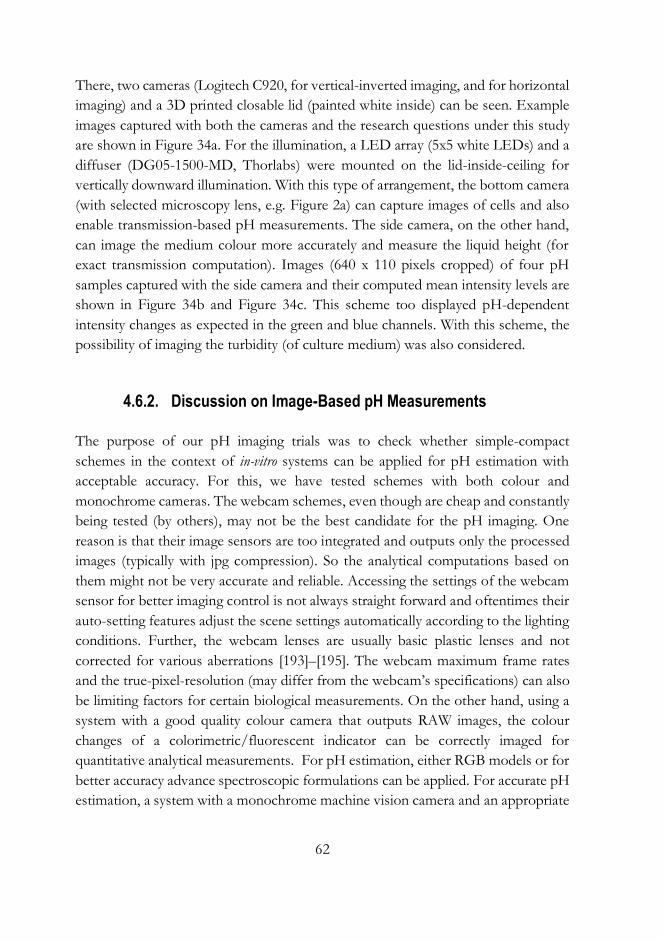
62
There, two cameras (Logitech C920, for vertical-inverted imaging, and for horizontal
imaging) and a 3D printed closable lid (painted white inside) can be seen. Example
images captured with both the cameras and the research questions under this study
are shown in Figure 34a. For the illumination, a LED array (5x5 white LEDs) and a
diffuser (DG05-1500-MD, Thorlabs) were mounted on the lid-inside-ceiling for
vertically downward illumination. With this type of arrangement, the bottom camera
(with selected microscopy lens, e.g. Figure 2a) can capture images of cells and also
enable transmission-based pH measurements. The side camera, on the other hand,
can image the medium colour more accurately and measure the liquid height (for
exact transmission computation). Images (640 x 110 pixels cropped) of four pH
samples captured with the side camera and their computed mean intensity levels are
shown in Figure 34b and Figure 34c. This scheme too displayed pH-dependent
intensity changes as expected in the green and blue channels. With this scheme, the
possibility of imaging the turbidity (of culture medium) was also considered.
4.6.2. Discussion on Image-Based pH Measurements
The purpose of our pH imaging trials was to check whether simple-compact
schemes in the context of in-vitro systems can be applied for pH estimation with
acceptable accuracy. For this, we have tested schemes with both colour and
monochrome cameras. The webcam schemes, even though are cheap and constantly
being tested (by others), may not be the best candidate for the pH imaging. One
reason is that their image sensors are too integrated and outputs only the processed
images (typically with jpg compression). So the analytical computations based on
them might not be very accurate and reliable. Accessing the settings of the webcam
sensor for better imaging control is not always straight forward and oftentimes their
auto-setting features adjust the scene settings automatically according to the lighting
conditions. Further, the webcam lenses are usually basic plastic lenses and not
corrected for various aberrations [193]–[195]. The webcam maximum frame rates
and the true-pixel-resolution (may differ from the webcam’s specifications) can also
be limiting factors for certain biological measurements. On the other hand, using a
system with a good quality colour camera that outputs RAW images, the colour
changes of a colorimetric/fluorescent indicator can be correctly imaged for
quantitative analytical measurements. For pH estimation, either RGB models or for
better accuracy advance spectroscopic formulations can be applied. For accurate pH
estimation, a system with a monochrome machine vision camera and an appropriate

63
colour illumination may be the best choice. The machine vision cameras permit
manual control of all the camera settings which is very important in accurate image
based quantitative analyses. In any pH imaging system, the implementation of a
proper illumination scheme is very critical. We have tested single LEDs, LED arrays
and LCD illumination. An interesting illumination option can be with a mini-LED-
projector where the intensity, colour and spatial distribution can be adjusted in
numerous combinations. In practical real-time pH imaging, controlling
(optically/electronically) the background illumination as well as concurrent
temperature monitoring are also essential. If multi-camera systems are appropriately
developed for in-vitro tabletop systems, it can incorporate TLM (including fluorescent
microscopy), as well as, maybe advanced features such as multi-parameter sensing,
quantitative phase recovery and movement-free 3D video microscopy.
The pH imaging results presented here are preliminary and the experiments serve
as examples highlighting a few possible practical options. More measurements,
repetitions, and further equipment development are needed for achieving rigorous
results. But the experiments showed non-fluorescent and cost-effective pH imaging
schemes could be developed and integrated into portable in-vitro systems for pH
monitoring and control. In any long-term cell experiments, two challenges any
imaging system might face are the medium evaporation (and related issues) and
bubble formation. Both of them can hinder accurate imaging, colour capture and
transmission measurements. See Figure 35 for a real case of bubble formation in a
TLM of MEF experiment and its effect on the pH prediction (Figure 35b).
Figure 35. How do bubbles hinder optical measurements? (a) A real case of an air bubble expansion (the black region) during the TLM of an MEF experiment. (b) The computed absorptions and pH from the four spatial locations marked as Loc1:4 at the left image. Here one can see that the bubble in the FOV causes a huge error in the computations.

64
In Figure 35b, the computed absorptions (and the pH) at four spatial locations
(Loc:1, 2, 3 and 4) during the TLM of ~ 2500 minutes are shown. A large bubble
gradually blocks the FOV and the light transmission, causing a huge error in the
absorption (and the pH commutation). In Figure 35b, the pH estimated are
erroneous just from the appearance of bubble onwards. As a matter of fact, a 50 %
change in light transmission would report more than 1.0 unit of pH change falsely.
Therefore the medium evaporation and bubble formations need to be carefully
controlled for accurate in-vitro image-based computations unless other ingenious
compensation techniques are available.

65
5. CONCLUSIONS
This chapter summarises the main results, provides answers to the research
questions listed in the Chapter 1.2 and discusses the limitations of the study.
5.1. Main Results
The main results and scientific contributions of this thesis are listed below
1. Constructed a good quality compact digital microscope for unstained live-
cell imaging. The imaging quality was validated using both stained
physiological samples (blood smear, skin section hair follicle and hard-
bone grinding section) and live-cells (cardiomyocytes, neurons, human
adipose stem cells (hASC) and mouse embryonic fibroblasts (MEF)).
2. Designed and assembled the interchangeable modular cell culturing
platform- iuCMP. A graphical user interface (GUI) software for the
iuCMP control and data acquisition was also scripted.
3. Scripted the beating signal analysis software CMaN with the following
specifications,
a) Extracts six separate signals of CM contractile motion in a single
processing.
b) Have features for movement centre (region of largest contractile
motion) detection and automated cluster finding.
c) Individual/batch wise processing of CM single cell or cluster
videos.
d) Offline and almost real-time automated video analysis. e) Compared to similar tools, it is several times faster, more
sensitive, computationally less expensive and allows ROI selection.
f) The signal waveform resembles an ECG waveform, corresponding to the contractile phenomena more exactly and
66
allows computation of contraction and relaxation features separately.
4. The iuCMP and CMaN have been used in a few studies/projects.
Currently, they are used in experiments to model ischemia with hiPSC-
CMs. The results are expected to provide more insight into ischemic heart
disease (IHD).
5. Conducted detailed automated temperature stressing experiments with
hiPSC-CMs. In data analysis, we showed that the relationship between
hiPSC-CM beating frequency and temperature is nonlinear and
subsequently computed the Q10 temperature coefficients. Further, we
reported the novel results of signal propagation between dissociated
clusters and their non-invasive measurements.
6. Constructed the optical non-contact pH measurement system MO-pH
using 3D printed parts and assemblies. The system is waterproof,
modular, sterilisable and suitable for real-time long-term 24/7pH
monitoring.
a. Developed a new absorption correction model to compensate for
the effect of biofouling.
b. Constructed also a new flow-through measurement and perfusion
arrangement as part of flasks with re-closable lids (RL-F).
5.2. Answering the Research Questions
Cell culture process monitoring is important to understand the cell functions,
metabolic properties as well as to improve the productivity and reproducibility.
Monitoring can be helpful not only for physiochemical or metabolite
measurements but also for a routine inspection of the substrates, electrodes,
contamination and biodegradation. Accurate process monitoring becomes
inevitable also for standardisation and regulatory agencies [196]. In many instances,
a suitable existing monitoring technology can directly be adopted. But sometimes
it becomes apparent the need to develop new methods to meet the specific
requirements. Currently, new monitoring technologies, both from the technology-

67
driven and biology-driven aspects are being developed at an ever-increasing speed.
This thesis is also in the direction of developing new technologies for cell culturing.
In a nutshell, there were two specific goals for this thesis. The first goal was to
develop an imaging module as part of/together with a tabletop modular cell culturing
system for cell experiments outside a traditional incubator. A portable multipurpose
system was envisioned. The second goal was to develop a 24/7 non-contact pH
measurement system for stem cell cultures. These two goals were pillared on five
specific research questions (see Section 1.2). In the following paragraphs, these
research questions and the details of how those questions were addressed are
discussed.
The first two research questions were
How can measurement systems with minimal disturbance to cells and
suitable for long-term studies outside a traditional incubator be created?
Can a mini phase contrast microscope with invert-upright convertibility be
developed for good quality imaging of unstained live-cells in-vitro?
To this direction, we conceptualised a tabletop, incubator-free ‘Invert-upright
microscope interchangeable modular cell culturing platform’-iuCMP with a mini-
bioreactor, digital microscope, cell-friendly monitoring systems (optical pO2 sensor,
MEA amplifier, TSP sensor) and with a cardiomyocytes functionality analysis
software. The iuCMP was first designed and optimised in SolidWorks’ 3D CAD
platform. The assembled system has been applied in various short-term and long-
term cell studies. The details of iuCMP together with the compact microscope design
was presented in Publication I. The 3D CAD design files were also published (as
Supplementary material) with this publication. In the Publication I, we demonstrated
incorporating biocompatible cell-friendly materials, good quality live-cell imaging, a
novel convertible microscopy architecture and measurement systems. The
convertible architecture enabled the system to be equally useful for both the
conventional inverted and upright (for imaging areas otherwise not accessible by
conventional microscopes) TLM applications. The imaging quality was validated
with histological specimens and with live-cell imaging of neurons, beating hiPSC-
CMs, MEFs and hASCs. The suitability of the system for long-term applications has
been verified with the orientation analysis of MEF on cellulose fibres and
cardiomyocytes imaging and beating signal analysis.
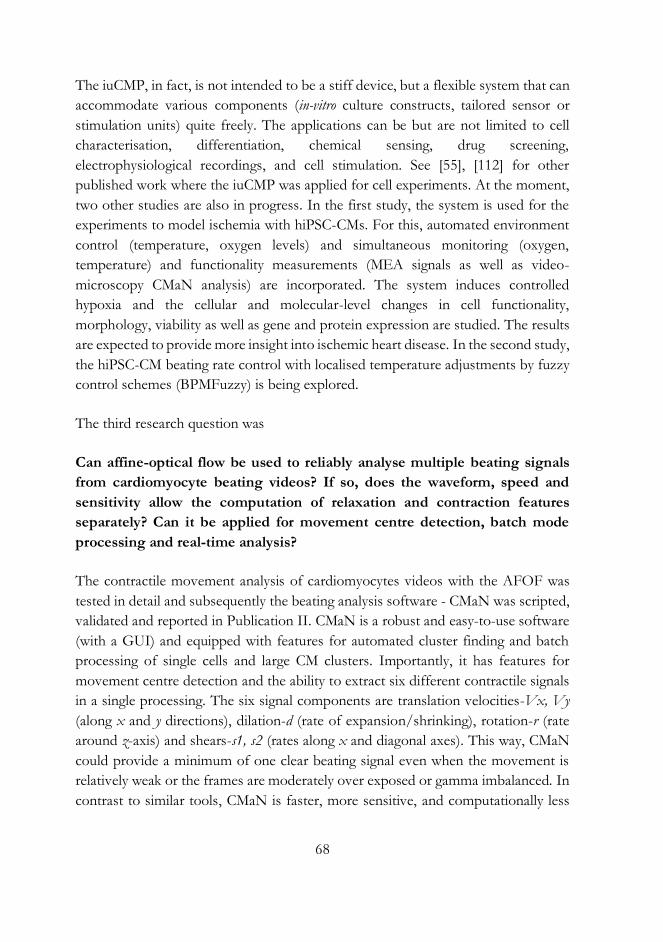
68
The iuCMP, in fact, is not intended to be a stiff device, but a flexible system that can
accommodate various components (in-vitro culture constructs, tailored sensor or
stimulation units) quite freely. The applications can be but are not limited to cell
characterisation, differentiation, chemical sensing, drug screening,
electrophysiological recordings, and cell stimulation. See [55], [112] for other
published work where the iuCMP was applied for cell experiments. At the moment,
two other studies are also in progress. In the first study, the system is used for the
experiments to model ischemia with hiPSC-CMs. For this, automated environment
control (temperature, oxygen levels) and simultaneous monitoring (oxygen,
temperature) and functionality measurements (MEA signals as well as video-
microscopy CMaN analysis) are incorporated. The system induces controlled
hypoxia and the cellular and molecular-level changes in cell functionality,
morphology, viability as well as gene and protein expression are studied. The results
are expected to provide more insight into ischemic heart disease. In the second study,
the hiPSC-CM beating rate control with localised temperature adjustments by fuzzy
control schemes (BPMFuzzy) is being explored.
The third research question was
Can affine-optical flow be used to reliably analyse multiple beating signals
from cardiomyocyte beating videos? If so, does the waveform, speed and
sensitivity allow the computation of relaxation and contraction features
separately? Can it be applied for movement centre detection, batch mode
processing and real-time analysis?
The contractile movement analysis of cardiomyocytes videos with the AFOF was
tested in detail and subsequently the beating analysis software - CMaN was scripted,
validated and reported in Publication II. CMaN is a robust and easy-to-use software
(with a GUI) and equipped with features for automated cluster finding and batch
processing of single cells and large CM clusters. Importantly, it has features for
movement centre detection and the ability to extract six different contractile signals
in a single processing. The six signal components are translation velocities-Vx, Vy
(along x and y directions), dilation-d (rate of expansion/shrinking), rotation-r (rate
around z-axis) and shears-s1, s2 (rates along x and diagonal axes). This way, CMaN
could provide a minimum of one clear beating signal even when the movement is
relatively weak or the frames are moderately over exposed or gamma imbalanced. In
contrast to similar tools, CMaN is faster, more sensitive, and computationally less
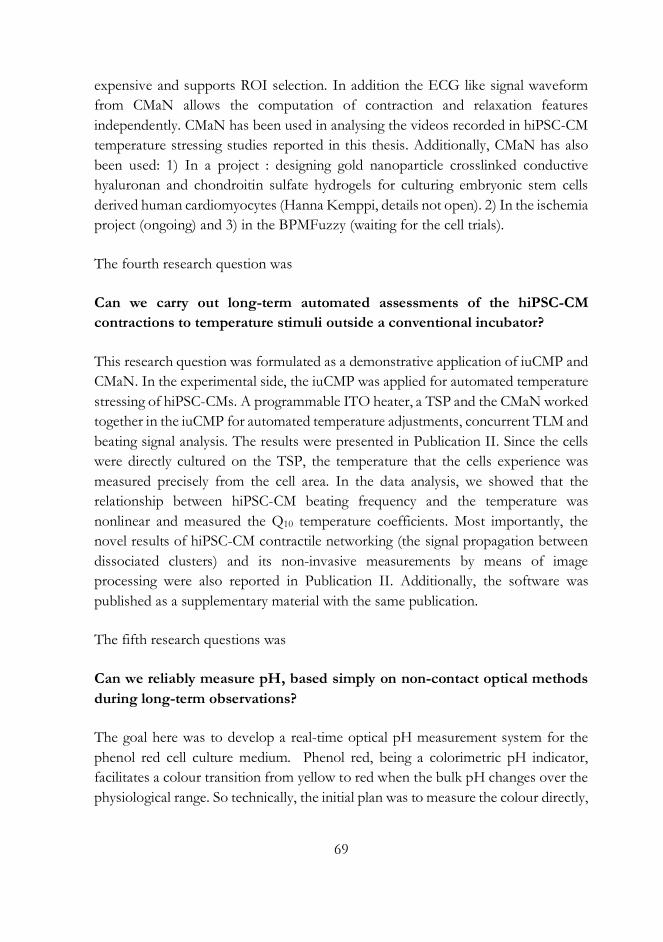
69
expensive and supports ROI selection. In addition the ECG like signal waveform
from CMaN allows the computation of contraction and relaxation features
independently. CMaN has been used in analysing the videos recorded in hiPSC-CM
temperature stressing studies reported in this thesis. Additionally, CMaN has also
been used: 1) In a project : designing gold nanoparticle crosslinked conductive
hyaluronan and chondroitin sulfate hydrogels for culturing embryonic stem cells
derived human cardiomyocytes (Hanna Kemppi, details not open). 2) In the ischemia
project (ongoing) and 3) in the BPMFuzzy (waiting for the cell trials).
The fourth research question was
Can we carry out long-term automated assessments of the hiPSC-CM
contractions to temperature stimuli outside a conventional incubator?
This research question was formulated as a demonstrative application of iuCMP and
CMaN. In the experimental side, the iuCMP was applied for automated temperature
stressing of hiPSC-CMs. A programmable ITO heater, a TSP and the CMaN worked
together in the iuCMP for automated temperature adjustments, concurrent TLM and
beating signal analysis. The results were presented in Publication II. Since the cells
were directly cultured on the TSP, the temperature that the cells experience was
measured precisely from the cell area. In the data analysis, we showed that the
relationship between hiPSC-CM beating frequency and the temperature was
nonlinear and measured the Q10 temperature coefficients. Most importantly, the
novel results of hiPSC-CM contractile networking (the signal propagation between
dissociated clusters) and its non-invasive measurements by means of image
processing were also reported in Publication II. Additionally, the software was
published as a supplementary material with the same publication.
The fifth research questions was
Can we reliably measure pH, based simply on non-contact optical methods
during long-term observations?
The goal here was to develop a real-time optical pH measurement system for the
phenol red cell culture medium. Phenol red, being a colorimetric pH indicator,
facilitates a colour transition from yellow to red when the bulk pH changes over the
physiological range. So technically, the initial plan was to measure the colour directly,
70
for example, in the medium outlet/inlet of a perfusion channel. For the colour
measurements, reflective, transmissive (absorptive) and transflective measurements
can be applied. Notably, however, the spectral transmission measurements showed
better pH measurement accuracy, repeatability and resolution. So we designed a two-
wavelength pH measurement system. The two-wavelength pH measurement
technique has previously been applied but we constructed a novel system, MO-pH
that is incubator compatible, sterilisable and suitable for long-term unattended
measurements. Its modular parts (cassettes) can be sterilised with alcohol.
Furthermore, we developed an absorption compensation model which addresses the
effect of biofouling in optical pH measurements reasonably well. Consequently, the
measurement accuracy improved notably. Currently, the MO-pH can provide a
resolution down to 0.1 pH unit in physiological pH range with mean absolute error
≤ 0.02. The MO-pH has been applied in 24/7 pH monitoring in several ASC
expansion cultures. The details were presented in Publication III. Additional long-
term pH measurement result in ASC osteogenic differentiation was presented in
Publication IV. The MO-pH has also been used in understanding the overall true
environmental (temperature, humidity and pH) behaviour in a water jacked
incubator in 2-3 weeks of continuous measurements. These results can also be seen
in the Publication IV. These measurements clearly showed the interplay between
measured parameters and possible instances of stress reactions at various stages in
the stem cell culture. In Publication IV, we also reported the pH changes as a
function of temperature in the absence and presence of CO2. All these
measurements provided a comprehensive picture of behaviour of critical control
parameters during long-term cell cultures, pointing out the need for bioprocess
systems with intelligent features, precise control, and robust cell function analysis.
These features will be crucial for maximum productivity in smart-device based
systems as well as in future organ-on-chip approaches.
5.3. Limitations of the Study
The iuCMP has been applied in various TLM studies, but the microscopy focus
drift is corrected at the moment manually once per day. Technically, z-stack imaging
is possible but it still cannot be used for automated focal drift correction at present.
Also the E-TL could have been tested for remote focus drift correction. As such the
system is a single spot TLM imaging device. For automated multisite imaging, either
require a motorised xy stage and/or multiple compact microscopes. Figure 2

71
(scheme 1 or 2) with multiple CMOS sensors (board level) may be a possible option
for this purpose. Fluorescent imaging is important in cell studies but our system lacks
it. Extra optics (filters, filter cubes), more sensitive cameras and electronics are
essential for this which may come as a separate module. There is no automated
medium exchange to remove the waste and replenish the nutrients. Also, we have
observed the instances of medium evaporation sometimes, but it may be tackled in
future with better incubator geometries or heating schemes. A few times we have
noticed the degradation/etching of micro-electrodes, likely by culture medium. In
the hiPSC-CM temperature stressing experiments only the video-based functionality
analysis was utilised. But since the studies were with cardiac stem cells,
measurements of gene or protein expressions could have been incorporated. The
phenol red-based pH measurements work only for a very narrow pH range (pH 6.8
to 8.2). One major disadvantage of this method is if the medium is very turbid, the
measurements may be unreliable. This scenario is usually associated with
contamination (bacterial, yeast etc.)[197] and is highly unlikely in sterile cultures.

72
REFERENCES
[1] F. Wang, “Culture of animal cells: A manual of basic technique, fifth edition,” In Vitro Cellular & Developmental Biology - Animal, vol. 42, no. 5, p. 169, 2006.
[2] P. E. Oomen, M. D. Skolimowski, and E. Verpoorte, “Implementing oxygen control in chip-based cell and tissue culture systems,” Lab on a Chip. 2016.
[3] A. Sarkar, “Bio Instrumentation,” in Stem Cell Culture, Discovery Publishing House, Pvt.Ltd, 2009, pp. 29–33.
[4] M. T. Jennie P. Mather, “Expression of cloned proteins in the mammalian cells,” in Large-Scale Mammalian Cell Culture Technology, V. 10., A. S. Lubiniecki, Ed. Marcel Dekker, 1990, p. 164.
[5] P. Stein, Gary S;Borowski, Maria; Luong, Mai X; Shi, Meng-Jiao; Smith, Kelly P, Vazquez, Ed., “Basic Cell Culture Growth Conditions,” in Human Stem Cell Technology and Biology: A Research Guide and Laboratory Manual, Wiley-Blackwell, 2011, pp. 34–35.
[6] R. Reig, M. Mattia, A. Compte, C. Belmonte, and M. V. Sanchez-Vives, “Temperature Modulation of Slow and Fast Cortical Rhythms,” Journal of Neurophysiology, 2010.
[7] K. Toischer, W. Zhu, M. Hünlich, B. A. Mohamed, S. Khadjeh, S. P. Reuter, K. Schäfer, D. Ramanujam, S. Engelhardt, L. J. Field, and G. Hasenfuss, “Cardiomyocyte proliferation prevents failure in pressure overload but not volume overload,” Journal of Clinical Investigation, vol. 127, no. 12, pp. 4285–4296, Dec. 2017.
[8] I. Watanabe and S. Okada, “Effects of temperature on growth rate of cultured mammalian cells (L5178Y),” The Journal of cell biology, vol. 32, no. 2, pp. 309–323, Feb. 1967.
[9] F. Triaud, D.-H. Clenet, Y. Cariou, T. Le Neel, D. Morin, and A. Truchaud, “Evaluation of Automated Cell Culture Incubators,” JALA: Journal of the Association for Laboratory Automation, vol. 8, no. 6, pp. 82–86, Dec. 2003.
[10] J. E. Swain, “Optimizing the culture environment in the IVF laboratory: impact of pH and buffer capacity on gamete and embryo quality,” Reproductive BioMedicine Online, vol. 21, pp. 6–16, 2010.
[11] J. A. Ryan, “Corning Guide for Identifying and Correcting Common Cell Growth Problems,” Corning Incorporated Life Sciences, 2019. [Online]. Available: https://beta-static.fishersci.com/content/dam/fishersci/en_US/documents/programs/scientific/technical-documents/technical-bulletins/corning-guide-identifying-cell-growth-problems-technical-bulletin.pdf. [Accessed: 12-Jan-2017].
[12] S. Fulda, A. M. Gorman, O. Hori, and A. Samali, “Cellular stress responses: cell survival and cell death.,” International journal of cell biology, vol. 2010, p. 214074,
73
2010. [13] B. Poljšak and I. Milisav, “Clinical implications of cellular stress responses,”
2012. [14] I. Milisav, “Cellular Stress Responses,” in Advances in Regenerative Medicine, InTech,
2011. [15] J. Kieninger, Y. Tamari, B. Enderle, G. Jobst, J. Sandvik, E. Pettersen, G. Urban,
J. Kieninger, Y. Tamari, B. Enderle, G. Jobst, J. A. Sandvik, E. O. Pettersen, and G. A. Urban, “Sensor Access to the Cellular Microenvironment Using the Sensing Cell Culture Flask,” Biosensors, vol. 8, no. 2, p. 44, Apr. 2018.
[16] R. G. Harrison, M. J. Greenman, F. P. Mall, and C. M. Jackson, “Observations of the living developing nerve fiber,” The Anatomical Record, vol. 1, no. 5, pp. 116–128, Jun. 1907.
[17] B. Jiang, W. Zheng, W. Zhang, and X. Jiang, “Organs on microfluidic chips: A mini review,” Science China Chemistry, vol. 57, no. 3, pp. 356–364, Mar. 2014.
[18] S. Petronis, M. Stangegaard, C. Bovöge Christensen, and M. Dufva, “Transparent polymeric cell culture chip with integrated temperature control and uniform media perfusion,” BioTechniques, vol. 40, no. 3, pp. 368–376, Mar. 2006.
[19] T. J. Nelson, A. Martinez-Fernandez, S. Yamada, Y. Ikeda, C. Perez-Terzic, and A. Terzic, “Induced pluripotent stem cells: advances to applications.,” Stem cells and cloning : advances and applications, vol. 3, pp. 29–37, Jan. 2010.
[20] G. Pasirayi, V. Auger, S. M. Scott, P. K.S.M. Rahman, M. Islam, L. O’Hare, and Z. Ali, “Microfluidic Bioreactors for Cell Culturing: A Review,” Micro and Nanosystemse, vol. 3, no. 2, pp. 137–160, Jul. 2011.
[21] K. Yum, S. G. Hong, K. E. Healy, and L. P. Lee, “Physiologically relevant organs on chips.,” Biotechnology journal, vol. 9, no. 1, pp. 16–27, Jan. 2014.
[22] J. M. (John M. . Davis, Basic cell culture : a practical approach. Oxford ;;New York : IRL Press, 1994.
[23] J. Blain Christen and A. G. Andreou, “Design, Fabrication, and Testing of a Hybrid CMOS/PDMS Microsystem for Cell Culture and Incubation,” IEEE Transactions on Biomedical Circuits and Systems, vol. 1, no. 1, pp. 3–18, Mar. 2007.
[24] D. Dutta, I. Heo, and H. Clevers, “Disease Modeling in Stem Cell-Derived 3D Organoid Systems,” Trends in Molecular Medicine. pp. 393–410, 2017.
[25] J. L. Sterneckert, P. Reinhardt, and H. R. Schöler, “Investigating human disease using stem cell models,” Nature Reviews Genetics. pp. 625–639, 2014.
[26] A. Fatehullah, S. H. Tan, and N. Barker, “Organoids as an in vitro model of human development and disease,” Nature Cell Biology. pp. 246–254, 2016.
[27] M. Mirbagheri, V. Adibnia, B. R. Hughes, S. D. Waldman, X. Banquy, and D. K. Hwang, “Advanced cell culture platforms: a growing quest for emulating natural tissues,” Materials Horizons, vol. 6, no. 1, pp. 45–71, 2019.
[28] J. S. Joseph, “Two-Dimensional (2D) and Three-Dimensional (3D) Cell Culturing in Drug Discovery,” S. T. Malindisa, Ed. Rijeka: IntechOpen, 2019, p. Ch. 2.
[29] K. Duval, H. Grover, L.-H. Han, Y. Mou, A. F. Pegoraro, J. Fredberg, and Z. Chen, “Modeling Physiological Events in 2D vs. 3D Cell Culture,” Physiology (Bethesda, Md.), vol. 32, no. 4, pp. 266–277, Jul. 2017.

74
[30] J. W. Haycock, “3D Cell Culture: A Review of Current Approaches and Techniques,” in 3D Cell Culture: Methods and Protocols, J. W. Haycock, Ed. Totowa, NJ: Humana Press, 2011, pp. 1–15.
[31] J. Hoarau-v, A. Rafii, and C. Touboul, “Halfway between 2D and Animal
Models : Are 3D Cultures the Ideal Tool to Study Cancer-Microenvironment
Interactions ?” [32] A.-J. Mäki, Modeling and Control of Microscale Cell Culture Environments Antti-Juhana
Mäki Modeling and Control of Microscale Cell Culture Environments, vol. 1557. Tampere University of Technology. Publication, 2018.
[33] M. M. Modena, K. Chawla, P. M. Misun, and A. Hierlemann, “Smart Cell Culture Systems: Integration of Sensors and Actuators into Microphysiological Systems.,” ACS chemical biology, vol. 13, no. 7, pp. 1767–1784, 2018.
[34] Nikon, “Live-Cell Imaging and Perfusion Chambers | MicroscopyU.” [Online]. Available: https://www.microscopyu.com/references/live-cell-imaging-and-perfusion-chambers. [Accessed: 01-Aug-2017].
[35] Okolab, “Microscope enclosures.” [Online]. Available: http://www.oko-lab.com/live-cell-imaging/cage-incubator/temperature-unit. [Accessed: 01-Aug-2017].
[36] S. L. Shorte and F. Frischknecht, Imaging cellular and molecular biological functions. Springer, 2007.
[37] J. L. Collins, B. van Knippenberg, K. Ding, and A. V. Kofman, “Time-Lapse Microscopy,” in Cell Culture, IntechOpen, 2019.
[38] A. G. Godin, B. Lounis, and L. Cognet, “Super-resolution microscopy approaches for live cell imaging.,” Biophysical journal, vol. 107, no. 8, pp. 1777–84, Oct. 2014.
[39] D. Jin, D. Wong, J. Li, Z. Luo, Y. Guo, B. Liu, Q. Wu, C.-M. Ho, and P. Fei, “Compact Wireless Microscope for In-Situ Time Course Study of Large Scale Cell Dynamics within an Incubator,” 2015.
[40] Ø. I. Helle, D. A. Coucheron, J.-C. Tinguely, C. I. Øie, and B. S. Ahluwalia, “Nanoscopy on-a-chip: super-resolution imaging on the millimeter scale,” Optics Express, vol. 27, no. 5, p. 6700, Mar. 2019.
[41] G. Vicidomini, P. Bianchini, and A. Diaspro, “STED super-resolved microscopy,” Nature Methods, vol. 15, no. 3. Nature Publishing Group, pp. 173–182, 01-Mar-2018.
[42] Y. S. Kim, S. Lee, J. Jung, S. Shin, H. G. Choi, G. H. Cha, W. Park, S. Lee, and Y. Park, “Combining three-dimensional quantitative phase imaging and fluorescence microscopy for the study of cell pathophysiology,” Yale Journal of Biology and Medicine, vol. 91, no. 3. Yale Journal of Biology and Medicine Inc., pp. 267–277, 01-Sep-2018.
[43] H. Li, C. Guo, D. Kim-Holzapfel, W. Li, Y. Altshuller, B. Schroeder, W. Liu, Y. Meng, J. B. French, K.-I. Takamaru, M. A. Frohman, and S. Jia, “Fast, volumetric live-cell imaging using high-resolution light-field microscopy,” Biomedical Optics Express, vol. 10, no. 1, p. 29, Jan. 2019.
[44] Y. S. Zhang, J. Ribas, A. Nadhman, J. Aleman, Š. Selimović, S. C. Lesher-Perez, T. Wang, V. Manoharan, S.-R. Shin, A. Damilano, N. Annabi, M. R. Dokmeci,

75
S. Takayama, and A. Khademhosseini, “A cost-effective fluorescence mini-microscope for biomedical applications,” Lab Chip, vol. 15, no. 18, pp. 3661–3669, 2015.
[45] M. B. Esch, T. L. King, and M. L. Shuler, “The Role of Body-on-a-Chip Devices in Drug and Toxicity Studies,” Annual Review of Biomedical Engineering, vol. 13, no. 1, pp. 55–72, Aug. 2011.
[46] N. S. Bhise, J. Ribas, V. Manoharan, Y. S. Zhang, A. Polini, S. Massa, M. R. Dokmeci, and A. Khademhosseini, “Organ-on-a-chip platforms for studying drug delivery systems,” Journal of Controlled Release, vol. 190, pp. 82–93, Sep. 2014.
[47] A. M. Ghaemmaghami, M. J. Hancock, H. Harrington, H. Kaji, and A. Khademhosseini, “Biomimetic tissues on a chip for drug discovery,” Drug Discovery Today, vol. 17, no. 3–4. pp. 173–181, 2012.
[48] C. Moraes, G. Mehta, S. C. Lesher-Perez, and S. Takayama, “Organs-on-a-Chip: A Focus on Compartmentalized Microdevices,” Annals of Biomedical Engineering, vol. 40, no. 6, pp. 1211–1227, Jun. 2012.
[49] D. Huh, G. A. Hamilton, and D. E. Ingber, “From 3D cell culture to organs-on-chips,” Trends in Cell Biology, vol. 21, no. 12, pp. 745–754, Dec. 2011.
[50] S. N. Bhatia and D. E. Ingber, “Microfluidic organs-on-chips.” [51] Y. Sei, K. Justus, P. Leduc, and Y. Kim, “Engineering living systems on chips:
From cells to human on chips,” Microfluidics and Nanofluidics, vol. 16, no. 5, pp. 907–920, May 2014.
[52] J. P. Wikswo, “The relevance and potential roles of microphysiological systems in biology and medicine,” Experimental Biology and Medicine, vol. 239, no. 9, pp. 1061–1072, 2014.
[53] Š. Selimović, M. R. Dokmeci, and A. Khademhosseini, “Organs-on-a-chip for drug discovery,” Current Opinion in Pharmacology, vol. 13, no. 5, pp. 829–833, 2013.
[54] M. L. Moya and S. C. George, “Integrating in vitro organ-specific function with the microcirculation,” Current Opinion in Chemical Engineering, vol. 3, pp. 102–111, 2014.
[55] H. Välimäki, J. Verho, J. Kreutzer, D. Kattipparambil Rajan, T. Ryynänen, M. Pekkanen-Mattila, A. Ahola, K. Tappura, P. Kallio, and J. Lekkala, “Fluorimetric oxygen sensor with an efficient optical read-out for in vitro cell models,” Sensors and Actuators B, vol. 249, pp. 738–746, 2017.
[56] D. Kattipparambil Rajan, M. Patrikoski, J. Verho, J. Sivula, H. Ihalainen, S. Miettinen, and J. Lekkala, “Optical non-contact pH measurement in cell culture with sterilizable, modular parts,” Talanta, vol. 161, pp. 755–761, Dec. 2016.
[57] I. Taurino, S. Massa, G. Sanzo, J. Aleman, B. Flavia, S. R. Shin, Y. S. Zhang, M. R. Dokmeci, G. De Micheli, S. Carrara, and A. Khademhosseini, “Platinum nanopetal-based potassium sensors for acute cell death monitoring,” RSC Advances, vol. 6, no. 46, pp. 40517–40526, 2016.
[58] I. Etaluma, “Lumascopes.” [Online]. Available: http://www.etaluma.com/products/about-lumascope-fluorescent-microscopes/. [Accessed: 03-Aug-2017].
[59] E. BioScience, “Real-time, quantitative live-cell analysis,IncuCyte ZOOM System,” 2016. [Online]. Available:

76
https://www.essenbioscience.com/media/uploads/files/8000-0333-E00-IncuCyte_ZOOM_brochure.pdf. [Accessed: 03-Aug-2017].
[60] J. H. Jung, C. Han, S. A. Lee, J. Kim, and C. Yang, “Microfluidic-integrated laser-controlled microactuators with on- chip microscopy imaging functionality.”
[61] C. Han, S. Pang, D. V. Bower, P. Yiu, and C. Yang, “Wide Field-of-View On-Chip Talbot Fluorescence Microscopy for Longitudinal Cell Culture Monitoring from within the Incubator,” Analytical Chemistry, vol. 85, no. 4, pp. 2356–2360, Feb. 2013.
[62] G. Zheng, S. A. Lee, Y. Antebi, M. B. Elowitz, and C. Yang, “The ePetri dish, an on-chip cell imaging platform based on subpixel perspective sweeping microscopy (SPSM).,” Proceedings of the National Academy of Sciences of the United States of America, vol. 108, no. 41, pp. 16889–94, Oct. 2011.
[63] J. El-Ali, P. K. Sorger, and K. F. Jensen, “Cells on chips,” Nature, vol. 442, no. 7101, pp. 403–411, Jul. 2006.
[64] W. Bishara, U. Sikora, O. Mudanyali, T.-W. Su, O. Yaglidere, S. Luckhart, and A. Ozcan, “Holographic pixel super-resolution in portable lensless on-chip microscopy using a fiber-optic array,” Lab on a Chip, vol. 11, no. 7, p. 1276, Apr. 2011.
[65] A. Greenbaum, U. Sikora, and A. Ozcan, “Field-portable wide-field microscopy of dense samples using multi-height pixel super-resolution based lensfree imaging,” Lab on a Chip, vol. 12, no. 7, p. 1242, Apr. 2012.
[66] W. Bishara, T.-W. Su, A. F. Coskun, and A. Ozcan, “Lensfree on-chip microscopy over a wide field-of-view using pixel super-resolution.,” Optics express, vol. 18, no. 11, pp. 11181–91, May 2010.
[67] Z. F. Phillips, M. Chen, L. Waller, L. Waller, C. Yang, and N. Sadras, “Single-shot quantitative phase microscopy with color-multiplexed differential phase contrast (cDPC),” PLOS ONE, vol. 12, no. 2, p. e0171228, Feb. 2017.
[68] A. Ozcan and E. McLeod, “Lensless Imaging and Sensing,” Annual Review of Biomedical Engineering, vol. 18, no. 1, pp. 77–102, Jul. 2016.
[69] H. Lee, Y. Lee, C. Song, H. R. Cho, R. Ghaffari, T. K. Choi, K. H. Kim, Y. B. Lee, D. Ling, H. Lee, S. J. Yu, S. H. Choi, T. Hyeon, and D. H. Kim, “An endoscope with integrated transparent bioelectronics and theranostic nanoparticles for colon cancer treatment,” Nature Communications, 2015.
[70] R. Singhal, Z. Orynbayeva, R. V. K. Sundaram, J. J. Niu, S. Bhattacharyya, E. A. Vitol, M. G. Schrlau, E. S. Papazoglou, G. Friedman, and Y. Gogotsi, “Multifunctional carbon-nanotube cellular endoscopes,” Nature Nanotechnology, 2011.
[71] R. Yan, J.-H. Park, Y. Choi, C.-J. Heo, S.-M. Yang, L. P. Lee, and P. Yang, “Nanowire-based single-cell endoscopy,” 2012.
[72] B. A. Flusberg, E. D. Cocker, W. Piyawattanametha, J. C. Jung, E. L. M. Cheung, and M. J. Schnitzer, “Fiber-optic fluorescence imaging.,” Nature methods, vol. 2, no. 12, pp. 941–50, Dec. 2005.
[73] M. Pierce, D. Yu, and R. Richards-Kortum, “High-resolution fiber-optic microendoscopy for in situ cellular imaging.,” Journal of visualized experiments (JoVE), no. 47, p. e2306, Jan. 2011.
77
[74] D. Shin, M. C. Pierce, A. M. Gillenwater, M. D. Williams, and R. R. Richards-Kortum, “A Fiber-Optic Fluorescence Microscope Using a Consumer-Grade Digital Camera for In Vivo Cellular Imaging,” PLoS ONE, vol. 5, no. 6, p. e11218, Jun. 2010.
[75] F. Helmchen, “Miniaturization of Fluorescence Microscopes Using Fibre Optics,” Experimental Physiology, vol. 87, no. 6, pp. 737–745, Nov. 2002.
[76] K. Bin Sung, C. Liang, M. Descour, T. Collier, M. Follen, and R. Richards-Kortum, “Fiber-optic confocal reflectance microscope with miniature objective for in vivo imaging of human tissues,” IEEE Transactions on Biomedical Engineering, vol. 49, no. 10, pp. 1168–1172, Oct. 2002.
[77] Y. Ando, T. Sakurai, K. Koida, H. Tei, A. Hida, K. Nakao, M. Natsume, and R. Numano, “In vivo bioluminescence and reflectance imaging of multiple organs in bioluminescence reporter mice by bundled-fiber-coupled microscopy,” Biomedical Optics Express, vol. 7, no. 3, p. 963, 2016.
[78] X. Meng, H. Huang, K. Yan, X. Tian, W. Yu, H. Cui, Y. Kong, L. Xue, C. Liu, and S. Wang, “Smartphone based hand-held quantitative phase microscope using the transport of intensity equation method,” Lab Chip, vol. 17, no. 1, pp. 104–109, 2017.
[79] A. Skandarajah, C. D. Reber, N. A. Switz, and D. A. Fletcher, “Quantitative imaging with a mobile phone microscope,” PLoS ONE, vol. 9, no. 5, 2014.
[80] Y. S. Zhang, J.-B. Chang, M. M. Alvarez, G. Trujillo-de Santiago, J. Aleman, B. Batzaya, V. Krishnadoss, A. A. Ramanujam, M. Kazemzadeh-Narbat, F. Chen, P. W. Tillberg, M. R. Dokmeci, E. S. Boyden, and A. Khademhosseini, “Hybrid Microscopy: Enabling Inexpensive High-Performance Imaging through Combined Physical and Optical Magnifications.,” Scientific reports, vol. 6, no. November 2015, p. 22691, 2016.
[81] M. P. Walzik, V. Vollmar, T. Lachnit, H. Dietz, S. Haug, H. Bachmann, M. Fath, D. Aschenbrenner, S. Abolpour Mofrad, O. Friedrich, and D. F. Gilbert, “A portable low-cost long-term live-cell imaging platform for biomedical research and education,” Biosensors and Bioelectronics, vol. 64, pp. 639–649, Feb. 2015.
[82] G. O. F. Parikesit, M. Darmawan, and A. Faisal, “Quantitative low-cost webcam-based microscopy,” Optical Engineering, vol. 49, no. 11, p. 113205, Nov. 2010.
[83] Jaycar, “Jaycar, 5MP USB 2.0 Digital Microscope with Professional Stand,” 2016. [Online]. Available: https://www.jaycar.com.au/5mp-usb-2-0-digital-microscope-with-professional-stand/p/QC3199. [Accessed: 17-Jul-2019].
[84] ImagingSys, “DGCUS USB 2.0 Digital Microscope 1000 x,” 2016. [Online]. Available: https://www.imagingsys.com/dgcus-usb-20-digital-microscope-1000-x-magnification-8-led-mini/. [Accessed: 31-Jul-2019].
[85] E. Laboratories, “Hybrid fluorescence microscope (upright/inverted), REVOLVE 4,” 2019. [Online]. Available: https://discover-echo.com/revolve. [Accessed: 23-May-2019].
[86] A. Courtney, L. M. Alvey, G. O. T. Merces, and M. Pickering, “The Flexiscope: a Low Cost, Flexible, Convertible, and Modular Microscope with Automated Scanning and Micromanipulation,” bioRxiv, p. 442210, Oct. 2018.
[87] S. B. Kim, K. Koo, H. Bae, M. R. Dokmeci, G. A. Hamilton, A. Bahinski, S. M.

78
Kim, D. E. Ingber, and A. Khademhosseini, “A mini-microscope for in situ monitoring of cells.,” Lab on a chip, vol. 12, no. 20, pp. 3976–82, Oct. 2012.
[88] J. Wu, L. Ouyang, N. Wadhawan, J. Li, M. Zhang, S. Liao, D. Levin, and F. Lin, “A compact microfluidic system for cell migration studies,” Biomedical Microdevices, vol. 16, no. 4, pp. 521–528, 2014.
[89] J. P. Sharkey, D. C. W. Foo, A. Kabla, J. J. Baumberg, and R. W. Bowman, “A one-piece 3D printed flexure translation stage for open-source microscopy,” Review of Scientific Instruments, vol. 87, no. 2, Feb. 2016.
[90] A. Maia Chagas, L. L. Prieto-Godino, A. B. Arrenberg, and T. Baden, “The €100 lab: A 3D-printable open-source platform for fluorescence microscopy, optogenetics, and accurate temperature control during behaviour of zebrafish, Drosophila, and Caenorhabditis elegans,” PLoS Biology, vol. 15, no. 7, p. e2002702, Jul. 2017.
[91] M. Delmans and J. Haseloff, “µCube: A Framework for 3D Printable Optomechanics,” Journal of Open Hardware, vol. 2, no. 1, pp. 1–9, May 2018.
[92] “You See Too,” 2019. [Online]. Available: http://useetoo.org/home/. [Accessed: 31-Mar-2020].
[93] “Miniscope V3 WireFree — Open Ephys.” [Online]. Available: https://open-ephys.org/miniscope-v3-wirefree. [Accessed: 31-Mar-2020].
[94] “Inscopix Miniature Microscope Technology.” [Online]. Available: https://www.inscopix.com/technology. [Accessed: 31-Mar-2020].
[95] M. Novakova, J. Bardonova, I. Provaznik, E. Taborska, H. Bochorakova, H. Paulova, and D. Horky, “Effects of voltage sensitive dye di-4-ANEPPS on guinea pig and rabbit myocardium.,” General physiology and biophysics, vol. 27, no. 1, pp. 45–54, Mar. 2008.
[96] D. Braeken, R. Huys, D. Jans, J. Loo, S. Severi, F. Vleugels, G. Borghs, G. Callewaert, and C. Bartic, “Local electrical stimulation of single adherent cells using three-dimensional electrode arrays with small interelectrode distances,” in 2009 Annual International Conference of the IEEE Engineering in Medicine and Biology Society, 2009, vol. 2009, pp. 2756–2759.
[97] A. Brüggemann, S. Stoelzle, M. George, J. C. Behrends, and N. Fertig, “Microchip Technology for Automated and Parallel Patch-Clamp Recording,” Small, vol. 2, no. 7, pp. 840–846, Jul. 2006.
[98] T. Uchida, R. Kitora, and K. Gohara, “Temperature dependence of synchronized beating of cultured neonatal rat heart-cell networks with increasing age measured by multi-electrode arrays,” Research Article Trends Med, vol. 18, no. 4, pp. 1–10, 2018.
[99] S. Nitsch, F. Braun, S. Ritter, M. Scholz, and I. S. Schroeder, “Functional video-based analysis of 3D cardiac structures generated from human embryonic stem cells,” Stem Cell Research, vol. 29, pp. 115–124, May 2018.
[100] M. Maddah, J. D. Heidmann, M. A. Mandegar, C. D. Walker, S. Bolouki, B. R. Conklin, and K. E. Loewke, “A Non-invasive Platform for Functional Characterization of Stem-Cell-Derived Cardiomyocytes with Applications in Cardiotoxicity Testing,” Stem Cell Reports, vol. 4, no. 4, pp. 621–631, Apr. 2015.
[101] T. Hayakawa, T. Kunihiro, T. Ando, S. Kobayashi, E. Matsui, H. Yada, Y. Kanda,
79
J. Kurokawa, and T. Furukawa, “Image-based evaluation of contraction–relaxation kinetics of human-induced pluripotent stem cell-derived cardiomyocytes: Correlation and complementarity with extracellular electrophysiology,” Journal of Molecular and Cellular Cardiology, vol. 77, pp. 178–191, Dec. 2014.
[102] E. K. Lee, Y. K. Kurokawa, R. Tu, S. C. George, and M. Khine, “Machine learning plus optical flow: a simple and sensitive method to detect cardioactive drugs,” Scientific Reports, vol. 5, no. 1, p. 11817, Dec. 2015.
[103] C. L. Mummery, L. Sala, B. J. Van Meer, L. G. J. Tertoolen, J. Bakkers, M. Bellin, R. P. Davis, C. Denning, M. A. E. Dieben, T. Eschenhagen, E. Giacomelli, C. Grandela, A. Hansen, E. R. Holman, M. R. M. Jongbloed, S. M. Kamel, C. D. Koopman, Q. Lachaud, I. Mannhardt, et al., “MUSCLEMOTION A Versatile Open Software Tool to Quantify Cardiomyocyte and Cardiac Muscle Contraction In Vitro and In Vivo,” 2017.
[104] C. N. Toepfer, A. Sharma, M. Cicconet, A. C. Garfinkel, M. Mücke, M. Neyazi, J. A. L. Willcox, R. Agarwal, M. Schmid, J. Rao, J. Ewoldt, O. Pourquié, A. Chopra, C. S. Chen, J. G. Seidman, and C. E. Seidman, “SarcTrack. An Adaptable Software Tool for Efficient Large-Scale Analysis of Sarcomere Function in hiPSC-Cardiomyocytes,” Circulation research, vol. 124, no. 8, pp. 1172–1183, Apr. 2019.
[105] E. Laurila, A. Ahola, J. Hyttinen, and K. Aalto-Setälä, “Methods for in vitro functional analysis of iPSC derived cardiomyocytes — Special focus on analyzing the mechanical beating behavior,” Biochimica et Biophysica Acta (BBA) - Molecular Cell Research, vol. 1863, no. 7, pp. 1864–1872, Jul. 2016.
[106] A. Ahola, A. L. Kiviaho, K. Larsson, M. Honkanen, K. Aalto-Setälä, and J. Hyttinen, “Video image-based analysis of single human induced pluripotent stem cell derived cardiomyocyte beating dynamics using digital image correlation,” BioMedical Engineering Online, vol. 13, no. 1, 2014.
[107] C. S. Chung and K. S. Campbell, “Temperature and transmural region influence functional measurements in unloaded left ventricular cardiomyocytes,” Physiological Reports, vol. 1, no. 6, pp. 1–13, 2013.
[108] R. Madonna, “Human-Induced pluripotent stem cells: In quest of clinical applications,” Molecular Biotechnology. 2012.
[109] V. K. Singh, M. Kalsan, N. Kumar, A. Saini, and R. Chandra, “Induced pluripotent stem cells: applications in regenerative medicine, disease modeling, and drug discovery,” Frontiers in Cell and Developmental Biology, 2015.
[110] D. Kattipparambil Rajan, J. Verho, J. Kreutzer, H. Valimaki, H. Ihalainen, J. Lekkala, M. Patrikoski, and S. Miettinen, “Monitoring pH, temperature and humidity in long-term stem cell culture in CO2 incubator,” in 2017 IEEE International Symposium on Medical Measurements and Applications, MeMeA 2017 - Proceedings, 2017, pp. 470–474.
[111] N. Schaible, G. Arteaga, T. Tveita, G. Sieck, T. Hoang, and Y. S. Han, “Hypothermia/rewarming disrupts excitation-contraction coupling in cardiomyocytes,” American Journal of Physiology-Heart and Circulatory Physiology, vol. 310, no. 11, pp. H1533–H1540, 2016.
80
[112] A.-J. Mäki, J. Verho, J. Kreutzer, T. Ryynänen, D. Kattipparambil Rajan, M. Pekkanen-Mattila, A. Ahola, J. Hyttinen, K. Aalto-Setälä, J. Lekkala, and P. Kallio, “A Portable Microscale Cell Culture System with Indirect Temperature Control,” SLAS TECHNOLOGY: Translating Life Sciences Innovation, vol. 23, no. 6, pp. 566–579, Dec. 2018.
[113] X. Ge, M. Hanson, H. Shen, Y. Kostov, K. A. Brorson, D. D. Frey, A. R. Moreira, and G. Rao, “Validation of an optical sensor-based high-throughput bioreactor system for mammalian cell culture,” Journal of Biotechnology, vol. 122, pp. 293–306, 2006.
[114] M. Bäcker, S. Beging, M. Biselli, A. Poghossian, J. Wang, W. Zang, P. Wagner, and M. J. Schöning, “Concept for a solid-state multi-parameter sensor system for cell-culture monitoring,” Electrochimica Acta, vol. 54, no. 25, pp. 6107–6112, Oct. 2009.
[115] “Research group: Sensor Technology and Biomeasurements (STB) - Tampere University of Technology.” [Online]. Available: https://tutcris.tut.fi/portal/en/organisations/research-group-sensor-technology-and-biomeasurements-stb(de495645-bd27-4bd0-8f41-2ef70bd1108c).html. [Accessed: 12-Oct-2019].
[116] R. Sislian, F. V. da Silva, R. Gedraite, H. Jokinen, and D. Kattipparambil Rajan, “Development of a Low-Cost Fuzzy Gain Schedule Neutralization Control System,” in Proceedings of the World Congress on Engineering and Computer Science (WCECS 2015),San Francisco, USA, 2015, vol. II, pp. 21–24.
[117] R. Sislian, F. V. da Silva, R. Gedraite, H. Jokinen, and D. Kattipparambil Rajan, “The Use of Mathematical Modeling for the Development of a Low Cost Fuzzy Gain Schedule Neutralization Control System,” in Transactions on Engineering Technologies, Singapore: Springer Singapore, 2017, pp. 525–539.
[118] T. Ryynänen, K. Nurminena, J. Hämäläinen, M. Leskelä, and J. Lekkala, “pH electrode based on ALD deposited iridium oxide,” in Procedia Engineering, 2010, vol. 5, pp. 548–551.
[119] D. Kattipparambil Rajan, J.-P. Raunio, M. T. Karjalainen, T. Ryynänen, and J. Lekkala, “Novel method for intensity correction using a simple maskless lithography device,” Sensors and Actuators A: Physical, vol. 194, pp. 40–46, May 2013.
[120] D. Kattipparambil Rajan and J. Lekkala, “A maskless exposure device for rapid photolithographic prototyping of sensor and microstructure layouts,” Procedia Engineering, vol. 5, pp. 331–334, 2010.
[121] E. B. Magnusson, S. Halldorsson, M. T. Ronan, and K. Leosson, “Real-time optical pH measurement in a standard microfluidic cell culture system,” vol. 4, no. 9, pp. 77–85, 2013.
[122] M. Naciri, D. Kuystermans, and M. Al-Rubeai, “Monitoring pH and dissolved oxygen in mammalian cell culture using optical sensors,” Cytotechnology, vol. 57, no. 3, pp. 245–250, Jul. 2008.
[123] Jim Cooper, “CO2 concentration and pH control in the cell culture laboratory,” Public Health England - GOV.UK. [Online]. Available: https://www.phe-culturecollections.org.uk/news/ecacc-news/co2-concentration-and-ph-control-

81
in-the-cell-culture-laboratory.aspx. [Accessed: 01-Apr-2020].
[124] T. Salpavaara, Timo Salpavaara Inductively Coupled Passive Resonance Sensors : Readout Methods and Applications, vol. 1524, no. 2018. 2018.
[125] K. Jan Pruszak, Máté Döbrössy, Jochen Kieninger and and G. N. Aravindalochanan, Gerald A. Urban, “Stem Cell Differentiation and Fate Specification,” in Stem Cell Engineering: Principles and Applications, Springer Heidelberg Dordrecht London New York, 2011, pp. 442–443.
[126] M. R. Koller, M. A. Palsson, I. Manchel, and B. O. Palsson, “Long-term culture-initiating cell expansion is dependent on frequent medium exchange combined with stromal and other accessory cell effects,” Blood, vol. 86, no. 5, pp. 1784 LP – 1793, Sep. 1995.
[127] T. Yao and Y. Asayama, “Animal-cell culture media: History, characteristics, and current issues,” Reproductive Medicine and Biology, vol. 16, no. 2, pp. 99–117, 2017.
[128] C. G. Mackenzie, J. B. Mackenzie, and P. Beck, “The effect of pH on growth, protein synthesis, and lipid-rich particles of cultured mammalian cells,” The Journal of Biophysical and Biochemical Cytology, vol. 9, no. 1, pp. 141 LP – 156, Jan. 1961.
[129] D. Wencel, T. Abel, and C. McDonagh, “Optical Chemical pH Sensors (Review),” Analytical Chemistry, vol. 86, no. 1, pp. 15–29, 2014.
[130] G. Nabovati, E. Ghafar-Zadeh, and M. Sawan, “A 64 pixel ISFET-based biosensor for extracellular pH gradient monitoring,” Proceedings - IEEE International Symposium on Circuits and Systems, vol. 2015-July, pp. 1762–1765, 2015.
[131] V. Saucedo, B. Wolk, A. Arroyo, and C. D. Feng, “Studying the drift of in line pH measurements in cell culture,” Biotechnology Progress, vol. 27, no. 3, pp. 885–890, May 2011.
[132] S. Lee, B. L. Ibey, G. L. Coté, and M. V. Pishko, “Measurement of pH and dissolved oxygen within cell culture media using a hydrogel microarray sensor,” Sensors and Actuators B: Chemical, vol. 128, no. 2, pp. 388–398, 2008.
[133] M. A. Hanson, X. Ge, Y. Kostov, K. A. Brorson, A. R. Moreira, and G. Rao, “Comparisons of optical pH and dissolved oxygen sensors with traditional electrochemical probes during mammalian cell culture.,” Biotechnology and bioengineering, vol. 97, no. 4, pp. 833–41, Jul. 2007.
[134] G. McMillan and J. Gray, “The Essentials of pH Measurement Design , Installation , Maintenance , and Improvement,” in International Instrumentation Symposium, 2009.
[135] K. R. Rogers and A. Mulchandani, “Biomolecular Sensing for Bioprocess and Environmental Monitoring Applications,” 1995.
[136] M. Oura, H. Kubo, S. Yamamori, S. Takeda, T. Shimizu, and T. Okano, “Development of cell culture monitoring system and novel non-contact pH
measurement.,” Conference proceedings : ... Annual International Conference of the IEEE Engineering in Medicine and Biology Society. IEEE Engineering in Medicine and Biology Society. Annual Conference, vol. 2011, pp. 22–5, 2011.
[137] J. Ehgartner, H. Wiltsche, and S. M. Borisov, “Low cost referenced luminescent imaging of oxygen and pH with a 2-CCD colour near infrared camera,” The Analyst, vol. 139, no. 19, p. 4924, Jul. 2014.
82
[138] J. Jang, S.-J. Moon, S.-H. Hong, and I.-H. Kim, “Colorimetric pH measurement of animal cell culture media,” Biotechnology Letters, vol. 32, no. 11, pp. 1599–1607, Nov. 2010.
[139] S. Capel-Cuevas, M. P. Cuéllar, I. de Orbe-Payá, M. C. Pegalajar, and L. F. Capitán-Vallvey, “Full-range optical pH sensor based on imaging techniques.,” Analytica chimica acta, vol. 681, no. 1–2, pp. 71–81, Nov. 2010.
[140] Z. Liu, J. Liu, and T. Chen, “Phenol red immobilized PVA membrane for an optical pH sensor with two determination ranges and long-term stability,” Sensors and Actuators B: Chemical, vol. 107, no. 1, pp. 311–316, May 2005.
[141] X. Xu, S. Smith, J. Urban, and Z. Cui, “An in line non-invasive optical system to monitor pH in cell and tissue culture.,” Medical engineering & physics, vol. 28, no. 5, pp. 468–74, Jun. 2006.
[142] X.-D. Wang and O. S. Wolfbeis, “Fiber-Optic Chemical Sensors and Biosensors (2008–2012),” Analytical Chemistry, vol. 85, no. 2, pp. 487–508, Jan. 2013.
[143] D. B. K. Sharma, “Ultraviolet and visible spectroscopy,” in Spectroscopy, 12th ed., Manjula Sharma, Ed. 2007, pp. 162–163.
[144] A. S. Jeevarajan, S. Vani, T. D. Taylor, and M. M. Anderson, “Continuous pH monitoring in a perfused bioreactor system using an optical pH sensor,” Biotechnology and Bioengineering, vol. 78, pp. 467–472, 2002.
[145] G. Hellé, S. Roberston, S. Cavadias, C. Mariet, and G. Cote, “Toward numerical prototyping of labs-on-chip: modeling for liquid–liquid microfluidic devices for radionuclide extraction,” Microfluidics and Nanofluidics, vol. 19, no. 5, pp. 1245–1257, 2015.
[146] D. Kattipparambil Rajan, J. Kreutzer, H. Välimäki, M. Pekkanen-Mattila, A. Ahola, A. Skogberg, K. Aalto-Setälä, H. Ihalainen, P. Kallio, and J. Lekkala, “A Portable Live-Cell Imaging System With an Invert-Upright-Convertible Architecture and a Mini-Bioreactor for Long-Term Simultaneous Cell Imaging, Chemical Sensing, and Electrophysiological Recording,” IEEE Access, vol. 6, pp. 11063–11075, 2018.
[147] D. Kattipparambil Rajan, A. J. Maki, M. Pekkanen-Mattila, J. Kreutzer, T. Ryynanen, H. Valimaki, J. Verho, J. T. Koivumaki, H. Ihalainen, K. Aalto-Setala, P. Kallio, and J. Lekkala, “Cardiomyocytes: Analysis of Temperature Response and Signal Propagation between Dissociated Clusters Using Novel Video-Based Movement Analysis Software,” IEEE Access, vol. 8, pp. 109275–109288, 2020.
[148] J. Kreutzer, L. Ylä-Outinen, P. Kärnä, T. Kaarela, J. Mikkonen, H. Skottman, S. Narkilahti, and P. Kallio, “Structured PDMS Chambers for Enhanced Human Neuronal Cell Activity on MEA Platforms,” Journal of Bionic Engineering, vol. 9, no. 1, pp. 1–10, Mar. 2012.
[149] S. S. Beauchemin and J. L. Barron, “The computation of optical flow,” ACM Computing Surveys, vol. 27, no. 3, pp. 433–466, Sep. 1995.
[150] B. K. P. Horn and B. G. Schunck, “Determining Optical Flow.” [151] D. Fleet and Y. Weiss, Optical Flow Estimation, Handbook of Mathematical Models in
Computer Vision. Springer, Heidelberg, 2005. [152] Y. David, “Affine optic flow (version 1.3),” MATLAB Central File Exchange,
2010. [Online]. Available:

83
https://se.mathworks.com/matlabcentral/fileexchange/27093-affine-optic-flow. [Accessed: 03-Mar-2017].
[153] C. Bonivento, C. Melchiorri, and H. Tolle, Advances in robotics- The ERNET Perspective; Proceedings of the Research Workshop of ERNET-European Robotics Network, Darmstadt, Germany, 1996. World Scientific, 1996.
[154] “How Transform (Coverage) works—Help _ ArcGIS for Desktop.pdf,” ESRI, 2019. [Online]. Available: http://desktop.arcgis.com/en/arcmap/10.3/tools/coverage-toolbox/how-transform-works.htm. [Accessed: 25-Aug-2019].
[155] Bnordgren, “Calculating coefficients for Affine Transformation,” Postgis, 2019. [Online]. Available: https://trac.osgeo.org/postgis/wiki/DevWikiAffineParameters. [Accessed: 25-Aug-2019].
[156] M. A. Wirth, “Texture Analysis,” 2004. [157] A. Stolzing, S. Sethe, and A. M. Scutt, “Stem cell reports,” Stem Cells and
Development, vol. 15, no. 4, pp. 478–487, Aug. 2006. [158] K. Purandhar, P. K. Jena, B. Prajapati, P. Rajput, and S. Seshadri, “Understanding
the Role of Heat Shock Protein Isoforms in Male Fertility, Aging and Apoptosis,” The World Journal of Men’s Health, vol. 32, no. 3, p. 123, Dec. 2014.
[159] M. S. Choudhery, M. Khan, R. Mahmood, S. Mohsin, S. Akhtar, F. Ali, S. N. Khan, and S. Riazuddin, “Mesenchymal stem cells conditioned with glucose depletion augments their ability to repair-infarcted myocardium,” Journal of Cellular and Molecular Medicine, vol. 16, no. 10, pp. 2518–2529, Oct. 2012.
[160] C. G. Crandall and J. González-Alonso, “Cardiovascular function in the heat-stressed human,” Acta Physiologica, vol. 199, no. 4, pp. 407–423, Aug. 2010.
[161] T. E. Wilson and C. G. Crandall, “Effect of Thermal Stress on Cardiac Function,” Exercise and Sport Sciences Reviews, vol. 39, no. 1, pp. 12–17, Jan. 2011.
[162] D. F. Wilson, “Quantifying the role of oxygen pressure in tissue function,” American Journal of Physiology-Heart and Circulatory Physiology, vol. 294, no. 1, pp. H11–H13, Jan. 2008.
[163] H. Välimäki, J. Kreutzer, J. Verho, K. Tappura, and J. Lekkala, “Fluorimetric Oxygen Sensor for in Vitro Cell Models,” in Procedia Engineering, 2016.
[164] L. F. Araujo, A. de Matos Soeiro, J. L. Fernandes, A. E. Pesaro, and C. V. Serrano, “Coronary artery disease in women: A review on prevention, pathophysiology, diagnosis, and treatment,” Vascular Health and Risk Management, vol. 2, no. 4, pp. 465–475, 2006.
[165] “Ischemic Heart Disease by National Heart Lung and Blood Institute,” 2019. [Online]. Available: https://www.nhlbi.nih.gov/health-topics/ischemic-heart-disease. [Accessed: 10-Aug-2019].
[166] N. Koitabashi, T. Danner, A. L. Zaiman, Y. M. Pinto, J. Rowell, J. Mankowski, D. Zhang, T. Nakamura, E. Takimoto, and D. A. Kass, “Pivotal role of cardiomyocyte TGF-β signaling in the murine pathological response to sustained pressure overload,” Journal of Clinical Investigation, vol. 121, no. 6, pp. 2301–2312, Jun. 2011.
[167] M. S. Mozaffari, J. Y. Liu, W. Abebe, and B. Baban, “Mechanisms of load

84
dependency of myocardial ischemia reperfusion injury.,” American journal of cardiovascular disease, vol. 3, no. 4, pp. 180–96, Nov. 2013.
[168] T. Ryynänen, M. Pekkanen-Mattila, D. Shah, J. Kreutzer, P. Kallio, J. Lekkala, and K. Aalto-Setälä, “Microelectrode array for noninvasive analysis of cardiomyocytes at the single-cell level,” Japanese Journal of Applied Physics, vol. 57, no. 11, p. 117001, Nov. 2018.
[169] A. C. Bon-Mathier, S. Rignault-Clerc, C. Bielmann, and N. Rosenblatt-Velin, “Oxygen as a key regulator of cardiomyocyte proliferation: New results about cell culture conditions!,” Biochimica et Biophysica Acta - Molecular Cell Research, vol. 1867, no. 3. Elsevier B.V., p. 118460, 01-Mar-2020.
[170] A. Carreau, B. El Hafny-Rahbi, A. Matejuk, C. Grillon, and C. Kieda, “Why is the partial oxygen pressure of human tissues a crucial parameter? Small molecules and hypoxia,” Journal of Cellular and Molecular Medicine, vol. 15, no. 6, pp. 1239–1253, Jun. 2011.
[171] J. Kreutzer, D. Shah, K. Tornberg, A.-J. Mäki, M. Pekkanen-Mattila, K. Aalto-Setälä, and P. Kallio, “Mini-incubator for prolonged hypoxia studies on MEA: Effect of hypoxia for IPSC-derived cardiomyocytes,” Frontiers in Cellular Neuroscience, vol. 12, 2018.
[172] A. Skogberg, A.-J. Mäki, M. Mettänen, P. Lahtinen, and P. Kallio, “Cellulose Nanofiber Alignment Using Evaporation-Induced Droplet-Casting, and Cell Alignment on Aligned Nanocellulose Surfaces,” Biomacromolecules, vol. 18, no. 12, pp. 3936–3953, Dec. 2017.
[173] K. Kartasalo, R.-P. Pölönen, M. Ojala, J. Rasku, J. Lekkala, K. Aalto-Setälä, and P. Kallio, “CytoSpectre: a tool for spectral analysis of oriented structures on cellular and subcellular levels,” BMC Bioinformatics, vol. 16, no. 1, p. 344, Dec. 2015.
[174] H. N. Po and N. M. Senozan, “The Henderson-Hasselbalch Equation: Its History and Limitations,” Journal of Chemical Education, vol. 78, no. 11, p. 1499, Nov. 2001.
[175] F. Lee, “Spectrophotometric Determination of Blood pH,” Journal of Biological Chemistry, vol. 236, no. 5, pp. 1589–1595, 1961.
[176] D. D. Van Slyke, L. V Hankes, and J. J. Vitols, “Photometric determination of pH with a single standard and calculation by nomogram.,” Clinical chemistry, vol. 12, no. 12, pp. 849–70, Dec. 1966.
[177] J. Sendroy and F. L. Rodkey, “Apparent Dissociation Constant of Phenol Red as Determined by Spectrophotometrometry and by Visual Colorimetry,” Clinical chemistry, vol. 7, pp. 646–54, Dec. 1961.
[178] C. Z. Lai, M. D. DeGrandpre, B. D. Wasser, T. A. Brandon, D. S. Clucas, E. J. Jaqueth, Z. D. Benson, C. M. Beatty, and R. S. Spaulding, “Spectrophotometric measurement of freshwater pH with purified meta-cresol purple and phenol red,” Limnology and Oceanography: Methods, vol. 14, no. 12, pp. 864–873, Dec. 2016.
[179] U. Kragh-Hansen and J. V. Møller, “Protein binding of small molecules,” Biochimica et Biophysica Acta (BBA) - Protein Structure, vol. 295, no. 2, pp. 447–456, Feb. 1973.
[180] VWR, “Cell culture flasks non treated or treated, sterile,” 2018. [Online].
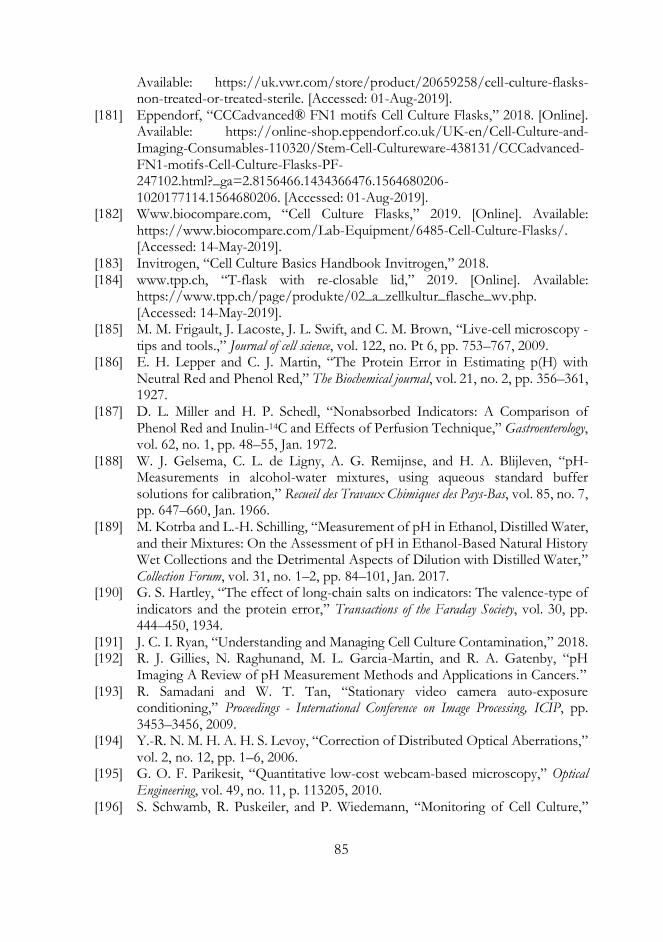
85
Available: https://uk.vwr.com/store/product/20659258/cell-culture-flasks-non-treated-or-treated-sterile. [Accessed: 01-Aug-2019].
[181] Eppendorf, “CCCadvanced® FN1 motifs Cell Culture Flasks,” 2018. [Online]. Available: https://online-shop.eppendorf.co.uk/UK-en/Cell-Culture-and-Imaging-Consumables-110320/Stem-Cell-Cultureware-438131/CCCadvanced-FN1-motifs-Cell-Culture-Flasks-PF-247102.html?_ga=2.8156466.1434366476.1564680206-1020177114.1564680206. [Accessed: 01-Aug-2019].
[182] Www.biocompare.com, “Cell Culture Flasks,” 2019. [Online]. Available: https://www.biocompare.com/Lab-Equipment/6485-Cell-Culture-Flasks/. [Accessed: 14-May-2019].
[183] Invitrogen, “Cell Culture Basics Handbook Invitrogen,” 2018. [184] www.tpp.ch, “T-flask with re-closable lid,” 2019. [Online]. Available:
https://www.tpp.ch/page/produkte/02_a_zellkultur_flasche_wv.php. [Accessed: 14-May-2019].
[185] M. M. Frigault, J. Lacoste, J. L. Swift, and C. M. Brown, “Live-cell microscopy - tips and tools.,” Journal of cell science, vol. 122, no. Pt 6, pp. 753–767, 2009.
[186] E. H. Lepper and C. J. Martin, “The Protein Error in Estimating p(H) with Neutral Red and Phenol Red,” The Biochemical journal, vol. 21, no. 2, pp. 356–361, 1927.
[187] D. L. Miller and H. P. Schedl, “Nonabsorbed Indicators: A Comparison of Phenol Red and Inulin-14C and Effects of Perfusion Technique,” Gastroenterology, vol. 62, no. 1, pp. 48–55, Jan. 1972.
[188] W. J. Gelsema, C. L. de Ligny, A. G. Remijnse, and H. A. Blijleven, “pH-Measurements in alcohol-water mixtures, using aqueous standard buffer solutions for calibration,” Recueil des Travaux Chimiques des Pays-Bas, vol. 85, no. 7, pp. 647–660, Jan. 1966.
[189] M. Kotrba and L.-H. Schilling, “Measurement of pH in Ethanol, Distilled Water, and their Mixtures: On the Assessment of pH in Ethanol-Based Natural History Wet Collections and the Detrimental Aspects of Dilution with Distilled Water,” Collection Forum, vol. 31, no. 1–2, pp. 84–101, Jan. 2017.
[190] G. S. Hartley, “The effect of long-chain salts on indicators: The valence-type of indicators and the protein error,” Transactions of the Faraday Society, vol. 30, pp. 444–450, 1934.
[191] J. C. I. Ryan, “Understanding and Managing Cell Culture Contamination,” 2018. [192] R. J. Gillies, N. Raghunand, M. L. Garcia-Martin, and R. A. Gatenby, “pH
Imaging A Review of pH Measurement Methods and Applications in Cancers.” [193] R. Samadani and W. T. Tan, “Stationary video camera auto-exposure
conditioning,” Proceedings - International Conference on Image Processing, ICIP, pp. 3453–3456, 2009.
[194] Y.-R. N. M. H. A. H. S. Levoy, “Correction of Distributed Optical Aberrations,” vol. 2, no. 12, pp. 1–6, 2006.
[195] G. O. F. Parikesit, “Quantitative low-cost webcam-based microscopy,” Optical Engineering, vol. 49, no. 11, p. 113205, 2010.
[196] S. Schwamb, R. Puskeiler, and P. Wiedemann, “Monitoring of Cell Culture,”

86
Springer, Cham, 2015, pp. 185–221. [197] R. Gustavsson, C. F. Mandenius, S. Löfgren, T. Scheper, and P. Lindner, “In situ
microscopy as online tool for detecting microbial contaminations in cell culture,” Journal of Biotechnology, vol. 296, pp. 53–60, Apr. 2019.

87
PUBLICATIONS
Publication I D. Kattipparambil Rajan, J. Kreutzer, H. Välimäki, M. Pekkanen-
Mattila, A. Ahola, A. Skogberg, K. Aalto-Setälä, H. Ihalainen, P.
Kallio, and J. Lekkala, “A Portable Live-Cell Imaging System With
an Invert-Upright-Convertible Architecture and a Mini-Bioreactor
for Long-Term Simultaneous Cell Imaging, Chemical Sensing, and
Electrophysiological Recording” IEEE Access, vol. 6, pp. 11063–
11075, 2018. (https://doi.org/10.1109/ACCESS.2018.2804378)
Publication II D. Kattipparambil Rajan, A. J. Maki, M. Pekkanen-Mattila, J.
Kreutzer, T. Ryynanen, H. Valimaki, J. Verho, J. T. Koivumaki, H.
Ihalainen, K. Aalto-Setala, P. Kallio, and J. Lekkala,
“Cardiomyocytes: Analysis of Temperature Response and Signal
Propagation between Dissociated Clusters Using Novel Video-
Based Movement Analysis Software” IEEE Access, vol. 8, pp.
109275–109288, 2020.
(https://doi.org/10.1109/ACCESS.2020.3001191)
Publication III D. Kattipparambil Rajan, M. Patrikoski, J. Verho, J. Sivula, H.
Ihalainen, S. Miettinen, and J. Lekkala, “Optical non-contact pH
measurement in cell culture with sterilizable, modular parts” Talanta,
vol. 161, pp. 755–761, Dec. 2016.
(https://doi.org/10.1016/j.talanta.2016.09.021)
Publication IV D. Kattipparambil Rajan, J. Verho, J Kreutzer, H Valimaki, H
Ihalainen, J Lekkala, M Patrikoski, S Miettinen. “Monitoring pH,
temperature and humidity in long-term stem cell culture in CO2
incubator” 2017 IEEE International Symposium on Medical
Measurements and Applications, MeMeA 2017 - Proceedings. IEEE,
pp. 470–474.
(https://doi.org/10.1109/MeMeA.2017.7985922)

88
PUBLICATION I
A portable live-cell imaging system with an invert-upright-convertible architecture and a mini-bioreactor for long-term simultaneous cell
imaging, chemical sensing, and electrophysiological recording
D. Kattipparambil Rajan, J. Kreutzer, H. Välimäki, M. Pekkanen-Mattila, A. Ahola, A.
Skogberg, K. Aalto-Setälä, H. Ihalainen, P. Kallio, and J. Lekkala.
Journal IEEE Access, vol. 6, pp.11063–11075, 2018
https://doi.org/10.1109/ACCESS.2018.2804378
©2018, IEEE. Reprinted with permission from the publisher.

A Portable Live-Cell Imaging System With anInvert-Upright-Convertible Architecture and aMini-Bioreactor for Long-Term SimultaneousCell Imaging, Chemical Sensing, andElectrophysiological RecordingDHANESH KATTIPPARAMBIL RAJAN 1, (Student Member, IEEE),JOOSE KREUTZER1, HANNU VÄLIMÄKI1, MARI PEKKANEN-MATTILA2,ANTTI AHOLA1, ANNE SKOGBERG1, KATRIINA AALTO-SETÄLÄ2,3,HEIMO IHALAINEN1, PASI KALLIO1, AND JUKKA LEKKALA11BioMediTech Institute and Faculty of Biomedical Sciences and Engineering, Tampere University of Technology, FI-33720 Tampere, Finland2BioMediTech, Faculty of Medicine and Life Sciences, University of Tampere, FI-33100 Tampere, Finland3Heart Hospital, Tampere University Hospital, FI-33521 Tampere, Finland
Corresponding author: Dhanesh Kattipparambil Rajan ([email protected])
This work was supported by the Finnish Funding Agency for Technology and Innovation (TEKES) through Human Spare Parts 2 Projectunder Grant 40332/14.
ABSTRACT Cell culture in-vitro is a well-known method to develop cell and disease models for studyingphysiologically relevant mechanisms and responses for various applications in life sciences. Conventionalmethods for instance, using static culture flasks or well plates, have limitations, as these cannot provideaccurate tractable models for advanced studies. However, microscale systems can overcome this since theymimic the cells’ natural microenvironment adequately. We have developed a portable live-cell imagingsystem with an invert-upright-convertible architecture and a mini-bioreactor for long-term simultaneouscell imaging and analysis, chemical sensing and electrophysiological recording. Our system integratesbiocompatible cell-friendly materials with modular measurement schemes and precise environment controland can be automated. High quality time-lapse cell imaging is hugely useful in cell/disease models.However, integration of advanced in-vitro systems into benchtop microscopes for in-situ imaging is trickyand challenging. This is especially true with device based biological systems, such as lab/organ/body-on-chips, ormini-bioreactors/microfluidic systems. They face issues ranging from optical and physical geometryincompatibilities to difficulties in connectivity of flow and perfusion systems. However, the novel modularsystemwe have developed either as an inverted or as an upright system can easily accommodate virtually anyin-vitro devices. Furthermore, it can accept additional sensor or measurement devices quite freely. Cell char-acterization, differentiation, chemical sensing, drug screening, microelectrode-array-electrophysiologicalrecordings, and cell stimulation can be carried out with simultaneous in-situ imaging and analysis. Moreover,our system can be configured to capture images from regions that are otherwise inaccessible by conventionalmicroscopes, for example, cells cultured on physical or biochemical sensor systems. We demonstrate thesystem for video-based beating analysis of cardiomyocytes, cell orientation analysis on nanocellulose, andsimultaneous long-term in-situ microscopy with pO2 and temperature sensing. The compact microscope assuch is comparable to standard phase-contrast-microscopes without any detectable aberrations and is usefulpractically for any in-situ microscopy demands.
INDEX TERMS Portable compact microscope, label-free long-term live-cell imaging, modular portablemicroscope for in-situ in-vitro cell imaging, portable cell culture system, portable cell culture and measure-ment system, low-cost biosensor technology.
tunnus
Text Box
This is the accepted version. For the published version and the supplementary materials follow the DOI link in the previous page.
tunnus
Text Box
VOLUME X,2018 page: x000

D. K. Rajan et al.: Portable Live-Cell Imaging System With an Invert-Upright-Convertible Architecture and a Mini-Bioreactor
I. INTRODUCTIONLive-cell microscopy is a tool used commonly in variousresearch applications and, is instrumental in investigatingnumerous intra and extra cellular dynamic processes andtheir environmental interactions. Traditional approaches tolive-cell imaging are often based on short or long- termtime-lapse microscopy (TLM) using high quality biologicalmicroscopes [1], [2]. The growing interest in this area is per-haps best evidenced by the dramatic increase in the numberof papers reporting numerous TLM studies in life sciences.In most TLMs, the cellular activity is imaged for durationsranging from milliseconds to hours in a specimen chamberwith special environment control [3], [4]. A TLM system forbiological specimens is typically equipped with a contrastenhancement technique such as, differential interference con-trast (DIC) or Hoffman modulation contrast (HMC), or fluo-rescence or phase contrast [1]. They can capture images atdefined time points to produce a TLM montage or movieto unveil dynamic biological processes. High-end systemscoupled with dedicated TLM softwares often support highframe rate movie recordings, and if desired, timely analysisof captured images during the TLM. The State-of-the-artTLM systems employ imaging modalities such as confocaland super resolution procedures in order to improve the con-trast, to reduce the photo-cytotoxicity and to capture imagesat resolutions higher than Abbe’s classical diffraction-limitedresolution [5]. The quality of TLM images by these systemsis high, however, it comes with a price; high costs and oftenthe hardware involves fairly complicated settings with largeform factors and high upkeep [6]. These systems oftentimescannot satisfy the need for high throughput observations dueto their bulky volume and limited flexibility [7]. Besides,in several device based biological systems, for example,lab/organ/body-on-chips, reaction chambers, bioreactors, andmicrofluidic culture systems, the real time processes need tobe timely imaged in in-situ. They can experience tremendouschallenges while being embedded into an off-the-shelf TLMsystem, due to issues ranging from optical and physical geom-etry incompatibility to difficulties in connectivity of flow andperfusion systems [8]–[17]. Several recent developments inphysical, chemical and biological sensors for cell culturingand cellular-tissue models are steadily being integrated intosystems for drug screening, regenerative medicine and stemcell engineering [18]–[20]. These sensors are efficient can-didates for process monitoring and environment regulation,however, most of them, unfortunately, are not compatiblewith conventional TLM hardware for synchronised imaging.Despite various TLM systems with remarkable specifica-tions being continually available in the market, still adaptingsteadily developing technologies into them is difficult andlaborious.
Breaking the barriers of achievable spatial resolution inmicroscopy is obviously important, but at the same time,the demand for miniaturized versions of biological micro-scopes with uncompromising imaging quality is also contin-ually increasing. Compact microscopes instead of high-end,
large-form-factor microscopes, are unavoidable in severalinstances, for obvious reasons, like following the biologicalevents in-situ in real time inside or outside of an incubator.Over the last years, several compact microscopes, have beendeveloped and some have been commercialised [21], [22].A number of compact systems, based on the emerging micro-scope modalities have been reported recently. The on-chipbrightfield - fluorescent microscopes [23]–[26] have success-fully demonstrated high resolution, large field-of-view (FOV)and incubator compatibility. However, the cells need to beplated on the imaging chip, making them less attractive forconventional cell culturing workflow. On the contrary, dig-ital holographic microscopy (DHM) is an excellent choicefor widefield lensless 2D/3D imaging, and numerous com-pact systems have been recently reported [27]–[29]. DHM,in general, can be implemented as a shadow or fluores-cent imaging modality either by quantitative or qualitativemeans, but in all cases, the image of the object must bereconstructed numerically from the diffraction pattern of thespecimen recorded [30], [31]. DHM, being a computationalmicroscopy, thus typically lacks the immediate visualiza-tion of the specimen, which can be cumbersome in certainbiomedical procedures [32]. Another imaging modality – theoptical projection tomography, that developed notably in thelast decade can produce 3D cell images, but apparently is notdirectly suitable for live-cell imaging. On the other hand, non-linear optical imagingmethods are suitable for live-cell imag-ing, but the miniaturization – from the instrumentation pointof view- is tricky. On the contrary, fiber optic microscopyhas remarkable advantages, but integrating fibers into cellchambers can be sometimes severely chaotic [33]–[38].In addition to downsizing the newly emerging microscopemodalities, modifying existingmicroscopymodalities to con-struct portable compact microscopes have unprecedentedpotential, especially when they are equipped with features forwireless communication, web interfacing and smart phonecompatibility. They can have widespread applications inremote cell microscopy, mobile healthcare and on-field med-ical diagnosis [39], [40]. Though several compact micro-scopes have been reported, most of them, except for afew are either bright-field or fluorescent systems [23]–[26],[39]–[41]. As live-cells are highly transparent for visiblewavelengths, the image contrast is extremely poor in bright-field systems. The contrast is greater in fluorescent systems,but staining with fluorescent markers is inevitable, whichcan sometimes be toxic and unacceptable. While chromaticaberration is visible in some of the reported cost-effectivesystems [7], controlling all the camera features in webcambased systems is not straight-forward or is sometimes impos-sible [7], [42], [43]. Besides, the maximum frame rate inweb-cam systems might be insufficient for fast dynamicrecordings.
Almost all the compact microscopes reported are intendedto be used with a specific system or for a specific purpose andnot necessarily modular for extended applications. They havebeen explicitly designed to be used either in the inverted or in
tunnus
Text Box
VOLUME X,2018 page: x000

D. K. Rajan et al.: Portable Live-Cell Imaging System With an Invert-Upright-Convertible Architecture and a Mini-Bioreactor
the upright configuration and are mutually exclusive. In thiscontext, we present a compact portable live-cell imagingsystem with a novel modular architecture, configurable eitheras an inverted or as an upright system, and with a mini biore-actor for simultaneous long-term live-cell imaging, chemi-cal sensing and electrophysiological recording. The systemconsists of a digital microscope module, an illuminationmodule, positioning and a motorized focusing stage, mini-incubator with biocompatible and cell-friendly materials,fluorometric pO2 sensor and microelectrode array (MEA)amplifier. We put forward a design where the illuminationand microscope modules can be swapped, i.e. the systemcan be converted between inverted and upright configura-tions. This architecture enables the system to be useful notonly for conventional inverted spatiotemporal cell imaging,but also as an upright system when the room below thecell platform is unavailable for inverted microscopy. Whensensors such as opto-chemical sensors [18], [19] need tobe integrated into cell platforms, ideally, they must oper-ate in close proximity of the cells, i.e typically just underthe cell platform, and resultantly, simultaneous uninterruptedinverted microscopy is practically impossible. In our design,the system can then be switched into an upright configuration,therefore, biochemical measurements conjointly with live-cell imaging becomes possible. The microscope module con-sists of mainly three optical components - a machine visioncamera, a mirror cube and a phase contrast objective. Theillumination module comprises primarily of a white LED,a LED lens, a ground glass diffuser and a projection lens.It provides a stable and reasonably safe illumination in bright-field or dark-field or phase contrast schemes. The manualxyz-stage module enables sample xy-positioning and coarsefocusing. Fine focusing is accomplished with a motorizedlinear stage. The magnification can be adjusted, primarilyby changing the objective lenses and additionally by usinglensless extension tubes. We employ highly correctedphase contrast objectives to produce high quality cellimages with minimal halo, distortion and aberration.The bioreactor assembly comprises of a transparent ITOcell heater, a mini-incubator with polydimethylsiloxane(PDMS) cell chamber [44], [45] and gas supply forCO2 buffering.
In the following, we first present a detailed construc-tion of the developed modular microscopy system. Then themicroscopy characterization and system performance results,based on studies with a resolution test-target and stainedhistology specimens, are shown. In the live-cell microscopysection, we study the system performance in different con-figurations when imaging a set of unstained cells. Thenwe show the results from orientation analysis of fibrob-lasts, long term video-based beating analysis of cardiomy-ocytes and an excerpt from simultaneous pO2 sensing andTLM study. We complete the paper by experimenting thez-stack capabilities of the system and, finally we discuss theresults.
FIGURE 1. Modular microscopy schematic arrangement for (a) invertedmicroscopy and (b) upright microscopy with optical fluorometric oxygensensor and MEA amplifier.
II. MODULAR CELL CULTURING SYSTEM ASSEMBLYThe modular system is schemed in FIGURE 1. Thewhole system was designed utilizing 3D computer-aideddesign (CAD) in Solidworks R©. Firstly, the 3D models ofsuitable commercially available opto-mechanical parts wereimported into the design, and the remaining parts were cus-tom designed (anodised aluminium). The sub-assemblies ofthe final interchangeable assembly (see FIGURE 2) are: acamera module, an illumination module, a manual xyz-stagemodule, a motorized focus stage, PDMS mini-incubator,pO2 sensor as well as a MEA amplifier with its holder.An original photograph of the final assembly is shown inFIGURE 2e. The details of each module are separatelydescribed in the following paragraphs. Check the supplemen-tary materials section for system design CAD files.
A. CAMERA MODULEA high quality digital microscope is constructed usingan achromat phase contrast objective, a mirror cube(CCM1-E02/M-Thorlabs) and a machine vision camera.The microscope assembly is illustrated in FIGURE 3a.Two adapters (SM1A10-Thorlabs) and a coupler(CMT2-Thorlabs) are used for coupling the parts in theassembly. A camera with internal C or CS mount in the frontaperture is required in the design. In the experiments dis-cussed later, monochrome (>40 frames-per-second) or colourcamera was used depending on the nature of application andintended analysis. The machine vision camera and the objec-tive lens are mounted perpendicular to each other through themirror cube. This geometry keeps the digital microscope verycompact and facilitates a fixed mounting hole for objectivesin the imaging plane. Moreover, it provides a great deal ofspace perpendicular to the imaging plane for additionaloptics. The mirror cube can be locked in its holder(FIGURE 2), either in upward or downward direction, respec-tively for inverted or upright microscopy. The cube holder’srail carrier head (dovetail RC2-Thorlabs, FIGURE 2a) allowsupward or downward wobble-free translation of the holderand allows to lock it securely at any place along the lengthof the corresponding dovetail rail (RLA1200-Thorlabs,FIGURE 2a). Further, with this mechanism, the camera
tunnus
Text Box
VOLUME X,2018 page: x000
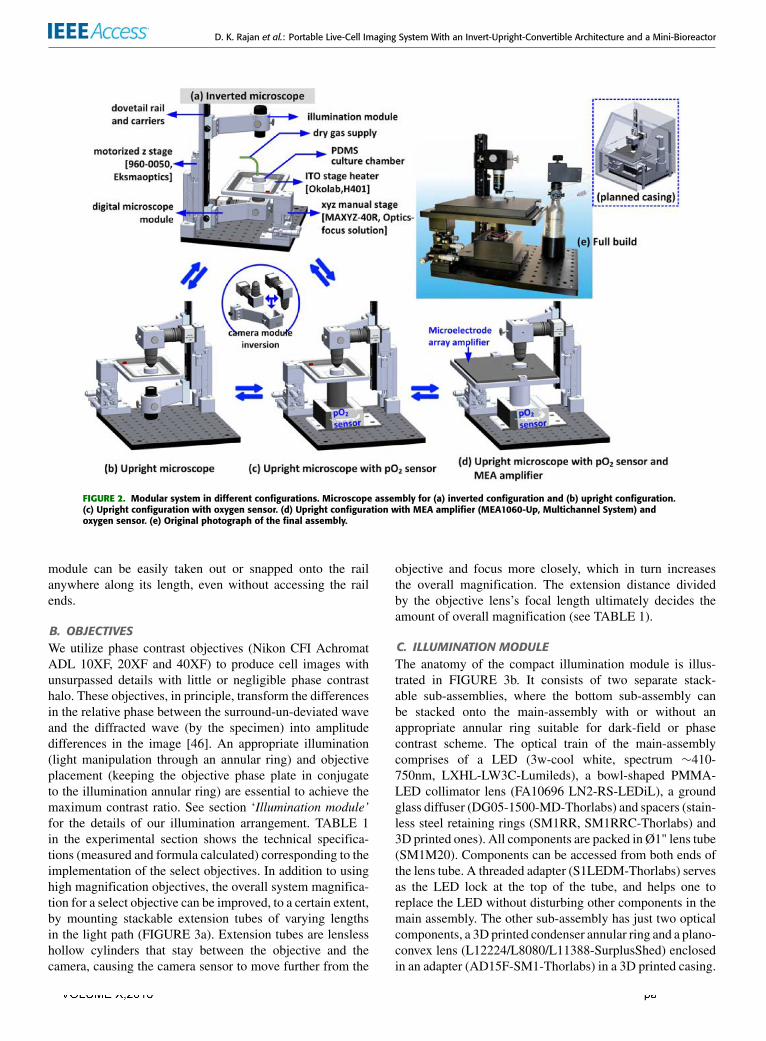
D. K. Rajan et al.: Portable Live-Cell Imaging System With an Invert-Upright-Convertible Architecture and a Mini-Bioreactor
FIGURE 2. Modular system in different configurations. Microscope assembly for (a) inverted configuration and (b) upright configuration.(c) Upright configuration with oxygen sensor. (d) Upright configuration with MEA amplifier (MEA1060-Up, Multichannel System) andoxygen sensor. (e) Original photograph of the final assembly.
module can be easily taken out or snapped onto the railanywhere along its length, even without accessing the railends.
B. OBJECTIVESWe utilize phase contrast objectives (Nikon CFI AchromatADL 10XF, 20XF and 40XF) to produce cell images withunsurpassed details with little or negligible phase contrasthalo. These objectives, in principle, transform the differencesin the relative phase between the surround-un-deviated waveand the diffracted wave (by the specimen) into amplitudedifferences in the image [46]. An appropriate illumination(light manipulation through an annular ring) and objectiveplacement (keeping the objective phase plate in conjugateto the illumination annular ring) are essential to achieve themaximum contrast ratio. See section ‘Illumination module’for the details of our illumination arrangement. TABLE 1in the experimental section shows the technical specifica-tions (measured and formula calculated) corresponding to theimplementation of the select objectives. In addition to usinghigh magnification objectives, the overall system magnifica-tion for a select objective can be improved, to a certain extent,by mounting stackable extension tubes of varying lengthsin the light path (FIGURE 3a). Extension tubes are lenslesshollow cylinders that stay between the objective and thecamera, causing the camera sensor to move further from the
objective and focus more closely, which in turn increasesthe overall magnification. The extension distance dividedby the objective lens’s focal length ultimately decides theamount of overall magnification (see TABLE 1).
C. ILLUMINATION MODULEThe anatomy of the compact illumination module is illus-trated in FIGURE 3b. It consists of two separate stack-able sub-assemblies, where the bottom sub-assembly canbe stacked onto the main-assembly with or without anappropriate annular ring suitable for dark-field or phasecontrast scheme. The optical train of the main-assemblycomprises of a LED (3w-cool white, spectrum ∼410-750nm, LXHL-LW3C-Lumileds), a bowl-shaped PMMA-LED collimator lens (FA10696 LN2-RS-LEDiL), a groundglass diffuser (DG05-1500-MD-Thorlabs) and spacers (stain-less steel retaining rings (SM1RR, SM1RRC-Thorlabs) and3D printed ones). All components are packed in Ø1" lens tube(SM1M20). Components can be accessed from both ends ofthe lens tube. A threaded adapter (S1LEDM-Thorlabs) servesas the LED lock at the top of the tube, and helps one toreplace the LED without disturbing other components in themain assembly. The other sub-assembly has just two opticalcomponents, a 3D printed condenser annular ring and a plano-convex lens (L12224/L8080/L11388-SurplusShed) enclosedin an adapter (AD15F-SM1-Thorlabs) in a 3D printed casing.
tunnus
Text Box
VOLUME X,2018 page: x000
tunnus
Text Box
VOLUME X,2018 page: x000

D. K. Rajan et al.: Portable Live-Cell Imaging System With an Invert-Upright-Convertible Architecture and a Mini-Bioreactor
TABLE 1. Modular microscope optical performance specifications, measured and estimated in air (at wavelength 550nm).
FIGURE 3. Compact microscopy parts. (a) Component assembly of thedigital microscope. (b) anatomy of the illumination module. Here,the bottom sub-assembly is stackable onto the main assembly. Thisenables easy replacement of the condenser annule while the objectivelens is changed. The S1LEDM-adapter functions as a lock fortesting or replacing of LEDs (prefer star type or 5mm through hole-LEDs).
The diffuser in the light path is critical for a highly homoge-nous illumination for high contrast imaging. A diffuser with1500 grits was specifically selected after several cell-imagingtrials to accomplish the greatest possible contrast. The illu-mination module has a variable NA (0.08 - 0.27) and amatching annule needs to be inserted into the sub-assemblyonce the objective is changed. The illumination module to thespecimen distance is adjusted freely to take full advantage ofthe NA.
D. STAGE MODULE AND MOTORIZED FOCUSING STAGEA manual xyz-stage (MAXYZ-40R, Optics-focus solution,see FIGURE 2a) with micrometer head screws, is includedin the set-up for coarse focusing and sample positioning(x, y = ±6.5mm, z = 10mm, resolution = 10 µm).A custom machined metallic frame with a rectangular slot ismounted onto the xyz-stage where, a standard k-frame trans-parent stage heater (Okolab, H401) can be loaded and locked.Once the camera and illumination modules are appropri-ately positioned on the dovetail rail and is coarsely focused,the motorized fine focusing is carried out from the soft-ware side. The narrowmotorized translation stage (960-0050,Eksma Optics, see FIGURE 2a) enables fine focusing(z = 50mm, resolution= 1.25µm [full steps]) at amaximumspeed of 5 mm/s. Furthermore, a specific stepper controller(980-0045-USB-Eksmaoptics), is also capable of dividing the
full steps upto 1/256 step/div for sub-micron stack acqui-sitions. The mechanical limit switches on the translationstage establish reference positions with an accuracy of severalmotor steps and assists emergency stopping.
E. FLUOROMETRIC pO2 SENSOR AND MEA AMPLIFIERThe pO2 sensing is based on phase-fluorimetric detection,where oxygen sensitive dyes, such as platinum(II) octaethyl-porphyrinketone are embedded in a thin, gas permeable poly-mer film (polystyrene) and then the pO2 sensitive phasedifference between the fluorescence emission and excitationsignal are read [47]. For this purpose, we applied a super crit-ical angle read-out scheme based on an in-contact paraboliclens [18], which has a high emission collection efficiencyand, moreover, facilitates efficient total internal reflectionexcitation. These features make the detection insensitive tobiofouling or other optical changes in the sensing surfaceand, more importantly, greatly reduces the amount of opticalpower radiated into the cell culture chamber. In addition,the set-up leaves room for microscopy illumination in thecentre of the cell chamber.
The MEA amplifier (bandwidth: 1Hz-3 kHz, gain:100-5000) is suitable for 49 mm × 49 mm MEA plateswith 8x8 grid configuration for multisite, parallel electro-physiological recording. When the amplifier lid is closed,the contact pins are pressed onto the MEA contact padswhich establishes the signal connectivity. The selected MEAamplifier ensures very high signal-to-noise ratio since theamplifier electronics stays very close to theMEAplate. Exter-nal ITO heater can be avoided in MEA measurements as itsintegrated heating element and temperature sensor serves thepurpose. Electrophysiological measurements combined withmorphological or chemical sensing or fluorescence readoutsand multisite stimulations can be efficiently carried out in themodular system.
F. INTERCHANGING BETWEEN INVERT AND UPRIGHTMICROSCOPY CONFIGURATIONSThe procedures involved in changing the microscope frominvert to upright scheme are illustrated in the FIGURE 2a-c.Firstly, the digital microscope mirror cube is reversed in the
tunnus
Text Box
VOLUME X,2018 page: x000
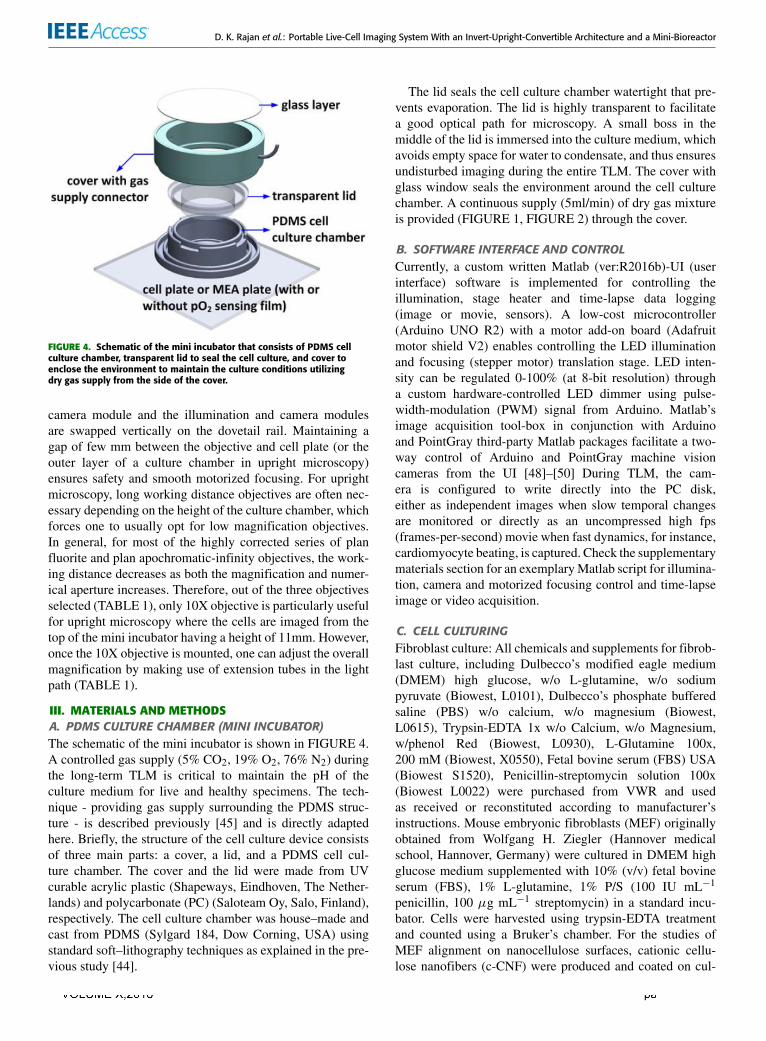
D. K. Rajan et al.: Portable Live-Cell Imaging System With an Invert-Upright-Convertible Architecture and a Mini-Bioreactor
FIGURE 4. Schematic of the mini incubator that consists of PDMS cellculture chamber, transparent lid to seal the cell culture, and cover toenclose the environment to maintain the culture conditions utilizingdry gas supply from the side of the cover.
camera module and the illumination and camera modulesare swapped vertically on the dovetail rail. Maintaining agap of few mm between the objective and cell plate (or theouter layer of a culture chamber in upright microscopy)ensures safety and smooth motorized focusing. For uprightmicroscopy, long working distance objectives are often nec-essary depending on the height of the culture chamber, whichforces one to usually opt for low magnification objectives.In general, for most of the highly corrected series of planfluorite and plan apochromatic-infinity objectives, the work-ing distance decreases as both the magnification and numer-ical aperture increases. Therefore, out of the three objectivesselected (TABLE 1), only 10X objective is particularly usefulfor upright microscopy where the cells are imaged from thetop of the mini incubator having a height of 11mm. However,once the 10X objective is mounted, one can adjust the overallmagnification by making use of extension tubes in the lightpath (TABLE 1).
III. MATERIALS AND METHODSA. PDMS CULTURE CHAMBER (MINI INCUBATOR)The schematic of the mini incubator is shown in FIGURE 4.A controlled gas supply (5% CO2, 19% O2, 76% N2) duringthe long-term TLM is critical to maintain the pH of theculture medium for live and healthy specimens. The tech-nique - providing gas supply surrounding the PDMS struc-ture - is described previously [45] and is directly adaptedhere. Briefly, the structure of the cell culture device consistsof three main parts: a cover, a lid, and a PDMS cell cul-ture chamber. The cover and the lid were made from UVcurable acrylic plastic (Shapeways, Eindhoven, The Nether-lands) and polycarbonate (PC) (Saloteam Oy, Salo, Finland),respectively. The cell culture chamber was house–made andcast from PDMS (Sylgard 184, Dow Corning, USA) usingstandard soft–lithography techniques as explained in the pre-vious study [44].
The lid seals the cell culture chamber watertight that pre-vents evaporation. The lid is highly transparent to facilitatea good optical path for microscopy. A small boss in themiddle of the lid is immersed into the culture medium, whichavoids empty space for water to condensate, and thus ensuresundisturbed imaging during the entire TLM. The cover withglass window seals the environment around the cell culturechamber. A continuous supply (5ml/min) of dry gas mixtureis provided (FIGURE 1, FIGURE 2) through the cover.
B. SOFTWARE INTERFACE AND CONTROLCurrently, a custom written Matlab (ver:R2016b)-UI (userinterface) software is implemented for controlling theillumination, stage heater and time-lapse data logging(image or movie, sensors). A low-cost microcontroller(Arduino UNO R2) with a motor add-on board (Adafruitmotor shield V2) enables controlling the LED illuminationand focusing (stepper motor) translation stage. LED inten-sity can be regulated 0-100% (at 8-bit resolution) througha custom hardware-controlled LED dimmer using pulse-width-modulation (PWM) signal from Arduino. Matlab’simage acquisition tool-box in conjunction with Arduinoand PointGray third-party Matlab packages facilitate a two-way control of Arduino and PointGray machine visioncameras from the UI [48]–[50] During TLM, the cam-era is configured to write directly into the PC disk,either as independent images when slow temporal changesare monitored or directly as an uncompressed high fps(frames-per-second) movie when fast dynamics, for instance,cardiomyocyte beating, is captured. Check the supplementarymaterials section for an exemplaryMatlab script for illumina-tion, camera and motorized focusing control and time-lapseimage or video acquisition.
C. CELL CULTURINGFibroblast culture: All chemicals and supplements for fibrob-last culture, including Dulbecco’s modified eagle medium(DMEM) high glucose, w/o L-glutamine, w/o sodiumpyruvate (Biowest, L0101), Dulbecco’s phosphate bufferedsaline (PBS) w/o calcium, w/o magnesium (Biowest,L0615), Trypsin-EDTA 1x w/o Calcium, w/o Magnesium,w/phenol Red (Biowest, L0930), L-Glutamine 100x,200 mM (Biowest, X0550), Fetal bovine serum (FBS) USA(Biowest S1520), Penicillin-streptomycin solution 100x(Biowest L0022) were purchased from VWR and usedas received or reconstituted according to manufacturer’sinstructions. Mouse embryonic fibroblasts (MEF) originallyobtained from Wolfgang H. Ziegler (Hannover medicalschool, Hannover, Germany) were cultured in DMEM highglucose medium supplemented with 10% (v/v) fetal bovineserum (FBS), 1% L-glutamine, 1% P/S (100 IU mL−1
penicillin, 100 µg mL−1 streptomycin) in a standard incu-bator. Cells were harvested using trypsin-EDTA treatmentand counted using a Bruker’s chamber. For the studies ofMEF alignment on nanocellulose surfaces, cationic cellu-lose nanofibers (c-CNF) were produced and coated on cul-
tunnus
Text Box
VOLUME X,2018 page: x000
tunnus
Text Box
VOLUME X,2018 page: x000
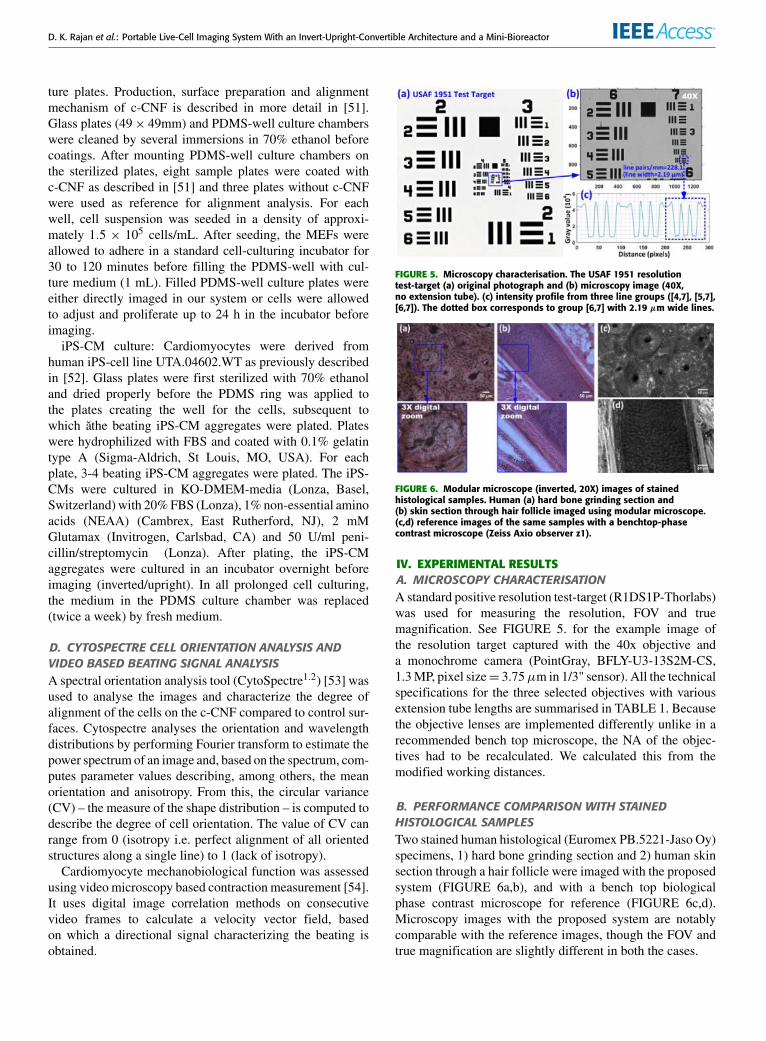
D. K. Rajan et al.: Portable Live-Cell Imaging System With an Invert-Upright-Convertible Architecture and a Mini-Bioreactor
ture plates. Production, surface preparation and alignmentmechanism of c-CNF is described in more detail in [51].Glass plates (49× 49mm) and PDMS-well culture chamberswere cleaned by several immersions in 70% ethanol beforecoatings. After mounting PDMS-well culture chambers onthe sterilized plates, eight sample plates were coated withc-CNF as described in [51] and three plates without c-CNFwere used as reference for alignment analysis. For eachwell, cell suspension was seeded in a density of approxi-mately 1.5 × 10⁵ cells/mL. After seeding, the MEFs wereallowed to adhere in a standard cell-culturing incubator for30 to 120 minutes before filling the PDMS-well with cul-ture medium (1 mL). Filled PDMS-well culture plates wereeither directly imaged in our system or cells were allowedto adjust and proliferate up to 24 h in the incubator beforeimaging.
iPS-CM culture: Cardiomyocytes were derived fromhuman iPS-cell line UTA.04602.WT as previously describedin [52]. Glass plates were first sterilized with 70% ethanoland dried properly before the PDMS ring was applied tothe plates creating the well for the cells, subsequent towhich ăthe beating iPS-CM aggregates were plated. Plateswere hydrophilized with FBS and coated with 0.1% gelatintype A (Sigma-Aldrich, St Louis, MO, USA). For eachplate, 3-4 beating iPS-CM aggregates were plated. The iPS-CMs were cultured in KO-DMEM-media (Lonza, Basel,Switzerland) with 20%FBS (Lonza), 1% non-essential aminoacids (NEAA) (Cambrex, East Rutherford, NJ), 2 mMGlutamax (Invitrogen, Carlsbad, CA) and 50 U/ml peni-cillin/streptomycin (Lonza). After plating, the iPS-CMaggregates were cultured in an incubator overnight beforeimaging (inverted/upright). In all prolonged cell culturing,the medium in the PDMS culture chamber was replaced(twice a week) by fresh medium.
D. CYTOSPECTRE CELL ORIENTATION ANALYSIS ANDVIDEO BASED BEATING SIGNAL ANALYSISA spectral orientation analysis tool (CytoSpectre1.2) [53] wasused to analyse the images and characterize the degree ofalignment of the cells on the c-CNF compared to control sur-faces. Cytospectre analyses the orientation and wavelengthdistributions by performing Fourier transform to estimate thepower spectrum of an image and, based on the spectrum, com-putes parameter values describing, among others, the meanorientation and anisotropy. From this, the circular variance(CV) – the measure of the shape distribution – is computed todescribe the degree of cell orientation. The value of CV canrange from 0 (isotropy i.e. perfect alignment of all orientedstructures along a single line) to 1 (lack of isotropy).
Cardiomyocyte mechanobiological function was assessedusing video microscopy based contraction measurement [54].It uses digital image correlation methods on consecutivevideo frames to calculate a velocity vector field, basedon which a directional signal characterizing the beating isobtained.
FIGURE 5. Microscopy characterisation. The USAF 1951 resolutiontest-target (a) original photograph and (b) microscopy image (40X,no extension tube). (c) intensity profile from three line groups ([4,7], [5,7],[6,7]). The dotted box corresponds to group [6,7] with 2.19 µm wide lines.
FIGURE 6. Modular microscope (inverted, 20X) images of stainedhistological samples. Human (a) hard bone grinding section and(b) skin section through hair follicle imaged using modular microscope.(c,d) reference images of the same samples with a benchtop-phasecontrast microscope (Zeiss Axio observer z1).
IV. EXPERIMENTAL RESULTSA. MICROSCOPY CHARACTERISATIONA standard positive resolution test-target (R1DS1P-Thorlabs)was used for measuring the resolution, FOV and truemagnification. See FIGURE 5. for the example image ofthe resolution target captured with the 40x objective anda monochrome camera (PointGray, BFLY-U3-13S2M-CS,1.3MP, pixel size= 3.75µm in 1/3" sensor). All the technicalspecifications for the three selected objectives with variousextension tube lengths are summarised in TABLE 1. Becausethe objective lenses are implemented differently unlike in arecommended bench top microscope, the NA of the objec-tives had to be recalculated. We calculated this from themodified working distances.
B. PERFORMANCE COMPARISON WITH STAINEDHISTOLOGICAL SAMPLESTwo stained human histological (Euromex PB.5221-Jaso Oy)specimens, 1) hard bone grinding section and 2) human skinsection through a hair follicle were imaged with the proposedsystem (FIGURE 6a,b), and with a bench top biologicalphase contrast microscope for reference (FIGURE 6c,d).Microscopy images with the proposed system are notablycomparable with the reference images, though the FOV andtrue magnification are slightly different in both the cases.
tunnus
Text Box
VOLUME X,2018 page: x000

D. K. Rajan et al.: Portable Live-Cell Imaging System With an Invert-Upright-Convertible Architecture and a Mini-Bioreactor
FIGURE 7. Long-term imaging performance measurements with a fixedspecimen. (a) numerical estimation of focus [56]. Trial 1: measurement inroom temperature. Trial 2: measurement at constant 37◦C with a supportpillar (inset). Ideally, a horizontal line would describe 0 focus drift. In oursystem, a slight focus drift is visible in Trial 2, but it is as low as 0.2%compared to 0.9% (Trial 1) in >12 hours period. (b, c) optical flow (overallrelative physical movement of the specimen) in xy plane in Trial 1 andTrial 2 estimated as described in [57]. The flow vector (green lineextending from the circles) indicates the xy movements were extremelysmall in Trial 2. (d) estimated flow field parameters [Note: -Vx indicates ashift of the last frame to the left compared to the first frame. Dilation androtation quantify the overall expansion (or shrinking) and twisting (aboutz-axis) respectively of the measurement area].
C. LONG-TERM PERFORMANCE AND STABILITYIn order to determine the focus consistency, TLM images(16 bit, 2 images/minute, camera: FL3-U3-13E4C-C) of thefixed specimen (FIGURE 6a) was captured for>12 hours andthe focus was numerically computed (FIGURE 7a), as previ-ously described in [56]. In Trial 1, images were captured atroom temperature without ITO heating and the frame supportpillar (FIGURE 7a inset). In Trial 2, the frame support wasprovided and the plate was set to 37◦C for the whole duration.The mean focus drift is ∼0.9 % in Trial 1 but it is as low asonly 0.2 % in Trial 2 in over 12 hours TLM. Additionally,the optical flow - the overall physical deformation betweenthe first and last images in TLM image series - was estimatedusing Lucas-Kanade method based on the spatial and tem-poral image gradients [57]. In FIGURE 7b and FIGURE 7c
FIGURE 8. Modular microscopy images of live-cells captured on differentoccasions of corresponding cell culture. (a) neurons on micro electrodearray (MEA) plate. (b,c) movie snapshots of a large and small (few cells)cluster of beating cardiomyocytes respectively on glass and MEA plate.(d) cropped view of MEF on glass. (e) beating cardiomyocytes onfluorescent pO2 sensing film in simultaneous hypoxia and TLM study(upright configuration). (f) an excerpt from the corresponding pO2measurement log [18].
the optical flow velocity vectors estimated are illustrated incorresponding images. Here, the green circles illustrate thepoints where the flow (movement) is computed, while thegreen lines represent the flow vector magnitude and direction.Additionally, the flow field parameters estimated are plottedin FIGURE 7d. Lucas-Kanade method is efficient to trackapparent pixel translations in xy-plane which in turn helpsto numerically estimate the xy drift of the imaging system.With a constant temperature supply and platform support,the x,y velocity components, though not zero, are muchsmaller (FIGURE 7d).
D. LIVE-CELL MICROSCOPYUnstained living cells (neurons, fibroblasts and cardiomy-ocytes) were imaged independently on different occasionsof cell culturing and the example snapshots are shown in(FIGURE 8). These trials were designed to iteratively fine-tune the optical performance of the microscopy module and,the suitability of the system for live-cell imaging was subse-quently confirmed. The system, in different configurations,is reproducible and has been successfully utilized for long-term TLM observations. For example, the inverted configura-tion was implemented in order to study A) the alignment and
tunnus
Text Box
VOLUME X,2018 page: x000
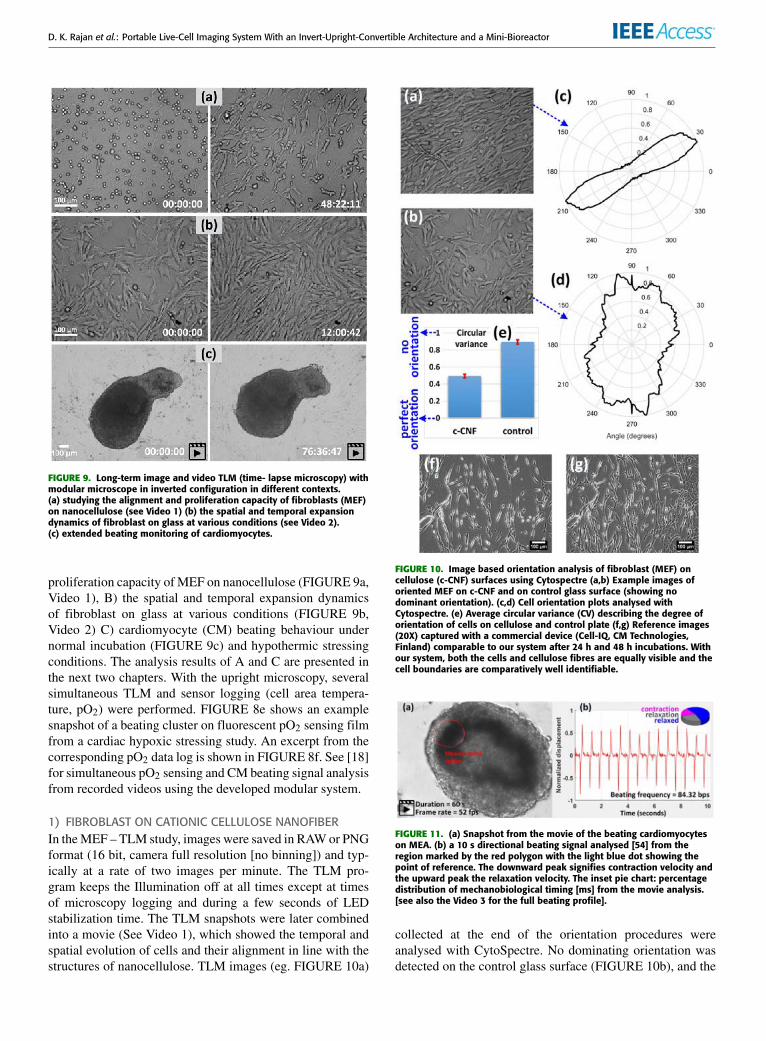
D. K. Rajan et al.: Portable Live-Cell Imaging System With an Invert-Upright-Convertible Architecture and a Mini-Bioreactor
FIGURE 9. Long-term image and video TLM (time- lapse microscopy) withmodular microscope in inverted configuration in different contexts.(a) studying the alignment and proliferation capacity of fibroblasts (MEF)on nanocellulose (see Video 1) (b) the spatial and temporal expansiondynamics of fibroblast on glass at various conditions (see Video 2).(c) extended beating monitoring of cardiomyocytes.
proliferation capacity of MEF on nanocellulose (FIGURE 9a,Video 1), B) the spatial and temporal expansion dynamicsof fibroblast on glass at various conditions (FIGURE 9b,Video 2) C) cardiomyocyte (CM) beating behaviour undernormal incubation (FIGURE 9c) and hypothermic stressingconditions. The analysis results of A and C are presented inthe next two chapters. With the upright microscopy, severalsimultaneous TLM and sensor logging (cell area tempera-ture, pO2) were performed. FIGURE 8e shows an examplesnapshot of a beating cluster on fluorescent pO2 sensing filmfrom a cardiac hypoxic stressing study. An excerpt from thecorresponding pO2 data log is shown in FIGURE 8f. See [18]for simultaneous pO2 sensing and CM beating signal analysisfrom recorded videos using the developed modular system.
1) FIBROBLAST ON CATIONIC CELLULOSE NANOFIBERIn theMEF – TLM study, images were saved in RAWor PNGformat (16 bit, camera full resolution [no binning]) and typ-ically at a rate of two images per minute. The TLM pro-gram keeps the Illumination off at all times except at timesof microscopy logging and during a few seconds of LEDstabilization time. The TLM snapshots were later combinedinto a movie (See Video 1), which showed the temporal andspatial evolution of cells and their alignment in line with thestructures of nanocellulose. TLM images (eg. FIGURE 10a)
FIGURE 10. Image based orientation analysis of fibroblast (MEF) oncellulose (c-CNF) surfaces using Cytospectre (a,b) Example images oforiented MEF on c-CNF and on control glass surface (showing nodominant orientation). (c,d) Cell orientation plots analysed withCytospectre. (e) Average circular variance (CV) describing the degree oforientation of cells on cellulose and control plate (f,g) Reference images(20X) captured with a commercial device (Cell-IQ, CM Technologies,Finland) comparable to our system after 24 h and 48 h incubations. Withour system, both the cells and cellulose fibres are equally visible and thecell boundaries are comparatively well identifiable.
FIGURE 11. (a) Snapshot from the movie of the beating cardiomyocyteson MEA. (b) a 10 s directional beating signal analysed [54] from theregion marked by the red polygon with the light blue dot showing thepoint of reference. The downward peak signifies contraction velocity andthe upward peak the relaxation velocity. The inset pie chart: percentagedistribution of mechanobiological timing [ms] from the movie analysis.[see also the Video 3 for the full beating profile].
collected at the end of the orientation procedures wereanalysed with CytoSpectre. No dominating orientation wasdetected on the control glass surface (FIGURE 10b), and the
tunnus
Text Box
VOLUME X,2018 page: x000

D. K. Rajan et al.: Portable Live-Cell Imaging System With an Invert-Upright-Convertible Architecture and a Mini-Bioreactor
FIGURE 12. Z-stack images (upright) of MEA microelectrode array.(a) A pseudo 3D volume visualization of the stack created with imageJ3D viewer (b) measurement of focus in the z-stack frames. The red dottedline position shows the best-focused plane where the gray level varianceis the highest.
average (three samples) CV computed is 0.92 (FIGURE 10d).On the c-CNF surface (FIGURE 10a), the orientation isclearly visible and the average (eight samples) CV is 0.49(FIGURE 10c). A similar cell experiment was performed ina commercial long-term live-cell imaging system providingstable incubation at 37◦C and 5% CO2 (Cell-IQ, CM Tech-nologies, Finland). Cells were incubated in Cell-IQ for 48±2h, while images were recorded. Example images recordedwith Cell IQ after 24 h and 48 h are presented for comparisonin FIGURE 10f,g. On the contrary, microscopy images withour system show cell boundaries reasonably well and the cellsand c-CNF fibres can be visualized better simultaneously.
2) CARDIOMYOCYTES AND VIDEO BASED SIGNAL ANALYSISMovies of the beating cardiomyocytes were recorded forTLM durations ranging from a few hours to several days,depending on the objective of the experimental study. Typ-ically, 1-minute movies were recorded once per hour in an8 bit uncompressed avi format (40-60 fps, 644x480 pix-els) and the mechanobiological properties were analysed.A 10-second beating signal analysed from a movie of a
CM cluster on MEA (FIGURE 11a) as part of a temper-ature stressing experiment is shown in FIGURE 11b (seealso Video 3). The beating rate is estimated to be 84 beatsper minute with average mechanobiological timings 19 ms,27 ms, 54 ms for contraction, relaxation and relaxed staterespectively.
E. Z-STACK ACQUISITIONThe z-stack acquisition scheme is also being tested. An exam-ple stack of microelectrode array as a pseudo 3D volume(3D viewer/imageJ) is shown in FIGURE 12a. Around 90frames, each in 1.25 µm step was captured with uprightconfiguration using the 4.1MP camera. In FIGURE 12b,the numerically computed focus from each frame isplotted [56]. The red dotted line indicates the frame with thehighest gray level variance corresponding to the best-focusedplane in the z search space.
V. DISCUSSION AND CONCLUSIONWe present a compact portable live-cell imaging system witha novel architecture and modular sub-assemblies for simul-taneous long-term cell imaging, chemical sensing, multisiteelectrophysiological recording and stimulation. The systemhas been characterised and tested with histological (stained)and biological live (unstained) specimens. The microscopyperformance (resolution and contrast) is comparable to thatof traditional phase contrast biological microscopes. Severalshort and long-term TLM recordings have been performedwith neurons, cardiomyocytes and fibroblasts. Successfullycompleted long-term TLM studies include monitoring thealignment and proliferation of mouse embryonic fibroblastson nanocellulose, the beating behaviour of human basedcardiomyocytes under normal and stressed (hypothermic)environments, and the evaluation of stability and suitability ofsensors (temperature sensitive plates, optical pO2, and pH).Although the imaging unit was developed primarily for ourbenchtop modular bioreactor, the digital microscope designas such can be used for building custom in-situ microscopesfor various applications, where a traditional microscope isnot acceptable or affordable. The system is fully functional,and supported with custom software allowing one to controlthe camera settings and TLM parameters and save the dataas independent images or high-fps movies. Further, the soft-ware also supports logging data from sensors (temperature,pO2, pH etc.) connecting via USB and adjusting the ITO-cell heater temperature in real time or in future time points.One major attribute of our system is its invert - upright con-vertibility, which facilitates a unique set-up for conventionalspatiotemporal cell imaging in two directions, and providesflexibility to integrate subassemblies or systems for addi-tional measurement tasks.
Notably, the image plane is reasonably planar withoutbarrel or pincushion distortions. Themicroscope does not suf-fer from focusing issues nor display colour halos, evidentlyowing to the existence of a well-defined image plane with-out noticeable chromatic and spherical aberrations. This was
tunnus
Text Box
VOLUME X,2018 page: x000
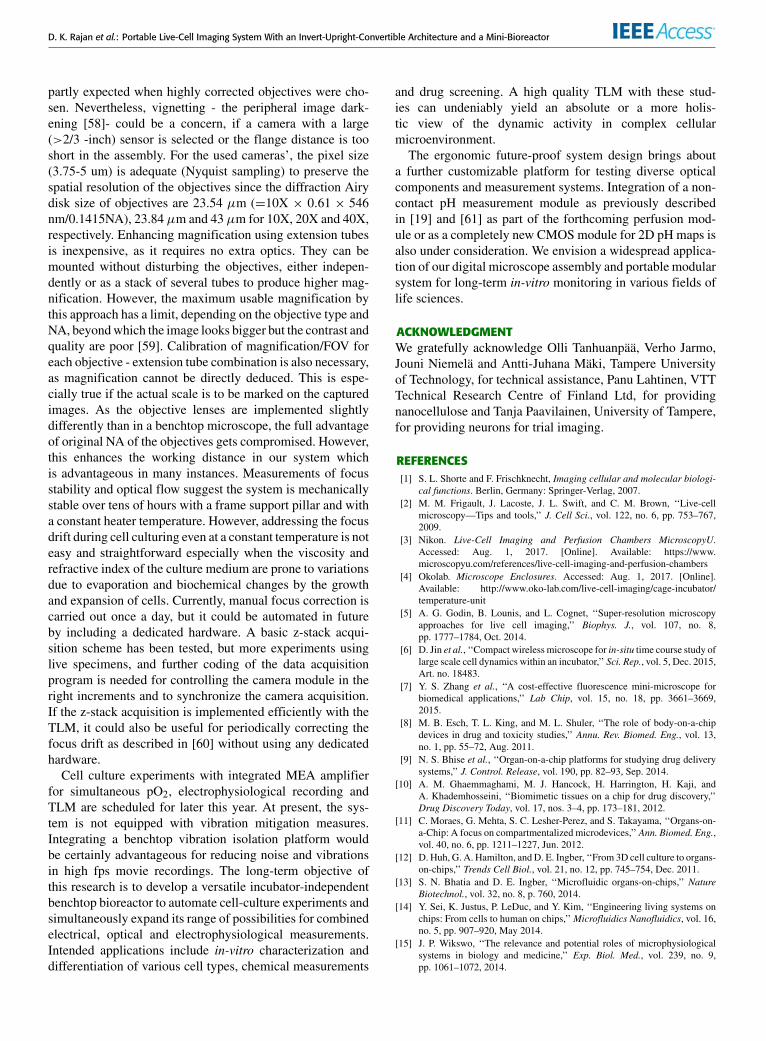
D. K. Rajan et al.: Portable Live-Cell Imaging System With an Invert-Upright-Convertible Architecture and a Mini-Bioreactor
partly expected when highly corrected objectives were cho-sen. Nevertheless, vignetting - the peripheral image dark-ening [58]- could be a concern, if a camera with a large(>2/3 -inch) sensor is selected or the flange distance is tooshort in the assembly. For the used cameras’, the pixel size(3.75-5 um) is adequate (Nyquist sampling) to preserve thespatial resolution of the objectives since the diffraction Airydisk size of objectives are 23.54 µm (=10X × 0.61 × 546nm/0.1415NA), 23.84µm and 43µm for 10X, 20X and 40X,respectively. Enhancing magnification using extension tubesis inexpensive, as it requires no extra optics. They can bemounted without disturbing the objectives, either indepen-dently or as a stack of several tubes to produce higher mag-nification. However, the maximum usable magnification bythis approach has a limit, depending on the objective type andNA, beyondwhich the image looks bigger but the contrast andquality are poor [59]. Calibration of magnification/FOV foreach objective - extension tube combination is also necessary,as magnification cannot be directly deduced. This is espe-cially true if the actual scale is to be marked on the capturedimages. As the objective lenses are implemented slightlydifferently than in a benchtop microscope, the full advantageof original NA of the objectives gets compromised. However,this enhances the working distance in our system whichis advantageous in many instances. Measurements of focusstability and optical flow suggest the system is mechanicallystable over tens of hours with a frame support pillar and witha constant heater temperature. However, addressing the focusdrift during cell culturing even at a constant temperature is noteasy and straightforward especially when the viscosity andrefractive index of the culture medium are prone to variationsdue to evaporation and biochemical changes by the growthand expansion of cells. Currently, manual focus correction iscarried out once a day, but it could be automated in futureby including a dedicated hardware. A basic z-stack acqui-sition scheme has been tested, but more experiments usinglive specimens, and further coding of the data acquisitionprogram is needed for controlling the camera module in theright increments and to synchronize the camera acquisition.If the z-stack acquisition is implemented efficiently with theTLM, it could also be useful for periodically correcting thefocus drift as described in [60] without using any dedicatedhardware.
Cell culture experiments with integrated MEA amplifierfor simultaneous pO2, electrophysiological recording andTLM are scheduled for later this year. At present, the sys-tem is not equipped with vibration mitigation measures.Integrating a benchtop vibration isolation platform wouldbe certainly advantageous for reducing noise and vibrationsin high fps movie recordings. The long-term objective ofthis research is to develop a versatile incubator-independentbenchtop bioreactor to automate cell-culture experiments andsimultaneously expand its range of possibilities for combinedelectrical, optical and electrophysiological measurements.Intended applications include in-vitro characterization anddifferentiation of various cell types, chemical measurements
and drug screening. A high quality TLM with these stud-ies can undeniably yield an absolute or a more holis-tic view of the dynamic activity in complex cellularmicroenvironment.
The ergonomic future-proof system design brings abouta further customizable platform for testing diverse opticalcomponents and measurement systems. Integration of a non-contact pH measurement module as previously describedin [19] and [61] as part of the forthcoming perfusion mod-ule or as a completely new CMOS module for 2D pH maps isalso under consideration. We envision a widespread applica-tion of our digital microscope assembly and portable modularsystem for long-term in-vitro monitoring in various fields oflife sciences.
ACKNOWLEDGMENTWe gratefully acknowledge Olli Tanhuanpää, Verho Jarmo,Jouni Niemelä and Antti-Juhana Mäki, Tampere Universityof Technology, for technical assistance, Panu Lahtinen, VTTTechnical Research Centre of Finland Ltd, for providingnanocellulose and Tanja Paavilainen, University of Tampere,for providing neurons for trial imaging.
REFERENCES[1] S. L. Shorte and F. Frischknecht, Imaging cellular and molecular biologi-
cal functions. Berlin, Germany: Springer-Verlag, 2007.[2] M. M. Frigault, J. Lacoste, J. L. Swift, and C. M. Brown, ‘‘Live-cell
microscopy—Tips and tools,’’ J. Cell Sci., vol. 122, no. 6, pp. 753–767,2009.
[3] Nikon. Live-Cell Imaging and Perfusion Chambers MicroscopyU.Accessed: Aug. 1, 2017. [Online]. Available: https://www.microscopyu.com/references/live-cell-imaging-and-perfusion-chambers
[4] Okolab. Microscope Enclosures. Accessed: Aug. 1, 2017. [Online].Available: http://www.oko-lab.com/live-cell-imaging/cage-incubator/temperature-unit
[5] A. G. Godin, B. Lounis, and L. Cognet, ‘‘Super-resolution microscopyapproaches for live cell imaging,’’ Biophys. J., vol. 107, no. 8,pp. 1777–1784, Oct. 2014.
[6] D. Jin et al., ‘‘Compact wireless microscope for in-situ time course study oflarge scale cell dynamics within an incubator,’’ Sci. Rep., vol. 5, Dec. 2015,Art. no. 18483.
[7] Y. S. Zhang et al., ‘‘A cost-effective fluorescence mini-microscope forbiomedical applications,’’ Lab Chip, vol. 15, no. 18, pp. 3661–3669,2015.
[8] M. B. Esch, T. L. King, and M. L. Shuler, ‘‘The role of body-on-a-chipdevices in drug and toxicity studies,’’ Annu. Rev. Biomed. Eng., vol. 13,no. 1, pp. 55–72, Aug. 2011.
[9] N. S. Bhise et al., ‘‘Organ-on-a-chip platforms for studying drug deliverysystems,’’ J. Control. Release, vol. 190, pp. 82–93, Sep. 2014.
[10] A. M. Ghaemmaghami, M. J. Hancock, H. Harrington, H. Kaji, andA. Khademhosseini, ‘‘Biomimetic tissues on a chip for drug discovery,’’Drug Discovery Today, vol. 17, nos. 3–4, pp. 173–181, 2012.
[11] C. Moraes, G. Mehta, S. C. Lesher-Perez, and S. Takayama, ‘‘Organs-on-a-Chip: A focus on compartmentalized microdevices,’’ Ann. Biomed. Eng.,vol. 40, no. 6, pp. 1211–1227, Jun. 2012.
[12] D. Huh, G. A. Hamilton, and D. E. Ingber, ‘‘From 3D cell culture to organs-on-chips,’’ Trends Cell Biol., vol. 21, no. 12, pp. 745–754, Dec. 2011.
[13] S. N. Bhatia and D. E. Ingber, ‘‘Microfluidic organs-on-chips,’’ NatureBiotechnol., vol. 32, no. 8, p. 760, 2014.
[14] Y. Sei, K. Justus, P. LeDuc, and Y. Kim, ‘‘Engineering living systems onchips: From cells to human on chips,’’Microfluidics Nanofluidics, vol. 16,no. 5, pp. 907–920, May 2014.
[15] J. P. Wikswo, ‘‘The relevance and potential roles of microphysiologicalsystems in biology and medicine,’’ Exp. Biol. Med., vol. 239, no. 9,pp. 1061–1072, 2014.

D. K. Rajan et al.: Portable Live-Cell Imaging System With an Invert-Upright-Convertible Architecture and a Mini-Bioreactor
[16] Š. Selimović, M. R. Dokmeci, and A. Khademhosseini, ‘‘Organs-on-a-chip for drug discovery,’’ Current Opinion Pharmacol., vol. 13, no. 5,pp. 829–833, 2013.
[17] M. L. Moya and S. C. George, ‘‘Integrating in vitro organ-specific func-tion with the microcirculation,’’ Current Opinion Chem. Eng., vol. 3,pp. 102–111, Mar. 2014.
[18] H. Välimäki et al., ‘‘Fluorimetric oxygen sensor with an efficient opticalread-out for in vitro cell models,’’ Sensors Actuators B, Chem., vol. 249,pp. 738–746, Oct. 2017.
[19] D. K. Rajan et al., ‘‘Optical non-contact pH measurement in cell cul-ture with sterilizable, modular parts,’’ Talanta, vol. 161, pp. 755–761,Dec. 2016.
[20] I. Taurino et al., ‘‘Platinum nanopetal-based potassium sensors for acutecell death monitoring,’’ RCS Adv., vol. 6, no. 46, pp. 40517–40526, 2016.
[21] I. Etaluma. Lumascopes. Accessed: Aug. 3, 2017. [Online]. Available:http://www.etaluma.com/products/about-lumascope-fluorescent-microscopes/
[22] E. BioScience. (2016). Real-time, quantitative live-cell analysis.IncuCyte ZOOM System. Accessed: Aug. 3, 2017. [Online]. Available:https://www.essenbioscience.com/media/uploads/files/8000-0333-E00-IncuCyte_ZOOM_brochure.pdf
[23] J. H. Jung, C. Han, S. A. Lee, J. Kim, and C. Yang, ‘‘Microfluidic-integrated laser-controlled microactuators with on-chip microscopy imag-ing functionality,’’ Lab Chip, vol. 14, no. 19, pp. 3781–3789, 2014.
[24] C. Han, S. Pang, D. V. Bower, P. Yiu, and C. Yang, ‘‘Wide field-of-view on-chip Talbot fluorescence microscopy for longitudinal cell cul-ture monitoring from within the incubator,’’ Anal. Chem., vol. 85, no. 4,pp. 2356–2360, Feb. 2013.
[25] G. Zheng, S. A. Lee, Y. Antebi, M. B. Elowitz, and C. Yang, ‘‘The ePetridish, an on-chip cell imaging platform based on subpixel perspectivesweeping microscopy (SPSM),’’ Proc. Nat. Acad. Sci. USA, vol. 108,no. 41, pp. 16889–16894, Oct. 2011.
[26] J. El-Ali, P. K. Sorger, and K. F. Jensen, ‘‘Cells on chips,’’Nature, vol. 442,no. 7101, pp. 403–411, Jul. 2006.
[27] W. Bishara et al., ‘‘Holographic pixel super-resolution in portable lenslesson-chip microscopy using a fiber-optic array,’’ Lab Chip, vol. 11, no. 7,pp. 1276–1279, Apr. 2011.
[28] A. Greenbaum, U. Sikora, and A. Ozcan, ‘‘Field-portable wide-fieldmicroscopy of dense samples using multi-height pixel super-resolutionbased lensfree imaging,’’ Lab Chip, vol. 12, no. 7, pp. 1242–1245,Apr. 2012.
[29] W. Bishara, T.-W. Su, A. F. Coskun, and A. Ozcan, ‘‘Lensfree on-chipmicroscopy over a wide field-of-view using pixel super-resolution,’’ Opt.Exp., vol. 18, no. 11, pp. 11181–11191, May 2010.
[30] Z. F. Phillips, M. Chen, and L. Waller, ‘‘Single-shot quantitative phasemicroscopy with color-multiplexed differential phase contrast (cDPC),’’PLoS ONE, vol. 12, no. 2, p. e0171228, Feb. 2017.
[31] A. Ozcan and E. McLeod, ‘‘Lensless imaging and sensing,’’ Annu. Rev.Biomed. Eng., vol. 18, no. 1, pp. 77–102, Jul. 2016.
[32] A. Greenbaum et al., ‘‘Imaging without lenses: achievements and remain-ing challenges of wide-field on-chip microscopy,’’ Nature Methods, vol. 9,no. 9, pp. 889–895, 2012.
[33] B. A. Flusberg, E. D. Cocker, W. Piyawattanametha, J. C. Jung,E. L. M. Cheung, andM. J. Schnitzer, ‘‘Fiber-optic fluorescence imaging,’’Nature Methods, vol. 2, no. 12, pp. 941–950, Dec. 2005.
[34] M. Pierce, D. Yu, and R. Richards-Kortum, ‘‘High-resolution fiber-opticmicroendoscopy for in situ cellular imaging,’’ J. Vis. Exp., vol. 47, p. e2306,Jan. 2011.
[35] D. Shin, M. C. Pierce, A. M. Gillenwater, M. D. Williams, andR. R. Richards-Kortum, ‘‘A fiber-optic fluorescence microscope using aconsumer-grade digital camera for in vivo cellular imaging,’’ PLoS ONE,vol. 5, no. 6, p. e11218, Jun. 2010.
[36] F. Helmchen, ‘‘Miniaturization of fluorescence microscopes using fibreoptics,’’ Experim. Physiol., vol. 87, no. 6, pp. 737–745, Nov. 2002.
[37] K.-B. Sung, C. Liang, M. Descour, T. Collier, M. Follen, and R. Richards-Kortum, ‘‘Fiber-optic confocal reflectance microscope with miniatureobjective for in vivo imaging of human tissues,’’ IEEE Trans. Biomed. Eng.,vol. 49, no. 10, pp. 1168–1172, Oct. 2002.
[38] Y. Ando et al., ‘‘In vivo bioluminescence and reflectance imaging of mul-tiple organs in bioluminescence reporter mice by bundled-fiber-coupledmicroscopy,’’ Biomed. Opt. Exp., vol. 7, no. 3, pp. 963–978, 2016.
[39] X. Meng et al., ‘‘Smartphone based hand-held quantitative phase micro-scope using the transport of intensity equation method,’’ Lab Chip, vol. 17,no. 1, pp. 104–109, 2017.
[40] A. Skandarajah, C. D. Reber, N. A. Switz, and D. A. Fletcher, ‘‘Quantita-tive imaging with a mobile phone microscope,’’ PLoS ONE, vol. 9, no. 5,p. e96906, 2014.
[41] Y. S. Zhang et al., ‘‘Hybrid microscopy: Enabling inexpensive high-performance imaging through combined physical and optical magnifica-tions,’’ Sci. Rep., vol. 6, Mar. 2016, Art. no. 22691.
[42] M. P. Walzik et al., ‘‘A portable low-cost long-term live-cell imagingplatform for biomedical research and education,’’ Biosens. Bioelectron.,vol. 64, pp. 639–649, Feb. 2015.
[43] G. O. F. Parikesit, M. Darmawan, and A. Faisal, ‘‘Quantitative low-cost webcam-based microscopy,’’ Opt. Eng., vol. 49, no. 11, p. 113205,Nov. 2010.
[44] J. Kreutzer et al., ‘‘Structured PDMS chambers for enhanced humanneuronal cell activity on MEA platforms,’’ J. Bionic Eng., vol. 9, no. 1,pp. 1–10, Mar. 2012.
[45] J. Kreutzer, L. Ylä-Outinen, A. J. Mäki, M. Ristola, S. Narkilahti, andP. Kallio, ‘‘Cell culture chamber with gas supply for prolonged recordingof human neuronal cells on microelectrode array,’’ J. Neurosci. Methods,vol. 280, pp. 27–35, Mar. 2017.
[46] D. B.Murphy, Fundamentals of Light Microscopy and Electronic Imaging,vol. 53. Hoboken, NJ, USA: Wiley, 2012.
[47] J. R. Lakowicz, Principles of Fluorescence Spectroscopy, 3rd ed. NewYork, NY, USA: Springer, 2006.
[48] D. Georg. Camera GUI (Version 1.0). Accessed: Aug. 1, 2017. [Online].Available: https://se.mathworks.com/matlabcentral/fileexchange/35919-cameragui
[49] MathWorks MATLAB Hardware Team. (2014). MATLAB SupportPackage for Arduino Hardware (Version 1.1), MATLAB CentralFile Exchange. Accessed: Apr. 1, 2014. [Online]. Available:https://se.mathworks.com/matlabcentral/fileexchange/47522-matlab-support-package-for-arduino-hardware
[50] MathWorks Image Acquisition Toolbox Team. Image AcquisitionToolbox Support Package for Point Grey Hardware (Version 1.1).Accessed: Aug. 1, 2017. [Online]. Available: https://se.mathworks.com/matlabcentral/fileexchange/45178-image-acquisition-toolbox-support-package-for-point-grey-hardware
[51] A. Skogberg, A.-J. Mäki, P. Lahtinen, and P. Kallio, ‘‘Cellulose nanofiberalignment using evaporation-induced droplet-casting, and cell alignmenton aligned nanocellulose surfaces,’’ Biomacromolecules, vol. 18, no. 12,pp. 3936–3953, 2017.
[52] A. L. Lahti et al., ‘‘Model for long QT syndrome type 2 usinghuman iPS cells demonstrates arrhythmogenic characteristics incell culture,’’ Disease Models Mech., vol. 5, no. 2, pp. 220–230,Mar. 2012.
[53] K. Kartasalo et al., ‘‘CytoSpectre: A tool for spectral analysis of orientedstructures on cellular and subcellular levels,’’ BMC Bioinf., vol. 16, no. 1,p. 344, Dec. 2015.
[54] A. Ahola, A. Kiviaho, K. Larsson, M. Honkanen, K. Aalto-Setälä,and J.Hyttinen, ‘‘Video image-based analysis of single human inducedpluripotent stem cell derived cardiomyocyte beating dynamics using dig-ital image correlation,’’ Biomed. Eng. Online, vol. 13, no. 1, p. 39,2014.
[55] I. T. Young, R. Zagers, L. J. van Vliet, J. Mullikin, F. Boddeke, andH. Netten, ‘‘Depth-of-focus in microscopy,’’ in Proc. 8th Scandin. Conf.Image Anal., 1993, pp. 493–498.
[56] S. Pertuz, D. Puig, andM. A. Garcia, ‘‘Analysis of focus measure operatorsfor shape-from-focus,’’ Pattern Recognit., vol. 46, no. 5, pp. 1415–1432,2013.
[57] Y. David. (2010). Affine Optic Flow (Version 1.3), MATLAB CentralFile Exchange. Accessed: Mar. 3, 2017. [Online]. Available:https://se.mathworks.com/matlabcentral/fileexchange/27093-affine-optic-flow?focused=6019470&tab=example
[58] F. J. W.-M. Leong, M. Brady, and J. O. D. McGee, ‘‘Correction of unevenillumination (vignetting) in digital microscopy images,’’ J. Clin. Pathol.,vol. 56, no. 8, pp. 619–621, Aug. 2003.
[59] Nikon. Useful Magnification Range MicroscopyU.Accessed:Aug. 10, 2017. https://www.microscopyu.com/microscopy-basics/useful-magnification-range
[60] M. Kreft, M. Stenovec, and R. Zorec, ‘‘Focus-drift correction in time-lapse confocal imaging,’’ Ann. New York Acad. Sci., vol. 1048, no. 1,pp. 321–330, Jun. 2005.
[61] D. K. Rajan et al., ‘‘Monitoring pH, temperature and humidity in long-termstem cell culture in CO2 incubator,’’ in Proc. IEEE Int. Symp. Med. Meas.Appl. (MeMeA), May 2017, pp. 470–474.
tunnus
Text Box
VOLUME X,2018 page: x000
tunnus
Text Box
VOLUME X,2018 page: x000
tunnus
Text Box
VOLUME X,2018 page: x000

D. K. Rajan et al.: Portable Live-Cell Imaging System With an Invert-Upright-Convertible Architecture and a Mini-Bioreactor
DHANESH KATTIPPARAMBIL RAJAN receivedthe M.Sc. degree (Tech.) in biomedical engineer-ing from the Tampere University of Technology(TUT), Finland, in 2008, where he is currently pur-suing the D.Sc. degree with BioMediTech Insti-tute. He was with the photolithography facility atTUT for four years. He is currently a Research Sci-entist with BioMediTech Institute and the Facultyof Biomedical Sciences and Engineering, TUT,where he develops compact-modular imaging and
optical measurement techniques and systems.
JOOSE KREUTZER received the B.Eng. degreein electrical and electronic engineering from theUniversity of Sunderland, Sunderland, U.K., in2003, and the M.Sc. degree in electrical engineer-ing from the Tampere University of Technology(TUT), Tampere, Finland, in 2005. He is currentlya Research Scientist with the Micro and Nanosys-tems Research Group, BioMediTech Institute, andthe Faculty of Biomedical Sciences and Engineer-ing, TUT. His current research interests include
microfabrication, microfluidics, and their applications in biomedical engi-neering, especially for stem cell-based bioengineering.
HANNU VÄLIMÄKI received the M.Sc. degreein electrical engineering from the Tampere Uni-versity of Technology (TUT), Tampere, Finland,in 1996. He was a Research Scientist in the fieldof acoustical and optical sensors with the VTTTechnical Research Centre of Finland, Tampere,until 2013. He is currently with the BioMediTechInstitute and Faculty of Biomedical Sciences andEngineering, TUT,where he develops optical sens-ing technologies for cell culturing applications.
MARI PEKKANEN-MATTILA received the Ph.D.degree in stem cell and tissue engineering fromthe University of Tampere, Finland, in 2011. Herresearch interests include human induced pluripo-tent stem cells, cell differentiation, and diseasemodeling of human genetic cardiac diseases.
ANTTI AHOLA received the master’s degree inbiomedical engineering from the Tampere Uni-versity of Technology, Finland, in 2010. He iscurrently pursuing the D.Sc. degree. His researchinterests include cardiomyocyte biomechanics,video microscopy, and image analysis.
ANNE SKOGBERG received the master’s degreein cell and tissue engineering from the Univer-sity of Tampere, Finland, in 2010. She is cur-rently pursuing the Ph.D. degree with the TampereUniversity of Technology, Finland. Her researchinterests include nanocellulose and its utilizationin biomedical applications.
KATRIINA AALTO-SETÄLÄ received the M.D.degree. She is currently a Professor of physiologywith the Faculty of Medicine and Life Sciences,University of Tampere, and a Cardiologist withthe Heart Hospital, Tampere University Hospital,Finland. She is an Invasive Cardiologist and is incharge of the Genetic Cardiac Outpatient Clinic,Heart Hospital. She was involved in human geneticcardiac diseases, such as genetic arrhythmias andatherosclerosis with the help of induced pluripo-
tent stem cell technology. Themain aim of the research group is to learnmoreabout the basic pathology of the genetic diseases as well as to test current andnew pharmaceutical agents to correct the abnormalities. Her research groupin collaboration with researchers at the Tampere University of Technologyhas also invented new methods to monitor and analyze the maturity andfunctionality of cardiomyocytes.
HEIMO IHALAINEN started teaching measure-ment technology at the Tampere University ofTechnology in 1974, and conducted research inmultivariate signals in the 1990s. In 2000, he wasinvolved in a new topic, measurement based onimages, and though he is officially retired now, thetopic motivates him to continue in the field.
PASI KALLIO received the M.S. degree in electri-cal engineering and the D.Tech. degree in automa-tion engineering from the Tampere University ofTechnology (TUT), Tampere, Finland, in 1994and 2002, respectively. Since 2008, he has beena Professor of automation engineering at TUT.He is currently the Vice Director of the Facultyof Biomedical Sciences and Engineering. He hasauthored over 130 articles and has over ten patentapplications. His current research interests include
microrobotics, microfluidics, and their automation in cell and tissue engi-neering, medical diagnostics, and soft material testing applications. He wasa recipient of the Finnish Automation Society Award in 2009. He was theChair of the IEEE Finland Section from 2012 to 2013.
JUKKA LEKKALA received the M.Sc. degreein electronics and the D.Sc. (Tech.) degree inbiomedical engineering from the Tampere Univer-sity of Technology (TUT), Tampere, Finland, in1979 and 1984, respectively. From 1985 to 2001,he was a Senior Research Scientist with the VTTTechnical Research Centre of Finland in differentresearch units developing biosensor technologyand sensor materials. In 1991, he was appointedas a Docent of bioelectronics with the University
of Oulu and a Docent of biomedical engineering at TUT. Since 2002, hehas been a Professor of automation engineering at TUT. He is currently aProfessor Emeritus with the Faculty of Biomedical Sciences and Engineering(TUT-BMT). He has over 170 scientific publications and ten patents. Hisresearch interests include sensors, measurement systems, and biosensing.
tunnus
Text Box
VOLUME X,2018 page: x000


PUBLICATION II
Cardiomyocytes: Analysis of temperature response and signal propagation between dissociated clusters using a novel video-based
movement analysis software.
D. Kattipparambil Rajan, A. J. Maki, M. Pekkanen-Mattila, J. Kreutzer, T. Ryynanen,
H. Valimaki, J. Verho, J. T. Koivumaki, H. Ihalainen, K. Aalto-Setala, P. Kallio, and J.
Lekkala.
Journal IEEE Access, vol. 8, pp. 109275–109288, 2020
https://doi.org/10.1109/ACCESS.2020.3001191
©2018, IEEE. Reprinted with permission from the publisher.

1
VOLUME XX 2020
‘Date of publication xxxx 00, 0000, date of current version xxxx 00, 0000. Digital Object Identifier 10.1109/ACCESS.2017.Doi Number
Cardiomyocytes: Analysis of temperature response and signal propagation between dissociated clusters using a novel video-based movement analysis software Dhanesh Kattipparambil Rajan 1, Antti-Juhana Mäki 1, Mari Pekkanen-Mattila 2, Joose Kreutzer 1, Tomi Ryynänen 1, Hannu Välimäki 1, Jarmo Verho 1, Jussi T Koivumäki 3, Heimo Ihalainen 1, Katriina Aalto-Setälä 2,3,4,5, Pasi Kallio 1, Jukka Lekkala 1 1Micro- and nanosystems research group, Faculty of Medicine and Health Technology, Tampere University, 33720 Tampere, Finland 2Heart group, Faculty of Medicine and Health Technology, Tampere University, 33520 Tampere, Finland 3Computational Biophysics and Imaging Group, Faculty of Medicine and Health Technology, Tampere University, 33520 Tampere, Fin land 4Heart Hospital, Tampere University Hospital, 33520 Tampere, Finland 5Clinical Medicine, Faculty of Medicine and Health Science, Tampere University, 33520 Tampere, Finland Corresponding author: Dhanesh K. Rajan (e-mail: [email protected]) This work was supported by the Business Finland (former Finnish Funding Agency for Technology and Innovation (TEKES)) through Human Spare Parts 2 Project.
ABSTRACT Human induced pluripotent stem cell-derived cardiomyocytes (hiPSC-CMs) provide a great resource for functional cell and tissue models that can be applied in the heart research, pharmaceutical industry and the future regenerative medicine. While experimenting with the cell models, the precise control of the environmental parameters is important. Temperature is a fundamental parameter, and the acute effect of temperature on hiPSC-CM functions has previously been studied. This paper reports on long-term, systematic temperature response studies of hiPSC-CM cultures. The studies are carried out outside an incubator in a modular cell culturing system, combined with a temperature sensor plate (TSP) and a new beating analysis software (CMaN—cardiomyocyte function analysis tool). Temperature sensing at the actual cell location is challenging with bulky external sensors, but a TSP with resistive microsensors provides an effortless solution. Experimental results showed that temperature affects the hiPSC-CM beating frequency nonlinearly with a Q10 temperature coefficient value of ~2.2. Both the active (contraction) and passive (relaxation) movements are influenced by temperature, while the changes in relaxation times are larger than the contraction times. The contraction amplitudes, however, exhibited a greater spread of variation. We also present novel results of the visualization of hiPSC-CM contractile networking and a non-invasive image-based measurement of signal propagation between dissociated CM clusters. Compared to previously reported tools, CMaN is an advanced, easy-to-use robust software. It is faster, more sensitive, computationally less expensive and extracts six different signals of the contractile motion per processing, allowing typically at least one useful beating signal even in complex cases. The software also supports movement center detection and independent computation of the relaxation and contraction features. INDEX TERMS Cardiomyocytes beating analysis software, Movement center detection, Cardiomyocytes temperature response, Nonlinear temperature dependency, Signal propagation between clusters
I. INTRODUCTION The limited availability of primary human cardiomyocytes (CMs) poses challenges for basic and translational research. However, human induced pluripotent stem cells (hiPSC) can
be differentiated into cardiomyocytes (hiPSC-CMs), providing an unlimited source of human CMs from healthy individuals, as well as from patients with genetic cardiac diseases. The hiPSC-CMs are a promising tool to study the
tunnus
Text Box
This is the author submitted manuscript which is under peer review and revision.
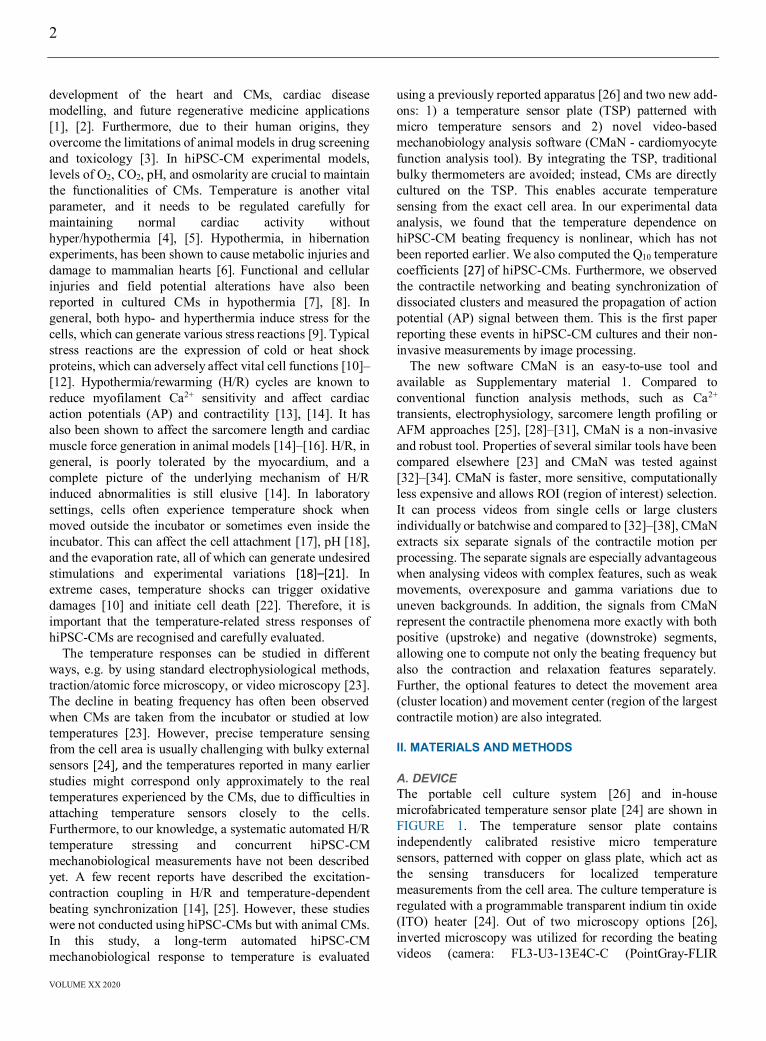
2
VOLUME XX 2020
development of the heart and CMs, cardiac disease modelling, and future regenerative medicine applications [1], [2]. Furthermore, due to their human origins, they overcome the limitations of animal models in drug screening and toxicology [3]. In hiPSC-CM experimental models, levels of O2, CO2, pH, and osmolarity are crucial to maintain the functionalities of CMs. Temperature is another vital parameter, and it needs to be regulated carefully for maintaining normal cardiac activity without hyper/hypothermia [4], [5]. Hypothermia, in hibernation experiments, has been shown to cause metabolic injuries and damage to mammalian hearts [6]. Functional and cellular injuries and field potential alterations have also been reported in cultured CMs in hypothermia [7], [8]. In general, both hypo- and hyperthermia induce stress for the cells, which can generate various stress reactions [9]. Typical stress reactions are the expression of cold or heat shock proteins, which can adversely affect vital cell functions [10]–[12]. Hypothermia/rewarming (H/R) cycles are known to reduce myofilament Ca2+ sensitivity and affect cardiac action potentials (AP) and contractility [13], [14]. It has also been shown to affect the sarcomere length and cardiac muscle force generation in animal models [14]–[16]. H/R, in general, is poorly tolerated by the myocardium, and a complete picture of the underlying mechanism of H/R induced abnormalities is still elusive [14]. In laboratory settings, cells often experience temperature shock when moved outside the incubator or sometimes even inside the incubator. This can affect the cell attachment [17], pH [18], and the evaporation rate, all of which can generate undesired stimulations and experimental variations [18]–[21]. In extreme cases, temperature shocks can trigger oxidative damages [10] and initiate cell death [22]. Therefore, it is important that the temperature-related stress responses of hiPSC-CMs are recognised and carefully evaluated. The temperature responses can be studied in different ways, e.g. by using standard electrophysiological methods, traction/atomic force microscopy, or video microscopy [23]. The decline in beating frequency has often been observed when CMs are taken from the incubator or studied at low temperatures [23]. However, precise temperature sensing from the cell area is usually challenging with bulky external sensors [24], and the temperatures reported in many earlier studies might correspond only approximately to the real temperatures experienced by the CMs, due to difficulties in attaching temperature sensors closely to the cells. Furthermore, to our knowledge, a systematic automated H/R temperature stressing and concurrent hiPSC-CM mechanobiological measurements have not been described yet. A few recent reports have described the excitation-contraction coupling in H/R and temperature-dependent beating synchronization [14], [25]. However, these studies were not conducted using hiPSC-CMs but with animal CMs. In this study, a long-term automated hiPSC-CM mechanobiological response to temperature is evaluated
using a previously reported apparatus [26] and two new add-ons: 1) a temperature sensor plate (TSP) patterned with micro temperature sensors and 2) novel video-based mechanobiology analysis software (CMaN - cardiomyocyte function analysis tool). By integrating the TSP, traditional bulky thermometers are avoided; instead, CMs are directly cultured on the TSP. This enables accurate temperature sensing from the exact cell area. In our experimental data analysis, we found that the temperature dependence on hiPSC-CM beating frequency is nonlinear, which has not been reported earlier. We also computed the Q10 temperature coefficients [27] of hiPSC-CMs. Furthermore, we observed the contractile networking and beating synchronization of dissociated clusters and measured the propagation of action potential (AP) signal between them. This is the first paper reporting these events in hiPSC-CM cultures and their non-invasive measurements by image processing. The new software CMaN is an easy-to-use tool and available as Supplementary material 1. Compared to conventional function analysis methods, such as Ca2+ transients, electrophysiology, sarcomere length profiling or AFM approaches [25], [28]–[31], CMaN is a non-invasive and robust tool. Properties of several similar tools have been compared elsewhere [23] and CMaN was tested against [32]–[34]. CMaN is faster, more sensitive, computationally less expensive and allows ROI (region of interest) selection. It can process videos from single cells or large clusters individually or batchwise and compared to [32]–[38], CMaN extracts six separate signals of the contractile motion per processing. The separate signals are especially advantageous when analysing videos with complex features, such as weak movements, overexposure and gamma variations due to uneven backgrounds. In addition, the signals from CMaN represent the contractile phenomena more exactly with both positive (upstroke) and negative (downstroke) segments, allowing one to compute not only the beating frequency but also the contraction and relaxation features separately. Further, the optional features to detect the movement area (cluster location) and movement center (region of the largest contractile motion) are also integrated. II. MATERIALS AND METHODS A. DEVICE The portable cell culture system [26] and in-house microfabricated temperature sensor plate [24] are shown in FIGURE 1. The temperature sensor plate contains independently calibrated resistive micro temperature sensors, patterned with copper on glass plate, which act as the sensing transducers for localized temperature measurements from the cell area. The culture temperature is regulated with a programmable transparent indium tin oxide (ITO) heater [24]. Out of two microscopy options [26], inverted microscopy was utilized for recording the beating videos (camera: FL3-U3-13E4C-C (PointGray-FLIR
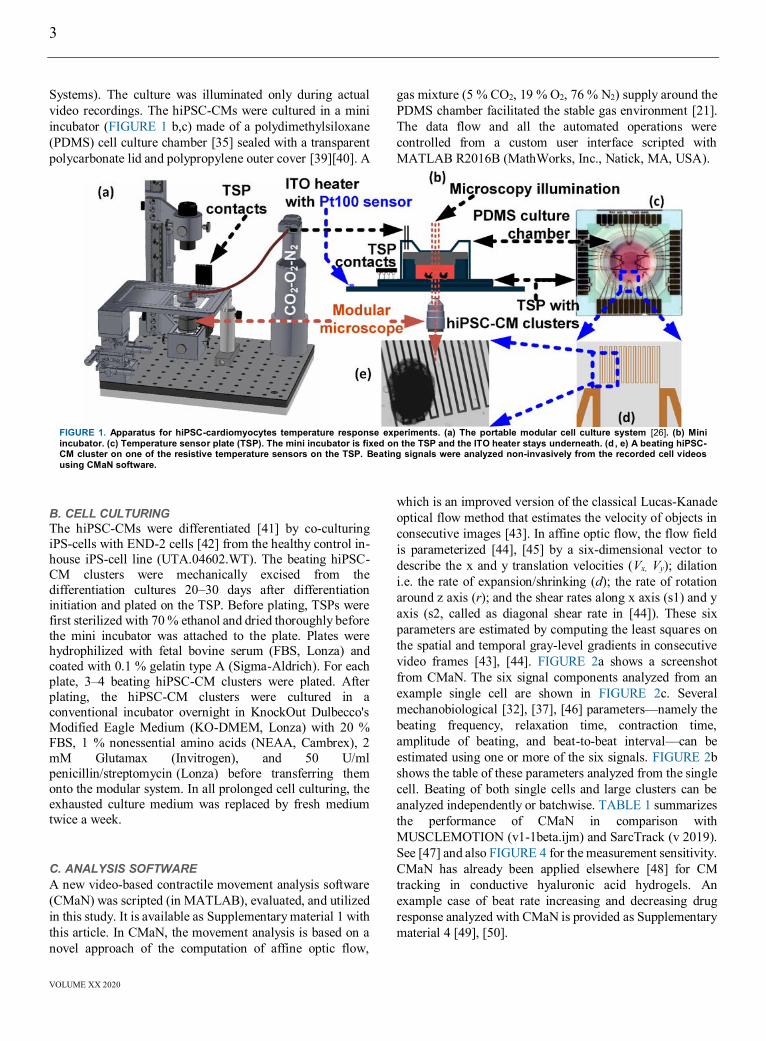
3
VOLUME XX 2020
Systems). The culture was illuminated only during actual video recordings. The hiPSC-CMs were cultured in a mini incubator (FIGURE 1 b,c) made of a polydimethylsiloxane (PDMS) cell culture chamber [35] sealed with a transparent polycarbonate lid and polypropylene outer cover [39][40]. A
gas mixture (5 % CO2, 19 % O2, 76 % N2) supply around the PDMS chamber facilitated the stable gas environment [21]. The data flow and all the automated operations were controlled from a custom user interface scripted with MATLAB R2016B (MathWorks, Inc., Natick, MA, USA).
B. CELL CULTURING The hiPSC-CMs were differentiated [41] by co-culturing iPS-cells with END-2 cells [42] from the healthy control in-house iPS-cell line (UTA.04602.WT). The beating hiPSC-CM clusters were mechanically excised from the differentiation cultures 20–30 days after differentiation initiation and plated on the TSP. Before plating, TSPs were first sterilized with 70 % ethanol and dried thoroughly before the mini incubator was attached to the plate. Plates were hydrophilized with fetal bovine serum (FBS, Lonza) and coated with 0.1 % gelatin type A (Sigma-Aldrich). For each plate, 3–4 beating hiPSC-CM clusters were plated. After plating, the hiPSC-CM clusters were cultured in a conventional incubator overnight in KnockOut Dulbecco's Modified Eagle Medium (KO-DMEM, Lonza) with 20 % FBS, 1 % nonessential amino acids (NEAA, Cambrex), 2 mM Glutamax (Invitrogen), and 50 U/ml penicillin/streptomycin (Lonza) before transferring them onto the modular system. In all prolonged cell culturing, the exhausted culture medium was replaced by fresh medium twice a week. C. ANALYSIS SOFTWARE A new video-based contractile movement analysis software (CMaN) was scripted (in MATLAB), evaluated, and utilized in this study. It is available as Supplementary material 1 with this article. In CMaN, the movement analysis is based on a novel approach of the computation of affine optic flow,
which is an improved version of the classical Lucas-Kanade optical flow method that estimates the velocity of objects in consecutive images [43]. In affine optic flow, the flow field is parameterized [44], [45] by a six-dimensional vector to describe the x and y translation velocities (Vx, Vy); dilation i.e. the rate of expansion/shrinking (d); the rate of rotation around z axis (r); and the shear rates along x axis (s1) and y axis (s2, called as diagonal shear rate in [44]). These six parameters are estimated by computing the least squares on the spatial and temporal gray-level gradients in consecutive video frames [43], [44]. FIGURE 2a shows a screenshot from CMaN. The six signal components analyzed from an example single cell are shown in FIGURE 2c. Several mechanobiological [32], [37], [46] parameters—namely the beating frequency, relaxation time, contraction time, amplitude of beating, and beat-to-beat interval—can be estimated using one or more of the six signals. FIGURE 2b shows the table of these parameters analyzed from the single cell. Beating of both single cells and large clusters can be analyzed independently or batchwise. TABLE 1 summarizes the performance of CMaN in comparison with MUSCLEMOTION (v1-1beta.ijm) and SarcTrack (v 2019). See [47] and also FIGURE 4 for the measurement sensitivity. CMaN has already been applied elsewhere [48] for CM tracking in conductive hyaluronic acid hydrogels. An example case of beat rate increasing and decreasing drug response analyzed with CMaN is provided as Supplementary material 4 [49], [50].
FIGURE 1. Apparatus for hiPSC-cardiomyocytes temperature response experiments. (a) The portable modular cell culture system [26]. (b) Mini incubator. (c) Temperature sensor plate (TSP). The mini incubator is fixed on the TSP and the ITO heater stays underneath. (d , e) A beating hiPSC-CM cluster on one of the resistive temperature sensors on the TSP. Beating signals were analyzed non-invasively from the recorded cell videos using CMaN software.
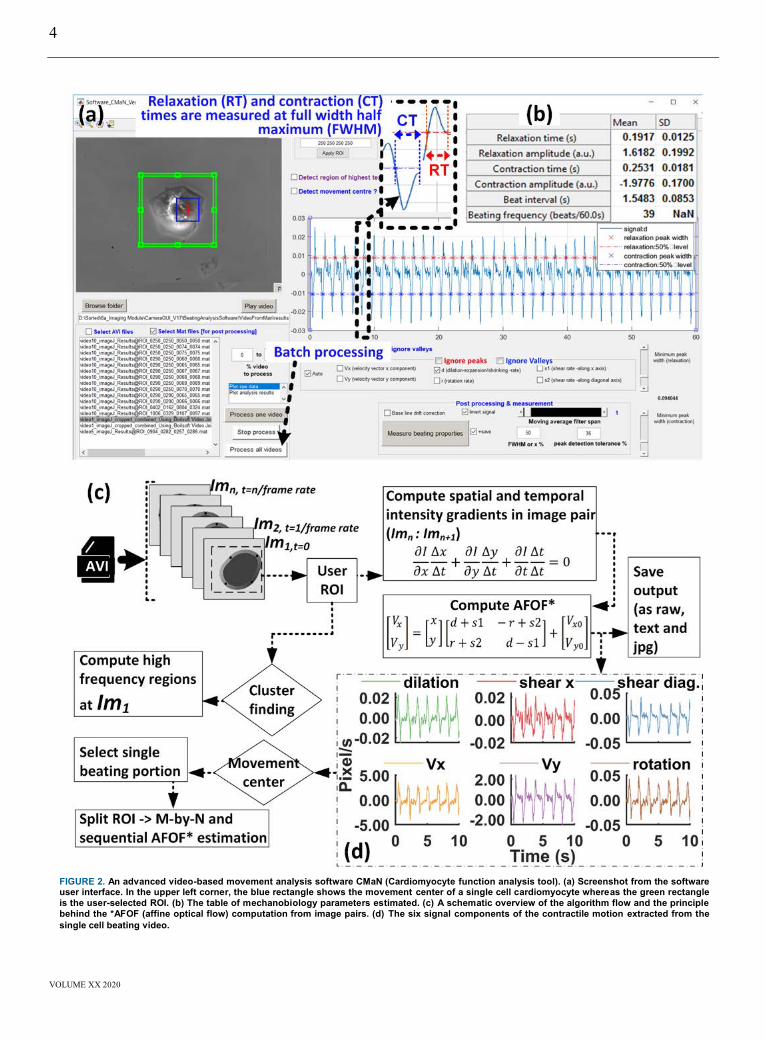
4
VOLUME XX 2020
FIGURE 2. An advanced video-based movement analysis software CMaN (Cardiomyocyte function analysis tool). (a) Screenshot from the software user interface. In the upper left corner, the blue rectangle shows the movement center of a single cell cardiomyocyte whereas the green rectangle is the user-selected ROI. (b) The table of mechanobiology parameters estimated. (c) A schematic overview of the algorithm flow and the principle behind the *AFOF (affine optical flow) computation from image pairs. (d) The six signal components of the contractile motion extracted from the single cell beating video.
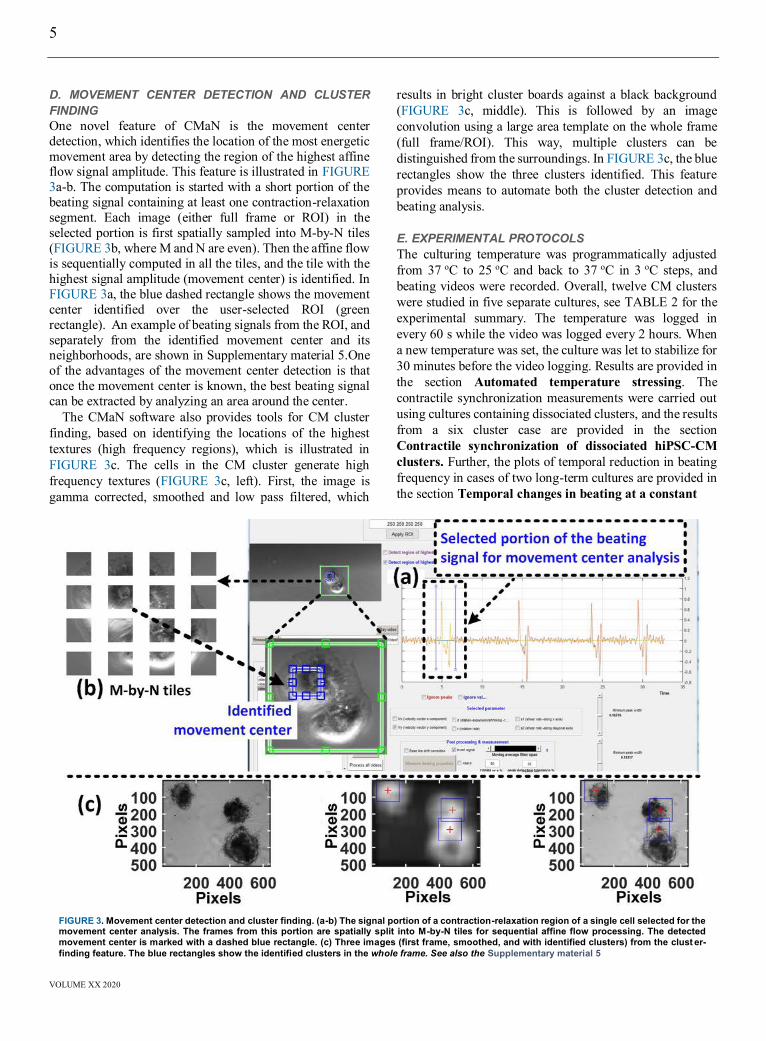
5
VOLUME XX 2020
D. MOVEMENT CENTER DETECTION AND CLUSTER FINDING One novel feature of CMaN is the movement center detection, which identifies the location of the most energetic movement area by detecting the region of the highest affine flow signal amplitude. This feature is illustrated in FIGURE 3a-b. The computation is started with a short portion of the beating signal containing at least one contraction-relaxation segment. Each image (either full frame or ROI) in the selected portion is first spatially sampled into M-by-N tiles (FIGURE 3b, where M and N are even). Then the affine flow is sequentially computed in all the tiles, and the tile with the highest signal amplitude (movement center) is identified. In FIGURE 3a, the blue dashed rectangle shows the movement center identified over the user-selected ROI (green rectangle). An example of beating signals from the ROI, and separately from the identified movement center and its neighborhoods, are shown in Supplementary material 5.One of the advantages of the movement center detection is that once the movement center is known, the best beating signal can be extracted by analyzing an area around the center. The CMaN software also provides tools for CM cluster finding, based on identifying the locations of the highest textures (high frequency regions), which is illustrated in FIGURE 3c. The cells in the CM cluster generate high frequency textures (FIGURE 3c, left). First, the image is gamma corrected, smoothed and low pass filtered, which
results in bright cluster boards against a black background (FIGURE 3c, middle). This is followed by an image convolution using a large area template on the whole frame (full frame/ROI). This way, multiple clusters can be distinguished from the surroundings. In FIGURE 3c, the blue rectangles show the three clusters identified. This feature provides means to automate both the cluster detection and beating analysis. E. EXPERIMENTAL PROTOCOLS The culturing temperature was programmatically adjusted from 37 oC to 25 oC and back to 37 oC in 3 oC steps, and beating videos were recorded. Overall, twelve CM clusters were studied in five separate cultures, see TABLE 2 for the experimental summary. The temperature was logged in every 60 s while the video was logged every 2 hours. When a new temperature was set, the culture was let to stabilize for 30 minutes before the video logging. Results are provided in the section Automated temperature stressing. The contractile synchronization measurements were carried out using cultures containing dissociated clusters, and the results from a six cluster case are provided in the section Contractile synchronization of dissociated hiPSC-CM clusters. Further, the plots of temporal reduction in beating frequency in cases of two long-term cultures are provided in the section Temporal changes in beating at a constant
FIGURE 3. Movement center detection and cluster finding. (a-b) The signal portion of a contraction-relaxation region of a single cell selected for the movement center analysis. The frames from this portion are spatially split into M-by-N tiles for sequential affine flow processing. The detected movement center is marked with a dashed blue rectangle. (c) Three images (first frame, smoothed, and with identified clusters) from the clust er-finding feature. The blue rectangles show the identified clusters in the whole frame. See also the Supplementary material 5

6
VOLUME XX 2020
temperature. The Q10 temperature coefficients were calculated using an exponential model, as (BF1/BF2)*exp(10/[T1 -T2]) where BF1 and BF2 are beating frequencies at temperatures T1 and T2 [27]. Statistical analysis: Pairwise comparisons of mean parameter values at different temperatures were performed by one sided parametric t-test and p < 0.05 was regarded as statistically significant. III. RESULTS A. AUTOMATED TEMPERATURE STRESSING The beating signals (Vy) analyzed from a representative cluster (C12, RNo-2) at three selected temperatures (37 oC, 31 oC, and 25 oC) as an overlay on corresponding beating
videos are shown in FIGURE 6. In addition, the figure displays the calculated values for the beating frequency (BF), contraction time (CT), relaxation time (RT), and relaxed time (RxT, the time between relaxation and contraction). The results show that lowering the temperature decreases BF, increases RT and RxT, while CT remains relatively constant here. The full video is provided as Supplementary material 2. FIGURE 5a-e shows the temperature induced changes in the beating frequency (BF), contraction time (CT), relaxation time (RT), and amplitude of contraction for two representative clusters (C9, C10, RNo-1:4). The data is from four consecutive stressing cycles lasting for approximately 60 hours. The results show that hiPSC-CM contractility responds strongly to the temperature changes: the beating frequency (FIGURE 5b) changes, as expected, directly proportionally to temperature and also declines over time (see also FIGURE 7b, C9 and C10, ~100 hours). In a single representative stressing cycle (FIGURE 7a, C12, RNo-1), the linear temperature coefficient is approximately 5 BPM/oC (the coefficient of determination, R2=0.97). Remarkably, nonlinear functions provide better fits, for
TABLE 1. CMaN performance comparison against MUSCLEMOTION and SarcTrack using two computers (System1: 2.6 GHz processor and 32 GB RAM, System2: 2.7 GHz processor and 8GB RAM). ✝30 s long avi (60 fps, 640 x 512 pixels, 32 bit RGB, 1.64 GB size on SSD hard drive). ✝220 avi files (33 GB size on external SSD drive). MUSCLEMOTION SarcTrack CMaN Platform Image J MATLAB MATLAB Algorithm principle pixel intensity difference fluorescent tag tracking affine flow User ROI no no yes Minimum ROI (pixels) NA NA 78 x 78 Number of signals/processing 1 1 6 Sensitivity see FIGURE 4 NA see FIGURE 4 Processing time (~ minutes) System1 System2 1 video✝ 3 (6 in dynamic mode) 350 1 1.3 Batch✝2 of videos 129 7390 25 28
FIGURE 4. CMaN analysis sensitivity. Column 1: Screenshots of 5 videos. Here the original video (1st one) was spatially downsized 1/8, 1/64, 1/128 and 1/256 times to produce subsequent videos with reduced movement area. Columns 2 &3: Normalized signals (referenced to original signal, ROI: full frame which includes also black area in downsized videos) analyzed with CMaN and MUSCLEMOTION. CMaN apparently displayed better sensitivity.
TABLE 2. Summary of temperature response experimentation
Cluster code
Temperature (range, step, [°C])
Number of replication cycles (code: RNo)
Logging interval TSP Video (minutes) (hours) C1 37-25-37, 3 5 1 2 C2 37-25-37, 3 5 1 2 C3 37-25-37, 3 8 1 2 C4 37-25-37, 3 8 1 2 C5 37-25-37, 3 8 1 2 C6 37-25-37, 3 8 1 2 C7 37-25-37, 3 8 1 2 C8 37-25-37, 3 8 1 2 C9 37-25-37, 3 6 1 2 C10 37-25-37, 3 6 1 2 C11 37-25-37, 3 4 1 2 C12 37-25-37, 3 2 1 2 C11 constant 37 - 1 4 C9 constant 37 - 1 18

7
VOLUME XX 2020
example, a 2nd degree polynomial and a monoexponential function yielded R2 = 0.9999 and R2 = 0.9996 respectively. FIGURE 7c shows the beating frequency (C9, C10) together with their nonlinear fits for 75 hours of culture. Here, the Q10 temperature coefficients (see plots) are larger than 2 (up to 60 hours), implying strong temperature dependence. Here also the R2 of nonlinear fits (FIGURE 7d) are usually larger than that of linear (poly1) fits. Further, the nonlinear temperature dependence was confirmed in the case of all the 12 clusters, and its significance was statistically verified with t-test on the R2 values. There, the nonlinear R2 > linear R2 in 0-15 hours (means 93 % and 90 %, p < 0.05) and 0-30 hours (means 91 % and 88 %, p < 0.05). But, for durations > 30 hours, several clusters show a reduction in spontaneous contractility by factors other than temperature too, hence the statistical analysis becomes complex. Similarly, the contraction and relaxation times also vary, but inversely (see FIGURE 5c,d) with the temperature, so their magnitudes are larger at lower temperatures. In addition, the relaxation times were often found to be larger than the contraction times. In TABLE 3, the relaxation and contraction times at low (T=25.0±0.1 oC) and high (T=37.1 ± 0.1 oC) temperatures are listed. The numbers show that a
12 oC decline in temperature causes a 80 % increase in the contraction time and a 115 % increase in the relaxation time. Likewise, the amplitude of contraction (FIGURE 5e), calculated as the geometric mean of the amplitudes of Vx and Vy signals also shows a strong temperature dependence
FIGURE 6. Effect of temperature on hiPSC-cardiomyocyte function. Analyzed beating signals (C12, RNo-1) at three selected temperatures as an overlay on the corresponding videos. See Supplementary material 2 for the full video. Calculated values are shown for the beating frequency (BF), contraction time (CT), relaxation time (RT), and relaxed time (RxT-the time between relaxation and contraction)
FIGURE 5. Temperature response plots of the two representative hiPSC-CM clusters (C9 and C10). Experimental data from approximately 60 hours of mechanobiological measurements where (a) Cell area temperature, (b) Beating frequency, (c) Contraction time, (d) Relaxation time, and (e) Amplitude of contraction. The temperature was precisely measured using the temperature sensitive plate and the plotted parameters were non-invasively analyzed with the video-based beating analysis software CMaN.

8
VOLUME XX 2020
similar to beating frequency. However, the beat-to-beat amplitude variation in the 60 s videos, especially at low temperatures, is large. Further, the beating frequency from four stressing cycles of all twelve clusters (from five different cell cultures) is shown in FIGURE 9. The span of beating frequency varied
from culture to culture, so for statistical comparison, frequencies are scaled between 1 and 0 using a normalization function (BF-min(BF))/(max(BF)-min(BF)), where BF is the beating frequency. Despite the normalization, the error bars show relatively large variations, which presumably stems from a biological variability between the individual clusters.
TABLE 3. The mean relaxation and contraction time of all clusters (C1-C12) at two temperatures. Results are presented in terms of mean and standard deviation. Statistical analysis according to t-test (one-tailed). Statistical significances are denoted as * p < 0.05; ** p < 0.01. Temperature (oC) Contraction time (CT, ms) Relaxation time(RT, ms) RT to CT ratio 37.1 ± 0.1 152 ± 21.6 177.3 ± 55.6 1.1 25.0 ± 0.1 274.1 ± 93.4 367.0 ± 110 1.3
B. CONTRACTILE SYNCHRONIZATION OF DISSOCIATED hiPSC-CM CLUSTERS We also quantified the electrical activation (AP propagation) between dissociated clusters by measuring the time delay between their beatings. FIGURE 10a shows six beating clusters (C3-C8) whose movement centers are marked with blue rectangles. Their beating signals are shown in FIGURE 10c, where the AP propagation time delay between contractions is clear. The signal propagation is also made * **
FIGURE 7. The hiPSC cardiomyocytes beating frequency in long-term temperature stressing experiments. The data are from automated temperature cycles of decreasing (37 oC to 25 oC) and increasing (25 oC to 37 oC) temperatures in 3 oC steps. (a) C12 data from a representative single stressing cycle (RNo-1) with linear and nonlinear (polynomial 2 and monoexponetial) fits. Compared to linear fit, the nonlinear functions showed nearly perfect (R2 ≈1) fits. (b) Beating frequencies of two clusters (C9 and C10, RNo-1:4) in about 60 hours of experiment. (c) Data (shown in upper right figure) rearranged into different time segments, with 2nd degree polynomial and monoexponential fits. The computed Q10 temperature coefficients are shown in each figure, showing a strong temperature dependence on hiPSC-CM function. However the coefficient of determination drops significantly in extended cultures.

9
VOLUME XX 2020
visually detectable in the original video by image processing; an example video is provided as Supplementary material 3. FIGURE 10b shows selected frames from this video. The dynamic sequence of cluster networking starts at cluster (FIGURE 10b(i)), passes through other clusters up until the cluster 6 (FIGURE 10b(vi)). Here, each frame is produced as the absolute difference in intensity between the actual frame and the first frame. As a result, a brighter passing halo becomes visible to describe the AP propagation delay. In FIGURE 10d, this time delay is plotted as a function of the cluster distance (cluster C8/ C7/ C6/ C5/ C4/C3- cluster C3), and the corresponding AP propagation velocities (slope) are calculated to be v = 3.88, 2.76, 2.34 and 1.98 mm/s at T = 37, 34, 31, and 28 oC, respectively.
C. TEMPORAL CHANGES IN BEATING AT A CONSTANT TEMPERATURE It has also been observed that the contractility slowly decreases over extended periods of time even at a constant temperature. The beating frequency plots from two long-term measurements at constant 37 oC with 2 clusters (C11, C9) are shown in FIGURE 8. The measured slope (dBF/dt [BPM/hrs]) values are -0.22 and -0.74, respectively, indicating a 68–85 % decline in beating frequency in 70–100 hours. The rate of the decline probably depends on many factors, including the cell density, secretory/metabolic conditions, and medium ageing (exhaustion of accessory food factors). IV. DISCUSSION In this paper, we have demonstrated the applicability of a previously reported modular cell culturing system [26] with two new add-ons: 1) temperature sensor plates [24] and 2) a
novel video-based mechanobiology analysis software, CMaN, to study the temperature response of hiPSC-CMs. Experiments were conducted outside a conventional incubator, and to the best of our knowledge, this is the first report describing a systematic automated temperature stressing and concurrent hiPSC-CM function analysis. The results show that the hiPSC-CM contractile function is strongly temperature dependent, and that typically temperature coefficient Q10> 2. Further, the beating frequency –temperature relationship was found to be well described by nonlinear (2nd order polynomial and monoexponential) functions. In the statistical analysis, the R2 values were always higher for the nonlinear models than for the linear ones, and some clusters showed nearly perfect (R2 ~1) nonlinear fits. Thus, maintaining a stable temperature in hiPSC-CMs experiments is of utmost important in order to minimize undesired stimulation of the cells and to avoid experimental errors. Further, we noticed that in continuous measurements, the contractility of hiPSC-CMs decreases over time even at fixed temperatures, which is also an important factor to consider in experimental designs. The medium ageing, evaporation, and related changes in the medium composition as well as exhaustion of essential nutrients are likely contributing to slowing the contractile kinetics temporally [19]. The combined beating frequency plot (FIGURE 9) contains the data from twelve beating clusters from five different cell cultures, hence the error bars also account for the biological variability. As the hiPSC-CMs are known to exhibit high phenotype variability, the variability of the temperature dependency between different myocytes/culture preparations also needs to be recognized. In contrast to beating frequency, the contraction and relaxation times vary inversely with temperature. The relaxation times are typically longer than the contraction times. The amplitude of the contraction, on the other hand, displayed more beat-to-beat variability (standard deviation) in almost all recorded videos. Intriguingly, some clusters ceased the beating function occasionally, but regained the function in due course and exhibited the temperature dependence in continued stressing cycles.
FIGURE 9. Beating frequency of twelve spontaneously beating hiPSC-cardiomyocyte clusters in four stressing cycles. The clusters are from five different cell cultures where the range of beating frequency varied from culture to culture. Thus, the error bars also account for the biological variability.
FIGURE 8. Temporal reduction of beating frequency at 37 oC in two separate cultures. A 68–85 % decline in beating frequency was observed in 70–100 hours.
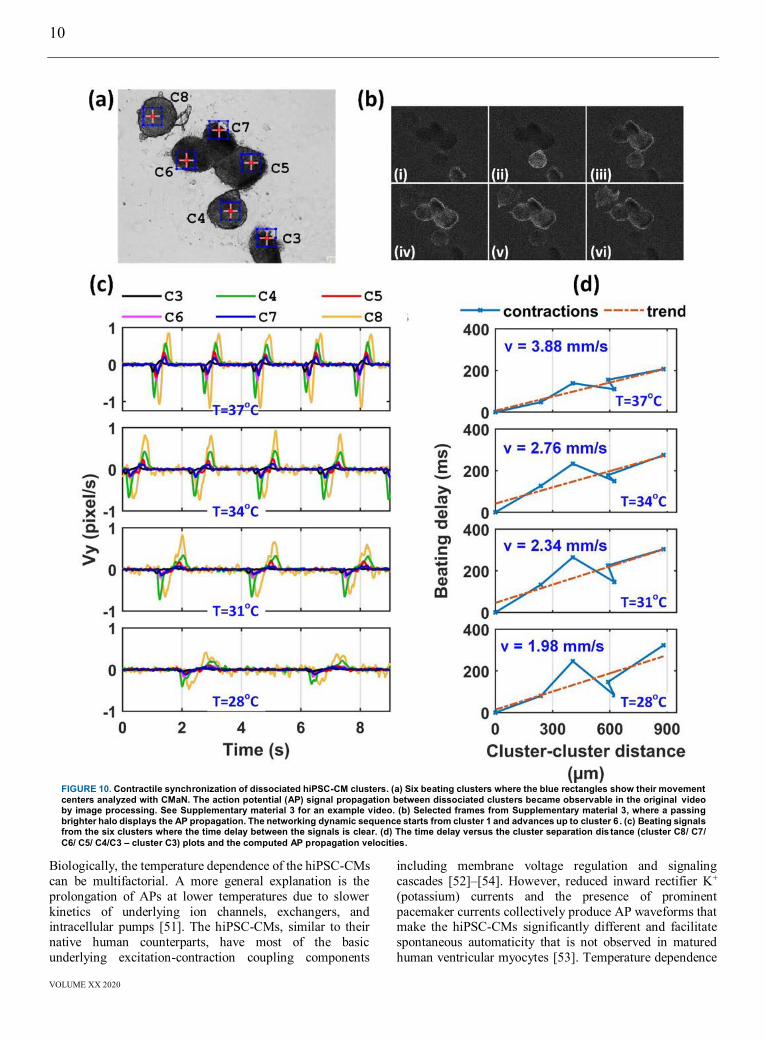
10
VOLUME XX 2020
Biologically, the temperature dependence of the hiPSC-CMs can be multifactorial. A more general explanation is the prolongation of APs at lower temperatures due to slower kinetics of underlying ion channels, exchangers, and intracellular pumps [51]. The hiPSC-CMs, similar to their native human counterparts, have most of the basic underlying excitation-contraction coupling components
including membrane voltage regulation and signaling cascades [52]–[54]. However, reduced inward rectifier K+ (potassium) currents and the presence of prominent pacemaker currents collectively produce AP waveforms that make the hiPSC-CMs significantly different and facilitate spontaneous automaticity that is not observed in matured human ventricular myocytes [53]. Temperature dependence
FIGURE 10. Contractile synchronization of dissociated hiPSC-CM clusters. (a) Six beating clusters where the blue rectangles show their movement centers analyzed with CMaN. The action potential (AP) signal propagation between dissociated clusters became observable in the original video by image processing. See Supplementary material 3 for an example video. (b) Selected frames from Supplementary material 3, where a passing brighter halo displays the AP propagation. The networking dynamic sequence starts from cluster 1 and advances up to cluster 6 . (c) Beating signals from the six clusters where the time delay between the signals is clear. (d) The time delay versus the cluster separation dis tance (cluster C8/ C7/ C6/ C5/ C4/C3 – cluster C3) plots and the computed AP propagation velocities.

11
VOLUME XX 2020
of AP prolongation has been previously studied in animal models [55], [56]. Guinea pig ventricular myocytes have shown 115 % prolongation of AP with a 10 oC temperature drop [56]. The acute effect of temperature on the relaxation time and pacemaker firing rate of Sprague-Dawley rat CMs has also been reported [3]. In our study, we measured the prolongation of the hiPSC-CM relaxation (analogue to the AP repolarization) and contraction times systematically. Multiple voltage-gated ion channels are presumably contributing to this; however, the exact quantification schemes of the dependence of most of the underlying mechanisms on environmental parameters (e.g. temperature, pO2, pH, pCO2) are ambiguous, and accurate models have not yet been developed. We also measured the propagation of electrical activation between dissociated hiPSC-CM clusters by optical means. The clusters, even though physically separated, are possibly connected to each other through cells (non-CMs) underneath, that act as a cardiac skeleton for mechanical scaffolding. A few studies using animal cells have confirmed the electrophysiological coupling of fibroblasts (of cardiac origin) with CMs to propagate contractions over finite distances [57]–[59]. Recently, some studies quantified the AP propagation distance and the beating synchronization of certain CM types [7], [60], [61]. In our study, we quantified the synchronization delay for hiPSC-CMs by non-invasive image-based measurements and measured the AP propagation velocities (v = 1.98-3.88 mm/s at 28-37 oC). The AP propagation velocities can obviously be a function of cell density, configuration (single cells, cell sheets, etc.), age, and maturation state. The software, CMaN, is freely available and in contrast to compared software programs, it is several times faster, more robust and sensitive, computationally less expensive and allows easy ROI selection. This allows processing of specific areas/cells carefully, for instance when frames contain multiple cells/clusters. More importantly, CMaN extracts six components of contractile motion per processing, which enables a minimum of one useful beating signal even in complex scenarios such as weak movements, or overexposure/gamma by uneven background illumination. Signal from CMaN is analogues to ECG with both positive (upstroke) and negative (downstroke) segments to represent the contractile phenomena more exactly. This helps to compute the beating frequency and contraction and relaxation phenomena separately. Additionally, CMaN has supplemental features for cluster finding and movement center detection. One limitation of the CMaN is that it can currently only process avi files. If the input comes as a sequence of images, those have to be first converted into an avi file (for example using ImageJ or the script provided in the CMaN user manual). Currently the mechanobiological analysis is carried out in two stages; first stage is the automatic signal extraction, and in the second stage, a fine tuning (adjusting thresholds with the sliders in the GUI) may be required in case of heavily noisy or complex beating scenarios. The software is an offline tool, but the basic script
for the affine flow computation is provided (see CMaN user manual) which can be edited for online automated beating analysis or other extended applications. One future direction is the measurement of contractile forces with beating signals by integrating a micro-displacement actuator (e.g. fluorescent beads/magnetic beads/micro-cantilevers). We are also developing cell and disease models where the platform described in this paper is directly applied. V. CONCLUSIONS We have described a system and software that allows the assessment of hiPSC derived CM contractions with changing temperatures. The highlights of the paper are the first time reporting of 1) the nonlinear temperature dependence on the beating frequency of hiPSC-CMs; 2) the visualization of hiPSC-CM contractile networking and the non-invasive measurement of signal propagation between dissociated clusters; 3) the release of an advanced and robust software that tracks multiple signals from CM beating videos. The system and software are useful additions in assay development and organ-on-chip experimentations. CONFLICT OF INTERESTS The authors report no conflicts of interest. ELECTRONIC SUPPLEMENTARY MATERIAL This article contains supplementary materials, which are available to authorized users. Supplementary material 1. CMaN- a video-based cardiomyocyte functional analysis software: https://figshare.com/s/3402bca86fe93f29a73f Supplementary material 2. Temperature response characteristics of a beating hiPSC-CM cluster at three selected temperatures: https://figshare.com/s/0ae47cd47234b93afb21 Supplementary material 3. Visualization of AP propagation between dissociated clusters. For better visualization the video speed is reduced to one third of the original speed: https://figshare.com/s/46d03767284ba2d32a1d Supplementary material 4. An example beat rate increasing and decreasing drug response analysis with CMaN: https://figshare.com/s/09cebfe5fbed9762f058 Supplementary material 5. Movement center analysis. Beating signals at the movement center and at different locations of a contracting hiPSC-CM: https://figshare.com/s/9bf68f0707a4e64a4a78 REFERENCES [1] R. Madonna, “Human-Induced pluripotent stem cells: In quest of clinical applications,” Molecular Biotechnology. 2012. [2] V. K. Singh, M. Kalsan, N. Kumar, A. Saini, and R. Chandra,
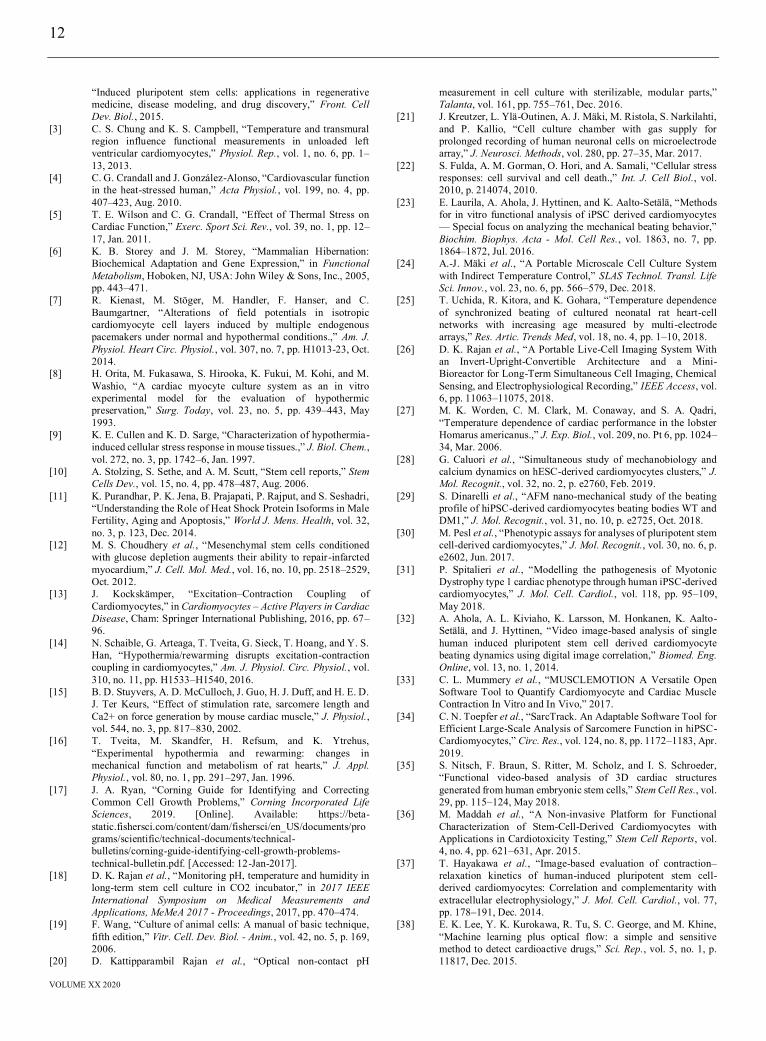
12
VOLUME XX 2020
“Induced pluripotent stem cells: applications in regenerative medicine, disease modeling, and drug discovery,” Front. Cell Dev. Biol., 2015. [3] C. S. Chung and K. S. Campbell, “Temperature and transmural region influence functional measurements in unloaded left ventricular cardiomyocytes,” Physiol. Rep., vol. 1, no. 6, pp. 1–13, 2013. [4] C. G. Crandall and J. González-Alonso, “Cardiovascular function in the heat-stressed human,” Acta Physiol., vol. 199, no. 4, pp. 407–423, Aug. 2010. [5] T. E. Wilson and C. G. Crandall, “Effect of Thermal Stress on
Cardiac Function,” Exerc. Sport Sci. Rev., vol. 39, no. 1, pp. 12–17, Jan. 2011. [6] K. B. Storey and J. M. Storey, “Mammalian Hibernation:
Biochemical Adaptation and Gene Expression,” in Functional Metabolism, Hoboken, NJ, USA: John Wiley & Sons, Inc., 2005, pp. 443–471. [7] R. Kienast, M. Stöger, M. Handler, F. Hanser, and C. Baumgartner, “Alterations of field potentials in isotropic cardiomyocyte cell layers induced by multiple endogenous pacemakers under normal and hypothermal conditions.,” Am. J. Physiol. Heart Circ. Physiol., vol. 307, no. 7, pp. H1013-23, Oct. 2014. [8] H. Orita, M. Fukasawa, S. Hirooka, K. Fukui, M. Kohi, and M. Washio, “A cardiac myocyte culture system as an in vitro experimental model for the evaluation of hypothermic preservation,” Surg. Today, vol. 23, no. 5, pp. 439–443, May 1993. [9] K. E. Cullen and K. D. Sarge, “Characterization of hypothermia-induced cellular stress response in mouse tissues.,” J. Biol. Chem., vol. 272, no. 3, pp. 1742–6, Jan. 1997. [10] A. Stolzing, S. Sethe, and A. M. Scutt, “Stem cell reports,” Stem Cells Dev., vol. 15, no. 4, pp. 478–487, Aug. 2006. [11] K. Purandhar, P. K. Jena, B. Prajapati, P. Rajput, and S. Seshadri, “Understanding the Role of Heat Shock Protein Isoforms in Male
Fertility, Aging and Apoptosis,” World J. Mens. Health, vol. 32, no. 3, p. 123, Dec. 2014. [12] M. S. Choudhery et al., “Mesenchymal stem cells conditioned with glucose depletion augments their ability to repair-infarcted myocardium,” J. Cell. Mol. Med., vol. 16, no. 10, pp. 2518–2529, Oct. 2012. [13] J. Kockskämper, “Excitation–Contraction Coupling of Cardiomyocytes,” in Cardiomyocytes – Active Players in Cardiac Disease, Cham: Springer International Publishing, 2016, pp. 67–96. [14] N. Schaible, G. Arteaga, T. Tveita, G. Sieck, T. Hoang, and Y. S. Han, “Hypothermia/rewarming disrupts excitation-contraction coupling in cardiomyocytes,” Am. J. Physiol. Circ. Physiol., vol. 310, no. 11, pp. H1533–H1540, 2016. [15] B. D. Stuyvers, A. D. McCulloch, J. Guo, H. J. Duff, and H. E. D. J. Ter Keurs, “Effect of stimulation rate, sarcomere length and Ca2+ on force generation by mouse cardiac muscle,” J. Physiol., vol. 544, no. 3, pp. 817–830, 2002. [16] T. Tveita, M. Skandfer, H. Refsum, and K. Ytrehus, “Experimental hypothermia and rewarming: changes in mechanical function and metabolism of rat hearts,” J. Appl. Physiol., vol. 80, no. 1, pp. 291–297, Jan. 1996. [17] J. A. Ryan, “Corning Guide for Identifying and Correcting
Common Cell Growth Problems,” Corning Incorporated Life Sciences, 2019. [Online]. Available: https://beta-static.fishersci.com/content/dam/fishersci/en_US/documents/programs/scientific/technical-documents/technical-bulletins/corning-guide-identifying-cell-growth-problems-technical-bulletin.pdf. [Accessed: 12-Jan-2017]. [18] D. K. Rajan et al., “Monitoring pH, temperature and humidity in long-term stem cell culture in CO2 incubator,” in 2017 IEEE International Symposium on Medical Measurements and Applications, MeMeA 2017 - Proceedings, 2017, pp. 470–474. [19] F. Wang, “Culture of animal cells: A manual of basic technique,
fifth edition,” Vitr. Cell. Dev. Biol. - Anim., vol. 42, no. 5, p. 169, 2006. [20] D. Kattipparambil Rajan et al., “Optical non-contact pH
measurement in cell culture with sterilizable, modular parts,” Talanta, vol. 161, pp. 755–761, Dec. 2016. [21] J. Kreutzer, L. Ylä-Outinen, A. J. Mäki, M. Ristola, S. Narkilahti, and P. Kallio, “Cell culture chamber with gas supply for prolonged recording of human neuronal cells on microelectrode array,” J. Neurosci. Methods, vol. 280, pp. 27–35, Mar. 2017. [22] S. Fulda, A. M. Gorman, O. Hori, and A. Samali, “Cellular stress
responses: cell survival and cell death.,” Int. J. Cell Biol., vol. 2010, p. 214074, 2010. [23] E. Laurila, A. Ahola, J. Hyttinen, and K. Aalto-Setälä, “Methods for in vitro functional analysis of iPSC derived cardiomyocytes — Special focus on analyzing the mechanical beating behavior,” Biochim. Biophys. Acta - Mol. Cell Res., vol. 1863, no. 7, pp. 1864–1872, Jul. 2016. [24] A.-J. Mäki et al., “A Portable Microscale Cell Culture System
with Indirect Temperature Control,” SLAS Technol. Transl. Life Sci. Innov., vol. 23, no. 6, pp. 566–579, Dec. 2018. [25] T. Uchida, R. Kitora, and K. Gohara, “Temperature dependence of synchronized beating of cultured neonatal rat heart-cell networks with increasing age measured by multi-electrode arrays,” Res. Artic. Trends Med, vol. 18, no. 4, pp. 1–10, 2018. [26] D. K. Rajan et al., “A Portable Live-Cell Imaging System With an Invert-Upright-Convertible Architecture and a Mini-Bioreactor for Long-Term Simultaneous Cell Imaging, Chemical Sensing, and Electrophysiological Recording,” IEEE Access, vol. 6, pp. 11063–11075, 2018. [27] M. K. Worden, C. M. Clark, M. Conaway, and S. A. Qadri, “Temperature dependence of cardiac performance in the lobster Homarus americanus.,” J. Exp. Biol., vol. 209, no. Pt 6, pp. 1024–34, Mar. 2006. [28] G. Caluori et al., “Simultaneous study of mechanobiology and calcium dynamics on hESC-derived cardiomyocytes clusters,” J. Mol. Recognit., vol. 32, no. 2, p. e2760, Feb. 2019. [29] S. Dinarelli et al., “AFM nano-mechanical study of the beating profile of hiPSC-derived cardiomyocytes beating bodies WT and DM1,” J. Mol. Recognit., vol. 31, no. 10, p. e2725, Oct. 2018. [30] M. Pesl et al., “Phenotypic assays for analyses of pluripotent stem cell-derived cardiomyocytes,” J. Mol. Recognit., vol. 30, no. 6, p. e2602, Jun. 2017. [31] P. Spitalieri et al., “Modelling the pathogenesis of Myotonic Dystrophy type 1 cardiac phenotype through human iPSC-derived cardiomyocytes,” J. Mol. Cell. Cardiol., vol. 118, pp. 95–109, May 2018. [32] A. Ahola, A. L. Kiviaho, K. Larsson, M. Honkanen, K. Aalto-Setälä, and J. Hyttinen, “Video image-based analysis of single human induced pluripotent stem cell derived cardiomyocyte beating dynamics using digital image correlation,” Biomed. Eng. Online, vol. 13, no. 1, 2014. [33] C. L. Mummery et al., “MUSCLEMOTION A Versatile Open Software Tool to Quantify Cardiomyocyte and Cardiac Muscle Contraction In Vitro and In Vivo,” 2017. [34] C. N. Toepfer et al., “SarcTrack. An Adaptable Software Tool for Efficient Large-Scale Analysis of Sarcomere Function in hiPSC-Cardiomyocytes,” Circ. Res., vol. 124, no. 8, pp. 1172–1183, Apr. 2019. [35] S. Nitsch, F. Braun, S. Ritter, M. Scholz, and I. S. Schroeder, “Functional video-based analysis of 3D cardiac structures generated from human embryonic stem cells,” Stem Cell Res., vol. 29, pp. 115–124, May 2018. [36] M. Maddah et al., “A Non-invasive Platform for Functional Characterization of Stem-Cell-Derived Cardiomyocytes with Applications in Cardiotoxicity Testing,” Stem Cell Reports, vol. 4, no. 4, pp. 621–631, Apr. 2015. [37] T. Hayakawa et al., “Image-based evaluation of contraction–relaxation kinetics of human-induced pluripotent stem cell-derived cardiomyocytes: Correlation and complementarity with extracellular electrophysiology,” J. Mol. Cell. Cardiol., vol. 77, pp. 178–191, Dec. 2014. [38] E. K. Lee, Y. K. Kurokawa, R. Tu, S. C. George, and M. Khine, “Machine learning plus optical flow: a simple and sensitive
method to detect cardioactive drugs,” Sci. Rep., vol. 5, no. 1, p. 11817, Dec. 2015.
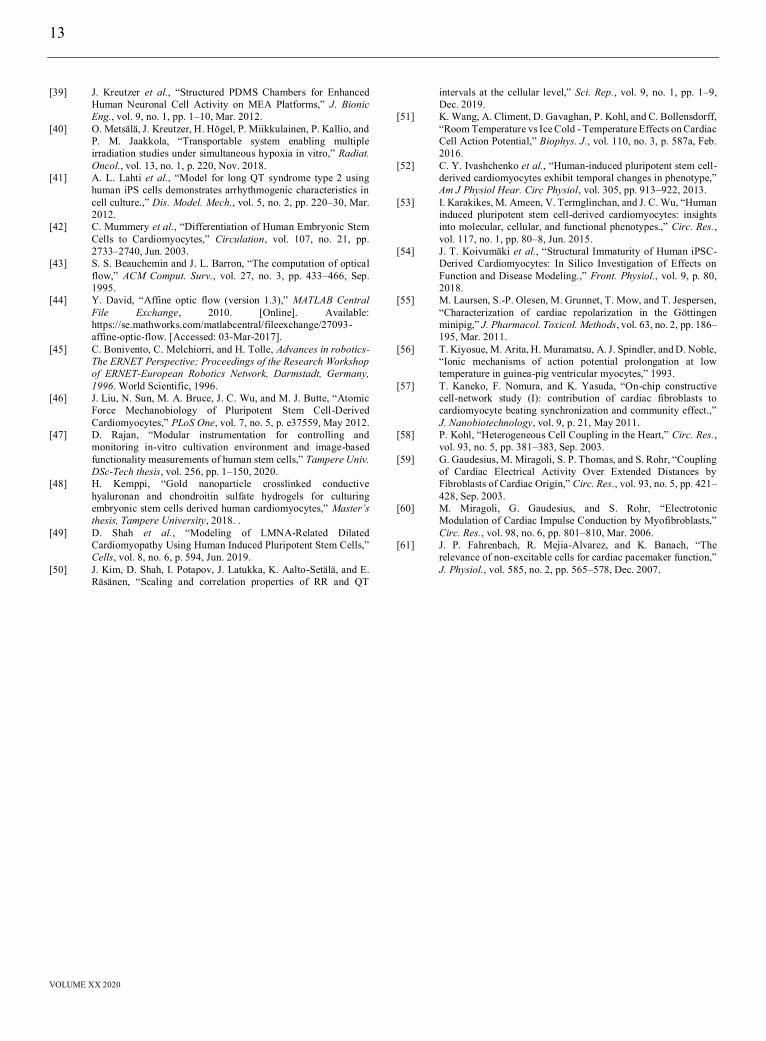
13
VOLUME XX 2020
[39] J. Kreutzer et al., “Structured PDMS Chambers for Enhanced Human Neuronal Cell Activity on MEA Platforms,” J. Bionic Eng., vol. 9, no. 1, pp. 1–10, Mar. 2012. [40] O. Metsälä, J. Kreutzer, H. Högel, P. Miikkulainen, P. Kallio, and P. M. Jaakkola, “Transportable system enabling multiple irradiation studies under simultaneous hypoxia in vitro,” Radiat. Oncol., vol. 13, no. 1, p. 220, Nov. 2018. [41] A. L. Lahti et al., “Model for long QT syndrome type 2 using human iPS cells demonstrates arrhythmogenic characteristics in cell culture.,” Dis. Model. Mech., vol. 5, no. 2, pp. 220–30, Mar. 2012. [42] C. Mummery et al., “Differentiation of Human Embryonic Stem
Cells to Cardiomyocytes,” Circulation, vol. 107, no. 21, pp. 2733–2740, Jun. 2003. [43] S. S. Beauchemin and J. L. Barron, “The computation of optical flow,” ACM Comput. Surv., vol. 27, no. 3, pp. 433–466, Sep. 1995. [44] Y. David, “Affine optic flow (version 1.3),” MATLAB Central File Exchange, 2010. [Online]. Available: https://se.mathworks.com/matlabcentral/fileexchange/27093-affine-optic-flow. [Accessed: 03-Mar-2017]. [45] C. Bonivento, C. Melchiorri, and H. Tolle, Advances in robotics- The ERNET Perspective; Proceedings of the Research Workshop of ERNET-European Robotics Network, Darmstadt, Germany, 1996. World Scientific, 1996. [46] J. Liu, N. Sun, M. A. Bruce, J. C. Wu, and M. J. Butte, “Atomic Force Mechanobiology of Pluripotent Stem Cell-Derived Cardiomyocytes,” PLoS One, vol. 7, no. 5, p. e37559, May 2012. [47] D. Rajan, “Modular instrumentation for controlling and monitoring in-vitro cultivation environment and image-based functionality measurements of human stem cells,” Tampere Univ. DSc-Tech thesis, vol. 256, pp. 1–150, 2020. [48] H. Kemppi, “Gold nanoparticle crosslinked conductive hyaluronan and chondroitin sulfate hydrogels for culturing embryonic stem cells derived human cardiomyocytes,” Master’s thesis, Tampere University, 2018. . [49] D. Shah et al., “Modeling of LMNA-Related Dilated Cardiomyopathy Using Human Induced Pluripotent Stem Cells,” Cells, vol. 8, no. 6, p. 594, Jun. 2019. [50] J. Kim, D. Shah, I. Potapov, J. Latukka, K. Aalto-Setälä, and E. Räsänen, “Scaling and correlation properties of RR and QT
intervals at the cellular level,” Sci. Rep., vol. 9, no. 1, pp. 1–9, Dec. 2019. [51] K. Wang, A. Climent, D. Gavaghan, P. Kohl, and C. Bollensdorff, “Room Temperature vs Ice Cold - Temperature Effects on Cardiac Cell Action Potential,” Biophys. J., vol. 110, no. 3, p. 587a, Feb. 2016. [52] C. Y. Ivashchenko et al., “Human-induced pluripotent stem cell-derived cardiomyocytes exhibit temporal changes in phenotype,” Am J Physiol Hear. Circ Physiol, vol. 305, pp. 913–922, 2013. [53] I. Karakikes, M. Ameen, V. Termglinchan, and J. C. Wu, “Human induced pluripotent stem cell-derived cardiomyocytes: insights into molecular, cellular, and functional phenotypes.,” Circ. Res., vol. 117, no. 1, pp. 80–8, Jun. 2015. [54] J. T. Koivumäki et al., “Structural Immaturity of Human iPSC-Derived Cardiomyocytes: In Silico Investigation of Effects on Function and Disease Modeling.,” Front. Physiol., vol. 9, p. 80, 2018. [55] M. Laursen, S.-P. Olesen, M. Grunnet, T. Mow, and T. Jespersen, “Characterization of cardiac repolarization in the Göttingen
minipig,” J. Pharmacol. Toxicol. Methods, vol. 63, no. 2, pp. 186–195, Mar. 2011. [56] T. Kiyosue, M. Arita, H. Muramatsu, A. J. Spindler, and D. Noble, “Ionic mechanisms of action potential prolongation at low temperature in guinea-pig ventricular myocytes,” 1993. [57] T. Kaneko, F. Nomura, and K. Yasuda, “On-chip constructive cell-network study (I): contribution of cardiac fibroblasts to cardiomyocyte beating synchronization and community effect.,” J. Nanobiotechnology, vol. 9, p. 21, May 2011. [58] P. Kohl, “Heterogeneous Cell Coupling in the Heart,” Circ. Res., vol. 93, no. 5, pp. 381–383, Sep. 2003. [59] G. Gaudesius, M. Miragoli, S. P. Thomas, and S. Rohr, “Coupling of Cardiac Electrical Activity Over Extended Distances by Fibroblasts of Cardiac Origin,” Circ. Res., vol. 93, no. 5, pp. 421–428, Sep. 2003. [60] M. Miragoli, G. Gaudesius, and S. Rohr, “Electrotonic
Modulation of Cardiac Impulse Conduction by Myofibroblasts,” Circ. Res., vol. 98, no. 6, pp. 801–810, Mar. 2006. [61] J. P. Fahrenbach, R. Mejia-Alvarez, and K. Banach, “The relevance of non-excitable cells for cardiac pacemaker function,” J. Physiol., vol. 585, no. 2, pp. 565–578, Dec. 2007.


PUBLICATION III
Optical non-contact pH measurement in cell culture with sterilizable, modular parts
D. Kattipparambil Rajan, M. Patrikoski, J. Verho, J. Sivula, H. Ihalainen, S. Miettinen,
and J. Lekkala.
Journal of Pure and Applied Analytical Chemistry, Talanta, vol. 161, pp. 755–761, 2016 (https://doi.org/10.1016/j.talanta.2016.09.021)
© 2016, Elsevier B.V. Reprinted with permission from the publisher.

Optical non-contact pH measurement in cell culture with sterilizable,modular parts
Dhanesh Kattipparambil Rajan a,n, Mimmi Patrikoski b,c, Jarmo Verho a, Jyrki Sivula b,c,Heimo Ihalainen a, Susanna Miettinen b,c, Jukka Lekkala a
a Department of Automation Science and Engineering, Tampere University of Technology, Tampere, Finlandb Adult Stem Cell Group, BioMediTech, Institute of Biosciences and Medical Technology, University of Tampere, Tampere, Finlandc Science Center, Tampere University Hospital, Tampere, Finland
a r t i c l e i n f o
Article history:Received 16 June 2016Received in revised form2 September 2016Accepted 5 September 2016Available online 8 September 2016
Keywords:Cell culture pH measurementCell culture non-contact pH measurementPhenol red medium pH measurementCell culture optical pH measurementLong term pH measurement
a b s t r a c t
A non-contact real time pH measurement using fully modular optical parts is described for phenol-redmedium cell cultures. The modular parts can be sterilized, and once the measurement is started at thebeginning of culture, no recalibration or maintenance is needed till the end of the culture. Measurementscan be carried out without any special manual attention. The modular assembly of LED and sensorcassettes is unique, robust, reusable and reproducible.
pH is measured in an intact closed flow system, without wasting any culture medium. A special pumpencapsulation enables the system to be effortlessly functional in extremely humid incubator environ-ments. This avoids lengthy sample tubings in and out of the incubator, associated large temperaturechanges and CO2 buffering issues.
A new correction model to compensate errors caused e.g. by biolayers in spectrometric pH mea-surement is put-forward, which improves the accuracy of pH estimation significantly. The methodprovides resolution down to 0.1 pH unit in physiological pH range with mean absolute error 0.02.
& 2016 Elsevier B.V. All rights reserved.
1. Introduction
pH monitoring in adult stem cell culture provides valuable in-formation on cell metabolic processes and overall growth en-vironment [1]. Cell viability and tissue functions in vivo arestrongly correlated to pH. Changes in extracellular pH from opti-mal can have substantial impact on cell metabolism and pro-liferation [2,3]. Most mammalian cells typically grow at pH 7.0–7.5[4,5]. For example, a fully prepared medium for human adiposestem cells is typically at E7.2 pH at 37 °C with sodium bicarbo-nate buffering. However, when cells proliferate and metabolizenutrients in the culture medium, they secrete CO2 and acid pro-ducts (lactic, carbonic etc.), causing the pH to invariably decreaseover time [1,4,5]. Extremely dense versus sparse plating con-fluency and rate of evaporation can also affect pH levels [6]. Formonitoring cellular environment, it is therefore important to havean accurate, rapid pH monitoring in real time. Conventionally, tomeasure pH reliably, electrochemical sensors or field effect
transistor (ISFET) sensors are used [2,6–8]. Electrochemical sensorsare precise, fast and reversible, but bulky, require large samplevolume and physical contact [4,8]. ISFETs, having non-metallicgates with pH selective membranes, can provide precise mea-surements for small volumes, but still requires physical contact[7,9]. Moreover, both of them show significant signal drift in longterm continuous operation and require periodic recalibration andmaintenance which restricts them as good candidates mainly forshort term applications [6,8,10–13]. A pH sensor in cell culture hasto be operated in an extreme sterile condition where the increasedrisk of contamination by periodic recalibration and maintenance,biolayer formation, and glass membrane cell clogging are all pro-blematic. In contrast to the aforementioned sensors, optical pHsensors have received widespread attention during the last decadein cell culture applications [14–18]. A few optical pH sensors arecommercially available as of Wavepod II-pHOPT from GE Health-care, iTube pH Bioreactor from PreSens, TruFluorspH from Finesseand OptiSens pH from Sartorius. Optical pH sensors, in general, arebased on indicator dyes, typically immobilized on a planar lightguide or on an optical fiber, forming an optode. Hþ ions inducechanges in the molecular structure or orbital energy levels of op-todes, which are translated into changes in spectroscopic phe-nomena such as absorption or reflectance or luminescence orfluorescence [8,17,18]. Most of these sensors require sample
Contents lists available at ScienceDirect
journal homepage: www.elsevier.com/locate/talanta
Talanta
http://dx.doi.org/10.1016/j.talanta.2016.09.0210039-9140/& 2016 Elsevier B.V. All rights reserved.
n Corresponding author.E-mail addresses: [email protected] (D. Kattipparambil Rajan),
[email protected] (M. Patrikoski), [email protected] (J. Verho),[email protected] (J. Sivula), [email protected] (H. Ihalainen),[email protected] (S. Miettinen), [email protected] (J. Lekkala).
Talanta 161 (2016) 755–761
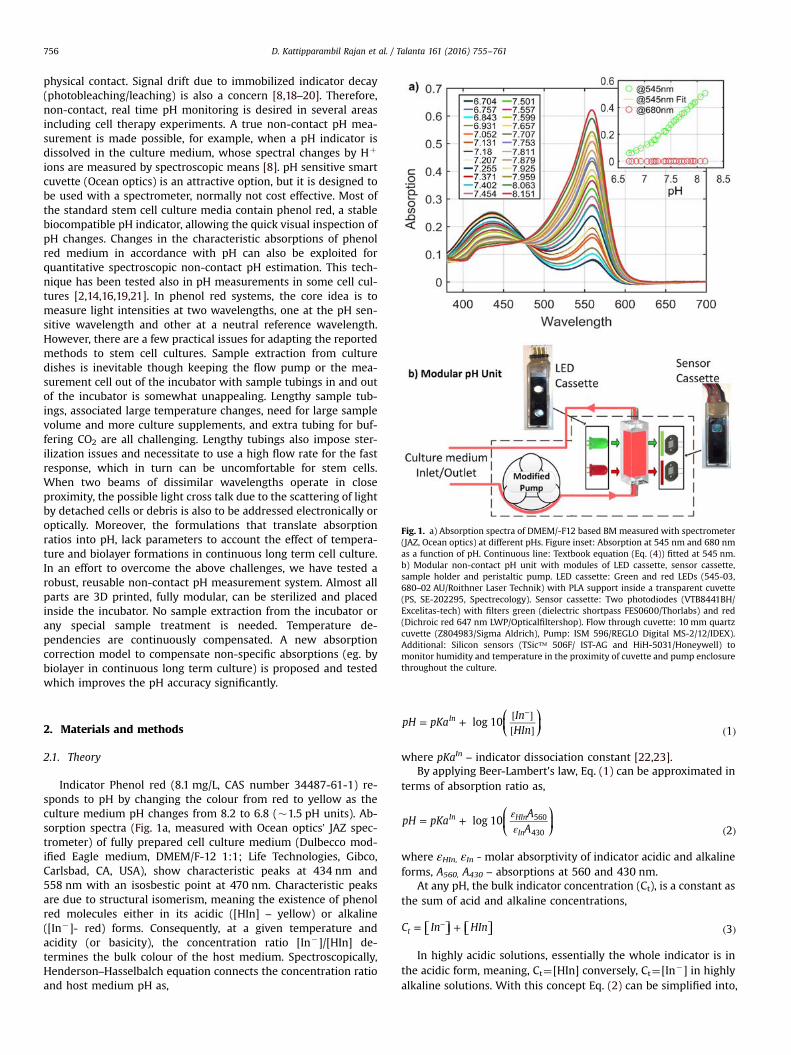
physical contact. Signal drift due to immobilized indicator decay(photobleaching/leaching) is also a concern [8,18–20]. Therefore,non-contact, real time pH monitoring is desired in several areasincluding cell therapy experiments. A true non-contact pH mea-surement is made possible, for example, when a pH indicator isdissolved in the culture medium, whose spectral changes by Hþ
ions are measured by spectroscopic means [8]. pH sensitive smartcuvette (Ocean optics) is an attractive option, but it is designed tobe used with a spectrometer, normally not cost effective. Most ofthe standard stem cell culture media contain phenol red, a stablebiocompatible pH indicator, allowing the quick visual inspection ofpH changes. Changes in the characteristic absorptions of phenolred medium in accordance with pH can also be exploited forquantitative spectroscopic non-contact pH estimation. This tech-nique has been tested also in pH measurements in some cell cul-tures [2,14,16,19,21]. In phenol red systems, the core idea is tomeasure light intensities at two wavelengths, one at the pH sen-sitive wavelength and other at a neutral reference wavelength.However, there are a few practical issues for adapting the reportedmethods to stem cell cultures. Sample extraction from culturedishes is inevitable though keeping the flow pump or the mea-surement cell out of the incubator with sample tubings in and outof the incubator is somewhat unappealing. Lengthy sample tub-ings, associated large temperature changes, need for large samplevolume and more culture supplements, and extra tubing for buf-fering CO2 are all challenging. Lengthy tubings also impose ster-ilization issues and necessitate to use a high flow rate for the fastresponse, which in turn can be uncomfortable for stem cells.When two beams of dissimilar wavelengths operate in closeproximity, the possible light cross talk due to the scattering of lightby detached cells or debris is also to be addressed electronically oroptically. Moreover, the formulations that translate absorptionratios into pH, lack parameters to account the effect of tempera-ture and biolayer formations in continuous long term cell culture.In an effort to overcome the above challenges, we have tested arobust, reusable non-contact pH measurement system. Almost allparts are 3D printed, fully modular, can be sterilized and placedinside the incubator. No sample extraction from the incubator orany special sample treatment is needed. Temperature de-pendencies are continuously compensated. A new absorptioncorrection model to compensate non-specific absorptions (eg. bybiolayer in continuous long term culture) is proposed and testedwhich improves the pH accuracy significantly.
2. Materials and methods
2.1. Theory
Indicator Phenol red (8.1 mg/L, CAS number 34487-61-1) re-sponds to pH by changing the colour from red to yellow as theculture medium pH changes from 8.2 to 6.8 (�1.5 pH units). Ab-sorption spectra (Fig. 1a, measured with Ocean optics’ JAZ spec-trometer) of fully prepared cell culture medium (Dulbecco mod-ified Eagle medium, DMEM/F-12 1:1; Life Technologies, Gibco,Carlsbad, CA, USA), show characteristic peaks at 434 nm and558 nm with an isosbestic point at 470 nm. Characteristic peaksare due to structural isomerism, meaning the existence of phenolred molecules either in its acidic ([HIn] – yellow) or alkaline([In�]- red) forms. Consequently, at a given temperature andacidity (or basicity), the concentration ratio [In�]/[HIn] de-termines the bulk colour of the host medium. Spectroscopically,Henderson–Hasselbalch equation connects the concentration ratioand host medium pH as,
= + [ ][ ] ( )
−⎛⎝⎜
⎞⎠⎟pH pKa
InHIn
log 101
In
where pKaIn – indicator dissociation constant [22,23].By applying Beer-Lambert's law, Eq. (1) can be approximated in
terms of absorption ratio as,
εε
= +( )
⎛⎝⎜
⎞⎠⎟pH pKa
AA
log 102
In HIn
In
560
430
where εHIn, εIn - molar absorptivity of indicator acidic and alkalineforms, A560, A430 – absorptions at 560 and 430 nm.
At any pH, the bulk indicator concentration (Ct), is a constant asthe sum of acid and alkaline concentrations,
= + ( )−⎡⎣ ⎤⎦ ⎡⎣ ⎤⎦C In HIn 3t
In highly acidic solutions, essentially the whole indicator is inthe acidic form, meaning, Ct¼[HIn] conversely, Ct¼[In�] in highlyalkaline solutions. With this concept Eq. (2) can be simplified into,
Fig. 1. a) Absorption spectra of DMEM/-F12 based BM measured with spectrometer(JAZ, Ocean optics) at different pHs. Figure inset: Absorption at 545 nm and 680 nmas a function of pH. Continuous line: Textbook equation (Eq. (4)) fitted at 545 nm.b) Modular non-contact pH unit with modules of LED cassette, sensor cassette,sample holder and peristaltic pump. LED cassette: Green and red LEDs (545-03,680–02 AU/Roithner Laser Technik) with PLA support inside a transparent cuvette(PS, SE-202295, Spectrecology). Sensor cassette: Two photodiodes (VTB8441BH/Excelitas-tech) with filters green (dielectric shortpass FES0600/Thorlabs) and red(Dichroic red 647 nm LWP/Opticalfiltershop). Flow through cuvette: 10 mm quartzcuvette (Z804983/Sigma Aldrich), Pump: ISM 596/REGLO Digital MS-2/12/IDEX).Additional: Silicon sensors (TSic™ 506F/ IST-AG and HiH-5031/Honeywell) tomonitor humidity and temperature in the proximity of cuvette and pump enclosurethroughout the culture.
D. Kattipparambil Rajan et al. / Talanta 161 (2016) 755–761756

= +− ( )
⎛⎝⎜
⎞⎠⎟pH pKa
AA A
log 104
In
mx
560
560
where Amx is the maximum absorption of highly alkaline state at560 nm [23,24].
Absorption as a function of pH at 545 nm (suitable LED nearestto 558 nmwavelength) at ambient temperature is shown in Fig. 1ainset. For fresh medium without any cells Eq. (4) is found to beaccurate enough. However, it was not accurate enough for realtime pH estimation in active cell culture. This is mainly due to theformation of proteins in the medium and protein coating or bio-layer on the cuvette wall leading to non-specific scattering andabsorption losses, which in turn induce error in A545. Conse-quently, an integrated reference transmission measurement at apH insensitive wavelength (eg. 680 nm, see Fig. 1) became in-evitable, for compensating the contributions of other species thanthe indicator molecules in the light path. We put forward an ab-sorption correction model (hereafter GR model) where the re-ference channel data is also included in the pH computation withcertain approximations, so that the accuracy of pH estimationimproved radically. The core objective of the GR model is to se-parate indicator absorption unequivocally from all other non-specific contributions arising out of detached entities (cells/celldebris/particles), biolayer, and protein binding in progressingculture [3,21,25]. Since absorption in a multicomponent system iscumulative in nature, the total absorption measured by 545 nmand 680 nm sensors can be expressed as
= + + ( )A A A t k 5total indicator dm545 545 545
545 545
= + + ( )A A A t k 6total indicator dm680 680 680
680 680
where Adm – absorption due to detached non-indicator moleculesin the medium, t, k – biolayer thickness and light loss constant incoated biolayer.
Since indicator molecules do not absorb light at 680 nm,
= ( )A 0 7indicator680
ε= ( )⎡⎣ ⎤⎦A b dmAlso 8dm
680680
Eqs. (7) and (8) in Eq. (6) yields [ ]dm . Additionally
ε= [ ] ( )A b dm 9dm545
545
Now Eq. (5) can be reconstructed as,
εε
εε
= − − −( )
⎡⎣⎢
⎤⎦⎥A A A t k t k
10indicator total total545 545 545
680
680545 545
545
680680 680
Eq. (10) represents the explicit indicator absorption in terms ofmeasured total absorptions and all other artifacts. However, sincemany of the artifact terms are practically immeasurable in thecontext of cell culture, a perfect artifact free measurement is vir-tually impossible. Nevertheless, the situation can be handledmathematically, with these approximations,
( )εε
=( )
k absolute constant ,11dm
545
680
εε
− ≈( )
⎡⎣⎢
⎤⎦⎥t k t k k
12bm545 545
545
680680 680
Now Eq. (10) can be simplified into an empirical formula as,
= − − ( )A A k A k 13indicator total dm total bl545 545 680
The glass electrode reference pH data at times of start, medium
change and end days of culture, can be used with Eqs. (4) and (13)to extract approximate values of kdm and kbl by means of non-linear least square fit. The approach seems to be straight forwardand has been effectively applied for real time pH measurements in4 long term cell cultures.
Integrated temperature measurements indicate several fluc-tuations though the temperature is expected to be constantthroughout the culture since cells and measurement setup are inthe incubator. This can be due to inherent incubator variabilities,heating caused by the measurement electronics and major dropsat times of incubator door openings. Door openings affect thetemperature and CO2 levels, which directly affect pH levels of theculture medium. Effect of temperature can be compensated in Eq.(4) with integrated temperature sensor readings by applying Van'tHoff's equilibrium constant correction as,
( )= +( )
− −⎡⎣⎢
⎤⎦⎥pKa pKa elog
14T T T T7.5 1
211
2 1
where T1 - initial temperature, T2 - new temperature.
2.2. Apparatus
Modular system schematic is shown in Fig. 1b. It consists of LEDand sensor modules (cassettes), a sample cuvette, peristalticpump, and their support structure. Transmitted light from the LEDmodule through the sample is measured with a sensor module.Optical filters in the sensor module eliminate measurement errorsresulting from the cross talk due to the scattering of light in cul-ture media by detached cells and debris. Spectra of LED's emissionand filter's transmission are shown in Fig. 2a. All the supportstructures are 3D printed (TAZ 3/LulzBot PLA(Polylactic acid)) andmodular cassettes are sealed using hot melt glue. Sealing efficacywas tested by keeping them in DI water bath for around 50 h at38° celsius. The cassettes can be sterilized with 90% ethanol quiteeasily. Culture medium flows through the cuvette at a very stablerate (5 ml/min) with the peristaltic pump. Placing commercialperistaltic pumps inside the incubator is usually not possible dueto their size, sterilization difficulties, and incompatibility in highhumidity (490% RH). Commercial pumps are typically rated for60–80% RH environment mainly due to associated electrical andelectronics parts. However, we separated the pump rotatory me-chanism from its electronics and casing and encapsulated it in aseparate 3D printed PLA casing. The whole pump can now bethoroughly sterilized with relative ease. Two short (o30 cm) si-licone tubes (228–0704AU/VWR International) establish the flowthrough the cuvette and peristaltic pump. Silicon temperaturesensor and humidity sensors continually monitor humidity andtemperature in the proximity of cuvette and pump enclosurethroughout the culture. The entire modular unit goes into an in-cubator after sterilization. Once the measurement commences atthe start of culture, no further parts replacement, recalibration isneeded till the end of culture. Measurements are carried outwithout any special manual attention or maintenance, exemptingthe medium changing days.
The LEDs are powered with constant current sources and theirlight output stability is mainly limited by the LEDs themselves. TheLEDs relative radiant intensity as a function of temperature isshown in Fig. 2b. The spectral stability of LEDs emission duringlong term operation measured with spectrometer is shown inFig. 2c. The photodiodes are reverse biased for a linear light re-sponse and the photocurrent to voltage conversion is done withresistors. All the sensors are powered by a regulated 5 V powersupply. LEDs, photodiodes, temperature and humidity sensors arecontrolled with a microcontroller board (Arduino Uno). A 16 bit8 channel data acquisition board of our own design is used for
D. Kattipparambil Rajan et al. / Talanta 161 (2016) 755–761 757
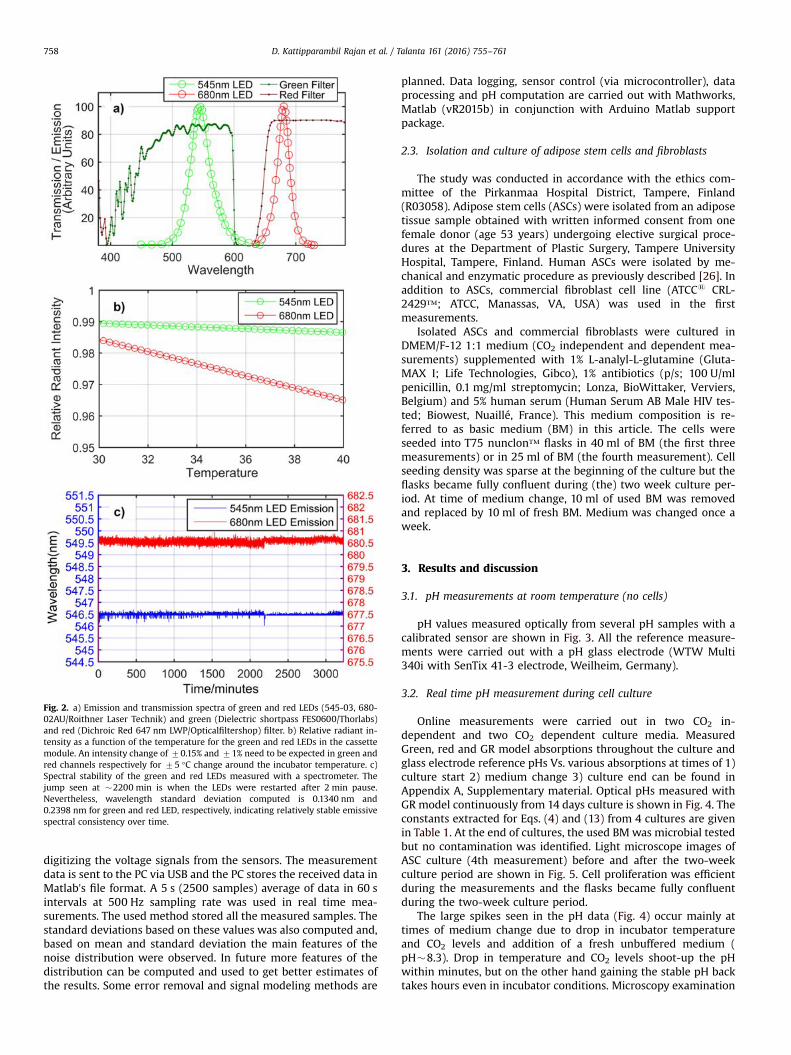
digitizing the voltage signals from the sensors. The measurementdata is sent to the PC via USB and the PC stores the received data inMatlab’s file format. A 5 s (2500 samples) average of data in 60 sintervals at 500 Hz sampling rate was used in real time mea-surements. The used method stored all the measured samples. Thestandard deviations based on these values was also computed and,based on mean and standard deviation the main features of thenoise distribution were observed. In future more features of thedistribution can be computed and used to get better estimates ofthe results. Some error removal and signal modeling methods are
planned. Data logging, sensor control (via microcontroller), dataprocessing and pH computation are carried out with Mathworks,Matlab (vR2015b) in conjunction with Arduino Matlab supportpackage.
2.3. Isolation and culture of adipose stem cells and fibroblasts
The study was conducted in accordance with the ethics com-mittee of the Pirkanmaa Hospital District, Tampere, Finland(R03058). Adipose stem cells (ASCs) were isolated from an adiposetissue sample obtained with written informed consent from onefemale donor (age 53 years) undergoing elective surgical proce-dures at the Department of Plastic Surgery, Tampere UniversityHospital, Tampere, Finland. Human ASCs were isolated by me-chanical and enzymatic procedure as previously described [26]. Inaddition to ASCs, commercial fibroblast cell line (ATCCs CRL-2429™; ATCC, Manassas, VA, USA) was used in the firstmeasurements.
Isolated ASCs and commercial fibroblasts were cultured inDMEM/F-12 1:1 medium (CO2 independent and dependent mea-surements) supplemented with 1% L-analyl-L-glutamine (Gluta-MAX I; Life Technologies, Gibco), 1% antibiotics (p/s; 100 U/mlpenicillin, 0.1 mg/ml streptomycin; Lonza, BioWittaker, Verviers,Belgium) and 5% human serum (Human Serum AB Male HIV tes-ted; Biowest, Nuaillé, France). This medium composition is re-ferred to as basic medium (BM) in this article. The cells wereseeded into T75 nunclon™ flasks in 40 ml of BM (the first threemeasurements) or in 25 ml of BM (the fourth measurement). Cellseeding density was sparse at the beginning of the culture but theflasks became fully confluent during (the) two week culture per-iod. At time of medium change, 10 ml of used BM was removedand replaced by 10 ml of fresh BM. Medium was changed once aweek.
3. Results and discussion
3.1. pH measurements at room temperature (no cells)
pH values measured optically from several pH samples with acalibrated sensor are shown in Fig. 3. All the reference measure-ments were carried out with a pH glass electrode (WTW Multi340i with SenTix 41-3 electrode, Weilheim, Germany).
3.2. Real time pH measurement during cell culture
Online measurements were carried out in two CO2 in-dependent and two CO2 dependent culture media. MeasuredGreen, red and GR model absorptions throughout the culture andglass electrode reference pHs Vs. various absorptions at times of 1)culture start 2) medium change 3) culture end can be found inAppendix A, Supplementary material. Optical pHs measured withGR model continuously from 14 days culture is shown in Fig. 4. Theconstants extracted for Eqs. (4) and (13) from 4 cultures are givenin Table 1. At the end of cultures, the used BM was microbial testedbut no contamination was identified. Light microscope images ofASC culture (4th measurement) before and after the two-weekculture period are shown in Fig. 5. Cell proliferation was efficientduring the measurements and the flasks became fully confluentduring the two-week culture period.
The large spikes seen in the pH data (Fig. 4) occur mainly attimes of medium change due to drop in incubator temperatureand CO2 levels and addition of a fresh unbuffered medium (pH�8.3). Drop in temperature and CO2 levels shoot-up the pHwithin minutes, but on the other hand gaining the stable pH backtakes hours even in incubator conditions. Microscopy examination
Fig. 2. a) Emission and transmission spectra of green and red LEDs (545-03, 680-02AU/Roithner Laser Technik) and green (Dielectric shortpass FES0600/Thorlabs)and red (Dichroic Red 647 nm LWP/Opticalfiltershop) filter. b) Relative radiant in-tensity as a function of the temperature for the green and red LEDs in the cassettemodule. An intensity change of 70.15% and 71% need to be expected in green andred channels respectively for 75 °C change around the incubator temperature. c)Spectral stability of the green and red LEDs measured with a spectrometer. Thejump seen at �2200 min is when the LEDs were restarted after 2 min pause.Nevertheless, wavelength standard deviation computed is 0.1340 nm and0.2398 nm for green and red LED, respectively, indicating relatively stable emissivespectral consistency over time.
D. Kattipparambil Rajan et al. / Talanta 161 (2016) 755–761758
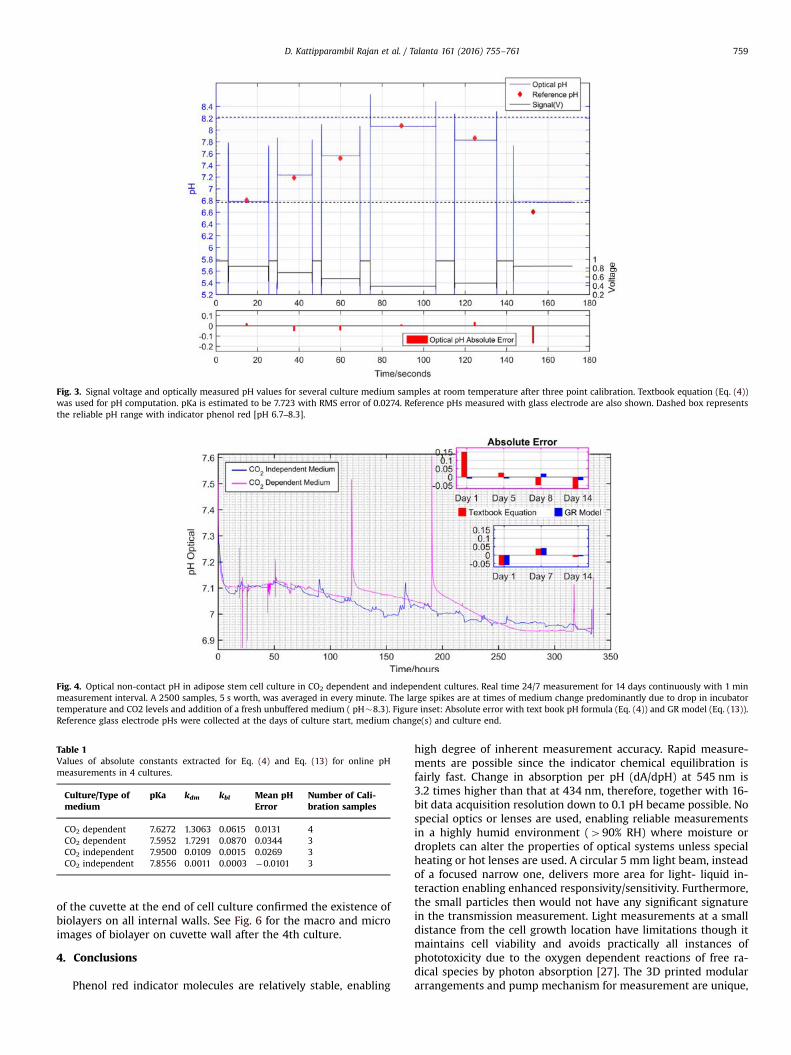
of the cuvette at the end of cell culture confirmed the existence ofbiolayers on all internal walls. See Fig. 6 for the macro and microimages of biolayer on cuvette wall after the 4th culture.
4. Conclusions
Phenol red indicator molecules are relatively stable, enabling
high degree of inherent measurement accuracy. Rapid measure-ments are possible since the indicator chemical equilibration isfairly fast. Change in absorption per pH (dA/dpH) at 545 nm is3.2 times higher than that at 434 nm, therefore, together with 16-bit data acquisition resolution down to 0.1 pH became possible. Nospecial optics or lenses are used, enabling reliable measurementsin a highly humid environment (490% RH) where moisture ordroplets can alter the properties of optical systems unless specialheating or hot lenses are used. A circular 5 mm light beam, insteadof a focused narrow one, delivers more area for light- liquid in-teraction enabling enhanced responsivity/sensitivity. Furthermore,the small particles then would not have any significant signaturein the transmission measurement. Light measurements at a smalldistance from the cell growth location have limitations though itmaintains cell viability and avoids practically all instances ofphototoxicity due to the oxygen dependent reactions of free ra-dical species by photon absorption [27]. The 3D printed modulararrangements and pump mechanism for measurement are unique,
Fig. 3. Signal voltage and optically measured pH values for several culture medium samples at room temperature after three point calibration. Textbook equation (Eq. (4))was used for pH computation. pKa is estimated to be 7.723 with RMS error of 0.0274. Reference pHs measured with glass electrode are also shown. Dashed box representsthe reliable pH range with indicator phenol red [pH 6.7–8.3].
Fig. 4. Optical non-contact pH in adipose stem cell culture in CO2 dependent and independent cultures. Real time 24/7 measurement for 14 days continuously with 1 minmeasurement interval. A 2500 samples, 5 s worth, was averaged in every minute. The large spikes are at times of medium change predominantly due to drop in incubatortemperature and CO2 levels and addition of a fresh unbuffered medium ( pH�8.3). Figure inset: Absolute error with text book pH formula (Eq. (4)) and GR model (Eq. (13)).Reference glass electrode pHs were collected at the days of culture start, medium change(s) and culture end.
Table 1Values of absolute constants extracted for Eq. (4) and Eq. (13) for online pHmeasurements in 4 cultures.
Culture/Type ofmedium
pKa kdm kbl Mean pHError
Number of Cali-bration samples
CO2 dependent 7.6272 1.3063 0.0615 0.0131 4CO2 dependent 7.5952 1.7291 0.0870 0.0344 3CO2 independent 7.9500 0.0109 0.0015 0.0269 3CO2 independent 7.8556 0.0011 0.0003 �0.0101 3
D. Kattipparambil Rajan et al. / Talanta 161 (2016) 755–761 759
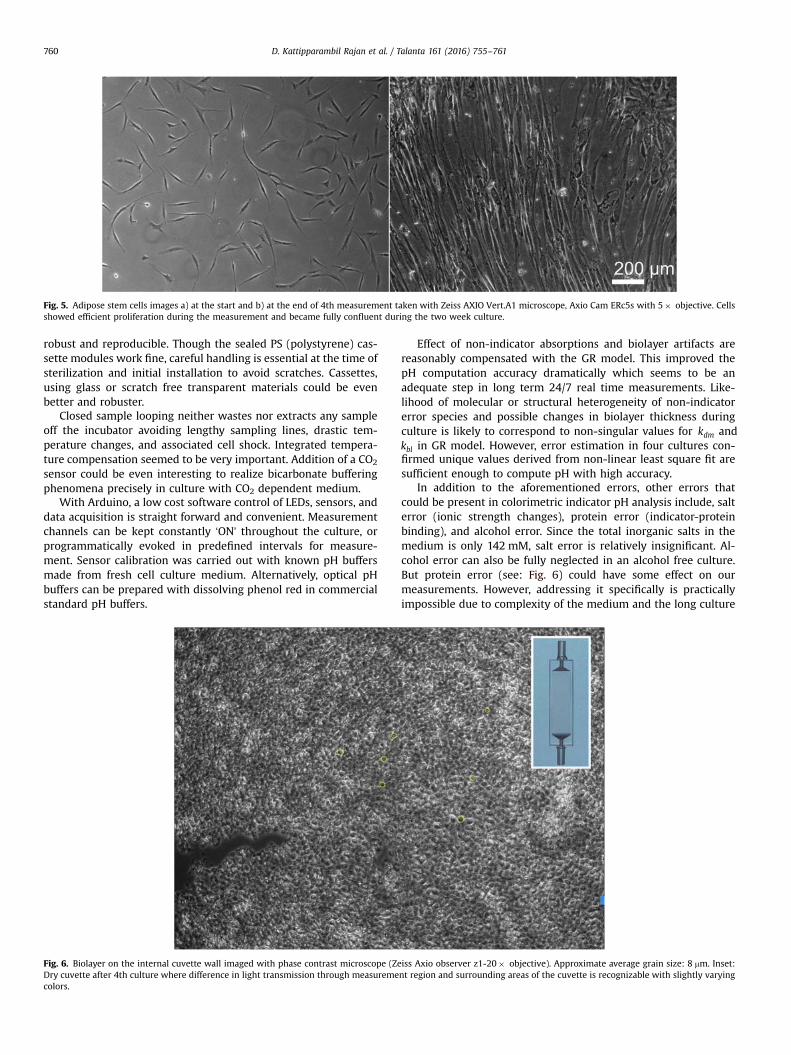
robust and reproducible. Though the sealed PS (polystyrene) cas-sette modules work fine, careful handling is essential at the time ofsterilization and initial installation to avoid scratches. Cassettes,using glass or scratch free transparent materials could be evenbetter and robuster.
Closed sample looping neither wastes nor extracts any sampleoff the incubator avoiding lengthy sampling lines, drastic tem-perature changes, and associated cell shock. Integrated tempera-ture compensation seemed to be very important. Addition of a CO2
sensor could be even interesting to realize bicarbonate bufferingphenomena precisely in culture with CO2 dependent medium.
With Arduino, a low cost software control of LEDs, sensors, anddata acquisition is straight forward and convenient. Measurementchannels can be kept constantly ‘ON’ throughout the culture, orprogrammatically evoked in predefined intervals for measure-ment. Sensor calibration was carried out with known pH buffersmade from fresh cell culture medium. Alternatively, optical pHbuffers can be prepared with dissolving phenol red in commercialstandard pH buffers.
Effect of non-indicator absorptions and biolayer artifacts arereasonably compensated with the GR model. This improved thepH computation accuracy dramatically which seems to be anadequate step in long term 24/7 real time measurements. Like-lihood of molecular or structural heterogeneity of non-indicatorerror species and possible changes in biolayer thickness duringculture is likely to correspond to non-singular values for kdm andkbl in GR model. However, error estimation in four cultures con-firmed unique values derived from non-linear least square fit aresufficient enough to compute pH with high accuracy.
In addition to the aforementioned errors, other errors thatcould be present in colorimetric indicator pH analysis include, salterror (ionic strength changes), protein error (indicator-proteinbinding), and alcohol error. Since the total inorganic salts in themedium is only 142 mM, salt error is relatively insignificant. Al-cohol error can also be fully neglected in an alcohol free culture.But protein error (see: Fig. 6) could have some effect on ourmeasurements. However, addressing it specifically is practicallyimpossible due to complexity of the medium and the long culture
Fig. 5. Adipose stem cells images a) at the start and b) at the end of 4th measurement taken with Zeiss AXIO Vert.A1 microscope, Axio Cam ERc5s with 5� objective. Cellsshowed efficient proliferation during the measurement and became fully confluent during the two week culture.
Fig. 6. Biolayer on the internal cuvette wall imaged with phase contrast microscope (Zeiss Axio observer z1-20� objective). Approximate average grain size: 8 mm. Inset:Dry cuvette after 4th culture where difference in light transmission through measurement region and surrounding areas of the cuvette is recognizable with slightly varyingcolors.
D. Kattipparambil Rajan et al. / Talanta 161 (2016) 755–761760
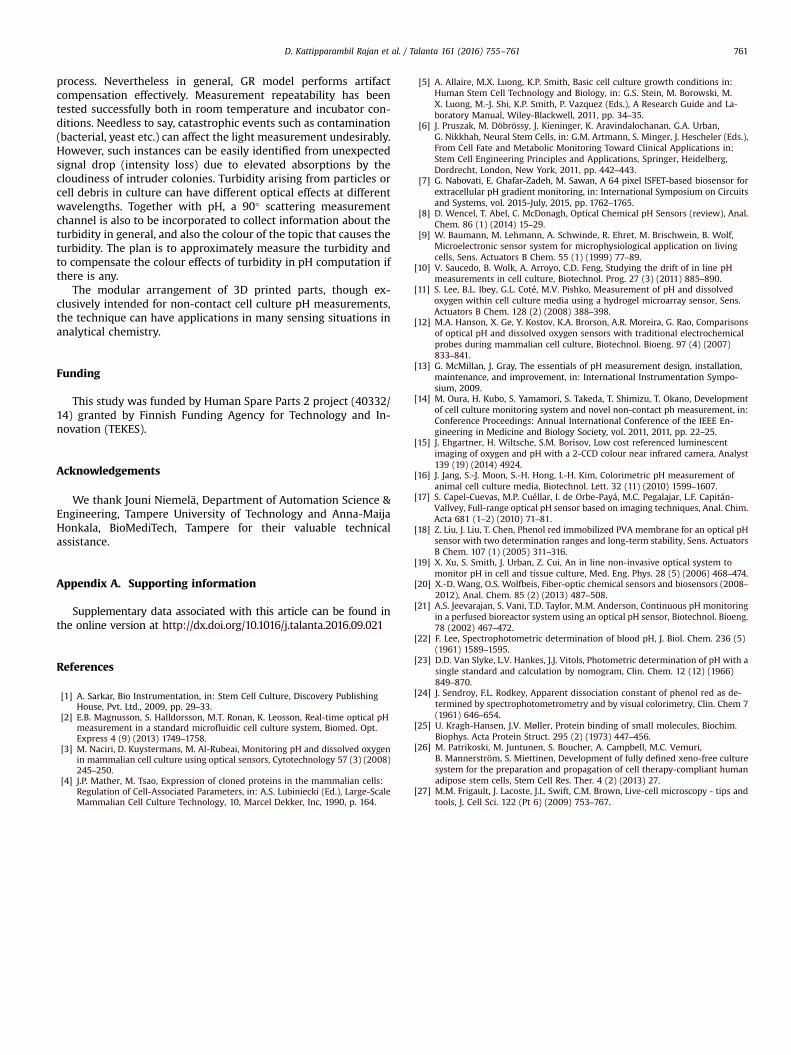
process. Nevertheless in general, GR model performs artifactcompensation effectively. Measurement repeatability has beentested successfully both in room temperature and incubator con-ditions. Needless to say, catastrophic events such as contamination(bacterial, yeast etc.) can affect the light measurement undesirably.However, such instances can be easily identified from unexpectedsignal drop (intensity loss) due to elevated absorptions by thecloudiness of intruder colonies. Turbidity arising from particles orcell debris in culture can have different optical effects at differentwavelengths. Together with pH, a 90° scattering measurementchannel is also to be incorporated to collect information about theturbidity in general, and also the colour of the topic that causes theturbidity. The plan is to approximately measure the turbidity andto compensate the colour effects of turbidity in pH computation ifthere is any.
The modular arrangement of 3D printed parts, though ex-clusively intended for non-contact cell culture pH measurements,the technique can have applications in many sensing situations inanalytical chemistry.
Funding
This study was funded by Human Spare Parts 2 project (40332/14) granted by Finnish Funding Agency for Technology and In-novation (TEKES).
Acknowledgements
We thank Jouni Niemelä, Department of Automation Science &Engineering, Tampere University of Technology and Anna-MaijaHonkala, BioMediTech, Tampere for their valuable technicalassistance.
Appendix A. Supporting information
Supplementary data associated with this article can be found inthe online version at http://dx.doi.org/10.1016/j.talanta.2016.09.021
References
[1] A. Sarkar, Bio Instrumentation, in: Stem Cell Culture, Discovery PublishingHouse, Pvt. Ltd., 2009, pp. 29–33.
[2] E.B. Magnusson, S. Halldorsson, M.T. Ronan, K. Leosson, Real-time optical pHmeasurement in a standard microfluidic cell culture system, Biomed. Opt.Express 4 (9) (2013) 1749–1758.
[3] M. Naciri, D. Kuystermans, M. Al-Rubeai, Monitoring pH and dissolved oxygenin mammalian cell culture using optical sensors, Cytotechnology 57 (3) (2008)245–250.
[4] J.P. Mather, M. Tsao, Expression of cloned proteins in the mammalian cells:Regulation of Cell-Associated Parameters, in: A.S. Lubiniecki (Ed.), Large-ScaleMammalian Cell Culture Technology, 10, Marcel Dekker, Inc, 1990, p. 164.
[5] A. Allaire, M.X. Luong, K.P. Smith, Basic cell culture growth conditions in:Human Stem Cell Technology and Biology, in: G.S. Stein, M. Borowski, M.X. Luong, M.-J. Shi, K.P. Smith, P. Vazquez (Eds.), A Research Guide and La-boratory Manual, Wiley-Blackwell, 2011, pp. 34–35.
[6] J. Pruszak, M. Döbrössy, J. Kieninger, K. Aravindalochanan, G.A. Urban,G. Nikkhah, Neural Stem Cells, in: G.M. Artmann, S. Minger, J. Hescheler (Eds.),From Cell Fate and Metabolic Monitoring Toward Clinical Applications in:Stem Cell Engineering Principles and Applications, Springer, Heidelberg,Dordrecht, London, New York, 2011, pp. 442–443.
[7] G. Nabovati, E. Ghafar-Zadeh, M. Sawan, A 64 pixel ISFET-based biosensor forextracellular pH gradient monitoring, in: International Symposium on Circuitsand Systems, vol. 2015-July, 2015, pp. 1762–1765.
[8] D. Wencel, T. Abel, C. McDonagh, Optical Chemical pH Sensors (review), Anal.Chem. 86 (1) (2014) 15–29.
[9] W. Baumann, M. Lehmann, A. Schwinde, R. Ehret, M. Brischwein, B. Wolf,Microelectronic sensor system for microphysiological application on livingcells, Sens. Actuators B Chem. 55 (1) (1999) 77–89.
[10] V. Saucedo, B. Wolk, A. Arroyo, C.D. Feng, Studying the drift of in line pHmeasurements in cell culture, Biotechnol. Prog. 27 (3) (2011) 885–890.
[11] S. Lee, B.L. Ibey, G.L. Coté, M.V. Pishko, Measurement of pH and dissolvedoxygen within cell culture media using a hydrogel microarray sensor, Sens.Actuators B Chem. 128 (2) (2008) 388–398.
[12] M.A. Hanson, X. Ge, Y. Kostov, K.A. Brorson, A.R. Moreira, G. Rao, Comparisonsof optical pH and dissolved oxygen sensors with traditional electrochemicalprobes during mammalian cell culture, Biotechnol. Bioeng. 97 (4) (2007)833–841.
[13] G. McMillan, J. Gray, The essentials of pH measurement design, installation,maintenance, and improvement, in: International Instrumentation Sympo-sium, 2009.
[14] M. Oura, H. Kubo, S. Yamamori, S. Takeda, T. Shimizu, T. Okano, Developmentof cell culture monitoring system and novel non-contact ph measurement, in:Conference Proceedings: Annual International Conference of the IEEE En-gineering in Medicine and Biology Society, vol. 2011, 2011, pp. 22–25.
[15] J. Ehgartner, H. Wiltsche, S.M. Borisov, Low cost referenced luminescentimaging of oxygen and pH with a 2-CCD colour near infrared camera, Analyst139 (19) (2014) 4924.
[16] J. Jang, S.-J. Moon, S.-H. Hong, I.-H. Kim, Colorimetric pH measurement ofanimal cell culture media, Biotechnol. Lett. 32 (11) (2010) 1599–1607.
[17] S. Capel-Cuevas, M.P. Cuéllar, I. de Orbe-Payá, M.C. Pegalajar, L.F. Capitán-Vallvey, Full-range optical pH sensor based on imaging techniques, Anal. Chim.Acta 681 (1–2) (2010) 71–81.
[18] Z. Liu, J. Liu, T. Chen, Phenol red immobilized PVA membrane for an optical pHsensor with two determination ranges and long-term stability, Sens. ActuatorsB Chem. 107 (1) (2005) 311–316.
[19] X. Xu, S. Smith, J. Urban, Z. Cui, An in line non-invasive optical system tomonitor pH in cell and tissue culture, Med. Eng. Phys. 28 (5) (2006) 468–474.
[20] X.-D. Wang, O.S. Wolfbeis, Fiber-optic chemical sensors and biosensors (2008–2012), Anal. Chem. 85 (2) (2013) 487–508.
[21] A.S. Jeevarajan, S. Vani, T.D. Taylor, M.M. Anderson, Continuous pH monitoringin a perfused bioreactor system using an optical pH sensor, Biotechnol. Bioeng.78 (2002) 467–472.
[22] F. Lee, Spectrophotometric determination of blood pH, J. Biol. Chem. 236 (5)(1961) 1589–1595.
[23] D.D. Van Slyke, L.V. Hankes, J.J. Vitols, Photometric determination of pH with asingle standard and calculation by nomogram, Clin. Chem. 12 (12) (1966)849–870.
[24] J. Sendroy, F.L. Rodkey, Apparent dissociation constant of phenol red as de-termined by spectrophotometrometry and by visual colorimetry, Clin. Chem 7(1961) 646–654.
[25] U. Kragh-Hansen, J.V. Møller, Protein binding of small molecules, Biochim.Biophys. Acta Protein Struct. 295 (2) (1973) 447–456.
[26] M. Patrikoski, M. Juntunen, S. Boucher, A. Campbell, M.C. Vemuri,B. Mannerström, S. Miettinen, Development of fully defined xeno-free culturesystem for the preparation and propagation of cell therapy-compliant humanadipose stem cells, Stem Cell Res. Ther. 4 (2) (2013) 27.
[27] M.M. Frigault, J. Lacoste, J.L. Swift, C.M. Brown, Live-cell microscopy - tips andtools, J. Cell Sci. 122 (Pt 6) (2009) 753–767.
D. Kattipparambil Rajan et al. / Talanta 161 (2016) 755–761 761


PUBLICATION IV
Monitoring pH, temperature and humidity in long-term stem cell culture in CO2 incubator
D. Kattipparambil Rajan, J. Verho, J Kreutzer, H Valimaki, H Ihalainen, J Lekkala,
M Patrikoski and S Miettinen.
IEEE International Symposium on Medical Measurements and Applications, MeMeA 2017 - Proceedings. IEEE, pp. 470–474.
https://doi.org/10.1109/MeMeA.2017.7985922
© 2017, IEEE. Reprinted with permission from the publisher.

Monitoring pH, temperature and humidity in long-term stem cell culture in CO2 incubator
Dhanesh Kattipparambil Rajan,
Jarmo Verho, Joose Kreutzer, Hannu Välimäki, Heimo Ihalainen, Jukka Lekkala
BioMediTech Institute and Faculty of Biomedical Sciences and Engineering, Tampere University of Technology
Tampere, Finland [email protected]
Mimmi Patrikoski, Susanna Miettinen Adult Stem Cell Group, BioMediTech
Institute of Biosciences and Medical Technology University of Tampere
Science Center, Tampere University Hospital Tampere, Finland
Abstract—Cell culture in stem cell research is on the rise, not only for basic research but also for its potential medical and therapeutic applications. Monitoring culture process using sensors throughout the culture helps to optimize culture conditions for optimal growth and maximize yield from the cells. Further, the sensor data gives insight into developing better cell culture systems. Typical stem cell culture platforms, e.g. well plates or flasks, cannot be easily equipped with sensors and impose many challenges in periodic process measurements in a CO2 incubator. We present an incubator compatible modular measurement system with three sensors, to monitor pH, temperature and humidity continuously throughout the culture. Sensors are assembled around a flow through cuvette for highly sterile non-contact measurements. No sample preparation or sample extraction from the incubator is needed and the measurements are carried out in a closed flow loop without wasting any medium. The modular assembly is novel, reusable and feasible for humid incubator environments. The system has been tested, validated and used in mesenchymal stem cell expansion and differentiation, for periods ranging from two to three weeks. Once the measurement has commenced at the beginning of culture, continuous measurements without sensor recalibration or special manual attention are carried out till the end of the culture. Measurement data clearly show the interplay between measured parameters, indicating a few stress sources present all through the culture. Additionally, it gives an overall picture of behavior of critical control parameters in an incubator and points out the need for bioprocess systems with automatic process monitoring and smart control for maximum yield, optimal growth and maintenance of the cells.
Keywords— incubator compatible sensors, cell culture incubator environmental monitoring, non-contact cell culture measurements, long-term cell culture measurements, long-term optical cell culture pH measurements
I. INTRODUCTION
Stem cell research is a rapidly expanding field to develop
therapeutic agents to treat diseases as well as to study disease development from early stages[1–3]. Cell culture is a critical part in stem cell research and culture parameters need to be refined according to the final purpose of the culture. Monitoring culture parameters using sensors throughout the culture helps to optimize culture conditions for optimal growth and maximum productivity. Further, the sensor data helps to visualize
necessary control schemes to be considered in designing optimized compact cell culture systems. Small-scale upstream cell culture for bioprocess development often occurs in flasks and multi-well plates kept in CO2 incubators. Incubators regulate temperature (~37oC), humidity (~95%RH) and gaseous atmosphere (CO2,/O2) around the cells, and also indirectly the pH of the culture medium with a bicarbonate buffer system. These parameters, ideally should be constant and not a source of experimental variations[4]. However, variations do occur, which create stress, and cells can respond, depending on the cell type, nature and duration of the stress, in various ways ranging from the activation of survival pathways to the initiation of cell death [5]. It can also adversely affect the cell attachment on culture platforms [6]. There is often an interplay between these parameters, for instance, the pH set-point, can be influenced not only by CO2 levels, but also by fluctuations in temperature and medium evaporation. Therefore, the incubator door opening conditions (duration and frequency), the nature of the fresh medium (preheated/pre-buffered) added at times of medium change, are also external stressors, resulting in undesirable experimental variations. When cells proliferate and metabolize nutrients, the byproducts (CO2, pyruvic, lactic acids etc.) tend to lower the pH, but the active bicarbonate buffer system, in principle, should counteract and stabilize the pH set-point. However our previous studies indicate a drop in pH in prolonged cultures which has been verified with electrochemical sensors as well [7]. In this study, we measured the pH, temperature, and humidity continuously in prolonged cultures in a water-jacketed incubator. Conventionally, sensor matrix chips or the combination of electrochemical and optical sensors are widely used in multi-analyte sensing, which usually requires large sample volume and physical contact with the measurand [8–16]. Electrochemical sensors, generally, are precise, fast and reversible, but signal drift, need for periodic calibration and maintenance are drawbacks in long-term biomedical applications. Several reported optical sensors also require sampling, physical contact or culture vessel modification and further, signal drift by photobleaching/leaching is also a concern in long term measurements[11,16–18]. On the other hand, non-contact measurement techniques are highly advantageous since they reduce instances of sterilization, minimize the risks of contamination and can be implemented without wasting any culture medium. Non-contact, real time pH monitoring is
This study was funded by Human Spare Parts 2 project (40332/14) granted byFinnish Funding Agency for Technology and Innovation (TEKES).
tunnus
Text Box
2017 MeMeA USA page: x000
tunnus
Text Box
This is the accepted version. For the published version follow the DOI link in the previous page.

desired in several areas, including cell therapy experiments. When the culture medium contains phenol red, changes in its characteristic light absorptions as a function of pH can also be exploited for non-contact pH estimation[14,15,17,19,20]. One basic method is measuring light intensities at a pH sensitive wavelength and at a neutral reference wavelength. However, there are a few practical issues for adapting the reported methods directly into the stem cell culture environment. Extracting the culture sample to be measured out of the incubator using length tubings and external pumps is somewhat unappealing. Lengthy sampling lines in and out of the incubator impose large temperature differences, and demand large sample volume and more culture supplements. Further, it creates sterilization issues and necessitate high flow rates for fast sensor response, which in turn can be stressful for the cells. The cross talk between light measurement channels, when light beams of two wavelengths operate in close proximity, due to scattering of light by detached cells or debris also needs to be addressed electronically or optically. Moreover, the effect of possible biolayer (on the internal wall of the measurement cell) on the pH and the effect of temperature on the pH are left untreated [14,15,17,19,20]. In our multisensor modular measurement system, for pH, the previously reported optical non-contact pH sensor employing a dual wavelength measurement is utilized [7]. The system parts are 3D printed, robust and fully modular. It can be easily sterilized and placed inside the incubator, therefore, no special sampling or sample extraction from the incubator is needed. Effect of temperature on absorption is also compensated continuously. The proposed absorption correction model [7] compensates non-specific absorptions (eg. by biolayers) which improves the pH accuracy significantly. The temperature sensor which is a platinum resistance thermometer in a stainless steel housing is highly precise and suitable for medical process measurements. The thermoset polymer based capacitive humidity sensor is fast, linear and has excellent long term stability. All the sensors are incubator compatible, and are tightly attached to the measurement cuvette for continuous long term cell culture measurements.
II. MATERIALS AND METHOD
A) Experimental
The modular measurement arrangement is shown in Fig.1. Mostly all support parts are 3D printed using PLA material. The flow through cuvette (Z804983/Sigma Aldrich) and silicon tubes are autoclave sterilized preceding the culture. Resistance thermometer (Heraeus-30500109/with stainless steel housing), humidity sensor (HIH-5031/Honeywell/factory calibrated), and pH sensor module are sterilized with 70-90% ethanol. Temperature and humidity sensors stay in contact with the external wall of the flow through cuvette. During measurements, medium is pumped through the flow through cuvette at ~ 3-5ml/min with the help of a modified peristaltic pump (ISM 596/REGLO/Digital MS-2/12/IDEX) encapsulated in a 3D printed airtight box. The measurement system is placed next to the culture bottle inside the incubator and the medium is constantly circulated through the flow through cuvette during the culture. No sample preparation or external sample
extraction outside of the incubator is needed. A CO2 sensor (GC-0016-COZIR/ Factory calibrated) was also used for collecting CO2 data for short-term characterization measurements. A 16 bit 8 channel data acquisition board of our own design is used for digitizing the voltage signals from the sensors. The measurement data is sent to the PC via USB and, the PC stores the received data in Mathworks, Matlab’s file format. A 5 s (2500 samples) average of data in 60 s intervals at 500 Hz sampling rate was used in real time measurements. Data logging, sensor control (via microcontroller), data processing and pH computation are carried out with Matlab (vR2015b). Once the measurement has begun, no recalibration or maintenance is needed and measurements can be carried out without any special manual attention till the end of the culture.
B) Cells and Culture Medium
The cell expansion and osteogenic differentiation
experiments described in this study were conducted in accordance with the ethics committee of the Pirkanmaa Hospital District, Tampere, Finland (R15161). Mesenchymal stem cells were isolated from adipose tissue samples (adipose stem cells, ASCs) obtained with written consent from donors undergoing elective surgical procedures at the Department of Plastic Surgery, Tampere University Hospital, Finland. Human ASCs were isolated by mechanical and enzymatic procedure as previously described [21]. In addition to ASCs, commercial fibroblast cell line (ATCC® CRL-2429™; ATCC, Manassas, VA, USA) was used in the initial trial measurements.
The pH, temperature and humidity were monitored during cell expansion and osteogenic differentiation. For cell
Fig.1. Modular incubator compatible measurement system. Check [7] for pH sensor module details. Measurement cuvette: 10mm Quartz flow through cuvette (Z804983/Sigma Aldrich). Pump: Modified peristaltic pump (ISM 596/REGLO Digital MS-2/12/IDEX). Temperature sensor: Platinum resistive thermometer (Heraeus 30500109/PT100 in stainless steel housing). Humidity sensor: Thermoset polymer capacitive sensor (HIH-5030/5031/Honeywell-factory calibrated).
tunnus
Text Box
2017 MeMeA USA page: x000

expansion, ASCs were cultured in DMEM/F-12 1:1 medium supplemented with 1% l-analyl-l-glutamine (GlutaMAX I; Life Technologies, Gibco), 1% antibiotics (p/s; 100 U/ml penicillin, 0.1 mg/ml streptomycin; Lonza, BioWittaker, Verviers, Belgium) and 5% human serum (Human Serum AB Male HIV tested; Biowest, Nuaillé, France). This medium composition is referred to as basic medium (BM) in this article. The cells were seeded into T75 nunclon™ flasks in 25 ml of BM in the first test (Fig.3). Cell seeding density was sparse at the beginning of the culture but the flasks became fully confluent during the two-week culture period. At the time of medium change, 10ml of used BM was removed and replaced by 10 ml of fresh BM. Medium was changed once a week.
For the osteogenic differentiation, cells were cultured in T150 flasks in osteogenic medium containing DMEM/F-12 1:1 medium (Life Technologies, Gibco, Rockville, MD) supplemented with 5% human serum (Biowest), 1% GlutaMAX I (Life Technologies), 1% p/s (p/s; 100 U/mL penicillin, 0.1 mg/mL streptomycin; Lonza), 200 μM L-ascorbic acid 2-phosphate (Sigma), 10mM beta-glycerophosphate (Sigma) and 5 nM dexamethasone (Sigma)]. Medium was changed twice a week during the three weeks’ induction period.
III. RESULTS AND DISCUSSION
A) System Characterization
In an effort to understand the effect of CO2 and temperature separately on pH, we measured the pH of the culture medium (without cells) as a function of temperature in the absence and presence of CO2. The measurement results are shown in Fig. 2a and Fig. 2b. The pH decreases with increase in the temperature as expected [22]. A decrease of ~ 0.2 pH unit in the absence of CO2 and a decrease of ~1.0 pH unit in the presence of CO2 were observed for ~10oC temperature rise. Culture medium with the bicarbonate buffer system is typically alkaline in the absence of CO2 due to sodium bicarbonate (NaHCO3) in the medium (Equation 1). Inside the incubator, CO2 dissolves in the medium to form carbonic acid (Equation 2). The carbonic acid to NaHCO3 ratio at 37oC regulates the pH (Equation 2). Since the NaHCO3 concentration is set by the media manufacturer, typically, a 5-10% CO2 environment is necessary to establish a
stable physiological pH [6,20-21]. The stabilization of pH, both in the absence and presence of CO2 (Fig. 2a and Fig. 2b) is seemingly, not a fast process, therefore medium pre-conditioning (pre-heating and pre-buffering) preceding the use
of any fresh medium is recommended to reduce the pH shock to cells.
B) Cell Culture pH Measurements.
Measurement results from cell expansion and osteogenic differentiation are shown in Fig.3 and Fig.4 respectively. The sudden large transients (spikes) in the data are mainly at times of medium change. Addition of fresh medium and drop in temperature and CO2 by incubator door openings at the time of medium change, shifts the chemical equilibrium (Equation 1&2) and shoots-up the pH. Further, the overall drop in solution H+ ionization due to drop in temperature also contributes to slight pH variations. Small pH changes e.g. from 7.3 to 7.2 is a seemingly small deviation, but it brings about actually large
Fig. 2. pH of the culture medium (without cells) as a function of temperature. a) Measurement in the absence of CO2.. The CO2 sensor showed 0.0995% mean base value though the incubator CO2 was set to zero. Around ~0.2 pH unit drop is seen with around 10oC temperature rise
b) Measurement in the presence of CO2. It took ~30 minutes to reach a stable 5% CO2 environment after CO2 was turned on. Relatively large pH drop (~1.0 pH units) is seen in the presence of CO2 over ~10oC temperature rise. The effect is presumably due to combined influence of temperature and CO2. Noticeably, the pH stabilization time is in the order of hours in both the cases in the studied typical culture flask arrangement in the incubator.
tunnus
Text Box
2017 MeMeA USA page: x000
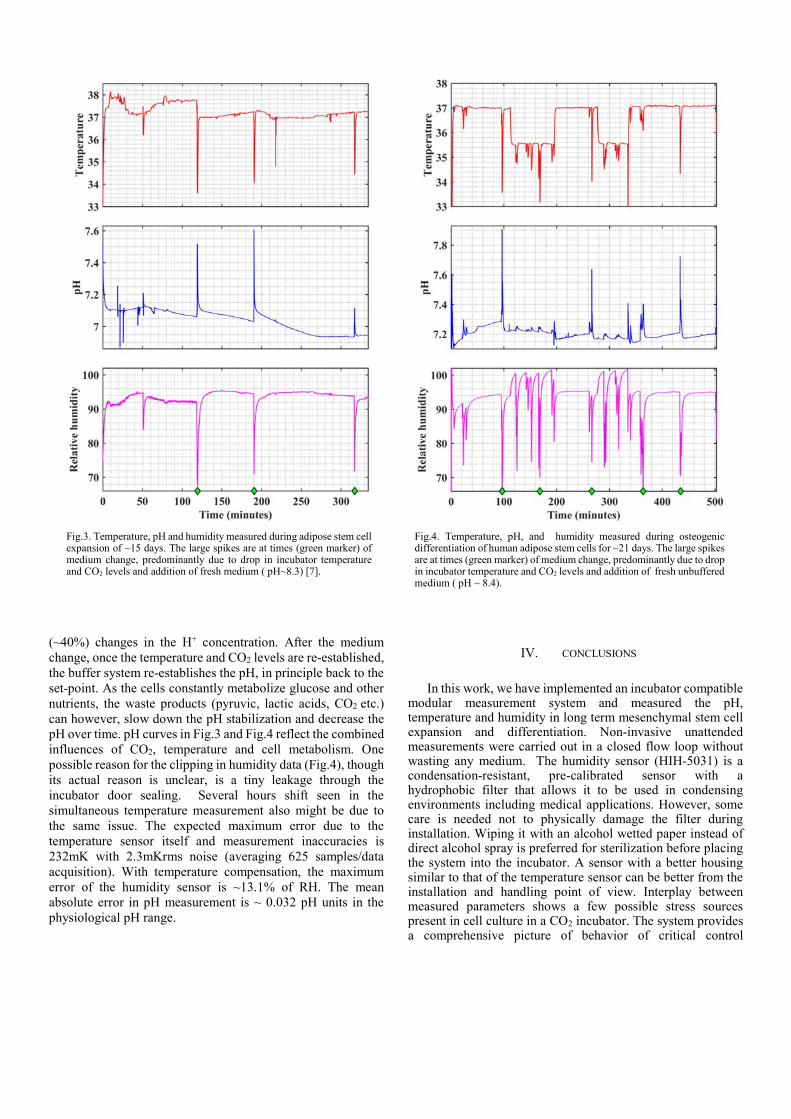
(~40%) changes in the H+ concentration. After the medium change, once the temperature and CO2 levels are re-established, the buffer system re-establishes the pH, in principle back to the set-point. As the cells constantly metabolize glucose and other nutrients, the waste products (pyruvic, lactic acids, CO2 etc.) can however, slow down the pH stabilization and decrease the pH over time. pH curves in Fig.3 and Fig.4 reflect the combined influences of CO2, temperature and cell metabolism. One possible reason for the clipping in humidity data (Fig.4), though its actual reason is unclear, is a tiny leakage through the incubator door sealing. Several hours shift seen in the simultaneous temperature measurement also might be due to the same issue. The expected maximum error due to the temperature sensor itself and measurement inaccuracies is 232mK with 2.3mKrms noise (averaging 625 samples/data acquisition). With temperature compensation, the maximum error of the humidity sensor is ~13.1% of RH. The mean absolute error in pH measurement is ~ 0.032 pH units in the physiological pH range.
IV. CONCLUSIONS
In this work, we have implemented an incubator compatible modular measurement system and measured the pH, temperature and humidity in long term mesenchymal stem cell expansion and differentiation. Non-invasive unattended measurements were carried out in a closed flow loop without wasting any medium. The humidity sensor (HIH-5031) is a condensation-resistant, pre-calibrated sensor with a hydrophobic filter that allows it to be used in condensing environments including medical applications. However, some care is needed not to physically damage the filter during installation. Wiping it with an alcohol wetted paper instead of direct alcohol spray is preferred for sterilization before placing the system into the incubator. A sensor with a better housing similar to that of the temperature sensor can be better from the installation and handling point of view. Interplay between measured parameters shows a few possible stress sources present in cell culture in a CO2 incubator. The system provides a comprehensive picture of behavior of critical control
Fig.3. Temperature, pH and humidity measured during adipose stem cell expansion of ~15 days. The large spikes are at times (green marker) of medium change, predominantly due to drop in incubator temperature and CO2 levels and addition of fresh medium ( pH~8.3) [7].
Fig.4. Temperature, pH, and humidity measured during osteogenic differentiation of human adipose stem cells for ~21 days. The large spikes are at times (green marker) of medium change, predominantly due to drop in incubator temperature and CO2 levels and addition of fresh unbuffered medium ( pH ~ 8.4).
tunnus
Text Box
2017 MeMeA USA page: x000

parameters in incubator based cell culture, and points out the need for bioprocess systems with automatic monitoring and smart control for the optimal growth and maintenance of the cells and maximum productivity. Our continued future research, planned in this direction will aid this.
V.ACKNOWLEDGMENT
We thank Jouni Niemelä and Antti-Juhana Mäki, Department of Automation Science and Engineering, Tampere University of Technology and Anna-Maija Honkala, BioMediTech, Tampere for their valuable technical assistance.
REFERENCES [1] M. Borowski, M. Giovino-Doherty, L. Ji, M.-J. Shi, K. P. Smith, and J.
Laning, Basic pluripotent stem cell culture protocols. Harvard Stem Cell Institute, 2008.
[2] B. Van Der Sanden, M. Dhobb, F. Berger, and D. Wion, “Optimizing stem cell culture,” J. Cell. Biochem., vol. 111, no. August, pp. 801–807, 2010.
[3] G. Maguire, “Therapeutics from Adult Stem Cells and the Hype Curve,” ACS Med. Chem. Lett., vol. 7, no. 5, pp. 441–443, May 2016.
[4] R. I. Freshney, Culture of animal cells : a manual of basic technique. Wiley-Liss, 1994.
[5] S. Fulda, A. M. Gorman, O. Hori, and A. Samali, “Cellular stress responses: cell survival and cell death.,” Int. J. Cell Biol., vol. 2010, p. 214074, 2010.
[6] J. A. Ryan, “Corning Guide for Identifying and Correcting Common Cell Growth Problems.” Corning Incorporated.
[7] D. Kattipparambil Rajan et al., “Optical non-contact pH measurement in cell culture with sterilizable, modular parts,” Talanta, vol. 161, pp. 755–761, 2016.
[8] E. Y. Hwang, D. Pappas, A. S. Jeevarajan, and M. M. Anderson, “Evaluation of the Paratrend Multi-Analyte Sensor for Potential Utilization in Long-Duration Automated Cell Culture Monitoring,” Biomed. Microdevices, vol. 63, no. 241, 2004.
[9] M. S. Wilson and W. Nie, “Electrochemical Multianalyte Immunoassays Using an Array-Based Sensor,” 2006.
[10] G. Nabovati, E. Ghafar-Zadeh, and M. Sawan, “A 64 pixel ISFET-based biosensor for extracellular pH gradient monitoring,” Proc. - IEEE Int. Symp. Circuits Syst., vol. 2015–July, pp. 1762–1765, 2015.
[11] D. Wencel, T. Abel, and C. McDonagh, “Optical Chemical pH Sensors (Review),” Anal. Chem., vol. 86, no. 1, pp. 15–29, 2014.
[12] W. Honda, S. Harada, T. Arie, S. Akita, and K. Takei, “Printed wearable temperature sensor for health monitoring,” IEEE SENSORS 2014 Proc., pp. 2227–2229, 2014.
[13] W. Baumann, M. Lehmann, A. Schwinde, R. Ehret, M. Brischwein, and B. Wolf, “Microelectronic sensor system for microphysiological application on living cells,” Sensors Actuators B Chem., vol. 55, no. 1, pp. 77–89, 1999.
[14] M. Oura, H. Kubo, S. Yamamori, S. Takeda, T. Shimizu, and T. Okano, “Development of cell culture monitoring system and novel non-contact pH measurement.,” Conf. Proc. ... Annu. Int. Conf. IEEE Eng. Med. Biol. Soc. IEEE Eng. Med. Biol. Soc. Annu. Conf., vol. 2011, pp. 22–5, 2011.
[15] J. Jang, S.-J. Moon, S.-H. Hong, and I.-H. Kim, “Colorimetric pH measurement of animal cell culture media,” Biotechnol. Lett., vol. 32, no. 11, pp. 1599–1607, Nov. 2010.
[16] Z. Liu, J. Liu, and T. Chen, “Phenol red immobilized PVA membrane for an optical pH sensor with two determination ranges and long-term stability,” Sensors Actuators B Chem., vol. 107, no. 1, pp. 311–316, May 2005.
[17] X. Xu, S. Smith, J. Urban, and Z. Cui, “An in line non-invasive optical system to monitor pH in cell and tissue culture.,” Med. Eng. Phys., vol.
28, no. 5, pp. 468–74, Jun. 2006.
[18] X.-D. Wang and O. S. Wolfbeis, “Fiber-Optic Chemical Sensors and Biosensors (2008–2012),” Anal. Chem., vol. 85, no. 2, pp. 487–508, Jan. 2013.
[19] E. B. Magnusson, S. Halldorsson, M. T. Ronan, and K. Leosson, “Real-time optical pH measurement in a standard microfluidic cell culture system,” vol. 4, no. 9, pp. 77–85, 2013.
[20] A. S. Jeevarajan, S. Vani, T. D. Taylor, and M. M. Anderson, “Continuous pH monitoring in a perfused bioreactor system using an optical pH sensor,” Biotechnol. Bioeng., vol. 78, pp. 467–472, 2002.
[21] M. Patrikoski et al., “Development of fully defined xeno-free culture system for the preparation and propagation of cell therapy-compliant human adipose stem cells.,” Stem Cell Res. Ther., vol. 4, no. 2, p. 27, 2013.
[22] A. Cooper and C. M. Johnson, “Introduction to Microcalorimetry and Biomolecular Energetics,” in Microscopy, Optical Spectroscopy, and Macroscopic Techniques, New Jersey: Humana Press, pp. 109–124.
[23] M. J. Gramer and T. Ogorzalek, “A semi-empirical mathematical model useful for describing the relationship between carbon dioxide, pH, lactate and base in a bicarbonate-buffered cell-culture process,” Biotechnol. Appl. Biochem, vol. 47, pp. 197–204, 2007.
[24] J. E. Swain, “Optimizing the culture environment in the IVF laboratory: impact of pH and buffer capacity on gamete and embryo quality,” Reprod. Biomed. Online, vol. 21, pp. 6–16, 2010.
tunnus
Text Box
2017 MeMeA USA page: x000