Modelling of an EGSB treating sugarcane vinasse using first-order variable kinetics
9
Modelling of an EGSB treating sugarcane vinasse using first-order variable kinetics Iván López and Liliana Borzacconi ABSTRACT An expanded granular sludge bed (EGSB) anaerobic reactor treating sugar cane vinasse was modelled using a simple model with two steps (acidogenesis and methanogenesis), two populations, two substrates and completely mixed conditions. A first-order kinetic equation for both steps with time-variant kinetic coefficients was used. An observer system was used to estimate the evolution of kinetic constants over time. The model was validated by comparing methane flow predictions with experimental values. An estimation of evolution of populations of microorganisms was also performed. This approach allows calculation of specific kinetic constants that reflect biological activity of microorganisms. Variation of specific kinetic constants reflects the influence of the fraction of raw vinasse in the feed. High salt concentrations in the reactor may have inhibited the process. Iván López (corresponding author) Liliana Borzacconi Facultad de Ingeniería, Universidad de la República, Uruguay E-mail: ivanl@fing.edu.uy Key words | EGSB, kinetic, modelling, observers INTRODUCTION Bioethanol production is very important for industrial appli- cations and in the substitution of energy-renewable sources for fossil fuels. The main objective of the distillation process is production of alcohol, but a concentrated wastewater called vinasse or stillage is simultaneously generated. About 15 L of vinasse are produced per litre of distillate alcohol (Van Haandel ; Pant & Adholeya ) over a concentration range that can vary widely according to the origin of the raw material. The organic matter concentration in vinasse apparently depends strongly on the design and operating conditions of each distillery and the origin of the vinasse. The concentration of organic matter shows a wide range of values: 20 to 33 g Chemical Oxygen Demand (COD)/L for cane juice vinasse and 48 to 120 g COD/L for vinasse from molasses, with a widely varying biodegrad- able fraction (Wilkie et al. ). Sulphate and potassium concentrations also show very high values. Because of the high organic load, anaerobic treatment with biogas recovery is recommended (Van Haandel & Van Lier ; Satyawali & Balakrishnan ). Anaerobic systems are particularly suit- able for handling high concentrations of organic matter and are highly favourable from the standpoint of sustainability (Fernández-Polanco et al. ). Most industrial applications of anaerobic technology for vinasse treatment are based on the Upflow Anaerobic Sludge Bed (UASB) reactor concept, widely used for waste- water treatment (Laubscher et al. ; Wolmarans & de Villiers ). The Expanded Granular Sludge Bed (EGSB) reactor is an extension of the upflow sludge bed concept that increases upflow liquid velocity. The higher upflow liquid velocity allows fluidisation of the sludge bed with a more intensive contact between liquid substrate and solid microorganisms. Industrial applications are rapidly increas- ing, and organic loads for the EGSB reactor are higher than for traditional UASB reactors. Nevertheless, stable operation of the reactor is challenging. Modelling efforts to understand the dynamic behaviour of the EGSB reactor are critical. High levels of potassium are reported to inhibit the oper- ation of the reactor, probably because of the neutralisation effect on the membrane potential (Chen et al. ). Release of micronutrients because of the exchange capacity of pot- assium with other ions has been reported (Ilangovan & Noyola ). As reported by Chen et al.(), the potass- ium IC50 (i.e. the concentration of inhibitor that decreases the biological activity to half) for acetate-utilising microor- ganisms was found to be between 0.15 and 0.74 mol/L but the degradation rate of glucose was virtually unaffected. Despite the great increase in anaerobic applications, the comprehensive and practical modelling of these systems is still developing. An important milestone in this field was 2080 © IWA Publishing 2011 Water Science & Technology | 64.10 | 2011 doi: 10.2166/wst.2011.697
-
Upload
independent -
Category
Documents
-
view
1 -
download
0
Transcript of Modelling of an EGSB treating sugarcane vinasse using first-order variable kinetics
2080 © IWA Publishing 2011 Water Science & Technology | 64.10 | 2011
Modelling of an EGSB treating sugarcane vinasse
using first-order variable kinetics
Iván López and Liliana Borzacconi
ABSTRACT
An expanded granular sludge bed (EGSB) anaerobic reactor treating sugar cane vinasse was
modelled using a simple model with two steps (acidogenesis and methanogenesis), two populations,
two substrates and completely mixed conditions. A first-order kinetic equation for both steps with
time-variant kinetic coefficients was used. An observer system was used to estimate the evolution of
kinetic constants over time. The model was validated by comparing methane flow predictions with
experimental values. An estimation of evolution of populations of microorganisms was also
performed. This approach allows calculation of specific kinetic constants that reflect biological
activity of microorganisms. Variation of specific kinetic constants reflects the influence of the fraction
of raw vinasse in the feed. High salt concentrations in the reactor may have inhibited the process.
doi: 10.2166/wst.2011.697
Iván López (corresponding author)Liliana BorzacconiFacultad de Ingeniería,Universidad de la República,UruguayE-mail: [email protected]
Key words | EGSB, kinetic, modelling, observers
INTRODUCTION
Bioethanol production is very important for industrial appli-
cations and in the substitution of energy-renewable sourcesfor fossil fuels. The main objective of the distillation processis production of alcohol, but a concentrated wastewater
called vinasse or stillage is simultaneously generated.About 15 L of vinasse are produced per litre of distillatealcohol (Van Haandel ; Pant & Adholeya ) over aconcentration range that can vary widely according to the
origin of the raw material. The organic matter concentrationin vinasse apparently depends strongly on the design andoperating conditions of each distillery and the origin of the
vinasse. The concentration of organic matter shows a widerange of values: 20 to 33 g Chemical Oxygen Demand(COD)/L for cane juice vinasse and 48 to 120 g COD/L
for vinasse from molasses, with a widely varying biodegrad-able fraction (Wilkie et al. ). Sulphate and potassiumconcentrations also show very high values. Because of the
high organic load, anaerobic treatment with biogas recoveryis recommended (Van Haandel & Van Lier ; Satyawali &Balakrishnan ). Anaerobic systems are particularly suit-able for handling high concentrations of organic matter and
are highly favourable from the standpoint of sustainability(Fernández-Polanco et al. ).
Most industrial applications of anaerobic technology
for vinasse treatment are based on the Upflow Anaerobic
Sludge Bed (UASB) reactor concept, widely used for waste-
water treatment (Laubscher et al. ; Wolmarans & deVilliers ). The Expanded Granular Sludge Bed (EGSB)reactor is an extension of the upflow sludge bed concept
that increases upflow liquid velocity. The higher upflowliquid velocity allows fluidisation of the sludge bed with amore intensive contact between liquid substrate and solidmicroorganisms. Industrial applications are rapidly increas-
ing, and organic loads for the EGSB reactor are higher thanfor traditional UASB reactors. Nevertheless, stable operationof the reactor is challenging. Modelling efforts to understand
the dynamic behaviour of the EGSB reactor are critical.High levels of potassium are reported to inhibit the oper-
ation of the reactor, probably because of the neutralisation
effect on the membrane potential (Chen et al. ). Releaseof micronutrients because of the exchange capacity of pot-assium with other ions has been reported (Ilangovan &
Noyola ). As reported by Chen et al. (), the potass-ium IC50 (i.e. the concentration of inhibitor that decreasesthe biological activity to half) for acetate-utilising microor-ganisms was found to be between 0.15 and 0.74 mol/L but
the degradation rate of glucose was virtually unaffected.Despite the great increase in anaerobic applications, the
comprehensive and practical modelling of these systems is
still developing. An important milestone in this field was
Table 1 | Vinasse characterisation
Parameter Range
COD (g/L) 56.4–65.8
BOD5 (g/L) 17.5–27.0
N-NH4þ (g N/L) 0.04–0.19
NTK (gN/L) 1.4
VFA (gHAc/L) 7.75–12.2
SO42� (g/L) 2.09–2.24
Kþ (g/L) 3.9–4.5
pH 4.0–4.3
2081 I. López & L. Borzacconi | EGSB model treating sugarcane vinasse Water Science & Technology | 64.10 | 2011
the IWA ADM1 (Batstone et al. , ; Batstone ).
This structured model includes multiple steps describing bio-chemical and physicochemical processes involving at least26 dynamic state variables and many parameters. Although
the complexity of anaerobic processes is reflected in theADM1 model, direct application for modelling and controlpurposes is difficult. The identification of model parametersunder actual operating conditions is quite difficult. On the
other hand,the ADM1 model fails to depict all of the com-plex phenomena that occur in an anaerobic system.
Simpler models with a reduced set of state variables
and parameters have been proposed (Dalla Torre &Stephanopoulos ; Angelidaki et al. ; Bernard et al.; Noykova et al. ; Haag et al. ). Morel et al.() have used a first-order kinetic model with time-variant parameters to model the UASB reactor. Althoughsimple models do not represent the complexity of real pro-cesses, parameter identification and model validation are
more straightforward in the simple models.Usually, from the hydrodynamic point of view, these
models are based on completely stirred tank reactor (CSTR)
conditions (Ojha & Singh ; Chowdhury & Mehrotra; Batstone ). A few authors have considered otherhydrodynamic behaviours (Wu & Hickey ; Keshtkar
et al. ; Pontes & Pinto ). As the kinetic modelsused are very simple, there is no need to consider deviationsfrom complete mixing behaviour (López & Borzacconi ).
Beyond the selection of an appropriate model to representthe system in a simple form, identification of the values of par-ameters is a complex task. Simplifications introduced in themodel are probably reflected in parameter variations when
environmental conditions change. Simpler models imply thatless generalisation of results is necessary when model par-ameters are fixed. In particular, if rate expressions are
simplified with respect to the dependence of state variables,parameters should ‘absorb’ this simplification to maintainthe same confidence level. The change in the history of micro-
organisms will then be transferred to the parameters, whichwill evolve over time. A simplified kinetic approach can beused but kinetic parameters will probably vary over time.
How can the path of this evolution be determined? Indepen-dent batch tests are tedious and are not practical forcontinuous monitoring. However, observers or software sen-sors can provide estimates of unmeasured variables or
unknown parameters based on knowledge of the processdynamics. Asymptotic observers are based on a linear trans-formation of state variables that allows the material balance
to be written in an independent form from the reactionkinetics (Dochain ). When a decoupled parameter
estimation (Perrier et al. ; Morel et al. ) is used, the
evolution of specific growth coefficients can be determinedsimultaneously.
MATERIALS AND METHODS
Experimental reactor
A bench scale EGSB reactor with a working volume of 6 L
and a total volume of 12 L (including phase separator) wasused for the treatment of sugarcane vinasse. The reactorwas placed in a temperature-controlled cabinet at 30± 1 WC.
Characterisation of the vinasse used to feed the reactor isshown in Table 1. The reactor was fed with diluted vinasse,increasing the percentage of raw vinasse over time
and maintaining the volumetric flow at an average valueof 4.4 L/d (standard deviation of 2.4 L/d). For monitoringpurposes, Chemical Oxygen Demand (COD), Volatile
Fatty Acids (VFA), alkalinity and pH were measured at theinlet and the outlet of the reactor. COD was determinedby the reflux method (APHA, AWWA, WEF ), andVFA and alkalinity were determined by a simplified titration
method (DiLallo & Albertson ). Gas flow was recordedby a wet-type gas meter (Schlumberger, Germany), and gascomposition was determined by gas chromatography
(Shimadzu GC 14B, Japan). Samples from the sludge bedwere periodically collected, and solids content in the reactorwas determined. Additionally, volatile suspended solids
(APHA, AWWA, WEF ) in the reactor effluent weredetermined routinely.
The model
A simple two-step model (acidogenesis –methanisation) wasused. In the first step, acidogenic bacteria (X1) consume the
2082 I. López & L. Borzacconi | EGSB model treating sugarcane vinasse Water Science & Technology | 64.10 | 2011
complex organic substrate (S1) and produce volatile fatty
acids (VFA, S2) and more bacteria. Next, a methanogenicpopulation (X2) consumes the VFA and produces methane(and more microorganisms). The model reduces the com-
plexity of the network of anaerobic reactions to only twobiological reactions in series.
Considering the simplicity and the mathematicalbenefits derived from a linear system, we propose to use a
first-order kinetic equation to represent the reaction ratesinstead of the most common Monod- or Haldane-based kin-etic equation. A first-order kinetic equation is the simpler
option, to reflect the dependence on the reactant concen-tration. Remember also that the most common kineticexpressions used in a biological process, like Monod or Hal-
dane kinetics, approximate to a first-order kinetic equationwhen the substrate concentration is low relative to the semi-saturation constant. Volumetric rates are
r1 ¼ k1S1 ð1Þ
r2 ¼ k2S2 ð2Þ
where S1 represents the concentration of the complexorganic substrate (expressed as g COD/L), S2 is the concen-
tration of the VFA (also expressed as g COD/L) and k1 andk2 (in d�1) are the first-order kinetic constants for both reac-tions. For the calculation of S1, only 90% of the non-VFACOD was considered anaerobically biodegradable.
Loss of complexity due to linear behaviour must be com-pensated by relaxing the fixed values of constant parameters tomaintain the same confidence level in the model. At the same
time, the number of microorganisms and their biologicalactivity must be reflected in the values of the constants. Wepropose dynamic behaviour of kinetic constants to encompass
biomass quantity and variation in environmental conditions.Many phenomena cannot be represented by the model
due to its simplicity. Variation in pH is not considered. Inhi-bition of the reaction caused by pH variation, by the
presence of chemicals or product inhibition are not rep-resented explicitly by the model.
Continuously stirred tank reactor (CSTR) behaviour
is assumed for the liquid phase. The high recirculationratio in an EGSB reactor is the dominant factor in produ-cing a significant amount of mixing. The production of
biogas, uniformly distributed inside the reactor due tofluidisation, also contributes to mixing. Equations for thedynamic model are:
_S1 ¼ DðS1in � S1Þ � k1S1 ð3Þ
_S2 ¼ DðS2in � S2Þ þ k1S1 � k2S2 ð4Þ
where D (in d�1) is the dilution rate, i.e., the inverse of thehydraulic retention time. The in subscript shows inlet con-ditions, and the dot variables are the respective time
derivatives.The solid phase also achieved a high degree of mixing
due to fluidisation. If the reactor is well designed, the bio-mass is retained in the reactor. However, a small fraction
of the solids content can be washed out with the liquid efflu-ent. To incorporate the effect of solids retention in thereactor, the α parameter (which represents the solid fraction
that leaves the reactor) was introduced, as in the work ofBernard et al. (). Two additional equations can be writ-ten to reflect the biomass dynamic:
_X1 ¼ Y1k1S1 � αDX1 ð5Þ
_X2 ¼ Y2k2S2 � αDX2 ð6Þ
where X1 is the concentration of acidogenic bacteria (in gVolatile Suspended Solids (VSS)/L), X2 is the concentrationof methanogenic bacteria (in g VSS/L), α is the solid fraction
that leaves the reactor and Y1 and Y2 are the substrates tobiomass yield of each type of microorganism.
Assuming that the kinetic constants are proportional tothe respective biomass quantities, we can write equations for
specific kinetic constants
k�1 ¼ k1=ðX1VÞ ð7Þ
k�2 ¼ k2=ðX2VÞ ð8Þ
both constants in (g VSS d)�1.
Kinetic estimation using observers
Model Equations (3) and (4) can be rewritten in a morecompact matrix form as
_S1_S2
� �¼ �S1 0
S1 �S2
� �k1
k2
� �þD
S1in � S1S2in � S2
� �ð9Þ
where
D ¼ D 0
0 D
� �
2083 I. López & L. Borzacconi | EGSB model treating sugarcane vinasse Water Science & Technology | 64.10 | 2011
Observers provide software estimations of unmeasured
variables or unknown parameters based on knowledge ofprocess dynamics. Asymptotic observers are based on alinear transformation of state variables that allows the
material balance to be written in a form independentof the reaction kinetics. We write the followingobserver system to estimate the kinetic constants (Morelet al. ):
_S1_S2
" #¼ �S1 0
S1 �S2
� �k1
k2
" #þD
S1in � S1S2in � S2
� �
þ ω1 0
0 ω2
� �S1 � S1S2 � S2
" #
_k1
_k2
" #¼
� 1S1
0
� 1S2
� 1S2
2664
3775 γ1 0
0 γ2
� �S1 � S1S2 � S2
� �ð10Þ
where the ‘hat’ variables are estimated and ωi and γi are thegains of the observers. Following the suggestion of Perrieret al. (), γi can be considered equal to ωi
2/4. Then onlytwo parameters must be adjusted. Knowing the inlet and
the reactor concentrations over time, the equations can beintegrated. The evolution of the kinetic constants is thusobtained.
The methane flux qM (in L/d) can be related to the S2degradation rate:
qM ¼ 0:38ð1� 1:42 × Y2Þk2S2VR ð11Þ
where 0.38 is the conversion factor to convert g COD to
litres of methane at 30 WC, 1.42 is the conversion factor to
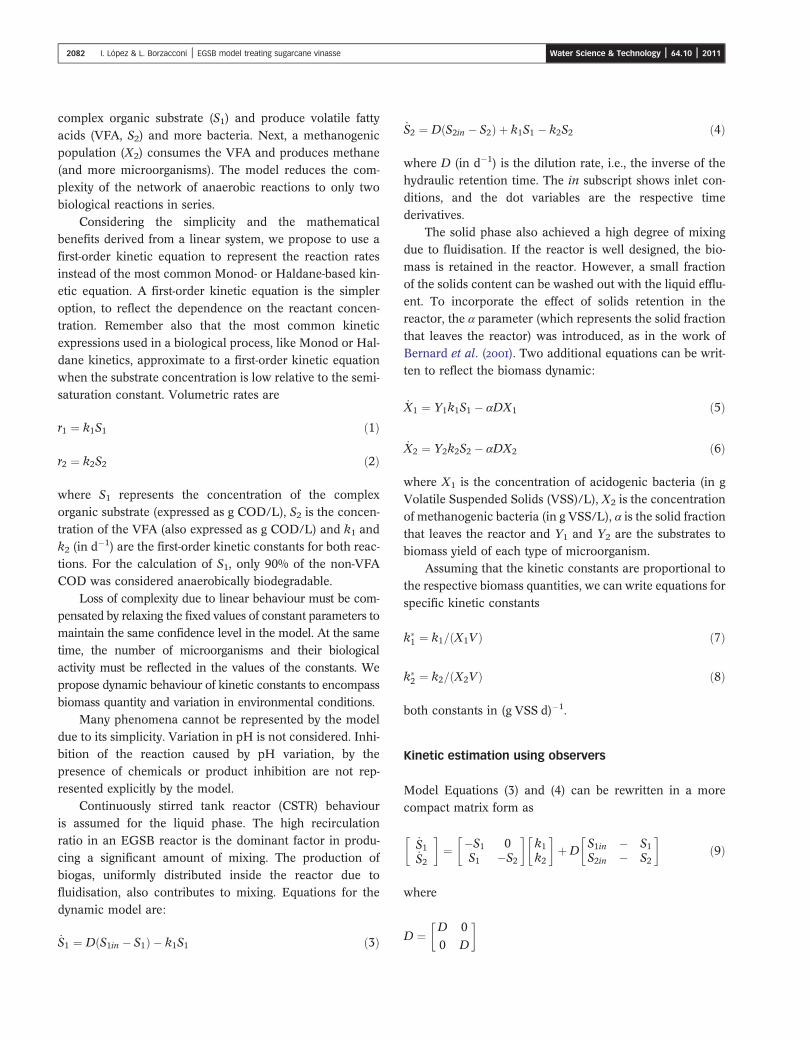
Figure 1 | Reactor performance. –inlet COD (g COD/L), - - - outlet COD (g COD/L), -○-○- volumet
convert VSS to COD for biomass, and VR is the active reac-
tor volume. If we have experimental data for methane flow,we can validate the model results.
The calculation algorithms were implemented and
the optimisation runs were performed using MATLAB®.Because the concentration determinations are notcontinuous, a spline interpolation was used to apply themodel.
RESULTS AND DISCUSSION
Figure 1 shows the experimental values of inlet and outletCOD. A relatively low organic load (an average of 3.7 gCOD/L · d referred to the active reactor volume) was
applied during the first 50 days to acclimate the biomassto vinasse. Organic load was then progressively increasedfor 40 days until an organic load of 18 g COD/L · d was
reached, and this approximate value was maintained for30 days. Between days 120 and 160, some operationalproblems were encountered that forced us to diminish
the organic load by half. Thereafter, the organic loadwas maintained at approximately 20 g COD/L · d. Afterday 200, the reactor was fed with a COD concentrationof approximately 40 g/L, diminishing the volumetric
flow. During this period, the VFA concentration in thereactor increased and bicarbonate addition was necessaryto maintain alkalinity. Finally, VFA concentrations
reached values up to 3 g COD/L, and destabilisationoccurred although the load was lowered. The pH wasmaintained in the range between 7 to 8 in the reactor
without alkali addition, even though the feed was at apH of approximately 4.5.
ric load (g COD/L · d).
2084 I. López & L. Borzacconi | EGSB model treating sugarcane vinasse Water Science & Technology | 64.10 | 2011
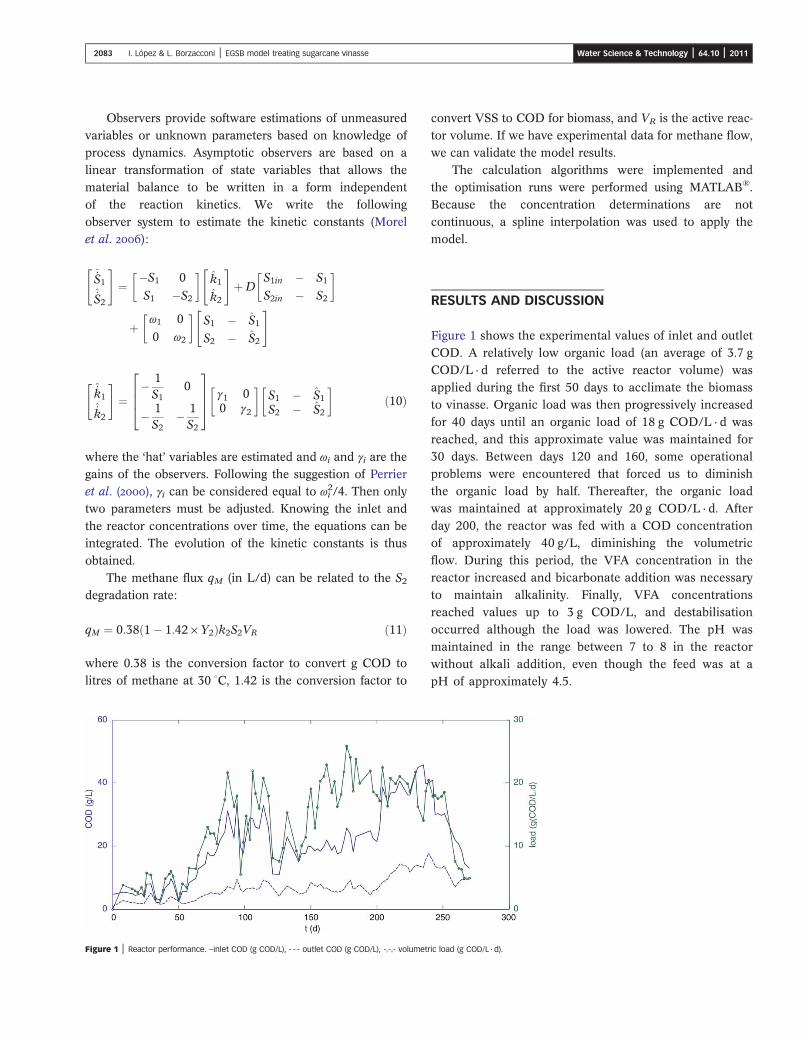
Adjustment of the observer parameters ωi was made
empirically in an attempt to achieve an acceptable fit withthe experimental variables and smooth behaviour of theestimated parameter. Figure 2 shows that a very good adjust-
ment was achieved with ω1¼ 2 and ω2¼ 3, providing anestimate of the evolution of the kinetic constants overtime. The results do not vary significantly when ωi par-ameters show minor variations. Optimisation of these
results is not warranted because there is too little changein the general behaviour of variables and parameters.
Low values of kinetic constants in the first 50 days cor-
respond to an acclimation period with a low organic loadand consequent low biological activity. After the first 50days of acclimation, kinetic constant k1 shows values
between 1.5 and 3 d�1. In the last period, when reactor fail-ure occurs, the k1 constant appears to fall. After theacclimation period, the methanogenic constant k2 fluctuatesmainly between 5 and 10 d�1, with some peaks that exceed
10 d�1. Variations in reactor working conditions arereflected in the variations of the kinetic parameters. Afterday 210, when raw vinasse dilution is diminished, the
methanogenic constant definitely tends to decrease. Withthis fall in the value of k2, the model reflects the destabilisa-tion of the reactor: the second step of the model
(methanogenesis) works with a low rate, and accumulation
Figure 2 | (a) S1 evolution, (*) experimental data, (�) estimation with ω1¼ 2, (b) S2 evolution,
observed values of k2 (d�1).
of acids occurs. The simple model not explains the reasons
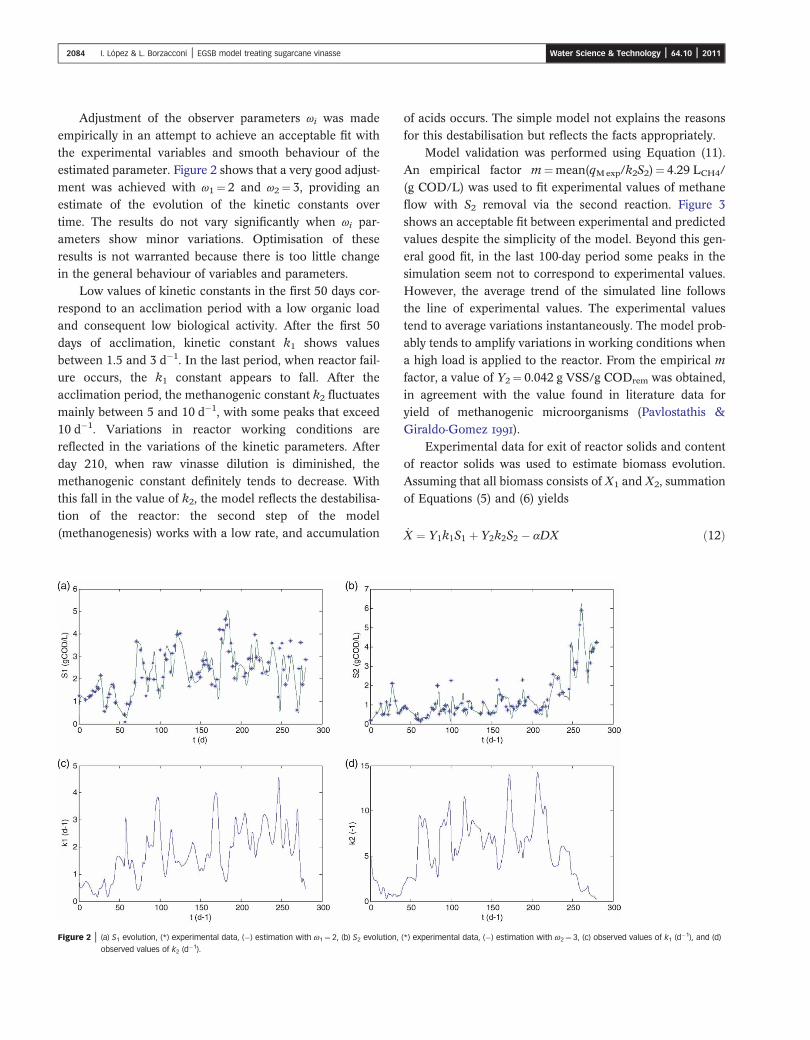
for this destabilisation but reflects the facts appropriately.Model validation was performed using Equation (11).
An empirical factor m¼mean(qMexp/k2S2)¼ 4.29 LCH4/
(g COD/L) was used to fit experimental values of methaneflow with S2 removal via the second reaction. Figure 3shows an acceptable fit between experimental and predictedvalues despite the simplicity of the model. Beyond this gen-
eral good fit, in the last 100-day period some peaks in thesimulation seem not to correspond to experimental values.However, the average trend of the simulated line follows
the line of experimental values. The experimental valuestend to average variations instantaneously. The model prob-ably tends to amplify variations in working conditions when
a high load is applied to the reactor. From the empirical mfactor, a value of Y2¼ 0.042 g VSS/g CODrem was obtained,in agreement with the value found in literature data foryield of methanogenic microorganisms (Pavlostathis &
Giraldo-Gomez ).Experimental data for exit of reactor solids and content
of reactor solids was used to estimate biomass evolution.
Assuming that all biomass consists of X1 and X2, summationof Equations (5) and (6) yields
_X ¼ Y1k1S1 þ Y2k2S2 � αDX ð12Þ
(*) experimental data, (�) estimation with ω2¼ 3, (c) observed values of k1 (d�1), and (d)
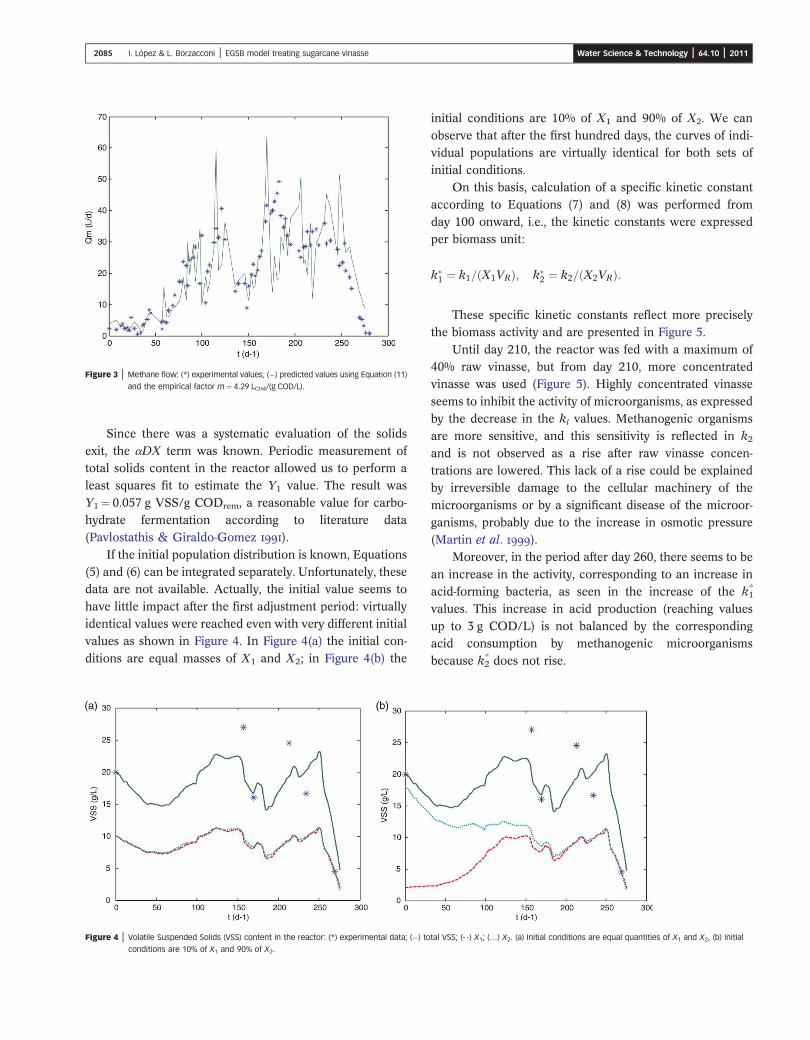
Figure 3 | Methane flow: (*) experimental values; (�) predicted values using Equation (11)
and the empirical factor m¼ 4.29 LCH4/(g COD/L).
2085 I. López & L. Borzacconi | EGSB model treating sugarcane vinasse Water Science & Technology | 64.10 | 2011
Since there was a systematic evaluation of the solidsexit, the αDX term was known. Periodic measurement oftotal solids content in the reactor allowed us to perform a
least squares fit to estimate the Y1 value. The result wasY1¼ 0.057 g VSS/g CODrem, a reasonable value for carbo-hydrate fermentation according to literature data
(Pavlostathis & Giraldo-Gomez ).If the initial population distribution is known, Equations
(5) and (6) can be integrated separately. Unfortunately, thesedata are not available. Actually, the initial value seems to
have little impact after the first adjustment period: virtuallyidentical values were reached even with very different initialvalues as shown in Figure 4. In Figure 4(a) the initial con-
ditions are equal masses of X1 and X2; in Figure 4(b) the
Figure 4 | Volatile Suspended Solids (VSS) content in the reactor: (*) experimental data; (�) to
conditions are 10% of X1 and 90% of X2.
initial conditions are 10% of X1 and 90% of X2. We can
observe that after the first hundred days, the curves of indi-vidual populations are virtually identical for both sets ofinitial conditions.
On this basis, calculation of a specific kinetic constantaccording to Equations (7) and (8) was performed fromday 100 onward, i.e., the kinetic constants were expressedper biomass unit:
k�1 ¼ k1=ðX1VRÞ; k�
2 ¼ k2=ðX2VRÞ:
These specific kinetic constants reflect more preciselythe biomass activity and are presented in Figure 5.
Until day 210, the reactor was fed with a maximum of40% raw vinasse, but from day 210, more concentratedvinasse was used (Figure 5). Highly concentrated vinasse
seems to inhibit the activity of microorganisms, as expressedby the decrease in the ki values. Methanogenic organismsare more sensitive, and this sensitivity is reflected in k2and is not observed as a rise after raw vinasse concen-trations are lowered. This lack of a rise could be explainedby irreversible damage to the cellular machinery of the
microorganisms or by a significant disease of the microor-ganisms, probably due to the increase in osmotic pressure(Martin et al. ).
Moreover, in the period after day 260, there seems to be
an increase in the activity, corresponding to an increase inacid-forming bacteria, as seen in the increase of the k1
*
values. This increase in acid production (reaching values
up to 3 g COD/L) is not balanced by the correspondingacid consumption by methanogenic microorganismsbecause k2
* does not rise.
tal VSS; (- -) X1; (…) X2. (a) Initial conditions are equal quantities of X1 and X2, (b) initial
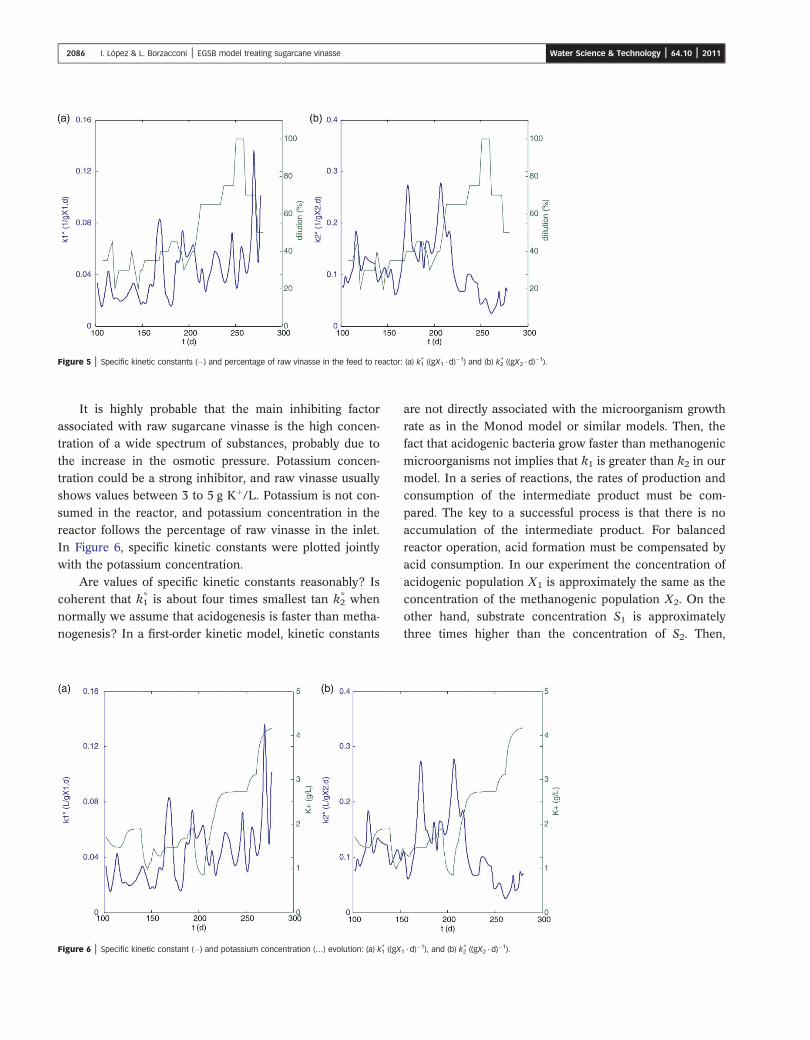
Figure 5 | Specific kinetic constants (�) and percentage of raw vinasse in the feed to reactor: (a) k1* ((gX1 · d)
�1) and (b) k2* ((gX2 · d)
�1).
2086 I. López & L. Borzacconi | EGSB model treating sugarcane vinasse Water Science & Technology | 64.10 | 2011
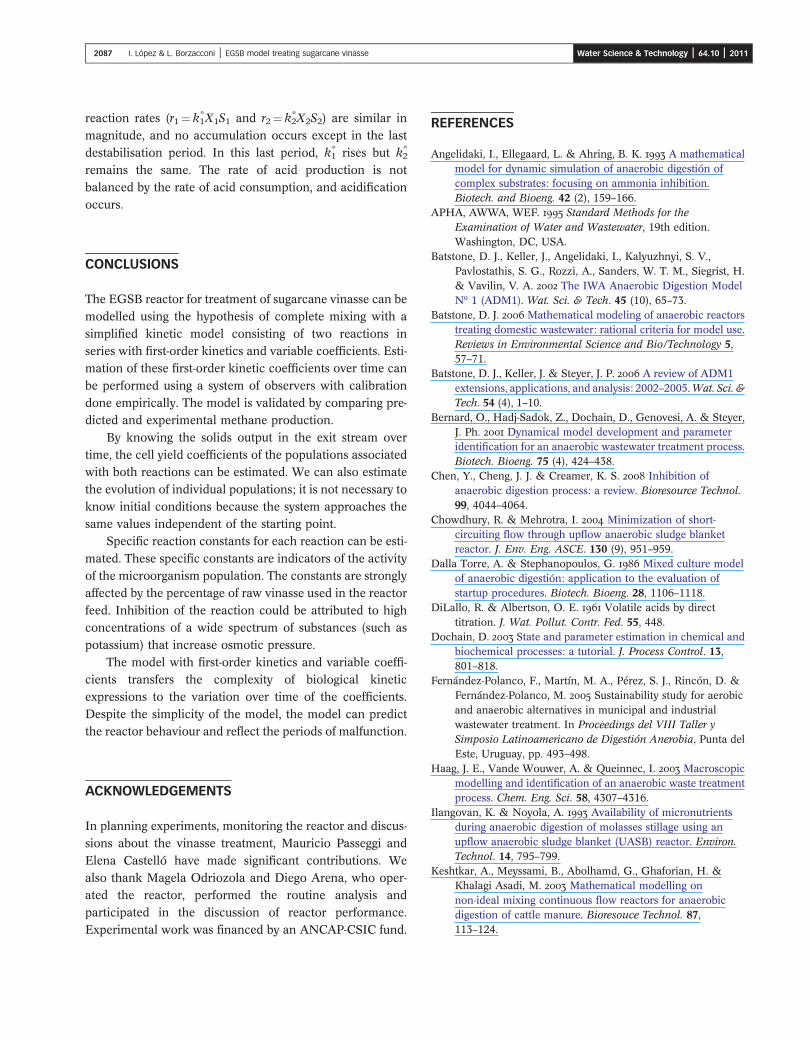
It is highly probable that the main inhibiting factorassociated with raw sugarcane vinasse is the high concen-tration of a wide spectrum of substances, probably due to
the increase in the osmotic pressure. Potassium concen-tration could be a strong inhibitor, and raw vinasse usuallyshows values between 3 to 5 g Kþ/L. Potassium is not con-
sumed in the reactor, and potassium concentration in thereactor follows the percentage of raw vinasse in the inlet.In Figure 6, specific kinetic constants were plotted jointlywith the potassium concentration.
Are values of specific kinetic constants reasonably? Iscoherent that k1
* is about four times smallest tan k2* when
normally we assume that acidogenesis is faster than metha-
nogenesis? In a first-order kinetic model, kinetic constants
Figure 6 | Specific kinetic constant (�) and potassium concentration (…) evolution: (a) k1* ((gX
are not directly associated with the microorganism growthrate as in the Monod model or similar models. Then, thefact that acidogenic bacteria grow faster than methanogenic
microorganisms not implies that k1 is greater than k2 in ourmodel. In a series of reactions, the rates of production andconsumption of the intermediate product must be com-
pared. The key to a successful process is that there is noaccumulation of the intermediate product. For balancedreactor operation, acid formation must be compensated byacid consumption. In our experiment the concentration of
acidogenic population X1 is approximately the same as theconcentration of the methanogenic population X2. On theother hand, substrate concentration S1 is approximately
three times higher than the concentration of S2. Then,
1 · d)�1), and (b) k2
* ((gX2 · d)�1).
2087 I. López & L. Borzacconi | EGSB model treating sugarcane vinasse Water Science & Technology | 64.10 | 2011
reaction rates (r1¼ k1*X1S1 and r2¼ k2
*X2S2) are similar in
magnitude, and no accumulation occurs except in the lastdestabilisation period. In this last period, k1
* rises but k2*
remains the same. The rate of acid production is not
balanced by the rate of acid consumption, and acidificationoccurs.
CONCLUSIONS
The EGSB reactor for treatment of sugarcane vinasse can bemodelled using the hypothesis of complete mixing with a
simplified kinetic model consisting of two reactions inseries with first-order kinetics and variable coefficients. Esti-mation of these first-order kinetic coefficients over time can
be performed using a system of observers with calibrationdone empirically. The model is validated by comparing pre-dicted and experimental methane production.
By knowing the solids output in the exit stream overtime, the cell yield coefficients of the populations associatedwith both reactions can be estimated. We can also estimate
the evolution of individual populations; it is not necessary toknow initial conditions because the system approaches thesame values independent of the starting point.
Specific reaction constants for each reaction can be esti-
mated. These specific constants are indicators of the activityof the microorganism population. The constants are stronglyaffected by the percentage of raw vinasse used in the reactor
feed. Inhibition of the reaction could be attributed to highconcentrations of a wide spectrum of substances (such aspotassium) that increase osmotic pressure.
The model with first-order kinetics and variable coeffi-cients transfers the complexity of biological kineticexpressions to the variation over time of the coefficients.
Despite the simplicity of the model, the model can predictthe reactor behaviour and reflect the periods of malfunction.
ACKNOWLEDGEMENTS
In planning experiments, monitoring the reactor and discus-sions about the vinasse treatment, Mauricio Passeggi and
Elena Castelló have made significant contributions. Wealso thank Magela Odriozola and Diego Arena, who oper-ated the reactor, performed the routine analysis and
participated in the discussion of reactor performance.Experimental work was financed by an ANCAP-CSIC fund.
REFERENCES
Angelidaki, I., Ellegaard, L. & Ahring, B. K. A mathematicalmodel for dynamic simulation of anaerobic digestión ofcomplex substrates: focusing on ammonia inhibition.Biotech. and Bioeng. 42 (2), 159–166.
APHA, AWWA, WEF. Standard Methods for theExamination of Water and Wastewater, 19th edition.Washington, DC, USA.
Batstone, D. J., Keller, J., Angelidaki, I., Kalyuzhnyi, S. V.,Pavlostathis, S. G., Rozzi, A., Sanders, W. T. M., Siegrist, H.& Vavilin, V. A. The IWA Anaerobic Digestion ModelNº 1 (ADM1). Wat. Sci. & Tech. 45 (10), 65–73.
Batstone, D. J. Mathematical modeling of anaerobic reactorstreating domestic wastewater: rational criteria for model use.Reviews in Environmental Science and Bio/Technology 5,57–71.
Batstone, D. J., Keller, J. & Steyer, J. P. A review of ADM1extensions, applications, and analysis: 2002–2005.Wat. Sci. &Tech. 54 (4), 1–10.
Bernard, O., Hadj-Sadok, Z., Dochain, D., Genovesi, A. & Steyer,J. Ph. Dynamical model development and parameteridentification for an anaerobic wastewater treatment process.Biotech. Bioeng. 75 (4), 424–438.
Chen, Y., Cheng, J. J. & Creamer, K. S. Inhibition ofanaerobic digestion process: a review. Bioresource Technol.99, 4044–4064.
Chowdhury, R. & Mehrotra, I. Minimization of short-circuiting flow through upflow anaerobic sludge blanketreactor. J. Env. Eng. ASCE. 130 (9), 951–959.
Dalla Torre, A. & Stephanopoulos, G. Mixed culture modelof anaerobic digestión: application to the evaluation ofstartup procedures. Biotech. Bioeng. 28, 1106–1118.
DiLallo, R. & Albertson, O. E. Volatile acids by directtitration. J. Wat. Pollut. Contr. Fed. 55, 448.
Dochain, D. State and parameter estimation in chemical andbiochemical processes: a tutorial. J. Process Control. 13,801–818.
Fernández-Polanco, F., Martín, M. A., Pérez, S. J., Rincón, D. &Fernández-Polanco, M. Sustainability study for aerobicand anaerobic alternatives in municipal and industrialwastewater treatment. In Proceedings del VIII Taller ySimposio Latinoamericano de Digestión Anerobia, Punta delEste, Uruguay, pp. 493–498.
Haag, J. E., Vande Wouwer, A. & Queinnec, I. Macroscopicmodelling and identification of an anaerobic waste treatmentprocess. Chem. Eng. Sci. 58, 4307–4316.
Ilangovan, K. & Noyola, A. Availability of micronutrientsduring anaerobic digestion of molasses stillage using anupflow anaerobic sludge blanket (UASB) reactor. Environ.Technol. 14, 795–799.
Keshtkar, A., Meyssami, B., Abolhamd, G., Ghaforian, H. &Khalagi Asadi, M. Mathematical modelling onnon-ideal mixing continuous flow reactors for anaerobicdigestion of cattle manure. Bioresouce Technol. 87,113–124.
2088 I. López & L. Borzacconi | EGSB model treating sugarcane vinasse Water Science & Technology | 64.10 | 2011
Laubscher, A. C. J., Wentzel, M. C., Le, J. M. W. & Ekama, G. A. Treatment of grain distillation wastewaters in an upflowanaerobic sludge bed (UASB) system. Water SA 27 (4),433–444.
López, I. & Borzacconi, UASB reactor hydrodynamics:residence time distribution and proposed modeling tools,accepted in. Environm. Technol. 31 (6), 591–600.
Martin, D. D., Ciulla, R. A. & Roberts, M. F. Osmoadaptationin Archaea. Applied and Environ. Microbiol. 65 (5),1815–1825.
Morel, E., Tartakovsky, B., Guiot, S. R. & Perrier, M. On-lineestimation of kinetic parameters in anaerobic digestion usingobserver-based estimators and multiwavelength fluorometry.Wat. Sci. Tech. 53 (4–5), 77–83.
Noykova, N., Müller, T. G., Gyllenberg, M. & Timmer, J. Quantitative analyses of anaerobic wastewater treatmentprocesses: identifiability and parameter estimation. Biotech.Bioeng. 78 (1), 89–103.
Ojha, C. S. P. & Singh, R. P. Flow distribution parameters inrelation to flow resistance in an upflow anaerobicsludge blanket reactor system. J. Env. Eng. ASCE. 128 (2),196–200.
Pant, D. & Adholeya, A. Biological approaches for treatmentof distillery wastewater: a review. Bioresource Technol. 98,2321–2334.
Pavlostathis, S. G. & Giraldo-Gomez, E. Kinetics of anaerobictreatment. Wat. Sci. Tech. 24 (8), 35–59.
Perrier, M., Feyo de Azevedo, S., Ferreira, E. C. & Dochain, D. Tuning of observer-basede estimators: theory andapplication to the on-line estimation of kinetic parameters.Control Eng. Practice. 8, 377–388.
Pontes, R. F. F. & Pinto, J. M. Analysis of integrated kineticand flow models for anaerobic digesters. Chem. Eng. Journal.122, 65–80.
Satyawali, Y. & Balakrishnan, M. Wastewater treatment inmolasses-based alcohol distilleries for COD and colorremoval: a review. J Environ. Manage. 86, 481–497.
Van Haandel, A. C. Integrated energy production andreduction of the environmental impact at alcohol distilleryplants. Water Sci. Technol. 52 (1–2), 49–57.
Van Haandel, A. C. & van Lier, J. Vinasse treatment forenergy production and environmental protection at alcoholdistillery plants. In Proc. of DIVER 2006. Int. Conf. onProduction and Uses of Ethanol, Havana, Cuba.
Wilkie, A. C., Riedesel, K. J. & Owens, J. M. Stillagecharacterization and anaerobic treatment of etanol stillagefrom conventional and cellulosic feedstocks. BiomassBioenerg. 19, 63–102.
Wolmarans, B. & de Villiers, G. H. Start-up of a UASBeffluent treatment plant on distillery wastewater.Water SA 28(1), 63–68.
Wu, M. M. & Hickey, R. F. Dynamic model for UASB reactorincluding reactor hydraulics, reaction and diffusion. J. Env.Eng. ASCE 123, 244–252.
First received 17 February 2011; accepted in revised form 17 May 2011

![[Treating frostbite injuries]](https://static.fdokumen.com/doc/165x107/633ff39332b09e4bae09a1b5/treating-frostbite-injuries.jpg)