Modelling and simulation of abnormal behaviour of thick-film tin oxide gas sensors in CO
13
ELSEVIER Sensors and Actuators B 21 (1994) 10!9-121 CHEMICAL Modelling and simulation of abnormal behaviour of thick-film tin oxide gas sensors in CO P.D. Skafidas, D.S. Vlachos, J.N. Avaritsiotis* National Technicd Univemity of Athens, Electrical Engineering Jlepartmenf LXvision of Computer Engitteering 157 73 Zogmphou, Atkens, GWCe Received 4 May 1993; in revised form 30 December 1993; accepted 17 January 1994 Abstract A new model is proposed that takes into account oxygen vacancies in tin oxide resistive-typegas sensors, assuming that lattice oxygen modifies the rate of oxygen adsorption. Applying this hypothesis in a Monte Carlo simulation, effects observed in thick-film samples are explained. Moreover, computational techniques have been used in order to simulate different thick- film structures, and the role of both surface coverage and reduction in the sensing mechanism is investigated. Tbe simulation results are in good qualitative agreement with the experimental results obtained from our samples. In particular, phenomena like undershoot and overshoot of the sample’s resistance, very long recovery times and poisoning of the sensor surface are discussed. Keywor&s:Modelling; Monte Carlo simulations; Tin oxide gas sensors; Carbon monoxide 1. Introdllction Semiconductor gas sensors based on SnO, have been widely accepted as an important tool for detecting or monitoring inflammable gases diluted in air, and many investigations have been published on gas-sensing char- acteristics, sensing mechanisms, promoter actions, and so on [l-7]. From these studies it is well known that negative charges accumulate on the surface in an at- mosphere containing oxygen. According to the general electronic theory of chemisorption, this is due to the discrete energy levels introduced by oxygen within the band gap in the surface region. The negative charge generates a depletion layer and a Schottky potential- energy barrier at the semiconductor surface; this has a very pronounced effect on the electrical conductance, especially those barriers at the grain boundaries. The conductivity is very sensitive at these grain boundaries, as shown in Fig. 1. Reducing-gas molecules like CO react with oxygen species ionosorbed on the semicon- ductor surface, decreasing the Schottky barrier and increasing the conductance. From temperature profile desorption (TPD) experiments, it was found that CO leaves the surface mainly as CO, [8]. * Corresponding author. i’ 0 n n n . . * . ..** I,.. Fig. 1. Physical (upper) and band model (lower) of the gas-sensing mechanism of thick-film tin oxide gas sensors. The depletion layer near the grain boundaries is responsible for the change of the resistance. The conductivity of the samples depends strongly on the chernisorption rate of oxygen. When this rate is low, exposure of the sample to reducing gases, like CO, will strongly modify the conductance and, after the removal of the reducing gas, the sample’s con- ductivity will need some time before reaching its initial value. On the other hand, when the rate of oxygen adsorption is high, the sample will not be so sensitive to the presence of a reducing gas but will show a very 09254005/94/$07.00 0 1994 Elsevier Science S.A. All rights reserved SSDI 0925-4005(94)01229-B
Transcript of Modelling and simulation of abnormal behaviour of thick-film tin oxide gas sensors in CO
ELSEVIER Sensors and Actuators B 21 (1994) 10!9-121 CHEMICAL
Modelling and simulation of abnormal behaviour of thick-film tin oxide gas sensors in CO
P.D. Skafidas, D.S. Vlachos, J.N. Avaritsiotis* National Technicd Univemity of Athens, Electrical Engineering Jlepartmenf LXvision of Computer Engitteering 157 73 Zogmphou, Atkens,
GWCe
Received 4 May 1993; in revised form 30 December 1993; accepted 17 January 1994
Abstract
A new model is proposed that takes into account oxygen vacancies in tin oxide resistive-type gas sensors, assuming that lattice oxygen modifies the rate of oxygen adsorption. Applying this hypothesis in a Monte Carlo simulation, effects observed in thick-film samples are explained. Moreover, computational techniques have been used in order to simulate different thick- film structures, and the role of both surface coverage and reduction in the sensing mechanism is investigated. Tbe simulation results are in good qualitative agreement with the experimental results obtained from our samples. In particular, phenomena like undershoot and overshoot of the sample’s resistance, very long recovery times and poisoning of the sensor surface are discussed.
Keywor&s: Modelling; Monte Carlo simulations; Tin oxide gas sensors; Carbon monoxide
1. Introdllction
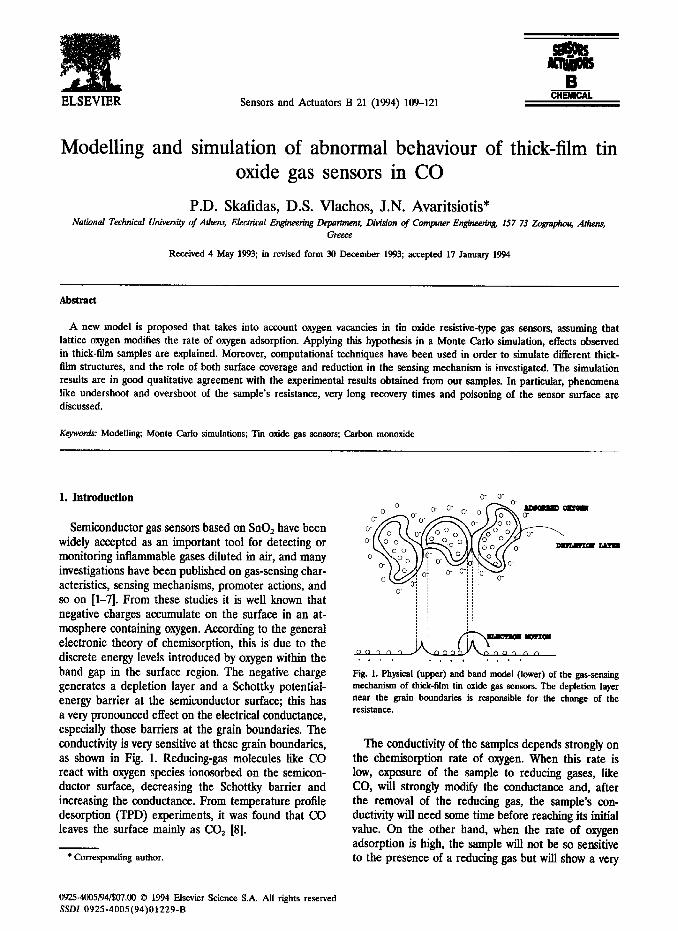
Semiconductor gas sensors based on SnO, have been widely accepted as an important tool for detecting or monitoring inflammable gases diluted in air, and many investigations have been published on gas-sensing char- acteristics, sensing mechanisms, promoter actions, and so on [l-7]. From these studies it is well known that negative charges accumulate on the surface in an at- mosphere containing oxygen. According to the general electronic theory of chemisorption, this is due to the discrete energy levels introduced by oxygen within the band gap in the surface region. The negative charge generates a depletion layer and a Schottky potential- energy barrier at the semiconductor surface; this has a very pronounced effect on the electrical conductance, especially those barriers at the grain boundaries. The conductivity is very sensitive at these grain boundaries, as shown in Fig. 1. Reducing-gas molecules like CO react with oxygen species ionosorbed on the semicon- ductor surface, decreasing the Schottky barrier and increasing the conductance. From temperature profile desorption (TPD) experiments, it was found that CO leaves the surface mainly as CO, [8].
* Corresponding author.
i’ 0 n n n . . * . ..** I,..
Fig. 1. Physical (upper) and band model (lower) of the gas-sensing mechanism of thick-film tin oxide gas sensors. The depletion layer near the grain boundaries is responsible for the change of the resistance.
The conductivity of the samples depends strongly on the chernisorption rate of oxygen. When this rate is low, exposure of the sample to reducing gases, like CO, will strongly modify the conductance and, after the removal of the reducing gas, the sample’s con- ductivity will need some time before reaching its initial value. On the other hand, when the rate of oxygen adsorption is high, the sample will not be so sensitive to the presence of a reducing gas but will show a very
09254005/94/$07.00 0 1994 Elsevier Science S.A. All rights reserved SSDI 0925-4005(94)01229-B
110 P.D. Sk&as et al. I Sensors and Actifom B 21 (1994) li3!-121
fast recovery. One may therefore conclude that sen- sitivity and sample recovery are competing effects. Also, since the chemisorption rate is influenced by the sub- strate temperature, these phenomena will depend on temperature.
Apart from the chemisorbed oxygen, the surface lattice oxygen plays an important role in the sensing mechanism. Although lattice oxygen does not react so fast [3] as oxygen adatoms, it can modify the chemi- sorption rate by altering the availability of local elec- trons. This stems from the well-known ionic nature of the tin oxide crystal, in which electrons are tightly bonded with tin and oxygen atoms.
The aim of this work is to study, by means of the Monte Carlo technique, the various reactions and their intermediate products in the presence of carbon mon- oxide. More precisely, experimental results that have been obtained in our laboratory showed some ‘strange’ effects (phenomena like undershoot and overshoot of the sample’s resistance, and very long recovery times), which could not be explained by the microscopic elec- trochemical model proposed by Windischmann and Mark [9]. Also, instabilities were observed [lo], which were assigned to the coverage dependence of CO adsorption on the tin oxide surface. A chemical mode1 is proposed to explain these phenomena, which is based on surface lattice oxygen vacancies. On the other hand, useful information about cluster formation and poi- soning effects was obtained.
2. Experimental
Tin dioxide-based thick-film gas sensors for CO with dimensions 3 cmx3 cm were fabricated on alumina substrates. Two thick-film pastes were produced ac- cording to a method similar to the one reported by Fuller and Warwick [ll]. More precisely, SnO, was prepared from SnCI,.5H,O. An aqueous solution of SnCl,.SH,O was neutralized with an aqueous ammonia solution (25%). The resulting precipitate (stannic acid) was washed thoroughly with deionized water to remove Cl- ions, dried at 100 “C for 24 h and then crushed with an agate mortar. The crushed powder was calcined at 600 “C for 6 h and then crushed again with an agate mortar for 1 h. In order to obtain the thick-film pastes, an aqueous solution of organic binder was used. Paste 1, which was used for the screen printing of sample 1, contained 1 wt.% palladium, whereas Paste 2, a plain tin oxide paste, was used for the printing of samples 2 and 3. The screen-printed sensors showed n-type conductivity [l]. Annealing for one week at 550 “C was required in order to make their response reproducible and stable.
All measurements were taken with the aid of an automatic system based on a 386s~ microprocessor with
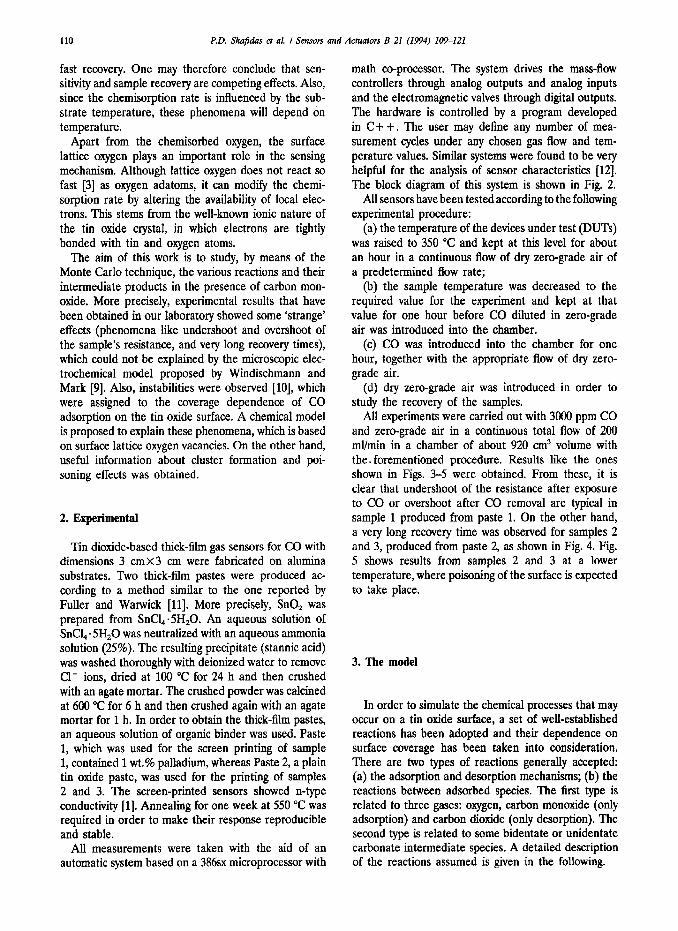
math co-processor. The system drives the mass-flow controllers through analog outputs and analog inputs and the electromagnetic valves through digital outputs. The hardware is controlled by a program developed in C + + . The user may define any number of mea- surement cycles under any chosen gas flow and tem- perature values. Similar systems were found to be very helpful for the analysis of sensor characteristics [12]. The block diagram of this system is shown in Fig. 2.
All sensors have been tested according to the following experimental procedure:
(a) the temperature of the devices under test (DUTs) was raised to 350 “C and kept at this level for about an hour in a continuous flow of dry zero-grade air of a predetermined flow rate;
(b) the sample temperature was decreased to the required value for the experiment and kept at that value for one hour before CO diluted in zero-grade air was introduced into the chamber.
(c) CO was introduced into the chamber for one hour, together with the appropriate flow of dry zero- grade air.
(d) dry zero-grade air was introduced in order to study the recovery of the samples.
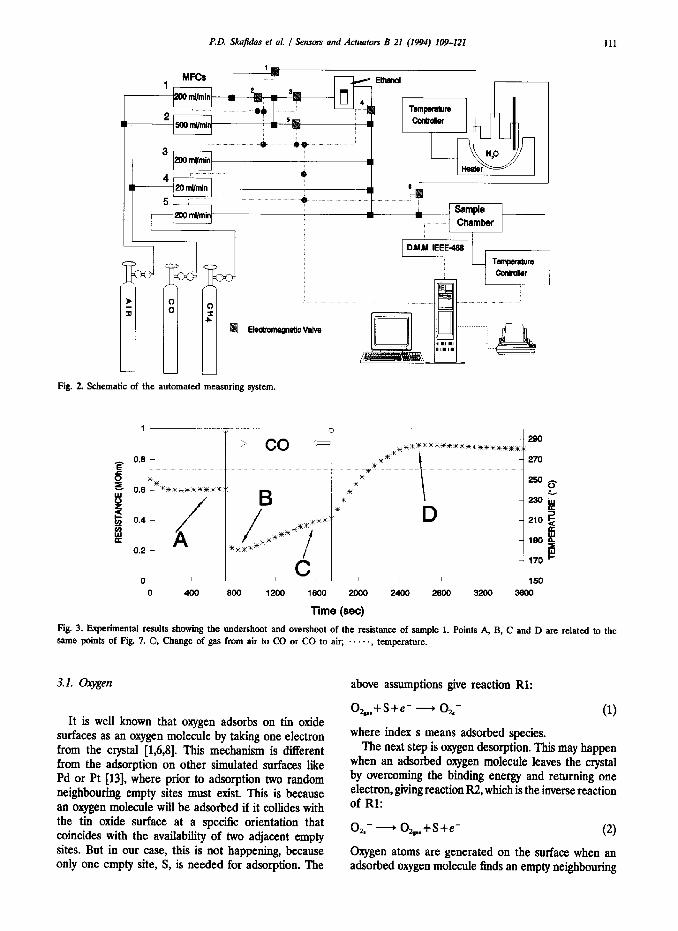
All experiments were carried out with 3000 ppm CO and zero-grade air in a continuous total flow of 200 ml/min in a chamber of about 920 cm3 volume with the. forementioned procedure. Results like the ones shown in Figs. 3-5 were obtained. From these, it is clear that undershoot of the resistance after exposure to CO or overshoot after CO removal are typical in sample 1 produced from paste 1. On the other hand, a very long recovery time was observed for samples 2 and 3, produced from paste 2, as shown in Fig. 4. Fig. 5 shows results from samples 2 and 3 at a lower temperature, where poisoning of the surface is expected to take place.
3. The model
In order to simulate the chemical processes that may occur on a tin oxide surface, a set of well-established reactions has been adopted and their dependence on surface coverage has been taken into consideration. There are two types of reactions generally accepted: (a) the adsorption and desorption mechanisms; (b) the reactions between adsorbed species. The first type is related to three gases: oxygen, carbon monoxide (only adsorption) and carbon dioxide (only desorption). The second type is related to some bidentate or unidentate carbonate intermediate species. A detailed description of the reactions assumed is given in the following.
112 P.D. Skafidas et OL J Sensors and Actuokm B 21 (1994) 109-121
390
370
350
330
310
290
270
L__ 250 0 1.2 2.4 3.6 4.0 6 7.2 8.4 9.6 10.0
Time (1OOOxsec)
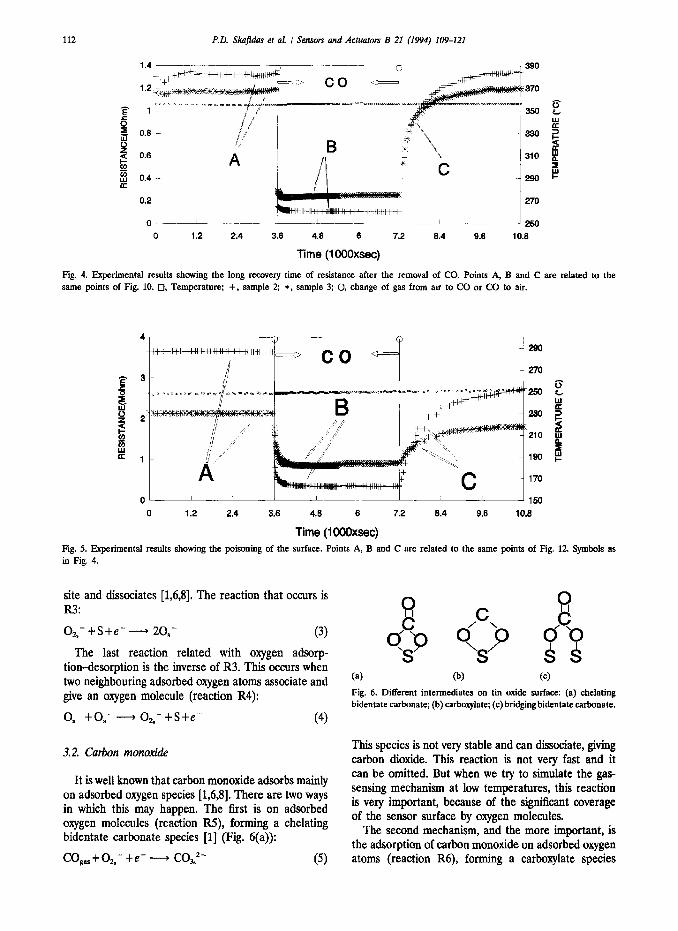
Fig. 4. Experimental results showing the long recovery time of resistance after the removal of CO. Points A, B and C are related to the same points of Fig. 10. 0, Temperature; +, sample 2; *, sample 3; 0, change of gas from air to CO or CO to air.
Fig. 5.
150 0 1.2 2.4 3.6 4.8 6 7.2 8.4 9.6 10.8
Time (1 OODxsec) Experimental results showing the poisoning of the surface. Points A, B and C are related to the same points of Fig. 12.
in Fig. 4.
site and dissociates [1,6,8]. The reaction that occurs is R3:
oz,- +s+e- - zo,- (3) The last reaction related with oxygen adsorp-
tion-desorption is the inverse of R3. This occurs when two neighbouring adsorbed oxygen atoms associate and give an oxygen molecule (reaction R4):
o,- +o,- - o*.- +s+e- (4)
3.2. Carbon monoxide
It is well known that carbon monoxide adsorbs mainly on adsorbed oxygen species [1,6,8]. There are two ways in which this may happen. The first is on adsorbed oxygen molecules (reaction RS), forming a chelating bidentate carbonate species [l] (Fig. 6(a)):
cogar+o*,- +e- - CO,‘- (5)
Symbols as
(a) @I w Fig. 6. Different intermediates on tin oxide surface: (a) chelating bidentate carbonate; (b) carboxylate; (c) bridgingbidentate carbonate.
This species is not very stable and can dissociate, giving carbon dioxide. This reaction is not very fast and it can be omitted. But when we try to simulate the gas- sensing mechanism at low temperatures, this reaction is very important, because of the significant coverage of the sensor surface by oxygen molecules.
The second mechanism, and the more important, is the adsorption of carbon monoxide on adsorbed oxygen atoms (reaction R6), forming a carboxylate species
P.D. Sk&as ef al. / Sensors and Actuators B 21 (1994) 109-121 113
[1,3,8] (Fig. 6(b)) that is very stable [3] up to 550 K:
co,,+o,- - co,- (6)
3.3. Carbon dioxide
It has already been mentioned that carboxylate species on tin oxide surfaces are very stable. But when an oxygen adatom is near a carboxylate species, it reacts (reaction R7):
CO,- + o,- - co3,a- (7)
A bridging bidentate carbonate [l] (Fig. 6(c)) is formed. This species is less stable than all other intermediates [l] and it is assumed that it leaves the surface hn- mediately, giving carbon dioxide and leaving behind an adsorbed oxygen atom.
Another mechanism responsible for the creation of carbon dioxide is the dissociation of the chelating bidentate carbonate. As mentioned previously, this is created either when carbon monoxide adsorbs on an oxygen molecule or when a carboxylate reacts with an adsorbed oxygen molecule that exists in a neighbouring site, giving reaction R8:
CO,- + O%- +e- - CO,,‘- +O,- -
CO,,,+20,- +e- (8)
Both bridging bidentate and chelating bidentate im- mediately leave the surface as soon as they are formed.
3.4. Other reactions
Additionally, two more chemical reactions have been taken into consideration in order to simulate the ex- istence of lattice oxygen on the surface of the sensors. Although reducing gases react with the lattice oxygen, this reaction has been found [3] to be negligible in comparison to the rate of reaction with the chemisorbed oxygen atoms. Adsorbed oxygen atoms may diffuse in and out of lattice sites, creating vacancies that play an important role in the gas-sensing mechanism. Intro- ducing the symbols ELS (empty lattice site) and OLS (oxygen lattice site), we have reactions R9 and RlO, respectively:
O.-+ELS- S+OLS (9)
S+OLS- O,- +ELS (10)
3.5. Assumptions of the model 3.5.1. Surface representation
The tin oxide surface is represented by a square matrix (L XL) of 10 000 active sites (L = 100). These sites may or may not be continuous (in two dimensions). In other words, the surface may be represented by a
uniform or a fractal two-dimensional array in order to meet the real dimensional&y of the crystal surface. Every site at the edge is considered (by modulo) to be a neighbouring site at the other edge (periodic boundary condition). In the case of a fractal surface, the reactions are simulated on incipient percolation clusters @PCs) on the square lattice. Since percolation theory is a rather well-established field in physics, we only briefly describe some properties of the IPCs that are essential for the understanding of the nature of the employed substrate (more details can be found in a number of reviews, such as [14]).
A cluster is defined as a group of sites connected by nearest-neighbour distances. Each site has a prob- ability, p, of entering the cluster or not. A percolating cluster is a cluster which has either its length or its width (or both) equal to L. It is well known that in the thermodynamic limit (L + m) there is a critical probability (PC) such that forp <pc there is no percolating cluster and for p=pS=0.5927 one intlnite percolation cluster, namely the IPC, abruptly appears for the first time. Theoretical results, obtained from both scaling arguments and Monte Carlo simulations, show that the fractal dimension of the IPCs is D, = 91i48 = 1.90. Due to their geometrical heterogeneities, such as branches, loops, dangling ends, etc., IPCs have been used for simulations of chemical reactions on rough surfaces. Also it is known that thin tllms, frequently employed in adsorption-reaction experiments, have percolation- cluster-like structures with a fractal dimension D,= 1.9 [15]. Both types of surfaces have been included in the simulation processes in order to represent both thick and thin films. It may be worth noting that a special characteristic of the above model for the crystal surface is homogeneity [16].
3.5.2. Adso@ion probabilities In order to take into account the effect of nearest
neighbours in the adsorption probabilities, a variable adsorption probability algorithm has been used. The adsorption probability is determined by three param- eters: the first is the fraction of each specific gas in the gas mixture; the second is the sticking coefficient of each candidate gas species, and the third is the surface coverage near the selected site. The first two parameters are easy to understand. As for the third parameter, if, for example, oxygen adsorption occurs, then one must decide if there are available electrons in the crystal in order that adsorption takes place. Because species already adsorbed act as electron ac- ceptors, adsorption is more difficult in surface areas with large coverage. On the other hand, experimental results have shown [lo] that carbon monoxide adsorption on adsorbed oxygen atoms is very closely related to surface coverage. To obtain this, we assign to every site five probability coefficients (that is, constant num-
114 P.D. S!u$das et al I &mm and Actiators B 21 (1994) 109-121
bers that are multiplied by the adsorption probability), corresponding to the five different values of the local coverage (the first is when no neighbour is occupied, the second is when one neighbour is occupied and the fifth is when all neighbours are occupied). This method has been found very useful, because one may change these coefficients very easily and, on the other hand, the calculation of probabilities may be performed very rapidly. On the contrary, the use of a mathematical expression would require a lot of computation time.
The adsorption probabilities also depend on the reduction of the surface. That is, the value of the ratio (tin atoms)/(oxygen atoms) on the surface plays an important role in gas adsorption [8]. As mentioned before, lattice oxygen atoms are included in the sii- ulation process in a dynamic way. It is then possible that surface areas with different values of (tin atoms)/ (oxygen atoms) exist. So, before adsorption, this local reduction is calculated. The physical basis for this is that the availability of electrons is higher in areas with fewer lattice oxygens, because lattice oxygen is generally assumed to be a strong acceptor of electrons.
At this point, the role of lattice oxygen in the ad- sorption mechanism must be examined in detail. Zemel [17] assumed that lattice oxygen plays an important direct role in this process. He assumed that surface Schottky defects are neutral and become negatively charged when they are occupied by oxygen drawn from the gas phase, inducing a surface depletion layer. On the other hand, the increasing number of oxygen Schottky defects, due to the presence of reducing gases, will have the same effect on the conductivity of the samples according to the process described earlier. Although, this is reasonable, Munnix and Schmeits [18] showed that these defects have no effect on the con- ductivity, but they become active as electron donors as soon as they ditfuse into the bulk. Thus the rise time of the conductivity after CO exposure would be comparable to the time constant of oxygen diffusion inside the tin oxide lattice. In many thick films, we measured rise times of less than 6 s. Based on these, we represent the role of lattice oxygen in a different way. Although oxygen lattice vacancies are not taken into account as electron donors, they affect the sensing mechanism by modifying the rate of oxygen adsorption. Areas with a large number of oxygen vacancies are considered to be more attractive to oxygen. After ad- sorption, oxygen adatoms may diffise to lattice vacan- cies, making the area less attractive. The time constant of this effect is considered to be low. On the other hand, areas with a small number of oxygen vacancies are less attractive because of the small electron avail- ability. In that case, oxygen lattice atoms may ditfuse and become chemisorbed on the crystal surface, making the area more attractive. From the above, it is clear
that the adsorption probability depends strongly on surface oxygen vacancies.
Since the adsorption has a variable probability, we may assign constant probabilities for the desorption. This simplifies the algorithm, bearing in mind that unfavourable species are very dilficult to create, due to the complicated test performed before adsorption.
3.5.3. Reaction probabilities Various algorithms have been proposed to account
for surface reactions between adsorbed species. The most popular is that of infinite rate of reaction [19], according to which reaction occurs if any of the four neighbours of the selected site is available for reaction. This technique gives good results in the case of carbon monoxide oxidation on a catalyst, where only one re- action may occur. In our case, however, a number of different reactions may occur. All reactions are con- sidered to have a finite rate, to allow the study of transient effects, and a predefined probability, which is used as a criterion to select reaction priorities.
3.5.4. Temperature effects In order to account for temperature effects, two
different models have been assumed, one for low and one for high temperatures. The set of reactions is the same, but reaction probabilities are different. One other parameter that is changed is that in the low-temperature model we assume that the carboxylate species is stable on the surface, but in the high-temperature model this species leaves the surface as soon as it is formed. Bidentate and chelating bidentate carbonate species, however, are considered to be unstable on the sensor surface in both low- and high-temperature models.
Thermal ditfusion of surface species modifies the results obtained, especially those that are related to cluster formation in Langmuir-Hinshelwood (L-H) cat- alytic reactions [15]. In our work, however, the dhfusion mechanism has been neglected for two reasons: the first is that the L-H reaction model is not the dominant mechanism on tin oxide, since carbon monoxide is not considered to adsorb on active sites; the second is the well-known ionic state of tin oxide, which does not permit significant diffusion rates [20].
One last characteristic of the present model is that the probability of an adsorption reaction has not only to do with the sticking coefficient of the specific gas on the tin oxide surface but also with the fraction of that gas in the gas mixture. This makes the simulation process very powerful, because the rates of adsorption are related to the reaction rates on the surface of the resistive gas sensor.
P.D. Sk&h et al. I Smcors and Achulors B 21 (1994) 109-121 115
4. The algorithm
Some symbols are defined first, in order to simplify the expressions of the calculated probabilities. These symbols, with their meanings are:
A, i = 1, . . 10 Calculated rate of reaction i. The cal- culation of each rate takes into account all the assumptions mentioned above.
The following 6, symbols represent the content of a site:
s,
8 OA
6 OM
&
Equals 1 if the selected site is empty or 0 otherwise. Equals 1 if the selected site is occupied by an oxygen atom or 0 otherwise. Equals 1 if the selected site is occupied by an oxygen molecule or 0 otherwise. Equals 1 if the selected site is occupied by a carboxylate or 0 otherwise.
The following 6n, symbols represent the content of neighbouring sites:
Sk
snoM
SSE
SSO
pi, i-l...10 PO
Equals 1 if there is at least one empty neighbouring site to the selected site or 0 otherwise. Equals 1 if there is a least one oxygen atom neighbour to the selected site or 0 otherwise. Equals 1 if there is at least one oxygen molecule neighbour to the selected site or 0 otherwise. Equals 1 if there is at least one car- boxylate neighbour to the selected site or 0 otherwise. Equals 1 if there is a lattice oxygen vacancy near the selected site or 0 oth- erwise. Equals 1 if there is a lattice oxygen near the selected site or 0 otherwise. Probability of reaction Ri. Probability of nothing happening at the selected site.
After calculating the rates of each reaction, they are normalized to values from 0 to 1. This is done because only the relative rates are of interest. The expressions used to calculate the probabilities from the relative rates at a site are:
P*=hSE
p2 = hsm
p3 = A3[&dnE V &&d P4= A4SOASnOA
PS = ~,ka,
(11)
(12)
(13)
(14)
(15)
Ps = @OA (16) (17)
(18) p9= A$SE (19)
PIO= L,SSO (20)
Each time a site is randomly selected. Then according to the content of this site (if it is empty or has an oxygen atom, etc.), all S, symbols except one are changed to zero. Then, some of the probabilities pi are nulled, so it is not necessary to calculate the rates Ai for them. To understand better the way that the algorithm decides what action to take, an example of how it is obtained in the case of an empty site is described. In that case, all probabilities are nulled except pi, p3, plo, because all 8, symbols are zero except &, which is equal to 1. The first step is to calculate these probabilities. This is achieved by searching the neighbourn and finding the values of the Sn, symbols. The second step is to decide if something will happen at this site, which means that we have to calculate the probabilityp,. This is obtained by the following expression:
l -Po’P1 +P3 +pm-PIP3 -PIP10 -P3Plo+PlP3P10
(21)
This expression is the probability that the result of a random experiment belongs to the union of some as- pects. In our case, every reaction is considered as an appearance. Then, the probability of something hap- pening is the union of these aspects. At this state, a random number is generated. If this number is less than po, then the calculation is stopped and a new site is selected. If not, the problem that has to be solved is the possibility of the combination of two or more reactions. This is achieved by calculating the exclusive probabilities p’ for every one of the accepted reactions:
P’l=Plu -P3)(1 -Pm) (22)
p’3= (1 -PllP3u -p10) (23)
P’lo= (1 -PN -P3ho (24)
These are the probabilities of only one reaction hap- pening. The third step is to divide the space from 0 to 1 into three subspaces with lengths analogous to the above reaction probabilities. Then a random number between 0 and 1 is generated. According to which subspace this number belongs, the corresponding re- action is selected. Then, a new site is selected until all sites of the surface have been visited. Then, a Monte Carlo iteration step is completed. Dividing the time in units in such a way that in every unit only one reaction can happen, then we can relate the number of iterations to real time [15,19].
116 P.D. Skjidas et al. I Semm and Achukm B 21 (1994) If_%121
By changing the rates Ai we can simulate different processes and transient characteristics as well. Since Monte Carlo methods are steady-state simulations, this seems a little strange. But with the relationship men- tioned above between the real time and the MC it- erations, this may become possible.
5. Simulation results and discussion
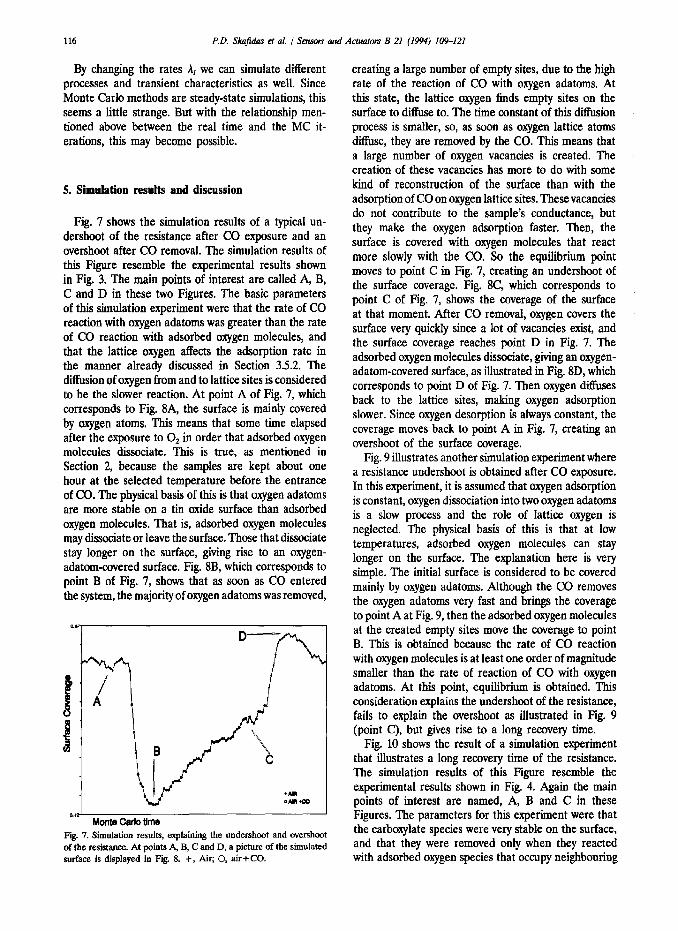
Fig. 7 shows the simulation results of a typical un- dershoot of the resistance after CO exposure and an overshoot after CO removal. The simulation results of this Figure resemble the experimental results shown in Fig. 3. The main points of interest are called A, B, C and D in these two Figures. The basic parameters of this simulation experiment were that the rate of CO reaction with oxygen adatoms was greater than the rate of CO reaction with adsorbed oxygen molecules, and that the lattice oxygen affects the adsorption rate in the manner already discussed in Section 3.5.2. The diffision of oxygen from and to lattice sites is considered to be the slower reaction. At point A of Fig. 7, which corresponds to Fig. 8A, the surface is mainly covered by oxygen atoms. This means that some time elapsed after the exposure to 0, in order that adsorbed oxygen molecules dissociate. This is true, as mentioned in Section 2, because the samples are kept about one hour at the selected temperature before the entrance of CO. The physical basis of this is that oxygen adatoms are more stable on a tin oxide surface than adsorbed oxygen molecules. That is, adsorbed oxygen molecules may dissociate or leave the surface. Those that dissociate stay longer on the surface, giving rise to an oxygen- adatom-covered surface. Fig. 8B, which corresponds to point B of Fig. 7, shows that as soon as CO entered the system, the majority of oxygen adatoms was removed,
D-
P
*Am *mace
Monte Carl0 time Fig. 7. Simulation results, expiaining the undershoot and overshoot of the resistance. At points A, B, C and D, a picture of the simulated surface is displayed in Fig. 8. +, Air; 0, air+CO.
creating a large number of empty sites, due to the high rate of the reaction of CO with oxygen adatoms. At this state, the lattice oxygen finds empty sites on the surface to diffuse to. The time constant of this diffusion process is smaller, so, as soon as oxygen lattice atoms diffuse, they are removed by the CO. This means that a large number of oxygen vacancies is created. The creation of these vacancies has more to do with some kind of reconstruction of the surface than with the adsorption of CO on oxygen lattice sites. Thesevacancies do not contribute to the sample’s conductance, but they make the oxygen adsorption faster. Then, the surface is covered with oxygen molecules that react more slowly with the CO. So the equilibrium point moves to point C in Fig. 7, creating an undershoot of the surface coverage. Fig. 8C, which corresponds to point C of Fig. 7, shows the coverage of the surface at that moment. After CO removal, oxygen covers the surface very quickly since a lot of vacancies exist, and the surface coverage reaches point D in Fig. 7. The adsorbed oxygen molecules dissociate, giving an oxygen- adatom-covered surface, as illustrated in Fig. 8D, which corresponds to point D of Fig. 7. Then oxygen diffuses back to the lattice sites, making oxygen adsorption slower. Since oxygen desorption is always constant, the coverage moves back to point A in Fig. 7, creating an overshoot of the surface coverage.
Fig. 9 illustrates another simulation experiment where a resistance undershoot is obtained after CO exposure. In this experiment, it is assumed that oxygen adsorption is constant, oxygen dissociation into two oxygen adatoms is a slow process and the role of lattice oxygen is neglected. The physical basis of this is that at low temperatures, adsorbed oxygen molecules can stay longer on the surface. The explanation here is very simple. The initial surface is considered to be covered mainly by oxygen adatoms. Although the CO removes the oxygen adatams very fast and brings the coverage to point A at Fig. 9, then the adsorbed oxygen molecules at the created empty sites move the coverage to point B. This is obtained because the rate of CO reaction with oxygen molecules is at least one order of magnitude smaller than the rate of reaction of CO with oxygen adatoms. At this point, equilibrium is obtained. This consideration explains the undershoot of the resistance, fails to explain the overshoot as illustrated in Fig. 9 (point C), but gives rise to a long recovery time.
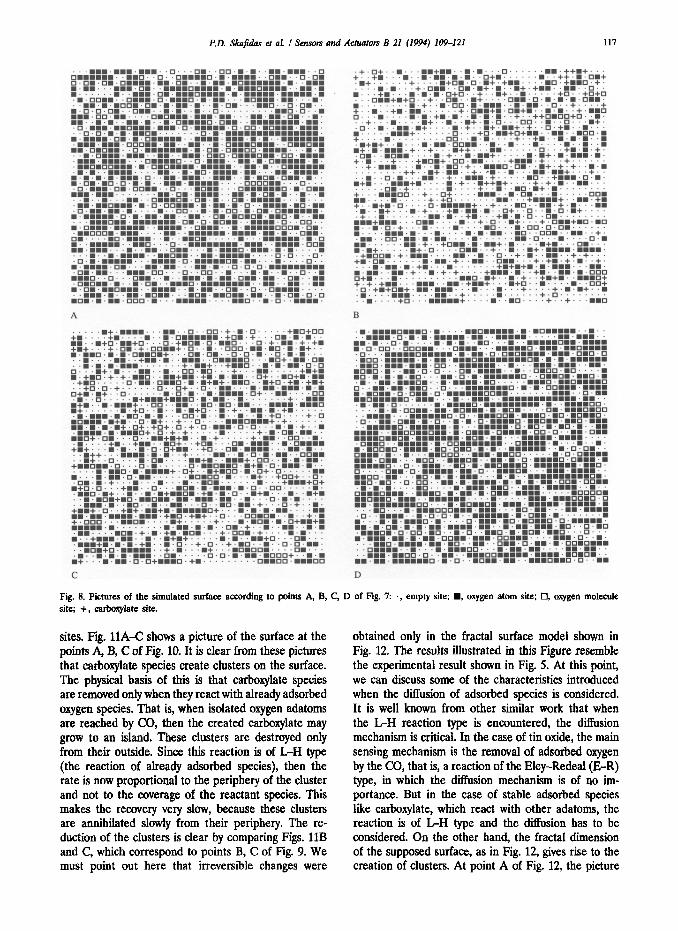
Fig. 10 shows the result of a simulation experiment that illustrates a long recovery time of the resistance. The simulation results of this Figure resemble the experimental results shown in Fig. 4. Again the main points of interest are named, A, B and C in these Figures. The parameters for this experiment were that the carboxylate species were very stable on the surface, and that they were removed only when they reacted with adsorbed oxygen species that occupy neighbouring
P.D. Shjidec et OL I Sensors and Actuators B 21 (1994) 109-121
C D
Fig. 8. Pictures of the simulated surface according to points A, B, C, D of Fig. 7: ., empty site; n , oxygen atom site; 0, oxygen molecule site; +, cuboxylate site.
sites. Fig. 11A-C shows a picture of tbe surface at the obtained only in tbe fractal surface model shown in points A, B, C of Fig. 10. It is clear from these pictures Fig. 12. Tbe results illustrated in this Figure resemble that carhoxylate species create clusters on the surface. the experimental result shown in Fig. 5. At this point, Tbe physical basis of this is that carboxylate species we can discuss some of the characteristics introduced are removed only when they react with already adsorbed when the dhTusion of adsorbed species is considered. oxygen species. That is, when isolated oxygen adatoms It is well known from other similar work that when are reached by CO, then the created carboxylate may the L-H reaction type is encountered, the diffusion grow to an island. These clusters are destroyed only mechanism is critical. In the case of tin oxide, the main from their outside. Since this reaction is of LH type sensing mechanism is the removal of adsorbed oxygen (the reaction of already adsorbed species), then the by the CO, that is, a reaction of tbe Eley-Redeal (E-R) rate is now proportional to the periphery of the cluster type, in which the diffusion mechanism is of no im- and not to the coverage of tbe reactant species. ‘Ibis portance. But in the case of stable adsorbed species makes tbe recovery very slow, because these clusters lie carboxylate, which react with other adatoms, the are annihilated slowly from their periphery. The re- reaction is of LH type and tbe diffusion has to be duction of the clusters is clear hy comparing Figs. 11B considered. On the other hand, the fractal dimension and C, which correspond to points B, C of Fig 9. We of the supposed surface, as in Fig. 12, gives rise to the must point out here that irreversible changes were creation of clusters. At point A of Fig. 12, the picture

118 P.D. Sk&as et aL I Sensors and Achuam B 21 (1994) 109421
Monte Carlo ttme Fig. 9. Simulation results showing a different explanation of the undershoot of the resistance, which fails to explain the overshoot. +, Air; 0, air+CO.
I ’ an’ 1
Manta cad0 time Fig. 10. Simulation results explaining the long recovery time of the resistance. Points A, B, C arc used in Fig. 11. +, Air; 0, air+CO.
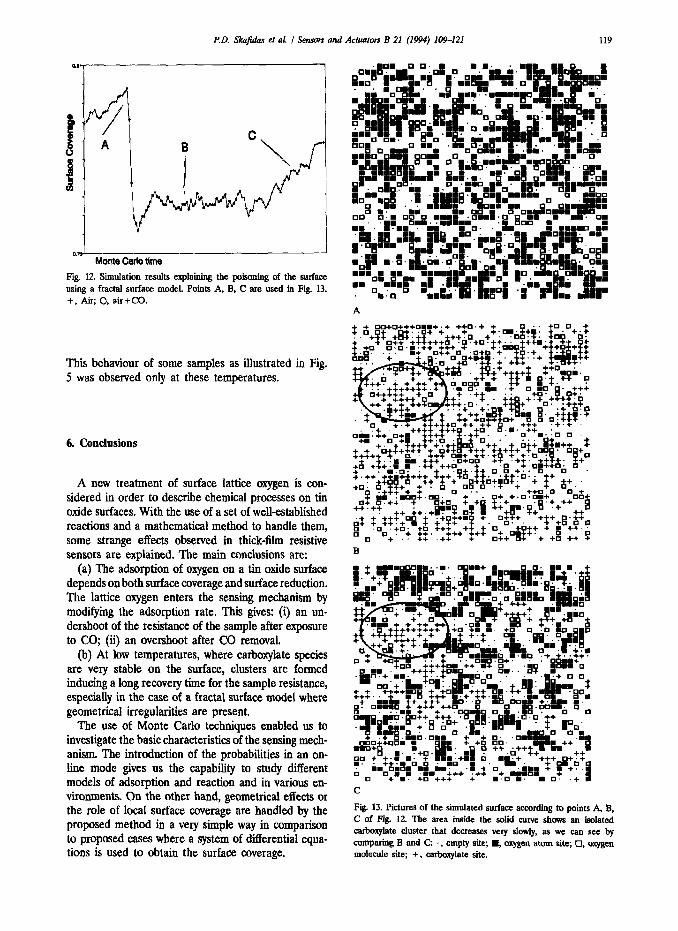
of the surface is illustrated at Fig. 13A. The surface is covered mainly by oxygen adatoms for the same reason discussed above. Fig. 13B, which corresponds to point B of Fig. 12, shows that large clusters of carboxylate species have been created. The most im- portant of these clusters are those covering regions that communicate with other regions through very nar- row channels of active sites. These clusters are very difficult to remove, because the adsorbed oxygen can reach the carboxylate species through these channels. An example of such a cluster is shown in Fig. 13B enclosed in a solid curve. Fig. 13C shows a picture of the surface that corresponds to point C of Fig. 12, i.e., a long time after the CO removal. The same cluster of interest is enclosed in a solid curve. By comparing Figs. 13B and C, the above-mentioned mechanism is clear. At this point it has to be mentioned that this is possible only at low temperatures (below 200 “C) where the carboxylate species are stable on the surface.
C
Fig. 11. Pictures of the simulated surface according to poink A, B, C of Fig. IO: ., empty site; n , oxygen atom site; 0, oxygen molecule site; +, carbxylate site.
RD. Skafidas et al. I Sensors and Actuators B 21 (NW} 109-121 119
_.- Monte Cetlo time
Fig. 12. Simulation results explaining the poisoning of the surface using a fractal surface model. Points A, Et, C are used in Fig. 13. +, Air, 0, air+CO.
This behaviour of some samples as illustrated in Fig. 5 was observed only at these temperatures.
6. Conclusions
A new treatment of surface lattice oxygen is con- sidered in order to describe chemical processes on tin oxide surfaces. With the use of a set of well-established reactions and a mathematical method to handle them, some strange effects observed in thick&n resistive sensors are explained. The main conclusions are:
(a) The adsorption of oxygen on a tin oxide surface depends on both surface coverage and surface reduction. The lattice oxygen enters the sensing mechanism by modiig the adsorption rate. This gives: (i) an un- dershoot of the resistance of the sample after exposure to CO; (ii) an overshoot after CO removal.
(b) At low temperatures, where carboxylate species are very stable on the surface, clusters are formed inducing a long recovery time for the sample resistance, especially in the case of a fractal surface model where geometrical irregularities are present.
The use of Monte Carlo techniques enabled us to investigate the basic characteristics of the sensing mech- anism. The introduction of the probabilities in an on- line mode gives us the capability to study different models of adsorption and reaction and in various en- vironments. On the other hand, geometrical effects or the role of local surface coverage are handled by the proposed method in a very simple way in comparison to proposed cases where a system of differential equa- tions is used to obtain the surface coverage.
Fii. 13. Pictures of the simulated surface according to points A, B, C of Fig. 12. The area inside the solid curve shows an isolated carboxylate cluster that decreases vety slowly, as we can see by comparing B and C: ., empty site; n , oxygen atom site; 0, oxygen molecule site; +, carboxylate site.

120 P.D. Skafkias et aL f Sensors and Achums B 21 (1994) 109-121
Acknowledgements Biographies
This work has been partly supported by the CEC BRITE/EURAM project No BREU-(X90.
The authom would like to thank IMEC (B) for providing the thick-film pastes.
P.D. Skafidus was born in Kalamata, Greece, in 1964. He received the B.E. degree in electrical engineering from the National Technical University of Athens in 1989. He is currently enrolled in the Ph.D. programme in electrical engineering at the National Technical University of Athens.
References
121
131
I41
PI
[71
PI
r91
PI
WI
WI
P31
P41
PSI
WI
WI
WI
I191
PI
M.J. Willett in P.T. Moo&y, J.O.W. Norris and D.E. Williams (eds.), Techniques and Meclmims in Ga.s Sending, IOP Pub- Iishiig, Bristol, 1991, Ch. 3, pp. 61-107. J.W. Erickson and S. Semancik, Surface conductivity in St-i4 (110): effects of oxygen, Surf: Sci. Len., 187 (1987) L658-L668. D. Kohl, Surface processes in the detection of reducing gases with SnOs-based devices, Sensors and Actuatam, I8 (1989) 71-113. D. Kohl, The role of noble metals in the chemistry of solid- state gas sensors, Scnrors and Achtaton, Bl (1990) 158-165. N. Yamasoe, Y. Kurokawa and T. Seiyama, Effects of additives on semiconductor gas sensors, Senrom and ACIUU~OIS, 4 (1983) 283-289. V. Lantto and P. Romppainen, Electrical studies on the reactions of CO with different oxygen species on Sn4 surfaces, Swf. Sci. 192 (1987) 243-264. P.T. Moseley, Materials selection for semiconductor gas sensors, Smuts and Achcolors B, 6 (1992) 149-156. J. Tamaki, M. Nagaishi, Y. Teraoka, N. Miura, N. Yamazoe, K. Moriya and Y. Nakamura, Adsorption behavior of CO and interfering gases on SnOe, SM Sci., 221 (1989) 183-196. H. Windischmann and P. Mark, A model for the operation of a thin-film SnOx conductance-modulation carbon monoxide sensor, J. Elecimchem. Sot., 126 (1979) 627-633. M. Nitta and M. Haradome, Oscillation phenomenon in thick- film CO sensor, IEEE Trans. Elecbvn Devices, ED-26 (1979) 219-223. MJ. Fuller and ME. Warwick, The catalytic oxidation of carbon monoxide on tin(IV) oxide, I. CataL, 29 (1973) 441-450. V. Demarne, A. Grisel, R. Sanjmes and F. Levy, Integrated semiconductor gas sensors evaluation with an automatic test system, Sensors and Actuators, Bl (1990) 87-92. RM. Zii, E. Guiari and Y. Barshad, Kinetic phase transitions in an irreversible surface-reaction model, Phys. Rev. Le., 56 (1986) 2553-2556. D. Staulfer, Scaling theory of percolation clusters, Phys Rep., 54 (1979) l-74. E. Albano, Monte-Carlo simulation of the oxidation of carbon monoxide on fractal surfaces, Sw$ Sci., 235 (1990) 351-359. A. Patrykiejew, Monte Carlo studies of adsorption III: localized monolayers on randomly heterogeneous surfaces, Thin Solid Ftims, 208 (1992) 189-196. J.N. Zemel, Theoretical description of gas-film interaction on S&x, Thin Solid Filme, 163 (1988) 189202. S. Munnis and M. Schmeits, Electronic structure of oxygen vacancies on TiOs (110) and SnO, (110) surfaces, J. Vat. Sci. Tech&, A5 (1987) 910-913. P. Araya, W. Pomd, R. Sant and E. Wolf, Monte Carlo simulations of carbon monoxide oxidation on Pt catalysts, Surf: sci. tirr., 208 (1989) L.8&L90. E. Fresat, K Darville and J. Gilles, Surface properties of tin dioxide single crystals, Surf: Sci., 226 (1983) 518-522.
Since 1991 he has been working for the National Technical University of Athens, Department of Elec- trical Engineering, Division of Computer Science, Mi- croelectronics Technology Laboratory as a research engineer. His research interests include automation and control, VLSI design and fabrication of solid-state gas sensors.
He is a student member of the IEEE.
D.S. Wuchos was born in Pireas, Greece, in 1967. He received the B.E. degree in electrical engineering from the National Technical University of Athens in 1991. He is currently enrolled in the Ph.D. programme in electrical engineering at the National Technical University of Athens.
Since 1992 he has been working for the National Technical University of Athens, Department of Elec- trical Engineering, Division of Computer Science, Mi- croelectronics Technology Laboratory as a research engineer. His research interests include modelling and simulation of gas-solid surface interactions, chemi- sorption theory and fabrication of solid-state gas sensors.
John Avaritsioti was born in Greece in 1948. He received his B.Sc.(Hon.) in physics from the Department of Physics of the University of Athens in 1972. His M.Sc. and Ph.D. degrees were obtained from Lough- borough University of Technology, UK, in 1974 and 1976, respectively, in the field of thin-film technology and fabrication of thin-film devices.
From 1976 to 1979 he was employed as a research fellow in the Thin Film Group of Loughborough Uni- versity of Technology. From 1980 to 1986 he was appointed lecturer at the Electronics Laboratory of Athens University, and in 1986 he was elected associate professor in the Department of Electrical Engineering of the National Technical University of Athens. In 1990 he was elected professor of microelectronics in the same department.
He has worked as a technical consultant to various British and Greek industrial firms for the incorporation of new thin&n deposition techniques in their pro- duction processes.
He has published over 30 technical articles in various scientific journals, and has presented more than three dozen papers at international conferences.
His research activities have been focused in the field of microelectronic materials and thin-film deposition

P.D. Skafidas et OL I Sensors and Achutors B 21 (EN) 109-121 121
techniques for use in the fabrication of semiconductor devices. His present research interests concern study of the electrical properties of thin insulating and sem- iconducting films deposited by sputtering, on-chip in- terconnections and MCMs for high-speed circuits, design of ASICs, development of fabrication processes
for the production of solid-state gas sensors and design and prototyping of smart sensors.
Professor Avaritsiotis is a member of the Editorial Advisory Board of the journal Active and Passive Electronic Components and a senior member of IEEE.