Modelling and Analysis of Central Metabolism Operating Regulatory Interactions in Salt Stress...
11
Modelling and Analysis of Central Metabolism Operating Regulatory Interactions in Salt Stress Conditions in a L- Carnitine Overproducing E. coli Strain Guido Santos 1 , Jose ´ A. Hormiga 1 , Paula Arense 2 , Manuel Ca ´ novas 2 , Ne ´ stor V. Torres 1 * 1 Departamento de Bioquı ´mica y Biologı ´a Molecular, Universidad de La Laguna, San Cristo ´ bal de La Laguna, Santa Cruz de Tenerife, Spain, 2 Departamento de Bioquı ´mica y Biologı ´a Molecular B, Universidad de Murcia, Murcia, Spain Abstract Based on experimental data from E. coli cultures, we have devised a mathematical model in the GMA-power law formalism that describes the central and L-carnitine metabolism in and between two steady states, non-osmotic and hyperosmotic (0.3 M NaCl). A key feature of this model is the introduction of type of kinetic order, the osmotic stress kinetic orders (g OSn ), derived from the power law general formalism, which represent the effect of osmotic stress in each metabolic process of the model. By considering the values of the g OSn linked to each metabolic process we found that osmotic stress has a positive and determinant influence on the increase in flux in energetic metabolism (glycolysis); L-carnitine biosynthesis production; the transformation/excretion of Acetyl-CoA into acetate and ethanol; the input flux of peptone into the cell; the anabolic use of pyruvate and biomass decomposition. In contrast, we found that although the osmotic stress has an inhibitory effect on the transformation flux from the glycolytic end products (pyruvate) to Acetyl-CoA, this inhibition is counteracted by other effects (the increase in pyruvate concentration) to the extent that the whole flux increases. In the same vein, the down regulation exerted by osmotic stress on fumarate uptake and its oxidation and the production and export of lactate and pyruvate are reversed by other factors up to the point that the first increased and the second remained unchanged. The model analysis shows that in osmotic conditions the energy and fermentation pathways undergo substantial rearrangement. This is illustrated by the observation that the increase in the fermentation fluxes is not connected with fluxes towards the tricaboxylic acid intermediates and the synthesis of biomass. The osmotic stress associated with these fluxes reflects these changes. All these observations support that the responses to salt stress observed in E. coli might be conserved in halophiles. Flux evolution during osmotic adaptations showed a hyperbolic (increasing or decreasing) pattern except in the case of peptone and fumarate uptake by the cell, which initially decreased. Finally, the model also throws light on the role of L-carnitine as osmoprotectant. Citation: Santos G, Hormiga JA, Arense P, Ca ´novas M, Torres NV (2012) Modelling and Analysis of Central Metabolism Operating Regulatory Interactions in Salt Stress Conditions in a L-Carnitine Overproducing E. coli Strain. PLoS ONE 7(4): e34533. doi:10.1371/journal.pone.0034533 Editor: Andrew Rowland Dalby, University of Westminster, United Kingdom Received December 10, 2011; Accepted March 1, 2012; Published April 13, 2012 Copyright: ß 2012 Santos et al. This is an open-access article distributed under the terms of the Creative Commons Attribution License, which permits unrestricted use, distribution, and reproduction in any medium, provided the original author and source are credited. Funding: This work was funded by research Grants from Spanish Ministerio de Ciencia e Innovacio ´ n (MICINN), Ref. No. BIO2008-04500-C02-01; BIO2008-04500- C02-02; BIO2011-29233-C02-01; BIO2011-29233-C02-02. Also from Agencia Canaria de Ciencia, Innovacio ´ n y Sociedad de la Informacio ´ n (ACIISI) Ref. PIL2070901 and Se ´neca Ref. 08660/PI/08. The funders had no role in study design, data collection and analysis, decision to publish, or preparation of the manuscript. Competing Interests: The authors have declared that no competing interests exist. * E-mail: [email protected] Introduction Stress responses and their underlying mechanisms are of foremost interest not only because they are critical for determining cell physiology and metabolism in such conditions but also because they reveal some conserved features that are largely independent of the organism [1]. Extensive investigation into E. coli stress responses [2–5] has shown that major components of the general and specific response regulate key cellular processes. However, most of the studies on the E. coli response to osmotic stress environmental changes refer to the transcription level. Despite some analyses [6–10], the mechanisms involved in the adaptation of the central and energy metabolism of bacteria to osmotic conditions remain largely unstudied. Important in this regard is the fact that, contrary to most cases where signaling is involved, the osmoregulation signals which eventually translates into changes in metabolism and physiology, are of a physicochemical rather that of chemical nature [11]. This paper deals with the osmoregulation of E. coli at the metabolic level; that is, the changes in metabolic processes which, prompted by signals associated with the new osmolarity conditions, occur during adaptation to increasingly saline environments. Important in this regard are some aspects that greatly determine the scope of our study. First, attention should be drawn to the distinction between the osmoregulatory mechanisms acting in the long term (when the system has reached a steady state in constant osmolarity conditions), and short term mechanisms, of a transient nature that occur in changing osmolarity conditions. Interestingly, little information is available concerning the long-term effects of salt stress exposure on the central metabolism of E. coli. In addition, in the case of hyperosmotic stress in E. coli, one well observed homeostatic mechanism is the synthesis of some osmoprotectants, non-toxic molecules that help compensate the osmotic pressure by accumulating in the intracellular medium. These osmoprotectants include K + , amino acids such as glutamate PLoS ONE | www.plosone.org 1 April 2012 | Volume 7 | Issue 4 | e34533
-
Upload
independent -
Category
Documents
-
view
3 -
download
0
Transcript of Modelling and Analysis of Central Metabolism Operating Regulatory Interactions in Salt Stress...

Modelling and Analysis of Central Metabolism OperatingRegulatory Interactions in Salt Stress Conditions in a L-Carnitine Overproducing E. coli StrainGuido Santos1, Jose A. Hormiga1, Paula Arense2, Manuel Canovas2, Nestor V. Torres1*
1 Departamento de Bioquımica y Biologıa Molecular, Universidad de La Laguna, San Cristobal de La Laguna, Santa Cruz de Tenerife, Spain, 2 Departamento de Bioquımica
y Biologıa Molecular B, Universidad de Murcia, Murcia, Spain
Abstract
Based on experimental data from E. coli cultures, we have devised a mathematical model in the GMA-power law formalismthat describes the central and L-carnitine metabolism in and between two steady states, non-osmotic and hyperosmotic(0.3 M NaCl). A key feature of this model is the introduction of type of kinetic order, the osmotic stress kinetic orders (gOSn),derived from the power law general formalism, which represent the effect of osmotic stress in each metabolic process of themodel. By considering the values of the gOSn linked to each metabolic process we found that osmotic stress has a positiveand determinant influence on the increase in flux in energetic metabolism (glycolysis); L-carnitine biosynthesis production;the transformation/excretion of Acetyl-CoA into acetate and ethanol; the input flux of peptone into the cell; the anabolicuse of pyruvate and biomass decomposition. In contrast, we found that although the osmotic stress has an inhibitory effecton the transformation flux from the glycolytic end products (pyruvate) to Acetyl-CoA, this inhibition is counteracted byother effects (the increase in pyruvate concentration) to the extent that the whole flux increases. In the same vein, the downregulation exerted by osmotic stress on fumarate uptake and its oxidation and the production and export of lactate andpyruvate are reversed by other factors up to the point that the first increased and the second remained unchanged. Themodel analysis shows that in osmotic conditions the energy and fermentation pathways undergo substantialrearrangement. This is illustrated by the observation that the increase in the fermentation fluxes is not connected withfluxes towards the tricaboxylic acid intermediates and the synthesis of biomass. The osmotic stress associated with thesefluxes reflects these changes. All these observations support that the responses to salt stress observed in E. coli might beconserved in halophiles. Flux evolution during osmotic adaptations showed a hyperbolic (increasing or decreasing) patternexcept in the case of peptone and fumarate uptake by the cell, which initially decreased. Finally, the model also throws lighton the role of L-carnitine as osmoprotectant.
Citation: Santos G, Hormiga JA, Arense P, Canovas M, Torres NV (2012) Modelling and Analysis of Central Metabolism Operating Regulatory Interactions in SaltStress Conditions in a L-Carnitine Overproducing E. coli Strain. PLoS ONE 7(4): e34533. doi:10.1371/journal.pone.0034533
Editor: Andrew Rowland Dalby, University of Westminster, United Kingdom
Received December 10, 2011; Accepted March 1, 2012; Published April 13, 2012
Copyright: � 2012 Santos et al. This is an open-access article distributed under the terms of the Creative Commons Attribution License, which permitsunrestricted use, distribution, and reproduction in any medium, provided the original author and source are credited.
Funding: This work was funded by research Grants from Spanish Ministerio de Ciencia e Innovacion (MICINN), Ref. No. BIO2008-04500-C02-01; BIO2008-04500-C02-02; BIO2011-29233-C02-01; BIO2011-29233-C02-02. Also from Agencia Canaria de Ciencia, Innovacion y Sociedad de la Informacion (ACIISI) Ref. PIL2070901and Seneca Ref. 08660/PI/08. The funders had no role in study design, data collection and analysis, decision to publish, or preparation of the manuscript.
Competing Interests: The authors have declared that no competing interests exist.
* E-mail: [email protected]
Introduction
Stress responses and their underlying mechanisms are of
foremost interest not only because they are critical for determining
cell physiology and metabolism in such conditions but also because
they reveal some conserved features that are largely independent
of the organism [1].
Extensive investigation into E. coli stress responses [2–5] has
shown that major components of the general and specific response
regulate key cellular processes. However, most of the studies on the
E. coli response to osmotic stress environmental changes refer to
the transcription level. Despite some analyses [6–10], the
mechanisms involved in the adaptation of the central and energy
metabolism of bacteria to osmotic conditions remain largely
unstudied. Important in this regard is the fact that, contrary to
most cases where signaling is involved, the osmoregulation signals
which eventually translates into changes in metabolism and
physiology, are of a physicochemical rather that of chemical
nature [11]. This paper deals with the osmoregulation of E. coli at
the metabolic level; that is, the changes in metabolic processes
which, prompted by signals associated with the new osmolarity
conditions, occur during adaptation to increasingly saline
environments.
Important in this regard are some aspects that greatly determine
the scope of our study. First, attention should be drawn to the
distinction between the osmoregulatory mechanisms acting in the
long term (when the system has reached a steady state in constant
osmolarity conditions), and short term mechanisms, of a transient
nature that occur in changing osmolarity conditions. Interestingly,
little information is available concerning the long-term effects of
salt stress exposure on the central metabolism of E. coli. In
addition, in the case of hyperosmotic stress in E. coli, one well
observed homeostatic mechanism is the synthesis of some
osmoprotectants, non-toxic molecules that help compensate the
osmotic pressure by accumulating in the intracellular medium.
These osmoprotectants include K+, amino acids such as glutamate
PLoS ONE | www.plosone.org 1 April 2012 | Volume 7 | Issue 4 | e34533

and proline, and trehalose and zwitterionic organic solutes like L-
carnitine, [12,13] a trimethylammonium compound well de-
scribed as osmoprotectant in this microorganism [14,15]. Further,
experimental evidence on the important role played by salt stress
on the energetic state and the main metabolic pathways of the cells
during metabolic biotransformations of trimethylammonium
compounds in E. coli has been shown [6].
Starting with the results of an anaerobic culture of a L-carnitine
E. coli overproducing strain subjected to an osmotic stress [10], we
have constructed a mathematical model which reproduces both
the non-osmotic and hyperosmotic steady states, as well as the
observed dynamic behavior of the transition between them. Our
aim was to quantify the signals and observed changes in fluxes; in
particular, we wished to contribute to the elucidation and
quantification of the response generated in E. coli by hyperosmotic
stress as regards the primary metabolism (central carbon) and its
relationship with the synthesis of an osmoprotectant, L-carnitine,
produced by a secondary metabolism.
Materials and Methods
Experimental MethodsThe experimental set up and data used to construct and verify
the model were taken from [10]. In the experimental set up used
by these authors, an L-carnitine overproducer E. coli (O44K74AS)
strain adapted to high salt concentration was used. After removal
of the storage medium, the bioreactor was operated in the
presence of this strain and a standard complex medium at a fixed
dilution rate. Once the initial steady state under standard salt
conditions (control, 0.085 M NaCl) was reached, a gradual
osmotic up-shift was carried out by feeding the culture with a
medium containing 0.3 or 0.5 M NaCl until a new, hyperosmotic
medium steady state was reached. This new steady state was
reached 70 h after switching the medium. This time period of
70 hours can be considered a long-term E. coli cell adaptation
period [10,16] since at least 12 generations were produced to keep
the cell population steady within the bioreactor. This number of
cell divisions meant that many changes and protein turn-overs, the
result of gene expressions and adaptations, had occurred to reach
the steady state within the reactor at the new salt concentration
[10]. The osmotic up-shift was carried out when the culture had
reached the steady state.
Mathematical modelingThe approach used to model this biochemical system involves
mathematical models in ordinary differential equations in the
power-law formalism. In this formalism [17] the processes that
conforms the biochemical networks are modelled using power-law
expansions in the variables of the system and are then included in
non-linear ordinary differential equations with the following
structure, called Generalized Mass Action (GMA):
dXidt
~P
j
c0j: P
p
k~1X
gjkk i~1, . . . ,nd ð1Þ
In Equation 1, Xi represents the model variables (concentrations of
compounds of the investigated network: metabolites, salt medium,
bacterial concentration, etc.), nd is the number of model variables,
and c’j (rate constants) and gjk (kinetic orders) are different kinds of
parameters defining the dynamics of the system. Unlike in
conventional kinetic models, where the kinetic orders are always
integer numbers, power-law models admit non-integer values.
In order to deal with the description and quantification of the
effect of the osmotic stress in the metabolic processes we use a new
type of kinetic order, the osmotic stress kinetic orders (gOSn),
derived from the power law general formalism. In the definition of
this system parameter, we follow a similar approach to that
presented by Fonseca et al. [18] for the study and quantification of
the temperature dependence of the system. While these authors
introduce a parameter that represents the change in enzymatic
activity brought about by an increase in temperature, our kinetic
orders (gOSn) represent the change caused by the osmotic stress.
In our case, the rate constants c’j can be expressed asc0j~kj:Ej ,
where kj depends on the properties of the molecular medium, such
as the pH, temperature or salt concentration (in our case only the
salt, kj~k0:fj(salt) and Ej is the enzyme concentration. The
enzyme concentration, Ej, under stress conditions also changes,
Ej~E0:hj(salt). Accordingly, c0j~k0
:fj(salt):E0:hj(salt). In the
phenomenological approach here proposed the effect of osmotic
stress in the rate constant and the enzyme activity is aggregated
into a single characteristic power-law term:
SaltgOSj~fj saltð Þ:hj saltð Þ
Therefore Equation 1 in the osmotic stress conditions under
consideration becomes:
dXi
dt~X
j
cj: P
p
k~1X
gjkk:Salt
gOSj i~1,:::,n d ð2Þ
The most notable property of these power-law equations is that
two such equations with the same structure can be used to describe
totally different dynamics (from inhibitory processes to the
description of cooperativity) simply by modifying the numerical
values of the kinetic orders involved [19]. Moreover, this type of
representation has been shown to be suitable and effective for the
modelling of dynamic signalling structures. It has been shown that
virtually any linear or non-linear system can be represented
accurately by a GMA of higher dimension through algebraic
equivalence transformations of variables in a process called
recasting [20].
Delay definition. A time-delay was applied to the model to
represent the different time scale between some distinct qualitative
processes within the cell (cell death, gene expression, etc.). This
delay was modeled using the linear chain trick [21], whereby the
delay was described using time-dependent fiction variables (in our
case, Delayname1 and Delayname2, where name is the name of the
variable to which the delay is applied). The features of distributed
time-delay (average value and standard deviation) depend on the
number of fictitious variables used and the value assigned to the
rate constant Kdelay. We noticed that more sophisticated strategies
are available to introduce time delay in ordinary differential
equation models (see for example, [22]). However, our initial
analysis indicated that the simple strategy used to model time-
delay was sufficient for our case study.
Parameter estimation. The numerical values for the
parameters ci and gjk are determined using an evolutionary
algorithm called simple genetic algorithm (SGA) adapted to
determine the values of parameters in power law models [23,24].
This algorithm starts with a population of individuals, which are
the set of parameters that generates a solution of the model. The
population is mutated and recombined; the convergence stems
from minimization of the value of the objective function (Fobj):
Fobj~Pnc
k~1
jckjzPnvar
j~1
Pntp
i~1
(xj(ti){xexpj (ti))
2
sj(ti)expj (ti)
2ð3Þ
Regulatory Interactions in Salt Stress Conditions
PLoS ONE | www.plosone.org 2 April 2012 | Volume 7 | Issue 4 | e34533

In Equation 3, nvarand ntp are the model variables and time points,
respectively; nc is the number of rate constants of the modelxj(ti)
and xexpj (ti)are the value of variable j at time i based on the
simulation of the model and the experimental data of the variable j
at time i, respectively; sj(ti) is the standard deviation of the
experimental value ofxexpj (ti). Furthermore, an additional term in
Equation 3 was introduced in order to obtain a more restrictive
objective function. This term is the sum of the c’s, in absolute
values, which allow the value of these parameters in the solutions
to be reduced. c is associated with the enzyme concentration; the
enzyme concentration (Pnc
k~1
jckj) is minimized in the data fitting
process.
The initial point integrating for the variables should be at the
same time an experimental and analytical steady state value. The
last condition is fulfilled by a set of system parameters satisfying
equations 3.
dXi(t~1)
dt~0 i~1, . . . ,nd ð4Þ
In the search for a solution, SGA was run through 10,000 iterations
using the 0.3 M salt concentration time series data. Initially, a first set of
cj and gjk parameters was found within the range searched (cj = [0, 20];
gjk = [23, 3]), showing a low value of Fobj. Then, the previously
obtained parameter solution was used in the subsequent searches
within a 95% of the first solution, the Fobj between 25% and 60% of the
initial Fobj in all cases.
Stability analysis. All eligible solutions should show initial
and final stable steady states. The stability of the steady states was
checked by analyzing the behavior of the model against small
perturbations.
Dynamic sensitivity analysis. Sensitivity analysis is a
general analysis tool useful for evaluating robustness and
characterizing system dynamics. Since our model studies the
system dynamics, it is possible to identify those parameters with a
major influence on the transient dynamics. For this purpose we
used a modified version of previously defined dynamic sensitivity
[24], the System Dynamic Sensitivity, SpkXi, as indicated in
equation 5:
SXipk(Xi,pk)~sgn
Ak,2{Ak
pk,2{pk
� �Dk
pk,2{pkj jpk
ð5Þ
In the above expression, Xi is the considered variable, while pk is
the parameter under scrutiny. Ak,2 is the area below the solution
curve, after a change of pk to pk,2. Ak is the area under the solution
curve using the original value pk. Dk is the area between the two
solution curves, using pk and pk,2, respectively. We have
considered changes in two kinds of parameter, the kinetic orders
and the rate constants. The SpkXi value corresponds to the
variation of the area under the variable time course after
perturbation in parameter space. For each model variable the
absolute values of the area Ak, Ak2 and Dk were calculated using the
trapezoidal method. Positive sensitivity means that the area under
the OnewO curve is greater than the area under the original curve
i.e. that the parameter pk has a positive influence on variable Xi.
Negative sensitivity means the opposite. Zero sensitivity means
that small changes in the parameter have no influence on the
variable. All sensitivities were computed for standardized
variables.
Figure 1. Schematic representation of the central metabolism of a L-carnitine overproducing E. coli strain applicable both to normaland osmotic stress conditions. Solid lines represent rate processes and dotted arrows represent regulatory interactions. The empty arrowrepresents the output flux of biomass. The ‘‘clock’’ symbols represent a time-delay in a process whose value is a parameter estimated during themodel calibration. The OS boxes represent the influence of the osmotic stress on the flux rate. See text for detail.doi:10.1371/journal.pone.0034533.g001
Regulatory Interactions in Salt Stress Conditions
PLoS ONE | www.plosone.org 3 April 2012 | Volume 7 | Issue 4 | e34533
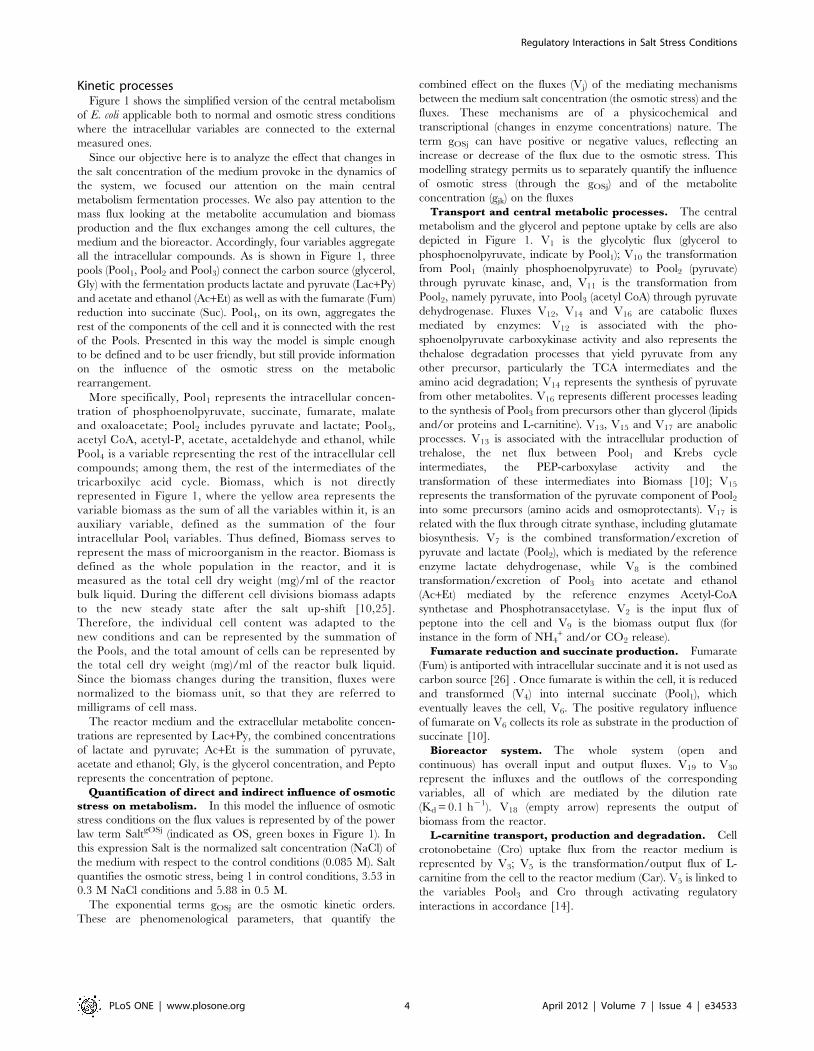
Kinetic processesFigure 1 shows the simplified version of the central metabolism
of E. coli applicable both to normal and osmotic stress conditions
where the intracellular variables are connected to the external
measured ones.
Since our objective here is to analyze the effect that changes in
the salt concentration of the medium provoke in the dynamics of
the system, we focused our attention on the main central
metabolism fermentation processes. We also pay attention to the
mass flux looking at the metabolite accumulation and biomass
production and the flux exchanges among the cell cultures, the
medium and the bioreactor. Accordingly, four variables aggregate
all the intracellular compounds. As is shown in Figure 1, three
pools (Pool1, Pool2 and Pool3) connect the carbon source (glycerol,
Gly) with the fermentation products lactate and pyruvate (Lac+Py)
and acetate and ethanol (Ac+Et) as well as with the fumarate (Fum)
reduction into succinate (Suc). Pool4, on its own, aggregates the
rest of the components of the cell and it is connected with the rest
of the Pools. Presented in this way the model is simple enough
to be defined and to be user friendly, but still provide information
on the influence of the osmotic stress on the metabolic
rearrangement.
More specifically, Pool1 represents the intracellular concen-
tration of phosphoenolpyruvate, succinate, fumarate, malate
and oxaloacetate; Pool2 includes pyruvate and lactate; Pool3,
acetyl CoA, acetyl-P, acetate, acetaldehyde and ethanol, while
Pool4 is a variable representing the rest of the intracellular cell
compounds; among them, the rest of the intermediates of the
tricarboxilyc acid cycle. Biomass, which is not directly
represented in Figure 1, where the yellow area represents the
variable biomass as the sum of all the variables within it, is an
auxiliary variable, defined as the summation of the four
intracellular Pooli variables. Thus defined, Biomass serves to
represent the mass of microorganism in the reactor. Biomass is
defined as the whole population in the reactor, and it is
measured as the total cell dry weight (mg)/ml of the reactor
bulk liquid. During the different cell divisions biomass adapts
to the new steady state after the salt up-shift [10,25].
Therefore, the individual cell content was adapted to the
new conditions and can be represented by the summation of
the Pools, and the total amount of cells can be represented by
the total cell dry weight (mg)/ml of the reactor bulk liquid.
Since the biomass changes during the transition, fluxes were
normalized to the biomass unit, so that they are referred to
milligrams of cell mass.
The reactor medium and the extracellular metabolite concen-
trations are represented by Lac+Py, the combined concentrations
of lactate and pyruvate; Ac+Et is the summation of pyruvate,
acetate and ethanol; Gly, is the glycerol concentration, and Pepto
represents the concentration of peptone.
Quantification of direct and indirect influence of osmotic
stress on metabolism. In this model the influence of osmotic
stress conditions on the flux values is represented by of the power
law term SaltgOSj (indicated as OS, green boxes in Figure 1). In
this expression Salt is the normalized salt concentration (NaCl) of
the medium with respect to the control conditions (0.085 M). Salt
quantifies the osmotic stress, being 1 in control conditions, 3.53 in
0.3 M NaCl conditions and 5.88 in 0.5 M.
The exponential terms gOSj are the osmotic kinetic orders.
These are phenomenological parameters, that quantify the
combined effect on the fluxes (Vj) of the mediating mechanisms
between the medium salt concentration (the osmotic stress) and the
fluxes. These mechanisms are of a physicochemical and
transcriptional (changes in enzyme concentrations) nature. The
term gOSj can have positive or negative values, reflecting an
increase or decrease of the flux due to the osmotic stress. This
modelling strategy permits us to separately quantify the influence
of osmotic stress (through the gOSj) and of the metabolite
concentration (gjk) on the fluxes
Transport and central metabolic processes. The central
metabolism and the glycerol and peptone uptake by cells are also
depicted in Figure 1. V1 is the glycolytic flux (glycerol to
phosphoenolpyruvate, indicate by Pool1); V10 the transformation
from Pool1 (mainly phosphoenolpyruvate) to Pool2 (pyruvate)
through pyruvate kinase, and, V11 is the transformation from
Pool2, namely pyruvate, into Pool3 (acetyl CoA) through pyruvate
dehydrogenase. Fluxes V12, V14 and V16 are catabolic fluxes
mediated by enzymes: V12 is associated with the pho-
sphoenolpyruvate carboxykinase activity and also represents the
thehalose degradation processes that yield pyruvate from any
other precursor, particularly the TCA intermediates and the
amino acid degradation; V14 represents the synthesis of pyruvate
from other metabolites. V16 represents different processes leading
to the synthesis of Pool3 from precursors other than glycerol (lipids
and/or proteins and L-carnitine). V13, V15 and V17 are anabolic
processes. V13 is associated with the intracellular production of
trehalose, the net flux between Pool1 and Krebs cycle
intermediates, the PEP-carboxylase activity and the
transformation of these intermediates into Biomass [10]; V15
represents the transformation of the pyruvate component of Pool2into some precursors (amino acids and osmoprotectants). V17 is
related with the flux through citrate synthase, including glutamate
biosynthesis. V7 is the combined transformation/excretion of
pyruvate and lactate (Pool2), which is mediated by the reference
enzyme lactate dehydrogenase, while V8 is the combined
transformation/excretion of Pool3 into acetate and ethanol
(Ac+Et) mediated by the reference enzymes Acetyl-CoA
synthetase and Phosphotransacetylase. V2 is the input flux of
peptone into the cell and V9 is the biomass output flux (for
instance in the form of NH4+ and/or CO2 release).
Fumarate reduction and succinate production. Fumarate
(Fum) is antiported with intracellular succinate and it is not used as
carbon source [26] . Once fumarate is within the cell, it is reduced
and transformed (V4) into internal succinate (Pool1), which
eventually leaves the cell, V6. The positive regulatory influence
of fumarate on V6 collects its role as substrate in the production of
succinate [10].
Bioreactor system. The whole system (open and
continuous) has overall input and output fluxes. V19 to V30
represent the influxes and the outflows of the corresponding
variables, all of which are mediated by the dilution rate
(Kd = 0.1 h21). V18 (empty arrow) represents the output of
biomass from the reactor.
L-carnitine transport, production and degradation. Cell
crotonobetaine (Cro) uptake flux from the reactor medium is
represented by V3; V5 is the transformation/output flux of L-
carnitine from the cell to the reactor medium (Car). V5 is linked to
the variables Pool3 and Cro through activating regulatory
interactions in accordance [14].
Regulatory Interactions in Salt Stress Conditions
PLoS ONE | www.plosone.org 4 April 2012 | Volume 7 | Issue 4 | e34533

Model EquationsIn accordance with the model scheme shown in Figure 1, the
system model equations are as follows.
Mass Balance. The mass balance equations of the processes
take the following form:
dGly
dt~V21{V22{V1
dPepto
dt~V23{V24{V2
dCro
dt~V25{V26{V3
dFum
dt~V19{V20{V4
dCar
dt~V5{V28
dSuc
dt~V6{V27
dPool1
dt~V1zV4{V6{V10zV12{V13{VBPool1
dPool2
dt~V10{V7{V8zV14{V15{VBPool2
dPool3
dt~V11{V8zV16{V17{VBPool3
dPool4
dt~V2zV3{V5{V9zV13{V12zV15{V14zV17{
V16{VBPool4
dLaczPy
dt~V7{V29
dAczEt
dt~V8{V30
dSalt
dt~Kd
:(Saltmedium{Salt)
ð6Þ
As said above, biomass is the sum of Pooli (i = 1, 2, 3, 4). In
Figure 1, V18 represents the output of biomass, but since
biomass is a variable composed of four terms, V18 is the sum
of four biomass contributions coming from each one of
the internal variables of Pooli, namely VBPool1, VBPool2,
VBPool3 and VBPool4. Accordingly, these fluxes are
represented in the corresponding Pooli differential equations
(see Equations 6).
Saltmedium is the normalized concentration of salt with respect to
the control condition in the input medium to the reactor and Salt
as defined above.
Delay equations. The delay equations that describe the
longer temporal hierarchies of the enzyme expression processes
are modelled using a three-equation linear chain trick. Delay is
applied to the variable Biomass, which is the sum of the variables
of the model Pool1, Pool2, Pool3 and Pool4, so this delay is applied
to each of these variables as a proportional part of the biomass that
they conform (Equations 6).
dDelayPool11
dt~Kdelay
:(Pool1{DelayPool11)
dDelayPool21
dt~Kdelay
:(Pool2{DelayPool21)
dDelayPool31
dt~Kdelay
:(Pool3{DelayPool31)
dDelayPool41
dt~Kdelay
:(Pool4{DelayPool41)
dDelayPool12
dt~Kdelay
:(Pool1{DelayPool12)
dDelayPool22
dt~Kdelay
:(Pool2{DelayPool22)
dDelayPool32
dt~Kdelay
:(Pool3{DelayPool32)
dDelayPool42
dt~Kdelay
:(Pool4{DelayPool42)
Biomass~DelayPool12zDelayPool22zDelayPool32zDelayPool42
ð7Þ
Power law rate equations. The rate equations in power law
form corresponding to the different fluxes are:
V1~c1:Gly:Biomass:SaltgOS1 V19~Kdmmedium
V2~c2:Pepto:Biomass:SaltgOS2 V20~Kd
:Fum
V3~c3:Cro:Biomass:SaltgOS3 V21~Kd
:Glymedium
V4~c4:Fum:Biomass:Pool
g471 SaltgOS4 V22~Kd
:Gly
V5~c5:Pool4:Pool
g593:Crog53 :SaltgOS5 V23~Kd
:Peptomedium
V6~c6:Pool1:Fumg64 :SaltgOS6 V24~Kd
:Pepto
V7~c7:Pool2:SaltgOS7 V25~Kd
:Cromedium
V8~c8:Pool3:SaltgOS8 V26~Kd
:Cro
V9~c9:Pool
g9104
:SaltgOS9 V27~Kd:Suc
V10~c10:Pool
g1071
:SaltgOS10 V28~Kd:Car
V11~c11:Pool
g1182
:SaltgOS11 V29~Kd:(LaczPy)
V12~c12:Pool
g12104
:SaltgOS12 V30~Kd:(AczEt)
V13~c13:Pool
g1371
:SaltgOS13 VBPool1~
Pool1
Biomass:V18
V14~c14:Pool
g14104
:SaltgOS14 VBPool2~
Pool2
Biomass:V18
V15~c15:Pool
g1582
:SaltgOS15 VBPool3~
Pool3
Biomass:V18
V16~c16:Pool
g16104
:SaltgOS16 VBPool4~
Pool4
Biomass:V18
V17~c17:Pool
g1793
:SaltgOS17
V18~c18:Biomass1814:SaltgOS18
ð8Þ
System parameters and constants. In this model approach
the rate constants (cj) are associated with the net enzyme activity of
each process and are considered to remain constant. It should be
noted here that since the osmotic kinetic orders measures the effect
on the fluxes of the mechanisms that mediate between the osmotic
stress and the fluxes, they include in their values the effects on the
fluxes associated with the changes that occurs in enzymes
(concentration, effectors, coenzymes etc.). Kinetic orders (gjk)
Regulatory Interactions in Salt Stress Conditions
PLoS ONE | www.plosone.org 5 April 2012 | Volume 7 | Issue 4 | e34533
measure the effect of each variable on the flux Vj. Glymedium,
Peptonemedium, Cromedium and Fummedium are the concentration of
glycerol, peptone, crotonobetaine and fumarate in the input
medium to the reactor, respectively, which are kept constant.
Identifiability of solutions. Many set of parameters
showing similar values of the objective function were found. In
order to select the most representative ones, a selection criterion
was applied. The selection criterion used ensures that the fitting of
each variable is independent from the remaining variables. Since
the objective function can give solutions with a poor fitting in one
of the variables if another variable has a very good fit, the criterion
mentioned above eliminate these kinds of solutions. According
with this criterion only was admitted as solutions for the osmotic
steady state (0.3 M) those in which the values of the dependent
variables were within the range 61.5 SD of the experimental
values of osmotic steady state, except in the case of Lac+Py and
Car (63 SD) and Biomass (64.5 SD). The value of the ranges was
estimated from the standard deviation of the data.
Model validation. The model was validated using a new set
of data which were not used in the parameter fitting procedure.
This data were obtained at 0.5 M salt concentration. Solutions
obtained by fitting with the 0.3 M data were tested against the
experimental data obtained at 0.5 M NaCl. In these conditions the
only solutions admitted were those in which the dependent
variables were within the range 63 SD of the experimental values.
In the case of the variables Lac+Py and Car and Biomass the
range was 66 SD and 69 SD, respectively.
Results and Discussion
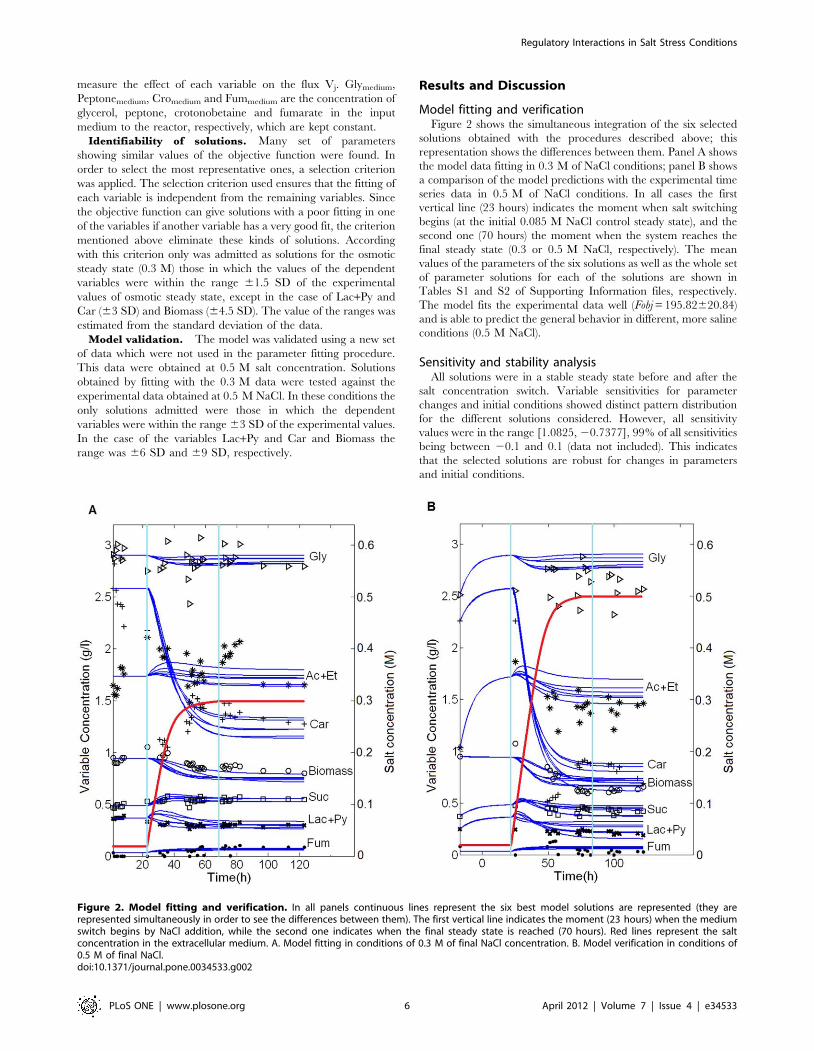
Model fitting and verificationFigure 2 shows the simultaneous integration of the six selected
solutions obtained with the procedures described above; this
representation shows the differences between them. Panel A shows
the model data fitting in 0.3 M of NaCl conditions; panel B shows
a comparison of the model predictions with the experimental time
series data in 0.5 M of NaCl conditions. In all cases the first
vertical line (23 hours) indicates the moment when salt switching
begins (at the initial 0.085 M NaCl control steady state), and the
second one (70 hours) the moment when the system reaches the
final steady state (0.3 or 0.5 M NaCl, respectively). The mean
values of the parameters of the six solutions as well as the whole set
of parameter solutions for each of the solutions are shown in
Tables S1 and S2 of Supporting Information files, respectively.
The model fits the experimental data well (Fobj = 195.82620.84)
and is able to predict the general behavior in different, more saline
conditions (0.5 M NaCl).
Sensitivity and stability analysisAll solutions were in a stable steady state before and after the
salt concentration switch. Variable sensitivities for parameter
changes and initial conditions showed distinct pattern distribution
for the different solutions considered. However, all sensitivity
values were in the range [1.0825, 20.7377], 99% of all sensitivities
being between 20.1 and 0.1 (data not included). This indicates
that the selected solutions are robust for changes in parameters
and initial conditions.
Figure 2. Model fitting and verification. In all panels continuous lines represent the six best model solutions are represented (they arerepresented simultaneously in order to see the differences between them). The first vertical line indicates the moment (23 hours) when the mediumswitch begins by NaCl addition, while the second one indicates when the final steady state is reached (70 hours). Red lines represent the saltconcentration in the extracellular medium. A. Model fitting in conditions of 0.3 M of final NaCl concentration. B. Model verification in conditions of0.5 M of final NaCl.doi:10.1371/journal.pone.0034533.g002
Regulatory Interactions in Salt Stress Conditions
PLoS ONE | www.plosone.org 6 April 2012 | Volume 7 | Issue 4 | e34533

Concentrations change in variablesFigure 3 shows the relative changes in variables concentrations
between the final (0.3 M NaCl) and the initial steady state. It can
be seen that the concentration of all the variables increased in
osmotic conditions. In particular Pool2 increased more than 6
times with respect to its value in nonosmotic conditions and Pool1and Fum doubled in concentration.
Kinetic order distribution for metabolic changes andosmotic stress
In previous studies [6,10] it was shown that, as a result of long-
term exposure to NaCl, the metabolism of E. coli adapts to stress
conditions, the adaptation being mediated by changes in enzyme
activities and cofactor levels. Integration of the experimental data
into a comprehensive model provides new evidences regarding the
actual flux distribution.
Figures 4A and 4B show the magnitude of the flux changes from
different perspectives. It can be seen that the fluxes showing the
increases in the 0.3 M steady state were V10 and V11. To a lesser
degree, V1, V2, V3, V4, V6, V8, V9, V12, V13, V14 and V15, also
decreased. Some fluxes (V5, V16 and V17) decreased when in
osmotic conditions while V7 remained practically unchanged.
Figure 4C show the estimated gOS kinetic orders. As stated
above the value of these parameters measure the effect of osmotic
stress on the corresponding fluxes. As can be seen, all of them are
within the [22, 2] range value. Those showing higher positive
values, indicating a major positive influence of the osmotic
conditions on the corresponding fluxes, are gOS2 (V2), gOS8 (V8),
gOS9 (V9), gOS10 (V10) and gOS14 (V14). Also positive but of minor
magnitude are gOS1 (V1), gOS3 (V3), gOS5 (V5), gOS12 (V12) and
gOS15 (V15). On the other hand, the gOS showing the greatest
negative values are gOS7 (V7) and gOS11 (V11). Negative too, but
less so, were: gOS6 (V6), gOS16 (V16) and gOS17 (V17). Parameters
gOS4 (V4) and gOS13 (V13) have zero values.
As stated above, the influence of osmotic stress conditions on the
flux values is represented by the term SaltgOSn. Examination of this
term in the context of each flux rate equation (see Equations 7)
allows us to analyse the magnitude and significance of the osmotic
associated interactions on each of the fluxes. The main results of
this section are summarized in Figure 4.
One observed change after the salt switch was the increase in
the flux V1. This flux is dependent on Gly and Salt and represents
the flux from external glycerol (Glymedium) to internal Pool1. The
corresponding kinetic order gOS1 is 0.3, meaning that the osmotic
stress has a moderate positive effect in the input of glycerol. Since
variable Gly remains constant (see Figure 2), we conclude that the
osmotic stress is responsible for this flux increase. This result shows
that there is a mechanism which relates osmotic stress with the
entrance and transformation of glycerol into Pool1.
Another result arises from the change in the fluxes V10 and V11.
V10, which increase its value in osmotic conditions, represents the
transformation from Pool1 to Pool2. Its value is dependent on
Pool1 and Salt through the kinetic orders g107 (1.6) and gOS10 (1.1),
respectively. Since both kinetic orders are positive and the values
of Pool1 and Salt are higher in osmotic conditions (Figure 3) the
positive influence of the osmotic stress must be added to the
positive effect of the other variables. A different situation is
observed in the case of V11, the flux representing the transforma-
tion from Pool2 to Pool3. V11 depends on Pool2 and Salt through
the kinetic orders g118 (1.7) and gOS11 (21.2), respectively. In this
case, despite the negative value of gOS11, V11 increased, the
positive effect of the combined Pool2 increased and its greater
kinetic order g118 being enough to compensate the negative
influence of SaltgOS11 term. It may be suggested that the increase
in V10 is to meet the energy requirements, while the increase in
V11 serves to compensate Pool2 accumulation. This would permit
increased energy synthesis in order to resist the selective pressure
imposed and would explain the increased rates of generation of
fermentation products.
V8, the combined transformation/excretion of Pool3 into
Ac+Et, reflects a different situation. This flux, which is dependent
on Pool3 and Salt through the kinetic orders 1 and gOS8 (1.6),
increases in osmotic conditions. In the stressed steady state, Pool3
Figure 3. Relative variable concentration changes. Mean values of the variables concentration changes for the selected solutions between thefinal, osmotic stress (0.3 M NaCl) and the initial steady state. Values were calculated as the ratio between the final and the initial steady states. Allvalues are normalized with respect to the initial steady state values.doi:10.1371/journal.pone.0034533.g003
Regulatory Interactions in Salt Stress Conditions
PLoS ONE | www.plosone.org 7 April 2012 | Volume 7 | Issue 4 | e34533

Regulatory Interactions in Salt Stress Conditions
PLoS ONE | www.plosone.org 8 April 2012 | Volume 7 | Issue 4 | e34533
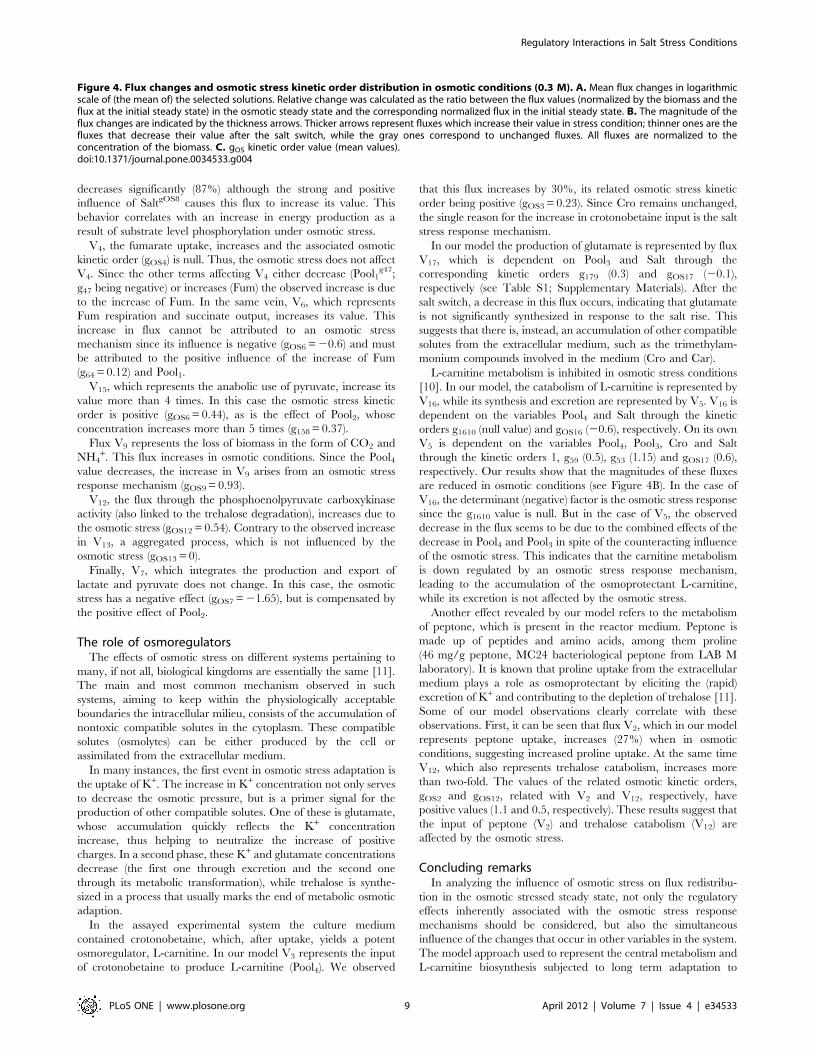
decreases significantly (87%) although the strong and positive
influence of SaltgOS8 causes this flux to increase its value. This
behavior correlates with an increase in energy production as a
result of substrate level phosphorylation under osmotic stress.
V4, the fumarate uptake, increases and the associated osmotic
kinetic order (gOS4) is null. Thus, the osmotic stress does not affect
V4. Since the other terms affecting V4 either decrease (Pool1g47;
g47 being negative) or increases (Fum) the observed increase is due
to the increase of Fum. In the same vein, V6, which represents
Fum respiration and succinate output, increases its value. This
increase in flux cannot be attributed to an osmotic stress
mechanism since its influence is negative (gOS6 = 20.6) and must
be attributed to the positive influence of the increase of Fum
(g64 = 0.12) and Pool1.
V15, which represents the anabolic use of pyruvate, increase its
value more than 4 times. In this case the osmotic stress kinetic
order is positive (gOS6 = 0.44), as is the effect of Pool2, whose
concentration increases more than 5 times (g158 = 0.37).
Flux V9 represents the loss of biomass in the form of CO2 and
NH4+. This flux increases in osmotic conditions. Since the Pool4
value decreases, the increase in V9 arises from an osmotic stress
response mechanism (gOS9 = 0.93).
V12, the flux through the phosphoenolpyruvate carboxykinase
activity (also linked to the trehalose degradation), increases due to
the osmotic stress (gOS12 = 0.54). Contrary to the observed increase
in V13, a aggregated process, which is not influenced by the
osmotic stress (gOS13 = 0).
Finally, V7, which integrates the production and export of
lactate and pyruvate does not change. In this case, the osmotic
stress has a negative effect (gOS7 = 21.65), but is compensated by
the positive effect of Pool2.
The role of osmoregulatorsThe effects of osmotic stress on different systems pertaining to
many, if not all, biological kingdoms are essentially the same [11].
The main and most common mechanism observed in such
systems, aiming to keep within the physiologically acceptable
boundaries the intracellular milieu, consists of the accumulation of
nontoxic compatible solutes in the cytoplasm. These compatible
solutes (osmolytes) can be either produced by the cell or
assimilated from the extracellular medium.
In many instances, the first event in osmotic stress adaptation is
the uptake of K+. The increase in K+ concentration not only serves
to decrease the osmotic pressure, but is a primer signal for the
production of other compatible solutes. One of these is glutamate,
whose accumulation quickly reflects the K+ concentration
increase, thus helping to neutralize the increase of positive
charges. In a second phase, these K+ and glutamate concentrations
decrease (the first one through excretion and the second one
through its metabolic transformation), while trehalose is synthe-
sized in a process that usually marks the end of metabolic osmotic
adaption.
In the assayed experimental system the culture medium
contained crotonobetaine, which, after uptake, yields a potent
osmoregulator, L-carnitine. In our model V3 represents the input
of crotonobetaine to produce L-carnitine (Pool4). We observed
that this flux increases by 30%, its related osmotic stress kinetic
order being positive (gOS3 = 0.23). Since Cro remains unchanged,
the single reason for the increase in crotonobetaine input is the salt
stress response mechanism.
In our model the production of glutamate is represented by flux
V17, which is dependent on Pool3 and Salt through the
corresponding kinetic orders g179 (0.3) and gOS17 (20.1),
respectively (see Table S1; Supplementary Materials). After the
salt switch, a decrease in this flux occurs, indicating that glutamate
is not significantly synthesized in response to the salt rise. This
suggests that there is, instead, an accumulation of other compatible
solutes from the extracellular medium, such as the trimethylam-
monium compounds involved in the medium (Cro and Car).
L-carnitine metabolism is inhibited in osmotic stress conditions
[10]. In our model, the catabolism of L-carnitine is represented by
V16, while its synthesis and excretion are represented by V5. V16 is
dependent on the variables Pool4 and Salt through the kinetic
orders g1610 (null value) and gOS16 (20.6), respectively. On its own
V5 is dependent on the variables Pool4, Pool3, Cro and Salt
through the kinetic orders 1, g59 (0.5), g53 (1.15) and gOS17 (0.6),
respectively. Our results show that the magnitudes of these fluxes
are reduced in osmotic conditions (see Figure 4B). In the case of
V16, the determinant (negative) factor is the osmotic stress response
since the g1610 value is null. But in the case of V5, the observed
decrease in the flux seems to be due to the combined effects of the
decrease in Pool4 and Pool3 in spite of the counteracting influence
of the osmotic stress. This indicates that the carnitine metabolism
is down regulated by an osmotic stress response mechanism,
leading to the accumulation of the osmoprotectant L-carnitine,
while its excretion is not affected by the osmotic stress.
Another effect revealed by our model refers to the metabolism
of peptone, which is present in the reactor medium. Peptone is
made up of peptides and amino acids, among them proline
(46 mg/g peptone, MC24 bacteriological peptone from LAB M
laboratory). It is known that proline uptake from the extracellular
medium plays a role as osmoprotectant by eliciting the (rapid)
excretion of K+ and contributing to the depletion of trehalose [11].
Some of our model observations clearly correlate with these
observations. First, it can be seen that flux V2, which in our model
represents peptone uptake, increases (27%) when in osmotic
conditions, suggesting increased proline uptake. At the same time
V12, which also represents trehalose catabolism, increases more
than two-fold. The values of the related osmotic kinetic orders,
gOS2 and gOS12, related with V2 and V12, respectively, have
positive values (1.1 and 0.5, respectively). These results suggest that
the input of peptone (V2) and trehalose catabolism (V12) are
affected by the osmotic stress.
Concluding remarksIn analyzing the influence of osmotic stress on flux redistribu-
tion in the osmotic stressed steady state, not only the regulatory
effects inherently associated with the osmotic stress response
mechanisms should be considered, but also the simultaneous
influence of the changes that occur in other variables in the system.
The model approach used to represent the central metabolism and
L-carnitine biosynthesis subjected to long term adaptation to
Figure 4. Flux changes and osmotic stress kinetic order distribution in osmotic conditions (0.3 M). A. Mean flux changes in logarithmicscale of (the mean of) the selected solutions. Relative change was calculated as the ratio between the flux values (normalized by the biomass and theflux at the initial steady state) in the osmotic steady state and the corresponding normalized flux in the initial steady state. B. The magnitude of theflux changes are indicated by the thickness arrows. Thicker arrows represent fluxes which increase their value in stress condition; thinner ones are thefluxes that decrease their value after the salt switch, while the gray ones correspond to unchanged fluxes. All fluxes are normalized to theconcentration of the biomass. C. gOS kinetic order value (mean values).doi:10.1371/journal.pone.0034533.g004
Regulatory Interactions in Salt Stress Conditions
PLoS ONE | www.plosone.org 9 April 2012 | Volume 7 | Issue 4 | e34533

osmotic stress conditions allows the influence of the osmotic stress
condition on fluxes to be quantified.
The model analysis shows that, after salt up-shift, the energy
and fermentation pathways in the central metabolism undergo
substantial rearrangement as they move towards an enhanced
energy production. This is the case of the increase observed in the
fermentative (V1, V2, V10, V11), anaplerotic (V12 and V13) and
succinate (V4 and V6; see [10]) fluxes. This is further illustrated by
the observation that the increase in the fermentation flux, V11
(from Pool2 to Pool3), is not connected with fluxes towards Pool4,
representing the tricaboxylic acid intermediates and the synthesis
of biomass. The values of the osmotic stress associated with these
fluxes reflect these changes.
Pyruvate kinase (V10) and Pyruvate dehydrogenase (V11), which
render pyruvate and acetyl-CoA, respectively, control energy
yields during growth [10]. In fact, the increase in Pyruvate kinase
activity is in good agreement with the observed increased glycerol
consumption (V1; gOS1), suggesting that glycolytic rates increased
as a consequence of stress towards fermentation (gOS2, gOS8, gOS9,
gOS10, and gOS14). On the other hand, under anaerobiosis, acetyl-
CoA is transformed to acetate (forming ATP) by phosphotransa-
cetylase-acetate kinase (Pta-Ack) pathway (V8 in our model, which
increases, see [27])
This would permit for increased energy synthesis to withstand
the osmotic stress and would explain the increased rates of
generation of fermentation products.
Furthermore, under anaerobic conditions, the TCA cycle (Pool1and Pool4) provides biosynthetic precursors. In osmotic stress
conditions, the activities of the controlling anaplerosis and
gluconeogenesis enzymes isocytrate lyase, phosphoenol pyruvate
carboxylase and phosphoenol pyruvate carboxykinase are altered
[10]. This demonstrates the effect of long-term salt stress as
regards cellular needs for anaplerotic intermediaries and energy
(Pool1 and Pool4, reversibly connected with Pool2). These
pathways allow the oxalacetate pool needed for biosynthesis to
be replenished (Pool1 node). Taken together, the model results
presented demonstrate the involvement of the biosynthetic
pathways in the adaptation to osmotic conditions, since they are
required for the production of cellular structural components.
Greater fluxes in the central energy-producing and anaplerotic
pathways have also been found in C. glutamicum when exposed to
increased osmolarity [28]. Interestingly, the model outcome
confirms the importance of acetate metabolism during long-term
exposure to salt and during stress adaptation.
Further, in the transition phase, osmotic adaptations of E. coli
metabolism translates into monotonic increases and decreases,
with the exception of peptone and fumarate uptake into the cell
which initially showed decreased concentrations.
Regarding the role of the osmoprotectant L-carnitine, we
conclude that its catabolism is negatively influenced by the osmotic
stress, while its synthesis and excretion is unaffected by any
osmotic stress response mechanism.
Supporting Information
Table S1 Mean parameters and SD values of theselected solutions.
(DOCX)
Table S2 System parameters value for six solutions.
(DOCX)
Acknowledgments
The authors gratefully acknowledge Dr. Carlos Gonzalez-Alcon and Hugo
Velasco-Bedran for helpful observations. The authors want to acknowledge
the excellent work done by one of the referees in evaluating the previous
versions of the manuscript. Their suggestions and comments have greatly
contributed to the improvement of this work.
Author Contributions
Conceived and designed the experiments: MC. Performed the experi-
ments: PA. Analyzed the data: GS JAH NVT. Contributed reagents/
materials/analysis tools: GS JAH MC NVT. Wrote the paper: NVT GS.
Model development: NVT GS. Parameter stimation, stability analysis and
dynamic sensitivity analysis: NVT GS JAH. Model analysis: NVT GS MC
PA.
References
1. Hengge-Aronis R (1999) Interplay of global regulatorsand cell physiologyin the
general stressresponse of Escherichia coli. Curr Opin in Microbiol 2: 148–152.
2. Chang DE, Smalley DJ, Conway T (2002) Gene expression profiling of
Escherichia coli growth transitions: an expanded stringent response model. Mol
Microbiol 45: 289–306.
3. Patten CL, Kirchhof MG, Schertzberg MR, Morton RA, Schellhorn HE (2004)
Microarray analysis of RpoS-mediated gene expression in Escherichia coli k-12.
Mol Genet Genomics 272: 580–591.
4. Gadgil M, Kapur V, Hu WS (2005) Transcriptional response of Escherichia coli
to temperature shift. Biotechnol Prog 21: 689–699.
5. Durfee T, Hansen AM, Zhi H, Blattner FR, Jin DJ (2008) Transcription
profiling of the stringent response in Escherichia coli. J Bacteriol 190: 1084–1096.
6. Canovas M, Bernal V, Sevilla A, Iborra JL (2006) Salt Stress Effects on the
Central and Carnitine Metabolism of Escherichia coli. Biotechnol Bioeng 96:
722–737.
7. Hengge-Aronis R (1996) Back to log phase: sigma(s) as a global regulator in the
osmotic control of gene expression in Escherichia coli. Mol Microbiol 21: 887–93.
8. Hengge-Aronis R (2002) Signal transduction and regulatory mechanisms
involved in control of the sigma(S) (RpoS) subunit of RNA polymerase.
Microbiol Mol Biol Rev 66: 373–95.
9. Brauer MJ, Yuan J, Bennett BD, Lu WY, Kimball E, et al. (2006) Conservation
of the metabolomic response to starvation across two divergent microbes. Proc
Natl Acad Sci USA 103: 19302–19307.
10. Arense P, Bernal V, Iborra JL, Canovas M (2010) Metabolic adaptation of
Escherichia coli to long-term exposure to salt stress. Proc Bio 45: 1459–1467.
11. Csonka LN, Hanson AD (1991) Prokaryotic osmoregulation: genetics and
physiology. Ann Rev Micro 45: 569–606.
12. Kappes RM, Bremer E (1998) Response of Bacillus subtilis to high osmolarity:
uptake of carnitine, crotonobetaine and gamma-butyrobetaine via the ABC
transport system OpuC. Microbiology-UK 144: 83–90.
13. Verheul A, Wouters JA, Rombouts FM, Abee T (1998) A possible role of ProP,ProU and CaiT in osmoprotection of Escherichia coli by carnitine. J Appl
Microbiol 85: 1036–46.
14. Canovas M, Sevilla A, Bernal V, Leal R, Iborra JL (2006) Role of energeticcoenzyme pools in the production of l-carnitine by Escherichia coli. Metab Eng 8:
603–18.
15. Bernal V, Sevilla A, Canovas M, Iborra JL (2007) Production of L-carnitine bysecondary metabolism of bacteria. Microb Cell Fact 6: 1–17.
16. Meynial Salles I, Forchhammer N, Croux C, Girbal L, Soucaille P (2007)
Evolution of a Saccharomyces cerevisiae metabolic pathway in Escherichia coli. Metab
Eng 9(2): 152–9.
17. Voit EO (2000) Computational Analysis of Biochemical Systems. Cambridge:
University Press. 531 p.
18. Fonseca LL, Sanchez C, Santos H, Voit EO (2011) Complex coordination ofmulti-scale response to environmental stress. Mol. BioSyst. 7: 731–741.
19. Vera J, Balsa-Canto E, Wellstead P, Banga JR, Wolkenhauer O (2007) Power-
Law models of signal transduction pathways. Cell Sig 19: 1531–1541.
20. Marin-Sanguino A, Voit EO, Gonzalez-Alcon C, Torres NV (2007) Optimi-zation of biotechnological systems through geometric programming. Theor Biol
Med Model 4: 38.
21. Macdonald N (1978) Time lags in Biological Models: Lecture Notes inBiomathematics. Springer-Varlag, Berlin-Heidelberg-New York. 468 p.
22. Mocek WT, Rudnicki R, Voit EO (2005) Approximation of delays in
biochemical systems. Math Biosci 198: 190–216.
23. Vera J, Bachman J, Pfeifer AC, Becker V, Hormiga JA, et al. (2008) A systemsbiology approach to analyse amplification in the JAK2-STAT5 signalling
pathway. BMC Syst Biol 2: 38.
24. Hormiga JA, Gonzalez-Alcon C, Sevilla A, Canovas M, Torres NV (2010)Quantitative analysis of the dynamic signaling pathway involved in the cAMP
mediated induction of L-carnitine biosynthesis in E. coli cultures. Mol BioSyst 6:
699–710.
Regulatory Interactions in Salt Stress Conditions
PLoS ONE | www.plosone.org 10 April 2012 | Volume 7 | Issue 4 | e34533
25. Bailey JE, Ollis DF (1986) Biochemical Engineering Fundamentals. McGraw-
Hill. Pg. pp 497–535.26. Zientz E, Six S, Unden G (1996) Identification of a third secondary carrier
(DcuC) for anaerobic C-4-dicarboxylate transport in Escherichia coli: Roles of the
three Dcu carriers in uptake and exchange. J Bacteriol 178: 7241–7247.
27. Kleman GL, Strohl WR (1994) Acetate metabolism by Escherichia coli in high-
cell-density fermentation. Appl Environ Microbiol 60(11): 3952–3958.28. Varela CA, Baez ME, Agosin E (2004) Osmotic stress response: Quantification
of cell maintenance and metabolic fluxes in a lysine-overproducing strain of
Corynebactetium glutamicum. Appl Environ Microbiol 70(7): 4222–4229.
Regulatory Interactions in Salt Stress Conditions
PLoS ONE | www.plosone.org 11 April 2012 | Volume 7 | Issue 4 | e34533