Expression of Carnitine Palmitoyl-Transferase 1 and 2 during mouse preimplantation development
13
Rend. Fis. Acc. Lincei s. 9, v. 14:217-229 (2003) Embriologia e morfogenesi. — Expression of Carnitine Palmitoyl-Transferase 1 and 2 during mouse preimplantation development. Nota di LUCA GENTILE, VITTORIO SEBASTIANO, VALERIA MERICO, MANUELA MONTI, MAURIZIO ZUCCOTTI, SILVIA GARA- GNA e CARLO ALBERTO REDI, presentata (*) dal Socio E. Capanna. ABSTRACT. — The metabolism of fatty acids represents an important energy source for early embryo- nic development. Our knowledge of the molecular basis that regulate this metabolism is very poor. In this study we have analysed the pattern of expression of Cpt-1 and Cpt-2 genes, that encode the enzymes CPT-1 and CPT-2, which play a role in long chain fatty acids transport inside the mitochondria. The data obtained from the RT-PCR analysis show a rapid reduction in the number of transcripts from antral oo- cyte to ovulated MII oocyte and a significant difference between the expression profiles of Cpt-1 and Cpt-2 genes during preimplantation development. Cpt-1 is first temporarily expressed at the G2 phase of 2-cell embryo, it disappears at the 4-cell stage and reappears consistently between the 8-cell and morula stage; Cpt-2 is expressed from the MII oocyte, decreases to very low level at the 8-cell stage and is actively transcribed from morula, where it abruptly increases its expression to reach its maximum at the blasto- cyst stage. Interestingly, the high expression of both Cpt-1 and Cpt-2 at the morula stage is correlated with an increasing profile of oxygen uptake and fatty acid oxidation found at this stage of development. Furthermore, this rise of transcription is concomitant with other important epigenetic changes occurring prior to embryo cavitation and involving a reorganisation of chromatin structure and DNA methylation. KEY WORDS: Preimplantation development; Fatty acids metabolism; Gene expression; Retro Tran- scriptase–Polymerase chain reaction. RIASSUNTO. — Espressione dei geni Carnitina Palmitoil-Transferasi 1 e 2 durante lo sviluppo preim- pianto di topo. Il metabolismo degli acidi grassi rappresenta una importante fonte di energia per l’em- brione nelle prime fasi di sviluppo preimpianto. Le conoscenze delle basi molecolari che regolano questo metabolismo sono molto scarse. In questo studio abbiamo analizzato il profilo di espressione dei geni Cpt-1 e Cpt-2, che traducono per gli enzimi CPT-1 e CPT-2, coinvolti nel trasporto degli acidi grassi a lunga catena all’interno dei mitocondri. I dati, ottenuti dall’analisi molecolare mediante la tecnica della RT-PCR, mostrano una notevole riduzione del numero dei trascritti tra oocita antrale e oocita ovulato in MII, ed una notevole differenza tra i profili di espressione di Cpt-1 e Cpt-2 durante lo sviluppo preim- pianto. Cpt-1 risulta essere temporaneamente espresso allo stadio di embrione a 2 cellule, è silente nel- l’embrione a 4 cellule e ricompare tra l’embrione a 8 cellule e lo stadio di morula; Cpt-2 è invece già espresso nell’oocita in MII, la sua espressione si riduce gradualmente fino a bassi livelli nell’embrione a 4 cellule, per poi tornare a essere attivamente trascritto nella morula, dove il numero di trascritti incremen- ta notevolmente fino a raggiungere il picco di espressione nella blastocisti. Significativo è il fatto che l’in- tensificazione dell’espressione genica di Cpt-1 e Cpt-2 allo stadio di morula è correlata con l’incremento nel consumo di ossigeno legato alla b-ossidazione degli acidi grassi in questo stesso stadio di sviluppo. Inoltre, questo aumento è concomitante con importanti fenomeni epigenetici che precedono la cavitazione del- l’embrione ed implicano la riorganizzazione della struttura della cromatina e la metilazione del DNA. INTRODUCTION Following fertilisation, the zygote goes through wide genome reorganisation and profound metabolic changes. Zygotic Genome Activation (ZGA) governs the transi- (*) Nella seduta del 14 febbraio 2003.
-
Upload
independent -
Category
Documents
-
view
1 -
download
0
Transcript of Expression of Carnitine Palmitoyl-Transferase 1 and 2 during mouse preimplantation development

Rend. Fis. Acc. Linceis. 9, v. 14:217-229 (2003)
Embriologia e morfogenesi. — Expression of Carnitine Palmitoyl-Transferase 1and 2 during mouse preimplantation development. Nota di LUCA GENTILE, VITTORIO
SEBASTIANO, VALERIA MERICO, MANUELA MONTI, MAURIZIO ZUCCOTTI, SILVIA GARA-GNA e CARLO ALBERTO REDI, presentata (*) dal Socio E. Capanna.
ABSTRACT. — The metabolism of fatty acids represents an important energy source for early embryo-nic development. Our knowledge of the molecular basis that regulate this metabolism is very poor. Inthis study we have analysed the pattern of expression of Cpt-1 and Cpt-2 genes, that encode the enzymesCPT-1 and CPT-2, which play a role in long chain fatty acids transport inside the mitochondria. The dataobtained from the RT-PCR analysis show a rapid reduction in the number of transcripts from antral oo-cyte to ovulated MII oocyte and a significant difference between the expression profiles of Cpt-1 andCpt-2 genes during preimplantation development. Cpt-1 is first temporarily expressed at the G2 phase of2-cell embryo, it disappears at the 4-cell stage and reappears consistently between the 8-cell and morulastage; Cpt-2 is expressed from the MII oocyte, decreases to very low level at the 8-cell stage and is activelytranscribed from morula, where it abruptly increases its expression to reach its maximum at the blasto-cyst stage. Interestingly, the high expression of both Cpt-1 and Cpt-2 at the morula stage is correlatedwith an increasing profile of oxygen uptake and fatty acid oxidation found at this stage of development.Furthermore, this rise of transcription is concomitant with other important epigenetic changes occurringprior to embryo cavitation and involving a reorganisation of chromatin structure and DNA methylation.
KEY WORDS: Preimplantation development; Fatty acids metabolism; Gene expression; Retro Tran-scriptase–Polymerase chain reaction.
RIASSUNTO. — Espressione dei geni Carnitina Palmitoil-Transferasi 1 e 2 durante lo sviluppo preim-pianto di topo. Il metabolismo degli acidi grassi rappresenta una importante fonte di energia per l’em-brione nelle prime fasi di sviluppo preimpianto. Le conoscenze delle basi molecolari che regolano questometabolismo sono molto scarse. In questo studio abbiamo analizzato il profilo di espressione dei geniCpt-1 e Cpt-2, che traducono per gli enzimi CPT-1 e CPT-2, coinvolti nel trasporto degli acidi grassi alunga catena all’interno dei mitocondri. I dati, ottenuti dall’analisi molecolare mediante la tecnica dellaRT-PCR, mostrano una notevole riduzione del numero dei trascritti tra oocita antrale e oocita ovulato inMII, ed una notevole differenza tra i profili di espressione di Cpt-1 e Cpt-2 durante lo sviluppo preim-pianto. Cpt-1 risulta essere temporaneamente espresso allo stadio di embrione a 2 cellule, è silente nel-l’embrione a 4 cellule e ricompare tra l’embrione a 8 cellule e lo stadio di morula; Cpt-2 è invece giàespresso nell’oocita in MII, la sua espressione si riduce gradualmente fino a bassi livelli nell’embrione a 4cellule, per poi tornare a essere attivamente trascritto nella morula, dove il numero di trascritti incremen-ta notevolmente fino a raggiungere il picco di espressione nella blastocisti. Significativo è il fatto che l’in-tensificazione dell’espressione genica di Cpt-1 e Cpt-2 allo stadio di morula è correlata con l’incrementonel consumo di ossigeno legato alla b-ossidazione degli acidi grassi in questo stesso stadio di sviluppo.Inoltre, questo aumento è concomitante con importanti fenomeni epigenetici che precedono la cavitazione del-l’embrione ed implicano la riorganizzazione della struttura della cromatina e la metilazione del DNA.
INTRODUCTION
Following fertilisation, the zygote goes through wide genome reorganisation andprofound metabolic changes. Zygotic Genome Activation (ZGA) governs the transi-
(*) Nella seduta del 14 febbraio 2003.

L. GENTILE ET AL.218
tion between maternal and embryonic regulation of development (Schultz, 1993) andis necessary for a correct development, since alterations in the pattern of zygotic geneexpression lead to the death of the embryo (Christians et al., 1995; Nothias et al.,1995).
This intense transcriptional activity of the newly formed embryonic genome (Ver-net et al., 1992; Bouniol et al., 1995; Aoki et al., 1997) occurs in conjunction with agradual degradation of maternal mRNAs stored during oocyte maturation in the ovary(Bachvarova, 1985). Simultaneously with changes in the pattern of gene expression,modifications in the embryonic metabolism take place (Wales, 1975; Bavister,1995).
This study will focus on the metabolism of fatty acids, which represent an impor-tant energy source for early embryonic development (Kane, 1979; Hillman and Flynn,1980), although very little is known about the regulation of the expression of thosegenes that are behind this metabolism.
Transport of Long Chain Fatty Acids (LCFA) is under control of Carnitine Palmi-toyl-Transferase 1 (CPT-1) and Carnitine Palmitoyl-Transferase 2 (CPT-2) enzymes,localised respectively on the external and internal mitochondrion membranes (Mc-Garry and Brown, 1997).
These enzymes regulate LCFA transit from the cytoplasmic compartment (whereLCFA are bound with specific binding proteins) to the mitochondrion matrix, thanksto esterification with carnitine (external membrane) and Coenzyme A (internal mem-brane). Once in the mitochondrion matrix, LCFA are oxidised with energy produc-tion. b-oxidation of LCFA is essential during cell differentiation (Bishop, 1971) andduring preimplantation (Hillman and Flynn, 1980) and peri-implantation (Paria et al.,1999) embryonic development. LCFA oxidation appears to be constant frommetaphase II oocytes to 8-cell embryos, whereas it increases from the latter stage up tothe blastocyst (Hillman and Flynn, 1980). Patterns of LCFA oxidation are consistentwith oxygen consumption which is relatively constant from the 1-cell to morula stagesand increases abruptly at the blastocyst stage (Houghton et al., 1996). Using a single-cell semi-quantitative Retro Transcriptase – Polymerase Chain Reaction (RT-PCR), inthis study we have analysed the expression profile of Cpt-1 and Cpt-2 genes through-out in vitro preimplantation development.
MATERIALS AND METHODS
Animals and chemicals.
Adult B6C3F1 (C57BL/6N 3 C3H/HeN) 5 month-old male and 5 week-old femalemice were purchased from Charles River (Como, Italy). Animals were maintained in atemperature- and humidity-controlled room with 12 hours light and 12 hours darkphases. Culture media were prepared from embryo tested reagents (Sigma Chemicalsco., Milano, Italy) and dissolved in Milli-Q Biocell water (Millipore, Milano,Italy).

EXPRESSION OF CARNITINE PALMITOYL-TRANSFERASE ... 219
Isolation of antral oocytes.
Females injected with 7.5 I.U. PMSG (Pregnant Mare Serum Gonadotropin) weresacrificed 48 hours after injection and antral oocytes were collected by puncturingovaries in M2 medium (Fulton and Whittingham, 1978).
Sperm isolation and induction of capacitation.
Sperm suspension for in vitro fertilisation (IVF) was prepared as described in Zuc-cotti et al. (1998). Briefly, punctured cauda epididymes were transferred to the bot-tom of a 5 ml tube, gently covered with 1.5 ml of Whittingham medium (Whitting-ham, 1971) and incubated at 37 7C under 5% CO2 in air. After 20 min a 400 ml drop ofthe upper part of the suspension was transferred to a 35 mm Petri dish and overlaidwith mineral oil. The drop was incubated at 37 7C under 5% CO2 in air for 40 min toallow sperm capacitation.
In vitro fertilisation and embryo culture.
Females were injected with 7.5 I.U. PMSG, followed, after 48 hours, by an injec-tion of 7.5 I.U. hCG (human Chorionic Gonadotropin). Females were sacrificed 15hours after hCG injection, oocytes were collected from the oviducts and cumulus cellswere removed by a brief exposition to 500 UE hyaluronidase in M2 medium. IVF wasperformed in a 100 ml drop of sperm suspension containing 2.0 3 106 spermatozoaand kept at 37 7C under 5% CO2 in air; the embryos were cultured in a 40 ml drop ofM16 medium (Whittingham, 1971) at 37 7C under 5% CO2 in air.
Samples collection.
One cell, 2-cell, 4-cell, 8-cell, morula and blastocyst embryos were collected at 6,32, 48, 56, 72 and 96 hours, respectively. Single antral oocytes, MII oocytes and em-bryos were transferred to the bottom of a 0.2 ml Eppendorf tube containing 1.5 mllysis buffer (Zuccotti et al., 2002) and analysed immediately. We have analysed atleast 10 individual oocytes or embryos for each of the developmental stagesconsidered.
RT-PCR.
Reagents and oligonucleotides for RT-PCR were purchased from Applera (Monza,Italy). The thermalcycler employed was a GeneAmp 9700 (Applera, Monza,Italy).
The relative amount of transcripts of the genes under study was determined usinga semi-quantitative single cell RT-PCR. This assay makes use of an exogenous(pAW109) and an endogenous (Hprt, Hypoxanthine phosphoribosyl transferase)RNAs as internal controls for the standardisation of the expression of the genes understudy. 2500 copies of pAW109 RNA were added to each sample, than retro-tran-scribed in 20 ml of the following reaction mixture (final concentration): 1 3 PCR
L. GENTILE ET AL.220
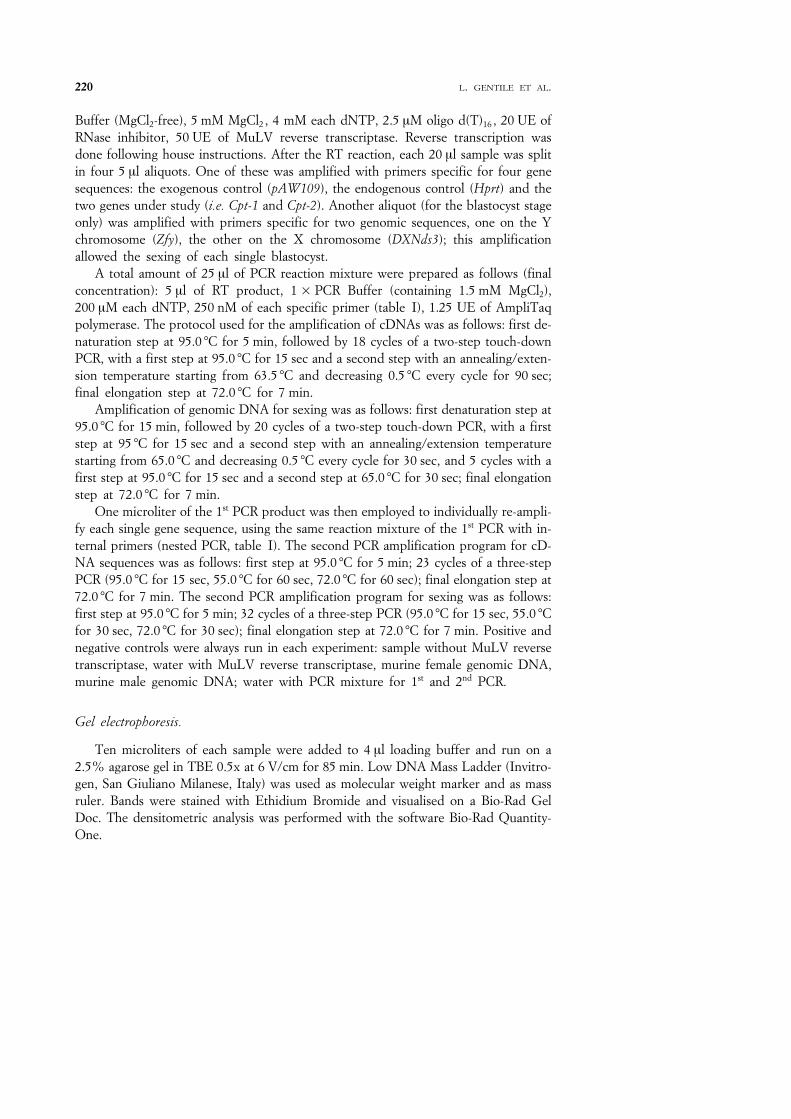
Buffer (MgCl2-free), 5 mM MgCl2 , 4 mM each dNTP, 2.5 mM oligo d(T)16 , 20 UE ofRNase inhibitor, 50 UE of MuLV reverse transcriptase. Reverse transcription wasdone following house instructions. After the RT reaction, each 20 ml sample was splitin four 5 ml aliquots. One of these was amplified with primers specific for four genesequences: the exogenous control (pAW109), the endogenous control (Hprt) and thetwo genes under study (i.e. Cpt-1 and Cpt-2). Another aliquot (for the blastocyst stageonly) was amplified with primers specific for two genomic sequences, one on the Ychromosome (Zfy), the other on the X chromosome (DXNds3); this amplificationallowed the sexing of each single blastocyst.
A total amount of 25 ml of PCR reaction mixture were prepared as follows (finalconcentration): 5 ml of RT product, 1 3 PCR Buffer (containing 1.5 mM MgCl2),200 mM each dNTP, 250 nM of each specific primer (table I), 1.25 UE of AmpliTaqpolymerase. The protocol used for the amplification of cDNAs was as follows: first de-naturation step at 95.0 7C for 5 min, followed by 18 cycles of a two-step touch-downPCR, with a first step at 95.0 7C for 15 sec and a second step with an annealing/exten-sion temperature starting from 63.5 7C and decreasing 0.5 7C every cycle for 90 sec;final elongation step at 72.0 7C for 7 min.
Amplification of genomic DNA for sexing was as follows: first denaturation step at95.0 7C for 15 min, followed by 20 cycles of a two-step touch-down PCR, with a firststep at 95 7C for 15 sec and a second step with an annealing/extension temperaturestarting from 65.0 7C and decreasing 0.5 7C every cycle for 30 sec, and 5 cycles with afirst step at 95.0 7C for 15 sec and a second step at 65.0 7C for 30 sec; final elongationstep at 72.0 7C for 7 min.
One microliter of the 1st PCR product was then employed to individually re-ampli-fy each single gene sequence, using the same reaction mixture of the 1st PCR with in-ternal primers (nested PCR, table I). The second PCR amplification program for cD-NA sequences was as follows: first step at 95.0 7C for 5 min; 23 cycles of a three-stepPCR (95.0 7C for 15 sec, 55.0 7C for 60 sec, 72.0 7C for 60 sec); final elongation step at72.0 7C for 7 min. The second PCR amplification program for sexing was as follows:first step at 95.0 7C for 5 min; 32 cycles of a three-step PCR (95.0 7C for 15 sec, 55.0 7Cfor 30 sec, 72.0 7C for 30 sec); final elongation step at 72.0 7C for 7 min. Positive andnegative controls were always run in each experiment: sample without MuLV reversetranscriptase, water with MuLV reverse transcriptase, murine female genomic DNA,murine male genomic DNA; water with PCR mixture for 1st and 2nd PCR.
Gel electrophoresis.
Ten microliters of each sample were added to 4 ml loading buffer and run on a2.5% agarose gel in TBE 0.5x at 6 V/cm for 85 min. Low DNA Mass Ladder (Invitro-gen, San Giuliano Milanese, Italy) was used as molecular weight marker and as massruler. Bands were stained with Ethidium Bromide and visualised on a Bio-Rad GelDoc. The densitometric analysis was performed with the software Bio-Rad Quantity-One.
EXPRESSION OF CARNITINE PALMITOYL-TRANSFERASE ... 221
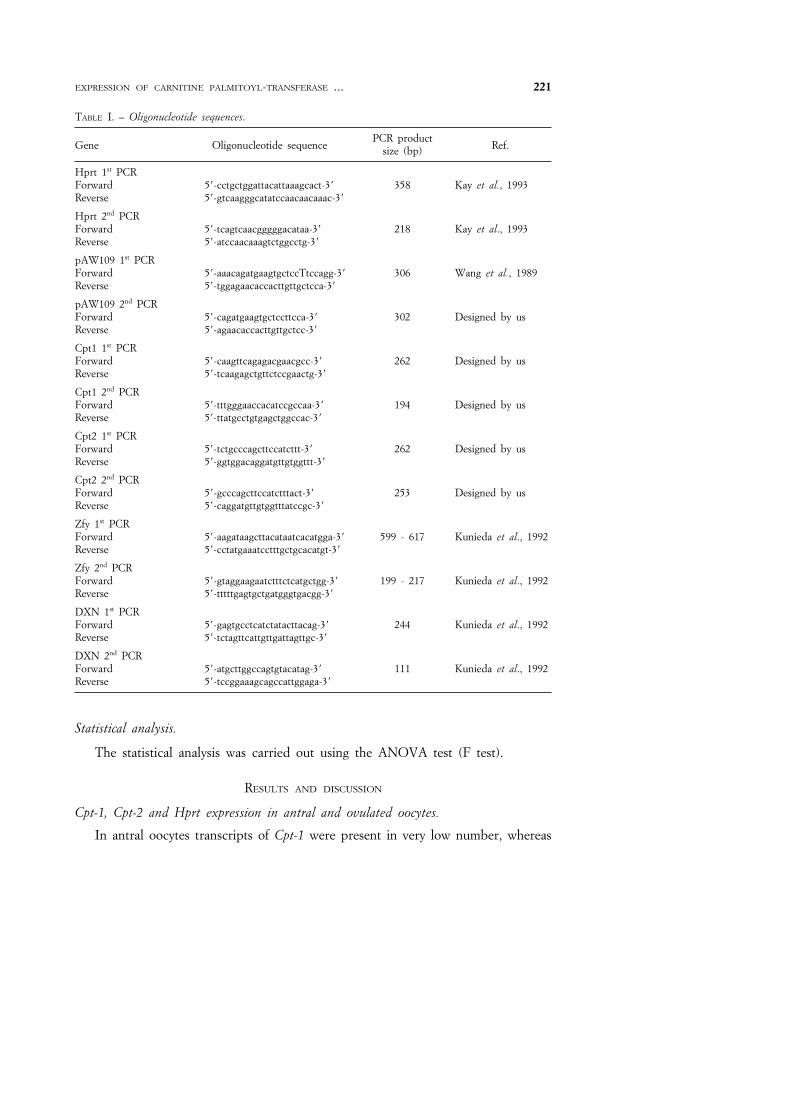
TABLE I. – Oligonucleotide sequences.
Gene Oligonucleotide sequencePCR product
size (bp) Ref.
Hprt 1st PCRForward 58-cctgctggattacattaaagcact-38 358 Kay et al., 1993Reverse 58-gtcaagggcatatccaacaacaaac-38
Hprt 2nd PCRForward 58-tcagtcaacgggggacataa-38 218 Kay et al., 1993Reverse 58-atccaacaaagtctggcctg-38
pAW109 1st PCRForward 58-aaacagatgaagtgctccTtccagg-38 306 Wang et al., 1989Reverse 58-tggagaacaccacttgttgctcca-38
pAW109 2nd PCRForward 58-cagatgaagtgctccttcca-38 302 Designed by usReverse 58-agaacaccacttgttgctcc-38
Cpt1 1st PCRForward 58-caagttcagagacgaacgcc-38 262 Designed by usReverse 58-tcaagagctgttctccgaactg-38
Cpt1 2nd PCRForward 58-tttgggaaccacatccgccaa-38 194 Designed by usReverse 58-ttatgcctgtgagctggccac-38
Cpt2 1st PCRForward 58-tctgcccagcttccatcttt-38 262 Designed by usReverse 58-ggtggacaggatgttgtggttt-38
Cpt2 2nd PCRForward 58-gcccagcttccatctttact-38 253 Designed by usReverse 58-caggatgttgtggtttatccgc-38
Zfy 1st PCRForward 58-aagataagcttacataatcacatgga-38 599 - 617 Kunieda et al., 1992Reverse 58-cctatgaaatcctttgctgcacatgt-38
Zfy 2nd PCRForward 58-gtaggaagaatctttctcatgctgg-38 199 - 217 Kunieda et al., 1992Reverse 58-tttttgagtgctgatgggtgacgg-38
DXN 1st PCRForward 58-gagtgcctcatctatacttacag-38 244 Kunieda et al., 1992Reverse 58-tctagttcattgttgattagttgc-38
DXN 2nd PCRForward 58-atgcttggccagtgtacatag-38 111 Kunieda et al., 1992Reverse 58-tccggaaagcagccattggaga-38
Statistical analysis.
The statistical analysis was carried out using the ANOVA test (F test).
RESULTS AND DISCUSSION
Cpt-1, Cpt-2 and Hprt expression in antral and ovulated oocytes.
In antral oocytes transcripts of Cpt-1 were present in very low number, whereas

L. GENTILE ET AL.222
Fig. 1. – Relative number of transcripts of Hprt, Cpt-1 and Cpt-2 genes in antral and ovulated MIIoocyte.
Cpt-2 showed the highest level of expression of all the stages of oocyte maturation orpreimplantation development analysed. The relative number of transcripts (rnt) ofCpt-1 was attested at 226 6 372 rnt, that of Cpt-2 was attested at 6814 6 4580 rnt andthat of the Hprt reached a value of 3035 6 499 rnt (fig. 1). Following ovulation,the rnt decreased abruptly in the MII oocyte: while Cpt-1 was not transcribed, Cpt-2expression showed a 2 fold decrease and was attested at 3084 6 2280 rnt; Hprt ex-pression decreased to 1924 6 1215 rnt. The rapid reduction in the number of Cpt-2transcripts identified may be attributed to the metabolic changes occurring at the timeof germinal vesicle breakdown and metaphase chromosomes condensation, whenRNA synthesis is ceased and one-half of the polyadenilated RNA accumulated duringoocyte growth is either degraded or deadenylated (Bachvarova, 1985; Bachvarova etal., 1985). This decrease occurs at a time when certain maternal messages are utilisedfor the first time and is accompanied by a decrease in the absolute rate of protein syn-

EXPRESSION OF CARNITINE PALMITOYL-TRANSFERASE ... 223
thesis from about 42 to 33 pg/hour per oocyte (Wassarman, 1988), reflecting turnoverof oocyte RNA and/or translational control mechanisms (Wassarman, 1988).
Cpt-1, Cpt-2 and Hprt expression during preimplantation development.
The data obtained from the RT-PCR analysis showed a significant difference be-tween the expression profiles of Cpt-1 and Cpt-2 genes during preimplantation devel-opment (fig. 2). Hprt pattern of transcription increased significantly from the 1-cellstage to morula and blastocyst (p> 0.05). Six hours after fertilisation, at the two pronu-clei stage, Cpt-1 transcripts were not detected; they were first temporarily identify dur-ing preimplantation development in the G2 phase of the 2-cell embryo (32 hours postinsemination) (160 6 247 rnt), but failed to be detected in the following 4-cell stage.
The transient expression of the Cpt-1 gene may be correlated with a transcription-ally active status of the embryonic genome at this stage of development. The G2 phaseof the second cell cycle is a particularly important moment during embryonic develop-ment. The first hurdle that a zygote encounters at the very beginning of developmentis the correct zygotic genome activation (ZGA). ZGA marks the passage and governsthe transition from maternal to embryonic control of development and it is crucial inthe life of the new individual, as inhibiting activation of zygotic genes will unable theembryo to continue its development (Christians et al., 1995; Nothias et al., 1995).ZGA results in the synthesis of about 40 new proteins (Nothias et al., 1995) and in re-cent years a number of the newly transcribed mammalian embryonic genes has beenidentified. Four genes expressed throughout preimplantation development: the Mhc
Fig. 2. – Relative number of transcripts of Hprt, Cpt-1 and Cpt-2 genes during preimplantationdevelopment.

L. GENTILE ET AL.224
(major histocompatibility complex) class I gene expressed from the 1-cell stage(Sprinks et al., 1993); the imprinted X-linked Xist (X-inactive specific transcript)gene, expressed solely from the paternal allele (Kay et al., 1994) and activated from theG2 phase of the 2-cell embryo (Latham and Rambhatla, 1995; Nesterova et al., 2001;Zuccotti et al., 2002); the Zfy (Zinc finger protein on the Y) and Sry (Sex-determiningregion on the Y) genes expressed from the 2-cell stage (Zwingman et al., 1993). Threegenes transiently expressed during the 1- to 2-cell stage: the heat shock gene Hsp 70.1(Christians et al., 1995), the imprinted U2afbp-rs (U2af binding protein related se-quence) (Latham et al., 1995) and the translation initiation factor eIF-4C (Davis et al.,1996).
In future experiments we will test the working hypothesis that Cpt-1 may representone of the newly transcribed zygotic genes and that its transcription is dependent onthe time elapsed since fertilisation. Embryos will be treated with cytochalasin D (in-hibitor of cytokinesis but not of DNA synthesis or nuclear progression) (Schultz,1993) from the G2-phase of the first cell-cycle, for a time equivalent to the 4-cell stagein control, untreated embryos. Earlier studies have shown that in preimplantation em-bryos there are genes whose expression is independent on DNA replication and geneswhose transcription is linked to DNA replication (Schultz et al., 1999). To verify ifCpt-1 expression is dependent on first or second DNA synthesis, we will treat 1- cellor 2-cell embryos in G1 with aphidicolin, a DNA replication inhibitor.
Cpt-1 transcripts were detected again at very low level beginning from the 8-cellstage (48 6 99 rnt) and consistently increased from morula (303 6 337 rnt) to hatch-ing blastocyst (667 6 308 rnt). Cpt-2 was expressed throughout preimplantation de-velopment, although with a variable number of transcripts. From the MII oocyte(3084 6 2280 rnt) the number of Cpt-2 transcripts decreased to attain a minimumvalue at the 8-cell stage (123 6 186 rnt), and then from morula it abruptly increased(1783 6 1200 rnt) to reach its relative maximum at the blastocyst stage(7000 6 2873 rnt). The decrease in the number of transcripts observed for Cpt-2 be-tween 1-cell and 8-cell stage may be attributed to a repression or reduced expression.Interestingly, the intensification of the expression of both Cpt-1 and Cpt-2 beginningat the morula stage is correlated with increasing profiles of oxygen uptake (Houghtonet al., 1996) and fatty acids oxidation found at this stage of development. Also, thisrise of transcription is concomitant with morphological modifications of mitochondria(Stern et al., 1971), and important epigenetic changes occurring prior to embryo cavi-tation and involving a reorganisation of chromatin structure (Clarke et al., 1992;Thompson 1996) and DNA methylation (Kafri et al., 1993; Santos et al., 2002).
Differential Cpt-2 expression in the oocytes and during preimplantation development.
A closer analysis of the data of Cpt-2 expression showed that two distinguishedgroups of embryos could be clearly sorted out at each stage of development analysed:a group with a higher (High Expression, HE, group) and a group with a lower (LowExpression, LE, group) relative number of transcripts (p> 0.05) (fig. 3). The exis-

EXPRESSION OF CARNITINE PALMITOYL-TRANSFERASE ... 225
Fig. 3. – The analysis of Cpt-2 expression has shown the exsistence of two groups of oocytes/embryoswith different number of transcripts: low expression group (a) and high expression group (b).
tence of two distinguished groups could explain the high variability detected amongsamples belonging to the same developmental stage. This difference was identified al-ready in MII oocytes, with 50% of the gametes belonging to the HE group and 50%

L. GENTILE ET AL.226
Fig. 4. – Gel electrophoreses of RT-PCR amplification of Hprt (a) and Cpt-2 transcripts (b) and the prod-uct of amplification of the exogenous control pAW109 (c). Each single blastocyst was sexed, thanks tothe amplification of a Y chromosome (Zfy) and an X chromosome (DXNds3) sequences (d). [: murinefemale genomic DNA; Z: murine male genomic DNA; RI: 1st RT blank (blastocyst and RT mixturewithout MuLV reverse transcriptase); RII: 2nd RT blank (water and RT mixture with MuLV reverse tran-scriptase); RIII: 1st PCR blank (water and PCR mixture); RIV: 2nd PCR blank (water and PCR mixture);
M: Low DNA Mass Ladder.
EXPRESSION OF CARNITINE PALMITOYL-TRANSFERASE ... 227
belonging to the LE group. Despite variations in Cpt-2 expression, Hprt and Cpt-1 didnot show significant differences within embryos at the same stage of development(p < 0.05).
Cpt-2 expression in male and female preimplantation embryos.
Recent work on mouse, cow, pig, sheep and human, has shown a difference in thespeed of preimplantation development between male (faster) and female (slower)(Valdivia et al., 1993). A quicker or slower developmental speed may be correlated tothe embryo metabolism and hence it could involve the metabolic genes analysed inthis study. In order to establish if the different expression of Cpt-2 is related with thesex of the embryo, using one of the four aliquots in which each single embryo samplewas subdivided after the retro-transcription step, we have analysed the sex of the blas-tocysts (fig. 4). Our results clearly demonstrated that there was no correlation be-tween sex of the embryo and Cpt-2 expression.
FUTURE STUDIES
Our future work will be aimed to understand if there is a correlation between theexpression of Cpt-2 and the developmental competence of oocytes and embryos. Weare now analysing the pattern of expression of this gene during in vivo preimplanta-tion development.
ACKNOWLEDGEMENTS
This study was funded by: Sigma Tau-Industrie Farmaceutiche Riunite, Comitati Telethon Fon-dazione Onlus, COFIN 2000-2001 and Olympus Foundation Science for Life.
REFERENCES
AOKI F., WORRAND D., SHULTZ R., 1997. Regulation of Transcriptional Activity during the First and SecondCell Cycles in the Preimplantation Mouse Embryo. Dev. Biol., 181: 296-307.
BACHVAROVA R., 1985. Gene expression during oogenesis and oocyte development in mammals. Dev. Biol.,1: 453-524.
BACHVAROVA R., DE LEON V., JOHNSON A., KAPLAN G., PAYNTON B.V., 1985. Changes in total RNA,polyadenylated RNA, and actin mRNA during meiotic maturation of mouse oocytes. Dev. Biol., 108:325-331.
BAVISTER B.D., 1995. Culture of preimplantation embryos: facts and artifacts. Hum. Reprod. Update, 1:91-148.
BISHOP D.G., 1971. The distribution and function of lipids in cell. In: A.R. JOHNSON, J.B. DAVENPORT
(eds.), Biochemistry and Methodology of Lipids. Wiley-Interscience, New York.BOUNIOL C., NGUYEN E., DEBEY P., 1995. Endogenous Transcription Occurs at the 1-Cell Stage in the
Mouse Embryo. Exp. Cell Res., 218: 57-62.CHRISTIANS E., CAMPION E., THOMPSON E.M., RENARD J.P., 1995. Expression of the HSP 70.1 gene, land-
mark of early zygotic activity in the mouse embryo, is restricted to the first burst of transcription. Devel-opment, 121: 545-551.

L. GENTILE ET AL.228
CLARKE H.G., OBLIN C., BUSTIN M., 1992. Developmental regulation of chromatin composition in mouseembryogenesis: somatic histone H1 is first detectable at the 4-cell stage. Development, 115:791-799.
DAVIS W. JR., DE SOUSA P.A., SCHULTZ R.M., 1996. Transient expression of translation initiation factoreIF-4C during the 2-cell stage of the preimplantation mouse embryo: identification by mRNA differentialdisplay and the role of DNA replication in zygotic gene activation. Dev. Biol., 174: 190-201.
FULTON B.P., WHITTINGHAM D.G., 1978. Activation of mammalian oocytes by intracellular injection of cal-cium. Nature, 273: 149-151.
HILLMAN N., FLYNN T.J., 1980. The metabolism of exogenous fatty acids by preimplantation mouse embryosdeveloping in vitro. J. Embryol. Exp. Morph., 56: 157-168.
HOUGHTON F.D., THOMPSON J.G., KENNEDY C.J., LEESE H.J., 1996. Oxygen consumption and energymetabolism of the early mouse embryo. Mol. Reprod. Dev., 44: 476-485.
KAFRI T., GAO X., RAZIN A., 1993. Mechanistic aspects of genome-wide demethylation in the preimplanta-tion mouse embryo. Proc. Natl. Acad. Sci. USA, 90: 10558-10562.
KANE M.T., 1979. Fatty acids as energy sources for culture of one-cell rabbit ova to viable morulae. Biol. Re-prod., 20: 323-332.
KAY G.F., PENNY J.D., PATEL D., ASHWORTH A., BROCKDORF N., RASTAN S., 1993. Expression of Xist dur-ing mouse development suggests a role in the initiation of X chromosome inactivation. Cell, 72:171-182.
KAY G.F., BARTON S.C., SURANI M.A., RASTAN S., 1994. Imprinting and X chromosome counting mecha-nisms determine Xist expression in early mouse development. Cell, 77: 639-650.
KUNIEDA T., XIAN M., KOBAYASHI E., IMAMICHI T., MORIWAKI K., TOYODA Y., 1992. Sexing of MousePreimplantation Embryos by Detection of Y chromosome-Specific Sequences Using Polymerase ChainReaction. Biol. Reprod., 46: 692-697.
LATHAM K.E., RAMBHATLA L., 1995. Expression of X-linked genes in androgenetic, gynogenetic, and normalmouse preimplantation embryos. Dev. Gen., 17: 212-222.
LATHAM K.E., RAMBHATLA L., HAYASHIZAKI Y., CHAPMAN V.M., 1995. Stage-specific induction and regula-tion by genomic imprinting of the mouse U2afbp-rs gene during preimplantation development. Dev. Bi-ol., 168: 670-676.
MCGARRY J.D., BROWN N.F., 1997. The mitochondrial carnitine palmitoyl-transferase system from conceptto molecular analysis. Europ. J. Biochem., 244: 1-14.
NESTEROVA T.B., BARTON S.C., SURANI M.A., BROCKDORFF N., 2001. Loss of Xist imprinting in diploidparthenogenetic preimplantation embryos. Dev. Biol., 235: 343-350.
NOTHIAS J.Y., MAJUMDER S., KANEKO K.J., DEPAMPHILIS M.L., 1995. Regulation of gene expression at thebeginning of mammalian development. J. Biol. Chem., 270: 22077-22080.
PARIA B.C., ZHAO X., WANG J., DAS S.K., DEY S.K., 1999. Fatty-acid amide hydrolase is expressed in themouse uterus and embryo during the periimplantation period. Biol. Reprod., 60: 1151-1157.
SANTOS F., HENDRICH B., REIK W., DEAN W., 2002. Dynamic Reprogramming of DNA Methylation in theEarly Mouse Embryo. Dev. Biol., 241: 172-182.
SCHULTZ R.M., 1993. Regulation of Zygotic Gene Activation in the Mouse. BioEssays, 15: 531-538.SCHULTZ R.M., DAVIS W. JR, STEIN P., SVOBODA P., 1999. Reprogramming of gene expression during preim-
plantation development. J. Exp. Zool., 285: 276-282.SPRINKS M.T., SELLENS M.H., DEALTRY G.B., FERNANDEZ N., 1993. Preimplantation mouse embryos ex-
press Mhc class I genes before the first cleavage division. Immunogenetics, 38: 35-40.STERN S., BIGGERS J.D., ANDERSON E., 1971. Mitochondria and early development of the mouse. J. Exp. Zo-
ol., 176: 179-191.THOMPSON E.M., 1996. Chromatin structure and gene expression in the preimplantation mammalian em-
bryo. Reprod. Nutr. Dev., 36: 619-635.VALDIVIA R.P., KUNIEDA T., AZUMA S., TOYODA Y., 1993. PCR sexing and developmental rate differences in
preimplantation mouse embryos fertilized and cultured in vitro. Mol. Reprod. Dev., 35: 121-126.

EXPRESSION OF CARNITINE PALMITOYL-TRANSFERASE ... 229
VERNET M., BONNEROT C., BRIAND P., NICOLAS J. F., 1992. Changes in permissiveness for the expression ofmicroinjected DNA during the first cleavage of mouse embryos. Mech. Dev., 36: 129-139.
WALES R.G., 1975. Maturation of the mammalian embryo: biochemical aspects. Biol. Reprod., 12:66-81.
WANG A.M., DOYLE M.V., MARK D.F., 1989. Quantitation of mRNA by the polymerase chain reaction.Proc. Natl. Acad. Sci. USA, 86: 9717-9721.
WASSARMAN P.M., 1988. The mammalian ovum. In: E. KNOBIL, J. NAIL et al. (eds.), The physiology of re-production. Raven Press, New York: 69-102.
WHITTINGHAM D.G., 1971. Culture of mouse ova. J. Reprod. Fertil. Suppl., 14: 7-21.ZUCCOTTI M., ROSSI P.G., MARTINEZ A., GARAGNA S., FORABOSCO A., REDI C.A., 1998. Meiotic and devel-
opmental competence of mouse antral oocytes. Biol. Reprod., 58: 700-704.ZUCCOTTI M., BOIANI M., PONCE R.H., GUIZZARDI S., SCANDROGLIO R., GARAGNA S., REDI C.A., 2002.
Mouse Xist expression begins at zygotic genome activation and is timed by a zygotic clock. Mol. Reprod.Dev., 61: 14-20.
ZWINGMAN T., ERICKSON R.P., BOYER T., AO A., 1993. Transcription of the sex-determining region genesSry and Zfy in the mouse preimplantation embryo. Proc. Natl. Acad. Sci. USA, 90: 814-817.
Pervenuta il 3 dicembre 2002,in forma definitiva il 14 gennaio 2003.
S. Garagna, L. Gentile, V. Merico, M. Monti, C.A. Redi, V. Sebastiano:Laboratorio di Biologia dello Sviluppo
Dipartimento di Biologia AnimaleUniversità degli Studi di PaviaPiazza Botta, 9 - 27100 PAVIA
mickeyHunipv.it
M. Zuccotti:Dipartimento di Medicina Sperimentale
Sezione di Istologia ed EmbriologiaUniversità degli Studi di Parma
Via Volturno, 39 - 43100 PARMA