Inactivation of Escherichia coli with Power Ultrasound in Apple Cider
Upload
independentCategory
view
3download
0
Modeling analysis of the L(�)-carnitine production
process by Escherichia coli
Daniel V. Guebel a,1, Nestor V. Torres b,c,*, Manuel Canovas d
aBiotechnology Counseling Services, Av San Martın 4927, (1417) Buenos Aires, ArgentinabGrupo de Tecnologıa Bioquımica, Dpto. Bioquımica y Biologıa Molecular, Facultad de Biologıa,
Universidad de La Laguna, (38206) La Laguna, Tenerife, Islas Canarias, Espanac Instituto Universitario de Bioorganica Antonio Gonzalez. Avda. Astfco. Fco. Sanchez, s/n 38206 La Laguna,
Tenerife, Islas Canarias, Espana, SpaindDepartamento de Bioquımica y Biologıa Molecular B, Facultad de Quımica, Universidad de Murcia, Espana
Received 17 May 2005; received in revised form 22 August 2005; accepted 23 August 2005
Abstract
The basis of a previous model for the crotonobetaine biotransformation into L(�)-carnitine by Escherichia coli strains [Canovas M, Maiquez
JR, Obon JM, Iborra JL. Modeling of the biotransformation of crotonobetaine into L(�)-carnitine by Escherichia coli strains. Biotechnol Bioeng
2002;77:764–75], are examined. The analysis focused on the multi-factorial nature of growth-limiting compounds and causes leading to rapid
decrease in L(�)-carnitine productivity. An explicit model for the maximum specific growth rate in anaerobic batch was formulated. Glycerol,
previously assumed to be the limiting substrate, actually exerts a negative, interactive, growth-effect on peptone. In contrast, peptone produces a
significant, positive, linear effect. Fumarate was also identified as a strong growth-promoting factor, while crotonobetaine interacts negatively with
this compound. Glycerol could be taken up through a regulated channel mechanism. Crotonobetaine and L(�)-carnitine could share a same type of
carrier transport, but their fluxes might be independent events of a reversible mechanism. Because of the reversibility of all the other participating
processes, the whole biotransforming network behaves as self-regulated. So, the decrease in L(�)-carnitine productivity can be explained by the
rapid network evolution toward a final equilibrium stage after its initial perturbation by the batch conditions applied. Thus, reported data have been
simulated by a simplified model based on these premises, which suggests that alternative transport mechanisms (e.g. concerted anti-port, ATP-
consuming transport) have little effect in the analyzed conditions. The proposed mechanism is consistent with the observed 1:1 ratio between
precursor input and product output, as well as with the bi-directionality constrains appearing due to the activities of CoA-ligase and
CoA-transferase enzymes. Some strategies for improving the process productivity are delineated.
# 2005 Elsevier Ltd. All rights reserved.
Keywords: L(�)-Carnitine; Biotransformation; Escherichia coli; Glycerol; Transport; Mathematical model
www.elsevier.com/locate/procbio
Process Biochemistry 41 (2006) 281–288
1. Introduction
Some Escherichia coli and Proteus strains transform
crotonobetaine and D(+)-carnitine into the specialty L(�)-
carnitine [1–4]. Crotonobetaine and carnitine are betaine-
related compounds, a series of aliphatic chemicals character-
ized by the presence of a cationic trimethylamino group. The
L(�)-carnitine enantiomer is increasingly in demand due to its
use in human medicine [5–7].
* Corresponding author. Tel.: +34 922 318334; fax: +34 922 318334.
E-mail addresses: [email protected] (D.V. Guebel), [email protected]
(N.V. Torres), [email protected] (M. Canovas).1 Tel.: +54 11 4503 9355.
1359-5113/$ – see front matter # 2005 Elsevier Ltd. All rights reserved.
doi:10.1016/j.procbio.2005.08.013
The enzymes participating have been identified [8–10]
and have allowed for the construction of a recombinant strain
carrying plasmids with copies of the caiT, A, B, C, D, E
operon that governs the biotransformation [11,12]. These
efforts have been matched by others oriented toward the
technological application of the biotransforming strains.
Thus, several operation modes (batch, continuous recycling,
etc.), with growing or resting cells, cultured in minimal or in
complex media, under anoxic or aerobic conditions, have
been assayed [13–21]. Two mathematical, unstructured
models have recently been presented as corollary: one
of them describes the responses in the different operation
modes [18], while the other optimizes one of these reactor
configurations [22].
D.V. Guebel et al. / Process Biochemistry 41 (2006) 281–288282
Some critical questions still remain concerning the
physiology of these strains in spite of the great effort dedicated.
Hence, a quantitative study on the integrated physiology of the
producing strains would greatly contribute to optimizing
production processes [23,24].
Most of the reported process data are scattered through the
100 h batch-runs. However, a proper understanding of the
underlying physiology requires a more detailed analysis of the
exponential growth phase since L(�)-carnitine productivity
falls sharply soon after the beginning of the culture and because
the glycerol uptake rate may well be faster than is currently
assumed [25,26].
In previous studies, glycerol has been considered the sole
limiting source of carbon and energy, even when culture media
included peptides and/or free amino acids [18]. Previous
models regarded fumarate as a L(�)-carnitine yield enhancer
[16], but did not consider its effect on the anaerobic growth of
biomass.
Evidence about the plasmids impact on the harboring strain
is scarce [15,17]. Moreover, no plasmid-stability studies in
working conditions have been reported. Cellular death, cellular
lysis, and cellular maintenance have been treated as equivalents
in previous models, while the difference in the energy
consumption for cellular maintenance between the wild and
the recombinant strain was not considered.
A strong linkage between the primary metabolism and the
bacterial capacity to produce L(�)-carnitine, has been proposed
[21]. This hypothesis is in line with the fact that crotonobetaine
biotransformation does involve CoA-intermediaries [27,28].
However, verification of this hypothesis requires evaluation of
the energy metabolic efficiency and the energy requirements of
the crotonobetaine and L-carnitine transporters.
Unfortunately, there is no agreement about the role of the
different transporter systems involved in trimethylammonium
metabolism, namely the ProP and ProU [29,30], as well as the
CaiT system [2]. Moreover, comparison of the available
evidence for the ProP system with information contained in the
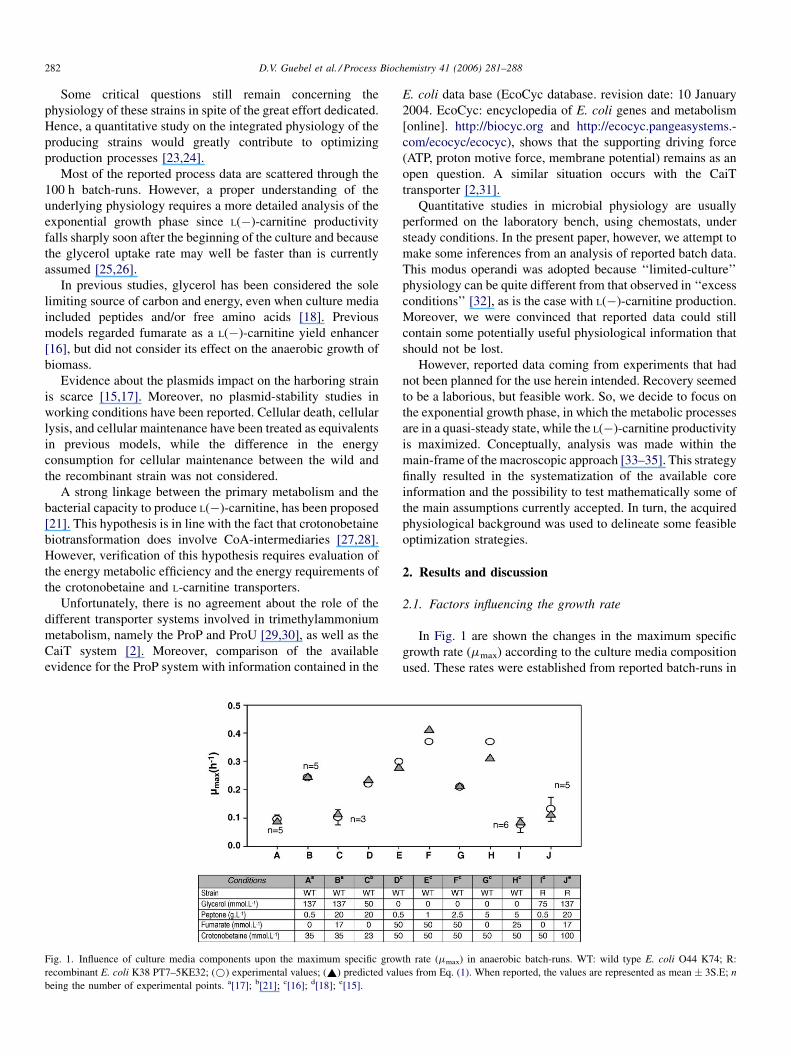
Fig. 1. Influence of culture media components upon the maximum specific grow
recombinant E. coli K38 PT7–5KE32; (*) experimental values; (~) predicted valu
being the number of experimental points. a[17]; b[21]; c[16]; d[18]; e[15].
E. coli data base (EcoCyc database. revision date: 10 January
2004. EcoCyc: encyclopedia of E. coli genes and metabolism
[online]. http://biocyc.org and http://ecocyc.pangeasystems.-
com/ecocyc/ecocyc), shows that the supporting driving force
(ATP, proton motive force, membrane potential) remains as an
open question. A similar situation occurs with the CaiT
transporter [2,31].
Quantitative studies in microbial physiology are usually
performed on the laboratory bench, using chemostats, under
steady conditions. In the present paper, however, we attempt to
make some inferences from an analysis of reported batch data.
This modus operandi was adopted because ‘‘limited-culture’’
physiology can be quite different from that observed in ‘‘excess
conditions’’ [32], as is the case with L(�)-carnitine production.
Moreover, we were convinced that reported data could still
contain some potentially useful physiological information that
should not be lost.
However, reported data coming from experiments that had
not been planned for the use herein intended. Recovery seemed
to be a laborious, but feasible work. So, we decide to focus on
the exponential growth phase, in which the metabolic processes
are in a quasi-steady state, while the L(�)-carnitine productivity
is maximized. Conceptually, analysis was made within the
main-frame of the macroscopic approach [33–35]. This strategy
finally resulted in the systematization of the available core
information and the possibility to test mathematically some of
the main assumptions currently accepted. In turn, the acquired
physiological background was used to delineate some feasible
optimization strategies.
2. Results and discussion
2.1. Factors influencing the growth rate
In Fig. 1 are shown the changes in the maximum specific
growth rate (mmax) according to the culture media composition
used. These rates were established from reported batch-runs in
th rate (mmax) in anaerobic batch-runs. WT: wild type E. coli O44 K74; R:
es from Eq. (1). When reported, the values are represented as mean � 3S.E; n
D.V. Guebel et al. / Process Biochemistry 41 (2006) 281–288 283
anaerobiosis with the wild and recombinant strain, by using
both ‘‘minimal’’ and ‘‘complex’’ culture media.
It is interesting to compare the wild and the recombinant
strain in relation to their growth capacity since their growth
difference (Dmmax) reflects the energy burden imposed by the
plasmids. However, a direct comparison is not feasible because
growth rates depend on the multiple culture conditions applied
and not only on the presence or absence of plasmids. To
overcome this problem and to better understand the substrates
effects, we established a simple model able to identify and
quantify the factors that influence mmax. This model is presented
by Eq. (1), which was established by multiple non-linear
regression with the available data (see Fig. 1).
As some mmax values are reported without their errors
(conditions D–H), but errors are available in others
(conditions A–C, I, J), and since ANOVA analysis requires
the occurrence of a common variance (homoscesdasticity
condition), and all data come from the same laboratory group,
we pooled the available variances to obtain an estimation of
the omitted errors. This was done by computing a weighted
average of the available variances according to their degrees
of freedom. Then, using a random number generator (Matlab
Software) we reconstructed the feasible mmax values by
simulating four replicates in each condition. This was done
following the specified errors according to a Gaussian
distribution centered on the reported mean values. Finally,
we performed a regression with ANOVA, which is
summarized in Eq. (1). Note that Eq. (1) only includes the
statistically significant terms ( p � 0.01) despite the data were
analyzed as a full factorial.
mmax ¼ 0:227 þ 0:119½peptone� þ 0:206½fumarate�
� 0:222½crotonobetaine� � 0:902½fumarate�
� ½crotonobetaine� � 0:159½peptone�½glycerol� (1)
In Eq. (1) is assumed that the growth effect produced by
0.5 g L�1 casamino acid (minimal medium) is equivalent to
that of the 0.5 g L�1 peptone (some complex media formula-
tions). Moreover, in terms of growth-promoting capacity,
culture media with 5–20 g L�1 of peptone have been
considered as equivalent to those containing 2.5 g L�1. In
fact, this latter value was the observed cut-off for the cellular
response to peptone [16].
As the independent variables in Eq. (1) have been centered
and normalized as [(X � Xaverage)/(Xmaximum � Xminimum)],
where X is the raw value of the considered variable, the
obtained regression coefficients give the effective contribution
of each variable to mmax, thus allowing the direct comparison of
their influences.
The type of microorganism (wild type or recombinant),
codified as binary variable (see table in Fig. 1), does not appear
in Eq. (1) because no difference was detected ( p = 0.433).
Although this result could seem somewhat unexpected, analysis
of some reported experiments [15,17] showed that plasmid-
mediated features were less important than might be expected
from a strong multi-copy system. Previously, values of
mmax = 0.603 h�1 were reported for the recombinant strain
and mmax = 0.650 h�1 for the wild type in anerobiosis, but the
experimental error was not indicated [18].
Neither was the linear term of glycerol effects significant
( p = 0.879). However, a negative, interactive effect between
glycerol and peptone was detected ( p < 0.01), being so
included in Eq. (1). Note that the omission of the linear glycerol
term in Eq. (1) has only little consequences on the descriptive
model capacity in the different analyzed conditions (see Fig. 1).
Fumarate is currently added to avoid the formation of the by-
product, g-butirobetaine [9,16]. Our analysis showed, however,
that fumarate also exerts a strong stimulant effect on biomass
growth ( p < 0.01). In fact, fumarate acts as electron acceptor,
improves NADH re-oxidation through the production of
succinate in the so-called anaerobic respiration [36,37]. In a
similar mechanism, fumarate prevents the above-mentioned
formation of g-butirobetaine.
Moreover, crotonobetaine neutralizes the positive growth
effect of fumarate since there was a negative interaction
between them ( p < 0.01). The basis of this effect was discussed
above in relation to the formation of g-butirobetaine, given that
crotonobetaine, as electron acceptor in anaerobiosis is a direct
competitor of fumarate. But, some other crotonobetaine effect
might also be produced: whilst the crotonobetaine linear effect
appears to be growth inhibitory ( p < 0.01), the linear effect
associated to fumarate appears to be growth stimulatory
( p < 0.01). Paradoxically, under saline hyperosmotic stress,
crotonobetaine exerts a protective growth-effect [17].
To illustrate the validity of Eq. (1), note that mmax in
condition C (poor growth condition) becomes very close to that
observed in condition B (good growth condition) when both are
compared after adjusting their fumarate and glycerol concen-
trations in Eq. (1) (see Fig. 1). As a whole, the above analysis
shows that the predictive quality of model Eq. (1) is good
(R2 = 0.922, average inaccuracy = 11.6%).
In conclusion, the achieved model was able to disaggregate
the growth effects of the different culture media components. In
contrast with previous assumptions, we not only concluded that
glycerol is not the sole source of carbon and energy that it is not
the main growth substrate for cells either. We showed that mmax
can be modulated either positively or negatively by several
factors. These factors were recognized and quantified their
influences. Both in the so-called ‘‘minimal medium’’ as well as
in ‘‘complex medium’’, it is apparent that the amino acids
(peptone or casamino) are the main growth substrates.
The latter is supported by the evidence that amino acids
contribute significantly to fulfilling the bacterial energy
demand in anaerobiosis [38], and that free proline availability
can limit bacterial growth due to its osmoprotectant role [39].
The role of amino acids in our system is also supported by the
fact that the recombinant strain maintained a constant biomass-
glycerol yield (Yx/glycerol = 0.0061 � 0.0007 g mmol�1) up to
67 h in batch experiments, while the exponential growth-phase
only lasted up to 36 h, such as can be verified on data from [18].
Since glycerol had a deleterious mmax effect, without any
apparent positive effect, it should be excluded. Since
crotonobetaine, being the L(�)-carnitine precursor, must be
D.V. Guebel et al. / Process Biochemistry 41 (2006) 281–288284
Table 1
Relationship between the initial concentration of glycerol in the culture medium ([glycerol]initial) and some parameters used to characterize the microbial growth
performance, such as the mean value of the specific glycerol consumption rate during the exponential phase (qglycerol exp. phase), the maximum specific growth rate
(mmax), and the presence or absence of lag-phases
[glycerol]initial (mmol L�1) qglycerol exp. phase (mmol g�1 h�1) Lag-phase (h) mmax (h�1)
20 3.88 � 0.43 (n = 3) 5.8 0.54 � 0.06 (n = 4)
40 2.29 � 0.05 (n = 2) 5.9 0.70 � 0.18 (n = 3)
75 2.82 � 0.43 (n = 4) 0 0.25 � 0.03 (n = 4)
150 3.11 � 1.24 (n = 5) 0 0.25 � 0.01 (n = 6)
Values determined from data in [18] with the recombinant strain in minimal medium, at pO2 = 30%, expressed as mean � S.E., n being the number of experimental
points used for parameter determination.
added despite its strong, inhibitory growth effect, its addition in
a fed-batch schedule is recommendable. In contrast, it could be
best to add the total required fumarate together with the peptone
from the very beginning, both for its growth stimulant effect
and because it prevents the formation of g-butirobetaine. Under
these new operating conditions, an increase by 140% in mmax
can be expected from Eq. (1). This would represent a significant
improvement since mmax in the working strains is a half of that
observed with other E. coli strains [29].
2.2. Glycerol uptake
The obtained results motivated us to explore whether the
negative growth-effect of glycerol is related with its cellular
transport. Detailed analyses of the reported data [18,21] led us
to conclude that working strains do not follow Monod’s model
for glycerol consumption. Instead, the linear trend observed is
consistent with the idea that glycerol may enter the cell through
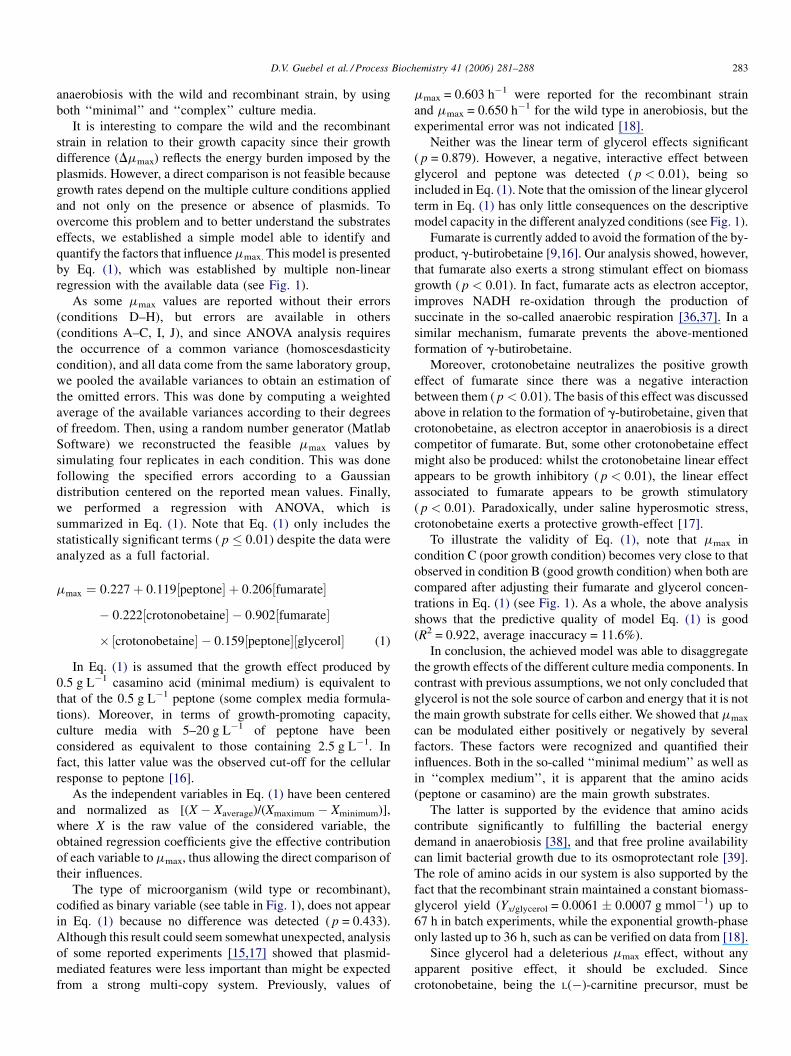
a membrane channel (see Fig. 2).
Some lines of evidence could support the occurrence
of a channel transport: (i) it has been described a specific
bacterial membrane channel for glycerol, the so-called
glycerol facilitator protein (Glpf) [25,26]; (ii) the absence of
saturation despite the broad range analyzed is against a
carrier with Monod’s kinetic whilst the Glpf channel is not
saturated below 200 mmol L�1 glycerol [40]; (iii) the fact
that the low glycerol affinity constant (Km = 335 mmol L�1
glycerol) reported for the working strains [18] results
Fig. 2. Relationship between the specific rates of glycerol consumption (qgly-
cerol) and extra-cellular glycerol concentration. Data based on [18] for batch-
runs with recombinant strain in minimal medium at a fixed pO2 (30%). (*)
Glycerol: 20 mmol L�1; (*) glycerol: 150 mmol L�1.
inconsistent with the glycerol consumption rates associated
to the exponential growth phase (see Table 1); (iv) the fact
that glycerol consumption rates display a hysteresis
(memory) effect (see Fig. 2).
A system is associated with hysteresis when its dynamic
is strongly conditioned by its history rather than by its
instantaneous, present conditions. According to data in Fig. 2,
a same value of glycerol consumption rate is associated with two
very different extra-cellular glycerol concentrations, depending
on the initial glycerol concentration applied. So, glycerol
consumption at any time is not conditioned by the instantaneous,
extra-cellular glycerol concentration as is assumed in Monod’s
model, but it was by the previous consumption rates in the same
series, its ‘‘dynamical history’’, that ultimately depends on the
initial glycerol concentration. In fact, data appear grouped in two
different straight-lines and not in a unique overlapping curve that
would denote its independence on the initial conditions used.
Note that each straight-line actually trace a ‘‘dynamical
trajectory’’ since in decreasing order it gives the temporal
sequence of consumption rates occurred in despite that time is not
explicitly represented in Fig. 2.
The fact that the straight-line at high initial glycerol
concentration (150 mmol L�1) has a lower slope than the
straight-line at low initial glycerol (20 mmol L�1), raised the
question of whether the referred to glycerol channel could
actually ‘‘open’’ or ‘‘close’’ in response to extra-cellular
glycerol availability.
Althoughadefinitiveanswerto thisquestionhave tocomefrom
direct experimentation, we also explored for some indirect
evidence.Thus, fromthe available datawedetermined the specific
rate of glycerol consumption associated to the exponential growth
phase (qglycerol exp. phase),hereindefinedasavalue representativeof
the whole period in which the culture grows atmmax (see Table 1).
Operationally, this corresponds to performing a weighted average
of the several qglycerol values established within the exponential
growth phase, each value being weighted by the discrete time
elapsed between successive samples.
From results in Table 1, we concluded that qglycerol exp. phase
behaves as approximately constant for the different conditions
given that within the available error only little or moderate
variation was produced in spite of the great variations in the
extra-cellular glycerol concentration. But according to the
double relationship between qglycerol and glycerol concentration
showed in Fig. 2, the constancy of qglycerol exp. phase in Table 1
D.V. Guebel et al. / Process Biochemistry 41 (2006) 281–288 285
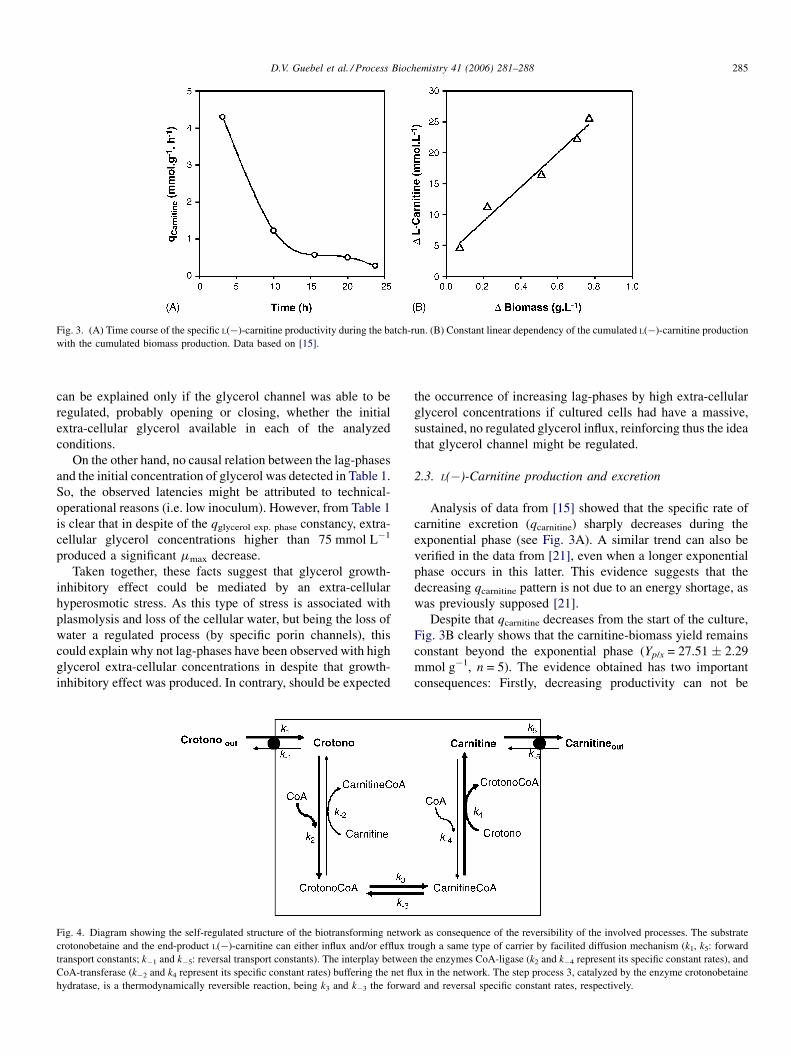
Fig. 3. (A) Time course of the specific L(�)-carnitine productivity during the batch-run. (B) Constant linear dependency of the cumulated L(�)-carnitine production
with the cumulated biomass production. Data based on [15].
can be explained only if the glycerol channel was able to be
regulated, probably opening or closing, whether the initial
extra-cellular glycerol available in each of the analyzed
conditions.
On the other hand, no causal relation between the lag-phases
and the initial concentration of glycerol was detected in Table 1.
So, the observed latencies might be attributed to technical-
operational reasons (i.e. low inoculum). However, from Table 1
is clear that in despite of the qglycerol exp. phase constancy, extra-
cellular glycerol concentrations higher than 75 mmol L�1
produced a significant mmax decrease.
Taken together, these facts suggest that glycerol growth-
inhibitory effect could be mediated by an extra-cellular
hyperosmotic stress. As this type of stress is associated with
plasmolysis and loss of the cellular water, but being the loss of
water a regulated process (by specific porin channels), this
could explain why not lag-phases have been observed with high
glycerol extra-cellular concentrations in despite that growth-
inhibitory effect was produced. In contrary, should be expected
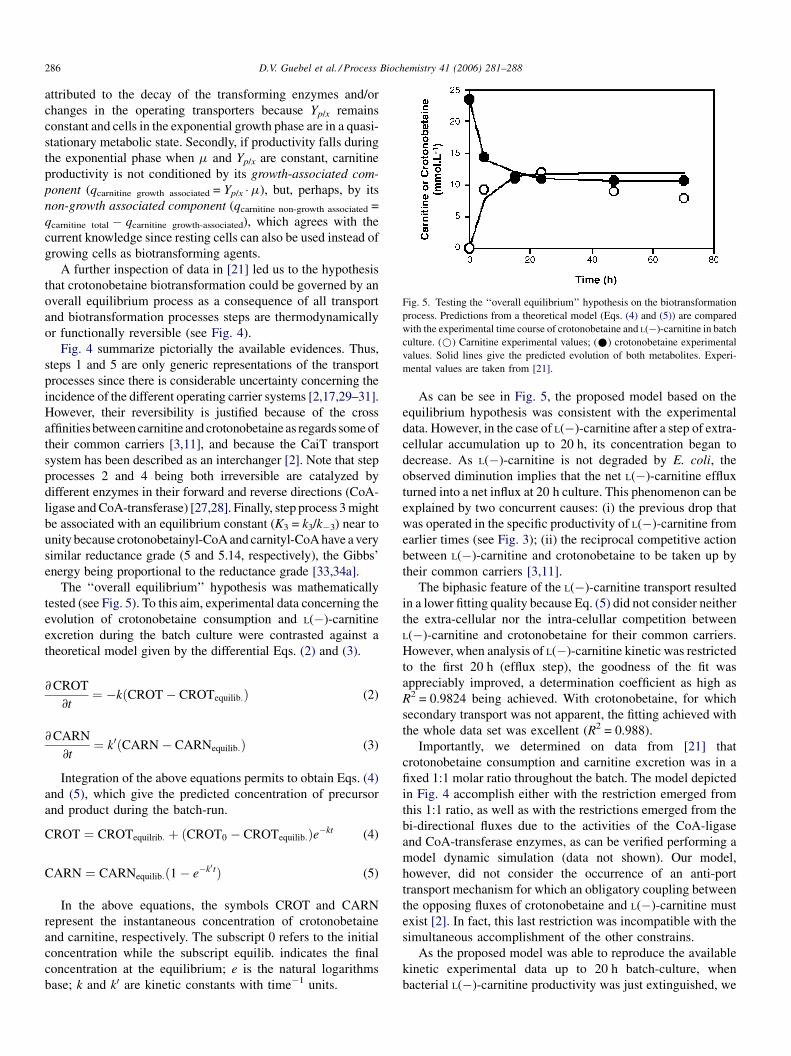
Fig. 4. Diagram showing the self-regulated structure of the biotransforming netwo
crotonobetaine and the end-product L(�)-carnitine can either influx and/or efflux tr
transport constants; k�1 and k�5: reversal transport constants). The interplay betwee
CoA-transferase (k�2 and k4 represent its specific constant rates) buffering the net fl
hydratase, is a thermodynamically reversible reaction, being k3 and k�3 the forwa
the occurrence of increasing lag-phases by high extra-cellular
glycerol concentrations if cultured cells had have a massive,
sustained, no regulated glycerol influx, reinforcing thus the idea
that glycerol channel might be regulated.
2.3. L(�)-Carnitine production and excretion
Analysis of data from [15] showed that the specific rate of
carnitine excretion (qcarnitine) sharply decreases during the
exponential phase (see Fig. 3A). A similar trend can also be
verified in the data from [21], even when a longer exponential
phase occurs in this latter. This evidence suggests that the
decreasing qcarnitine pattern is not due to an energy shortage, as
was previously supposed [21].
Despite that qcarnitine decreases from the start of the culture,
Fig. 3B clearly shows that the carnitine-biomass yield remains
constant beyond the exponential phase (Yp/x = 27.51 � 2.29
mmol g�1, n = 5). The evidence obtained has two important
consequences: Firstly, decreasing productivity can not be
rk as consequence of the reversibility of the involved processes. The substrate
ough a same type of carrier by facilited diffusion mechanism (k1, k5: forward
n the enzymes CoA-ligase (k2 and k�4 represent its specific constant rates), and
ux in the network. The step process 3, catalyzed by the enzyme crotonobetaine
rd and reversal specific constant rates, respectively.
D.V. Guebel et al. / Process Biochemistry 41 (2006) 281–288286
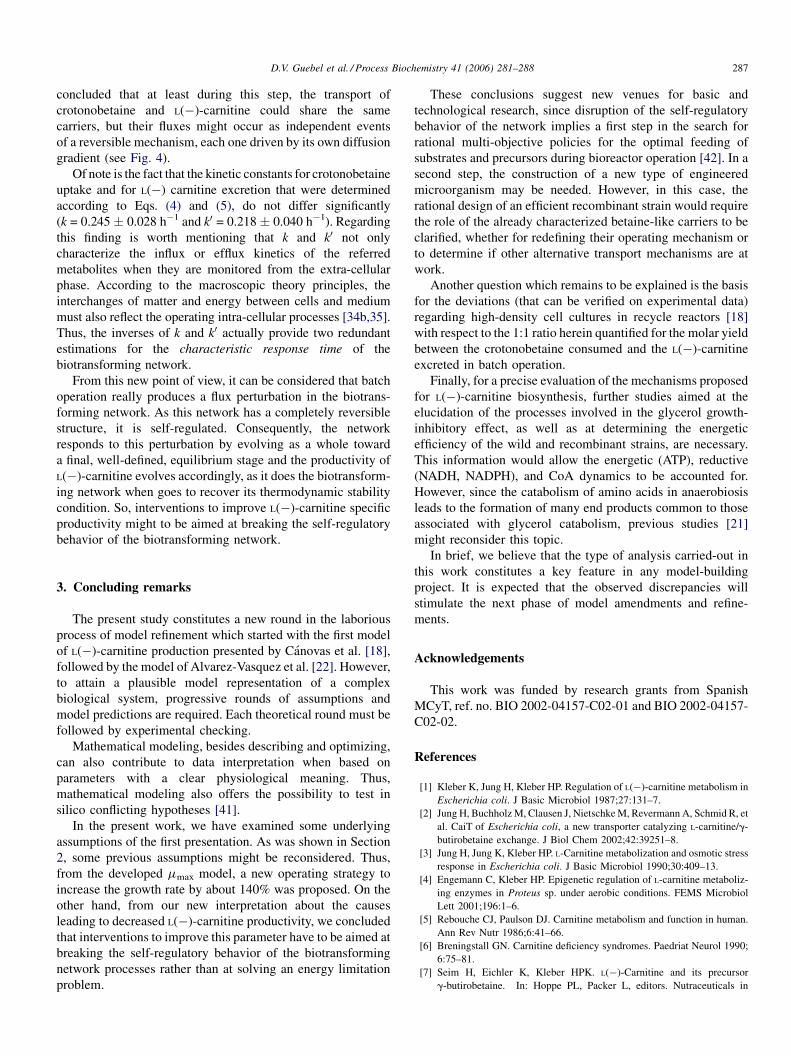
Fig. 5. Testing the ‘‘overall equilibrium’’ hypothesis on the biotransformation
process. Predictions from a theoretical model (Eqs. (4) and (5)) are compared
with the experimental time course of crotonobetaine and L(�)-carnitine in batch
culture. (*) Carnitine experimental values; (*) crotonobetaine experimental
values. Solid lines give the predicted evolution of both metabolites. Experi-
mental values are taken from [21].
attributed to the decay of the transforming enzymes and/or
changes in the operating transporters because Yp/x remains
constant and cells in the exponential growth phase are in a quasi-
stationary metabolic state. Secondly, if productivity falls during
the exponential phase when m and Yp/x are constant, carnitine
productivity is not conditioned by its growth-associated com-
ponent (qcarnitine growth associated = Yp/x �m), but, perhaps, by its
non-growth associated component (qcarnitine non-growth associated =
qcarnitine total � qcarnitine growth-associated), which agrees with the
current knowledge since resting cells can also be used instead of
growing cells as biotransforming agents.
A further inspection of data in [21] led us to the hypothesis
that crotonobetaine biotransformation could be governed by an
overall equilibrium process as a consequence of all transport
and biotransformation processes steps are thermodynamically
or functionally reversible (see Fig. 4).
Fig. 4 summarize pictorially the available evidences. Thus,
steps 1 and 5 are only generic representations of the transport
processes since there is considerable uncertainty concerning the
incidence of the different operating carrier systems [2,17,29–31].
However, their reversibility is justified because of the cross
affinities between carnitine and crotonobetaine as regards some of
their common carriers [3,11], and because the CaiT transport
system has been described as an interchanger [2]. Note that step
processes 2 and 4 being both irreversible are catalyzed by
different enzymes in their forward and reverse directions (CoA-
ligase and CoA-transferase) [27,28]. Finally, step process 3 might
be associated with an equilibrium constant (K3 = k3/k�3) near to
unity because crotonobetainyl-CoA and carnityl-CoA have a very
similar reductance grade (5 and 5.14, respectively), the Gibbs’
energy being proportional to the reductance grade [33,34a].
The ‘‘overall equilibrium’’ hypothesis was mathematically
tested (see Fig. 5). To this aim, experimental data concerning the
evolution of crotonobetaine consumption and L(�)-carnitine
excretion during the batch culture were contrasted against a
theoretical model given by the differential Eqs. (2) and (3).
@CROT
@t¼ �kðCROT � CROTequilib:Þ (2)
@CARN
@t¼ k0ðCARN � CARNequilib:Þ (3)
Integration of the above equations permits to obtain Eqs. (4)
and (5), which give the predicted concentration of precursor
and product during the batch-run.
CROT ¼ CROTequilrib: þ ðCROT0 � CROTequilib:Þe�kt (4)
CARN ¼ CARNequilib:ð1 � e�k0tÞ (5)
In the above equations, the symbols CROT and CARN
represent the instantaneous concentration of crotonobetaine
and carnitine, respectively. The subscript 0 refers to the initial
concentration while the subscript equilib. indicates the final
concentration at the equilibrium; e is the natural logarithms
base; k and k0 are kinetic constants with time�1 units.
As can be see in Fig. 5, the proposed model based on the
equilibrium hypothesis was consistent with the experimental
data. However, in the case of L(�)-carnitine after a step of extra-
cellular accumulation up to 20 h, its concentration began to
decrease. As L(�)-carnitine is not degraded by E. coli, the
observed diminution implies that the net L(�)-carnitine efflux
turned into a net influx at 20 h culture. This phenomenon can be
explained by two concurrent causes: (i) the previous drop that
was operated in the specific productivity of L(�)-carnitine from
earlier times (see Fig. 3); (ii) the reciprocal competitive action
between L(�)-carnitine and crotonobetaine to be taken up by
their common carriers [3,11].
The biphasic feature of the L(�)-carnitine transport resulted
in a lower fitting quality because Eq. (5) did not consider neither
the extra-cellular nor the intra-celullar competition between
L(�)-carnitine and crotonobetaine for their common carriers.
However, when analysis of L(�)-carnitine kinetic was restricted
to the first 20 h (efflux step), the goodness of the fit was
appreciably improved, a determination coefficient as high as
R2 = 0.9824 being achieved. With crotonobetaine, for which
secondary transport was not apparent, the fitting achieved with
the whole data set was excellent (R2 = 0.988).
Importantly, we determined on data from [21] that
crotonobetaine consumption and carnitine excretion was in a
fixed 1:1 molar ratio throughout the batch. The model depicted
in Fig. 4 accomplish either with the restriction emerged from
this 1:1 ratio, as well as with the restrictions emerged from the
bi-directional fluxes due to the activities of the CoA-ligase
and CoA-transferase enzymes, as can be verified performing a
model dynamic simulation (data not shown). Our model,
however, did not consider the occurrence of an anti-port
transport mechanism for which an obligatory coupling between
the opposing fluxes of crotonobetaine and L(�)-carnitine must
exist [2]. In fact, this last restriction was incompatible with the
simultaneous accomplishment of the other constrains.
As the proposed model was able to reproduce the available
kinetic experimental data up to 20 h batch-culture, when
bacterial L(�)-carnitine productivity was just extinguished, we
D.V. Guebel et al. / Process Biochemistry 41 (2006) 281–288 287
concluded that at least during this step, the transport of
crotonobetaine and L(�)-carnitine could share the same
carriers, but their fluxes might occur as independent events
of a reversible mechanism, each one driven by its own diffusion
gradient (see Fig. 4).
Of note is the fact that the kinetic constants for crotonobetaine
uptake and for L(�) carnitine excretion that were determined
according to Eqs. (4) and (5), do not differ significantly
(k = 0.245 � 0.028 h�1 and k0 = 0.218 � 0.040 h�1). Regarding
this finding is worth mentioning that k and k0 not only
characterize the influx or efflux kinetics of the referred
metabolites when they are monitored from the extra-cellular
phase. According to the macroscopic theory principles, the
interchanges of matter and energy between cells and medium
must also reflect the operating intra-cellular processes [34b,35].
Thus, the inverses of k and k0 actually provide two redundant
estimations for the characteristic response time of the
biotransforming network.
From this new point of view, it can be considered that batch
operation really produces a flux perturbation in the biotrans-
forming network. As this network has a completely reversible
structure, it is self-regulated. Consequently, the network
responds to this perturbation by evolving as a whole toward
a final, well-defined, equilibrium stage and the productivity of
L(�)-carnitine evolves accordingly, as it does the biotransform-
ing network when goes to recover its thermodynamic stability
condition. So, interventions to improve L(�)-carnitine specific
productivity might to be aimed at breaking the self-regulatory
behavior of the biotransforming network.
3. Concluding remarks
The present study constitutes a new round in the laborious
process of model refinement which started with the first model
of L(�)-carnitine production presented by Canovas et al. [18],
followed by the model of Alvarez-Vasquez et al. [22]. However,
to attain a plausible model representation of a complex
biological system, progressive rounds of assumptions and
model predictions are required. Each theoretical round must be
followed by experimental checking.
Mathematical modeling, besides describing and optimizing,
can also contribute to data interpretation when based on
parameters with a clear physiological meaning. Thus,
mathematical modeling also offers the possibility to test in
silico conflicting hypotheses [41].
In the present work, we have examined some underlying
assumptions of the first presentation. As was shown in Section
2, some previous assumptions might be reconsidered. Thus,
from the developed mmax model, a new operating strategy to
increase the growth rate by about 140% was proposed. On the
other hand, from our new interpretation about the causes
leading to decreased L(�)-carnitine productivity, we concluded
that interventions to improve this parameter have to be aimed at
breaking the self-regulatory behavior of the biotransforming
network processes rather than at solving an energy limitation
problem.
These conclusions suggest new venues for basic and
technological research, since disruption of the self-regulatory
behavior of the network implies a first step in the search for
rational multi-objective policies for the optimal feeding of
substrates and precursors during bioreactor operation [42]. In a
second step, the construction of a new type of engineered
microorganism may be needed. However, in this case, the
rational design of an efficient recombinant strain would require
the role of the already characterized betaine-like carriers to be
clarified, whether for redefining their operating mechanism or
to determine if other alternative transport mechanisms are at
work.
Another question which remains to be explained is the basis
for the deviations (that can be verified on experimental data)
regarding high-density cell cultures in recycle reactors [18]
with respect to the 1:1 ratio herein quantified for the molar yield
between the crotonobetaine consumed and the L(�)-carnitine
excreted in batch operation.
Finally, for a precise evaluation of the mechanisms proposed
for L(�)-carnitine biosynthesis, further studies aimed at the
elucidation of the processes involved in the glycerol growth-
inhibitory effect, as well as at determining the energetic
efficiency of the wild and recombinant strains, are necessary.
This information would allow the energetic (ATP), reductive
(NADH, NADPH), and CoA dynamics to be accounted for.
However, since the catabolism of amino acids in anaerobiosis
leads to the formation of many end products common to those
associated with glycerol catabolism, previous studies [21]
might reconsider this topic.
In brief, we believe that the type of analysis carried-out in
this work constitutes a key feature in any model-building
project. It is expected that the observed discrepancies will
stimulate the next phase of model amendments and refine-
ments.
Acknowledgements
This work was funded by research grants from Spanish
MCyT, ref. no. BIO 2002-04157-C02-01 and BIO 2002-04157-
C02-02.
References
[1] Kleber K, Jung H, Kleber HP. Regulation of L(�)-carnitine metabolism in
Escherichia coli. J Basic Microbiol 1987;27:131–7.
[2] Jung H, Buchholz M, Clausen J, Nietschke M, Revermann A, Schmid R, et
al. CaiT of Escherichia coli, a new transporter catalyzing L-carnitine/g-
butirobetaine exchange. J Biol Chem 2002;42:39251–8.
[3] Jung H, Jung K, Kleber HP. L-Carnitine metabolization and osmotic stress
response in Escherichia coli. J Basic Microbiol 1990;30:409–13.
[4] Engemann C, Kleber HP. Epigenetic regulation of L-carnitine metaboliz-
ing enzymes in Proteus sp. under aerobic conditions. FEMS Microbiol
Lett 2001;196:1–6.
[5] Rebouche CJ, Paulson DJ. Carnitine metabolism and function in human.
Ann Rev Nutr 1986;6:41–66.
[6] Breningstall GN. Carnitine deficiency syndromes. Paedriat Neurol 1990;
6:75–81.
[7] Seim H, Eichler K, Kleber HPK. L(�)-Carnitine and its precursor
g-butirobetaine. In: Hoppe PL, Packer L, editors. Nutraceuticals in
D.V. Guebel et al. / Process Biochemistry 41 (2006) 281–288288
health and disease prevention. New York: Marcel Dekker Inc.; 2001. p.
217–56.
[8] Jung H, Jung K, Kleber HP. Purification and properties of L-carnitine
dehydratase from Escherichia coli—a new enzyme of L-carnitine meta-
bolization. Biochim Biophys Acta 1989;1003:270–6.
[9] Roth S, Jung K, Jung H, Homel RK, Kleber HP. Crotonobetaine reductase
from Escherichia coli—a new enzyme inducible enzyme of anaerobic
metabolization of L-(�)carnitine. Antonie Van Leuuwenhoek 1994;65:
63–9.
[10] Kleber HP. Bacterial L-carnitine metabolism. FEMS Microbiol Lett
1997;147:1–9.
[11] Eichler K, Bourgis F, Buchet A, Kleber HP, Mandrand-Berthelot MA.
Molecular characterization of the cai operon necessary for carnitine
metabolism in Escherichia coli. Mol Microbiol 1994;13:775–86.
[12] Eichler K, Buchet A, Bouris F, Kleber HP, Mandrand-Berthelot MA. The
fix Escherichia coli region contains four genes related to L-carnitine
metabolism. J Basic Microbiol 1995;35:217–27.
[13] Hoeks FWJMM, Kulla H, Meyer HP. Continuous cell-recycle process for
L-carnitine production: performance, engineering and downstream pro-
cessing aspects compared with discontinuous processes. Chem Eng J
1992;22:117–28.
[14] Castellar MR, Canovas M, Kleber HP, Iborra JL. Biotransformation of
D(+)–L(�)-carnitine by resting cells of Escherichia coli O44K7. J Appl
Microbiol 1998;85:883–90.
[15] Castellar MR, Obon JM, Maran A, Canovas M, Iborra JL. L-Carnitine
production using a recombinant Escherichia coli strain. Enzyme Micro-
biol Technol 2001;28:785–91.
[16] Obon JM, Maıquez JR, Canovas M, Kleber HP, Iborra JL. High density E.
coli cell system for continuous L-carnitine production. Appl Microb
Biotechnol 1999;51:760–4.
[17] Torroglosa T. Biotransformacion de compuestos de trimetilamonio con
cepas de E. coli para la produccion de L(�)-carnitina. Ph.D. thesis. Spain:
Universidad de Murcia; 2003.
[18] Canovas M, Maiquez JR, Obon JM, Iborra JL. Modeling of the biotrans-
formation of crotonobetaine into L(�)-carnitine by Escherichia coli
strains. Biotechnol Bioeng 2002;77:764–75.
[19] Canovas M, Maiquez J, De Diego T, Buendıa B, Espinosa G, Iborra JL.
Membrane cell retention systems for continuous production of L-carnitine
using Proteus sp. J Membr Sci 2003;214:101–11.
[20] Canovas M, Torroglosa T, Kleber HP, Iborra JL. Effect of salt stress on
crotonobetaine and D(+) L-carnitine biotransformation into L(�)-carnitine
by resting cells of Escherichia coli. J Basic Microbiol 2003;43:259–68.
[21] Canovas M, Bernal V, Torroglosa T, Ramirez JL, Iborra JL. Link between
primary and secondary metabolism in the biotransformation of trimethy-
lammonium compounds by Escherichia coli. Biotechnol Bioeng 2003;
84:686–99.
[22] Alvarez-Vasquez F, Canovas M, Iborra JL, Torres NV. Modeling, optimiza-
tion and experimental assessment of continuous L(�)-carnitine production
by Escherichia coli cultures. Biotechnol Bioeng 2002;80:794–805.
[23] Marin-Sanguino A, Torres NV. Optimization of tryptophan production in
bacteria. Design a strategy for genetic manipulation of the tryptophan operon
for tryptophan flux maximization. Biotechnol Prog 2000;16:133–45.
[24] Guebel DV, Torres Darias NV. Optimization of the citric acid production
by A. niger through a metabolic flux balance model. Electron J Biotechnol
2001;4 [online] available in the Web athttp://www.ejbiotechnology.info/
content/vol4/issue1/full2.
[25] Voegele RT, Sweet GD, Boos W. Glycerol kinase of Escherichia coli is
activated by interaction with the glycerol facilitator. J Bacteriol 1993;
175:1087–94.
[26] Lu D, Grayson P, Schulten K. Glycerol conductance and physical asym-
metry of the Escherichia coli glycerol facilitator GlpF. Biophys J 2003;
85:2977–87.
[27] Elssner T, Henning L, Frauendorf H, Haferburg D, Kleber HP. Isolation,
identification and synthesis of gamma-butirobetainyl-CoA and crotono-
betainyl-CoA compounds involved in carnitine metabolism of E. coli.
Biochemistry 2000;39:10761–9.
[28] Elssner T, Engemann C, Baumgart K, Kleber HP. Involvement for
coenzyme A esters and two new enzymes, an enoyl-CoA hydratase
and a CoA transferase, in the hydratation of crotonobetaine to L(�)-
carnitine by Escherichia coli. Biochemistry 2001;40:11140–8.
[29] Verheul A, Wouters JA, Rombouts FM, Abee T. A possible role of ProP,
ProU and CaiT in osmoprotection of Escherichia coli by L-carnitine. J
Appl Microbiol 1998;85:1036–46.
[30] Racher KI, Culham DE, Wood JM. Requirements for osmosensing and
osmotic activation of transporter ProP from Escherichia coli. Biochem-
istry 2001;40:7324–33.
[31] Jung H, Jung K, Kleber HP. L-Carnitine uptake byEscherichia coli. J Basic
Microbiol 1990;30:507–14.
[32] Larsen PI, Sydnes LK, Landfald B, Strom AR. Osmoregulation in
Escherichia coli by accumulation of organic osmolites: betaines, glutamic
acid and trehalose. Arch Microbiol 1987;147:1–7.
[33] Erickson LE, Minkevich IG, Eroshin VK. Application of mass and energy
balance regularities in fermentation. Biotechnol Bioeng 1978;XX:1595–
621 [reprinted in Biotechnol Bioeng 2000;67:748–74].
[34] [a] Roels J. Energetic and kinetics in biotechnology. Amsterdam: Elsevier
Scientific Publishers, 1983. p. 23–74;
[b] Roels J. Energetic and kinetics in biotechnology. Amsterdam: Elsevier
Scientific Publishers, 1983. p. 204–231.
[35] Noorman HJ, Heijnen JJ, Luyben KCM. Linear relation in microbial
reaction systems: a general overview of their origin, form and use.
Biotechnol Bioeng 1991;38:603–18.
[36] Kroger A. Fumarate as terminal acceptor of phosphorylative electron
transport. Biochim Biophys Acta 1978;505:129–45.
[37] Maklashina E, Berthold DA, Cecchini G. Anaerobic expression of
Escherichia coli succinate dehydrogenase: functional replacement of
fumarate reductase in the respiratory chain during anaerobic growth. J
Bacteriol 1998;180:5989–96.
[38] Cunchillos Ch, Lecointre G. Evolution of amino acid metabolism inferred
through cladistic analysis. J Biol Chem 2003;278:47960–70.
[39] Amewzaga R, Booth IR. Osmoprotection of Escherichia coli by peptone is
mediated by the uptake and accumulation of free proline but not of
proline-containing peptides. Appl Environ Microbiol 1999;65:5272–8.
[40] Maurel C, Reizer J, Schroeder JI, Chrispeels MJ, Saier MH. Functional
characterization of the Escherichia coli glycerol facilitator, GlpF, in
Xenopus oocytes. J Biol Chem 1994;269:11869–72.
[41] Guebel DV, Torres NV. Interactive astrocytic-neuronal sulphur amino acid
metabolism in mammalian brain: its assessment by a mathematical hybrid
model. Biochim Biophys Acta 2004;1674:12–28.
[42] Vera J, De Atauri P, Cascante M, Torres NV. Multicriteria optimization of
biochemical systems by linear programming. Application to the ethanol
production by Saccharomyces cerevisiae. Biotechnol Bioeng 2003;83:
335–43.
Copyright © 2022 FDOKUMEN