Modelled Perception by Insect Pollinators - MDPI
14
plants Article The Effects of Ozone on Visual Attraction Traits of Erodium paularense (Geraniaceae) Flowers: Modelled Perception by Insect Pollinators Samuel Prieto-Benítez * , Raquel Ruiz-Checa, Victoria Bermejo-Bermejo and Ignacio Gonzalez-Fernandez Citation: Prieto-Benítez, S.; Ruiz-Checa, R.; Bermejo-Bermejo, V.; Gonzalez-Fernandez, I. The Effects of Ozone on Visual Attraction Traits of Erodium paularense (Geraniaceae) Flowers: Modelled Perception by Insect Pollinators. Plants 2021, 10, 2750. https://doi.org/10.3390/ plants10122750 Academic Editor: Simon Hodge Received: 28 October 2021 Accepted: 8 December 2021 Published: 14 December 2021 Publisher’s Note: MDPI stays neutral with regard to jurisdictional claims in published maps and institutional affil- iations. Copyright: © 2021 by the authors. Licensee MDPI, Basel, Switzerland. This article is an open access article distributed under the terms and conditions of the Creative Commons Attribution (CC BY) license (https:// creativecommons.org/licenses/by/ 4.0/). Ecotoxicology of Air Pollution, Environmental Department CIEMAT, 28040 Madrid, Spain; [email protected] (R.R.-C.); [email protected] (V.B.-B.); [email protected] (I.G.-F.) * Correspondence: [email protected] Abstract: Ozone (O 3 ) effects on the visual attraction traits (color, perception and area) of petals are described for Erodium paularense, an endangered plant species. Plants were exposed to three O 3 treatments: charcoal-filtered air (CFA), ambient (NFA) and ambient + 40 nL L -1 O 3 (FU+) in open-top chambers. Changes in color were measured by spectral reflectance, from which the anthocyanin reflectance index (ARI) was calculated. Petal spectral reflectance was mapped onto color spaces of bees, flies and butterflies for studying color changes as perceived by different pollinator guilds. Ozone-induced increases in petal reflectance and a rise in ARI under NFA were observed. Ambient O 3 levels also induced a partial change in the color perception of flies, with the number of petals seen as blue increasing to 53% compared to only 24% in CFA. Butterflies also showed the ability to partially perceive petal color changes, differentiating some CFA petals from NFA and FU+ petals through changes in the excitation of the UV photoreceptor. Importantly, O 3 reduced petal area by 19.8 and 25% in NFA and FU+ relative to CFA, respectively. In sensitive species O 3 may affect visual attraction traits important for pollination, and spectral reflectance is proposed as a novel method for studying O 3 effects on flower color. Keywords: pollination syndrome; biodiversity; Mediterranean mountain ecosystems; petal pigments; petal area; flower spectral reflectance 1. Introduction Tropospheric ozone (O 3 ) is one of the most important atmospheric pollutants, owing to its wide distribution and high toxicity, and it is also a short-lived greenhouse gas [1–4]. The main precursors of O 3 are due to industrial activity and transportation. However, high O 3 levels are found in rural, background and mountainous areas downwind of pollution sources [5–9]. The Mediterranean basin is considered a global biodiversity hotspot that is partic- ularly affected by O 3 pollution [10,11]. The characteristics of the Mediterranean climate enhance the formation and persistence of O 3 , resulting in frequent and high-concentration episodes [4,8,12,13]. One of the most adverse threats of O 3 , from a biodiversity and ecosystem functioning conservation perspective, is its effect on the reproductive ability of wild herbs [3,11,14]. O 3 effects on flower number and biomass have been used to define critical levels for O 3 risk assessment on semi-natural vegetation (sensu [15]) communities within the UNECE Convention on Long-Range Transboundary Air Pollution [16,17]. High levels of O 3 can alter the development of flowers including timing of flowering [18,19]. Ozone can also decrease the number or biomass of flowers [20–27], although in some species it may have the opposite effect [28–30]. In contrast to flower number or biomass, the effects of O 3 on other important pol- lination syndrome traits, such as floral traits related to the attraction of a specific group Plants 2021, 10, 2750. https://doi.org/10.3390/plants10122750 https://www.mdpi.com/journal/plants
-
Upload
khangminh22 -
Category
Documents
-
view
2 -
download
0
Transcript of Modelled Perception by Insect Pollinators - MDPI

plants
Article
The Effects of Ozone on Visual Attraction Traits of Erodiumpaularense (Geraniaceae) Flowers Modelled Perception byInsect Pollinators
Samuel Prieto-Beniacutetez Raquel Ruiz-Checa Victoria Bermejo-Bermejo and Ignacio Gonzalez-Fernandez
Citation Prieto-Beniacutetez S
Ruiz-Checa R Bermejo-Bermejo V
Gonzalez-Fernandez I The Effects of
Ozone on Visual Attraction Traits of
Erodium paularense (Geraniaceae)
Flowers Modelled Perception by
Insect Pollinators Plants 2021 10
2750 httpsdoiorg103390
plants10122750
Academic Editor Simon Hodge
Received 28 October 2021
Accepted 8 December 2021
Published 14 December 2021
Publisherrsquos Note MDPI stays neutral
with regard to jurisdictional claims in
published maps and institutional affil-
iations
Copyright copy 2021 by the authors
Licensee MDPI Basel Switzerland
This article is an open access article
distributed under the terms and
conditions of the Creative Commons
Attribution (CC BY) license (https
creativecommonsorglicensesby
40)
Ecotoxicology of Air Pollution Environmental Department CIEMAT 28040 Madrid SpainRaquelRuizChecaciemates (RR-C) victoriabermejociemates (VB-B) ignaciogonzalezciemates (IG-F) Correspondence samuelprietociemates
Abstract Ozone (O3) effects on the visual attraction traits (color perception and area) of petals aredescribed for Erodium paularense an endangered plant species Plants were exposed to three O3
treatments charcoal-filtered air (CFA) ambient (NFA) and ambient + 40 nL Lminus1 O3 (FU+) in open-topchambers Changes in color were measured by spectral reflectance from which the anthocyaninreflectance index (ARI) was calculated Petal spectral reflectance was mapped onto color spacesof bees flies and butterflies for studying color changes as perceived by different pollinator guildsOzone-induced increases in petal reflectance and a rise in ARI under NFA were observed AmbientO3 levels also induced a partial change in the color perception of flies with the number of petalsseen as blue increasing to 53 compared to only 24 in CFA Butterflies also showed the ability topartially perceive petal color changes differentiating some CFA petals from NFA and FU+ petalsthrough changes in the excitation of the UV photoreceptor Importantly O3 reduced petal area by198 and 25 in NFA and FU+ relative to CFA respectively In sensitive species O3 may affect visualattraction traits important for pollination and spectral reflectance is proposed as a novel method forstudying O3 effects on flower color
Keywords pollination syndrome biodiversity Mediterranean mountain ecosystems petal pigmentspetal area flower spectral reflectance
1 Introduction
Tropospheric ozone (O3) is one of the most important atmospheric pollutants owingto its wide distribution and high toxicity and it is also a short-lived greenhouse gas [1ndash4]The main precursors of O3 are due to industrial activity and transportation However highO3 levels are found in rural background and mountainous areas downwind of pollutionsources [5ndash9]
The Mediterranean basin is considered a global biodiversity hotspot that is partic-ularly affected by O3 pollution [1011] The characteristics of the Mediterranean climateenhance the formation and persistence of O3 resulting in frequent and high-concentrationepisodes [481213]
One of the most adverse threats of O3 from a biodiversity and ecosystem functioningconservation perspective is its effect on the reproductive ability of wild herbs [31114]O3 effects on flower number and biomass have been used to define critical levels for O3risk assessment on semi-natural vegetation (sensu [15]) communities within the UNECEConvention on Long-Range Transboundary Air Pollution [1617] High levels of O3 canalter the development of flowers including timing of flowering [1819] Ozone can alsodecrease the number or biomass of flowers [20ndash27] although in some species it may havethe opposite effect [28ndash30]
In contrast to flower number or biomass the effects of O3 on other important pol-lination syndrome traits such as floral traits related to the attraction of a specific group
Plants 2021 10 2750 httpsdoiorg103390plants10122750 httpswwwmdpicomjournalplants
Plants 2021 10 2750 2 of 14
of pollinators [3132] are less studied Ozone effects at environmentally relevant concen-trations on pollen and nectar fresh weight or composition important nutritional sourcesfor pollinators have been described for some plant species [33ndash35] Pollinators associatethese nutritive rewards with a range of flower traits that can also be affected by O3 Ozoneeffects on nectar composition in Vicia faba changed honeybee olfactory associations whichcould have an effect on floral visitation rates [35] Floral scent blends were modified byO3 exposure in Brassicaceae species [36] while different studies show that floral volatileemissions can decompose faster in O3 rich atmospheres decreasing the range of attractionfor pollinators [37ndash40] All these effects can result in the altered behavior of some pollinatorguilds as described for Sinapis arvensis plants exposed to O3 [28]
The detection of flowers also depends on the color and on the size of the coloredparts [41] Ozone has been described to decrease color in flowers of Saintpaulia lonantha [42]but changes in flower detectability by pollinators may vary depending on the guild ofpollinators Bees flies and butterflies have different photoreceptors with different colorsensitivities [414344] Thus color changes and detectability by different pollinator guildsmust be addressed together with studying the effects on pollination syndromes No O3effects on petal size have been reported to date
While most of the studies about the O3 sensitivity of herbaceous semi-natural vege-tation species have focused on widely distributed species or plant communities relevantinformation for biodiversity conservation may be obtained from studies with endemicor vulnerable species In the present experiment we studied the sensitivity of Erodiumpaularense Fzed Gled and Isco (Geraniaceae) (Figure 1) a plant endemic to central Spainthat inhabits the mountain slopes of the Central System [4546] within the Mediterraneanbiogeographical region This species is categorized as endangered (EN) by the red listof Spanish vascular flora [47] E paularense is a perennial woody rosulate chamaephyteFlowers have five purplish-pink to whitish-pink colored petals with three to eight flowersclumped in each inflorescence and are protandrous with visible nectar production [4548]E paularense is a self-incompatible species its seeds are only formed from crosspollinationand its flowers are visited by bees butterflies and flies [4849] Its distinctive colored petalscan be a visual signal for pollinator attraction [45] Therefore changes in color and petalsize may affect the pollination success of this species
Plants 2021 10 x FOR PEER REVIEW 2 of 14
In contrast to flower number or biomass the effects of O3 on other important pollination syndrome traits such as floral traits related to the attraction of a specific group of pollinators [3132] are less studied Ozone effects at environmentally relevant concentrations on pollen and nectar fresh weight or composition important nutritional sources for pollinators have been described for some plant species [33ndash35] Pollinators associate these nutritive rewards with a range of flower traits that can also be affected by O3 Ozone effects on nectar composition in Vicia faba changed honeybee olfactory associations which could have an effect on floral visitation rates [35] Floral scent blends were modified by O3 exposure in Brassicaceae species [36] while different studies show that floral volatile emissions can decompose faster in O3 rich atmospheres decreasing the range of attraction for pollinators [37ndash40] All these effects can result in the altered behavior of some pollinator guilds as described for Sinapis arvensis plants exposed to O3 [28]
The detection of flowers also depends on the color and on the size of the colored parts [41] Ozone has been described to decrease color in flowers of Saintpaulia lonantha [42] but changes in flower detectability by pollinators may vary depending on the guild of pollinators Bees flies and butterflies have different photoreceptors with different color sensitivities [414344] Thus color changes and detectability by different pollinator guilds must be addressed together with studying the effects on pollination syndromes No O3 effects on petal size have been reported to date
While most of the studies about the O3 sensitivity of herbaceous semi-natural vegetation species have focused on widely distributed species or plant communities relevant information for biodiversity conservation may be obtained from studies with endemic or vulnerable species In the present experiment we studied the sensitivity of Erodium paularense Fzed Gled and Isco (Geraniaceae) (Figure 1) a plant endemic to central Spain that inhabits the mountain slopes of the Central System [4546] within the Mediterranean biogeographical region This species is categorized as endangered (EN) by the red list of Spanish vascular flora [47] E paularense is a perennial woody rosulate chamaephyte Flowers have five purplish-pink to whitish-pink colored petals with three to eight flowers clumped in each inflorescence and are protandrous with visible nectar production [4548] E paularense is a self-incompatible species its seeds are only formed from crosspollination and its flowers are visited by bees butterflies and flies [4849] Its distinctive colored petals can be a visual signal for pollinator attraction [45] Therefore changes in color and petal size may affect the pollination success of this species
Figure 1 Picture of E paularense in bloom Figure 1 Picture of E paularense in bloom
The O3 sensitivity of E paularense pollinator visual attraction traits was tested inan O3 fumigation experiment using open-top chambers (OTCs) Petal area and spectralreflectance were measured as treatment responses We hypothesized that O3 could reduce
Plants 2021 10 2750 3 of 14
petal development and induce color changes as a result of increases in petal anthocyaninlevels as estimated using spectral reflectance measurements which may be related toan antioxidant response against O3 injury [50] Petal reflectance was also mapped ontocolor spaces based on the relative excitations of the photoreceptors of bees flies andbutterflies [44] to assess if color change could be perceptible by pollinators Specificallywe aimed to answer the following questions (i) Is petal area affected by O3 exposure(ii) Do the petal color and anthocyanin content change in response to O3 (iii) Does thechamber effect change the size and color of petals (iv) Can O3-induced petal color changesbe perceived by bees flies and butterflies
2 Results21 Ozone Exposure and Growing Conditions
Plants growing in OTCs were subjected to a range of O3 exposures Plants in charcoal-filtered air (CFA) were the least exposed to ozone showing a filtration efficiency of 475compared to the ambient O3 levels recorded in chamber-less plots (AMB) (Table 1A) AMBand non-filtered air (NFA) OTCs exhibited comparable O3 exposures with 29 lower O3concentration in NFA compared with AMB non-filtered air supplemented with 40 nL Lminus1
of O3 (FU+) plants were the most exposed with O3 concentrations 564 higher than thoseof the ambient levels and an AOT40 around 10000 nL Lminus1 h higher than that of AMB andNFA
Table 1 (A) Ozone exposure conditions during the experiment N LM or LMM and N PERM are the number of petalsused in lineal models or lineal mixed models and PERMANOVA respectively AOT40 is the accumulated (37 days) O3
concentration over a threshold of 40 nL Lminus1 during daylight hours 7ndash15 h O3 nL Lminus1 is the mean (7ndash15 h) O3 concentrationDaily O3 mean nL Lminus1 is the mean (0ndash24 h) O3 concentration (B) Chamber effect on growing conditions Mean and maxtemperature (Tordf) relative humidity (RH) vapor pressure deficit (VDP) and photosynthetic active radiation (PAR) are themean values during daylight hours outside (ambient) and inside the OTCs (OTC)
(A) Ozone Exposure and N AOT40 7ndash15 h O3 Mean Daily O3 Mean
Treatment N LM or LMM N PERM (nL Lminus1 h) (nL Lminus1) (nL Lminus1)
AMB 17 18 29227 413 36CFA 17 17 237 217 173NFA 15 17 23332 401 352FU+ 17 18 121215 646 488
(B) Growth Conditions
Mean Tordf (C) Max Tordf (C) RH () VPD (kPa) PAR micromol (mminus2 sminus1)
Ambient 158 286 525 078 841OTC 191 336 565 106 6982
During daylight hours the OTC effect was characterized by a 33 C temperaturewarming 4 higher relative air humidity a 36 increase in VPD and 17 less photosyn-thetic active radiation (PAR) (Table 1B) The similarity between ozone levels in AMB andNFA treatments allowed for testing the effect of the change in growing conditions on petalvariables which we termed the chamber effect As the plants growing inside the OTCsshared the same growing conditions the effect due to different ozone levels was testedusing only OTC treatments (CFA NFA and FU+)
22 Ozone and Chamber Effects on Petal Area Reflectance and ARI
Petal area (Figure 2) was reduced by O3 exposure by 198 and 25 in NFA andFU+ compared to CFA respectively (χ2
1 = 504 p = 0025) The model with the plant as arandom factor yielded the lowest AIC values and the priori contrast for petal area usedwas CFA different from NFA and FU+
Plants 2021 10 2750 4 of 14Plants 2021 10 x FOR PEER REVIEW 4 of 14
Figure 2 Mean and SE of petal area in charcoal-filtered air (CFA) non-filtered air (NFA) non-filtered air with 40 nL Lminus1 of O3 (FU+) and chamber-less (AMB) treatments Ozone effects (CFA NFA and FU+) and chamber effects (AMB versus NFA) are presented separately Different letters denote differences at p lt 005 among treatments
Ozone (NFA and FU+) also induced an increase in relative reflectance across the full spectrum (Figure 3A) and this increase was significant in the PERMANOVA analysis (F3
66 =324 p = 002) In consequence when the maximum height of the peak from 325 to 600 nm was analyzed the a priori test showed a linear increase in this peak from CFA to FU+ F245 = 701 p = 0002) However flowers grown under CFA and FU+ shared similar ARI levels and only NFA had high ARI values using the a priori contrasts based on treatment means (F146 = 42 p = 0046) For ARI and the maximum height of the peak from 325 to 600 nm ozone analyses the model with lower AIC values was the one without the plant as a random factor
Figure 3 Mean petal relative reflectance spectrum per treatment (left) and mean anthocyanin reflectance index (ARI) of petals (right) (A) Ozone (O3) treatment levels are compared for charcoal-filtered air (CFA) non-filtered air (NFA) and non-filtered air with 40 nl lminus1 of O3 (FU+) (B) Chamber effect and plants growing outside open-top chambers (AMB) are compared with NFA Error bars denote the standard error of the mean Different letters denote differences at p lt 005 among treatments
The chamber effect (AMB vs NFA Figures 2 and 3B) did not result in changes in maximum height of peaks from 325 to 600 nm ARI or petal size (χ21 = 0035 p = 085 χ21 =
02 p = 088 F130 = 0003 p = 096 respectively) For the chamber effect analyses of ARI and
Figure 2 Mean and SE of petal area in charcoal-filtered air (CFA) non-filtered air (NFA) non-filtered air with 40 nL Lminus1 ofO3 (FU+) and chamber-less (AMB) treatments Ozone effects (CFA NFA and FU+) and chamber effects (AMB versus NFA)are presented separately Different letters denote differences at p lt 005 among treatments
Ozone (NFA and FU+) also induced an increase in relative reflectance across the fullspectrum (Figure 3A) and this increase was significant in the PERMANOVA analysis(F3 66 =324 p = 002) In consequence when the maximum height of the peak from 325to 600 nm was analyzed the a priori test showed a linear increase in this peak from CFAto FU+ F245 = 701 p = 0002) However flowers grown under CFA and FU+ sharedsimilar ARI levels and only NFA had high ARI values using the a priori contrasts basedon treatment means (F146 = 42 p = 0046) For ARI and the maximum height of the peakfrom 325 to 600 nm ozone analyses the model with lower AIC values was the one withoutthe plant as a random factor
Plants 2021 10 x FOR PEER REVIEW 4 of 14
Figure 2 Mean and SE of petal area in charcoal-filtered air (CFA) non-filtered air (NFA) non-filtered air with 40 nL Lminus1 of O3 (FU+) and chamber-less (AMB) treatments Ozone effects (CFA NFA and FU+) and chamber effects (AMB versus NFA) are presented separately Different letters denote differences at p lt 005 among treatments
Ozone (NFA and FU+) also induced an increase in relative reflectance across the full spectrum (Figure 3A) and this increase was significant in the PERMANOVA analysis (F3
66 =324 p = 002) In consequence when the maximum height of the peak from 325 to 600 nm was analyzed the a priori test showed a linear increase in this peak from CFA to FU+ F245 = 701 p = 0002) However flowers grown under CFA and FU+ shared similar ARI levels and only NFA had high ARI values using the a priori contrasts based on treatment means (F146 = 42 p = 0046) For ARI and the maximum height of the peak from 325 to 600 nm ozone analyses the model with lower AIC values was the one without the plant as a random factor
Figure 3 Mean petal relative reflectance spectrum per treatment (left) and mean anthocyanin reflectance index (ARI) of petals (right) (A) Ozone (O3) treatment levels are compared for charcoal-filtered air (CFA) non-filtered air (NFA) and non-filtered air with 40 nl lminus1 of O3 (FU+) (B) Chamber effect and plants growing outside open-top chambers (AMB) are compared with NFA Error bars denote the standard error of the mean Different letters denote differences at p lt 005 among treatments
The chamber effect (AMB vs NFA Figures 2 and 3B) did not result in changes in maximum height of peaks from 325 to 600 nm ARI or petal size (χ21 = 0035 p = 085 χ21 =
02 p = 088 F130 = 0003 p = 096 respectively) For the chamber effect analyses of ARI and
Figure 3 Mean petal relative reflectance spectrum per treatment (left) and mean anthocyaninreflectance index (ARI) of petals (right) (A) Ozone (O3) treatment levels are compared for charcoal-filtered air (CFA) non-filtered air (NFA) and non-filtered air with 40 nL Lminus1 of O3 (FU+) (B) Chambereffect and plants growing outside open-top chambers (AMB) are compared with NFA Error barsdenote the standard error of the mean Different letters denote differences at p lt 005 amongtreatments
The chamber effect (AMB vs NFA Figures 2 and 3B) did not result in changes in max-imum height of peaks from 325 to 600 nm ARI or petal size (χ2
1 = 0035 p = 085 χ21 = 02
p = 088 F130 = 0003 p = 096 respectively) For the chamber effect analyses of ARI andthe maximum height of the peak from 325 to 600 nm the model with lower AIC values wasthe one with the plant as a random factor but for petal area the lowest AIC was obtainedfor the model without the factor plant
Plants 2021 10 2750 5 of 14
23 Ozone and Chamber Effects on Pollinator Color Perception
Figure 4 summarizes treatment effects on fly bee and butterfly color perceptions ofpetals Each dot represents the color perception of a single petal by a specific pollinatorThe different axes defining the color spaces represent the relative excitation level of aparticular photoreceptor The color spaces (described in Figure 5) are divided in 4 and6 sections for flies and bees respectively each of them corresponding to a perceived colorButterfly color space is represented by a tetrahedron where each vertex corresponds to theperception of a specific color There were some differences in the fly color space amongO3 treatments (Figure 4A) In fly vision most of the FU+ petals (83) were seen as FlyYellow while 53 and 24 of the NFA and CFA petals respectively were in the Fly Bluequadrant In bee color space E paularense petals were in the UV-Blue and Blue segments ofthe hexagon Although most of the CFA petals were concentrated next to the higher valuesof the bee UV-Green color axis there was no point beyond the 009 Euclidean distancethreshold that would indicate a perceptible change in color for bees (Figure 4B) In butterflyvision the UV photoreceptor (u) showed the greatest variability among O3 treatmentswith most CFA petals situated in the lower values of the UV photoreceptor Althoughconsiderable overlapping was found between treatment levels six CFA petals exceeded the003 threshold established for the color discrimination of butterflies (ellipse in Figure 4C) inthe UV axis (photoreceptor u) A total of 47 and 33 of NFA and FU+ petals respectivelyshowed a perceptible color change for butterflies compared with CFA petals highlightedby the ellipse There was no chamber effect in the vision of the E paularense petals and noclear differentiation between AMB and NFA treatments were detected in any of the threecolor spaces (Figure 4)
Plants 2021 10 x FOR PEER REVIEW 5 of 14
the maximum height of the peak from 325 to 600 nm the model with lower AIC values was the one with the plant as a random factor but for petal area the lowest AIC was obtained for the model without the factor plant
23 Ozone and Chamber Effects on Pollinator Color Perception Figure 4 summarizes treatment effects on fly bee and butterfly color perceptions of
petals Each dot represents the color perception of a single petal by a specific pollinator The different axes defining the color spaces represent the relative excitation level of a particular photoreceptor The color spaces (described in Figure 5) are divided in 4 and 6 sections for flies and bees respectively each of them corresponding to a perceived color Butterfly color space is represented by a tetrahedron where each vertex corresponds to the perception of a specific color There were some differences in the fly color space among O3 treatments (Figure 4A) In fly vision most of the FU+ petals (83) were seen as Fly Yellow while 53 and 24 of the NFA and CFA petals respectively were in the Fly Blue quadrant In bee color space E paularense petals were in the UV-Blue and Blue segments of the hexagon Although most of the CFA petals were concentrated next to the higher values of the bee UV-Green color axis there was no point beyond the 009 Euclidean distance threshold that would indicate a perceptible change in color for bees (Figure 4B) In butterfly vision the UV photoreceptor (u) showed the greatest variability among O3 treatments with most CFA petals situated in the lower values of the UV photoreceptor Although considerable overlapping was found between treatment levels six CFA petals exceeded the 003 threshold established for the color discrimination of butterflies (ellipse in Figure 4C) in the UV axis (photoreceptor u) A total of 47 and 33 of NFA and FU+ petals respectively showed a perceptible color change for butterflies compared with CFA petals highlighted by the ellipse There was no chamber effect in the vision of the E paularense petals and no clear differentiation between AMB and NFA treatments were detected in any of the three color spaces (Figure 4)
Figure 4 Fly (A) bee (B) and butterfly (C) vision of E paularense petals For each pollinator guild petal color is represented by the color space (colors spaces in Figure 5) according to how they would be perceived Left panels zoom-in O3
Figure 4 Fly (A) bee (B) and butterfly (C) vision of E paularense petals For each pollinator guildpetal color is represented by the color space (colors spaces in Figure 5) according to how they wouldbe perceived Left panels zoom-in O3 treatments charcoal-filtered air (CFA) non-filtered air (NFA)and non-filtered air + 40 nL Lminus1 of O3 (FU+) Right panels represent the chamber effect and chamber-less plots (AMB) are compared with NFA Bee UV-Blue and Bee Blue are segments of the bee hexagonFly Blue and Fly Yellow are fly color categories Butterfly colors are represented by UV (u) Blue (s)Green (m) and Red (l) triangles in the x y and z axes For each color space the axes values denotethe excitation of each petal on each photoreceptor type scaled into the color space
Plants 2021 10 2750 6 of 14
Plants 2021 10 x FOR PEER REVIEW 6 of 14
treatments charcoal-filtered air (CFA) non-filtered air (NFA) and non-filtered air + 40 nL Lminus1 of O3 (FU+) Right panels represent the chamber effect and chamber-less plots (AMB) are compared with NFA Bee UV-Blue and Bee Blue are segments of the bee hexagon Fly Blue and Fly Yellow are fly color categories Butterfly colors are represented by UV (u) Blue (s) Green (m) and Red (l) triangles in the x y and z axes For each color space the axes values denote the excitation of each petal on each photoreceptor type scaled into the color space
Figure 5 Schematic representation of the O3 treatment and chamber effects on Erodium paularense petals area and their reflectance spectrum and how pollinators perceive petal colors At the top from left to right a molecule of ozone a flower of E paularense and an OTC are presented In the center there is the mean reflectance spectra of all the petals measured in the experiment Around the spectra there are the color spaces for bees (hexagon) flies (rectangle a hoverfly is represented) and butterflies (tetrahedron) The dots within the color spaces are the perceived color for each petal from the experiment E (B) E (UV) E (G) are Blue UV and Green bee colors Fly Blue Fly UV Fly Purple and Fly Yellow are the fly color categories Butterfly colors are UV (u) Blue (s) Green (m) and Red (l)
3 Discussion The main objective of this study testing the use of petal area and spectral reflectance
for the description of O3 effects on flower visual attractiveness shows that both variables may be affected by O3 exposure These two parameters related with pollinator visual attraction can be used in combination with other pollinator attraction variables such as olfactory attraction and nutritional rewards in order to describe the potential mechanisms of the O3 effect on pollination Since this study is a first approach to studying O3 effects on visual pollinator attraction the potential importance of visual signaling on pollinator attraction and ways for future research and limitations of the present study are further discussed
Importantly from the pollinator attraction perspective petal size was affected by O3 exposure with flowers developing under higher O3 exposures having smaller petals than those developing under CFA Other studies have shown the negative effects of O3 on individual flower weight [24] number [31625] and corolla length [51] but to the best of our knowledge this is the first study reporting the negative effects of O3 on petal size In species where flowers are tightly grouped in inflorescences the effect on inflorescence size may be important but in E paularense the flowers within the inflorescence are clearly separated from each other and do not open synchronously Thus it was considered that individual flower size would be a more relevant visual attraction trait than inflorescence size Smaller petals are less visible making the pollinatorsrsquo search for the E paularense flower more difficult In the presence of other generalist plant species that are less
Figure 5 Schematic representation of the O3 treatment and chamber effects on Erodium paularensepetals area and their reflectance spectrum and how pollinators perceive petal colors At the topfrom left to right a molecule of ozone a flower of E paularense and an OTC are presented In thecenter there is the mean reflectance spectra of all the petals measured in the experiment Around thespectra there are the color spaces for bees (hexagon) flies (rectangle a hoverfly is represented) andbutterflies (tetrahedron) The dots within the color spaces are the perceived color for each petal fromthe experiment E (B) E (UV) E (G) are Blue UV and Green bee colors Fly Blue Fly UV Fly Purpleand Fly Yellow are the fly color categories Butterfly colors are UV (u) Blue (s) Green (m) and Red (l)
3 Discussion
The main objective of this study testing the use of petal area and spectral reflectancefor the description of O3 effects on flower visual attractiveness shows that both variablesmay be affected by O3 exposure These two parameters related with pollinator visualattraction can be used in combination with other pollinator attraction variables such asolfactory attraction and nutritional rewards in order to describe the potential mechanismsof the O3 effect on pollination Since this study is a first approach to studying O3 effectson visual pollinator attraction the potential importance of visual signaling on pollinatorattraction and ways for future research and limitations of the present study are furtherdiscussed
Importantly from the pollinator attraction perspective petal size was affected byO3 exposure with flowers developing under higher O3 exposures having smaller petalsthan those developing under CFA Other studies have shown the negative effects of O3 onindividual flower weight [24] number [31625] and corolla length [51] but to the best of ourknowledge this is the first study reporting the negative effects of O3 on petal size In specieswhere flowers are tightly grouped in inflorescences the effect on inflorescence size may beimportant but in E paularense the flowers within the inflorescence are clearly separatedfrom each other and do not open synchronously Thus it was considered that individualflower size would be a more relevant visual attraction trait than inflorescence size Smallerpetals are less visible making the pollinatorsrsquo search for the E paularense flower moredifficult In the presence of other generalist plant species that are less sensitive to O3pollinators may be less attracted by E paularense flowers which may result in lower flowervisitation frequency and lower reproductive success In this way it has been observed thatchanges in the color and size of petals in Moricandia arvensis can result in shifts of pollinatorguilds [52] These types of effects can be particularly important for the reproductive successof E paularense Low viable seed production rates have been reported for this species whichare not limited by pollen availability [48] Low viable seed production rates may be relatedwith the provenance of the pollen with low-quality pollinators visiting more flowers within
Plants 2021 10 2750 7 of 14
than among plants and producing self-incompatibilities [53] Thus O3 effects on pollinatorattraction traits might be of particular importance for this species
Ozone-induced changes in petal reflectance the maximum height of reflectance peaksand ARI values could be associated with changes in petal anthocyanin levels Anthocyaninsare the main pigments present in blue and purple flowers [54] which are produced bypetal epidermis cells during flower development [55] High anthocyanin concentrationfound in the petals of the related species Erodium cicutarium [56] have been associatedwith minimum and maximum reflectance peak values around 550 and 650 nm [57ndash60]which are also present in E paularense The similarity of the reflectance spectra of bothspecies suggest that anthocyanin could also be the main pigment of E paularense petalsand the reported changes in petal reflectance induced by O3 may be related to changes inanthocyanin content
The synthesis of anthocyanin in leaves has been described as an antioxidant responseagainst abiotic stresses produced by low temperature UV drought heavy metals or wound-ing [5961] Regarding O3 stress most of the existing studies show that this pollutant can alsoinduce an increase of foliar anthocyanin levels as an early antioxidant response [5062ndash65]We hypothesized that O3 may be directly absorbed by the stomatal pores present in petalsof most plant species [66] triggering an antioxidant response that results in increasedanthocyanin production However the response to O3 exposure in this experiment wasnot linear as has been reported for other species and response parameters [10] Furtherexperiments would be necessary to identify the possible mechanisms explaining O3 effectson petal pigment levels
The changes found in the reflectance spectra did not result in a strong color perceptionchange an important pollinator attraction trait for the three pollinator guilds evaluatedbut some subtle effects were observed Petals were within the UV-Blue or Blue segmentof the bee vision hexagon and none were further than the minimum Euclidean distancerequired to be perceptible as a color change for bees On the contrary in flies most of theFU+ petals were perceived as yellow while some petal under less ozone-dense levels (NFAand CFA) were perceived as blue Additionally butterflies seem to be able to distinguishsome O3-induced changes in petal color Most of the petals under CFA had lower valuesfor the UV photoreceptor than ambient (NFA) or elevated (FU+) O3 treatments The visualperception of petals by pollinators does not only depend on pigment concentration butalso on other traits such as petal epidermis micromorphology [67] Future studies couldalso address these effects since O3 has been described as capable of affecting leaf epidermismicromorphology (eg [68]) Further research will be needed to study if ozone effects onvisual attraction traits are accompanied by changes in pollinator rewarding which mayresult in pollinator behavioral changes Beyond the study of the mechanisms by whichozone may affect pollinator attraction plant traits other experiments such as bioassays orpollinator visitation rate monitoring would improve the understanding of the potentialconsequences of all of these changes on the actual behavior of pollinators
The use of OTCs to study O3 effects on plants has the advantage of controlled O3exposures under close to field growing conditions and allowing exposure to below ambientO3 levels in the CFA treatment Environmentally relevant ozone exposures have beenapplied in this experiment Plants under high-O3-level treatment (FU+) were exposed tolevels comparable with the highest concentrations recorded in the natural distribution areaof E paularense at Sierra de Guadarrama in central Spain during dry and warm years [5]The maximum monthly average O3 concentrations recorded at the mid altitudes of theSierra de Guadarrama reached up to 55 nL Lminus1 which are comparable to the averagevalue at the elevated O3 treatment used in this study (Table 1) However OTCs change byits design plant growing conditions (Table 1) which could have modified the pollinatorsyndrome traits of E paularense In this experiment plants growing in OTCs receivedless light than plants growing outside OTCs although OTCs plants also received directsunlight through the open top of the chamber for several hours a day OTCs also changedthe VPD conditions but VPD levels remained in non-limiting levels of gas exchange for
Plants 2021 10 2750 8 of 14
a range of species [69] both inside and outside OTCs and it was not expected to have alimiting effect on plant growth and flower development The main chamber effect recordedwas a mean temperature increase of 3 C and an increase of 5 C in absolute maximumtemperature It has been proven that different traits of pollination syndrome are affected bytemperature increases Higher temperatures may produce changes in species phenologyadvancing the flowering time and producing temporal mismatches between the pollinatorsand flower presence lowering the reproductive plant fitness [7071] Temperature increasescan also affect the plantndashpollinator interaction by changing the scent production and nectarcomposition decreasing the pollen amount and reducing the flower size [71] Some studiesalso indicated that high temperatures decreased the amounts of anthocyanins in flowerpetals of other species [72ndash74] However in the present study temperature increases inOTCs had no effect on the petal area of E paularense nor the reflectance spectra or theamounts of anthocyanins in petals as evaluated with ARI compared with AMB plants
4 Materials and Methods41 OTC Experiment
The experiment was performed in an NCLAN-type OTC (adapted from the originaldesign by [75]) facility located in central Spain 403prime N 426primeW 450 masl The experimentwas conducted in 4 plots with three O3 treatments and one ambient plot (AMB) withoutchamber Three O3 treatments were applied charcoal-filtered air (CFA) non-filtered air(NFA) reproducing ambient levels and non-filtered air supplemented with 40 nL Lminus1 ofO3 (FU+) Ozone was produced from pure O2 by means of an O3 generator (A2Z OzoneInc Louisville KY USA) and supplied to the FU+ plot 8 h dayminus1 (700 to 1500 GTM)over 37 days Ozone concentrations inside each chamber and AMB plots were monitoredcontinuously using an UV absorbance monitor (MLreg 9810B Teledyne Thousand OaksCA USA) with an automated time-sharing system Ozone exposure was described by themean (7ndash15 h) concentration and the AOT40 index calculated as the accumulated hourlyconcentration over a threshold of 40 nL Lminus1 during daylight hours over the fumigationperiod Meteorological conditions (air temperaturemdashT (C) air relative humiditymdashRH() and photosynthetic active radiationmdashPAR (micromol mminus2 sminus1)) inside and outside theOTCs were continuously measured using AM2315 (T and RH Adafruit Industries LLCNew York NY USA) and Apogee SQ 110 (PAR Apogee Instruments Inc Logan UTUSA) sensors The plots were not in the shadow of any vegetation or building TheOTCs are constructed of the same material and have the same shape Therefore apartfrom the different ozone concentration the conditions were the same inside the chambersDifferences in meteorological conditions between ambient and OTC plots were used todescribe the chamber effect on measured variables The AMB treatment was considered ascontrol when assessing the chamber effect within the OTCs
42 Plant Material
Erodium paularense plants were raised from seeds collected from natural populationsat the Sierra de Guadarrama National Park and transplanted to 21 pots containing peatvermiculite and perlite (602020) in the spring of 2017 Plants grew outdoors except duringO3 fumigation experiments and were kept well irrigated and fertilized In the secondspring growing season plants were exposed to O3 in OTC for 70 days AOT40 values foreach of the treatments were 5920 12 4324 16761 nL Lminus1h for AMB CFA NFA and FU+respectively
The present study was conducted in the third spring growing season on the sameplant material The two-year-old plants were transferred to the OTCs on 3 April and wereexposed to the same O3 fumigation treatments as the previous year for 37 days Priorto the start of the O3 fumigation treatments all the inflorescences were removed so thatthe measurements were conducted on flowers developed under the treatment conditionsdescribed in Table 1
Plants 2021 10 2750 9 of 14
43 Spectral Reflectance Measurements Anthocyanin Index and Petal Area
On 10 May 2019 for each of two plants per OTC in the same phenological stage threepetals from three fully developed flowers growing in different inflorescences were excisedfor measurements Right after the excision alternating between the different O3 treatmentspetal spectral reflectance measurements were collected Relative reflectance spectra ofeach petal were measured with a Hand-Held FieldSpec spectroradiometer (AnalyticalSpectral Devices Boulder CO USA) on the 325 nm to 1075 nm wavelength range with aspectral resolution of 3 nm Petals were inserted in a leaf clip illuminated with a halogenbulb (2900 K color temperature) and measured against a black background (black paintedvinyl) A white reference (Gore-Tex white PTFE reflector material) was taken before eachmeasurement An average of 25 spectra per petal were considered for analysis
Ozone and chamber effects on petal spectral reflectance were evaluated for the fullrange of spectral reflectance wavelengths (325ndash1075 nm) the maximum height of spectralpeaks and the anthocyanin reflectance index (ARI) Maximum height of peaks from 325 to600 nm was extracted from each reflectance spectra in R software version 402 [76] usingthe function peakshape (Pavo package) [77] The content of anthocyanins in each petal wasestimated with the anthocyanin reflectance index ARI = (R800R550) minus (R800R700) [78]where R is the relative reflectance value at the specified wavelength
After reflectance measurements metric-scaled photos were taken on all intact petalsand the area was measured using ImageJ software [79] A total of 70 and 66 petal measure-ments were collected for spectral reflectance and petal area respectively (Table 1A)
44 Pollinator Color Perception
Pavo package [77] in R software was used to analyze the reflectance spectra and toplot the color space of bees flies and butterflies using available models in the wavelengthrange of 300ndash700 nm To generate the visual model both the petal spectral and sensitivitydata were trimmed to the 325ndash700 nm wavelength range Visual models for each of beesand flies were generated based on the spectral sensitivity data of each photoreceptor class3 and 4 classes respectively already implemented in Pavo package Butterfly sensitivitydata of 4 photoreceptor classes were extracted from [44] (see also [80]) Similar to [44] thefollowing setups for bee fly and butterfly visuals models were chosen green foliage asbackground spectra and D65 (standard day light) as illuminant The longest-wavelengthphotoreceptor of each pollinator was used to calculate luminance (achromatic) receptorstimulation [77]
Hexagon rectangle and tetrahedron plots were performed to represent the color spaceof bee fly and butterflies respectively [434481] Figure 5 summarizes how all petal spectrawere represented on each color space To assess the perceptible color change we followedthe criteria established by [44] to ensure at least 60 of correct color discrimination Fliessee different colors when stimuli are in different color space quadrants For bees andbutterflies a minimum distance in the color space axis values of 009 and 003 was requiredrespectively [44]
45 Statistics
Two sets of analyses were performed one to study the influence of O3 treatments(excluding AMB plot) and a second one to assess the chamber effect (NFA vs AMB plots)on ARI maximum height of peaks and petal area Petal area was used as covariable for ARIand reflectance analyses as petals did not completely cover the background surface of thespectroradiometer and this may affect the comparison of relative reflectance values amongtreatments Then to control for the plant-to-plant variability in petals traits the identityof each plant was considered as a random factor For each analysis the AIC (Akaikeinformation criterion) value was used to choose the most parsimonious model betweenlineal (without random factor) or mixed lineal model (with random factor) Ozone effectswere evaluated using increasing linear a-priori contrasts as expected However contrastscomparing O3 treatment means were also tested For petal area a reduction in size was
Plants 2021 10 2750 10 of 14
expected thus linear decreasing and difference from the control treatment a-priori contrasts(CFA versus NFA or FU+) were used for this variable To fulfill the assumption of normalityof the residuals for ANOVA a logarithmic transformation of ARI was performed A-prioricontrasts in linear models were based on [82] Mixed linear models were performed usinglmer function (lme4 package [83]) Anova function was used for the mixed models (carpackage [84]) To test the hypothesis of a ldquolinear increaserdquo the contrpoly function [76] wasused For ARI the contrast coding based on the treatment means was CFA = minus1 NFA = 2and FU+ = minus1 The contrast coding for the ldquodifference from control treatmentrdquo hypothesiswas CFA = 2 NFA= minus1 FU+ = minus1 for petal area One-way ANOVA tests were performedto evaluate the chamber effect (NFA vs AMB) on ARI maximum height of peaks and petalarea
A PERMANOVA analysis was performed to compare the reflectance spectra values(from 325 to 1075 nm) as a multivariate trait among treatments To prevent PERMANOVAfrom being largely influenced by high reflectance values at some wavelengths data weresquared then root transformed and a similarity matrix was made by BrayndashCurtis approxi-mation [85] A total of 9999 permutations were chosen and PERMANOVA was performedusing vegan package [86] All the statistical analyses described were carried out in Rsoftware [76]
5 Conclusions
This study highlights that visual attraction parameters such as petal area and color maybe sensitive to O3 exposure These features are proposed as novel response variables forstudying O3 effects on pollination syndrome traits associated with flower visual attractionalthough the results presented warrant further research
This O3 fumigation experiment shows how petal area was reduced by O3 exposurein Erodium paularense an endangered and endemic herbaceous species of the The CentralSystem in Spain Petal color as perceived by different pollinator guilds was partiallymodified for butterflies and flies and indications of a non-linear O3 effect on petal antho-cyanin content were suggested by experimental results Current high O3 levels found in thedistribution area of this species are high enough to potentially affect pollination syndrometraits as described in this study imposing an additional burden to climatic warming Otherpollinator syndrome traits may also be affected in this species Further studies would beneeded in order to clarify the overall effect of O3 on the pollination success and survival ofthis species before this threat can be addressed in the conservation management policies ofE paularense
Author Contributions Conceptualization IG-F Methodology SP-B and IG-F Formal Analy-sis SP-B Investigation RR-C VB-B and IG-F WritingmdashOriginal Draft Preparation SP-BWritingmdashReview and Editing SP-B RR-C VB-B and IG-F Supervision IG-F All authors haveread and agreed to the published version of the manuscript
Funding Funding was provided by FEDERSpanish Ministry of Science and InnovationndashAEIEDEN-MED (CGL2017-84687-C2-1-R) Structural Funds 2014ndash2020 (ERDF and ESF)Comunidad de Madrid(Spain)AGRISOST cm S2018BAA-4330 and Biodiv-Support (PCI2018-093149)mdashState ResearchAgency of the Spanish Ministry of Science and Innovation through APCIN SP-B funded by GrantPTA2018-016159-I funded by MCINAEI 1013039501100011033
Institutional Review Board Statement Not applicable
Informed Consent Statement Not applicable
Data Availability Statement Publicly available datasets were analyzed in this study This datacan be found here httprdgroupsciemateswebgeca-ciemat Averaged flower spectral dataavailable at FReD database (httpwwwreflectancecouk)
Plants 2021 10 2750 11 of 14
Acknowledgments The OTC experimental facility located on La Higueruela Research Farm issupported by an agreement between MNCN (CSIC) and CIEMAT The farm personnel and especiallythe valuable work of Jose Mariacutea Goacutemez Camacho on plant care and OTC facility maintenanceare greatly acknowledged The experimental research on this protected species was conducted inaccordance with the guidelines and recommendations outlined by the Aacuterea de Conservacioacuten de Floray Fauna from Consejeriacutea de Medio Ambiente de la Comunidad de Madrid and the Sierra de GuadarramaNational Park that provided permits for seed collection Alborada plant nursery took care of seedlingsuntil the start of the experimental work We thank Thomas E White for helping with pavo R packageanalyses
Conflicts of Interest The authors declare no conflict of interest
References1 Ainsworth EA Yendrek CR Sitch S Collins WJ Emberson LD The Effects of Tropospheric Ozone on Net Primary
Productivity and Implications for Climate Change Annu Rev Plant Biol 2012 63 637ndash661 [CrossRef]2 Chappelka AH Samuelson LJ Ambient ozone effects on forest trees of the eastern United States A review New Phytol 1998
139 91ndash108 [CrossRef]3 Leisner CP Ainsworth EA Quantifying the effects of ozone on plant reproductive growth and development Glob Chang Biol
2011 18 606ndash616 [CrossRef]4 Mills G Sharps K Simpson D Pleijel H Frei M Burkey K Emberson L Uddling J Broberg M Feng Z et al Closing
the global ozone yield gap Quantification and cobenefits for multistress tolerance Glob Chang Biol 2018 24 4869ndash4893[CrossRef] [PubMed]
5 Elvira S Fernaacutendez IG Alonso R Sanz J Bermejo-Bermejo V Ozone levels in the Spanish Sierra de Guadarrama mountainrange are above the thresholds for plant protection Analysis at 2262 1850 and 995 m asl Environ Monit Assess 2016 188 593[CrossRef]
6 Monks PS Archibald AT Colette A Cooper O Coyle M Derwent R Fowler D Granier C Law KS Mills GE et alTropospheric ozone and its precursors from the urban to the global scale from air quality to short-lived climate forcer AtmosChem Phys Discuss 2015 15 8889ndash8973 [CrossRef]
7 Paoletti E De Marco A Beddows D Harrison RM Manning WJ Ozone levels in European and USA cities are increasingmore than at rural sites while peak values are decreasing Environ Pollut 2014 192 295ndash299 [CrossRef] [PubMed]
8 Querol X Alastuey A Gangoiti G Perez N Lee HK Eun HR Park Y Mantilla E Escudero M Titos G et alPhenomenology of summer ozone episodes over the Madrid Metropolitan Area central Spain Atmos Chem Phys Discuss 201818 6511ndash6533 [CrossRef]
9 Querol X Alastuey A Pandolfi M Reche C Peacuterez N Minguilloacuten M Moreno T Viana M Escudero M Orio A et al2001ndash2012 trends on air quality in Spain Sci Total Environ 2014 490 957ndash969 [CrossRef] [PubMed]
10 Agathokleous E Feng Z Oksanen E Sicard P Wang Q Saitanis CJ Araminiene V Blande JD Hayes F Calatayud Vet al Ozone affects plant insect and soil microbial communities A threat to terrestrial ecosystems and biodiversity Sci Adv2020 6 eabc1176 [CrossRef]
11 Fuhrer J Martin MV Mills G Heald CL Harmens H Hayes F Sharps K Bender J Ashmore MR Current and futureozone risks to global terrestrial biodiversity and ecosystem processes Ecol Evol 2016 6 8785ndash8799 [CrossRef]
12 Cristofanelli P Bonasoni P Background ozone in the southern Europe and Mediterranean area Influence of the transportprocesses Environ Pollut 2009 157 1399ndash1406 [CrossRef] [PubMed]
13 Millaacuten M Salvador R Mantilla E Artnano B Meteorology and photochemical air pollution in Southern Europe Experimentalresults from EC research projects Atmos Environ 1996 30 1909ndash1924 [CrossRef]
14 Mills G Wagg S Harmens H Ozone Pollution Impacts on Ecosystem Services and Biodiversity NERCCentre for Ecology ampHydrology Bangor UK 2013 p 104
15 Di Gregorio A Jansen LJM Land Cover Classification System (LCCS) Classification Concepts and User Manual Food and AgricultureOrganization Rome Italy 2000
16 Hayes F Harmens H Mills G Bender J Gruumlnhage L Ozone critical levels for (semi-) natural vegetation dominated byperennial grassland species Environ Sci Pollut Res 2020 28 15090ndash15098 [CrossRef]
17 Sanz J Fernaacutendez IG Elvira S Muntifering R Alonso R Bermejo-Bermejo V Setting ozone critical levels for annualMediterranean pasture species Combined analysis of open-top chamber experiments Sci Total Environ 2016 571 670ndash679[CrossRef] [PubMed]
18 Raumlmouml K Kanerva T Ojanperauml K Manninen S Growth onset senescence and reproductive development of meadow speciesin mesocosms exposed to elevated O3 and CO2 Environ Pollut 2007 145 850ndash860 [CrossRef]
19 Sanz J Bermejo V Muntifering R Gonzaacutelez-Fernaacutendez I Gimeno B Elvira S Alonso R Plant phenology growth andnutritive quality of Briza maxima Responses induced by enhanced ozone atmospheric levels and nitrogen enrichment EnvironPollut 2011 159 423ndash430 [CrossRef] [PubMed]
Plants 2021 10 2750 12 of 14
20 Bender J Muntifering R Lin J Weigel H Growth and nutritive quality of Poa pratensis as influenced by ozone andcompetition Environ Pollut 2006 142 109ndash115 [CrossRef]
21 Bergweiler C Manning W Inhibition of flowering and reproductive success in spreading dogbane (Apocynum androsaemifolium)by exposure to ambient ozone Environ Pollut 1999 105 333ndash339 [CrossRef]
22 Danielsson H Gelang J Pleijel H Ozone sensitivity growth and flower development in Phleum genotypes of differentgeographic origin in the Nordic countries Environ Exp Bot 1999 42 41ndash49 [CrossRef]
23 Drogoudi P Ashmore MR Does elevated ozone have differing effects in flowering and deblossomed strawberry New Phytol2000 147 561ndash569 [CrossRef] [PubMed]
24 Franzaring J Tonneijck A Kooijman A Dueck T Growth responses to ozone in plant species from wetlands Environ ExpBot 2000 44 39ndash48 [CrossRef]
25 Hayes F Williamson J Mills G Ozone pollution affects flower numbers and timing in a simulated BAP priority calcareousgrassland community Environ Pollut 2012 163 40ndash47 [CrossRef]
26 Stewart C Black V Black C Roberts J Direct Effects of Ozone on the Reproductive Development of Brassica Species J PlantPhysiol 1996 148 172ndash178 [CrossRef]
27 Taylor MD Sinn JP Davis DD Pell EJ The impact of ozone on a salt marsh cordgrass (Spartina alterniflora) Environ Pollut2002 120 701ndash705 [CrossRef]
28 Duque L Poelman EH Steffan-Dewenter I Effects of ozone stress on flowering phenology plant-pollinator interactions andplant reproductive success Environ Pollut 2021 272 115953 [CrossRef]
29 Kohut RJ Laurence JA Colavito LJ The influence of ozone exposure dynamics on the growth and yield of kidney beanEnviron Pollut 1988 53 79ndash88 [CrossRef]
30 Retzlaff WA Williams LE Dejong TM Growth and Yield Response of Commercial Bearing-agersquo Casselmanrsquo Plum Trees toVarious Ozone Partial Pressures ASA 1997 26 858ndash865 [CrossRef]
31 Fenster CB Armbruster WS Wilson P Dudash MR Thomson JD Pollination Syndromes and Floral Specialization AnnuRev Ecol Evol Syst 2004 35 375ndash403 [CrossRef]
32 Van Der Pijl L Ecological aspects of flower evolution I Phyletic evolution Evolution 1960 14 403ndash416 [CrossRef]33 Simpson BB Neff JL Floral Rewards Alternatives to Pollen and Nectar Ann Mo Bot Gard 1981 68 301 [CrossRef]34 Ribeiro H Duque L Sousa R Abreu I Ozone effects on soluble protein content of Acer negundo Quercus robur and Platanus
spp pollen Aerobiologia 2013 29 443ndash447 [CrossRef]35 Stabler D Impacts of Ozone Pollution on Nectar and Pollen Quality and Their Significance for Pollinators Doctoral Dissertation
University of Newcastle Newcastle upon Tyne UK 201636 Saunier A Blande JD The effect of elevated ozone on floral chemistry of Brassicaceae species Environ Pollut 2019 255 113257
[CrossRef]37 Blande JD Holopainen JK Niinemets Uuml Plant volatiles in polluted atmospheres Stress responses and signal degradation
Plant Cell Environ 2014 37 1892ndash1904 [CrossRef]38 Farreacute-Armengol G Penuelas J Li T Yli-Pirilauml P Filella I Llusia J Blande JD Ozone degrades floral scent and reduces
pollinator attraction to flowers New Phytol 2016 209 152ndash160 [CrossRef] [PubMed]39 McFrederick QS Fuentes JD Roulston T Kathilankal JC Lerdau M Effects of air pollution on biogenic volatiles and
ecological interactions Oecologia 2009 160 411ndash420 [CrossRef]40 McFrederick QS Kathilankal JC Fuentes JD Air pollution modifies floral scent trails Atmos Environ 2008 42 2336ndash2348
[CrossRef]41 Giurfa M Lehrer M Honeybee vision and floral displays From detection to close-up recognition In Cognitive Ecology of
Pollination Animal Behaviour and Floral Evolution Chittka L Thomson J Eds Cambridge University Press Cambridge UK2001 pp 61ndash82 [CrossRef]
42 Roshchina VV The Autofluorescence Response of Flower Cells from Saintpaulia Ionantha as the Biosensor Reaction to OzoneComput Biol Bioinform 2017 4 60ndash66 [CrossRef]
43 Arnold SEJ Savolainen V Chittka L Flower colours along an alpine altitude gradient seen through the eyes of fly and beepollinators Arthropod-Plant Interact 2009 3 27ndash43 [CrossRef]
44 Ohashi K Makino TT Arikawa K Floral colour change in the eyes of pollinators Testing possible constraints and correlatedevolution Funct Ecol 2015 29 1144ndash1155 [CrossRef]
45 Gonzaacutelez-Benito E Martin C Iriondo J Autecology and conservation of Erodium paularense Fdez Glez amp Izco Biol Conserv1995 72 55ndash60 [CrossRef]
46 Martiacuten C Gonzaacutelez-Benito ME Iriondo JM The use of genetic markers in the identification and characterization of threerecently discovered populations of a threatened plant species Mol Ecol 1999 8 S31ndashS40 [CrossRef]
47 Moreno JC Lista Roja 2008 de la Flora Vascular Espantildeola Direccioacuten General de Medio Natural y PoliacuteticaForestal (Ministerio deMedio Ambiente y Medio Rural y Marino y Sociedad Espantildeola de Biologiacutea de la Conservacioacutende Plantas) Madrid Spain 2008(In Spanish)
48 Albert MJ Escudero A Iriondo J Female Reproductive Success of Narrow Endemic Erodium paularense in ContrastingMicrohabitats Ecology 2001 82 1734ndash1747 [CrossRef]
Plants 2021 10 2750 13 of 14
49 Albert MJ Biologiacutea de la Conservacioacuten de Erodium Paularense Fern Gonz amp Izco (Geraniaceae) Doctoral Thesis UniversidadPoliteacutecnica of Madrid Madrid Spain 2003 (In Spanish)
50 Foot JP Caporn SJM Lee JA Ashenden TW The effect of long-term ozone fumigation on the growth physiology and frostsensitivity of Calluna vulgaris New Phytol 1996 133 503ndash511 [CrossRef]
51 Ansari N Agrawal M Agrawal SB An assessment of growth floral morphology and metabolites of a medicinal plant Sidacordifolia L under the influence of elevated ozone Environ Sci Pollut Res 2020 28 832ndash845 [CrossRef]
52 Goacutemez JM Perfectti F Armas C Narbona E Gonzaacutelez-Megiacuteas A Navarro L DeSoto L Torices R Within-individualphenotypic plasticity in flowers fosters pollination niche shift Nat Commun 2020 11 4019 [CrossRef]
53 de Jong TJ Waser NM Klinkhamer PG Geitonogamy The neglected side of selfing Trends Ecol Evol 1993 8 321ndash325[CrossRef]
54 Rudall PJ Colourful cones How did flower colour first evolve J Exp Bot 2020 71 759ndash767 [CrossRef]55 Martin C Gerats T Control of Pigment Biosynthesis Genes during Petal Development Plant Cell 1993 5 1253ndash1264 [CrossRef]
[PubMed]56 Kay Q Daoud H Stirton C Pigment distribution light reflection and cell structure in petals Bot J Linn Soc 1981 83 57ndash83
[CrossRef]57 Boyer M Miller J Belanger M Hare E Wu J Senescence and spectral reflectance in leaves of northern pin oak (Quercus
palustris Muenchh) Remote Sens Environ 1988 25 71ndash87 [CrossRef]58 Menzel R Shmida A The Ecology of flower colours and the natural colour vision of insect pollinators The Israeli flora as a
study case Biol Rev 1993 68 81ndash120 [CrossRef]59 Merzlyak MN Chivkunova OB Light-stress-induced pigment changes and evidence for anthocyanin photoprotection in
apples J Photochem Photobiol B Biol 2000 55 155ndash163 [CrossRef]60 Arnold SEJ Faruq S Savolainen V McOwan PW Chittka L FReD The Floral Reflectance DatabasemdashA Web Portal for
Analyses of Flower Colour PLoS ONE 2010 5 e14287 [CrossRef]61 Chalker-Scott L Environmental Significance of Anthocyanins in Plant Stress Responses Photochem Photobiol 1999 70 1ndash9
[CrossRef]62 de Rezende FM Furlan CM Anthocyanins and tannins in ozone-fumigated guava trees Chemosphere 2009 76 1445ndash1450
[CrossRef] [PubMed]63 Gravano E Bussotti F Strasser RJ Schaub M Novak K Skelly J Tani C Ozone symptoms in leaves of woody plants in
open-top chambers Ultrastructural and physiological characteristics Physiol Plant 2004 121 620ndash633 [CrossRef]64 Koukol J Dugger WM Anthocyanin formation as a response to ozone and smog treatment in Rumex crispus L Plant Physiol
1967 42 1023ndash1024 [CrossRef]65 Rozpadek P Nosek M Slesak I Kunicki E Dziurka M Miszalski Z Ozone fumigation increases the abundance of nutrients
in Brassica vegetables Broccoli (Brassica oleracea var italica) and Chinese cabbage (Brassica pekinensis) Eur Food Res Technol2014 240 459ndash462 [CrossRef]
66 Zhang F Murphy MRC Cardoso AA Jordan GJ Brodribb TJ Similar geometric rules govern the distribution of veins andstomata in petals sepals and leaves New Phytol 2018 219 1224ndash1234 [CrossRef]
67 Costa VBS Pimentel RMM Chagas MGS Alves GD Castro CC Petal micromorphology and its relationship topollination Plant Biol 2017 19 115ndash122 [CrossRef] [PubMed]
68 Vollenweider P Guumlnthardt-Goerg MS Menard T Baumgarten M Matyssek R Schaub M Macro- and microscopic leafinjury triggered by ozone stress in beech foliage (Fagus sylvatica L) Ann For Sci 2019 76 71 [CrossRef]
69 Larcher W Physiological Plant Ecology Springer BerlinHeidelberg Germany 2003 p 514 ISBN 978-3-540-43516-770 Hegland SJ Nielsen A Laacutezaro A Bjerknes A-L Totland Oslash How does climate warming affect plant-pollinator interactions
Ecol Lett 2009 12 184ndash195 [CrossRef] [PubMed]71 Scaven VL Rafferty NE Physiological effects of climate warming on flowering plants and insect pollinators and potential
consequences for their interactions Curr Zool 2013 59 418ndash426 [CrossRef] [PubMed]72 Dela G Or E Ovadia R Nissim-Levi A Weiss D Oren-Shamir M Changes in anthocyanin concentration and composition
in lsquoJaguarrsquo rose flowers due to transient high-temperature conditions Plant Sci 2003 164 333ndash340 [CrossRef]73 Nozaki K Takamura T Fukai S Effects of high temperature on flower colour and anthocyanin content in pink flower genotypes
of greenhouse chrysanthemum (Chrysanthemum morifoliumRamat) J Hortic Sci Biotechnol 2006 81 728ndash734 [CrossRef]74 Shaked-Sachray L Weiss D Reuveni M Nissim-Levi A Oren-Shamir M Increased anthocyanin accumulation in aster
flowers at elevated temperatures due to magnesium treatment Physiol Plant 2002 114 559ndash565 [CrossRef]75 Heck WW Taylor OC Adams R Bingham G Miller J Preston E Weinstein L Assessment of Crop Loss from Ozone J
Air Pollut Control Assoc 1982 32 353ndash361 [CrossRef]76 Team RC R Core Team A Language and Environment for Statistical Computing R Foundation for Statistical Computing Vienna
Austria 2019 Available online httpswwwR-projectorg (accessed on 1 June 2021)77 Maia R Gruson H Endler JA White TE PAVO 2 New tools for the spectral and spatial analysis of colour in R Methods Ecol
Evol 2019 10 1097ndash1107 [CrossRef]78 Merzlyak MN Solovchenko AE Gitelson AA Reflectance spectral features and non-destructive estimation of chlorophyll
carotenoid and anthocyanin content in apple fruit Postharvest Biol Technol 2003 27 197ndash211 [CrossRef]
Plants 2021 10 2750 14 of 14
79 Bourne R ImageJ In Fundamentals of Digital Imaging in Medicine Springer London UK 2009 Volume 9 pp 185ndash188 [CrossRef]80 Koshitaka H Kinoshita M Vorobyev M Arikawa K Tetrachromacy in a butterfly that has eight varieties of spectral receptors
Proc R Soc B Boil Sci 2008 275 947ndash954 [CrossRef] [PubMed]81 Chittka L The colour hexagon A chromaticity diagram based on photoreceptor excitations as a generalized representation of
colour opponency J Comp Physiol A 1992 170 533ndash543 [CrossRef]82 Schad DJ Vasishth S Hohenstein S Kliegl R How to capitalize on a priori contrasts in linear (mixed) models A tutorial J
Mem Lang 2020 110 104038 [CrossRef]83 Bates D Maumlchler M Bolker B Walker S Fitting Linear Mixed-Effects Models Using lme4 J Stat Softw 2015 67 1ndash48
[CrossRef]84 Fox J Weisberg S An R Companion to Applied Regression 3rd ed Sage Thousand Oaks CA USA 2019 Available online
httpssocialsciencesmcmastercajfoxBooksCompanion (accessed on 4 October 2020)85 Clarke KR Gorley RN PRIMER v6 User ManualTutorial PRIMER-E Ltd Plymouth UK 200686 Oksanen J Blanchet FG Kindt R Legendre P Minchin P OrsquoHara RB Simpson G Solymos P Stevenes MHH Wagner
H Vegan 2012 Community Ecology Package R Package Version 20-2 Available online httpCRANR-projectorgpackage=vegan (accessed on 1 June 2021)
- Introduction
- Results
-
- Ozone Exposure and Growing Conditions
- Ozone and Chamber Effects on Petal Area Reflectance and ARI
- Ozone and Chamber Effects on Pollinator Color Perception
-
- Discussion
- Materials and Methods
-
- OTC Experiment
- Plant Material
- Spectral Reflectance Measurements Anthocyanin Index and Petal Area
- Pollinator Color Perception
- Statistics
-
- Conclusions
- References
-
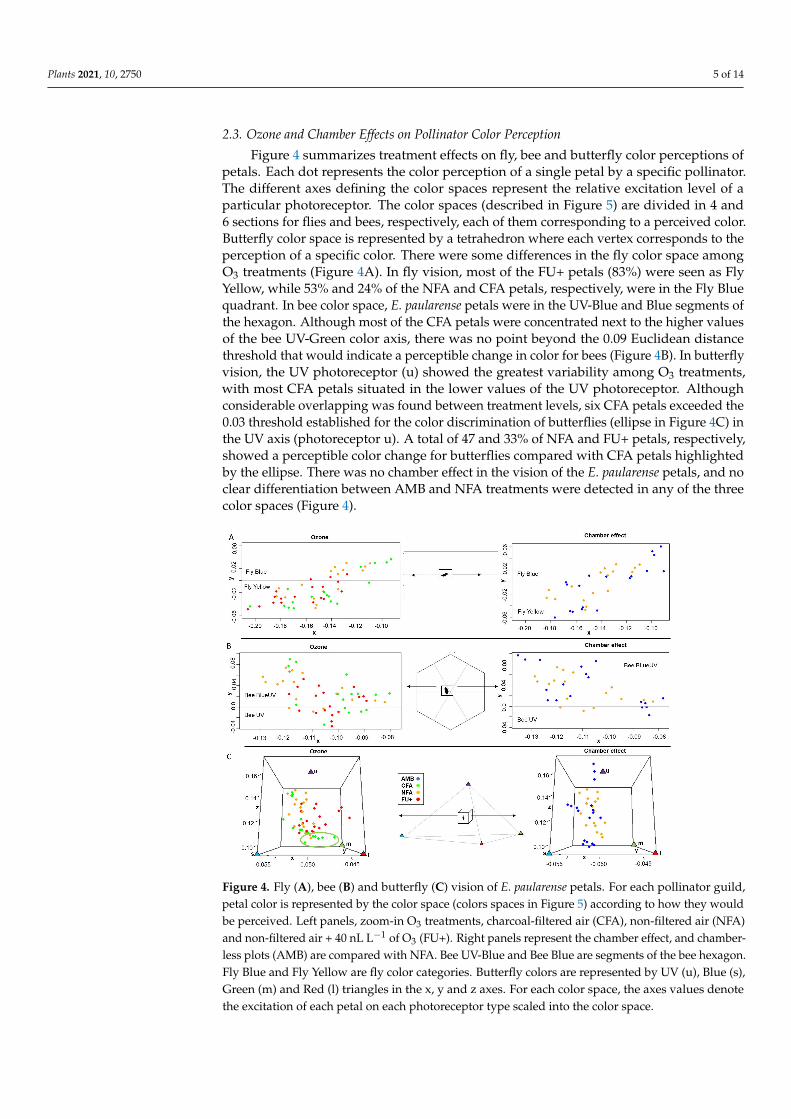