Status and trends of European pollinators. Key findings of the STEP project
74
STATUS and TRENDS of EUROPEAN POLLINATORS
Transcript of Status and trends of European pollinators. Key findings of the STEP project

STATUS and TRENDS of EUROPEAN POLLINATORS

1
STATUS AND TRENDS OF EUROPEANPOLLINATORSKey Findings from the STEP project
The research leading to these results has received funding from the European Community’s Seventh Framework Programme (FP7/2007-2013) under grant agreement no 244090, STEP Project (Status and Trends of European Pollinators, www.step-project.net)
Citation: Potts S., Biesmeijer K., Bommarco R., Breeze T., Carvalheiro L., Franzén M., González-Varo J.P., Holz-schuh A., Kleijn D., Klein A.-M., Kunin, B., Lecocq T., Lundin O., Michez D., Neumann P., Nieto A., Penev L., Ras-mont P., Ratamäki O., Riedinger V., Roberts S.P.M., Rundlöf M., Scheper J., Sørensen P., Steffan-Dewenter I., Stoev P., Vilà M., Schweiger O. (2015) Status and trends of European pollinators. Key findings of the STEP project. Pensoft Publishers, Sofia, 72 pp.
Front cover: Wikimedia Commons
Disclaimer: The views expressed in this publication are those of the authors and do not necessarily reflect the views or opinions of the funders or reviewers.
First published 2015ISBN: 978-954-642-762-5ISBN: 978-954-642-763-2
Pensoft Publishers12, Prof. Georgi Zlatarski St.1700 Sofia, Bulgariae-mail: info.pensoft.netwww.pensoft.net
All content is Open Access, distributed under the terms of the Creative Commons Attribution License (CC BY 4.0), which permits unrestricted use, distribution, and reproduction in any medium, provided that the original author and source are credited.
Printed in Bulgaria, 14 January 2015
Design by
Contents
Project Partners........................................................................................................................................... 5
Foreword....................................................................................................................................................... 7
Background............................................................... .................................................................................. 8
Chapter 1: Status and Trends of Pollinators across Europe........................................................ 101.1 Biodiversity loss among bees and wild flowers slows in NW-Europe........... 11
1.2 First ever Red List of European bees......................................................................... 14
1.3 Drastic historic shifts in bumblebee community composition in Sweden........................................................................................................................... 17
Chapter 2: Drivers and Pressures on Pollinators........................................................................... 202.1 Combined effects of global change pressures on animal-mediated
pollination.......................................................................................................................... 21
2.2 The relative importance of broad-scale drivers for the distribution of European pollinators...................................................................................................... 25
2.3 Future climatic risks for European bumblebees.................................................... 27
2.4 Expansion of mass-flowering crops leads to transient pollinator dilution and reduced wild plant pollination........................................................... 30
2.5 Impact of chronic neonicotinoid exposure on honeybee colony performance and queen supersedure..................................................................... 33
Chapter 3: Wider Impacts of Changes in Pollinators................................................................... 363.1 Wild pollinators enhance fruit set of crops regardless of honeybee
abundance......................................................................................................................... 37
3.2 Agricultural policies exacerbate honeybee pollination servicesupply-demand mismatches across Europe.......................................................... 39
4
3.3 Contribution of pollinator-mediated crops to nutrients in the human food supply......................................................................................................... 41
3.4 Ecological intensification: harnessing ecosystem services for food security...................................................................................................................... 43
3.5 Annual dynamics of wild bee densities: attractiveness and productivity effects of oilseed rape........................................................................... 46
Chapter 4: Mitigating Against Pollinator Losses........................................................................... 494.1 Environmental factors driving the effectiveness of European
agri-environmental measures in mitigating pollinator loss – a meta-analysis................................................................................................................. 50
4.2 Late-season flowers benefit bumblebees............................................................... 53
4.3 Landscapes with wild bee habitats enhance pollination, fruit set and yield of sweet cherry............................................................................... 56
4.4 Early mass-flowering crops mitigate pollinator dilution in late-flowering crops................................................................................................... 59
Chapter 5: Informing Policy.................................................................................................................. 625.1 How can pollination ecology research help answer
important questions?..................................................................................................... 63
5.2 Multi-level analysis of mismatch and interplay between pollination-related policies and practices .............................................................. 65
5.3 Conceptual model for evidence analysis to support policy............................. 68
Conclusion and Future Steps............................................................................................................... 70
List of Authors........................................................................................................................................... 71
4

5
Project Partners
The STEP project ran from 2010-2015, combining the expertise of 22 research institu-tions from 17 European countries with more than 120 researchers.
University of Reading, UK (Project Coordinator)
Helmholtz Centre for Environmental Research, Germany
Swedish University of Agricultural Sciences, Sweden
Stichting Dienst Landbouwkundig Onderzoek (Alterra), Netherlands
Aarhus University, Denmark
University of Leeds, UK
University of Bayreuth, Germany
National Institute of Agronomic Research, France
Federal Department of Economic Affairs, Switzerland
Finnish Environment Institute, Finland
Lund University, Sweden
6
Spanish Council for Scientific Research, Spain
University of Tartu, Estonia
PENSOFT Publishers, Bulgaria
University of Bern, Switzerland
University of Novi Sad, Faculty of Sciences, Serbia
University of Mons, Belgium
Jagiellonian University, Poland
University of Pisa, Italy
University of the Aegean, Greece
Julius Maximilians University Würzburg, Germany
Stichting Naturalis Biodiversity Center (Naturalis), Netherlands
University of Freiburg, Germany
Collaborative organisations:
International Union for Conservation of Nature (IUCN)
The Food and Agriculture Organization of the United Nations (FAO)
7
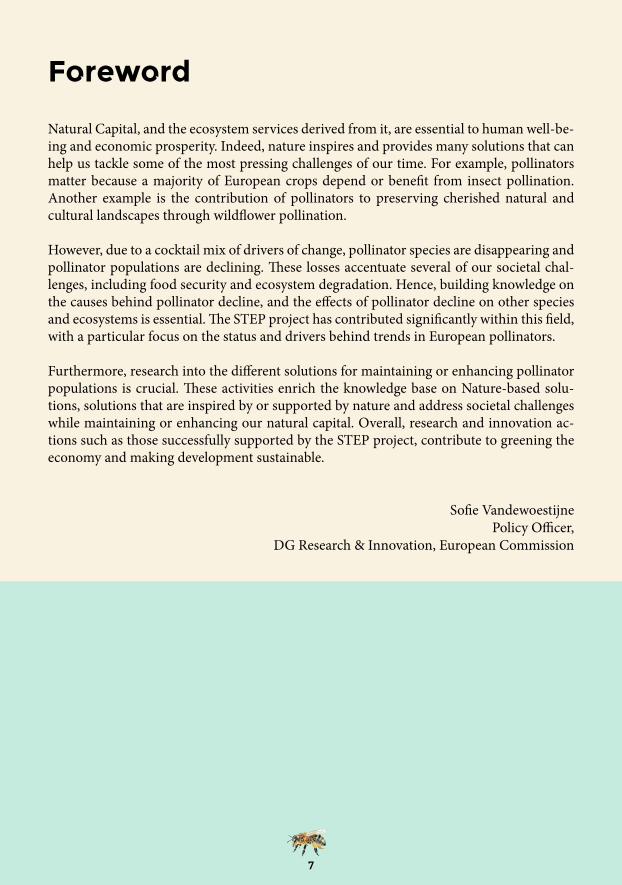
Foreword
Natural Capital, and the ecosystem services derived from it, are essential to human well-be-ing and economic prosperity. Indeed, nature inspires and provides many solutions that can help us tackle some of the most pressing challenges of our time. For example, pollinators matter because a majority of European crops depend or benefit from insect pollination. Another example is the contribution of pollinators to preserving cherished natural and cultural landscapes through wildflower pollination.
However, due to a cocktail mix of drivers of change, pollinator species are disappearing and pollinator populations are declining. These losses accentuate several of our societal chal-lenges, including food security and ecosystem degradation. Hence, building knowledge on the causes behind pollinator decline, and the effects of pollinator decline on other species and ecosystems is essential. The STEP project has contributed significantly within this field, with a particular focus on the status and drivers behind trends in European pollinators.
Furthermore, research into the different solutions for maintaining or enhancing pollinator populations is crucial. These activities enrich the knowledge base on Nature-based solu-tions, solutions that are inspired by or supported by nature and address societal challenges while maintaining or enhancing our natural capital. Overall, research and innovation ac-tions such as those successfully supported by the STEP project, contribute to greening the economy and making development sustainable.
Sofie VandewoestijnePolicy Officer,
DG Research & Innovation, European Commission
7
8
BackgroundSociety benefits in a multitude of ways from nature in the form of food production, the pro-visioning of clean drinking water, the decomposition of wastes, and the pollination of crops amongst many others. These ‘ecosystem services’ are all underpinned by biodiversity, which remains under threat globally, and so the conservation and sustainable use of biodiversity is a key challenge for all sectors of society.
The majority of global, and European, biodiversity is made up of insects, but we still know relatively little about the distribution and abundance of most species, and even less about their dynamics and the threats they face. This lack of knowledge on the status and trends of the majority of Europe’s species is of concern, and is particularly important for species that play important functional roles, such as pollinators.
The most widely managed pollinator in Europe is the honeybee (Apis mellifera), with most wild and feral colonies already lost. The remaining colonies are managed by beekeepers and have been shown to have undergone severe and widespread declines throughout much of Europe. Wild pollinators in Europe are dominated by approximately 2,000 species of wild bees (e.g. bumblebees and solitary bees) and hoverflies, with a smaller contribution of but-terflies, beetles and other fly species. Declines in wild bees and hoverflies have been clearly documented in some parts of Europe (e.g. the Netherlands, Belgium and UK), however, the geographic extent, scale and identity of those species in decline is largely unknown for most of Europe. While several European countries have established Red Lists for bees of conservation concern, until recently there is no European Red List with which to help direct conservation priorities at the continental scale.
Many individual causes of pollinator decline have been documented and include habitat loss and fragmentation, pesticides, loss of floral resources, pests and diseases, alien invasive species and climate change. However, the relative importance of these drivers and their interacting effects have been poorly explored until recently.
The majority, 84%, of European crops benefit, at least in part, from insect pollination and 78% of temperate wildflowers need biotic pollination. An estimated ~10% of the total eco-nomic value of European agricultural output for human food amounted to €22 billion in 2005 (€14.2 for the EU) was dependent upon insect pollination. However, more informa-tion is needed on the vulnerability of crops and regions to pollination loss, and also on the contribution of insect pollinated crops to food security.
Loss of pollinators can be mitigated through a number of interventions including on-farm management and protection of semi-natural habitats in the wider landscape. However, infor-mation is fragmentary on the range of mitigation options available in Europe and their relative effectiveness in delivering pollinator conservation. Further, while there are a variety of options for enhancing pollination, such as supplementing managed pollinators, supporting wild pol-linators and artificial pollination, there is no broad picture of these practices across Europe.
9
As a response to the need for a better understanding of the science of pollinators and pollina-tion services, and how this can be used to help support policy and better practices, a number of national and international initiatives have been established. One of these, the STEP project (Status and Trends of European Pollinators) was funded by the European Commission.
The STEP project has helped science and policy move forward on many of the above chal-lenges which are illustrated in the following chapters. Specifically STEP has:
Documented the status and trends of pollinators (managed honeybees, wild bees and hoverflies) and animal-pollinated plants.Assessed the importance of multiple pressures that are driving changes in pollinators and animal-pollinated plants at scales ranging from single fields, to landscapes, to the whole of Europe.Quantified the impact of changes in pollinator populations and communities on wild plants and crops.Evaluated the effectiveness of strategies to mitigate the impacts of changes in polli-nators and animal-pollinated plants.Developed ways to improve the interface between the scientific knowledge-base on pollinator shifts and policy instruments.Developed communication and educational links with a wide range of stakeholders and the general public on the importance of recent shifts in pollinators, the main drivers and impacts of pollinator shifts and mitigation strategies through dissemination and training.
The following chapters summarise some of the key findings of the STEP project as a series of short case studies. Each case study presents a summary of the main scientific evidence fol-lowed by a short description of its policy relevance. These case studies are not an exhaustive list of all the outputs of the STEP project, but simply a small sample to highlight some of the main outcomes; a full list of publications and other outputs can be found on the STEP website (www.STEP-project.net). All the case studies include members of the STEP team and many also involved extensive collaborative efforts with researchers from all round the globe. The case studies have been authored by members of the STEP project, and the full list of contribu-tors to each study can be found in the authorship lists of the relevant publications, with those who are STEP members highlighted.
Chapter 1 starts by documenting the current status and trends of European pollinators and insect-pollinated plants; Chapter 2 then addresses a range of drivers of change, and Chapter 3 the resulting societal impacts of shifts in pollinators and pollination services. Mitigation responses to loss of pollinators and services are explored in Chapter 4, and fi-nally Chapter 5 looks at how evidence from the STEP project, and elsewhere, can be used to better inform policy making. Taken together these case studies demonstrate how a large-scale project bringing together a range of international expertise can generate important new knowledge to help safeguard Europe’s pollinators and the benefits they bring society.
Prof. Simon Potts, Coordinator of STEP

10
Chapter 1: Status and Trends of Pollinators across EuropeKoos Biesmeijer
Documenting trends in European pollinators (e.g. bees, hoverflies and butterflies) and plants that depend on animals for their pollination is not straightforward as historic data are very dispersed or lacking. Moreover, pollinators include the European honeybee, main-ly kept by beekeepers, as well as hundreds of wild species, many of which are barely known and studied. Still, we have made considerable progress in collating data from many different sources, developing analytical methods to improve the detection of patterns, and producing solid evidence for recent trends in pollinating insects and plant for several parts of Europe. Unfortunately, data availability is still the main bottleneck and has restricted the scope of some of our findings to specific species groups or a few countries. Below, and in the case studies 1.1-1.3 we will summarize some major recent findings.
European managed honeybees are often said to be in decline, but information was patchy and localized until Potts et al. (2010)* set out to compile data for 18 European countries. They observed consistent declines between 1985-2005 in colony numbers in Central Euro-pean countries and some increases in Mediterranean countries, while beekeeper numbers declined in all countries examined. This supports the view that honeybees and beekeeping are in decline at least in some regions. Further conclusions are hampered, however, by lack of standardized methodologies, which they recommend to be adopted at the national and global level. The EU COST Action COLOSS has made significant progress on this. Infor-mation on other pollinators is scarce and dispersed, but a serious attempt to assess trends in wild bees has been initiated in collaboration with the IUCN in the ‘European Bees Red List – project’ (case study 1.2). The first group that was assessed were the 68 species of bumblebees, important pollinators of many crops and wild plants. Of these species 46% are declining, 29% are stable and 13% are increasing in population or distribution.
Another study (case study 1.1) brought together more than 30 million species observation records on pollinators and plants from the Netherlands, the UK and Belgium, which have been collected largely by amateur naturalists with expert knowledge on these groups. The study shows that severe declines and homogenization of communities has occurred since the 1950s. However, declines seem to have stabilized and sometimes even reversed for a few groups in recent years. Ideally, one would obtain insight into shifts in abundance of species. This is rarely possible, as standardized surveys of biodiversity are fairly recent. Case study 1.3, explains how historic data on the number of bumblebee foragers visiting red clover flowers in Sweden, was used to assess shifts in relative abundance of different species. Sev-eral historically common species have now virtually disappeared and current bumblebee communities are dominated by very different species than past communities.*Potts S.G., Roberts S.P.M., Dean R., Marris G., Brown M., Jones R., Settele J. (2010) Declines of managed hon-eybees and beekeepers in Europe. Journal of Apicultural Research 49: 15-22.
11
1.1 Biodiversity loss among bees and wild flowers slows in
NW-Europe
Koos Biesmeijer, Luisa Carvalheiro and Bill Kunin
Summary of the science
A study published Ecology Letters in 2013 found evidence of dramatic reductions in the di-versity of species of bees, hoverflies, butterflies and wild flowers in Britain, Belgium and the Netherlands in the post war period. But the picture brightened markedly after 1990, with a slowdown in local and national biodiversity losses among bees, hoverflies and wild plants.
For example, the study found a 30% fall in local bumblebee diversity in all three countries between the 1950s and the 1980s. However, by 2010 that decline slowed to an estimated 10 per cent in Britain, whilst in Belgium and the Netherlands bumblebee diversity had stabilised.
The picture was better for other wild bees, with an 8 per cent reduction in diversity in the Netherlands and a stable picture in Great Britain turning into significant increases (7 per cent in the Netherlands and 10 per cent in Britain) over the past 20 years. While these soli-tary bees continued to decline in Belgium, hoverfly diversity improved there, shifting from stable diversity in the 1980s to significant (20 per cent) increases in recent decades. British wildflower diversity had declined about 20 per cent from the 1950s to the 1980s, but again the declines have ceased in the past 20 years. Not all groups fared so well. Butterfly diversity continued to fall in all three countries at roughly the same rates as in the past.
This work is based on a very large dataset of species records and sophisticated analytic meth-ods. However, while we can use biodiversity records to measure changes in the diversity of pollinators, we cannot tell what is happening to their overall abundance or to the quality of the pollination services they provide to wildflowers or agricultural crops. To study these issues would require a proper long-term monitoring programme to be set up.
Moreover, it is still unclear what drove the patterns of richness change reported here. It is possible that by 1990 the most sensitive species had already gone and were, partially, re-placed by generalist species. But that is probably not the whole story, as there are still plenty of rare and vulnerable species present in recent records. There is a much more encouraging possibility: reducing environmental pollution, conservation work and agri-environment programs paying farmers to encourage biodiversity may be having a positive effect.
We may also be seeing a slowdown of the drivers of decline. The post war emphasis on getting land into production and on more intensive farming has given way to a more stable situation in which the rate of landscape change has slowed and in which agrichemical ex-cesses are regulated.
12
Policy relevance
Most observers suggest the 1992 Rio Earth Summit targets to slow biodiversity loss by 2010 failed, but what we are seeing here is a significant slowing or reversal of the declines for wild plants and their insect pollinators. If what we take from the Rio targets is that the investment in conservation gave us no results, then that is a counsel of despair. This study brings a pos-itive message for conservation. But some important groups are undoubtedly still declining, so continued and increased investment in conservation practices is essential to guarantee the persistence of a diverse assemblage of species.
Reference
Carvalheiro L.G., Kunin W.E., Keil P., Aguirre-Gutiérrez J., Ellis W.N., Fox R., Groom Q., Hennekens S., Van Landuyt W., Maes D., Van de Meutter F., Michez D., Rasmont P., Ode B., Potts S.G., Reemer M., Roberts S.P.M., Schaminée J., WallisDeVries M.F. and Biesmeijer J.C. (2013) Species richness declines and biotic homogenization have slowed down for NW-Euro-pean pollinators and plants. Ecology Letters 16: 870-878.
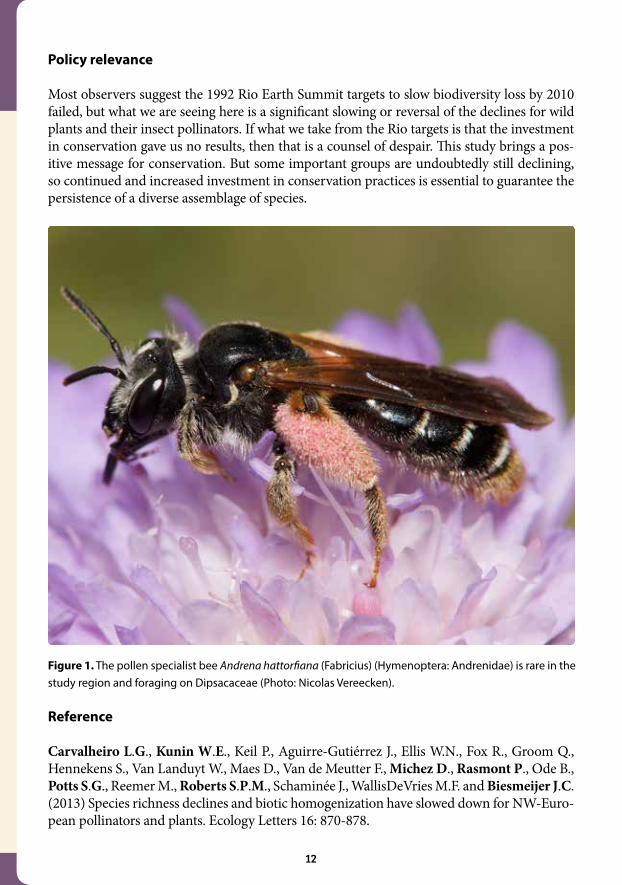
Figure 1. The pollen specialist bee Andrena hattorfiana (Fabricius) (Hymenoptera: Andrenidae) is rare in the study region and foraging on Dipsacaceae (Photo: Nicolas Vereecken).
13
-40
-20
020
4060
-4
0-2
00
2040
60-4
0-2
00
2040
60
-40
-20
020
4060
-40
-20
020
4060
160km
10km
20km
40km
80km
Wholecountry
160km
10km
20km
40km
80km
Wholecountry
dependent on insects
intermediate dependenceindependent of insects
Flower visitors
Cha
nge
(%)
Netherlands
Netherlands
Belgium
Belgium
Great Britain
Cha
nge
(%)
Cha
nge
(%)
Cha
nge
(%)
Cha
nge
(%)
Plants
Cha
nge
(%)
-40
-20
020
4060
bumblebees
hover�ies
butter�ies
other bees
1950-1969 vs. 1970-1989 1970-1989 vs. 1990-2009P1 P2 P2 P3
a) b)
c) d)
e) f )
g) h)
i) j)
k) l)Great Britain
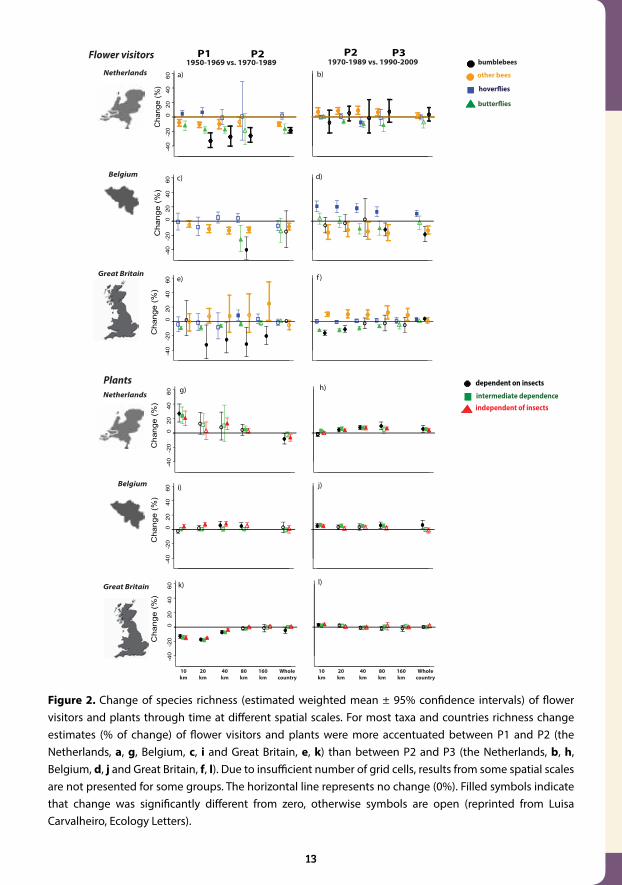
Figure 2. Change of species richness (estimated weighted mean ± 95% confidence intervals) of flower visitors and plants through time at different spatial scales. For most taxa and countries richness change estimates (% of change) of flower visitors and plants were more accentuated between P1 and P2 (the Netherlands, a, g, Belgium, c, i and Great Britain, e, k) than between P2 and P3 (the Netherlands, b, h, Belgium, d, j and Great Britain, f, l). Due to insufficient number of grid cells, results from some spatial scales are not presented for some groups. The horizontal line represents no change (0%). Filled symbols indicate that change was significantly different from zero, otherwise symbols are open (reprinted from Luisa Carvalheiro, Ecology Letters).
-40
-20
020
4060
-4
0-2
00
2040
60-4
0-2
00
2040
60
-40
-20
020
4060
-40
-20
020
4060
160km
10km
20km
40km
80km
Wholecountry
160km
10km
20km
40km
80km
Wholecountry
dependent on insects
intermediate dependenceindependent of insects
Flower visitors
Cha
nge
(%)
Netherlands
Netherlands
Belgium
Belgium
Great Britain
Cha
nge
(%)
Cha
nge
(%)
Cha
nge
(%)
Cha
nge
(%)
Plants
Cha
nge
(%)
-40
-20
020
4060
bumblebees
hover�ies
butter�ies
other bees
1950-1969 vs. 1970-1989 1970-1989 vs. 1990-2009P1 P2 P2 P3
a) b)
c) d)
e) f )
g) h)
i) j)
k) l)Great Britain
-40
-20
020
4060
-4
0-2
00
2040
60-4
0-2
00
2040
60
-40
-20
020
4060
-40
-20
020
4060
160km
10km
20km
40km
80km
Wholecountry
160km
10km
20km
40km
80km
Wholecountry
dependent on insects
intermediate dependenceindependent of insects
Flower visitors
Cha
nge
(%)
Netherlands
Netherlands
Belgium
Belgium
Great Britain
Cha
nge
(%)
Cha
nge
(%)
Cha
nge
(%)
Cha
nge
(%)
Plants
Cha
nge
(%)
-40
-20
020
4060
bumblebees
hover�ies
butter�ies
other bees
1950-1969 vs. 1970-1989 1970-1989 vs. 1990-2009P1 P2 P2 P3
a) b)
c) d)
e) f )
g) h)
i) j)
k) l)Great Britain
14
1.2 First ever Red List of European beesDenis Michez, Pierre Rasmont, Stuart P. M. Roberts and Ana Nieto
Summary of the science
Extinction drivers vary in space and time, interact synergistically, and affect species and/or functional groups differently (Figure 1 A, B). One of the main challenges of the STEP project was to assess how each bee species among the 1,965 species native in Europe is potentially experiencing a risk of extinction. Assessing the status of all European bees was a major task that required a coordinated large-scale effort involving specialists from across Europe, as well as a standardized framework of assessment. The STEP project collaborated with IUCN and applied the internationally recognized IUCN (International Union for Conservation of Nature) Red List procedures (www.iucnredlist.org) to guide the development of a Red Data Book for European bees. As the knowledge base for this assessment was both taxonomically and geographically incomplete, we involved the majority of the European bee expert community (i.e. taxonomists and ecologists). We also built a partnership with the European team of IUCN to coordinate and guide this process. A team of more than 40 experts participated in the development of the assessments and the review process for this first European bee Red List. The following information was collected for all the species: nomenclature, distribution, country records, population size and trend, preferred habitats, general ecology, modes of utilisation, major threats, ecosystem services provided and current and future conservation measures.
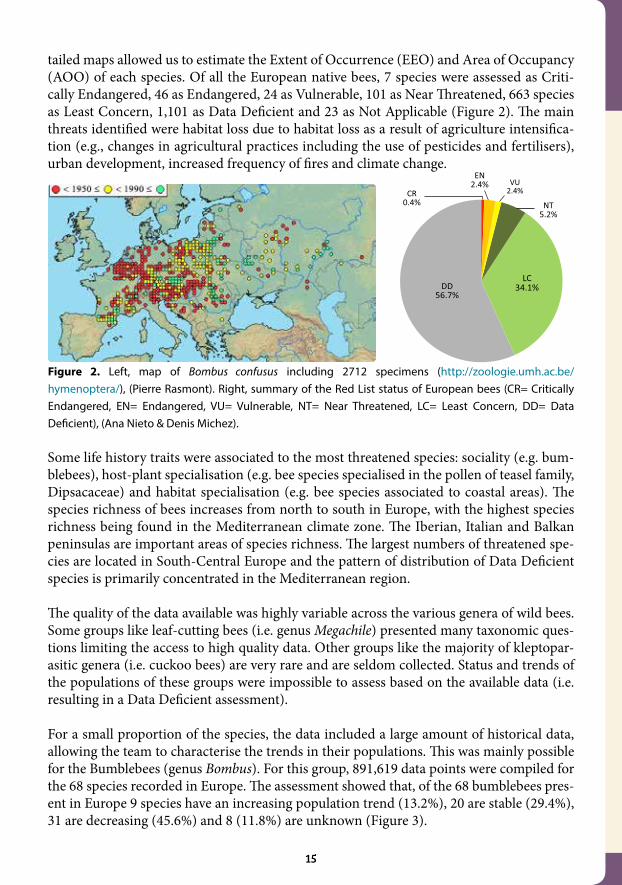
The first outcome was an updated checklist of European bees, which now includes 1,965 species. This is an important step forward as the last comprehensive list of European bees was published in 1901 by Friese. The team gathered all the available observations to produce detailed maps of 1,585 species including 2.5 million data points; these maps are available on the IUCN and Atlas Hymenoptera websites, and example is given in Figure 2. These de-
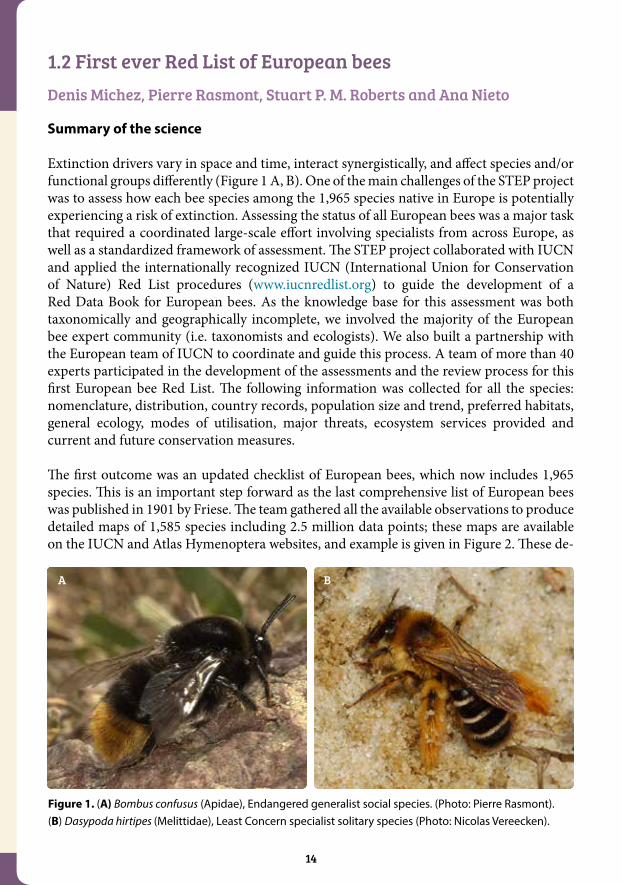
Figure 1. (A) Bombus confusus (Apidae), Endangered generalist social species. (Photo: Pierre Rasmont). (B) Dasypoda hirtipes (Melittidae), Least Concern specialist solitary species (Photo: Nicolas Vereecken).
15
tailed maps allowed us to estimate the Extent of Occurrence (EEO) and Area of Occupancy (AOO) of each species. Of all the European native bees, 7 species were assessed as Criti-cally Endangered, 46 as Endangered, 24 as Vulnerable, 101 as Near Threatened, 663 species as Least Concern, 1,101 as Data Deficient and 23 as Not Applicable (Figure 2). The main threats identified were habitat loss due to habitat loss as a result of agriculture intensifica-tion (e.g., changes in agricultural practices including the use of pesticides and fertilisers), urban development, increased frequency of fires and climate change.
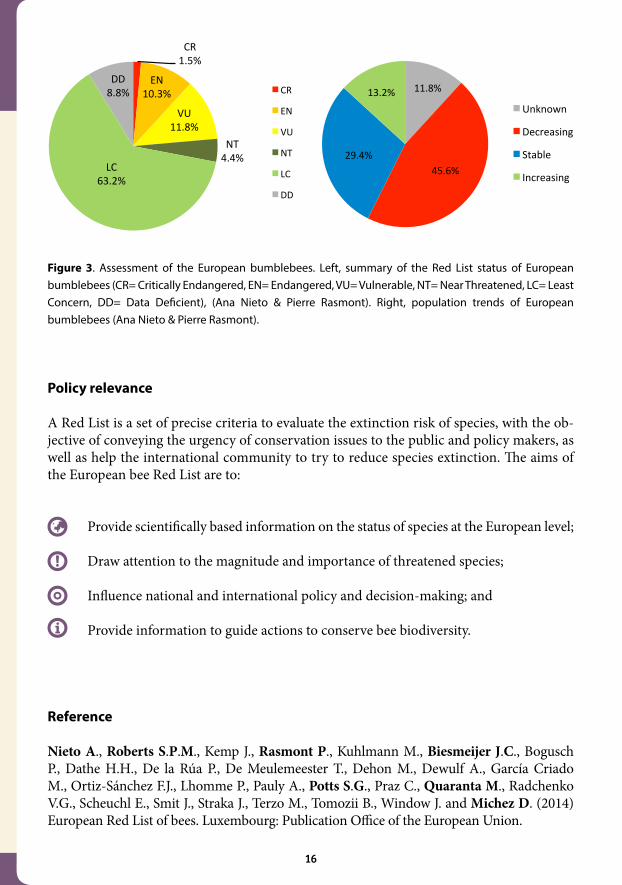
Some life history traits were associated to the most threatened species: sociality (e.g. bum-blebees), host-plant specialisation (e.g. bee species specialised in the pollen of teasel family, Dipsacaceae) and habitat specialisation (e.g. bee species associated to coastal areas). The species richness of bees increases from north to south in Europe, with the highest species richness being found in the Mediterranean climate zone. The Iberian, Italian and Balkan peninsulas are important areas of species richness. The largest numbers of threatened spe-cies are located in South-Central Europe and the pattern of distribution of Data Deficient species is primarily concentrated in the Mediterranean region. The quality of the data available was highly variable across the various genera of wild bees. Some groups like leaf-cutting bees (i.e. genus Megachile) presented many taxonomic ques-tions limiting the access to high quality data. Other groups like the majority of kleptopar-asitic genera (i.e. cuckoo bees) are very rare and are seldom collected. Status and trends of the populations of these groups were impossible to assess based on the available data (i.e. resulting in a Data Deficient assessment). For a small proportion of the species, the data included a large amount of historical data, allowing the team to characterise the trends in their populations. This was mainly possible for the Bumblebees (genus Bombus). For this group, 891,619 data points were compiled for the 68 species recorded in Europe. The assessment showed that, of the 68 bumblebees pres-ent in Europe 9 species have an increasing population trend (13.2%), 20 are stable (29.4%), 31 are decreasing (45.6%) and 8 (11.8%) are unknown (Figure 3).
Figure 2. Left, map of Bombus confusus including 2712 specimens (http://zoologie.umh.ac.be/ hymenoptera/), (Pierre Rasmont). Right, summary of the Red List status of European bees (CR= Critically Endangered, EN= Endangered, VU= Vulnerable, NT= Near Threatened, LC= Least Concern, DD= Data Deficient), (Ana Nieto & Denis Michez).
16
Policy relevance
A Red List is a set of precise criteria to evaluate the extinction risk of species, with the ob-jective of conveying the urgency of conservation issues to the public and policy makers, as well as help the international community to try to reduce species extinction. The aims of the European bee Red List are to:
Provide scientifically based information on the status of species at the European level;
Draw attention to the magnitude and importance of threatened species;
Influence national and international policy and decision-making; and
Provide information to guide actions to conserve bee biodiversity.
Reference
Nieto A., Roberts S.P.M., Kemp J., Rasmont P., Kuhlmann M., Biesmeijer J.C., Bogusch P., Dathe H.H., De la Rúa P., De Meulemeester T., Dehon M., Dewulf A., García Criado M., Ortiz-Sánchez F.J., Lhomme P., Pauly A., Potts S.G., Praz C., Quaranta M., Radchenko V.G., Scheuchl E., Smit J., Straka J., Terzo M., Tomozii B., Window J. and Michez D. (2014) European Red List of bees. Luxembourg: Publication Office of the European Union.
!
i
Figure 3. Assessment of the European bumblebees. Left, summary of the Red List status of European bumblebees (CR= Critically Endangered, EN= Endangered, VU= Vulnerable, NT= Near Threatened, LC= Least Concern, DD= Data Deficient), (Ana Nieto & Pierre Rasmont). Right, population trends of European bumblebees (Ana Nieto & Pierre Rasmont).
11.8%
45.6%
29.4%
13.2%
Unknown
Decreasing
Stable
Increasing
CR 1.5%
EN 10.3%
VU 11.8%
NT 4.4%
LC 63.2%
DD 8.8% CR
EN
VU
NT
LC
DD
11.8%
45.6% 29.4%
13.2%
Unknown
Decreasing
Stable
Increasing
CR 1.5%
EN 10.3%
VU 11.8%
NT 4.4%
LC 63.2%
DD 8.8% CR
EN
VU
NT
LC
DD
17
1.3 Drastic historic shifts in bumblebee community composition in Sweden
Ola Lundin
Summary of the science
Wild bees are threatened by many factors. Two important drivers are land use change and intensification. Declines in species richness of bumblebees have received particular attention, especially in Europe and North America. Many pollinator-dependent crops rely on bees for yield, and the threats that bees are facing have raised concerns that crop pollination might also be at risk. This concern depends on how drastic the changes in bee composition have been, how important the declining bee species are for crop pollination, and the extent to which crop yields are sensitive to changes in pollination service. We addressed these questions, using his-toric data for a highly pollination dependent crop – red clover.
Charles Darwin noted that bees, primarily bumblebees, are essential for red clover seed production, as the flowers do not set any seeds unless bees pollinate them. Sweden has
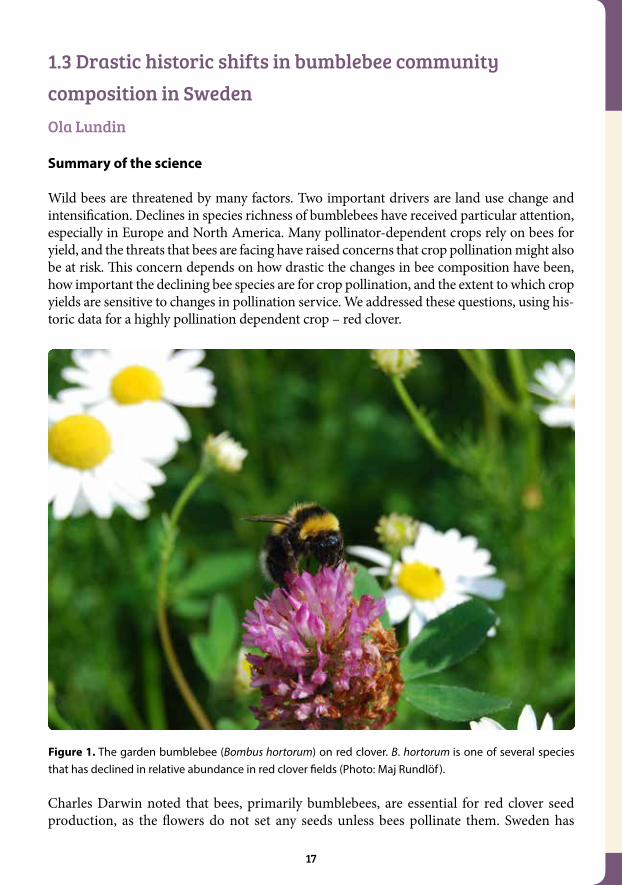
Figure 1. The garden bumblebee (Bombus hortorum) on red clover. B. hortorum is one of several species that has declined in relative abundance in red clover fields (Photo: Maj Rundlöf ).
18
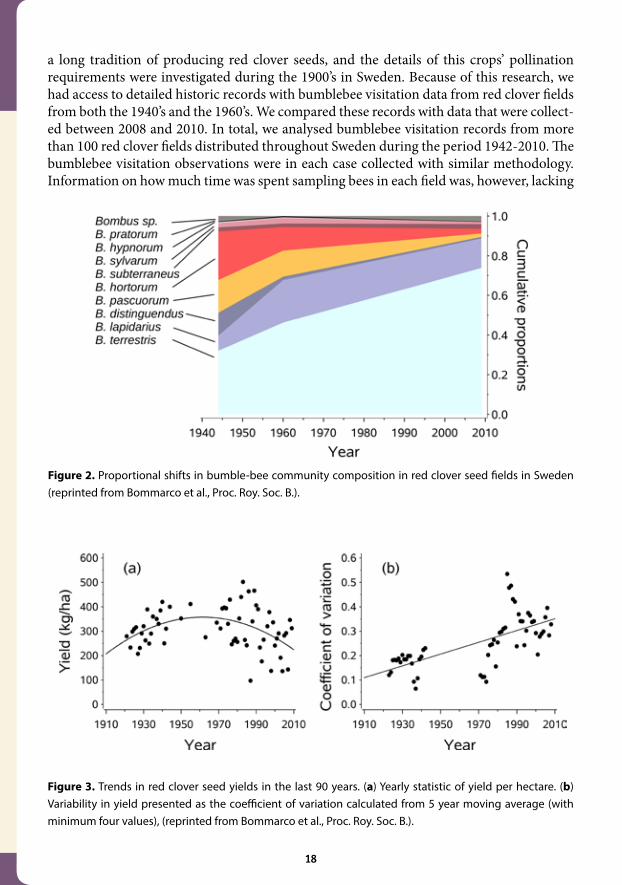
a long tradition of producing red clover seeds, and the details of this crops’ pollination requirements were investigated during the 1900’s in Sweden. Because of this research, we had access to detailed historic records with bumblebee visitation data from red clover fields from both the 1940’s and the 1960’s. We compared these records with data that were collect-ed between 2008 and 2010. In total, we analysed bumblebee visitation records from more than 100 red clover fields distributed throughout Sweden during the period 1942-2010. The bumblebee visitation observations were in each case collected with similar methodology. Information on how much time was spent sampling bees in each field was, however, lacking
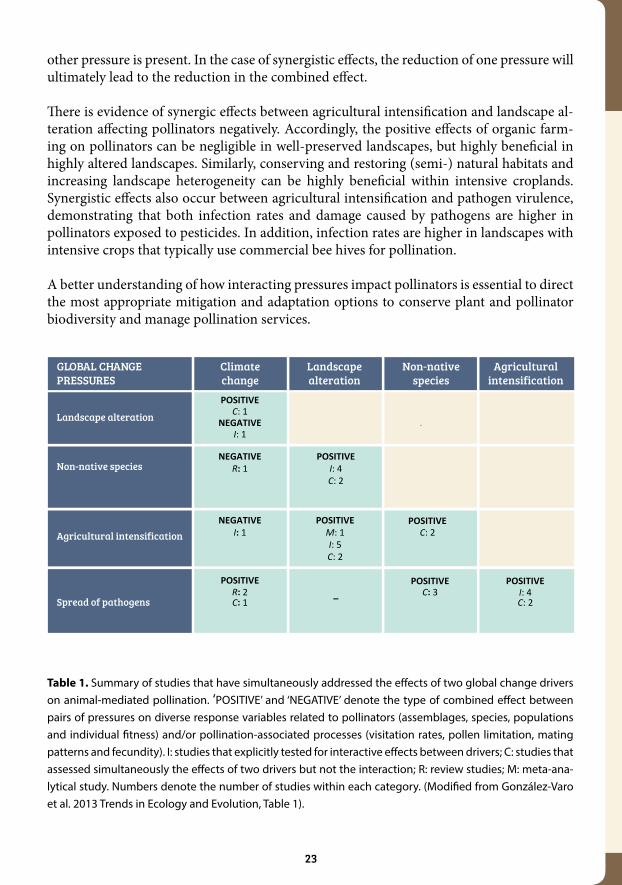
Figure 3. Trends in red clover seed yields in the last 90 years. (a) Yearly statistic of yield per hectare. (b) Variability in yield presented as the coefficient of variation calculated from 5 year moving average (with minimum four values), (reprinted from Bommarco et al., Proc. Roy. Soc. B.).
Figure 2. Proportional shifts in bumble-bee community composition in red clover seed fields in Sweden (reprinted from Bommarco et al., Proc. Roy. Soc. B.).

19
for much of the historic records. Therefore, we focused on analysing how the proportion of each bumblebee species had changed over time, as this measure is relatively stable to differences in sampling effort. We also compiled and analysed data on red clover yields in Sweden during the last 90 years.
We found drastic shifts in the relative abundance of several bumblebee species over time (Fig-ures 1 and 2). Two generalist species had increased in relative abundance, such that they now completely dominate the bee community at the expense of several other more specialized bumblebees, including some that are specialized on pollinating deep flowers, such as red clo-ver. We suggest that this shift in the bumblebee community is related to the loss and frag-mentation of key bumblebee habitats, such as hay meadows and semi-natural pastures, in the agricultural landscape. We also highlighted that legumes in general, and especially red clover, which are important nectar and pollen resources for bumblebees, have become much rarer in the landscape. This reduced availability and increased fragmentation of resources, is a proba-ble reason why only generalist and highly mobile bumblebee species have been able to main-tain large populations in intensively managed agricultural landscapes. In fact, they might even have been favoured by these changes due to release from competition from other bumblebee species. In parallel to the shifts in functional composition of pollinator communities across Sweden, we found that red clover seed yields have declined since the 1960’s and that the vari-ation in seed yields has doubled in the last decades (Figure 3). Our approach cannot confirm a causal link between changes in the relative abundances of bumblebees and lower and more variable yields, but we do provide some strong evidence consistent with this explanation.
Policy relevance
The case study illustrates that there are important opportunities to better understand trends in pollinator communities by using historic data from the literature, and there may be fur-ther historic information available in libraries and archives, which could be used to better understand trends in other species in other regions. Our study, however, also illustrates the limitations of such approaches, as the available data did not allow us to draw conclusions about shifts in absolute bumblebee abundances. Therefore, more standardized monitoring and documentation of the occurrence and abundance of pollinators are needed to enable comprehensive assessments of pollinator trends.
From a conservation perspective, the study highlights that management practices which contribute to conservation of the diversity of pollinators is important, but probably not sufficient to secure and stabilise yields of insect pollinated crops. To achieve production benefits, there is also a need for management which safeguards a wide range of functionally important pollinators at sufficient abundances.
Reference
Bommarco R., Lundin O., Smith H.G., Rundlöf M. (2012) Drastic historic shifts in bumblebee community composition in Sweden. Proceedings of the Royal Society B-Biological Sciences 279: 309-315.

20
Chapter 2: Drivers and Pressures on PollinatorsOliver Schweiger
Status and trends of pollinators are determined by a variety of drivers and pressures and many of them are prone to changes as a result of anthropogenic activities. Major glob-al change pressures are climate change, landscape alteration, agricultural intensification, non-native species and spread of pathogens. Climatic conditions set the general precondi-tions for the occurrence and performance of wild species according to their specific phys-iological limits. Current climate change shifts the suitable climatic conditions in time and space, and pollinators that cannot compensate for this or have limited abilities to follow these changes, can be seriously threatened. The major impact of land-use change concerns the loss of habitat area or degradation of its quality (e.g. loss of nectar, pollen and nesting resources). Agricultural intensification, such as the increased use of fertilisers and pesti-cides, is a highly sensitive issue because the increased demand for food grown on a limited amount of suitable land can favour intensification to increase yields per hectare, while the consequences for pollinators may be detrimental. The wide-ranging concerns about pesti-cides, especially of systemic pesticides, resulted in the temporary ban of three major neon-icotinoids by the European Commission. In addition to land use and climate pressures, the introduction of non-native pollinators can increase the risk of pathogen spread, especially of non-native pathogens which likely show higher virulence in their novel hosts. All these different environmental drivers rarely act in isolation and interactive effects, where one driver increases the severity of another driver, are likely to be important. Awareness of this importance is increasing, yet most studies have only analysed single specific drivers in isolation, but to develop effective management strategies, a solid framework of such inter-action mechanisms is needed (see case study 2.1).
There is also an urgent need to know about the relative importance of the multiple drivers. Land transformation is currently thought to be the most important driver but most of the suitable land in Europe has already been converted to agricultural fields and, and so further shifts in land use to farming may be limited. This leads to the question of whether the impact of other drivers such as climate change, or an increase in agrochemicals, will gain importance. A question addressed in case study 2.2, where we show that climate predominantly deter-mines the geographic distribution of European pollinators at large spatial scales, followed by land use and agricultural intensity.
Given the high impact of climate on pollinator distributions, knowledge of potential future changes is of particular relevance. In case study 2.3 we show that future climate change will indeed pose serious risks to bumblebees.
An increased pressure from land-use intensity is explored by case study 2.4, where de-clines in pollinator densities in European mass-flowering crops are described. In such

21
intensively utilised agricultural areas, pesticides represent a major source of potential concern for pollinators and thus fair test guidelines for pesticide approval are needed. Unfortunately, the effects of chronic exposure to sub-lethal dosages, as they appear in the field, and their interactions with other environmental pressures such as common parasites may not be fully relevant in current pesticide certification procedures, although some pesticides can be shown to have severe impacts on pollinator colony performance and fitness (see case study 2.5).
2.1 Combined effects of global change pressures on animal-mediated pollinationJuan P. González-Varo and Montserrat Vilà
Summary of the science
Pollination is essential in the sexual reproduction of seed plants and a key ecosystem service to human welfare as many crops depend on animal pollination for yield production (Figure 1). Increasing evidence of pollinator declines has been reported as a consequence of five major global change pressures: climate change, landscape alteration, agricultural intensification, in-troduction of non-native species, and spread of pathogens. Our study reviewed the current evidence for these drivers acting simultaneously on pollinators and pollination services.
Climate change entails changes in community composition through shifts in the geographi-cal range and/or phenology of pollinator and plant species. Landscape alteration comprises the degradation, destruction and fragmentation of natural habitats, resulting in associated changes in landscape configuration, habitat diversity, and community composition. Inten-sive agriculture is characterised by an increase in input of pesticides and fertilisers, farm size, monocultures and simplified crop rotations. The effects of biological invasions on an-imal-mediated pollination have usually been addressed by considering non-native plants and non-native pollinators, both affecting the natural patters of plant-pollinator interac-tions. Further, the huge increase during the past decades in the trade of managed pollina-tors has promoted pathogen transmission to wild pollinators, and vice versa.
These global change pressures differ in their biotic and abiotic nature and also in their spa-tial and temporal scales of actions. For example, climate warming usually acts at the region-al scale, while other pressures, such as the spread of pathogens, are typically more localised, although they might expand very quickly through the landscape.
A given pressure can impact animal-mediated pollination directly by disrupting the oc-currence, abundance and phenology of flower and pollinator species. However, a pressure can also impact pollination indirectly, by interacting with other pressures, either additively or non-additively. Non-additive effects occur if the impact of a given pressure is amplified

22
(synergistic effects) or buffered (antagonistic effects) when it occurs in combination with another pressure.
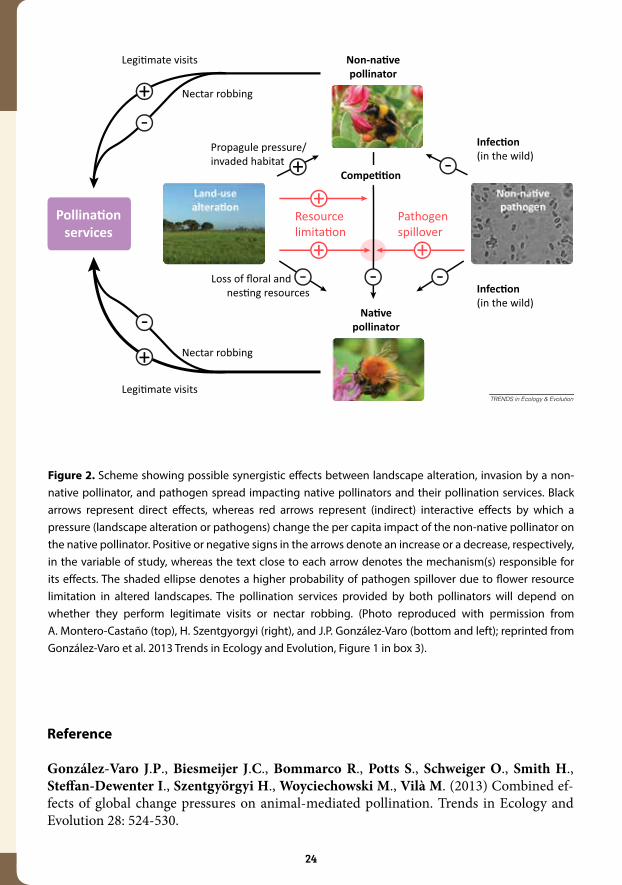
As exemplified in Figure 2, landscape alteration might impact native pollinators directly by reducing floral and nesting resources. Indirect impacts of landscape alteration include (i) favouring the abundance of non-native pollinators, and (ii) the increase in its per capita impact through resource limitation, which additionally would increase the probability of pathogen spillover.
To date, only a few empirical studies have explicitly tested the interactive effects of multi-ple global change pressures on pollinators and/or animal-mediated pollination (Table 1). Consequently, our knowledge on the interaction between various pressures is still limit-ed and many interaction combinations are still underexplored. For example, given that pathogen spillover is considered a major driver for observed bumblebee declines, more attention should be placed to pathogen spread under contrasting scenarios of landscape alteration. Also unexplored are those interactions between climate change and landscape alteration, agricultural intensification or non-native species. Climate change is expected to cause phenological mismatches in the low diversity plant-pollinator communities of
highly modified or intensively cultivat-ed landscapes, jeopardizing both plant reproduction and pollinator feeding. Nevertheless, non-native plants and pollinators could potentially provide food supply and pollination function, respectively, to resident native species in periods where native plants and pol-linators have curtailed their phenology.
Overall, the outstanding challenges are to combine observational and manip-ulative experimental designs to analyse explicitly pair-wise, and further multi-ple, interactions between pressures.
Policy relevance
Our review of the empirical evidence about the effects of multiple global change pressures on pollinators and pollination highlights that we are far from understanding their combined effects. Management actions aimed at buffering the impacts of a particular pressure could prove ineffective if an-
Figure 1. The bee Lasioglossum albocinctum visiting flowers of Spanish lavender (Lavandula stoechas) in a small woodland remnant (Photo: Juan P. González-Varo).
23
other pressure is present. In the case of synergistic effects, the reduction of one pressure will ultimately lead to the reduction in the combined effect.
There is evidence of synergic effects between agricultural intensification and landscape al-teration affecting pollinators negatively. Accordingly, the positive effects of organic farm-ing on pollinators can be negligible in well-preserved landscapes, but highly beneficial in highly altered landscapes. Similarly, conserving and restoring (semi-) natural habitats and increasing landscape heterogeneity can be highly beneficial within intensive croplands. Synergistic effects also occur between agricultural intensification and pathogen virulence, demonstrating that both infection rates and damage caused by pathogens are higher in pollinators exposed to pesticides. In addition, infection rates are higher in landscapes with intensive crops that typically use commercial bee hives for pollination.
A better understanding of how interacting pressures impact pollinators is essential to direct the most appropriate mitigation and adaptation options to conserve plant and pollinator biodiversity and manage pollination services.
Table 1. Summary of studies that have simultaneously addressed the effects of two global change drivers on animal-mediated pollination. ‘POSITIVE’ and ‘NEGATIVE’ denote the type of combined effect between pairs of pressures on diverse response variables related to pollinators (assemblages, species, populations and individual fitness) and/or pollination-associated processes (visitation rates, pollen limitation, mating patterns and fecundity). I: studies that explicitly tested for interactive effects between drivers; C: studies that assessed simultaneously the effects of two drivers but not the interaction; R: review studies; M: meta-ana-lytical study. Numbers denote the number of studies within each category. (Modified from González-Varo et al. 2013 Trends in Ecology and Evolution, Table 1).
GLOBAL CHANGE
Landscape alteration
POSITIVEC: 1
NEGATIVEI: 1
NEGATIVER: 1
NEGATIVEI: 1
–
POSITIVER: 2C: 1
POSITIVEC: 3
POSITIVEM: 1I: 5C: 2
POSITIVEI: 4C: 2
Non-native species
Agricultural intensification
Spread of pathogens
PRESSURESClimatechange
Landscapealteration
Non-nativespecies
Agriculturalintensification
POSITIVE
POSITIVEI: 4C: 2
C: 2
24
Figure 2. Scheme showing possible synergistic effects between landscape alteration, invasion by a non-native pollinator, and pathogen spread impacting native pollinators and their pollination services. Black arrows represent direct effects, whereas red arrows represent (indirect) interactive effects by which a pressure (landscape alteration or pathogens) change the per capita impact of the non-native pollinator on the native pollinator. Positive or negative signs in the arrows denote an increase or a decrease, respectively, in the variable of study, whereas the text close to each arrow denotes the mechanism(s) responsible for its effects. The shaded ellipse denotes a higher probability of pathogen spillover due to flower resource limitation in altered landscapes. The pollination services provided by both pollinators will depend on whether they perform legitimate visits or nectar robbing. (Photo reproduced with permission from A. Montero-Castaño (top), H. Szentgyorgyi (right), and J.P. González-Varo (bottom and left); reprinted from González-Varo et al. 2013 Trends in Ecology and Evolution, Figure 1 in box 3).
Reference
González-Varo J.P., Biesmeijer J.C., Bommarco R., Potts S., Schweiger O., Smith H., Steffan-Dewenter I., Szentgyörgyi H., Woyciechowski M., Vilà M. (2013) Combined ef-fects of global change pressures on animal-mediated pollination. Trends in Ecology and Evolution 28: 524-530.
25
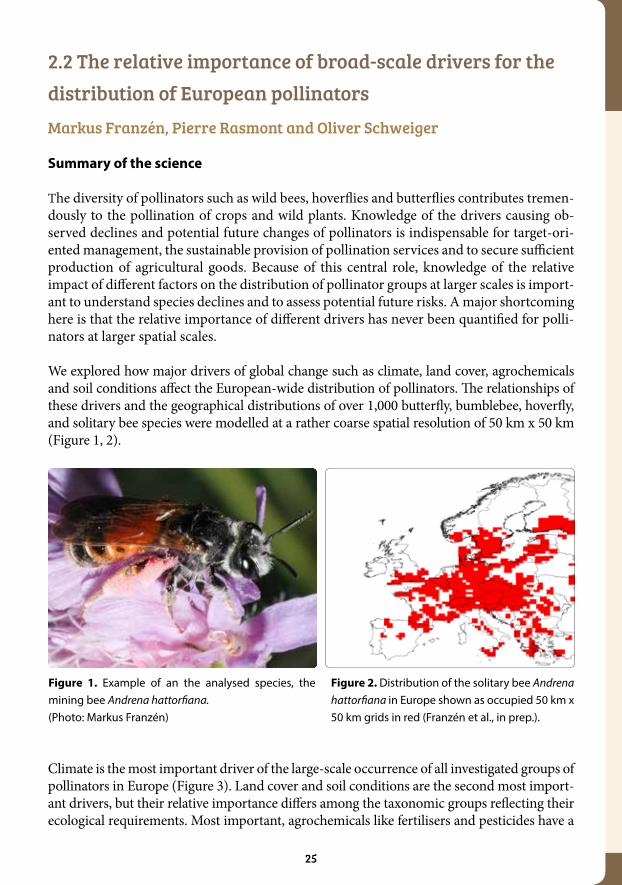
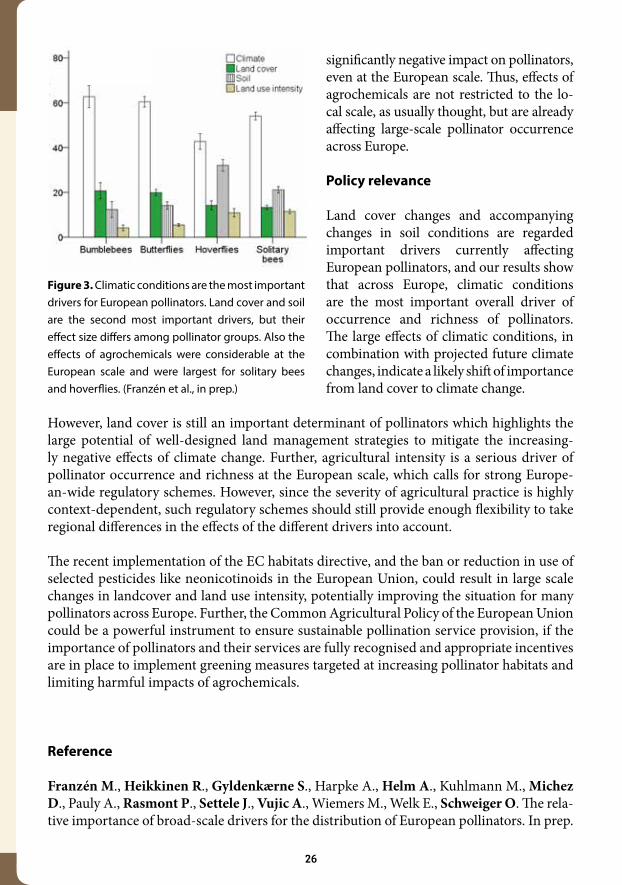
2.2 The relative importance of broad-scale drivers for the distribution of European pollinatorsMarkus Franzén, Pierre Rasmont and Oliver Schweiger
Summary of the science
The diversity of pollinators such as wild bees, hoverflies and butterflies contributes tremen-dously to the pollination of crops and wild plants. Knowledge of the drivers causing ob-served declines and potential future changes of pollinators is indispensable for target-ori-ented management, the sustainable provision of pollination services and to secure sufficient production of agricultural goods. Because of this central role, knowledge of the relative impact of different factors on the distribution of pollinator groups at larger scales is import-ant to understand species declines and to assess potential future risks. A major shortcoming here is that the relative importance of different drivers has never been quantified for polli-nators at larger spatial scales.
We explored how major drivers of global change such as climate, land cover, agrochemicals and soil conditions affect the European-wide distribution of pollinators. The relationships of these drivers and the geographical distributions of over 1,000 butterfly, bumblebee, hoverfly, and solitary bee species were modelled at a rather coarse spatial resolution of 50 km x 50 km (Figure 1, 2).
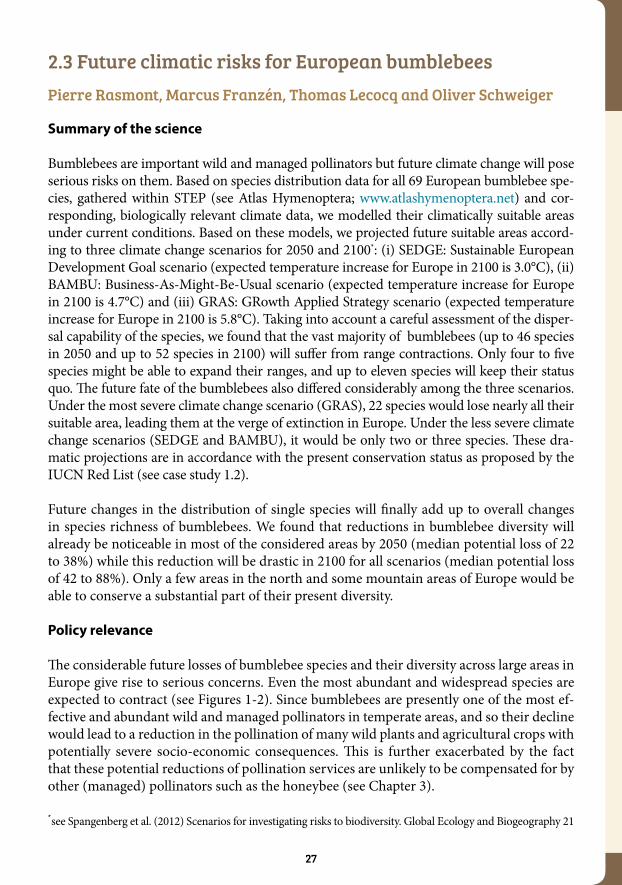
Climate is the most important driver of the large-scale occurrence of all investigated groups of pollinators in Europe (Figure 3). Land cover and soil conditions are the second most import-ant drivers, but their relative importance differs among the taxonomic groups reflecting their ecological requirements. Most important, agrochemicals like fertilisers and pesticides have a
Figure 2. Distribution of the solitary bee Andrena hattorfiana in Europe shown as occupied 50 km x 50 km grids in red (Franzén et al., in prep.).
Figure 1. Example of an the analysed species, the mining bee Andrena hattorfiana.(Photo: Markus Franzén)
26
significantly negative impact on pollinators, even at the European scale. Thus, effects of agrochemicals are not restricted to the lo-cal scale, as usually thought, but are already affecting large-scale pollinator occurrence across Europe.
Policy relevance
Land cover changes and accompanying changes in soil conditions are regarded important drivers currently affecting European pollinators, and our results show that across Europe, climatic conditions are the most important overall driver of occurrence and richness of pollinators. The large effects of climatic conditions, in combination with projected future climate changes, indicate a likely shift of importance from land cover to climate change.
However, land cover is still an important determinant of pollinators which highlights the large potential of well-designed land management strategies to mitigate the increasing-ly negative effects of climate change. Further, agricultural intensity is a serious driver of pollinator occurrence and richness at the European scale, which calls for strong Europe-an-wide regulatory schemes. However, since the severity of agricultural practice is highly context-dependent, such regulatory schemes should still provide enough flexibility to take regional differences in the effects of the different drivers into account.
The recent implementation of the EC habitats directive, and the ban or reduction in use of selected pesticides like neonicotinoids in the European Union, could result in large scale changes in landcover and land use intensity, potentially improving the situation for many pollinators across Europe. Further, the Common Agricultural Policy of the European Union could be a powerful instrument to ensure sustainable pollination service provision, if the importance of pollinators and their services are fully recognised and appropriate incentives are in place to implement greening measures targeted at increasing pollinator habitats and limiting harmful impacts of agrochemicals.
Reference
Franzén M., Heikkinen R., Gyldenkærne S., Harpke A., Helm A., Kuhlmann M., Michez D., Pauly A., Rasmont P., Settele J., Vujic A., Wiemers M., Welk E., Schweiger O. The rela-tive importance of broad-scale drivers for the distribution of European pollinators. In prep.
Figure 3. Climatic conditions are the most important drivers for European pollinators. Land cover and soil are the second most important drivers, but their effect size differs among pollinator groups. Also the effects of agrochemicals were considerable at the European scale and were largest for solitary bees and hoverflies. (Franzén et al., in prep.)
27
2.3 Future climatic risks for European bumblebees Pierre Rasmont, Marcus Franzén, Thomas Lecocq and Oliver Schweiger
Summary of the science
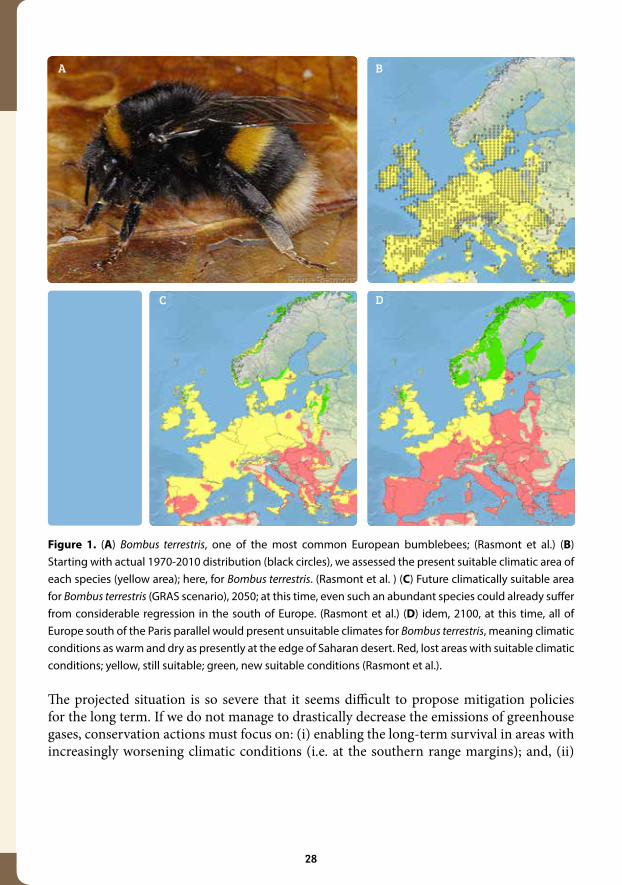
Bumblebees are important wild and managed pollinators but future climate change will pose serious risks on them. Based on species distribution data for all 69 European bumblebee spe-cies, gathered within STEP (see Atlas Hymenoptera; www.atlashymenoptera.net) and cor-responding, biologically relevant climate data, we modelled their climatically suitable areas under current conditions. Based on these models, we projected future suitable areas accord-ing to three climate change scenarios for 2050 and 2100*: (i) SEDGE: Sustainable European Development Goal scenario (expected temperature increase for Europe in 2100 is 3.0°C), (ii) BAMBU: Business-As-Might-Be-Usual scenario (expected temperature increase for Europe in 2100 is 4.7°C) and (iii) GRAS: GRowth Applied Strategy scenario (expected temperature increase for Europe in 2100 is 5.8°C). Taking into account a careful assessment of the disper-sal capability of the species, we found that the vast majority of bumblebees (up to 46 species in 2050 and up to 52 species in 2100) will suffer from range contractions. Only four to five species might be able to expand their ranges, and up to eleven species will keep their status quo. The future fate of the bumblebees also differed considerably among the three scenarios. Under the most severe climate change scenario (GRAS), 22 species would lose nearly all their suitable area, leading them at the verge of extinction in Europe. Under the less severe climate change scenarios (SEDGE and BAMBU), it would be only two or three species. These dra-matic projections are in accordance with the present conservation status as proposed by the IUCN Red List (see case study 1.2).
Future changes in the distribution of single species will finally add up to overall changes in species richness of bumblebees. We found that reductions in bumblebee diversity will already be noticeable in most of the considered areas by 2050 (median potential loss of 22 to 38%) while this reduction will be drastic in 2100 for all scenarios (median potential loss of 42 to 88%). Only a few areas in the north and some mountain areas of Europe would be able to conserve a substantial part of their present diversity.
Policy relevance
The considerable future losses of bumblebee species and their diversity across large areas in Europe give rise to serious concerns. Even the most abundant and widespread species are expected to contract (see Figures 1-2). Since bumblebees are presently one of the most ef-fective and abundant wild and managed pollinators in temperate areas, and so their decline would lead to a reduction in the pollination of many wild plants and agricultural crops with potentially severe socio-economic consequences. This is further exacerbated by the fact that these potential reductions of pollination services are unlikely to be compensated for by other (managed) pollinators such as the honeybee (see Chapter 3).
*see Spangenberg et al. (2012) Scenarios for investigating risks to biodiversity. Global Ecology and Biogeography 21
28
The projected situation is so severe that it seems difficult to propose mitigation policies for the long term. If we do not manage to drastically decrease the emissions of greenhouse gases, conservation actions must focus on: (i) enabling the long-term survival in areas with increasingly worsening climatic conditions (i.e. at the southern range margins); and, (ii)
Figure 1. (A) Bombus terrestris, one of the most common European bumblebees; (Rasmont et al.) (B) Starting with actual 1970-2010 distribution (black circles), we assessed the present suitable climatic area of each species (yellow area); here, for Bombus terrestris. (Rasmont et al. ) (C) Future climatically suitable area for Bombus terrestris (GRAS scenario), 2050; at this time, even such an abundant species could already suffer from considerable regression in the south of Europe. (Rasmont et al.) (D) idem, 2100, at this time, all of Europe south of the Paris parallel would present unsuitable climates for Bombus terrestris, meaning climatic conditions as warm and dry as presently at the edge of Saharan desert. Red, lost areas with suitable climatic conditions; yellow, still suitable; green, new suitable conditions (Rasmont et al.).
29
increasing species abilities to keep track with changing climates and to establish viable pop-ulations in new climatically suitable areas (i.e. at the northern range margins).
Microclimatic heterogeneity could help to increase the survival probabilities at the southern range margins when average conditions get worse, since such areas would still provide a certain amount of suitable conditions. Such heterogeneity is given in mountains and deep valleys, which could conserve a highly diversified fauna, but it should also be targeted in agricultural areas by careful management, and thus would require concerted new actions through instruments such as the Common Agricultural Policy of the EU.
At the northern range margins, natural dispersal can be facilitated by increasing connectivity and quality of semi-natural areas. Agri-environment schemes appear as an effective measure in this context and their implementation in a climate change context should be fostered through policy support.
Reference
Rasmont P., Franzen M., Lecocq T., Harpke A., Roberts S.P.M., Biesmeijer K., Castro L., Cederberg B., Dvorák L., Fitzpatrick Ú., Gonseth Y., Haubruge E., Mahé G., Manino A., Mi-chez D., Neumayer J., Ødegaard F., Paukkunen J., Pawlikowski T., Potts S.G., Reemer M., Straka J., Settele J., Schweiger O. (2015) Climatic Risk and Distribution Atlas of European Bumblebees. Pensoft Publishers, Sofia.
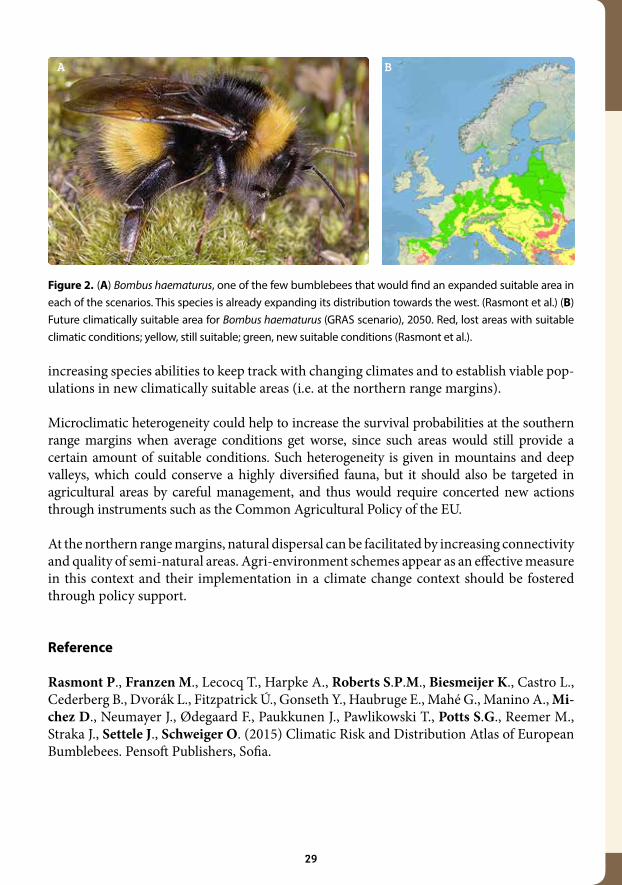
Figure 2. (A) Bombus haematurus, one of the few bumblebees that would find an expanded suitable area in each of the scenarios. This species is already expanding its distribution towards the west. (Rasmont et al.) (B) Future climatically suitable area for Bombus haematurus (GRAS scenario), 2050. Red, lost areas with suitable climatic conditions; yellow, still suitable; green, new suitable conditions (Rasmont et al.).

30
2.4 Expansion of mass-flowering crops leads to transient pollinator dilution and reduced wild plant pollination Andrea Holzschuh and Ingolf Steffan-Dewenter
Summary of the science
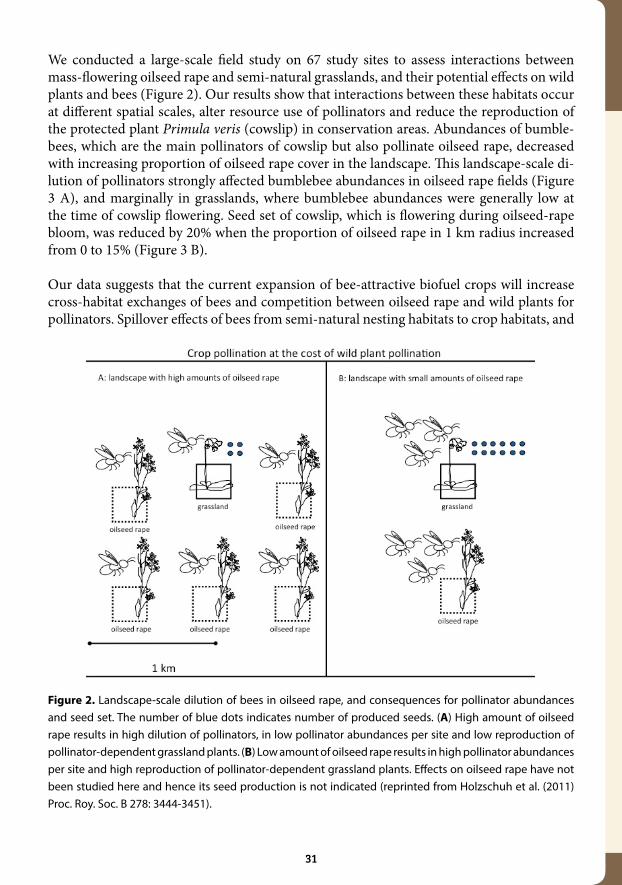
Negative consequences of land-use intensification and habitat loss for biodiversity and as-sociated ecosystem services have often been reported, but the exact mechanisms are still poorly understood. Although biodiversity loss is mostly assumed to be a direct result of decreasing habitat area and of impeded organism exchanges between habitat fragments, in-direct effects mediated by changed species interactions might be just as important. Indirect effects of land-use intensification via species interactions can be expected to be ubiquitous where managed and natural habitats adjoin (Figure 1), or where species using multiple habitats connect managed and natural habitats on a larger scale.
Figure 1. Protected semi-natural habitat in a landscape with mass-flowering oilseed rape fields (Photo: Andrea Holzschuh).
31
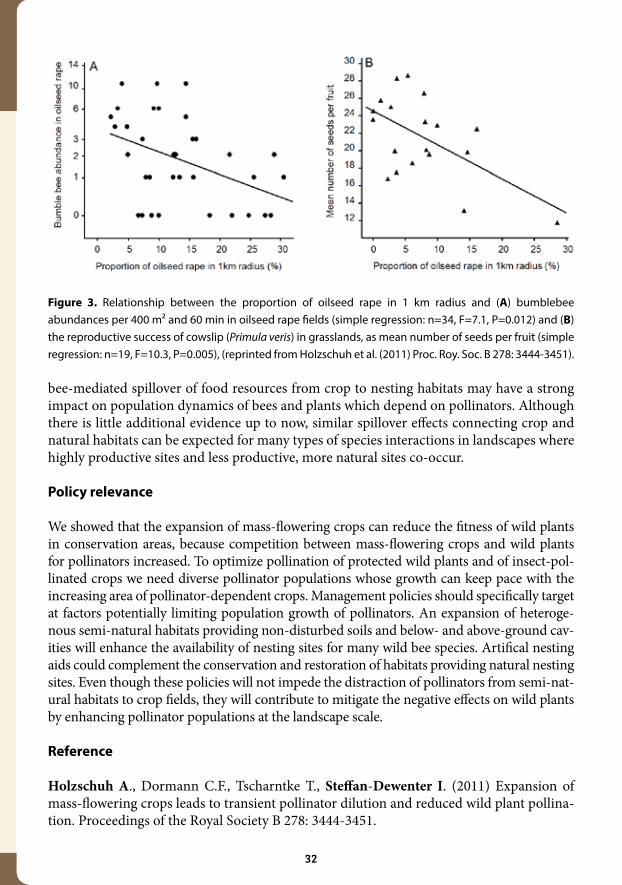
We conducted a large-scale field study on 67 study sites to assess interactions between mass-flowering oilseed rape and semi-natural grasslands, and their potential effects on wild plants and bees (Figure 2). Our results show that interactions between these habitats occur at different spatial scales, alter resource use of pollinators and reduce the reproduction of the protected plant Primula veris (cowslip) in conservation areas. Abundances of bumble-bees, which are the main pollinators of cowslip but also pollinate oilseed rape, decreased with increasing proportion of oilseed rape cover in the landscape. This landscape-scale di-lution of pollinators strongly affected bumblebee abundances in oilseed rape fields (Figure 3 A), and marginally in grasslands, where bumblebee abundances were generally low at the time of cowslip flowering. Seed set of cowslip, which is flowering during oilseed-rape bloom, was reduced by 20% when the proportion of oilseed rape in 1 km radius increased from 0 to 15% (Figure 3 B).
Our data suggests that the current expansion of bee-attractive biofuel crops will increase cross-habitat exchanges of bees and competition between oilseed rape and wild plants for pollinators. Spillover effects of bees from semi-natural nesting habitats to crop habitats, and
Figure 2. Landscape-scale dilution of bees in oilseed rape, and consequences for pollinator abundances and seed set. The number of blue dots indicates number of produced seeds. (A) High amount of oilseed rape results in high dilution of pollinators, in low pollinator abundances per site and low reproduction of pollinator-dependent grassland plants. (B) Low amount of oilseed rape results in high pollinator abundances per site and high reproduction of pollinator-dependent grassland plants. Effects on oilseed rape have not been studied here and hence its seed production is not indicated (reprinted from Holzschuh et al. (2011) Proc. Roy. Soc. B 278: 3444-3451).
32
bee-mediated spillover of food resources from crop to nesting habitats may have a strong impact on population dynamics of bees and plants which depend on pollinators. Although there is little additional evidence up to now, similar spillover effects connecting crop and natural habitats can be expected for many types of species interactions in landscapes where highly productive sites and less productive, more natural sites co-occur.
Policy relevance
We showed that the expansion of mass-flowering crops can reduce the fitness of wild plants in conservation areas, because competition between mass-flowering crops and wild plants for pollinators increased. To optimize pollination of protected wild plants and of insect-pol-linated crops we need diverse pollinator populations whose growth can keep pace with the increasing area of pollinator-dependent crops. Management policies should specifically target at factors potentially limiting population growth of pollinators. An expansion of heteroge-nous semi-natural habitats providing non-disturbed soils and below- and above-ground cav-ities will enhance the availability of nesting sites for many wild bee species. Artifical nesting aids could complement the conservation and restoration of habitats providing natural nesting sites. Even though these policies will not impede the distraction of pollinators from semi-nat-ural habitats to crop fields, they will contribute to mitigate the negative effects on wild plants by enhancing pollinator populations at the landscape scale.
Reference
Holzschuh A., Dormann C.F., Tscharntke T., Steffan-Dewenter I. (2011) Expansion of mass-flowering crops leads to transient pollinator dilution and reduced wild plant pollina-tion. Proceedings of the Royal Society B 278: 3444-3451.
Figure 3. Relationship between the proportion of oilseed rape in 1 km radius and (A) bumblebee abundances per 400 m² and 60 min in oilseed rape fields (simple regression: n=34, F=7.1, P=0.012) and (B) the reproductive success of cowslip (Primula veris) in grasslands, as mean number of seeds per fruit (simple regression: n=19, F=10.3, P=0.005), (reprinted from Holzschuh et al. (2011) Proc. Roy. Soc. B 278: 3444-3451).
33
2.5 Impact of chronic neonicotinoid exposure on honeybee colony performance and queen supersedure Peter Neumann
Summary of the science
Honeybees provide economically and ecologically vital pollination services to some crops and wild plants. During the last decade elevated losses of managed colonies have been doc-umented in Europe and North America. Despite growing consensus on the involvement of multiple causal factors, the underlying interactions impacting on honeybee health and col-ony failure are not fully resolved. Parasites and pathogens are among the main candidates, but sub-lethal exposure to widespread agricultural pesticides may also affect honeybees.
To investigate effects of sub-lethal dietary neonicotinoid exposure on honeybee colony per-formance, a fully crossed experimental design was implemented using 24 colonies, includ-ing sister-queens from two different strains, and experimental in-hive pollen feeding with or without environmentally relevant concentrations of the neonicotinoids thiamethoxam and clothianidin.
Honeybee colonies chronically exposed to both neonicotinoids over two brood cycles ex-hibited decreased performance in the short-term resulting in declining numbers of adult bees (-228%) and brood (-213%), as well as a reduction in honey production (-229%) and pollen collections (-219%), but colonies recovered in the medium-term and overwintered successfully (Figure 1, Table 1). However, significantly decelerated growth of neonicoti-noid-exposed colonies during the following spring was associated with queen failure, re-vealing previously undocumented long-term impacts of neonicotinoids: queen supersedure was observed for 60% of the neonicotinoid-exposed colonies within a one year period, but not for control colonies. Linked to this, neonicotinoid exposure was significantly associated with a reduced propensity to swarm during the next spring. Both short-term and long-term effects of neonicotinoids on colony performance were significantly influenced by the hon-eybees’ genetic background.
Sub-lethal neonicotinoid exposure did not provoke increased winter losses of honeybee colonies. Yet, significant detrimental short and long-term impacts on colony performance and queen fate suggest that neonicotinoids may contribute to colony weakening in a com-plex manner. Further, we highlight the importance of the genetic basis of neonicotinoid susceptibility in honeybees which can vary substantially. Even though honeybee colonies constitute buffered systems, the data show clear effects of the neonicotinoids.
Policy relevance
Taken together with the clear evidence in other species, and with other substances, it is becoming increasingly clear that systemic neonicotinoids may potentially compromise pol-
34
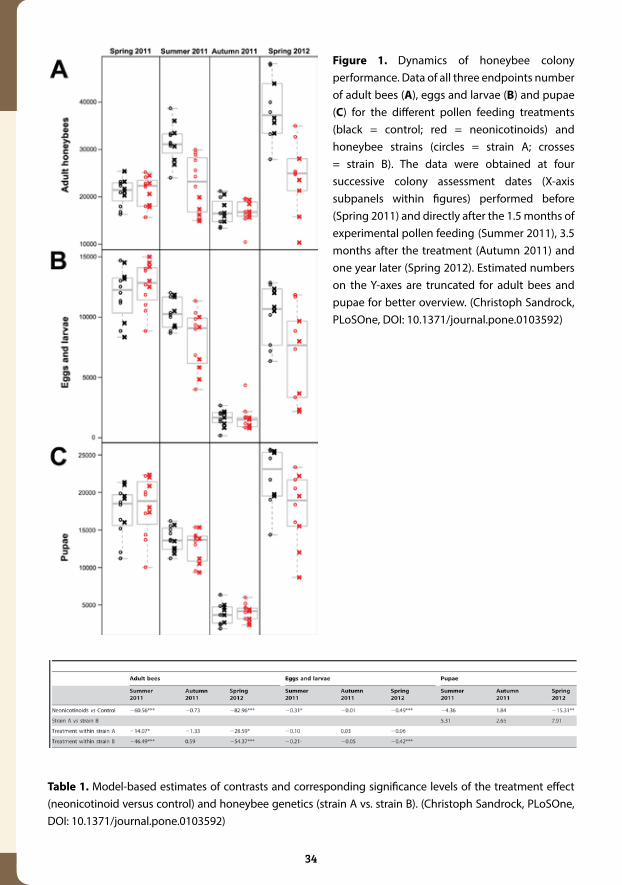
Figure 1. Dynamics of honeybee colony performance. Data of all three endpoints number of adult bees (A), eggs and larvae (B) and pupae (C) for the different pollen feeding treatments (black = control; red = neonicotinoids) and honeybee strains (circles = strain A; crosses = strain B). The data were obtained at four successive colony assessment dates (X-axis subpanels within figures) performed before (Spring 2011) and directly after the 1.5 months of experimental pollen feeding (Summer 2011), 3.5 months after the treatment (Autumn 2011) and one year later (Spring 2012). Estimated numbers on the Y-axes are truncated for adult bees and pupae for better overview. (Christoph Sandrock, PLoSOne, DOI: 10.1371/journal.pone.0103592)
Table 1. Model-based estimates of contrasts and corresponding significance levels of the treatment effect (neonicotinoid versus control) and honeybee genetics (strain A vs. strain B). (Christoph Sandrock, PLoSOne, DOI: 10.1371/journal.pone.0103592)
35
lination services in Europe and elsewhere via weakening of bee populations. While the EU ban of the neonicotinoids was a first significant step allowing more time for relevant evi-dence to be collected and assessed, further policy actions must be taken to safeguard crop pollination and species conservation in Europe, such as instruments to reduce the usage of agrochemicals known to harm polinators.
Reference
Sandrock C., Tanadini M., Tanadini LG., Fauser-Misslin A., Potts S.G., Neumann P. (2014) Impact of chronic neonicotinoid exposure on honeybee colony performance and queen su-persedure. PLoS ONE 9(8): e103592.
Figure 2. Honeybee queen and attending workers (Photo: Peter Neumann).

36
Chapter 3: Wider Impacts of Changes in PollinatorsRiccardo Bommarco
In STEP we set out to explore how observed declines in wild and managed pollinators impact plant-pollinator interactions, and the pollination services provided by the honey-bees, wild bees, hoverflies and other insects that visit the flowers of cultivated and wild plants. We further assessed how these changes affect the wider society, economies and human health.
We have addressed impacts on crop pollination by gathering and synthesising a com-prehensive set of primary data from crop pollination researchers around the world (case study 3.1), supplemented with strategically placed empirical case studies (e.g. 3.5). We consistently found that high quality natural or semi-natural habitat provides an essen-tial basis for abundant and species rich bee communities in agricultural landscapes worldwide. Pollinator visitation decreased with distance from natural areas, resulting in decreased crop fruit set and stability of pollination services. Conserving, restoring and re-creating natural habitat are, together with decreasing agricultural inputs, pri-mary steps to secure sufficient provisioning of pollination services to agriculture (case study 3.4). Interestingly, we also discovered that wild insects, compared to honeybees, pollinate crops more effectively than previously thought. Pollination by managed hon-eybees supplements, rather than substitutes pollination by wild insects emphasising the importance of monitoring and protecting wild as well as managed crop pollinators (case study 3.1).
Pollinator declines may impact society, economy and human well-fare, directly through degraded crop pollination in agriculture, and in the long-term through declining bio-diversity and ecosystem functioning. Two aspects that we focused on were the impacts on crop yield and quality. We found that increased cultivation of pollination dependent crops drove up demand for pollination at a rate greater than could be supplied by hon-eybee stocks across Europe, thereby creating a pollination deficit (case study 3.2). Future increased cultivation of biofuels is expected to increase this deficit. In another case study (3.3) we show that the contribution of nutrients from animal-pollinated crops to the hu-man diet is paramount. These crops provide almost all vitamin C, vitamin A and other micronutrients such as carotenoids, calcium, fluoride, folic acid and several antioxidants in human diets. Pollinators thus contribute substantially to the quality of our diet, and pollination declines may increase the risk of poor quality diets for the global human population. Overall, and despite some knowledge gaps, it is clear that severe pollinator declines will have drastic and widespread impacts on our daily lives, global economies and food security.
37
3.1 Wild pollinators enhance fruit set of crops regardless of
honeybee abundance
Riccardo Bommarco
Summary of the science
There is an increasing concern that the observed declines of both wild and managed pol-linators might impact the pollination, and thereby production, of world agricultural crops negatively. Whether the declines among wild pollinators, or of managed pollinators (mainly honeybees, Apis mellifera), have equally severe consequences for crop yields has, however, remained unclear. It has generally been assumed that most of the pollen in crops worldwide is transferred by honeybees. Wild pollinators have been thought to play a supporting and complementary role to the honeybee in cross-fertilizing crops. Earlier work indicated that wild pollinators might be important as service providers (Garibaldi et al. 2011), so continu-ing this we quantified the relative contribution to cross-pollination in crops by managed honeybees and wild insects.
We first tested whether wild insect and honeybee visitation enhanced pollen deposition on stigmas of crop flowers. Second, we assessed to what extent visitation to the crop flowers by wild insects or honeybees improved fruit set. Third, we explore if visitation by honeybees might affect the benefit derived from wild insects. We wanted to understand whether fruit set is promoted by a higher number of species or individuals of wild pollinator that visit the flowers, only in situations when few honeybees visit the flowers.
To reach general answers to these questions, we contacted scientists that perform research on crop pollination from all over the world. We asked them to send us their original data on flower visitation and fruit set in crops. The response was extremely positive, and we were able to collect primary data from 600 agricultural fields on all continents, except Antarctica, and for 41 crops.
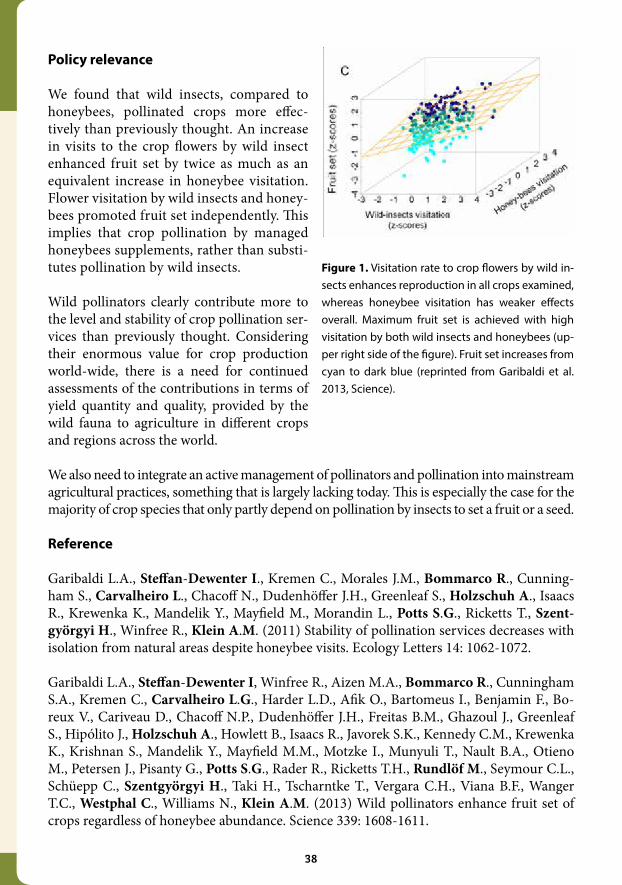
We found a universally positive association of fruit set with increased flower visitation by wild insects in cropping systems worldwide (Figure 1). In contrast, fruit set increased with flower visitation by honeybees in only 14% of the cropping systems included. Overall, wild insects pollinated crops more efficiently than we had previously thought and had hypothe-sised. In fact, an increase in wild insect visitation enhanced fruit set by twice as much as an equivalent increase in honeybee visitation. Visitation by wild insects and honeybees pro-moted fruit set independently, such that pollination by managed honeybees supplemented, rather than substituted pollination by wild insects. Our results suggest that new practices for integrated management of both honeybees and diverse wild insect assemblages will enhance global crop yields.
38
Policy relevance
We found that wild insects, compared to honeybees, pollinated crops more effec-tively than previously thought. An increase in visits to the crop flowers by wild insect enhanced fruit set by twice as much as an equivalent increase in honeybee visitation. Flower visitation by wild insects and honey-bees promoted fruit set independently. This implies that crop pollination by managed honeybees supplements, rather than substi-tutes pollination by wild insects.
Wild pollinators clearly contribute more to the level and stability of crop pollination ser-vices than previously thought. Considering their enormous value for crop production world-wide, there is a need for continued assessments of the contributions in terms of yield quantity and quality, provided by the wild fauna to agriculture in different crops and regions across the world.
We also need to integrate an active management of pollinators and pollination into mainstream agricultural practices, something that is largely lacking today. This is especially the case for the majority of crop species that only partly depend on pollination by insects to set a fruit or a seed.
Reference
Garibaldi L.A., Steffan-Dewenter I., Kremen C., Morales J.M., Bommarco R., Cunning-ham S., Carvalheiro L., Chacoff N., Dudenhöffer J.H., Greenleaf S., Holzschuh A., Isaacs R., Krewenka K., Mandelik Y., Mayfield M., Morandin L., Potts S.G., Ricketts T., Szent-györgyi H., Winfree R., Klein A.M. (2011) Stability of pollination services decreases with isolation from natural areas despite honeybee visits. Ecology Letters 14: 1062-1072.
Garibaldi L.A., Steffan-Dewenter I, Winfree R., Aizen M.A., Bommarco R., Cunningham S.A., Kremen C., Carvalheiro L.G., Harder L.D., Afik O., Bartomeus I., Benjamin F., Bo-reux V., Cariveau D., Chacoff N.P., Dudenhöffer J.H., Freitas B.M., Ghazoul J., Greenleaf S., Hipólito J., Holzschuh A., Howlett B., Isaacs R., Javorek S.K., Kennedy C.M., Krewenka K., Krishnan S., Mandelik Y., Mayfield M.M., Motzke I., Munyuli T., Nault B.A., Otieno M., Petersen J., Pisanty G., Potts S.G., Rader R., Ricketts T.H., Rundlöf M., Seymour C.L., Schüepp C., Szentgyörgyi H., Taki H., Tscharntke T., Vergara C.H., Viana B.F., Wanger T.C., Westphal C., Williams N., Klein A.M. (2013) Wild pollinators enhance fruit set of crops regardless of honeybee abundance. Science 339: 1608-1611.
Figure 1. Visitation rate to crop flowers by wild in-sects enhances reproduction in all crops examined, whereas honeybee visitation has weaker effects overall. Maximum fruit set is achieved with high visitation by both wild insects and honeybees (up-per right side of the figure). Fruit set increases from cyan to dark blue (reprinted from Garibaldi et al. 2013, Science).
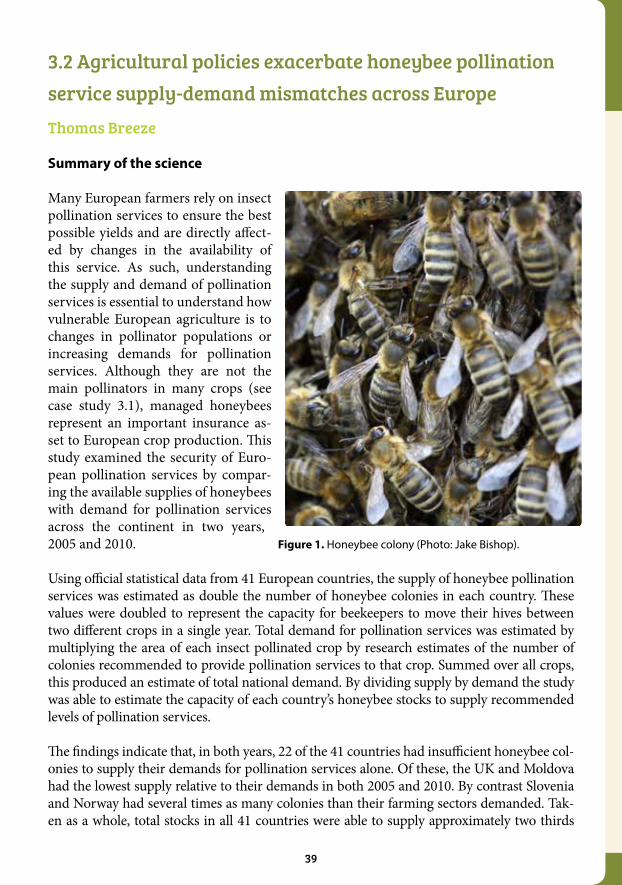
39
3.2 Agricultural policies exacerbate honeybee pollination service supply-demand mismatches across EuropeThomas Breeze
Summary of the science
Many European farmers rely on insect pollination services to ensure the best possible yields and are directly affect-ed by changes in the availability of this service. As such, understanding the supply and demand of pollination services is essential to understand how vulnerable European agriculture is to changes in pollinator populations or increasing demands for pollination services. Although they are not the main pollinators in many crops (see case study 3.1), managed honeybees represent an important insurance as-set to European crop production. This study examined the security of Euro-pean pollination services by compar-ing the available supplies of honeybees with demand for pollination services across the continent in two years, 2005 and 2010.
Using official statistical data from 41 European countries, the supply of honeybee pollination services was estimated as double the number of honeybee colonies in each country. These values were doubled to represent the capacity for beekeepers to move their hives between two different crops in a single year. Total demand for pollination services was estimated by multiplying the area of each insect pollinated crop by research estimates of the number of colonies recommended to provide pollination services to that crop. Summed over all crops, this produced an estimate of total national demand. By dividing supply by demand the study was able to estimate the capacity of each country’s honeybee stocks to supply recommended levels of pollination services.
The findings indicate that, in both years, 22 of the 41 countries had insufficient honeybee col-onies to supply their demands for pollination services alone. Of these, the UK and Moldova had the lowest supply relative to their demands in both 2005 and 2010. By contrast Slovenia and Norway had several times as many colonies than their farming sectors demanded. Tak-en as a whole, total stocks in all 41 countries were able to supply approximately two thirds
Figure 1. Honeybee colony (Photo: Jake Bishop).
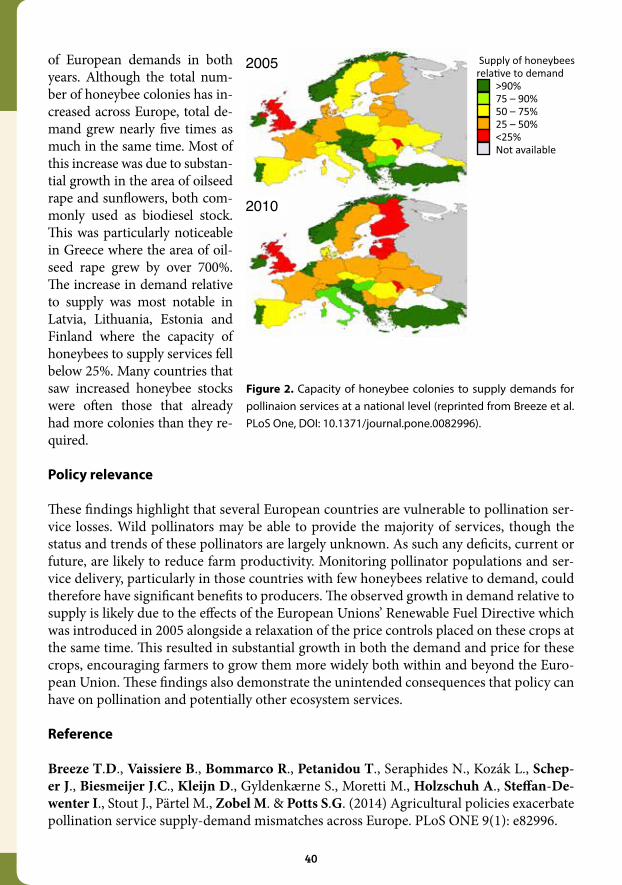
40
of European demands in both years. Although the total num-ber of honeybee colonies has in-creased across Europe, total de-mand grew nearly five times as much in the same time. Most of this increase was due to substan-tial growth in the area of oilseed rape and sunflowers, both com-monly used as biodiesel stock. This was particularly noticeable in Greece where the area of oil-seed rape grew by over 700%. The increase in demand relative to supply was most notable in Latvia, Lithuania, Estonia and Finland where the capacity of honeybees to supply services fell below 25%. Many countries that saw increased honeybee stocks were often those that already had more colonies than they re-quired.
Policy relevance
These findings highlight that several European countries are vulnerable to pollination ser-vice losses. Wild pollinators may be able to provide the majority of services, though the status and trends of these pollinators are largely unknown. As such any deficits, current or future, are likely to reduce farm productivity. Monitoring pollinator populations and ser-vice delivery, particularly in those countries with few honeybees relative to demand, could therefore have significant benefits to producers. The observed growth in demand relative to supply is likely due to the effects of the European Unions’ Renewable Fuel Directive which was introduced in 2005 alongside a relaxation of the price controls placed on these crops at the same time. This resulted in substantial growth in both the demand and price for these crops, encouraging farmers to grow them more widely both within and beyond the Euro-pean Union. These findings also demonstrate the unintended consequences that policy can have on pollination and potentially other ecosystem services.
Reference
Breeze T.D., Vaissiere B., Bommarco R., Petanidou T., Seraphides N., Kozák L., Schep-er J., Biesmeijer J.C., Kleijn D., Gyldenkærne S., Moretti M., Holzschuh A., Steffan-De-wenter I., Stout J., Pärtel M., Zobel M. & Potts S.G. (2014) Agricultural policies exacerbate pollination service supply-demand mismatches across Europe. PLoS ONE 9(1): e82996.
Figure 2. Capacity of honeybee colonies to supply demands for pollinaion services at a national level (reprinted from Breeze et al. PLoS One, DOI: 10.1371/journal.pone.0082996).

41
3.3 Contribution of pollinator-mediated crops to nutrients in the human food supply Alexandra-Maria Klein
Summary of the science
Several studies have been conducted to evaluate monetary values of pollination services on crop pollination. However, it is difficult to assign monetary values to pollination services because they are frequently not traded in the marketplace and values differ widely depend-ing on methods, value systems and scales of analysis. Furthermore, the value of money changes constantly with shifting markets, particularly in the face of the current global fi-nancial crisis. In contrast, biophysical measures such as the nutritional composition of an-imal-pollinated plants and the nutrient requirements to prevent deficiency in humans are relatively stable and may be measured objectively. We used this biophysical approach to evaluate the global nutritional value of pollinator-dependent crops.
Staple crop production (e.g. cassava, corn, potato, rice, wheat and yam) has doubled in the past 50 years due to new crop strains, increased use of agrochemicals, irrigation and new agri-cultural techniques. These grains and starchy vegetables are mostly wind-pollinated, self-pol-linated, or vegetatively propagated crops. While they provide the majority of calories in the human diet, they are poor sources of most micronutrients. What little micronutrients are present in these sources are mostly lost in processing or preservation. Dependence on these
Figure 1. Proportion of fat-soluble vitamins (K= vitamin K, E= vitamin E, γToco= γ – tocopherol, αCaro = α-carotene, A= vitamin A, βCaro = β-carotene, δToco= δ – tocopherol, βCrypto = β - cryptoxanthin, βToco= β – tocopherol) in global crop production (%) produced without pollinators (grey), produced with pollinators but attributed to autonomous self- or wind pollination (light-yellow), produced with pollinators and directly attributed to animal pollination (yellow), (Modified from Eilers et al., PLoS One, DOI: 10.1371/journal.pone.0021363).
42
staple crops, due to food system failures and declines in diet diversity, are responsible for micronutrient deficiency (‘Hidden Hunger’) in over two billion people worldwide, especially in underprivileged areas. This underscores the importance of diet diversity and the need for animal-pollinated plants to prevent micronutrient deficiency. However, the contribution of these plants to worldwide micronutrient availability has not been quantified.
We evaluated the nutritional composition of animal-pollinated world crops. We calculated pollinator dependent and independent proportions of different nutrients of world crops, em-ploying FAO data for crop production, USDA data for nutritional composition and pollinator dependency data. Crop plants that depend fully or partially on animal pollinators contain more than 90% of vitamin C, the whole quantity of Lycopene and almost the full quantity of the antioxidants β-cryptoxanthin and β-tocopherol, the majority of the lipid, vitamin A and related carotenoids, calcium and fluoride, and a large portion of folic acid (see Figure 1 for the proportion of fat-soluble vitamins attributed to animal pollination in yellow).
This biophysical evaluation of the importance of pollination services for the production of vitamins and minerals highlights that ongoing pollinator decline may exacerbate current difficulties of providing a nutritionally adequate diet for the global human population.
Policy relevance
Animal-pollinated crops contain the majority of the available dietary lipid, vitamin A, C and E, and a large portion of the minerals calcium, fluoride and iron worldwide. Micronutrient deficiencies resulting from potential declines in animal-pollinated crops can be identified for different regions and are likely to be worse in developing nations (Chaplin-Kramer et al. 2014). Policy makers can use the method demonstrated here to identify the matching regions of severe pollinator decline with greatest risk of losing essential vitamins and minerals.
Supplementation and fortification of vitamins and minerals are not adequate substitutes for the loss or reduction of the nutrients from food sources attributed to pollinator loss. Mandatory fortification has been successful only in some countries, such as the U.S. and China, but it depends on an organised and regulated food industry. Synthetically fabricated healthcare products are only available to 25% of the world population, while the other 75% relies on ethnobotanical remedies and these people depend on the vitamins and minerals of fruits and seeds that largely depend on pollination services.
Reference
Eilers E.J., Kremen C., Greenleaf S., Garber A.K., Klein A-M. (2011) Contribution of polli-nator-mediated crops to nutrients in the human food supply. PLoS One 6(6): e21363.
Chaplin-Kramer R., Dombeck E., Gerber J., Knuth K.A., Mueller N.D., Mueller M., Ziv G., Klein A-M. 2014 Global malnutrition overlaps with pollinator-dependent micronu-trient production. Proceedings B Royal Society of Publishing 281: 1799. http://dx.doi.org/10.1098/rspb.2014.1799
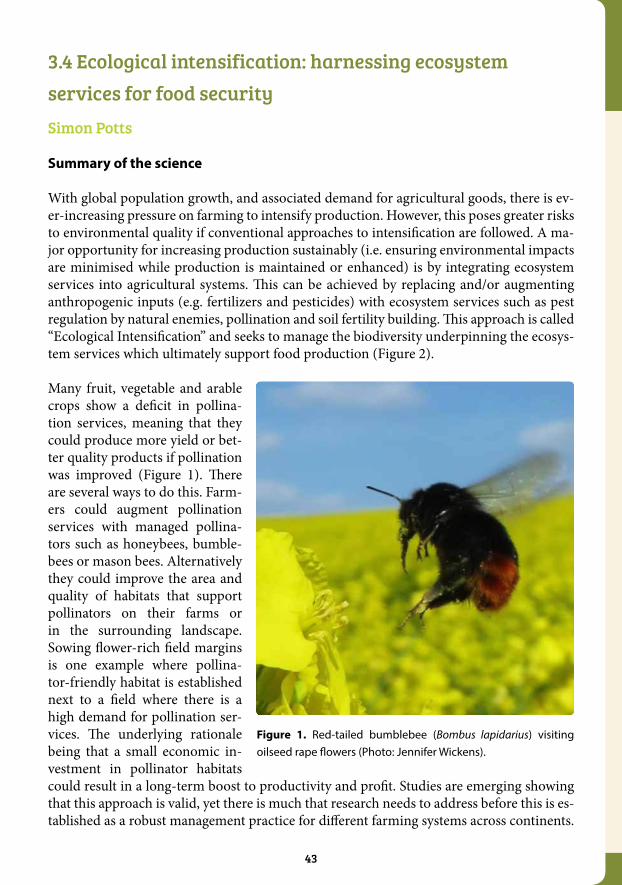
43
3.4 Ecological intensification: harnessing ecosystem services for food securitySimon Potts
Summary of the science
With global population growth, and associated demand for agricultural goods, there is ev-er-increasing pressure on farming to intensify production. However, this poses greater risks to environmental quality if conventional approaches to intensification are followed. A ma-jor opportunity for increasing production sustainably (i.e. ensuring environmental impacts are minimised while production is maintained or enhanced) is by integrating ecosystem services into agricultural systems. This can be achieved by replacing and/or augmenting anthropogenic inputs (e.g. fertilizers and pesticides) with ecosystem services such as pest regulation by natural enemies, pollination and soil fertility building. This approach is called “Ecological Intensification” and seeks to manage the biodiversity underpinning the ecosys-tem services which ultimately support food production (Figure 2).
Many fruit, vegetable and arable crops show a deficit in pollina-tion services, meaning that they could produce more yield or bet-ter quality products if pollination was improved (Figure 1). There are several ways to do this. Farm-ers could augment pollination services with managed pollina-tors such as honeybees, bumble-bees or mason bees. Alternatively they could improve the area and quality of habitats that support pollinators on their farms or in the surrounding landscape. Sowing flower-rich field margins is one example where pollina-tor-friendly habitat is established next to a field where there is a high demand for pollination ser-vices. The underlying rationale being that a small economic in-vestment in pollinator habitats could result in a long-term boost to productivity and profit. Studies are emerging showing that this approach is valid, yet there is much that research needs to address before this is es-tablished as a robust management practice for different farming systems across continents.
Figure 1. Red-tailed bumblebee (Bombus lapidarius) visiting oilseed rape flowers (Photo: Jennifer Wickens).

44
A smart approach to ecological intensification is to identify win:win practices which can ben-efit multiple ecosystem services simultaneously. For instance, if flower margins can support the natural enemies of crop pests (e.g. carabid beetles, spiders and parasitoid wasps), as well as pollinators, then these beneficial insects could also spillover into the crop and reduce yield losses. Field margins can also play a role in soil protection, help buffer water courses from agricultural pollutants and help support other wildlife valued by the society, such as birds.
As energy prices and population are projected to go up in the next few decades, farming needs to shift increasingly from being highly dependent upon synthetic inputs to utilising biodiversity driven ecosystem services. Ecological intensification shows huge promise in helping this transition and will be an indispensable tool to reconcile the demands of food security, biodiversity conservation and sustainable societies (Figure 3).
Figure 2. Conceptualisation of the contribution of regulating and supporting services to provisioning services (production). (a) Production can only attain a level set by the lowest underpinning regulating or supporting service, in this case pest regulation, despite other services being super-optimal. (b) Pest regulation is enhanced and so production increases, and the yield gap is reduced, to the level set by the next limiting service, in this case soil nutrients. (c) Ecological replacement is where a proportion of one of more underpinning services (e.g. pest regulation) is supplied by biodiversity derived services (e.g. natural enemies, green bar) rather anthropogenic derived services (e.g. insecticides, red bar); production remains the same overall but more of the regulating and/or supporting service(s) are provided by biodiversity. (d) Ecological enhancement is where the level of one of more underpinning services (e.g. pest regulation) is boosted by biodiversity derived services (green bar) rather than anthropogenic derived services (red bar); with the result in production increasing overall (reprinted from Bommarco et al. 2013, Trends in Ecology and Evolution).
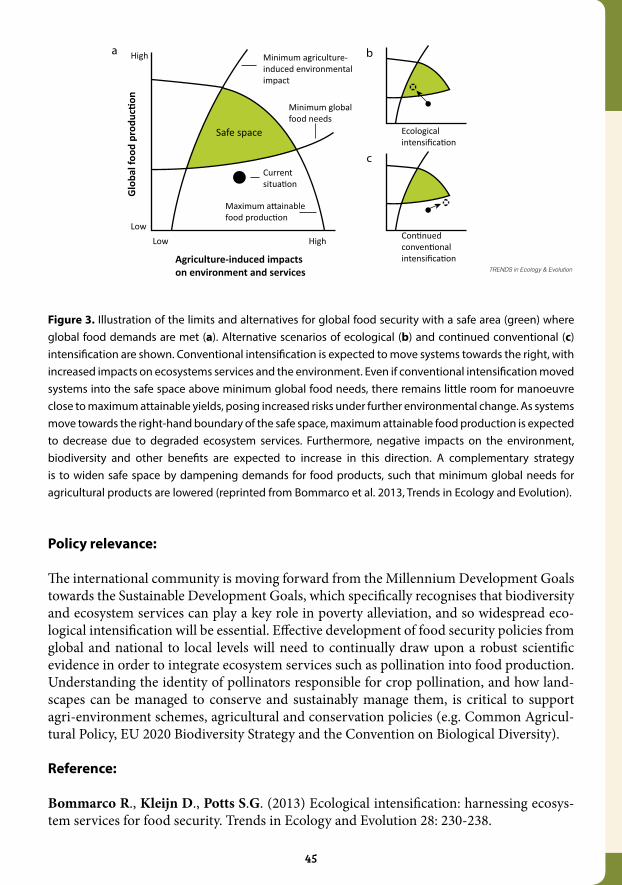
45
Policy relevance:
The international community is moving forward from the Millennium Development Goals towards the Sustainable Development Goals, which specifically recognises that biodiversity and ecosystem services can play a key role in poverty alleviation, and so widespread eco-logical intensification will be essential. Effective development of food security policies from global and national to local levels will need to continually draw upon a robust scientific evidence in order to integrate ecosystem services such as pollination into food production. Understanding the identity of pollinators responsible for crop pollination, and how land-scapes can be managed to conserve and sustainably manage them, is critical to support agri-environment schemes, agricultural and conservation policies (e.g. Common Agricul-tural Policy, EU 2020 Biodiversity Strategy and the Convention on Biological Diversity).
Reference: Bommarco R., Kleijn D., Potts S.G. (2013) Ecological intensification: harnessing ecosys-tem services for food security. Trends in Ecology and Evolution 28: 230-238.
Figure 3. Illustration of the limits and alternatives for global food security with a safe area (green) where global food demands are met (a). Alternative scenarios of ecological (b) and continued conventional (c) intensification are shown. Conventional intensification is expected to move systems towards the right, with increased impacts on ecosystems services and the environment. Even if conventional intensification moved systems into the safe space above minimum global food needs, there remains little room for manoeuvre close to maximum attainable yields, posing increased risks under further environmental change. As systems move towards the right-hand boundary of the safe space, maximum attainable food production is expected to decrease due to degraded ecosystem services. Furthermore, negative impacts on the environment, biodiversity and other benefits are expected to increase in this direction. A complementary strategy is to widen safe space by dampening demands for food products, such that minimum global needs for agricultural products are lowered (reprinted from Bommarco et al. 2013, Trends in Ecology and Evolution).
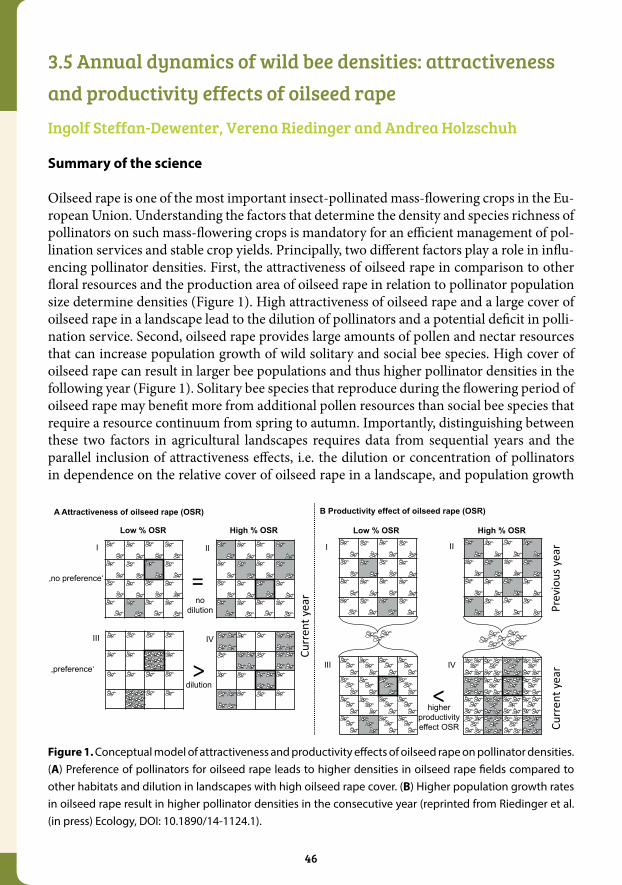
46
3.5 Annual dynamics of wild bee densities: attractiveness and productivity effects of oilseed rape Ingolf Steffan-Dewenter, Verena Riedinger and Andrea Holzschuh
Summary of the science
Oilseed rape is one of the most important insect-pollinated mass-flowering crops in the Eu-ropean Union. Understanding the factors that determine the density and species richness of pollinators on such mass-flowering crops is mandatory for an efficient management of pol-lination services and stable crop yields. Principally, two different factors play a role in influ-encing pollinator densities. First, the attractiveness of oilseed rape in comparison to other floral resources and the production area of oilseed rape in relation to pollinator population size determine densities (Figure 1). High attractiveness of oilseed rape and a large cover of oilseed rape in a landscape lead to the dilution of pollinators and a potential deficit in polli-nation service. Second, oilseed rape provides large amounts of pollen and nectar resources that can increase population growth of wild solitary and social bee species. High cover of oilseed rape can result in larger bee populations and thus higher pollinator densities in the following year (Figure 1). Solitary bee species that reproduce during the flowering period of oilseed rape may benefit more from additional pollen resources than social bee species that require a resource continuum from spring to autumn. Importantly, distinguishing between these two factors in agricultural landscapes requires data from sequential years and the parallel inclusion of attractiveness effects, i.e. the dilution or concentration of pollinators in dependence on the relative cover of oilseed rape in a landscape, and population growth
A Attractiveness of oilseed rape (OSR)
Low % OSR High % OSR
‚no preference‘
,preference‘
Curr
ent y
ear
=
> dilution
nodilution
Low % OSR High % OSR
Curr
ent y
ear
Prev
ious
yea
r
>
B Productivity effect of oilseed rape (OSR)
higherproductivityeffect OSR
I II
III IV
I II
III IV
Figure 1. Conceptual model of attractiveness and productivity effects of oilseed rape on pollinator densities.(A) Preference of pollinators for oilseed rape leads to higher densities in oilseed rape fields compared to other habitats and dilution in landscapes with high oilseed rape cover. (B) Higher population growth rates in oilseed rape result in higher pollinator densities in the consecutive year (reprinted from Riedinger et al. (in press) Ecology, DOI: 10.1890/14-1124.1).
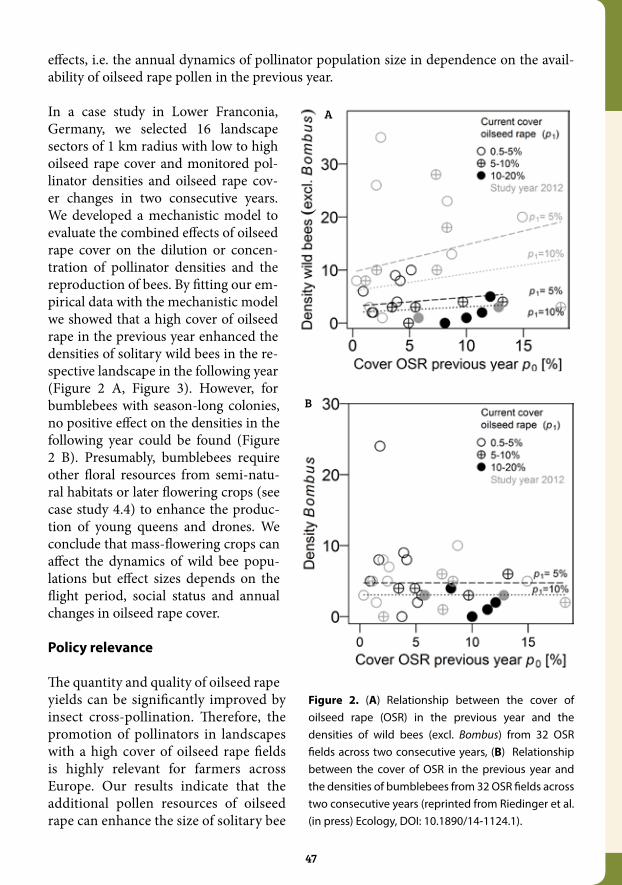
47
effects, i.e. the annual dynamics of pollinator population size in dependence on the avail-ability of oilseed rape pollen in the previous year.
In a case study in Lower Franconia, Germany, we selected 16 landscape sectors of 1 km radius with low to high oilseed rape cover and monitored pol-linator densities and oilseed rape cov-er changes in two consecutive years. We developed a mechanistic model to evaluate the combined effects of oilseed rape cover on the dilution or concen-tration of pollinator densities and the reproduction of bees. By fitting our em-pirical data with the mechanistic model we showed that a high cover of oilseed rape in the previous year enhanced the densities of solitary wild bees in the re-spective landscape in the following year (Figure 2 A, Figure 3). However, for bumblebees with season-long colonies, no positive effect on the densities in the following year could be found (Figure 2 B). Presumably, bumblebees require other floral resources from semi-natu-ral habitats or later flowering crops (see case study 4.4) to enhance the produc-tion of young queens and drones. We conclude that mass-flowering crops can affect the dynamics of wild bee popu-lations but effect sizes depends on the flight period, social status and annual changes in oilseed rape cover.
Policy relevance
The quantity and quality of oilseed rape yields can be significantly improved by insect cross-pollination. Therefore, the promotion of pollinators in landscapes with a high cover of oilseed rape fields is highly relevant for farmers across Europe. Our results indicate that the additional pollen resources of oilseed rape can enhance the size of solitary bee
Figure 2. (A) Relationship between the cover of oilseed rape (OSR) in the previous year and the densities of wild bees (excl. Bombus) from 32 OSR fields across two consecutive years, (B) Relationship between the cover of OSR in the previous year and the densities of bumblebees from 32 OSR fields across two consecutive years (reprinted from Riedinger et al. (in press) Ecology, DOI: 10.1890/14-1124.1).
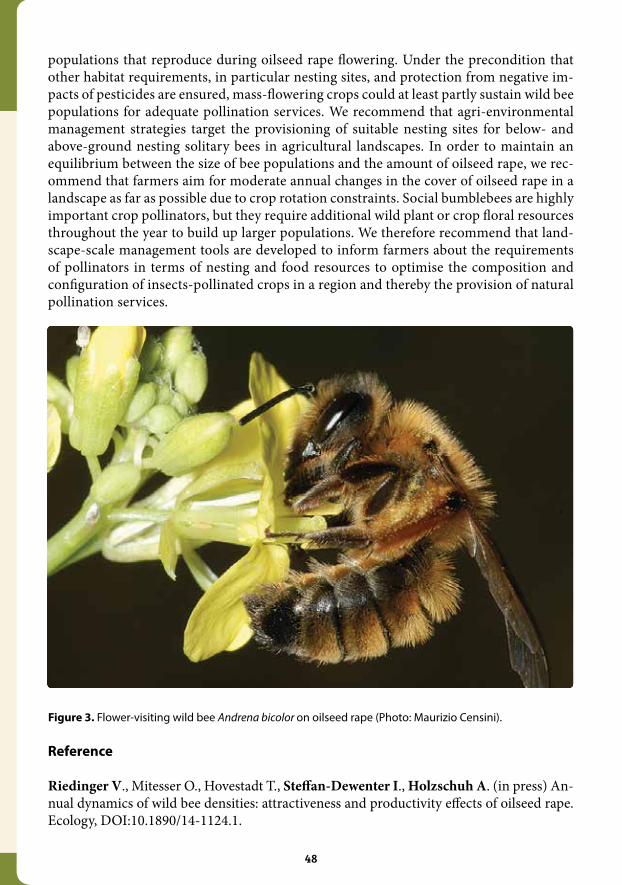
48
populations that reproduce during oilseed rape flowering. Under the precondition that other habitat requirements, in particular nesting sites, and protection from negative im-pacts of pesticides are ensured, mass-flowering crops could at least partly sustain wild bee populations for adequate pollination services. We recommend that agri-environmental management strategies target the provisioning of suitable nesting sites for below- and above-ground nesting solitary bees in agricultural landscapes. In order to maintain an equilibrium between the size of bee populations and the amount of oilseed rape, we rec-ommend that farmers aim for moderate annual changes in the cover of oilseed rape in a landscape as far as possible due to crop rotation constraints. Social bumblebees are highly important crop pollinators, but they require additional wild plant or crop floral resources throughout the year to build up larger populations. We therefore recommend that land-scape-scale management tools are developed to inform farmers about the requirements of pollinators in terms of nesting and food resources to optimise the composition and configuration of insects-pollinated crops in a region and thereby the provision of natural pollination services.
Reference
Riedinger V., Mitesser O., Hovestadt T., Steffan-Dewenter I., Holzschuh A. (in press) An-nual dynamics of wild bee densities: attractiveness and productivity effects of oilseed rape. Ecology, DOI:10.1890/14-1124.1.
Scheda del progetto STEP
I pronubi aiutano la produzione agricola
L’Italia ha una ricchezza di specie di api selvatiche tra le più alte d’Europa (nella foto: Andrena bicolor su fiore di colza). Fotografia Maurizio Censini
Gli insetti impollinatori sono essenziali per la produttività di un ampio ventaglio di colture europee di importanza economica perché incrementano il raccolto e migliorano la qualità del prodotto (Riquadro 1).
Pur ammettendo che l’ape domestica, che è allevata, è in grado di provvedere alle necessità di impollinazione di alcune colture, sono però i pronubi selvatici come i bombi, le api solitarie e le mosche sirfidi a risultare, in tutta Europa, gli impollinatori più efficaci. Nel Regno Unito, ad esempio, le api mellifere sono sufficienti ad impollinare solo un terzo delle colture agricole che ne hanno necessità, mentre sono gli impollinatori selvatici a compiere il grosso del lavoro.
Riquadro 1: Colture che beneficiano dell’impollinazione entomofila
• Frutta – melo, arancio, pero, pesco, melone e anguria, limone, fragola, lampone, susino, albicocco, ciliegio, kiwi, mango e ribes
• Ortaggi – pomodoro, carota, cipolla, peperone, zucca, fava, zucchina, fagiolo, melanzana, zucca e cetriolo
• Colture industriali – cotone, colza, girasole, senape, soia e grano saraceno
• Frutta secca – mandorlo e castagno
• Piante aromatiche – basilico, salvia, rosmarino, timo, coriandolo, cumino e aneto
• Foraggio per gli animali – erba medica, trifoglio e meliloto
• Piante officinali – camomilla, lavanda ed enotera
In Europa gli insetti impollinatori contribuiscono alla produzione agricola di 150 colture (84%)
Queste colture dipendono parzialmente o interamente dagli insetti per l’impollinazione e il raccolto
Si stima che il valore degli insetti impollinatori in Europa si aggiri intorno ai 22 miliardi di euro all’anno
Oltre alle api mellifere anche le api selvatiche ed altri insetti sono importanti impollinatori
Status and trends of European pollinators STEP-project www.step-project.net
Figure 3. Flower-visiting wild bee Andrena bicolor on oilseed rape (Photo: Maurizio Censini).
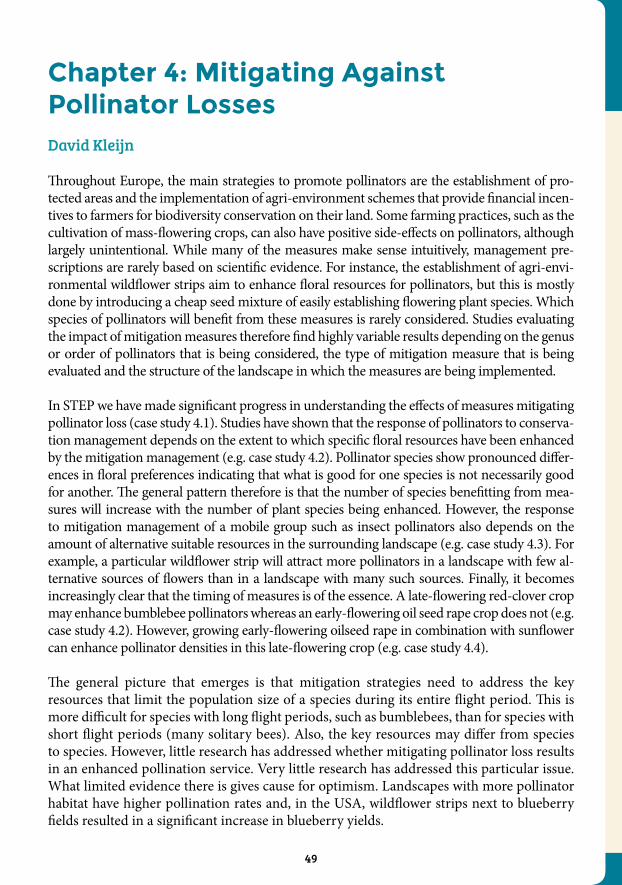
49
Chapter 4: Mitigating Against Pollinator LossesDavid Kleijn
Throughout Europe, the main strategies to promote pollinators are the establishment of pro-tected areas and the implementation of agri-environment schemes that provide financial incen-tives to farmers for biodiversity conservation on their land. Some farming practices, such as the cultivation of mass-flowering crops, can also have positive side-effects on pollinators, although largely unintentional. While many of the measures make sense intuitively, management pre-scriptions are rarely based on scientific evidence. For instance, the establishment of agri-envi-ronmental wildflower strips aim to enhance floral resources for pollinators, but this is mostly done by introducing a cheap seed mixture of easily establishing flowering plant species. Which species of pollinators will benefit from these measures is rarely considered. Studies evaluating the impact of mitigation measures therefore find highly variable results depending on the genus or order of pollinators that is being considered, the type of mitigation measure that is being evaluated and the structure of the landscape in which the measures are being implemented. In STEP we have made significant progress in understanding the effects of measures mitigating pollinator loss (case study 4.1). Studies have shown that the response of pollinators to conserva-tion management depends on the extent to which specific floral resources have been enhanced by the mitigation management (e.g. case study 4.2). Pollinator species show pronounced differ-ences in floral preferences indicating that what is good for one species is not necessarily good for another. The general pattern therefore is that the number of species benefitting from mea-sures will increase with the number of plant species being enhanced. However, the response to mitigation management of a mobile group such as insect pollinators also depends on the amount of alternative suitable resources in the surrounding landscape (e.g. case study 4.3). For example, a particular wildflower strip will attract more pollinators in a landscape with few al-ternative sources of flowers than in a landscape with many such sources. Finally, it becomes increasingly clear that the timing of measures is of the essence. A late-flowering red-clover crop may enhance bumblebee pollinators whereas an early-flowering oil seed rape crop does not (e.g. case study 4.2). However, growing early-flowering oilseed rape in combination with sunflower can enhance pollinator densities in this late-flowering crop (e.g. case study 4.4).
The general picture that emerges is that mitigation strategies need to address the key resources that limit the population size of a species during its entire flight period. This is more difficult for species with long flight periods, such as bumblebees, than for species with short flight periods (many solitary bees). Also, the key resources may differ from species to species. However, little research has addressed whether mitigating pollinator loss results in an enhanced pollination service. Very little research has addressed this particular issue. What limited evidence there is gives cause for optimism. Landscapes with more pollinator habitat have higher pollination rates and, in the USA, wildflower strips next to blueberry fields resulted in a significant increase in blueberry yields.

50
4.1 Environmental factors driving the effectiveness of European agri-environmental measures in mitigating pollinator loss – a meta-analysis
David Kleijn and Jeroen Scheper
Summary of the science
Farmland represents one of the dominant land-uses in Europe, covering more than 45% of the area of the European Union. This farmland has traditionally supported high levels of biodiversity and about half of the species are associated with habitats that have been shaped by agriculture. However, the intensification of agriculture since the second half of the 20th century has caused severe declines in farmland biodiversity. Agri-environment schemes are the main tool to counteract this biodiversity decline. Yet, the success of agri-environment schemes on biodiversity is unpredictable. This variability of effectiveness has been hypoth-esized to be caused by factors such as landscape structure (e.g. the amount of semi-natural habitat), farming intensity and the extent to which agri-environmental prescriptions suc-ceed in improving habitat quality for the targeted species.
Focusing on pollinating insects, we provide the first comprehensive analysis of the factors that potentially influence the effectiveness of agri-environment schemes. We perform a quantita-tive analysis of published studies examining the effectiveness of agri-environment schemes. Although thus far most agri-environment schemes are not specifically targeted at pollinators, many schemes may potentially be beneficial to pollinators. For instance, schemes reducing the intensity of farming practices and schemes involving the creation or restoration of non-cropped farmland habitats can, either directly or indirectly, enhance the availability of floral resources and nesting sites and/or reduce sources of mortality (i.e. pesticides).
Our results show that by improving floral resource availability, agri-environment schemes generally promote pollinators in agricultural landscapes. However, it is easier to enhance resource availability in structurally simple (few semi-natural habitats) than in cleared (no semi-natural habitats) or complex landscapes (many semi-natural habitats) and in crop-lands than in grasslands. In complex landscapes, where availability of floral resources and nesting sites is already high, the introduction of additional resources by means of agri-en-vironment schemes results in relatively small increases. In simple landscapes, arable farm-ing systems are much more devoid of essential pollinator resources, it is easier to increase resource availability significantly with agri-environmental management. This results in the counter-intuitive situation that the most pronounced increases in pollinator diversity can be obtained in landscapes with low levels of biodiversity where measures will mainly benefit the species that are least affected by agricultural intensification.
Different types of measures showed significant differences in their effects on pollinators. Sowing flower strips generally resulted in the largest increase and organic farming in the

51
lowest increase (Figure 1). The response of pollinators to individual measures also seemed to be mediated by their effect on floral resources. For example, pollinator species richness and abundance in sown flower strips were generally positively related to the number of flowering plant species that were sown (Figure 2)
Policy relevance
Insight into the ecological factors that explain the success or failure of agri-environmen-tal measures is essential if we want to contribute to halting or reversing biodiversity loss on farmland. This study shows that agri-environmental measures generally enhance local pollinator species richness and abundance in agro-ecosystems, and are most effective when implemented in structurally simple, resource-poor landscapes dominated by arable fields where they readily enhance resource availability for pollinators. However, these landscapes mainly support common generalist species with good dispersal capabilities that are of rela-tively little interest from a biodiversity conservation perspective. As the common generalist pollinator species are the species that contribute most to the pollination of crops, from the
-0.6
0.0
0.6
1.2
1.8
2.4
3.0
3.6
FS OF GS/NR
d sp
ecie
s ric
hnes
s
24 23
20
(a) Cropland
-0.6
0.0
0.6
1.2
1.8
2.4
3.0
3.6
FS EG OF
d sp
ecie
s ric
hnes
s
4
34 5
(b) Grassland
-0.6
0.0
0.6
1.2
1.8
2.4
3.0
3.6
FS OF GS/NR
d ab
unda
nce
31
27 30
(c)
-0.6
0.0
0.6
1.2
1.8
2.4
3.0
3.6
FS EG OF
d ab
unda
nce
4
34 9
(d)
Figure 1. Effects of different types of agri-environmental measures on species richness (top) and abundance (bottom) of pollinators in croplands (a, c) and grasslands (b, d). Indicated are mean effect sizes ± 95% CI, with positive values indicating positive effects. Numbers indicate sample sizes. FS: sown flower strip; OF: organic farming; GS/NR: grass-sown or naturally regenerated field margin or set-aside; EG: extensive grassland (Modified from Scheper et al. 2013, Ecology Letters).
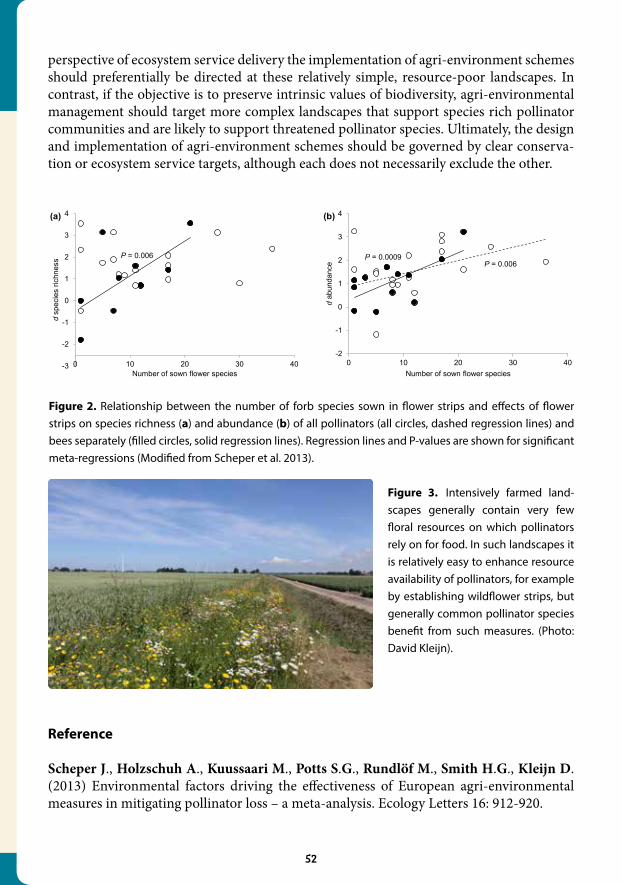
52
perspective of ecosystem service delivery the implementation of agri-environment schemes should preferentially be directed at these relatively simple, resource-poor landscapes. In contrast, if the objective is to preserve intrinsic values of biodiversity, agri-environmental management should target more complex landscapes that support species rich pollinator communities and are likely to support threatened pollinator species. Ultimately, the design and implementation of agri-environment schemes should be governed by clear conserva-tion or ecosystem service targets, although each does not necessarily exclude the other.
Reference
Scheper J., Holzschuh A., Kuussaari M., Potts S.G., Rundlöf M., Smith H.G., Kleijn D. (2013) Environmental factors driving the effectiveness of European agri-environmental measures in mitigating pollinator loss – a meta-analysis. Ecology Letters 16: 912-920.
-3
-2
-1
0
1
2
3
4
0 10 20 30 40
d sp
ecie
s ric
hnes
s
Number of sown flower species
P = 0.006
(a)
-2
-1
0
1
2
3
4
0 10 20 30 40
d ab
unda
nce
Number of sown flower species
P = 0.0009 P = 0.006
(b)
Figure 2. Relationship between the number of forb species sown in flower strips and effects of flower strips on species richness (a) and abundance (b) of all pollinators (all circles, dashed regression lines) and bees separately (filled circles, solid regression lines). Regression lines and P-values are shown for significant meta-regressions (Modified from Scheper et al. 2013).
Figure 3. Intensively farmed land-scapes generally contain very few floral resources on which pollinators rely on for food. In such landscapes it is relatively easy to enhance resource availability of pollinators, for example by establishing wildflower strips, but generally common pollinator species benefit from such measures. (Photo: David Kleijn).
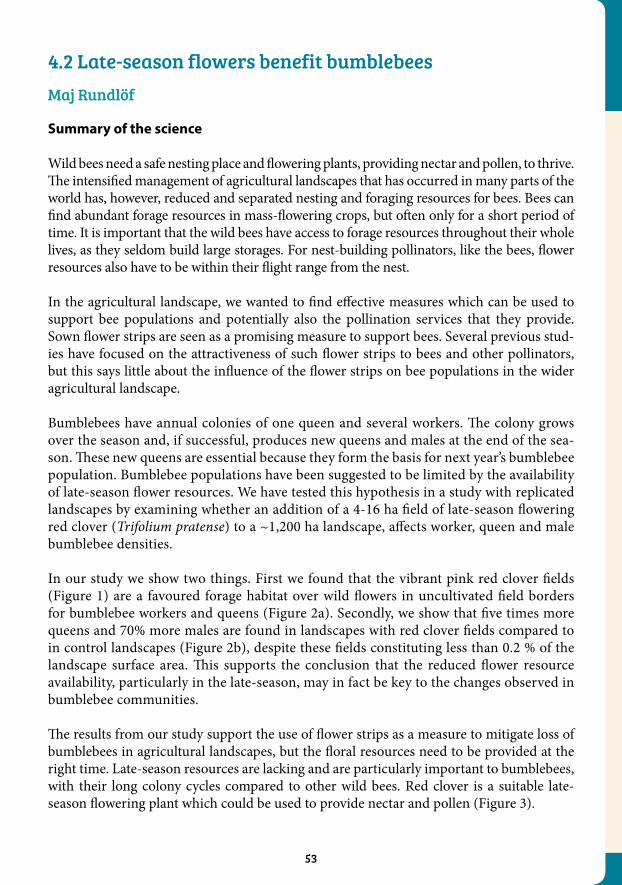
53
4.2 Late-season flowers benefit bumblebeesMaj Rundlöf
Summary of the science
Wild bees need a safe nesting place and flowering plants, providing nectar and pollen, to thrive. The intensified management of agricultural landscapes that has occurred in many parts of the world has, however, reduced and separated nesting and foraging resources for bees. Bees can find abundant forage resources in mass-flowering crops, but often only for a short period of time. It is important that the wild bees have access to forage resources throughout their whole lives, as they seldom build large storages. For nest-building pollinators, like the bees, flower resources also have to be within their flight range from the nest.
In the agricultural landscape, we wanted to find effective measures which can be used to support bee populations and potentially also the pollination services that they provide. Sown flower strips are seen as a promising measure to support bees. Several previous stud-ies have focused on the attractiveness of such flower strips to bees and other pollinators, but this says little about the influence of the flower strips on bee populations in the wider agricultural landscape.
Bumblebees have annual colonies of one queen and several workers. The colony grows over the season and, if successful, produces new queens and males at the end of the sea-son. These new queens are essential because they form the basis for next year’s bumblebee population. Bumblebee populations have been suggested to be limited by the availability of late-season flower resources. We have tested this hypothesis in a study with replicated landscapes by examining whether an addition of a 4-16 ha field of late-season flowering red clover (Trifolium pratense) to a ~1,200 ha landscape, affects worker, queen and male bumblebee densities.
In our study we show two things. First we found that the vibrant pink red clover fields (Figure 1) are a favoured forage habitat over wild flowers in uncultivated field borders for bumblebee workers and queens (Figure 2a). Secondly, we show that five times more queens and 70% more males are found in landscapes with red clover fields compared to in control landscapes (Figure 2b), despite these fields constituting less than 0.2 % of the landscape surface area. This supports the conclusion that the reduced flower resource availability, particularly in the late-season, may in fact be key to the changes observed in bumblebee communities.
The results from our study support the use of flower strips as a measure to mitigate loss of bumblebees in agricultural landscapes, but the floral resources need to be provided at the right time. Late-season resources are lacking and are particularly important to bumblebees, with their long colony cycles compared to other wild bees. Red clover is a suitable late-season flowering plant which could be used to provide nectar and pollen (Figure 3).
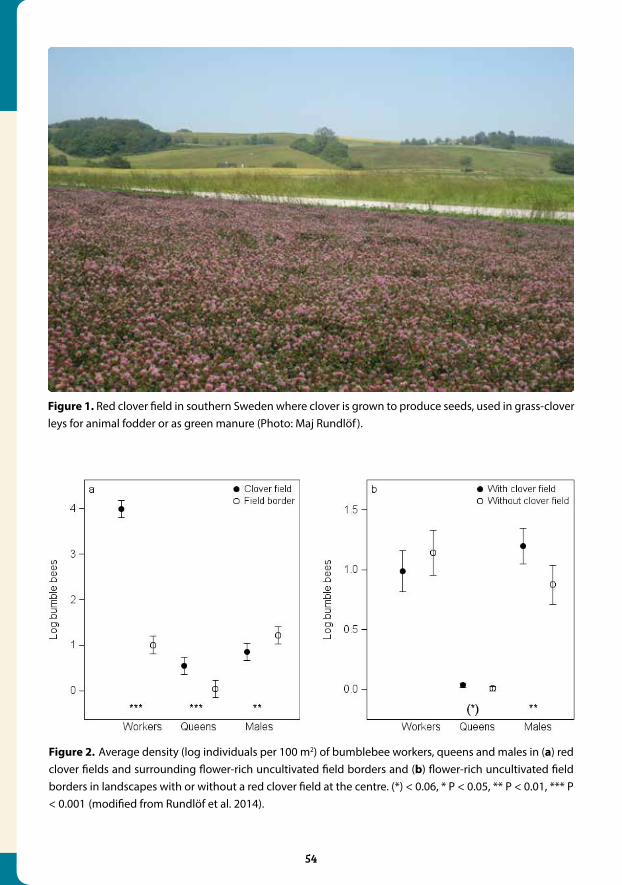
54
Figure 1. Red clover field in southern Sweden where clover is grown to produce seeds, used in grass-clover leys for animal fodder or as green manure (Photo: Maj Rundlöf ).
Figure 2. Average density (log individuals per 100 m2) of bumblebee workers, queens and males in (a) red clover fields and surrounding flower-rich uncultivated field borders and (b) flower-rich uncultivated field borders in landscapes with or without a red clover field at the centre. (*) < 0.06, * P < 0.05, ** P < 0.01, *** P < 0.001 (modified from Rundlöf et al. 2014).
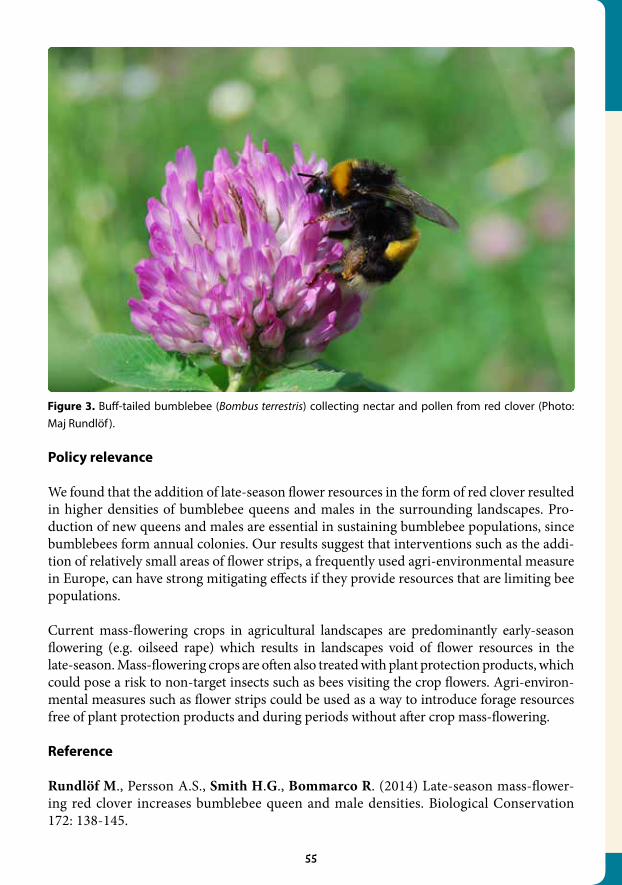
55
Policy relevance
We found that the addition of late-season flower resources in the form of red clover resulted in higher densities of bumblebee queens and males in the surrounding landscapes. Pro-duction of new queens and males are essential in sustaining bumblebee populations, since bumblebees form annual colonies. Our results suggest that interventions such as the addi-tion of relatively small areas of flower strips, a frequently used agri-environmental measure in Europe, can have strong mitigating effects if they provide resources that are limiting bee populations.
Current mass-flowering crops in agricultural landscapes are predominantly early-season flowering (e.g. oilseed rape) which results in landscapes void of flower resources in the late-season. Mass-flowering crops are often also treated with plant protection products, which could pose a risk to non-target insects such as bees visiting the crop flowers. Agri-environ-mental measures such as flower strips could be used as a way to introduce forage resources free of plant protection products and during periods without after crop mass-flowering.
Reference
Rundlöf M., Persson A.S., Smith H.G., Bommarco R. (2014) Late-season mass-flower-ing red clover increases bumblebee queen and male densities. Biological Conservation 172: 138-145.
Figure 3. Buff-tailed bumblebee (Bombus terrestris) collecting nectar and pollen from red clover (Photo: Maj Rundlöf ).

56
4.3 Landscapes with wild bee habitats enhance pollination, fruit set and yield of sweet cherryAndrea Holzschuh
Summary of the science
For the vast majority of crops it is unknown whether managed honeybees or wild bees are the most efficient pollinators, and how the pollination service provided by wild bees can be ensured.
Cherries production is in excess of 2 million metric tons annually, and is one of the leading global food crops which greatly depend on animal pollination (Figure 1). Honeybees have been assumed to be the main pollinators in cherry, but there is anecdotal evidence that wild bees provide better pollination services. Although cherry producers might strongly depend on pollination services provided by bees, there has been no replicated study assessing the relative importance of honeybees and wild bees for cherry production to date.
We assessed in a landscape-scale study how sweet cherry production is influenced by (1) high-diversity bee habitats, and (2) flowering vegetation which might compete with cher-ry for pollinators or might facilitate cherry pollination. Comparing fruit set of a bagged branch, where insects could not access the flowers, with fruit set of an open-pollinated branch on 32 cherry trees. Bagged flowers produced only 3% of the fruits produced by open-pollinated flowers. Although two thirds of all flower visitors were honeybees, fruit set increased with wild bee visitation only (Fig-ure 2 A, B), presumably due to the higher pollination efficiency of wild bees. The low fruit set in orchards with low wild pollinator visitation was experimentally shown to be due to pollen limitation. Wild bee visitation increased with the proportion of high-diver-sity bee habitats in the surrounding landscape (1 km radius) and consequently also fruit set
increased with the proportion of high-diversity bee habitats (Figure 2 C, D). An increase in the proportion of high-diversity bee habitats from 20% to 50% enhanced fruit set by 150%. Neither flower cover of ground vegetation nor bee densities on ground transects were relat-ed to flower visitation in trees or fruit set suggesting that ground vegetation neither com-petes with cherry for pollinators nor facilitates cherry pollination.
Figure 1. Cherry trees in bloom (Photo: Jan-Hendrik Dudenhöffer).
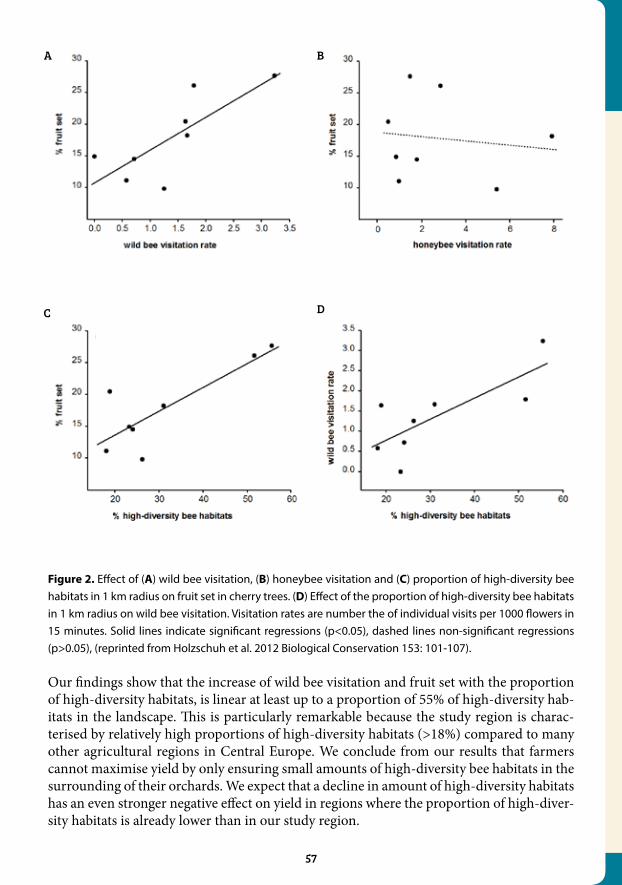
57
Our findings show that the increase of wild bee visitation and fruit set with the proportion of high-diversity habitats, is linear at least up to a proportion of 55% of high-diversity hab-itats in the landscape. This is particularly remarkable because the study region is charac-terised by relatively high proportions of high-diversity habitats (>18%) compared to many other agricultural regions in Central Europe. We conclude from our results that farmers cannot maximise yield by only ensuring small amounts of high-diversity bee habitats in the surrounding of their orchards. We expect that a decline in amount of high-diversity habitats has an even stronger negative effect on yield in regions where the proportion of high-diver-sity habitats is already lower than in our study region.
Figure 2. Effect of (A) wild bee visitation, (B) honeybee visitation and (C) proportion of high-diversity bee habitats in 1 km radius on fruit set in cherry trees. (D) Effect of the proportion of high-diversity bee habitats in 1 km radius on wild bee visitation. Visitation rates are number the of individual visits per 1000 flowers in 15 minutes. Solid lines indicate significant regressions (p<0.05), dashed lines non-significant regressions (p>0.05), (reprinted from Holzschuh et al. 2012 Biological Conservation 153: 101-107).

58
Policy relevance
Cherry fruit set and the economically important final cherry yield proved to be highly de-pendent on insect pollination and increased with wild bee visitation and the proportion of high-diversity bee habitats in the surrounding landscape. Typical high-diversity bee habi-tats are semi-natural habitats that provide nesting sites and food resources before and after the mass-flowering period of the crop, e.g. non-intensively used grasslands, old fallows, hedges or forest edges (Figure 3).
Our data shows that only the protection or restoration of high-diversity bee habitats will guarantee pollination and high yields, and that additional high-diversity bee habitat even enhances yield if the proportion of high-diversity bee habitats is already high (50 % in our study). High-diversity bee habitat should be located within the foraging distance of the pollinators, which was 1 km for the wild bees in our study. Farmers who locate their or-chards surrounded by high-diversity bee habitats should gain a monetary advantage over competitors without high-diversity bee habitats in the landscape. Cherry yield could not be maximized in our study if farmers relied on honeybee pollination only.
Reference
Holzschuh A., Dudenhöffer J-H., Tscharntke T. (2012) Landscapes with wild bee hab-itats enhance pollination, fruit set and yield of sweet cherry. Biological Conservation 153:101-107.
Figure 3. Landscape with arable lands and high-diversity bee habitats surrounding a cherry orchard in the lower middle of the photo (Photo: Jan-Hendrik Dudenhöffer).
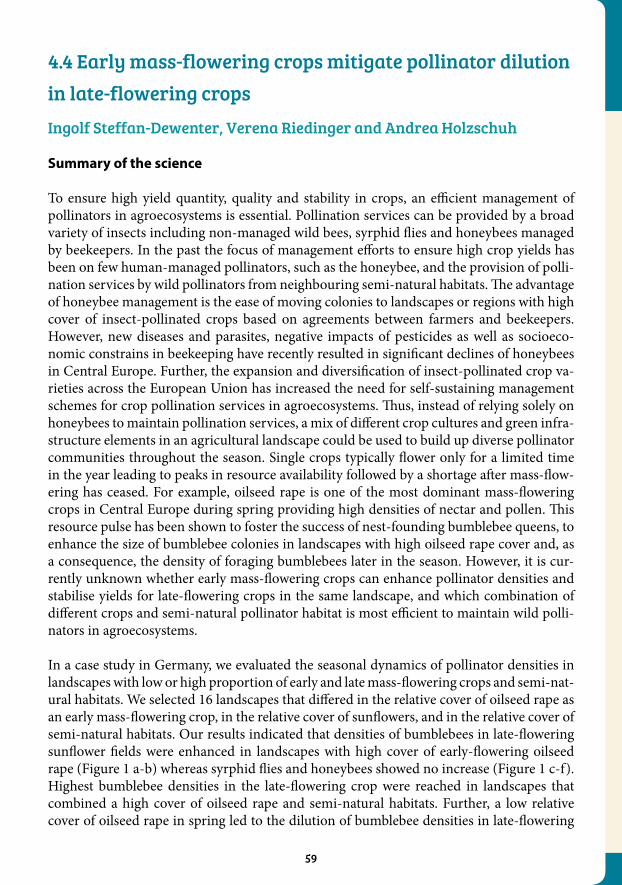
59
4.4 Early mass-flowering crops mitigate pollinator dilution in late-flowering crops Ingolf Steffan-Dewenter, Verena Riedinger and Andrea Holzschuh
Summary of the science
To ensure high yield quantity, quality and stability in crops, an efficient management of pollinators in agroecosystems is essential. Pollination services can be provided by a broad variety of insects including non-managed wild bees, syrphid flies and honeybees managed by beekeepers. In the past the focus of management efforts to ensure high crop yields has been on few human-managed pollinators, such as the honeybee, and the provision of polli-nation services by wild pollinators from neighbouring semi-natural habitats. The advantage of honeybee management is the ease of moving colonies to landscapes or regions with high cover of insect-pollinated crops based on agreements between farmers and beekeepers. However, new diseases and parasites, negative impacts of pesticides as well as socioeco-nomic constrains in beekeeping have recently resulted in significant declines of honeybees in Central Europe. Further, the expansion and diversification of insect-pollinated crop va-rieties across the European Union has increased the need for self-sustaining management schemes for crop pollination services in agroecosystems. Thus, instead of relying solely on honeybees to maintain pollination services, a mix of different crop cultures and green infra-structure elements in an agricultural landscape could be used to build up diverse pollinator communities throughout the season. Single crops typically flower only for a limited time in the year leading to peaks in resource availability followed by a shortage after mass-flow-ering has ceased. For example, oilseed rape is one of the most dominant mass-flowering crops in Central Europe during spring providing high densities of nectar and pollen. This resource pulse has been shown to foster the success of nest-founding bumblebee queens, to enhance the size of bumblebee colonies in landscapes with high oilseed rape cover and, as a consequence, the density of foraging bumblebees later in the season. However, it is cur-rently unknown whether early mass-flowering crops can enhance pollinator densities and stabilise yields for late-flowering crops in the same landscape, and which combination of different crops and semi-natural pollinator habitat is most efficient to maintain wild polli-nators in agroecosystems.
In a case study in Germany, we evaluated the seasonal dynamics of pollinator densities in landscapes with low or high proportion of early and late mass-flowering crops and semi-nat-ural habitats. We selected 16 landscapes that differed in the relative cover of oilseed rape as an early mass-flowering crop, in the relative cover of sunflowers, and in the relative cover of semi-natural habitats. Our results indicated that densities of bumblebees in late-flowering sunflower fields were enhanced in landscapes with high cover of early-flowering oilseed rape (Figure 1 a-b) whereas syrphid flies and honeybees showed no increase (Figure 1 c-f). Highest bumblebee densities in the late-flowering crop were reached in landscapes that combined a high cover of oilseed rape and semi-natural habitats. Further, a low relative cover of oilseed rape in spring led to the dilution of bumblebee densities in late-flowering
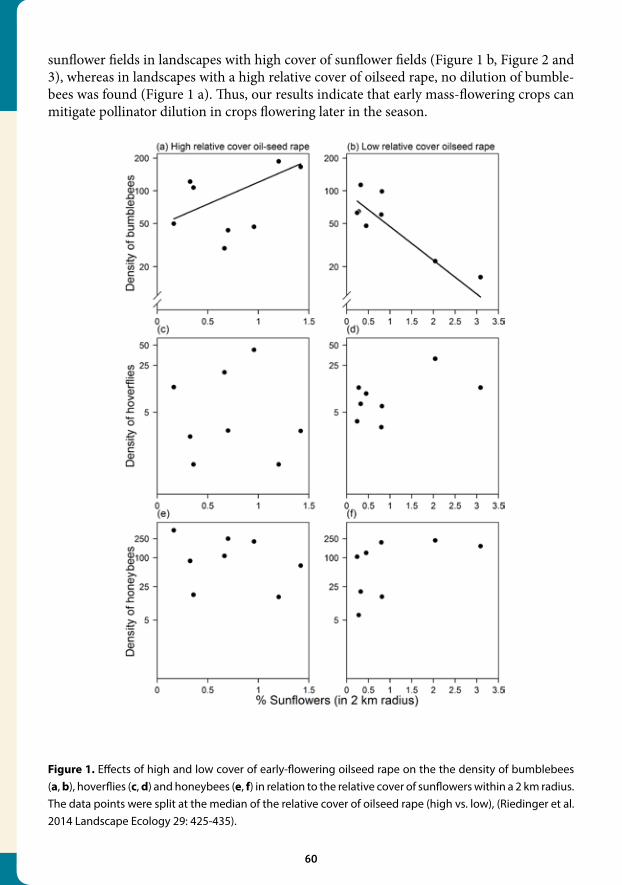
60
sunflower fields in landscapes with high cover of sunflower fields (Figure 1 b, Figure 2 and 3), whereas in landscapes with a high relative cover of oilseed rape, no dilution of bumble-bees was found (Figure 1 a). Thus, our results indicate that early mass-flowering crops can mitigate pollinator dilution in crops flowering later in the season.
Figure 1. Effects of high and low cover of early-flowering oilseed rape on the the density of bumblebees (a, b), hoverflies (c, d) and honeybees (e, f) in relation to the relative cover of sunflowers within a 2 km radius. The data points were split at the median of the relative cover of oilseed rape (high vs. low), (Riedinger et al. 2014 Landscape Ecology 29: 425-435).
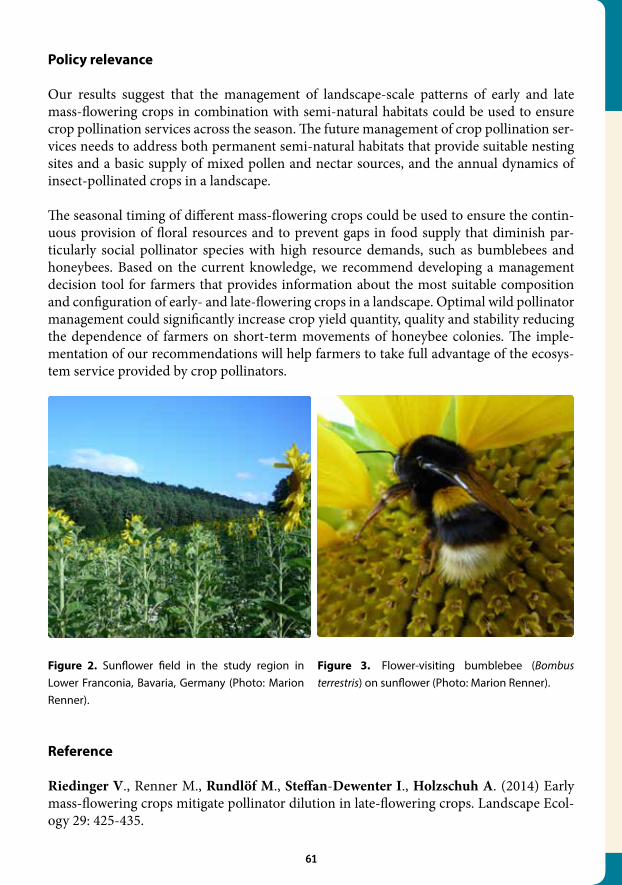
61
Policy relevance
Our results suggest that the management of landscape-scale patterns of early and late mass-flowering crops in combination with semi-natural habitats could be used to ensure crop pollination services across the season. The future management of crop pollination ser-vices needs to address both permanent semi-natural habitats that provide suitable nesting sites and a basic supply of mixed pollen and nectar sources, and the annual dynamics of insect-pollinated crops in a landscape.
The seasonal timing of different mass-flowering crops could be used to ensure the contin-uous provision of floral resources and to prevent gaps in food supply that diminish par-ticularly social pollinator species with high resource demands, such as bumblebees and honeybees. Based on the current knowledge, we recommend developing a management decision tool for farmers that provides information about the most suitable composition and configuration of early- and late-flowering crops in a landscape. Optimal wild pollinator management could significantly increase crop yield quantity, quality and stability reducing the dependence of farmers on short-term movements of honeybee colonies. The imple-mentation of our recommendations will help farmers to take full advantage of the ecosys-tem service provided by crop pollinators.
Reference
Riedinger V., Renner M., Rundlöf M., Steffan-Dewenter I., Holzschuh A. (2014) Early mass-flowering crops mitigate pollinator dilution in late-flowering crops. Landscape Ecol-ogy 29: 425-435.
Figure 2. Sunflower field in the study region in Lower Franconia, Bavaria, Germany (Photo: Marion Renner).
Figure 3. Flower-visiting bumblebee (Bombus terrestris) on sunflower (Photo: Marion Renner).
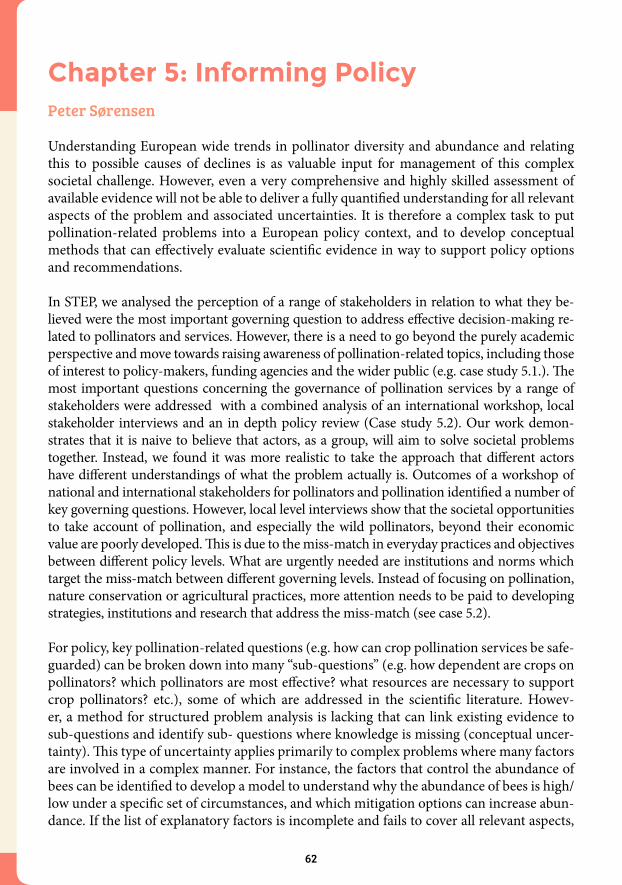
62
Chapter 5: Informing PolicyPeter Sørensen
Understanding European wide trends in pollinator diversity and abundance and relating this to possible causes of declines is as valuable input for management of this complex societal challenge. However, even a very comprehensive and highly skilled assessment of available evidence will not be able to deliver a fully quantified understanding for all relevant aspects of the problem and associated uncertainties. It is therefore a complex task to put pollination-related problems into a European policy context, and to develop conceptual methods that can effectively evaluate scientific evidence in way to support policy options and recommendations.
In STEP, we analysed the perception of a range of stakeholders in relation to what they be-lieved were the most important governing question to address effective decision-making re-lated to pollinators and services. However, there is a need to go beyond the purely academic perspective and move towards raising awareness of pollination-related topics, including those of interest to policy-makers, funding agencies and the wider public (e.g. case study 5.1.). The most important questions concerning the governance of pollination services by a range of stakeholders were addressed with a combined analysis of an international workshop, local stakeholder interviews and an in depth policy review (Case study 5.2). Our work demon-strates that it is naive to believe that actors, as a group, will aim to solve societal problems together. Instead, we found it was more realistic to take the approach that different actors have different understandings of what the problem actually is. Outcomes of a workshop of national and international stakeholders for pollinators and pollination identified a number of key governing questions. However, local level interviews show that the societal opportunities to take account of pollination, and especially the wild pollinators, beyond their economic value are poorly developed. This is due to the miss-match in everyday practices and objectives between different policy levels. What are urgently needed are institutions and norms which target the miss-match between different governing levels. Instead of focusing on pollination, nature conservation or agricultural practices, more attention needs to be paid to developing strategies, institutions and research that address the miss-match (see case 5.2).
For policy, key pollination-related questions (e.g. how can crop pollination services be safe-guarded) can be broken down into many “sub-questions” (e.g. how dependent are crops on pollinators? which pollinators are most effective? what resources are necessary to support crop pollinators? etc.), some of which are addressed in the scientific literature. Howev-er, a method for structured problem analysis is lacking that can link existing evidence to sub-questions and identify sub- questions where knowledge is missing (conceptual uncer-tainty). This type of uncertainty applies primarily to complex problems where many factors are involved in a complex manner. For instance, the factors that control the abundance of bees can be identified to develop a model to understand why the abundance of bees is high/low under a specific set of circumstances, and which mitigation options can increase abun-dance. If the list of explanatory factors is incomplete and fails to cover all relevant aspects,
63
then the subsequent understanding of the problem, based on the concept model, will also be incomplete, and important relations can be hidden knowledge gaps. This is a fundamen-tal problem in modelling and it is, thus, important to carefully map and define the factors in order not to ignore critical aspects that may have relevance for the governing question. An approach to dealing with the issue of complexity in governing questions for pollinators is described in case study 5.3.
5.1 How can pollination ecology research help answer Important questions?
Koos Biesmeijer, Luisa Carvalheiro and Peter Sørensen
Summary of the science
While pollination has been studied for centuries, it remains a dynamic field of scientif-ic research constantly adopting novel methods and improving our understanding of the interactions between plants and their pollinators. A recent paper (Mayer et al. 2011) listed the main scientific questions that still need to be addressed in this field, focussing on the ecological and biological system itself. These questions were put together from a long list of suggestions from scientific experts in the pollination research field. A close examination of the paper gives the impression that the scope of the questions is rather limited. Particularly given that the authors hope the paper will contribute to raising awareness of pollination-related topics including those of interest to policy-makers, funding agencies and the wider public. To complement the effort of the Mayer et al. (2011) paper, we developed a simple framework integrating ecological, societal and socio-ecological issues relevant to pollinators and pollination and outlined a pathway to come to a ‘whole-society’ list of key questions for future research in the field of pollination ecology (Biesmeijer, Sorensen & Carvalheiro, 2011). This case study is an excerpt of the latter paper.
There are different types of questions one can ask about pollinators and pollination. For in-stance, questions in the Mayer et al. (2011) paper range from “What is the lifespan of pollen grains”, a very specific mechanistic question, to “How can we better employ plants and their pollinators as educational tools for public awareness?”, an educational-societal question. In fact, questions may address four major, partly separate, realms (Figure 1), namely:
Questions dealing with the workings of nature, including ecology, evolution and be-haviour; in Figure 1 referred to as “ECOLOGY”.
Questions about how ecosystems and biodiversity provide human society with goods and services, including crop pollination, honey production and genetic resources of managed pollinators. (ECOLOGY → SOCIETY)
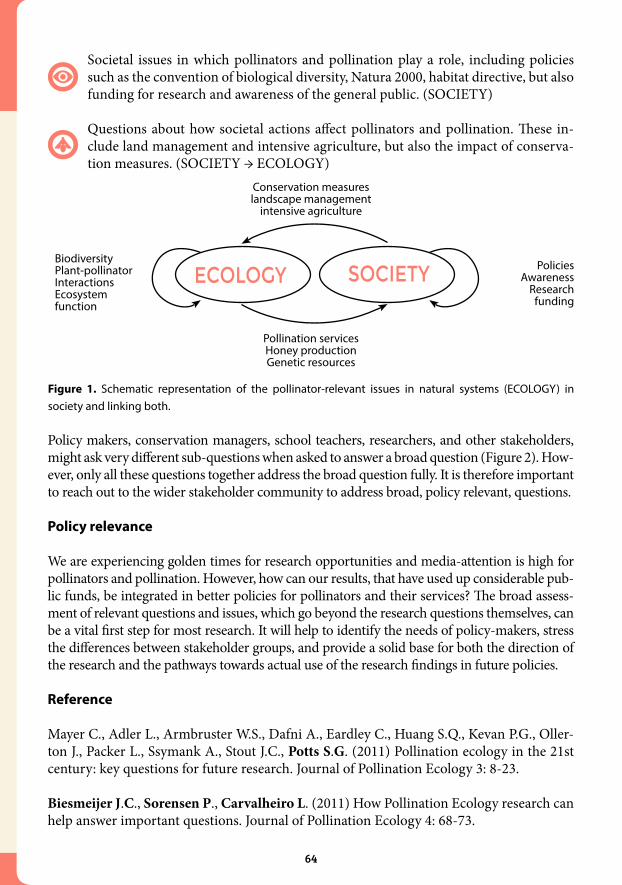
64
Societal issues in which pollinators and pollination play a role, including policies such as the convention of biological diversity, Natura 2000, habitat directive, but also funding for research and awareness of the general public. (SOCIETY)
Questions about how societal actions affect pollinators and pollination. These in-clude land management and intensive agriculture, but also the impact of conserva-tion measures. (SOCIETY → ECOLOGY)
Policy makers, conservation managers, school teachers, researchers, and other stakeholders, might ask very different sub-questions when asked to answer a broad question (Figure 2). How-ever, only all these questions together address the broad question fully. It is therefore important to reach out to the wider stakeholder community to address broad, policy relevant, questions.
Policy relevance
We are experiencing golden times for research opportunities and media-attention is high for pollinators and pollination. However, how can our results, that have used up considerable pub-lic funds, be integrated in better policies for pollinators and their services? The broad assess-ment of relevant questions and issues, which go beyond the research questions themselves, can be a vital first step for most research. It will help to identify the needs of policy-makers, stress the differences between stakeholder groups, and provide a solid base for both the direction of the research and the pathways towards actual use of the research findings in future policies.
Reference
Mayer C., Adler L., Armbruster W.S., Dafni A., Eardley C., Huang S.Q., Kevan P.G., Oller-ton J., Packer L., Ssymank A., Stout J.C., Potts S.G. (2011) Pollination ecology in the 21st century: key questions for future research. Journal of Pollination Ecology 3: 8-23.
Biesmeijer J.C., Sorensen P., Carvalheiro L. (2011) How Pollination Ecology research can help answer important questions. Journal of Pollination Ecology 4: 68-73.
Figure 1. Schematic representation of the pollinator-relevant issues in natural systems (ECOLOGY) in society and linking both.
Conservation measures landscape management
intensive agriculture
Pollination servicesHoney productionGenetic resources
BiodiversityPlant-pollinator InteractionsEcosystem function
PoliciesAwareness
Research funding
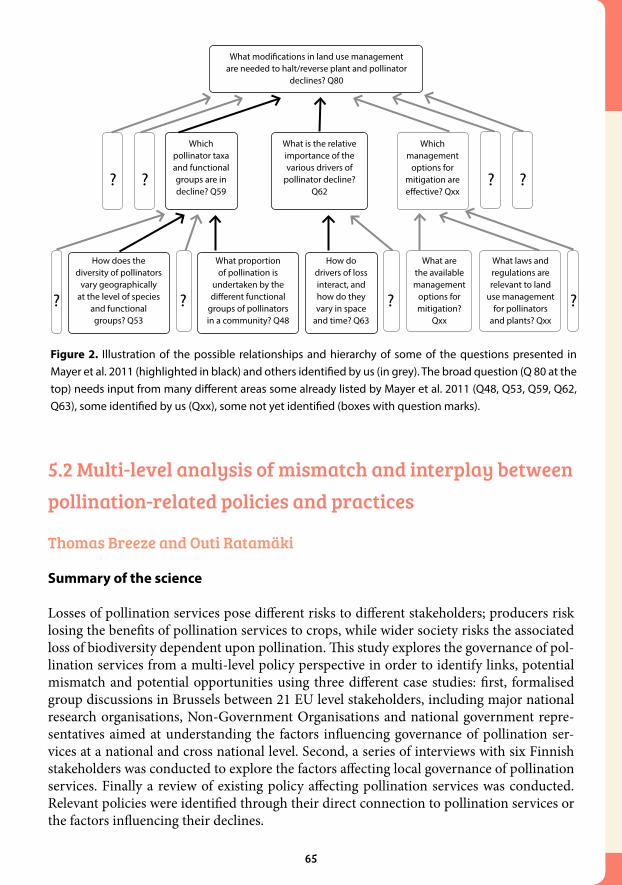
65
5.2 Multi-level analysis of mismatch and interplay between pollination-related policies and practices
Thomas Breeze and Outi Ratamäki
Summary of the science
Losses of pollination services pose different risks to different stakeholders; producers risk losing the benefits of pollination services to crops, while wider society risks the associated loss of biodiversity dependent upon pollination. This study explores the governance of pol-lination services from a multi-level policy perspective in order to identify links, potential mismatch and potential opportunities using three different case studies: first, formalised group discussions in Brussels between 21 EU level stakeholders, including major national research organisations, Non-Government Organisations and national government repre-sentatives aimed at understanding the factors influencing governance of pollination ser-vices at a national and cross national level. Second, a series of interviews with six Finnish stakeholders was conducted to explore the factors affecting local governance of pollination services. Finally a review of existing policy affecting pollination services was conducted. Relevant policies were identified through their direct connection to pollination services or the factors influencing their declines.
Figure 2. Illustration of the possible relationships and hierarchy of some of the questions presented in Mayer et al. 2011 (highlighted in black) and others identified by us (in grey). The broad question (Q 80 at the top) needs input from many different areas some already listed by Mayer et al. 2011 (Q48, Q53, Q59, Q62, Q63), some identified by us (Qxx), some not yet identified (boxes with question marks).
What modifications in land use management are needed to halt/reverse plant and pollinator
declines? Q80
Which pollinator taxa and functional groups are in decline? Q59
?
? ?? ?
?? ?
What is the relative importance of the various drivers of
pollinator decline? Q62
How does the diversity of pollinators
vary geographically at the level of species
and functional groups? Q53
What proportion of pollination is
undertaken by the different functional
groups of pollinators in a community? Q48
How do drivers of loss interact, and how do they vary in space
and time? Q63
What are the available management
options for mitigation?
Qxx
What laws and regulations are relevant to land
use management for pollinators
and plants? Qxx
Which management
options for mitigation are effective? Qxx
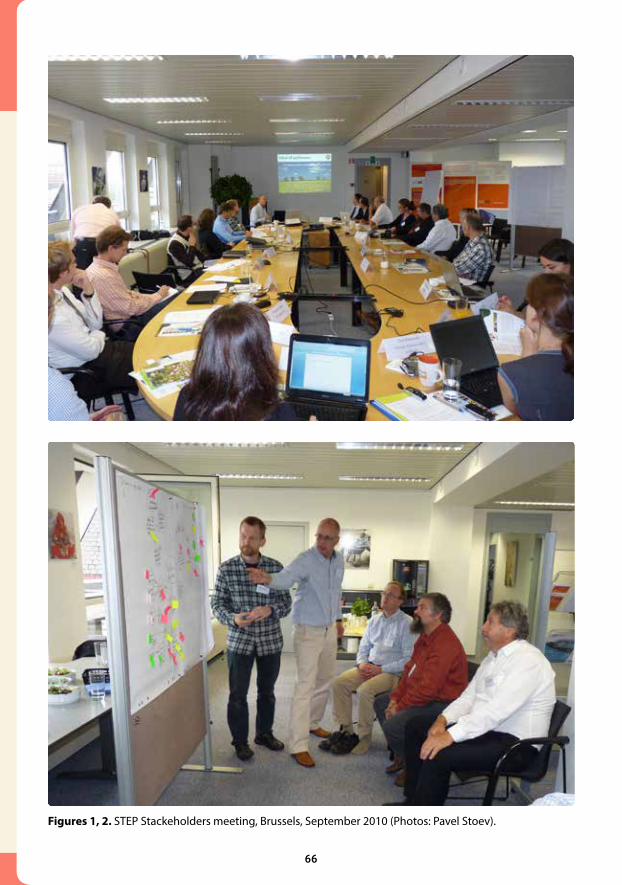
66
Figures 1, 2. STEP Stackeholders meeting, Brussels, September 2010 (Photos: Pavel Stoev).
67
Participants at the Brussels workshop identified four major concerns relating to the im-pacts of pollinator losses; biodiversity, agriculture, ecosystem services and functions and human health. The impacts of biodiversity were the primary concern of this group, but in particular what the loss of pollinator diversity may have on agriculture and human wellbeing. By contrast, most of the Finnish stakeholders interviewed only regarded hon-eybees as important pollinators of crops and were primarily focused on the economic effects of pollination on agriculture. Although they often recognised the importance of conservation efforts, local stakeholder motivation to undertake these measures was influ-enced by a number of apparent barriers, including difficulty trusting policy makers and perceived impracticalities. Analysis of relevant policy identified 15 International poli-cies that affect pollination services. Most of these concerned agriculture (e.g. the EU’s Common Agricultural Policy) or biodiversity (e.g. the UN’s Convention on Biological Diversity) although some broader policies were also found to be relevant (such as the Plant Protection Products Directive). While many of these policies can directly affect pollinators, they were not explicitly referenced in most.
The findings of these three case studies highlight a mismatch between EU and local gover-nance concerns surrounding the loss of pollination services. National and EU stakeholders focused on the impacts of pollination on biodiversity while local stakeholders were mostly concerned with the agricultural impacts. This mismatch is further represented in the policy review with biodiversity policy taking little account of agricultural impacts and farming policy often encouraging practices detrimental to biodiversity.
Policy relevance
The findings of this study highlight the mismatch between EU and local understanding of the problem of pollination service loss and governance priorities. This illustrates that, while larger institutions can form the backbone for wider activities, these policies need to be tailored at a local level, including financial incentives for achievable, practical measures that facilitate rather than hinder local business. For example, although honeybees were con-sidered to be the main or only pollinator of crops (but see Case 3.1), local stakeholders un-derstood the role of biodiversity in pollination services. Higher level policy could therefore incentivise conservation efforts and other social opportunities by highlighting the effective-ness of wild pollinators as free service providers.
Reference
Ratamäki O., Jokinen P., Sørensen P., Breeze T.D., Potts S.G. (in press) Multi-level Anal-ysis of Misfit and Interplay between Pollination-related Policies and Practices. Ecosystem Services.

68
5.3 Conceptual model for evidence analysis to support policy Peter Sørensen
Summary of the science
The summary of the conceptual model is based on Sørensen et al. (in prep.) and the govern-ing question: “How to manage ecosystems to protect bees (native/domestic)?”. The general structure is shown in Figure 1, which defines a three step approach .
Step 1: Aims to identify a “complete” list of factors that control the presence and abundance of bees, including the human activities that have an influence on these factors. If the defined list of factors is “incomplete”, then the subsequent understanding, based on the concept model, will also be incomplete and important topics may be ignored. This is a fundamental problem in modelling (Walker et al.*, 2003 and Sørensen et al., 2010) and it is, thus, important to make a careful mind map in Step 1 to define factors in order not to overlook topics that may have high relevance to the governing question, see Figure 2. The method in Step 1 is a refinement of the method suggested by Sørensen et al. (2010) and is combined with the hierarchical sub-divisions of questions suggested by Biesmeijer et al. (2011), which identified important pollination ecology research questions. Figure 2 shows the principle applied here using a sim-ple example for illustration. The complete conceptual model can contain up to 100 factors. Too many factors will make the model inaccessible for practical management purposes and too few factors will make the model too broad and, thus, result in only trivial conclusions.
Step 2: In Step 2, some factors are defined to have casual effects on other factors. This is shown through an example in Figure 3, where the application of an insecticide can cause contam-ination of pollen and thereby expose both larvae and worker (and the other life stages of a bee; not shown in our simple example). Thus, in Figure 3, arrow No. 1 relates contamination of pollen to negative effects on the larvae, while arrow No. 2 relates insecticide application to contamination of pollen. These two relations are different in the way that arrow No. 1 not only considers insecticides, and arrow No.2 does not consider how contaminated pollen can affect larvae, but rather how insecticides can end up contaminating pollen; this is a subtle, but important, difference for science based understanding. The final conceptual model is much more complex, having hundreds of relations in a network connecting the factors.
Step 3: The importance of the relations defined in Step 2 (shown as arrows in Figure 3) are evaluated based on available lines of evidences. This forms an efficient way to map the knowl-edge and to integrate different pieces of evidence into a coherent analysis of understanding and uncertainty. The pieces of evidence are collected from research results and can include a broad range of sources, such as peer-reviewed studies and expert opinions. Once populated with evi-dence, the conceptual model can then facilitate policy and practitioners to identify the key rel-evant evidence available to help inform decision making on a particular aspect of pollinators.
*Walker et al. (2003) Defining uncertainty, a conceptual basis for uncertainty management in model-based decision support. Integrated Assessment 4 (1).
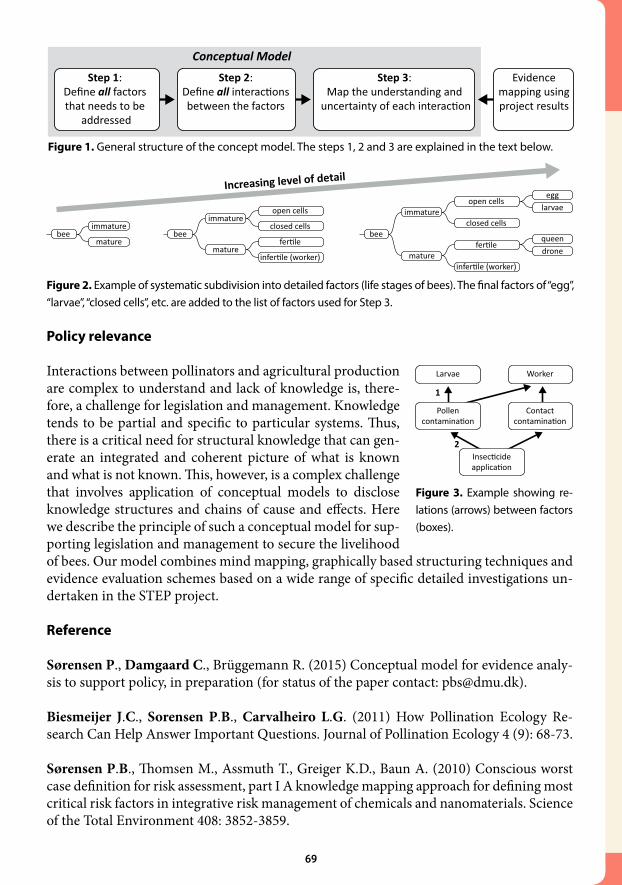
69
Policy relevance
Interactions between pollinators and agricultural production are complex to understand and lack of knowledge is, there-fore, a challenge for legislation and management. Knowledge tends to be partial and specific to particular systems. Thus, there is a critical need for structural knowledge that can gen-erate an integrated and coherent picture of what is known and what is not known. This, however, is a complex challenge that involves application of conceptual models to disclose knowledge structures and chains of cause and effects. Here we describe the principle of such a conceptual model for sup-porting legislation and management to secure the livelihood of bees. Our model combines mind mapping, graphically based structuring techniques and evidence evaluation schemes based on a wide range of specific detailed investigations un-dertaken in the STEP project.
Reference
Sørensen P., Damgaard C., Brüggemann R. (2015) Conceptual model for evidence analy-sis to support policy, in preparation (for status of the paper contact: [email protected]).
Biesmeijer J.C., Sorensen P.B., Carvalheiro L.G. (2011) How Pollination Ecology Re-search Can Help Answer Important Questions. Journal of Pollination Ecology 4 (9): 68-73.
Sørensen P.B., Thomsen M., Assmuth T., Greiger K.D., Baun A. (2010) Conscious worst case definition for risk assessment, part I A knowledge mapping approach for defining most critical risk factors in integrative risk management of chemicals and nanomaterials. Science of the Total Environment 408: 3852-3859.
Larvae
1
2
Worker
Pollencontamina�on
Insec�cideapplica�on
Contactcontamina�on
Figure 3. Example showing re-lations (arrows) between factors (boxes).
Figure 2. Example of systematic subdivision into detailed factors (life stages of bees). The final factors of “egg”, “larvae”, “closed cells”, etc. are added to the list of factors used for Step 3.
Step 1: Define all factors that needs to be
addressed
Step 2: Define all interac�ons between the factors
Step 3: Map the understanding and
uncertainty of each interac�on
Evidence mapping using project results
Conceptual Model
beeimmature
maturebee
open cells
closed cells
fer�le
infer�le (worker)
immature
mature
bee
open cells
closed cells
fer�le
infer�le (worker)
immature
mature
egglarvae
queendrone
Increasing level of detail
Figure 1. General structure of the concept model. The steps 1, 2 and 3 are explained in the text below.
Conclusion and Future Steps
Concerns about pollinators and pollination services continue to rise up the political, sci-entific and public agendas. Consequently we need to increase our understanding of the current status and trends of pollinators, determine the causes of declines and develop ways to sustainably manage pollinators to secure delivery of pollination services now and in the future. To do this Europe must develop robust scientific evidence to underpin policy and practice measures to safeguard our pollinators. STEP has strengthened our knowledge base in all these areas to better inform decision makers, farmers, growers, conservationists and beekeepers about how we can protect and manage this critical natural resource.
Specifically STEP has delivered a Red List of European Bees to help direct conserva-tion efforts at the national and continental level. The project has provided multi-scale, multi-species assessment of the shifts in pollinators across Europe and identified the key combinations of drivers of change. By determining the main causes of loss it is possible to direct policy and management interventions to help reduce these environmental pres-sures. STEP has also determined which pollinators actually pollinate crops and so help focus mitigation measures for taxa of greatest economic importance. The project has pro-duced a set of tools and methodologies to help with future monitoring and assessment of both pollinators and the services they deliver to support planners and decision makers in managing the wider landscape.
STEP continues to produce a portfolio of dissemination materials ranging from top inter-national scientific publications to carefully targeted booklets for end-users such as farm-ers and beekeepers, as well as delivering findings directly to a wide range of stakeholders through talks, workshops, TV and newspaper articles. STEP has also helped train a new cohort of postdoctoral researchers and PhD students in the field of pollinator conservation and pollination services to carry on the aims of STEP.
Prof. Simon Potts
70
List of AuthorsBiesmeijer Koos
Naturalis Biodiversity Center, postbus 9517, 2300 RA, Leiden, The NetherlandsBommarco Riccardo
Swedish University of Agricultural Sciences, Department of Ecology, P.O. Box 7044, SE-750 07 Uppsala, Sweden
Breeze ThomasCentre for Agri-Environmental Research, School of Agriculture Policy and Development, Reading University, Reading, RG6 6AR, UK
Carvalheiro LuisaSchool of Biology, University of Leeds, UK & Naturalis Biodiversity Center, postbus 9517, 2300 RA, Leiden, The Netherlands
Franzén MarkusDepartment of Community Ecology, Helmholtz Centre for Environmental Research GmbH - UFZ, Theodor-Lieser-Strasse 4, 06120 Halle, Germany
González-Varo Juan P. Estación Biológica de Doñana (EBD-CSIC), Avd. Américo Vespucio s/n, Isla de la Cartuja, 41092 Sevilla, Spain
Holzschuh AndreaDepartment of Animal Ecology and Tropical Biology, Biocenter, University of Würzburg, Am Hubland, 97074 Würzburg, Germany
Klein Alexandra-MariaFaculty of Environment and Natural Resources, University of Freiburg, Tennenbacher Str. 4, 79106, Freiburg, Germany
Kleijn DavidResource Ecology Group, Wageningen University & Animal Ecology Team, Alterra, PO Box 47, 6700 AA, Wageningen, The Netherlands
Kunin BillSchool of Biology, University of Leeds, Leeds, LS2 9JT, UK
Lecocq ThomasUniversité de Mons, Laboratoire de Zoologie, Place du Parc 23, B-7000 Mons, Belgium
Lundin OlaSwedish University of Agricultural Sciences, Department of Ecology, P.O. Box 7044, SE-750 07 Uppsala, Sweden
Michez Denis Université de Mons, Laboratoire de Zoologie, Place du Parc 23, B-7000 Mons, Belgium
Neumann Peter Institute of Bee Health, Vetsuisse Faculty, University of Bern, Bremgartenstr. 109a, CH-3001 Bern, Switzerland
71
72
Nieto AnaGlobal Species Programme & Key Biodiversity Areas Programme, IUCN (International Union for Conservation of Nature), 64, Boulevard Louis Schmidt, 1040 Brussels, Belgium
Penev LyubomirInstitute of Biodiversity & Ecosystem Research, Bulgarian Academy of Sciences and Pensoft Publishers, Sofia, Bulgaria
Potts Simon Centre for Agri-Environmental Research, School of Agriculture Policy and Development, Reading University, Reading, RG6 6AR, UK
Rasmont PierreUniversité de Mons, Laboratoire de Zoologie, Place du Parc 23, B-7000 Mons, Belgium
Ratamäki Outi Finnish Environment Institute, P.O. Box 140, FIN-00251 Helsinki, Finland; University of Eastern Finland, P.O. Box 111, FI-80101 Joensuu, Finland
Riedinger VerenaDepartment of Animal Ecology and Tropical Biology, Biocenter, University of Würzburg, Am Hubland, 97074 Würzburg, Germany
Roberts Stuart P. M. Swedish University of Agricultural Sciences, Department of Ecology, P.O. Box 7044, SE-750 07 Uppsala, Sweden
Rundlöf MajLund University, Department of Biology, Biodiversity, Ecology building, SE-223 62 Lund, Sweden
Scheper Jeroen Resource Ecology Group, Wageningen University & Animal Ecology Team, Alterra, PO Box 47, 6700 AA, Wageningen, The Netherlands
Schweiger OliverDepartment of Community Ecology, Helmholtz Centre for Environmental Research GmbH - UFZ, Theodor-Lieser-Strasse 4, 06120 Halle, Germany
Sørensen PeterInstitute of Bioscience, Faculty of Science and Technology, Aarhus University, Vejlsovej 25, 8600 Silkeborg, Denmark
Steffan-Dewenter IngolfDepartment of Animal Ecology and Tropical Biology, Biocenter, University of Würzburg, Am Hubland, 97074 Würzburg, Germany
Stoev PavelNational Museum of Natural History and Pensoft Publishers, Sofia, Bulgaria
Vandewoestijne Sofie European Commission, DG Research & Innovation, I3, CDMA 03/081, 1049 Brussels/Belgium
Vilà MontserratEstación Biológica de Doñana (EBD-CSIC), Avd. Américo Vespucio s/n, Isla de la Cartuja, 41092 Sevilla, Spain
72
This booklet summarises the key findings from the European Commission’s Framework 7 project ‘Status and Trends of European Pollinators’ (STEP) as a series of short case studies. Each case study presents a summary of the main scientific findings followed by a short description of its relevance to policy. Chapters 1 and 2 deal respectively with: the current status and trends of European pollinators and insect-pollinated plants, and the drivers of change. Chapter 3 provides new insights on the resulting societal impacts of the shifts of pollinators and pollination services. Mitigation responses to loss of pollinators and services are explored in Chapter 4, while Chapter 5 looks at how evidence from the STEP project, and elsewhere, can be used to better inform policy making. The booklet is aimed at a wide range of readers – policy-makers, researchers, land managers, beekeepers, farmers, veterinarians, school-teachers and the wider public.