Trends in insect catch at historic properties
7
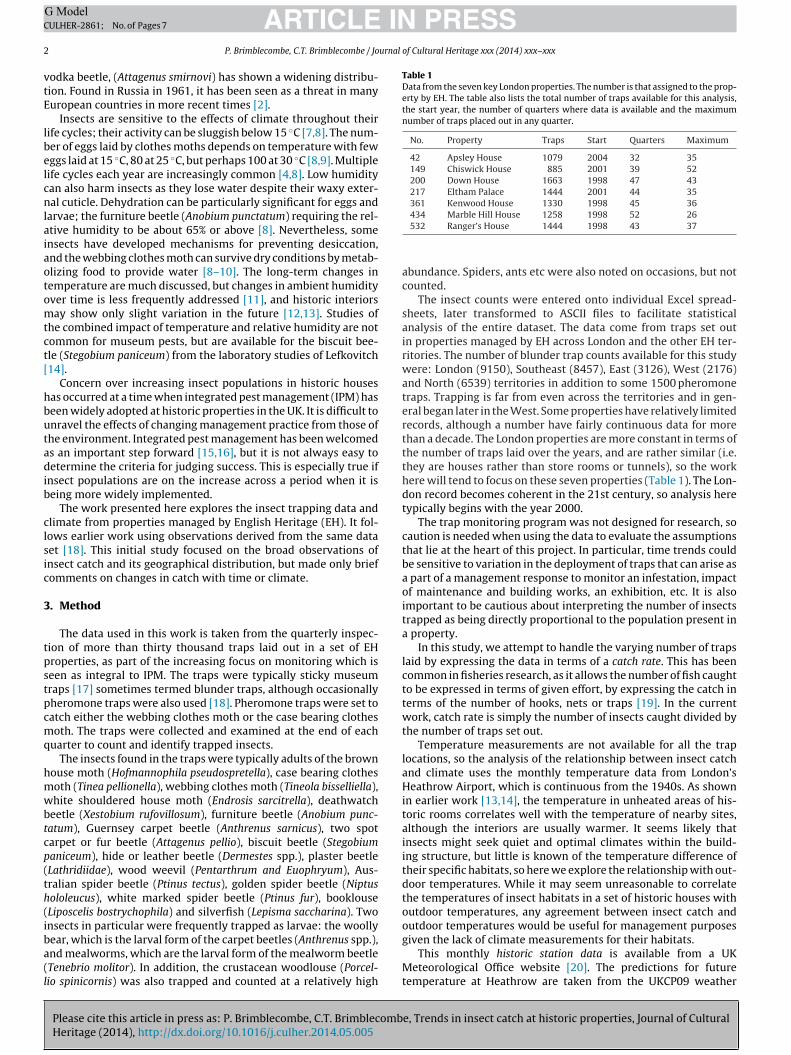
Please cite this article in press as: P. Brimblecombe, C.T. Brimblecombe, Trends in insect catch at historic properties, Journal of Cultural Heritage (2014), http://dx.doi.org/10.1016/j.culher.2014.05.005 ARTICLE IN PRESS G Model CULHER-2861; No. of Pages 7 Journal of Cultural Heritage xxx (2014) xxx–xxx Available online at ScienceDirect www.sciencedirect.com Original article Trends in insect catch at historic properties Peter Brimblecombe a,∗ , Caroline Truth Brimblecombe b a School of Energy and Environment, City University of Hong Kong, Kowloon, Hong Kong b Write! Consultancy, 49, St Benedict’s street, Norwich NR2 4PG, UK a r t i c l e i n f o Article history: Received 15 October 2013 Accepted 12 May 2014 Available online xxx Keywords: Arthropods Blunder traps Catch rate Climate change English Heritage stock Pheromone traps Integrated pest management a b s t r a c t Warmer climate has the potential to increase the number of insect pests in historic properties. This pos- sibility has been explored using the catch from some thirty thousand insect traps laid out in English Heritage properties over more than a decade. The trapping programme resulted from an increasing focus on integrated pest management (IPM). Trapping has been more frequent in London and the Southeast. Quarterly inspection and replacement has led to a detailed record of catch. Although these data were col- lected for management purposes, they offer the potential to assess the impact of environmental change. Variation in the number of traps placed out requires data to be expressed as catch rate (insects caught per trap). The record suggests an increase in the average catch of booklice (Liposcelis bostrychophila) summed across all the properties examined over the period 2000–2012. There was a striking increase in the prevalence of the webbing clothes moth (Tinea pellionella) even when accounting for the increasing use of attractant pheromones in traps. In addition, infestations (i.e. > 10 insects per trap) also seemed to increase. However, these increases over time are not likely to be attributable to increasing temperatures. Nevertheless, the catch rate for woolly bear larvae (Anthrenus spp.) at the London properties showed a weak correlation with temperature in the warmer seasons. If temperature were to increase across the 21st century, a dramatic increase in catch rate would be expected. However, it is hardly likely as the abundance of insects is not driven by temperature alone. Other factors such as: food, habitat, access points, housekeeping and indoor climate can all have an impact on insect numbers and on infestations within a property. © 2014 Elsevier Masson SAS. All rights reserved. 1. Research aims The aim of the research was to evaluate trends in insect catch in historic properties, and the impact of climate and environmental change on insect numbers. The study made use of insect trapping data collected over a period of more than ten years in properties managed by English Heritage. It follows earlier work using obser- vations derived from the same data set, and which focused on broad observations of insect catch and its geographical distribu- tion. In the current study, data was assessed against temperature records to determine correlation with temperature, and against expected future temperatures to predict changes in insect numbers. The results can be used to help guide pest management policies in historic properties. ∗ Corresponding author. Tel.: +852 3442 4676; fax: +852 3442 0688. E-mail addresses: [email protected] (P. Brimblecombe), [email protected] (C.T. Brimblecombe). 2. Introduction Climate change may alter the distribution of insects. This has the potential for example to alter the prevalence of mosquitoes, and thus affect the distribution of malaria [1]. It can also be relevant to the management of historic properties [2,3] as there is much con- cern about increasing insect populations in historic houses [4,5]; insects attack the structure of wooden buildings, furniture, and textiles. As early as classical times, there was discussion of the damage to clothes by moths and the potential solutions to this nuisance. Although there have been a number of recent studies of the role climate change, in particular how increasing temperatures might affect the number of insects in the heritage environment, these have been theoretical studies [3] or based on a small number of obser- vations [2]. Support for the idea of an increasing threat comes from observations of the move of more temperature-sensitive species northward. An example of this has been the discovery of barkfly (Atlantopsocus adustus) characteristic of Madeira and the Canary Islands, in Cornwall [6]. In the heritage context, brown carpet or http://dx.doi.org/10.1016/j.culher.2014.05.005 1296-2074/© 2014 Elsevier Masson SAS. All rights reserved.
-
Upload
independent -
Category
Documents
-
view
1 -
download
0
Transcript of Trends in insect catch at historic properties
C
O
T
Pa
b
ARAA
KABCCEPI
1
hcdmvbtreTh
(
1
ARTICLE IN PRESSG ModelULHER-2861; No. of Pages 7
Journal of Cultural Heritage xxx (2014) xxx–xxx
Available online at
ScienceDirectwww.sciencedirect.com
riginal article
rends in insect catch at historic properties
eter Brimblecombea,∗, Caroline Truth Brimblecombeb
School of Energy and Environment, City University of Hong Kong, Kowloon, Hong KongWrite! Consultancy, 49, St Benedict’s street, Norwich NR2 4PG, UK
a r t i c l e i n f o
rticle history:eceived 15 October 2013ccepted 12 May 2014vailable online xxx
eywords:rthropodslunder trapsatch ratelimate changenglish Heritage stockheromone trapsntegrated pest management
a b s t r a c t
Warmer climate has the potential to increase the number of insect pests in historic properties. This pos-sibility has been explored using the catch from some thirty thousand insect traps laid out in EnglishHeritage properties over more than a decade. The trapping programme resulted from an increasing focuson integrated pest management (IPM). Trapping has been more frequent in London and the Southeast.Quarterly inspection and replacement has led to a detailed record of catch. Although these data were col-lected for management purposes, they offer the potential to assess the impact of environmental change.Variation in the number of traps placed out requires data to be expressed as catch rate (insects caughtper trap). The record suggests an increase in the average catch of booklice (Liposcelis bostrychophila)summed across all the properties examined over the period 2000–2012. There was a striking increase inthe prevalence of the webbing clothes moth (Tinea pellionella) even when accounting for the increasinguse of attractant pheromones in traps. In addition, infestations (i.e. > 10 insects per trap) also seemed toincrease. However, these increases over time are not likely to be attributable to increasing temperatures.Nevertheless, the catch rate for woolly bear larvae (Anthrenus spp.) at the London properties showed a
weak correlation with temperature in the warmer seasons. If temperature were to increase across the21st century, a dramatic increase in catch rate would be expected. However, it is hardly likely as theabundance of insects is not driven by temperature alone. Other factors such as: food, habitat, accesspoints, housekeeping and indoor climate can all have an impact on insect numbers and on infestationswithin a property.© 2014 Elsevier Masson SAS. All rights reserved.
. Research aims
The aim of the research was to evaluate trends in insect catch inistoric properties, and the impact of climate and environmentalhange on insect numbers. The study made use of insect trappingata collected over a period of more than ten years in propertiesanaged by English Heritage. It follows earlier work using obser-
ations derived from the same data set, and which focused onroad observations of insect catch and its geographical distribu-ion. In the current study, data was assessed against temperatureecords to determine correlation with temperature, and againstxpected future temperatures to predict changes in insect numbers.
Please cite this article in press as: P. Brimblecombe, C.T. BrimblecombHeritage (2014), http://dx.doi.org/10.1016/j.culher.2014.05.005
he results can be used to help guide pest management policies inistoric properties.
∗ Corresponding author. Tel.: +852 3442 4676; fax: +852 3442 0688.E-mail addresses: [email protected] (P. Brimblecombe), [email protected]
C.T. Brimblecombe).
http://dx.doi.org/10.1016/j.culher.2014.05.005296-2074/© 2014 Elsevier Masson SAS. All rights reserved.
2. Introduction
Climate change may alter the distribution of insects. This has thepotential for example to alter the prevalence of mosquitoes, andthus affect the distribution of malaria [1]. It can also be relevant tothe management of historic properties [2,3] as there is much con-cern about increasing insect populations in historic houses [4,5];insects attack the structure of wooden buildings, furniture, andtextiles. As early as classical times, there was discussion of thedamage to clothes by moths and the potential solutions to thisnuisance.
Although there have been a number of recent studies of the roleclimate change, in particular how increasing temperatures mightaffect the number of insects in the heritage environment, these havebeen theoretical studies [3] or based on a small number of obser-vations [2]. Support for the idea of an increasing threat comes from
e, Trends in insect catch at historic properties, Journal of Cultural
observations of the move of more temperature-sensitive speciesnorthward. An example of this has been the discovery of barkfly(Atlantopsocus adustus) characteristic of Madeira and the CanaryIslands, in Cornwall [6]. In the heritage context, brown carpet or
IN PRESSG ModelC
2 urnal of Cultural Heritage xxx (2014) xxx–xxx
vtE
lbelcnlaiaotomtct[
hbutadib
clsic
3
tpstpcmq
hmwbtcp(th(iba(l
Table 1Data from the seven key London properties. The number is that assigned to the prop-erty by EH. The table also lists the total number of traps available for this analysis,the start year, the number of quarters where data is available and the maximumnumber of traps placed out in any quarter.
No. Property Traps Start Quarters Maximum
42 Apsley House 1079 2004 32 35149 Chiswick House 885 2001 39 52200 Down House 1663 1998 47 43217 Eltham Palace 1444 2001 44 35361 Kenwood House 1330 1998 45 36
ARTICLEULHER-2861; No. of Pages 7
P. Brimblecombe, C.T. Brimblecombe / Jo
odka beetle, (Attagenus smirnovi) has shown a widening distribu-ion. Found in Russia in 1961, it has been seen as a threat in manyuropean countries in more recent times [2].
Insects are sensitive to the effects of climate throughout theirife cycles; their activity can be sluggish below 15 ◦C [7,8]. The num-er of eggs laid by clothes moths depends on temperature with fewggs laid at 15 ◦C, 80 at 25 ◦C, but perhaps 100 at 30 ◦C [8,9]. Multipleife cycles each year are increasingly common [4,8]. Low humidityan also harm insects as they lose water despite their waxy exter-al cuticle. Dehydration can be particularly significant for eggs and
arvae; the furniture beetle (Anobium punctatum) requiring the rel-tive humidity to be about 65% or above [8]. Nevertheless, somensects have developed mechanisms for preventing desiccation,nd the webbing clothes moth can survive dry conditions by metab-lizing food to provide water [8–10]. The long-term changes inemperature are much discussed, but changes in ambient humidityver time is less frequently addressed [11], and historic interiorsay show only slight variation in the future [12,13]. Studies of
he combined impact of temperature and relative humidity are notommon for museum pests, but are available for the biscuit bee-le (Stegobium paniceum) from the laboratory studies of Lefkovitch14].
Concern over increasing insect populations in historic housesas occurred at a time when integrated pest management (IPM) haseen widely adopted at historic properties in the UK. It is difficult tonravel the effects of changing management practice from those ofhe environment. Integrated pest management has been welcomeds an important step forward [15,16], but it is not always easy toetermine the criteria for judging success. This is especially true if
nsect populations are on the increase across a period when it iseing more widely implemented.
The work presented here explores the insect trapping data andlimate from properties managed by English Heritage (EH). It fol-ows earlier work using observations derived from the same dataet [18]. This initial study focused on the broad observations ofnsect catch and its geographical distribution, but made only briefomments on changes in catch with time or climate.
. Method
The data used in this work is taken from the quarterly inspec-ion of more than thirty thousand traps laid out in a set of EHroperties, as part of the increasing focus on monitoring which iseen as integral to IPM. The traps were typically sticky museumraps [17] sometimes termed blunder traps, although occasionallyheromone traps were also used [18]. Pheromone traps were set toatch either the webbing clothes moth or the case bearing clothesoth. The traps were collected and examined at the end of each
uarter to count and identify trapped insects.The insects found in the traps were typically adults of the brown
ouse moth (Hofmannophila pseudospretella), case bearing clothesoth (Tinea pellionella), webbing clothes moth (Tineola bisselliella),hite shouldered house moth (Endrosis sarcitrella), deathwatch
eetle (Xestobium rufovillosum), furniture beetle (Anobium punc-atum), Guernsey carpet beetle (Anthrenus sarnicus), two spotarpet or fur beetle (Attagenus pellio), biscuit beetle (Stegobiumaniceum), hide or leather beetle (Dermestes spp.), plaster beetleLathridiidae), wood weevil (Pentarthrum and Euophryum), Aus-ralian spider beetle (Ptinus tectus), golden spider beetle (Niptusololeucus), white marked spider beetle (Ptinus fur), booklouseLiposcelis bostrychophila) and silverfish (Lepisma saccharina). Twonsects in particular were frequently trapped as larvae: the woolly
Please cite this article in press as: P. Brimblecombe, C.T. BrimblecombHeritage (2014), http://dx.doi.org/10.1016/j.culher.2014.05.005
ear, which is the larval form of the carpet beetles (Anthrenus spp.),nd mealworms, which are the larval form of the mealworm beetleTenebrio molitor). In addition, the crustacean woodlouse (Porcel-io spinicornis) was also trapped and counted at a relatively high
434 Marble Hill House 1258 1998 52 26532 Ranger’s House 1444 1998 43 37
abundance. Spiders, ants etc were also noted on occasions, but notcounted.
The insect counts were entered onto individual Excel spread-sheets, later transformed to ASCII files to facilitate statisticalanalysis of the entire dataset. The data come from traps set outin properties managed by EH across London and the other EH ter-ritories. The number of blunder trap counts available for this studywere: London (9150), Southeast (8457), East (3126), West (2176)and North (6539) territories in addition to some 1500 pheromonetraps. Trapping is far from even across the territories and in gen-eral began later in the West. Some properties have relatively limitedrecords, although a number have fairly continuous data for morethan a decade. The London properties are more constant in terms ofthe number of traps laid over the years, and are rather similar (i.e.they are houses rather than store rooms or tunnels), so the workhere will tend to focus on these seven properties (Table 1). The Lon-don record becomes coherent in the 21st century, so analysis heretypically begins with the year 2000.
The trap monitoring program was not designed for research, socaution is needed when using the data to evaluate the assumptionsthat lie at the heart of this project. In particular, time trends couldbe sensitive to variation in the deployment of traps that can arise asa part of a management response to monitor an infestation, impactof maintenance and building works, an exhibition, etc. It is alsoimportant to be cautious about interpreting the number of insectstrapped as being directly proportional to the population present ina property.
In this study, we attempt to handle the varying number of trapslaid by expressing the data in terms of a catch rate. This has beencommon in fisheries research, as it allows the number of fish caughtto be expressed in terms of given effort, by expressing the catch interms of the number of hooks, nets or traps [19]. In the currentwork, catch rate is simply the number of insects caught divided bythe number of traps set out.
Temperature measurements are not available for all the traplocations, so the analysis of the relationship between insect catchand climate uses the monthly temperature data from London’sHeathrow Airport, which is continuous from the 1940s. As shownin earlier work [13,14], the temperature in unheated areas of his-toric rooms correlates well with the temperature of nearby sites,although the interiors are usually warmer. It seems likely thatinsects might seek quiet and optimal climates within the build-ing structure, but little is known of the temperature difference oftheir specific habitats, so here we explore the relationship with out-door temperatures. While it may seem unreasonable to correlatethe temperatures of insect habitats in a set of historic houses withoutdoor temperatures, any agreement between insect catch andoutdoor temperatures would be useful for management purposesgiven the lack of climate measurements for their habitats.
e, Trends in insect catch at historic properties, Journal of Cultural
This monthly historic station data is available from a UKMeteorological Office website [20]. The predictions for futuretemperature at Heathrow are taken from the UKCP09 weather

ING ModelC
urnal
gardfooabo
swsabat
4
4
ttdtttt(tivatfIa(
icicd
FTpKs
ARTICLEULHER-2861; No. of Pages 7
P. Brimblecombe, C.T. Brimblecombe / Jo
enerator (discussed in more detail in [13]) and here we havedopted the scenario A1F1 as it gives the largest changes and thusepresents a type of worst case. The projections are available at aaily time resolution for thirty-year periods, and output is availableor 100 different evaluations, essentially providing 3000 estimatesf the daily weather conditions in each period. The thirty-year peri-ds used here centre on 2035, 2045, 2055, 2065, 2075, and 2085 inddition to a baseline period centred on 1975. Daily temperature foroth the observed data and projections was calculated as the meanf maximum and minimum daily temperatures in the records.
As shown in an earlier study [18], insect catch tends to be highlykewed, yet clustered rather than randomly distributed. This alongith the small numbers of insects found in traps can make clas-
ical approaches to statistical analysis problematic, as they oftenssume a normal distribution. Here, correlation and trends haveeen determined as the Kendall Tau rank correlation coefficient (�)long with its two-sided P-value as an estimate of significance usinghe online Wessa.net web-enabled application [21].
. Results
.1. Changes over time
As the traps were laid as part of an IPM program, it is impor-ant to consider the possibility that changes observed might behe result of the number of traps placed out (Fig. 1a) or arise fromifferent decisions regarding the distribution of traps in proper-ies or territories. There is a general view that insects such ashe webbing clothes moth have been on the increase in proper-ies, e.g. [4,5]. A variety of reasons have been offered to explainhese changes such as warmer winters, wider use of natural fibresincluding wool insulation material), decreased use of potent insec-icides such as DDVP/dichlorvos/Vapona [4] and the possibility thatnsects may increasingly exploit organic debris in dead spaces andoids of buildings. In an earlier study [18] of the EH trap data, itppeared that the average catch of booklice across all the proper-ies increased over the period 2000–2012 (� = 0.64, P = 0.003), whileor the frequently trapped woolly bear larvae this was not apparent.f anything there were hints of a decreased catch rate for the larvaeveraged across all sites, although the decrease had low significance� = −0.21, P = 0.36).
Fig. 1b shows the trend in the total catch rate of identifiednsects for the entire data set and suggests an increase in the
Please cite this article in press as: P. Brimblecombe, C.T. BrimblecombHeritage (2014), http://dx.doi.org/10.1016/j.culher.2014.05.005
atch rate (� = 0.36, P = 0.1). This occurs against a background ofncrease in the number of traps placed out, but of course theatch rate corrects for the increased effort. Fig. 1c shows that sameata for London with hints of a negative trend (� = −0.31, P = 0.16),
ig. 1. (a) The number of traps placed out across all the EH territories. (b) The total catchhe line gives running mean of the Heathrow temperature for the previous four quartersroperties. (e) The average number of different species caught in an individual traps at thenwood House (open squares) and Eltham Palace (black diamonds). (g) The total catchquares) from all territories. (h) The total catch rate for the booklice (black diamonds) and
PRESSof Cultural Heritage xxx (2014) xxx–xxx 3
especially if the value at the year 2000 is removed (� = −0.52,P = 0.02), which may have biased the result, as relatively few trapswere placed out that year. There is no clear trend in annual tem-perature at Heathrow when plotted as a quarterly running meanacross this period (line in Fig. 1c). Thus, temperature is not an obvi-ous explanation for any change. The negative trend in insect catchis supported by the percentage of traps that have captured one ormore insects (Fig. 1d; � = −0.56, P = 0.009) and the average num-ber of different species caught in an individual trap (see Fig. 1e;� = −0.54, P = 0.01). An earlier analysis suggested that the Londondata from individual properties were poorly correlated [18] andthis is illustrated by the example in Fig. 1f, where we see no cor-relation (� = −0.05) between the trends for the total insect catch attwo London properties, Kenwood House and Eltham Palace.
Fig. 1g and h explore the changes over time for some individ-ual insects across all territories. There appears to be little changein catch rate for the varied carpet beetles across just over a decade(� = −0.28, P = 0.20) although there might be a slight decrease inwoolly bear larvae (� = −0.38, P = 0.08). The total catch rate for thebooklice (black diamonds) increases over time as seen in the pos-itive Kendall � correlation coefficient (� = 0.64, P = 0.003), but thisis hardly surprising, as they are such a substantial fraction of thetotal the catch rate as shown in Fig. 1b. Silverfish (open squaresFig. 1h) show a slight negative correlation (� = −0.28, P = 0.20) overthe period summed from all territories.
There has been an enormous increase in the prevalence ofthe webbing clothes moth over the last decade [22]. Historically,clothes moths were a frequent problem at great houses in Englandwhere natural insecticides were often mixed to special recipes [3].At the beginning of the 21st century, the webbing clothes mothwas absent or found only in small numbers in the major museumsof London [4]. The larvae of this insect are extremely small (0.5 mm)and eat fabric, leaving holes, spin silk, and excrete a gritty, pelletedfrass. They are thus able to damage and disfigure historic objects[22]. An analysis of data from non-pheromone traps at HamptonCourt Palace [4] showed that while no moths were collected in2002, almost a hundred were trapped by 2010. Xavier-Rowe andLauder [5] have drawn attention to a similar very rapid increase inthe catch of the webbing clothes moth at EH properties. However,the EH data can be difficult to interpret, as it is not easy to disentan-gle the increases in the total catch from changes in the number oftraps, and a widening use of traps that have a pheromone presentas an attractant (therefore catching more insects).
e, Trends in insect catch at historic properties, Journal of Cultural
Fig. 2 examines the trapping data for the webbing clothesmoth. In 2004, just 30 pheromone traps were distributed, whilethis has risen to almost 250 in the current decade. Thus, the rawdata of total number of moths trapped (Fig. 2a) is biased, but has
rate for insects from all territories. (c) Total catch rate for the London properties.. (d) The percentage of traps that have captured one or more insects at the Londone London properties. (f) Trends for the total insect catch at two London properties
rate for the varied carpet beetles (black diamonds) and woolly bear larvae (open silverfish (open squares) from all territories.
ARTICLE IN PRESSG ModelCULHER-2861; No. of Pages 7
4 P. Brimblecombe, C.T. Brimblecombe / Journal of Cultural Heritage xxx (2014) xxx–xxx
Fig. 2. (a) The annual catch of webbing clothes moths caught in all the territories. (b)Annual catch rate for webbing clothes moths caught in pheromone traps from all theterritories. (c) Annual catch rate for webbing clothes moths caught in pheromonetraps in London (open diamonds), Marble Hill House (black triangles) and KenwoodHouse (black diamonds). (d) Annual catch rate for webbing clothes moths caught inblunder traps in London (open diamonds), Eltham Palace (black dots), Marble HillHouse (black triangles) and Kenwood House (black diamonds). Inset: annual catchrtK
noboobmse
m((fobn(crtif
aHNtNhPbtit
4
t
ate for webbing clothes moths caught in blunder traps (Cb) plotted as a function ofhe annual catch rate for webbing clothes moths caught in pheromone traps (Cp) forenwood House.
evertheless served to raise awareness among property managersf the problem. As with the previous analysis, this difficulty cane removed by expressing the catch in terms of catch rate tovercome changes in the number of traps put out. Additionally, thebservation from the pheromone traps and the blunder traps cane treated separately. The annual catch rate for webbing clothesoths from the pheromone traps from all the territories (Fig. 2b)
uggests that even when the data is treated in this way there isvidence of an increasing catch rate (� = 0.67, P = 0.016).
The catch rate for all London properties is shown as open dia-onds in Fig. 2c. This suggests that there is an overall increase
� = 0.67, P = 0.016). Two individual properties, Marble Hill Houseblack triangles) and Kenwood House (black diamonds) had catchesrom a hundred or more pheromone traps, so these are also plottedn Fig. 2c. The catch is much higher at Kenwood House and may welle increasing (� = 0.62, P = 0.07), while at Marble Hill House there iso evidence of an increase, and if anything it may have decreased� = −0.31, P = 0.29). This suggests that individual properties canhange in different ways over time. The overall increase in catchate in London might be somewhat of an illusion, as this is essen-ially driven by the very large increases at Kenwood House, whichs on Hampstead Heath. If we look at all the London data except thator Kenwood House, the positive trend is weaker (� = 0.33, P = 0.25).
Fig. 2d shows the catch rate for blunder traps in London andt some individual properties: Eltham Palace (black dots), Marbleill House (black triangles) and Kenwood House (black diamonds).aturally, this rate is very much lower than that in the pheromone
raps. The trend over time is much less apparent in these traps.evertheless, at Kenwood House where the catch rate is ratherigh, there is a reasonable and not unexpected correlation (� = 0.62,
= 0.07) between the catch rates in the pheromone traps, Cp and thelunder traps, Cb (inset to Fig. 2d). This would suggest that wherehe moth catch is reasonably high the attraction of the pheromones not such that it prevents insects from stumbling into the blunderraps.
Please cite this article in press as: P. Brimblecombe, C.T. BrimblecombHeritage (2014), http://dx.doi.org/10.1016/j.culher.2014.05.005
.2. Changing infestation
In an earlier study [18] of the EH data set, there was evidencehat insects were not randomly distributed among the traps (i.e.
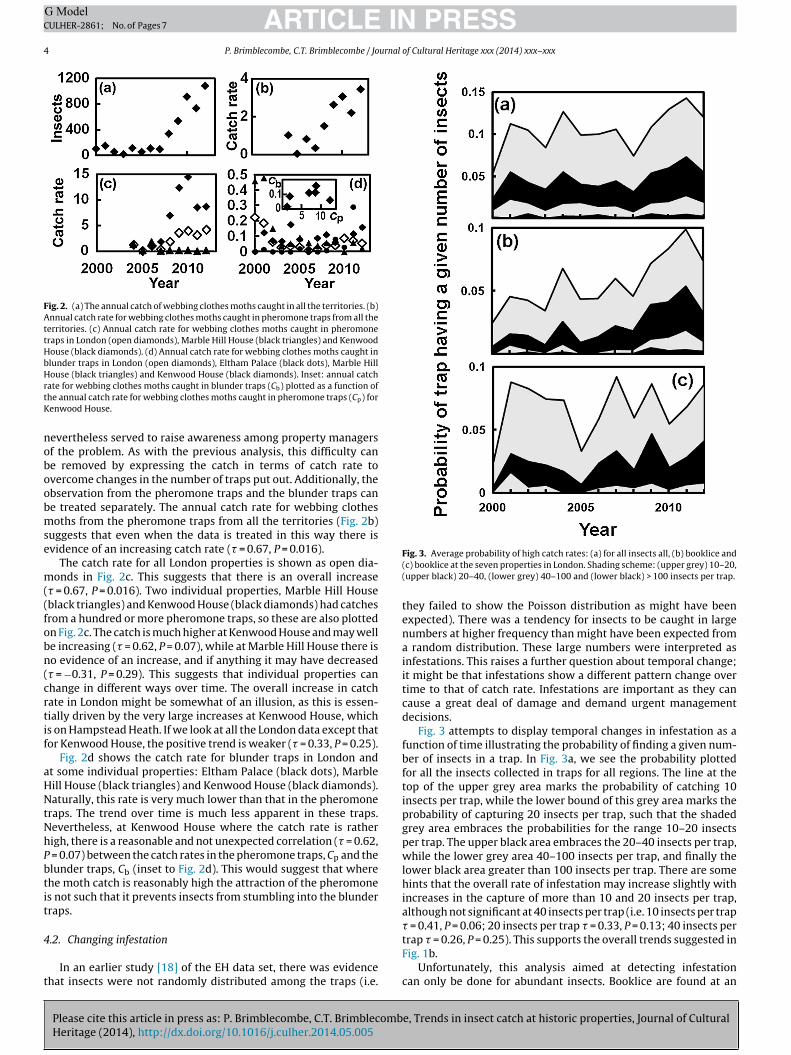
Fig. 3. Average probability of high catch rates: (a) for all insects all, (b) booklice and(c) booklice at the seven properties in London. Shading scheme: (upper grey) 10–20,(upper black) 20–40, (lower grey) 40–100 and (lower black) > 100 insects per trap.
they failed to show the Poisson distribution as might have beenexpected). There was a tendency for insects to be caught in largenumbers at higher frequency than might have been expected froma random distribution. These large numbers were interpreted asinfestations. This raises a further question about temporal change;it might be that infestations show a different pattern change overtime to that of catch rate. Infestations are important as they cancause a great deal of damage and demand urgent managementdecisions.
Fig. 3 attempts to display temporal changes in infestation as afunction of time illustrating the probability of finding a given num-ber of insects in a trap. In Fig. 3a, we see the probability plottedfor all the insects collected in traps for all regions. The line at thetop of the upper grey area marks the probability of catching 10insects per trap, while the lower bound of this grey area marks theprobability of capturing 20 insects per trap, such that the shadedgrey area embraces the probabilities for the range 10–20 insectsper trap. The upper black area embraces the 20–40 insects per trap,while the lower grey area 40–100 insects per trap, and finally thelower black area greater than 100 insects per trap. There are somehints that the overall rate of infestation may increase slightly withincreases in the capture of more than 10 and 20 insects per trap,although not significant at 40 insects per trap (i.e. 10 insects per trap� = 0.41, P = 0.06; 20 insects per trap � = 0.33, P = 0.13; 40 insects per
e, Trends in insect catch at historic properties, Journal of Cultural
trap � = 0.26, P = 0.25). This supports the overall trends suggested inFig. 1b.
Unfortunately, this analysis aimed at detecting infestationcan only be done for abundant insects. Booklice are found at an

ING ModelC
urnal
absitPtettot
idtiipnogm
4
tepsutvr
tdcesdamft
Fpa(q
ARTICLEULHER-2861; No. of Pages 7
P. Brimblecombe, C.T. Brimblecombe / Jo
verage catch rate over all the EH territories, so the analysis haseen repeated for this insect (Fig. 3b), which reveals a ratherimilar pattern to that of the total catch, suggesting an increasednfestation over time. In fact focussing on a single insect makeshe trends more significant (i.e. 10 booklice per trap � = 0.69,
= 0.001; 20 booklice per trap � = 0.62, P = 0.004; 40 booklice perrap � = 0.51, P = 0.02). This similarity with the results of Fig. 3a isxpected, as booklice so dominate the overall catch. Fig. 3c showshe probability of booklice infestation as detected in the traps fromhe seven London properties, but here there is little clear indicationf a trend (i.e. 10 insects per trap � = 0.03, P = 0.95; 20 insects perrap � = 0.31, P = 0.16; 40 insects per trap � = 0.27, P = 0.22).
The increase in the total catch of insects over time (Fig. 1b), thencreasing catch of booklice summed across all territories (blackiamonds Fig. 1h) in addition to the greater prevalence for infesta-ion (Fig. 3a and b) is a persistent indication of an increase of thisnsect. It may partially explain the general impression among thosenvolved in pest management at historic properties that insectests are increasing. However, we must always consider an alter-ative, though unlikely explanation, that changes are an outcomef the monitoring set up under integrated pest management pro-rammes; these may have become effective at targeting the roomsost liable to infestation.
.3. Changes with temperature
There has been considerable interest in the potential for insectso increase under warmer climates, but it can be difficult tostablish using trapping data. It is likely that higher summer tem-eratures may make the adults and larvae more active, but asuggested earlier catch does not necessarily relate to the insect pop-lation within a property. It is possible that in early spring whenhe larvae are feeding, higher temperatures may be especially rele-ant to the damage they cause. Nevertheless, this study has had toestrict itself to analysing catch rather than any resultant damage.
Although there are hints of increases in insect catch over time,his cannot be interpreted as an effect of climate as there is noistinct change in temperature over the period (Fig. 1c). The loworrelations established in the previous sections have made it nec-ssary to look more thoughtfully at the data to separate any climateignal from interference due to issues such as trap number andistribution. The temperature effect was explored by limiting the
Please cite this article in press as: P. Brimblecombe, C.T. BrimblecombHeritage (2014), http://dx.doi.org/10.1016/j.culher.2014.05.005
nalysis to the London region and looking only at the warmeronths of the year, trying to split these in ways that accounted
or the trapping of insects. Fig. 4a shows the relationship betweenhe catch rate for woolly bear larvae at the London properties
ig. 4. Average catch rate at the London properties. (a) Catch rate for woolly bear larvae ieriod. (b) Catch rate for woolly bear larvae in quarters 2 and 3 as a function of the averagend 3 as a function of the average temperature May–August. (d) Catch rate for brown houe) Catch rate for plaster beetles in quarters 2 and 3 as a function of the average tempeuarters 2 and 3 as a function of the average temperature for the same period.
PRESSof Cultural Heritage xxx (2014) xxx–xxx 5
and the temperature for the summer months July–September.There seems to be a significant positive relationship between theJuly–September catch rate and temperature (� = 0.36, P = 0.1). Thisimproves if the single outlier at very high temperature is removed(� = 0.42, P = 0.06). Fig. 4b shows the relationship between the catchrate over warmer months (quarters 2 and 3, i.e. April–September)and temperature over the same period. Here, the relationship iseven stronger (� = 0.62, P = 0.004) as we have doubled the numberof trap samples available, although necessarily weakened the dis-criminating power of temperature, because it is averaged over sucha long period. Fig. 4c shows the slightly weaker yet positive relation-ship (� = 0.37, P = 0.09) between the average summer catch rate forwoolly bear larvae at all seven London properties, but here correlat-ing catch with temperature from just the four months May–August,which seemed likely to make a noticeable contribution to the catch.Another measure would be accumulated degree-days [3] above atemperature where insects are active (perhaps 15 ◦C), but this gavea very similar picture to that for the other measures of temperatureadopted in Fig. 4a–c.
The relationship shown for woolly bear larvae in Fig. 4c isrepeated for brown house moths in Fig. 4d, and this again showsa positive relationship with May–August temperature (� = 0.35,P = 0.11) and it is better than the relationship between theApril–September catch rate and the temperature for the sameperiod (� = 0.28, P = 0.20). The same relationship is shown for theplaster beetle in Fig. 4e and here, although it is positive, it is notespecially strong (� = 0.25, P = 0.27). It is not improved by plottingquarter 3 catch rate against temperature for the same period or forall the warm months (respectively � = 0.21, � = 0.23), although nei-ther of these alternative relationships are shown in the figure. Thebooklice, silverfish and woodlice by contrast show almost no cor-relation (or a negative one in the case of woodlice) when the catchrate for all the warm months is plotted, as in Fig. 4f–h, against tem-perature over the same period (respectively � = 0.13, 0.0, −0.21).
As correlations would be less significant where the number ofinsects trapped is small, it was difficult to examine changes at indi-vidual London properties. The catch rate for woolly bear larvae forsix of the seven properties in London is shown in Fig. 5; ApsleyHouse being omitted because its record was less complete. Thesegraphs explore the warm season (April–September) catch rate asa function of temperature for the same period. As expected, lowinsect catch in the individual houses means the correlations were
e, Trends in insect catch at historic properties, Journal of Cultural
much weaker than those of Fig. 4a–c. However, despite the weak-ness of these correlations with temperature it should be noted thatall are at least positive (i.e. a: Chiswick House: � = 0.44, P = 0.054; b:Down House: � = 0.24, P = 0.30; c: Eltham Palace: � = 0.24, P = 0.35; d:
n the summer (July–September) as a function of average temperature for the same temperature for the same period. (c) Catch rate for woolly bear larvae in quarters 2se moths in quarters 2 and 3 as a function of the average temperature May–August.rature May–August. Catch rate for (f) booklice, (g) silverfish, and (h) woodlice, in

ARTICLE IN PRESSG ModelCULHER-2861; No. of Pages 7
6 P. Brimblecombe, C.T. Brimblecombe / Journal of Cultural Heritage xxx (2014) xxx–xxx
Fig. 5. Average warm season (April–September) catch rate for woolly bear larvaeisH
KP
4
eqtuic
C
tctmaiwwnpup3ttwa
Fig. 6. (a) The catch of woolly bear larvae for all London properties from 2000–2011along with an exponential regression line fit to catch defined by the equation inthe text. (b) Observed and predicted median values of the warm season tempera-ture with dispersion shown as the 16- and 84-percentiles. (c) Median catch rate for
n six individual London properties as a function of average temperature across theame period. (a) Chiswick House, (b) Down House, (c) Eltham Palace, (d) Kenwoodouse, (e) Marble Hill House, (f) Ranger’s House.
enwood House: � = 0.091, P = 0.73; e: Marble Hill House: � = 0.181, = 0.45; f: Ranger’s House: � = 0.38, P = 0.12).
.4. Future change in insect catch
The correlation between temperature and catch rate is weakven for woolly bear larvae, which are trapped comparatively fre-uently. Thus, temperature seems to be only one of the parametershat explain changes in catch rate. However, given the interest innderstanding whether a changing climate might cause increases
n the insect catch in historic properties, we attempted a trial cal-ulation. An exponential regression line:
= 6 × 10⁻⁶ exp (0.7387T)
was fit to the catch of woolly bear larvae for all London proper-ies from 2000–2011 (Fig. 6a). This fit the equation with a Pearsonorrelation coefficient, r2 = 0.811, where C is the catch rate and T ishe warm season (April–September) average temperature, ◦C. The
edian value of the warm season temperature is shown in Fig. 6bs derived from data for Heathrow over the period 1950–2010. Its plotted for slightly overlapping eleven-year periods as medians
ith the dispersion shown as the 16 and 84-percentiles, whichould be roughly equivalent to a standard deviation were the dataormally distributed. The predictions of median warm season tem-erature from 2035 onwards used UKCP09 output for Heathrowsing the A1F scenario. The output was determined for thirty-yeareriods centered at 2035, 2045 through to 2085 and represents000 determinations at each point, with dispersion again shown as
Please cite this article in press as: P. Brimblecombe, C.T. BrimblecombHeritage (2014), http://dx.doi.org/10.1016/j.culher.2014.05.005
he 16 and 84-percentiles. Much as expected, we see an increase inhe temperature predicted for the coming century. The catch rateas determined from equation 1 for every year from 1950–2010
nd from the three thousand estimated for every thirty-year period
woolly bear larvae in London as estimated from using the warm season tempera-tures, with dispersion shown as the 16- and 84-percentiles. The inset enlarges theearly part of the record.
to give predictions for the median catch rate into the future (Fig. 6c).Dispersion is again shown as the 16 and 84-percentiles. The fig-ure shows a very dramatic increase in the predicted catch rate forwoolly bear larvae. This large change is hardly surprising given thatthe equation is exponential in temperature. However, such a largeincrease is very unlikely. Statistically, it is not really appropriate toextrapolate the non-linear equation beyond the region over whichit was established, but additionally there would be other reasonswhy catch rate would be unlikely to show such a large increase e.g.as food or habitable niches would not necessarily grow in parallelwith temperature. Nevertheless, the simple calculation serves toremind us that rising temperatures would provide the potential forincreased numbers of insects.
5. Conclusion
It is likely that a wide range of parameters control insectsand infestations in historic properties. This study suggests a
e, Trends in insect catch at historic properties, Journal of Cultural
fairly cautious approach to changing pest management policiesin anticipation of climate change impacts. While the number oftemperature-sensitive species might be expected to increase, it isnot easy to predict the impact in terms of infestation and damage to

ING ModelC
urnal
hiwtsi
cresopwt
ivatamurtpfhtai
deoFatticsp
A
2
[
[
[
[
[
[
[
[
[
[
[
ARTICLEULHER-2861; No. of Pages 7
P. Brimblecombe, C.T. Brimblecombe / Jo
istoric collections. Food, habitat, access points, housekeeping andndoor climate can all affect insect numbers and on infestations
ithin a property. Staffing levels, visitor numbers, the introduc-ion of food and availability of habitat, such as dark undisturbedpaces and loans between collections may be important factors tonvestigate further.
Climate change sits alongside other potential risks to historicollections. Future work needs to unravel the importance of a widerange of variables that affect insect numbers and infestations ifffective responses are to be formulated. This could entail site-pecific studies to evaluate insect catch against probable driversf insect numbers. It also seems important to examine the effect ofrevious responses to infestations, for example if an insect speciesere reduced for long periods following a specific action (such as
reatment of the infested object, deep cleaning, etc.).It would be useful to analyse one-off events such as deep clean-
ng, maintenance, changing room-use against continuous climateariables. It can be difficult to parameterise these irregular eventsnd issues such as food and niche availability, but these are likelyo be significant controls on the prevalence of insects. Addition-lly, it is important to consider how best to parameterise the pestanagement regimes within historic properties. The current study
ses data from a trapping regime, which changed over time and inesponse to local conditions, emerging risks and monitoring oppor-unities, and as such, there was no clear baseline. The diversity ofroperties to be monitored proved to be an additional complicatingactor. Even where properties were broadly similar (e.g. the Londonouses), insect numbers and infestations can vary widely. Infesta-ions can be specific to a room or set of rooms within a property,nd so a detailed study within a selected property could yield usefulnformation to guide future protocols.
Climate change can be expected to influence insect numbers andistribution, but the prevalence of insects within a historic prop-rty is not a function of climate alone. Numerous other factors aref importance, such as food, habitat, and ease of ingress for insects.ortunately, these are often more readily managed than our fluctu-ting external climate. Insect infestations are likely to be reducedhrough attention to indoor climate, inspection of collections, staffraining, thoughtful hosting of events and well-chosen housekeep-ng and maintenance regimes. These are manageable factors thatan limit infestation, so the impact of climate seems unlikely to out-trip managers’ ability to control insect pests in historic properties,rovided it is well understood.
Please cite this article in press as: P. Brimblecombe, C.T. BrimblecombHeritage (2014), http://dx.doi.org/10.1016/j.culher.2014.05.005
cknowledgements
This work forms part of the English Heritage contract NHPPC2.301-6282. It would not have been possible without the efforts
[
[
PRESSof Cultural Heritage xxx (2014) xxx–xxx 7
of staff who set the traps and recorded the results, sometimes formore than a decade. We would like to thank Dee Lauder HelenLloyd, Pascal Querner and David Thickett for much useful insight.
References
[1] V. Ermert, A.H. Fink, H. Paeth, The potential effects of climate change on malariatransmission in Africa using bias-corrected regionalised climate projectionsand a simple malaria seasonality model, Climatic Change 120 (2013) 741–754.
[2] L. Stengaard Hansen, M. Akerlund, T. Grontoft, M. Rhyl-Svendsen, A. Schmidt, J.Bergh, et al., Future pest status of an insect pest in museums, Attagenus smirnovi:distribution and food consumption in relation to climate change, J. Cultur. Herit.13 (2012) 22–27.
[3] P. Brimblecombe, P. Lankester, Long-term changes in climate and insect dam-age in historic houses, Studies Conserv. 58 (2013) 13–22.
[4] D.B. Pinniger, Ten years on – from vodka beetles to risk zones, in: P. Winsor,D. Pinniger, L. Bacon, B. Child, K. Harris, D. Lauder, et al. (Eds.), Integrated pestmanagement for collections, English Heritage, Swindon UK, 2011, pp. 1–9.
[5] A. Xavier-Rowe, D. Lauder, Ten years of integrated pest management at EnglishHeritage, in: P. Winsor, D. Pinniger, L. Bacon, B. Child, K. Harris, D. Lauder, et al.(Eds.), Integrated pest management for collections, English Heritage, SwindonUK, 2011, pp. 10–15.
[6] K.N.A. Alexander, Atlantopsocus adustus (Hagen) (Psoc.: Psocidae) new to Britainfrom East Cornwall, Entomologists Record 119 (2007) 76.
[7] D.B. Pinniger, Pest management in museums archives and historic houses,Archetype Publications Ltd, London, 2001.
[8] R.E. Child, Insect damage as a function of climate, in: T. Padfield, K. Borchersen(Eds.), Museum microclimates, National Museum of Denmark, Copenhagen,2007.
[9] P.D. Cox, D. Pinniger, Biology, behaviour and environmentally sustainable con-trol of Tineola bisselliella, J. Stored Prod. Res. 43 (2007) 2–32.
10] R. Plarre, B. Kruger-Carstensen, An attempt to reconstruct the natural andcultural history of the webbing clothes moth Tineola bisselliella Hummel (Lep-idoptera: Tineidae), J. Entomol. Acarological Res. Series II 43 (2011) 83–93.
11] P. Brimblecombe, Temporal humidity variations in the heritage climate of SouthEast England, Herit. Sci. 1 (2013) 3 (11 p.).
12] P. Lankester, P. Brimblecombe, Future thermohygrometric climate within his-toric houses, J. Cultur. Herit. 13 (2012) 1–6.
13] P. Lankester, P. Brimblecombe, The impact of future climate on historic interi-ors, Sci. Total Environ. 417 (2012) 248–254.
14] L.P. Lefkovitch, A laboratory study of Stegobium paniceum (L.) (Coleoptera:Anobiidae), J. Stored Prod. Res. 3 (1967) 235–249.
15] P. Winsor, D. Pinniger, L. Bacon, B. Child, K. Harris, D. Lauder, et al. (Eds.), Inte-grated pest management for collections, English Heritage, Swindon UK, 2011,p. viii.
16] P. Querner, S. Simon, M. Morelli, S. Fürenkranz, Insect pest management pro-grammes and results from their application in two large museum collectionsin Berlin and Vienna, Int. Biodeterior. Biodegrad. 84 (2012) 275–280.
17] R.E. Child, D.B. Pinniger, Insect trapping in museums and historic houses, Stud-ies Conserv 39 (Supp. 2) (1994) 129–131.
18] P. Brimblecombe, C. Brimblecombe, D. Thickett, D. Lauder, Statistics of insectcatch within historic properties, Herit. Sci. 1 (34) (2013).
19] D. B Stobart, R. Alvarez-Barastegui, R. Goni, Effect of habitat patchiness on thecatch rates of a Mediterranean coastal bottom long-line fishery, Fisheries Res.129–130 (2012) 110–118.
20] UKMO Historic station data Heathrow (London Airport: http://www.
e, Trends in insect catch at historic properties, Journal of Cultural
metoffice.gov.uk/pub/data/weather/uk/climate/stationdata/heathrowdata.txt)21] Wessa, Kendall � rank correlation (v1.0.11) in Free Statistics Software
(v1.1.23-r7), Office for research development and education, URL: http://www.wessa.net/rwasp kendall.wasp/Wessa.net
22] D.B. Pinniger, Clothes moths–numbers are surging, Pest Mag. (2009) 17–18.