Modeling physical and biogeochemical controls over carbon accumulation in a boreal forest soil
29
Modeling physical and biogeochemical controls over carbon accumulation in a boreal 1 forest soil 2 3 Jonathan J Carrasco 1,2 , Jason C Neff 2,* , and Jennifer W Harden 1 4 5 6 1 US Geological Survey, 345 Middlefield Rd., ms 962, Menlo Park, CA 94025. 7 [email protected] 8 9 2 Geological Sciences Department, University of Colorado, CB 399, Boulder, CO 80309. 303- 10 492-6187, [email protected] 11 * Corresponding author 12 13
-
Upload
independent -
Category
Documents
-
view
0 -
download
0
Transcript of Modeling physical and biogeochemical controls over carbon accumulation in a boreal forest soil
Modeling physical and biogeochemical controls over carbon accumulation in a boreal 1
forest soil 2
3
Jonathan J Carrasco1,2, Jason C Neff2,*, and Jennifer W Harden1 4
5
6
1 US Geological Survey, 345 Middlefield Rd., ms 962, Menlo Park, CA 94025. 7
9 2Geological Sciences Department, University of Colorado, CB 399, Boulder, CO 80309. 303-10
492-6187, [email protected] 11
*Corresponding author 12
13
2
Abstract 1
Boreal soils are important to the global C cycle due to large C stocks, repeated 2
disturbance from fire, and the potential for permafrost thaw to expose previously stable, buried 3
C. To evaluate the primary mechanisms responsible for both short and long-term C 4
accumulation in boreal soils, we developed a multi-isotope (12, 14C) soil C model with dynamic 5
soil layers that develop through time as soil organic matter burns and re-accumulates. We then 6
evaluated the mechanisms that control organic matter turnover in boreal regions including carbon 7
input rates, substrate recalcitrance, soil moisture and temperature, and the presence of historical 8
permafrost to assess the importance of these factors in boreal C accumulation. Results indicate 9
that total C accumulation is controlled by the rate of carbon input, decomposition rates and the 10
presence of historical permafrost. However, unlike more temperate ecosystems, one of the key 11
mechanisms involved in C preservation in boreal soils examined here is the cooling of 12
subsurface soil layers as soil depth increases rather than increasing recalcitrance in subsurface 13
soils. The propagation of the 14C bomb spike into soils also illustrates the importance of 14
historical permafrost and 20th century warming in contemporary boreal soil respiration fluxes. 15
Both 14C and total C simulation data also strongly suggest that boreal SOM need not be 16
recalcitrant to accumulate; the strong role of soil temperature controls on boreal C accumulation 17
at our modeling test site in Manitoba, Canada indicates that carbon in the deep organic soil 18
horizons is probably relatively labile and thus subject to perturbations that result from changing 19
climatic conditions in the future. 20
21
Keywords: black spruce, boreal, carbon, decomposition, model, soil22
3
Introduction 1
2
Poorly-drained boreal soils are rich in organic matter and play a critical role in the global 3
carbon (C) cycle due to the large accumulation of soil C via the long-term preservation of old, 4
deep C. The mechanisms responsible for accumulation of C in boreal soils include the physical 5
and chemical properties of soils and the biophysical regulation of decomposition. Within boreal 6
soils several factors are important to the control of decomposition rates; most notably, 7
temperature, substrate recalcitrance, and moisture (Hobbie et al., 2000). In addition to these 8
factors, fire also contributes to boreal soil C dynamics through combustion of organic matter and 9
production of highly recalcitrant black carbon compounds (Harden, 2000; Czimczik, 2003). 10
Understanding the influence of these factors on C stabilization in boreal soils is essential to 11
improving predictions of how boreal soil C might respond to a warming climate. 12
Soil temperature influences the rate of microbial activity in soils and therefore, regulates 13
the rate of soil organic carbon (SOC) decomposition. Indeed, decomposition in arctic and boreal 14
soils is sensitive to temperature based on both field observations (Goulden et al., 1998) and 15
laboratory incubations (Dioumaeva et al., 2002; Mikan et al., 2002; Neff and Hooper, 2002). 16
This response to soil temperature influences the seasonal dynamics of soil respiration in boreal 17
soils. Warm surface organic soils appear to be the dominant source of CO2-C released in the 18
summer, though the insulated humic organic layer and thawed mineral soil contributes as much 19
as 20% of the annual CO2-C loss during the fall through early spring (Winston et al., 1997). The 20
stability of the deeper soil C is of particular interest as climate change may increase soil 21
temperatures at depth, thereby increasing the flux of old C from the deep soil. 22
The influence of substrate quality and recalcitrance on the rate of decomposition in boreal 23
soils has been explored primarily through examination of decomposition rates for leaf litter 24
substrate from different growth forms (Flanagan and van Cleve, 1983; Hobbie, 1996) and soil 25
beneath various arctic and boreal plants (Neff and Hooper, 2002). It is evident from these 26
studies that the rate of decomposition varies considerably due to growth form, but the 27
recalcitrance of buried humic material relative to the less humified soil organic matter (SOM) in 28
the surface horizon is not known. While it is clear from radiocarbon dating that the deeper, 29
humic layers are indeed older, it is unclear why. Substrate age does not necessarily correspond 30
4
with recalcitrance if other factors such as cold temperatures or high moisture content are 1
protecting the carbon from decomposition. 2
Fire is the other critical process that we need to understand in order to predict boreal soil 3
responses to climate changes. Fire influences the C cycle through direct combustion loss of 4
biomass and surface soil organic C (Kasischke et al., 1995; Kasischke and Johnstone, 2005), 5
creation of recalcitrant black carbon (Czimczik et al,. 2003), and through the legacy of fire that 6
persists for decades following fire through changes in NPP and soil temperature (O'Neill et al., 7
2003; Bond-Lamberty et al., 2004). One of the additional effects of fire on soils is the influence 8
on soil temperature regime that occurs following combustion of the surface layer. This loss of 9
live and dead moss layers exposes previously buried soil to warmer temperatures near the 10
surface, and thus, may increase decomposition (Harden et al., submitted). As with substrate 11
recalcitrance and soil physical factors, fire is part of the mosaic of interacting controls that 12
influence contemporary boreal decomposition processes and will control future carbon dynamics 13
in these ecosystems. 14
The quantitative influence of multiple interacting controls on soil organic matter 15
decomposition is difficult to establish in field studies but is well suited to examination in a 16
simulation model environment. In this paper, we describe a new layered soil decomposition 17
model that can be used to assess the mechanisms of C accumulation in poorly-drained boreal 18
soils. We use this model and data from a well characterized, poorly drained ecosystem in 19
Manitoba, Canada to carry out an assessment of what factors influence decomposition and C 20
accumulation in this setting. We chose poorly-drained boreal soils as they represent soils 21
intermediate in decomposition and C accumulation compared to well-drained upland soils and 22
organic rich, very poorly drained ecosystems (Rapalee, 1998). The model simulates both 12C 23
and 14C isotopes in order to evaluate the formation and aging of soil C as it accumulates in the 24
soil profile. The results of this study indicate that, in contrast to many temperate ecosystems, 25
SOC accumulation depends strongly on the interaction between carbon inputs and losses 26
(controlled by carbon inputs and decomposition rate) and the thermal characteristics of the soil 27
profile. The study also suggests that boreal soils need not be highly recalcitrant to accumulate 28
large stores of carbon. Rather, historically cold conditions and cool temperatures deep in the soil 29
profile, between wildland fire events, appear to play a large role in historic carbon accumulation 30
5
rates. The potential lability of subsurface boreal soils suggests that carbon release from these 1
ecosystems could be highly sensitive to future warming trends. 2
Methods 3
Model Structure 4
The model was developed in a Matlab modeling environment and uses a series of coupled 5
ordinary differential equations (Table 1) which are solved by a Runge-Kutta 4th-order algorithm. 6
The distribution of 12C and 14C through pools and layers are solved simultaneously for each 7
isotope. The equations governing 12C and 14C are identical (Table 1) with the exception of 8
radiocarbon decay which is modeled as a loss of 14C from each discrete carbon pool at each 9
timestep based on the following equation: 10
yrCDecay
8267114 = (1) 11
Each carbon isotope is simulated as separate C pools and then calculations of ∆14C are made for 12
each time step after the simulation ends. Input of 12C or 14C to organic matter pools is based on 13
productivity as discussed below, however in the case of 14C, we simulate the time course of 14
incorporation of the atmospheric 14C spike into plants and soils from 1950 to the present. All 15
simulations were run with a monthly time step for 6500 years in order to capture the ecosystem 16
and soil development following the retreat of the Laurentide ice sheet in boreal Canada (Harden 17
et al., 1992). Many of the parameterizations given below may be appropriate in a range of boreal 18
settings. However, for our model sensitivity testing, we parameterize the model for a well 19
studied, poorly drained black spruce stand in Manitoba, Canada (see below). 20
21
Site Description 22 23
We use soils in poorly-drained boreal forests in northern Manitoba as the target for our 24
initial model testing. The soil used to evaluate our simulations is from the Northern Study Area 25
Old Black Spruce (NOBS) site of the Boreal Ecosystem and Atmosphere Study (BOREAS) 26
(Sellers et al., 1995). While about half of the area under the flux tower is underlain by 27
moderately drained soils with tall black spruce/feathermoss cover, the other half of the area is 28
mapped as more poorly drained (imperfect, poor, and very poorly drained) soils, much of which 29
is overlain by Sphagnum moss and sparse cover of black spruce (Veldhuis, 2000). This poorly 30
6
drained, Sphagnum covered soil, is the target of our study because it includes a thick mat of 1
organic soil layers that are amenable to radiocarbon dating (Trumbore and Harden, 1997) and 2
because many poorly drained soils were underlain by permafrost in the region over the past 20 3
years (Veldhuis et al, 2002). Sample OBSP9 (Trumbore et al., 1998) was collected in 1994 and 4
analyzed for bulk density, C, and radiocarbon; this profile contains 2 cm of living sphagnum 5
moss, dead moss from 4 to 30 cm, moss and dead roots from 30 to 41 cm, and humified organic 6
matter from 43 to 69 cm depth. The stand age at NOBS was approximately 120 years old at the 7
time of field data collection (Trumbore and Harden, 1997). Aboveground NPP for the NOBS 8
site is estimated to be 0.120 kg C m-2 yr-1 but ranges from 0.098 kg C m-2 yr-1 in a young jack 9
pine stand to 0.349 kg C m-2 yr-1 in an aspen stand (Gower et al., 1997). 10
11
Dynamic model layer development 12
The model simulates multiple organic soil layers and soil depth, the latter of which 13
changes through time as organic matter is consumed and re-accumulates between disturbance 14
events (fire). We do not simulate the dynamics of carbon in mineral soil horizons in this model. 15
Layers in the simulation model develop through time following fire and are tracked in the model 16
as vertically discrete SOC layers with each new layer containing the regrowing surface moss, 17
roots and the surface SOC. In the final 120 years of a simulation, soil layers are generated every 18
five years in order to create sufficient detail to evaluate the propagation of the radiocarbon 19
bomb-spike into soils. The number of model layers at the end of the run is thus equivalent to the 20
total number of fire events that occur during the simulation plus 24 additional layers created 21
during the final 120 years of the simulation. This layering structure is not intended to mimic the 22
creation of diagnostic soil horizons but rather to allow the depth of soils to change through time 23
as organic matter accumulates. The thickness of each layer is determined from a parameterized 24
relationship between soil organic matter content and bulk carbon density for multiple depths 25
within a soil profile (Figure 1). This structure is markedly different from existing soil organic 26
matter models but is able to represent the transition from low bulk C density in dead moss and 27
fibric horizons to higher bulk C density in mesic and humic horizons. This depth/carbon 28
relationship is essential to modeling of boreal soils because of strong thermal gradients from 29
surface to deep soils. Stated more directly, by converting carbon content to soil depth we are 30
7
able to simultaneously model the thermal properties and SOM pool distributions in a boreal soil 1
profile. 2
Model parameters and simulations 3
We assembled a suite of model scenarios to evaluate the performance of the model with a 4
range of parameters that included fixed (Table 2) and intentionally varied parameters (Table 3) 5
designed to examine the quantitative importance of several factors on boreal soil C storage. The 6
central focus of our model analysis included factorial combinations of two levels for the soil 7
thermal regime, fire return interval, fire severity, decomposition quotient (Q10), and soil moisture 8
regulation of decomposition. We also used three levels for net primary production and SOC pool 9
structure/turnover dynamics. Combined, these variables allow comparison of the relative 10
importance of soil thermal history, fire disturbance, the temperature and moisture sensitivity of 11
decomposition, variability in NPP and the nature of SOC pool structure and turnover. 12
The model simulations were parameterized with several static parameters used in all 13
simulations. These parameters controlled the allocation of NPP into the various biomass pools, 14
the residence time for C in each of the biomass pools and standing-dead pool, root depth 15
distribution, and the burn severity for standing live black spruce stems (Table 2). 16
The parameters that were varied were done so in a factorial design so that every level of 17
each parameter was combined with each level of the other parameters (Table 3). This was done 18
to identify the combinations of parameters that performed well with respect to the observed 19
NOBS data and those combinations that resulted in poor model-data fit. The model was 20
unconstrained allowing the simulations to accumulate as little or as much C as the model 21
parameters dictated. A total of 288 individual model runs were performed. 22
Net primary productivity 23
For our model simulations, we varied total NPP values from 0.135, 0.180, and 0.225 kg C 24
m-2 yr-1 following simulations for this site by Harden et al. 2000. The above and belowground 25
NPP pools included aboveground black spruce stem and branch C (Cs+b) and belowground root C 26
(Cr), as well as aboveground Sphagnum moss and black spruce needle C (Cm+n). The root NPP 27
and the root biomass distribution both followed a negative exponential model with depth 28
(Jackson et al., 1996). The root biomass C (Cr,z) was a single pool within each layer based on 29
layer depth z and thickness. Net primary productivity allocation was as shown in Table 2. To 30
8
reflect the low NPP during post-fire forest regrowth, we scaled all NPP values up to their 1
prescribed values over the first 50 years post-fire (O'Neill et al., 2003). 2
We parameterized C residence times for the live biomass pools to reflect the mean age of 3
C within each pool (Table 2). We used decay constants of 0.015 yr-1 for Cs+b, 0.167 yr-1 for Cm+n 4
(Schuur et al., 2003), and 0.125 yr-1 for Cr (Steele et al., 1997). After burning, stem C enters the 5
standing-dead pool (Cs-d) before entering the soil. The residence time for Cs-d is 0.094 yr-1 6
(Manies, 2005), resulting in a large input of coarse woody debris to the soil shortly after fire. 7
SOC pool structure 8
We developed three different model SOC pool structures to evaluate the influence of 9
carbon pool structure, turnover time and humification on the pattern and amount of C 10
accumulation. These three structures include two representations of organic matter 11
decomposition that assume that SOM is a homogenous slow or homogeneous fast turnover pool 12
of carbon and an additional representation that uses a multiple pool structure (Figure 2). In these 13
two structures, carbon is simulated as a single pool with uniform inherent turnover time through 14
the profile. The actual turnover time of these simulations is determined by the temperature and 15
moisture controls described below. These pool structures are described by the simple 16
designations single-pool labile (Sl) and single-pool recalcitrant (Sr). The third structure is 17
analogous to more contemporary ecosystem model structures that have fast, slow and recalcitrant 18
material (Parton, 1987, 1987). This multiple-pool structure represents increasing recalcitrance 19
with decomposition as organic matter becomes progressively humified and is designated as the 20
multiple-pool humic (Mh) C pool structure. The effect of this structure is that organic matter 21
becomes increasingly recalcitrant as it is cycles through decomposition and so therefore results 22
in increasing recalcitrance in older, deeper, more-decomposed organic matter. We do not 23
include an explicit black carbon (BC) pool in this model because the fraction of soil contained in 24
black carbon tends to be very small (<1%) (Czimczik et al., 2003) and because there is currently 25
not enough information to parameterize the turnover of this pool with much confidence. We did 26
however evaluate the potential impact of highly recalcitrant black carbon produced at low rates 27
during fires in an earlier version of this model and found that neither total carbon nor 14C profiles 28
were sensitive to the inclusion of BC in the model (data not shown). This is a research area 29
where further modeling is certainly warranted as more information becomes available. 30
9
We parameterized our three organic matter structures based on field and laboratory 1
studies as described below. The recalcitrant single SOC pool structure had a k = 0.018 yr-1 at 2
5ºC. This was based on the determination of field based turnover time for the surface soil at the 3
Northern Old Black Spruce (NOBS) site in Manitoba (Trumbore and Harden, 1997). This field-4
based turnover time implicitly includes both environmental and substrate level controls on 5
decomposition in the surface soil layer, including any level of recalcitrance whether chemical or 6
physical. This parameter set is hereon referred to as single-recalcitrant (Sr). To evaluate a faster 7
single pool model, we increased the field-based decay constant by 50% to k = 0.027 yr-1 at 5ºC to 8
account for the field temperature and moisture regulation (single-labile, Sl). The multiple pool 9
SOC structure was based on the results of a laboratory incubation using respired ∆ 14C-CO2 and 10
the ∆ 14C of C pools in the NOBS soil (Dioumaeva et al., 2002). Normalized k values at 5°C for 11
these pools were: fine k = 0.107 yr-1, coarse k = 0.037 yr-1 and humic k = 0.023 yr-1. 12
Carbon from the moss and needle litter, along with the fine root fraction of Cr enters 13
either the single C pool or the fine fraction C pool (Cf) upon senescence. Woody biomass, 14
including standing-dead C and the coarse fraction of root C, flows to either the single C pool or 15
to a coarse fraction pool (Cc). As these pools decompose, carbon flows to a separate humic C 16
pool (Ch) in the multiple-pool set or is recycled into the single C pool in the recalcitrant and 17
labile single pool sets. Carbon loss (CO2-C) resulting from microbial growth efficiencies during 18
turnover is prescribed at 50% following Parton et al. (1987). 19
Soil thermal regime and Q10 20
Soil temperature profiles in the model are based on data collected during 1994-1996 at 21
depths of 5-100 cm in the Old Black Spruce site at the BOREAS Northern Study Area (Sutton, 22
1998). We reduced the dataset to a record of average monthly soil temperatures by depth for this 23
period (Figure 3a). In order to determine a soil temperature profile for each month, the modeled 24
soil layer midpoint was calculated and the corresponding soil temperature was interpolated from 25
the record. As soils develop during a simulation, increases in soil depth translate into alteration 26
of soil thermal properties following these depth/temperature relationships. The relationship 27
between soil depth and temperature is purely correlative in this model but is consistent with 28
temperature profiles in other boreal soils (Harden, unpublished data) 29
Soil carbon decay constants (i.e., k's) were normalized to 5°C to reflect the inherent 30
lability of the various C substrates at 5°C as described above, and then were adjusted up or down 31
10
by f[T(t,z)], a function of temperature in month t and for layer midpoint depth z. For this 1
function, we used a Q10 response which was normalized to a value of 1.0 at 5°C. When soil 2
temperature is below 0°C, we set f[T(t,z)] to 10% of the Q10 value. This was done to capture the 3
reduced rate of decomposition in very cold soils and to reflect the large decline in free soil water 4
as soils freeze, reducing the interaction of microbes and enzymes with the soil C. However, due 5
to the lag in deep soil freeze relative to the surface soil (Figure 3a), deep soil respiration 6
continues well into the fall and early winter, as has been observed in the field (Winston et al., 7
1997). The layer temperature was then applied to the decay constant as f[T(t,z)] based on the Q10 8
relationship. 9
We evaluated the sensitivity of C accumulation to variation in Q10 by carrying out 10
simulations with a Q10 of either 2 or 3. Boreal soil incubation studies have shown soil 11
decomposition Q10 values generally range from 2 to 3 (Clein, 1995; Dioumaeva, 2002; Neff, 12
2002). We used both values to assess the influence of Q10 on the resulting accumulation and the 13
pattern of C accumulation throughout the soil profile in our model. 14
Permafrost is probably currently absent on the NOBS site, but in some years may be 15
sporadically present in some of the larger Sphagnum hummocks. Permafrost was more 16
widespread in the early 1990s, and it may have underlain the whole area in the past as is evident 17
from small collapses (H. Veldhuis, personal communication). Studies on other shallow peatlands 18
have revealed that permafrost can be widespread, but that its distribution is controlled by depth 19
of peat, shading, fire history, and slope (Mills et al., 1987; Veldhuis et al., 2002). To examine 20
the potential influence of changing modern temperature regimes we used a modern temperature 21
simulation (assumes modern temperatures are the same as the past 6500 yr) and a historically 22
colder scenario based on borehole thermometry. The historically colder scenario assumes a 2°C 23
warming over the past 500 years to bring model input temperatures up to modern values by the 24
end of the simulations, which is consistent with warming trends for northern latitude ecosystems 25
inferred from borehole thermometry (Beltrami et al., 1995). 26
Moisture regulation 27
The influence of soil moisture content on decomposition was handled in a similar manner 28
to soil temperature. We calculated the soil profile water filled pore-space (WFPS) for each 29
month based on monthly average volumetric moisture content from NOBS during 1994-1996. 30
NOBS data were recorded at depths of 7.5, 22.5, 45, 75, and 105 cm (Figure 3b). We used the 31
11
WFPS record and the decomposition/ moisture response curve from a prior modeling study 1
(Frolking, 1996) that slowed decomposition under 20% WFPS and above 50% WFPS. To 2
provide an assessment of model sensitivity to moisture, we included two moisture response 3
curves in our simulations; one that allows optimal decomposition between 30-50% WFPS 4
(strong regulation) and one that allowed optimal conditions from 30-70% WFPS (weak 5
regulation). Both curves were otherwise similar to the Frolking et al. (1996) parameterization. 6
Fire return interval and fire severity 7
The influence of fire in the model includes the effects of combustion and soil thermal 8
changes. Fire is modeled to burn a small fraction of Cs+b (Table 2) and a fraction of all other 9
exposed C pools, which includes the surface SOC pool(s), and Cr in the surface organic layer 10
(Kasischke et al., 1995; Harden et al., 2000). All fires are stand killing, resulting in the transfer 11
of all Cr into the single SOC pool for the single pool model simulations or into both Cf (85% of 12
Cr) and Cc (15% of Cr) in the multiple pool simulations. All unburned surface moss and needles 13
immediately become Cf, while in the aboveground pools, the black spruce stems and branches 14
(Cs+b) become standing-dead stems and branches (Cs-d) and have a lag before entering the soil 15
and contributing to the detrital soil C. This model version does not attempt to include changes in 16
the soil thermal regime due to changes in soil albedo or soil water content following fire, 17
although these effects may be large and important (Chapin, 2000). 18
We tested the model sensitivity to fire return interval by using a 200 year interval as 19
supported by research from continental Canada (B. J. Stocks , personal communication) as well 20
as a fire return interval of 150 years based on measures of fire intervals observed in Alaska for 21
moderately drained systems (Kasischke, 1995). In addition, we used two different levels of burn 22
severity for consumption of surface moss, black spruce needles, and surface organic soil. One 23
set was based on a burn severity of 30% of available fuels (Harden, 2000) and the other was 24
based on a lower burn severity of 20% (Table 3). 25
Evaluation of model scenarios 26
Since boreal forests can vary widely based on soil drainage and stand age, we selected the 27
NOBS site as our reference site in order to test the model structure and parameterizations. To 28
evaluate the model simulations, we employed two different measures of goodness of fit that 29
represent different aspects of model function. We compared modeled total C to site C to 30
12
examine which parameters have the largest effect on C estimates. We also compared modeled 1
and site soil 14C profiles to examine the distribution of C through the soil. For total C, we 2
calculated the relative deviation (RD) in total soil C from the NOBS soil profile for each 3
simulation. For the goodness of fit in the radiocarbon profile, we interpolated the NOBS 4
radiocarbon depth record and compared simulated radiocarbon values throughout the profile to 5
the interpolated radiocarbon values for NOBS at the same layer depth. We used an unweighted 6
root-mean square deviation (RMSD) for this measure. In order to combine the two different 7
measures of fit, we ranked the values of the two measures separately and then calculated the 8
average of the rank for each simulation with equal weighting for both total C RD and the 14C 9
RMSD. The lower the average rank, the better the overall fit to the NOBS data. 10
11
Statistical Tests 12
The series of parameters described above were run in a full factorial design resulting in 13
288 hundred individual simulations. To evaluate the quantitative importance of each factor on 14
soil C accumulation (total C) or distribution (14C RMSD), we carried out main effects analysis of 15
variance (ANOVA). All statistical tests were carried out in Statistica (Statsoft Inc., Version 7, 16
Tulsa, OK, USA). We also carried out a rank based analysis by evaluating the 10 simulations 17
that had the lowest, equally weighted combination, of 14C RMSD and total C RD. 18
Results 19
The batch simulations resulted in a span of C accumulation from 10.4 kg C m-2 to 207 kg 20
C m-2. The distribution of C, and 14C in particular, throughout the soil profile, shows that the 21
model simulations were capable of capturing the observed 14C depth pattern quite well (Figure 22
4). The simulation data were plotted accordingly, and show that the simulations varied 23
considerably in the depth of the primary bomb-spike from a low of 18 cm to a high of 34 cm, 24
reflecting either too little (18 cm) or too much (34 cm) C accumulation since the late 1950s. The 25
model simulations were able to dynamically grow soil layers and resulted in the change in total 26
organic soil layer depth with time and especially immediately following fire. 27
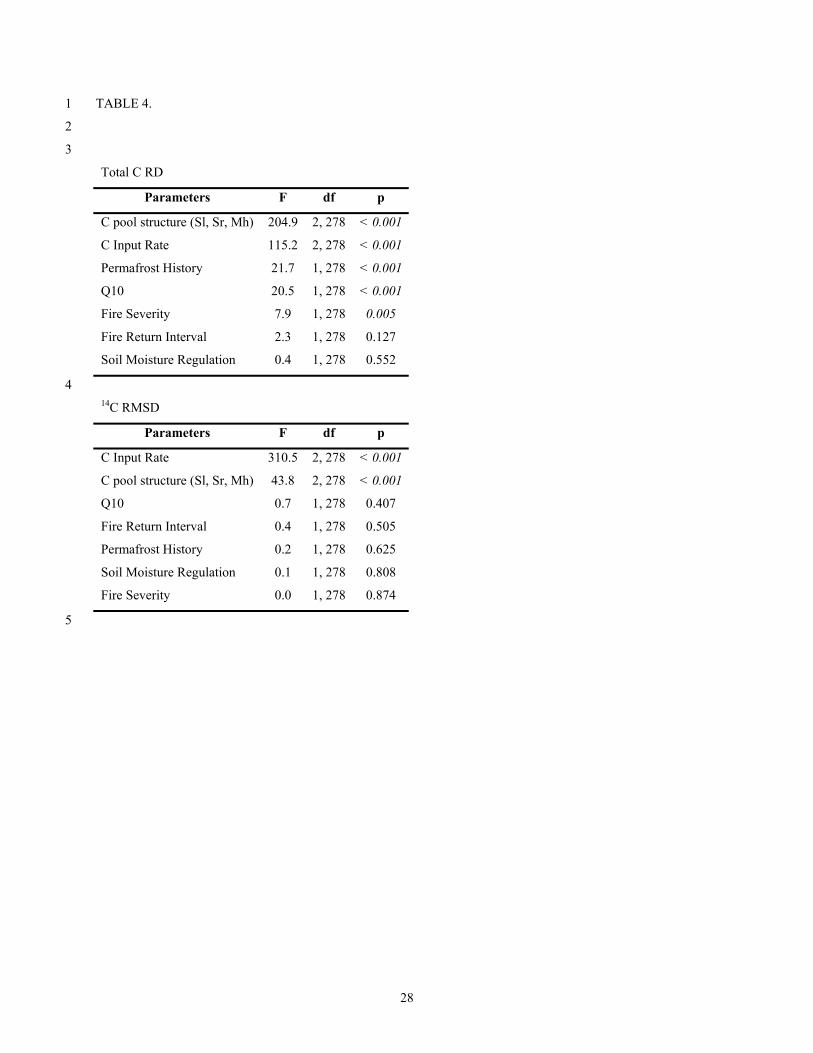
The structure of the SOC pool (and associated lability or recalcitrance) and carbon input 28
rate (NPP) were the two most important factors in determining total C and the 14C RMSD in 29
simulations (Figure 5, ANOVA results in Table 4). The accuracy (14C RMSD) of model-data 30
comparisons of the 14C soil profile was primarily determined by the rate of carbon input (and rate 31
13
of increase in soil depth) whereas a greater number of variables had a statistically significant 1
effect on total carbon content estimates including soil permafrost history, Q10, and fire severity 2
(ANOVA F values in Table 4). 3
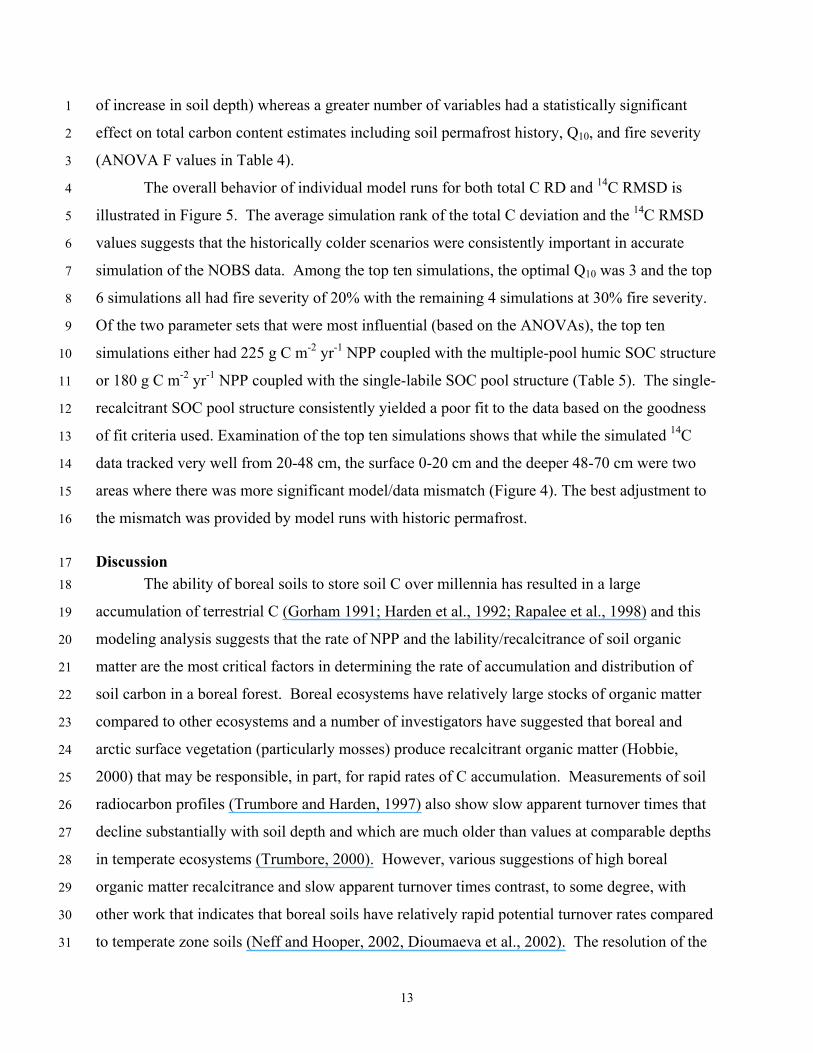
The overall behavior of individual model runs for both total C RD and 14C RMSD is 4
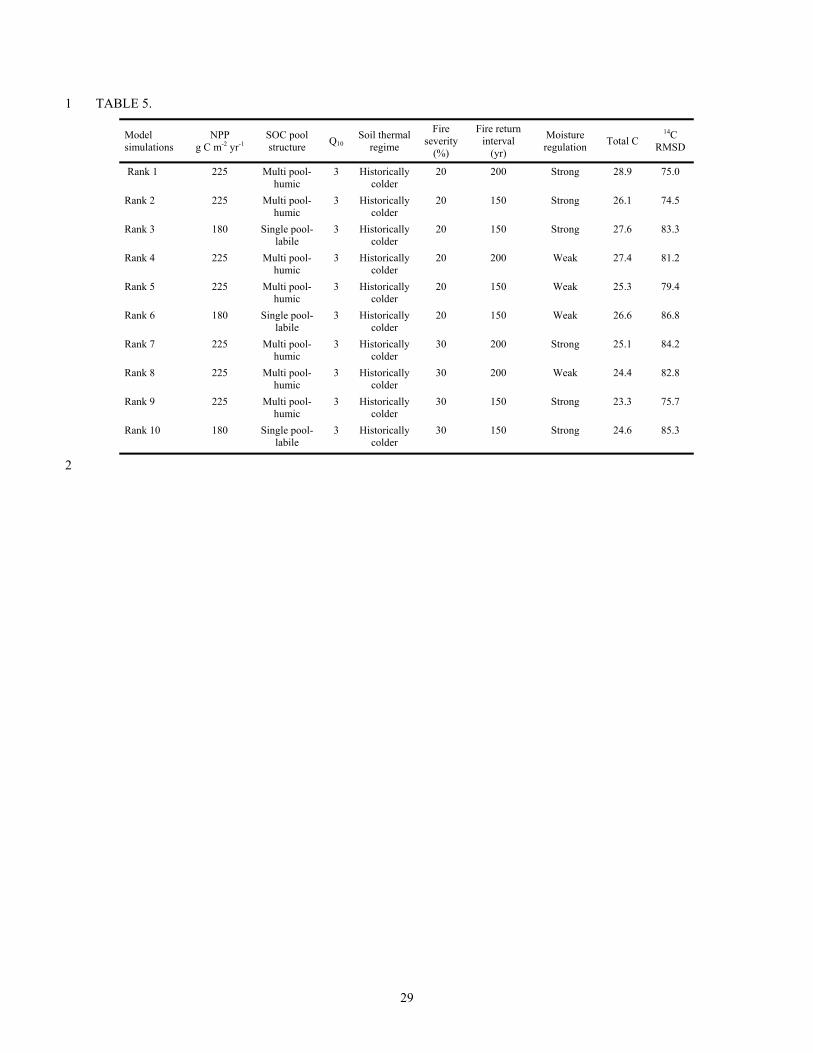
illustrated in Figure 5. The average simulation rank of the total C deviation and the 14C RMSD 5
values suggests that the historically colder scenarios were consistently important in accurate 6
simulation of the NOBS data. Among the top ten simulations, the optimal Q10 was 3 and the top 7
6 simulations all had fire severity of 20% with the remaining 4 simulations at 30% fire severity. 8
Of the two parameter sets that were most influential (based on the ANOVAs), the top ten 9
simulations either had 225 g C m-2 yr-1 NPP coupled with the multiple-pool humic SOC structure 10
or 180 g C m-2 yr-1 NPP coupled with the single-labile SOC pool structure (Table 5). The single-11
recalcitrant SOC pool structure consistently yielded a poor fit to the data based on the goodness 12
of fit criteria used. Examination of the top ten simulations shows that while the simulated 14C 13
data tracked very well from 20-48 cm, the surface 0-20 cm and the deeper 48-70 cm were two 14
areas where there was more significant model/data mismatch (Figure 4). The best adjustment to 15
the mismatch was provided by model runs with historic permafrost. 16
Discussion 17
The ability of boreal soils to store soil C over millennia has resulted in a large 18
accumulation of terrestrial C (Gorham 1991; Harden et al., 1992; Rapalee et al., 1998) and this 19
modeling analysis suggests that the rate of NPP and the lability/recalcitrance of soil organic 20
matter are the most critical factors in determining the rate of accumulation and distribution of 21
soil carbon in a boreal forest. Boreal ecosystems have relatively large stocks of organic matter 22
compared to other ecosystems and a number of investigators have suggested that boreal and 23
arctic surface vegetation (particularly mosses) produce recalcitrant organic matter (Hobbie, 24
2000) that may be responsible, in part, for rapid rates of C accumulation. Measurements of soil 25
radiocarbon profiles (Trumbore and Harden, 1997) also show slow apparent turnover times that 26
decline substantially with soil depth and which are much older than values at comparable depths 27
in temperate ecosystems (Trumbore, 2000). However, various suggestions of high boreal 28
organic matter recalcitrance and slow apparent turnover times contrast, to some degree, with 29
other work that indicates that boreal soils have relatively rapid potential turnover rates compared 30
to temperate zone soils (Neff and Hooper, 2002, Dioumaeva et al., 2002). The resolution of the 31
14
debate over what factors control boreal decomposition is critical in light of rapid temperature 1
changes leading to thawing permafrost, changes in fire frequency and severity, and the 2
possibility of large soil carbon losses in coming decades (Gorham 1991; Shaver et al., 1992; 3
Kasischke et al., 1995; Chapin et al., 2000; McGuire et al., 2002). 4
The model analysis presented here for a black spruce/Sphagnum moss system illustrates 5
that carbon input rates and disturbance are important factors controlling boreal SOM cycling. In 6
this sense, boreal ecosystems are similar to temperate and tropical ecosystems (Randerson, 1996 7
#6). However, SOM dynamics in boreal ecosystems are substantially different from temperate 8
or tropical ecosystems in some critical ways. This modeling exercise suggests that, unlike many 9
tropical or temperate ecosystems, boreal SOM does not need to be exceptionally recalcitrant to 10
accumulate (Krull, 2003 #4). Consistently, the best model fits to both total C and 14C SOC 11
distributions were scenarios with the fastest inherent/potential turnover time which are based on 12
laboratory incubations (Neff, 2002, 2002, Dioumaeva et al., 2002), but which are then modified 13
based on temperature and moisture conditions. For both our single pool labile (Sl) and 14
recalcitrant (Sr) cases, we started with field-based turnover times and in the case of the Sr 15
scenarios, further reduced turnover with our temperature and moisture scalars. In the Sl scenario 16
a faster inherent turnover is introduced and then adjusted downward by temperature and 17
moisture. One interesting result of these scenarios is that the labile decomposition scenario (Sl) 18
combined with the highest NPP inputs and temperature regulation of decomposition can be used 19
to explain both the C stock and isotope profile (Figure 5). By contrast, the slow decomposition 20
(Sr) scenario, especially when combined with the two highest NPP input values lead to 21
substantial overestimation of soil carbon stocks. Overall, simulation of isotopic profiles in soils 22
is more sensitive to parameter variation than simulation of total carbon. Whereas many of the 23
simulations accurately predict total soil carbon, they do a very poor job predicting the 24
propagation of the bomb spike through the soil profile (seen as high 14C RMSD in figure 5). 25
These results indicate that accurate simulation of total carbon (a typical metric for model 26
performance) may not be evidence for appropriate representation of underlying model 27
mechanisms. 28
This analysis suggests that one mechanism for carbon preservation in boreal soils is the 29
interaction between organic surface layers and the thermal characteristics of boreal soil profiles. 30
As boreal soils develop, slowly decomposing moss litter provides an increasingly thick organic 31
15
mat which in turn causes deeper soils to become progressively colder (Yoshikawa, 2002 #2246). 1
In this model analysis, both Q10 and the history of soil thermal properties (i.e., historical 2
permafrost and 20th century warming) played a role in carbon accumulation in the model 3
simulations. Neither of these scenarios, however, fully addresses the basic role of temperature in 4
boreal C preservation. The temperature gradient between surface and deep soils in the Manitoba 5
site in summer months can exceed 10°C (Figure 2). Even within the top 50 cm of soil, there are 6
gradients of 5-8°C during July and August. Given a Q10 of 2-3, these gradients can result in a 7
50-300% difference in mid summer decomposition between surface and deep soils of similar 8
recalcitrance. Following the factorial analyses described in the results, we carried out an 9
additional simulation in which we set the temperature of the entire soil profile equal to that of 10
surface soils. This constant temperature simulation is inherently unrealistic but it offers insight 11
into the role of the thermal characteristics of the soil profile on decomposition. When the 12
thermal gradients of the soil profile are removed, total simulated SOM content at the end of a 13
model run was 30-40% of the top ten runs shown in Table 5. This feedback between soil depth 14
(as influenced by C input rate and SOM decomposition structure), temperature, and carbon 15
preservation is critical to understanding and modeling boreal soil C accumulation. In a general 16
sense, boreal SOM accumulates because there is an interaction between moderate litter 17
recalcitrance and the cooling that occurs in soils as organic matter accumulates in a boreal 18
ecosystem. The resulting organic matter profile can have exceptionally old radiocarbon values 19
if C persists between fire events, but this modeling analysis highlights how the interaction of 20
temperature and recalcitrance yields soil organic matter with exceptionally slow apparent (but 21
much faster inherent) turnover times. 22
For all the reasons discussed above, boreal soils appear to have very different 23
mechanisms influencing decomposition than all but the most extreme (e.g. alpine) temperate or 24
tropical soils, particularly in the interactions between organic layer depth and soil profile 25
temperatures. However boreal soils are also very diverse, particularly with regard to soil 26
moisture content. In a drier setting, fire may play a larger role in recalcitrance and turnover than 27
presented here, particularly when fires can burn to mineral soils and have large impacts on 28
nutrient content, plant substrates, and SOM composition (Harden et al., 2004; Neff et al., 2005). 29
For drier boreal systems, changes in fire return intervals with climate change (Gillett, 2004 #2), 30
could be a major future control on soil C flux. There are also much wetter soils than those 31
16
modeled here and for those soils, more work is needed to understand (and parameterize for 1
modeling) moisture limitations to decomposition. Finally, permafrost cover through much of the 2
boreal region is discontinuous (Brown 1969). The site used in this analysis in Manitoba, 3
Canada does not currently have permafrost but the soil 14C profile suggests that the loss of 4
permafrost may have been relatively recent. The discontinuity around 50 cm in the ∆14C 5
accumulation curve at the NOBS site (Figure 4) suggests that permafrost used to be present but 6
has disappeared over the past century. Loss of permafrost, coupled with a relatively high, 7
inherent decomposability of boreal soils, suggest that more attention should be paid to the 8
mechanisms that control both surface and deep boreal carbon storage in both models and field 9
experiments. 10
Implications 11
In this paper, we used a range of techniques to estimate parameters for modeling, but the 12
accuracy of this exercise is to some degree limited by the data available from field and laboratory 13
studies. This is particularly true for estimates of soil organic matter turnover times and above 14
and belowground NPP. These factors play a major role in boreal C accumulation rates in the site 15
we examined and in general remain difficult to estimate. While better boreal parameter 16
estimates might improve our modeling ability, much more work is needed to better represent the 17
unique characteristics of boreal ecosystems in regional and global ecosystem models. This 18
analysis clearly illustrates that boreal soil carbon models need to be vertically resolved, 19
mechanically sophisticated, and capable of simulating millennial scale changes in soil carbon 20
dynamics in order to capture key aspects of contemporary boreal C cycling, let alone predict 21
future changes in boreal C cycling. The carbon pool structure for northern soils is probably best 22
captured by discreet representation of soil depth as it relates to physical processes (Trumbore, 23
1997). Several factors are critically important to include in future boreal modeling exercises. 24
First, most large scale ecosystem models simulate only a single layer of SOC dynamics and this 25
analysis illustrates the potential risk of ignoring the role of deeper soils (and historical 26
permafrost) in current day modeling analyses. Second, most ecosystem models have their 27
origins in the temperate zone, and include parameterizations that represent the role of 28
aggregation and sorption on soil carbon storage. Such mechanisms do not apply to the deep 29
organic horizons of boreal systems, which illustrates that inclusion (implicit or explicit) of 30
recalcitrance due to physical stabilization mechanisms in boreal models may risk significant 31
17
underestimates of the potential for decomposition in a changing climate. Finally, this study 1
illustrates that boreal decomposition dynamics are tightly coupled to the physical/thermal 2
properties of soils; the same coupling is needed in models if we hope to simulate the fundamental 3
controls on boreal carbon cycling. 4
5
Acknowledgements 6 We thank H. Veldhuis, Q. Zhuang, A. D. McGuire, and two anonymous reviewers for 7
their helpful comments on an earlier manuscript and to Merritt Turetsky for earlier discussions. 8 This work was supported by grants from the NSF (DEB 0077881) and (OPP 0115744). 9
10
Literature cited 11
Beltrami, H., D. S. Chapman, S. Archambault, and Y. Bergeron (1995), Reconstruction of high 12 resolution ground temperature histories combining dendrochronological and geothermal 13 data, Earth and Planetary Science Letters, 136(3-4), 437-445. 14
Bond-Lamberty B., C. K. Wang, and S. T. Gower (2004), Net primary production and net 15 ecosystem production of a boreal black spruce wildfire chronosequence, Global Change 16 Biology, 10(4), 473-487. 17
Brown R. J. E. (1969), Factors influencing discontinuous permafrost in Canada, in The 18 Periglacial Environment, edited by T. L. Pewe, pp. 11-53, McGill-Queens University 19 Press, Montreal. 20
Chapin, F. S., A. D. McGuire, J. Randerson, R. Pielke, D. Baldocchi, S. E. Hobbie, N. Roulet, 21 W. Eugster, E. Kasischke, E. B. Rastetter, S. A. Zimov and S. W. Running (2000), Arctic 22 and boreal ecosystems of western North America as components of the climate system, 23 Global Change Biology, 6, 211-223. 24
Clein, J. S. and J. P. Schimel (1995), Microbial activity of tundra and taiga soils at subzero 25 temperatures, Soil Biology & Biochemistry, 27(9), 1231-1234. 26
Czimczik, C. I., C. M. Preston, M. W. I. Schmidt and E. D. Schulze (2003), How surface fire in 27 Siberian Scots pine forests affects soil organic carbon in the forest floor: Stocks, 28 molecular structure, and conversion to black carbon (charcoal), Global Biogeochemical 29 Cycles, 17(1), 1020, doi:10.1029/2002GB001956. 30
Dioumaeva, I., S. Trumbore, E. A. G. Schuur, M. L. Goulden, M. Litvak and A. I. Hirsch (2002), 31 Decomposition of peat from upland boreal forest: Temperature dependence and sources 32 of respired carbon, Journal of Geophysical Research-Atmospheres, 108(D3), 8222, 33 doi:10.1029/2001JD000848. 34

18
Flanagan, P. W. and K. van Cleve (1983), Nutrient cycling in relation to decomposition and 1 organic-matter quality in taiga ecosystems, Canadian Journal of Forest Research, 13(5), 2 795-817. 3
Frolking, S., M. L. Goulden, S. C. Wofsy, S. M. Fan, D. J. Sutton, J. W. Munger, A. M. Bazzaz, 4 B. C. Daube, P. M. Crill, J. D. Aber, L. E. Band, X. Wang, K. Savage, T. Moore and R. 5 C. Harriss (1996), Modelling temporal variability in the carbon balance of a spruce/moss 6 boreal forest, Global Change Biology, 2(4), 343-366. 7
Gillett, N. P., A. J. Weaver, F. W. Zwiers and M. D. Flannigan (2004), Detecting the effect of 8 climate change on canadian forest fires, Geophys. Res. Lett., 31, L18211, 9 doi:10.1029/2004GL020876. 10
Gorham, E. (1991), Northern Peatlands - Role in the carbon-cycle and probable responses to 11 climatic warming, Ecological Applications, 1(2), 182-195. 12
Goulden, M. L., S. C. Wofsy, J. W. Harden, S. E. Trumbore, P. M. Crill, S. T. Gower, T. Fries, 13 B. C. Daube, S. M. Fan, D. J. Sutton, A. Bazzaz and J. W. Munger (1998), Sensitivity of 14 boreal forest carbon balance to soil thaw, Science, 279(5348), 214-217. 15
Gower, S. T., J. G. Vogel, J. M. Norman, C. J. Kucharik, S. J. Steele and T. K. Stow (1997), 16 Carbon distribution and aboveground net primary production in aspen, jack pine, and 17 black spruce stands in Saskatchewan and Manitoba, Canada, Journal of Geophysical 18 Research-Atmospheres, 102(D24), 29029-29041. 19
Harden, J.W., K. L. Manies, M. R. Turetsky, J. C. Neff (submitted), Effects of wildfire and 20 permafrost on soil organic matter and soil climate in interior Alaska, Global Change 21 Biology. 22
Harden, J. W., E. T. Sundquist, R. F. Stallard and R. K. Mark (1992), Dynamics of soil carbon 23 during deglaciation of the laurentide ice-sheet, Science, 258(5090), 1921-1924. 24
Harden, J. W., J. C. Neff, D. V. Sandberg, M. R. Turetsky, R. Ottmar, G. Gleixner, T. L. Fries 25 and K. L. Manies (2004), Chemistry of burning the forest floor during the FROSTFIRE 26 experimental burn, interior Alaska, 1999, Global Biogeochemical Cycles, 18, GB3014, 27 doi:10.1029/2003GB002194. 28
Harden, J. W., S. E. Trumbore, B. J. Stocks, A. Hirsch, S. T. Gower, K. P. O'Neill and E. S. 29 Kasischke (2000), The role of fire in the boreal carbon budget, Global Change Biology, 30 6, 174-184. 31
Hobbie, S. E. (1996), Temperature and plant species control over litter decomposition in alaskan 32 tundra, Ecological Monographs, 66(4), 503-522. 33
Hobbie, S. E., J. P. Schimel, S. E. Trumbore and J. R. Randerson (2000), Controls over carbon 34 storage and turnover in high-latitude soils, Global Change Biology, 6, 196-210. 35
19
Jackson, R. B., J. Canadell, J. R. Ehleringer, H. A. Mooney, O. E. Sala and E. D. Schulze (1996), 1 A global analysis of root distributions for terrestrial biomes, Oecologia, 108(3), 389-411. 2
Kasischke, E. S., N. L. Christensen and B. J. Stocks (1995), Fire, global warming, and the carbon 3 balance of boreal forests, Ecological Applications, 5(2), 437-451. 4
Kasischke, ES and Johnstone, JF (2005). Variation on post-fire organic layer thickness in a black 5 spruce forest complex in Interior Alaska and its effects on temperature and moisture. 6 Can. Jour. For. Research. 35(9), 2164-2177 7
Krull, E. S., J. A. Baldock and J. O. Skjemstad (2003), Importance of mechanisms and processes 8 of the stabilisation of soil organic matter for modelling carbon turnover, Functional Plant 9 Biology, 30(2), 207-222. 10
Manies, K. L., J. W. Harden, B. P. Bond-Lamberty and K. P. O'Neill (2005), Woody debris 11 along an upland chronosequence in boreal manitoba and its impact on long-term carbon 12 storage, Canadian Journal of Forest Research, 35(2), 472-482. 13
McGuire, A. D., C. Wirth, M. Apps, J. Beringer, J. Clein, H. Epstein, D. W. Kicklighter, J. 14 Bhatti, F. S. Chapin, B. de Groot, D. Efremov, W. Eugster, M. Fukuda, T. Gower, L. 15 Hinzman, B. Huntley, G. J. Jia, E. Kasischke, J. Melillo, V. Romanovsky, A. Shvidenko, 16 E. Vaganov and D. Walker (2002), Environmental variation, vegetation distribution, 17 carbon dynamics and water/energy exchange at high latitudes, Journal of Vegetation 18 Science, 13(3), 301-314. 19
Mikan, C. J., J. P. Schimel and A. P. Doyle (2002), Temperature controls of microbial respiration 20 in arctic tundra soils above and below freezing, Soil Biology & Biochemistry, 34(11), 21 1785-1795. 22
Mills, G.F., H. Veldhuis, and R.G. Eilers (1987), Thermal and moisture regime characteristics of 23 a veneer bog in North Central Manitoba, In Proc. Symposium ‘87, Wetlands/Peatlands, 24 edited by D. D. A. Rubec and R. P. Overend, pp. 45-52, Edmonton, Alberta, Canada. 25
Neff, J. C. and D. U. Hooper (2002), Vegetation and climate controls on potential CO2, DOC and 26 DON production in northern latitude soils, Global Change Biology, 8(9), 872-884. 27
O'Neill, K. P., E. S. Kasischke and D. D. Richter (2003), Seasonal and decadal patterns of soil 28 carbon uptake and emission along an age sequence of burned black spruce stands in 29 interior Alaska, Journal of Geophysical Research-Atmospheres, 108(D1), 8155, 30 doi:10.1029/2001JD000443. 31
Parton, W. J., D. S. Schimel, C. V. Cole and D. S. Ojima (1987), Analysis of factors controlling 32 soil organic-matter levels in great-plains grasslands, Soil Science Society of America 33 Journal, 51(5), 1173-1179. 34
Randerson, J. T., M. V. Thompson, C. M. Malmstrom, C. B. Field and I. Y. Fung (1996), 35 Substrate limitations for heterotrophs: Implications for models that estimate the seasonal 36 cycle of atmospheric CO2, Global Biogeochemical Cycles, 10, 585-602. 37
20
Rapalee, G., S. E. Trumbore, E. A. Davidson, J. W. Harden and H. Veldhuis (1998), Soil carbon 1 stocks and their rates of accumulation and loss in a boreal forest landscape, Global 2 Biogeochemical Cycles, 12(4), 687-701. 3
Schuur, E. A. G., S. E. Trumbore, M. C. Mack and J. W. Harden (2003), Isotopic composition of 4 carbon dioxide from a boreal forest fire: Inferring carbon loss from measurements and 5 modeling, Global Biogeochemical Cycles, 17(1), 1001, doi:10.1029/2001GB001840. 6
Sellers, P., F. Hall, H. Margolis, B. Kelly, D. Baldocchi, G. den Hartog, J. Cihlar, M.G. Ryan, B. 7 Goodison, P. Crill, K.J. Ranson, D. Lettenmaier, and D.E. Wickland (1995), The boreal 8 ecosystem-atmosphere study (BOREAS): an overview and early results from the 1994 9 field year. Bulletin of the American Meteorological Society. 76(9):1549-1577. 10
Shaver, G. R., W. D. Billings, F. S. Chapin, A. E. Giblin, K. J. Nadelhoffer, W. C. Oechel and 11 E. B. Rastetter (1992), Global change and the carbon balance of arctic ecosystems, 12 Bioscience, 42(6), 433-441. 13
Steele, S. J., S. T. Gower, J. G. Vogel and J. M. Norman (1997), Root mass, net primary 14 production and turnover in aspen, jack pine and black spruce forests in Saskatchewan and 15 Manitoba, Canada, Tree Physiology, 17(8-9), 577-587. 16
Sutton, D., M. L. Goulden, A. Bazzaz, B. C. Daube, S.-M. Fan, J. W. Munger, and S. Wofsy. 17 (1998), BOREAS TF-03 NSA-NOBS Tower Flux, Meteorological, and Soil Temperature 18 Data, http://daacsti.ornl.gov, Oak Ridge National Laboratory DAAC, Oak Ridge, TN. 19
Trumbore, S. (2000), Age of soil organic matter and soil respiration: Radiocarbon constraints on 20 belowground C dynamics, Ecological Applications, 10(2), 399-411. 21
Trumbore, S. E. and J. W. Harden (1997), Accumulation and turnover of carbon in organic and 22 mineral soils of the BOREAS Northern Study Area, Journal of Geophysical Research-23 Atmospheres, 102(D24), 28817-28830. 24
Trumbore, S. E., J. W. Harden, E. T. Sundquist, and G. C. Winston (1998) BOREAS TGB-12 25 Soil Carbon Data: NSA. Data set. Available on-line [http://www.daac.ornl.gov] from Oak 26 Ridge National Laboratory Distributed Active Archive Center, Oak Ridge, Tennessee, 27 U.S.A. 28
Veldhuis, H. (2000), BOREAS TE-20 Soils Data over the NSA-MSA and Tower Sites in Vector 29 Format Data, http://daacsti.ornl.gov, Oak Ridge National Laboratory DAAC, Oak Ridge, 30 TN. 31
Veldhuis, H., R.G. Eilers, and G.F. Mills (2002), Permafrost distribution and soil climate in the 32 Glacial Lake Agassiz basin in North-central Manitoba, Canada. In Proc. 17th World 33 Congress of Soil Science, Bangkok, Thailand. 34
Winston, G. C., E. T. Sundquist, B. B. Stephens and S. E. Trumbore (1997), Winter CO2 fluxes 35 in a boreal forest, Journal of Geophysical Research-Atmospheres, 102(D24), 28795-36 28804. 37

21
Yoshikawa, K., W. R. Bolton, V. E. Romanovsky, M. Fukuda and L. D. Hinzman (2002), 1 Impacts of wildfire on the permafrost in the boreal forests of interior Alaska, Journal of 2 Geophysical Research-Atmospheres, 108(D1). 3
4
22
FIGURE CAPTIONS: 1
2
Figure 1. Depth profile of carbon density used in the model to determine soil layer depth. 3
Layer thickness was based on a relationship between cumulative C calculated from this C density 4
curve and the basal depth of each layer. Data used to develop this C density curve is based on 5
poorly drained soils in the BOREAS Northern Study Area. 6
7
Figure 2. Diagram of the layered boreal C cycle model. Carbon enters the system in the 8
live pools shown here in gray. Detrital soil carbon pools are shown in thick black boxes. In 9
single pool simulations (a), a humic C pool is not used and so byproducts from decomposition 10
are recycled into the single C pool. However, in the multi-pool simulations (b) a humic C pool is 11
incorporated and receives C from both fine and coarse C pools. Following fire the surface layer 12
(z1) is created, burying the deep layers beneath it during regrowth. 13
14
Figure 3. Monthly temperature and water filled pore-space profiles based on data 15
collected from the BOREAS Northern Study Area Old Black Spruce site. Data shown is average 16
of record from 1994-1996 with (a) temperature recorded at 5, 10, 20, 50, and 100 cm depth and 17
(b) water filled pore-space content recorded at 7.5, 22.5, 45, 75, 105 cm depth. Note that the 18
extreme soil temperatures are found in the top 10-20 cm of the soil with temperature fluctuations 19
dampened in the deeper soil. Water filled pore space increases in the surface soil in May and 20
June and water moves into deeper soil for the remaining summer months and into fall. The white 21
line across both panels indicates the transition from organic to mineral soil in the figure. 22
23
Figure 4. Modeled radiocarbon profile distributions for all 288 simulations overlaid on 24
the plot of NOBS data. NOBS data is represented by error bars showing the value of ∆ 14C and 25
the layer thickness represented by the value. The primary bomb-spike in the surface soil is based 26
on sphagnum only, while the smaller bomb-spike and old radiocarbon of the deeper soil reflects 27
the bulk soil radiocarbon for that depth. The 10 simulations with the best overall fit to the NOBS 28
data are shown in black. 29
30
31

23
Figure 5. A scatterplot showing the distribution of simulations based on the two measures 1
of fit to the observed NOBS data. Data are categorized based on net primary productivity 2
parameters (135, 180, 225 g C m-2 yr-1) and the soil C pool structure (single pool – recalcitrant, 3
single pool – labile, and a multi-pool humic approach). The relative deviation of cumulative C 4
indicates whether accumulation of C in the simulation met the target amount and values close to 5
zero on both axes are closest to field data. 6
7

24
TABLE CAPTIONS: 1
2
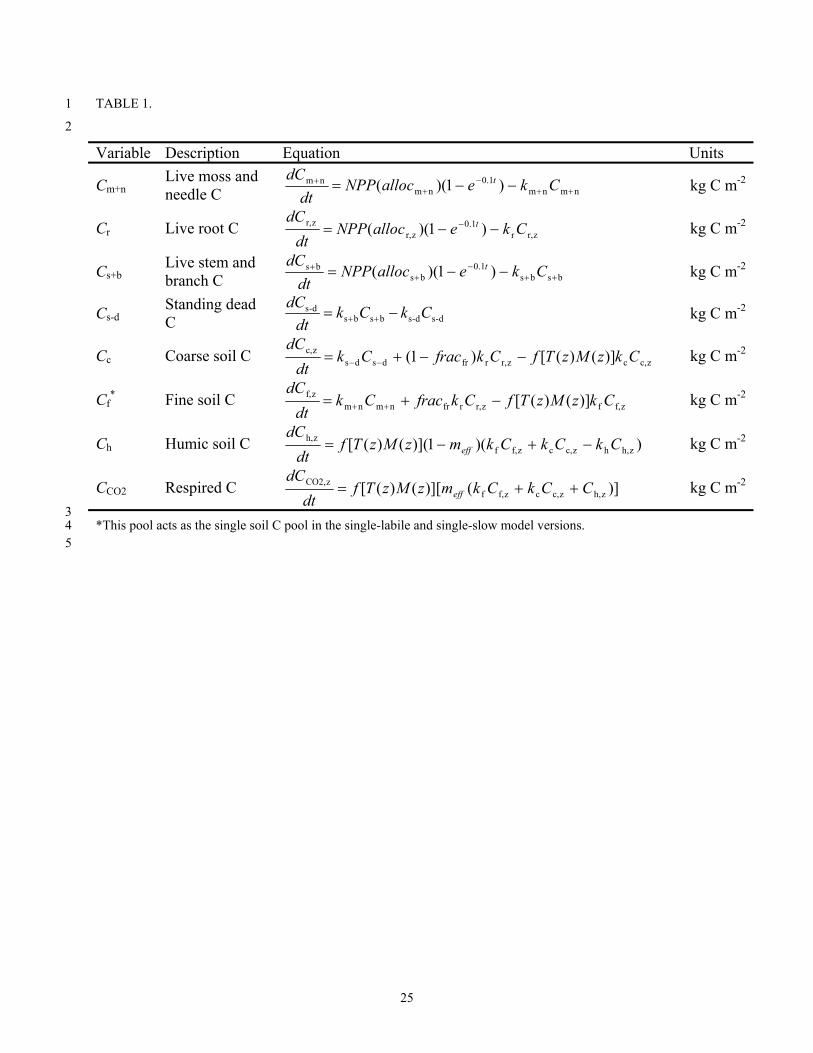
Table 1. Model equations. The variable t is time in years since fire. The function )](),([ zMzTf 3 represents the temperature (T(z)) and moisture (M(z)) scalars used to regulate depth-dependent 4 turnover rates. Soil pools are layer dependent and are indicated as such by the subscript z 5 representing soil layer depth. Refer to methods for further details. 6 7
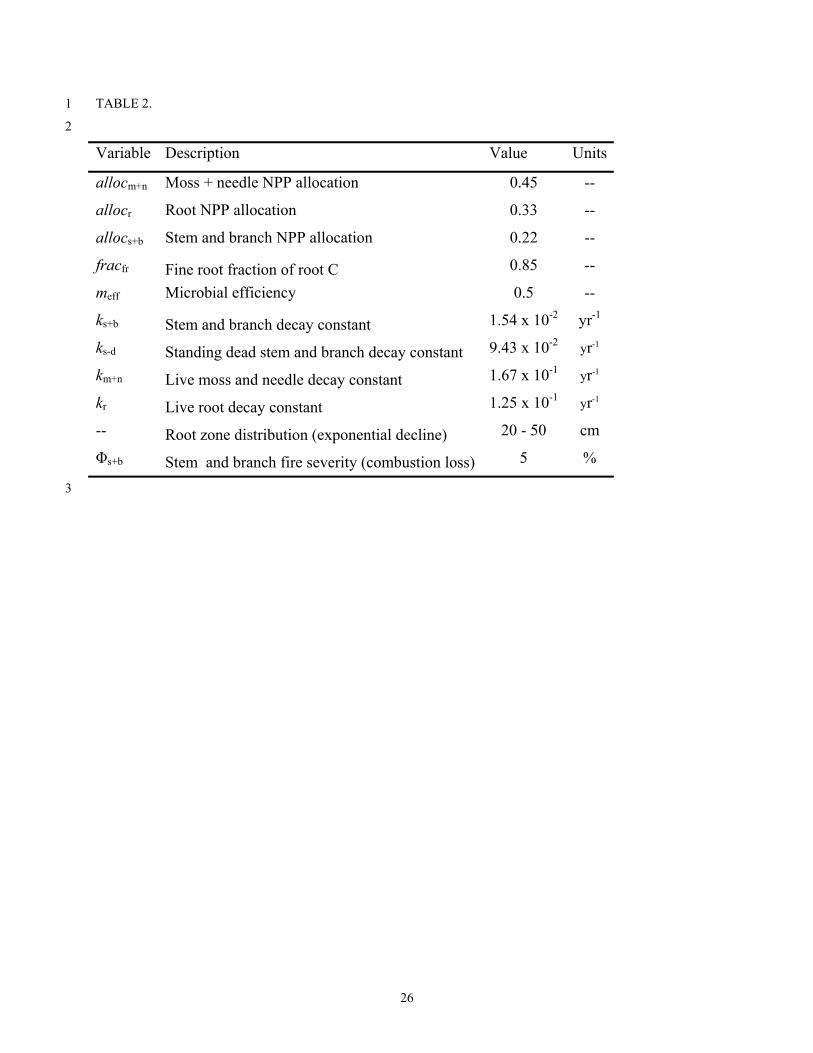
Table 2. Fixed model parameters used in all model simulations. 8
9
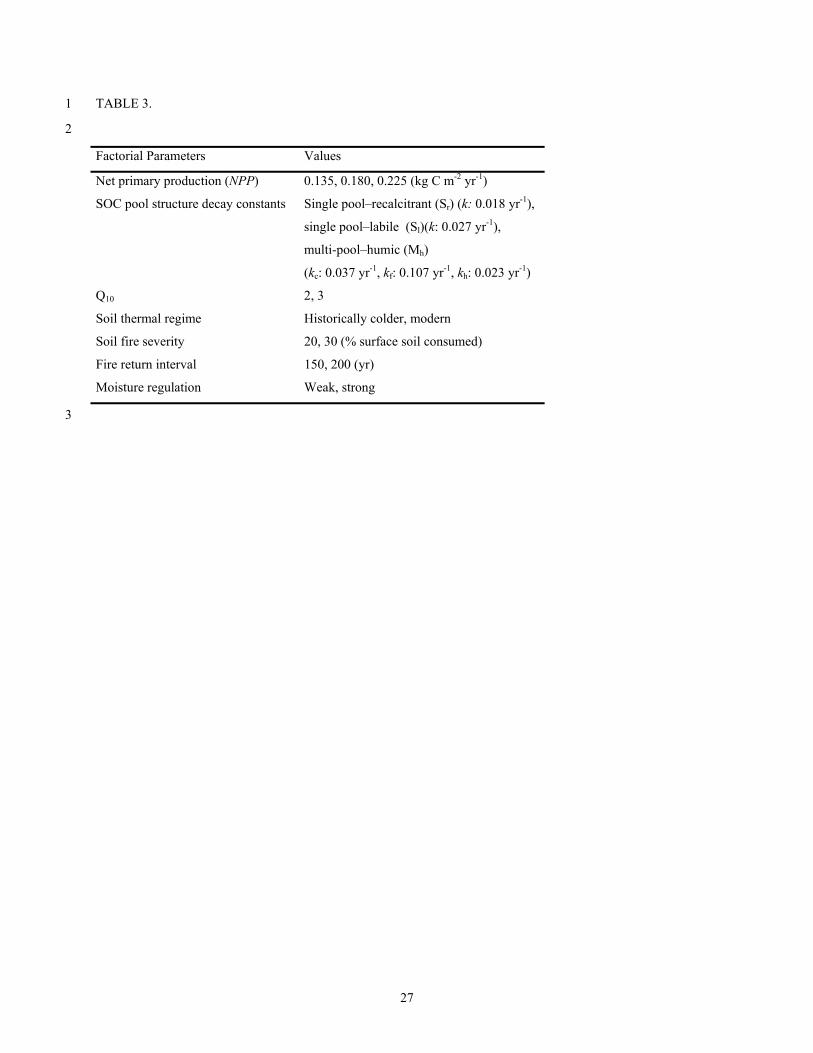
Table 3. Model parameterizations. 10
11
Table 4. Main effects ANOVAs for all simulations based on total C RSD and 14C RMSD. 12
13
Table 5. The 10 best simulations based on average rank of total C RSD and 14C RMSD and the 14
corresponding parameters used for each simulation. 15
16
25
TABLE 1. 1
2
Variable Description Equation Units
Cm+n Live moss and needle C nmnm
1.0nm
nm )1)(( ++−
++ −−= CkeallocNPP
dtdC t kg C m-2
Cr Live root C zr,r1.0
zr,zr, )1)(( CkeallocNPP
dtdC t −−= − kg C m-2
Cs+b Live stem and branch C bsbs
1.0bs
bs )1)(( ++−
++ −−= CkeallocNPP
dtdC t kg C m-2
Cs-d Standing dead C d-sd-sbsbs
d-s CkCkdt
dC−= ++ kg C m-2
Cc Coarse soil C zc,czr,rfrdsds
zc, )]()([)1( CkzMzTfCkfracCkdt
dC−−+= −− kg C m-2
Cf* Fine soil C zf,fzr,rfrnmnm
zf, )]()([ CkzMzTfCkfracCkdt
dC−+= ++ kg C m-2
Ch Humic soil C ))(1)](()([ zh,hzc,czf,fzh, CkCkCkmzMzTf
dtdC
eff −+−= kg C m-2
CCO2 Respired C )]()][()([ zh,zc,czf,fzCO2, CCkCkmzMzTf
dtdC
eff ++= kg C m-2
3 *This pool acts as the single soil C pool in the single-labile and single-slow model versions. 4
5
26
TABLE 2. 1
2
Variable Description Value Units
allocm+n Moss + needle NPP allocation 0.45 --
allocr Root NPP allocation 0.33 --
allocs+b Stem and branch NPP allocation 0.22 --
fracfr Fine root fraction of root C 0.85 --
meff Microbial efficiency 0.5 --
ks+b Stem and branch decay constant 1.54 x 10⁻² yr-1
ks-d Standing dead stem and branch decay constant 9.43 x 10⁻² yr-1
km+n Live moss and needle decay constant 1.67 x 10⁻¹ yr-1
kr Live root decay constant 1.25 x 10⁻¹ yr-1
-- Root zone distribution (exponential decline) 20 - 50 cm
Φs+b Stem and branch fire severity (combustion loss) 5 %
3
27
TABLE 3. 1
2
Factorial Parameters Values
Net primary production (NPP) 0.135, 0.180, 0.225 (kg C m-2 yr-1)
SOC pool structure decay constants Single pool–recalcitrant (Sr) (k: 0.018 yr-1),
single pool–labile (Sl)(k: 0.027 yr-1),
multi-pool–humic (Mh)
(kc: 0.037 yr-1, kf: 0.107 yr-1, kh: 0.023 yr-1)
Q10 2, 3
Soil thermal regime Historically colder, modern
Soil fire severity 20, 30 (% surface soil consumed)
Fire return interval 150, 200 (yr)
Moisture regulation Weak, strong
3
28
TABLE 4. 1
2
3
Total C RD
Parameters F df p
C pool structure (Sl, Sr, Mh) 204.9 2, 278 < 0.001
C Input Rate 115.2 2, 278 < 0.001
Permafrost History 21.7 1, 278 < 0.001
Q10 20.5 1, 278 < 0.001
Fire Severity 7.9 1, 278 0.005
Fire Return Interval 2.3 1, 278 0.127
Soil Moisture Regulation 0.4 1, 278 0.552
4 14C RMSD
Parameters F df p
C Input Rate 310.5 2, 278 < 0.001
C pool structure (Sl, Sr, Mh) 43.8 2, 278 < 0.001
Q10 0.7 1, 278 0.407
Fire Return Interval 0.4 1, 278 0.505
Permafrost History 0.2 1, 278 0.625
Soil Moisture Regulation 0.1 1, 278 0.808
Fire Severity 0.0 1, 278 0.874
5
29
TABLE 5. 1
Model simulations
NPP g C m-2 yr-1
SOC pool structure Q10
Soil thermal regime
Fire severity
(%)
Fire return interval
(yr)
Moisture regulation Total C
14C RMSD
Rank 1 225 Multi pool- humic
3 Historically colder
20 200 Strong 28.9 75.0
Rank 2 225 Multi pool- humic
3 Historically colder
20 150 Strong 26.1 74.5
Rank 3 180 Single pool- labile
3 Historically colder
20 150 Strong 27.6 83.3
Rank 4 225 Multi pool- humic
3 Historically colder
20 200 Weak 27.4 81.2
Rank 5 225 Multi pool- humic
3 Historically colder
20 150 Weak 25.3 79.4
Rank 6 180 Single pool- labile
3 Historically colder
20 150 Weak 26.6 86.8
Rank 7 225 Multi pool- humic
3 Historically colder
30 200 Strong 25.1 84.2
Rank 8 225 Multi pool- humic
3 Historically colder
30 200 Weak 24.4 82.8
Rank 9 225 Multi pool- humic
3 Historically colder
30 150 Strong 23.3 75.7
Rank 10 180 Single pool- labile
3 Historically colder
30 150 Strong 24.6 85.3
2