Connecting biodiversity and biogeochemical role by microbial ...
290
Connecting biodiversity and biogeochemical role by microbial metagenomics Tomàs Llorens Marès Aquesta tesi doctoral està subjecta a la llicència Reconeixement- NoComercial – CompartirIgual 4.0. Espanya de Creative Commons. Esta tesis doctoral está sujeta a la licencia Reconocimiento - NoComercial – CompartirIgual 4.0. España de Creative Commons. This doctoral thesis is licensed under the Creative Commons Attribution-NonCommercial- ShareAlike 4.0. Spain License.
-
Upload
khangminh22 -
Category
Documents
-
view
2 -
download
0
Transcript of Connecting biodiversity and biogeochemical role by microbial ...

Connecting biodiversity and biogeochemical role by microbial metagenomics
Tomàs Llorens Marès
Aquesta tesi doctoral està subjecta a la llicència Reconeixement- NoComercial – CompartirIgual 4.0. Espanya de Creative Commons. Esta tesis doctoral está sujeta a la licencia Reconocimiento - NoComercial – CompartirIgual 4.0. España de Creative Commons. This doctoral thesis is licensed under the Creative Commons Attribution-NonCommercial-ShareAlike 4.0. Spain License.

! ! !
Tesi Doctoral Universitat de Barcelona
Facultat de Biologia – Departament d’Ecologia Programa de doctorat en Ecologia Fonamental i Aplicada
Connecting biodiversity and biogeochemical role
by microbial metagenomics Vincles entre biodiversitat microbiana i funció biogeoquímica
mitjançant una aproximació metagenòmica
Memòria presentada pel Sr. Tomàs Llorens Marès per optar al grau de doctor per la Universitat de Barcelona
Tomàs Llorens Marès
Centre d’Estudis Avançats de Blanes (CEAB) Consejo Superior de Invest igaciones Cient í f icas (CSIC)
Blanes, Juny de 2015
Vist i plau del director i tutora de la tesi
El director de la tesi Dr. Emilio Ortega Casamayor
Investigador científic del CEAB (CSIC)
La tutora de la tesi Dra. Isabel Muñoz Gracia
Professora al Departament d’Ecologia (UB)
Llorens-Marès, T., 2015. Connecting biodiversity and biogeochemical role by microbial metagenomics. PhD thesis. Universitat de Barcelona. 272 p. Disseny coberta: Jordi Vissi Garcia i Tomàs Llorens Marès. Fletxes coberta: Jordi Vissi Garcia. Fotografia coberta: Estanys de Baiau (Transpirinenca 2008), fotografia de l’autor.
! ! !
La ciència es construeix a partir d’aproximacions que s’acosten
progressivament a la realitat
Isaac Asimov (1920-1992)


!
V!
Agraïments Tot va començar l’estiu de 2009, just acabada la carrera de Biotecnologia. Com sovint passa quan acabes una etapa i n’has de començar una altra, els interrogants s’obren al teu davant i la millor forma de resoldre’ls és provar. Vaig fer una col·laboració al departament d’Enginyeria de Bioprocessos de la UAB en optimització de fermentacions (un tema clarament aplicat), però no em va convèncer. Jo sóc blanenc de tota la vida, els meus pares i avis tenen un botiga de pesca a on hi van a comprar coses la gent del Centre d’Estudis Avançats de Blanes i sabia que feien ciència a la muntanya i al mar. I així va ser com l’Àngel (responsable de manteniment del CEAB), em va dirigir a l’Emili, qui posteriorment seria el meu director de tesi. I aquí cau el primer agraïment, si l’Àngel no s’hagués interessat en preguntar-ho i dir-ho als meus pares, segurament no hauria escrit aquesta tesi, moltes gràcies Àngel! Doncs bé, casualitats de la vida, el grup de l’Emili es dedicava a estudiar l’ecologia dels llacs de muntanya (ja sabeu que m’apassiona la muntanya) i a més, utilitzant tècniques moleculars, que segurament era la única via d’entrada al CEAB tenint en compte la carrera que havia estudiat. Allò va resultar en una col·laboració durant el mes d’Agost i el repte d’escriure un projecte per a obtenir una beca per a fer el doctorat en el seu grup. Aquell any vaig marxar d’octubre a març a fer unes pràctiques a una empresa biotecnològica a Slough (al costat de Londres), en uns mesos que em va servir per escriure el projecte i adonar-me’n que fer el doctorat era la decisió correcta.
En tornar, vaig seguir col·laborant tot l’estiu amb l’Emili i després vam saber que no ens havien donat la beca. De totes formes, l’Emili va confiar en mi, i em va contractar a través d’un projecte per a que pogués fer la tesi. Això s’ha anat repetint any rere any fins acabar la tesi i no puc fer res més que estar eternament agraït d’haver pogut fer una tesi doctoral sense disposar de beca, una cosa que només depenia de l’Emili. Aprofito per agrair-te tot el

!!VI!
temps que has dedicat a la meva tesi, sobretot aquests darrers mesos (per no dir setmanes) i també per ensenyar-me tantes coses sobre la ciència i sobretot com transmetre un missatge, ja sigui en un article o en una xerrada, moltíssimes gràcies!
Aquell primer any també va ser el del màster en Ecologia Fonamental i Aplicada, un any on vaig fer la meva primera incursió en l’Ecologia (una branca que no es toca massa a Biotecnologia) i també em va servir per fer classes a la UdG, cosa que em va fer molta il·lusió. Moltes gràcies als magnífics companys d’aquell màster amb qui vam compartir molts bons moments i als professors que em van ensenyar una forma diferent de mirar el món. Merci Marc per l’ajuda en aquell mostreig al Redó i per ensenyar-me com funciona el món de l’esquí de muntanya! Espero que ens seguim trobant per aquestes muntanyes perdudes arreu del món!
El segon any va ser el de l’estada al JCVI de San Diego, California. Van ser tres mesos apassionants, on vaig aprendre moltíssim de la gent d’allà, però també amb la Maria, que va estar-hi un mes fent-me costat i ajudant-nos mútuament per comprendre com funcionava aquest món de la metagenòmica. Gràcies Maria per aquells dies i pel que ens hem ajudat després! Qui ens havia de dir que aniríem a casa del mateix Craig Venter a celebrar el seu aniversari, o que coneixeríem en persona un parell de premis Nobel, se’ns dubte allò va ser un gran moment d’aquesta tesi! Allà hi vaig conèixer molta altra gent, i tots em van ajudar moltíssim en cada pas que s’havia de fer. Shibu you were the person that supported me in most bioinformatics problems, thank you very much for your time! And Chris, thanks for everything during my stay there, for your knowledge on global ecology and metagenomics that was very important during this PhD. Jeroen you were a fantastic friend in and out of the JCVI and it was a pleasure to share with you some great adventures!
L’equador de la tesi també va comptar amb una estada internacional a la Penn State University (State College, Pennsylvania),

!
VII!
una col·laboració que es va gestar en un congrés a Holanda, on vaig presentar els resultats de l’estada a San Diego. Thanks Don to host me and believe in the Chl. luteolum CIII genome! It was a short but intense month in which I learned everything about green sulfur bacteria and its genomes with the incredible support of Jay!
El quart any va ser per encarar la segona part de la tesi, on vaig fer una part de feina de laboratori (que finalment no ha sortit a la tesi) i on vam anar a mostrejar l’estany Redó! Quina il·lusió que em va fer! A principis d’any també vaig tenir la oportunitat de fer una de les xerrades d’Aula Blanes. Gràcies Pep per donar-me aquesta oportunitat, per poder acostar la ciència a la gent del poble i a la família, i poder ensenyar la feina que estava fent al CEAB i que ara es veu reflectida en aquesta tesi doctoral. Feu una molt bona feina amb Aula Blanes, no deixeu mai de fer-ho!
Com molt bé sabeu, m'agrada fer curses de llarga distància, i en aquestes curses, quan més es pateix és cap al final, quan s’acumula tot el cansament psicològic i físic; però tot i que el final sol ser duríssim, també és quan te n’adones que acabaràs i en els darrers quilòmetres és quan gaudeixes més i et sents més ple, orgullós i feliç de l’esforç realitzat. Doncs no hi ha un símil millor per descriure aquest darrer any, ha estat duríssim, sobretot els darrers dos mesos on he concentrat moltíssima energia per acabar d’escriure aquesta tesi que teniu a les vostres mans, però alhora, ara, escrivint aquests agraïments i quan ja veig que arriba el final, és el moment de sentir-se feliç i orgullós d’aquest llarg camí recorregut durant aquests 5 anys.
I durant aquest camí, amb qui més he compartit a nivell científic ha estat amb els companys de grup. Els primers anys, vaig aprendre moltíssim de tres fenòmens com en Jean-Chris, l’Albert i l’Antoni, ha estat un honor poder compartir hores de treball amb vosaltres, em vau transmetre una autèntica passió per la ciència. No m’oblido tampoc de la Natalia, la Carmen, l’Anna, l’Ade i la Clàudia que tot i compartir-hi poc temps també han suposat un gra de sorra

!!VIII!
per aquesta tesi. Amb en Xevi vam compartir l’organització d’un congrés a Santa Susanna i la paraula que em ve al cap per definir-lo és “mestre”, gràcies per totes les hores que t’he tret del teu temps i per ser una persona que sempre està disposada a ajudar i aconsellar-te amb saviesa sobre qualsevol assumpte. I en Gela, que sempre sap trobar una solució per a treure el màxim rendiment del cluster i amb qui un dia haurem d’anar a volar amb parapent! Amb l’Steffi vam compartir unes quantes hores refent els càlculs de les qPCRs... Vaia tela! Moltes gràcies pels teus consells i el genial cap de setmana a Taüll! I els darrers anys s’han incorporat en Rüdi i en Vicente, un parell que apunten molt alt i que han sigut de gran suport en aquest final de tesi!
El CEAB està ple de gent fantàstica que ho fan tot molt fàcil, des de la gent d’administració fins a tots els que fan que el centre tiri cada dia endavant, moltes gràcies a tots vosaltres per tots els moments en què us he necessitat. Gràcies Xavi per les sortides amb bici... jo que em pensava que em coneixia el territori! Amb en Guillem i en Miquel vam començar compartint el cinquè nivell d’anglès a l’EOI i han acabat per ser dos grans empentes en aquest final de tesi, teniu molta culpa de que hagi pogut acabar la tesi abans d’agost perquè m’heu facilitat molts del passos “burrocràtics”! I a tots aquells amb qui he compartit algun moment de lleure, ja sigui un soparet, una sortida amb bicicleta, un partidet de futbol o un te a la terrassa del CEAB, gràcies per haver-me acollit tan bé tot i ser un “outsider” de Blanes!
La meva colla d’amics de Blanes tindrà alguna culpa d’aquest doctorat, a més, aviat en serem tres de doctors! Heu de saber que sou uns cracks i que les nostres converses filosòfiques (no per arreglar el món, sinó per arreglar-nos a nosaltres) han estat imprescindibles per tirar-ho endavant i entendre el sentit de tot plegat! Igual que passa amb els companys d’universitat, van ser només quatre anys, però d’aquella promoció en va sortir un grup especial que crec que va més enllà de simples companys

!
IX!
d’Universitat... Gràcies perquè cada trobada amb vosaltres és un pou de coneixement que s’encomana com un virus!
I, evidentment, la family: pares, avis, tiets, cosins... els que sempre hi sou i sort de vosaltres que mai heu tingut un no i sempre m’heu ajudat en tot, això sí que és tenir un gran suport! I volia acabar amb tu, que no només has hagut d’aguantar les meves “neures” doctorals, sinó que també has d’aguantar dia rere dia les esportives, cauístiques, musicals, existencials... i malgrat tot, segueixes aguantant-me i donant-me suport!
S’acaba una etapa i en comença una altra que segur que serà tan o més emocionant que totes les que han vingut fins ara.
Blanes, Juny de 2015

!!X!
Informe del director El Dr. Emilio Ortega Casamayor, Investigador Científic del Centre d’Estudis Avançats de Blanes (CSIC), i director de la Tesi Doctoral elaborada per Tomàs Llorens Marès i que porta per títol “Connecting biodiversity and biogeochemical role by
microbial metagenomics” INFORMA Que els treballs de recerca portats a terme per Tomàs Llorens Marès com a part de la seva formació pre-doctoral i inclosos a la seva Tesi Doctoral han donat lloc a dos articles publicats, i tres manuscrits addicionals a punt de ser enviats a revistes d’àmbit internacional. A continuació es detalla la llista d’articles així com els índexs d’impacte (segons el SCI de la ISI Web of Knowledge) de les revistes on han estat publicats els treballs.
1. Llorens-Marès T, JC Auguet, EO Casamayor (2012) Winter to spring changes in the slush bacterial community composition of a high mountain lake (Lake Redon, Pyrenees). Environ Microbiol Reports 4 (1): 50-56. doi:! 10.1111/j.1758-2229.2011.00278.x.
L’índex d’impacte de la revista Environmental Microbiology Reports es de 3.264. Aquesta revista pertany a la categoria “Environmental Sciences” a la posició 35 de 216 revistes, quedant inclosa al grup de revistes del 1er quartil.
2. Llorens–Marès T, S Yooseph, J Goll, J Hoffman, M Vila-Costa, CM Borrego, CL Dupont, EO Casamayor (2015) Connecting biodiversity and potential functional role in modern euxinic environments by microbial metagenomics. ISME J 9: 1648-1661. doi:10.1038/ismej.2014.254.

!
XI!
L’índex d’impacte del ISME Journal al 2014 va ser de 9.267. Tenint en compte aquest índex d’impacte la revista ocupa el 4rt lloc de la categoria ISI “Ecology”, i el 9è a la categoria ISI “Microbiology”, quedant inclosa en les revistes del primer decil en tots dos casos. Alhora, FA CONSTAR Que en Tomàs Llorens ha participat activament en el desenvolupament del treball de recerca associat a cadascun d’aquests treballs així com en la seva elaboració a les diferents fases, participant en el plantejament inicial dels objectius i liderant el processament de les dades, aplicació de la metodologia i optimització del processos bioinformàtics, filogenètics i d’assignació funcional, així com en la redacció dels articles i seguiment del procés de revisió dels mateixos. Que cap dels co-autors dels articles abans esmentats ha utilitzat o bé té present utilitzar implícita o explícitament aquests treballs per a l’elaboració d’una altra Tesi Doctoral.
Signat a Blanes, 23 de Juny 2015
Dr. Emilio Ortega Casamayor

!!XII!
Contents
Connecting biodivers ity and biogeochemical role by microbial metagenomics
1. General introduction 3 1.1. Microbial biodiversity and evolution 4 1.2. Microbial metagenomics 8 1.3. Biogeochemical cycling 11 1.4. Connecting biodiversity and biogeochemical role: two case studies 15
1.4.1. Banyoles karstic system with euxinic waters 15 1.4.2. Deep oligotrophic high-mountain Lake Redon 17
2. Objectives 21
Part I : Anoxic and suboxic systems with prevalent euxinia !
3. High bacterial diversity and phylogenetic novelty in euxinic waters of karstic lakes analyzed by 16S-tag community profiling 27
4. Connecting biodiversity and potential functional role in modern euxinic environments by microbial metagenomics 45
5. Speciation and ecological success in a natural population of green sulfur bacteria mediated by horizontal gene transfer 73

!
XIII!
Part I I : Oxic system with ol igotrophic waters !
6. Winter to spring changes in the slush bacterial community composition of a high-mountain lake (Lake Redon, Pyrenees) 105
7. A metagenomics view on the microbial biogeochemical potential of an ultraoligotrophic high-mountain lake (Lake Redon, Pyrenees) 117
General overview !
8. General discussion 145 8.1. A comparative overview of the main bacterial players in the stratified aquatic ecosystems explored 145 8.2. Comparative analysis of the functional potential of the two contrasting ecosystems explored 148 8.3. Potential and limitations of microbial metagenomics 152
9. Conclusions 157
Bibl iography !! 161
Appendix !
A. Supplementary material 193
B. Original publications 249


Connecting biodiversity and biogeochemical
role by microbial metagenomics


1 General introduction
Antonie van Leeuwenhoek (1632-1723) unveiled the microbial world at the end of the 17th century using handcrafted microscopes, a revolutionary methodological advance by that time. During the 18th, 19th and early 20th centuries, the study of microorganisms increased at a slow but constant pace hand in hand with technological improvements that initially promoted the study of microscopic life forms under two main perspectives, i.e. laboratory culturing and biochemical studies on a few bacterial strains, and structural descriptions by light and, late in 1930, electronic microscopy. Simultaneously, Ernst Haeckel (1834-1919) coined the word ecology in 1866, combining two Greek words for "household" and "knowledge" in what we now define as "the branch of biology dealing with the relations and interactions between organisms and their environment." The idea that microbes are ubiquitous and that microbiology could contribute to a universal theory of life began to flourish in the beginning of the 20th century by Martinus Beijerinck (1851-1931) and Lourens Baas Becking (1895-1963) (O'Malley 2008). However, it was not until the late 1960s that Thomas D. Brock (Ohio, 1926) wrote the first textbook with the term microbial ecology (Brock 1966), trying to integrate all the different disciplines studying microorganisms and its influence on ecology in the same global field.
Chapter 1 4
Because of the technical difficulties to study microorganisms in situ, microbial ecology has always been a methods-driven discipline. In this PhD dissertation we explore the potential and limitations of the application of metagenomics for the study of microorganisms in situ. 1.1 Microbial biodiversity and evolution The revolutionary vision of Carl Woese (1928-2012), using the divergence between nucleotide sequences of the small subunit of the ribosomal DNA (16S rRNA) as a ‘molecular clock’, allowed him to discover a completely new branch of life (Woese and Fox 1977), and changed the historical and classical view of the five kingdoms of life to a new paradigm based on three domains: Archaea, Bacteria and Eukarya (Woese et al. 1990). But it was Norman Pace and his team that combining a reverse transcriptase with DNA cloning techniques (Lane et al. 1985), and later improved by the polymerase chain reaction (PCR) protocol (Mullis and Faloona 1987), provided an easy methodology to obtain 16S rRNA sequences from field samples and popularized the study of microbes in situ. Thanks to these techniques, molecular microbial ecology flourished as an important field to help unveiling the biogeochemical interactions mediated by microbial communities and thus, understand the role of microorganisms in the evolution of life on Earth (O'Malley and Dupre 2007).
Currently, aerobic processes are prevalent both on land and oceanic ecosystems. However, early ocean and atmosphere were totally anoxic, and the emergence of life took place under anaerobic conditions (Kasting and Siefert 2002). Anoxic conditions dominated during the first half of Earth’s history, until the appearance of oxygenic photosynthesis, the biological process by which cyanobacteria obtained energy and reducing power from light and water, respectively, and released O2 as “waste” product. Microbial activity changed the air composition in what is know as the great oxygenation event (GOE). However, the deep ocean remained

General introduction
5
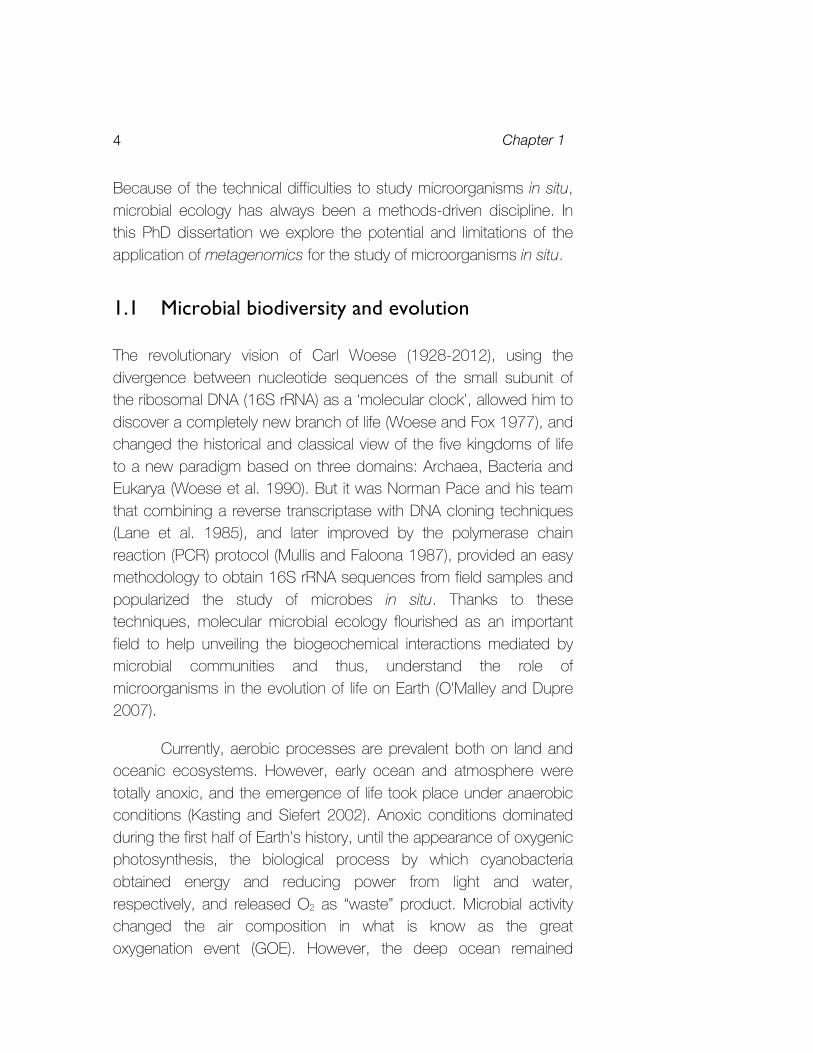
dominantly anoxic and the sink of organic matter from productive areas (mostly along continental margins), favoured the development of highly reduced environments where euxinic conditions (oxygen-free waters with dissolved hydrogen sulfide (H2S)) were abundant, in what is known as the “Canfield Ocean” (Meyer and Kump 2008, Lyons et al. 2014). Overall, the “chemical soup” in early stages of Earth influenced the evolution of microbial life, which in turn changed the biogeochemistry of the atmosphere and ocean (Fig. 1.1). Thus,
Figure 1.1: Conceptual framework of the link between biogeochemical cycles and microorganisms and how using NGS technologies we can reconstruct the history of evolution of life on Earth. Figure from Reysenbach and Shock (2002).

Chapter 1 6
the study of current environments with contrasting redox conditions may help to better understand the early evolution of life on Earth, and unveil the evolutionary history by which biogeochemical interactions turned hot water and rocks into habitats (Reysenbach and Shock 2002).
The evolution of life is driven by changes in the DNA (i.e., mutation, duplication, truncation…), which may lead to a different or new aminoacidic sequence with the improvement in a specific function of the cell. However, the fast adaptation of prokaryotic species to new conditions cannot be only explained by molecular evolution (Ochman et al. 2000). Prokaryotes have the ability to exchange DNA with highly divergent organisms, i.e. horizontal gene transfer (HGT), which allows acquiring specific functions by the direct transfer of genetic material (Wiedenbeck and Cohan 2011). Various mechanisms may explain HGT (i.e. phage-mediated transduction, transformation or conjugation), and it is a major mechanism for bacterial innovation and adaptation to colonize new ecological niches. As a consequence of HGT among highly diverse microorganisms, it is very difficult to define “prokaryotic species” as uniform entities, and we now understand that there are various forces driving microbial speciation, which include genetic variation (mutations), population dynamics (HGT), and ecological processes (niche-adaptation) that effect the evolution of prokaryotes and shape the current microbial world (Doolittle and Zhaxybayeva 2009) and the ecological success of a given population (Aminov 2011).
The use of environmental genetic methods unveiled the diversity and importance of microorganisms in situ, but it was not until the 21st century when the massive use of next-generation sequencing (NGS) techniques, has produced an exponential growth in the number of both 16S rRNA gene sequences (16S-tag community profiling) and microbial genomes available in databases (Fig. 1.2). According to 16S rRNA gene phylogenies, at least 60 major prokaryotic phyla have been identified (Rinke et al. 2013),

General introduction
7
although probably many more will be discovered in the coming years (Brown et al. 2015, Spang et al. 2015). Conversely, around 90% of all microbial strains cultured in the laboratory only belong to four main bacterial phyla, i.e., Proteobacteria, Actinobacteria, Firmicutes and Bacteroidetes (Fig. 1.3). The titanic task of culturing and a bias to a few prokaryotic groups restricts the global understanding of
Figure 1.2: Increase in cultured sequences (purple), sequenced genomes (grey) and number of 16S rRNA sequences in RDP & SILVA databases (green) over the last 35 years. Note the different scale for SSU sequences (two orders of magnitude higher).
Figure 1.3: Phylum-level distribution of prokaryotic cultured isolates, compared to sequenced genomes. Figure adapted from Rinke et al. (2013).
Chapter 1 8
metabolic diversity. Accordingly, available sequenced genomes are also biased to these four main phyla (Fig. 1.3). 1.2 Microbial metagenomics The application of NGS technologies for the analysis of genomic DNA has been successfully applied to both complex environmental samples (metagenomics) and individual organisms or cells (genomics). However, metagenomics has the potential to provide genomes in silico from uncultivated microorganisms (see the exponential increase of sequenced genomes in 2013 and 2014, doubling the number of cultured species; Fig. 1.2) by the analysis of either low-complexity environmental samples (Tyson et al. 2004) or previously sorted single-cells (Rinke et al. 2013) offering the possibility to unveil the genetic potential of uncultured but abundant microbial species.
Metagenomics also provides an excellent framework in order to explore and understand the role of the whole microbial community into the functioning of a given ecosystem. The initial major contributions of metagenomics were on the ubiquity and energetic role of proteorhodopsins (Fuhrman et al. 2008), and on the importance of archaeal ammonia oxidizers (Treusch et al. 2005, Prosser and Nicol 2008). This approach also permitted ambitious environmental sequencing challenges such as the Global Ocean Sampling (GOS) expedition carried out by the J. Craig Venter Institute, which sampled from the northwest Atlantic to the eastern tropical Pacific in a vast and pioneering metagenomics study (Rusch et al. 2007) that helped to substantially expand the universe of protein families (Yooseph et al. 2007).
Metagenomic studies easily generate billions of sequences that need to be sequentially processed in order to extract information and knowledge. This high computing demand consolidated Bioinformatics as a separated discipline from computational biology

General introduction
9
to facilitate massive sequence processing and data analyses from metagenomic studies (Kunin et al. 2008) to meet an ever growing high performance computing needs. After samples collection, DNA extraction, preparation and sequencing, sequence reads processing is crucial to refine the information in a process that requires a high demand of computational power (Fig. 1.4). First, reads need to be trimmed to remove low-quality bases and sequence adapters. A second optional step is assembly, which is the process of combining sequence reads in order to obtain longer stretches of contiguous DNA, which are called contigs. Assembly is a crucial step in genome sequencing to obtain both the lowest number and the largest fragments from a genome. It becomes easier when a close previously described reference genome is available (co-assembly). Otherwise, de novo assembly from complex environmental samples is a very difficult task because of the lack of sequence similarity between reads. Recently, methods based on sequence composition (Wrighton et al. 2012) or differential coverage binning of multiple metagenomes (Albertsen et al. 2013) have been used in order to circumvent this limitation and obtain reasonable de novo genome assemblies. Either for assembled or unassembled reads the next
Figure 1.4: General environmental metagenomics workflow. Figure taken from http://envgen.github.io/metagenomics.html.
Chapter 1 10
computational demand is annotation, which comprises a first step where genes or open reading frames (ORFs) are predicted (i.e. protein coding sequences (CDS) and a second step, which allows the assignment of putative gene functions and taxonomic neighbours of ORFs by a process based on homology searches against databases (Thomas et al. 2012). The correct annotation of ORFs with curated protein databases is essential in order to obtain a correct picture of the metabolic potential in the community.
There are some drawbacks however, that need to be kept in mind when metagenomics studies are carried out (Gilbert and Dupont 2011). First, the length of reads generated by NGS is a limiting factor for a correct identification of the sequences. Second, the annotation of proteins is based on previously identified sequences (i.e. cultured microorganisms). This is why most metagenomics studies are only able to annotate ~20% of the reads and there will be always a bias to cultured organisms in genes identification. Finally, as mentioned above, HGT is a common mechanism for prokaryotic innovation and adaptation (Ochman et al. 2000, Wiedenbeck and Cohan 2011), thus the functional taxonomic assignment should be carefully considered. In addition, metagenomics only provides the genomic potential of the community, but not the in situ activity of the microbial community, and should be complemented by mRNA extraction (gene expression) and metatranscriptomics for the identification of those genes that are being transcribed in situ (Gifford et al. 2011, Vila-Costa et al. 2013).
A key application of metagenomics is focused on the links between biogeochemical cycles and microbes driving energy and matter transformations in the ecosystems. A comprehensive understanding of the individual role of microbial populations in the biogeochemical cycling, and its influence in the dynamics of the ecosystem is a need to predict the ecosystem response to current environmental challenges (e.g., climate and global change, contamination, oil spills, etc.).

General introduction
11
1.3 Biogeochemical cycling The most important elements for life are carbon, nitrogen, phosphorus and sulfur, and understanding how microorganisms mediate the biogeochemical processes driving the transformations of these elements and the key genes performing each step of the cycle is of major interest. To obtain usable energy for the cell, oxygen (O2) is the preferred electron acceptor because of the higher reduction potential obtained from the redox couple O2/organic matter, from which more energy can be obtained. In the absence of oxygen, other compounds may be used as electron acceptors. The reduction potential of each redox couple, determines the preferred sequence of electron acceptors under anoxic conditions, which mainly are nitrate (NO3-), iron (Fe3+), sulfate (SO42-) and carbon dioxide (CO2), respectively. The biochemical transformations taking part in most ecosystems have been largely described by biochemistry; however, the main drivers of these transformations are not well understood and remain unknown for most environments. Metagenomics may provide a better understanding on these processes, but in order to fully decipher metagenomics into a comprehensive biogeochemical framework, we need to have a complete view on the metabolic processes involved in the biogeochemical cycling and on the functional genes driving each transformation.
Carbon compounds form the basis of all known life forms on Earth, but, apart from the geological record, carbon is mostly found as CO2 in the atmosphere or inorganic carbon dissolved in the oceans. It is difficult to evaluate all processes in which carbon takes part, however, the major biological processes involve the assimilation of CO2 into organic matter and the respiration to CO2 as a residual product (Fig. 1.5). The environmental availability of organic carbon compounds is the main driver of productivity and thus it is very important to understand how microorganisms link C recycling by the antagonist processes of photosynthesis and respiration either aerobic or anaerobic. CO2 can be used for both oxygenic and

Chapter 1 12
anoxygenic photosynthesis, but it can be also used as an electron acceptor in anaerobic respiration by methanogenic archaea. The energy yield through methanogenesis is very low, but this process might have been very important in early stages of life (Reysenbach and Shock 2002). Several studies have reported the genetic inventory for carbon cycling such as carbon fixation (Fuchs 2011) or aerobic respiration (Schmetterer et al. 2001).
The nitrogen cycle is also very important on Earth, not only for organisms, but also because it is probably the most altered cycle by human activities (Galloway et al. 2008). In the absence of oxygen, nitrates are the main alternative as final electron acceptors, and play an important role in the oceanic oxygen minimum zones (OMZs) and in coastal areas as a consequence of anthropogenically induced
Figure 1.5: Redox cycle for the carbon cycle. Figure from Madigan (2012).

General introduction
13
coastal eutrophication (Lam and Kuypers 2011). The understanding and functional relationships among the nitrogen cycle has changed substantially in the last years, with recently discovered processes like dissimilatory nitrogen transformations in eukaryotes, anaerobic ammonium oxidation coupled to nitrite reduction (anammox) or anaerobic methane oxidation with nitrite (Thamdrup 2012), highlighting that new metagenomics studies may provide new evidence for different and more diverse transformations within any metabolic cycle. The whole set of genes participating in the nitrogen cycle have been mainly identified and are available in databases for metagenomics annotation (Fig. 1.6).
Figure 1.6: Major biological nitrogen transformation pathways and their associated genes. Figure from Canfield et al. (2010).
Chapter 1 14
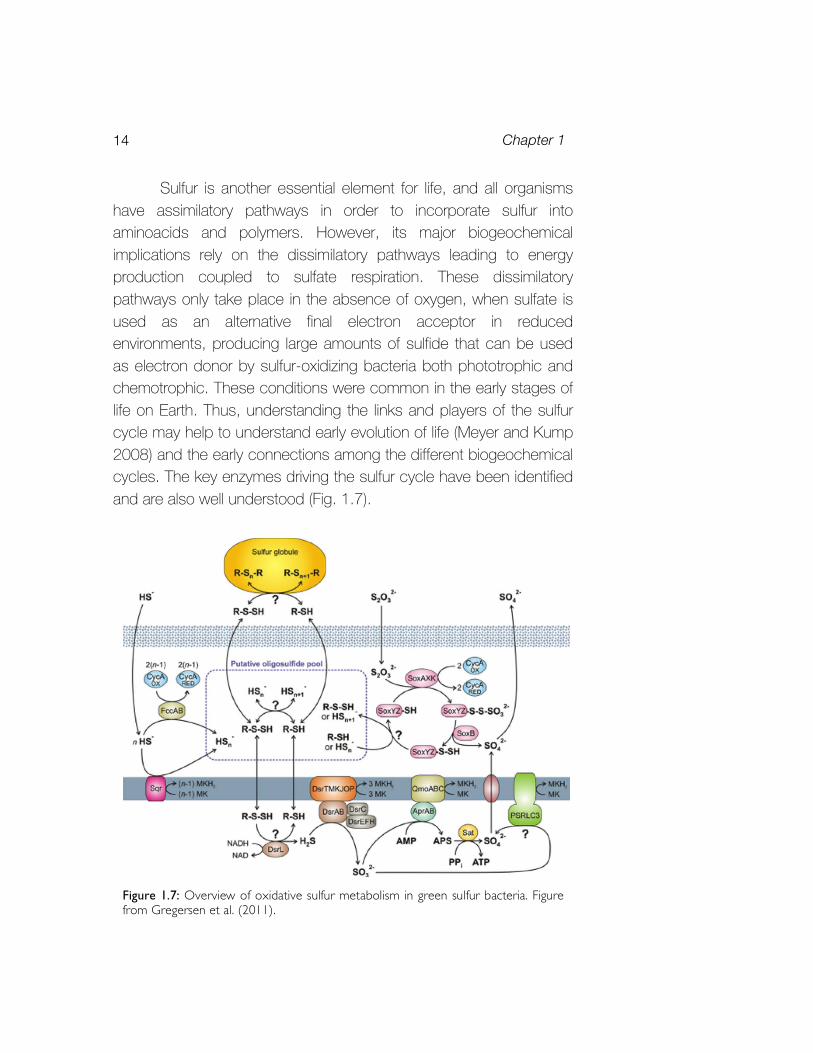
Sulfur is another essential element for life, and all organisms have assimilatory pathways in order to incorporate sulfur into aminoacids and polymers. However, its major biogeochemical implications rely on the dissimilatory pathways leading to energy production coupled to sulfate respiration. These dissimilatory pathways only take place in the absence of oxygen, when sulfate is used as an alternative final electron acceptor in reduced environments, producing large amounts of sulfide that can be used as electron donor by sulfur-oxidizing bacteria both phototrophic and chemotrophic. These conditions were common in the early stages of life on Earth. Thus, understanding the links and players of the sulfur cycle may help to understand early evolution of life (Meyer and Kump 2008) and the early connections among the different biogeochemical cycles. The key enzymes driving the sulfur cycle have been identified and are also well understood (Fig. 1.7).
Figure 1.7: Overview of oxidative sulfur metabolism in green sulfur bacteria. Figure from Gregersen et al. (2011).

General introduction
15
Finally, phosphorus is not used in dissimilatory pathways coupled to energy production, but it is very important in oligotrophic ecosystems where it has emerged as one of the main limiting factors (Dyhrman et al. 2007). Thus, the assimilation of either inorganic or organic phosphorus, and its storage in the cell are properties that will be of great relevance for microorganisms living in phosphorus-limited environments. Various studies provide the major genes involved in phosphorus transport and metabolism (Martiny et al. 2006, Vila-Costa et al. 2013, Carini et al. 2014).
1.4 Connecting biodiversity and biogeochemical role: two case studies In order to explore the potential and limitations of metagenomics to unveil the main drivers of biogeochemical processes, two contrasted and widely studied ecosystems with global ecological interest were selected. First, the Banyoles karstic system, a mirror to the past euxinic conditions where three different lakes provide different euxinic situations where reduced compounds and sulfate were highly available: Lake Cisó, a small eutrophic lake with high carbon inputs, permanent anoxia and high euxinia; Lake Vilar, a meromictic mesotrophic lake; and Lake Banyoles basin CIII, a meromictic deep oligotrophic basin. And second, the ultraoligotrophic Lake Redon, with three contrasted situations to study: the slush, an oxygenated environment with labile carbon from algal exudates; the epilimnion oxygenated layer with low availability of reduced compounds; and the hypolimnion, a dark layer under the influence of the mineralization microbial processes from the sediment.
1.4.1 Banyoles karstic system with euxinic waters Euxinic conditions (i.e. anoxic conditions with the presence of dissolved hydrogen sulfide) were common in the oceans during long periods of Earth history (Anbar 2008, Meyer and Kump 2008,

Chapter 1 16
Reinhard et al. 2013). Nowadays, only some specific environments mimic those conditions found in early stages of life. The Banyoles karstic system (BKS) contains a group of lakes with sulfate-rich underlying waters, which harbours an active community of anaerobic sulfate-reducing bacteria producing large amounts of sulfide and creating the necessary conditions for euxinia. BKS offers a diverse range of conditions to study lakes with different stratification conditions and nutrient levels from eutrophy to oligotrophy.
The first microbial ecology studies on Banyoles area date back to the 1970s, when the physiological adaptations and competition between green and purple sulfur bacteria were initially studied. The ecological niches of green and purple are mostly determined by sulfide concentration and light (Guerrero et al. 1980), and pure cultures demonstrated that light quality plays a selective role on the competition between green and brown sulfur bacteria (Montesinos et al. 1983). Detailed vertical in situ distribution analyses showed sulfide- and light-limitation as main drivers for the massive development of phototrophic sulfur bacteria in the lakes (Guerrero et al. 1985) with the diel cycle playing an important role in their metabolism (Van Gemerden et al. 1985). A comprehensive review on the microbial ecology of Lake Cisó also described quantitatively the interactions among different microbial populations (Pedros-Alio and Guerrero 1993). The distribution and adaptations of green sulfur bacteria were explored in detail through HPLC and pigment analysis (Borrego et al. 1999). Lately, these environments have been used as a model system to explore the performance and potential of genetic fingerprinting methods with natural samples (Casamayor et al. 2000, Casamayor et al. 2001a, Casamayor et al. 2001b, Casamayor et al. 2002). Conspicuous blooms of brown sulfur bacteria have been recurrently found in these lakes along many years (Guerrero et al. 1985, Borrego et al. 1999), being an appropriate model ecosystem to apply genomic sequencing on naturally blooming populations. Recently, studies on dark carbon fixation showed the importance of the chemolithoautotrophic guild to this process (Garcia-Cantizano et

General introduction
17
al. 2005), forming a taxonomically and not fully understood complex group of microaerophilic and anaerobic microorganisms coexisting in the same water layers and potentially competing for the same substrates (Casamayor 2010, Lliros et al. 2011). 1.4.2 Deep oligotrophic high-mountain Lake Redon Oxygen is the main driver of microbial energetics in the modern world, and thus it is important to understand the functioning of aerobic ecosystems linked to the different microbial roles in the present biogeochemical cycling. Alpine lakes with low direct human influence are considered excellent study sites for plankton ecologists and act as sentinels to predict the responses of whole ecosystems to global change (Catalan et al. 2002). Lake Redon, is a deep oligotrophic lake situated in the middle of the Pyrenees at an altitude of 2240m, presenting a strong dynamism in water stratification, a dimictic regime with mixing periods in spring and autumn, and ice-covered during 6 months a year, adding yet another level of complexity in the limnological variability along the year.
The lake has been extensively studied and its physical properties (Catalan 1988), limnological and seasonal changes of water chemistry and primary production are well understood (Catalan and Camarero 1991, Catalan 1992, Camarero and Catalan 1993, Catalan et al. 1994). The dynamics of the ice cover, which consists of a superposition of different layers of ice and slush (a mixture of water and snow), have been also studied (Catalan 1989), and the slush layers are predicted to be microbial activity hotspots (Felip et al. 1995). The eukaryotic microbial assemblages of the slush and water column were described by fluorescence and microscopic analysis in late 1990s (Felip et al. 1999a, Felip et al. 1999b, Felip et al. 2002). Recent molecular microbial ecology studies have focused on the detection of airborne bacteria and its influence in the microbial community composition of the bacterioneuston (Hervas and Casamayor 2009), and on the role of archaea in the nitrification in

Chapter 1 18
oligotrophic cold lakes (Auguet et al. 2012, Restrepo-Ortiz and Casamayor 2013, Restrepo-Ortiz et al. 2014).


2 Objectives
The main objective of this PhD dissertation was to unveil the link between biogeochemistry and microbial diversity using metagenomics functional potential under a biogeochemical cycling framework as a proxy to connect a mechanistic perspective with whole-system ecology.
Comparative analysis of biodiversity and microbial nutrient cycling of two contrasted situations (i.e. anoxic and suboxic systems with prevalent euxinia, and an oxic system with oligotrophic waters) were used as a proxy to provide a new view to whole-ecosystem functioning of ancient and modern environments. The previous knowledge on the biogeochemistry, ecology and functioning of these ecosystems, offered an excellent framework to connect the
biodiversity and biogeochemical role by microbial metagenomics.
The detailed objectives of each chapter and the structure of this PhD Thesis are as follows:
Chapter 2 22
Part I: Anoxic and suboxic systems with prevalent
euxinia
Chapter 3: The main objective was to unveil an unknown but large fraction of microbial diversity that remained hidden due to the low resolution of the techniques used in previous studies (i.e. culturing or DGGE). A 16S-tag community profiling was used to describe the bacterial diversity of the metalimnion and hypolimnion of Lake Banyoles basin CIII, Lake Cisó and Lake Vilar (Submitted manuscript to FEMS Microbiology Ecology).
Chapter 4: The main goal was to explore the links between microbial composition and functionality for the carbon, nitrogen and sulfur cycling after phylogenetic and functional identification. A metagenomics approach was used to describe the genetic potential of the metalimnion and hypolimnion of Lake Banyoles basin CIII and Lake Cisó in order to unveil the biogeochemical functioning under fully anoxic conditions (Llorens-Mares et al. 2015).
Chapter 5: Blooming populations of GSB have been recurrently found in Lake Banyoles CIII basin. We used this opportunity to show an example how the culture limitation can be overcomed in natural populations and used assembly and comparative genomics analysis to reconstruct the genome of a green sulfur bacteria population and understand the main genetic factors explaining its ecological success (Submitted manuscript to ISME Journal).

Objectives
23
Part I1: Oxic system with oligotrophic waters
Chapter 6: The slush and water column microbial communities of the high-mountain Lake Redon had been mainly studied by microscopy methods. In this chapter, we aimed to unveil the bacterial diversity through CARD-FISH and 16S rRNA clone libraries. The main community changes from winter to spring were characterized (Llorens-Mares et al. 2012).
Chapter 7: The main objective was to explore the functional and taxonomic links as a proxy of the potential of each biogeochemical cycle in Lake Redon. The microbial genetic potential of the slush, the epilimnion and the hypolimnion were described through metagenomics (Manuscript in preparation).


Part I: Anoxic and suboxic systems
with prevalent euxinia


3 High bacterial diversity and phylogenetic
novelty in euxinic waters of karstic lakes
analyzed by 16S-tag community profiling1,2
Abstract Microbial communities developed under extreme low redox conditions use to grow in sulfide-rich environments, and experience limitation of electron acceptors. We explored the bacterial composition in the metalimnia and hypolimnia of three sulfurous lakes from the Lake Banyoles karstic area (NE Spain) through 16S rRNA tag sequencing. High relative abundances of Actinobacteria was observed in the metalimnion of the three lakes, and of Alphaproteobacteria of the SAR11 group in samples with the lowest sulfide concentrations. Betaproteobacteria of the order Burkholderiales were highly represented being more abundant in metalimnia than in hypolimnia. Abundant and well-known sulfate
1 Llorens-Marès T, CM Borrego, CL Dupont, EO Casamayor. Manuscript submitted to FEMS Microbiology Ecology. 2 See supplementary material in Appendix A
Chapter 3 28
reducers and sulfide oxidizers (e.g., Chromatiales and Chlorobiales) were detected, indicating the potential for an active sulfur cycle, and high diversity indices were found in all samples but the hypolimnion of basin C-III where a Chlorobi bloom dominated. We noticed a systematic underestimation of Epsilonproteobacteria abundance with the currently available 907R “universal” primer and we argue for the need of a modified primer version. The novelty patterns showed a higher proportion of OTUs of the “highest novelty” for the hypolimnia (38% of total sequences) than for the metalimnia (17%). Elusimicrobia, Chloroflexi, Fibrobacteres and Spirochaetes were the taxa with the highest proportion of novel sequences. Introduction Anoxic and sulfurous (euxinic) waters in aquatic systems are a consequence of both the stratification of the water column and the depletion of oxygen in deep waters due to aerobic microbial respiration of organic matter in the sediments. As a consequence, anaerobic respiration and fermentation prevail leading to the accumulation of reduced compounds (e.g. NH4, H2S, CH4, H2, among others) in the bottom water compartment. Euxinic conditions may occur at different scales both in marine systems (e.g. microbial mats, sediments, estuaries, fjords, stagnant marine basins, coastal lagoons) and in continental areas (lakes and reservoirs, eutrophic shallow forest ponds, lacustrine sediments) in response to stratification conditions and large nutrient inputs from natural or anthropogenic sources. Although locally restricted, recent studies have raised concerns on the expected increase of anoxic conditions under a global change scenario (warming, eutrophication and marine intrusions) (Diaz and Rosenberg 2008, Wright et al. 2012).
Anoxic, sulfide-rich waters have traditionally been considered as “dead zones” because anoxia and sulfide accumulation strongly limit the eukaryotic life (Vaquer-Sunyer and Duarte 2008, Ekau et al. 2010). Conversely, euxinic waters are hot spots of prokaryotic

High bacterial diversity in euxinic lakes 29
diversity and activity (Pedros-Alio and Guerrero 1993, Garcia-Cantizano et al. 2005, Barberan and Casamayor 2011). The dynamic nature of physico-chemical gradients along the water column and the wide range of organic and inorganic compounds that accumulate in oxic-anoxic interfaces and bottom waters are impossible to mimic under laboratory conditions. This inability to reproduce in situ conditions in vitro has limited our success in recovering cultured representatives of many microbial groups, especially those that are not among the most abundant but have a key role for ecosystem functioning (Lynch and Neufeld 2015).
Most previous studies carried out in karstic lakes with euxinic bottom waters have focused on the diversity and activity of the abundant taxa and their impact into prevalent biogeochemical cycles (i.e. sulphur and carbon) (Camacho and Vicente 1998, Tonolla et al. 2004, Lehours et al. 2007, Casamayor et al. 2012). Particularly, many studies carried out in different lakes and lagoons of the Banyoles Karstic System (BKS, NE Spain) dealt on the seasonal dynamics and activity of anoxygenic photosynthetic sulfur bacteria (Borrego et al. 1999, Casamayor et al. 2007, Bañeras et al. 2010). Further studies aimed to gain a first view on the planktonic microbial diversity using 16S rRNA gene fingerprinting, showed that euxinic bottom waters harbored very diverse bacterial and archaeal communities that differed among lakes and seasons (Casamayor et al. 2000, Casamayor et al. 2001b, Casamayor et al. 2002, Lliros et al. 2008). In all these cases, an unknown but probably large fraction of microbial diversity remained hidden due to the low resolution of the technique used (i.e. DGGE). In this regard, a recent study using pyrotag sequencing of archaeal 16S rRNA genes revealed archaeal communities mainly composed of uncultured groups, whose distribution is mainly driven by sulfide and DOC concentrations (Fillol et al. 2015). In the present work, we have investigated the sulfurous waters of three karstic lakes of the BKS to unveil the phylogenetic novelty of bacterial groups inhabiting euxinic waters of varying sulfide. Our results show that cold, anoxic, sulfide-rich hypolimnetic waters harbor a high degree of novelty in 16S rRNA gene sequences, largely

Chapter 3 30
exceeding that found at the oxic-anoxic interface and with large metabolic potential. Materials and methods Study area and sampling Lakes Cisó, Vilar, and Lake Banyoles-basin III (C-III) are located in the Banyoles Karstic System, northeastern Spain (42°8'N, 2°45'E). The three lakes have an oxic-anoxic interface, or redoxcline, located at different depths in the water column. C-III is a meromictic, oligotrophic basin with a maximal depth of 32 m, and a redoxcline between 18 and 21 m depending on the season, where a conspicuous population of brown-colored GSB seasonally blooms (Borrego et al. 1999). Lake Vilar is a meromictic, mesotrophic lake formed by two circular basins of 9 m and 11 m depth and a surface area of 11,000 m2. In Vilar, the oxic-anoxic interface is usually located between 4.5 m to 6 m depth. Lake Cisó is a small monomictic eutrophic lake (650 m2), located 1 km away from Lake Vilar, with a maximum depth of 6.5 m, and a redoxcline at 1.5 m below the surface.
The lakes were sampled on May 2010, and vertical profiles of temperature, conductivity, oxygen, and redox potential, were measured in situ with a multiparametric probe OTT-Hydrolab MS5 (Hatch Hydromet, Loveland, CO, USA). Sulfide was measured following Trüper and Schlegel (1964). Photosynthetic pigments were analyzed by HPLC as previously reported (Borrego et al. 1999). Water samples for DNA extraction were pre-filtered through a 200 μm nylon mesh and collected on 0.1 μm Supor 293 mm membrane disc filters (Pall Life Sciences, IL, USA). DNA was extracted using the phenol/chloroform method in lysis buffer followed by ethanol precipitation (Zeigler Allen et al. 2012).

High bacterial diversity in euxinic lakes 31
DNA extraction, pyrosequencing and sequence
processing
Bacterial community composition was analyzed by PCR-amplified 16S rRNA gene tag sequencing with the primer pair 341F-907R matching the V3–V5 hypervariable regions (Van de Peer et al. 1996). Amplicons were sequenced using 454 FLX system technology (454 Life Sciences, Branford, CT, USA) at the Research and Testing Laboratory (Lubbock, TX). PCR and sequencing methods were done according to RTL protocols (http://www.researchandtesting.com). Sequences were quality filtered and edited with Mothur (Schloss et al. 2009), and denoised and chimera filtered using OTUPIPE (Edgar 2010, Edgar et al. 2011). Overall, 36,130 final sequences of >200 bp in length were clustered into Operational Taxonomic Units (OTUs) at 97% identity with OTUPIPE. OTUs were then aligned with SINA (Quast et al. 2013) and classified according to the SILVA108 SSURef database (Pruesse et al., 2007). Extremely novel sequences (identity in 16S RNA gene to previously reported sequences < 92% and with at least 5 sequences present in the dataset for each lake) were deposited in GenBank with accession numbers HG764771 to HG764781. The pyrotag 16S rRNA gene sequence dataset was deposited in the European Nucleotide Archive facility of the EMBL-EBI (http://www.ebi.ac.uk/) under accession number PRJEB5429.
The 16S rRNA gene novelty was explored by BLASTn identity searches against the GenBank database (search on January 2015). The identity of each single sequence was related to both the closest environmental match (CEM) and the closest cultured match (CCM) available in GenBank. Novelty patterns were presented via dispersion plots (del Campo and Massana 2011, Triado-Margarit and Casamayor 2013). The degree of phylogenetic novelty between the metalimnetic and hypolimnetic compartments for those OTUs with ≥80% of the sequences present in each compartment was compared. The closest match was used to explore the novelty within both different taxa and rare and abundant OTU categories. The non-parametric test of the Kruskal-Wallis one-way analysis of variance

Chapter 3 32
was used in the R environment (R Core Team 2014) to test for significance between categories and multiple pairwise comparisons using the “pgirmess” package. Results and discussion
Physico-chemical characterizat ion of the water column
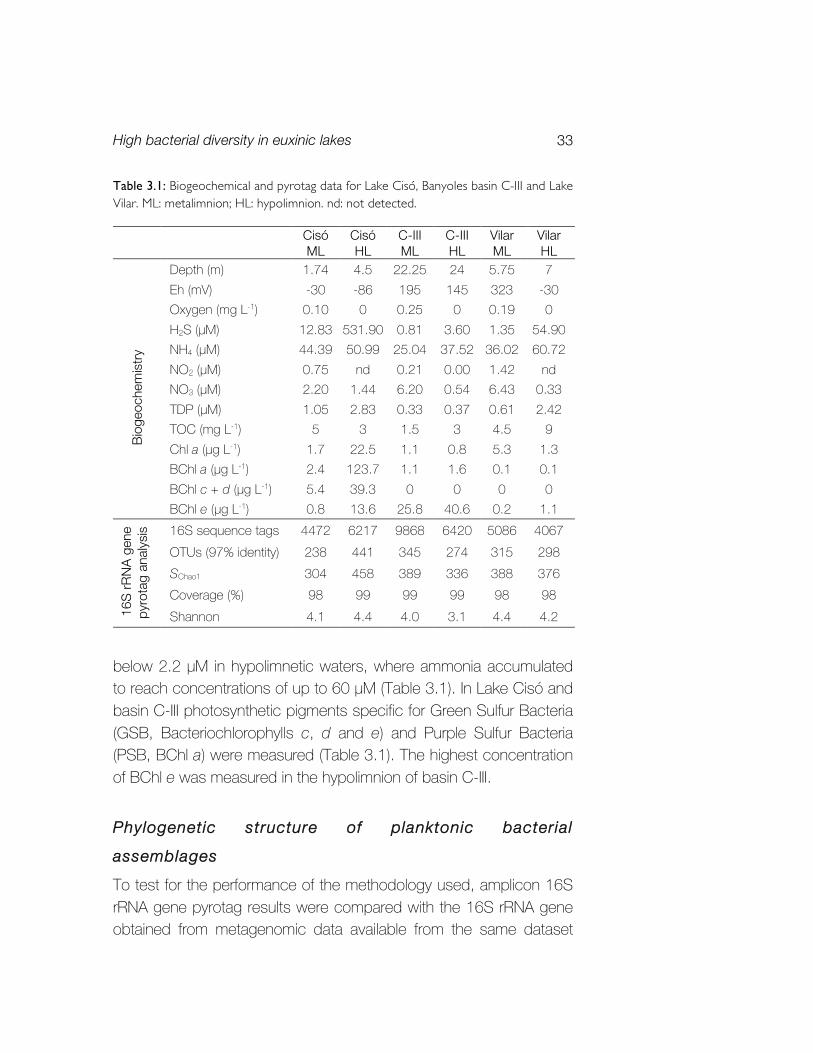
The water columns of the three lakes showed stable stratification with two water compartments separated by a well-defined redoxcline around the oxic-anoxic interface (Fig. 3.1, shaded area). Sulfide concentrations ranged between maximal concentrations in the hypolimnetic waters of Lake Cisó (600 µM) and a few micromols sulfide in the metalimnion of the three lakes (Table 3.1). Sulfide was undetectable in the upper, well-oxygenated epilimnion of all lakes. Higher nitrate and nitrite concentrations were always measured at the metalimnetic water layers. Oxidized nitrogen species were always
Figure 3.1: Vertical profiles of physico-chemical data for Banyoles basin C-III, Lake Vilar, and Lake Cisó. The 16S rRNA pyrotag analyses were carried out at two selected depths in each lake covering the redoxcline zones and the anoxic sulfurous hypolimnia. ORP: oxidation / reduction potential (Redox potential).
High bacterial diversity in euxinic lakes 33
Table 3.1: Biogeochemical and pyrotag data for Lake Cisó, Banyoles basin C-III and Lake Vilar. ML: metalimnion; HL: hypolimnion. nd: not detected.
Cisó
ML Cisó HL
C-III ML
C-III HL
Vilar ML
Vilar HL
Bio
geoc
hem
istr
y
Depth (m) 1.74 4.5 22.25 24 5.75 7 Eh (mV) -30 -86 195 145 323 -30 Oxygen (mg L-1) 0.10 0 0.25 0 0.19 0 H2S (μM) 12.83 531.90 0.81 3.60 1.35 54.90 NH4 (μM) 44.39 50.99 25.04 37.52 36.02 60.72 NO2 (μM) 0.75 nd 0.21 0.00 1.42 nd NO3 (μM) 2.20 1.44 6.20 0.54 6.43 0.33 TDP (μM) 1.05 2.83 0.33 0.37 0.61 2.42 TOC (mg L-1) 5 3 1.5 3 4.5 9 Chl a (μg L-1) 1.7 22.5 1.1 0.8 5.3 1.3 BChl a (μg L-1) 2.4 123.7 1.1 1.6 0.1 0.1 BChl c + d (μg L-1) 5.4 39.3 0 0 0 0 BChl e (μg L-1) 0.8 13.6 25.8 40.6 0.2 1.1
16S
rRN
A g
ene
pyro
tag
anal
ysis
16S sequence tags 4472 6217 9868 6420 5086 4067 OTUs (97% identity) 238 441 345 274 315 298 SChao1 304 458 389 336 388 376 Coverage (%) 98 99 99 99 98 98 Shannon 4.1 4.4 4.0 3.1 4.4 4.2
below 2.2 µM in hypolimnetic waters, where ammonia accumulated to reach concentrations of up to 60 µM (Table 3.1). In Lake Cisó and basin C-III photosynthetic pigments specific for Green Sulfur Bacteria (GSB, Bacteriochlorophylls c, d and e) and Purple Sulfur Bacteria (PSB, BChl a) were measured (Table 3.1). The highest concentration of BChl e was measured in the hypolimnion of basin C-III.
Phylogenetic structure of planktonic bacterial
assemblages To test for the performance of the methodology used, amplicon 16S rRNA gene pyrotag results were compared with the 16S rRNA gene obtained from metagenomic data available from the same dataset

Chapter 3 34
(Llorens-Mares et al. 2015). Relative abundances showed a high degree of concordance for the different taxa (Fig. 3.2) but noticeable discrepancies were observed for the Actinobacteria (possibly overestimated in PCR-pyrotag analyses) and for the Epsilonproteobacteria (probably underestimated). In fact, the reverse primer used for the preliminary PCR step (907R) showed one mismatch to 16S rRNA gene sequences from members of the Class Epsilonproteobacteria (5’-CCG TCA ATT CMT TTR AGT TT-3’). The in silico coverage of this primer against the ARB database only detected 2% of the epsilonproteobacterial sequences whereas a full coverage was obtained in silico using a modified version of this reverse primer (5’-CCG TCT ATT CMT TTR AGT TT-3’.) A similar underestimation of Epsilonproteobacteria in 16S-pyrotags compared to the metagenomic dataset was observed in samples from the Baltic Sea (Dupont et al. 2014), pointing to a systematic underestimation of Epsilonproteobacteria abundance by pyrotag analyses using the
Figure 3.2: Relationship between the relative abundance for the bacterial 16S rRNA gene found in the amplicons pyrotags (present study) and in the metagenomic shotgun analysis for Lake Cisó and Banyoles basin C-III (Llorens-Marès et al. 2015).

High bacterial diversity in euxinic lakes 35
currently available 907R primer. Accordingly, the use of alternative primers targeting other hypervariable regions (e.g. V1–V4) of the 16S rRNA gene or a modified version of the 907R primer are needed for surveying bacterial diversity in aquatic systems where Epsilonproteobacteria are present.
The average number of OTUs (97% identity cutoff) per sample was 318 (range 238–441 OTUs) with a sampling coverage close to 99% (Table 3.1). Overall, most abundant OTUs affiliated to Betaproteobacteria of the order Burkholderiales, Actinobacteria of the orders Frankiales and Micrococcales, Alphaproteobacteria of the SAR11 cluster (Pelagibacterales), Bacteroidetes (mainly Flavobacteriales), Chlorobiales (GSB), Deltaproteobacteria (Syntrophobacterales, probably sulfate-reducers, SRB), and Gammaproteobacteria (Chromatiales, PSB). These populations were differentially distributed between water layers and among lakes (Fig. 3.3 and Supplementary Table A.C3.1) and corresponded to taxa commonly found in freshwater lakes (Tamames et al. 2010, Newton et al. 2011). Shannon diversity index was fairly similar in the metalimnion and hypolimnion of lakes Vilar and Cisó, contrasting with the less diverse community in the hypolimnion of basin C-III due to the dominance of GSB (67.6% of total tag reads, Table 3.1 and Supplementary Table A.C3.1). Several studies carried out in meromictic lakes reported the occurrence of very rich and diverse microbial communities at oxic-anoxic interfaces and euxinic waters in comparison to those inhabiting the upper, well oxygenated water layers (Barberan and Casamayor 2011, Gies et al. 2014). In this regard, several authors have pointed out that hypolimnia of stratified lakes may promote endemism of microbial communities due to the isolation of bottom water (Shade et al. 2008, Barberan and Casamayor 2011).
The high relative abundance of Actinobacteria observed in the metalimnion of the three lakes (average 31.6%±5.6%) is consistent with the widespread distribution of this taxa in freshwater systems, where they constitute a diverse and dominant fraction of the heterotrophic bacterioplankton (Glockner et al. 2000, Barberan and

Chapter 3 36
Figu
re 3
.3:
Ord
er le
vel b
acte
rial c
omm
unity
stru
ctur
e (re
lative
abu
ndan
ces
in th
e 16
S rR
NA
gene
am
plico
n m
ixtur
e) in
the
met
alim
nia a
nd
hypo
limnia
of la
kes C
isó, V
ilar a
nd B
anyo
les b
asin
C-III.
High bacterial diversity in euxinic lakes 37
Casamayor 2010). Of special relevance is also the phylogenetic richness and abundance of sequences affiliated to well-known groups of sulfate reducers and sulfide oxidizers, indicating the potential for an active sulfur cycle at both the metalimnion and hypolimnion of basin C-III and Lake Cisó. The anoxic conditions and high sulfate concentrations present in this karstic area makes it a suitable environment for the growth and activity of planktonic SRB (23% of 16S rRNA amplicon genes affiliated to Deltaproteobacteria in Cisó-Hypolimnion). In this regard, metagenomic analyses of samples from the hypolimnion of Lake Cisó identified a substantial contribution of genes for sulfate reduction (c. 16% of total reads) from Desulfobacterales and Syntrophobacterales (Llorens-Mares et al. 2015). Similar contribution of planktonic SRB in euxinic bottom water layers has been reported for other meromictic lakes with active sulfur cycling such as Lake Mahoney (Klepac-Ceraj et al. 2012) and Arctic lake A (Comeau et al. 2012). The predominant sulfur oxidizers detected in the studied lakes were the anoxygenic photosynthetic sulfur bacteria of the phylum Chlorobi in basin C-III and the purple sulfur bacteria (i.e. Chromatiaceae) in Lake Cisó. Both groups have consistently been found in lakes of the Banyoles karstic system where they account for most of the biomass and C photoassimilation rates at the oxic-anoxic interfaces and hypolimnetic waters (Garcia-Cantizano et al. 2005). In the studied lakes, the predominance of anoxygenic sulfur bacteria over non-photosynthetic gamma- or epsilonproteobacterial sulfur oxidizers that are prevalent in oceanic Oxygen Minimum Zones or anoxic marine basins (Grote et al. 2008, Wright et al. 2012, Dupont et al. 2014) might be probably explained by the shallower location of sulfidic redoxclines at photic depths that favours the blooming of anoxygenic phototrophs. In turn, the low recovery of sequences affiliated to epsilonproteobacterial sulfur oxidizers might be related, in addition to the underestimation caused by the primer pair used (see above), to a low representativeness during spring and summer in comparison to winter season, where they constitute active population in the O2/H2S interface of basin C-III (Borrego et al. in preparation). In fact, metagenomic analyses of the

Chapter 3 38
same dataset detected genes from chemolithotrophic, sulfur oxidizing Epsilonproteobacteria related to C fixation (Arnon cycle), sulfide oxidation and denitrification in metalimnetic and hypolimnetic samples of basin C-III and Lake Cisó (Llorens-Mares et al. 2015). Interestingly, previous studies had reported that different types of anoxygenic photosynthetic bacteria dominate in the different lakes due to different ecophysiological strategies in pigment composition and use of light spectra, motility and carbon storage strategies (Guerrero et al. 1985, Van Gemerden et al. 1985), but our analyses extend this to sulfide oxidizers, sulfate reducers, denitrifying bacteria, and other functional guilds. Conversely, phylogenetically closer groups may belong to different functional guilds, as in the case of Actinobacteria that were predominant in the metalimnia of both lakes but whereas the family Microbacteriaceae dominated sulfur mineralization processes in Lake Cisó, Sporichthyaceae (Frankiales) were mostly involved in assimilatory sulfate reduction in Lake Banyoles. Understanding how the environmental conditions and community composition influence which taxa succeeds and the ultimate ecophysiological reasons are major challenges for future studies.
The metal imnetic and hypol imnetic genetic novelty To assess the phylogenetic novelty of the 16S rRNA gene sequences found in the meta- and hypolimnia we analyzed their identity against their first BLAST hit to both the closest environmental match (CEM) and closest cultured representatives (CCM) in databases (Fig. 3.4). Both water layers have c. 60% of the OTUs placed in the “cultured gap” area (Table 3.2). However, two major differences were observed in the novelty patterns of metalimnia vs. hypolimnia. First, a larger number of well-known OTUs of limited novelty (both CEM and CCM ≥97% identity) were found in the metalimnia (21%) than in the hypolimnia (6%). And second, a higher proportion of OTUs in the “highest novelty” area (both CEM and CCM
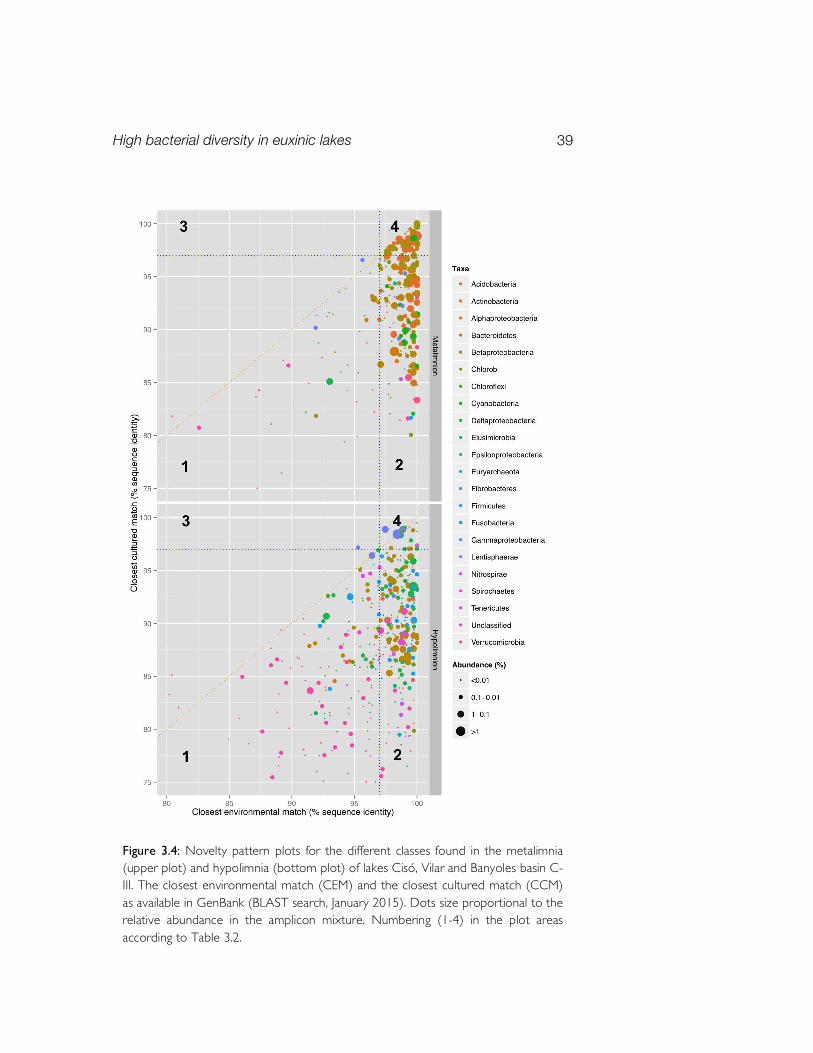
High bacterial diversity in euxinic lakes 39
Figure 3.4: Novelty pattern plots for the different classes found in the metalimnia (upper plot) and hypolimnia (bottom plot) of lakes Cisó, Vilar and Banyoles basin C-III. The closest environmental match (CEM) and the closest cultured match (CCM) as available in GenBank (BLAST search, January 2015). Dots size proportional to the relative abundance in the amplicon mixture. Numbering (1-4) in the plot areas according to Table 3.2.

Chapter 3 40
Table 3.2: Percentages and total number of OTUs in the two data subsets (metalimnion vs. hypolimnion) assigned to the different plot areas established in the novelty patterns (see also Fig. 3.4). The different plot areas were named according to the identity values to both the closest environmental match (CEM) and cultured representatives (CCM) in databases.
P lot area 1a P lot area 2b P lot area 3c P lot area 4d Metalimnion 17.2% (46) 61.4% (164) 0.0% (0) 21.3% (57) Hypolimnion 37.9% (148) 56.0% (219) 0.3% (1) 5.9% (23)
a) The highest novelty plot area: contains phylotypes matching < 97% identity to both CEM and CCM.
b) The cultured gap plot area: contains phylotypes matching > 97% identity to CEM and < 97% to CCM.
c) The environmental gap plot area contains phylotypes with sequence identity < 97% to CEM and > 97% to CCM.
d) The limited novelty plot area: contains phylotypes matching > 97 % to both CEM and CCM. According to a class/phylum-level novelty distribution,
Elusimicrobia and Chloroflexi were the taxa with the highest number of novel sequences with 81% and 35% of the OTUs below the 97% identity cutoff, respectively, and secondarily Fibrobacteres and Spirochaetes (Fig. 3.5). Elusimicrobia (formerly known as Termite Group-1) is a deeply branching, highly diverse bacterial group, which members have consistently been found in the most disparate environments (soil, wastewater, sediments and, particularly, the hindgut of termites) (Herlemann et al. 2007). According to the genomic analysis of the first cultivated representative (Elusimicrobium minutum), Elusimicrobia are capable of anaerobic growth by fermentation of sugars and amino acids and exhibit some tolerance to molecular oxygen (Herlemann et al. 2009). The occurrence of Elusimicrobia in the anoxic water layers of the studied lakes is thus in agreement with the physico-chemistry of the lakes and the large number of genes related with fermentative pathways recently

High bacterial diversity in euxinic lakes 41
identified in Lake Banyoles (Llorens-Mares et al. 2015). The presence of Chloroflexi is common in freshwater lakes, where they usually exhibit a large morphological and phylogenetical diversity, including green non-sulfur photosyntethic bacteria (Gich et al. 2001). In fact, the Chloroflexi is among the most abundant groups identified in euxinic water layers of stratified lakes (Lehours et al. 2007, Comeau
Figure 3.5: Class-level novelty distribution for the phylotypes found in lakes Cisó, Vilar and Banyoles basin C-III. The closest match identity as available in GenBank (BLAST search, January 2015).
Chapter 3 42
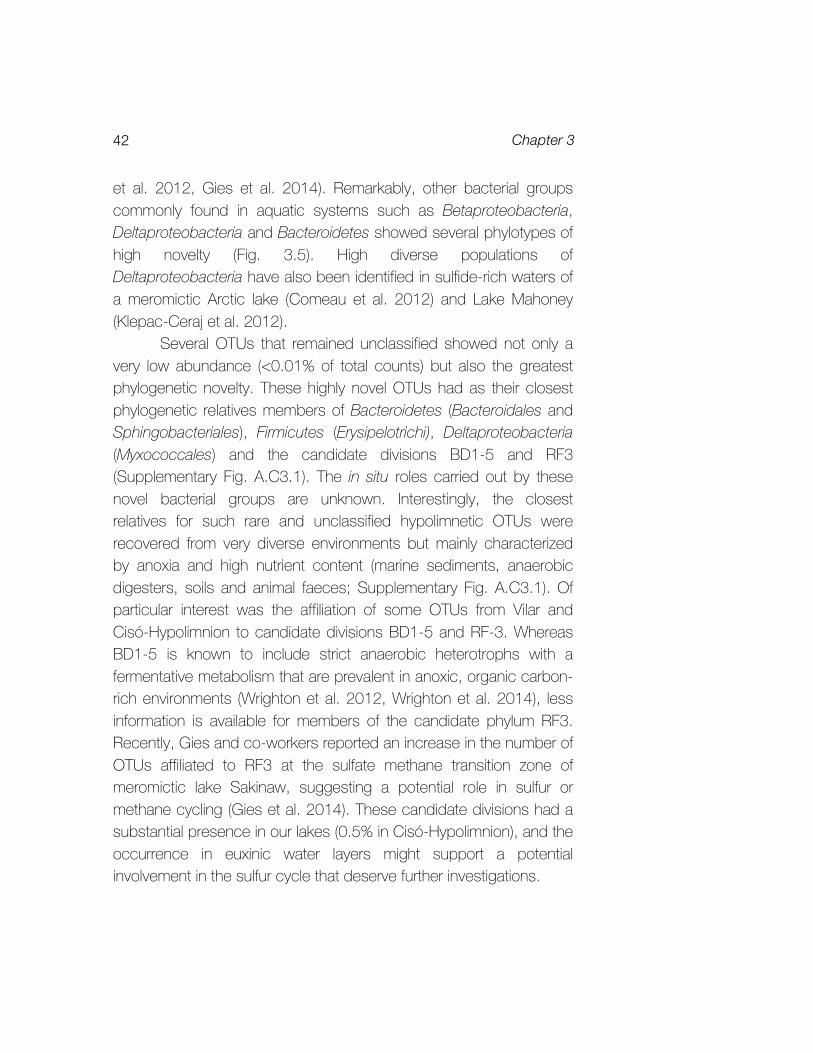
et al. 2012, Gies et al. 2014). Remarkably, other bacterial groups commonly found in aquatic systems such as Betaproteobacteria, Deltaproteobacteria and Bacteroidetes showed several phylotypes of high novelty (Fig. 3.5). High diverse populations of Deltaproteobacteria have also been identified in sulfide-rich waters of a meromictic Arctic lake (Comeau et al. 2012) and Lake Mahoney (Klepac-Ceraj et al. 2012).
Several OTUs that remained unclassified showed not only a very low abundance (<0.01% of total counts) but also the greatest phylogenetic novelty. These highly novel OTUs had as their closest phylogenetic relatives members of Bacteroidetes (Bacteroidales and Sphingobacteriales), Firmicutes (Erysipelotrichi), Deltaproteobacteria (Myxococcales) and the candidate divisions BD1-5 and RF3 (Supplementary Fig. A.C3.1). The in situ roles carried out by these novel bacterial groups are unknown. Interestingly, the closest relatives for such rare and unclassified hypolimnetic OTUs were recovered from very diverse environments but mainly characterized by anoxia and high nutrient content (marine sediments, anaerobic digesters, soils and animal faeces; Supplementary Fig. A.C3.1). Of particular interest was the affiliation of some OTUs from Vilar and Cisó-Hypolimnion to candidate divisions BD1-5 and RF-3. Whereas BD1-5 is known to include strict anaerobic heterotrophs with a fermentative metabolism that are prevalent in anoxic, organic carbon-rich environments (Wrighton et al. 2012, Wrighton et al. 2014), less information is available for members of the candidate phylum RF3. Recently, Gies and co-workers reported an increase in the number of OTUs affiliated to RF3 at the sulfate methane transition zone of meromictic lake Sakinaw, suggesting a potential role in sulfur or methane cycling (Gies et al. 2014). These candidate divisions had a substantial presence in our lakes (0.5% in Cisó-Hypolimnion), and the occurrence in euxinic water layers might support a potential involvement in the sulfur cycle that deserve further investigations.

High bacterial diversity in euxinic lakes 43
Acknowledgements X Triadó-Margarit is acknowledged for data analyses. This research was funded by grants GOS-LAKES CGL2009-08523-E and DARKNESS CGL2012-32747 to EOC and ARCANOX CGL2009-13318-C02-02 to CBM from the Spanish Office of Science (MINECO) and from financial support by the Beyster Family Fund of the San Diego Foundation and the Life Technologies Foundation to the J. Craig Venter Institute.

4 Connecting biodiversity and potential
functional role in modern euxinic
environments by microbial
metagenomics1,2
Abstract Stratified sulfurous lakes are appropriate environments for studying the links between composition and function in microbial communities and are potentially modern analogues of anoxic conditions prevailing in the ancient ocean. We explored these aspects in the Lake Banyoles karstic area (NE Spain) through metagenomics and in silico reconstruction of carbon, nitrogen, and sulfur metabolic pathways that were tightly coupled through a few bacterial groups. The 1 Original publication in Appendix B: Llorens-Marès T, S Yooseph, J Goll, J Hoffman, M Vila-Costa, CM Borrego, CL Dupont, EO Casamayor (2015) Connecting biodiversity and potential functional role in modern euxinic environments by microbial metagenomics. ISME J 9:1648-1661. doi:10.1038/ismej.2014.254. 2 See supplementary material in Appendix A
Chapter 4 46
potential for nitrogen fixation and denitrification was detected in both autotrophs and heterotrophs, with both nitrogen and carbon fixation being found in Chlorobiaceae. Campylobacterales accounted for a large percentage of denitrification genes, while Gallionellales were putatively involved in denitrification, iron oxidation and carbon fixation and may have a major role in the iron cycle. Bacteroidales were also abundant and showed potential for dissimilatory nitrate reduction to ammonium. The very low abundance of genes for nitrification, the minor abundance of anammox genes, the high potential for nitrogen fixation and mineralization, and the potential for chemotrophic CO2 fixation and CO oxidation all provide potential insights to anoxic zone functioning. We observed higher gene abundances of AOB than AOA that may have a geochemical and evolutionary link related to the relative abundance of Fe and Cu in these environments. Overall, these results offer a more detailed perspective on the microbial ecology of anoxic aquatic environments and may help to develop new geochemical proxies to infer biology and chemistry interactions in ancient ecosystems. Introduction Linking microbial community composition and ecological processes such as carbon (CO2 fixation and respiration), nitrogen (nitrification, denitrification, and N2 fixation), and sulfur cycling (sulfur assimilation, anaerobic sulfate respiration, and sulfide oxidation) is a primary goal for microbial ecologists. This information is needed to improve our understanding on the structure and functioning of microbial communities, to properly guide experimental research efforts, to promote our ability to understand fundamental mechanisms controlling microbial processes and interactions in situ (Prosser 2012), and to approach the study of earlier interactions biosphere-hydrosphere-geosphere (Severmann and Anbar 2009). However, A detailed comprehension of biological interactions in highly complex systems is difficult (Bascompte and Sole 1995).

Biodiversity and biogeochemistry in euxinic lakes 47
Stratified lakes with euxinic (anoxic and sulfurous) bottom waters are simplified study systems to explore current biodiversity-biogeochemistry interactions because of its high activity, large biomass, and low microbial diversity (Guerrero et al. 1985). Usually, oxic-anoxic interfaces contain conspicuous blooms of photosynthetic bacteria, which are often macroscopically visible because of the high intracellular content of pigments, and additional microbial populations also tend to accumulate (Pedrós-Alió and Guerrero 1993). These blooms are, in fact, natural enrichment cultures that facilitate physiological studies in situ (Van Gemerden et al. 1985). At such interfaces, fine gradients of physicochemical conditions are present and tight coupling between different biogeochemical cycles (mainly carbon, nitrogen and sulfur) are established. Microbes adapted to such gradients are difficult to culture because in situ conditions are very difficult to mimic in the laboratory, and their study has improved perceptibly by culture-independent methods (Casamayor et al. 2000).
Stratified euxinic lake systems may also provide potential modern day analogue ecosystems for the oceans during long periods of Earth history. The planet was essentially anoxic until 2.7-2.4 billion years ago, with a ferruginous ocean (Anbar 2008, Reinhard et al. 2013). With the advent of oxygenic photosynthesis, atmospheric oxygen began to rise, as did the oxygen content in the surface oceans. The deep oceans remained anoxic, but entered a period of temporal and spatial heterogeneity. Strong euxinic conditions might be expected in ancient coastal areas, with merely anoxic conditions in the open ocean, though high Fe deep ocean conditions would have been maintained (Reinhard et al. 2013). By contrast, Fe is low in the deep waters of the modern ocean and, therefore, it is difficult to find appropriate ancient ocean analogues in the current marine realm. With this in mind, stratified aquatic systems with high Fe concentrations in deep waters could be more appropriate modern day analogues of the Proterozoic ocean. Karstic lacustrine systems with a gradient of organic carbon delivery and sulfide concentrations generated by sulfate reduction, as well as

Chapter 4 48
being rich in iron, would provide reasonable biogeochemical analogues for ancient coastal to open ocean gradients.
In this study, we explored the oxic-anoxic interface (metalimnion) and bottom waters (hypolimnion) from two sulfurous lakes in the Banyoles karstic area (NE Spain) through shotgun metagenomics and in silico analysis of several metabolic pathways. In the framework of paleoreconstruction of anoxic conditions in ancient marine systems, one lake would be representative of strong euxinic conditions (Lake Cisó) and the other of low euxinia and an active iron cycle (basin III of Lake Banyoles). We explore the links between microbial composition and functionality for the carbon, nitrogen, and sulfur cycling after phylogenetic and functional identification. The taxonomic identity assigned to each functional step was determined by the closest match in databases, and the relative abundance and distribution of marker genes was comparatively analyzed among samples as a proxy of the potential in situ relevance of these pathways under the specific environmental conditions studied. Because of the lack of oxygen, large microbial biomass, and high contribution of deep dark fixation processes to overall CO2 incorporation (Casamayor 2010, Casamayor et al. 2008, 2012), we hypothesized a high genetic potential for chemotrophic CO2 fixation and a tight redox coupling between carbon, nitrogen and sulfur biogeochemical cycling. In addition, because of its euxinic nature we also expected a low contribution of both methanogens and ammonia oxidizers in the biogeochemical cycles prevailing in these environments. Materials and methods Environment and samples col lection
Lake Cisó and basin III of Lake Banyoles (Banyoles C-III) are in the Banyoles karstic area, northeastern Spain (42°8'N, 2°45'E), and the microbial communities inhabiting these water bodies have been extensively studied by limnologists and microbial ecologists (e.g.,

Biodiversity and biogeochemistry in euxinic lakes 49
Garcia-Gil and Abellà 1992, Guerrero et al. 1980, Pedrós-Alió and Guerrero 1993). The lakes were sampled on May 8–9, 2010. Vertical profiles of temperature, conductivity, oxygen, and redox potential were measured in situ with a multiparametric probe OTT-Hydrolab MS5 (Hatch Hydromet, Loveland, CO, USA). The different water compartments (oxic epilimnion, metalimnion with the oxic-anoxic interface, and anoxic hypolimnion) were determined for each lake according to the physico-chemical profiles recorded in-situ (Fig. 4.1). For sulfide analyses, 10 ml of subsamples were collected in screw-capped glass tubes and immediately alkalinized by adding 0.1 ml of 1 M NaOH and fixed by adding 0.1 ml of 1 M zinc acetate. Sulfide was analyzed in the laboratory according to Trüper and Schlegel (1964). For pigments, water samples were processed as described by Guerrero and colleagues (1985) and analyzed by HPLC as previously reported (Borrego et al. 1999). Iron (Fe+2) concentrations were obtained from Garcia-Gil (1990).
These lakes are stratified and have incoming sulfate-rich water seeping in through bottom springs resulting in deep waters rich in reduced sulfur compounds. An oxic-anoxic interface, or redoxcline, is established in the water column where light and sulfide usually coexist. Lake Banyoles is a gypsum karst spring area consisting of 6 main basins covering a surface area of 1.1 km2. The basin III (C-III) is meromictic with a maximal depth of 32 m, and a redoxcline between 18 and 21 m, depending on the season. Blooms of brown-colored photosynthetic green sulfur bacteria (Chlorobiaceae) and purple sulfur bacteria (Chromatiaceae) have been periodically reported (Garcia-Gil and Abellà 1992). Lake Cisó is a small monomictic lake (650 m2), located 1 km away from Lake Banyoles, with a maximum depth of 6.5 m. The thermocline is at 1.5 m, where different bacterial populations accumulate (Casamayor et al. 2000). The presence of aerobic chemoautotrophic sulfur-oxidizing bacteria, and substantial fixation of CO2 in the dark have been previously reported in sulfurous lakes (Casamayor 2010). Lake Cisó is a small eutrophic water body fully surrounded by trees that strongly limit the incident irradiance on the lake and the landscape provide continuous allochthonous

Chapter 4 50
organic matter inputs both by leaching from the littoral zone and submerged vegetal debris. The system is therefore prone to a dominance of aerobic respiration and mineralization in surface layers overlying sulfate respiration, fermentation, and anaplerotic pathways at depth. In addition, the conspicuous presence of photosynthetic organisms and dissolved and particulate organic matter causes a strong light extinction and quality filtering in the first two meters that severely limits the development of oxygenic and anoxygenic green phototrophs (Vila and Abellà 1994). Conversely, the open-basin Banyoles C-III is oligotrophic, with a lower influence of the littoral zone. The basin maintains a stable, sharp chemocline that oscillates in depth between 19 and 21 m depending on the season, being shallower during summer. Active sulfate reduction occurring at the permanent anoxic monimolimnion causes sulfide accumulation below the chemocline, usually reaching concentrations of up to 1 mM
Figure 4.1: Vertical profiles of physico-chemical data for Lake Banyoles basin C-III and Lake Cisó. Metagenomic analyses were carried out at two selected depths (dotted lines): the oxic-anoxic interface (shadowed areas indicate the redoxcline zone) and the anoxic and sulfurous (euxinic) hypolimnia.
Biodiversity and biogeochemistry in euxinic lakes 51
during summer and late fall. Lower sulfide concentrations are common however during spring. Light intensities reaching the O2/H2S interface are generally low (between 1% and 0.1% of surface incident light in winter and summer, respectively) despite the transparency of the epilimnetic waters of Lake Banyoles. The brown-pigmented green sulfur bacteria are better adapted to low irradiances than the green-pigmented (Garcia-Gil and Abellà 1992) and massively bloom in C-III.
The oxic-anoxic metalimnion interface and the euxinic (anoxic and sulfurous) hypolimnion samples for metagenomic analyses were determined in situ according to the vertical physico-chemical profiles. Samples were pre-filtered in the field through a 200 μm nylon mesh and kept in the dark in 25 L polycarbonate carboys until further processing in the lab 2–4 hours later. The plankton was collected using serial filtration onto 3.0, 0.8, and 0.1μm Supor 293 mm membrane disc filters (Pall Life Sciences, Port Washington, NY, USA), and stored in liquid nitrogen or -80ºC until DNA extraction. DNA extraction and pyrosequencing was carried out at the J Craig Venter Institute in Rockville, MD, USA as recently reported (Zeigler Allen et al. 2012). DNA sequences analyses
A shotgun metagenomics approach was applied on all three size fractions of four samples from Lakes Cisó and Banyoles C-III. Identical reads were removed using CD-HIT (Li and Godzik 2006). Annotation of metagenomic reads was conducted through the JCVI prokaryotic annotation pipeline (Tanenbaum et al. 2010) using Uniref100, PFAM, TIGRfam and KEGG Orthologs (KO) databases for taxonomic and functional annotation. JCVI Metagenomics reports (http://jcvi.org/metarep) was used for analysis and comparative metagenomics (Goll et al. 2010). KO annotation was used for functional analysis and KO counts were normalized according to the length of the read and the length of the target gene (Sharon et al. 2009b). The communities and functional profiles found in each size fraction were highly similar (Supplementary Fig. A.C4.1) and, therefore, we pooled all reads after normalizing for sequencing depth

Chapter 4 52
for subsequent analyses, which allows for a better comparison of metagenomes.
The functional analyses focused on the three main biogeochemical cycles for this type of lakes, i.e., carbon (C), nitrogen (N) and sulfur (S) cycling. The genetic potential of the microbial community was analyzed following the C, N, and S marker genes (KOs) as reported by (Lauro et al. 2011) with a few modifications. We amended this previous rubric by adding the anaerobic carbon fixation carried out through the Calvin cycle by Chromatiaceae and additional genes for polysulfide reduction, nitrate reduction, and nitrite oxidation. In addition, the genes pyruvate:ferredoxin oxidoreductase (porA/B) were not considered as marker genes for fermentation as in Lauro et al. (2011), because they are key genes in the rTCA cycle used for carbon fixation by Epsilonproteobacteria abundant in our study lakes (Campbell and Cary 2004, Takai et al. 2005). Because both sulfide oxidation and dissimilatory sulfate reduction pathways are mediated by the same set of genes (aprA, aprB, and dsrA) but are found in different families of bacteria, we assigned metagenomic reads to each pathway according to phylogeny, i.e., sulfate reduction for Firmicutes and Deltaproteobacteria reads, and sulfide oxidation for Alphaproteobacteria, Betaproteobacteria, Chlorobiaceae, and Chromatiaceae. Finally, for the sulfur-oxidizing Epsilonproteobacteria of the order Campylobacterales we specifically searched for sox genes (coding for thiosulfate oxidation) not currently available in the KEGG database. Marker genes used in the present work are shown in supplementary material (Supplementary Table A.C4.1). Hierarchical clustering and heatmap plots were generated with R (R Core Team 2014) using the library ‘seriation’. Metagenomic data has been deposited at CAMERA (Sun et al. 2011) under accession number CAM_P_0001174.
Biodiversity and biogeochemistry in euxinic lakes 53
Results Environmental parameters
At the time of sampling (spring 2010), the water column was thermally stratified with thermoclines spanning from 1.5 to 3 m in Lake Cisó, and 7 to 14 m in basin C-III (Fig. 4.1). Chemical stratification was disconnected from thermal stratification in basin C-III, where a sharp chemocline was detected at 21 m depth based on the higher conductivity of incoming sulfate-rich waters. The epilimnion of C-III showed oxygen concentrations > 6 mg l–1, with rapid drawdowns in the hypolimnion, and the sharp oxic-anoxic interface caused an abrupt decrease in the redox potential and generated of a pronounced redoxcline (Fig. 4.1, shaded area). In Lake Cisó, the epilimnion (0–1.5 m depth) was oxygen deficient (0.2 -1 mg l–1) and the water column became completely anoxic below 2 m depth. In this case, the redoxcline and the oxic-anoxic interface were located in a narrow water layer of 0.5 m width (1.5–2 m depth). The concentration of nitrogen and sulfur species changed according to these physico-chemical gradients with high concentrations of ammonia mainly in the hypolimnia (up to 60 µM) and sulfide concentrations ranging between 532 µM in Lake Cisó and <1 µM in C-III in agreement with redox potential (Eh) measurements (Table 4.1, and Supplementary Fig. A.C4.2). The concentration of Chl a measured in the lakes agreed with their traditional trophic status (oligotrophic for C-III, and mesotrophic for Lake Cisó). Biomarker pigments for green sulfur (BChl c, d and e) and purple sulfur bacteria (BChl a) were detected in the metalimnion and hypolimnion of Lake Cisó and basin C-III. Particularly, conspicuous concentrations of BChl e, the characteristic pigment of brown-colored species of Chlorobium, were measured between 22 and 24 m depth in basin C-III (Table 4.1). An active Fe2+ cycle has been previously reported in Lake Banyoles with concentrations 8-10 µM in both the resurgence of groundwater (bottom spring) and water column of basin C-III, inflow velocity of 0.8 mmol total Fe/hour, and concentrations up to 8 mg

Chapter 4 54
Table 4.1: Biogeochemical data for Lake Cisó and Banyoles basin C-III. Abbreviations: BChl, bacteriochlorophyll; b.d.l., below detection limits; Chla, chlorophyll a; HL, hypolimnion; ML, metalimnion; Eh, redox potential; TOC, total organic carbon; TDP, total dissolved phosphorus.
Cisó ML
Cisó HL
C-I I I ML
C-I I I HL
Depth (m) 1.75 4.5 22.25 24 Temperature (ºC) 12.9 10.6 12.6 12.6 Conductivity (μS cm-1) 2260 2268 2603 2604 Eh (mV) -30 -86 195 145 Oxygen (mg l-1) 0.10 0 0.25 0 H2S (μM) 12.8 531.9 0.8 3.6 Light (% incident) 1% <0.1% 1% <0.1% TOC (mg L-1) 5 3 1.5 3 pH 7.40 7.23 7.14 7.15 TDP (μM) 1.05 2.83 0.33 0.37 NH4 (μM) 44.39 50.99 25.04 37.52 NO2 (μM) 0.75 b.d.l. 0.21 0.00 NO3 (μM) 2.20 1.44 6.20 0.54 Urea (μM) 4.84 0.17 1,91 1.08 Si (μM) 185.0 168.1 144.8 114.5 Chl a (μg l-1) 1.7 22.5 1.1 0.8 BChl a (μg l-1) 2.4 123.7 1.1 1.6 BChl c and d (μg l-1) 5.4 39.3 0 0 BChl e (μg l-1) 0.8 13.6 25.8 40.6
total Fe/g in sediment (dry weight) (Garcia-Gil 1990). Interestingly, we also observed substantial concentrations of nitrate in the bottom of the basin, coming from the groundwater, and high concentration in surface waters originating from the surrounding crop fields and farms (Supplementary Fig. A.C4.2). Taxonomic structure of the microbial communit ies
The overall taxonomic breakdown of the communities was assessed using the phylogenetic annotation of the metagenomic reads. The Domain Bacteria numerically dominated the genetic composition of
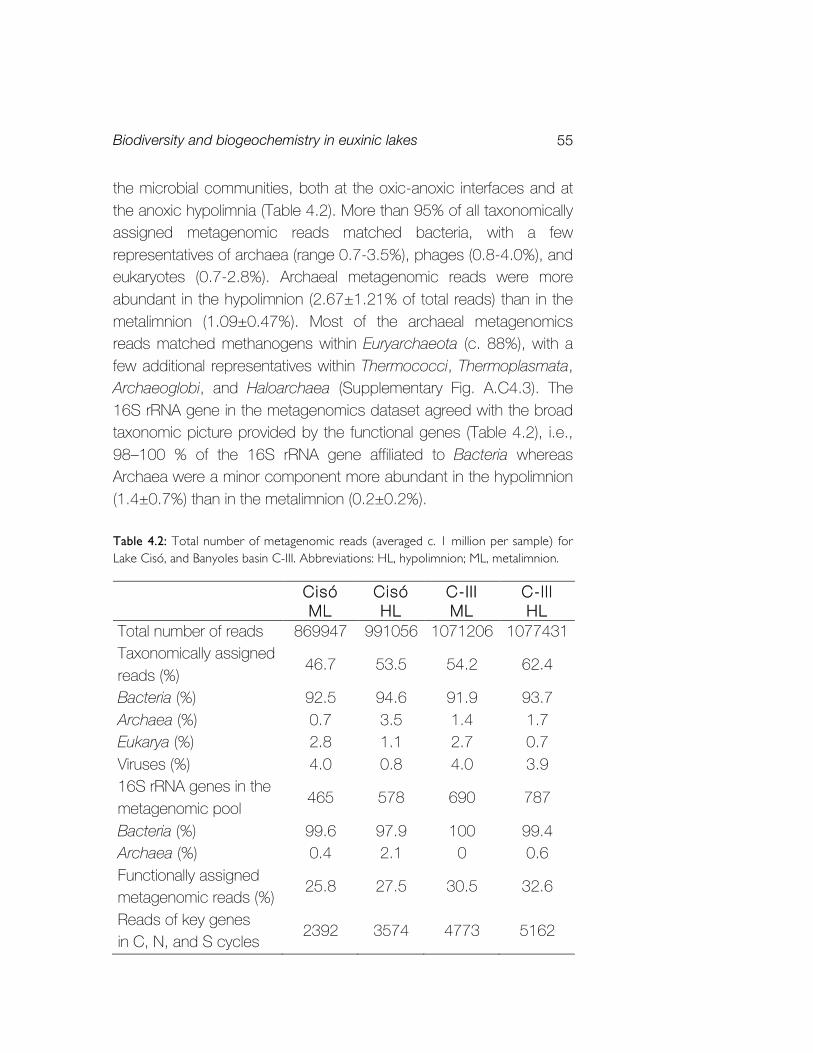
Biodiversity and biogeochemistry in euxinic lakes 55
the microbial communities, both at the oxic-anoxic interfaces and at the anoxic hypolimnia (Table 4.2). More than 95% of all taxonomically assigned metagenomic reads matched bacteria, with a few representatives of archaea (range 0.7-3.5%), phages (0.8-4.0%), and eukaryotes (0.7-2.8%). Archaeal metagenomic reads were more abundant in the hypolimnion (2.67±1.21% of total reads) than in the metalimnion (1.09±0.47%). Most of the archaeal metagenomics reads matched methanogens within Euryarchaeota (c. 88%), with a few additional representatives within Thermococci, Thermoplasmata, Archaeoglobi, and Haloarchaea (Supplementary Fig. A.C4.3). The 16S rRNA gene in the metagenomics dataset agreed with the broad taxonomic picture provided by the functional genes (Table 4.2), i.e., 98–100 % of the 16S rRNA gene affiliated to Bacteria whereas Archaea were a minor component more abundant in the hypolimnion (1.4±0.7%) than in the metalimnion (0.2±0.2%). Table 4.2: Total number of metagenomic reads (averaged c. 1 million per sample) for Lake Cisó, and Banyoles basin C-III. Abbreviations: HL, hypolimnion; ML, metalimnion.
Cisó ML
Cisó HL
C-I I I ML
C-I I I HL
Total number of reads 869947 991056 1071206 1077431 Taxonomically assigned reads (%) 46.7 53.5 54.2 62.4
Bacteria (%) 92.5 94.6 91.9 93.7 Archaea (%) 0.7 3.5 1.4 1.7 Eukarya (%) 2.8 1.1 2.7 0.7 Viruses (%) 4.0 0.8 4.0 3.9 16S rRNA genes in the metagenomic pool 465 578 690 787
Bacteria (%) 99.6 97.9 100 99.4 Archaea (%) 0.4 2.1 0 0.6 Functionally assigned metagenomic reads (%) 25.8 27.5 30.5 32.6
Reads of key genes in C, N, and S cycles 2392 3574 4773 5162

Chapter 4 56
Interestingly, we observed higher proportion of functional reads affiliated to Crenarchaeota-Thaumarchaeota at the oxic-anoxic interface (12.3±0.4% of total archaeal reads) than at the anoxic and sulfurous bottom of the lakes (8.6±0.5%). Thaumarchaeota metagenomic reads putatively assigned to ammonia-oxidizers were 0.03% of total reads but were not detected in the 16S rRNA pool. Conversely, ammonia-oxidizing bacteria (AOB, Nitrosomonadales- and Nitrosococcus-like) and nitrite-oxidizing bacteria (NOB, Nitrospirae-like) metagenomic reads were detected at ten times higher concentration (0.3% of total reads). AOB were also detected in the 16S rRNA pool at similar concentrations (0.1% of total 16S rRNA gene). Overall, the most abundantly recovered 16S rRNA gene from the metagenomic dataset matched Chlorobiales (green sulfur bacteria; 20%, range 5-50%), Campylobacterales (epsilon-Proteobacteria; 14%, range 11-21%), Burkholderiales (beta-Proteobacteria; 12%, range 0.5-35%), OD1 (8%, range 4-13%), and Frankiales (Actinobacteria; 5%, range 0.3-12%), among others (Fig. 4.2, and Supplementary Table A.C4.2). These populations were differentially distributed between layers and lakes (Fig. 4.2, and see details in Supplementary Table A.C4.2) and yielded a taxonomic clustering according to the redox potential, with samples with higher redox (> -30 mV) and lower sulfide concentrations (sulfide <13 µM) closer each other than to the most euxinic sample (Lake Cisó hypolimnion, sulfide >500 µM, redox -86 mV; Table 4.1). Functional structure of the microbial communit ies
The metagenomic dataset comprised four million reads of average length 377 bp and 54 % of the metagenomic reads were taxonomically assigned based on the APIS or BLAST, while 22% could be assigned KO numbers and thus putative functions (e-value 10-5). From the identified KOs, we selected marker genes related to carbon (C), nitrogen (N), and sulfur (S) cycling (Supplementary Table A.C4.1). Anaerobic C fixation, nitrogen fixation, and assimilatory sulfate reduction genes accounted for a substantial percentage of annotated reads in the hypolimnia, whereas genes for aerobic

Biodiversity and biogeochemistry in euxinic lakes 57
Figure 4.2: Prokaryotic comm
unity structure (relative abundances at the Order level) of Lake Banyoles basin C
-III and Lake Cisó obtained from
the 16S rRNA gene present in the m
etagenomic pool. See detailed inform
ation in Supplementary Table A.C4.2. H
ierarchical clustering based on Bray-Curtis dissim
ilarity matrices.
Chapter 4 58
respiration, nitrogen assimilation, and sulfur mineralization were more abundant at the oxic-anoxic interfaces (Supplementary Table A.C4.3). Other less abundant metabolic pathways such as ammonification, anammox-SRAO (sulfate-reducing anaerobic ammonia oxidation, Rikmann et al. 2012), and dissimilatory sulfate reduction were detected,mostly in the hypolimnion of Lake Cisó. Such differences were globally captured by a functional level (hierarchical analysis; C, N and S pathways were examined) that grouped the samples according to presence/absence of oxygen (Fig. 4.3). This clustering analysis produced the same result using multiple other functional annotations, including KEGG (EC), GO terms, and MetaCyc. Similarly, repeating this analysis with all size fractions as separate libraries (data not shown), and housekeeping genes
Figure 4.3: Heatmap plot and functional clustering of the selected KEGG Orthologs for the predicted ORFs from the metagenomic reads for Lake Cisó and Banyoles basin C-III.
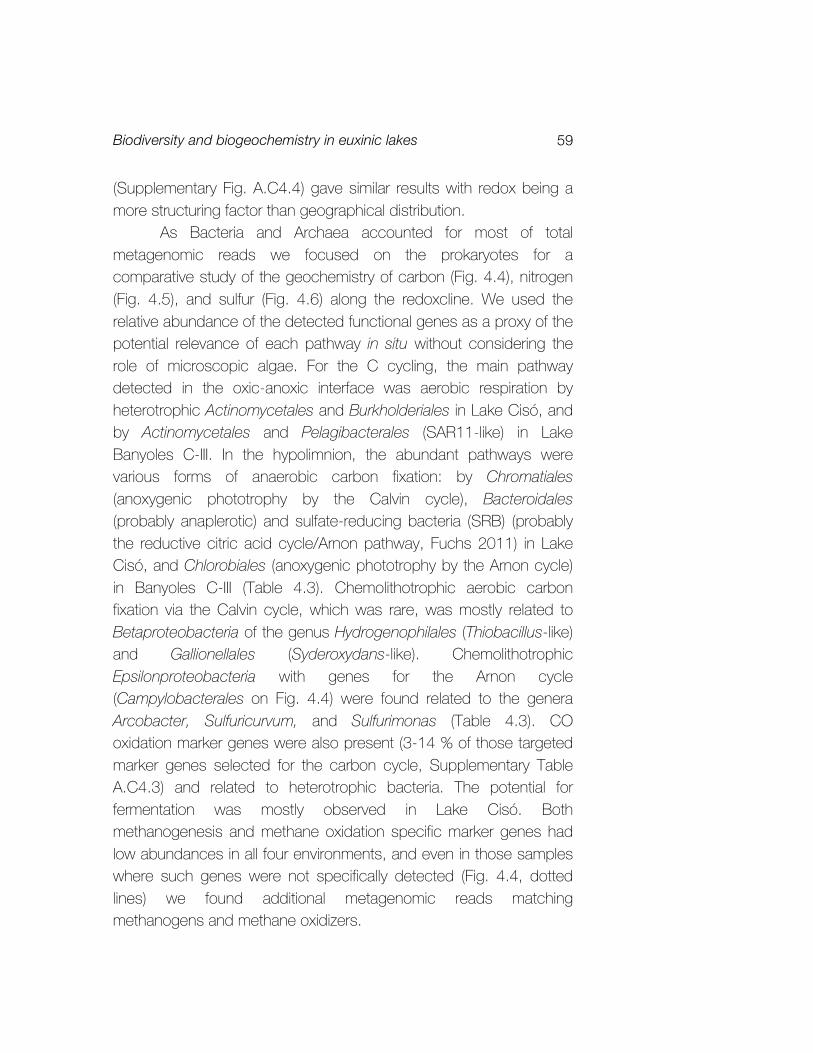
Biodiversity and biogeochemistry in euxinic lakes 59
(Supplementary Fig. A.C4.4) gave similar results with redox being a more structuring factor than geographical distribution.
As Bacteria and Archaea accounted for most of total metagenomic reads we focused on the prokaryotes for a comparative study of the geochemistry of carbon (Fig. 4.4), nitrogen (Fig. 4.5), and sulfur (Fig. 4.6) along the redoxcline. We used the relative abundance of the detected functional genes as a proxy of the potential relevance of each pathway in situ without considering the role of microscopic algae. For the C cycling, the main pathway detected in the oxic-anoxic interface was aerobic respiration by heterotrophic Actinomycetales and Burkholderiales in Lake Cisó, and by Actinomycetales and Pelagibacterales (SAR11-like) in Lake Banyoles C-III. In the hypolimnion, the abundant pathways were various forms of anaerobic carbon fixation: by Chromatiales (anoxygenic phototrophy by the Calvin cycle), Bacteroidales (probably anaplerotic) and sulfate-reducing bacteria (SRB) (probably the reductive citric acid cycle/Arnon pathway, Fuchs 2011) in Lake Cisó, and Chlorobiales (anoxygenic phototrophy by the Arnon cycle) in Banyoles C-III (Table 4.3). Chemolithotrophic aerobic carbon fixation via the Calvin cycle, which was rare, was mostly related to Betaproteobacteria of the genus Hydrogenophilales (Thiobacillus-like) and Gallionellales (Syderoxydans-like). Chemolithotrophic Epsilonproteobacteria with genes for the Arnon cycle (Campylobacterales on Fig. 4.4) were found related to the genera Arcobacter, Sulfuricurvum, and Sulfurimonas (Table 4.3). CO oxidation marker genes were also present (3-14 % of those targeted marker genes selected for the carbon cycle, Supplementary Table A.C4.3) and related to heterotrophic bacteria. The potential for fermentation was mostly observed in Lake Cisó. Both methanogenesis and methane oxidation specific marker genes had low abundances in all four environments, and even in those samples where such genes were not specifically detected (Fig. 4.4, dotted lines) we found additional metagenomic reads matching methanogens and methane oxidizers.

Chapter 4 60
Car
bon
cycl
e:CISÓ
AN
AER
OB
ICA
ERO
BIC
FAC
ULT
ATIV
E
Cal
vin
cycl
e ca
rbon
fixa
tion
Ana
erob
ic c
arbo
n fix
atio
n
Aer
obic
resp
iratio
n
Ferm
enta
tion M
etha
noge
nesi
s
Aer
obic
met
hane
oxi
datio
n
(Aer
obic
)C
O o
xida
tion
CO
CO
2
METALIMNION
Org
anic
mat
ter
(CH
2O)
H2
CH
4
CO
2
CIII
AN
AER
OB
ICA
ERO
BIC
FAC
ULT
ATIV
E
Cal
vin
cycl
e ca
rbon
fixa
tion
Ana
erob
ic c
arbo
n fix
atio
n
Aer
obic
resp
iratio
n
Ferm
enta
tion M
etha
noge
nesi
s
Aer
obic
met
hane
oxi
datio
n
(Aer
obic
)C
O o
xida
tion
CO
CO
2O
rgan
ic m
atte
r(C
H2O
)
H2
CH
4
CO
2
AN
AER
OB
ICA
ERO
BIC
FAC
ULT
ATIV
E
Cal
vin
cycl
e ca
rbon
fixa
tion
Ana
erob
ic c
arbo
n fix
atio
n
Aer
obic
resp
iratio
n
Ferm
enta
tion M
etha
noge
nesi
s
Aer
obic
met
hane
oxi
datio
n
(Ana
erob
ic)
CO
oxi
datio
nC
O
CO
2
HYPOLIMNION
Org
anic
mat
ter
(CH
2O)
H2
CH
4
CO
2A
NA
ERO
BIC
AER
OB
ICFA
CU
LTAT
IVE
Cal
vin
cycl
e ca
rbon
fixa
tion
Ana
erob
ic c
arbo
n fix
atio
n
Aer
obic
resp
iratio
n
Ferm
enta
tion M
etha
noge
nesi
s
Aer
obic
met
hane
oxi
datio
n
(Ana
erob
ic)
CO
oxi
datio
n
CO
CO
2O
rgan
ic m
atte
r(C
H2O
)
H2
CH
4
CO
2
Hydr
ogen
ophil
lales
24%
**Chr
omat
iales
3%
Actin
omyc
etale
s 42%
Burk
holde
riales
36%
Burk
holde
riales
48%
Actin
omyc
etale
s 21%
Met
hano
micr
obial
esM
etha
nosa
rcina
les
Rhod
ocyc
lales
Burk
holde
riaBu
rkho
lderia
Rhod
ocyc
lales
Rhod
ocyc
lales
Actin
omyc
etale
s 50%
Burk
holde
riales
22%
Sphin
goba
cteria
les 1
3%Ca
mpy
lobac
tera
les12
%
Acho
leplas
mat
ales
Clos
tridial
esSp
iroch
aeta
les
Acho
leplas
mat
ales
Bacil
lales
Clos
tridial
es
Actin
omyc
etale
s 23%
Spiro
chae
tales
23%
Bacte
roida
les 1
2%De
sulfa
rcula
les 1
2%De
sulfo
bacte
rales
10%
Chlor
obial
es 9
%Cl
ostrid
iales
5%
Synt
roph
obac
tera
les 4
%
Actin
omyc
etale
s 40%
Rick
ettsi
ales (
SAR1
1) 1
5%
Actin
omyc
etale
s 26%
Actin
omyc
etale
s 54%
Actin
omyc
etale
s 57%
Clos
tridial
es 2
6%Sy
ntro
phob
acte
rales
15%
Desu
lfuro
mon
adale
sTh
erm
otog
ales
**Chr
omat
iales
21%
Gall
ionell
ales 2
9%Hy
drog
enop
hillal
es 8
%
Gall
ionell
ales 7
8%
Chlor
obial
es 7
8%Ca
mpy
lobac
tera
les 4
%
Chlor
obial
es 7
0%Ca
mpy
lobac
tera
les 3
%
Figu
re
4.4:
Ge
netic
po
tent
ial
for
seve
ral
steps
of t
he c
arbo
n cy
cle
in La
ke
Cisó
an
d Ba
nyole
s bas
in C-
III us
ing
a co
mbin
ation
of
no
rmali
zed
mar
ker
gene
s. Ar
rows
siz
e pr
opor
tiona
l to
th
e po
tent
ial
flux
of
the
carb
on p
athwa
ys (
100%
va
lue, s
ee S
upple
men
tary
Table
A.
C4.3)
. Do
tted
lines
: no
t de
tecte
d m
arke
d ge
nes
but
putat
ive p
rese
nce
of th
e pa
thwa
y (se
e m
ain te
xt).
Relat
ive a
bund
ance
s fo
r th
e m
ain
micr
obes
po
tent
ially
drivi
ng
each
co
nver
sion
step
are
show
n (o
nly f
or t
hose
th
at co
ntrib
uted
>1%
of
the
mar
ker
gene
s m
ixtur
e). *
*Chromatiales:
anox
ygen
ic ph
otot
roph
y th
roug
h th
e Ca
lvin
cycle
.

Biodiversity and biogeochemistry in euxinic lakes 61
METALIMNION
Nitrogen cycle:
CISÓN
O3 -
NO
2 -
NH
4 +
N2 +N
2 OO
rganic N
Nitrogen assim
ilation
Am
monification
Nitrification
Mineralization
Nitrogen fixation
Anam
mox
(SR
AO
)
Denitrification
Nitrate reduction + N
itrite oxidation(N
arGH
/NxrA
B)
Nitrate reduction
Nitrate reduction
Nitrate reduction
Nitrate reduction
Nitrate reduction + N
itrite oxidation(N
arGH
/NxrA
B)
Nitrate reduction + N
itrite oxidation(N
arGH
/NxrA
B)
Nitrate reduction + N
itrite oxidation(N
arGH
/NxrA
B)
NO
3 -
NO
2 -
NH
4 +
N2 +N
2 OO
rganic N
Nitrogen assim
ilation
Am
monification
Nitrification
Mineralization
Nitrogen fixation
Anam
mox
(SR
AO
)
Denitrification
CIII
HYPOLIMNION
NO
3 -
NO
2 -
NH
4 +
N2 +N
2 OO
rganic N
Nitrogen assim
ilation
Am
monification
Nitrification
Mineralization
Nitrogen fixation
Anam
mox
(SR
AO
)
Denitrification
NO
3 -
NO
2 -
NH
4 +
N2 +N
2 OO
rganic N
Nitrogen assim
ilation
Am
monification
Nitrification
Mineralization
Nitrogen fixation
Anam
mox
(SR
AO
)
Denitrification
Bacteroidales 57%
BacteroidalesBacteroidales
BacteroidalesD
esulfuromonadales
Cam
pylobacterales
Cam
pylobacterales 47%Syntrophobacteales 23%
Cam
pylobacterales 35%O
ceanospirillales 29%C
ampylobacterales 63%
Desulfovibrionales 56%
Deferribacterales 16%
Cam
pylobacterales 69%
Cam
pylobacterales 85%
Cam
pylobacterales 27%O
ceanospirillales 19%G
allionellales 17%
Cam
pylobacterales 39%O
ceanospirillales 26%G
allionellales 16%
Actinomycetales 57%
Burkholderiales 23%
Burkholderiales 53%**N
itrospirae (NO
B)
Burkholderiales 94%**N
itrospirae (NO
B)
Actinomycetales 45%
Burkholderiales 31%**N
itrospirae (NO
B)
Burkholderiales 33%R
hodobacterales 33%**N
itrospirae (NO
B)
**Nitrosom
onadales**N
itrosococcus**Thaum
archaeota
**Nitrosom
onadales**N
itrosococcus**Thaum
archaeota
**Nitrosom
onadales**N
itrosococcus**Thaum
archaeota
**Nitrosom
onadales**N
itrosococcus**Thaum
archaeota
Actinomycetales 12%
Burkholderiales 9%
Actinomycetales 43%
Chlorobiales 17%
Rickettsiales 7%
Cam
pylobacterales 6%
Chlorobiales 59%
Cam
pylobacterales 19%G
allionellales 4%
Syntrophobacterales 51%C
hlorobiales 19%
Desulfovibrionales
SyntrophobacteralesC
hlorobiales
Syntrophobacterales
SyntrophobacteralesD
esulfuromonadales
SyntrophobacteralesD
esulfobacterales
Chlorobiales 88%
Chlorobiales 89%
Actinomycetales 13%
Bacteroidales 14%C
lostridiales 8%
Thermotogales 11%
Actinomycetales 9%
Rickettsiales 8%
Cam
pylobacterales 23%C
hlorobiales 12%
Figure 4.5:
Genetic
potential for several steps of
the nitrogen
cycle in
Lake Cisó
and Banyoles
basin C-III
using a
combination of norm
alized m
arker genes. Arrows size
proportional to
the potential
flux of
the nitrogen
pathways (100%
value, see
Supplementary
Table A.C4.3). Dotted lines:
not detected marked genes
but putative
presence of
the pathw
ay (see
main
text). Relative abundances for
the m
ain m
icrobes potentially
driving each
conversion step are shown (only
for those
that contributed
>1% of
the m
arker genes
mixture).
**Presence of AOA, AO
B and
NO
B reads
in the
metagenom
ic pool.

Chapter 4 62
Sulfu
r cyc
le:
CISÓ
METALIMNION
SO
42-
H2S
Ass
imila
tory
sul
fate
redu
ctio
n Dis
sim
ilato
ry s
ulfa
te re
duct
ion
Sul
fur o
xida
tion
Min
eral
izat
ion
Org
anic
sul
fur
CIII
SO
42-
H2S
Ass
imila
tory
sul
fate
redu
ctio
n Dis
sim
ilato
ry s
ulfa
te re
duct
ion
Sul
fur o
xida
tion
Min
eral
izat
ion
Org
anic
sul
fur
HYPOLIMNION
SO
42-
H2S
Ass
imila
tory
sul
fate
redu
ctio
n Dis
sim
ilato
ry s
ulfa
te re
duct
ion
Sul
fur o
xida
tion
Min
eral
izat
ion
Org
anic
sul
fur
RS
N
Pol
ysul
fide
redu
ctio
n
RS
N
Pol
ysul
fide
redu
ctio
n
RS
N
Pol
ysul
fide
redu
ctio
n
RS
N
Pol
ysul
fide
redu
ctio
n
SO
42-
H2S
Ass
imila
tory
sul
fate
redu
ctio
n Dis
sim
ilato
ry s
ulfa
te re
duct
ion
Sul
fur o
xida
tion
Min
eral
izat
ion
Org
anic
sul
fur
Burk
holde
riales
64%
Actin
omyc
etale
s 9%
Desu
lfuro
mon
adale
s 9%
Rick
ettsi
laes 3
3%Ac
tinom
ycet
ales 2
3%Bu
rkho
lderia
les 1
7%Ch
lorob
iales
15%
Chlor
obial
es 6
3%
Chlor
obial
esHy
drog
enop
hilale
s**C
ampy
lobac
tera
les
Chro
mat
iales
54%
Hydr
ogen
ophil
ales 2
3%**C
ampy
lobac
tera
les
Chlor
obial
es 7
4%G
allion
ellale
s 19%
Hydr
ogen
ophil
ales 4
%**C
ampy
lobac
tera
les
Chlor
obial
es 8
3%G
allion
ellale
s 14%
Hydr
ogen
ophil
ales 2
%**C
ampy
lobac
tera
les
Synt
roph
obac
tera
les 5
9%De
sulfo
bacte
rales
27%
Desu
lfarc
ulales
10%
Desu
lfoba
ctera
les
Chlor
obial
es Desu
lfovib
riona
les 3
3%De
sulfo
bacte
rales
17%
Selen
omon
adale
s 14%
Chlor
obial
es 9
%
Chlor
obial
es 6
0%De
sulfo
vibrio
nales
27%
Chlor
obial
es 5
6%De
sulfo
bacte
rales
10%
Desu
lfovib
riona
les 7
%Ca
mpy
lobac
tera
les 7
%
Desu
lfoba
ctera
les
Synt
roph
obac
tera
lesDe
sulfo
bacte
rales
Burk
holde
riales
51%
Rhizo
biales
10%
Burk
holde
riales
32%
Bacte
roida
les 1
2%
Actin
omyc
etale
s 21%
Alte
rom
onad
ales 9
%Th
izobia
les 7
%
Gall
ionell
ales 2
2%Ba
ctero
idales
9%
Burk
holde
riales
43%
Actin
omyc
etale
s 36%
Figu
re
4.6:
Ge
netic
po
tent
ial
for
seve
ral
steps
of t
he s
ulfur
cyc
le in
Lake
Ci
só
and
Bany
oles b
asin
C-III
using
a
com
binat
ion
of
norm
alize
d m
arke
r ge
nes.
Arro
ws
size
prop
ortio
nal
to
the
pote
ntial
flu
x of
th
e su
lfur
path
ways
(1
00%
value
, see
Sup
plem
entar
y Ta
ble
A.C4
.3).
Relat
ive
abun
danc
es fo
r the
main
m
icrob
es
pote
ntial
ly dr
iving
eac
h co
nver
sion
step
are
show
n (o
nly fo
r th
ose
that
cont
ribut
ed
>1%
of
the
mar
ker
gene
s mixt
ure)
. **Campylobacteraceae
cont
ribut
ed t
hrou
gh sox
ge
nes
not
repo
rted
in KE
GG d
atab
ase.

Biodiversity and biogeochemistry in euxinic lakes 63
Table 4.3: Carbon fixation cycles and main metabolic traits of the C-fixing microorganisms found in this study. *SRAO: sulfate-reducing ammonium oxidation. aAlso known as reverse Krebs cycle, reverse tricarboxylic acid cycle (rTCA) and reverse citric acid cycle. bAlso known as Wood–Ljungdahl pathway.
Taxa/ phylogeny
C-f ixat ion pathway
Tra i ts Main genera ident i f ied in Lakes Cisó and CI I I f rom the 16S rRNA gene present in the metagenomic pool
Gallionellales Betaproteo-bacteria
Calvin Facultative Chemolithoautotroph Energy sources: Fe(II)/sulfide Denitrification
Sideroxydans
Hydrogeno-philales Betaproteo-bacteria
Calvin Chemolithoautotroph Sulfide oxidation
Campylo-bacterales Epsilonpro-teobacteria
Arnona Chemolithoautotroph Denitrification Sulfide oxidation
Arcobacter, Sulfuricurvum, Sulfurimonas
Chromatiales Gammapro-teobacteria
Calvin Photolithoautotroph Anaerobic Tolerates oxygen
Lamprocystis
Chlorobiales Chlorobi
Arnona Photolithoautotroph Anaerobic (strict) N fixation
Chlorobium luteolum
Desulfo-bacterales Deltaproteo-bacteria
Arnona Reductive acetil-CoAb
Heterotroph Sulfate reducers
Desulfatiferula, Desulfobulbus, Desulfocapsa, Desulfosalsimonas
Syntropho-bacterales Deltaproteo-bacteria
Arnona Reductive acetil-CoA(?)b
Heterotroph Sulfate reducer/ sulfide oxidation SRAO*
Desulfomonile
Desulfuro-monadales Deltaproteo-bacteria
Reductive Acetil-CoAb
Nitrate dependent Fe(II) oxidation with production of ammonium (Weber et al., 2006)

Chapter 4 64
For the nitrogen cycle, most of the detected marker genes catalyzed N assimilation and mineralization (Supplementary Table A.C4.3, Fig. 4.5). Denitrification was observed in low abundance in all the cases (c. 3% of the nitrogen functional reads selected), and the main taxa involved were Campylobacterales (autotrophic Sulfurimonas and Arcobacter), Oceanospirillales (heterotrophs) and Gallionellales (autotrophic Sideroxydans). Conversely, the potential for nitrogen fixation (nif genes) was observed in all the cases, though in higher abundance under euxinia (18%±11%) than in the oxic-anoxic interfaces (4%±4%). The nif genes were most related to Chlorobium in Lake Banyoles, while in Lake Cisó were most similar to Syntrophobacterales. Under the most euxinic conditions, c. 6% of the total nitrogen marker genes examined were the anammox catalyzing enzyme hydrazine oxidoreductase, though these were associated with Syntrophobacterales instead of the planctomycetales found in oceanic anoxic zones. Both aerobic ammonia oxidation and nitrification marker genes had very low abundance, and only were properly detected in Lake Banyoles C-III hypolimnion (amoC gene 97% identical to Nitrosospira multiformis). However, metagenomic reads matching Thaumarchaeota (AOA), Nitrosomonadales and Nitrosococcus (AOB), and Nitrospirae NOB were detected in all lakes and water layers (Fig. 4.5, dotted lines), pointing out that the genetic potential to close the nitrogen cycle was there, but at very low abundance as compared to other pathways in the cycle.
Finally, in the S cycle (Supplementary Table A.C4.3, Fig. 4.6) the highest percentage of the reads matched assimilatory sulfate reduction (28%±9% of those targeted sulfur marker genes) and sulfur mineralization (35%±25%) mostly driven by the predominant heterotrophic organisms found in each water layer (Actinomycetales and Burkholderiales). Most sulfide oxidation genes likely originated from Chlorobiales in Lake Banyoles C-III, and Chromatiales in Lake Cisó, with further contributions from chemolithotrophs Gallionellales, Hydrogenophilales, and Campylobacterales. The potential for planktonic sulfate reduction was only observed in strong euxinia (Lake Cisó hypolimnion, 16% of targeted sulfur reads as compared to

Biodiversity and biogeochemistry in euxinic lakes 65
1.4%±1% in the remaining samples), with reads likely originating from Desulfobacterales and most probably Syntrophobacterales, although members of this group may carry out both reductive and oxidative parts of the sulfur cycle. Interestingly, we observed a high richness of sulfate-reducing bacteria genera (Table 4.3) with the potential to degrade a wide variety of carbon compounds to help to maintain the high sulfide concentrations found in Lake Cisó.
While the metagenomic dataset does not contain transcriptome or proteome data, and thus only indicates potential function, we observed a direct linear relationship between relative abundance of dissimilatory sulfate reduction genes and in situ sulfide concentrations (r= 0.998, p= 0.002). Although this comparison should be carefully interpreted because the low number of samples compared, it suggests a close link between both the abundance of planktonic SRB genomes and sulfide production. We also observed significant direct linear relationships between the relative abundance of anaerobic carbon fixation genes from bacterial chemotrophs and denitrification (r= 0.958, p= 0.042) suggesting a close link between chemoautotrophy and the nitrogen cycle. Discussion Stratified planktonic environments with sharp chemical gradients and sulfide-rich bottom waters are valuable current windows on past Earth conditions. Anoxic and euxinic conditions were common but spatially and temporally heterogeneous in ancient oceans during Proterozoic (Lyons et al. 2014, Reinhard et al. 2013) and may have played an important role in mass extinctions during the Phanerozoic (Meyer and Kump 2008). The presence of marker pigments for photosynthetic sulfur bacteria (i.e. isorenieratene and okenone) have been often reported as evidence of euxinic conditions in ancient oceans (Damsté and Köster 1998, Brocks et al. 2005). These conditions are not common nowadays, although persistent euxinia can be found in deep silled basins such as the Black Sea, Baltic

Chapter 4 66
Sea, and Cariaco Basin (Millero 1991, Stewart et al. 2007). Future climate change scenarios predict, however, an increasing of euxinia phenomena, mainly in coastal marine ecosystems (Diaz and Rosenberg 2008). The study of stratified sulfurous lakes has, therefore, an additional interest to predict biogeochemical functioning and microbial interactions in such future scenarios. In the present study, we explored the community composition and functional genes content along a gradient of redox conditions in a karstic sulfurous area. Continental systems are cheaper and easier to sample than marine basins, and a large variety of photo- and chemolithotrophs organisms, sulfide-oxidizing and sulfate-reducing bacteria, fermenters, denitrifying microbes, methanogens and methane oxidizers are expected to be found according to previous studies (e.g., Casamayor et al. 2000, Barberán and Casamayor 2011). The metabolisms harbored by these microorganisms have the potential to provide insights into the ecosystems operating in euxinic early stages of Earth. The strong euxinic conditions found in Lake Cisó may match biogeochemistry in ancient coastal areas, whereas basin C-III in Lake Banyoles may represent the transition from euxinic coastal areas to merely anoxic and rich Fe conditions in the ancient open ocean (Fig. 4.7).
The very low abundance of genes for nitrification, the minor presence of anammox genes, the high potential for nitrogen fixation and mineralization, and the potential for chemotrophic CO2 fixation and CO oxidation all provide potential clues on the ancient oceanic anoxic zones functioning. The low abundance of ammonia oxidizers (AOA and AOB) agrees with the high ammonia accumulation in the anoxic bottom of the lakes, the lack of oxygen,and presence of potentially toxic sulfide. We observed, however, a higher gene abundance of AOB relative to AOA in the metagenomic pool that may have a geochemical link related to the abundance of Fe in these environments. AOA have a highly copper-dependent system for ammonia oxidation and electron transport (Walker et al. 2010), completely different from the iron-dependent system present in AOB. The tradeoff in Fe versus Cu rich ammonia oxidation enzymatic

Biodiversity and biogeochemistry in euxinic lakes 67
systems would suggest that AOA evolved relatively recently (<550 million years ago) and that the Proterozoic oceans, which would have been Fe rich, would have been AOB dominated. Interestingly, the evolutionary dynamics of the amoA genes cladogenesis events visualized using lineage through time plots, displays a different scenario for AOA and AOB, with AOB showing a more constant cladogenesis through the evolutionary time whereas AOA experienced two fast diversification events separated by a long steady-state period (Fernàndez-Guerra and Casamayor 2012).
The potential for nitrogen fixation and denitrification was detected in both autotrophs and heterotroph microbial lineages, suggesting a diverse range of potential overlaps between carbon and nitrogen cycling in the ancient ocean, and an active nitrogen cycle in anoxic systems. Our results show a potential major contribution to nitrogen fixation by Chlorobiaceae under euxinic conditions. Chlorobiaceae were also the major contributors to carbon fixation in
Figure 4.7: Lake Cisó and basin C-III of Lake Banyoles as modern analogues of anoxic conditions prevailing in the ancient ocean. The illustration shows the geochemical distributions of Fe, S, C, and O2 in depth profiles and along different oceanic regimes (shelf, slope, open ocean) during the Proterozoic (Lyons et al. 2014). Lake Cisó would be closer to coastal and continental shelf areas whereas Banyoles C-III would be a more open ocean analog.
Chapter 4 68
Banyoles C-III coupled to sulfide oxidation through the Arnon cycle. Therefore, the reported presence of Chlorobiaceae in the ancient ocean (Damsté and Köster 1998, Brocks et al. 2005) would have been of major relevance not only for the carbon cycle but also for the nitrogen cycle. Campylobacterales (Epsilonproteobacteria) accounted for a large percentage of the denitrification genes in the anaerobic layers of both lakes, but were taxonomically segregated (Arcobacter dominated in Cisó, Sulfurimonas was present in C-III). Both genera respire nitrate coupled to C fixation in the dark through the reverse TCA cycle (Burgin and Hamilton 2007, Grote et al. 2012, Labrenz et al. 2005), being potentially able to couple denitrification to sulfur oxidation (Ghosh and Dam 2009). The other important group involved in denitrification was the chemolithoautotrophic Gallionellales oxidizing sulfide or Fe2+ while respiring nitrate, and producing NH4
+ or N2. The presence of Gallionellales exclusively in C-III is probably due to their close relation with the iron cycle (Weber et al. 2006), and by the fact that an active Fe2+ cycle has been previously detected in Lake Banyoles (Garcia-Gil et al. 1990). The potential role of Gallionellales in ancient oceans with an active iron cycle is therefore of major interest.
The case of Bacteroidales also deserves to be mentioned. Bacteroidales have been typically considered aerobic or microaerophilic chemoorganoheterotrophic bacteria (Reichenbach 2006), and have been recurrently detected in the Banyoles area (Casamayor et al. 2000, Casamayor et al. 2002, Casamayor et al. 2012) and in marine environments (Fernández-Gomez et al. 2013). However, their role in anaerobic, sulfide-rich layers was not elucidated. Here, we assigned Bacteroidales as potentially catalyzing DNRA (dissimilatory nitrate reduction to ammonium), coupling the electron flow from organic matter to the reduction of nitrate. Thus, we would expect a potential gradient of distribution for anaerobic Bacteroidales in the ancient ocean being more abundant in the organic carbon and sulfide rich coastal zones (Fig. 4.7) than in the anoxic and more oligotrophic open ocean. We also noticed the low abundance of key processes in the anaerobic carbon cycle such as

Biodiversity and biogeochemistry in euxinic lakes 69
CH4 cycling, probably because in the presence of limiting levels of sulfate, methanogens are generally poor competitors with sulfate reducers in stratified natural environments (Raskin et al. 1996). Sulfate reduction normally occurs in fully anoxic sediments by SRB (Holmer and Storkholm 2001). However, as shown here, a water column with euxinic conditions and a high availability of organic carbon is also suitable for the growth of an important community of planktonic SRB.
Previous studies in Banyoles area measured unexpected high rates of dark carbon fixation at the oxic-anoxic interface and the hypolimnetic waters, accounting for 58% of total annual fixed carbon in Lake Cisó (Garcia-Cantizano et al. 2005). It was proposed that photosynthetic bacteria could be partly carrying out dark carbon incorporation in situ (Casamayor et al. 2008), and Thiobacilli may actively fix CO2 at certain depths (Casamayor 2010). However the ecological factors modulating the process and the microbial populations performing dark carbon fixation are still not well understood (Casamayor et al. 2012). In the present investigation, we detected the potential for chemotrophic CO2 fixation mainly through the reverse TCA cycle (K00174, K00175 and K00244 from KEGG Orthology) in Bacteroidales, Campylobacterales and Desulfarculales. In addition, other SRB such as Desulfobacterales may also participate through the anaerobic C1-pathway (Wood-Ljungdahl pathway, K00194 and K00197) yielding formate assimilation and CO2 fixation (Fuchs 2011, Hugler et al. 2003, Sun et al. 2010). Interestingly, the diversity of taxa potentially participating in carbon fixation in the dark was larger in Lake Cisó than in C-III, in agreement with in situ measurements carried out in former investigations (Casamayor 2010, Garcia-Cantizano et al. 2005). These findings would suggest an active carbon fixation in ancient euxinic oceans beyond the euphotic zone that certainly deserves further investigation.
Additionally, the oxidation of carbon monoxide (CO) generates ATP and CO2 that may be further processed through one of the reductive CO2 fixation pathways to be used as C source (King and

Chapter 4 70
Weber 2007, Ragsdale 2004). Some studies indicate that organisms using CO as both energy and C source can be viewed as the extant survivors of early metabolic processes (Huber and Wächtershäuser 1997). In the hypoxic layers we found that the heterotrophic group of Actinomycetales accounted for most of CO monooxygenase genes in agreement with their mixotrophic lifestyle (Schmidt and Conrad 1993). More interestingly, in the anoxic depths of Lake Cisó we found that CO-oxidation genes were mainly related to SRB from Deltaproteobacteria group (Geobacter and delta proteobacterium NaphS2) and to Firmicutes (Carboxidothermus hydrogenoformans, Moorella thermoacetica, Clostridium spp.). This finding suggests that the fate of the reducing equivalents from CO-oxidation in anaerobic conditions could be coupled to sulfate-reduction (carried out by SRB) to produce sulfide, or to CO2 reduction to produce acetate (SRB and Firmicutes) (King and Weber 2007, Roberts et al. 2004). To check whether CO oxidation could be coupled to CO2 reduction to yield acetate (Ragsdale 2004, Roberts et al. 2004), we identified the phylogenetic affiliation of acetyl-CoA synthase genes (ACS, K14138), and found that Desulfobacterales and Firmicutes had the potential to use the Wood-Ljungdahl pathway to obtain energy and fix carbon from CO in the hypolimnion of Lake Cisó. However, although the CO-oxidizing genes were detected, we cannot assess their relevance in the lake or the ancient oceans because CO-oxidizing bacteria carry out a facultative mixotrophic metabolism (Gadkari et al. 1990).
Overall, the metagenomics approach unveiled the interrelationships between microbes and biogeochemical cycling in a comparative framework in two lakes that are modern analogues of ancient ocean conditions. These results may also help to develop new geochemical proxies to infer ancient ocean biology and chemistry. A major pitfall in our metagenomic approach is the reliance on the assumption that the genes come from a particular bacteria or archaea according to phylogentic annotation; lateral gene transfer would compromise the direct link of phylogeny to a metabolic pathway. In most of the cases we found the 16S rRNA gene counterpart present in the metagenomic data pool, giving additional

Biodiversity and biogeochemistry in euxinic lakes 71
support to such links. Obvious next steps include an experimental quantification of the energy and matter fluxes involved in each of the metabolic pathways to get a complete picture on the tight coupling between microbes and biogeochemical cycling in euxinic ecosystems. Acknowledgements JC Auguet, M Llirós, F Gich, FM Lauro and JM Gasol are acknowledged for field and lab assistance and ancillary data. We sincerely appreciate insightful comments and suggestions from anonymous reviewers and the editor. This research was funded by Grants GOS-LAKES CGL2009-08523-E and DARKNESS CGL2012-32747 to EOC from the Spanish Office of Science (MINECO), from financial support by the Beyster Family Fund of the San Diego Foundation and the Life Technologies Foundation to the J. Craig Venter Institute, and the NASA Astrobiology Institute to CLD.


5 Speciation and ecological success in a
natural population of green sulfur bacteria
mediated by horizontal gene transfer1,2
Abstract In a recent metagenomics study in the euxinic Lake Banyoles, a bloom of the green sulfur bacteria (GSB) Chlorobium luteolum was identified using metagenomic and 16S rRNA analysis. The bloom was detected in the boundary between the oxic and anoxic layers of the lake. Metagenomic assembly resulted in a bin of 41 contigs and a total size of 2.15 Mbp for the dominant population, which we named Chl. luteolum CIII. Chl. luteolum CIII is very similar (91.7% Average Nucleotide Identity (ANI) and 99.7% 16S rRNA identity) to its cultured counterpart Chl. luteolum DSM 273T, which we used for a comparative analysis in order to determine genomic changes, e.g., 1 Llorens–Marès T, Z Liu, L Zeigler-Allen, DB Rusch, MT Craig, CL Dupont, DA Bryant and EO Casamayor. Manuscript submitted to ISME Journal. 2 See supplementary material in Appendix A

Chapter 5 74
horizontal gene transfer (HGT) that could explain the ecological success of CIII strain. Several differences in the potential for ferrous iron acquisition, ATP synthesis or gas vesicle formation were detected, but possibly, the most striking difference relates to pigment biosynthesis. Chl. luteolum DSM 273T is a green-colored GSB that synthesizes bacteriochlorophyll (BChl) c, while Chl. luteolum CIII is a brown-colored GSB that synthesizes BChl e. We found that Chl. luteolum CIII had incorporated an 18-kbp cluster with the putative genes needed for BChl e biosynthesis and specific carotenoids that likely give Chl. luteolum CIII a photosynthetic advantage over other strains sharing the same niche. We also genomically characterized what we believe to be the first described GSB phage, which based on the metagenomic coverage, was likely in an active state of lytic infection. This phage may serve both to control the blooming population and as a vector for the observed HGT. This work links three closely related issues that are usually studied separately: HGT, ecological success and bloom control through phage infection. Introduction Green sulfur bacteria (GSB, Chlorobiaceae) form blooms, often of monoclonal nature, in the twilight zone of stratified lakes with euxinic (anoxic and sulfidic) bottom waters (Gregersen et al. 2009). GSB are anaerobic photoautotrophs that couple anoxic oxidation of sulfide and CO2 fixation, and their specific contents in carotenoids and bacteriochlorophylls (BChl c, d, e and a) are ecological traits that dictate both their light-harvesting capacities and their potential ecological success (Montesinos et al. 1983, Van Gemerden and Mas 1995, Bryant et al. 2012). Usually brown-colored GSB (cells mostly containing BChl e and isorenieratene) bloom in deeper layers of stratified lakes, whereas green-colored GSB (cells with BChl c and chlorobactene as dominant pigments) are more abundant in anoxic water layers nearer the surface or underneath plates of purple sulfur bacteria (Montesinos et al. 1983). However, the genomic adaptations
Speciation and ecological success by HGT 75
of phototrophic sulfur bacterial blooms to particular environments is still unclear (Gregersen et al. 2009).
Horizontal gene transfer (HGT) is a major mechanism for bacterial innovation and adaptation to colonize new ecological niches and improve in situ performance, thus acting as a trigger for prokaryotic speciation (Ochman et al. 2000, Wiedenbeck and Cohan 2011). HGT may be driven by transformation (naturally incorporated environmental DNA), conjugation (i.e., genetic material acquired through plasmid exchange between cells), and transduction (through phage infection). Within Chlorobiaceae, Chlorobaculum tepidum TLS (formerly Chlorobium tepidum TLS), shows one of the genomes with the highest proportion of HGT (c. 24% of all genes, (Nakamura et al. 2004) probably related to the fact that this bacterium is naturally transformable (Ormerod 1988, Frigaard and Bryant 2001). Likely examples of transduction are also found in GSB; the sox cluster for thiosulfate utilization is a well-known example of lateral gene transfer in Chlorobium phaeovibrioides DSM 265 (Frigaard and Bryant 2008). However, phages infecting GSB have not been described so far (Frigaard and Bryant 2008).
Genome comparisons of closely related populations are important to identify the role of HGT in ecotype formation and ecological diversification (Cohan and Koeppel 2008). Metagenomic approaches can capture genomic differences in natural populations when pure cultures are difficult to obtain (Bhaya et al. 2007, Palenik et al. 2009, Klatt et al. 2011) and avoid the necessity to mimic the scale of natural ecosystems in laboratory experiments, which may discount the effect of potentially important variables for HGT (Aminov 2011). From an ecological perspective, the effect of HGT on the distribution and abundance of cyanobacteria of the genus Prochlorococcus and its ecotypes have been examined (Rocap et al. 2003, Martiny et al. 2009) and a comparative analysis of four Pseudomonas putida strains demonstrating that HGT played a key role in its adaptation process to each environmental niche (Wu et al. 2011). However, no studies have focused on the in situ context in which HGT explains the ecological success of a population and the
Chapter 5 76
complex interplay between recombination and ecology in a natural population (Polz et al. 2013).
The reconstruction of microbial genomes directly from environmental DNA through metagenomics can be difficult (Luo et al. 2012). Initial studies have focused on simple communities, such as a low-complexity acid mine drainage microbial biofilm with 6 estimated species (Tyson et al. 2004). Other studies have used tools to help simplify the community, such as the use of enrichment cultures (Martin et al. 2006), sequencing multiple metagenomes of the same community (Albertsen et al. 2013) or a dual approach of single-cell sequencing with coassembly and binning of multiple metagenomes (Dupont et al. 2012). In the present study, we reconstructed the consensus genome of a natural blooming GSB population without previous culturing. This dominant population serves as a natural enrichment culture (Van Gemerden et al. 1985), from which a nearly complete genome was assembled and used to study ecosystem-specific adaptations. The presence of putative phage assemblies with homology to the consensus genome showed for the first time consistent evidence for virus-mediated horizontal gene transfer in a natural population of green sulfur bacteria. Materials and methods Environment and sample analysis
The bloom sample was collected from deep (24 m) euxinic waters of meromictic basin III (CIII) of karstic Lake Banyoles (NE Spain, 42 18’N, 21 45’E) on May 9, 2010. Brown-pigmented green sulfur bacteria massively and persistently bloom in C-III (Montesinos et al. 1983). Methods of sampling, environmental analysis, filtering, and DNA extraction were recently reported (Llorens-Mares et al. 2015). The size fraction 0.8-3 μm was targeted for assembly. In this sample we had measured high concentrations of BChl e, the characteristic pigment of brown-colored species of Chlorobium with a high relative abundance (>50%) of 16S rRNA gene closely matching (99.7%

Speciation and ecological success by HGT 77
identity) the green-colored species Chlorobium luteolum DSM 273T (Llorens-Mares et al. 2015). Accordingly, the natural population from which we obtained the DNA for metagenomic sequencing and genome reconstruction was named Chl. luteolum CIII. Metagenomics analyses
A total of 492,615 reads with 401-nt average read length were generated by shotgun metagenomics. Reads were assembled using two different software assemblers: Newbler Assembler (Roche) and CLC Assembly Cell (CLC bio), which produced 2,971 and 23,490 contigs, respectively. For each assembly we selected contigs > 3kb that were plotted against GC content and read depth (Supplementary Fig. A.C5.1). To assemble Chl. luteolum CIII specifically, we selected contigs with ~57% GC (equivalent to the 57.33% GC of Chl. luteolum DSM 273T) and a read depth of ~29. Using these criteria, we selected 45 contigs from the Newbler assembly (average length, 47 kb, average read depth 29.9 ± 2.8, and mol% GC = 56.7%) and 75 contigs from the CLC assembly (average length 28 kb, average read depth 29.1 ± 3.2, and mol% GC = 56.7%). We then used phred/phrap/consed package (Ewing et al. 1998, Gordon et al. 1998, Gordon 2003) to combine these assemblies to produce a final assembly of 41 contigs totaling 2,152,917 bp with an average mol% GC = 56.73%.
Contigs were ordered and oriented according to the reference genome, Chl. luteolum DSM 273T, and visualized for a synteny comparison using Genome Matcher (Ohtsubo et al. 2008). The genome encoded 2,057 open reading frames (ORFs) that were annotated with RAST (Aziz et al. 2008) with rigorous manual curation. We checked for genomic completeness by searching for a set of 110 universally occurring marker genes, very rarely duplicated, essential for cellular life, and believed to be very ancient (Dupont et al. 2012). All 110 of these genes were present in CIII genome, and all were present as single-copy genes.
We used DNAPlotter (Carver et al. 2009), for a visualization of different traits such as the global genome, the mol% GC, the GC

Chapter 5 78
skew and all ORFs. For a visual comparison with the reference genome we used the Artemis Comparison Tool (ACT) (Rutherford et al. 2000, Carver et al. 2005, Carver et al. 2012). Perl scripts were run to obtain a list of the ORFs that were classified as orthologs with the reference genome using a whole-genome reciprocal BlastP analysis (Fuchsman and Rocap 2006, Moreno-Hagelsieb and Latimer 2008) in order to establish differences in protein coding between strains.
For a global comparison of similarity between genomes and to assess the Average Nucleotide Identity (ANI) of CIII genome with other sequenced GSB, we used JSpecies V1.2.1 (Richter and Rossello-Mora 2009). Hierarchical clustering analysis of the resulting all vs. all ANI similarity matrix obtained with JSpecies was performed in R (R Core Team 2014).
As a result of the assemblies with Newbler and CLC, we detected the presence of large contigs (>3 kb) with an unusually high read-depth (~79 to 325×; Supplementary Fig. A.C5.1). Based on their isolation from the cellular size fraction, these sequences were eventually assigned to a potential infecting phage population. We reassembled these contigs with the same procedure followed for Chl. luteolum CIII. A long contig (65 kb) with read depth 34 and mol% GC = 34.8 was also selected because the presence of genes coding for phage related proteins. We ended with five contigs designated as putatively phage-derived sequences. These contigs were annotated with the JCVI viral annotation pipeline (Lorenzi et al. 2011). One of the putative phage-derived contigs had similarity to a region of the Chl. luteolum CIII genome. This region was visualized for synteny using the R package genoPlotR (Guy et al. 2010). 16S rRNA phylogenetic analysis
A comprehensive phylogenetic tree of the 16S rRNA gene was generated with reference sequences from the phylum Chlorobi, from the assembled genome and from previous studies in the area (Figueras et al. 1997, Casamayor et al. 2000). Sequences were aligned with SINA aligner (Pruesse et al. 2012), and phylogenetically
Speciation and ecological success by HGT 79
compared by maximum likelihood with the general time-reversible model from RAxML v7.3.0 (Stamatakis 2006) using Bacteroidetes fragilis as outgroup. BChl e phylogenetic analysis
Genes encoding proteins associated with BChl e biosynthesis (e.g., BchF3, BciD; Maresca 2007, Harada et al. 2013) and isorenieratene biosynthesis (CruB, Maresca et al. 2008b) were found on two different CIII contigs. We designed primers for each contig end in order to confirm by PCR amplification and DNA sequencing that the genes were contiguous and formed a cluster in one genomic locale in the natural population.
Only one gene, bciD, has conclusively been demonstrated to be involved in BChl e biosynthesis (Harada et al. 2013). This gene was previously annotated as encoding a protein of the radical S-adenosyl-L-methionine (RSAM) enzyme superfamily. Harada and coworkers showed that BciD is required for conversion of the C7 methyl group of BChlide c into the formyl group found in BChl e; however, the complete reaction mechanism remains unclear. The bciD gene is present in all brown-colored GSB with sequenced genomes (and is missing from the genomes of all green-colored GSB that synthesize BChl c or d). The bciD gene occurs in a cluster with other potential genes that may encode proteins with a role in BChl e biosynthesis: BchF3, a homolog of BchF (3-vinyl (bacterio)-chlorophyllide hydratase) and a putative dehydrogenase/oxidoreductase (SDR) (Maresca 2007). It has recently been suggested that a bchQ paralog, also present in all brown-colored GSB, could play a role in the synthesis of BChl e methylation homologs by adding methyl groups to the BChlide e at C-82 (Gomez Maqueo Chew et al. 2007, Thweatt and Bryant, unpublished results). Interestingly, the gene cluster also contains cruB, the γ-carotene cyclase that produces β–carotene, the precursor of isorenieratene, which is produced by almost all brown-colored GSB (Maresca 2007, Harada et al. 2013). Therefore, the concatenated protein sequences of these genes were used to

Chapter 5 80
construct a maximum likelihood tree to assess the phylogenetic relationships of the Bchl e cluster inserted in strain Chl. luteolum CIII with the other sequenced brown-colored GSB species (Chl. phaeobacteroides DSM 266, Chl. clathratiforme DSM 5477, Ptc. phaeum CIB 2401, Cba. limnaeum DSM 1677 and Ptc. phaeobacteroides BS1). PartitionFinderProtein v1.0.1 (Lanfear et al. 2012) was used to determine the best substitution model for each partition, and RAxML v7.3.0 (Stamatakis 2006) was used to generate the maximum likelihood tree. We used as outgroup a combination of distantly related sequences for each of four concatenated proteins: SDR (short-chain dehydrogenase/reductase enzyme; AGA91907 from Thioflavicoccus mobilis 8321), CruB (ACF12554 from Chloroherpeton thalassium ATCC 35110), RSAM (radical S-adenosylmethionine protein; ACF01393 from Rhodopseudomonas palustris TIE-1) and BchF3 (ABB27675 from Chlorobium chlorochromatii CaD3). A visual syntenic analysis of the region containing the BChl e cluster in all sequenced genomes was performed using the R package genoPlotR (Guy et al. 2010). FeoB, metal lophospherase and vrl locus analyses
Both FeoB and metallophosphoesterase protein trees were generated as follows. Reference sequences were collected from the non-redundant NCBI database using BlastP and aligned using MUSCLE (Edgar 2004). Aligned sequences were cleaned with Gblocks (Castresana 2000), and a maximum likelihood tree for each protein alignment was generated using RAxML v7.3.0 (Stamatakis 2006). SyntTax (Oberto 2013) was used to explore the genomic context of FeoB in other Chlorobium spp. genomes and vrl locus in other genomes.
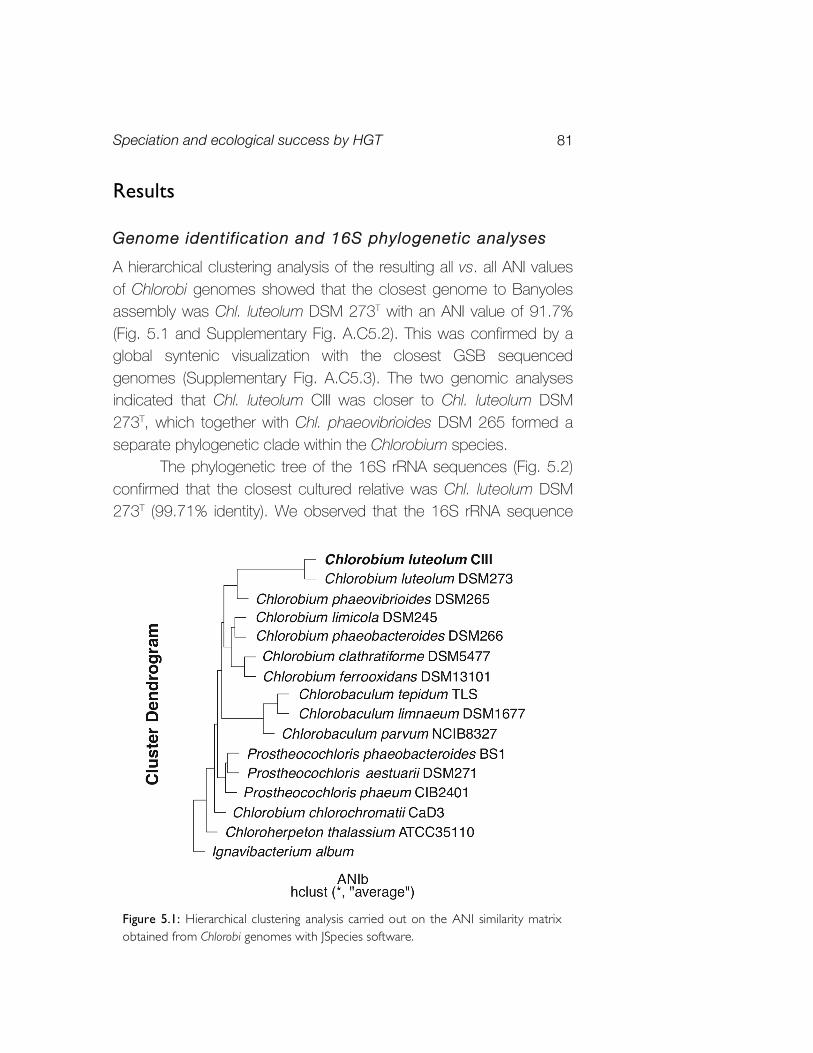
Speciation and ecological success by HGT 81
Results Genome identi f ication and 16S phylogenetic analyses
A hierarchical clustering analysis of the resulting all vs. all ANI values of Chlorobi genomes showed that the closest genome to Banyoles assembly was Chl. luteolum DSM 273T with an ANI value of 91.7% (Fig. 5.1 and Supplementary Fig. A.C5.2). This was confirmed by a global syntenic visualization with the closest GSB sequenced genomes (Supplementary Fig. A.C5.3). The two genomic analyses indicated that Chl. luteolum CIII was closer to Chl. luteolum DSM 273T, which together with Chl. phaeovibrioides DSM 265 formed a separate phylogenetic clade within the Chlorobium species.
The phylogenetic tree of the 16S rRNA sequences (Fig. 5.2) confirmed that the closest cultured relative was Chl. luteolum DSM 273T (99.71% identity). We observed that the 16S rRNA sequence
Figure 5.1: Hierarchical clustering analysis carried out on the ANI similarity matrix obtained from Chlorobi genomes with JSpecies software.

Chapter 5 82
collected in 2010 was identical to VIBAC-6, which was collected from Lake Vilar in 1996 (Casamayor et al. 2000), a neighboring lake connected to Lake Banyoles. The tree topology slightly differed from other GSB trees (Imhoff 2003, Liu et al. 2012) because we used an alignment of 472 nucleotides in order to include the partial sequences CIBAC-3 and VIBAC-6 (Casamayor et al. 2000).
Figure 5.2: 16S rRNA RAxML phylogeny of Chl. luteolum CIII genome assembly with related species from the phylum Chlorobi and sequences from previous studies in Banyoles karstic area (UdG6046, UdG6047, UdG6051, VIBAC-6 and CIBAC-3). Bacteroidetes fragilis was used as the outgroup.

Speciation and ecological success by HGT 83
We plotted the 16S rRNA identity values vs. the ANI values for
all genomes in order to establish the relationships among the 16S identities and whole genome similarities within the Chlorobi group (Fig. 5.3). Two genomes were distantly related in both terms: Ignavibacterium album and Chloroherpeton thalassium ATCC 35110. Most genomes fell within 66.0-73.7% ANI and 91.9-97.7% 16S identity. The three species of Chlorobaculum (i.e., Cba. limnaeum DSM 1677, Cba. tepidum TLS and Cba. parvum NCIB 8327) clustered together in the 16S rRNA phylogenetic tree (Fig. 5.2) and showed a ratio ANI:16S closer to 1:1 than other GSB but Chl. luteolum DSM 273T vs. Chl. luteolum CIII (Fig. 5.3). Key genetic events for the ecological success of strain
CII I
Some clusters of genes were found to be missing from CIII as compared to DSM 273T (Supplementary Table A.C5.1). For example, Chl. luteolum DSM 273T has a gas vesicle gene cluster encoding eighteen proteins (YP374609 to YP374627), most of which have best hits to Chl. clathratiforme DSM 5477. More relevant was the
Figure 5.3: Plotted values of ANI versus 16S identity for Chlorobi genomes.

Chapter 5 84
absence of an ATP synthase operon, which included the eight required genes (atpA (F1), atpD (F1), atpG (F1), atpH (F1), atpC (F1), atpE (F0), atpB (F0) and atpF (F0)) for the synthesis of the ATP synthase complex. We checked for the presence of additional ATP synthase genes, as they are essential for cell viability, and found them interspersed across the genome (both in DSM 273T and CIII). Apparently the operon found in Chl. luteolum DSM 273T and missing in CIII strain had homology with the Na+-dependent F1F0-ATP synthase found in the halotolerant cyanobacterium Aphanothece halophytica (Soontharapirakkul et al. 2011), indicating that it could be related to salt tolerance, which should not be required in the freshwater Lake Banyoles.
Figure 5.4: Circular map of Chl. luteolum CIII genome using DNAplotter. The first two circles starting from the center are GC-skew and G+C content. Baseline on the G+C plot represents de average value of 56.7%. The other four circles starting from G+C content are tRNA and rRNA (red and blue respectively), all reverse strand ORFs (light green), all forward strand ORFs (green) and all the ORFs more closely related to genes in organisms other than Chl. luteolum DSM 273T (orange). Special features are indicated.

Speciation and ecological success by HGT 85
In contrast, 286 genes in the Chl. luteolum CIII genome were more closely related to genes in organisms other than Chl. luteolum DSM 273T and thus might have been acquired by HGT (Fig. 5.4; Supplementary Table A.C5.2). Among them eight open reading frames (from 679 to 686) were detected in contig-51 with the same structure and best protein similarity scores (95-99%) to Chl. phaeovibrioides DSM 265 (Supplementary Table A.C5.2). The products of these genes were identified as two copies of FeoA, FeoB, flavodoxin, a ferritin-DPS family member, and three hypothetical proteins. A phylogenetic tree of the FeoB proteins showed that two different variants of FeoB are encoded in Chlorobium spp. genomes (Supplementary Fig. A.C5.4). The first form of the FeoB is predicted to be a protein of 712 aa, and it is present in most Chlorobium spp. genomes including Chl. luteolum DSM 273T and Chl. luteolum CIII. The second form of FeoB is a protein of 790 aa with homologs only found in some GSB, including Cba. tepidum TLS, Cba. parvum NCIB 8327, Chl. limicola DSM 245, Ptc. phaeobacteroides BS1, Chl. phaeobacteroides DSM 266 and Chl. phaeovibrioides DSM 265 (Supplementary Fig. A.C5.5).
The region including ORFs 1936 to 1955 (Supplementary Table A.C5.2) showed greatest similarity (80-99%) with Chl. phaeobacteroides DSM 266 and Chl. clathratiforme DSM 5477 proteins. A closer inspection of this region allowed us to link it with BChl e and isorenieratene biosynthesis, which are mostly obligately linked processes (Maresca 2007). The region with the BChl e genes was initially split into two contigs: ORFs 1936 to 1944 at the end of contig31 and ORFs 1945 to 1955 in the beginning of contig41 (Supplementary Fig. A.C5.6). Due to the importance of this region in explaining the ecological role and the gain of the ability to synthesize BChl e, we decided to close this gap using PCR and DNA sequencing with the original high molecular weight DNA used for sequencing. The result was a 1312 nucleotide linking sequence, which contained a transposase of the IS4 family, with best hit with Chl. phaeobacteroides DSM 266 (YP_912276). The presence of this IS4 element, which occurs multiple times in the Chl. luteolum CIII,

Chapter 5 86
Figu
re 5
.5: M
axim
um li
kelih
ood
phylo
geny
with
RAx
ML
of fi
ve c
onca
tena
ted
prot
eins (
SDR,
CruB
, BciD
(RSA
M),
BchF
3 an
d Bc
hQ2 )
foun
d in
all
BChl
e sy
nthe
sizing
geno
mes
. A co
mbin
ation
of d
istan
tly re
lated
sequ
ence
s for
eac
h of
the
four
conc
atena
ted
gene
s wer
e us
ed as
the
outg
roup
. The
ge
nom
e sy
nten
y of t
he re
gion
is sh
own
next
to th
e ph
yloge
netic
tree
. The
bit
scor
e of
the
BLAS
T ali
gnm
ent i
s rep
rese
nted
with
shad
es o
f red
(sam
e or
ientat
ion) a
nd b
lue (i
nver
se o
rient
ation
).

Speciation and ecological success by HGT 87
explained why this gene cluster was initially split between two contigs.
The phylogenetic tree of the putative proteins involved in BChl e biosynthesis showed a high similarity between Chl. clathratiforme DSM 5477, Chl. phaeobacteroides DSM 266 and Chl. luteolum CIII (Fig. 5.5), respectively. A synteny analysis of the region showed that gene positions were always conserved (Fig. 5.5) with the exception of an inversion in the SDR gene, a putative dehydrogenase/ oxidoreductase. It also showed that Chl. clathratiforme DSM 5477, Chl. phaeobacteroides DSM 266 and Chl. luteolum CIII had additional genes in this cluster that apparently were not related to BChl e biosynthesis, possibly explaining a different phylogenetic history and also showing the genomic flexibility of this region. A detailed analysis of the transition in mol% GC across this cluster with Chl. phaeobacteroides DSM 266 (Supplementary Fig. A.C5.7), showed the same GC pattern in the incorporated region in contrast with the “outside” regions, which had the GC average of its respective genomes: 57% for Chl. luteolum CIII and 48% for Chl. phaeobacteroides DSM 266, suggesting HGT as the most probable mechanism for its incorporation in the genome.
Phage-related HGT
We detected the insertion of a cluster of six genes (ORFs 574 to 592 on contigs 44 and 20) not found in the genome of Chl. luteolum DSM 273T, that had homologs with the virulence-related locus (vrl locus) of Dichelobacter nodosus (Haring et al. 1995). Specifically, we found vrlJKLOPQ in Chl. luteolum CIII, a cluster that has been found in highly dissimilar organisms, including Acidothermus cellulolyticus, Thermoanaerobacter ethanolicus, Nitrosococcus mobilis and N. oceani (Knaust et al. 2007). A synteny analysis of the region added Desulfovibrio aespoeensis Aspo2 and Methanosalsum zhilinae DSM 4017 to this list (Supplementary Fig. A.C5.8). The presence of phage-related proteins at the end of the region (Supplementary Fig. A.C5.8: ORFs 590 and 591), suggests the possible horizontal transfer of the cluster containing the vrl proteins.

Chapter 5 88
A couple of genomic regions were characterized by multiple recombination events according to the comparison of Chl. luteolum CIII with Chl. luteolum DSM 273T (Supplementary Fig. A.C5.9), and thus we named them “promiscuous regions.” Most of the genes in these regions were found in different contigs and were classified as encoding hypothetical proteins. Not surprisingly, many of the genes found in these “promiscuous regions” were related to mobile elements (integrases, recombinases, transposases, among others), but some of them were also annotated as phage-related proteins. In addition to the phage-related proteins found in the genome, another genomic indicator of past phage infection was identified within the assembled Chl. luteolum CIII sequences; CRISPRs (Clustered Regularly Interspaced Short Palindromic Repeats), which are region(s) of a genome that contain multiple, short repeats with interspersed spacer DNA, acquired from past viral encounters (Westra et al. 2014). One CRISPR locus was identified that contains a direct repeat sequence of 32 bp and 12 spacer regions (Supplementary Fig. A.C5.10 and Supplementary Table A.C5.3). Although no spacer sequences were identified within the larger data, it suggests this bacterium uses a CRISPR/Cas-like mechanism to evade phage infection.
The “promiscuous regions”, together with CRISPRs and the vrl locus, provided evidence for the ongoing association and genomic exchange between Chl. luteolum CIII and phages. Another interesting observation was that 36.9% of the non-hypothetical proteins with non-reciprocal BLAST hits to strain Chl. luteolum DSM 273T (the theoretically acquired proteins) were related to mobile elements or phages (Fig. 5.6). This illustrates the plasticity of these genomes and the substantial gene flow that appears to be occurring, mostly between closely related genomes but also between phylogenetically distant organisms (e.g., the vrl locus). The taxonomic assignment of the proteins gained by Chl. luteolum CIII (Fig. 5.7) showed that 39% of these proteins had best hits with other GSB, but a striking 33% were most closely related to a large variety of species, with Proteobacteria being the taxon with the highest hits.

Speciation and ecological success by HGT 89
Putative GSB phage
To date phages infecting GSB have not been reported (Frigaard and Bryant 2008). However, the presence in the genome of both a large number of phage-related proteins and CRISPR repeats are strong arguments supporting the existence of such viruses. In the assembly analysis carried out in the present study, we found a set of large contigs (>3 kbp) with a very high read depth (Supplementary Fig. A.C5.2). We re-assembled these contigs following the same procedure used for Chl. luteolum CIII, and obtained 5 contigs (Supplementary Table A.C5.4) that were identified as putative bacteriophage (see below). Due to the procedures for isolation, i.e., plankton size fraction analyzed between 0.8 and 3 μm, these putative phages were likely to be infecting the GSB at the time of sampling, either through a lysogenic or lytic infection process. Putative phage contigs 2 and 4 could not be classified to any known bacteriophage and only encoded three phage-related genes. Based on homology of multiple ORFs to an N4-like phage, contig 1 was probably derived from a Podovirus. Finally, according to the GC content, read depth (Supplementary Table A.C5.4), and predicted host-acquired auxiliary metabolic genes (AMG), contigs 3 and 5 (Supplementary Table A.C5.5) are predicted to be derived from a putative lytic Myoviridae phage. The read depth of contigs 3 and 5 is ~6-fold higher (i.e.,
Figure 5.6: Plot with the percentage of non-reciprocal CIII ORFs with strain DSM 273T assigned to different functional categories.

Chapter 5 90
Fi
gure
5.7
: Plo
t with
the
taxo
nom
ic as
signm
ent o
f non
-recip
roca
l CIII
ORF
s with
stra
in D
SM 2
73T .

Speciation and ecological success by HGT 91
174×) than the average for Chl. luteolum CIII, which strongly suggests that this virus was involved in an active, lytic infection process. A phylogenetic reconstruction of the phage-conserved DNA polymerase provided further evidence that the predicted sequences form a distinctive lineage related to DNA polymerases found in other bacteriophage (Supplementary Fig. A.C5.11). The largest contig was 106 kb (contig 5), and its predicted proteins indicated a mixed homology to known bacteriophage (Supplementary Fig. A.C5.12); this is not unexpected because no phage has yet been described for GSB (Frigaard and Bryant 2008).
BlastN analysis of Chl. luteolum CIII versus the putative phage returned a high-identity region of 51 nucleotides next to the vrl locus in Chl. luteolum CIII that matched two separate parts of the putative phage (Fig. 5.8). One was 20 nt long with 100% identity, and the other was 33 nt long but contained two mismatches. The two regions were separated by 2169 nt, in which the coding sequence for a hypothetical protein from Sinorhizobium phage PBC5 (Contig5_11) was found (Fig. 5.8 and Supplementary Table A.C5.5). Interestingly, next to this similarity region, and as part of the vrl locus insertion, we found a bacteriophage P4 integrase (ORF 591) and a phage transcriptional regulator alpA (ORF 590). About 50 kb from this region, a putative AMG within a region of conserved phage genes was predicted to be a metallophosphoesterase, a Ser/Thr protein phosphatase (Supplementary Table A.C5.5; Contig5_33), with strong sequence homology with ORF 547 from Chl. luteolum CIII genome (Fig. 5.8). A phylogenetic tree of metallophosphoesterase sequences was constructed, and showed that the protein encoded on Contig5_33 was clearly derived from GSB, and also had close sequence homology with other phage metallophosphoesterases (Fig. 5.9). Together these data provide consistent evidence for phage/host interactions in GSB.

Chapter 5 92
Figu
re 5
.8: S
ynte
nic a
nalys
is sh
owing
the
relat
ionsh
ip of
the
putat
ive G
SB p
hage
with
the
Chl.
lute
olum
CIII
geno
me
sequ
ence
. A b
lue sh
ade
indica
tes
the
hom
ology
regio
n of
the
met
allop
hosp
hoes
tera
se g
ene.
A re
d cir
cle in
dicate
s th
e re
gion
with
the
51 n
ucleo
tides
iden
tity
regio
n. Th
e typ
es o
f ge
nes i
dent
ified
in th
e pu
tative
Chl
. lut
eolu
m C
III ph
age
are
indica
ted
in co
lors:
DNA
met
abol
ism (r
ed),
struc
tura
l and
pac
kagin
g (b
lue),
puta
tive
host
deriv
ed (y
ellow
) and
tRN
As (g
reen
). Sp
ecial
feat
ures
on
both
sequ
ence
s are
indic
ated
and
desc
ribed
with
arro
ws.
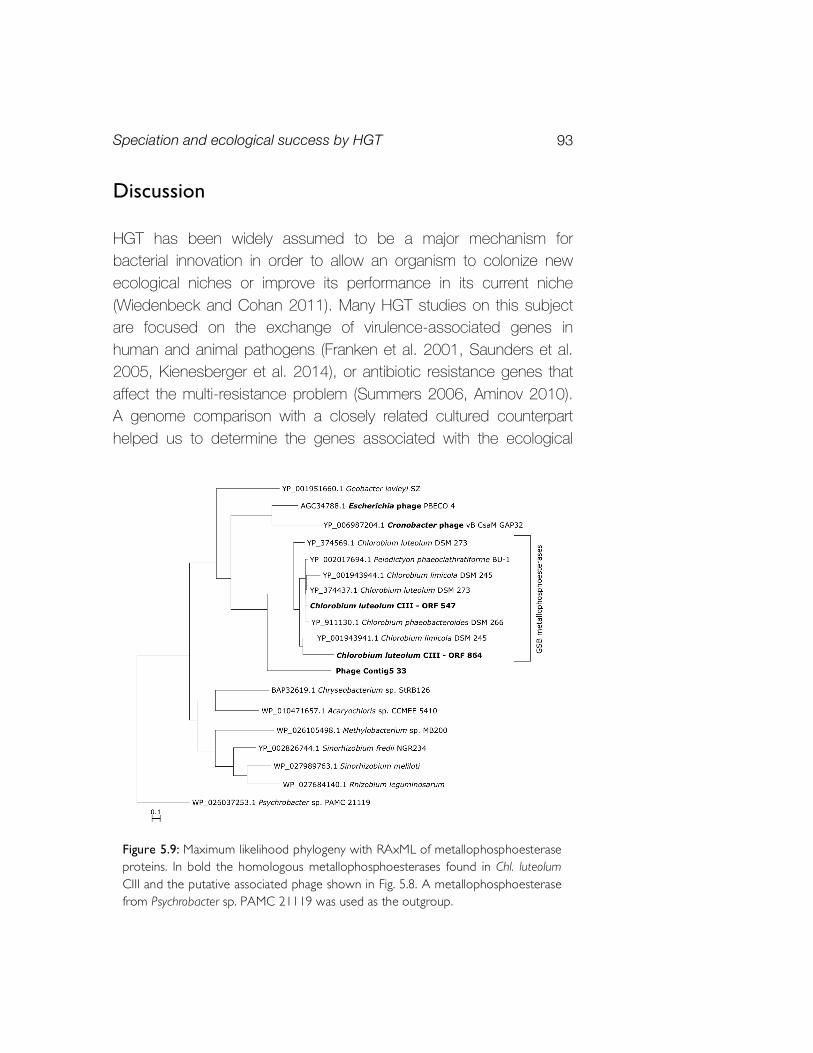
Speciation and ecological success by HGT 93
Discussion HGT has been widely assumed to be a major mechanism for bacterial innovation in order to allow an organism to colonize new ecological niches or improve its performance in its current niche (Wiedenbeck and Cohan 2011). Many HGT studies on this subject are focused on the exchange of virulence-associated genes in human and animal pathogens (Franken et al. 2001, Saunders et al. 2005, Kienesberger et al. 2014), or antibiotic resistance genes that affect the multi-resistance problem (Summers 2006, Aminov 2010). A genome comparison with a closely related cultured counterpart helped us to determine the genes associated with the ecological
Figure 5.9: Maximum likelihood phylogeny with RAxML of metallophosphoesterase proteins. In bold the homologous metallophosphoesterases found in Chl. luteolum CIII and the putative associated phage shown in Fig. 5.8. A metallophosphoesterase from Psychrobacter sp. PAMC 21119 was used as the outgroup.

Chapter 5 94
success of the strain blooming in Lake Banyoles basin CIII. The ecology and physiology of phototrophic sulfur bacteria in stratified lakes under euxinic conditions has been widely studied not only from an ecological point of view (Montesinos et al. 1983, Van Gemerden and Mas 1995, Borrego et al. 1999) but also from a genomic perspective (Tonolla et al. 2005, Frigaard and Bryant 2008, Habicht et al. 2011, Bryant et al. 2012). These previous findings provide this study with a consistent background to explore the role of HGT in the ecological success of a natural population, and possibly to understand the complex interplay between recombination and ecology in the environment (Polz et al. 2013). The genome reconstruction of a dominant GSB population, Chl. luteolum CIII, that has a closely related, cultivated counterpart with a fully sequenced genome, Chl. luteolum DSM 273T, provided a unique opportunity to explore some of the genes that convey advantages to the natural population.
The Average Nucleotide Identity (ANI) between two genomes is used as a standard for the prokaryotic species definition (Richter and Rossello-Mora 2009), and an ANI above ~95-96% is considered to indicate that the compared strains belong to the same species. Interestingly, the two Chl. luteolum strains compared here exhibited 99.7% identity in 16S rRNA sequence and only 91.7% ANI. This could simply reflect time, indicating that the differences found between strains DSM 273T and CIII are very recent and that the high degree of genetic exchange between these two Chlorobi populations is not yet reflected by their 16S rRNA sequences, but significantly captured through a whole-genome evaluation like ANI. This supports the idea that lateral exchange of genetic material within GSB occurs at a very high rate, as seen on a general study about HGT, in which Cba. tepidum TLS was the bacterium with the highest proportion of horizontally transferred genes in its genome (Nakamura et al. 2004), and that GSB are good candidates for HGT-guided evolution studies.
GSB are strict photoautotrophs that strongly depend on light availability and light harvesting for growth. In order to exploit the light wavelengths that reach the anoxic deep water layers where GSB

Speciation and ecological success by HGT 95
reside, these organisms synthesize specific carotenoids and specialized light-harvesting antenna organelles, chlorosomes, which are the most efficient light-harvesting structures known (Frigaard and Bryant 2006, Orf and Blankenship 2013). The type of BChl preferentially found in the chlorosome is one of the key factors that explain the ecological success of a strain within the water column (Montesinos et al. 1983, Van Gemerden and Mas 1995, Bryant et al. 2012).
Brown-pigmented blooms of GSB had already been detected in Lake Banyoles basin CIII in 1978 (Montesinos et al. 1983) and a sample taken in 1996 in the Banyoles area (VIBAC-6, Casamayor et al. 2000) possibly comes from the same population as that assembled in this study. On the other hand, strains UdG6047, UdG6046 and UdG6051 isolated from Banyoles (Figueras et al. 1997), were classified as Chlorobium phaeobacteroides because they were brown and contained BChl e and isorenieratene. Altogether, these findings show that pigments such as BChl e are not reliable phylogenetic markers, thus they should not be used for phylogenetic classification because they are not monophyletic traits (Maresca 2007). This can easily be shown to be the case, as a frameshift mutation in the bchU gene causes the mutant to produce BChl d instead of BChl c (Maresca et al. 2004) while a mutation in bciD causes cells to produce BChl c instead of BChl e (Harada et al. 2013). The presence of a transposase IS4 in the cluster of genes thought to mediate the synthesis of BChl e may partly explain the mobility of this region and may additionally be related to recent biological transformations, not only within a genome but also in horizontal transfer mechanisms (Ochman et al. 2000, De Palmenaer et al. 2008), which is the most reasonable explanation for the pigment-phylogeny incongruences.
The BChl e cluster acquired by Chl. luteolum CIII confers some advantages that are crucial from an ecological point of view. Firstly, the absorption peak of the BChl shifts from 746 nm in BChl c to 714 nm in BChl e (Harada et al. 2013) allowing it to cover a different range of wavelengths. However, more importantly, there is a

Chapter 5 96
large increase in absorption in the blue near 520 nm, which overlaps strongly with those light wavelengths that penetrate most deeply in the water column. Furthermore, the BChl e cluster includes the cruB gene, which is responsible for the biosynthesis of b-carotene and thus enables the production of isorenieratene and b-isorenieratene, which are almost universally associated with organisms that synthesize BChl e (Maresca et al. 2008a). These carotenoids are important elements to broaden and increase the absorption of brown-colored species between 480 and 550 nm (Imhoff 1995) and expand the photo-adaptation range (Hirabayashi et al. 2004). These differences are of great significance in terms of competition in an ecological niche where light is one of the limiting factors (Van Gemerden and Mas 1995, Stomp et al. 2007).
Iron is an essential micronutrient for many life processes including photosynthesis, respiration and nitrogen fixation (Martin et al. 1994, Boyd et al. 2000, Dupont et al. 2006). GSB have numerous proteins with Fe/S clusters in the reaction centers, including high intracellular levels of ferredoxins and rubredoxins (Bryant et al. 2012), and are therefore highly dependent upon iron for growth. Among them, FeoAB proteins are used for the uptake of Fe2+ (Kammler et al. 1993), flavodoxin as a low-potential electron donor that replaces ferredoxin and is induced by iron limitation (LaRoche et al. 1996, Chauhan et al. 2011), and ferritin-DPS as an iron storage protein (Andrews et al. 2003). FeoAB catalyze the uptake of reduced ferrous iron, which predominates under low-oxygen conditions (Bhaya et al. 2007), and the genes for FeoAB have also been found in closely related populations of the same species (Bhaya et al. 2007, Klatt et al. 2011). Soluble Fe2+ is abundant in basin CIII (Garcia-Gil 1990), but the reaction with hydrogen sulfide reduces its biological availability and thus, the incorporation of an iron transport cluster for ferrous iron by lateral transfer might confer both a higher affinity to Chl. luteolum CIII strain, and higher iron storage capacity. In addition, the presence of a flavodoxin in the cluster might be helpful under iron limitation because flavodoxin replaces ferredoxin in many reactions, thus saving iron for reaction centers and cytochromes and
Speciation and ecological success by HGT 97
giving this strain a clear advantage in the competition with other microorganisms sharing the same environment.
There are many ways to explain all these genomic differences, and one of them is transduction, the process by which horizontal transfer of genetic material is accomplished through phage infection. Viruses have two main roles in microbial ecology. Firstly, they are the main “predators” for bacterial populations in environments where only a few grazers are present and low bacterial diversity is found, like the anoxic hypolimnion of stratified karst lakes (Pedros-Alio et al. 2000, Bettarel et al. 2004). In these conditions only phages or nutrient limitation are capable of controlling the blooming populations (Maranger et al. 1994, Deng and Hayes 2008, Riemann and Grossart 2008) that are typical for GSB or PSB in stratified lakes (Overmann 1997, Gregersen et al. 2009). Secondly, they can manipulate the environment by influencing the history and evolution of their hosts through transduction (Rohwer and Thurber 2009). At the present time, no phage capable of infecting a GSB has ever been isolated (Frigaard and Bryant 2008), but we describe here a phage sequence that could explain both HGT events and control of the dominant Chl. luteolum CIII strain. The presence of CRISPRs and the high proportion of mobile elements and phage-related proteins in the Chl. luteolum CIII genome provides strong evidence for previous phage infection, and a close relationship between GSB and phages. In this study, we observed the presence of phage-related contigs with very high read-depth, which directly points to the possibility of an ongoing lytic infection of the dominant Chl. luteolum CIII population.
Additional indirect evidences for a GSB–phage relationship are also provided for in our analyses. Metallophosphoesterases represent a functionally diverse superfamily of enzymes with two metal ions bound at the conserved active site (Lohse et al. 1995). Within metallophosphoesteraes, Ser/Thr protein phosphatases are important components of various regulatory mechanisms for metabolic processes through signal transduction by protein phosphorylation (Villafranca et al. 1996). This mechanism has recently been reported to be present and functional in prokaryotes
Chapter 5 98
(Macek et al. 2008). Ser/Thr phosphatases have previously been identified in phages such as PBECO4 (Kim et al. 2013) or bacteriophage λ, suggesting they may mediate the dephosphorylation of certain proteins to allow more effective production of phage or regulate viral transcription (Cohen and Cohen 1989). Thus, the presence of a metallophosphoesterase in the phage sequence assembly, which has close phylogenetic identity to a gene associated with the putative host GSB, is robust evidence connecting this phage with Chl. luteolum CIII.
Further evidence linking our phage and GSB genomes is the similarity found in the region next to the insertion of the vrl locus, which has previously been related to virulence factors (Billington et al. 1999). However, a recent study (Knaust et al. 2007) demonstrated the expression of the vrl locus in Desulfococcus multivorans and a high degree of conservation of various vrl orthologs found in other sequenced genomes, suggesting that these genes could serve a yet-unknown function distinct from pathogenicity. Interestingly, proteins encoded by the vrl locus have best BlastP hits with distantly related organisms, suggesting that transfer of these genes might occur through a nonspecific bacterial virus (Chiura 1997, Fuhrman 1999), an idea that is consistent with observations in D. nodosus, for which it has also been speculated that virus-mediated gene transfer has occurred (Cheetham et al. 1995, Haring et al. 1995, Billington et al. 1999, Knaust et al. 2007). Finally, the phylogenetic reconstruction of the phage-conserved DNA polymerase showed an association with a distinct lineage of Myoviridae. Considering that no phage has yet been described for any GSB, it is not surprising that it would be difficult to associate this polymerase precisely with a specific virus.
Additional mechanisms that can drive HGT cannot be ruled out from our study. Bacterial lysis releases DNA to the environment and natural transformation is the uptake and incorporation of free DNA by any bacterium capable of acquiring exogenous DNA. GSB belonging to the genus Chlorobaculum are well known to be naturally transformable (Ormerod 1988, Frigaard and Bryant 2001, Harada et al. 2013), and thus transformation might be a mechanism that could
Speciation and ecological success by HGT 99
explain the incorporation of clusters of genes from closely related organisms sharing the same ecological niche, like the gene clusters for BChl e synthesis or iron transport from other GSB. Finally, conjugation is the transfer of genetic material between bacteria through cell-to-cell transfer and has been suggested to be a major mechanism responsible for HGT (Norman et al. 2009, Halary et al. 2010, Wozniak and Waldor 2010). A gene expression system by conjugative plasmid transfer has recently been tested in GSB (Azai et al. 2013); however, it is not likely to be a common natural mechanism in GSB. Among 18 GSB with sequenced genomes, only Ptc. aestuarii DSM 271T was found to contain any plasmids, although the one plasmid it contained did harbor genes for the production of a conjugative apparatus (Bryant et al. 2012).
Overall, we were able to reconstruct the genome of an ecologically successful GSB population from an euxinic karstic lake. The availability of a closely related reference genome, Chl. luteolum DSM 273T, was crucial for an exhaustive comparative analysis and for the detection of key genetic differences. The ecological implications of acquiring the genes for BChl e synthesis and Fe transport are substantial, and they could confer upon Chl. luteolum CIII a clear advantage over green-colored GSB in water-column positioning. Brown-colored GSB containing BChl e can harvest light efficiently at much greater depths in the water column than green-colored organisms synthesizing BChl c or BChl d (Maresca et al. 2004). We cannot infer the mechanism by which Chl. luteolum CIII lost the putative salt tolerance ATPase cluster but we suspect that these genes would be unnecessary in a freshwater lake ecosystem like Lake Banyoles. Because genomes are not available, we cannot clarify why the Chlorobium phaeobacteroides strains previously isolated from Lake Banyoles (Figueras et al. 1997), possibly were not successful populations in situ. The influence of phages in the environment is much larger than previously thought (Fuhrman 1999, Sharon et al. 2009a), and we describe here strong initial evidence for a putative phage that infects GSB, that could both control the blooming population and that could act as a HGT vector. It may now
Chapter 5 100
be possible to confirm these ideas through laboratory experiments. The vrl locus points to a viral-related cluster with the potential to be transferred between distantly related organisms and deserves more investigation in order to determine its function, which will be necessary to understand its recurrent presence in distantly related genomes. Follow-up studies should be focused to reveal why GSB genomes are so flexible in terms of horizontal gene transfer and intensify the search for and research on GSB phages, to understand how they might be responsible for exerting biological control and genome flexibility on these ancient photoautotrophic microorganisms.

Speciation and ecological success by HGT 101
Acknowledgements This research was funded by grant DARKNESS CGL2012-32747 from the Spanish Office of Science (MINECO) to EOC and by the Global Ocean Sampling Project supported by the Beyster Family Foundation Fund of the San Diego Foundation and the Life Technology Foundation (to JCVI). Work on BChl e biosynthesis and the genomics of GSB in the laboratory of D. A. B. was supported by the Division of Chemical Sciences, Geosciences, and Biosciences, Office of Basic Energy Sciences of the U.S. Department of Energy through Grant DE-FG02-94ER20137.

Part II: Oxic system with oligotrophic
waters


6 Winter to spring changes
in the slush bacterial community
composition of a high-mountain lake
(Lake Redon, Pyrenees)1,2
Abstract Bacterial community composition was analyzed in the slush layers of snow-covered Lake Redon (2,240 m altitude, Limnological Observatory of the Pyrenees, LOOP, NE Spain) in winter and spring and compared with bacteria from the lake water column, using 16S rRNA gene clone libraries and CARD-FISH counts. The set of biological data was related to changes in bacterial production and to other relevant environmental variables measured in situ. In winter, up
1 Original publication in Appendix B: Llorens-Marès T, JC Auguet, EO Casamayor (2012) Winter to spring changes in the slush bacterial community composition of a high mountain lake (Lake Redon, Pyrenees). Environ Microbiol Reports 4(1):50-56. doi: 10.1111/j.1758-2229.2011.00278.x. 2 See supplementary material in Appendix A

Chapter 6 106
to 70% of the 16S rRNA sequences found in the slush were closely related to planktonic bacteria from the water column beneath the ice. Conversely, during spring ablation, 50% of the sequences had >97% identity with bacteria from the cryosphere (i.e., globally distributed glaciers, snow, and ice) and may have originated from remote aerosol deposition. The transition winter to spring was characterized by consistent community changes switching from assemblages dominated by Betaproteobacteria, Verrucomicrobia and Bacteroidetes during snowpack growth to communities essentially dominated by the Bacteroidetes of classes Cytophagia and Sphingobacteria. This strong bacterial composition switch was associated with consistent increases in bacterial abundance and production, and decreasing bacterial diversity. Introduction Ice cover and snowpacks in high-altitude lakes play a pivotal role in the dynamic of the pelagic system by preventing turbulence and reducing the exchange of light, heat, gases, liquid and particles between the atmosphere and the water column (Catalan 1992, Wharton et al. 1993). The ice cover generally lasts 6 months or longer and is characterized by sandwich-like structures constituted by a superposition of snow, white ice and slush (i.e., a mixture of water and snow) layers on top of a sheet of black ice (Eppacher 1966, Adams and Allan 1987). Episodic events of flooding by lake water, melting and freezing drive dynamic changes in the physical structure and chemical characteristics of alpine ice covers (Catalan 1989, Psenner et al. 1999). Microbial activities and biomasses in the slush layers are far larger than in the water column, with a great variety and density of morphologies including short rods and cocci-like bacteria, filaments, flagellate protists (autotrophic and heterotrophic), and ciliates (Felip et al. 1995, Felip et al. 1999b).
While microbial communities from the remote cryospheres such as sea ice (Bowman et al. 1997, Brinkmeyer et al. 2003), polar

Slush bacterial composition 107
lakes (Priscu et al. 1999, Crump et al. 2003, Mosier et al. 2007) and glacier habitats (Zhang et al. 2008, Xiang et al. 2009, Zhang et al. 2009) have been extensively documented, those thriving in nearer non-permanent ice covered alpine lakes have remained poorly studied. Most of such studies have been mainly focused on eukaryotic microorganisms by traditional microscopy methods, as in the case of Lake Redon (Felip et al. 1995, Felip et al. 1999b, Felip et al. 2002), or in Lake Gossenköllessee, Tyrolean Alps, using general bacterial probes and FISH counts (Alfreider et al. 1996). In this work, we described the 16S rRNA gene composition of bacteria inhabiting the slush layers of an alpine lake, both in winter during growing of the snowpack, and in spring during the melting phase. Overall, bacterial composition and functioning in Lake Redon were closely related to other ice-related ecosystems on Earth suggesting that alpine areas are good models to improve the current understanding on the dynamics and functional role of cold adapted microorganisms facing climate variations. Results and discussion Samples were collected from different slush layers (see Fig. 6.1) and the lake water column (2 m depth beneath the ice sheet) of Lake Redon (Limnological Observatory of the Pyrenees, LOOP, NE Spain) both in winter during growth of the snowpack (March 20, 2009; 246 cm cover thickness), and in spring during the ablation phase (May 27, 2009; 70 cm cover thickness). One sample from a pool formed at the top of the snowpack in spring was also added to the study. The limnology of the lake and the different planktonic populations have been extensively studied for the last 25 years with traditional (Catalan et al. 2006), and recently with DNA-based (Hervas and Casamayor 2009) approaches. Water from the slush layer was pumped from small holes drilled in the cover (see more details in Felip et al. 1995). Bacterial community composition was analyzed by 16S rRNA gene clone libraries (Hervas and Casamayor 2009) and

Chapter 6 108
CARD-FISH counts (Medina-Sanchez et al. 2005). DNA extraction and cloning conditions were as previously reported (Dumestre et al. 2002, Ferrera et al. 2004) Overall, 437 sequences were analyzed (see accession numbers FR696618 to FR697054 in GenBank and Table 6.1 for more details), and environmental information for each sample made publicly available (accession numbers ERS016138-ERS016142 in GenBank). Bacterial activity was estimated by [3H]leucine incorporation according to the method described by Kirchman (1993) with slight modifications (Felip et al. 1995).
The highest concentrations of NO3 and NH4 were found in the top slush layer in winter, and in the water column in spring (Table 6.1). NO2 concentrations were similar in the water columns (WC), but increased significantly in the slush layers in spring. Interestingly, the highest concentrations were found in the pond sample (1.04 μeq L-1).
Figure 6.1: Bacterial community structure in Lake Redon after CARD-FISH counts and 16S rRNA gene clone libraries. Populations are represented by relative abundances of clones in different phylogenetic groups. The ice-cover during winter (March) was 246 cm thick and composed by three slush layers at 55cm, 145cm and 166cm from the surface, respectively. In spring (May) melting ponds were present on the ice-cover, which was only 70 cm thick and showed two slush layers at 20 cm and 50 cm from the surface. Water Column (WC) samples were collected 2 m depth from the black ice.

Slush bacterial composition 109
Table 6.1: Concentration of nitrogen com
pounds, total dissolved phosphorous (TDP), dissolved organic carbon (D
OC), bacterial abundance (D
API counts) and production (BP) in the set of sam
ples analyzed, and diversity indicators obtained from clone libraries in slush (SL), water colum
n (WC),
and an ice-melting pond in Lake Redon. O
TUs and diversity indices were calculated at 3% cut-off. Samples labelled in bold were selected for 16S
rRNA gene clone libraries. nd: not determ
ined.
Layer
NO3
(μeq L-1)
NH4
(μeq L-1)
NO2
(μeq L-1)
TDP (nm
ol L-1)
DOC
(m
g L-1)
DAPI (×10
4cells mL
-1) BP
(pm
ol Leu L-1h
-1) Clone
numbers
OTU
(97%)
Coverage (%
) S
Chao1
Winter
SL 1 17
14.2 0.08
90 1.2
14.9 nd
Nd nd
nd nd
SL
2
7
2.4
0
.05
9
4
0.6
9
.9
4.2
±0
.2
90
5
0
68
8
1 ±
18
SL 3
7 3.4
0.05 68
0.6 16.5
nd Nd
nd nd
nd W
C
6
2.8
0
.07
4
4
0.5
4
2.5
1
.2±
0.2
9
0
45
6
1
16
4 ±
93
Spring
PO
ND
3
3
.8
1.0
4
28
4
1.3
1
78
.5
22
3.1
±5
.2
81
4
2
63
1
14
± 5
3
SL
1
4
3.5
0
.38
1
80
0
.8
86
.5
27
6.3
±1
1.0
8
9
18
8
8
73
± n
d
SL 2 4
3.2 0.28
123 0.6
76.1 nd
Nd nd
nd nd
WC
1
5
9.6
0
.07
6
0
0.7
6
8.8
7
8.0
±9
.1
87
3
8
72
7
7 ±
29

Chapter 6 110
Total dissolved phosphorus (TDP) and dissolved organic carbon (DOC) showed the highest concentrations closer to the surface (Table 6.1) both in winter (top slush layers) and spring (pond). We did not observe temporal changes in DOC concentrations but TDP doubled in the spring, probably due to frequent Saharan dust depositions on this area (Hervas et al. 2009, Reche et al. 2009). All concentrations were within previously reported ranges in this area (Felip et al. 1995, Felip et al. 1999b).
Total DAPI counts and bacterial production values in slush layers were similar to those found by Alfreider et al. (1996) and tended to be higher than in the water column (WC), except for DAPI counts during winter (Table 6.1). Slush layers offer better conditions for bacterial growth than the WC because the ice grains matrix with nutrient-rich interstitial water, provides a better environment for bacterial activity, interaction between cells and substrate, and for the development of filamentous forms as previously discussed (Felip et al. 1995, Felip et al. 1999b). We observed that Bacteroidetes were particularly favored being twice as abundant in the slush layers than in the plankton as shown by CARD-FISH counts (Fig. 6.1). Betaproteobacteria cells were also found to be more abundant in the slush layers in winter. These results are in agreement with a previous CARD-FISH work carried out in Lake Gossenköllessee (Alfreider et al. 1996). As in this previous work, we also observed a shift towards bacteria that did not hybridize with any of the group-specific probes tested in the transition from the upper slush layer to the WC. Particularly in March, up to 70% of EUB338 positive cells did not hybridize with any of the group specific probes tested, and the sum of the cells hybridized with probes BET42a (for Betaproteobacteria), HGC69a (for Actinobacteria) and CF319a (for Bacteroidetes) was particularly low. We could relate this fact to the abundance of Verrucomicrobia sequences in the WC (up to 46%, Fig. 6.1). Interestingly, bacterial production increased 72.2 ± 48.2 fold (Table 6.1) from winter to spring, and we observed significant increases in bacterial abundance (4.2 ± 2.6 fold, Table 6.1), mainly by Bacteroidetes (12 times more abundant in spring vs. winter),

Slush bacterial composition 111
Betaproteobacteria (nine times) and Actinobacteria (10 times) (Fig. 6.1). During the ablation phase, light availability increased promoting massive algae growth (Felip et al. 1999b), further fuelling most of the bacterial activity detected. Glaciers, which hold 75% of the freshwater on the planet, are largely autotrophic systems (Anesio et al. 2009), and polar sea ice has also shown a net autotrophic activity integrated over an entire season although polar seas melting will probably exacerbate bacterial respiration (Kaartokallio 2004). Ice-melting is therefore a major promoter of community transitions both in marine and in inland waters. Previous studies in Lake Redon (Pyrenees) and Lake Gossenköllesee (Tyrolean Alps) showed that temporal changes in eukaryotic assemblages were strongly affected by the physical transformation of the lake cover and the snowpack in the catchment (Felip et al. 1999b, Felip et al. 2002). After 16S rRNA gene analyses, we observed drastic changes in the slush bacterial community composition (Fig. 6.1) and a decrease in bacterial diversity from winter to spring (Table 6.1). The vulnerability of the cryosphere (i.e., cold ecosystems) to climate change and its potential large influence in the emission of greenhouse gases will certainly promote more research on the ecology of the microbial communities inhabiting these habitats.
All the sequences obtained in this work fell into eight bacterial phyla (Fig. 6.1 and Supplementary Fig. A.C6.1). Overall, Bacteroidetes was the most abundant (42% of all 16S rRNA gene sequences) and showed a marked winter to spring increase in abundance (17 ± 7 to 59 ± 6% respectively, Fig. 6.1); there was a clear phylogenetic segregation between the ice-growth phase in winter (mostly Flavobacteria and Bacteroidia) and the spring ablation period (mostly Cytophagia and Sphingobacteria) (Fig. 6.2 and Supplementary Fig. A.C6.1). Bacteroidetes are abundant in inland waters (Barberan and Casamayor 2010) and closely related to phytoplankton blooms, both using phytoplankton exudates during algal growth (Zeder et al. 2009) or complex DOM derived from senescent phytoplankton (Pinhassi et al. 2004, Teira et al. 2008). Algae were abundant in the spring sample as detected by
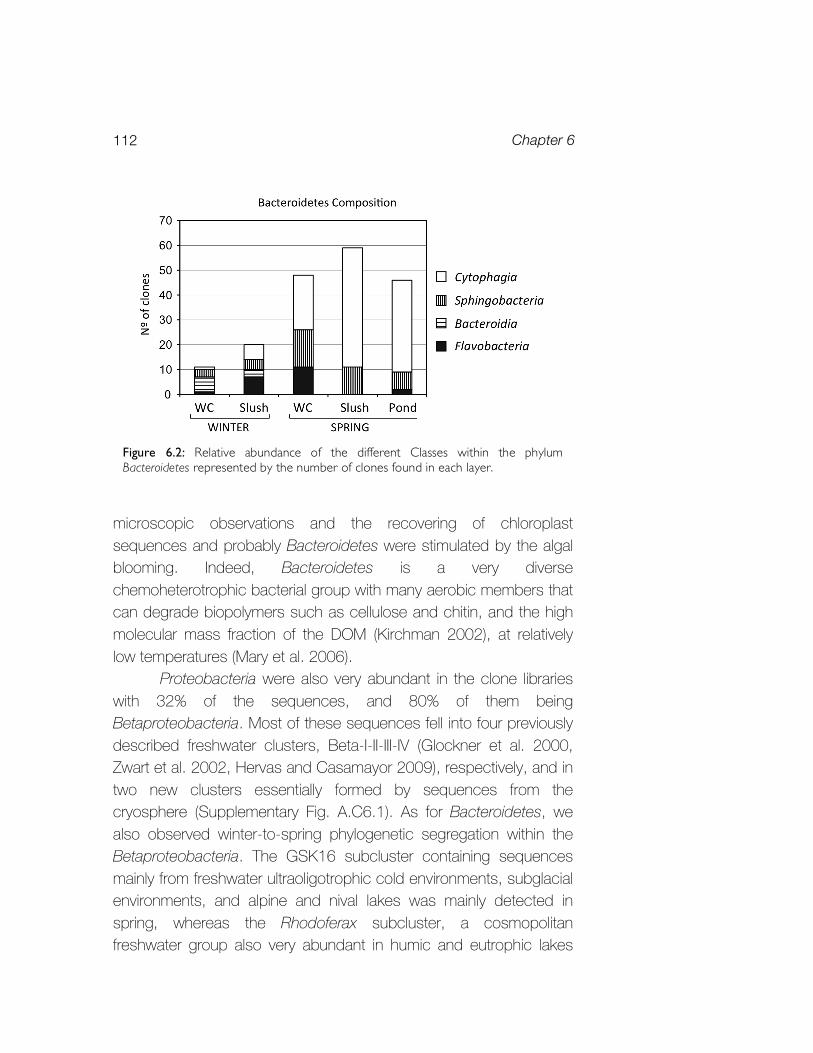
Chapter 6 112
microscopic observations and the recovering of chloroplast sequences and probably Bacteroidetes were stimulated by the algal blooming. Indeed, Bacteroidetes is a very diverse chemoheterotrophic bacterial group with many aerobic members that can degrade biopolymers such as cellulose and chitin, and the high molecular mass fraction of the DOM (Kirchman 2002), at relatively low temperatures (Mary et al. 2006).
Proteobacteria were also very abundant in the clone libraries with 32% of the sequences, and 80% of them being Betaproteobacteria. Most of these sequences fell into four previously described freshwater clusters, Beta-I-II-III-IV (Glockner et al. 2000, Zwart et al. 2002, Hervas and Casamayor 2009), respectively, and in two new clusters essentially formed by sequences from the cryosphere (Supplementary Fig. A.C6.1). As for Bacteroidetes, we also observed winter-to-spring phylogenetic segregation within the Betaproteobacteria. The GSK16 subcluster containing sequences mainly from freshwater ultraoligotrophic cold environments, subglacial environments, and alpine and nival lakes was mainly detected in spring, whereas the Rhodoferax subcluster, a cosmopolitan freshwater group also very abundant in humic and eutrophic lakes
Figure 6.2: Relative abundance of the different Classes within the phylum Bacteroidetes represented by the number of clones found in each layer.
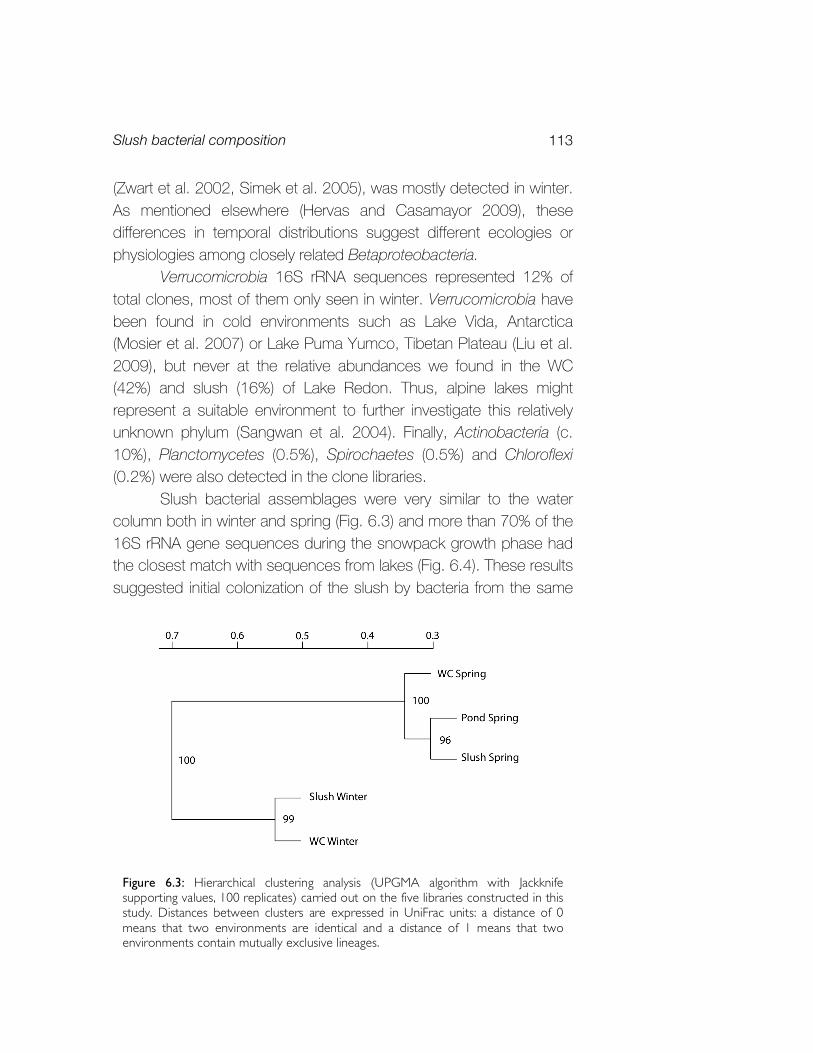
Slush bacterial composition 113
(Zwart et al. 2002, Simek et al. 2005), was mostly detected in winter. As mentioned elsewhere (Hervas and Casamayor 2009), these differences in temporal distributions suggest different ecologies or physiologies among closely related Betaproteobacteria.
Verrucomicrobia 16S rRNA sequences represented 12% of total clones, most of them only seen in winter. Verrucomicrobia have been found in cold environments such as Lake Vida, Antarctica (Mosier et al. 2007) or Lake Puma Yumco, Tibetan Plateau (Liu et al. 2009), but never at the relative abundances we found in the WC (42%) and slush (16%) of Lake Redon. Thus, alpine lakes might represent a suitable environment to further investigate this relatively unknown phylum (Sangwan et al. 2004). Finally, Actinobacteria (c. 10%), Planctomycetes (0.5%), Spirochaetes (0.5%) and Chloroflexi (0.2%) were also detected in the clone libraries.
Slush bacterial assemblages were very similar to the water column both in winter and spring (Fig. 6.3) and more than 70% of the 16S rRNA gene sequences during the snowpack growth phase had the closest match with sequences from lakes (Fig. 6.4). These results suggested initial colonization of the slush by bacteria from the same
Figure 6.3: Hierarchical clustering analysis (UPGMA algorithm with Jackknife supporting values, 100 replicates) carried out on the five libraries constructed in this study. Distances between clusters are expressed in UniFrac units: a distance of 0 means that two environments are identical and a distance of 1 means that two environments contain mutually exclusive lineages.
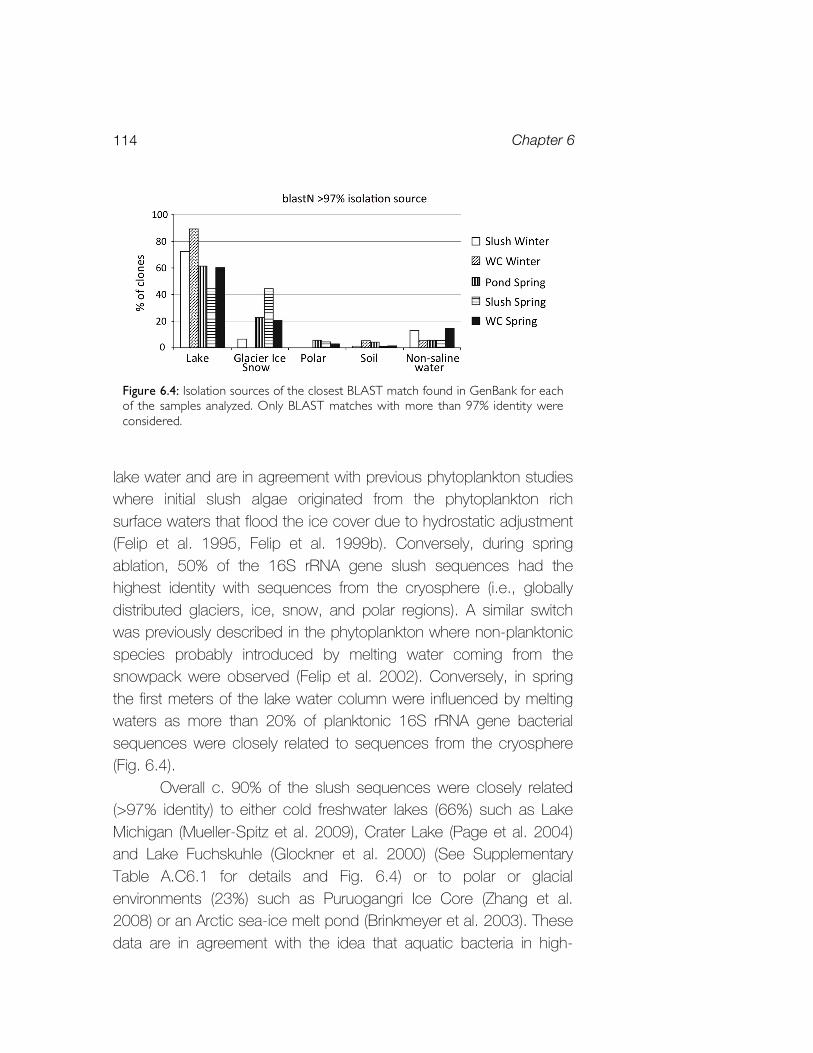
Chapter 6 114
lake water and are in agreement with previous phytoplankton studies where initial slush algae originated from the phytoplankton rich surface waters that flood the ice cover due to hydrostatic adjustment (Felip et al. 1995, Felip et al. 1999b). Conversely, during spring ablation, 50% of the 16S rRNA gene slush sequences had the highest identity with sequences from the cryosphere (i.e., globally distributed glaciers, ice, snow, and polar regions). A similar switch was previously described in the phytoplankton where non-planktonic species probably introduced by melting water coming from the snowpack were observed (Felip et al. 2002). Conversely, in spring the first meters of the lake water column were influenced by melting waters as more than 20% of planktonic 16S rRNA gene bacterial sequences were closely related to sequences from the cryosphere (Fig. 6.4).
Overall c. 90% of the slush sequences were closely related (>97% identity) to either cold freshwater lakes (66%) such as Lake Michigan (Mueller-Spitz et al. 2009), Crater Lake (Page et al. 2004) and Lake Fuchskuhle (Glockner et al. 2000) (See Supplementary Table A.C6.1 for details and Fig. 6.4) or to polar or glacial environments (23%) such as Puruogangri Ice Core (Zhang et al. 2008) or an Arctic sea-ice melt pond (Brinkmeyer et al. 2003). These data are in agreement with the idea that aquatic bacteria in high-
Figure 6.4: Isolation sources of the closest BLAST match found in GenBank for each of the samples analyzed. Only BLAST matches with more than 97% identity were considered.

Slush bacterial composition 115
mountain regions are globally distributed (Zwart et al. 1998, Glockner et al. 2000, Liu et al. 2006, Sommaruga and Casamayor 2009) but only develop in cold and oligotrophic habitats as alpine lakes, glaciers, snow or polar environments. As previously discussed (Hervas et al. 2009, Hervas and Casamayor 2009), airborne dispersal is probably the mechanism that better explains the cosmopolitanism found in alpine areas. Despite their minor quantitative relevance in the whole cryosphere, these alpine areas are very convenient systems for surveying changes in microbial composition, dynamics, activity, and fate following environmental perturbations. Acknowledgements We are thankful to Centre de Recerca d’Alta Muntanya, Universitat de Barcelona, Vielha for laboratory facilities. L Camarero, M Felip, M Vila-Costa, X Triadó, and A Fernandez-Guerra are acknowledged for field and lab assistance and ancillary data. This research was supported by grants PIRENA CGL2009-13318 and GOS-LAKES CGL2009-08523-E to E.O.C., and CONSOLIDER grant GRACCIE CSD2007-00067 from the Spanish Office of Science and Innovation (MICINN). J.C.A. benefits from a Juan de la Cierva postdoctoral fellow (MICINN).


7 A metagenomics view on the microbial
biogeochemical potential of an
ultraoligotrophic high-mountain lake
(Lake Redon, Pyrenees)1
Abstract The biodiversity and potential functional role of a deep high-mountain lake was analyzed by microbial metagenomics. We explored three samples from two contrasted limnological situations: the surface slush during the ice melting phase, and the epilimnion and hypolimnion at the end of the stratification period. The slush sample was dominated by algae whereas bacteria dominated the planktonic samples. Diversity indices were higher in the hypolimnion and lower in the slush, where a bloom of Chrysophyceae dominated the community. Accordingly, most of the reads from the slush showed the potential for aerobic respiration and aerobic carbon fixation by
1 See supplementary material in Appendix A

Chapter 7 118
algae. In contrast, planktonic aerobic respiration was mainly dominated by heterotrophic Burkholderiales in the epilimnion and Actinobacteria and Burkholderiales in the hypolimnion. The potential for an active nitrogen cycle (nitrification, nitrite oxidation and nitrate reduction) was mainly found in the slush and hypolimnion. No genes for dissimilatory nitrate reduction to ammonium were detected and potential for methanogenesis, anaerobic ammonia oxidation and dissimilatory sulfur pathways were only detected in the hypolimnion. The microbial community of the lake seems to have adapted to P-limitation by the ability to uptake and utilize organic phosphorus. Overall, we evaluated the main processes shaping the biogeochemistry of Lake Redon and unveiled the presence of marker genes for key biogeochemical pathways, which may help to further study the response of alpine lakes to environmental changes. Introduction The study of biogeochemical processes in highly diluted alpine oligotrophic environments is a difficult task. High-altitude aquatic ecosystems experience extreme physical conditions like low temperatures, high UV radiation, ultraoligotrophic conditions and strong temporal dynamics driven by a long winter with the formation of an ice cover. They harbour lower concentrations of microbial biomass than other aquatic systems, which make it difficult to explore microbial activities and processes by classical in situ methods (Sommaruga 2001, Catalan et al. 2006). These conditions are very difficult and tedious to mimic in the laboratory, and therefore the culturability of microorganisms living under such extreme conditions is very low. Molecular ecology and metagenomics may help microbial ecologists to overcome these difficulties to properly explore ecological processes and microbial community composition in highly diluted waters (Alfreider et al. 1996, Llorens-Mares et al. 2012, Barberan and Casamayor 2014).

High-mountain lake metagenomics 119
Physical properties, biogeochemical processes and primary production in high-mountain Lake Redon have been largely studied by traditional limnologists (Catalan 1988, Catalan et al. 1992, Camarero et al. 1999). Microbial activities (Felip et al. 1995) and eukaryotic microbial assemblages inhabiting Lake Redon were described by fluorescence and microscopic analysis (Felip et al. 1999a, Felip et al. 2002). However, there is still a lack of a mechanistic knowledge to understand how the environment shapes the bacterial community composition and the individual roles carried out within the carbon, nitrogen, sulfur and phosphorus cycles. Previous studies highlighted a prevalent role of the nitrogen cycle in high-mountain lakes (Catalan 1992, Catalan et al. 1994), where atmospheric depositions (i.e., rain and snow) act as main sources of nitrogen, phosphorus and iron (Camarero and Catalan 1993, Catalan et al. 1994, Reche et al. 2009). In addition, phosphorus limitation may play a prevalent role in microbial growth and phytoplankton composition and productivity (Catalan et al. 2006, Camarero and Catalan 2012). Unveiling the microbial communities potentially involved in the biogeochemical cycling will favour a better understanding on the ecological lake functioning and help the interpretation of past and future studies related with both climate change and remote sensing of environmental pollution (Catalan et al. 2002).
In the present study, we explored three different water layers of the deep glacial dimictic Lake Redon (central Pyrenees): the slush during the ice-covered period, and the epilimnion and hypolimnion during the stratified period before the autumn overturn. These three different situations were analyzed by metagenomics and in silico analysis for phylogenetic classification and identification of the main metabolic pathways. We hypothesized to find a limited dissimilatory sulfur cycle because of the presence of oxygen in the whole water column and a predominance of aerobic-related genes in all the samples with autotrophy dominating in the slush and epilimnion. We also expected an important presence of nitrogen- and phosphorus-
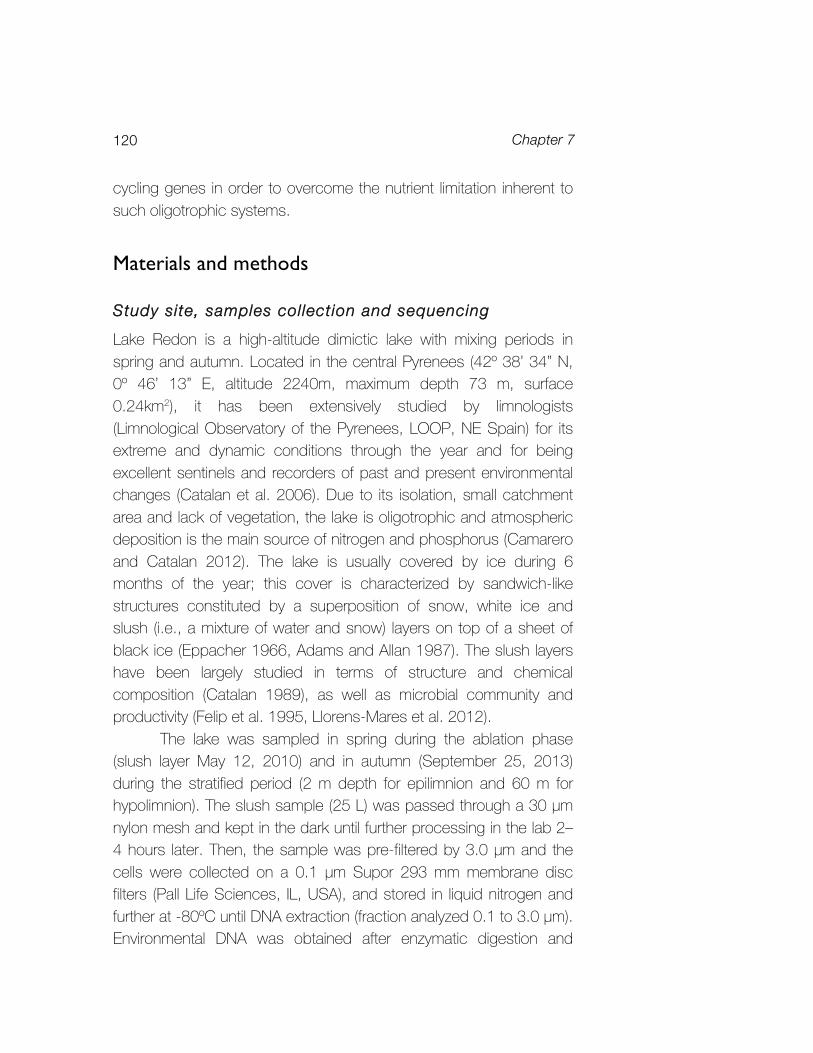
Chapter 7 120
cycling genes in order to overcome the nutrient limitation inherent to such oligotrophic systems. Materials and methods Study site, samples col lection and sequencing
Lake Redon is a high-altitude dimictic lake with mixing periods in spring and autumn. Located in the central Pyrenees (42º 38’ 34” N, 0º 46’ 13” E, altitude 2240m, maximum depth 73 m, surface 0.24km2), it has been extensively studied by limnologists (Limnological Observatory of the Pyrenees, LOOP, NE Spain) for its extreme and dynamic conditions through the year and for being excellent sentinels and recorders of past and present environmental changes (Catalan et al. 2006). Due to its isolation, small catchment area and lack of vegetation, the lake is oligotrophic and atmospheric deposition is the main source of nitrogen and phosphorus (Camarero and Catalan 2012). The lake is usually covered by ice during 6 months of the year; this cover is characterized by sandwich-like structures constituted by a superposition of snow, white ice and slush (i.e., a mixture of water and snow) layers on top of a sheet of black ice (Eppacher 1966, Adams and Allan 1987). The slush layers have been largely studied in terms of structure and chemical composition (Catalan 1989), as well as microbial community and productivity (Felip et al. 1995, Llorens-Mares et al. 2012).
The lake was sampled in spring during the ablation phase (slush layer May 12, 2010) and in autumn (September 25, 2013) during the stratified period (2 m depth for epilimnion and 60 m for hypolimnion). The slush sample (25 L) was passed through a 30 µm nylon mesh and kept in the dark until further processing in the lab 2–4 hours later. Then, the sample was pre-filtered by 3.0 µm and the cells were collected on a 0.1 µm Supor 293 mm membrane disc filters (Pall Life Sciences, IL, USA), and stored in liquid nitrogen and further at -80ºC until DNA extraction (fraction analyzed 0.1 to 3.0 µm). Environmental DNA was obtained after enzymatic digestion and

High-mountain lake metagenomics 121
phenol extraction in Tris-EDTA buffer, and 454 pyrosequencing analyses were carried out at the J Craig Venter Institute in Rockville, MD, USA as recently reported (Zeigler Allen et al. 2012). The planktonic samples (15L) were passed through a 30 µm nylon mesh and kept in the dark until further processing in the lab 2–4 hours later. The samples were pre-filtered by 5.0 µm and the plankton collected onto 0.2 µm polycarbonate membranes (47 mm diameter, Nucleopore, Whatman Ltd.) and stored at -20ºC in lysis buffer (40mM EDTA, 50mM Tris, pH 8.3, 0.75 M sucrose) until nucleic acid extraction (fraction analyzed 0.2 to 5.0 µm). For the genomic DNA extraction, the membranes were enzymatically digested with lysozyme, proteinase K and sodium dodecylsulfate incubation, followed by phenol-chloroform-isoamyl (25:24:1, v/v/v) extraction. Purification and concentration was carried out with Amicon® Ultra 4 Centrifugal Filter Units – 100000 NMWL (Millipore). Shotgun library generation (550 bp), DNA preparation and Illumina MiSeq (Illumina, San Diego, CA) sequencing with 2×250 bp configuration was performed at ASCIDEA (Barcelona, Spain). DNA sequences analyses
Metagenomics sequences were quality filtered and annotated as recently reported (Llorens-Mares et al. 2015). Approximately four hundred thousand reads were recovered from the slush sample by 454 sequencing technology, and about ten million reads from the planktonic samples by Illumina. KEGG Orthologs (KO) annotation was used for functional analysis and KO counts were normalized according to the length of the read and the length of the target gene (Sharon et al. 2009b) in order to have comparable results from the different sequencing methodologies. The functional analyses focused in the genetic potential of the main biogeochemical cycles, i.e., carbon (C), nitrogen (N) and sulfur (S) cycling (Lauro et al. 2011, Llorens-Mares et al. 2015). In order to investigate the role of phosphate (P) incorporation and processing in phosphorus-limited conditions, we compiled the key genes for phosphorus cycling (Gifford et al. 2011, Vila-Costa et al. 2013) into the KO list for
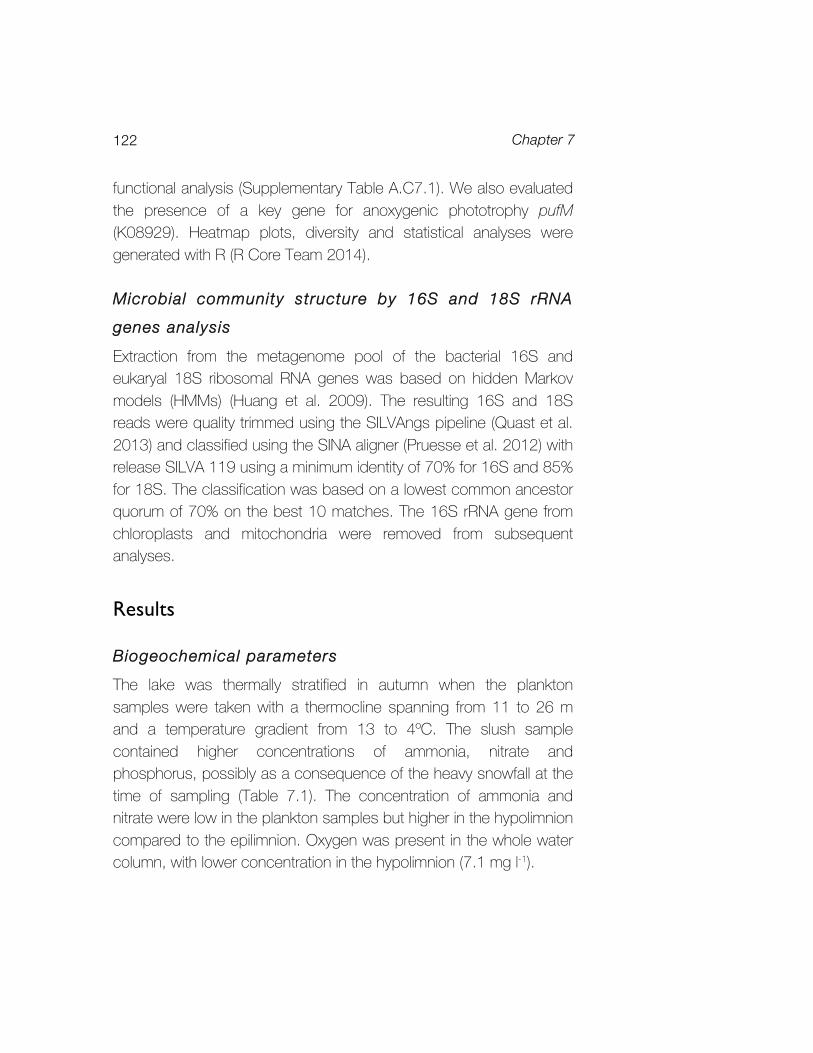
Chapter 7 122
functional analysis (Supplementary Table A.C7.1). We also evaluated the presence of a key gene for anoxygenic phototrophy pufM (K08929). Heatmap plots, diversity and statistical analyses were generated with R (R Core Team 2014). Microbial community structure by 16S and 18S rRNA
genes analysis
Extraction from the metagenome pool of the bacterial 16S and eukaryal 18S ribosomal RNA genes was based on hidden Markov models (HMMs) (Huang et al. 2009). The resulting 16S and 18S reads were quality trimmed using the SILVAngs pipeline (Quast et al. 2013) and classified using the SINA aligner (Pruesse et al. 2012) with release SILVA 119 using a minimum identity of 70% for 16S and 85% for 18S. The classification was based on a lowest common ancestor quorum of 70% on the best 10 matches. The 16S rRNA gene from chloroplasts and mitochondria were removed from subsequent analyses. Results
Biogeochemical parameters
The lake was thermally stratified in autumn when the plankton samples were taken with a thermocline spanning from 11 to 26 m and a temperature gradient from 13 to 4ºC. The slush sample contained higher concentrations of ammonia, nitrate and phosphorus, possibly as a consequence of the heavy snowfall at the time of sampling (Table 7.1). The concentration of ammonia and nitrate were low in the plankton samples but higher in the hypolimnion compared to the epilimnion. Oxygen was present in the whole water column, with lower concentration in the hypolimnion (7.1 mg l-1).
High-mountain lake metagenomics 123
Table 7.1: Biogeochemical data for Lake Redón. Abbreviations: DOC, dissolved organic carbon; TDP, total dissolved phosphorus.
Slush Epilimnion Hypolimnion
Depth (m) 0 2 60 Temperature (ºC) 0 13 4 Conductivity (μS cm-1) 8.2 9.6 10.1 Oxygen (mg l-1) 8.5 8.6 7.1 Light (% incident) 100 90 0 DOC (mg l-1) 0.55 0.3 0.2 pH 5.49 6.84 6.22 TDP (μM) 0.35 0.01 0.02 NH4 (μM) 16.43 0.3 3.1 NO2 (μM) 0.08 0.08 0.09 NO3 (μM) 11.74 4.6 6.3 Bacterial abundance (x 105 cells ml-1) 8.6 5.2 8.8
Microbial community structure
At the time of sampling the slush sample was dominated by eukaryotes (>80% of the total rRNA reads) whereas prokaryotes dominated planktonic samples both in surface (93%) and in deep waters (95%) (Fig. 7.1 and Supplementary Table A.C7.2). Higher prokaryotic diversity was found in the hypolimnion (Table 7.2; Shannon-Weaver index H’=3.23) than in the slush (H’=2.40) and the epilimnion (H’=1.90). The highest eukaryotic diversity was also found in the hypolimnion (H’=2.59), followed by the epilimnion (H’=2.34) and the lowest diversity in the slush (H’=0.67). This result is in agreement with an algal bloom of Chrysophyceae (85% of 18S rRNA recovered reads and 73% of total rRNA reads) present in the slush layer in May. From these, c. 70% of the sequences were assigned to the uncultured Chrysophyceae group CCMP1899 and 20% to the chrysophyta genus Hydrurus. The second most abundant lineage in the slush was the fungi Chytridiomycota (5.5%). Sequences related to other protists such as Ciliophora (2.5%), Basidiomycota and

Chapter 7 124
Table 7.2: Metagenomic data.
Slush Epilimnion Hypolimnion Total number of reads 396197 10307742 11618730 Functionally assigned metagenomic reads as KO
33080 (8.3%)
1567195 (15.2%)
903012 (7.8%)
Reads of key genes in C, N, S and P cycles 836 46014 26358
16S rRNA genes in the metagenomic pool* 73 8838 8795
16S rRNA Shannon-Weaver index 2.40 1.90 3.23 18S rRNA genes in the metagenomic pool 402 598 433
18S rRNA Shannon-Weaver index 0.67 2.34 2.59 *Chloroplasts and mitochondria were discarded in this count.
Figure 7.1: Global community structure (relative abundances at the Phylum level except for Proteobacteria at the Class level) of Lake Redon obtained from the 16S and 18S rRNA gene present in the metagenomic pool. See detailed information in supplementary Table A.C7.2.
High-mountain lake metagenomics 125
Cercozoa were also found. The bacterial component represented only 15.4% of the microbial community present in the slush and was dominated by Burkholderiales (Betaproteobacteria, 34.2% of total 16S rRNA reads) followed by Pseudomonadales (Gammaproteobacteria, 17.8%) and in lower proportion Clostridiales (Firmicutes, 5.5%) and Acidimicrobiales (Actinobacteria, 4.1%). Archaeal ribosomal sequences were not detected.
In the epilimnion, the eukaryotic 18S rRNA gene pool was dominated by the algae Chrysophyceae (33%) mainly of the uncultured clusters LG07-07 (30% of total chrysophytes), P34.48 (14%), and E222 (11%), and of the order Chromulinales (16%). Bicosoecida (8% of total 18S rRNA gene reads) and the alveolates Ciliphora (16.1%) and Dinoflagellata (6%) were also present in the epilimnion. Up to 10.5% of the 18S rRNA gene reads were from fungi (mainly Basidiomycota and Ascomycota), and 6% were affiliated to the protist Cercozoa. Conversely, the hypolimnetic protists were dominated by Cryptomonas (30.5%), the alveolates Protalveolata (10.6%) and Ciliophora (8%), Nucletmycea (9%) and Chrysophyceae (9%, most of them of the uncultured P34.48 cluster and Chromulinales). We also observed substantial differences in the planktonic bacterial community composition between the epi- and hypolimnion. The 16S rRNA gene pool from the epilimnion was dominated by Burkholderiales (48.7%), Frankiales (19.1%) and Flavobacteriales (9.3%). Conversely, the bacterial assemblage from the hypolimnion was more evenly distributed and Frankiales dominated (24.5%), followed by Burkholderiales (7.9%), Sphingobacteriales (6.2%), Flavobacteriales (5.5%), Planktomycetales (4.4%), Acidimicrobiales (4.1%), Candidate Division OD1 (3.8%) and various verrucomicrobial lineages (7.5%). Nine hypolimnion sequences (0.1% of the total 16S rRNA gene reads) affiliated to the domain Archaea (Euryarchaeotal clade DHVEG-6).
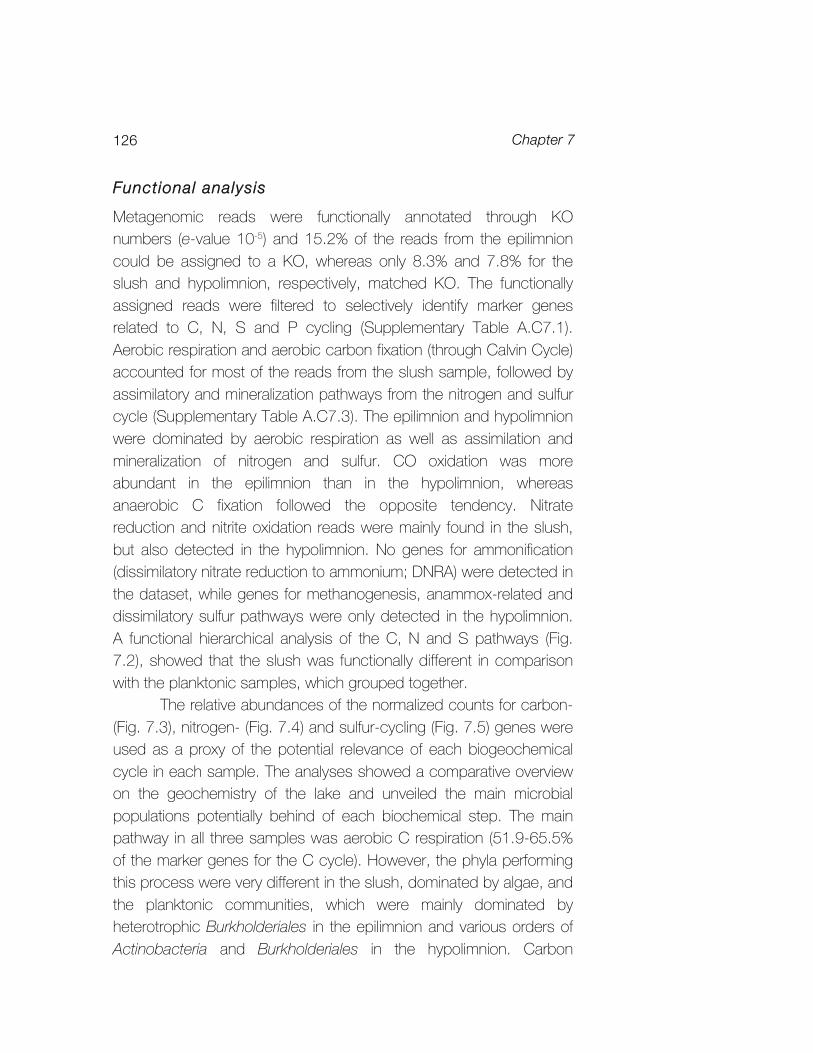
Chapter 7 126
Functional analysis
Metagenomic reads were functionally annotated through KO numbers (e-value 10-5) and 15.2% of the reads from the epilimnion could be assigned to a KO, whereas only 8.3% and 7.8% for the slush and hypolimnion, respectively, matched KO. The functionally assigned reads were filtered to selectively identify marker genes related to C, N, S and P cycling (Supplementary Table A.C7.1). Aerobic respiration and aerobic carbon fixation (through Calvin Cycle) accounted for most of the reads from the slush sample, followed by assimilatory and mineralization pathways from the nitrogen and sulfur cycle (Supplementary Table A.C7.3). The epilimnion and hypolimnion were dominated by aerobic respiration as well as assimilation and mineralization of nitrogen and sulfur. CO oxidation was more abundant in the epilimnion than in the hypolimnion, whereas anaerobic C fixation followed the opposite tendency. Nitrate reduction and nitrite oxidation reads were mainly found in the slush, but also detected in the hypolimnion. No genes for ammonification (dissimilatory nitrate reduction to ammonium; DNRA) were detected in the dataset, while genes for methanogenesis, anammox-related and dissimilatory sulfur pathways were only detected in the hypolimnion. A functional hierarchical analysis of the C, N and S pathways (Fig. 7.2), showed that the slush was functionally different in comparison with the planktonic samples, which grouped together.
The relative abundances of the normalized counts for carbon- (Fig. 7.3), nitrogen- (Fig. 7.4) and sulfur-cycling (Fig. 7.5) genes were used as a proxy of the potential relevance of each biogeochemical cycle in each sample. The analyses showed a comparative overview on the geochemistry of the lake and unveiled the main microbial populations potentially behind of each biochemical step. The main pathway in all three samples was aerobic C respiration (51.9-65.5% of the marker genes for the C cycle). However, the phyla performing this process were very different in the slush, dominated by algae, and the planktonic communities, which were mainly dominated by heterotrophic Burkholderiales in the epilimnion and various orders of Actinobacteria and Burkholderiales in the hypolimnion. Carbon

High-mountain lake metagenomics 127
fixation through the Calvin cycle was abundant in the slush sample by algae, and rare in the planktonic samples. Carbon monoxide (CO) oxidation marker genes were mainly found in the planktonic samples and related to heterotrophic bacteria (Burholderiales, Rhizobiales and Rhodospirillales). Anaerobic carbon fixation was mainly found in the hypolimnion mostly by Burkholderiales and Rhizobiales (probably anaplerotic through the reductive citric acid cycle/Arnon pathway).
Figure 7.2: Heatmap plot and functional clustering of the selected KEGG Orthologs for the predicted ORFs from the metagenomic reads for Lake Redon.
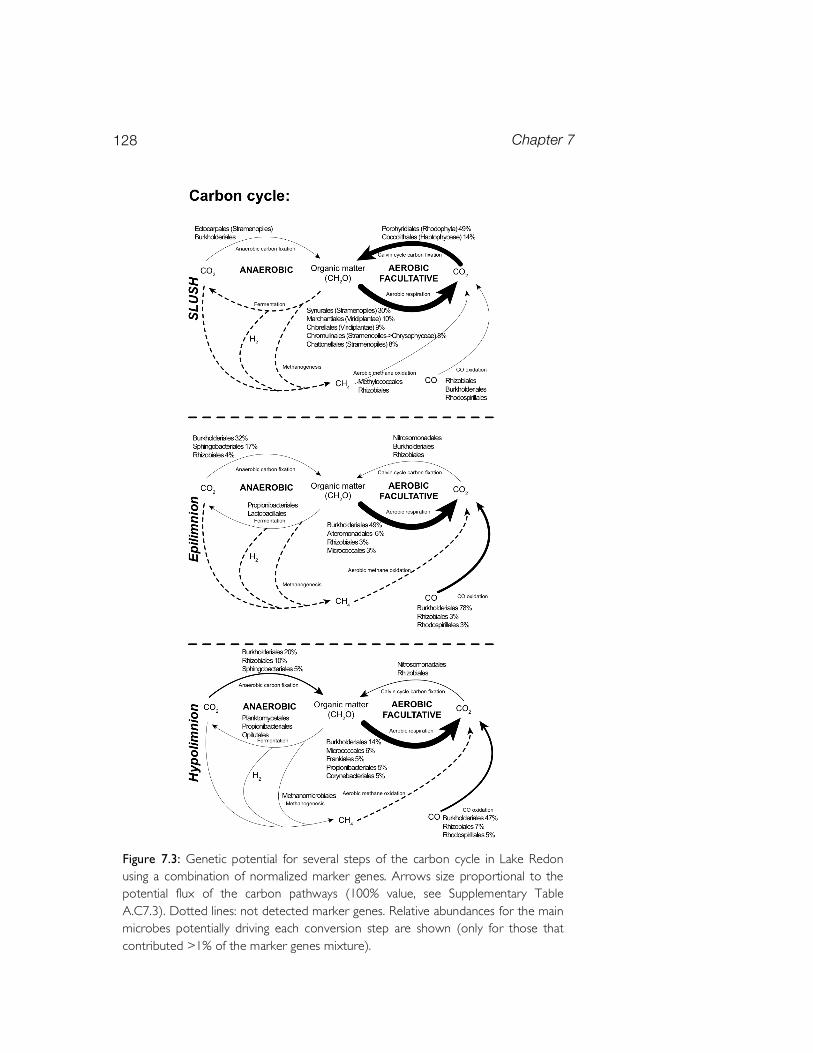
Chapter 7 128
Figure 7.3: Genetic potential for several steps of the carbon cycle in Lake Redon using a combination of normalized marker genes. Arrows size proportional to the potential flux of the carbon pathways (100% value, see Supplementary Table A.C7.3). Dotted lines: not detected marker genes. Relative abundances for the main microbes potentially driving each conversion step are shown (only for those that contributed >1% of the marker genes mixture).

High-mountain lake metagenomics 129
Figure 7.4: Genetic potential for several steps of the nitrogen cycle in Lake Redon using a combination of normalized marker genes. Arrows size proportional to the potential flux of the nitrogen pathways (100% value, see Supplementary Table A.C7.3). Dotted lines: not detected marker genes. Relative abundances for the main microbes potentially driving each conversion step are shown (only for those that contributed >1% of the marker genes mixture).

Chapter 7 130
Figure 7.5: Genetic potential for several steps of the sulfur cycle in Lake Redon using a combination of normalized marker genes. Arrows size proportional to the potential flux of the sulfur pathways (100% value, see Supplementary Table A.C7.3). Dotted lines: not detected marker genes. Relative abundances for the main microbes potentially driving each conversion step are shown (only for those that contributed >1% of the marker genes mixture).
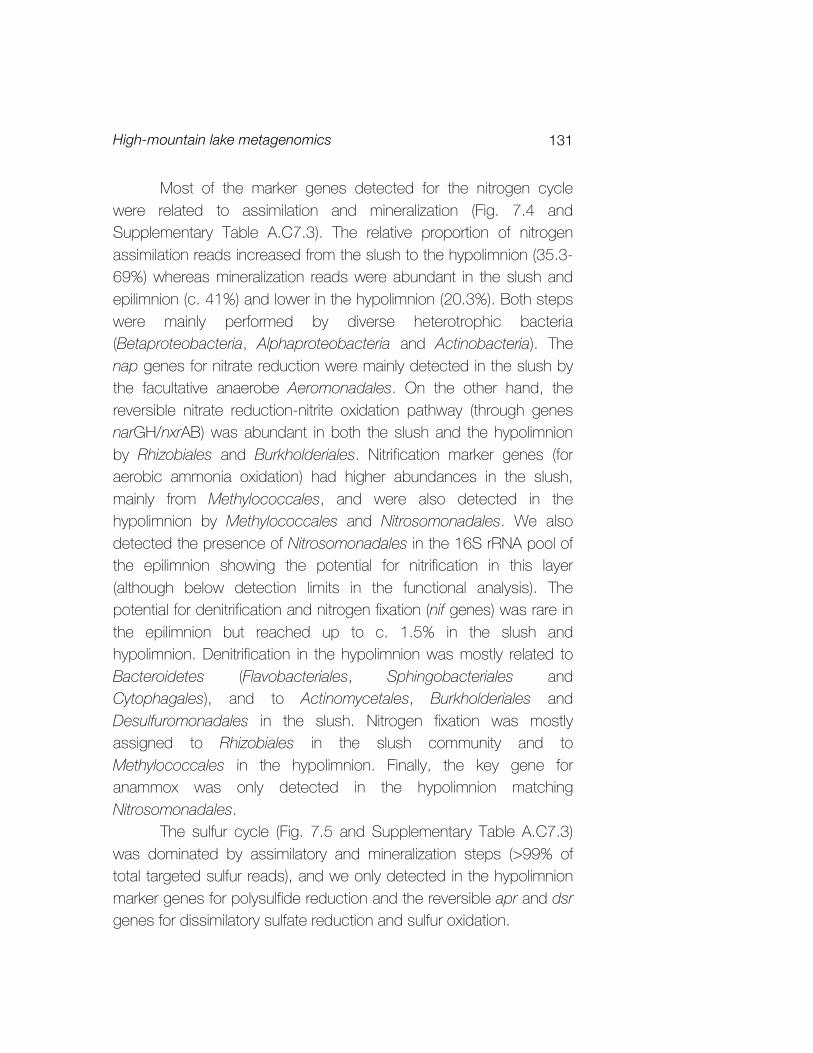
High-mountain lake metagenomics 131
Most of the marker genes detected for the nitrogen cycle were related to assimilation and mineralization (Fig. 7.4 and Supplementary Table A.C7.3). The relative proportion of nitrogen assimilation reads increased from the slush to the hypolimnion (35.3-69%) whereas mineralization reads were abundant in the slush and epilimnion (c. 41%) and lower in the hypolimnion (20.3%). Both steps were mainly performed by diverse heterotrophic bacteria (Betaproteobacteria, Alphaproteobacteria and Actinobacteria). The nap genes for nitrate reduction were mainly detected in the slush by the facultative anaerobe Aeromonadales. On the other hand, the reversible nitrate reduction-nitrite oxidation pathway (through genes narGH/nxrAB) was abundant in both the slush and the hypolimnion by Rhizobiales and Burkholderiales. Nitrification marker genes (for aerobic ammonia oxidation) had higher abundances in the slush, mainly from Methylococcales, and were also detected in the hypolimnion by Methylococcales and Nitrosomonadales. We also detected the presence of Nitrosomonadales in the 16S rRNA pool of the epilimnion showing the potential for nitrification in this layer (although below detection limits in the functional analysis). The potential for denitrification and nitrogen fixation (nif genes) was rare in the epilimnion but reached up to c. 1.5% in the slush and hypolimnion. Denitrification in the hypolimnion was mostly related to Bacteroidetes (Flavobacteriales, Sphingobacteriales and Cytophagales), and to Actinomycetales, Burkholderiales and Desulfuromonadales in the slush. Nitrogen fixation was mostly assigned to Rhizobiales in the slush community and to Methylococcales in the hypolimnion. Finally, the key gene for anammox was only detected in the hypolimnion matching Nitrosomonadales.
The sulfur cycle (Fig. 7.5 and Supplementary Table A.C7.3) was dominated by assimilatory and mineralization steps (>99% of total targeted sulfur reads), and we only detected in the hypolimnion marker genes for polysulfide reduction and the reversible apr and dsr genes for dissimilatory sulfate reduction and sulfur oxidation.

Chapter 7 132
The P cycle was studied separately and compared with the abundances previously found in meso-eutrophic lakes from the Banyoles area where phosphorus has a higher availability (Fig. 7.6 and Supplementary Table A.C7.3). Five of the steps related to the phosphorus cycle were found to be significantly different in lake Redon compared to the abundances found in Banyoles area (p-value < 0.05, t-test). In the case of phosphate regulation and phosphonoacetate hydrolase, the relative abundances were
Figure 7.6: Boxplot showing differences in the genetic potential for several steps of the phosphorus cycle in Lake Redon (three samples: slush, epilimnion and hypolimnion) and Lake Banyoles area (four samples: two lakes metalimnion and hypolimnion) using a combination of normalized marker genes. Significant differences are labeled with one asterisk (p-value < 0.05, t-test) or two asterisks (p-value < 0.01, t-test).
High-mountain lake metagenomics 133
significantly higher in Banyoles. In contrast, marker genes for the glycerol-3-phosphate (G3P) transporter, and phosphonate transport and metabolism were more abundant in Lake Redon. Phosphonate transport and metabolism in the slush were dominated by Rhizobiales (c. 50%) and Burkholderiales (c. 24%), and by Burkholderiales in the planktonic samples. The G3P transporter was mainly assigned to Rhodobacterales in the slush, and again to Burkholderiales but also Rhizobiales in the plankton.
Finally, the normalized abundance of the key gene for anoxygenic phototrophy (pufM) was also evaluated. Only one sequence of the slush metagenome was assigned to pufM, while pufM sequences from the epilimnion doubled those found in the hypolimnion and were mostly affiliated to Rhodobacterales (37% and 30% respectively) and Rhizobiales (14% and 21% respectively). Discussion Microbial eukaryotic community composit ion in Lake
Redon
Initial studies on phytoplankton ecology and productivity of Lake Redon were carried out more than 25 years ago (Catalan et al. 1992). The microbial eukaryotic communities analysed by traditional microscopic observations were usually dominated by chrysophytes and cryptophytes in the ice and snow cover (Felip et al. 1995, Felip et al. 1999b), and chrysophytes and chlorophytes in the water column, with Cryptophyta being mostly associated with deep water layers (Felip et al. 1999a). According to these previous studies, the microbial assemblages of the slush are highly dynamic depending on the phase of the ice cover (Felip et al. 1995, Felip et al. 1999b). Recently DNA sequencing methods applied to the planktonic eukaryotic communities of 11 Pyrenean lakes, including Lake Redon, showed a high genetic richness and a significant dominance of Chrysophyceae, Cryptophyta and Alveolata (Llorens-Mares et al. 2012, Triado-Margarit and Casamayor 2012, Barberan and
Chapter 7 134
Casamayor 2014). In the present work, we observed that a bloom of Chrysophyceae, potentially formed by different populations, dominated the microbial assemblage of the slush. Small autotrophic flagellated chrysophytes are usually found in the water column and slush samples of oligotrophic alpine lakes (Felip et al. 2002) and are considered to be adapted to extreme cold and nutrient limited environments (Kammerlander et al. 2015). The 18S rRNA gene dataset of the epilimnion was also dominated by Chrysophyceae but its relative abundance decreased in the hypolimnion, where Cryptomonas dominated the eukaryotic fraction. This tendency has also been detected previously by microscopic studies (Felip et al. 1999a), and the metagenomics data also agreed that cryptophytes were more abundant in the hypolimnion. Interestingly, the taxonomic affiliations within the Chrysophyceae showed that the slush was dominated by the uncultured group CCMP1899 and the genus Hydrurus, two clades that had been previously related to sea ice and snow (Harding et al. 2011, Majaneva et al. 2012, Garcia-Descalzo et al. 2013). In contrast, the plankton was dominated by various groups (LG07-07, Chromulinales, P34.48 and E222) different from those found in the slush and mostly reported from freshwater lakes (Richards et al. 2005, Triado-Margarit and Casamayor 2012), some of them potentially with a mixotrophic lifestyle (Felip et al. 1999a).
The fungi Chytridiomycota had been previously reported in high-elevation soils that depend on soil moisture from melting snowbanks (Freeman et al. 2009). These conditions are very similar to those found in the slush layer where we detected Chytridiomycota as the second most abundant eukaryotic phylum. In addition, Chytridiomycota have been recently reported in Pyrenean lakes and freshwater oligotrophic systems but are still poorly known (Monchy et al. 2011, Triado-Margarit and Casamayor 2012). Interestingly, in the epilimnion 10.5% of the 18S rRNA sequences were related to Fungi but mainly from the clades Basidiomicota and Ascomycota. These two fungal groups have been previously found in aquatic systems, also in high-altitude cold lakes (Libkind et al. 2009) and are efficient decomposers of organic matter.

High-mountain lake metagenomics 135
Finally, Bicosoecids, a typical planktonic group in freshwater lakes that was below detection limits in a previous study carried out by PCR amplification, cloning and sequencing of the 18S rRNA gene in the same area in July 2008 (Triado-Margarit and Casamayor 2012), was found at relatively high abundances in the epilimnion (8%). This discrepancy suggests either a marked temporal dynamics for this small flagellate or a priming bias in the previous PCR study. Other important eukaryotic groups detected here, were in agreement with previous studies in remote high-mountain lakes (Triado-Margarit and Casamayor 2012, Kammerlander et al. 2015) like the alveolates Ciliophora (mostly in the epilimnion) and Protalveolata (the second most abundant phylum in the hypolimnion), or Chlorophyta and Cercozoa more evenly distributed in the water column.
Prokaryotic community structure in Lake Redon
Substantial differences were observed between the slush sample analyzed in a previous study in Lake Redon, March and May 2009 (Llorens-Mares et al. 2012) where it was dominated by Bacteroidetes and Betaproteobacteria. In May 2010, Burkholderiales (Betaproteobacteria) was the most abundant order followed by Pseudomonadales (Gammaproteobacteria) and Bacteroidetes were not among the most abundant populations. Other studies that reported the bacterial composition in slush assemblages of alpine lakes (Alfreider et al. 1996) or a glacier ice metagenome (Simon et al. 2009), showed higher presence of Betaproteobacteria and Bacteroidetes and a minor contribution of Gammaproteobacteria. However, most of the gammaproteobacterial sequences detected in the slush, affiliated with Acinetobacter sp. that has been previously related with dust depositions in Pyrenean lakes (Hervas et al. 2009, Hervas and Casamayor 2009). Three dust depositions were recorded in the five weeks prior to the sampling of the slush (http://www.calima.ws), which may explain the high abundance of Acinetobacter-like sequences found in this sample.
The epilimnion sample showed the typical bacterial composition of an oligotrophic freshwater system (Newton et al.

Chapter 7 136
2011, Barberan and Casamayor 2014), with dominance of aerobic heterotrophs Betaproteobacteria (mainly Burkholderiales of the family Comamonadaceae and genus Limnohabitans), Actinobacteria (mainly Frankiales) and Bacteroidetes (mainly Flavobacteriales and Sphingobacteriales). Contrastingly, the hypolimnion harboured much more diversity than the epilimnion or the slush, and Actinobacteria was the most abundant phyla above Bacteroidetes and Betaproteobacteria. Different groups with contrasting metabolic strategies were detected in the hypolimnion, like Planktomycetes, which may perform anaerobic ammonium oxidation (Jetten et al. 2003) or Verrucomicrobia, which can efficiently respond to phosphorus availability in the hypolimnion (Lindstrom et al. 2004). Candidate division OD1 was also detected in the deep layer and it has been previously detected in boreal suboxic hypolimnion being directly related to anaerobic methane oxidation (Peura et al. 2012). In addition, the presence of other methylotrophic bacteria like Methylophilales (2.3%) and Methylococcales (2.4%) suggest that the methane cycle could be active in the sediment of Lake Redon, as previously reported in a small boreal polyhumic lake with a large anoxic hypolimnion (Taipale et al. 2011). However, there are not many studies unveiling the community composition and diversity of the hypolimnetic layers of freshwater systems. Here, we add support to the hypothesis that hypolimnia harbour more diversity than the epilimnion and that they contain poorly characterized bacteria that are more difficult to culture and study (Barberan and Casamayor 2011, Peura et al. 2012). Thus, it is important to explore these habitats in order to seek for novel microbial life and to feed databases with new metabolic potential (Barberan and Casamayor 2014).
The presence of diverse archaeal populations in freshwater habitats has been recently studied (Lliros et al. 2008, Auguet et al. 2010), and specially, the role of ammonia-oxidizing archaea (AOA) in the first step of nitrification, which may play a pivotal role in oligotrophic environments (Martens-Habbena et al. 2009, Auguet et al. 2011, Auguet et al. 2012). In turn, total abundances of archaea have always been minoritary (0-7%) among the prokaryotic

High-mountain lake metagenomics 137
community of high-mountain lakes (Pernthaler et al. 1998, Auguet et al. 2012). Strong seasonality for archaeal communities have been previously reported (Murray et al. 1998, Pernthaler et al. 1998), and highly related to the dynamics of ammonium and nitrite concentrations (Auguet et al. 2011). Here, we only found 0.1% of archaeal sequences and exclusively in the hypolimnion that matched the enigmatic and heterogeneous Deep Sea Hydrothermal Vent Euryarchaeotic Group 6 (DHVEG-6). The DHVEG-6 clade was initially reported from deep-sea hydrothermal vents and related to the methane metabolism with the ability to grow in relatively oxidative environments (Nunoura et al. 2012). Members of this large group have also been detected in saline shallow lakes (Casamayor et al. 2013) but the lack of cultured representatives makes it a largely unknown microbial group.
Functional potential of the microbial communit ies
inhabit ing Lake Redon
In general, metagenomic studies usually assign 20-30% of the total sequences to KEGG Orthologs (Simon et al. 2009, Llorens-Mares et al. 2015). However, we could only annotate through KO up to 15% of the reads from the epilimnion, 8% for the slush, and 8% for the hypolimnion. These numbers are certainly below expectations and clearly show lack of information in databases probably related to the difficulty of culturing bacteria from these habitats that usually need very specific conditions to grow in the laboratory. But most importantly, it highlights that major microbiological efforts should be focused on these habitats in order to unveil some of the metabolisms present, and to improve the current understanding of the biogeochemical cycling under low redox conditions.
Aerobic respiration was the most important step detected within the carbon cycle for Lake Redon, as expected for a freshwater lake dominated by heterotrophic and autotrophic microorganisms. Carbon fixation through the Calvin cycle was remarkable in the slush sample in agreement with the bloom of Chrysophyceae identified by

Chapter 7 138
18S rRNA gene taxonomy. However, the genes from the Calvin cycle where mainly annotated as taxonomically related to Rhodophyta and Haptophyceae. This incongruence is probably a consequence of the lack of available Chrysophyceae genomes in databases that lead to a misclassification after distantly matching the closest sequences available in databases. In turn, we observed a low presence of Calvin cycle genes in the epilimnion in agreement with previous studies that locate the deep chlorophyll maximum in Lake Redon at 25-35 meters depth (Catalan and Camarero 1991).
Another feature that could widen the strategies in order to obtain energy is the ability to use light as a complementary energy source through aerobic anoxygenic phototrophy (AAP) (Yurkov and Beatty 1998). The presence of AAP in marine habitats has been largely studied (Beja et al. 2002, Allgaier et al. 2003), but the relevance in freshwater habitats has been neglected until recently (Salka et al. 2011), and their role in oligotrophic habitats may be important as an alternative to reduce the requirements for organic substrates (Caliz and Casamayor 2014). In Lake Redon we detected the key gene for AAP (pufM) in the plankton and only one sequence was detected in the slush. Most of these sequences were related to either Rhodobacterales or Rhizobiales. However, this is probably a misidentification due to the lack of Limnohabitans genomes in databases, which were identified as the major contributors of pufM diversity in high-altitude lakes in the Pyrenees (Caliz and Casamayor 2014). Actually, 30% of the 16S rRNA sequences that were classified as Burkholderiales in the epilimnion were also assigned to Limnohabitans.
The current understanding of the global nitrogen cycle has been substantially extended over the last years, including new players and pathways mainly carried out by specialized microorganisms (Thamdrup 2012) that added new possibilities to nitrogen transformations in situ. Bulk measurements of the water chemistry in Lake Redon had indicated a nitrate increase near the bottom possibly from an active microbial nitrification using the ammonium released from the sediment (Catalan et al. 1992). Recent

High-mountain lake metagenomics 139
studies on high-mountain lakes have evaluated the importance of ammonia-oxidizing archaea (AOA) in the nitrogen cycle, suggesting a pivotal role of archaea in nitrification (Martens-Habbena et al. 2009), especially in oligotrophic systems where the abundances of ammonia-oxidizing bacteria (AOB) by PCR amplification showed contradictory results (Auguet et al. 2012, Vila-Costa et al. 2014). Here, we only detected a very low abundance of archaea in the hypolimnion and the nitrification genes detected were all related to AOB (Fig. 7.4, Nitrosomonadales and Methylococcales). Previous studies on the temporal dynamics of AOA, showed that changes in AOA abundances were both very dynamic and narrowly allocated in the water column (Auguet et al. 2011, Restrepo-Ortiz et al. 2014), thus it is possible that we could not capture the importance of AOA at the time and depths of sampling. The lack of nitrification genes by both archaea and bacteria in the epilimnion may be related to both the photoinhibition at high light intensities (Guerrero and Jones 1996, Merbt et al. 2012, Small et al. 2013) and the lack of substrate. Interestingly, the potential for the second step of nitrification, nitrite oxidation, was detected in the three samples collected, but the lowest abundance was again found in the epilimnion. Genes for the additional process by which ammonia can be oxidized (anaerobic ammonia oxidation, anammox), were only detected at very low abundances in the hypolimnion by Nitrosomonadales, suggesting a minor contribution of the anammox process. Previous studies suggested that the ammonium produced in the sediment by microbial decomposition of the organic matter from early summer phytoplankton blooms was behind the active nitrification detected in summer-autumn (Catalan 1992, Catalan et al. 1992). Because we could just capture a small nitrifying community in the hypolimnion, most of this process is probably ocurring in the surface sediment. Another study (Auguet et al. 2011) also suggested that the dark slush layers in winter-spring could be hotspots for nitrification when algae did not develop yet and atmospheric depositions (i.e., rain or snow) were rich in ammonium. We could not detect archaeal sequences for AOA in the 16S rRNA gene pool from the slush sample (probably
Chapter 7 140
both because of the radiation effect mostly on AOA (Merbt et al. 2012) and the competition with algae for reactive nitrogen), but we could detect the presence of genes for nitrification by Methylococcales, which indicates the potential for AOB nitrification in the ammonium rich slush layer.
For the sulfur cycle we did not expect to find the potential for dissimilatory sulfur utilization as the lake is mainly oxygenated during the whole year. However the presence of sulfate as a dominant anion in the lake (Camarero et al. 1999) possibly allows the presence of phyla with the potential to utilize as energy source the small amounts of sulfide probably produced in the sediment, and fuelled the presence of populations with the potential to use polysulfides and carry out sulfur oxidation.
Finally, most oligotrophic lakes are characterized by P limitation (Catalan et al. 2006, Camarero and Catalan 2012), which is a key element for bacterial growth. Thus, the microbial community living in P-limited environments must be adapted to these conditions. Most studies on the P cycle focused their attention in marine environments (Bjorkman and Karl 2003, Longnecker et al. 2010) and showed a bacterial prevalence to the utilization of inorganic phosphorus in front of dissolved organic phosphorus (DOP). However, recent studies showed the capability to incorporate and process DOP in the form of phosphonates by bacteria (Quinn et al. 2007, Martinez et al. 2010, Luo et al. 2011). Here, we compared the key genes for P cycling with a non-oligotrophic environment (two lakes in Banyoles karstic area; Llorens-Mares et al. 2015), and detected that genes for phosphonate transport, metabolism and G3P transporter were significantly more abundant in Lake Redon than Banyoles area. This is adding evidence that the microbial community of the oligotrophic Lake Redon have adapted to P-limitation by the ability to uptake and utilize phosphorus in organic forms that come from the decomposition of senescent phytoplankton blooms occurring in the lake. A previous metatranscriptomic study in a phosphorus limited mountain lake (Vila-Costa et al. 2013), showed a higher expression of phosphonate transport, metabolism and G3P
High-mountain lake metagenomics 141
transporter during the night and it has also been suggested that the ability to metabolize phosphonates as a sole P source may explain the success of Trichodesmium in low-phosphate environments (Dyhrman et al. 2006, Dyhrman et al. 2007), which may explain the overrepresentation of such genes in Lake Redon.
Overall, we provided by microbial metagenomics a large repertory of marker genes, showing the biogeochemical potential of an ultraoligotrophic stratified lake. These results may help to better understand the biogeochemical drivers in these ecosystems and help to address further studies on the biology and chemistry of these lakes, which are considered very sensitive sentinels for environmental changes. The lack of cultured counterparts in the databases emerged as a major pitfall for a complete metagenomic analysis, highlighting the need of complementary microbiological and biochemical approaches to fully unveil the links between microbes and biogeochemical cycling in oligotrophic environments. Acknowledgements J Caliz, M Sala and X Triadó-Margarit are acknowledged for field and lab assistance and ancillary data. This research was funded by Grants GOS-LAKES CGL2009-08523-E and DARKNESS CGL2012-32747 to EOC from the Spanish Office of Science (MINECO) and from financial support by the Beyster Family Fund of the San Diego Foundation and the Life Technology Foundation to the J Craig Venter Institute.


General overview


8 General discussion
The main goal of this Thesis was to explore the links between biogeochemistry and microbial diversity using both the functional potential unveiled by metagenomics and the main nutrients cycling framework for a mechanistic approach to disentangle the complex whole-system ecology in stratified lakes. Two contrasted lacustrine habitats were explored, the euxinic waters of the Banyoles karstic system (BKS) and the oligotrophic oxygenated waters of Lake Redon (Pyrenees). 8.1 A comparative overview of the main bacterial players in the stratified aquatic ecosystems explored The environmental context of the systems studied showed highly contrasting biogeochemical situations, both among lakes and within lakes (Table 8.1). Overall, Lake Cisó and Lake Banyoles basin C-III showed much lower oxygen concentration and higher organic carbon load than samples from Lake Redon. High accumulation of ammonia was detected in BKS, whereas only the surface slush in Lake Redon showed high ammonia values. Hypolimnetic layers of BKS always harboured higher concentrations of sulfides than the
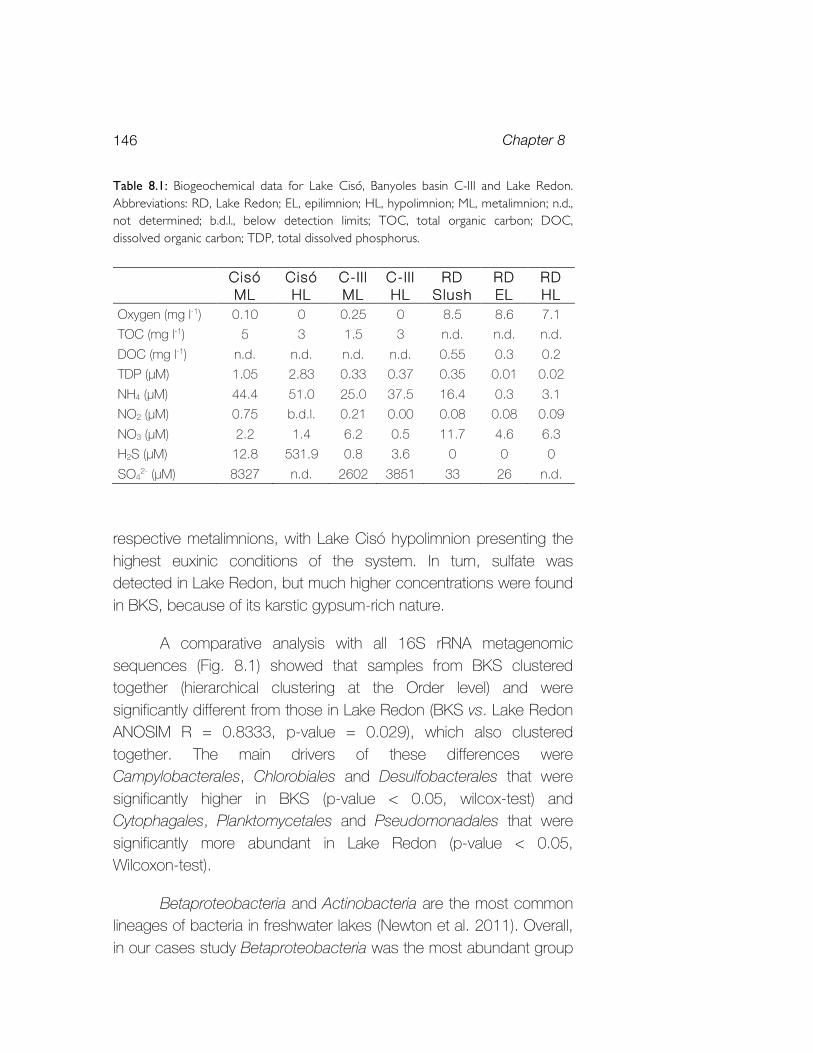
Chapter 8 146
Table 8.1: Biogeochemical data for Lake Cisó, Banyoles basin C-III and Lake Redon. Abbreviations: RD, Lake Redon; EL, epilimnion; HL, hypolimnion; ML, metalimnion; n.d., not determined; b.d.l., below detection limits; TOC, total organic carbon; DOC, dissolved organic carbon; TDP, total dissolved phosphorus.
Cisó
ML Cisó HL
C-I I I ML
C-I I I HL
RD Slush
RD EL
RD HL
Oxygen (mg l-1) 0.10 0 0.25 0 8.5 8.6 7.1 TOC (mg l-1) 5 3 1.5 3 n.d. n.d. n.d. DOC (mg l-1) n.d. n.d. n.d. n.d. 0.55 0.3 0.2 TDP (μM) 1.05 2.83 0.33 0.37 0.35 0.01 0.02 NH4 (μM) 44.4 51.0 25.0 37.5 16.4 0.3 3.1 NO2 (μM) 0.75 b.d.l. 0.21 0.00 0.08 0.08 0.09 NO3 (μM) 2.2 1.4 6.2 0.5 11.7 4.6 6.3 H2S (μM) 12.8 531.9 0.8 3.6 0 0 0 SO4
2- (μM) 8327 n.d. 2602 3851 33 26 n.d. respective metalimnions, with Lake Cisó hypolimnion presenting the highest euxinic conditions of the system. In turn, sulfate was detected in Lake Redon, but much higher concentrations were found in BKS, because of its karstic gypsum-rich nature.
A comparative analysis with all 16S rRNA metagenomic sequences (Fig. 8.1) showed that samples from BKS clustered together (hierarchical clustering at the Order level) and were significantly different from those in Lake Redon (BKS vs. Lake Redon ANOSIM R = 0.8333, p-value = 0.029), which also clustered together. The main drivers of these differences were Campylobacterales, Chlorobiales and Desulfobacterales that were significantly higher in BKS (p-value < 0.05, wilcox-test) and Cytophagales, Planktomycetales and Pseudomonadales that were significantly more abundant in Lake Redon (p-value < 0.05, Wilcoxon-test).
Betaproteobacteria and Actinobacteria are the most common lineages of bacteria in freshwater lakes (Newton et al. 2011). Overall, in our cases study Betaproteobacteria was the most abundant group

General discussion
147
(23 ± 19%) followed by Actinobacteria (16 ± 13%). However, their dominance varied depending on the layer, with Betaproteobacteria being always higher in the presence of high oxygen (epilimnion and slush), whilst Actinobacteria dominated under lower oxygen concentrations like those found in BKS metalimnia or the hypolimnion of Lake Redon. Bacteroidetes is a very diverse chemoorganotrophic group with the potential to degrade complex biopolymers, which explains their important presence in both the eutrophic Lake Cisó and the oligotrophic Lake Redon where they can use either phytoplankton exudates during algal growth (Zeder et al. 2009) or complex dissolved organic matter (DOM) from senescent phytoplankton (Pinhassi et al. 2004, Teira et al. 2008). Chlorobi and Epsilonproteobacteria are not typical phyla found in oxygenated freshwater lakes and they were not found in Lake Redon. However, their abundances in BKS were very important, with GSB blooming in basin C-III of Lake Banyoles and Epsilonproteobacteria being consistently present in high abundances (>10%). Their importance is related to the oxidation of the abundant sulfide either through chemolithoautotrophy (Epsilonproteobacteria) or photolithoautotrophy (Chlorobiales).
Figure 8.1: Prokaryotic community structure (relative abundances) of Banyoles Karstic Area (Lake Cisó and Lake Banyoles basin CIII) and Lake Redon obtained from the 16S rRNA gene present in the metagenomic pool. Hierarchical clustering based on Bray-Curtis dissimilarity matrices at the Order level. EL: Epilimnion; ML: Metalimnion; HL: Hypolimnion.

Chapter 8 148
In general, we observed that diversity was always higher in the hypolimnia than in the upper water masses. The relative abundances of Candidate Division OD1 in BKS (8 ± 4% all samples) and Lake Redon hypolimnia (4%), suggests an important role of this uncultured heterogeneous group in the biogeochemical cycling of stratified aquatic ecosystems. OD1 had been previously found in anoxic environments and may have the potential to be an obligate fermenter producing acetate, formate, lactate and ethanol as end products (Wrighton et al. 2012, Wrighton et al. 2014). Conversely, archaeal sequences were not abundant and mainly found in hypolimnetic waters, both in BKS (~3%; mostly methanogens) and Lake Redon (0.01%; Candidate division DHVEG-6). Previous studies analyzed and highlighted the role of archaea in oligotrophic environments, mainly ammonia-oxidizing archaea (AOA) (Auguet et al. 2011, Auguet et al. 2012, Restrepo-Ortiz et al. 2014), but also uncultured freshwater Euryarchaeota (Restrepo-Ortiz and Casamayor 2013). These studies also showed a strong seasonality of these AOA populations, which peaked in summer and were significantly related to the dynamics of ammonium and changes in the amount of atmospheric precipitation, which is the main source of nitrogen in remote mountain catchments (Catalan et al. 1994). Thus, we may have not captured the importance of archaea at the time of sampling (autumn) but they might be important depending on the biogeochemical dynamics of the lake. 8.2 Comparative analysis of the functional potential of the two contrasting ecosystems explored The application of normalization procedures (Sharon et al. 2009b), permitted a comparison of the functional potential harboured in the different samples circumventing the different methodologies applied (Fig. 8.2). In contrast to taxonomic clustering (Fig. 8.1), functional clustering grouped together all planktonic samples, telling apart the slush as the most idiosyncratic sample as a consequence of an algal
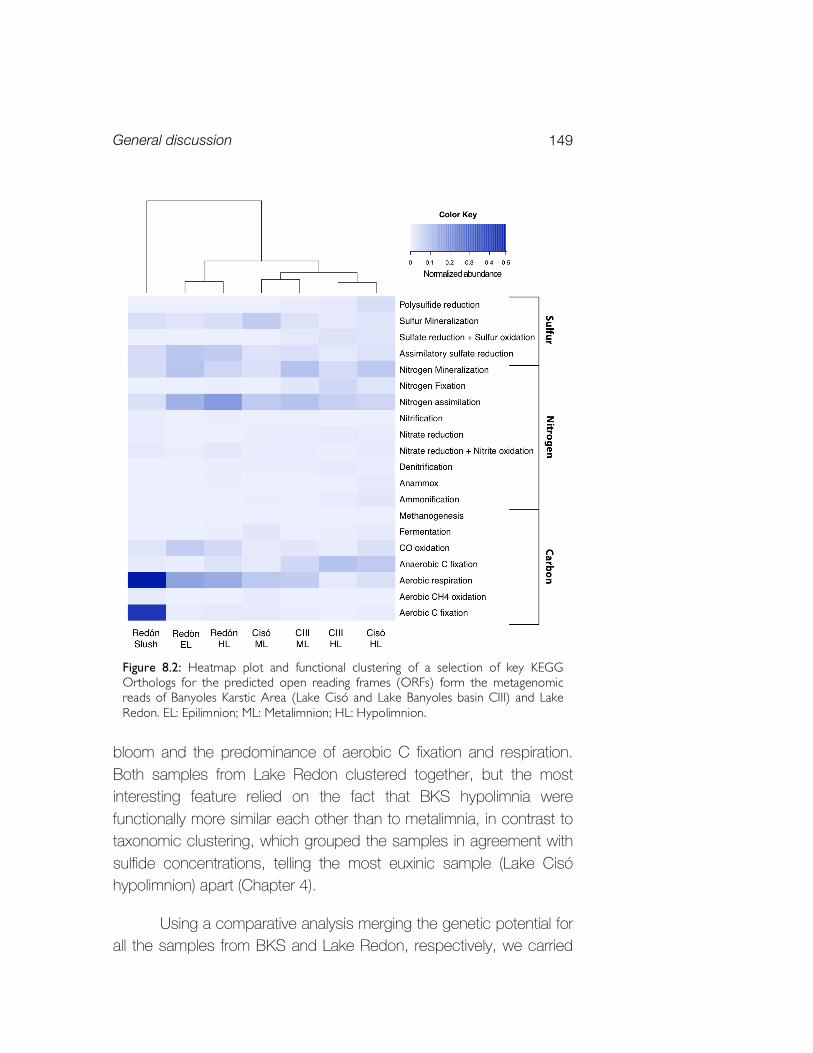
General discussion
149
bloom and the predominance of aerobic C fixation and respiration. Both samples from Lake Redon clustered together, but the most interesting feature relied on the fact that BKS hypolimnia were functionally more similar each other than to metalimnia, in contrast to taxonomic clustering, which grouped the samples in agreement with sulfide concentrations, telling the most euxinic sample (Lake Cisó hypolimnion) apart (Chapter 4).
Using a comparative analysis merging the genetic potential for all the samples from BKS and Lake Redon, respectively, we carried
Figure 8.2: Heatmap plot and functional clustering of a selection of key KEGG Orthologs for the predicted open reading frames (ORFs) form the metagenomic reads of Banyoles Karstic Area (Lake Cisó and Lake Banyoles basin CIII) and Lake Redon. EL: Epilimnion; ML: Metalimnion; HL: Hypolimnion.

Chapter 8 150
out an exercise to unveil which were the most important functions that described the characteristic biogeochemical cycling present in each system (Fig. 8.3).
Figure 8.3: Heatmap plot and functional clustering of a selection of key KEGG Orthologs for the predicted open reading frames (ORFs) form the metagenomic reads of Banyoles karstic system (BKS: Lake Cisó and Lake Banyoles basin CIII) and Lake Redon. EL: Epilimnion; ML: Metalimnion; HL: Hypolimnion. Significant differences are labeled with one asterisk (p-value < 0.05, t-test) or two asterisks (p-value < 0.01, t-test).

General discussion
151
For the carbon cycle, aerobic respiration was significantly higher in Lake Redon (p-value < 0.05, t-test), something that was expected for its mainly aerobic characteristics. The potential for aerobic C fixation through the Calvin cycle was also higher in Lake Redon as a consequence of the algal bloom in the slush sample. In contrast, anaerobic C fixation (both through phototrophic processes and chemotrophic processes) was, as expected, more abundant in BKS related to its sulfurous nature.
The nitrogen cycle only showed one significant difference (p-value < 0.05, t-test), the highest abundance of ammonification (Dissimilatory Nitrate Reduction to Ammonia; DNRA) in BKS. The first electron acceptor after oxygen is usually nitrate, thus the presence of DNRA potential in BKS where anoxia predominated, was expected. BKS usually show accumulation of ammonia in the hypolimnion, related to the lack of oxygen and presence of potentially toxic sulfide to ammonia oxidizers. In contrast, Lake Redon shows a higher potential for nitrification, mostly in the slush and hypolimnion. Finally, the potential for nitrogen assimilation was also higher in Lake Redon. Assimilatory pathways are those that lead to incorporation of a nutrient into organic (cellular) components. Possibly the ultraoligotrophic characteristics of Lake Redon force microbial populations to efficiently incorporate any nitrogen compound present in the environment and thus be overrepresented in the microbial metagenome.
For the sulfur cycle, assimilatory pathways were again significantly higher in Lake Redon than in BKS (p-value < 0.01, t-test). The vast availability of sulfur compounds in BKS probably makes it less important to incorporate essential sulfur into organic compounds, which turns into a vital necessity in Lake Redon. The potential for DNRA was detected in BKS but the sulfate-rich waters, makes it an appropriate environment for the development of sulfate-reducing bacteria and sulfide oxidizers. Consequently, in BKS the

Chapter 8 152
genetic potential is higher for sulfate reduction and sulfur oxidation than for DNRA.
Finally, for the phosphorus cycle, G3P transporter, phosphonate metabolism and phosphonate transport were found to be significantly higher in Lake Redon (p-value < 0.05, t-test). The ultraoligotrophic nature of the lake and the phosphate limitation explain the higher proportion of pathways that led to efficiently incorporate and metabolize organic phosphorus (Chapter 7). 8.3 Potential and limitations of microbial metagenomics
We used two different metagenomic technologies in this PhD
thesis: 454 pyrosequencing, producing a lower number (~300,000 reads / run) but longer reads (~400 bp) and Illumina, producing a larger number (~10 million reads / run) but shorter reads (~250 bp). Both protocols have been proved to be a good alternative to PCR-based 16S-tag sequencing for evaluate microbial structure and diversity (Logares et al. 2014). Bioinformatics filtering of the 16S sequences directly from the metagenomic reads avoids the use of PCR amplification and primer bias, which may result in changes of the in situ relative proportions. In general, a good agreement between methods is expected, but the use of 16S-tag sequencing and metagenomics in the same sample (Chapter 3 and 4), detected underestimation of Epsilonproteobacteria as a consequence of a mismatch in the reverse primer, thus confirming the advantages of using metagenomics to simultaneously explore both microbial biodiversity and functionality in a given ecosystem. However, the cost of metagenomics is still too high to be routinely used on a day-to-day basis for the simultaneous analysis of several tens of samples, and PCR-tag sequencing is a valid approach still for large comparisons of microbial communities at a reasonable cost.
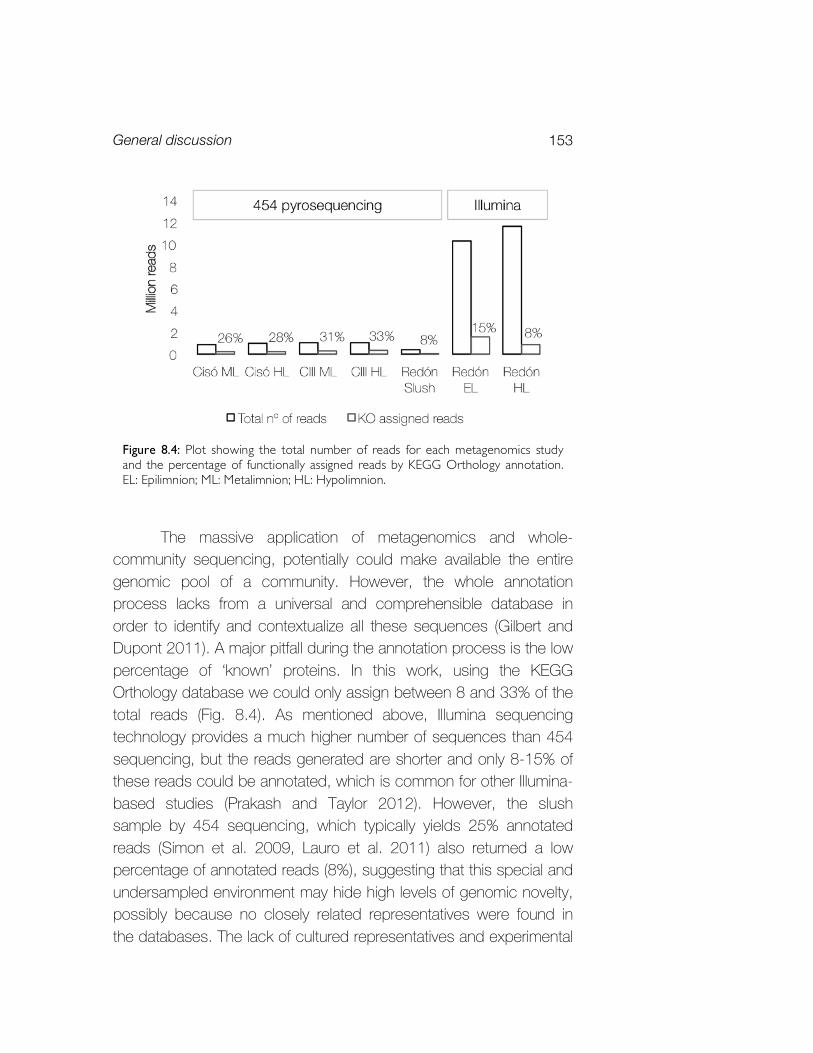
General discussion
153
The massive application of metagenomics and whole-
community sequencing, potentially could make available the entire genomic pool of a community. However, the whole annotation process lacks from a universal and comprehensible database in order to identify and contextualize all these sequences (Gilbert and Dupont 2011). A major pitfall during the annotation process is the low percentage of ‘known’ proteins. In this work, using the KEGG Orthology database we could only assign between 8 and 33% of the total reads (Fig. 8.4). As mentioned above, Illumina sequencing technology provides a much higher number of sequences than 454 sequencing, but the reads generated are shorter and only 8-15% of these reads could be annotated, which is common for other Illumina-based studies (Prakash and Taylor 2012). However, the slush sample by 454 sequencing, which typically yields 25% annotated reads (Simon et al. 2009, Lauro et al. 2011) also returned a low percentage of annotated reads (8%), suggesting that this special and undersampled environment may hide high levels of genomic novelty, possibly because no closely related representatives were found in the databases. The lack of cultured representatives and experimental
Figure 8.4: Plot showing the total number of reads for each metagenomics study and the percentage of functionally assigned reads by KEGG Orthology annotation. EL: Epilimnion; ML: Metalimnion; HL: Hypolimnion.

Chapter 8 154
studies to confirm predicted functions are the main reason for this large pool of unknown proteins that we were not able to annotate and unveil their functions. The use of either experimental approaches (Reisch et al. 2008) or bioinformatic techniques (Abe et al. 2009, Jaroszewski et al. 2009) is currently of major interest to explore this unknown fraction of the metagenomic protein universe and to expand the potential and accuracy of metagenomics analyses.
Metagenomics can also be useful to obtain genomic information from uncultured organisms, especially in environmental samples of limited complexity. In this PhD thesis we used a natural blooming population of the uncultured green sulfur bacteria (GSB), Chlorobium luteolum CIII, to reconstruct its genome in silico (Chapter 5). The high similarity of Chl. luteolum CIII with a cultured counterpart, Chl. luteolum DSM273T helped to carry out this reconstruction and added more insights on the debate of the prokaryote species definition (Doolittle and Zhaxybayeva 2009, Richter and Rossello-Mora 2009). The identification of key genomic differences through HGT events explained the ecological success of Chl. luteolum CIII. Altogether, we probably captured the first events in the ecological differentiation of a new species, with consistent genomic differences but still with high 16S rRNA gene identity (Shapiro et al. 2012). The genome reconstruction and the clues unveiled using bioinformatic analysis added evidences for a first putative GSB phage and for the key factors involved in speciation processes in prokaryotes and the importance of HGT in ecological success.
Overall, our analyses provided a new view on the well-known biogeochemical functioning of karstic and alpine lakes. In spite of the limitations of metagenomics and annotation, we used the previous knowledge on the ecology of the lakes to prove that metagenomics is a very accurate way to unveil the links between functional potential and microbial biodiversity of a given ecosystem. We also could identify some populations as potential key stone species of biogeochemical processes and this knowledge can be further used

General discussion
155
to establish new hypothesis to be tested both through experimental approaches and matter and energy fluxes quantification. Finally, this PhD thesis also added some ideas in order to understand the functioning of ancient anoxic oceans, using euxinic lakes as modern analogs with different carbon inputs as proxies of different oceanic situations.

9 Conclusions
• The hypolimnia of Lakes Cisó, Vilar and Banyoles showed
higher bacterial novelty than metalimnia with Elusimicrobia and Chloroflexi harbouring the highest number of novel 16S rRNA gene sequences.
• The potential for dark carbon fixation in these lakes was tentatively assigned to Hydrogenophilales (Thiobacillus-like) and Gallionellales (Syderoxidans-like) via the Calvin cycle, Bacteroidales, Campylobacterales and Desulfarculales through the Arnon cycle, and Desulfobacterales via the reductive acetil-CoA cycle.
• If the findings from sulfurous lakes are equivalent to ancient
oceans (as in the case of green sulfur bacteria), then Gallionellales may have played an important role in the biogeochemistry of the iron cycle, a low contribution of nitrification and archaea was probably accounting for the nitrogen cycle, Campylobacterales may have acted as the main players of denitrification, and Bacteroidales may have been main players for dissimilatory nitrate reduction to ammonium mainly in organic carbon-rich zones.
Chapter 9 158
• The acquisition of laterally transferred genes offering new
functional alternatives, was key in order to explain the ecological success of the recurrent green sulfur bacteria bloom in Lake Banyoles basin CIII. The drivers for such horizontal gene transfer were potentially phages.
• In the slush of Lake Redon, the community composition shift
from winter to spring was characterized by a decrease in bacterial diversity, dominance of Bacteroidetes and consistent increases in bacterial abundance and production.
• The potential for nitrification in Lake Redon was mainly found
in the slush and hypolimnion by ammonia-oxidizing bacteria. Lower abundances of nitrification genes were found in the epilimnion.
• Planktonic microbial communities of Lake Redon showed a
higher genomic potential for assimilatory pathways (nitrite, phosphate and sulfate) than those from the Banyoles area.


Bibliography

Bibliography 163
Bibliography
Abe, T., S. Kanaya, H. Uehara, and T. Ikemura. 2009. A novel bioinformatics strategy for function prediction of poorly-characterized protein genes obtained from metagenome analyses. DNA Res 16:287-297.
Adams, W. P., and C. Allan. 1987. Aspects of the chemistry of ice, notably snow, on lakes. Pages 393–466 in H. G. Jones and W. J. Orville-Thomas, editors. Seasonal snowcovers: physics, chemistry, hydrology. Reidel Publishing Company, Dordrecht, The Netherlands.
Albertsen, M., P. Hugenholtz, A. Skarshewski, K. L. Nielsen, G. W. Tyson, and P. H. Nielsen. 2013. Genome sequences of rare, uncultured bacteria obtained by differential coverage binning of multiple metagenomes. Nature Biotechnology 31:533-+.
Alfreider, A., J. Pernthaler, R. Amann, B. Sattler, F. O. Glockner, A. Wille, and R. Psenner. 1996. Community analysis of the bacterial assemblages in the winter cover and pelagic layers of a high mountain lake by in situ hybridization. Appl Environ Microbiol 62:2138-2144.
Allgaier, M., H. Uphoff, A. Felske, and I. Wagner-Dobler. 2003. Aerobic anoxygenic photosynthesis in Roseobacter clade bacteria from diverse marine habitats. Appl Environ Microbiol 69:5051-5059.
Aminov, R. I. 2010. A brief history of the antibiotic era: lessons learned and challenges for the future. Front Microbiol 1.
Aminov, R. I. 2011. Horizontal gene exchange in environmental microbiota. Front Microbiol 2.
Anbar, A. D. 2008. Oceans Elements and Evolution. Science 322:1481-1483.
Andrews, S. C., A. K. Robinson, and F. Rodriguez-Quinones. 2003. Bacterial iron homeostasis. FEMS Microbiol Rev 27:215-237.
Anesio, A. M., A. J. Hodson, A. Fritz, R. Psenner, and B. Sattler. 2009. High microbial activity on glaciers: importance to the global carbon cycle. Global Change Biology 15:955-960.
Auguet, J. C., A. Barberan, and E. O. Casamayor. 2010. Global ecological patterns in uncultured Archaea. Isme Journal 4:182-190.
Auguet, J. C., N. Nomokonova, L. Camarero, and E. O. Casamayor. 2011. Seasonal Changes of Freshwater Ammonia-Oxidizing Archaeal Assemblages and Nitrogen Species in Oligotrophic Alpine Lakes. Appl Environ Microbiol 77:1937-1945.

Bibliography 164
Auguet, J. C., X. Triado-Margarit, N. Nomokonova, L. Camarero, and E. O. Casamayor. 2012. Vertical segregation and phylogenetic characterization of ammonia-oxidizing Archaea in a deep oligotrophic lake. Isme Journal 6:1786-1797.
Azai, C., J. Harada, and H. Oh-oka. 2013. Gene Expression System in Green Sulfur Bacteria by Conjugative Plasmid Transfer. PLoS ONE 8.
Aziz, R. K., D. Bartels, A. A. Best, M. DeJongh, T. Disz, R. A. Edwards, K. Formsma, S. Gerdes, E. M. Glass, M. Kubal, F. Meyer, G. J. Olsen, R. Olson, A. L. Osterman, R. A. Overbeek, L. K. McNeil, D. Paarmann, T. Paczian, B. Parrello, G. D. Pusch, C. Reich, R. Stevens, O. Vassieva, V. Vonstein, A. Wilke, and O. Zagnitko. 2008. The RAST Server: rapid annotations using subsystems technology. BMC Genomics 9:75.
Bañeras, L., M. Ros-Ponsati, X. P. Cristina, J. L. Garcia-Gil, and C. M. Borrego. 2010. Phosphorus deficiency and kinetics of alkaline phosphatase in isolates and natural populations of phototrophic sulphur bacteria. FEMS Microbiol Ecol 73:243-253.
Barberan, A., and E. O. Casamayor. 2010. Global phylogenetic community structure and beta-diversity patterns in surface bacterioplankton metacommunities. Aquatic Microbial Ecology 59:1-10.
Barberan, A., and E. O. Casamayor. 2011. Euxinic Freshwater Hypolimnia Promote Bacterial Endemicity in Continental Areas. Microb Ecol 61:465-472.
Barberan, A., and E. O. Casamayor. 2014. A phylogenetic perspective on species diversity, beta-diversity and biogeography for the microbial world. Mol Ecol 23:5868-5876.
Bascompte, J., and R. V. Sole. 1995. Rethinking Complexity - Modeling Spatiotemporal Dynamics in Ecology. Trends in Ecology & Evolution 10:361-366.
Beja, O., M. T. Suzuki, J. F. Heidelberg, W. C. Nelson, C. M. Preston, T. Hamada, J. A. Eisen, C. M. Fraser, and E. F. DeLong. 2002. Unsuspected diversity among marine aerobic anoxygenic phototrophs. Nature 415:630-633.
Bettarel, Y., T. Sime-Ngando, C. Amblard, and J. Dolan. 2004. Viral activity in two contrasting lake ecosystems. Appl Environ Microbiol 70:2941-2951.
Bhaya, D., A. R. Grossman, A. S. Steunou, N. Khuri, F. M. Cohan, N. Hamamura, M. C. Melendrez, M. M. Bateson, D. M. Ward, and J. F. Heidelberg. 2007. Population level functional diversity in a microbial community revealed by comparative genomic and metagenomic analyses. Isme Journal 1:703-713.
Billington, S. J., A. S. Huggins, P. A. Johanesen, P. K. Crellin, J. K. Cheung, M. E. Katz, C. L. Wright, V. Haring, and J. I. Rood. 1999. Complete nucleotide

Bibliography 165
sequence of the 27-kilobase virulence related locus (vrl) of Dichelobacter nodosus: Evidence for extrachromosomal origin. Infection and Immunity 67:1277-1286.
Bjorkman, K. M., and D. M. Karl. 2003. Bioavailability of dissolved organic phosphorus in the euphotic zone at station ALOHA, North Pacific Subtropical Gyre. Limnology and Oceanography 48:1049-1057.
Borrego, C. M., L. Baneras, and J. Garcia-Gil. 1999. Temporal variability of Chlorobium phaeobacteroides antenna pigments in a meromictic karstic lake. Aquatic Microbial Ecology 17:121-129.
Bowman, J. P., S. A. McCammon, M. V. Brown, D. S. Nichols, and T. A. McMeekin. 1997. Diversity and association of psychrophilic bacteria in Antarctic sea ice. Appl Environ Microbiol 63:3068-3078.
Boyd, P. W., A. J. Watson, C. S. Law, E. R. Abraham, T. Trull, R. Murdoch, D. C. E. Bakker, A. R. Bowie, K. O. Buesseler, H. Chang, M. Charette, P. Croot, K. Downing, R. Frew, M. Gall, M. Hadfield, J. Hall, M. Harvey, G. Jameson, J. LaRoche, M. Liddicoat, R. Ling, M. T. Maldonado, R. M. McKay, S. Nodder, S. Pickmere, R. Pridmore, S. Rintoul, K. Safi, P. Sutton, R. Strzepek, K. Tanneberger, S. Turner, A. Waite, and J. Zeldis. 2000. A mesoscale phytoplankton bloom in the polar Southern Ocean stimulated by iron fertilization. Nature 407:695-702.
Brinkmeyer, R., K. Knittel, J. Jurgens, H. Weyland, R. Amann, and E. Helmke. 2003. Diversity and structure of bacterial communities in arctic versus antarctic pack ice. Appl Environ Microbiol 69:6610-6619.
Brock, T. D. 1966. Principles of Microbial Ecology. Prentice-Hall, Englewood Cliffs, New Jersey, USA.
Brocks, J. J., G. D. Love, R. E. Summons, A. H. Knoll, G. A. Logan, and S. A. Bowden. 2005. Biomarker evidence for green and purple sulphur bacteria in a stratified Palaeoproterozoic sea. Nature 437:866-870.
Brown, C. T., L. A. Hug, B. C. Thomas, I. Sharon, C. J. Castelle, A. Singh, M. J. Wilkins, K. C. Wrighton, K. H. Williams, and J. F. Banfield. 2015. Unusual biology across a group comprising more than 15% of domain Bacteria. Nature advance onl ine publ icat ion.
Bryant, D., Z. Liu, T. Li, F. Zhao, A. G. Costas, C. Klatt, D. Ward, N.-U. Frigaard, and J. Overmann. 2012. Comparative and Functional Genomics of Anoxygenic Green Bacteria from the Taxa Chlorobi, Chloroflexi, and Acidobacteria. Pages 47-102 in R. Burnap and W. Vermaas, editors. Functional Genomics and Evolution of Photosynthetic Systems. Springer Netherlands.
Bibliography 166
Burgin, A. J., and S. K. Hamilton. 2007. Have we overemphasized the role of denitrification in aquatic ecosystems? A review of nitrate removal pathways. Frontiers in Ecology and the Environment 5:89-96.
Caliz, J., and E. O. Casamayor. 2014. Environmental controls and composition of anoxygenic photoheterotrophs in ultraoligotrophic high-altitude lakes (Central Pyrenees). Environ Microbiol Rep 6:145-151.
Camacho, A., and E. Vicente. 1998. Carbon photoassimilation by sharply stratified phototrophic communities at the chemocline of Lake Arcas (Spain). FEMS Microbiol Ecol 25:11-22.
Camarero, L., and J. Catalan. 1993. Chemistry of Bulk Precipitation in the Central and Eastern Pyrenees, Northeast Spain. Atmospheric Environment Part a-General Topics 27:83-94.
Camarero, L., and J. Catalan. 2012. Atmospheric phosphorus deposition may cause lakes to revert from phosphorus limitation back to nitrogen limitation. Nat Commun 3:1118.
Camarero, L., M. Felip, M. Ventura, F. Bartumeus, and J. Catalan. 1999. The relative importance of the planktonic food web in the carbon cycle of an oligotrophic mountain lake in a poorly vegetated catchment (Redó, Pyrenees). Journal of Limnology 58:203-212.
Campbell, B. J., and S. C. Cary. 2004. Abundance of reverse tricarboxylic acid cycle genes in free-living microorganisms at deep-sea hydrothermal vents. Appl Environ Microbiol 70:6282-6289.
Canfield, D. E., A. N. Glazer, and P. G. Falkowski. 2010. The evolution and future of Earth's nitrogen cycle. Science 330:192-196.
Carini, P., A. E. White, E. O. Campbell, and S. J. Giovannoni. 2014. Methane production by phosphate-starved SAR11 chemoheterotrophic marine bacteria. Nat Commun 5:4346.
Carver, T., S. R. Harris, M. Berriman, J. Parkhill, and J. A. McQuillan. 2012. Artemis: an integrated platform for visualization and analysis of high-throughput sequence-based experimental data. Bioinformatics 28:464-469.
Carver, T., N. Thomson, A. Bleasby, M. Berriman, and J. Parkhill. 2009. DNAPlotter: circular and linear interactive genome visualization. Bioinformatics 25:119-120.
Carver, T. J., K. M. Rutherford, M. Berriman, M. A. Rajandream, B. G. Barrell, and J. Parkhill. 2005. ACT: the Artemis Comparison Tool. Bioinformatics 21:3422-3423.

Bibliography 167
Casamayor, E. O. 2010. Vertical distribution of planktonic autotrophic thiobacilli and dark CO2 fixation rates in lakes with oxygen-sulfide interfaces. Aquatic Microbial Ecology 59:217-228.
Casamayor, E. O., I. Ferrera, X. Cristina, C. M. Borrego, and J. M. Gasol. 2007. Flow cytometric identification and enumeration of photosynthetic sulfur bacteria and potential for ecophysiological studies at the single-cell level. Environ Microbiol 9:1969-1985.
Casamayor, E. O., J. Garcia-Cantizano, and C. Pedros-Alio. 2008. Carbon dioxide fixation in the dark by photosynthetic bacteria in sulfide-rich stratified lakes with oxic-anoxic interfaces. Limnology and Oceanography 53:1193-1203.
Casamayor, E. O., M. Lliros, A. Picazo, A. Barberan, C. M. Borrego, and A. Camacho. 2012. Contribution of deep dark fixation processes to overall CO2 incorporation and large vertical changes of microbial populations in stratified karstic lakes. Aquatic Sciences 74:61-75.
Casamayor, E. O., J. Mas, and C. Pedros-Alio. 2001a. In Situ Assessment on the Physiological State of Purple and Green Sulfur Bacteria through the Analyses of Pigment and 5S rRNA Content. Microb Ecol 42:427-437.
Casamayor, E. O., G. Muyzer, and C. Pedros-Alio. 2001b. Composition and temporal dynamics of planktonic archaeal assemblages from anaerobic sulfurous environments studied by 16S rDNA denaturing gradient gel electrophoresis and sequencing. Aquatic Microbial Ecology 25:237-246.
Casamayor, E. O., C. Pedros-Alio, G. Muyzer, and R. Amann. 2002. Microheterogeneity in 16S ribosomal DNA-defined bacterial populations from a stratified planktonic environment is related to temporal changes and to ecological adaptations. Appl Environ Microbiol 68:1706-1714.
Casamayor, E. O., H. Schafer, L. Baneras, C. Pedros-Alio, and G. Muyzer. 2000. Identification of and spatio-temporal differences between microbial assemblages from two neighboring sulfurous lakes: Comparison by microscopy and denaturing gradient gel electrophoresis. Appl Environ Microbiol 66:499-508.
Casamayor, E. O., X. Triado-Margarit, and C. Castaneda. 2013. Microbial biodiversity in saline shallow lakes of the Monegros Desert, Spain. FEMS Microbiol Ecol 85:503-518.
Castresana, J. 2000. Selection of conserved blocks from multiple alignments for their use in phylogenetic analysis. Mol Biol Evol 17:540-552.
Catalan, J. 1988. Physical properties of the environment relevant to the pelagic ecosystem of a deep high-mountain lake (Estany Redó, Central Pyrenees). Oecol. aquat 9:89-123.

Bibliography 168
Catalan, J. 1989. The winter cover of a high-mountain mediterranean lake (Estany-Redo, Pyrenees). Water Resources Research 25:519-527.
Catalan, J. 1992. Evolution of dissolved and particulate matter during the ice-covered period in a deep, high-mountain lake. Canadian Journal of Fisheries and Aquatic Sciences 49:945-955.
Catalan, J., E. Ballesteros, L. Camarero, M. Felip, and E. Gacia. 1992. Limnology in the Pyrenean lakes. Limnetica 8:27-38.
Catalan, J., and L. Camarero. 1991. Ergoclines and Biological Processes in High Mountain Lakes - Similarities between Summer Stratification and the Ice-Forming Periods in Lake Redo (Pyrenees). International Association of Theoretical and Applied Limnology - Proceedings, Vol 24, Pt 2 24:1011-1015.
Catalan, J., L. Camarero, M. Felip, S. Pla, M. Ventura, T. Buchaca, F. Bartumeus, G. de Mendoza, A. Miró, E. Casamayor, J. Sánchez-Medina, M. Bacardit, M. Altuna, M. Bartrons, and D. Díaz de Quijano. 2006. High mountain lakes: extreme habitats and witnesses of environmental changes. Limnetica 25:551-584.
Catalan, J., L. Camarero, E. Gacia, E. Ballesteros, and M. Felip. 1994. Nitrogen in the Pyrenean lakes (Spain). Hydrobiologia 274:17-27.
Catalan, J., S. Pla, M. Rieradevall, M. Felip, M. Ventura, T. Buchaca, L. Camarero, A. Brancelj, P. G. Appleby, A. Lami, A. Grytnes, A. Agusti-Panareda, and R. Thompson. 2002. Lake Redo ecosystem response to an increasing warming in the Pyrenees during the twentieth century. Journal of Paleolimnology 28:129-145.
Chauhan, D., I. M. Folea, C. C. Jolley, R. Kouril, C. E. Lubner, S. Lin, D. Kolber, F. Wolfe-Simon, J. H. Golbeck, E. J. Boekema, and P. Fromme. 2011. A Novel Photosynthetic Strategy for Adaptation to Low-Iron Aquatic Environments. Biochemistry 50:686-692.
Cheetham, B. F., D. B. Tattersall, G. A. Bloomfield, J. I. Rood, and M. E. Katz. 1995. Identification of a Gene Encoding a Bacteriophage-Related Integrase in a Vap Region of the Dichelobacter-Nodosus Genome. Gene 162:53-58.
Chiura, H. X. 1997. Generalized gene transfer by virus-like particles from marine bacteria. Aquatic Microbial Ecology 13:75-83.
Cohan, F. M., and A. F. Koeppel. 2008. The Origins of Ecological Diversity in Prokaryotes. Current Biology 18:R1024-U1017.
Cohen, P. T., and P. Cohen. 1989. Discovery of a protein phosphatase activity encoded in the genome of bacteriophage lambda. Probable identity with open reading frame 221. Biochem J 260:931-934.

Bibliography 169
Comeau, A. M., T. Harding, P. E. Galand, W. F. Vincent, and C. Lovejoy. 2012. Vertical distribution of microbial communities in a perennially stratified Arctic lake with saline, anoxic bottom waters. Scientific Reports 2.
Crump, B. C., G. W. Kling, M. Bahr, and J. E. Hobbie. 2003. Bacterioplankton community shifts in an arctic lake correlate with seasonal changes in organic matter source. Appl Environ Microbiol 69:2253-2268.
Damsté, J. S. S., and J. Köster. 1998. A euxinic southern North Atlantic Ocean during the Cenomanian/Turonian oceanic anoxic event. Earth and Planetary Science Letters 158:165-173.
De Palmenaer, D., P. Siguier, and J. Mahillon. 2008. IS4 family goes genomic. BMC Evol Biol 8:18.
del Campo, J., and R. Massana. 2011. Emerging Diversity within Chrysophytes, Choanoflagellates and Bicosoecids Based on Molecular Surveys. Protist 162:435-448.
Deng, L., and P. K. Hayes. 2008. Evidence for cyanophages active against bloom-forming freshwater cyanobacteria. Freshwater Biology 53:1240-1252.
Diaz, R. J., and R. Rosenberg. 2008. Spreading dead zones and consequences for marine ecosystems. Science 321:926-929.
Doolittle, W. F., and O. Zhaxybayeva. 2009. On the origin of prokaryotic species. Genome Res 19:744-756.
Dumestre, J. F., E. O. Casamayor, R. Massana, and C. Pedros-Alio. 2002. Changes in bacterial and archaeal assemblages in an equatorial river induced by the water eutrophication of Petit Saut dam reservoir (French Guiana). Aquatic Microbial Ecology 26:209-221.
Dupont, C. L., J. Larsson, S. Yooseph, K. Ininbergs, J. Goll, J. Asplund-Samuelsson, J. P. McCrow, N. Celepli, L. Z. Allen, M. Ekman, A. J. Lucas, Å. Hagström, M. Thiagarajan, B. Brindefalk, A. R. Richter, A. F. Andersson, A. Tenney, D. Lundin, A. Tovchigrechko, J. A. A. Nylander, D. Brami, J. H. Badger, A. E. Allen, D. B. Rusch, J. Hoffman, E. Norrby, R. Friedman, J. Pinhassi, J. C. Venter, and B. Bergman. 2014. Functional Tradeoffs Underpin Salinity-Driven Divergence in Microbial Community Composition. PLoS ONE 9:e89549.
Dupont, C. L., D. B. Rusch, S. Yooseph, M. J. Lombardo, R. A. Richter, R. Valas, M. Novotny, J. Yee-Greenbaum, J. D. Selengut, D. H. Haft, A. L. Halpern, R. S. Lasken, K. Nealson, R. Friedman, and J. C. Venter. 2012. Genomic insights to SAR86, an abundant and uncultivated marine bacterial lineage. Isme Journal 6:1186-1199.

Bibliography 170
Dupont, C. L., S. Yang, B. Palenik, and P. E. Bourne. 2006. Modern proteomes contain putative imprints of ancient shifts in trace metal geochemistry. Proc Natl Acad Sci U S A 103:17822-17827.
Dyhrman, S. T., J. W. Ammerman, and B. A. S. Van Mooy. 2007. Microbes and the Marine Phosphorus Cycle. Oceanography 20:110-116.
Dyhrman, S. T., P. D. Chappell, S. T. Haley, J. W. Moffett, E. D. Orchard, J. B. Waterbury, and E. A. Webb. 2006. Phosphonate utilization by the globally important marine diazotroph Trichodesmium. Nature 439:68-71.
Edgar, R. C. 2004. MUSCLE: multiple sequence alignment with high accuracy and high throughput. Nucleic Acids Res 32:1792-1797.
Edgar, R. C. 2010. Search and clustering orders of magnitude faster than BLAST. Bioinformatics 26:2460-2461.
Edgar, R. C., B. J. Haas, J. C. Clemente, C. Quince, and R. Knight. 2011. UCHIME improves sensitivity and speed of chimera detection. Bioinformatics 27:2194-2200.
Ekau, W., H. Auel, H. O. Portner, and D. Gilbert. 2010. Impacts of hypoxia on the structure and processes in pelagic communities (zooplankton, macro-invertebrates and fish). Biogeosciences 7:1669-1699.
Eppacher, T. 1966. Umweltfaktoren und Lebewelt im Pelagial des Gossenköllesees (Kühtai, Stubaier Alpen, 2.413 m). PhD thesis. University of Innsbruck.
Ewing, B., L. Hillier, M. C. Wendl, and P. Green. 1998. Base-calling of automated sequencer traces using phred. I. Accuracy assessment. Genome Res 8:175-185.
Felip, M., F. Bartumeus, S. Halac, and J. Catalan. 1999a. Microbial plankton assemblages, composition and biomass, during two ice-free periods in a deep high mountain lake (Estany Redó, Pyrenees). Journal of Limnology 58:10.
Felip, M., L. Camarero, and J. Catalan. 1999b. Temporal changes of microbial assemblages in the ice and snow cover of a high mountain lake. Limnology and Oceanography 44:973-987.
Felip, M., B. Sattler, R. Psenner, and J. Catalan. 1995. Highly active microbial communities in the ice and snow cover of high mountain lakes. Appl Environ Microbiol 61:2394-2401.
Felip, M., A. Wille, B. Sattler, and R. Psenner. 2002. Microbial communities in the winter cover and the water column of an alpine lake: system connectivity and uncoupling. Aquatic Microbial Ecology 29:123-134.

Bibliography 171
Fernandez-Gomez, B., M. Richter, M. Schuler, J. Pinhassi, S. G. Acinas, J. M. Gonzalez, and C. Pedros-Alio. 2013. Ecology of marine Bacteroidetes: a comparative genomics approach. Isme Journal 7:1026-1037.
Fernandez-Guerra, A., and E. O. Casamayor. 2012. Habitat-Associated Phylogenetic Community Patterns of Microbial Ammonia Oxidizers. PLoS ONE 7.
Ferrera, I., R. Massana, E. O. Casamayor, V. Balague, O. Sanchez, C. Pedros-Alio, and J. Mas. 2004. High-diversity biofilm for the oxidation of sulfide-containing effluents. Applied Microbiology and Biotechnology 64:726-734.
Figueras, J. B., L. J. Garcia-Gil, and C. A. Abella. 1997. Phylogeny of the genus Chlorobium based on 16S rDNA sequence. FEMS Microbiol Lett 152:31-36.
Fillol, M., A. Sànchez-Melsió, F. Gich, and C. M. Borrego. 2015. Diversity of Miscellaneous Crenarchaeotic Group archaea in freshwater karstic lakes and their segregation between planktonic and sediment habitats.
Franken, C., G. Haase, C. Brandt, J. Weber-Heynemann, S. Martin, C. Lammler, A. Podbielski, R. Lutticken, and B. Spellerberg. 2001. Horizontal gene transfer and host specificity of beta-haemolytic streptococci: the role of a putative composite transposon containing scpB and lmb. Molecular Microbiology 41:925-935.
Freeman, K. R., A. P. Martin, D. Karki, R. C. Lynch, M. S. Mitter, A. F. Meyer, J. E. Longcore, D. R. Simmons, and S. K. Schmidt. 2009. Evidence that chytrids dominate fungal communities in high-elevation soils. Proc Natl Acad Sci U S A 106:18315-18320.
Frigaard, N.-U., and D. Bryant. 2008. Genomic Insights into the Sulfur Metabolism of Phototrophic Green Sulfur Bacteria. Pages 337-355 in R. Hell, C. Dahl, D. Knaff, and T. Leustek, editors. Sulfur Metabolism in Phototrophic Organisms. Springer Netherlands.
Frigaard, N.-U., and D. A. Bryant. 2006. Chlorosomes: antenna organelles in photosynthetic green bacteria. Pages 79-114 Complex intracellular structures in prokaryotes. Springer.
Frigaard, N. U., and D. A. Bryant. 2001. Chromosomal gene inactivation in the green sulfur bacterium Chlorobium tepidum by natural transformation. Appl Environ Microbiol 67:2538-2544.
Fuchs, G. 2011. Alternative Pathways of Carbon Dioxide Fixation: Insights into the Early Evolution of Life? Pages 631-+ in S. Gottesman and C. S. Harwood, editors. Annual Review of Microbiology, Vol 65. Annual Reviews, Palo Alto.
Bibliography 172
Fuchsman, C. A., and G. Rocap. 2006. Whole-genome reciprocal BLAST analysis reveals that planctomycetes do not share an unusually large number of genes with Eukarya and Archaea. Appl Environ Microbiol 72:6841-6844.
Fuhrman, J. A. 1999. Marine viruses and their biogeochemical and ecological effects. Nature 399:541-548.
Fuhrman, J. A., M. S. Schwalbach, and U. Stingl. 2008. Proteorhodopsins: an array of physiological roles? Nat Rev Microbiol 6:488-494.
Gadkari, D., K. Schricker, G. Acker, R. M. Kroppenstedt, and O. Meyer. 1990. Streptomyces thermoautotrophicus sp. nov., a Thermophilic CO- and H(2)-Oxidizing Obligate Chemolithoautotroph. Appl Environ Microbiol 56:3727-3734.
Galloway, J. N., A. R. Townsend, J. W. Erisman, M. Bekunda, Z. Cai, J. R. Freney, L. A. Martinelli, S. P. Seitzinger, and M. A. Sutton. 2008. Transformation of the nitrogen cycle: recent trends, questions, and potential solutions. Science 320:889-892.
Garcia-Cantizano, J., E. O. Casamayor, J. M. Gasol, R. Guerrero, and C. Pedros-Alio. 2005. Partitioning of CO2 incorporation among planktonic microbial guilds and estimation of in situ specific growth rates. Microb Ecol 50:230-241.
Garcia-Descalzo, L., E. Garcia-Lopez, M. Postigo, F. Baquero, A. Alcazar, and C. Cid. 2013. Eukaryotic microorganisms in cold environments: examples from Pyrenean glaciers. Front Microbiol 4:55.
Garcia-Gil, L. J. 1990. Phototrophic bacteria and iron cycle in Lake Banyoles. Autonomous University of Barcelona.
Garcia-Gil, L. J., and C. A. Abella. 1992. Population dynamics of phototrophic bacteria in three basins of Lake Banyoles (Spain). Pages 87-94 in V. Ilmavirta and R. Jones, editors. The Dynamics and Use of Lacustrine Ecosystems. Springer Netherlands.
Garcia-Gil, L. J., L. Salagenoher, J. V. Esteva, and C. A. Abella. 1990. Distribution of iron in lake Banyoles in relation to the ecology of purple and green sulur bacteria. Hydrobiologia 192:259-270.
Ghosh, W., and B. Dam. 2009. Biochemistry and molecular biology of lithotrophic sulfur oxidation by taxonomically and ecologically diverse bacteria and archaea. FEMS Microbiol Rev 33:999-1043.
Gich, F., J. Garcia-Gil, and J. Overmann. 2001. Previously unknown and phylogenetically diverse members of the green nonsulfur bacteria are indigenous to freshwater lakes. Archives of Microbiology 177:1-10.
Gies, E. A., K. M. Konwar, J. T. Beatty, and S. J. Hallam. 2014. Illuminating Microbial Dark Matter in Meromictic Sakinaw Lake. Appl Environ Microbiol 80:6807-6818.
Bibliography 173
Gifford, S. M., S. Sharma, J. M. Rinta-Kanto, and M. A. Moran. 2011. Quantitative analysis of a deeply sequenced marine microbial metatranscriptome. ISME J 5:461-472.
Gilbert, J. A., and C. L. Dupont. 2011. Microbial metagenomics: beyond the genome. Ann Rev Mar Sci 3:347-371.
Glockner, F. O., E. Zaichikov, N. Belkova, L. Denissova, J. Pernthaler, A. Pernthaler, and R. Amann. 2000. Comparative 16S rRNA analysis of lake bacterioplankton reveals globally distributed phylogenetic clusters including an abundant group of actinobacteria. Appl Environ Microbiol 66:5053-5065.
Goll, J., D. B. Rusch, D. M. Tanenbaum, M. Thiagarajan, K. Li, B. A. Methe, and S. Yooseph. 2010. METAREP: JCVI metagenomics reports--an open source tool for high-performance comparative metagenomics. Bioinformatics 26:2631-2632.
Gomez Maqueo Chew, A., N. U. Frigaard, and D. A. Bryant. 2007. Bacteriochlorophyllide c C-8(2) and C-12(1) methyltransferases are essential for adaptation to low light in Chlorobaculum tepidum. Journal of Bacteriology 189:6176-6184.
Gordon, D. 2003. Viewing and editing assembled sequences using Consed. Curr Protoc Bioinformatics Chapter 11:Unit11 12.
Gordon, D., C. Abajian, and P. Green. 1998. Consed: a graphical tool for sequence finishing. Genome Res 8:195-202.
Gregersen, L. H., D. A. Bryant, and N. U. Frigaard. 2011. Mechanisms and evolution of oxidative sulfur metabolism in green sulfur bacteria. Front Microbiol 2:116.
Gregersen, L. H., K. S. Habicht, S. Peduzzi, M. Tonolla, D. E. Canfield, M. Miller, R. P. Cox, and N. U. Frigaard. 2009. Dominance of a clonal green sulfur bacterial population in a stratified lake. FEMS Microbiol Ecol 70:30-41.
Grote, J., G. Jost, M. Labrenz, G. J. Herndl, and K. Juergens. 2008. Epsilonproteobacteria Represent the Major Portion of Chemoautotrophic Bacteria in Sulfidic Waters of Pelagic Redoxclines of the Baltic and Black Seas. Appl Environ Microbiol 74:7546-7551.
Grote, J., T. Schott, C. G. Bruckner, F. O. Glockner, G. Jost, H. Teeling, M. Labrenz, and K. Jurgens. 2012. Genome and physiology of a model Epsilonproteobacterium responsible for sulfide detoxification in marine oxygen depletion zones. Proc Natl Acad Sci U S A 109:506-510.
Guerrero, M. A., and R. D. Jones. 1996. Photoinhibition of marine nitrifying bacteria. I. Wavelength-dependent response. Marine ecology progress series. Oldendorf 141:183-192.

Bibliography 174
Guerrero, R., E. Montesinos, I. Esteve, and C. Abella. 1980. Physiological Adaptation and Growth of Purple and Green Sulfur Bacteria in a Meromictic Lake (Vila) as Compared to a Holomictic Lake (Siso). Pages 161-171 in M. Dokulil, H. Metz, and D. Jewson, editors. Shallow Lakes Contributions to their Limnology. Springer Netherlands.
Guerrero, R., E. Montesinos, C. Pedros-Alio, I. Esteve, J. Mas, H. Van Gemerden, P. A. G. Hofman, and J. F. Bakker. 1985. Phototrophic sulfur bacteria in two Spanish lakes: vertical distribution and limiting factors. Limnology and Oceanography 30:919-931.
Guy, L., J. R. Kultima, and S. G. Andersson. 2010. genoPlotR: comparative gene and genome visualization in R. Bioinformatics 26:2334-2335.
Habicht, K. S., M. Miller, R. P. Cox, N. U. Frigaard, M. Tonolla, S. Peduzzi, L. G. Falkenby, and J. S. Andersen. 2011. Comparative proteomics and activity of a green sulfur bacterium through the water column of Lake Cadagno, Switzerland. Environ Microbiol 13:203-215.
Halary, S., J. W. Leigh, B. Cheaib, P. Lopez, and E. Bapteste. 2010. Network analyses structure genetic diversity in independent genetic worlds. Proc Natl Acad Sci U S A 107:127-132.
Harada, J., T. Mizoguchi, S. Satoh, Y. Tsukatani, M. Yokono, M. Noguchi, A. Tanaka, and H. Tamiaki. 2013. Specific Gene bciD for C7-Methyl Oxidation in Bacteriochlorophyll e Biosynthesis of Brown-Colored Green Sulfur Bacteria. PLoS ONE 8.
Harding, T., A. D. Jungblut, C. Lovejoy, and W. F. Vincent. 2011. Microbes in High Arctic Snow and Implications for the Cold Biosphere. Appl Environ Microbiol 77:3234-3243.
Haring, V., S. J. Billington, C. L. Wright, A. S. Huggins, M. E. Katz, and J. I. Rood. 1995. Delineation of the Virulence-Related Locus (Vrl) of Dichelobacter-Nodosus. Microbiology-Uk 141:2081-2089.
Herlemann, D. P. R., O. Geissinger, and A. Brune. 2007. The termite group I phylum is highly diverse and widespread in the environment. Appl Environ Microbiol 73:6682-6685.
Herlemann, D. P. R., O. Geissinger, W. Ikeda-Ohtsubo, V. Kunin, H. Sun, A. Lapidus, P. Hugenholtz, and A. Brune. 2009. Genomic Analysis of "Elusimicrobium minutum," the First Cultivated Representative of the Phylum "Elusimicrobia" (Formerly Termite Group 1). Appl Environ Microbiol 75:2841-2849.

Bibliography 175
Hervas, A., L. Camarero, I. Reche, and E. O. Casamayor. 2009. Viability and potential for immigration of airborne bacteria from Africa that reach high mountain lakes in Europe. Environ Microbiol 11:1612-1623.
Hervas, A., and E. O. Casamayor. 2009. High similarity between bacterioneuston and airborne bacterial community compositions in a high mountain lake area. FEMS Microbiol Ecol 67:219-228.
Hirabayashi, H., T. Ishii, S. Takaichi, K. Inoue, and K. Uehara. 2004. The role of carotenoids in the photoadaptation of the brown-colored sulfur bacterium Chlorobium phaeobacteroides. Photochem Photobiol 79:280-285.
Holmer, M., and P. Storkholm. 2001. Sulphate reduction and sulphur cycling in lake sediments: a review. Freshwater Biology 46:431-451.
Huang, Y., P. Gilna, and W. Li. 2009. Identification of ribosomal RNA genes in metagenomic fragments. Bioinformatics 25:1338-1340.
Huber, C., and G. Wachtershauser. 1997. Activated acetic acid by carbon fixation on (Fe,Ni)S under primordial conditions. Science 276:245-247.
Hugler, M., H. Huber, K. O. Stetter, and G. Fuchs. 2003. Autotrophic CO2 fixation pathways in archaea (Crenarchaeota). Arch Microbiol 179:160-173.
Imhoff, J. 1995. Taxonomy and Physiology of Phototrophic Purple Bacteria and Green Sulfur Bacteria. Pages 1-15 in R. Blankenship, M. Madigan, and C. Bauer, editors. Anoxygenic Photosynthetic Bacteria. Springer Netherlands.
Imhoff, J. F. 2003. Phylogenetic taxonomy of the family Chlorobiaceae on the basis of 16S rRNA and fmo (Fenna-Matthews-Olson protein) gene sequences. Int J Syst Evol Microbiol 53:941-951.
Jaroszewski, L., Z. Li, S. S. Krishna, C. Bakolitsa, J. Wooley, A. M. Deacon, I. A. Wilson, and A. Godzik. 2009. Exploration of uncharted regions of the protein universe. PLoS Biol 7:e1000205.
Jetten, M. S. M., O. Sliekers, M. Kuypers, T. Dalsgaard, L. van Niftrik, I. Cirpus, K. van de Pas-Schoonen, G. Lavik, B. Thamdrup, D. Le Paslier, H. J. M. Op den Camp, S. Hulth, L. P. Nielsen, W. Abma, K. Third, P. Engstrom, J. G. Kuenen, B. B. Jorgensen, D. E. Canfield, J. S. S. Damste, N. P. Revsbech, J. Fuerst, J. Weissenbach, M. Wagner, I. Schmidt, M. Schmid, and M. Strous. 2003. Anaerobic ammonium oxidation by marine and freshwater planctomycete-like bacteria. Applied Microbiology and Biotechnology 63:107-114.
Kaartokallio, H. 2004. Food web components, and physical and chemical properties of Baltic Sea ice. Marine Ecology-Progress Series 273:49-63.
Kammerlander, B., H.-W. Breiner, S. Filker, R. Sommaruga, B. Sonntag, and T. Stoeck. 2015. High diversity of protistan plankton communities in remote high mountain lakes in the European Alps and the Himalayan mountains.

Bibliography 176
Kammler, M., C. Schon, and K. Hantke. 1993. Characterization of the Ferrous Iron Uptake System of Escherichia-Coli. Journal of Bacteriology 175:6212-6219.
Kasting, J. F., and J. L. Siefert. 2002. Life and the evolution of Earth's atmosphere. Science 296:1066-1068.
Kienesberger, S., H. Sprenger, S. Wolfgruber, B. Halwachs, G. G. Thallinger, G. I. Perez-Perez, M. J. Blaser, E. L. Zechner, and G. Gorkiewicz. 2014. Comparative Genome Analysis of Campylobacter fetus Subspecies Revealed Horizontally Acquired Genetic Elements Important for Virulence and Niche Specificity. PLoS ONE 9.
Kim, M. S., S. S. Hong, K. Park, and H. Myung. 2013. Genomic analysis of bacteriophage PBECO4 infecting Escherichia coli O157:H7. Arch Virol 158:2399-2403.
King, G. M., and C. F. Weber. 2007. Distribution, diversity and ecology of aerobic CO-oxidizing bacteria. Nat Rev Microbiol 5:107-118.
Kirchman, D. L. 1993. Leucine incorporation as a measure of biomass production by heterotrophic bacteria. Pages 509-512 in P. F. Kemp, B. F. Sherr, E. B. Sherr, and J. J. Cole, editors. Handbook of Methods in Aquatic Microbial Ecology. Lewis Publishers, Boca Raton, FL, USA.
Kirchman, D. L. 2002. The ecology of Cytophaga-Flavobacteria in aquatic environments. FEMS Microbiol Ecol 39:91-100.
Klatt, C. G., J. M. Wood, D. B. Rusch, M. M. Bateson, N. Hamamura, J. F. Heidelberg, A. R. Grossman, D. Bhaya, F. M. Cohan, M. Kuhl, D. A. Bryant, and D. M. Ward. 2011. Community ecology of hot spring cyanobacterial mats: predominant populations and their functional potential. Isme Journal 5:1262-1278.
Klepac-Ceraj, V., C. A. Hayes, W. P. Gilhooly, T. W. Lyons, R. Kolter, and A. Pearson. 2012. Microbial diversity under extreme euxinia: Mahoney Lake, Canada. Geobiology 10:223-235.
Knaust, F., M. Kube, R. Reinhardt, and R. Rabus. 2007. Analyses of the vrl gene cluster in Desulfococcus multivorans: Homologous to the virulence-associated locus of the ovine footrot pathogen Dichelobacter nodosus strain A198. Journal of Molecular Microbiology and Biotechnology 13:156-164.
Kunin, V., A. Copeland, A. Lapidus, K. Mavromatis, and P. Hugenholtz. 2008. A bioinformatician's guide to metagenomics. Microbiol Mol Biol Rev 72:557-578, Table of Contents.
Labrenz, M., G. Jost, C. Pohl, S. Beckmann, W. Martens-Habbena, and K. Jurgens. 2005. Impact of different in vitro electron donor/acceptor conditions

Bibliography 177
on potential chemolithoautotrophic communities from marine pelagic redoxclines. Appl Environ Microbiol 71:6664-6672.
Lam, P., and M. M. Kuypers. 2011. Microbial nitrogen cycling processes in oxygen minimum zones. Ann Rev Mar Sci 3:317-345.
Lane, D. J., B. Pace, G. J. Olsen, D. A. Stahl, M. L. Sogin, and N. R. Pace. 1985. Rapid determination of 16S ribosomal RNA sequences for phylogenetic analyses. Proc Natl Acad Sci U S A 82:6955-6959.
Lanfear, R., B. Calcott, S. Y. Ho, and S. Guindon. 2012. Partitionfinder: combined selection of partitioning schemes and substitution models for phylogenetic analyses. Mol Biol Evol 29:1695-1701.
LaRoche, J., P. W. Boyd, R. M. L. McKay, and R. J. Geider. 1996. Flavodoxin as an in situ marker for iron stress in phytoplankton. Nature 382:802-805.
Lauro, F. M., M. Z. DeMaere, S. Yau, M. V. Brown, C. Ng, D. Wilkins, M. J. Raftery, J. A. Gibson, C. Andrews-Pfannkoch, M. Lewis, J. M. Hoffman, T. Thomas, and R. Cavicchioli. 2011. An integrative study of a meromictic lake ecosystem in Antarctica. ISME J 5:879-895.
Lehours, A. C., P. Evans, C. Bardot, K. Joblin, and F. Gerard. 2007. Phylogenetic diversity of archaea and bacteria in the anoxic zone of a meromictic lake (Lake Pavin, France). Appl Environ Microbiol 73:2016-2019.
Li, W. Z., and A. Godzik. 2006. Cd-hit: a fast program for clustering and comparing large sets of protein or nucleotide sequences. Bioinformatics 22:1658-1659.
Libkind, D., M. Moline, J. P. Sampaio, and M. van Broock. 2009. Yeasts from high-altitude lakes: influence of UV radiation. FEMS Microbiol Ecol 69:353-362.
Lindstrom, E. S., K. Vrede, and E. Leskinen. 2004. Response of a member of the Verrucomicrobia, among the dominating bacteria in a hypolimnion, to increased phosphorus availability. Journal of Plankton Research 26:241-246.
Liu, Y., T. Yao, N. Jiao, S. Kang, Y. Zeng, and S. Huang. 2006. Microbial community structure in moraine lakes and glacial meltwaters, Mount Everest. FEMS Microbiol Lett 265:98-105.
Liu, Y. Q., T. D. Yao, L. P. Zhu, N. Z. Jiao, X. B. Liu, Y. H. Zeng, and H. C. Jiang. 2009. Bacterial Diversity of Freshwater Alpine Lake Puma Yumco on the Tibetan Plateau. Geomicrobiology Journal 26:131-145.
Liu, Z., C. G. Klatt, M. Ludwig, D. B. Rusch, S. I. Jensen, M. Kuhl, D. M. Ward, and D. A. Bryant. 2012. 'Candidatus Thermochlorobacter aerophilum:' an aerobic chlorophotoheterotrophic member of the phylum Chlorobi defined by metagenomics and metatranscriptomics. ISME J 6:1869-1882.

Bibliography 178
Lliros, M., L. Alonso-Saez, F. Gich, A. Plasencia, O. Auguet, E. O. Casamayor, and C. M. Borrego. 2011. Active bacteria and archaea cells fixing bicarbonate in the dark along the water column of a stratified eutrophic lagoon. FEMS Microbiol Ecol 77:370-384.
Lliros, M., E. O. Casamayor, and C. Borrego. 2008. High archaeal richness in the water column of a freshwater sulfurous karstic lake along an interannual study. FEMS Microbiol Ecol 66:331-342.
Llorens-Mares, T., J. C. Auguet, and E. O. Casamayor. 2012. Winter to spring changes in the slush bacterial community composition of a high-mountain lake (Lake Redon, Pyrenees). Environ Microbiol Rep 4:50-56.
Llorens-Mares, T., S. Yooseph, J. Goll, J. Hoffman, M. Vila-Costa, C. M. Borrego, C. L. Dupont, and E. O. Casamayor. 2015. Connecting biodiversity and potential functional role in modern euxinic environments by microbial metagenomics. ISME J 9:1648-1661.
Logares, R., S. Sunagawa, G. Salazar, F. M. Cornejo-Castillo, I. Ferrera, H. Sarmento, P. Hingamp, H. Ogata, C. de Vargas, G. Lima-Mendez, J. Raes, J. Poulain, O. Jaillon, P. Wincker, S. Kandels-Lewis, E. Karsenti, P. Bork, and S. G. Acinas. 2014. Metagenomic 16S rDNA Illumina tags are a powerful alternative to amplicon sequencing to explore diversity and structure of microbial communities. Environ Microbiol 16:2659-2671.
Lohse, D. L., J. M. Denu, and J. E. Dixon. 1995. Insights derived from the structures of the Ser/Thr phosphatases calcineurin and protein phosphatase 1. Structure 3:987-990.
Longnecker, K., M. W. Lomas, and B. A. S. Van Mooy. 2010. Abundance and diversity of heterotrophic bacterial cells assimilating phosphate in the subtropical North Atlantic Ocean. Environ Microbiol 12:2773-2782.
Lorenzi, H. A., J. Hoover, J. Inman, T. Safford, S. Murphy, L. Kagan, and S. J. Williamson. 2011. TheViral MetaGenome Annotation Pipeline (VMGAP): An automated tool for the functional annotation of viral Metagenomic shotgun sequencing data. Stand Genomic Sci 4:418-429.
Luo, C. W., D. Tsementzi, N. C. Kyrpides, and K. T. Konstantinidis. 2012. Individual genome assembly from complex community short-read metagenomic datasets. Isme Journal 6:898-901.
Luo, H. W., H. M. Zhang, R. A. Long, and R. Benner. 2011. Depth distributions of alkaline phosphatase and phosphonate utilization genes in the North Pacific Subtropical Gyre. Aquatic Microbial Ecology 62:61-69.
Lynch, M. D. J., and J. D. Neufeld. 2015. Ecology and exploration of the rare biosphere. Nature Reviews Microbiology 13:217-229.

Bibliography 179
Lyons, T. W., C. T. Reinhard, and N. J. Planavsky. 2014. The rise of oxygen in Earth's early ocean and atmosphere. Nature 506:307-315.
Macek, B., F. Gnad, B. Soufi, C. Kumar, J. V. Olsen, I. Mijakovic, and M. Mann. 2008. Phosphoproteome analysis of E. coli reveals evolutionary conservation of bacterial Ser/Thr/Tyr phosphorylation. Mol Cell Proteomics 7:299-307.
Madigan, M. T. 2012. Brock biology of microorganisms. Benjamin Cummings, San Francisco.
Majaneva, M., J. M. Rintala, M. Piisila, D. P. Fewer, and J. Blomster. 2012. Comparison of wintertime eukaryotic community from sea ice and open water in the Baltic Sea, based on sequencing of the 18S rRNA gene. Polar Biology 35:875-889.
Maranger, R., D. F. Bird, and S. K. Juniper. 1994. Viral and Bacterial Dynamics in Arctic Sea-Ice during the Spring Algal Bloom near Resolute, Nwt, Canada. Marine Ecology Progress Series 111:121-127.
Maresca, J. A. 2007. The genetic basis for pigment variation among green sulfur bacteria. The Pennsylvania State University, University Park.
Maresca, J. A., A. Gomez Maqueo Chew, M. R. Ponsati, N. U. Frigaard, J. G. Ormerod, and D. A. Bryant. 2004. The bchU gene of Chlorobium tepidum encodes the c-20 methyltransferase in bacteriochlorophyll c biosynthesis. Journal of Bacteriology 186:2558-2566.
Maresca, J. A., J. E. Graham, and D. A. Bryant. 2008a. The biochemical basis for structural diversity in the carotenoids of chlorophototrophic bacteria. Photosynth Res 97:121-140.
Maresca, J. A., S. P. Romberger, and D. A. Bryant. 2008b. Isorenieratene biosynthesis in green sulfur bacteria requires the cooperative actions of two carotenoid cyclases. Journal of Bacteriology 190:6384-6391.
Martens-Habbena, W., P. M. Berube, H. Urakawa, J. R. de la Torre, and D. A. Stahl. 2009. Ammonia oxidation kinetics determine niche separation of nitrifying Archaea and Bacteria. Nature 461:976-U234.
Martin, H. G., N. Ivanova, V. Kunin, F. Warnecke, K. W. Barry, A. C. McHardy, C. Yeates, S. M. He, A. A. Salamov, E. Szeto, E. Dalin, N. H. Putnam, H. J. Shapiro, J. L. Pangilinan, I. Rigoutsos, N. C. Kyrpides, L. L. Blackall, K. D. McMahon, and P. Hugenholtz. 2006. Metagenomic analysis of two enhanced biological phosphorus removal (EBPR) sludge communities. Nature Biotechnology 24:1263-1269.
Martin, J. H., K. H. Coale, K. S. Johnson, S. E. Fitzwater, R. M. Gordon, S. J. Tanner, C. N. Hunter, V. A. Elrod, J. L. Nowicki, T. L. Coley, R. T. Barber, S. Lindley, A. J. Watson, K. Vanscoy, C. S. Law, M. I. Liddicoat, R. Ling, T.

Bibliography 180
Stanton, J. Stockel, C. Collins, A. Anderson, R. Bidigare, M. Ondrusek, M. Latasa, F. J. Millero, K. Lee, W. Yao, J. Z. Zhang, G. Friederich, C. Sakamoto, F. Chavez, K. Buck, Z. Kolber, R. Greene, P. Falkowski, S. W. Chisholm, F. Hoge, R. Swift, J. Yungel, S. Turner, P. Nightingale, A. Hatton, P. Liss, and N. W. Tindale. 1994. Testing the Iron Hypothesis in Ecosystems of the Equatorial Pacific-Ocean. Nature 371:123-129.
Martinez, A., G. W. Tyson, and E. F. DeLong. 2010. Widespread known and novel phosphonate utilization pathways in marine bacteria revealed by functional screening and metagenomic analyses. Environ Microbiol 12:222-238.
Martiny, A. C., M. L. Coleman, and S. W. Chisholm. 2006. Phosphate acquisition genes in Prochlorococcus ecotypes: evidence for genome-wide adaptation. Proc Natl Acad Sci U S A 103:12552-12557.
Martiny, A. C., Y. Huang, and W. Z. Li. 2009. Occurrence of phosphate acquisition genes in Prochlorococcus cells from different ocean regions. Environ Microbiol 11:1340-1347.
Mary, I., D. G. Cummings, I. C. Biegala, P. H. Burkill, S. D. Archer, and M. V. Zubkov. 2006. Seasonal dynamics of bacterioplankton community structure at a coastal station in the western English Channel. Aquatic Microbial Ecology 42:119-126.
Medina-Sanchez, J. M., M. Felip, and E. O. Casamayor. 2005. Catalyzed reported deposition-fluorescence in situ hybridization protocol to evaluate phagotrophy in mixotrophic protists. Appl Environ Microbiol 71:7321-7326.
Merbt, S. N., D. A. Stahl, E. O. Casamayor, E. Marti, G. W. Nicol, and J. I. Prosser. 2012. Differential photoinhibition of bacterial and archaeal ammonia oxidation. FEMS Microbiol Lett 327:41-46.
Meyer, K. M., and L. R. Kump. 2008. Oceanic euxinia in Earth history: Causes and consequences. Pages 251-288 Annual Review of Earth and Planetary Sciences.
Millero, F. J. 1991. The oxidation of H2S in Framvaren fjord. Limnology and Oceanography 36:1006-1014.
Monchy, S., G. Sanciu, M. Jobard, S. Rasconi, M. Gerphagnon, M. Chabe, A. Cian, D. Meloni, N. Niquil, U. Christaki, E. Viscogliosi, and T. Sime-Ngando. 2011. Exploring and quantifying fungal diversity in freshwater lake ecosystems using rDNA cloning/sequencing and SSU tag pyrosequencing. Environ Microbiol 13:1433-1453.
Montesinos, E., R. Guerrero, C. Abella, and I. Esteve. 1983. Ecology and Physiology of the Competition for Light between Chlorobium-Limicola and

Bibliography 181
Chlorobium-Phaeobacteroides in Natural Habitats. Appl Environ Microbiol 46:1007-1016.
Moreno-Hagelsieb, G., and K. Latimer. 2008. Choosing BLAST options for better detection of orthologs as reciprocal best hits. Bioinformatics 24:319-324.
Mosier, A. C., A. E. Murray, and C. H. Fritsen. 2007. Microbiota within the perennial ice cover of Lake Vida, Antarctica. FEMS Microbiol Ecol 59:274-288.
Mueller-Spitz, S. R., G. W. Goetz, and S. L. McLellan. 2009. Temporal and spatial variability in nearshore bacterioplankton communities of Lake Michigan. FEMS Microbiol Ecol 67:511-522.
Mullis, K. B., and F. A. Faloona. 1987. Specific synthesis of DNA in vitro via a polymerase-catalyzed chain reaction. Methods Enzymol 155:335-350.
Murray, A. E., C. M. Preston, R. Massana, L. T. Taylor, A. Blakis, K. Wu, and E. F. DeLong. 1998. Seasonal and spatial variability of bacterial and archaeal assemblages in the coastal waters near Anvers Island, Antarctica. Appl Environ Microbiol 64:2585-2595.
Nakamura, Y., T. Itoh, H. Matsuda, and T. Gojobori. 2004. Biased biological functions of horizontally transferred genes in prokaryotic genomes. Nat Genet 36:760-766.
Newton, R. J., S. E. Jones, A. Eiler, K. D. McMahon, and S. Bertilsson. 2011. A Guide to the Natural History of Freshwater Lake Bacteria. Microbiology and Molecular Biology Reviews 75:14-49.
Norman, A., L. H. Hansen, and S. J. Sorensen. 2009. Conjugative plasmids: vessels of the communal gene pool. Philosophical Transactions of the Royal Society B-Biological Sciences 364:2275-2289.
Nunoura, T., Y. Takaki, H. Kazama, M. Hirai, J. Ashi, H. Imachi, and K. Takai. 2012. Microbial Diversity in Deep-sea Methane Seep Sediments Presented by SSU rRNA Gene Tag Sequencing. Microbes and Environments 27:382-390.
O'Malley, M. A. 2008. 'Everything is everywhere: but the environment selects': ubiquitous distribution and ecological determinism in microbial biogeography. Stud Hist Philos Biol Biomed Sci 39:314-325.
O'Malley, M. A., and J. Dupre. 2007. Size doesn't matter: towards a more inclusive philosophy of biology. Biology & Philosophy 22:155-191.
Oberto, J. 2013. SyntTax: a web server linking synteny to prokaryotic taxonomy. BMC Bioinformatics 14:4.
Ochman, H., J. G. Lawrence, and E. A. Groisman. 2000. Lateral gene transfer and the nature of bacterial innovation. Nature 405:299-304.

Bibliography 182
Ohtsubo, Y., W. Ikeda-Ohtsubo, Y. Nagata, and M. Tsuda. 2008. GenomeMatcher: a graphical user interface for DNA sequence comparison. BMC Bioinformatics 9:376.
Orf, G. S., and R. E. Blankenship. 2013. Chlorosome antenna complexes from green photosynthetic bacteria. Photosynth Res 116:315-331.
Ormerod, J. G. 1988. Natural Genetic Transformation in Chlorobium. Pages 315-319 in J. M. Olson, J. G. Ormerod, J. Amesz, E. Stackebrandt, and H. G. Trüper, editors. Green Photosynthetic Bacteria. Springer US.
Overmann, J. 1997. Mahoney Lake: A Case Study of the Ecological Significance of Phototrophic Sulfur Bacteria. Pages 251-288 in J. G. Jones, editor. Advances in Microbial Ecology. Springer US.
Page, K. A., S. A. Connon, and S. J. Giovannoni. 2004. Representative freshwater bacterioplankton isolated from Crater Lake, Oregon. Appl Environ Microbiol 70:6542-6550.
Palenik, B., Q. Ren, V. Tai, and I. T. Paulsen. 2009. Coastal Synechococcus metagenome reveals major roles for horizontal gene transfer and plasmids in population diversity. Environ Microbiol 11:349-359.
Pedros-Alio, C., J. I. Calderon-Paz, and J. M. Gasol. 2000. Comparative analysis shows that bacterivory, not viral lysis, controls the abundance of heterotrophic prokaryotic plankton. FEMS Microbiol Ecol 32:157-165.
Pedros-Alio, C., and R. Guerrero. 1993. Microbial ecology in Lake Ciso. Advances in Microbial Ecology 13:155-209.
Pernthaler, J., F. O. Glockner, S. Unterholzner, A. Alfreider, R. Psenner, and R. Amann. 1998. Seasonal community and population dynamics of pelagic bacteria and archaea in a high mountain lake. Appl Environ Microbiol 64:4299-4306.
Peura, S., A. Eiler, S. Bertilsson, H. Nykanen, M. Tiirola, and R. I. Jones. 2012. Distinct and diverse anaerobic bacterial communities in boreal lakes dominated by candidate division OD1. Isme Journal 6:1640-1652.
Pinhassi, J., M. M. Sala, H. Havskum, F. Peters, O. Guadayol, A. Malits, and C. Marrase. 2004. Changes in bacterioplankton composition under different phytoplankton regimens. Appl Environ Microbiol 70:6753-6766.
Polz, M. F., E. J. Alm, and W. P. Hanage. 2013. Horizontal gene transfer and the evolution of bacterial and archaeal population structure. Trends in Genetics 29:170-175.
Prakash, T., and T. D. Taylor. 2012. Functional assignment of metagenomic data: challenges and applications. Brief Bioinform 13:711-727.

Bibliography 183
Priscu, J. C., E. E. Adams, W. B. Lyons, M. A. Voytek, D. W. Mogk, R. L. Brown, C. P. McKay, C. D. Takacs, K. A. Welch, C. F. Wolf, J. D. Kirshtein, and R. Avci. 1999. Geomicrobiology of subglacial ice above Lake Vostok, Antarctica. Science 286:2141-2144.
Prosser, J. I. 2012. Ecosystem processes and interactions in a morass of diversity. FEMS Microbiol Ecol 81:507-519.
Prosser, J. I., and G. W. Nicol. 2008. Relative contributions of archaea and bacteria to aerobic ammonia oxidation in the environment. Environ Microbiol 10:2931-2941.
Pruesse, E., J. Peplies, and F. O. Glockner. 2012. SINA: accurate high throughput multiple sequence alignment of ribosomal RNA genes. Bioinformatics.
Psenner, R., B. Sattler, A. Wille, C. H. Fritsen, J. C. Priscu, M. Felip, and J. Catalan. 1999. Lake ice microbial communities in alpine and antarctic lakes. Pages 17–31 in S. F. Margesin R, editor. Cold adapted organisms. Springer-Verlag, Heidelberg.
Quast, C., E. Pruesse, P. Yilmaz, J. Gerken, T. Schweer, P. Yarza, J. Peplies, and F. O. Glockner. 2013. The SILVA ribosomal RNA gene database project: improved data processing and web-based tools. Nucleic Acids Res 41:D590-596.
Quinn, J. P., A. N. Kulakova, N. A. Cooley, and J. W. McGrath. 2007. New ways to break an old bond: the bacterial carbon-phosphorus hydrolases and their role in biogeochemical phosphorus cycling. Environ Microbiol 9:2392-2400.
R Core Team. 2014. R: A Language and Environment for Statistical Computing. R Foundation for Statistical Computing, Vienna, Austria.
Ragsdale, S. W. 2004. Life with carbon monoxide. Crit Rev Biochem Mol Biol 39:165-195.
Raskin, L., B. E. Rittmann, and D. A. Stahl. 1996. Competition and coexistence of sulfate-reducing and methanogenic populations in anaerobic biofilms. Appl Environ Microbiol 62:3847-3857.
Reche, I., E. Ortega-Retuerta, O. Romera, E. Pulido-Villena, R. Morales-Baquero, and E. O. Casamayor. 2009. Effect of Saharan dust inputs on bacterial activity and community composition in Mediterranean lakes and reservoirs. Limnology and Oceanography 54:869-879.
Reichenbach, H. 2006. The order Cytophagales. Pages 549–590 in Dworkin M, Falkow S, Rosenberg E, Schleifer K-H, and Stackebrandt E, editors. Prokaryotes. Springer, Berlin.
Reinhard, C. T., N. J. Planavsky, L. J. Robbins, C. A. Partin, B. C. Gill, S. V. Lalonde, A. Bekker, K. O. Konhauser, and T. W. Lyons. 2013. Proterozoic

Bibliography 184
ocean redox and biogeochemical stasis. Proc Natl Acad Sci U S A 110:5357-5362.
Reisch, C. R., M. A. Moran, and W. B. Whitman. 2008. Dimethylsulfoniopropionate-dependent demethylase (DmdA) from Pelagibacter ubique and Silicibacter pomeroyi. Journal of Bacteriology 190:8018-8024.
Restrepo-Ortiz, C. X., J. C. Auguet, and E. O. Casamayor. 2014. Targeting spatiotemporal dynamics of planktonic SAGMGC-1 and segregation of ammonia-oxidizing thaumarchaeota ecotypes by newly designed primers and quantitative polymerase chain reaction. Environ Microbiol 16:689-700.
Restrepo-Ortiz, C. X., and E. O. Casamayor. 2013. Environmental distribution of two widespread uncultured freshwater Euryarchaeota clades unveiled by specific primers and quantitative PCR. Environ Microbiol Rep 5:861-867.
Reysenbach, A. L., and E. Shock. 2002. Merging genomes with geochemistry in hydrothermal ecosystems. Science 296:1077-1082.
Richards, T. A., A. A. Vepritskiy, D. E. Gouliamova, and S. A. Nierzwicki-Bauer. 2005. The molecular diversity of freshwater picoeukaryotes from an oligotrophic lake reveals diverse, distinctive and globally dispersed lineages. Environ Microbiol 7:1413-1425.
Richter, M., and R. Rossello-Mora. 2009. Shifting the genomic gold standard for the prokaryotic species definition. Proc Natl Acad Sci U S A 106:19126-19131.
Riemann, L., and H. P. Grossart. 2008. Elevated lytic phage production as a consequence of particle colonization by a marine Flavobacterium (Cellulophaga sp.). Microb Ecol 56:505-512.
Rikmann, E., I. Zekker, M. Tomingas, T. Tenno, A. Menert, L. Loorits, and T. Tenno. 2012. Sulfate-reducing anaerobic ammonium oxidation as a potential treatment method for high nitrogen-content wastewater. Biodegradation 23:509-524.
Rinke, C., P. Schwientek, A. Sczyrba, N. N. Ivanova, I. J. Anderson, J. F. Cheng, A. Darling, S. Malfatti, B. K. Swan, E. A. Gies, J. A. Dodsworth, B. P. Hedlund, G. Tsiamis, S. M. Sievert, W. T. Liu, J. A. Eisen, S. J. Hallam, N. C. Kyrpides, R. Stepanauskas, E. M. Rubin, P. Hugenholtz, and T. Woyke. 2013. Insights into the phylogeny and coding potential of microbial dark matter. Nature 499:431-437.
Roberts, G. P., H. Youn, and R. L. Kerby. 2004. CO-sensing mechanisms. Microbiol Mol Biol Rev 68:453-473, table of contents.
Rocap, G., F. W. Larimer, J. Lamerdin, S. Malfatti, P. Chain, N. A. Ahlgren, A. Arellano, M. Coleman, L. Hauser, W. R. Hess, Z. I. Johnson, M. Land, D.

Bibliography 185
Lindell, A. F. Post, W. Regala, M. Shah, S. L. Shaw, C. Steglich, M. B. Sullivan, C. S. Ting, A. Tolonen, E. A. Webb, E. R. Zinser, and S. W. Chisholm. 2003. Genome divergence in two Prochlorococcus ecotypes reflects oceanic niche differentiation. Nature 424:1042-1047.
Rohwer, F., and R. V. Thurber. 2009. Viruses manipulate the marine environment. Nature 459:207-212.
Rusch, D. B., A. L. Halpern, G. Sutton, K. B. Heidelberg, S. Williamson, S. Yooseph, D. Y. Wu, J. A. Eisen, J. M. Hoffman, K. Remington, K. Beeson, B. Tran, H. Smith, H. Baden-Tillson, C. Stewart, J. Thorpe, J. Freeman, C. Andrews-Pfannkoch, J. E. Venter, K. Li, S. Kravitz, J. F. Heidelberg, T. Utterback, Y. H. Rogers, L. I. Falcon, V. Souza, G. Bonilla-Rosso, L. E. Eguiarte, D. M. Karl, S. Sathyendranath, T. Platt, E. Bermingham, V. Gallardo, G. Tamayo-Castillo, M. R. Ferrari, R. L. Strausberg, K. Nealson, R. Friedman, M. Frazier, and J. C. Venter. 2007. The Sorcerer II Global Ocean Sampling expedition: Northwest Atlantic through Eastern Tropical Pacific. PLoS Biol 5:398-431.
Rutherford, K., J. Parkhill, J. Crook, T. Horsnell, P. Rice, M. A. Rajandream, and B. Barrell. 2000. Artemis: sequence visualization and annotation. Bioinformatics 16:944-945.
Salka, I., Z. Cuperova, M. Masin, M. Koblizek, and H. P. Grossart. 2011. Rhodoferax-related pufM gene cluster dominates the aerobic anoxygenic phototrophic communities in German freshwater lakes. Environ Microbiol 13:2865-2875.
Sangwan, P., X. L. Chen, P. Hugenholtz, and P. H. Janssen. 2004. Chthoniobacter flavus gen. nov., sp nov., the first pure-culture representative of subdivision two, Spartobacteria classis nov., of the phylum Verrucomicrobia. Appl Environ Microbiol 70:5875-5881.
Saunders, N. J., P. Boonmee, J. F. Peden, and S. A. Jarvis. 2005. Inter-species horizontal transfer resulting in core-genome and niche-adaptive variation within Helicobacter pylori. BMC Genomics 6.
Schloss, P. D., S. L. Westcott, T. Ryabin, J. R. Hall, M. Hartmann, E. B. Hollister, R. A. Lesniewski, B. B. Oakley, D. H. Parks, C. J. Robinson, J. W. Sahl, B. Stres, G. G. Thallinger, D. J. Van Horn, and C. F. Weber. 2009. Introducing mothur: open-source, platform-independent, community-supported software for describing and comparing microbial communities. Appl Environ Microbiol 75:7537-7541.
Schmetterer, G., A. Valladares, D. Pils, S. Steinbach, M. Pacher, A. M. Muro-Pastor, E. Flores, and A. Herrero. 2001. The coxBAC operon encodes a cytochrome c oxidase required for heterotrophic growth in the cyanobacterium
Bibliography 186
Anabaena variabilis strain ATCC 29413. Journal of Bacteriology 183:6429-6434.
Schmidt, U., and R. Conrad. 1993. Hydrogen, carbon-monoxide, and methane dynamics in Lake Constance. Limnology and Oceanography 38:1214-1226.
Severmann, S., and A. D. Anbar. 2009. Reconstructing Paleoredox Conditions through a Multitracer Approach: The Key to the Past Is the Present. Elements 5:359-364.
Shade, A., S. E. Jones, and K. D. McMahon. 2008. The influence of habitat heterogeneity on freshwater bacterial community composition and dynamics. Environ Microbiol 10:1057-1067.
Shapiro, B. J., J. Friedman, O. X. Cordero, S. P. Preheim, S. C. Timberlake, G. Szabo, M. F. Polz, and E. J. Alm. 2012. Population Genomics of Early Events in the Ecological Differentiation of Bacteria. Science 336:48-51.
Sharon, I., A. Alperovitch, F. Rohwer, M. Haynes, F. Glaser, N. Atamna-Ismaeel, R. Y. Pinter, F. Partensky, E. V. Koonin, Y. I. Wolf, N. Nelson, and O. Beja. 2009a. Photosystem I gene cassettes are present in marine virus genomes. Nature 461:258-262.
Sharon, I., A. Pati, V. M. Markowitz, and R. Y. Pinter. 2009b. A Statistical Framework for the Functional Analysis of Metagenomes. Pages 496-511 in S. Batzoglou, editor. Research in Computational Molecular Biology, Proceedings. Springer, Berlin, Heildelberg, Germany.
Simek, K., K. Hornak, J. Jezbera, M. Masin, J. Nedoma, J. M. Gasol, and M. Schauer. 2005. Influence of top-down and bottom-up manipulations on the R-BT065 subcluster of beta-proteobacteria, an abundant group in bacterioplankton of a freshwater reservoir. Appl Environ Microbiol 71:2381-2390.
Simon, C., A. Wiezer, A. W. Strittmatter, and R. Daniel. 2009. Phylogenetic diversity and metabolic potential revealed in a glacier ice metagenome. Appl Environ Microbiol 75:7519-7526.
Small, G. E., G. S. Bullerjahn, R. W. Sterner, B. F. N. Beall, S. Brovold, J. C. Finlay, R. M. L. McKay, and M. Mukherjee. 2013. Rates and controls of nitrification in a large oligotrophic lake. Limnology and Oceanography 58:276-286.
Sommaruga, R. 2001. The role of solar UV radiation in the ecology of alpine lakes. J Photochem Photobiol B 62:35-42.
Sommaruga, R., and E. O. Casamayor. 2009. Bacterial 'cosmopolitanism' and importance of local environmental factors for community composition in remote high-altitude lakes. Freshwater Biology 54:994-1005.

Bibliography 187
Soontharapirakkul, K., W. Promden, N. Yamada, H. Kageyama, A. Incharoensakdi, A. Iwamoto-Kihara, and T. Takabe. 2011. Halotolerant cyanobacterium Aphanothece halophytica contains an Na+-dependent F1F0-ATP synthase with a potential role in salt-stress tolerance. J Biol Chem 286:10169-10176.
Spang, A., J. H. Saw, S. L. Jorgensen, K. Zaremba-Niedzwiedzka, J. Martijn, A. E. Lind, R. van Eijk, C. Schleper, L. Guy, and T. J. G. Ettema. 2015. Complex archaea that bridge the gap between prokaryotes and eukaryotes. Nature 521:173-179.
Stamatakis, A. 2006. RAxML-VI-HPC: maximum likelihood-based phylogenetic analyses with thousands of taxa and mixed models. Bioinformatics 22:2688-2690.
Stewart, K., S. Kassakian, M. Krynytzky, D. DiJulio, and J. Murray. 2007. Oxic, suboxic, and anoxic conditions in the Black Sea. Pages 1-21 in V. Yanko-Hombach, A. Gilbert, N. Panin, and P. Dolukhanov, editors. The Black Sea Flood Question: Changes in Coastline, Climate, and Human Settlement. Springer Netherlands.
Stomp, M., J. Huisman, L. J. Stal, and H. C. Matthijs. 2007. Colorful niches of phototrophic microorganisms shaped by vibrations of the water molecule. ISME J 1:271-282.
Summers, A. O. 2006. Genetic linkage and horizontal gene transfer, the roots of the antibiotic multi-resistance problem. Animal Biotechnology 17:125-135.
Sun, H., S. Spring, A. Lapidus, K. Davenport, T. G. Del Rio, H. Tice, M. Nolan, A. Copeland, J. F. Cheng, S. Lucas, R. Tapia, L. Goodwin, S. Pitluck, N. Ivanova, I. Pagani, K. Mavromatis, G. Ovchinnikova, A. Pati, A. Chen, K. Palaniappan, L. Hauser, Y. J. Chang, C. D. Jeffries, J. C. Detter, C. Han, M. Rohde, E. Brambilla, M. Goker, T. Woyke, J. Bristow, J. A. Eisen, V. Markowitz, P. Hugenholtz, N. C. Kyrpides, H. P. Klenk, and M. Land. 2010. Complete genome sequence of Desulfarculus baarsii type strain (2st14(T)). Stand Genomic Sci 3:276-284.
Sun, S. L., J. Chen, W. Z. Li, I. Altintas, A. Lin, S. Peltier, K. Stocks, E. E. Allen, M. Ellisman, J. Grethe, and J. Wooley. 2011. Community cyberinfrastructure for Advanced Microbial Ecology Research and Analysis: the CAMERA resource. Nucleic Acids Res 39:D546-D551.
Taipale, S., P. Kankaala, M. W. Hahn, R. I. Jones, and M. Tiirola. 2011. Methane-oxidizing and photoautotrophic bacteria are major producers in a humic lake with a large anoxic hypolimnion. Aquatic Microbial Ecology 64:81-95.
Takai, K., B. J. Campbell, S. C. Cary, M. Suzuki, H. Oida, T. Nunoura, H. Hirayama, S. Nakagawa, Y. Suzuki, F. Inagaki, and K. Horikoshi. 2005. Enzymatic and genetic characterization of carbon and energy metabolisms by

Bibliography 188
deep-sea hydrothermal chemolithoautotrophic isolates of Epsilonproteobacteria. Appl Environ Microbiol 71:7310-7320.
Tamames, J., J. J. Abellan, M. Pignatelli, A. Camacho, and A. Moya. 2010. Environmental distribution of prokaryotic taxa. BMC Microbiol 10.
Tanenbaum, D. M., J. Goll, S. Murphy, P. Kumar, N. Zafar, M. Thiagarajan, R. Madupu, T. Davidsen, L. Kagan, S. Kravitz, D. B. Rusch, and S. Yooseph. 2010. The JCVI standard operating procedure for annotating prokaryotic metagenomic shotgun sequencing data. Stand Genomic Sci 2:229-237.
Teira, E., J. M. Gasol, M. Aranguren-Gassis, A. Fernandez, J. Gonzalez, I. Lekunberri, and X. A. Alvarez-Salgado. 2008. Linkages between bacterioplankton community composition, heterotrophic carbon cycling and environmental conditions in a highly dynamic coastal ecosystem. Environ Microbiol 10:906-917.
Thamdrup, B. 2012. New pathways and processes in the global nitrogen cycle. Annual Review of Ecology, Evolution, and Systematics 43:407-428.
Thomas, T., J. Gilbert, and F. Meyer. 2012. Metagenomics - a guide from sampling to data analysis. Microb Inform Exp 2:3.
Tonolla, M., R. Peduzzi, and D. Hahn. 2005. Long-term population dynamics of phototrophic sulfur bacteria in the chemocline of Lake Cadagno, Switzerland. Appl Environ Microbiol 71:3544-3550.
Tonolla, M., S. Peduzzi, A. Demarta, R. Peduzzi, and D. Hahn. 2004. Phototropic sulfur and sulfate-reducing bacteria in the chemocline of meromictic Lake Cadagno, Switzerland. 2004 63:10.
Treusch, A. H., S. Leininger, A. Kletzin, S. C. Schuster, H. P. Klenk, and C. Schleper. 2005. Novel genes for nitrite reductase and Amo-related proteins indicate a role of uncultivated mesophilic crenarchaeota in nitrogen cycling. Environ Microbiol 7:1985-1995.
Triado-Margarit, X., and E. O. Casamayor. 2012. Genetic diversity of planktonic eukaryotes in high mountain lakes (Central Pyrenees, Spain). Environ Microbiol 14:2445-2456.
Triado-Margarit, X., and E. O. Casamayor. 2013. High genetic diversity and novelty in planktonic protists inhabiting inland and coastal high salinity water bodies. FEMS Microbiol Ecol 85:27-36.
Trüper, H. G., and H. G. Schlegel. 1964. Sulphur Metabolism in Thiorhodaceae .1. Quantitative Measurements on Growing Cells of Chromatium Okenii. Antonie Van Leeuwenhoek Journal of Microbiology and Serology 30:225-&.
Tyson, G. W., J. Chapman, P. Hugenholtz, E. E. Allen, R. J. Ram, P. M. Richardson, V. V. Solovyev, E. M. Rubin, D. S. Rokhsar, and J. F. Banfield.

Bibliography 189
2004. Community structure and metabolism through reconstruction of microbial genomes from the environment. Nature 428:37-43.
Van de Peer, Y., S. Chapelle, and R. De Wachter. 1996. A quantitative map of nucleotide substitution rates in bacterial rRNA. Nucleic Acids Res 24:3381-3391.
Van Gemerden, H., and J. Mas. 1995. Ecology of Phototrophic Sulfur Bacteria. Pages 49-85 in R. Blankenship, M. Madigan, and C. Bauer, editors. Anoxygenic Photosynthetic Bacteria. Springer Netherlands.
Van Gemerden, H., E. Montesinos, J. Mas, and R. Guerrero. 1985. Diel Cycle of Metabolism of Phototrophic Purple Sulfur Bacteria in Lake Ciso (Spain). Limnology and Oceanography 30:932-943.
Vaquer-Sunyer, R., and C. M. Duarte. 2008. Thresholds of hypoxia for marine biodiversity. Proc Natl Acad Sci U S A 105:15452-15457.
Vila, X., and C. A. Abella. 1994. Effects of light quality on the physiology and the ecology of planktonic green sulfur bacteria in lakes. Photosynth Res 41:53-65.
Vila-Costa, M., M. Bartrons, J. Catalan, and E. O. Casamayor. 2014. Nitrogen-cycling genes in epilithic biofilms of oligotrophic high-altitude lakes (Central Pyrenees, Spain). Microb Ecol 68:60-69.
Vila-Costa, M., S. Sharma, M. A. Moran, and E. O. Casamayor. 2013. Diel gene expression profiles of a phosphorus limited mountain lake using metatranscriptomics. Environ Microbiol 15:1190-1203.
Villafranca, J. E., C. R. Kissinger, and H. E. Parge. 1996. Protein serine/threonine phosphatases. Curr Opin Biotechnol 7:397-402.
Walker, C. B., J. R. de la Torre, M. G. Klotz, H. Urakawa, N. Pinel, D. J. Arp, C. Brochier-Armanet, P. S. G. Chain, P. P. Chan, A. Gollabgir, J. Hemp, M. Hugler, E. A. Karr, M. Konneke, M. Shin, T. J. Lawton, T. Lowe, W. Martens-Habbena, L. A. Sayavedra-Soto, D. Lang, S. M. Sievert, A. C. Rosenzweig, G. Manning, and D. A. Stahl. 2010. Nitrosopumilus maritimus genome reveals unique mechanisms for nitrification and autotrophy in globally distributed marine crenarchaea. Proc Natl Acad Sci U S A 107:8818-8823.
Weber, K. A., L. A. Achenbach, and J. D. Coates. 2006. Microorganisms pumping iron: anaerobic microbial iron oxidation and reduction. Nature Reviews Microbiology 4:752-764.
Westra, E. R., A. Buckling, and P. C. Fineran. 2014. CRISPR-Cas systems: beyond adaptive immunity. Nat Rev Microbiol 12:317-326.
Wharton, R. A., W. B. Lyons, and D. J. D. Marais. 1993. Stable isotopic biogeochemistry of carbon and nitrogen in a perennially ice-covered Antartic lake. Chemical Geology 107:159-172.
Bibliography 190
Wiedenbeck, J., and F. M. Cohan. 2011. Origins of bacterial diversity through horizontal genetic transfer and adaptation to new ecological niches. FEMS Microbiol Rev 35:957-976.
Woese, C. R., and G. E. Fox. 1977. Phylogenetic structure of the prokaryotic domain: the primary kingdoms. Proc Natl Acad Sci U S A 74:5088-5090.
Woese, C. R., O. Kandler, and M. L. Wheelis. 1990. Towards a natural system of organisms: proposal for the domains Archaea, Bacteria, and Eucarya. Proc Natl Acad Sci U S A 87:4576-4579.
Wozniak, R. A. F., and M. K. Waldor. 2010. Integrative and conjugative elements: mosaic mobile genetic elements enabling dynamic lateral gene flow. Nature Reviews Microbiology 8:552-563.
Wright, J. J., K. M. Konwar, and S. J. Hallam. 2012. Microbial ecology of expanding oxygen minimum zones. Nature Reviews Microbiology 10:381-394.
Wrighton, K. C., C. J. Castelle, M. J. Wilkins, L. A. Hug, I. Sharon, B. C. Thomas, K. M. Handley, S. W. Mullin, C. D. Nicora, A. Singh, M. S. Lipton, P. E. Long, K. H. Williams, and J. F. Banfield. 2014. Metabolic interdependencies between phylogenetically novel fermenters and respiratory organisms in an unconfined aquifer. Isme Journal 8:1452-1463.
Wrighton, K. C., B. C. Thomas, I. Sharon, C. S. Miller, C. J. Castelle, N. C. VerBerkmoes, M. J. Wilkins, R. L. Hettich, M. S. Lipton, K. H. Williams, P. E. Long, and J. F. Banfield. 2012. Fermentation, Hydrogen, and Sulfur Metabolism in Multiple Uncultivated Bacterial Phyla. Science 337:1661-1665.
Wu, X. A., S. Monchy, S. Taghavi, W. Zhu, J. Ramos, and D. van der Lelie. 2011. Comparative genomics and functional analysis of niche-specific adaptation in Pseudomonas putida. FEMS Microbiol Rev 35:299-323.
Xiang, S. R., T. C. Shang, Y. Chen, Z. F. Jing, and T. D. Yao. 2009. Dominant Bacteria and Biomass in the Kuytun 51 Glacier. Appl Environ Microbiol 75:7287-7290.
Yooseph, S., G. Sutton, D. B. Rusch, A. L. Halpern, S. J. Williamson, K. Remington, J. A. Eisen, K. B. Heidelberg, G. Manning, W. Z. Li, L. Jaroszewski, P. Cieplak, C. S. Miller, H. Y. Li, S. T. Mashiyama, M. P. Joachimiak, C. van Belle, J. M. Chandonia, D. A. Soergel, Y. F. Zhai, K. Natarajan, S. Lee, B. J. Raphael, V. Bafna, R. Friedman, S. E. Brenner, A. Godzik, D. Eisenberg, J. E. Dixon, S. S. Taylor, R. L. Strausberg, M. Frazier, and J. C. Venter. 2007. The Sorcerer II Global Ocean Sampling expedition: Expanding the universe of protein families. PLoS Biol 5:432-466.
Yurkov, V. V., and J. T. Beatty. 1998. Aerobic anoxygenic phototrophic bacteria. Microbiol Mol Biol Rev 62:695-724.
Bibliography 191
Zeder, M., S. Peter, T. Shabarova, and J. Pernthaler. 2009. A small population of planktonic Flavobacteria with disproportionally high growth during the spring phytoplankton bloom in a prealpine lake. Environ Microbiol 11:2676-2686.
Zeigler Allen, L., E. E. Allen, J. H. Badger, J. P. McCrow, I. T. Paulsen, L. D. Elbourne, M. Thiagarajan, D. B. Rusch, K. H. Nealson, S. J. Williamson, J. C. Venter, and A. E. Allen. 2012. Influence of nutrients and currents on the genomic composition of microbes across an upwelling mosaic. ISME J 6:1403-1414.
Zhang, X. F., T. D. Yao, L. D. Tian, S. J. Xu, and L. Z. An. 2008. Phylogenetic and physiological diversity of bacteria isolated from Puruogangri ice core. Microb Ecol 55:476-488.
Zhang, X. J., X. J. Ma, N. L. Wang, and T. D. Yao. 2009. New subgroup of Bacteroidetes and diverse microorganisms in Tibetan plateau glacial ice provide a biological record of environmental conditions. FEMS Microbiol Ecol 67:21-29.
Zwart, G., B. C. Crump, M. Agterveld, F. Hagen, and S. K. Han. 2002. Typical freshwater bacteria: an analysis of available 16S rRNA gene sequences from plankton of lakes and rivers. Aquatic Microbial Ecology 28:141-155.
Zwart, G., W. D. Hiorns, B. A. Methe, M. P. Van Agterveld, R. Huismans, S. C. Nold, J. P. Zehr, and H. J. Laanbroek. 1998. Nearly identical 16S rRNA sequences recovered from lakes in North America and Europe indicate the existence of clades of globally distributed freshwater bacteria. Systematic and Applied Microbiology 21:546-556.


Appendix A

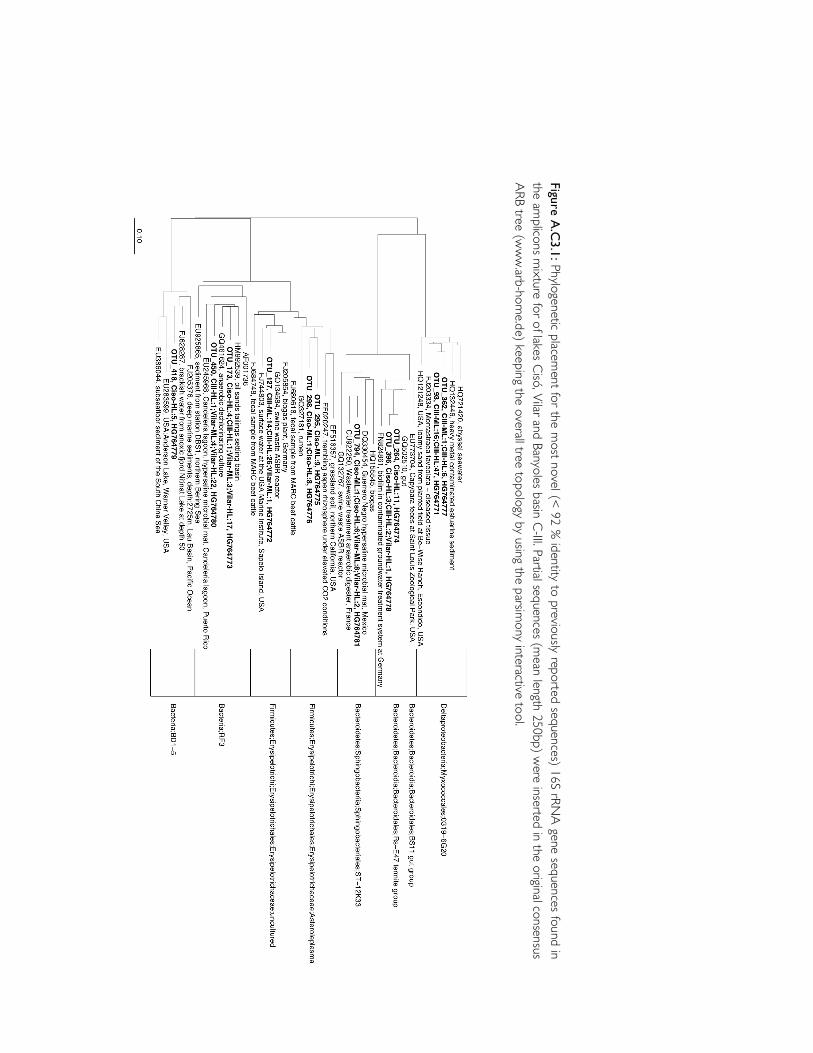
Figure A.C
3.1: Phylogenetic placement for the m
ost novel (< 92 % identity to previously reported sequences) 16S rRNA gene sequences found in
the amplicons m
ixture for of lakes Cisó, Vilar and Banyoles basin C-III. Partial sequences (mean length 250bp) were inserted in the original consensus
ARB tree (www.arb-home.de) keeping the overall tree topology by using the parsim
ony interactive tool.

Table A.C3.1: Specific taxonomic composition (Order level) of Bacteria (% relative abundance) surveyed by PCR-amplified 16S rRNA gene and 454-tag sequencing for Banyoles basin C-III, Lake Vilar, and Lake Cisó. ML: Metalimnion. HL: Hypolimnion.
Phylum/Class Order Cisó-ML
Cisó-HL
CIII-ML
CIII-HL
Vilar-ML
Vilar- HL
Acidobacteria Other 0.0 0.7 0.0 0.0 0.0 0.0 Actinobacteria
Acidimicrobiales 2.8 0.0 8.3 0.0 2.8 2.7 Frankiales 14.2 1.3 21.0 2.3 15.7 24.2 Micrococcales 21.3 3.7 0.0 0.0 3.2 1.7 Other 1.8 0.2 1.6 0.5 2.3 2.6
Alphaproteo-bacteria
Rickettsiales (SAR11) 0.0 0.0 15.7 0.0 18.5 20.5 Other 1.2 0.5 0.5 0.4 1.4 1.1
Bacteroidetes Bacteroidales 0.0 3.8 0.0 0.0 1.7 5.3 Flavobacteriales 4.4 0.0 3.5 0.0 12.0 1.4 Sphingobacteriales 4.0 9.3 5.8 1.0 4.9 3.0 Other 4.2 4.1 0.6 1.3 2.4 4.4
Betaproteo-bacteria
Burkholderiales 31.8 15.5 4.2 1.2 7.0 4.5 Hydrogenophilales 0.0 0.0 0.0 0.0 3.2 2.4 Methylophilales 3.7 0.0 1.4 0.0 2.2 1.9 Gallionellales 0.0 0.0 2.4 8.2 0.0 0.0 Rhodocyclales 0.0 0.0 0.0 0.0 3.9 5.2 Other 0.4 0.5 0.4 1.9 1.0 0.2
Chlorobi
Chlorobiales 1.1 3.7 23.7 67.6 0.0 0.0 Other 0.0 0.0 0.2 0.7 0.1 0.1
Chloroflexi
Anaerolineales 0.0 2.0 0.0 0.0 0.0 0.0 Other 0.2 0.9 1.3 0.9 0.6 1.5
Cyanobacteria Cyanobacteria 1.7 0.5 0.0 0.4 6.2 0.0 Synechococcus 0.0 0.0 1.1 0.0 0.0 0.0 Other 0.0 0.0 1.9 0.3 0.0 0.0
Deltaproteo-bacteria
Desulfobacterales 0.0 4.5 0.0 1.1 0.0 1.0 Desulfuromonadales 0.0 0.0 0.0 1.1 0.0 0.0 Myxococcales 0.0 0.0 0.0 0.0 1.1 0.0 Syntrophobacterales 0.0 16.0 0.0 1.2 0.0 0.0 Other 1.3 2.7 1.4 0.2 0.3 0.8
Epsilonproteo-bacteria
Campylobacterales 2.3 0.0 0.8 2.1 0.0 0.0 Other 0.0 0.3 0.0 0.0 0.0 0.0
Firmicutes Clostridiales 0.0 4.5 0.0 0.0 0.0 1.1 Erysipelotrichales 0.0 2.3 0.0 1.2 2.7 3.1 Other 0.6 0.0 0.8 0.4 0.2 0.0
Gammaproteo-bacteria
Aeromonadales 0.0 0.0 0.0 0.0 0.1 0.0 Chromatiales 1.6 12.2 0.0 0.0 1.0 0.0 Methylococcales 0.0 0.0 0.0 0.0 1.5 0.0 Pseudomonadales 0.0 0.0 0.0 0.0 0.0 3.6 Other 0.1 0.2 0.3 0.3 1.2 1.3
Spirochaetes Spirochaetales 0.0 3.2 0.0 0.0 0.0 1.7 Other 0.3 0.0 0.0 0.4 0.0 0.0
Tenericutes
Acholeplasmatales 0.0 3.0 0.0 0.0 0.0 0.0 Other 0.0 0.0 0.0 0.9 0.0 0.0
Verrucomicrobia Other 0.0 0.0 0.0 0.0 1.3 0.6 Other Other 0.3 0.9 1.3 0.6 0.4 0.6 Unclassified Unclassified 0.7 3.4 1.8 4.0 1.1 3.3

Table A
.C3.2: D
etailed information on the O
TUs placed in the highest novelty plot area with mean abundances >0.01% (Fig. 3.4).
!!OTU
C
isó M
L C
isóH
L C
III M
L C
III H
L Vilar M
L Vilar H
L Layer >80%
Abundance
CC
M
CEM
C
losest M
atch C
lassification
OTU_532
0 4
0 0
0 0
Hypolimnion
0.1-0.01 92.31
96.13 96.13
Acidobacteria Holophagae Holophagales Holophagaceae
OTU_416
0 5
0 0
0 0
Hypolimnion
0.1-0.01 84.53
93.41 93.41
Alphaproteobacteria Rickettsiales Candidatus
OTU_219
0 16
0 0
0 0
Hypolimnion
0.1-0.01 86.41
94.62 94.62
Alphaproteobacteria Rhodospirillales Rhodospirillaceae Thalassospira
OTU_398
0 9
0 0
0 0
Hypolimnion
0.1-0.01 87.86
91.4 91.4
Bacteroidetes Sphingobacteria Sphingobacteriales
OTU_283
0 10
0 0
0 0
Hypolimnion
0.1-0.01 88.1
91.86 91.86
Bacteroidetes Sphingobacteria Sphingobacteriales
OTU_522
0 4
0 0
0 0
Hypolimnion
0.1-0.01 86.96
94.07 94.07
Bacteroidetes Bacteroidia Bacteroidales Rikenellaceae
OTU_412
0 5
0 0
0 0
Hypolimnion
0.1-0.01 89.59
94.95 94.95
Bacteroidetes Sphingobacteria Sphingobacteriales W
CHB1-69

Tab
le A
.C3.
2: Continued
! !
OTU
C
isó
ML
Cis
óH
L C
III
ML
CIII
H
L Vi
lar
ML
Vila
r H
L La
yer
>80%
Ab
unda
nce
CC
M
CEM
C
lose
st
Mat
ch
Cla
ssifi
catio
n
OTU
_634
0
2 1
0 1
8 Hy
polim
nion
0.1-
0.01
95
.05
95.4
6 95
.46
Bact
eroid
etes
Ba
cter
oidia
Bact
eroid
ales
Porp
hyro
mon
adac
eae
OTU
_200
0
12
0 0
0 6
Hypo
limnio
n 0.
1-0.
01
86.2
8 96
.34
96.3
4 Ba
cter
oidet
es
Bact
eroid
ia Ba
cter
oidale
s FT
Lpos
t3
OTU
_647
0
7 0
0 0
0 Hy
polim
nion
0.1-
0.01
88
.73
96.7
4 96
.74
Bact
eroid
etes
Ba
cter
oidia
Bact
eroid
ales
Rike
nella
ceae
O
TU_4
91
0 0
0 4
0 0
Hypo
limnio
n 0.
1-0.
01
93.6
7 96
.04
96.0
4 Un
reso
lved
Beta
prot
eoba
cter
ia O
TU_9
39
0 0
0 0
0 3
Hypo
limnio
n 0.
1-0.
01
93.0
9 96
.05
96.0
5 Be
tapr
oteo
bact
eria
Rhod
ocyc
lales
Rh
odoc
yclac
eae
uncu
lture
d O
TU_4
43
0 5
0 0
0 0
Hypo
limnio
n 0.
1-0.
01
92.5
7 92
.88
92.8
8 Un
reso
lved
Chlor
oflex
i O
TU_1
82
0 11
1
4 0
0 Hy
polim
nion
0.1-
0.01
86
.35
94.8
5 94
.85
Chlor
oflex
i An
aero
linea
e An
aero
linea
les
Anae
rolin
eace
ae
OTU
_414
0
7 0
0 0
0 Hy
polim
nion
0.1-
0.01
89
.51
96.9
96
.9
Chlor
oflex
i An
aero
linea
e An
aero
linea
les
Anae
rolin
eace
ae

Tab
le A
.C3.
2: Continued
! !
OTU
C
isó
ML
Cis
óH
L C
III
ML
CIII
H
L Vi
lar
ML
Vila
r H
L La
yer
>80%
Ab
unda
nce
CC
M
CEM
C
lose
st
Mat
ch
Cla
ssifi
catio
n
OTU
_170
0
26
0 0
0 0
Hypo
limnio
n 0.
1-0.
01
81.5
91
.91
91.9
1 De
ltapr
oteo
bact
eria
Myx
ococ
cales
03
19-6
G20
O
TU_3
21
0 5
0 0
0 0
Hypo
limnio
n 0.
1-0.
01
90.1
9 92
.51
92.5
1 De
ltapr
oteo
bact
eria
Desu
lfoba
cter
ales
Desu
lfoba
cter
acea
e un
cultu
red
OTU
_330
1
6 0
0 0
0 Hy
polim
nion
0.1-
0.01
92
.64
93.3
2 93
.32
Delta
prot
eoba
cter
ia Sy
ntro
phob
acte
rales
Sy
ntro
phac
eae
Desu
lfom
onile
O
TU_4
97
0 4
0 0
0 0
Hypo
limnio
n 0.
1-0.
01
86.9
6 95
.67
95.6
7 De
ltapr
oteo
bact
eria
Sva0
485
OTU
_289
0
7 0
2 0
0 Hy
polim
nion
0.1-
0.01
85
.91
96.4
1 96
.41
Delta
prot
eoba
cter
ia M
yxoc
occa
les
0319
-6G
20
OTU
_415
0
5 0
0 0
0 Hy
polim
nion
0.1-
0.01
96
.89
96.8
9 96
.89
Delta
prot
eoba
cter
ia De
sulfu
rom
onad
ales
Geo
bact
erac
eae
Geo
bact
er
OTU
_469
0
0 0
4 0
0 Hy
polim
nion
0.1-
0.01
86
.59
95.9
95
.9
Elus
imicr
obia
OTU
_183
0
21
0 0
0 0
Hypo
limnio
n 0.
1-0.
01
89.7
5 92
.24
92.2
4 Fir
micu
tes
Clos
tridia
Clos
tridial
es
Veillo
nella
ceae
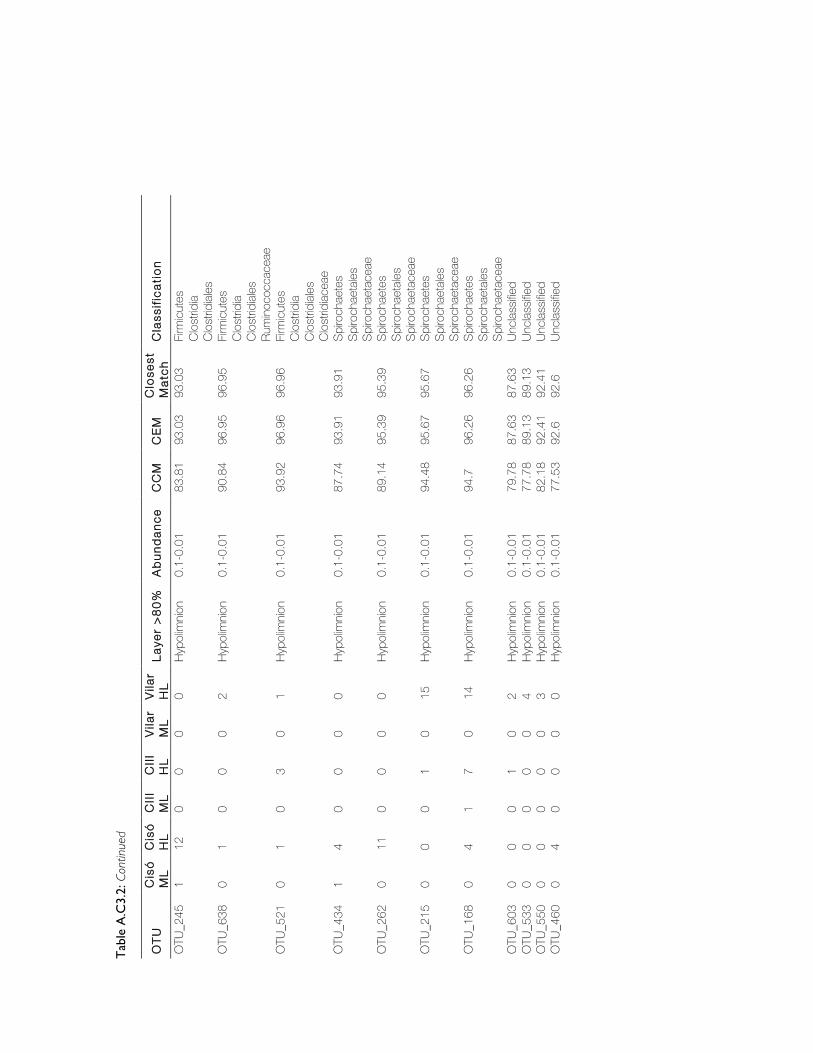
Tab
le A
.C3.
2: Continued
! !
OTU
C
isó
ML
Cis
óH
L C
III
ML
CIII
H
L Vi
lar
ML
Vila
r H
L La
yer
>80%
Ab
unda
nce
CC
M
CEM
C
lose
st
Mat
ch
Cla
ssifi
catio
n
OTU
_245
1
12
0 0
0 0
Hypo
limnio
n 0.
1-0.
01
83.8
1 93
.03
93.0
3 Fir
micu
tes
Clos
tridia
Clos
tridial
es
OTU
_638
0
1 0
0 0
2 Hy
polim
nion
0.1-
0.01
90
.84
96.9
5 96
.95
Firm
icute
s Cl
ostrid
ia Cl
ostrid
iales
Ru
mino
cocc
acea
e O
TU_5
21
0 1
0 3
0 1
Hypo
limnio
n 0.
1-0.
01
93.9
2 96
.96
96.9
6 Fir
micu
tes
Clos
tridia
Clos
tridial
es
Clos
tridiac
eae
OTU
_434
1
4 0
0 0
0 Hy
polim
nion
0.1-
0.01
87
.74
93.9
1 93
.91
Spiro
chae
tes
Spiro
chae
tales
Sp
iroch
aeta
ceae
O
TU_2
62
0 11
0
0 0
0 Hy
polim
nion
0.1-
0.01
89
.14
95.3
9 95
.39
Spiro
chae
tes
Spiro
chae
tales
Sp
iroch
aeta
ceae
O
TU_2
15
0 0
0 1
0 15
Hy
polim
nion
0.1-
0.01
94
.48
95.6
7 95
.67
Spiro
chae
tes
Spiro
chae
tales
Sp
iroch
aeta
ceae
O
TU_1
68
0 4
1 7
0 14
Hy
polim
nion
0.1-
0.01
94
.7
96.2
6 96
.26
Spiro
chae
tes
Spiro
chae
tales
Sp
iroch
aeta
ceae
O
TU_6
03
0 0
0 1
0 2
Hypo
limnio
n 0.
1-0.
01
79.7
8 87
.63
87.6
3 Un
class
ified
OTU
_533
0
0 0
0 0
4 Hy
polim
nion
0.1-
0.01
77
.78
89.1
3 89
.13
Uncla
ssifie
d O
TU_5
50
0 0
0 0
0 3
Hypo
limnio
n 0.
1-0.
01
82.1
8 92
.41
92.4
1 Un
class
ified
OTU
_460
0
4 0
0 0
0 Hy
polim
nion
0.1-
0.01
77
.53
92.6
92
.6
Uncla
ssifie
d

Tab
le A
.C3.
2: Continued
! !
OTU
C
isó
ML
Cis
óH
L C
III
ML
CIII
H
L Vi
lar
ML
Vila
r H
L La
yer
>80%
Ab
unda
nce
CC
M
CEM
C
lose
st
Mat
ch
Cla
ssifi
catio
n
OTU
_489
0
4 0
0 0
0 Hy
polim
nion
0.1-
0.01
80
.61
92.7
5 92
.75
Uncla
ssifie
d O
TU_3
74
0 0
1 5
0 0
Hypo
limnio
n 0.
1-0.
01
78.2
8 93
.45
93.4
5 Un
class
ified
OTU
_208
0
1 3
3 2
16
Hypo
limnio
n 0.
1-0.
01
80.5
8 94
.23
94.2
3 Un
class
ified
OTU
_164
0
5 1
3 1
18
Hypo
limnio
n 0.
1-0.
01
88.9
2 94
.32
94.3
2 Un
class
ified
OTU
_475
0
0 0
0 0
4 Hy
polim
nion
0.1-
0.01
86
.33
94.3
7 94
.37
Uncla
ssifie
d O
TU_2
96
0 9
0 0
0 0
Hypo
limnio
n 0.
1-0.
01
79.5
5 94
.7
94.7
Un
class
ified
OTU
_602
0
1 0
0 0
2 Hy
polim
nion
0.1-
0.01
78
.46
94.8
94
.8
Uncla
ssifie
d O
TU_3
39
0 7
1 5
1 9
Hypo
limnio
n 0.
1-0.
01
82.9
3 95
.71
95.7
1 Un
class
ified
OTU
_304
0
9 0
0 0
0 Hy
polim
nion
0.1-
0.01
84
.71
96.1
2 96
.12
Uncla
ssifie
d O
TU_4
18
0 5
0 0
0 0
Hypo
limnio
n 0.
1-0.
01
75.4
5 88
.43
88.4
3 Un
class
ified
OTU
_173
0
4 0
1 3
17
Hypo
limnio
n 0.
1-0.
01
84.3
8 92
.13
92.1
3 Un
class
ified
OTU
_362
0
0 1
6 0
0 Hy
polim
nion
0.1-
0.01
84
.39
89.5
4 89
.54
Uncla
ssifie
d O
TU_2
98
1 8
0 0
0 0
Hypo
limnio
n 0.
1-0.
01
84.9
4 86
.04
86.0
4 Un
class
ified
OTU
_396
0
3 0
2 0
1 Hy
polim
nion
0.1-
0.01
86
.03
88.3
3 88
.33
Uncla
ssifie
d O
TU_2
64
0 11
0
0 0
0 Hy
polim
nion
0.1-
0.01
86
.59
88.8
1 88
.81
Uncla
ssifie
d O
TU_1
23
1 51
0
0 0
0 Hy
polim
nion
1-0.
1 90
.67
92.7
5 92
.75
Delta
prot
eoba
cter
ia De
sulfo
bact
erale
s De
sulfo
bact
erac
eae
uncu
lture
d O
TU_7
1 4
145
1 11
0
0 Hy
polim
nion
1-0.
1 92
.51
94.6
5 94
.65
Firm
icute
s Cl
ostrid
ia Cl
ostrid
iales
Fa
mily
O
TU_1
59
23
264
0 0
0 0
Hypo
limnio
n 1-
0.1
96.4
96
.4
96.4
G
amm
apro
teob
acte
ria
Chro
mat
iales
Ch
rom
atiac
eae
OTU
_450
0
0 0
1 4
22
Hypo
limnio
n 1-
0.1
83.6
4 91
.46
91.4
6 Un
class
ified
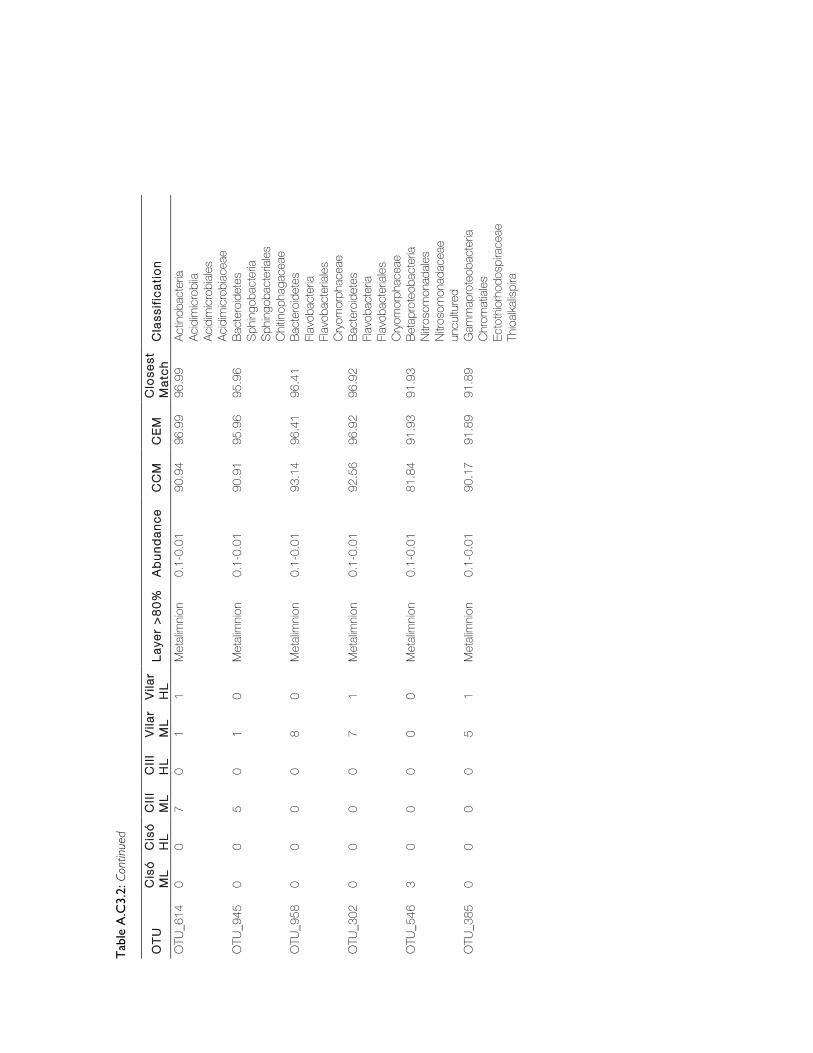
Tab
le A
.C3.
2: Continued
! !
OTU
C
isó
ML
Cis
óH
L C
III
ML
CIII
H
L Vi
lar
ML
Vila
r H
L La
yer
>80%
Ab
unda
nce
CC
M
CEM
C
lose
st
Mat
ch
Cla
ssifi
catio
n
OTU
_614
0
0 7
0 1
1 M
etali
mnio
n 0.
1-0.
01
90.9
4 96
.99
96.9
9 Ac
tinob
acte
ria
Acidi
micr
obiia
Ac
idim
icrob
iales
Ac
idim
icrob
iacea
e O
TU_9
45
0 0
5 0
1 0
Met
alim
nion
0.1-
0.01
90
.91
95.9
6 95
.96
Bact
eroid
etes
Sp
hingo
bact
eria
Sphin
goba
cter
iales
Ch
itinop
haga
ceae
O
TU_9
58
0 0
0 0
8 0
Met
alim
nion
0.1-
0.01
93
.14
96.4
1 96
.41
Bact
eroid
etes
Fla
voba
cter
ia Fla
voba
cter
iales
Cr
yom
orph
acea
e O
TU_3
02
0 0
0 0
7 1
Met
alim
nion
0.1-
0.01
92
.56
96.9
2 96
.92
Bact
eroid
etes
Fla
voba
cter
ia Fla
voba
cter
iales
Cr
yom
orph
acea
e O
TU_5
46
3 0
0 0
0 0
Met
alim
nion
0.1-
0.01
81
.84
91.9
3 91
.93
Beta
prot
eoba
cter
ia Ni
troso
mon
adale
s Ni
troso
mon
adac
eae
uncu
lture
d O
TU_3
85
0 0
0 0
5 1
Met
alim
nion
0.1-
0.01
90
.17
91.8
9 91
.89
Gam
map
rote
obac
teria
Ch
rom
atial
es
Ecto
thior
hodo
spira
ceae
Th
ioalka
lispi
ra
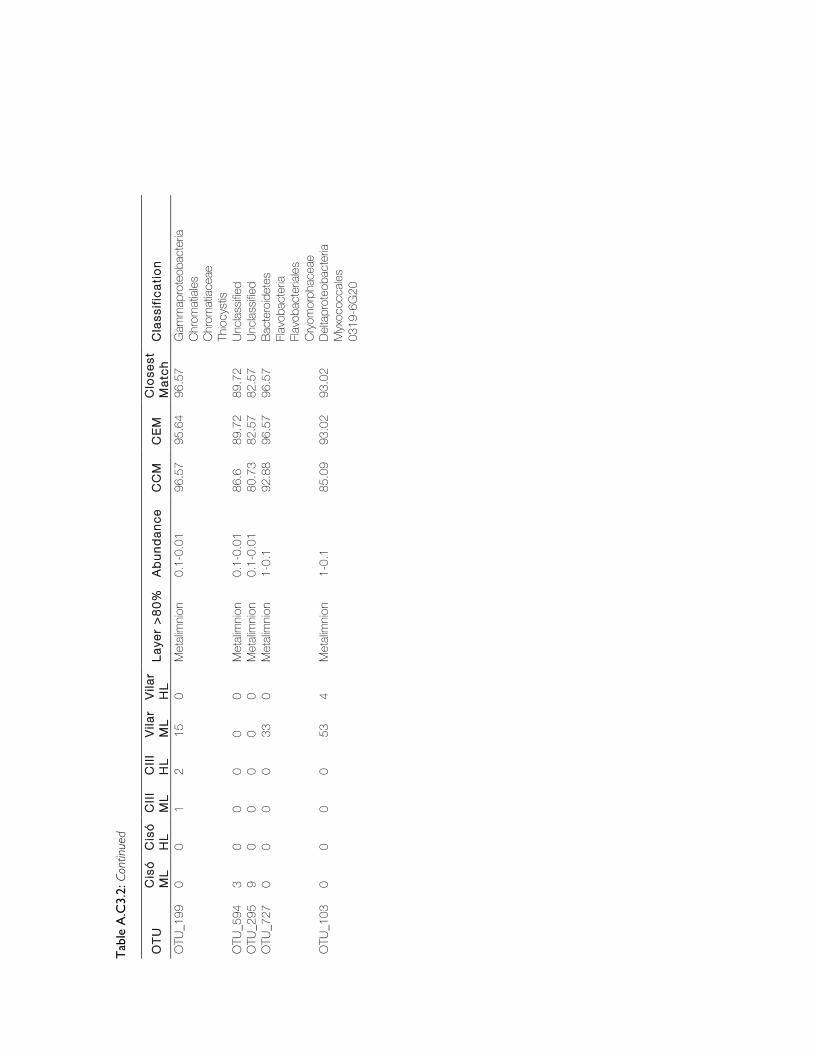
Tab
le A
.C3.
2: Continued
! !
OTU
C
isó
ML
Cis
óH
L C
III
ML
CIII
H
L Vi
lar
ML
Vila
r H
L La
yer
>80%
Ab
unda
nce
CC
M
CEM
C
lose
st
Mat
ch
Cla
ssifi
catio
n
OTU
_199
0
0 1
2 15
0
Met
alim
nion
0.1-
0.01
96
.57
95.6
4 96
.57
Gam
map
rote
obac
teria
Ch
rom
atial
es
Chro
mat
iacea
e Th
iocys
tis
OTU
_594
3
0 0
0 0
0 M
etali
mnio
n 0.
1-0.
01
86.6
89
.72
89.7
2 Un
class
ified
OTU
_295
9
0 0
0 0
0 M
etali
mnio
n 0.
1-0.
01
80.7
3 82
.57
82.5
7 Un
class
ified
OTU
_727
0
0 0
0 33
0
Met
alim
nion
1-0.
1 92
.88
96.5
7 96
.57
Bact
eroid
etes
Fla
voba
cter
ia Fla
voba
cter
iales
Cr
yom
orph
acea
e O
TU_1
03
0 0
0 0
53
4 M
etali
mnio
n 1-
0.1
85.0
9 93
.02
93.0
2 De
ltapr
oteo
bact
eria
Myx
ococ
cales
03
19-6
G20
!

Figure A.C4.1: Comparison of the phylogenetic composition (phylum level) for the metagenomics reads found in each size fraction (3, 0.8, and 0.1 µm). Very similar composition was observed among the differents fractions.
Figure A.C4.2: Vertical distributions of ammonium, nitrate and nitrite in Lake Banyoles basin C-III.
1e+01
1e+02
1e+03
1e+04
1e+05
1e+01 1e+02 1e+03 1e+04 1e+05
0.8 µm
0.1
µm
1e+01
1e+02
1e+03
1e+04
1e+05
1e+01 1e+02 1e+03 1e+04 1e+05
3.0 µm
0.1
µm
1e+01
1e+02
1e+03
1e+04
1e+05
1e+01 1e+02 1e+03 1e+04 1e+05
3.0 µm
0.8
µm
Metagenomics phyla (size fraction comparison of reads abundance)
1:1 1:1 1:1
Ammonia (µM)0 10 20 30 40 50 60
Dep
th (m
)
0
5
10
15
20
25
Nitrite, Nitrate (µM)0 5 10 15 20
NH4+
NO2–
NO3–
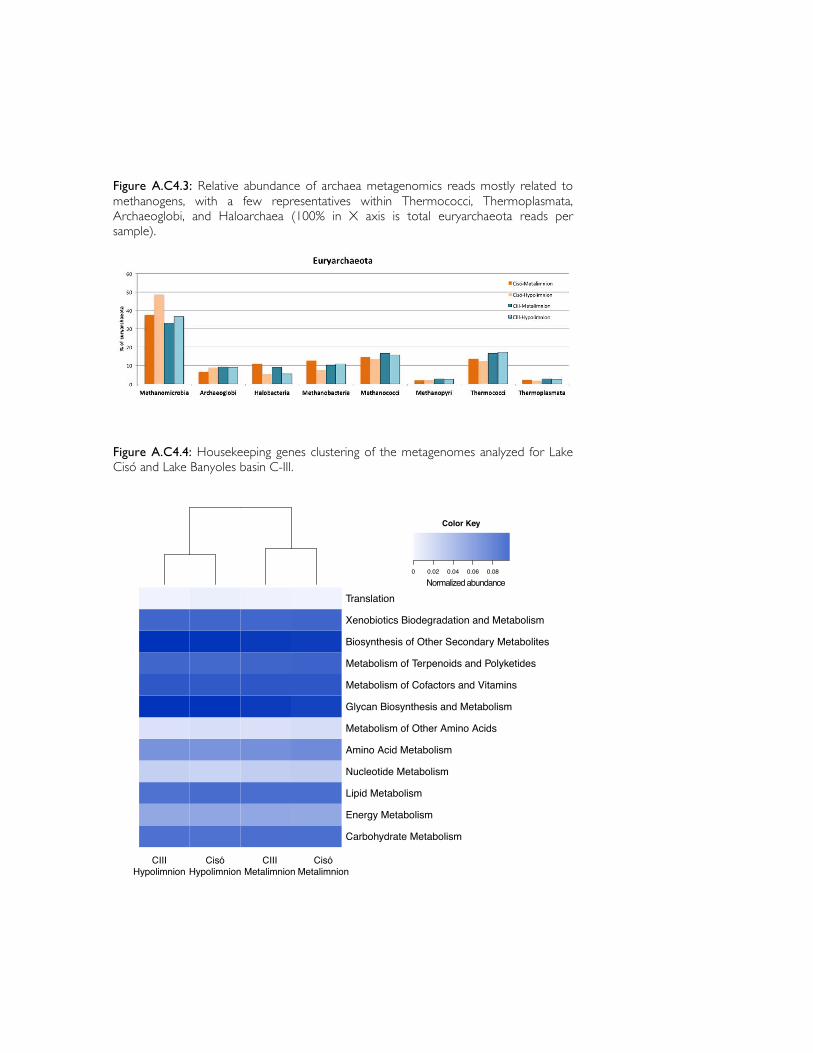
Figure A.C4.3: Relative abundance of archaea metagenomics reads mostly related to methanogens, with a few representatives within Thermococci, Thermoplasmata, Archaeoglobi, and Haloarchaea (100% in X axis is total euryarchaeota reads per sample).
Figure A.C4.4: Housekeeping genes clustering of the metagenomes analyzed for Lake Cisó and Lake Banyoles basin C-III.
Carbohydrate Metabolism
Energy Metabolism
Lipid Metabolism
Nucleotide Metabolism
Amino Acid Metabolism
Metabolism of Other Amino Acids
Glycan Biosynthesis and Metabolism
Metabolism of Cofactors and Vitamins
Metabolism of Terpenoids and Polyketides
Biosynthesis of Other Secondary Metabolites
Xenobiotics Biodegradation and Metabolism
Translation
0 0.02 0.04 0.06 0.08
Normalized abundance
Color Key
CisóMetalimnion
CIIIMetalimnion
CIIIHypolimnion
CisóHypolimnion

Table A.C4.1: Detailed list of the marker genes used in the present work for the carbon, nitrogen and sulfur cycles in for Banyoles basin C-III and Lake Cisó. !
Cycle Step KEGG Gene
CAR
BON
Aerobic C f ixat ion*(Calvin cycle) (K00855+K01602)/2
K00855 phosphoribulokinase K01602 RuBisCO small chain
Aerobic CH4 oxidat ion K08684 methane monooxygenase Aerobic respirat ion (K02256+K02262)/2 +(K02274+K02276)/2
K02256 cytochrome c oxidase subunit I (coxI)
K02262 cytochrome c oxidase subunit III (coxIII)
K02274 cytochrome c oxidase subunit I (coxA)
K02276 cytochrome c oxidase subunit III (coxC)
Anaerobic C f ixat ion (Arnon:K00174,K00175, K00244,K01648. Reductive Acetil-CoA: K00194,K00197) (K00174+K00175+K00244+K01648)/4+(K00194 +K00197)/2
K00174 2-oxoglutarate:ferredoxin oxidoreductase subunit alpha
K00175 2-oxoglutarate:ferredoxin oxidoreductase subunit beta
K00244 frdA; fumarate reductase flavoprotein subunit
K01648 adenosinetriphosphate (ATP) citrate lyase
K00194 CO dehydrogenase subunit delta
K00197 CO dehydrogenase subunit gamma
CO oxidat ion (K03518+K03519+K03520)/3
K03518 CO dehydrogenase small subunit (coxS)
K03519 cutM, coxM; carbon-monoxide dehydrogenase medium subunit
K03520 cutL, coxL; carbon-monoxide dehydrogenase large subunit
Fermentat ion K00016 L-lactate dehydrogenase Methanogenesis (K00400+K00401)/2 K00400 coenzyme M methyl reductase
beta subunit (mcrB)
K00401 methyl coenzyme M reductase system, component A2
NIT
ROG
EN
Ammonif icat ion K05904+K03385 K03385
formate-dependent nitrite reductase periplasmic cytochrome c552 (nrfA)
K05904 cytochrome c nitrite reductase (nrfA)
Anammox (SRAO) K10535
hydroxylamine oxidoreductase/hydrazine oxidoreducatse (hao/hzo)
Denit r i f icat ion (K02305+K04561+K00376)/3
K00376 nitrous oxide reductase (nosZ) K02305 nitric-oxide reductase (norC) K04561 nitric-oxide reductase (norB)
Nit rate reduct ion + Nit r i te oxidat ion (K00370+K00371)/2
K00370 nitrate reductase alpha & nitrite oxidoreductase (narG/nxrA)
K00371 nitrate reductase beta & nitrite oxidoreductase (narH/nxrB)
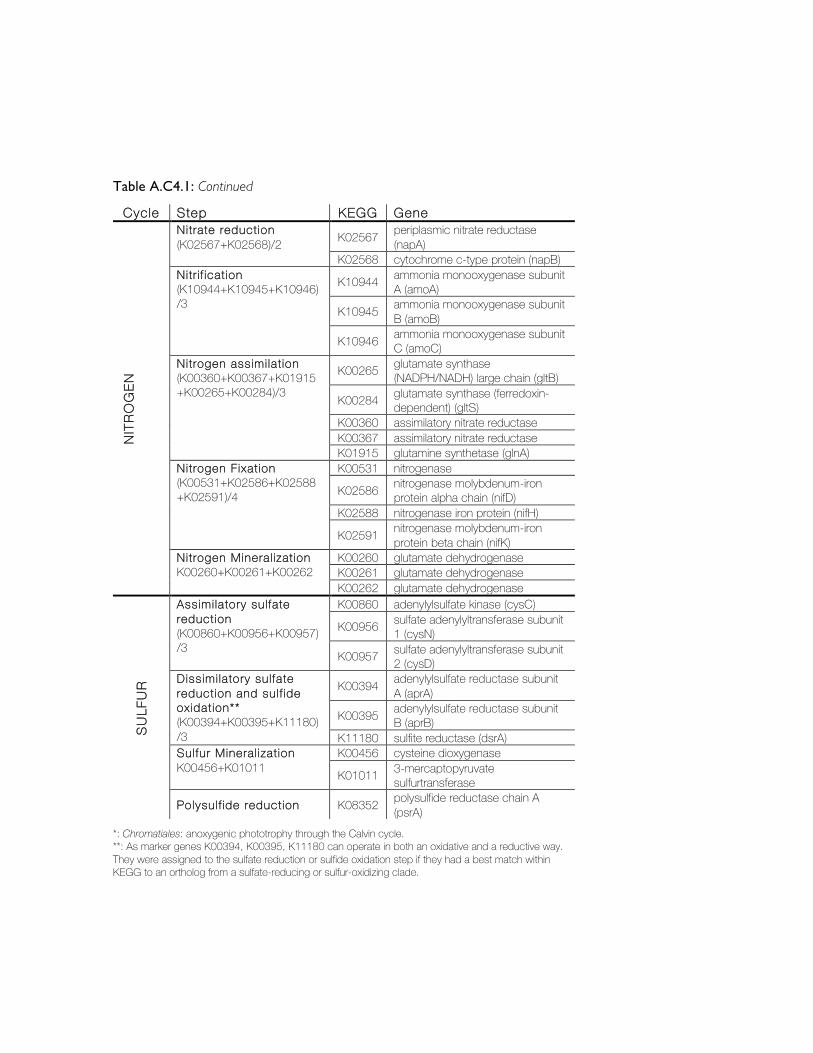
Table A.C4.1: Continued !
Cycle Step KEGG Gene
NIT
ROG
EN
N i t rate reduct ion (K02567+K02568)/2 K02567 periplasmic nitrate reductase
(napA) K02568 cytochrome c-type protein (napB)
Nit r i f icat ion (K10944+K10945+K10946)/3
K10944 ammonia monooxygenase subunit A (amoA)
K10945 ammonia monooxygenase subunit B (amoB)
K10946 ammonia monooxygenase subunit C (amoC)
Nit rogen assimi lat ion (K00360+K00367+K01915+K00265+K00284)/3
K00265 glutamate synthase (NADPH/NADH) large chain (gltB)
K00284 glutamate synthase (ferredoxin-dependent) (gltS)
K00360 assimilatory nitrate reductase K00367 assimilatory nitrate reductase K01915 glutamine synthetase (glnA)
Nit rogen Fixat ion (K00531+K02586+K02588+K02591)/4
K00531 nitrogenase
K02586 nitrogenase molybdenum-iron protein alpha chain (nifD)
K02588 nitrogenase iron protein (nifH)
K02591 nitrogenase molybdenum-iron protein beta chain (nifK)
Nit rogen Mineral izat ion K00260+K00261+K00262
K00260 glutamate dehydrogenase K00261 glutamate dehydrogenase K00262 glutamate dehydrogenase
SULF
UR
Assimi latory sul fate reduct ion (K00860+K00956+K00957)/3
K00860 adenylylsulfate kinase (cysC)
K00956 sulfate adenylyltransferase subunit 1 (cysN)
K00957 sulfate adenylyltransferase subunit 2 (cysD)
Dissimi latory sul fate reduct ion and sul f ide oxidat ion** (K00394+K00395+K11180)/3
K00394 adenylylsulfate reductase subunit A (aprA)
K00395 adenylylsulfate reductase subunit B (aprB)
K11180 sulfite reductase (dsrA) Sul fur Mineral izat ion K00456+K01011
K00456 cysteine dioxygenase
K01011 3-mercaptopyruvate sulfurtransferase
Polysul f ide reduct ion K08352 polysulfide reductase chain A (psrA)
*: Chromatiales: anoxygenic phototrophy through the Calvin cycle. **: As marker genes K00394, K00395, K11180 can operate in both an oxidative and a reductive way. They were assigned to the sulfate reduction or sulfide oxidation step if they had a best match within KEGG to an ortholog from a sulfate-reducing or sulfur-oxidizing clade.
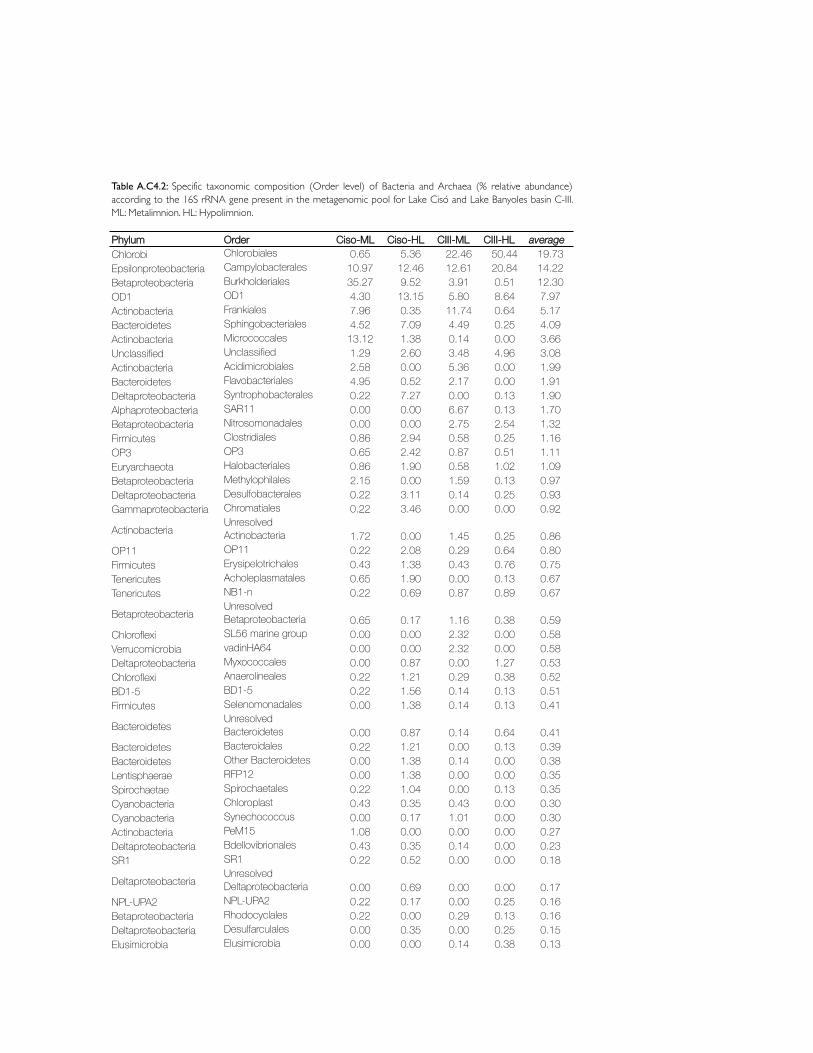
Phylum Order Ciso-ML Ciso-HL CIII-ML CIII-HL averageChlorobi Chlorobiales 0.65 5.36 22.46 50.44 19.73Epsilonproteobacteria Campylobacterales 10.97 12.46 12.61 20.84 14.22Betaproteobacteria Burkholderiales 35.27 9.52 3.91 0.51 12.30OD1 OD1 4.30 13.15 5.80 8.64 7.97Actinobacteria Frankiales 7.96 0.35 11.74 0.64 5.17Bacteroidetes Sphingobacteriales 4.52 7.09 4.49 0.25 4.09Actinobacteria Micrococcales 13.12 1.38 0.14 0.00 3.66Unclassified Unclassified 1.29 2.60 3.48 4.96 3.08Actinobacteria Acidimicrobiales 2.58 0.00 5.36 0.00 1.99Bacteroidetes Flavobacteriales 4.95 0.52 2.17 0.00 1.91Deltaproteobacteria Syntrophobacterales 0.22 7.27 0.00 0.13 1.90Alphaproteobacteria SAR11 0.00 0.00 6.67 0.13 1.70Betaproteobacteria Nitrosomonadales 0.00 0.00 2.75 2.54 1.32Firmicutes Clostridiales 0.86 2.94 0.58 0.25 1.16OP3 OP3 0.65 2.42 0.87 0.51 1.11Euryarchaeota Halobacteriales 0.86 1.90 0.58 1.02 1.09Betaproteobacteria Methylophilales 2.15 0.00 1.59 0.13 0.97Deltaproteobacteria Desulfobacterales 0.22 3.11 0.14 0.25 0.93Gammaproteobacteria Chromatiales 0.22 3.46 0.00 0.00 0.92
ActinobacteriaUnresolved Actinobacteria 1.72 0.00 1.45 0.25 0.86
OP11 OP11 0.22 2.08 0.29 0.64 0.80Firmicutes Erysipelotrichales 0.43 1.38 0.43 0.76 0.75Tenericutes Acholeplasmatales 0.65 1.90 0.00 0.13 0.67Tenericutes NB1-n 0.22 0.69 0.87 0.89 0.67
BetaproteobacteriaUnresolved Betaproteobacteria 0.65 0.17 1.16 0.38 0.59
Chloroflexi SL56 marine group 0.00 0.00 2.32 0.00 0.58Verrucomicrobia vadinHA64 0.00 0.00 2.32 0.00 0.58Deltaproteobacteria Myxococcales 0.00 0.87 0.00 1.27 0.53Chloroflexi Anaerolineales 0.22 1.21 0.29 0.38 0.52BD1-5 BD1-5 0.22 1.56 0.14 0.13 0.51Firmicutes Selenomonadales 0.00 1.38 0.14 0.13 0.41
BacteroidetesUnresolved Bacteroidetes 0.00 0.87 0.14 0.64 0.41
Bacteroidetes Bacteroidales 0.22 1.21 0.00 0.13 0.39Bacteroidetes Other Bacteroidetes 0.00 1.38 0.14 0.00 0.38Lentisphaerae RFP12 0.00 1.38 0.00 0.00 0.35Spirochaetae Spirochaetales 0.22 1.04 0.00 0.13 0.35Cyanobacteria Chloroplast 0.43 0.35 0.43 0.00 0.30Cyanobacteria Synechococcus 0.00 0.17 1.01 0.00 0.30Actinobacteria PeM15 1.08 0.00 0.00 0.00 0.27Deltaproteobacteria Bdellovibrionales 0.43 0.35 0.14 0.00 0.23SR1 SR1 0.22 0.52 0.00 0.00 0.18
DeltaproteobacteriaUnresolved Deltaproteobacteria 0.00 0.69 0.00 0.00 0.17
NPL-UPA2 NPL-UPA2 0.22 0.17 0.00 0.25 0.16Betaproteobacteria Rhodocyclales 0.22 0.00 0.29 0.13 0.16Deltaproteobacteria Desulfarculales 0.00 0.35 0.00 0.25 0.15Elusimicrobia Elusimicrobia 0.00 0.00 0.14 0.38 0.13
Table A.C4.2: Specific taxonomic composition (Order level) of Bacteria and Archaea (% relative abundance)according to the 16S rRNA gene present in the metagenomic pool for Lake Cisó and Lake Banyoles basin C-III.ML: Metalimnion. HL: Hypolimnion.

Phylum Order Ciso-ML Ciso-HL CIII-ML CIII-HL average
Table A.C4.2: Continued
Actinobacteria Gaiellales 0.00 0.52 0.00 0.00 0.13
LentisphaeraeUnresolved Lentisphaerae 0.00 0.52 0.00 0.00 0.13
Verrucomicrobia Chthoniobacterales 0.00 0.52 0.00 0.00 0.13TM7 TM7 0.00 0.52 0.00 0.00 0.13Euryarchaeota Methanomicrobiales 0.00 0.52 0.00 0.00 0.13Gammaproteobacteria Legionellales 0.22 0.17 0.00 0.13 0.13Deltaproteobacteria Sva0485 0.00 0.35 0.14 0.00 0.12OP8 OP8 0.00 0.35 0.14 0.00 0.12Chlorobi Ignavibacteriales 0.00 0.17 0.29 0.00 0.12Fibrobacteres Fibrobacteria 0.00 0.17 0.14 0.13 0.11Chloroflexi Unresolved Chloroflexi 0.00 0.00 0.43 0.00 0.11Alphaproteobacteria Rhodobacterales 0.43 0.00 0.00 0.00 0.11Lentisphaerae WCHB1-41 0.00 0.17 0.00 0.25 0.11Alphaproteobacteria Rhizobiales 0.22 0.17 0.00 0.00 0.10Deltaproteobacteria Desulfuromonadales 0.00 0.00 0.00 0.38 0.10Planctomycetes Phycisphaerae 0.00 0.35 0.00 0.00 0.09Betaproteobacteria Hydrogenophilales 0.22 0.00 0.00 0.13 0.09Lentisphaerae Victivallales 0.00 0.17 0.14 0.00 0.08Planctomycetes Planctomycetales 0.00 0.17 0.14 0.00 0.08Fusobacteria Fusobacteriales 0.00 0.17 0.00 0.13 0.08
AlphaproteobacteriaUnresolved Alphaproteobacteria 0.00 0.00 0.29 0.00 0.07
Gammaproteobacteria Pseudomonadales 0.00 0.00 0.29 0.00 0.07Gemmatimonadetes Gemmatimonadales 0.00 0.00 0.14 0.13 0.07Planctomycetes vadinHA49 0.00 0.00 0.14 0.13 0.07Actinobacteria Propionibacteriales 0.22 0.00 0.00 0.00 0.05Gammaproteobacteria Thiotrichales 0.22 0.00 0.00 0.00 0.05Bacteroidetes Cytophagales 0.22 0.00 0.00 0.00 0.05TM6 TM6 0.22 0.00 0.00 0.00 0.05
AcidobacteriaUnresolved Acidobacteria 0.00 0.17 0.00 0.00 0.04
Actinobacteria Corynebacteriales 0.00 0.17 0.00 0.00 0.04Alphaproteobacteria Rickettsiales 0.00 0.17 0.00 0.00 0.04Deltaproteobacteria 43F-1404R 0.00 0.17 0.00 0.00 0.04Deltaproteobacteria Desulfovibrionales 0.00 0.17 0.00 0.00 0.04Cyanobacteria Gastranaerophilales 0.00 0.17 0.00 0.00 0.04BRC1 BRC3 0.00 0.17 0.00 0.00 0.04TA06 TA08 0.00 0.17 0.00 0.00 0.04Euryarchaeota Methanobacteriales 0.00 0.17 0.00 0.00 0.04Euryarchaeota Thermoplasmatales 0.00 0.17 0.00 0.00 0.04Alphaproteobacteria Caulobacterales 0.00 0.00 0.14 0.00 0.04Gammaproteobacteria Xanthomonadales 0.00 0.00 0.14 0.00 0.04Verrucomicrobia Opitutales 0.00 0.00 0.14 0.00 0.04WS6 WS8 0.00 0.00 0.14 0.00 0.04Alphaproteobacteria Rhodospirillales 0.00 0.00 0.00 0.13 0.03Alphaproteobacteria Sphingomonadales 0.00 0.00 0.00 0.13 0.03Lentisphaerae MSBL3 0.00 0.00 0.00 0.13 0.03Verrucomicrobia OPB35 0.00 0.00 0.00 0.13 0.03

Table A.C4.3: Relative abundance of marker genes related to carbon, nitrogen and sulfur cycling as a proxy of the potential in situ relevance of the metabolic pathways. ML: Metalimnion. HL: Hypolimnion.
Cycle Process Cisó-ML %
Cisó-HL %
CIII-ML %
CIII-HL %
CARB
ON
Aerobic C fixation 5.6 3.9 2.0 1.6 Aerobic CH4 oxidation 7.9 0.0 0.8 0.5 Aerobic respiration 58.5 20.2 50.5 9.0 Anaerobic C fixation 8.8 48.0 33.7 82.0 CO oxidation 8.0 20.3 12.0 4.3 Fermentation 11.2 7.0 1.0 2.5 Methanogenesis 0.0 0.6 0.0 0.0
NITR
OG
EN
Ammonification 1.7 8.1 0.5 2.6 Anammox (SRAO) 0.0 5.5 0.3 0.3 Denitrification 1.8 2.7 2.3 4.6 Nitrate reduction + Nitrite oxidation (NarGH/NxrAB) 3.5 5.2 1.8 1.5
Nitrate reduction 1.8 3.6 2.6 6.5 Nitrification 0.0 0.0 0.0 0.0 Nitrogen assimilation 63.6 25.5 42.5 36.1 Nitrogen Fixation 1.1 10.7 8.1 25.8 Nitrogen Mineralization 26.5 38.8 41.9 22.6
SULF
UR
Assimilatory sulfate reduction 26.5 26.9 39.9 18.1 Sulfur Mineralization 71.5 18.2 34.1 16.8 Sulfur oxidation 0.4 5.6 16.6 41.8 Dissimilatory sulfate reduction 0.7 15.6 0.9 2.7 Polysilfide reduction 1.0 33.8 8.5 20.6
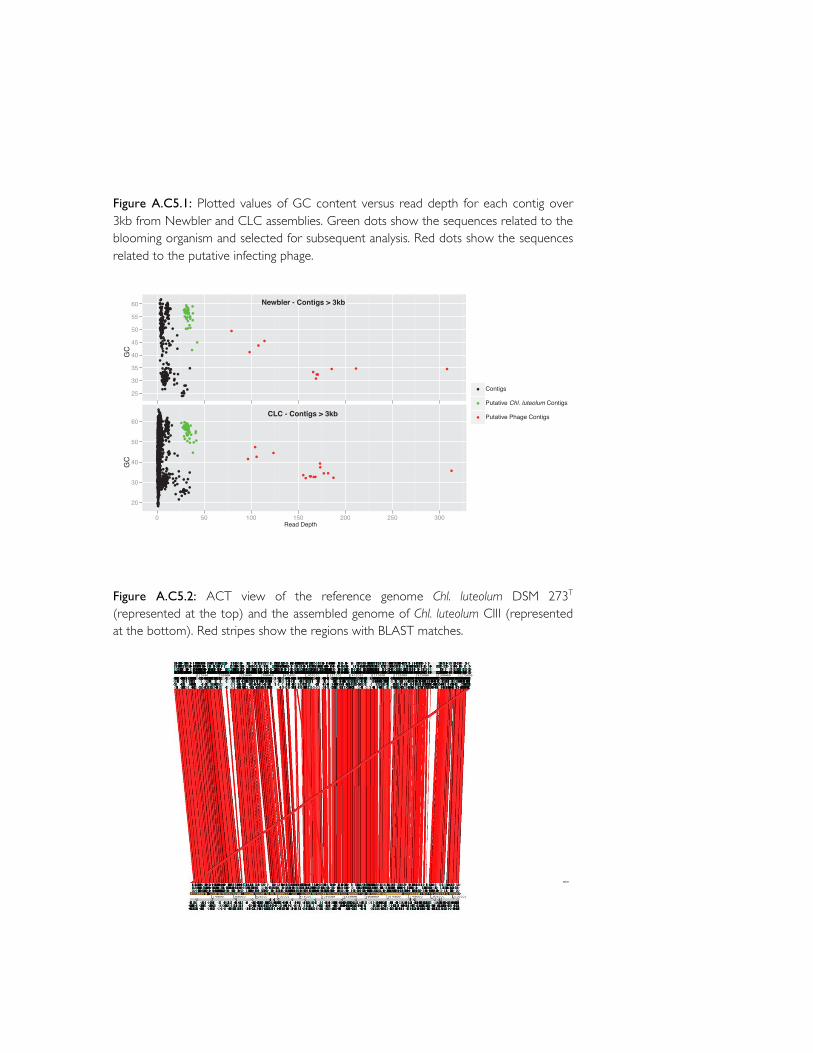
Figure A.C5.1: Plotted values of GC content versus read depth for each contig over 3kb from Newbler and CLC assemblies. Green dots show the sequences related to the blooming organism and selected for subsequent analysis. Red dots show the sequences related to the putative infecting phage.
Figure A.C5.2: ACT view of the reference genome Chl. luteolum DSM 273T (represented at the top) and the assembled genome of Chl. luteolum CIII (represented at the bottom). Red stripes show the regions with BLAST matches.
Read Depth
GC
20
30
40
50
60
0 50 100 150 200 250 300
Contigs
Putative Chl. luteolum Contigs
Putative Phage ContigsCLC - Contigs > 3kb
GC
25
30
35
40
45
50
55
60 Newbler - Contigs > 3kb

Figure A.C5.3: Whole genome alignments of Chlorobi genomes: a) I. album, b) Chp. thalassium ATCC 35110, c) Chl. chlorochromatii CaD3, d) Ptc. phaeum CIB 2401, e) Ptc. aestuarii DSM 271, f) Ptc. phaeobacteroides BS1, g) Cba. parvum NCIB 8327, h) Cba. limnaeum DSM 1677, i) Cba. tepidum TLS, j) Chl. ferrooxidans DSM 13101, k) Chl. clathratiforme DSM 5477, l) Chl. phaeobacteroides DSM 266, m) Chl. limicola DSM 245, n) Chl. phaeovibrioides DSM 265, o) Chl. luteoulm DSM 273T, p) Chl. luteolum CIII. The dots show the conserved regions after BLAST analysis of each sequence versus the others. The green square marks both strains of Chl. luteolum whilst the orange square marks the three strains within the genus Chlorobaculum.

Figure A.C5.4: Maximum likelihood phylogeny with RAxML of the FeoB (Ferrous iron transport protein B). The red squares mark the two cluster forming each FeoB form in GSB. FeoB sequences related to Chl. luteolum sp. are in bold.
NP_907576.1 Wolinella succinogenes DSM1740
YP_394270.1 Sulfurimonas denitrificans DSM1251
EAL56293.1 Campylobacter coli RM2228
NP_907159.1 Wolinella succinogenes DSM1740
FeoB Chlorobium phaeobacteroides BS1
FeoB Prosthecochloris aestuarii DSM271
FeoB Chlorobaculum tepidum TLS
FeoB Chlorobaculum parvum NCIB8327
FeoB Chlorobium phaeobacteroides DSM266
FeoB Chlorobium limicola DSM245
FeoB Chlorobium chlorochromatii CaD3
FeoB Chlorobium clathratiforme DSM5477
FeoB Chlorobium ferrooxidans DSM13031
FeoB Chlorobium luteolum DSM 273
FeoB Chlorobium luteolum CIII - ORF 2026
FeoB Chlorobium phaeovibrioides DSM265
NP_903223.1 Chromobacterium violaceum ATCC12472
NP_814259.1 Enterococcus faecalis V583
NP_462409.1 Salmonella enterica Typhimurium LT2
FeoB Chlorobium phaeobacteroides BS1
FeoB Chlorobium limicola DSM245
FeoB Chlorobaculum parvum NCIB8327
FeoB Chlorobaculum tepidum TLS
FeoB Chlorobium phaeobacteroides DSM266
FeoB Chlorobium phaeovibrioides DSM265
FeoB Chlorobium luteolum CIII - ORF 681
YP_351866.1 Rhodobacter sphaeroides 2.4.1
EGJ23273.1 Rhodobacter sphaeroides WS8N
YP_002524484.1 Rhodobacter sphaeroides KD131
YP_001042353.1 Rhodobacter sphaeroides ATCC17029
YP_001170015.1 Rhodobacter sphaeroides ATCC17025
YP_002799439.1 Azotobacter vinelandii DJ
YP_320070.1 Anabaena variabilis ATCC29413
NP_954309.1 Geobacter sulfurreducens PCA
YP_900481.1 Pelobacter propionicus DSM2379
FeoB Treponema caldaria DSM7334
YP_002801829.1 Azotobacter vinelandii DJ
YP_900461.1 Pelobacter propionicus DSM2379
NP_952433.1 Geobacter sulfurreducens PCA
YP_899525.1 Pelobacter propionicus DSM2379 1.0
FeoBcluster~712aa
FeoBcluster~790aa

Figure A.C5.5: Syntenic analysis of the FeoB protein (form 790aa) within GSB using SyntTax (Oberto 2013).
Figure A.C5.6: ACT view of the region with the insertion of the BChl e cluster in the assembled genome of Chl. luteolum CIII (represented at the bottom) in comparison with the reference genome Chl. luteolum DSM 273T (represented at the top). Red stripes show the regions with BLAST matches. The inserted region covers from ~2032800 to ~2052600 of Chl. luteolum CIII.
SyntTax Report http://archaea.u-psud.fr/SyntTax page 1/2
Genomic contexts
Chlorobium phaeovibrioidesDSM 265 uid58129
Score: 92.10
0512
0513
0514
purU
0516
0517
0518
0519
0520
0521
0522
0523
0524
0525
0526
0527
0528
0529
Chlorobaculum parvumNCIB 8327 uid59185
Score: 67.15
1424
1425
1426
1427
1428
1429
1430
1431
1432
1433
1434
1435
1436
1437
1438
Chlorobium limicolaDSM 245 uid58127
Score: 66.65
0745
0746
0747
0748
0749
0750
0751
0752
0753
0754
0755
0756
0757
0758
0759
0760
dnaK
Chlorobaculum tepidumTLS uid57897Score: 65.33
1732
1733
1734
1735
1736
1737
fld1739
ftn1741
111744
1745
1746
1747
1748
1749
1750
1751
1752
Chlorobium phaeobacteroidesDSM 266 uid58133
Score: 63.45
0311
0312
0313
0314
0315
0316
0317
0318
0319
0320
0321
0322
0323
0324
0325
0326
0327
0328
0329
Chlorobium phaeobacteroidesBS1 uid58131Score: 58.56
0615
0616
0617
0618
0619
0620
0621
0622
0623
0624
0625
0626
0627
0628
0629
glyA
FeoA FeoA FeoB Hyp
Hyp FlavodoxinFerritin-DPS
Hyp

Figure A.C5.7: GC content plot of the region of the BChl e cluster in Chl. luteolum CIII (Contigs 31 and 41), with dots in black and red respectively, versus Chl. phaeobacteroides DSM266, with dots in blue. The squared dots show the position of each of the five proteins proposed for BChl e synthesis. The vertical red dots show the exact region that we propose to be inserted in Chl. luteolum CIII.
Figure A.C5.8: Syntenic analysis of ORFs 575 (vrlQ) to 584 (vrlJ) from Chl. luteolum CIII showing the relationships with the closest relatives of the vrl cluster.
30#
35#
40#
45#
50#
55#
60#
65#
70#
0# 20# 40# 60# 80# 100# 120#
%"GC"conten
t"
Posi-on"
BChl"e"region"C.luteolum"CIII"(Con-g"31"&"41)"vs."C.phaeobacteroides"DSM266""
Con.g31#
Con.g41#
DSM266#
ICMT#
SDR#
cruB#
RSAM#
bchF3#
Inserted#region#
vrlK vrlL vrlM vrlO vrlP vrlQ vrlR vrlSJIHGFEDvrlCBA N
Chl. luteolum CIII
D. nodosus A198
D. multivorans
D. aespoeensis Aspo-2
N. watsoni C-113
N. oceani ATCC 19707
M. zhilinae DSM 4017
vrl locus synteny
5kb
phage transcriptional regulator AlpAphage integrase family protein
582 581 580 579 578 577 576 575 574584592 591 588

Figure A.C5.9: ACT view of the promiscuous regions found in the assembled genome of Chl. luteolum CIII (represented at the bottom) in comparison with the reference genome Chl. luteolum DSM 273T (represented at the top). Red stripes show the regions with BLAST matches.
Promiscuous Region 1
Promiscuous Region 2
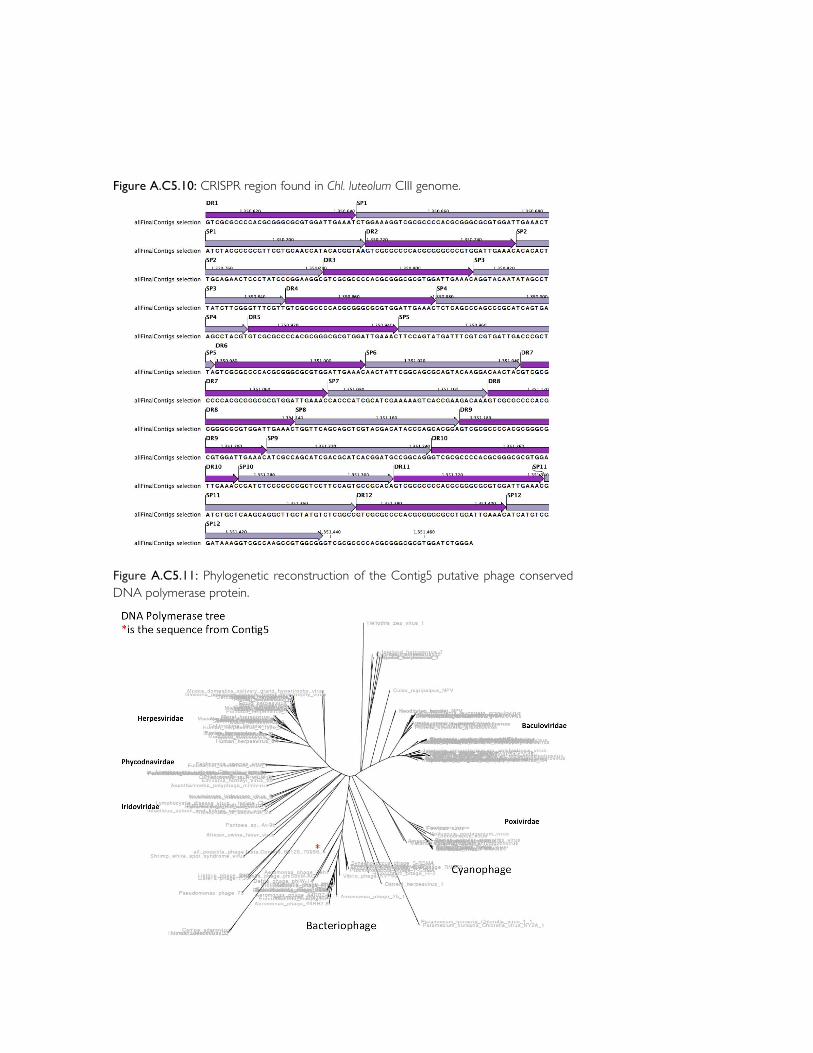
Figure A.C5.10: CRISPR region found in Chl. luteolum CIII genome.
Figure A.C5.11: Phylogenetic reconstruction of the Contig5 putative phage conserved DNA polymerase protein.

Figure A.C5.12: Contig5 putative phage homology annotation map.

Chl. luteolum DSM 273 protein
Protein Length
Identity (%)
Coverage (%)
Protein BLAST First Hit
YP_373947.1 570 87.59 100 ribonuclease [Chlorobium phaeovibrioides DSM 265]YP_373984.1 87 40 54 hypothetical protein Clim_0040 [Chlorobium limicola DSM 245]YP_374035.1 562 62.99 100 sulfatase [Chlorobium phaeobacteroides DSM 266]YP_374298.1 6678 96 74 putative outer membrane adhesin like protein [Chlorobium phaeovibrioides DSM 265]YP_374299.1 609 71.72 98 outer membrane efflux protein [Chlorobium phaeovibrioides DSM 265]YP_374301.1 274 67.18 95 hypothetical protein Cvib_0427 [Chlorobium phaeovibrioides DSM 265]YP_374302.1 457 66.23 99 hypothetical protein Cvib_0428 [Chlorobium phaeovibrioides DSM 265]YP_374303.1 474 71.98 98 peptidase M50 [Chlorobium phaeovibrioides DSM 265]YP_374304.1 205 59.51 100 peptidase M50 [Chlorobium phaeovibrioides DSM 265]YP_374395.1 310 90 100 glycosyl transferase family protein [Chlorobium phaeovibrioides DSM 265]YP_374440.1 278 94.96 100 hypothetical protein Cvib_1738 [Chlorobium phaeovibrioides DSM 265]YP_374441.1 256 98.44 100 hypothetical protein Cvib_1737 [Chlorobium phaeovibrioides DSM 265]YP_374461.1 378 73.45 94 extracellular solute-binding protein [Chlorobium phaeovibrioides DSM 265]YP_374484.1 64 81.25 75 hypothetical protein Cvib_0599 [Chlorobium phaeovibrioides DSM 265]YP_374532.1 111 80.91 99 hypothetical protein Clim_0656 [Chlorobium limicola DSM 245]YP_374533.1 94 81.91 100 hypothetical protein Cphamn1_1311 [Chlorobium phaeobacteroides BS1]YP_374566.1 99 97.98 100 transposase IS3/IS911 family protein [Chlorobium phaeovibrioides DSM 265]YP_374567.1 144 96.99 92 hypothetical protein Cvib_1140 [Chlorobium phaeovibrioides DSM 265]YP_374568.1 164 69.81 65 hypothetical protein Cphamn1_0714 [Chlorobium phaeobacteroides BS1]YP_374569.1 262 - - Hypothetical protein (without blast)YP_374572.1 495 75.15 100 RNA-directed DNA polymerase [Prosthecochloris aestuarii DSM 271]YP_374573.1 246 80.59 96 peptidase A24AYP_374574.1 313 84.03 100 type II secretion system protein [Chlorobium phaeovibrioides DSM 265]YP_374575.1 322 81.37 100 type II secretion system protein [Chlorobium phaeovibrioides DSM 265]YP_374576.1 479 83.92 100 type II secretion system protein E [Chlorobium phaeovibrioides DSM 265]YP_374577.1 381 83.46 100 Flp pilus assembly protein ATPase CpaE-like protein [Chlorobium phaeovibrioides DSM 265]YP_374578.1 356 88.2 100 hypothetical protein Cvib_0567 [Chlorobium phaeovibrioides DSM 265]YP_374579.1 140 79.17 100 TadE family protein [Chlorobium phaeovibrioides DSM 265]YP_374580.1 461 84.82 100 type II and III secretion system protein [Chlorobium phaeovibrioides DSM 265]YP_374581.1 262 87.79 100 SAF domain-containing protein [Chlorobium phaeovibrioides DSM 265]YP_374595.1 282 38.1 45 Sel1 domain-containing protein [Candidatus Odyssella thessalonicensis]YP_374596.1 213 - - Hypothetical protein (without blast)YP_374597.1 4661 47.83 83 hypothetical protein Sden_0384 [Shewanella denitrificans OS217]YP_374598.1 85 50 80 hypothetical protein [Brachyspira innocens]YP_374599.1 260 28.8 70 sporulation initiation inhibitor protein soj [Enterococcus dispar]YP_374600.1 572 58.46 95 type I secretion system ATPase [Prosthecochloris aestuarii DSM 271]YP_374601.1 563 60.51 98 type I secretion system ATPase [Prosthecochloris aestuarii DSM 271]YP_374602.1 393 64.95 94 secretion protein HlyD family protein [Prosthecochloris aestuarii DSM 271]YP_374603.1 443 43.79 96 TolC family type I secretion outer membrane protein [Prosthecochloris aestuarii DSM 271]YP_374604.1 169 - - Hypothetical protein (without blast)YP_374605.1 101 - - Hypothetical protein (without blast)YP_374606.1 60 71.43 58 gas vesicle protein [Oscillatoria acuminata PCC 6304]YP_374607.1 68 - - Hypothetical protein (without blast)YP_374608.1 105 - - Hypothetical protein (without blast)YP_374609.1 68 98.53 100 gas vesicle synthesis protein GvpA [Pelodictyon phaeoclathratiforme BU-1]YP_374610.1 68 98.53 100 gas vesicle synthesis protein GvpA [Pelodictyon phaeoclathratiforme BU-1]YP_374611.1 201 40.44 91 hypothetical protein Ppha_1817 [Pelodictyon phaeoclathratiforme BU-1]YP_374612.1 387 39.9 98 hypothetical protein Ppha_1816 [Pelodictyon phaeoclathratiforme BU-1]YP_374613.1 299 85.23 99 gas vesicle protein GvpN [Pelodictyon phaeoclathratiforme BU-1]YP_374614.1 105 40.59 96 hypothetical protein Ppha_1814 [Pelodictyon phaeoclathratiforme BU-1]YP_374615.1 97 81.44 100 gas vesicle protein GvpA [Pelodictyon phaeoclathratiforme BU-1]YP_374616.1 183 57.87 97 hypothetical protein [Polaribacter]YP_374617.1 314 52.41 99 ATPase [Polaribacter franzmannii]YP_374618.1 718 75.56 99 ATPase AAA [Pelodictyon phaeoclathratiforme BU-1]YP_374620.1 260 63.08 100 gas vesicle synthesis GvpLGvpF [Pelodictyon phaeoclathratiforme BU-1]YP_374621.1 259 64.14 97 gas vesicle synthesis GvpLGvpF [Pelodictyon phaeoclathratiforme BU-1]YP_374622.1 64 57.81 100 Gas vesicle G [Pelodictyon phaeoclathratiforme BU-1]YP_374623.1 90 60.92 97 hypothetical protein Ppha_1805 [Pelodictyon phaeoclathratiforme BU-1]YP_374624.1 262 34.62 99 hypothetical protein [Polaribacter franzmannii]YP_374625.1 69 72.41 84 gas vesicle protein GvpA [Pelodictyon phaeoclathratiforme BU-1]YP_374626.1 245 25.7 99 gas vesicle synthesis GvpLGvpF [Pelodictyon phaeoclathratiforme BU-1]YP_374627.1 116 71.05 98 gas vesicle protein K [Pelodictyon phaeoclathratiforme BU-1]YP_374636.1 138 70.59 99 hypothetical protein Ppha_1968 [Pelodictyon phaeoclathratiforme BU-1]YP_374652.1 330 43.62 90 type 11 methyltransferase [Chlorobium phaeovibrioides DSM 265]YP_374656.1 96 40.48 44 hypothetical protein [Thermoplasmatales archaeon A-plasma]YP_374677.1 119 82.35 100 hypothetical protein Cvib_1079 [Chlorobium phaeovibrioides DSM 265]YP_374678.1 123 73.04 93 hypothetical protein Cvib_1077 [Chlorobium phaeovibrioides DSM 265]YP_374679.1 191 76.22 86 hypothetical protein Cvib_1076 [Chlorobium phaeovibrioides DSM 265]YP_374680.1 763 69.99 100 lipopolysaccharide biosynthesis protein [Chlorobium phaeovibrioides DSM 265]YP_374681.1 450 61.11 100 sugar transferase [Chlorobium phaeovibrioides DSM 265]YP_374682.1 402 67.4 91 DegT/DnrJ/EryC1/StrS aminotransferase [Pseudomonas fulva 12-X]YP_374683.1 506 53.88 94 O-antigen transporter [Desulfotalea psychrophila LSv54]YP_374684.1 232 50.43 100 hypothetical protein [Rhizobium leguminosarum]
Table A.C5.1: List of proteins not found in Chl. luteolum CIII but present in Chl. luteolum DSM 273. In bold proteinscommented in the text.

Chl. luteolum DSM 273 protein
Protein Length
Identity (%)
Coverage (%)
Protein BLAST First Hit
Table A.C5.1: Continued
YP_374685.1 329 37.93 97 hypothetical protein AZKH_0360 [Azoarcus sp. KH32C]YP_374686.1 333 43.5 98 glycosyl transferase family protein [Acidithiobacillus ferrooxidans ATCC 23270]YP_374687.1 353 36.06 93 hydroxyneurosporene-O-methyltransferase [Synechococcus sp. PCC 6312]YP_374688.1 397 47.1 100 group 1 glycosyl transferase [Thermodesulfobacterium geofontis OPF15]YP_374689.1 427 28.64 95 hypothetical protein [Pseudomonas luteola]YP_374690.1 361 52.77 95 group 1 glycosyl transferase [Nitratifractor salsuginis DSM 16511]YP_374691.1 371 45 97 group 1 glycosyl transferase [Chlorobium phaeovibrioides DSM 265]YP_374692.1 338 62.24 100 radical SAM domain-containing protein [Chlorobium phaeovibrioides DSM 265]YP_374693.1 321 45.37 97 hypothetical protein [Agarivorans albus]YP_374706.1 248 80.65 100 type 11 methyltransferase [Desulfovibrio africanus str. Walvis Bay]YP_374707.1 240 - - Hypothetical protein (without blast)YP_374708.1 315 68.99 100 type II secretion system protein [Pelodictyon phaeoclathratiforme BU-1]YP_374709.1 322 60.87 100 type II secretion system protein [Chlorobium phaeovibrioides DSM 265]YP_374710.1 472 77.97 99 type II secretion system protein E [Chlorobaculum parvum NCIB 8327]YP_374711.1 381 71.39 100 Flp pilus assembly protein ATPase CpaE-like protein [Pelodictyon phaeoclathratiforme BU-1]YP_374712.1 349 - - Hypothetical protein (without blast)YP_374713.1 156 53.64 95 TadE family protein [Chlorobium phaeovibrioides DSM 265]YP_374714.1 486 66.46 100 type II and III secretion system protein [Chlorobium phaeovibrioides DSM 265]YP_374715.1 266 - - Hypothetical protein (without blast)YP_374716.1 60 58.82 85 hypothetical protein CT0438 [Chlorobium tepidum TLS]YP_374717.1 100 36.14 68 hypothetical protein [Actinomyces neuii]YP_374718.1 429 61.59 99 amino acid permease-associated protein [Prosthecochloris aestuarii DSM 271]YP_374719.1 305 69.4 88 AraC family transcripiotnal regulator [Pelodictyon phaeoclathratiforme BU-1]YP_374720.1 371 55.36 93 RND family efflux transporter MFP subunit [Chlorobium phaeovibrioides DSM 265]YP_374721.1 1070 84.54 99 hydrophobe/amphiphile efflux-1 (HAE1) family protein [Chlorobium phaeovibrioides DSM 265]YP_374722.1 476 63.27 99 NodT family RND efflux system outer membrane lipoprotein [Pelodictyon phaeoclathratiforme BU-1]YP_374723.1 266 76.32 100 oxidoreductase FAD/NAD(P)-binding subunit [Chlorobium phaeovibrioides DSM 265]YP_374724.1 76 60.32 83 hypothetical protein Clim_1374 [Chlorobium limicola DSM 245]YP_374725.1 371 70.94 91 cytochrome-c peroxidase [Prosthecochloris aestuarii DSM 271]YP_374726.1 191 69.71 91 hypothetical protein Cvib_0736 [Chlorobium phaeovibrioides DSM 265]YP_374727.1 101 40 53 conserved hypothetical protein [Talaromyces stipitatus ATCC 10500]YP_374728.1 98 29.63 83 DEAD/DEAH box helicase [Flavobacteriaceae bacterium HQM9]YP_374729.1 267 31.53 79 uncharacterized protein [Eubacterium dolichum CAG:375]YP_374730.1 164 30.77 48 hypothetical protein [Caulobacter sp. AP07]YP_374731.1 68 37.5 79 hypothetical protein Mlg_1310 [Alkalilimnicola ehrlichii MLHE-1]YP_374732.1 215 48.45 90 N-acetylmuramoyl-L-alanine amidase [Marinilabilia salmonicolor]YP_374733.1 151 48.84 57 hypothetical protein [Janthinobacterium sp. CG3]YP_374735.1 191 70.68 100 hypothetical protein Cvib_0066 [Chlorobium phaeovibrioides DSM 265]YP_374736.1 167 80.84 100 membrane-flanked domain-containing protein [Chlorobium phaeovibrioides DSM 265]YP_374737.1 331 64.74 94 ADP-ribosylation/crystallin J1 [Chlorobium phaeovibrioides DSM 265]YP_374738.1 116 77.78 93 XRE family transcriptional regulator [Pelodictyon phaeoclathratiforme BU-1]YP_374739.1 190 50.55 96 vir region protein-like protein [Chlorobium ferrooxidans]YP_374740.1 430 34.39 99 hypothetical protein [Thioalkalivibrio sp. ALgr3]YP_374741.1 144 56.03 81 hypothetical protein [Thauera sp. 28]YP_374742.1 87 63.22 100 XRE family transcriptional regulator [Thioalkalivibrio thiocyanoxidans]YP_374743.1 107 74.76 96 XRE family transcriptional regulator [Pelodictyon phaeoclathratiforme BU-1]YP_374744.1 113 70.37 96 hypothetical protein [Chlorobium ferrooxidans]YP_374745.1 138 35.48 44 n-ethylammeline chlorohydrolase [Sutterella wadsworthensis CAG:135]YP_374746.1 193 58.38 96 hypothetical protein [Chlorobium ferrooxidans]YP_374747.1 261 49.01 97 hypothetical protein HYPDE_35033 [Hyphomicrobium denitrificans 1NES1]YP_374748.1 783 47.34 99 hypothetical protein Gura_4117 [Geobacter uraniireducens Rf4]YP_374749.1 606 43.61 99 hypothetical protein [Marinobacter lipolyticus]YP_374757.1 698 - - Hypothetical protein (without blast)YP_374758.1 162 65.98 59 KilAYP_374760.1 129 49.21 98 hypothetical protein Cag_1618 [Chlorobium chlorochromatii CaD3]YP_374762.1 198 85.13 98 resolvase [Prosthecochloris aestuarii DSM 271]YP_374763.1 237 53.51 78 hypothetical protein Cphamn1_0562 [Chlorobium phaeobacteroides BS1]YP_374764.1 342 - - Hypothetical protein (without blast)YP_374765.1 643 - - Hypothetical protein (without blast)YP_374766.1 260 - - Hypothetical protein (without blast)YP_374767.1 990 - - Hypothetical protein (without blast)YP_374768.1 508 56.2 99 polar amino acid ABC transporter inner membrane protein [Geobacter lovleyi SZ]YP_374769.1 363 70.08 99 ABC transporter [Geobacter lovleyi SZ]YP_374770.1 112 - - Hypothetical protein (without blast)YP_374773.1 314 40.69 98 hypothetical protein Cphamn1_2329 [Chlorobium phaeobacteroides BS1]YP_374774.1 722 23.33 71 conserved membrane hypothetical protein [Microcystis sp. T1-4]YP_374776.1 78 - - Hypothetical protein (without blast)YP_374777.1 278 51.83 69 Reverse transcriptase (RNA-dependent DNA polymerase) [Thiorhodovibrio sp. 970]YP_374778.1 483 66.39 99 radical SAM domain-containing protein [Prosthecochloris aestuarii DSM 271]YP_374779.1 372 33.57 97 NHPM bacteriocin system secretion protein [Haliscomenobacter hydrossis DSM 1100]YP_374780.1 517 96.4 21 hypothetical protein Cphamn1_2332 [Chlorobium phaeobacteroides BS1]YP_374781.1 724 98.76 100 ABC transporter-like protein [Chlorobium phaeobacteroides BS1]YP_374782.1 741 97.98 100 ABC transporter-like protein [Chlorobium phaeobacteroides BS1]

Chl. luteolum DSM 273 protein
Protein Length
Identity (%)
Coverage (%)
Protein BLAST First Hit
Table A.C5.1: Continued
YP_374783.1 331 96.37 100 hypothetical protein Cphamn1_2329 [Chlorobium phaeobacteroides BS1]YP_374784.1 86 - - Hypothetical protein (without blast)YP_374785.1 471 43.71 98 SagB-type dehydrogenase domain-containing protein [Microcoleus sp. PCC 7113]YP_374786.1 329 43.75 75 hypothetical protein SCE1572_24675 [Sorangium cellulosum So0157-2]YP_374787.1 749 42.75 100 hypothetical protein [Oscillatoria sp. PCC 10802]YP_374788.1 114 41.57 78 nitrile hydratase [Azospirillum amazonense]YP_374789.1 116 - - Hypothetical protein (without blast)YP_374790.1 79 - - Hypothetical protein (without blast)YP_374791.1 339 29.64 82 hypothetical protein [Oscillatoria formosa]YP_374792.1 94 - - Hypothetical protein (without blast)YP_374793.1 118 - - Hypothetical protein (without blast)YP_374794.1 68 - - Hypothetical protein (without blast)YP_374795.1 94 - - Hypothetical protein (without blast)YP_374798.1 137 50.41 88 response regulator receiver protein [Prosthecochloris aestuarii DSM 271]YP_374799.1 738 50.55 98 multi-sensor signal transduction histidine kinase [Prosthecochloris aestuarii DSM 271]YP_374805.1 109 - - Hypothetical protein (without blast)YP_374864.1 214 52.22 95 thiamine monophosphate synthase [Chlorobium phaeovibrioides DSM 265]YP_374885.1 96 78.95 99 plasmid stabilization system [Chlorobium phaeobacteroides BS1]YP_374931.1 388 - - Hypothetical protein (without blast)YP_374932.1 1099 - - Hypothetical protein (without blast)YP_374933.1 376 - - Hypothetical protein (without blast)YP_374934.1 588 35.69 93 hypothetical protein [Glaciecola punicea]YP_374935.1 255 39.76 97 hypothetical protein [Chlorobium ferrooxidans]YP_374936.1 964 - - Hypothetical protein (without blast)YP_374945.1 143 - - Hypothetical protein (without blast)YP_374968.1 468 80.31 97 F0F1 ATP synthase subunit beta [Chlorobaculum parvum NCIB 8327]YP_374969.1 129 63.57 100 ATP synthase F0F1 subunit epsilon [Chlorobium tepidum TLS]YP_374970.1 106 54.46 95 F0F1-ATPase subunit [Prosthecochloris aestuarii DSM 271]YP_374971.1 101 45.26 94 F1/F0 ATPaseYP_374972.1 223 74.89 100 F0F1 ATP synthase subunit A [Chlorobaculum parvum NCIB 8327]YP_374973.1 93 75.27 100 alternate F1F0 ATPase F0 subunit C [Chlorobaculum parvum NCIB 8327]YP_374974.1 264 44.84 94 alternate F1F0 ATPase F0 subunit B [Prosthecochloris aestuarii DSM 271]YP_374975.1 511 71.31 97 F0F1 ATP synthase subunit alpha [Chlorobaculum parvum NCIB 8327]YP_374976.1 303 53.82 96 hypothetical protein [Zavarzinella formosa]YP_374981.1 91 57.5 88 prevent-host-death protein [Rhizobium giardinii]YP_374998.1 684 42.76 99 multi-sensor signal transduction histidine kinase [Pelodictyon phaeoclathratiforme BU-1]YP_374999.1 101 38.57 66 hypothetical protein [Chlorobium ferrooxidans]YP_375000.1 167 38 60 hypothetical protein [Chlorobium ferrooxidans]YP_375001.1 283 37.7 89 hypothetical protein [Chlorobium ferrooxidans]YP_375002.1 277 42.32 96 phosphate binding protein [Chlorobium phaeobacteroides BS1]YP_375003.1 633 31.65 97 integral membrane sensor signal transduction histidine kinase [Chlorobium phaeovibrioides DSM 265]YP_375004.1 241 - - Hypothetical protein (without blast)YP_375005.1 203 - - Hypothetical protein (without blast)YP_375006.1 118 - - Hypothetical protein (without blast)YP_375007.1 203 - - Hypothetical protein (without blast)YP_375008.1 218 47.59 75 hypothetical protein Cvib_0849 [Chlorobium phaeovibrioides DSM 265]YP_375030.1 245 75.32 94 ABC transporter [Chlorobium ferrooxidans]YP_375046.1 222 79.91 96 cob(II)yrinic acid aYP_375077.1 164 31.88 37 hypothetical protein [Chlorobium ferrooxidans]YP_375086.1 81 62.96 100 hypothetical protein [Chlorobium ferrooxidans]YP_375090.1 476 63.95 80 hypothetical protein Cvib_0772 [Chlorobium phaeovibrioides DSM 265]YP_375132.1 356 66.11 99 Protein of unknown function [Flavobacterium psychrophilum JIP02/86]YP_375164.1 153 64.8 82 NUDIX hydrolase [Chlorobium ferrooxidans]YP_375185.1 97 43.55 64 hypothetical protein Cvib_1030 [Chlorobium phaeovibrioides DSM 265]YP_375205.1 259 38.58 99 predicted protein [Populus trichocarpa]YP_375206.1 128 54 94 hypothetical protein [Selenomonas sp. CM52]YP_375207.1 146 44.53 83 hypothetical protein PST_3752 [Pseudomonas stutzeri A1501]YP_375237.1 247 82.89 92 ABC transporter-like protein [Pelodictyon phaeoclathratiforme BU-1]YP_375261.1 183 41.72 83 PAS domain-containing protein [Nostoc sp. PCC 7524]YP_375348.1 362 82.87 100 hydrogenase (NiFe) small subunit (hydA):Twin-arginine translocation pathway signal [Chlorobium ferrooxidans]YP_375349.1 572 88.99 100 nickel-dependent hydrogenase large subunit [Pelodictyon phaeoclathratiforme BU-1]YP_375350.1 227 80.62 100 Ni/Fe-hydrogenaseYP_375351.1 158 70.25 100 hydrogenase maturation protease [Pelodictyon phaeoclathratiforme BU-1]YP_375352.1 226 60.47 95 cobalt transport protein CbiM [Ammonifex degensii KC4]YP_375353.1 111 48.48 89 cobalamin biosynthesis protein [Dictyoglomus thermophilum H-6-12]YP_375354.1 283 35.69 91 cobalt ABC transporter permease [Desulfitobacterium metallireducens]YP_375355.1 269 51.33 96 hypothetical protein [Nocardioides sp. Iso805N]YP_375356.1 347 77.52 100 hydrogenase [Chlorobium ferrooxidans]YP_375357.1 362 83.43 100 hydrogenase expression/formation protein HypD [Pelodictyon phaeoclathratiforme BU-1]YP_375358.1 90 73.86 97 hydrogenase assembly chaperone HypC/HupF [Chlorobium phaeobacteroides DSM 266]YP_375359.1 719 62.06 99 (NiFe) hydrogenase maturation protein HypF [Pelodictyon phaeoclathratiforme BU-1]YP_375360.1 268 74.63 99 hydrogenase nickel incorporation protein HypB [Chlorobium ferrooxidans]YP_375361.1 117 70.09 100 hydrogenase nickel incorporation protein HypA [Pelodictyon phaeoclathratiforme BU-1]

Chl. luteolum DSM 273 protein
Protein Length
Identity (%)
Coverage (%)
Protein BLAST First Hit
Table A.C5.1: Continued
YP_375406.1 465 99.57 100 hypothetical protein Cphamn1_0372 [Chlorobium phaeobacteroides BS1]YP_375438.1 131 46.09 95 cytochrome c [Chlorobium phaeovibrioides DSM 265]YP_375439.1 639 45.93 96 receptor [Chlorobium tepidum TLS]YP_375441.1 267 53.14 89 molybdenum ABC transporterYP_375442.1 226 70.09 95 Fis family transcriptional regulator [Chlorobium phaeobacteroides DSM 266]YP_375447.1 118 27.27 72 hypothetical protein EMIHUDRAFT_230279 [Emiliania huxleyi CCMP1516]YP_375448.1 383 80.11 98 cystathionine gamma-synthase [Pelodictyon phaeoclathratiforme BU-1]YP_375450.1 214 63.64 98 LuxR family transcriptional regulator [Chlorobium ferrooxidans]YP_375451.1 317 82.33 100 cysteine synthase A [Pelodictyon phaeoclathratiforme BU-1]YP_375452.1 335 76.35 99 sulfate transporter subunit [Chlorobium ferrooxidans]YP_375453.1 277 77.26 100 sulfate/thiosulfate transporter subunit [Chlorobium ferrooxidans]YP_375454.1 289 71.83 97 sulfate ABC transporter permease [Chlorobium ferrooxidans]YP_375455.1 357 75.35 100 sulfate ABC transporter [Chlorobium ferrooxidans]YP_375456.1 599 71.95 100 adenylylsulfate kinase [Chlorobium ferrooxidans]YP_375457.1 293 79.52 100 sulfate adenylyltransferase [Chlorobium ferrooxidans]YP_375458.1 250 67.26 90 phosphoadenosine phosphosulfate reductase [Chlorobium ferrooxidans]YP_375459.1 319 53 89 sulfite reductase subunit beta [Chlorobium ferrooxidans]YP_375465.1 622 63.56 97 protein-disulfide reductase [Chlorobium ferrooxidans]YP_375466.1 306 61.69 96 thiamine biosynthesis protein ApbE [Chlorobium ferrooxidans]YP_375467.1 417 52.73 97 hypothetical protein [Chlorobium ferrooxidans]YP_375468.1 76 54.17 92 putative lipoprotein [Shewanella sp. ANA-3]YP_375469.1 194 60.9 80 thiol:disulfide interchange protein DsbE [Chlorobium tepidum TLS]YP_375549.1 244 37.5 28 PREDICTED: zinc finger protein 184-like [Monodelphis domestica]YP_375561.1 237 77.63 96 hypothetical protein Cvib_1450 [Chlorobium phaeovibrioides DSM 265]YP_375608.1 142 51.49 94 TOBE domain-containing protein [Chlorobium limicola DSM 245]YP_375609.1 299 68.51 97 ABC transporter [Chlorobium phaeobacteroides DSM 266]YP_375692.1 254 55.56 92 methyltransferase FkbM [Polaromonas sp. CF318]YP_375702.1 180 46.2 87 hypothetical protein [Bacillus methanolicus]YP_375718.1 242 66.86 71 hypothetical protein CT2253 [Chlorobium tepidum TLS]YP_375719.1 614 44.89 60 hypothetical protein DaAHT2_2022 [Desulfurivibrio alkaliphilus AHT2]YP_375720.1 627 49.59 98 hypothetical protein Nit79A3_2002 [Nitrosomonas sp. Is79A3]YP_375721.1 448 - - Hypothetical protein (without blast)YP_375722.1 311 30.12 52 hypothetical protein [Rhodopseudomonas sp. B29]YP_375723.1 197 72.96 99 conserved hypothetical protein [Thiomonas arsenitoxydans]YP_375724.1 109 40.57 97 hypothetical protein [Pseudomonas]YP_375725.1 163 54.55 27 hypothetical protein [Clostridium botulinum]YP_375726.1 526 69.01 99 integrase catalytic subunit [Chlorobium phaeobacteroides DSM 266]YP_375727.1 246 80.08 100 IstB ATP binding domain-containing protein [Chlorobium phaeobacteroides DSM 266]YP_375728.1 217 - - Hypothetical protein (without blast)YP_375731.1 286 - - Hypothetical protein (without blast)YP_375732.1 115 98.26 100 hypothetical protein Cvib_0656 [Chlorobium phaeovibrioides DSM 265]YP_375733.1 112 61.54 93 hypothetical protein Cag_1308 [Chlorobium chlorochromatii CaD3]YP_375734.1 111 97.3 100 XRE family transcriptional regulator [Chlorobium phaeovibrioides DSM 265]YP_375735.1 100 30.49 69 1-O-acylceramide synthase precursorYP_375738.1 309 52.27 99 UDP-glucose 4-epimerase [Herminiimonas arsenicoxydans]YP_375739.1 253 52.24 97 hypothetical protein Tbd_1874 [Thiobacillus denitrificans ATCC 25259]YP_375740.1 391 50.87 88 glycosyl transferase [Rhizobium sp. CF142]YP_375741.1 317 55.41 96 UDP-glucose epimerase [Rhizobium leguminosarum bv. viciae 3841]YP_375742.1 282 61.73 98 SAM-dependent methyltransferase [Rhizobium sp. CF142]YP_375743.1 189 55.56 100 branched-chain amino acid transport system substrate-binding protein [Bradyrhizobium sp. DFCI-1]YP_375744.1 276 54.58 99 biopolymer transporter TolQ [Bradyrhizobium sp. DFCI-1]YP_375745.1 313 42.66 89 hypothetical protein Syn7502_03249 [Synechococcus sp. PCC 7502]YP_375746.1 618 50.64 99 hypothetical protein [Methyloversatilis universalis]YP_375747.1 274 48.06 94 glycosyl transferase family protein [Polynucleobacter necessarius subsp. asymbioticus QLW-P1DMWA-1]YP_375748.1 415 26.13 93 hypothetical protein Ajs_3024 [Acidovorax sp. JS42]YP_375750.1 465 99.57 100 hypothetical protein Cphamn1_0372 [Chlorobium phaeobacteroides BS1]YP_375751.1 205 86.41 90 hypothetical protein Cvib_0639 [Chlorobium phaeovibrioides DSM 265]YP_375752.1 226 39.25 94 hypothetical protein [Methylophilus methylotrophus]YP_375753.1 405 53.32 100 hypothetical protein [Pseudomonas stutzeri]YP_375756.1 251 39.46 87 hypothetical protein Cag_1263 [Chlorobium chlorochromatii CaD3]YP_375757.1 595 46.26 99 hypothetical protein [Thioalkalivibrio sp. AKL17]YP_375758.1 213 57.42 98 hypothetical protein [Methylococcus capsulatus]YP_375759.1 436 47.42 98 polysaccharide biosynthesis protein [Thioalkalivibrio sp. ALRh]YP_375760.1 97 51.14 91 hypothetical protein [Methylocystis rosea]YP_375761.1 348 30.29 96 hypothetical protein [Janthinobacterium sp. CG3]YP_375762.1 241 53.33 93 hypothetical protein [uncultured Thiohalocapsa sp. PB-PSB1]YP_375763.1 181 50 98 hypothetical protein NE1883 [Nitrosomonas europaea ATCC 19718]YP_375764.1 408 58.23 99 hypothetical protein NAL212_1260 [Nitrosomonas sp. AL212]YP_375765.1 48 50.98 100 hypothetical protein Cphamn1_1966 [Chlorobium phaeobacteroides BS1]YP_375766.1 91 50 93 prevent-host-death protein [Pseudomonas pelagia]YP_375767.1 139 76.98 100 PilT domain-containing protein [Chlorobium phaeobacteroides DSM 266]YP_375768.1 79 78.48 100 hypothetical protein Cphamn1_1965 [Chlorobium phaeobacteroides BS1]YP_375769.1 136 93.38 100 putative transcriptional regulator [Chlorobium phaeovibrioides DSM 265]

Chl. luteolum DSM 273 protein
Protein Length
Identity (%)
Coverage (%)
Protein BLAST First Hit
Table A.C5.1: Continued
YP_375770.1 246 83.33 100 hypothetical protein Cvib_0610 [Chlorobium phaeovibrioides DSM 265]YP_375771.1 272 99.63 100 hypothetical protein Cvib_0609 [Chlorobium phaeovibrioides DSM 265]YP_375772.1 93 69.23 42 hypothetical protein NE1822 [Nitrosomonas europaea ATCC 19718]YP_375773.1 271 68.91 99 hypothetical protein NE1821 [Nitrosomonas europaea ATCC 19718]YP_375777.1 362 60.93 95 glycosyl transferase family protein [Chlorobium phaeovibrioides DSM 265]YP_375779.1 343 90.38 100 lipopolysaccharide biosynthesis protein [Chlorobium phaeovibrioides DSM 265]YP_375781.1 120 89.61 64 XRE family transcriptional regulator [Chlorobium phaeovibrioides DSM 265]YP_375782.1 182 94.51 100 PA-phosphatase-like phosphoesterase [Chlorobium phaeovibrioides DSM 265]YP_375783.1 390 89.43 95 XRE family transcriptional regulator [Chlorobium phaeovibrioides DSM 265]YP_375792.1 152 75.66 100 mobile mystery protein A [Chlorobium limicola DSM 245]YP_375793.1 395 64.89 99 filamentation induced by cAMP protein fic [Pelodictyon phaeoclathratiforme BU-1]YP_375794.1 107 83.52 85 XRE family transcriptional regulator [Chlorobium phaeobacteroides DSM 266]YP_375795.1 101 63.53 80 hypothetical protein Ppha_0790 [Pelodictyon phaeoclathratiforme BU-1]YP_375805.1 100 57.14 35 ATP-dependent helicase [Desulfovibrio magneticus RS-1]YP_375812.1 81 - - Hypothetical protein (without blast)YP_375890.1 75 78.67 100 chlorosome envelope protein B [Chlorobium limicola DSM 245]YP_375895.1 462 58.04 92 multi-sensor hybrid histidine kinase [Pelodictyon phaeoclathratiforme BU-1]YP_375908.1 103 50.94 51 cytochrome C biogenesis protein CycH [Joostella marina]YP_375909.1 88 51.67 67 Death-on-curing protein [Pasteurella multocida]YP_375948.1 417 52.87 99 hypothetical protein Ppha_2822 [Pelodictyon phaeoclathratiforme BU-1]

Chl. luteolum CIII protein Contig Protein Length
Identity (%)
Coverage (%) Protein BLAST First Hit Comments
fig|319225.9.peg.32 Contig26 39 - - Hypothetical protein (without blast)fig|319225.9.peg.42 Contig26 41 - - Hypothetical protein (without blast)fig|319225.9.peg.50 Contig26 53 36 81 ALS operon regulatory protein [Patulibacter americanus]fig|319225.9.peg.60 Contig26 306 84 94 hypothetical protein Cvib_0032 [Chlorobium phaeovibrioides DSM 265]fig|319225.9.peg.136 Contig52 39 - - Hypothetical protein (without blast)fig|319225.9.peg.214 Contig52 265 94 100 50S ribosomal protein L2 [Pelodictyon phaeoclathratiforme BU-1]fig|319225.9.peg.234 Contig52 39 100 100 50S ribosomal protein L36 [Chlorobium phaeovibrioides DSM 265]fig|319225.9.peg.376 Contig54 82 29 99 hypothetical protein CRE_13618 [Caenorhabditis remanei]fig|319225.9.peg.395 Contig54 39 52 66 hypothetical protein conserved [Cyanidioschyzon merolae strain 10D]fig|319225.9.peg.397 Contig54 83 49 90 addiction module antitoxin [Pelobacter propionicus DSM 2379]fig|319225.9.peg.398 Contig54 57 46 66 CopG family transcriptional regulator [Chlorobium phaeobacteroides BS1]fig|319225.9.peg.399 Contig54 41 - - Hypothetical protein (without blast)
fig|319225.9.peg.403 Contig54 118 32 74 1-(5-phosphoribosyl)-5-[(5-phosphoribosylamino)methylideneamino] imidazole-4-carboxamide isomerase [Escherichia coli]
fig|319225.9.peg.405 Contig8 76 57 100 TPR repeat-containing protein [Chlorobium luteolum DSM 273]fig|319225.9.peg.407 Contig8 112 45 39 hypothetical protein ROP_36070 [Rhodococcus opacus B4]fig|319225.9.peg.408 Contig8 299 - - Hypothetical protein (without blast)fig|319225.9.peg.413 Contig21-32 753 62 62 outer membrane adhesin-like protein [Cellulophaga algicola DSM 14237]fig|319225.9.peg.420 Contig32 66 32 88 PREDICTED: mitochondrial dynamic protein MID49 [Ceratotherium simum simum]fig|319225.9.peg.427 Contig32 60 - - Hypothetical protein (without blast)fig|319225.9.peg.433 Contig32 58 45 95 hypothetical protein Paes_1821 [Prosthecochloris aestuarii DSM 271]fig|319225.9.peg.439 Contig32 42 - - Hypothetical protein (without blast)fig|319225.9.peg.447 Contig32 49 44 81 small nuclear ribonucleoprotein [Paracoccidioides sp. 'lutzii' Pb01]fig|319225.9.peg.455 Contig32 47 - - Hypothetical protein (without blast)fig|319225.9.peg.468 Contig32 43 - - Hypothetical protein (without blast)fig|319225.9.peg.541 Contig48 49 - - Hypothetical protein (without blast)fig|319225.9.peg.549 Contig48 202 83 87 transposase IS5 family [Chlorobium phaeobacteroides BS1]fig|319225.9.peg.550 Contig48 182 63 97 hypothetical protein Ppha_0792 [Pelodictyon phaeoclathratiforme BU-1]fig|319225.9.peg.551 Contig48 42 - - Hypothetical protein (without blast)fig|319225.9.peg.554 Contig44 39 - - Hypothetical protein (without blast)fig|319225.9.peg.555 Contig44 84 100 94 hypothetical protein Plut_0516 [Chlorobium luteolum DSM 273]fig|319225.9.peg.558 Contig44 48 - - Hypothetical protein (without blast)fig|319225.9.peg.574 Contig44 294 67 98 hypothetical protein [Methylohalobius crimeensis] vrl clusterfig|319225.9.peg.575 Contig44 250 84 100 hypothetical protein DNO_0175 [Dichelobacter nodosus VCS1703A] vrl cluster-vrlQfig|319225.9.peg.576 Contig44 630 88 100 PglZ domain protein [Desulfococcus multivorans] vrl cluster-vrlPfig|319225.9.peg.577 Contig44 965 91 99 SNF2-related protein [Desulfococcus multivorans] vrl cluster-vrlOfig|319225.9.peg.578 Contig44 621 61 99 UvrD/REP helicase [Methanosalsum zhilinae DSM 4017] vrl clusterfig|319225.9.peg.579 Contig44 572 55 99 ATP-dependent endonuclease [Methanosalsum zhilinae DSM 4017] vrl clusterfig|319225.9.peg.580 Contig44 258 97 99 hypothetical protein Noc_0059 [Nitrosococcus oceani ATCC 19707] vrl cluster-vrlLfig|319225.9.peg.581 Contig44 544 60 99 transcriptional regulator [Alcanivorax hongdengensis] vrl clusterfig|319225.9.peg.582 Contig44-20 1085 91 100 virulence associated protein [Thiobacillus denitrificans] vrl cluster-vrlKfig|319225.9.peg.583 Contig20 82 - - Hypothetical protein (without blast) vrl clusterfig|319225.9.peg.584 Contig20 172 73 99 hypothetical protein [Pseudomonas aeruginosa] vrl cluster-vrlJfig|319225.9.peg.585 Contig20 45 62 89 restriction endonuclease [Firmicutes bacterium CAG:176] vrl clusterfig|319225.9.peg.586 Contig20 166 29 74 putative uncharacterized protein [Ruminococcus sp. CAG:353] vrl clusterfig|319225.9.peg.587 Contig20 68 45 90 hypothetical protein Deba_0112 [Desulfarculus baarsii DSM 2075] vrl clusterfig|319225.9.peg.588 Contig20 623 77 96 hypothetical protein Cpha266_2066 [Chlorobium phaeobacteroides DSM 266] vrl clusterfig|319225.9.peg.589 Contig20 52 - - Hypothetical protein (without blast) vrl clusterfig|319225.9.peg.590 Contig20 79 66 83 phage transcriptional regulator AlpA [Chlorobium phaeobacteroides DSM 266] vrl clusterfig|319225.9.peg.591 Contig20 423 83 95 phage integrase family protein [Chlorobium phaeobacteroides DSM 266] vrl clusterfig|319225.9.peg.592 Contig20 614 44 99 Crp family transcriptional regulator [Halothece sp. PCC 7418] vrl clusterfig|319225.9.peg.615 Contig20 40 56 82 hypothetical protein Cvib_0599 [Chlorobium phaeovibrioides DSM 265]fig|319225.9.peg.616 Contig20 65 100 100 hypothetical protein Plut_0557 [Chlorobium luteolum DSM 273]fig|319225.9.peg.617 Contig20 43 41 76 hypothetical protein [Hydrocarboniphaga effusa]fig|319225.9.peg.636 Contig51 73 53 42 prop expression regulator [Dickeya zeae]fig|319225.9.peg.668 Contig51 54 37 92 hypothetical protein [Streptomyces clavuligerus]fig|319225.9.peg.679 Contig51 109 99 100 FeoA family protein [Chlorobium phaeovibrioides DSM 265] Iron clusterfig|319225.9.peg.680 Contig51 76 96 100 FeoA family protein [Chlorobium phaeovibrioides DSM 265] Iron clusterfig|319225.9.peg.681 Contig51 796 97 100 ferrous iron transport protein B [Chlorobium phaeovibrioides DSM 265] Iron clusterfig|319225.9.peg.682 Contig51 95 96 81 hypothetical protein Cvib_0522 [Chlorobium phaeovibrioides DSM 265] Iron clusterfig|319225.9.peg.683 Contig51 105 98 100 hypothetical protein Cvib_0523 [Chlorobium phaeovibrioides DSM 265] Iron clusterfig|319225.9.peg.684 Contig51 169 98 100 flavodoxin [Chlorobium phaeovibrioides DSM 265] Iron clusterfig|319225.9.peg.685 Contig51 201 98 100 Ferritin Dps family protein [Chlorobium phaeovibrioides DSM 265] Iron clusterfig|319225.9.peg.686 Contig51 118 95 100 hypothetical protein Cvib_0526 [Chlorobium phaeovibrioides DSM 265] Iron clusterfig|319225.9.peg.705 Contig51 56 48 49 hypothetical protein Paes_0777 [Prosthecochloris aestuarii DSM 271]fig|319225.9.peg.706 Contig51 62 28 74 hypothetical protein [Nitritalea halalkaliphila]fig|319225.9.peg.708 Contig51 48 87 81 N-6 DNA methylase [Desulfococcus multivorans]fig|319225.9.peg.709 Contig51 52 39 94 hypothetical protein [Streptosporangium roseum DSM 43021]
fig|319225.9.peg.710 Contig51 167 62 68 type I restriction-modification system subunit M [Dehalogenimonas lykanthroporepellens BL-DC-9]
fig|319225.9.peg.712 Contig51 64 - - Hypothetical protein (without blast)fig|319225.9.peg.715 Contig51 45 67 82 hypothetical protein Cag_1199 [Chlorobium chlorochromatii CaD3]fig|319225.9.peg.729 Contig51 83 29 63 ABC transporter [Treponema succinifaciens DSM 2489]fig|319225.9.peg.730 Contig51 39 48 82 hypothetical protein [Metascardovia criceti]fig|319225.9.peg.732 Contig51 75 - - Hypothetical protein (without blast)fig|319225.9.peg.733 Contig51 45 71 55 hypothetical protein Plut_0699 [Chlorobium luteolum DSM 273]fig|319225.9.peg.734 Contig51 60 41 88 hypothetical protein Plut_0706 [Chlorobium luteolum DSM 273]fig|319225.9.peg.739 Contig51 51 86 56 RND family efflux transporter [Chlorobium luteolum DSM 273]fig|319225.9.peg.744 Contig51 53 - - Hypothetical protein (without blast)fig|319225.9.peg.746 Contig43 63 92 61 imidazoleglycerol-phosphate dehydratase [Chlorobium luteolum DSM 273]fig|319225.9.peg.747 Contig43 79 - - Hypothetical protein (without blast)fig|319225.9.peg.752 Contig43 48 - - Hypothetical protein (without blast)
Table A.C5.2: List of proteins present en Chl. Luteolum CIII but absent in Chl luteolum DSM 273. In bold proteins commented in the text.

Chl. luteolum CIII protein ContigProtein Length
Identity (%)
Coverage (%)
Protein BLAST First Hit Comments
Table A.C5.2: Continued
fig|319225.9.peg.753 Contig43 53 63 88 hypothetical protein Cphamn1_1271 [Chlorobium phaeobacteroides BS1]fig|319225.9.peg.757 Contig43 46 - - Hypothetical protein (without blast)fig|319225.9.peg.769 Contig43 86 68 67 5'-3'-deoxyribonucleotidase [Gordonia rhizosphera]fig|319225.9.peg.770 Contig43 50 66 96 5'-3'-deoxyribonucleotidase [Eudoraea adriatica]fig|319225.9.peg.771 Contig43 40 - - Hypothetical protein (without blast)fig|319225.9.peg.776 Contig43 425 65 89 hypothetical protein [Desulfobacter postgatei]fig|319225.9.peg.777 Contig43 50 98 82 hypothetical protein Plut_0742 [Chlorobium luteolum DSM 273]fig|319225.9.peg.794 Contig43 59 - - Hypothetical protein (without blast)fig|319225.9.peg.795 Contig43 196 - - Hypothetical protein (without blast)fig|319225.9.peg.796 Contig43 201 65 24 hypothetical protein EhV359 [Emiliania huxleyi virus 86]fig|319225.9.peg.801 Contig43 42 - - Hypothetical protein (without blast)fig|319225.9.peg.806 Contig43 47 - - Hypothetical protein (without blast)fig|319225.9.peg.809 Contig43 47 80 100 phage integrase family protein [Chlorobium phaeobacteroides DSM 266] Promiscuous region 1fig|319225.9.peg.810 Contig43 79 69 99 phage integrase family protein [Chlorobium phaeobacteroides DSM 266] Promiscuous region 1fig|319225.9.peg.811 Contig43 423 78 98 phage resistance protein [Cupriavidus sp. HPC(L)] Promiscuous region 1fig|319225.9.peg.813 Contig30 58 45 89 hypothetical protein Cpha266_1600 [Chlorobium phaeobacteroides DSM 266] Promiscuous region 1fig|319225.9.peg.814 Contig30 78 35 66 KLTH0G08822p [Lachancea thermotolerans] Promiscuous region 1fig|319225.9.peg.815 Contig30 202 42 98 outer surface protein [Chlorobium tepidum TLS] Promiscuous region 1fig|319225.9.peg.819 Contig23 144 97 100 hypothetical protein Cvib_0100 [Chlorobium phaeovibrioides DSM 265] Promiscuous region 1
fig|319225.9.peg.820 Contig23 39 76 55XRE family plasmid maintenance system antidote protein [Chlorobium phaeobacteroides DSM 266]
Promiscuous region 1
fig|319225.9.peg.822 Contig23 406 87 100 hypothetical protein Cvib_1663 [Chlorobium phaeovibrioides DSM 265] Promiscuous region 1fig|319225.9.peg.823 Contig13 46 - - Hypothetical protein (without blast) Promiscuous region 1fig|319225.9.peg.824 Contig13 39 - - Hypothetical protein (without blast) Promiscuous region 1fig|319225.9.peg.825 Contig13 39 - - Hypothetical protein (without blast) Promiscuous region 1fig|319225.9.peg.830 Contig13 38 - - Hypothetical protein (without blast) Promiscuous region 1fig|319225.9.peg.831 Contig13-12 174 91 100 PAS/PAC sensor hybrid histidine kinase [Chlorobium luteolum DSM 273] Promiscuous region 1fig|319225.9.peg.833 Contig12 42 - - Hypothetical protein (without blast) Promiscuous region 1fig|319225.9.peg.834 Contig12 77 82 100 transposase IS4 family protein [Pelodictyon phaeoclathratiforme BU-1] Promiscuous region 1fig|319225.9.peg.836 Contig12 81 61 51 hypothetical protein [Chlorobium ferrooxidans] Promiscuous region 1
fig|319225.9.peg.837 Contig12 47 64 98CopG/Arc/MetJ family addiction module antidote protein [Chlorobium limicola DSM 245]
Promiscuous region 1
fig|319225.9.peg.838 Contig12 100 86 100 plasmid stabilization system [Chlorobium limicola DSM 245] Promiscuous region 1fig|319225.9.peg.839 Contig12 165 92 92 invertase/recombinase like protein [Chlorobium luteolum DSM 273] Promiscuous region 1fig|319225.9.peg.840 Contig12 219 38 97 KfrA protein [Xanthomonas axonopodis] Promiscuous region 1fig|319225.9.peg.841 Contig12 44 40 100 hypothetical protein [Nitrosococcus oceani] Promiscuous region 1fig|319225.9.peg.842 Contig12 401 90 99 type I restriction-modification system M subunit [Desulfarculus baarsii DSM 2075] Promiscuous region 1fig|319225.9.peg.843 Contig12 508 47 99 ATP-dependent DNA helicase [Methanosarcina acetivorans C2A] Promiscuous region 1fig|319225.9.peg.844 Contig12 511 85 100 DNA methyltransferase [Alcanivorax pacificus] Promiscuous region 1fig|319225.9.peg.845 Contig12 777 30 99 Hypothetical protein XCAW_a00004 [Xanthomonas citri subsp. citri Aw12879] Promiscuous region 1
fig|319225.9.peg.846 Contig12 399 72 100restriction modification system DNA specificity domain-containing protein [Desulfarculus baarsii DSM 2075]
Promiscuous region 1
fig|319225.9.peg.847 Contig12 494 71 99 hypothetical protein Acife_0670 [Acidithiobacillus ferrivorans SS3] Promiscuous region 1fig|319225.9.peg.848 Contig12 317 57 95 hypothetical protein Acife_0671 [Acidithiobacillus ferrivorans SS3] Promiscuous region 1fig|319225.9.peg.849 Contig12 993 85 99 HsdR family type I site-specific deoxyribonuclease [Desulfovibrio alaskensis G20] Promiscuous region 1fig|319225.9.peg.850 Contig12 2092 73 100 hypothetical protein BN69_1887 [Methylocystis sp. SC2] Promiscuous region 1fig|319225.9.peg.851 Contig12 102 49 82 hypothetical protein [Methylocystis parvus] Promiscuous region 1fig|319225.9.peg.853 Contig12 40 - - Hypothetical protein (without blast) Promiscuous region 1fig|319225.9.peg.854 Contig12 49 77 100 hypothetical protein [Pedosphaera parvula] Promiscuous region 1fig|319225.9.peg.856 Contig12 50 53 86 hypothetical protein Clim_0913 [Chlorobium limicola DSM 245] Promiscuous region 1fig|319225.9.peg.858 Contig12 49 - - Hypothetical protein (without blast) Promiscuous region 1fig|319225.9.peg.861 Contig12 323 66 100 sodium:calcium antiporter [Desulfovibrio longus] Promiscuous region 1fig|319225.9.peg.864 Contig12 270 65 97 Ser/Thr protein phosphatase [Chlorobium luteolum DSM 273] Promiscuous region 1fig|319225.9.peg.865 Contig12 43 54 62 acetolactate synthase putative [alpha proteobacterium BAL199] Promiscuous region 1fig|319225.9.peg.867 Contig22 169 66 99 hypothetical protein Ppha_0792 [Pelodictyon phaeoclathratiforme BU-1] Promiscuous region 1fig|319225.9.peg.868 Contig22 279 65 98 hypothetical protein [Thiothrix flexilis] Promiscuous region 1fig|319225.9.peg.869 Contig22 51 - - Hypothetical protein (without blast) Promiscuous region 1fig|319225.9.peg.887 Contig22 38 57 62 Patatin [Oscillatoria nigro-viridis PCC 7112]fig|319225.9.peg.908 Contig22 90 31 88 hypothetical protein [Commensalibacter intestini]fig|319225.9.peg.910 Contig22 46 50 80 transcription factor putative [Ricinus communis]fig|319225.9.peg.916 Contig22 194 62 97 abortive phage resistance protein-like protein [Desulfovibrio alaskensis G20]fig|319225.9.peg.917 Contig22 446 72 98 abortive phage resistance protein [Nitrosomonas europaea ATCC 19718]fig|319225.9.peg.920 Contig22 38 - - Hypothetical protein (without blast)fig|319225.9.peg.934 Contig29 208 87 51 thiamine monophosphate synthase [Chlorobium luteolum DSM 273]fig|319225.9.peg.936 Contig29 64 - - Hypothetical protein (without blast)fig|319225.9.peg.937 Contig29 40 - - Hypothetical protein (without blast)fig|319225.9.peg.973 Contig46 63 43 77 hypothetical protein [Kaistia granuli]fig|319225.9.peg.1001 Contig46 43 - - Hypothetical protein (without blast)fig|319225.9.peg.1006 Contig46 160 95 100 hypothetical protein Cvib_0886 [Chlorobium phaeovibrioides DSM 265]fig|319225.9.peg.1007 Contig46 1189 95 100 hypothetical protein Cvib_0885 [Chlorobium phaeovibrioides DSM 265]fig|319225.9.peg.1040 Contig36 39 - - Hypothetical protein (without blast)fig|319225.9.peg.1045 Contig36 47 - - Hypothetical protein (without blast)fig|319225.9.peg.1062 Contig36 82 37 88 hypothetical protein Plut_1094 [Chlorobium luteolum DSM 273]fig|319225.9.peg.1099 Contig18 256 60 97 hypothetical protein Cvib_0813 [Chlorobium phaeovibrioides DSM 265]fig|319225.9.peg.1112 Contig18 39 - - Hypothetical protein (without blast)fig|319225.9.peg.1126 Contig18 112 56 88 hypothetical protein [Chlorobium ferrooxidans]fig|319225.9.peg.1130 Contig18 41 53 75 transposase-like [Chlorobium luteolum DSM 273]fig|319225.9.peg.1131 Contig18 38 - - Hypothetical protein (without blast)fig|319225.9.peg.1142 Contig11 92 - - Hypothetical protein (without blast)fig|319225.9.peg.1143 Contig11 38 - - Hypothetical protein (without blast)fig|319225.9.peg.1144 Contig11 261 55 100 hypothetical protein Cag_0645 [Chlorobium chlorochromatii CaD3]fig|319225.9.peg.1146 Contig11 214 45 88 hypothetical protein Cphamn1_1562 [Chlorobium phaeobacteroides BS1]
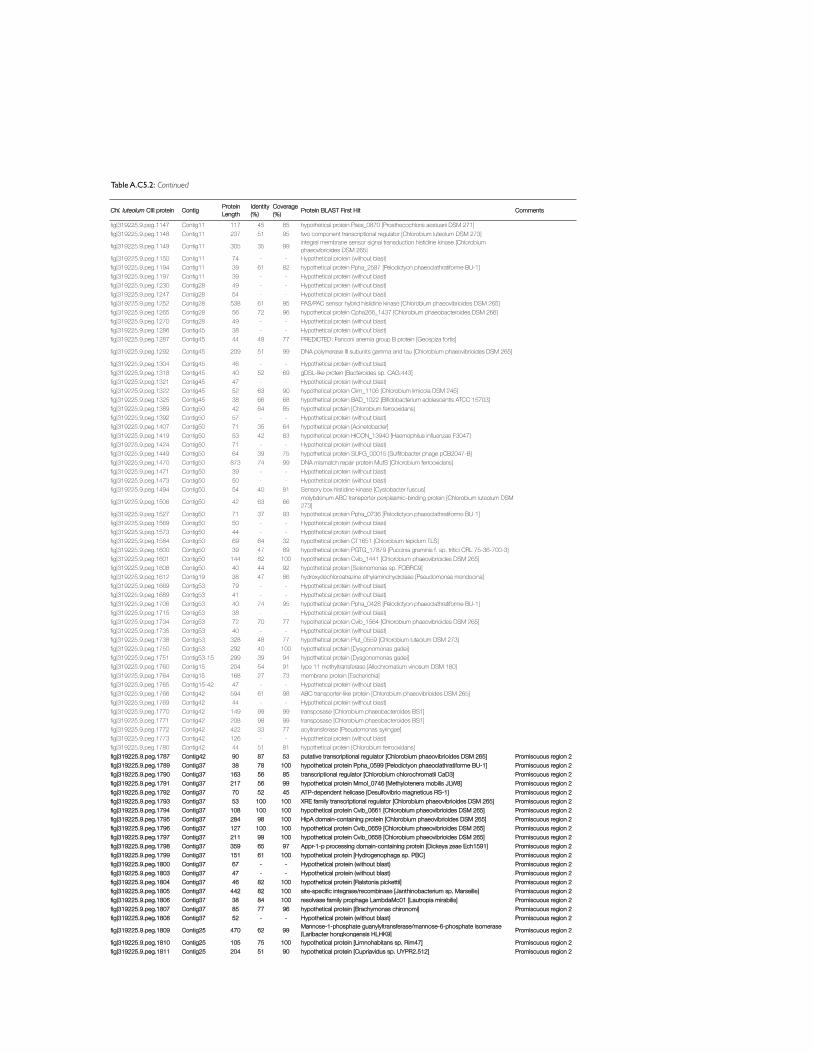
Chl. luteolum CIII protein ContigProtein Length
Identity (%)
Coverage (%)
Protein BLAST First Hit Comments
Table A.C5.2: Continued
fig|319225.9.peg.1147 Contig11 117 45 85 hypothetical protein Paes_0870 [Prosthecochloris aestuarii DSM 271]fig|319225.9.peg.1148 Contig11 237 51 95 two component transcriptional regulator [Chlorobium luteolum DSM 273]
fig|319225.9.peg.1149 Contig11 305 35 99 integral membrane sensor signal transduction histidine kinase [Chlorobium phaeovibrioides DSM 265]
fig|319225.9.peg.1150 Contig11 74 - - Hypothetical protein (without blast)fig|319225.9.peg.1194 Contig11 39 61 82 hypothetical protein Ppha_2587 [Pelodictyon phaeoclathratiforme BU-1]fig|319225.9.peg.1197 Contig11 39 - - Hypothetical protein (without blast)fig|319225.9.peg.1230 Contig28 49 - - Hypothetical protein (without blast)fig|319225.9.peg.1247 Contig28 54 - - Hypothetical protein (without blast)fig|319225.9.peg.1252 Contig28 538 61 95 PAS/PAC sensor hybrid histidine kinase [Chlorobium phaeovibrioides DSM 265]fig|319225.9.peg.1265 Contig28 56 72 96 hypothetical protein Cpha266_1437 [Chlorobium phaeobacteroides DSM 266]fig|319225.9.peg.1270 Contig28 49 - - Hypothetical protein (without blast)fig|319225.9.peg.1286 Contig45 38 - - Hypothetical protein (without blast)fig|319225.9.peg.1287 Contig45 44 48 77 PREDICTED: Fanconi anemia group B protein [Geospiza fortis]
fig|319225.9.peg.1292 Contig45 209 51 99 DNA polymerase III subunits gamma and tau [Chlorobium phaeovibrioides DSM 265]
fig|319225.9.peg.1304 Contig45 46 - - Hypothetical protein (without blast)fig|319225.9.peg.1318 Contig45 40 52 69 gDSL-like protein [Bacteroides sp. CAG:443]fig|319225.9.peg.1321 Contig45 47 - - Hypothetical protein (without blast)fig|319225.9.peg.1322 Contig45 52 63 90 hypothetical protein Clim_1106 [Chlorobium limicola DSM 245]fig|319225.9.peg.1325 Contig45 38 66 68 hypothetical protein BAD_1022 [Bifidobacterium adolescentis ATCC 15703]fig|319225.9.peg.1389 Contig50 42 64 85 hypothetical protein [Chlorobium ferrooxidans]fig|319225.9.peg.1392 Contig50 57 - - Hypothetical protein (without blast)fig|319225.9.peg.1407 Contig50 71 35 64 hypothetical protein [Acinetobacter]fig|319225.9.peg.1419 Contig50 53 42 83 hypothetical protein HICON_13940 [Haemophilus influenzae F3047]fig|319225.9.peg.1424 Contig50 71 - - Hypothetical protein (without blast)fig|319225.9.peg.1449 Contig50 64 39 75 hypothetical protein SUFG_00015 [Sulfitobacter phage pCB2047-B]fig|319225.9.peg.1470 Contig50 873 74 99 DNA mismatch repair protein MutS [Chlorobium ferrooxidans]fig|319225.9.peg.1471 Contig50 39 - - Hypothetical protein (without blast)fig|319225.9.peg.1473 Contig50 50 - - Hypothetical protein (without blast)fig|319225.9.peg.1494 Contig50 54 40 91 Sensory box histidine kinase [Cystobacter fuscus]
fig|319225.9.peg.1506 Contig50 42 63 66 molybdenum ABC transporter periplasmic-binding protein [Chlorobium luteolum DSM 273]
fig|319225.9.peg.1527 Contig50 71 37 93 hypothetical protein Ppha_0736 [Pelodictyon phaeoclathratiforme BU-1]fig|319225.9.peg.1569 Contig50 50 - - Hypothetical protein (without blast)fig|319225.9.peg.1573 Contig50 44 - - Hypothetical protein (without blast)fig|319225.9.peg.1584 Contig50 69 64 32 hypothetical protein CT1651 [Chlorobium tepidum TLS]fig|319225.9.peg.1600 Contig50 39 47 89 hypothetical protein PGTG_17879 [Puccinia graminis f. sp. tritici CRL 75-36-700-3]fig|319225.9.peg.1601 Contig50 144 82 100 hypothetical protein Cvib_1441 [Chlorobium phaeovibrioides DSM 265]fig|319225.9.peg.1608 Contig50 40 44 92 hypothetical protein [Selenomonas sp. FOBRC9]fig|319225.9.peg.1612 Contig19 38 47 86 hydroxydechloroatrazine ethylaminohydrolase [Pseudomonas mendocina]fig|319225.9.peg.1669 Contig53 79 - - Hypothetical protein (without blast)fig|319225.9.peg.1689 Contig53 41 - - Hypothetical protein (without blast)fig|319225.9.peg.1706 Contig53 40 74 95 hypothetical protein Ppha_0428 [Pelodictyon phaeoclathratiforme BU-1]fig|319225.9.peg.1715 Contig53 38 - - Hypothetical protein (without blast)fig|319225.9.peg.1734 Contig53 72 70 77 hypothetical protein Cvib_1564 [Chlorobium phaeovibrioides DSM 265]fig|319225.9.peg.1735 Contig53 40 - - Hypothetical protein (without blast)fig|319225.9.peg.1738 Contig53 328 48 77 hypothetical protein Plut_0559 [Chlorobium luteolum DSM 273]fig|319225.9.peg.1750 Contig53 292 40 100 hypothetical protein [Dysgonomonas gadei]fig|319225.9.peg.1751 Contig53-15 299 39 94 hypothetical protein [Dysgonomonas gadei]fig|319225.9.peg.1760 Contig15 204 54 91 type 11 methyltransferase [Allochromatium vinosum DSM 180]fig|319225.9.peg.1764 Contig15 168 27 73 membrane protein [Escherichia]fig|319225.9.peg.1765 Contig15-42 47 - - Hypothetical protein (without blast)fig|319225.9.peg.1766 Contig42 594 61 98 ABC transporter-like protein [Chlorobium phaeovibrioides DSM 265]fig|319225.9.peg.1769 Contig42 44 - - Hypothetical protein (without blast)fig|319225.9.peg.1770 Contig42 149 99 99 transposase [Chlorobium phaeobacteroides BS1]fig|319225.9.peg.1771 Contig42 208 98 99 transposase [Chlorobium phaeobacteroides BS1]fig|319225.9.peg.1772 Contig42 422 33 77 acyltransferase [Pseudomonas syringae]fig|319225.9.peg.1773 Contig42 126 - - Hypothetical protein (without blast)fig|319225.9.peg.1780 Contig42 44 51 81 hypothetical protein [Chlorobium ferrooxidans]fig|319225.9.peg.1787 Contig42 90 87 53 putative transcriptional regulator [Chlorobium phaeovibrioides DSM 265] Promiscuous region 2fig|319225.9.peg.1789 Contig37 38 78 100 hypothetical protein Ppha_0599 [Pelodictyon phaeoclathratiforme BU-1] Promiscuous region 2fig|319225.9.peg.1790 Contig37 163 56 85 transcriptional regulator [Chlorobium chlorochromatii CaD3] Promiscuous region 2fig|319225.9.peg.1791 Contig37 217 56 99 hypothetical protein Mmol_0746 [Methylotenera mobilis JLW8] Promiscuous region 2fig|319225.9.peg.1792 Contig37 70 52 45 ATP-dependent helicase [Desulfovibrio magneticus RS-1] Promiscuous region 2fig|319225.9.peg.1793 Contig37 53 100 100 XRE family transcriptional regulator [Chlorobium phaeovibrioides DSM 265] Promiscuous region 2fig|319225.9.peg.1794 Contig37 108 100 100 hypothetical protein Cvib_0661 [Chlorobium phaeovibrioides DSM 265] Promiscuous region 2fig|319225.9.peg.1795 Contig37 284 98 100 HipA domain-containing protein [Chlorobium phaeovibrioides DSM 265] Promiscuous region 2fig|319225.9.peg.1796 Contig37 127 100 100 hypothetical protein Cvib_0659 [Chlorobium phaeovibrioides DSM 265] Promiscuous region 2fig|319225.9.peg.1797 Contig37 211 99 100 hypothetical protein Cvib_0658 [Chlorobium phaeovibrioides DSM 265] Promiscuous region 2fig|319225.9.peg.1798 Contig37 359 65 97 Appr-1-p processing domain-containing protein [Dickeya zeae Ech1591] Promiscuous region 2fig|319225.9.peg.1799 Contig37 151 61 100 hypothetical protein [Hydrogenophaga sp. PBC] Promiscuous region 2fig|319225.9.peg.1800 Contig37 67 - - Hypothetical protein (without blast) Promiscuous region 2fig|319225.9.peg.1803 Contig37 47 - - Hypothetical protein (without blast) Promiscuous region 2fig|319225.9.peg.1804 Contig37 46 82 100 hypothetical protein [Ralstonia pickettii] Promiscuous region 2fig|319225.9.peg.1805 Contig37 442 82 100 site-specific integrase/recombinase [Janthinobacterium sp. Marseille] Promiscuous region 2fig|319225.9.peg.1806 Contig37 38 84 100 resolvase family prophage LambdaMc01 [Lautropia mirabilis] Promiscuous region 2fig|319225.9.peg.1807 Contig37 85 77 96 hypothetical protein [Brachymonas chironomi] Promiscuous region 2fig|319225.9.peg.1808 Contig37 52 - - Hypothetical protein (without blast) Promiscuous region 2
fig|319225.9.peg.1809 Contig25 470 62 99Mannose-1-phosphate guanylyltransferase/mannose-6-phosphate isomerase [Laribacter hongkongensis HLHK9]
Promiscuous region 2
fig|319225.9.peg.1810 Contig25 105 75 100 hypothetical protein [Limnohabitans sp. Rim47] Promiscuous region 2fig|319225.9.peg.1811 Contig25 204 51 90 hypothetical protein [Cupriavidus sp. UYPR2.512] Promiscuous region 2

Chl. luteolum CIII protein ContigProtein Length
Identity (%)
Coverage (%)
Protein BLAST First Hit Comments
Table A.C5.2: Continued
fig|319225.9.peg.1812 Contig25 358 54 95 transposase IS116/IS110/IS902 [Comamonas testosteroni CNB-2] Promiscuous region 2fig|319225.9.peg.1813 Contig25 41 74 95 Excinuclease ABC C subunit domain protein partial [Methylosinus trichosporium] Promiscuous region 2fig|319225.9.peg.1814 Contig25 157 98 100 hypothetical protein Cvib_0613 [Chlorobium phaeovibrioides DSM 265] Promiscuous region 2fig|319225.9.peg.1818 Contig25 325 50 98 glycosyl transferase family protein [Chlorobium limicola DSM 245] Promiscuous region 2fig|319225.9.peg.1819 Contig25 46 39 62 NADH dehydrogenase subunit C [Methylophaga aminisulfidivorans] Promiscuous region 2fig|319225.9.peg.1821 Contig25 157 68 71 hypothetical protein Plut_1888 [Chlorobium luteolum DSM 273] Promiscuous region 2fig|319225.9.peg.1822 Contig25-14 252 63 53 lipopolysaccharide biosynthesis protein [Chlorobium phaeovibrioides DSM 265] Promiscuous region 2fig|319225.9.peg.1824 Contig10 173 87 95 hypothetical protein Plut_1885 [Chlorobium luteolum DSM 273] Promiscuous region 2fig|319225.9.peg.1827 Contig10 53 46 67 molybdopterin oxidoreductase [Burkholderia phymatum STM815]fig|319225.9.peg.1828 Contig10 38 - - Hypothetical protein (without blast)fig|319225.9.peg.1830 Contig10 44 - - Hypothetical protein (without blast)fig|319225.9.peg.1831 Contig10 51 - - Hypothetical protein (without blast)fig|319225.9.peg.1834 Contig10 38 - - Hypothetical protein (without blast)fig|319225.9.peg.1837 Contig10 74 42 73 hypothetical protein B5T_03156 [Alcanivorax dieselolei B5]fig|319225.9.peg.1838 Contig10 50 83 59 transposase IS4 family protein [Chlorobium limicola DSM 245]fig|319225.9.peg.1841 Contig31 76 83 97 AsnC family transcriptional regulator [Chlorobium ferrooxidans]fig|319225.9.peg.1851 Contig31 50 36 90 iron transporter FeoB [Sphingomonas melonis]fig|319225.9.peg.1860 Contig31 77 34 62 hypothetical protein Ppha_0977 [Pelodictyon phaeoclathratiforme BU-1]fig|319225.9.peg.1861 Contig31 62 - - Hypothetical protein (without blast)fig|319225.9.peg.1913 Contig31 41 - - Hypothetical protein (without blast)fig|319225.9.peg.1929 Contig31 40 - - Hypothetical protein (without blast)fig|319225.9.peg.1936 Contig31 207 92 100 alpha/beta hydrolase [Chlorobium phaeobacteroides DSM 266] BChl e cluster
fig|319225.9.peg.1937 Contig31 219 96 99isoprenylcysteine carboxyl methyltransferase [Pelodictyon phaeoclathratiforme BU-1]
BChl e cluster
fig|319225.9.peg.1938 Contig31 348 84 100 transposase and inactivated derivatives [Chlorobium phaeobacteroides DSM 266] BChl e cluster
fig|319225.9.peg.1940 Contig31 427 96 100coenzyme F420 hydrogenase/dehydrogenase subunit beta [Chlorobium phaeobacteroides DSM 266]
BChl e cluster
fig|319225.9.peg.1941 Contig31 258 93 100short-chain dehydrogenase/reductase SDR [Pelodictyon phaeoclathratiforme BU-1]
BChl e cluster-SDR
fig|319225.9.peg.1942 Contig31 55 93 100 hypothetical protein Cpha266_0190 [Chlorobium phaeobacteroides DSM 266] BChl e clusterfig|319225.9.peg.1943 Contig31 122 87 100 hypothetical protein Ppha_2742 [Pelodictyon phaeoclathratiforme BU-1] BChl e clusterfig|319225.9.peg.1944 Contig31 514 95 100 hypothetical protein Cpha266_0192 [Chlorobium phaeobacteroides DSM 266] BChl e cluster-cruBfig|319225.9.peg.1946 Contig41 294 95 100 aldolase [Chlorobium phaeobacteroides DSM 266] BChl e clusterfig|319225.9.peg.1947 Contig41 706 97 100 short chain dehydrogenase [Chlorobium phaeobacteroides DSM 266] BChl e cluster
fig|319225.9.peg.1948 Contig41 402 99 100 hypothetical protein Cpha266_0196 [Chlorobium phaeobacteroides DSM 266]BChl e cluster-bciD (RSAM)
fig|319225.9.peg.1949 Contig41 60 80 100 hypothetical protein Cpha266_0197 [Chlorobium phaeobacteroides DSM 266] BChl e cluster
fig|319225.9.peg.1950 Contig41 159 93 1002-oxoglutarate synthase subunit 2-oxoacid-ferredoxin oxidoreductase subunit CD [Chlorobium phaeobacteroides DSM 266]
BChl e cluster-bchF3
fig|319225.9.peg.1951 Contig41 453 94 99 radical SAM domain-containing protein [Chlorobium phaeobacteroides DSM 266] BChl e cluster-bchQ2
fig|319225.9.peg.1953 Contig41 204 86 100proto-chlorophyllide reductase 57 kD subunit [Chlorobium phaeobacteroides DSM 266]
BChl e cluster
fig|319225.9.peg.1954 Contig41 60 92 100 chlorosome envelope protein B [Chlorobium phaeobacteroides DSM 266] BChl e clusterfig|319225.9.peg.1955 Contig41 54 - - Hypothetical protein (without blast) BChl e clusterfig|319225.9.peg.1965 Contig41 78 86 99 hypothetical protein Cvib_1657 [Chlorobium phaeovibrioides DSM 265]fig|319225.9.peg.1969 Contig41 46 - - Hypothetical protein (without blast)fig|319225.9.peg.1974 Contig27 59 - - Hypothetical protein (without blast)fig|319225.9.peg.1981 Contig27 39 38 82 hypothetical protein partial [[Clostridium] difficile]fig|319225.9.peg.1997 Contig27 39 84 100 hypothetical protein Clim_2404 [Chlorobium limicola DSM 245]fig|319225.9.peg.1999 Contig27 57 - - Hypothetical protein (without blast)fig|319225.9.peg.2031 Contig27 40 - - Hypothetical protein (without blast)fig|319225.9.peg.2036 Contig27 39 - - Hypothetical protein (without blast)fig|319225.9.peg.2041 Contig27 54 38 89 possible N-carbamoyl-L-amino-acid hydrolase [Weissella paramesenteroides]fig|319225.9.peg.2059 Contig27 435 100 100 transposase IS4 family protein [Chlorobium phaeobacteroides DSM 266]
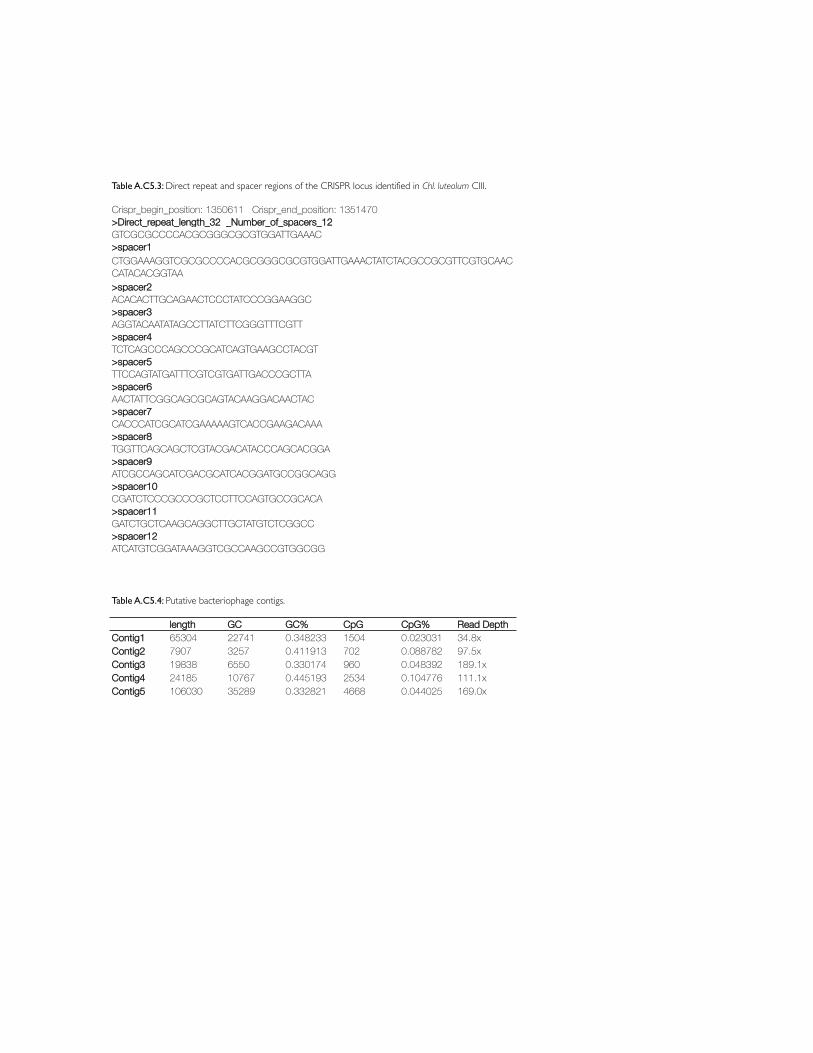
>spacer1
>spacer2
>spacer3
>spacer4
>spacer5
>spacer6
>spacer7
>spacer8
>spacer9
>spacer10
>spacer11
>spacer12
length GC GC% CpG CpG% Read Depth
Contig1 65304 22741 0.348233 1504 0.023031 34.8xContig2 7907 3257 0.411913 702 0.088782 97.5xContig3 19838 6550 0.330174 960 0.048392 189.1xContig4 24185 10767 0.445193 2534 0.104776 111.1xContig5 106030 35289 0.332821 4668 0.044025 169.0x
CGATCTCCCGCCCGCTCCTTCCAGTGCCGCACA
TCTCAGCCCAGCCCGCATCAGTGAAGCCTACGT
GTCGCGCCCCACGCGGGCGCGTGGATTGAAAC
Table A.C5.3: Direct repeat and spacer regions of the CRISPR locus identified in Chl. luteolum CIII.
Table A.C5.4: Putative bacteriophage contigs.
Crispr_begin_position: 1350611 Crispr_end_position: 1351470>Direct_repeat_length_32 _Number_of_spacers_12
CTGGAAAGGTCGCGCCCCACGCGGGCGCGTGGATTGAAACTATCTACGCCGCGTTCGTGCAACCATACACGGTAA
ACACACTTGCAGAACTCCCTATCCCGGAAGGC
AGGTACAATATAGCCTTATCTTCGGGTTTCGTT
GATCTGCTCAAGCAGGCTTGCTATGTCTCGGCC
ATCATGTCGGATAAAGGTCGCCAAGCCGTGGCGG
TTCCAGTATGATTTCGTCGTGATTGACCCGCTTA
AACTATTCGGCAGCGCAGTACAAGGACAACTAC
CACCCATCGCATCGAAAAAGTCACCGAAGACAAA
TGGTTCAGCAGCTCGTACGACATACCCAGCACGGA
ATCGCCAGCATCGACGCATCACGGATGCCGGCAGG

Table A.C
5.5: Predicted host-acquired auxiliary metabolic genes for putative bacteriophage contigs 3 and 5.
Putative ClassificationO
RFStart
StopO
rientation%
identityal. length
Hit IDHit Annotation
Hit TaxaContig3
Contig3_11
252-
5775
MCA2930-NC_002977
prophage MuM
c02, head decoration protein M
ethylococcus capsulatus str. Bath
Myovirus
Contig3_21474
1875-
31122
JCVI_PEP_1113079352272-UDEL_CHESAPEAKE_VIRO
PLANKTON_SM
PL UDEL_CHESAPEAKE_VIRO
PLANKTON_SM
PL
Contig3_31903
4561-
48448
gi448936869-KC465899 term
inasee large subunit Pelagibacter phage HTVC008M
Contig3_44563
6551-
38212
gi448936864-KC465899 proxim
al tail sheath stabilization Pelagibacter phage HTVC008M
Contig3_56634
7257-
41165
gi113200614-NC_008296 14 neck protein
Synechococcus phage syn9
Contig3_67261
8043-
29190
JCVI_PEP_1113079359376-UDEL_CHESAPEAKE_VIRO
PLANKTON_SM
PL UDEL_CHESAPEAKE_VIRO
PLANKTON_SM
PL
Contig3_78058
9824-
40142
SAK_0759-NC_007432 prophage Lam
bdaSa04, minor structural protein
Streptococcus agalactiae A909Contig3_8
985813594
-35
271gi448936843-KC465899
baseplate wedge Pelagibacter phage HTVC008M
Contig3_913598
14008-
37124
gi58532890-NC_006820 25 tail lysozym
e Synechococcus phage S-PM
2Contig3_10
1453917122
-26
284gi448936818-KC465899
structural protein Pelagibacter phage HTVC008M
Contig5Contig5_1
1825
+45
168gi448936853-KC465899
hypothetical protein Pelagibacter phage HTVC008M
Myovirus
Contig5_21953
4884-
37464
gi113200684-NC_008296 41 41 helicase
Synechococcus phage syn9Contig5_3
48925789
-68
134HM
PREF0381_0731-NZ_AEPW01000024
dUTP diphosphatase Eubacterium
saburreum DSM
3986Contig5_4
76878534
+34
234gi448936812-KC465899
baseplate hub subunit Pelagibacter phage HTVC008M
Contig5_512302
13156-
42247
gi58533011-NC_006820 32 single-stranded DNA binding protein
Synechococcus phage S-PM2
Contig5_614114
16014-
49191
jgi_96647_7147.m000009-Volca1
hypothetical protein Volvox carteri
Contig5_716072
18892-
60138
JCVI_PEP_1113079336300-UDEL_CHESAPEAKE_VIRO
PLANKTON_SM
PL UDEL_CHESAPEAKE_VIRO
PLANKTON_SM
PL
Contig5_818949
19923-
62224
JCVI_PEP_1113079330680-UDEL_CHESAPEAKE_VIRO
PLANKTON_SM
PL UDEL_CHESAPEAKE_VIRO
PLANKTON_SM
PL
Contig5_919942
22297-
31285
gi38640254-NC_005260 rnh RnaseH
Aeromonas phage Aeh1
Contig5_1022330
24590-
36311
gi412993653-FO082278
COG
0438: Glycosyltransferase (ISS)
Bathycoccus prasinosContig5_11
3133631797
+45
136gi18071215-NC_003324
hypothetical protein Sinorhizobium
phage PBC5Contig5_12
3400034405
+42
139gi312281419-NC_006884
glutamine-dependent NAD(+) synthetase
Prochlorococcus phage P-SSM4
Contig5_1334423
35437-
30342
gi113200699-NC_008296 61 DNA prim
ase Synechococcus phage syn9
Contig5_1435522
37252+
40425
gi448936870-KC465899 tail sheath protein
Pelagibacter phage HTVC008MContig5_15
3765838203
+34
170gi448936871-KC465899
tail tube monom
er Pelagibacter phage HTVC008M
Contig5_1638748
40827+
42482
gi113200635-NC_008296 20 portal vertex protein
Synechococcus phage syn9Contig5_17
4320043833
+43
202gi61806308-NC_006884
21 prohead core scaffolding protein and protease Prochlorococcus phage P-SSM
4Contig5_18
4830249441
+28
319gi61806006-NC_006883
22 prohead core protein Prochlorococcus phage P-SSM
2Contig5_19
4948650817
+44
441gi448936880-KC465899
major capsid
Pelagibacter phage HTVC008MContig5_20
5089453715
+34
213gi161322921-ABIB01000021
glycosyltransferase, group 2 family
Kordia algicida OT-1Contig5_21
5407554635
+32
165gi61806313-NC_006884
3 gp3 Prochlorococcus phage P-SSM
4Contig5_22
5465156889
+36
311gi91220154-NZ_AAPR01000540
UvsW Psychroflexus torquis ATCC 700755
Contig5_2356893
59673+
35574
gi58532930-NC_006820 46 endonuclease subunit
Synechococcus phage S-PM2
Contig5_2461534
62666+
29257
Sala_1869-NC_008048 hypothetical protein
Sphingopyxis alaskensis RB2256Contig5_25
6268764967
+36
307gi61806033-NC_006883
44 clamp loader sm
all subunit Prochlorococcus phage P-SSM
2Contig5_26
6498266768
+48
206EUR_29810-FP929042
thymidylate synthase, flavin-dependent
Eubacterium rectale DSM
17629Contig5_27
6677567758
+36
326ViPhICP1_gp191-NC_015157
hypothetical protein Vibrio phage ICP1
Contig5_2868120
70955+
36846
gi58532945-NC_006820 43 DNA polym
erase Synechococcus phage S-PM
2

Tabl
e A
.C5.
5: Continued
Puta
tive
Clas
sifica
tion
ORF
Star
tSt
opO
rient
atio
n%
iden
tity
al. le
ngth
Hit I
DHi
t Ann
otat
ion
Hit T
axa
Cont
ig5_2
971
604
7248
0-
4220
1gi2
8259
9019
-NC_
0136
97
base
plate
hub
sub
unit a
nd ta
il lys
ozym
e; s
imila
r to
YP_0
0146
9479
.1 g
p5 b
asep
late
hub
subu
nit a
nd ta
il lys
ozym
e D
eftia
pha
ge p
hiW-1
4
Cont
ig5_3
073
075
7358
4+
3616
4HM
PREF
0983
_023
37-N
Z_AC
TJ01
0000
53
puta
tive
hydr
olase
pro
tein
Ery
sipelo
tricha
ceae
bac
teriu
m 3
_1_5
3Co
ntig5
_31
7358
875
057
+28
250
Acj61
p202
-NC_
0146
61
gp30
DNA
ligas
e A
cinet
obac
ter p
hage
Acj6
1Co
ntig5
_32
7506
875
559
+37
160
Rvan
_313
6-NC
_014
664
met
allop
hosp
hoes
tera
se R
hodo
micr
obium
vann
ielii A
TCC
1710
0Co
ntig5
_33
7557
176
386
+49
160
Cpha
266_
0651
-NC_
0086
39
met
allop
hosp
hoes
tera
se C
hloro
bium
pha
eoba
cter
oides
DSM
266
Cont
ig5_3
476
719
8006
4+
4222
7RE
R_24
950-
NC_0
1249
0 hy
poth
etica
l pro
tein;
K07
074
Rho
doco
ccus
ery
thro
polis
PR4
Cont
ig5_3
581
939
8284
8+
4016
9gi2
0066
007-
NC_0
0352
4||A
C1_2
808-
NZ_A
BDV0
1000
026
Gp4
5 pr
otein
Clos
tridium
pha
ge p
hi362
6
Cont
ig5_3
682
904
8362
1+
4415
2RU
MLA
C_01
904-
NZ_A
BOU0
2000
045
hypo
thet
ical p
rote
in R
umino
cocc
us la
ctar
is AT
CC 2
9176
Cont
ig5_3
785
018
8750
4+
3833
7gi1
6132
6946
-ABI
B010
0000
1 hy
poth
etica
l pro
tein
|| RNA
ligas
e (A
TP)
Kor
dia a
lgicid
a OT
-1
Cont
ig5_3
887
546
8804
0+
3916
3SR
U_11
90-N
C_00
7677
||SRM
_013
76-
NC_0
1403
2||g
i2945
0719
1-NC
_014
032
HNH
endo
nucle
ase
dom
ain-c
onta
ining
pro
tein|
|HNH
en
donu
cleas
e S
alinib
acte
r rub
er D
SM 1
3855
Cont
ig5_3
988
062
8922
9+
4435
9Ha
lhy_3
676-
NC_0
1551
0 RN
A lig
ase,
DRB
0094
fam
ily H
alisc
omen
obac
ter h
ydro
ssis
DSM
110
0Co
ntig5
_40
9161
092
350
+39
233
GM
21_3
826-
NC_0
1291
8 hy
poth
etica
l pro
tein
Geo
bact
er s
p. M
21
Cont
ig5_4
192
377
9346
6+
4014
4gi3
3620
690-
NC_0
0506
6||g
i2386
9501
4-NC
_012
740
4 he
ad c
omple
tion
prot
ein||h
ead
com
pletio
n pr
otein
Ent
erob
acte
ria p
hage
RB4
9
Cont
ig5_4
294
040
9499
1+
4810
5VR
7_gp
129-
NC_0
1479
2 De
nV e
ndon
uclea
se V
N-g
lycos
ylase
UV
repa
ir en
zym
e E
nter
obac
teria
pha
ge vB
_Eco
M-V
R7
Cont
ig5_4
399
618
1000
05-
4710
7Ru
nsl_3
984-
NC_0
1570
3 HN
H en
donu
cleas
e R
unell
a sli
thyfo
rmis
DSM
195
94Co
ntig5
_44
1045
6510
4825
+60
84gi3
1806
5996
-NC_
0068
20
Hypo
thet
ical-P
rote
in | b
elong
ing to
T4-
LIKE
GC:
780
Syn
echo
cocc
us p
hage
S-P
M2
Cont
ig5_4
510
4843
1060
30+
3910
4m
ru_0
296-
NC_0
1379
0 hy
poth
etica
l pro
tein
Met
hano
brev
ibact
er ru
mina
ntium
M1
Red=
DNA
met
aboli
sm; B
lue=S
truct
ural
and
pack
aging
; Gre
en=L
ysis;
Purp
le=Pu
tativ
e ho
st d
erive
d
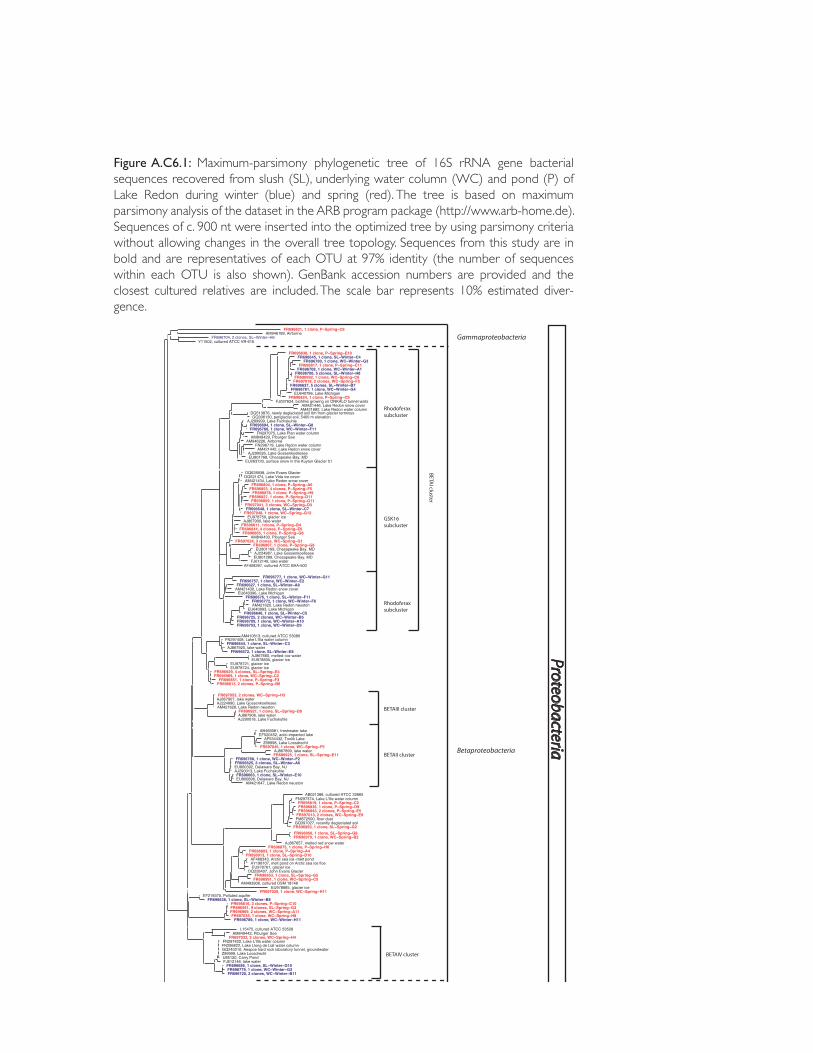
FR696821, 1 clone, PïSpringïC6AM946189, Airborne
FR696704, 2 clones, SLïWinterïH6
FR696838, 1 clone, PïSpringïE10FR696645, 1 clone, SLïWinterïC4
FR696780, 1 clone, WCïWinterïG3FR696817, 1 clone, PïSpringïC11
FR696708, 1 clone, WCïWinterïA1FR696706, 5 clones, SLïWinterïH8FR696992, 1 clone, WCïSpringïC6
FR697018, 2 clones, WCïSpringïF2FR696637, 5 clones, SLïWinterïB7FR696781, 1 clone, WCïWinterïG4
EU640786, Lake MichiganFR696824, 1 clone, PïSpringïC9
FJ037624, biofilms growing on ONKALO tunnel wallsAM421446, Lake Redon snow cover
AM421682, Lake Redon water columnDQ513876, newly deglaciated soil 0m from glacier terminusGQ306130, periglacial soil, 5400 m elevation
AJ289999, Lake FuchskuhleFR696694, 1 clone, SLïWinterïG8FR696766, 1 clone, WCïWinterïF11
FN297075, Lake Plan water columnAM849429, Piburger See
AM946226, AirborneFN296779, Lake Redon water columnAM421442, Lake Redon snow cover
AJ290026, Lake GossenkoelleseeEU801768, Chesapeake Bay, MD
EU263720, surface snow in the Kuytun Glacier 51
DQ628938, John Evans GlacierDQ521474, Lake Vida ice coverAM421434, Lake Redon snow cover
FR696804, 1 clone, PïSpringïA6FR696853, 4 clones, PïSpringïF5
FR696878, 1 clone, PïSpringïH9FR696827, 1 clone, PïSpringïD11FR696859, 1 clone, PïSpringïG11
FR697041, 3 clones, WCïSpringïD3FR696648, 1 clone, SLïWinterïC7
FR697048, 1 clone, WCïSpringïG12EU978750, glacier ice
AJ867900, lake waterFR696811, 1clone, PïSpringïB4
FR696844, 4 clones, PïSpringïE6FR696865, 1 clone, PïSpringïG6
AM849430, Piburger SeeFR697024, 3 clones, WCïSpringïG1
FR696867, 1 clone, PïSpringïG8EU801169, Chesapeake Bay, MD
AJ224987, Lake GossenkoelleseeEU801289, Chesapeake Bay, MD
FJ612149, lake water
FR696777, 1 clone, WCïWinterïG11FR696757, 1 clone, WCïWinterïE2
FR696627, 1 clone, SLïWinterïA8AM421430, Lake Redon snow cover
EU640396, Lake MichiganFR696676, 1 clone, SLïWinterïF11
FR696772, 1 clone, WCïWinterïF6AM421620, Lake Redon neuston
EU640993, Lake MichiganFR696646, 1 clone, SLïWinterïC5
FR696725, 2 clones, WCïWinterïB5FR696709, 1 clone, WCïWinterïA10FR696753, 1 clone, WCïWinterïD9
FN297408, Lake L'Illa water columnFR696644, 1 clone, SLïWinterïC3AJ867925, lake water
FR696672, 1 clone, SLïWinterïE8AJ867660, meltedïice waterEU978835, glacier ice
EU978721, glacier iceEU978724, glacier ice
FR696929, 4 clones, SLïSpringïE4FR696989, 1 clone, WCïSpringïC2
FR696851, 1 clone, PïSpringïF3FR696813, 2 clones, PïSpringïB6
FR697053, 2 clones, WCïSpringïH3AJ867907, lake waterAJ224990, Lake GossenkoelleseeAM421628, Lake Redon neuston
FR696921, 1 clone, SLïSpringïD8AJ867906, lake waterAJ290018, Lake Fuchskuhle
AB468981, freshwater lakeEF520452, acidïimpacted lake
AF534432, Toolik LakeZ99998, Lake Loosdrecht
FR697045, 1 clone, WCïSpringïF5AJ867899, lake waterFR696925, 1 clone, SLïSpringïE11
FR696768, 1 clone, WCïWinterïF2FR696625, 3 clones, SLïWinterïA6EU800392, Delaware Bay, NJAJ290013, Lake FuchskuhleFR696663, 1 clone, SLïWinterïE10EU800896, Delaware Bay, NJ
AM421647, Lake Redon neuston
FN297374, Lake L'Illa water columnFR696819, 1 clone, PïSpringïC2FR696836, 1 clone, PïSpringïD9FR696843, 2 clones, PïSpringïE5
FR697013, 2 clones, WCïSpringïE9FM872500, floor dustGQ397027, recently deglaciated soil
FR696950, 1 clone, SLïSpringïG2FR696956, 1 clone, SLïSpringïG8FR696979, 1 clone, WCïSpringïB2
AJ867657, melted red snow waterFR696875, 1 clone, PïSpringïH6
FR696803, 1 clone, PïSpringïA4FR696913, 1 clone, SLïSpringïD10
AF468343, Arctic sea iceïmelt pondAY198107, melt pond on Arctic sea ice floeEU978761, glacier ice
DQ228407, John Evans GlacierFR696953, 1 clone, SLïSpringïG5
FR696991, 1 clone, WCïSpringïC5
EU978685, glacier iceFR697030, 1 clone, WCïSpringïH11
EF219370, Polluted aquiferFR696638, 1 clone, SLïWinterïB8
FR696816, 3 clones, PïSpringïC10FR696951, 9 clones, SLïSpringïG3FR696969, 2 clones, WCïSpringïA11FR697035, 1 clone, WCïSpringïH8
FR696789, 1 clone, WCïWinterïH11
AM849442, Piburger SeeFR697032, 2 clones, WCïSpringïH4
FN297422, Lake L'Illa water columnFN296822, Lake Llong de Liat water columnGQ240210, Aespoe hard rock laboratory tunnel, groundwater Z99999, Lake LoosdrechtU85120, Carry PondFJ612146, lake water
FR696686, 1 clone, SLïWinterïG10FR696779, 1 clone, WCïWinterïG2FR696720, 2 clones, WCïWinterïB11
Rhodoferax subcluster
GSK16 subcluster
BETAIII cluster
BETAII clusterBetaproteobacteria
Gammaproteobacteria
Rhodoferax subcluster
BETAIV cluster
airet
cabo
etor
P
BETre
tsul
c IA
Y11502, cultured ATCC VR-616
AF408397, cultured ATCC BAA-500
AM410613, cultured ATCC 53080
AB021388, cultured ATCC 33665
AM493906, cultured DSM 18748
L15475, cultured ATCC 53528
Figure A.C6.1: Maximum-parsimony phylogenetic tree of 16S rRNA gene bacterial sequences recovered from slush (SL), underlying water column (WC) and pond (P) of Lake Redon during winter (blue) and spring (red). The tree is based on maximum parsimony analysis of the dataset in the ARB program package (http://www.arb-home.de). Sequences of c. 900 nt were inserted into the optimized tree by using parsimony criteria without allowing changes in the overall tree topology. Sequences from this study are in bold and are representatives of each OTU at 97% identity (the number of sequences within each OTU is also shown). GenBank accession numbers are provided and the closest cultured relatives are included. The scale bar represents 10% estimated diver-gence.

FN297422, Lake L Illa water columnFN296822, Lake Llong de Liat water columnGQ240210, Aespoe hard rock laboratory tunnel, groundwater Z99999, Lake LoosdrechtU85120, Carry PondFJ612146, lake water
FR696686, 1 clone, SLïWinterïG10FR696779, 1 clone, WCïWinterïG2FR696720, 2 clones, WCïWinterïB11
FR696728, 1 clone, WCïWinterïB8FR696730, 1 clone, WCïWinterïC1FR696731, 1 clone, WCïWinterïC10
FR696961, 1 clone, SLïSpringïH2FN297061, Lake Podo water column
FR696649, 1 clone, SLïWinterïC8FR696796, 1 clone, WCïWinterïH8
AJ289986, Lake FuchskuhleAM946191, AirborneAM990740, Petrosia ficiformis spongeFR696665, 1 clone, SLïWinterïE12
FR697020, 1 clone, WCïSpringïF6EU642848, submerged biofilm mats of a montane wetlandAJ867917, lake water
FR696621, 4 clones, SLïWinterïA2
FR696864, 1 clone, PïSpringïG5FR696735, 1 clone, WCïWinterïC3FR696977, 1 clone, WCïSpringïB1
FR696633, 1 clone, SLïWinterïB2FR696705, 2 clones, SLïWinterïH7FR696655, 2 clones, SLïWinterïD2
FR696670, 1 clone, SLïWinterïE6FR697015, 1 clone, WCïSpringïF10
EU978702, glacier iceFR696666, 2 clones, SLïWinterïE2
FR696752, 1 clone, WCïWinterïD8
FR696673, 3 clones, SLïWinterïE9FR696760, 5 clones, WCïWinterïE5
EU644133, active layer, lowïcentred polygon, near permafrost table; Rim_BottomFR696769, 1 clone, WCïWinterïF3
FN296967, Lake Roi water columnFN297782, Lake Gerber water columnFR696681, 2 clones, SLïWinterïF5
EU801889, Chesapeake Bay, MDFN297500, Lake Ibonet Perramo water columnFR696862, 1 clone, PïSpringïG3
FR697037, 1 clone, WCïSpringïA12FR696997, 9 clones, WCïSpringïD10
AF534436, Toolik Lake main station at 3 m depthFN296861, Lake Llong de Liat water columnFR696849, 1 clone, PïSpringïF12
FN296888, Lake Roi water columnFR696701, 5 clones, SLïWinterïH3FN297454, Lake L'Illa water columnEU703195, freshwater lake at altitude of 4082 maslFR696993, 1 clone, WCïSpringïC7
AY948069, Parker RiverFR696717, 1 clone, WCïWinterïA9
FR696697, 1 clone, SLïWinterïH10GQ340105, water column
FR696900, 5 clones, SLïSpringïC1FR696988, 3 clones, WCïSpringïC12FR696871, 2 clones, PïSpringïH12
FR696995, 1 clone, WCïSpringïC9FR696893, 5 clones, SLïSpringïB3FR697049, 8 clones, WCïSpringïG2
FR696822, 1 clone, PïSpringïC7FR696927, 1 clone, SLïSpringïE2
FR696850, 1 clone, PïSpringïF2FR697014, 1 clone, WCïSpringïF1
FR696815, 3 clones, PïSpringïB9FR696668, 1 clone, SLïWinterïE4FN297378, Lake L'Illa water column
FN297400, Lake L'Illa water columnFN296790, Lake Llong de Liat water columnEU978680, glacier ice
FN297353, Lake L'Illa water columnFR696771, 1 clone, WCïWinterïF5
FN297025, Lake Roi water columnFR697025, 1 clone, WCïSpringïG6
FN296497, Lake Llong Neuston samplesFR696759, 1 clone, WCïWinterïE4DQ675463, freshwater moraine lake at 5152m
FR696641, 1 clone, SLïWinterïC11FR696751, 1 clone, WCïWinterïD7
FJ006847, freshwater of Woopo wetlandEU800510, Delaware Bay, NJ
FR696624, 1 clone, SLïWinterïA5FR697009, 1 clone, WCïSpringïE12
EU800953, Delaware Bay, NJ
FN297380, Lake L'Illa water columnFN297395, Lake L'Illa water column
FR696798, 1 clone, PïSpringïA1FR696833, 1 clone, PïSpringïD6
FR696812, 10 clones, PïSpringïB5FR696820, 6 clones, PïSpringïC4FR696874, 2 clones, PïSpringïH5FR697054, 1 clone, WCïSpringïH7
FR696806, 1 clone, PïSpringïB1FR696888, 25 clones, SLïSpringïA9FR697006, 11 clones, WCïSpringïE1
FR696861, 1 clone, PïSpringïG2FR696866, 1 clone, PïSpringïG7FR696856, 1 clone, PïSpringïF8FR696808, 1 clone, PïSpringïB11
FR696814, 12 clones, PïSpringïB8FR696966, 23 clones, SLïSpringïH8FR697031, 10 clones, WCïSpringïH12DQ675476, glacier meltwater at 5800m
FN296912, Lake Roi water columnDQ981405, Puruogangri ice core
FN297458, Lake L'Illa water columnAY584584, Crater LakeFN297453, Lake L'Illa water column
EU640057, Lake MichiganFR696698, 6 clones, SLïWinterïH11FR696762, 1 clone, WCïWinterïE7
DQ675462, freshwater moraine lake at 5152mEU641766, Lake Michigan
AF361200, Rimov ReservoirDQ628942, subglacial water or ice or sediment
Sphingobacteria
Cytophagia
Alphaproteobacteria
BETAIV cluster
Deltaproteobacteria
Bacteroidia
Flavobacteria
sete
dior
etca
BAB119198, cultured ATCC 49361
AF090991, cultured ATCC 49418
AJ438173, cultured DSM 12145
AM230484, cultured DSM 30193
Figure A.C6.1: Continued

0.10
,EU640057, Lake Michigan
FR696698, 6 clones, SLïWinterïH11FR696762, 1 clone, WCïWinterïE7
DQ675462, freshwater moraine lake at 5152mEU641766, Lake Michigan
AF361200, Rimov ReservoirDQ628942, subglacial water or ice or sediment
FR696910, 1 clone, SLïSpringïC8FJ872373, rhizosphere
FR696696, 1 clone, SLïWinterïH1AJ289992, Lake Fuchskuhle
FN296971, Lake Roi water columnFJ612180, lake waterGQ340097, water columnFR696636, 3 clones, SLïWinterïB5FR696795, 30 clones, WCïWinterïH6FR696791, 2 clones, WCïWinterïH2FR696739, 1 clone, WCïWinterïC7
EU641499, Lake MichiganFJ612199, lake water
FN297204, Lake Plan water columnFN297150, Lake Plan water columnFR696703, 2 clones, SLïWinterïH5
EU641799, Lake MichiganFJ546829, mixolimnionFR696671, 1 clone, SLïWinterïE7FR696776, 3 clones, WCïWinterïG10FR696639, 1 clone, SLïWinterïC1
FR696722, 1 clone, WCïWinterïB2EU801097, Delaware Bay, NJ
FR696724, 1 clone, WCïWinterïB4FR696700, 2 clones, SLïWinterïH2FR696713, 1 clone, WCïWinterïA4
FN296839, Lake Llong de Liat water columnFR696721, 1 clone, WCïWinterïB12FR696786, 1 clone, WCïWinterïG9
FR696685, 2 clones, SLïWinterïF9
FR696743, 1 clone, WCïWinterïD10DQ675513, freshwater moraine lake at 5152m
FR696931, 1 clone, SLïSpringïE6
AM946192, AirborneAM946193, Airborne
AF468439, Arctic sea iceïmelt pondEU978795, glacier ice
FR696620, 2 clones, SLïWinterïA11GQ340188, water columnFR696650, 1 clone, SLïWinterïC9
AJ575556, freshwaterEU117834, lake epilimnion
FN296466, Lake Llong Neuston samplesFN297387, Lake L'Illa water columnFR696699, 2 clones, SLïWinterïH12FR696778, 2 clones, WCïWinterïG12
FR697042, 4 clones, WCïSpringïD9FN297605, Lake Granotes water column
FR696702, 1 clone, SLïWinterïH4FR696736, 1 clone, WCïWinterïC4
FR697003, 1 clone, WCïSpringïD6FJ612194, lake waterFN296687, Lake Llong neuston samplesFR696733, 1 clone, WCïWinterïC12FR696661, 1 clone, SLïWinterïD8
EU117963, lake epilimnionFJ810555, coal tar wasteïcontaminated groundwater
EU117741, lake epilimnionFR696629, 1 clone, SLïWinterïB1
GU305849, YangHe reservoir waterFR696942, 1 clone, SLïSpringïF5
FJ916088, integrated lake epilimnionFR696653, 1 clone, SLïWinterïD11FR696740, 3 clones, WCïWinterïC8FR696976, 2 clones, WCïSpringïA9
EU234320, upstream of Wang Yang RiverFR697039, 1 clone, WCïSpringïB6AJ867924, lake waterFR697005, 1 clone, WCïSpringïD8
FR697021, 1 clone, WCïSpringïF7
EU234313, upstream of Wang Yang RiverEU800661, Delaware Bay, NJAJ575535, freshwater
FN296962, Lake Roi water columnFR696688, 2 clones, SLïWinterïG12FR696761, 3 clones, WCïWinterïE6
FR696973, 1 clone, WCïSpringïA6FN296988, Lake Roi water columnFR696679, 2 clones, SLïWinterïF3
GU305774, MiYu reservoir waterEU801946, Chesapeake Bay, MDFR696634, 1 clone, SLïWinterïB3
DQ520161, hypertrophic freshwater lakeFR696774, 1 clone, WCïWinterïF8
FR696707, 3 clones, SLïWinterïH9FR696727, 3 clones, WCïWinterïB7
FR696873, 2 clones, PïSpringïH4FR696941, 7 clones, SLïSpringïF4
FR696841, 1 clone, PïSpringïE3FJ946522, arctic snowAY948009, Parker River
AY948053, Parker RiverFR696968, 1 clone, WCïSpringïA10
FR696664, 1 clone, SLïWinterïE11
EU642222, Lake MichiganFR696749, 1 clone, WCïWinterïD5
Verrucomicrobia
Planctomycetes
Actinobacteria
Chloroplasts
Spirochaetes
AY271254, cultured ATCC BAA-835
AF399914, cultured ATCC 35122
AJ863164, cultured DSM 16987
Figure A.C6.1: Continued

Table A.C6.1. Closest BLASTs of slush (SL), water column (WC) and pond (P) 16S rRNA gene OTUs. The isolation source of the closest BLAST was retrieved from the GenBank database.
OTUs Closest BLAST
Category Accession nº Clone id.
Nº of c lones at 97%
Sequence Isolat ion source Ident i ty (%)
Actino-bacteria
FR696942 SL-Spring-F5 1 GU305849 YangHe reservoir water
99,9
FR696620 SL-Winter-A11 2 EU978795 Glacier ice 99,3 FR696629 SL-Winter-B1 1 EU117741 lake epilimnion 98,5 FR696634 SL-Winter-B3 1 EU801946 Chesapeake Bay,
MD 98,8
FR696650 SL-Winter-C9 1 GQ340188 Water column 98,5 FR696653 SL-Winter-D11 1 FJ916088 Integrated lake
epilimnion 99,1
FR696661 SL-Winter-D8 1 EU117963 Lake epilimnion 98,6 FR696679 SL-Winter-F3 2 FN296988 Lake Roi water
column 98,7
FR696688 SL-Winter-G12 2 EU800661 Delaware Bay, NJ 98,7 FR696699 SL-Winter-H12 2 FN296466 Lake Llong
Neuston samples 99,4
FR696702 SL-Winter-H4 1 FJ810555 Contaminated groundwater
97,9
FR696707 SL-Winter-H9 3 AY792234 Humic Lake 95,7 FR696973 WC-Spring-A6 1 EU234313 Upstream of Wang
Yang River 100,0
FR696976 WC-Spring-A9 2 EU234320 Upstream of Wang Yang River
99,7
FR697039 WC-Spring-B6 1 FJ916087 Integrated lake epilimnion
87,9
FR697003 WC-Spring-D6 1 FJ612194 Lake water 99,8 FR697005 WC-Spring-D8 1 AJ867924 Lake water 99,8 FR697042 WC-Spring-D9 4 AJ575556 Freshwater 100,0 FR697021 WC-Spring-F7 1 EU800576 Delaware Bay, NJ 96,4 FR696727 WC-Winter-B7 3 AY792234 Humic Lake 95,0 FR696733 WC-Winter-C12 1 EU117963 lake epilimnion 98,6 FR696736 WC-Winter-C4 1 FN296687 Lake Llong
Neuston samples 98,4
FR696740 WC-Winter-C8 3 FJ916088 Integrated lake epilimnion
99,3
FR696761 WC-Winter-E6 3 FN296962 Lake Roi water column
98,7
FR696774 WC-Winter-F8 1 DQ520161 Hypertrophic freshwater lake
99,1
FR696778 WC-Winter-G12 2 FN297605 Lake Granotes water column
98,7
Bacteroide-tes (class
Bacteroidia)
FR696673 SL-Winter-E9 3 EF034416 Spitsbergen permafrost soil
96,6
FR696760 WC-Winter-E5 5 EF034715 Spitsbergen permafrost soil
96,7
FR696769 WC-Winter-F3 1 EU644133 Permafrost 97,2 Bacteroide-tes (class
Cytophagia)
FR696698 SL-Winter-H11 6 EU641766 Lake Michigan 99,2 FR696762 WC-Winter-E7 1 DQ675462 Freshwater
moraine lake 99,1
FR696798 P-Spring-A1 1 FN297458 Lake L'Illa water column
97,0
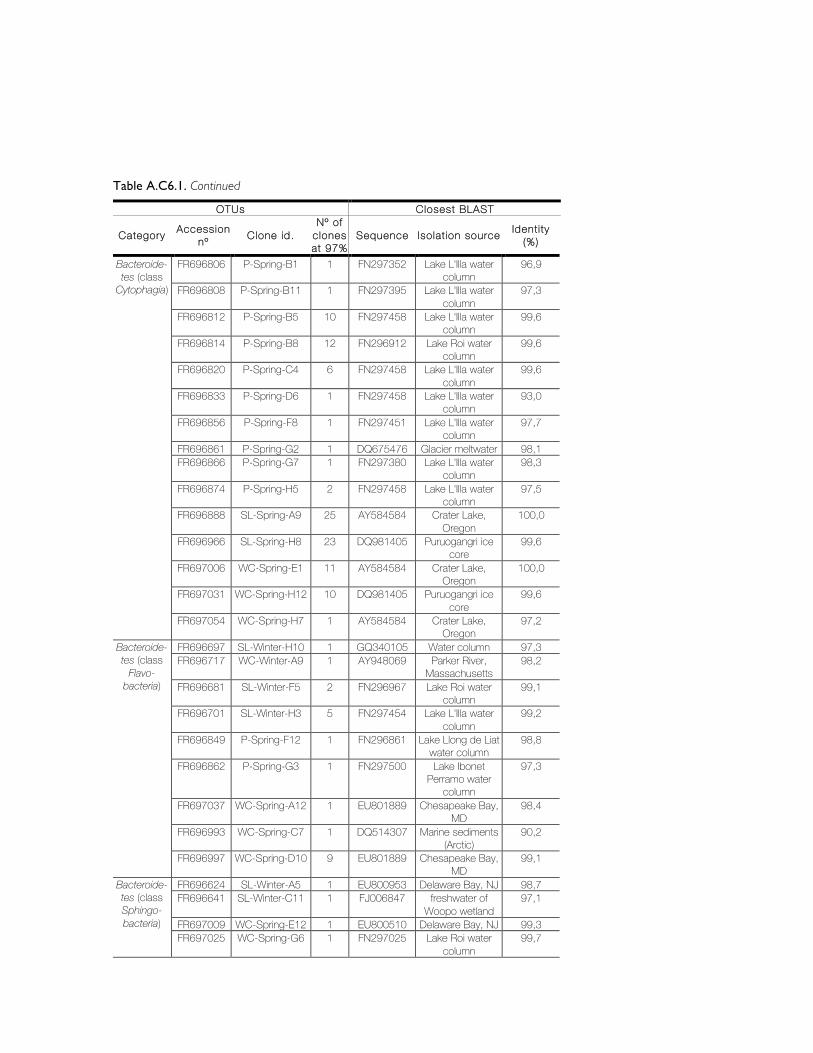
Table A.C6.1. Continued
OTUs Closest BLAST
Category Accession nº Clone id.
Nº of c lones at 97%
Sequence Isolat ion source Ident i ty (%)
Bacteroide-tes (class
Cytophagia)
FR696806 P-Spring-B1 1 FN297352 Lake L'Illa water column
96,9
FR696808 P-Spring-B11 1 FN297395 Lake L'Illa water column
97,3
FR696812 P-Spring-B5 10 FN297458 Lake L'Illa water column
99,6
FR696814 P-Spring-B8 12 FN296912 Lake Roi water column
99,6
FR696820 P-Spring-C4 6 FN297458 Lake L'Illa water column
99,6
FR696833 P-Spring-D6 1 FN297458 Lake L'Illa water column
93,0
FR696856 P-Spring-F8 1 FN297451 Lake L'Illa water column
97,7
FR696861 P-Spring-G2 1 DQ675476 Glacier meltwater 98,1 FR696866 P-Spring-G7 1 FN297380 Lake L'Illa water
column 98,3
FR696874 P-Spring-H5 2 FN297458 Lake L'Illa water column
97,5
FR696888 SL-Spring-A9 25 AY584584 Crater Lake, Oregon
100,0
FR696966 SL-Spring-H8 23 DQ981405 Puruogangri ice core
99,6
FR697006 WC-Spring-E1 11 AY584584 Crater Lake, Oregon
100,0
FR697031 WC-Spring-H12 10 DQ981405 Puruogangri ice core
99,6
FR697054 WC-Spring-H7 1 AY584584 Crater Lake, Oregon
97,2
Bacteroide-tes (class
Flavo-bacteria)
FR696697 SL-Winter-H10 1 GQ340105 Water column 97,3 FR696717 WC-Winter-A9 1 AY948069 Parker River,
Massachusetts 98,2
FR696681 SL-Winter-F5 2 FN296967 Lake Roi water column
99,1
FR696701 SL-Winter-H3 5 FN297454 Lake L'Illa water column
99,2
FR696849 P-Spring-F12 1 FN296861 Lake Llong de Liat water column
98,8
FR696862 P-Spring-G3 1 FN297500 Lake Ibonet Perramo water
column
97,3
FR697037 WC-Spring-A12 1 EU801889 Chesapeake Bay, MD
98,4
FR696993 WC-Spring-C7 1 DQ514307 Marine sediments (Arctic)
90,2
FR696997 WC-Spring-D10 9 EU801889 Chesapeake Bay, MD
99,1
Bacteroide-tes (class Sphingo-bacteria)
FR696624 SL-Winter-A5 1 EU800953 Delaware Bay, NJ 98,7 FR696641 SL-Winter-C11 1 FJ006847 freshwater of
Woopo wetland 97,1
FR697009 WC-Spring-E12 1 EU800510 Delaware Bay, NJ 99,3 FR697025 WC-Spring-G6 1 FN297025 Lake Roi water
column 99,7
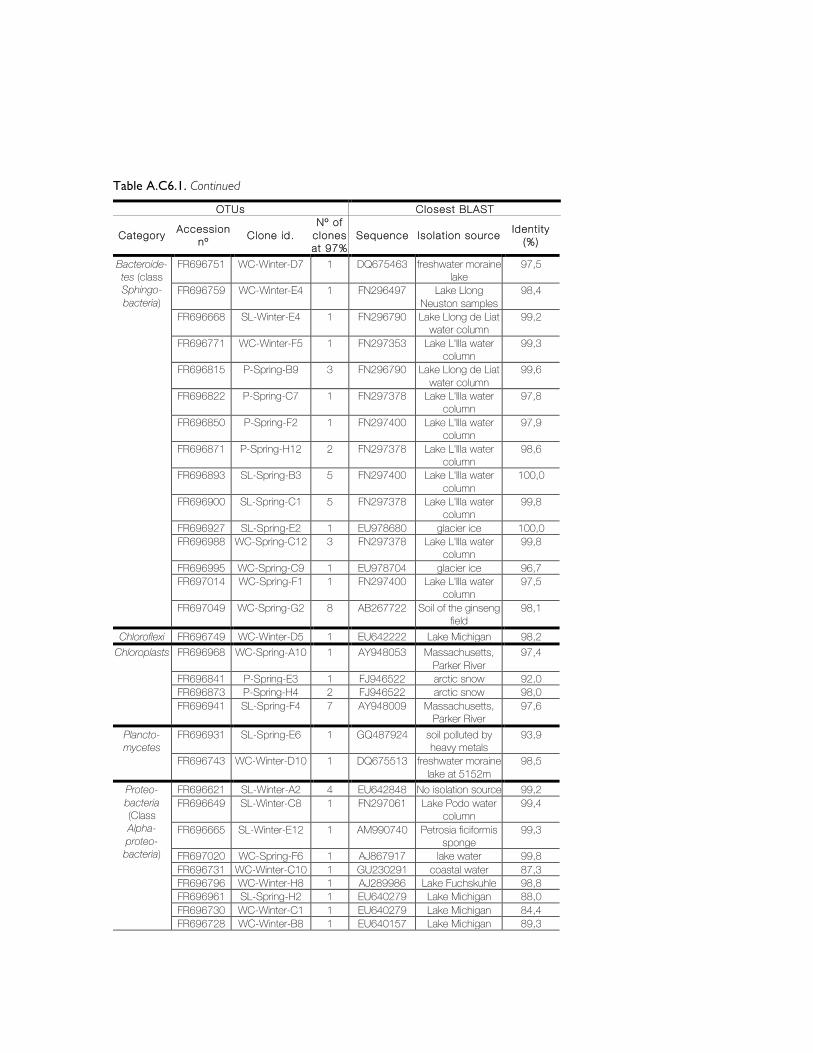
Table A.C6.1. Continued
OTUs Closest BLAST
Category Accession nº Clone id.
Nº of c lones at 97%
Sequence Isolat ion source Ident i ty (%)
Bacteroide-tes (class Sphingo-bacteria)
FR696751 WC-Winter-D7 1 DQ675463 freshwater moraine lake
97,5
FR696759 WC-Winter-E4 1 FN296497 Lake Llong Neuston samples
98,4
FR696668 SL-Winter-E4 1 FN296790 Lake Llong de Liat water column
99,2
FR696771 WC-Winter-F5 1 FN297353 Lake L'Illa water column
99,3
FR696815 P-Spring-B9 3 FN296790 Lake Llong de Liat water column
99,6
FR696822 P-Spring-C7 1 FN297378 Lake L'Illa water column
97,8
FR696850 P-Spring-F2 1 FN297400 Lake L'Illa water column
97,9
FR696871 P-Spring-H12 2 FN297378 Lake L'Illa water column
98,6
FR696893 SL-Spring-B3 5 FN297400 Lake L'Illa water column
100,0
FR696900 SL-Spring-C1 5 FN297378 Lake L'Illa water column
99,8
FR696927 SL-Spring-E2 1 EU978680 glacier ice 100,0 FR696988 WC-Spring-C12 3 FN297378 Lake L'Illa water
column 99,8
FR696995 WC-Spring-C9 1 EU978704 glacier ice 96,7 FR697014 WC-Spring-F1 1 FN297400 Lake L'Illa water
column 97,5
FR697049 WC-Spring-G2 8 AB267722 Soil of the ginseng field
98,1
Chloroflexi FR696749 WC-Winter-D5 1 EU642222 Lake Michigan 98,2 Chloroplasts FR696968 WC-Spring-A10 1 AY948053 Massachusetts,
Parker River 97,4
FR696841 P-Spring-E3 1 FJ946522 arctic snow 92,0 FR696873 P-Spring-H4 2 FJ946522 arctic snow 98,0 FR696941 SL-Spring-F4 7 AY948009 Massachusetts,
Parker River 97,6
Plancto-mycetes
FR696931 SL-Spring-E6 1 GQ487924 soil polluted by heavy metals
93,9
FR696743 WC-Winter-D10 1 DQ675513 freshwater moraine lake at 5152m
98,5
Proteo-bacteria (Class Alpha-proteo-bacteria)
FR696621 SL-Winter-A2 4 EU642848 No isolation source 99,2 FR696649 SL-Winter-C8 1 FN297061 Lake Podo water
column 99,4
FR696665 SL-Winter-E12 1 AM990740 Petrosia ficiformis sponge
99,3
FR697020 WC-Spring-F6 1 AJ867917 lake water 99,8 FR696731 WC-Winter-C10 1 GU230291 coastal water 87,3 FR696796 WC-Winter-H8 1 AJ289986 Lake Fuchskuhle 98,8 FR696961 SL-Spring-H2 1 EU640279 Lake Michigan 88,0 FR696730 WC-Winter-C1 1 EU640279 Lake Michigan 84,4 FR696728 WC-Winter-B8 1 EU640157 Lake Michigan 89,3

Table A.C6.1. Continued
OTUs Closest BLAST
Category Accession nº Clone id.
Nº of c lones at 97%
Sequence Isolat ion source Ident i ty (%)
Proteo-bacteria
(Class Beta-proteo-bacteria)
FR697030 WC-Spring-H11 1 EU801264 Chesapeake Bay, MD
94,4
FR696803 P-Spring-A4 1 EU978761 glacier ice 97,4 FR696804 P-Spring-A6 1 EU978750 glacier ice 95,9 FR696811 P-Spring-B4 1 EU801169 Chesapeake Bay,
MD 96,9
FR696813 P-Spring-B6 2 EU978835 glacier ice 97,7 FR696816 P-Spring-C10 3 AJ867660 melted-ice water 99,5 FR696817 P-Spring-C11 1 FJ037624 biofilms 98,3 FR696819 P-Spring-C2 1 FN297374 Lake L'Illa water
column 97,9
FR696824 P-Spring-C9 1 GQ306130 periglacial soil, 5400 m elevation
97,5
FR696827 P-Spring-D11 1 EU978750 glacier ice 95,8 FR696836 P-Spring-D9 1 DQ228407 John Evans Glacier 97,0 FR696838 P-Spring-E10 1 EU263720 surface snow in
the Kuytun Glacier 51
98,5
FR696843 P-Spring-E5 2 AY198107 melt pond on Arctic sea ice floe
98,2
FR696844 P-Spring-E6 4 EU801169 Chesapeake Bay, MD
98,2
FR696851 P-Spring-F3 1 EU978835 glacier ice 96,6 FR696853 P-Spring-F5 4 EU978750 glacier ice 97,7 FR696859 P-Spring-G11 1 EU978750 glacier ice 93,4 FR696865 P-Spring-G6 1 AB519656 antarctic snow 96,0 FR696867 P-Spring-G8 1 FM209305 sand soil 95,6 FR696875 P-Spring-H6 1 FN297386 Lake L'Illa water
column 93,7
FR696878 P-Spring-H9 1 EF079081 freshwater reserve De Bruuk
94,6
FR696913 SL-Spring-D10 1 DQ228407 John Evans Glacier 99,1 FR696921 SL-Spring-D8 1 AJ867906 lake water 99,9 FR696925 SL-Spring-E11 1 AJ867899 lake water 97,1 FR696929 SL-Spring-E4 4 EU978835 glacier ice 99,9 FR696950 SL-Spring-G2 1 AB074523 No isolation source 99,1 FR696951 SL-Spring-G3 9 AJ867660 melted-ice water 100,0 FR696953 SL-Spring-G5 1 EU978685 glacier ice 97,7 FR696956 SL-Spring-G8 1 AJ867657 melted red snow
water 99,5
FR696625 SL-Winter-A6 3 EU800392 Delaware Bay, NJ 99,3 FR696627 SL-Winter-A8 1 EU801768 Chesapeake Bay,
MD 99
FR696637 SL-Winter-B7 5 EU640747 Lake Michigan 99,5 FR696638 SL-Winter-B8 1 EF219370 No isolation source 97,1 FR696644 SL-Winter-C3 1 FN297408 Lake L'Illa water
column 99,5
FR696645 SL-Winter-C4 1 EU801480 Chesapeake Bay, MD
98,4
FR696646 SL-Winter-C5 1 EU640993 Lake Michigan 99,6 FR696648 SL-Winter-C7 1 AM849430 Piburger See 98,3 FR696663 SL-Winter-E10 1 EU800896 Delaware Bay, NJ 99,1

Table A.C6.1. Continued
OTUs Closest BLAST
Category Accession nº Clone id.
Nº of clones at 97%
Sequence Isolat ion source Ident i ty (%)
Proteo-bacteria
(Class Beta-proteo-bacteria)
FR696672 SL-Winter-E8 1 AJ867925 lake water 98,7 FR696676 SL-Winter-F11 1 AM849429 Piburger See 99,7 FR696686 SL-Winter-G10 1 FN297422 Lake L'Illa water
column 99,4
FR696694 SL-Winter-G8 1 EU640396 Lake Michigan 99,6 FR696706 SL-Winter-H8 5 AJ867930 lake water 99,6 FR696969 WC-Spring-A11 2 AJ867660 melted-ice water 99,8 FR696979 WC-Spring-B2 1 AJ867657 melted red snow
water 99,4
FR696989 WC-Spring-C2 1 EU978835 glacier ice 99,8 FR696991 WC-Spring-C5 1 GQ397027 soil 97,0 FR696992 WC-Spring-C6 1 AJ867905 lake water 99,5 FR697041 WC-Spring-D3 3 AM849430 Piburger See 99,0 FR697013 WC-Spring-E9 2 AY198107 melt pond on
Arctic sea ice floe 99,7
FR697018 WC-Spring-F2 2 GQ340350 water column 98,7 FR697045 WC-Spring-F5 1 EU800896 Delaware Bay, NJ 99,8 FR697024 WC-Spring-G1 3 AJ867900 lake water 99,9 FR697048 WC-Spring-G12 1 AM849430 Piburger See 99,5 FR697053 WC-Spring-H3 2 AJ224990 Lake
Gossenkoellesee 99,2
FR697032 WC-Spring-H4 2 AM849442 Piburger See 99,6 FR697035 WC-Spring-H8 1 EU978724 glacier ice 98,8 FR696708 WC-Winter-A1 1 AJ867918 lake water 96,9 FR696709 WC-Winter-A10 1 EU640396 Lake Michigan 98 FR696725 WC-Winter-B5 2 EU640396 Lake Michigan 98,4 FR696753 WC-Winter-D9 1 EU640396 Lake Michigan 95,4 FR696757 WC-Winter-E2 1 FN296779 Lake Redon water
column 99,4
FR696766 WC-Winter-F11 1 EU640396 Lake Michigan 99,1 FR696768 WC-Winter-F2 1 EU800392 Delaware Bay, NJ 98,6 FR696772 WC-Winter-F6 1 FN297075 Lake Plan water
column 99
FR696777 WC-Winter-G11 1 FN296779 Lake Redon water column
83,3
FR696779 WC-Winter-G2 1 GQ240210 groundwater 99,2 FR696780 WC-Winter-G3 1 FN296425 Lake Llong
Neuston samples 98,4
FR696781 WC-Winter-G4 1 EU640786 Lake Michigan 99,3 FR696789 WC-Winter-H11 1 FN297408 Lake L'Illa water
column 99,6
FR696720 WC-Winter-B11 2 FJ612146 lake water 98,9 Proteo-bacteria
(Class Delta-proteo-bacteria)
FR696633 SL-Winter-B2 1 EU640494 Lake Michigan 95,6 FR696655 SL-Winter-D2 2 EU640494 Lake Michigan 96,0 FR696670 SL-Winter-E6 1 EU640494 Lake Michigan 95,6 FR696705 SL-Winter-H7 2 EU640494 Lake Michigan 97,7 FR696864 P-Spring-G5 1 DQ337084 subsurface water 89,8 FR696666 SL-Winter-E2 2 EU978702 glacier ice 99,4 FR696735 WC-Winter-C3 1 AJ966227 Lake Geneva 92,6 FR696977 WC-Spring-B1 1 EU803555 Lake Gatun 87,0 FR696752 WC-Winter-D8 1 FJ745099 surface marine
water 90,5
FR697015 WC-Spring-F10 1 EU640494 Lake Michigan 98,0

Table A.C6.1. Continued
OTUs Closest BLAST
Category Accession nº Clone id.
Nº of c lones at 97%
Sequence Isolat ion source Ident i ty (%)
Proteo-bacteria (Class
Gamma-proteo-bacteria)
FR696821 P-Spring-C6 1 EF520622 acid-impacted lake 84,4
FR696704 SL-Winter-H6 2 AY580815 Marine water 90,8
Spiro-chaetes
FR696664 SL-Winter-E11 1 AB540019 lake 94,0
Verruco-microbia
FR696910 SL-Spring-C8 1 FJ872373 rhizosphere 99,0 FR696636 SL-Winter-B5 3 FN296971 Lake Roi water
column 99,3
FR696639 SL-Winter-C1 1 FN296971 Lake Roi water column
96,7
FR696671 SL-Winter-E7 1 FJ546829 mixolimnion 99,0 FR696685 SL-Winter-F9 2 EF072607 GASP Watkinsville
sampling site, Georgia, USA
89,2
FR696696 SL-Winter-H1 1 AJ289992 Lake Fuchskuhle 98,0 FR696700 SL-Winter-H2 2 FN296839 Lake Llong de Liat
water column 99,2
FR696703 SL-Winter-H5 2 FN297150 Lake Plan water column
99,1
FR696713 WC-Winter-A4 1 FN296839 Lake Llong de Liat water column
99,7
FR696721 WC-Winter-B12 1 EF072607 GASP Watkinsville sampling site, Georgia, USA
87,3
FR696722 WC-Winter-B2 1 GQ340097 water column 97,7 FR696724 WC-Winter-B4 1 EU801097 Delaware Bay, NJ 99,0 FR696739 WC-Winter-C7 1 EU641499 Lake Michigan 97,8 FR696776 WC-Winter-G10 3 FJ546829 mixolimnion 99,6 FR696786 WC-Winter-G9 1 EF072607 GASP Watkinsville
sampling site, Georgia, USA
88,2
FR696791 WC-Winter-H2 2 GQ340097 water column 98,1 FR696795 WC-Winter-H6 30 FN296971 Lake Roi water
column 99,5
!
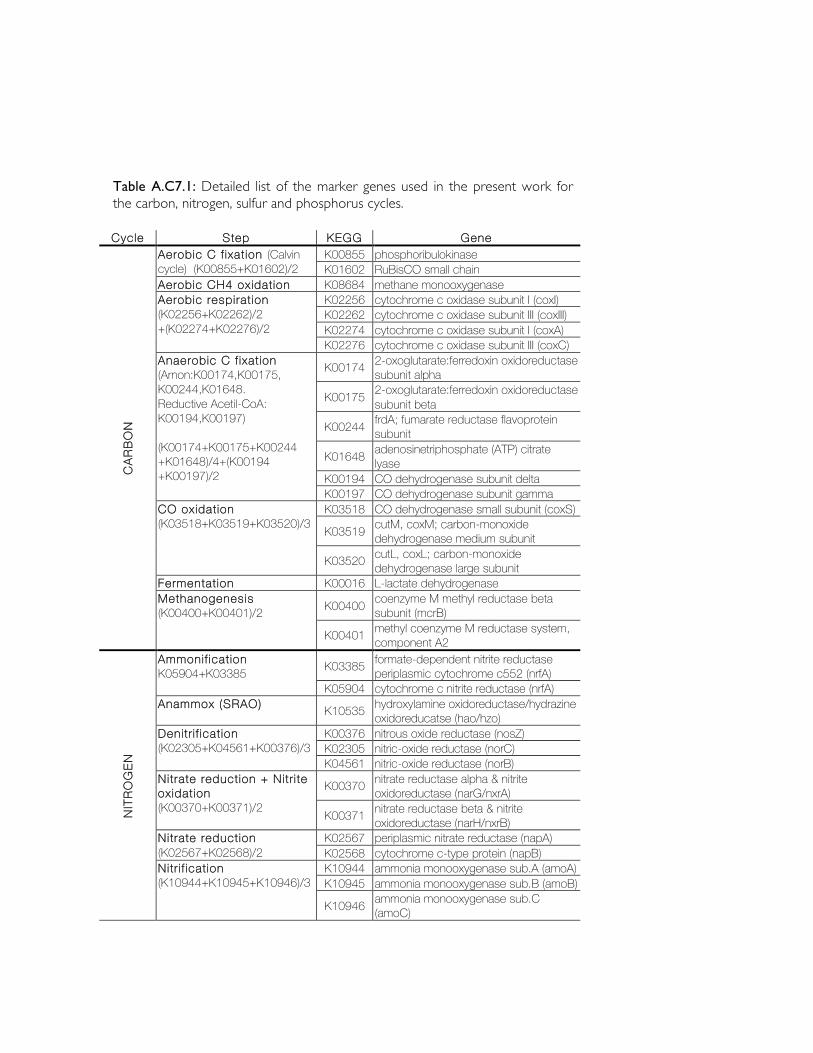
Table A.C7.1: Detailed list of the marker genes used in the present work for the carbon, nitrogen, sulfur and phosphorus cycles. !!Cycle Step KEGG Gene
CAR
BON
Aerobic C f ixat ion (Calvin cycle) (K00855+K01602)/2
K00855 phosphoribulokinase K01602 RuBisCO small chain
Aerobic CH4 oxidat ion K08684 methane monooxygenase Aerobic respirat ion (K02256+K02262)/2 +(K02274+K02276)/2
K02256 cytochrome c oxidase subunit I (coxI) K02262 cytochrome c oxidase subunit III (coxIII) K02274 cytochrome c oxidase subunit I (coxA) K02276 cytochrome c oxidase subunit III (coxC)
Anaerobic C f ixat ion (Arnon:K00174,K00175, K00244,K01648. Reductive Acetil-CoA: K00194,K00197) (K00174+K00175+K00244 +K01648)/4+(K00194 +K00197)/2
K00174 2-oxoglutarate:ferredoxin oxidoreductase subunit alpha
K00175 2-oxoglutarate:ferredoxin oxidoreductase subunit beta
K00244 frdA; fumarate reductase flavoprotein subunit
K01648 adenosinetriphosphate (ATP) citrate lyase
K00194 CO dehydrogenase subunit delta K00197 CO dehydrogenase subunit gamma
CO oxidat ion (K03518+K03519+K03520)/3
K03518 CO dehydrogenase small subunit (coxS)
K03519 cutM, coxM; carbon-monoxide dehydrogenase medium subunit
K03520 cutL, coxL; carbon-monoxide dehydrogenase large subunit
Fermentat ion K00016 L-lactate dehydrogenase Methanogenesis (K00400+K00401)/2 K00400 coenzyme M methyl reductase beta
subunit (mcrB)
K00401 methyl coenzyme M reductase system, component A2
NIT
ROG
EN
Ammonif icat ion K05904+K03385 K03385 formate-dependent nitrite reductase
periplasmic cytochrome c552 (nrfA) K05904 cytochrome c nitrite reductase (nrfA)
Anammox (SRAO) K10535 hydroxylamine oxidoreductase/hydrazine oxidoreducatse (hao/hzo)
Denit r i f icat ion (K02305+K04561+K00376)/3
K00376 nitrous oxide reductase (nosZ) K02305 nitric-oxide reductase (norC) K04561 nitric-oxide reductase (norB)
Nit rate reduct ion + Nit r i te oxidat ion (K00370+K00371)/2
K00370 nitrate reductase alpha & nitrite oxidoreductase (narG/nxrA)
K00371 nitrate reductase beta & nitrite oxidoreductase (narH/nxrB)
Nit rate reduct ion (K02567+K02568)/2
K02567 periplasmic nitrate reductase (napA) K02568 cytochrome c-type protein (napB)
Nit r i f icat ion (K10944+K10945+K10946)/3
K10944 ammonia monooxygenase sub.A (amoA) K10945 ammonia monooxygenase sub.B (amoB)
K10946 ammonia monooxygenase sub.C (amoC)

Table A.C7.1: Continued !Cycle Step KEGG Gene
NIT
ROG
EN
N i t rogen assimi lat ion (K00360+K00367+K01915+ K00265+K00284)/3
K00265 glutamate synthase (NADPH/NADH) large chain (gltB)
K00284 glutamate synthase (ferredoxin-dependent) (gltS)
K00360 assimilatory nitrate reductase K00367 assimilatory nitrate reductase K01915 glutamine synthetase (glnA)
Nit rogen Fixat ion (K00531+K02586+K02588+ K02591)/4
K00531 nitrogenase
K02586 nitrogenase molybdenum-iron protein alpha chain (nifD)
K02588 nitrogenase iron protein (nifH)
K02591 nitrogenase molybdenum-iron protein beta chain (nifK)
Nit rogen Mineral izat ion K00260+K00261+K00262
K00260 glutamate dehydrogenase K00261 glutamate dehydrogenase K00262 glutamate dehydrogenase
SULF
UR
Assimi latory sul fate reduct ion (K00860+K00956+K00957)/3
K00860 adenylylsulfate kinase (cysC)
K00956 sulfate adenylyltransferase subunit 1 (cysN)
K00957 sulfate adenylyltransferase subunit 2 (cysD)
Dissimi latory sul fate reduct ion and sul f ide oxidat ion (K00394+K00395+K11180)/3
K00394 adenylylsulfate reductase subunit A (aprA)
K00395 adenylylsulfate reductase subunit B (aprB)
K11180 sulfite reductase (dsrA) Sul fur Mineral izat ion K00456+K01011
K00456 cysteine dioxygenase K01011 3-mercaptopyruvate sulfurtransferase
Polysul f ide reduct ion K08352 polysulfide reductase chain A (psrA)
PHO
SPH
ORU
S
Phosphate transport (K02038+K02036+K02037+ K02040)/4
K02038 phosphate transport system permease protein (pstA)
K02036 phosphate transport system ATP-binding protein (pstB)
K02037 pstC; phosphate transport system permease protein (pstC)
K02040 phosphate transport system substrate-binding protein (pstS)
Phosphonoacetate hydrolase K06193 phosphonoacetate hydrolase (phnA)
2-phosphonopropionate transporter K04750 PhnB protein (phnB)
Phosphonate transport (K02041+K02044+K02042)/3 K02041 phosphonate transport system ATP-
binding protein (phnC)
K02044 phosphonate transport system substrate-binding protein (phnD)
K02042 phosphonate transport system permease protein (phnE)
!
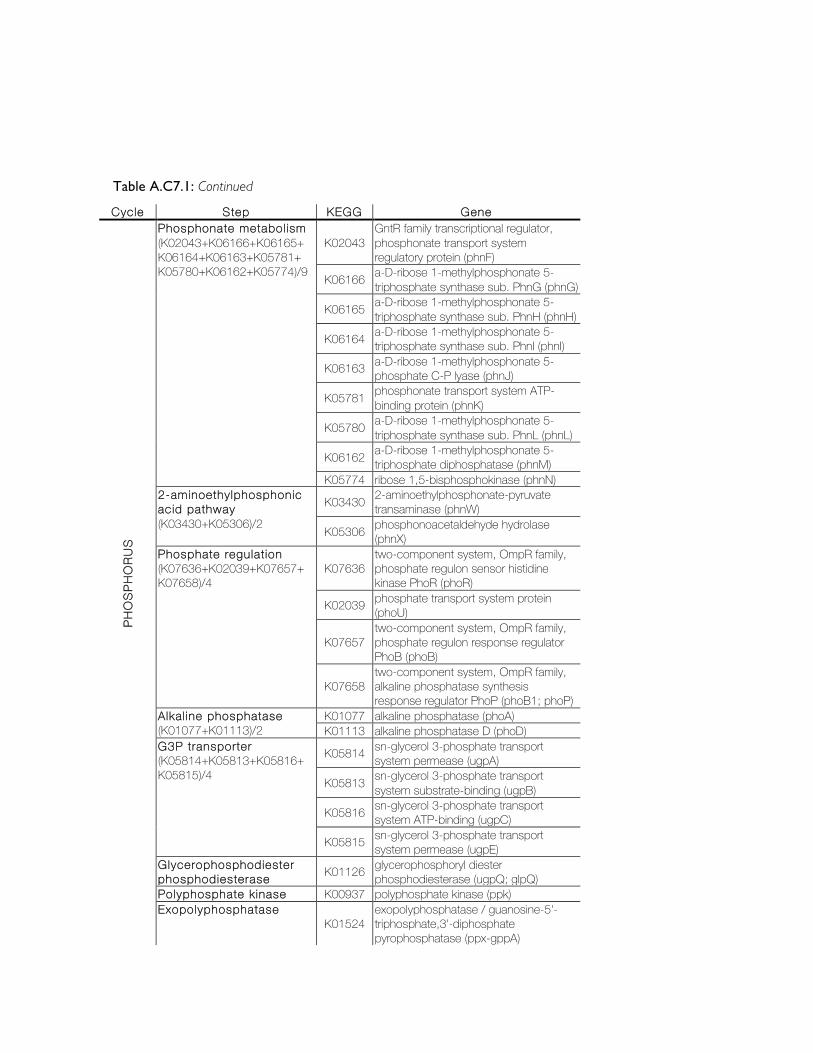
Table A.C7.1: Continued !Cycle Step KEGG Gene
PHO
SPH
ORU
S
Phosphonate metabol ism (K02043+K06166+K06165+ K06164+K06163+K05781+ K05780+K06162+K05774)/9
K02043 GntR family transcriptional regulator, phosphonate transport system regulatory protein (phnF)
K06166 a-D-ribose 1-methylphosphonate 5-triphosphate synthase sub. PhnG (phnG)
K06165 a-D-ribose 1-methylphosphonate 5-triphosphate synthase sub. PhnH (phnH)
K06164 a-D-ribose 1-methylphosphonate 5-triphosphate synthase sub. PhnI (phnI)
K06163 a-D-ribose 1-methylphosphonate 5-phosphate C-P lyase (phnJ)
K05781 phosphonate transport system ATP-binding protein (phnK)
K05780 a-D-ribose 1-methylphosphonate 5-triphosphate synthase sub. PhnL (phnL)
K06162 a-D-ribose 1-methylphosphonate 5-triphosphate diphosphatase (phnM)
K05774 ribose 1,5-bisphosphokinase (phnN) 2-aminoethylphosphonic acid pathway (K03430+K05306)/2
K03430 2-aminoethylphosphonate-pyruvate transaminase (phnW)
K05306 phosphonoacetaldehyde hydrolase (phnX)
Phosphate regulat ion (K07636+K02039+K07657+ K07658)/4
K07636 two-component system, OmpR family, phosphate regulon sensor histidine kinase PhoR (phoR)
K02039 phosphate transport system protein (phoU)
K07657 two-component system, OmpR family, phosphate regulon response regulator PhoB (phoB)
K07658 two-component system, OmpR family, alkaline phosphatase synthesis response regulator PhoP (phoB1; phoP)
Alkal ine phosphatase (K01077+K01113)/2
K01077 alkaline phosphatase (phoA) K01113 alkaline phosphatase D (phoD)
G3P transporter (K05814+K05813+K05816+ K05815)/4
K05814 sn-glycerol 3-phosphate transport system permease (ugpA)
K05813 sn-glycerol 3-phosphate transport system substrate-binding (ugpB)
K05816 sn-glycerol 3-phosphate transport system ATP-binding (ugpC)
K05815 sn-glycerol 3-phosphate transport system permease (ugpE)
Glycerophosphodiester phosphodiesterase K01126 glycerophosphoryl diester
phosphodiesterase (ugpQ; glpQ) Polyphosphate k inase K00937 polyphosphate kinase (ppk) Exopolyphosphatase
K01524 exopolyphosphatase / guanosine-5'-triphosphate,3'-diphosphate pyrophosphatase (ppx-gppA)

rRNA gene Phylum Order Slush EL ML18S Alveolata BOLA914 0.0 0.5 0.7
Alveolata Ciliophora 2.5 16.1 7.9Alveolata Dinoflagellata 0.2 6.0 0.5Alveolata Protalveolata 0.0 0.3 10.6Alveolata Unresolved Alveolata 0.0 1.3 2.3Chloroplastida Charophyta 0.0 0.5 0.0Chloroplastida Chlorophyta 0.0 3.8 2.3Chloroplastida Unresolved Chloroplastida 0.0 1.7 0.2Cryptomonadales Cryptomonas 0.2 1.0 30.5Discoba Discicristata 0.0 0.0 0.2Fungi Chytridiomycota 5.5 0.5 0.0Fungi Basidiomycota 1.0 5.5 1.8Fungi Ascomycota 0.0 4.3 2.8Fungi Unresolved Fungi 0.0 0.2 0.2Holozoa Choanomonada 0.0 0.0 2.1Holozoa Metazoa 0.2 0.8 0.9Holozoa Unresolved Holozoa 0.0 0.0 0.7Kathablepharidae Kathablepharidae 0.0 0.8 0.0Nucletmycea LKM11 0.0 0.0 6.7Nucletmycea LKM15 0.0 0.0 0.7Nucletmycea Unresolved Nucletmycea 0.0 0.0 1.6P1-31 P1-31 0.0 0.0 2.5Rhizaria Cercozoa 0.5 5.9 3.5Stramenopiles Bicosoecida 0.0 8.0 1.8Stramenopiles Labyrinthulomycetes 0.0 0.0 0.2Stramenopiles MAST-12 0.0 0.7 0.0Stramenopiles MAST-2 0.0 0.0 0.2Stramenopiles Bolidomonas 0.0 0.3 0.0Stramenopiles Chrysophyceae 85.3 33.1 8.8Stramenopiles Diatomea 0.0 0.0 0.2Stramenopiles Dictyochophyceae 0.0 0.3 0.2Stramenopiles Unresolved Stramenopiles 1.2 3.3 2.3Stramenopiles Peronosporomycetes 0.0 0.3 0.2Telonema Telonema 0.0 0.0 2.1Unclassified Unclassified 3.2 4.2 4.6Unresolved Centrohelida Unresolved Centrohelida 0.0 0.0 0.2Unresolved Opisthokonta Unresolved Opisthokonta 0.0 0.0 0.2Unresolved SAR Unresolved SAR 0.0 0.3 0.0
rRNA gene Phylum Order Slush EL ML16S Acidobacteria Acidobacteriales 0.0 0.0 0.0
Acidobacteria Holophagales 0.0 0.0 0.1Acidobacteria Subgroup 3 0.0 0.0 0.8Acidobacteria Unresolved Acidobacteria 0.0 0.0 0.0Actinobacteria Acidimicrobiales 4.1 0.0 4.1Actinobacteria Coriobacteriales 0.0 0.0 0.0Actinobacteria Corynebacteriales 1.4 0.3 1.4
Table A.C7.2: Specific taxonomic composition (Order level) for 16S and 18S rRNA gene (% relativeabundance) in the metagenomic pooI. EL: Epilimnion. HL: Hypolimnion.

rRNA gene Phylum Order Slush EL ML
Table A.C7.2: Continued
16S Actinobacteria Frankiales 0.0 19.1 24.5Actinobacteria Gaiellales 0.0 0.0 0.5Actinobacteria Micrococcales 0.0 1.1 0.4Actinobacteria PeM15 0.0 0.0 0.1Actinobacteria Propionibacteriales 1.4 0.3 0.2Actinobacteria Solirubrobacterales 0.0 0.0 0.9Actinobacteria Streptomycetales 0.0 0.0 0.0Actinobacteria Unresolved Actinobacteria 0.0 2.4 3.1Actinobacteria Unresolved Thermoleophilia 0.0 0.0 0.0Alphaproteobacteria Caulobacterales 1.4 0.4 1.4Alphaproteobacteria Parvularculales 0.0 0.0 0.0Alphaproteobacteria Rhizobiales 0.0 1.5 0.8Alphaproteobacteria Rhodobacterales 0.0 0.0 0.1Alphaproteobacteria Rhodospirillales 2.7 0.1 0.8Alphaproteobacteria Rickettsiales 0.0 0.1 0.4Alphaproteobacteria SAR11 clade 0.0 0.1 0.1Alphaproteobacteria Sphingomonadales 2.7 0.6 0.4Alphaproteobacteria Unresolved Alphaproteobacteria 1.4 0.3 0.4Betaproteobacteria Burkholderiales 34.2 48.7 7.9Betaproteobacteria Hydrogenophilales 0.0 0.0 0.0Betaproteobacteria Methylophilales 0.0 0.6 2.3Betaproteobacteria Neisseriales 0.0 0.2 0.0Betaproteobacteria Nitrosomonadales 0.0 0.0 0.7Betaproteobacteria Rhodocyclales 0.0 0.0 0.1Betaproteobacteria TRA3-20 1.4 0.0 0.2Betaproteobacteria Unresolved Betaproteobacteria 2.7 1.7 1.4Deltaproteobacteria Bdellovibrionales 0.0 0.0 0.1Deltaproteobacteria Desulfobacterales 0.0 0.0 0.0Deltaproteobacteria Desulfuromonadales 0.0 0.0 0.1Deltaproteobacteria Myxococcales 0.0 0.1 2.2Deltaproteobacteria Sh765B-TzT-29 0.0 0.0 0.0Deltaproteobacteria Sva0485 0.0 0.0 0.0Deltaproteobacteria Unresolved Deltaproteobacteria 0.0 0.0 0.2Epsilonproteobacteria Campylobacterales 0.0 0.1 0.0Gammaproteobacteria Aeromonadales 2.7 0.0 0.0Gammaproteobacteria Alteromonadales 0.0 0.0 0.1Gammaproteobacteria Chromatiales 0.0 0.0 0.0Gammaproteobacteria Enterobacteriales 1.4 0.0 0.0Gammaproteobacteria Legionellales 0.0 0.1 0.5Gammaproteobacteria Methylococcales 0.0 0.0 2.4Gammaproteobacteria NKB5 0.0 0.0 0.0Gammaproteobacteria Oceanospirillales 0.0 0.0 0.0Gammaproteobacteria Pseudomonadales 17.8 0.4 0.4Gammaproteobacteria Thiotrichales 0.0 0.0 0.0Gammaproteobacteria Xanthomonadales 0.0 0.1 0.1Gammaproteobacteria Unresolved Gammaproteobacteria 0.0 0.1 0.6

rRNA gene Phylum Order Slush EL ML
Table A.C7.2: Continued
16S Proteobacteria Unresolved Proteobacteria 0.0 0.4 0.9Armatimonadetes Chthonomonadales 0.0 0.0 0.0Armatimonadetes Unresolved Armatimonadetes 0.0 0.0 0.1Bacteroidetes Bacteroidales 0.0 0.0 0.1Bacteroidetes BSV13 0.0 0.0 0.0Bacteroidetes Cytophagales 1.4 1.8 1.2Bacteroidetes Flavobacteriales 1.4 9.3 5.5Bacteroidetes Sphingobacteriales 2.7 5.0 6.2Bacteroidetes Unresolved Bacteroidetes 0.0 0.3 0.6Bacteroidetes vadinHA17 0.0 0.0 0.0Bacteroidetes WCHB1-32 0.0 0.0 0.0BD1-5 BD1-5 0.0 0.0 0.0Candidate division JS1 Candidate division JS3 0.0 0.0 0.0Candidate division OD1 Candidate division OD1 0.0 0.1 3.8Candidate division OP11 Candidate division OP11 0.0 0.0 0.1Candidate division OP3 Candidate division OP3 0.0 0.0 0.2Candidate division TM7 Candidate division TM7 0.0 0.0 0.6Chlamydiae Chlamydiales 2.7 0.0 0.3Chloroflexi Chloroflexales 0.0 0.1 0.2Chloroflexi S085 0.0 0.0 0.0Chloroflexi SL56 marine group 0.0 0.0 0.2Chloroflexi TK10 0.0 0.0 0.1Chloroflexi Unresolved Chloroflexi 0.0 0.0 0.1Cyanobacteria Gastranaerophilales 0.0 0.0 0.0Cyanobacteria SubsectionI 1.4 0.1 0.0Cyanobacteria SubsectionIV 0.0 0.0 0.0Cyanobacteria Unresolved Cyanobacteria 0.0 0.5 0.1Elusimicrobia Lineage IV 0.0 0.0 0.0Fibrobacteres Fibrobacterales 0.0 0.0 0.0Firmicutes Bacillales 0.0 0.3 0.1Firmicutes Clostridiales 5.5 0.1 0.1Firmicutes Lactobacillales 0.0 0.0 0.0Firmicutes Unresolved Firmicutes 0.0 0.0 0.0Fusobacteria Fusobacteriales 0.0 0.0 0.1Gemmatimonadetes Gemmatimonadales 0.0 0.0 1.6Lentisphaerae MSBL3 0.0 0.0 0.0Lentisphaerae Oligosphaerales 0.0 0.0 0.0Lentisphaerae Victivallales 0.0 0.0 0.0Nitrospirae Nitrospirales 0.0 0.0 0.0NPL-UPA2 NPL-UPA2 0.0 0.0 0.1Planctomycetes Phycisphaerales 0.0 0.0 2.1Planctomycetes Planctomycetales 1.4 0.3 4.4Planctomycetes Unresolved Planctomycetes 0.0 0.0 0.1Planctomycetes vadinHA49 0.0 0.0 0.1SM2F11 SM2F11 0.0 0.0 0.0Spirochaetae Spirochaetales 0.0 0.2 0.1

rRNA gene Phylum Order Slush EL ML
Table A.C7.2: Continued
16S Tenericutes Anaeroplasmatales 0.0 0.0 0.0TM6 TM6 0.0 0.0 0.1Verrucomicrobia Chthoniobacterales 2.7 0.0 1.6Verrucomicrobia OPB35 soil group 0.0 0.0 2.4Verrucomicrobia Opitutales 0.0 0.1 1.2Verrucomicrobia Unknown Order 0.0 0.0 0.1Verrucomicrobia Unresolved Opitutae 0.0 0.1 0.2Verrucomicrobia Unresolved Verrucomicrobia 0.0 0.0 0.2Verrucomicrobia vadinHA64 0.0 0.6 1.8Verrucomicrobia Verrucomicrobiales 0.0 0.0 0.0WCHB1-60 WCHB1-60 0.0 0.0 0.0Euryarchaeota Halobacteriales 0.0 0.0 0.1Euryarchaeota Unresolved Euryarchaeota 0.0 0.0 0.0Unclassified Unclassified 5.5 2.0 2.8
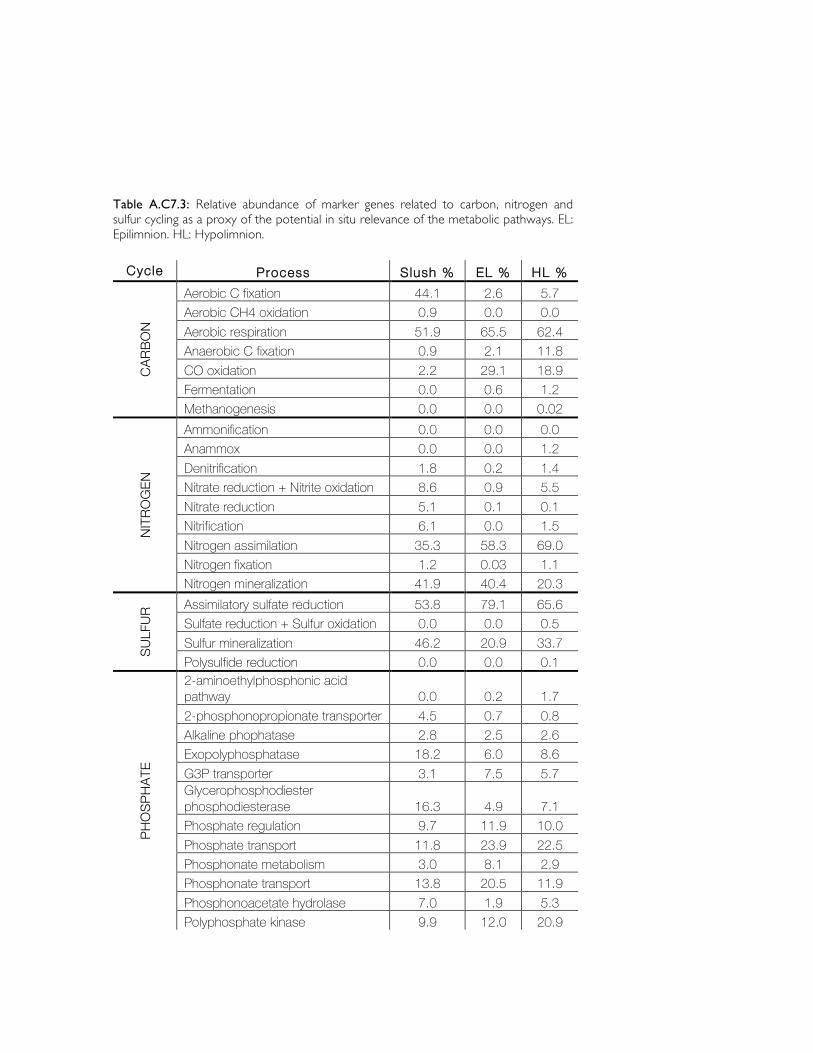
Table A.C7.3: Relative abundance of marker genes related to carbon, nitrogen and sulfur cycling as a proxy of the potential in situ relevance of the metabolic pathways. EL: Epilimnion. HL: Hypolimnion.
Cycle Process Slush % EL % HL %
CARB
ON
Aerobic C fixation 44.1 2.6 5.7 Aerobic CH4 oxidation 0.9 0.0 0.0 Aerobic respiration 51.9 65.5 62.4 Anaerobic C fixation 0.9 2.1 11.8 CO oxidation 2.2 29.1 18.9 Fermentation 0.0 0.6 1.2 Methanogenesis 0.0 0.0 0.02
NITR
OG
EN
Ammonification 0.0 0.0 0.0 Anammox 0.0 0.0 1.2 Denitrification 1.8 0.2 1.4 Nitrate reduction + Nitrite oxidation 8.6 0.9 5.5 Nitrate reduction 5.1 0.1 0.1 Nitrification 6.1 0.0 1.5 Nitrogen assimilation 35.3 58.3 69.0 Nitrogen fixation 1.2 0.03 1.1 Nitrogen mineralization 41.9 40.4 20.3
SULF
UR Assimilatory sulfate reduction 53.8 79.1 65.6
Sulfate reduction + Sulfur oxidation 0.0 0.0 0.5 Sulfur mineralization 46.2 20.9 33.7 Polysulfide reduction 0.0 0.0 0.1
PHO
SPHA
TE
2-aminoethylphosphonic acid pathway 0.0 0.2 1.7 2-phosphonopropionate transporter 4.5 0.7 0.8 Alkaline phophatase 2.8 2.5 2.6 Exopolyphosphatase 18.2 6.0 8.6 G3P transporter 3.1 7.5 5.7 Glycerophosphodiester phosphodiesterase 16.3 4.9 7.1 Phosphate regulation 9.7 11.9 10.0 Phosphate transport 11.8 23.9 22.5 Phosphonate metabolism 3.0 8.1 2.9 Phosphonate transport 13.8 20.5 11.9 Phosphonoacetate hydrolase 7.0 1.9 5.3 Polyphosphate kinase 9.9 12.0 20.9

Appendix B


Winter to spring changes in the slush bacterialcommunity composition of a high-mountain lake(Lake Redon, Pyrenees)emi4_278 50..56
Tomàs Llorens-Marès, Jean-Christophe Auguet* andEmilio O. CasamayorLimnological Observatory of the Pyrenees (LOOP) –Biogeodynamics & Biodiversity Group, Centro deEstudios Avanzados de Blanes, CEAB-CSIC, AccésCala Sant Francesc, 14, 17300 Blanes, Girona, Spain.
Summary
Bacterial community composition was analysed in theslush layers of snow-covered Lake Redon (2240 maltitude, Limnological Observatory of the Pyrenees,LOOP, NE Spain) in winter and spring and comparedwith bacteria from the lake water column, using 16SrRNA gene clone libraries and CARD-FISH counts. Theset of biological data was related to changes in bacte-rial production and to other relevant environmentalvariables measured in situ. In winter, up to 70% of the16S rRNA sequences found in the slush were closelyrelated to planktonic bacteria from the water columnbeneath the ice. Conversely, during spring ablation,50% of the sequences had > 97% identity with bacteriafrom the cryosphere (i.e. globally distributed glaciers,snow and ice) and may have originated from remoteaerosol deposition. The transition winter to spring wascharacterized by consistent community changesswitching from assemblages dominated by Beta-proteobacteria, Verrucomicrobia and Bacteroidetesduring snowpack growth to communities essentiallydominated by the Bacteroidetes of classes Cytophagiaand Sphingobacteria. This strong bacterial composi-tion switch was associated with consistent increasesin bacterial abundance and production, and decreas-ing bacterial diversity.
Introduction
Ice cover and snowpacks in high-altitude lakes play apivotal role in the dynamic of the pelagic system by pre-venting turbulence and reducing the exchange of light,heat, gases, liquid and particles between the atmosphere
and the water column (Catalan, 1992; Wharton et al.,1993). The ice cover generally lasts 6 months or longerand is characterized by sandwich-like structures consti-tuted by a superposition of snow, white ice and slush (i.e.a mixture of water and snow) layers on top of a sheet ofblack ice (Eppacher, 1966; Adams and Allan, 1987). Epi-sodic events of flooding by lake water, melting and freez-ing drive dynamic changes in the physical structure andchemical characteristics of alpine ice covers (Catalan,1989; Psenner et al., 1999). Microbial activities and bio-masses in the slush layers are far larger than in the watercolumn, with a great variety and density of morphologiesincluding short rods and cocci-like bacteria, filaments,flagellate protists (autotrophic and heterotrophic), and cili-ates (Felip et al., 1995; Felip et al., 1999).
While microbial communities from the remote cryo-spheres, such as sea ice (Bowman et al., 1997; Brink-meyer et al., 2003), polar lakes (Priscu et al., 1999;Crump et al., 2003; Mosier et al., 2007) and glacier habi-tats (Zhang et al., 2008; 2009; Xiang et al., 2009), havebeen extensively documented, those thriving in nearernon-permanent ice covered alpine lakes have remainedpoorly studied. Most of such studies have been mainlyfocused on eukaryotic microorganisms by traditionalmicroscopy methods, as in the case of Lake Redon(Felip et al., 1995; 1999; 2002), or in Lake Gossen-köllessee, Tyrolean Alps, using general bacterial probesand FISH counts (Alfreider et al., 1996). In this work, wedescribed the 16S rRNA gene composition of bacteriainhabiting the slush layers of an alpine lake both inwinter during growing of the snowpack, and in springduring the melting phase. Overall, bacterial compositionand functioning in Lake Redon were closely related toother ice-related ecosystems on Earth, suggesting thatalpine areas are good models to improve the currentunderstanding on the dynamics and functional role ofcold adapted microorganisms facing climate variations.
Results and discussion
Samples were collected from different slush layers (seeFig. 1) and the lake water column (2 m depth beneath theice sheet) of Lake Redon (Limnological Observatory ofthe Pyrenees, LOOP, NE Spain) both in winter during
Received 5 May, 2011; accepted 11 July, 2011. *For correspondence.E-mail [email protected]; Tel. (+34) 972 336 101; Fax (+34)972 337 806.
Environmental Microbiology Reports (2012) 4(1), 50–56 doi:10.1111/j.1758-2229.2011.00278.x
© 2011 Society for Applied Microbiology and Blackwell Publishing Ltd
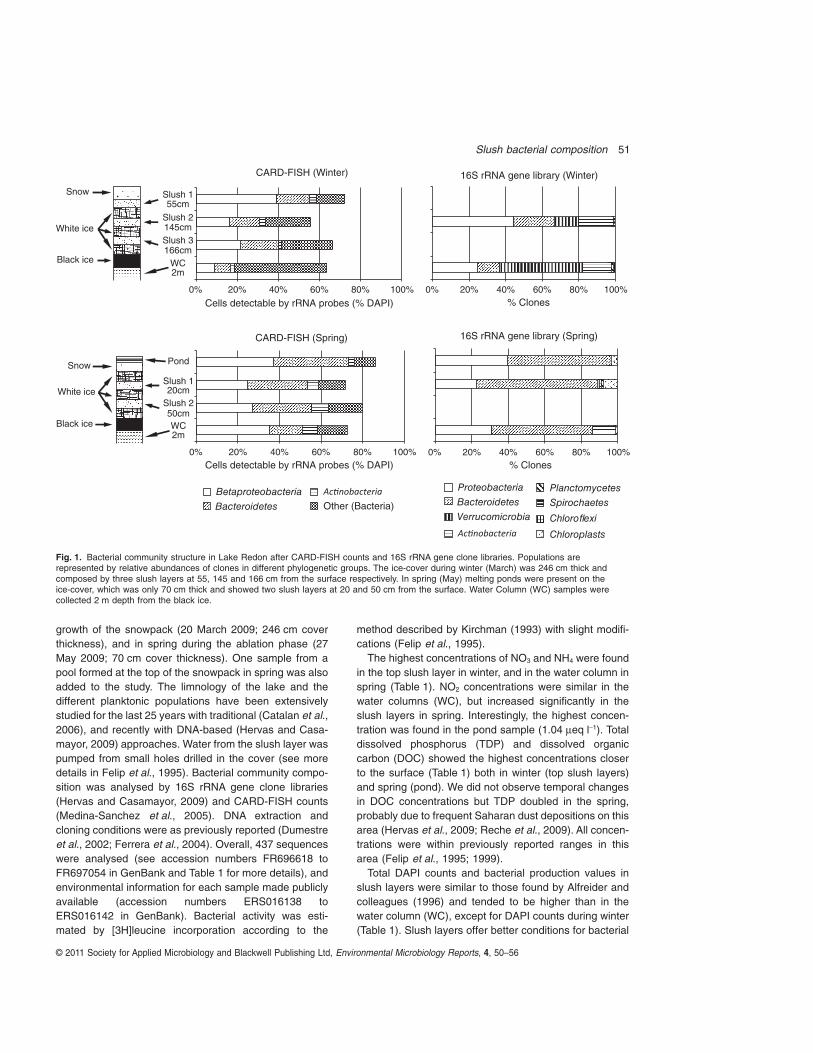
growth of the snowpack (20 March 2009; 246 cm coverthickness), and in spring during the ablation phase (27May 2009; 70 cm cover thickness). One sample from apool formed at the top of the snowpack in spring was alsoadded to the study. The limnology of the lake and thedifferent planktonic populations have been extensivelystudied for the last 25 years with traditional (Catalan et al.,2006), and recently with DNA-based (Hervas and Casa-mayor, 2009) approaches. Water from the slush layer waspumped from small holes drilled in the cover (see moredetails in Felip et al., 1995). Bacterial community compo-sition was analysed by 16S rRNA gene clone libraries(Hervas and Casamayor, 2009) and CARD-FISH counts(Medina-Sanchez et al., 2005). DNA extraction andcloning conditions were as previously reported (Dumestreet al., 2002; Ferrera et al., 2004). Overall, 437 sequenceswere analysed (see accession numbers FR696618 toFR697054 in GenBank and Table 1 for more details), andenvironmental information for each sample made publiclyavailable (accession numbers ERS016138 toERS016142 in GenBank). Bacterial activity was esti-mated by [3H]leucine incorporation according to the
method described by Kirchman (1993) with slight modifi-cations (Felip et al., 1995).
The highest concentrations of NO3 and NH4 were foundin the top slush layer in winter, and in the water column inspring (Table 1). NO2 concentrations were similar in thewater columns (WC), but increased significantly in theslush layers in spring. Interestingly, the highest concen-tration was found in the pond sample (1.04 meq l-1). Totaldissolved phosphorus (TDP) and dissolved organiccarbon (DOC) showed the highest concentrations closerto the surface (Table 1) both in winter (top slush layers)and spring (pond). We did not observe temporal changesin DOC concentrations but TDP doubled in the spring,probably due to frequent Saharan dust depositions on thisarea (Hervas et al., 2009; Reche et al., 2009). All concen-trations were within previously reported ranges in thisarea (Felip et al., 1995; 1999).
Total DAPI counts and bacterial production values inslush layers were similar to those found by Alfreider andcolleagues (1996) and tended to be higher than in thewater column (WC), except for DAPI counts during winter(Table 1). Slush layers offer better conditions for bacterial
Snow
White ice
Black ice
0% 20% 40% 60% 80% 100%
WC
Slush 2
Slush 1
Pond
CARD-FISH (Spring)
Snow
White ice
Black ice
0% 20% 40% 60% 80% 100%
WC
Slush 3
Slush 2
Slush 1
Cells detectable by rRNA probes (% DAPI)
Cells detectable by rRNA probes (% DAPI)
CARD-FISH (Winter)
Betaproteobacteria Bacteroidetes Other (Bacteria)
0% 20% 40% 60% 80% 100%% Clones
16S rRNA gene library (Winter)
Proteobacteria Bacteroidetes Verrucomicrobia
Planctomycetes Spirochaetes
Chloroflexi
Chloroplasts
% Clones 0% 20% 40% 60% 80% 100%
16S rRNA gene library (Spring)
55cm
145cm
166cm
2m
20cm
2m
50cm
Fig. 1. Bacterial community structure in Lake Redon after CARD-FISH counts and 16S rRNA gene clone libraries. Populations arerepresented by relative abundances of clones in different phylogenetic groups. The ice-cover during winter (March) was 246 cm thick andcomposed by three slush layers at 55, 145 and 166 cm from the surface respectively. In spring (May) melting ponds were present on theice-cover, which was only 70 cm thick and showed two slush layers at 20 and 50 cm from the surface. Water Column (WC) samples werecollected 2 m depth from the black ice.
Slush bacterial composition 51
© 2011 Society for Applied Microbiology and Blackwell Publishing Ltd, Environmental Microbiology Reports, 4, 50–56

growth than the WC because the ice grains matrix withnutrient-rich interstitial water provides a better environ-ment for bacterial activity, interaction between cells andsubstrate, and for the development of filamentous formsas previously discussed (Felip et al., 1995; 1999). Weobserved that Bacteroidetes were particularly favouredbeing twice more abundant in the slush layers than in theplankton as shown by CARD-FISH counts (Fig. 1). Betap-roteobacteria cells were also found to be more abundantin the slush layers in winter. These results are in agree-ment with a previous CARD-FISH work carried out in LakeGossenköllessee (Alfreider et al., 1996). As in this previ-ous work, we also observed a shift towards bacteria thatdid not hybridize with any of the group-specific probestested in the transition from the upper slush layer to theWC. Particularly in March, up to 70% of EUB338 positivecells did not hybridize with any of the group-specificprobes tested, and the sum of the cells hybridized withprobes BET42a (for Betaproteobacteria), HGC69a (forActinobacteria) and CF319a (for Bacteroidetes) was par-ticularly low. We could relate this fact to the abundanceof Verrucomicrobia sequences in the WC (up to 46%,Fig. 1). Interestingly, bacterial production increased72.2 ! 48.2-fold (Table 1) from winter to spring, and weobserved significant increases in bacterial abundance(4.2 ! 2.6-fold, Table 1), mainly by Bacteroidetes (12times more abundant in spring versus winter), Betapro-teobacteria (9 times) and Actinobacteria (10 times)(Fig. 1). During the ablation phase, light availabilityincreased promoting massive algae growth (Felip et al.,1999), further fuelling most of the bacterial activitydetected. Glaciers, which hold 75% of the freshwater onthe planet, are largely autotrophic systems (Anesio et al.,2009), and polar sea ice has also shown a net autotrophicactivity integrated over an entire season although polarseas melting will probably exacerbate bacterial respiration(Kaartokallio, 2004). Ice-melting is therefore a major pro-moter of community transitions both in marine and ininland waters. Previous studies in Lake Redon (Pyrenees)and Lake Gossenköllesee (Tyrolean Alps) showed thattemporal changes in eukaryotic assemblages werestrongly affected by the physical transformation of thelake cover and the snowpack in the catchment (Felipet al., 1999; Felip et al., 2002). After 16S rRNA geneanalyses, we observed drastic changes in the slush bac-terial community composition (Fig. 1) and a decrease inbacterial diversity from winter to spring (Table 1). Thevulnerability of the cryosphere (i.e. cold ecosystems) toclimate change and its potential large influence in theemission of greenhouse gases will certainly promotemore research on the ecology of the microbial communi-ties inhabiting these habitats.
All the sequences obtained in this work fell intoeight bacterial phyla (Fig. 1 and Fig. S1). Overall,Ta
ble
1.C
once
ntra
tion
ofni
trog
enco
mpo
unds
,tot
aldi
ssol
ved
phos
phor
ous
(TD
P),
diss
olve
dor
gani
cca
rbon
(DO
C),
bact
eria
labu
ndan
ce(D
AP
Icou
nts)
and
prod
uctio
n(B
P)i
nth
ese
tofs
ampl
esan
alys
ed,
and
dive
rsity
indi
cato
rsob
tain
edfr
omcl
one
libra
ries
insl
ush
(SL)
,w
ater
colu
mn
(WC
)an
dan
ice-
mel
ting
pond
inLa
keR
edon
.
Laye
rN
O3
(meq
l-1)
NH
4
(meq
l-1)
NO
2
(meq
l-1)
TD
P(n
mol
l-1)
DO
C(m
gl-1
)D
AP
I(¥
104 c
ells
ml-1
)B
P(p
mol
Leu
l-1h-1
)C
lone
num
bers
OT
U(9
7%)
Cov
erag
e(%
)S
Cha
o1
Win
ter
SL
117
14.2
0.08
901.
214
.9nd
ndnd
ndnd
SL
27
2.4
0.05
940.
69.
94.
2!
0.2
9050
6881
!18
SL
37
3.4
0.05
680.
616
.5nd
ndnd
ndnd
WC
62.
80.
0744
0.5
42.5
1.2
!0.
290
4561
164
!93
Spr
ing
PO
ND
33.
81.
0428
41.
317
8.5
223.
1!
5.2
8142
6311
4!
53S
L1
43.
50.
3818
00.
886
.527
6.3
!11
.089
1888
73!
ndS
L2
43.
20.
2812
30.
676
.1nd
ndnd
ndnd
WC
159.
60.
0760
0.7
68.8
78.0
!9.
187
3872
77!
29
OT
Us
and
dive
rsity
indi
ces
wer
eca
lcul
ated
at3%
cut-
off.
Sam
ples
labe
lled
inbo
ldw
ere
sele
cted
for
16S
rRN
Age
necl
one
libra
ries.
nd,
not
dete
rmin
ed.
52 T. Llorens-Marès, J.-C. Auguet and E. O. Casamayor
© 2011 Society for Applied Microbiology and Blackwell Publishing Ltd, Environmental Microbiology Reports, 4, 50–56

Bacteroidetes was the most abundant (42% of all 16SrRNA gene sequences) and showed a marked winter tospring increase in abundance (17 ! 7 to 59 ! 6% respec-tively, Fig. 1); there was a clear phylogenetic segregationbetween the ice-growth phase in winter (mostly Flavobac-teria and Bacteroidia) and the spring ablation period(mostly Cytophagia and Sphingobacteria) (Fig. 2 andFig. S1). Bacteroidetes are abundant in inland waters(Barberán and Casamayor, 2010) and closely related tophytoplankton blooms, both using phytoplankton exu-dates during algal growth (Zeder et al., 2009) or complexDOM derived from senescent phytoplankton (Pinhassiet al., 2004; Teira et al., 2008). Algae were abundant inthe spring sample as detected by microscopic observa-tions, and the recovering of chloroplast sequences andprobably Bacteroidetes were stimulated by the algalblooming. Indeed, Bacteroidetes is a very diverse chemo-heterotrophic bacterial group with many aerobic membersthat can degrade biopolymers such as cellulose andchitin, and the high molecular mass fraction of the DOM(Kirchman, 2002), at relatively low temperatures (Maryet al., 2006).
Proteobacteria were also very abundant in the clonelibraries with 32% of the sequences, and 80% of thembeing Betaproteobacteria. Most of these sequences fellinto four previously described freshwater clusters, Beta-I-II-III-IV (Glockner et al., 2000; Zwart et al., 2002; Hervasand Casamayor, 2009), respectively, and in two new clus-ters essentially formed by sequences from the cryosphere(Fig. S1). As for Bacteroidetes, we also observed winter-to-spring phylogenetic segregation within the Betaproteo-bacteria. The GSK16 subcluster containing sequencesmainly from freshwater ultraoligotrophic cold environ-ments, subglacial environments and alpine and nivallakes was mainly detected in spring, whereas the Rhod-oferax subcluster, a cosmopolitan freshwater group alsovery abundant in humic and eutrophic lakes (Zwart et al.,2002; Simek et al., 2005), was mostly detected in winter.
As mentioned elsewhere (Hervas and Casamayor, 2009),these differences in temporal distributions suggest differ-ent ecologies or physiologies among closely relatedBetaproteobacteria.
Verrucomicrobia 16S rRNA sequences represented12% of total clones, most of them only seen in winter.Verrucomicrobia have been found in cold environmentssuch as Lake Vida, Antarctica (Mosier et al., 2007) orLake Puma Yumco, Tibetan Plateau (Liu et al., 2009), butnever at the relative abundances we found in the WC(42%) and slush (16%) of Lake Redon. Thus, alpine lakesmight represent a suitable environment to further investi-gate this relatively unknown phylum (Sangwan et al.,2004). Finally, Actinobacteria (c. 10%), Planctomycetes(0.5%), Spirochaetes (0.5%) and Chloroflexi (0.2%) werealso detected in the clone libraries.
Slush bacterial assemblages were very similar to thewater column both in winter and spring (Fig. 3) and morethan 70% of the 16S rRNA gene sequences during thesnowpack growth phase had the closest match withsequences from lakes (Fig. 4). These results suggestedinitial colonization of the slush by bacteria from the samelake water and are in agreement with previous phy-toplankton studies where initial slush algae originatedfrom the phytoplankton-rich surface waters that flood theice cover due to hydrostatic adjustment (Felip et al., 1995;1999). Conversely, during spring ablation, 50% of the 16SrRNA gene slush sequences had the highest identity withsequences from the cryosphere (i.e. globally distributedglaciers, ice, snow and polar regions). A similar switchwas previously described in the phytoplankton where non-planktonic species probably introduced by melting watercoming from the snowpack were observed (Felip et al.,2002). In spring, the first meters of the lake water columnwere also influenced by melting waters and more than
0
10
20
30
40
50
60
70
WC Slush WC Slush Pond
No.
of c
lone
s Cytophagia
Sphingobacteria
Bacteroidia
Flavobacteria
WINTER SPRING
Fig. 2. Relative abundance of the different Classes within thephylum Bacteroidetes represented by the number of clones foundin each layer.
WC Spring
0.30.40.50.60.7
Pond Spring
Slush Spring
Slush Winter
WC Winter
100
100
99
96
Fig. 3. Hierarchical clustering analysis (UPGMA algorithm withJackknife supporting values, 100 replicates) carried out on the fivelibraries constructed in this study. Distances between clusters areexpressed in UniFrac units: a distance of 0 means that twoenvironments are identical and a distance of 1 means that twoenvironments contain mutually exclusive lineages.
Slush bacterial composition 53
© 2011 Society for Applied Microbiology and Blackwell Publishing Ltd, Environmental Microbiology Reports, 4, 50–56

20% of planktonic 16S rRNA gene bacterial sequenceswere closely related to sequences from the cryosphere(Fig. 4).
Overall c. 90% of the slush sequences were closelyrelated (> 97% identity) either to cold freshwater lakes(66%), such as Lake Michigan (Mueller-Spitz et al.,2009), Crater Lake (Page et al., 2004) and Lake Fuchs-kuhle (Glockner et al., 2000) (see Table S1 for detailsand Fig. 4), or to polar or glacial environments (23%),such as Puruogangri Ice Core (Zhang et al., 2008) or anArctic sea-ice melt pond (Brinkmeyer et al., 2003).These data are in agreement with the idea that aquaticbacteria in high-mountain regions are globally distributed(Zwart et al., 1998; Glockner et al., 2000; Liu et al.,2006; Sommaruga and Casamayor, 2009) but onlydevelop in cold and oligotrophic habitats as alpine lakes,glaciers, snow or polar environments. As previously dis-cussed (Hervas and Casamayor, 2009; Hervas et al.,2009), airborne dispersal is probably the mechanismthat better explains the cosmopolitanism found in alpineareas. Despite their minor quantitative relevance in thewhole cryosphere, these alpine areas are very conve-nient systems for surveying changes in microbialcomposition, dynamics, activity and fate following envi-ronmental perturbations.
Acknowledgements
We are thankful to Centre de Recerca d’Alta Muntanya, Uni-versitat de Barcelona, Vielha for laboratory facilities. L Cama-rero, M Felip, M Vila-Costa, X Triadó and A Fernandez-Guerra are acknowledged for field and lab assistance andancillary data. This research was supported by grantsPIRENA CGL2009-13318 and GOS-LAKES CGL2009-08523-E to E.O.C., and CONSOLIDER grant GRACCIECSD2007-00067 from the Spanish Office of Science andInnovation (MICINN). J.C.A. benefits from a Juan de laCierva postdoctoral fellow (MICINN).
References
Adams, W.P., and Allan, C. (1987) Aspects of the chemistry ofice, notably snow, on lakes. In Seasonal Snowcovers:
Physics, Chemistry, Hydrology. Jones, H.G., and Orville-Thomas, W.J. (eds). Dordrecht, The Netherlands: ReidelPublishing Company, pp. 393–466.
Alfreider, A., Pernthaler, J., Amann, R., Sattler, B., Glockner,F.O., Wille, A., and Psenner, R. (1996) Community analysisof the bacterial assemblages in the winter cover andpelagic layers of a high mountain lake by in situ hybridiza-tion. Appl Environ Microbiol 62: 2138–2144.
Anesio, A.M., Hodson, A.J., Fritz, A., Psenner, R., andSattler, B. (2009) High microbial activity on glaciers: impor-tance to the global carbon cycle. Glob Change Biol 15:955–960.
Barberán, A., and Casamayor, E.O. (2010) Global phyloge-netic community structure and beta-diversity patterns ofsurface bacterioplankton metacommunities. Aquat MicrobEcol 59: 1–10.
Bowman, J.P., McCammon, S.A., Brown, M.V., Nichols, D.S.,and McMeekin, T.A. (1997) Diversity and association ofpsychrophilic bacteria in Antarctic sea ice. Appl EnvironMicrobiol 63: 3068–3078.
Brinkmeyer, R., Knittel, K., Jurgens, J., Weyland, H., Amann,R., and Helmke, E. (2003) Diversity and structure of bac-terial communities in arctic versus antarctic pack ice. ApplEnviron Microbiol 69: 6610–6619.
Catalan, J. (1989) The winter cover of a high-mountain medi-terranean lake (Estany-Redo, Pyrenees). Water ResourRes 25: 519–527.
Catalan, J. (1992) Evolution of dissolved and particulatematter during the ice-covered period in a deep, high-mountain lake. Can J Fish Aquat Sci 49: 945–955.
Catalan, J., Camarero, L., Felip, M., Pla, S., Ventura, M.,Buchaca, T., et al. (2006) High mountain lakes: extremehabitats and witnesses of environmental changes. Lim-netica 25: 551–584.
Crump, B.C., Kling, G.W., Bahr, M., and Hobbie, J.E. (2003)Bacterioplankton community shifts in an arctic lake corre-late with seasonal changes in organic matter source. ApplEnviron Microbiol 69: 2253–2268.
Dumestre, J.F., Casamayor, E.O., Massana, R., and Pedrós-Alió, C. (2002) Changes in bacterial and archaeal assem-blages in an equatorial river induced by the watereutrophication of Petit Saut dam reservoir (FrenchGuiana). Aquat Microb Ecol 26: 209–221.
Eppacher, T. (1966) Umweltfaktoren und Lebewelt im Pela-gial des Gossenköllesees (Kühtai, Stubaier Alpen, 2.413m). PhD Thesis. Innsbruck, Austria: University of Inns-bruck.
Fig. 4. Isolation sources of the closest BLASTmatch found in GenBank for each of thesamples analysed. Only BLAST matches withmore than 97% identity were considered.
0
20
40
60
80
100
Lake Glacier Ice Snow
Polar Soil Non-saline water
% o
f clo
nes
Slush Winter
WC Winter
Pond Spring
Slush Spring
WC Spring
54 T. Llorens-Marès, J.-C. Auguet and E. O. Casamayor
© 2011 Society for Applied Microbiology and Blackwell Publishing Ltd, Environmental Microbiology Reports, 4, 50–56

Felip, M., Sattler, B., Psenner, R., and Catalan, J. (1995)Highly active microbial communities in the ice and snowcover of high mountain lakes. Appl Environ Microbiol 61:2394–2401.
Felip, M., Camarero, L., and Catalan, J. (1999) Temporalchanges of microbial assemblages in the ice and snowcover of a high mountain lake. Limnol Oceanogr 44: 973–987.
Felip, M., Wille, A., Sattler, B., and Psenner, R. (2002) Micro-bial communities in the winter cover and the water columnof an alpine lake: system connectivity and uncoupling.Aquat Microb Ecol 29: 123–134.
Ferrera, I., Massana, R., Casamayor, E.O., Balagué, V.,Sánchez, O., Pedrós-Alió, C., and Mas, J. (2004) High-diversity biofilm for the oxidation of sulfide-containing efflu-ents. Appl Microbiol Biotechnol 64: 726–734.
Glockner, F.O., Zaichikov, E., Belkova, N., Denissova, L.,Pernthaler, J., Pernthaler, A., and Amann, R. (2000) Com-parative 16S rRNA analysis of lake bacterioplanktonreveals globally distributed phylogenetic clusters includingan abundant group of actinobacteria. Appl Environ Micro-biol 66: 5053–5065.
Hervas, A., and Casamayor, E.O. (2009) High similaritybetween bacterioneuston and airborne bacterial commu-nity compositions in a high mountain lake area. FEMSMicrobiol Ecol 67: 219–228.
Hervas, A., Camarero, L., Reche, I., and Casamayor, E.O.(2009) Viability and potential for immigration of airbornebacteria from Africa that reach high mountain lakes inEurope. Environ Microbiol 11: 1612–1623.
Kaartokallio, H. (2004) Food web components, and physicaland chemical properties of Baltic Sea ice. Mar Ecol ProgSer 273: 49–63.
Kirchman, D.L. (1993) Leucine incorporation as a measure ofbiomass production by heterotrophic bacteria. In Hand-book of Methods in Aquatic Microbial Ecology. Kemp, P.F.,Sherr, B.F., Sherr, E.B., and Cole, J.J. (eds). Boca Raton,FL, USA: Lewis Publishers, pp. 509–512.
Kirchman, D.L. (2002) The ecology of Cytophaga-Flavobacteria in aquatic environments. FEMS MicrobiolEcol 39: 91–100.
Liu, Y., Yao, T., Jiao, N., Kang, S., Zeng, Y., and Huang, S.(2006) Microbial community structure in moraine lakes andglacial meltwaters, Mount Everest. FEMS Microbiol Lett265: 98–105.
Liu, Y.Q., Yao, T.D., Zhu, L.P., Jiao, N.Z., Liu, X.B., Zeng,Y.H., and Jiang, H.C. (2009) Bacterial diversity of freshwa-ter alpine lake puma yumco on the Tibetan plateau. Geomi-crobiol J 26: 131–145.
Mary, I., Cummings, D.G., Biegala, I.C., Burkill, P.H., Archer,S.D., and Zubkov, M.V. (2006) Seasonal dynamics ofbacterioplankton community structure at a coastal station inthe western English Channel. Aquat Microb Ecol 42: 119–126.
Medina-Sanchez, J.M., Felip, M., and Casamayor, E.O.(2005) Catalyzed reported deposition-fluorescence in situhybridization protocol to evaluate phagotrophy in mix-otrophic protists. Appl Environ Microbiol 71: 7321–7326.
Mosier, A.C., Murray, A.E., and Fritsen, C.H. (2007) Micro-biota within the perennial ice cover of Lake Vida, Antarc-tica. FEMS Microbiol Ecol 59: 274–288.
Mueller-Spitz, S.R., Goetz, G.W., and McLellan, S.L. (2009)Temporal and spatial variability in nearshore bacterioplank-ton communities of Lake Michigan. FEMS Microbiol Ecol67: 511–522.
Page, K.A., Connon, S.A., and Giovannoni, S.J. (2004) Rep-resentative freshwater bacterioplankton isolated fromCrater Lake, Oregon. Appl Environ Microbiol 70: 6542–6550.
Pinhassi, J., Sala, M.M., Havskum, H., Peters, F., Guadayol,O., Malits, A., and Marrase, C. (2004) Changes in bacteri-oplankton composition under different phytoplankton regi-mens. Appl Environ Microbiol 70: 6753–6766.
Priscu, J.C., Adams, E.E., Lyons, W.B., Voytek, M.A., Mogk,D.W., Brown, R.L., et al. (1999) Geomicrobiology of sub-glacial ice above Lake Vostok, Antarctica. Science 286:2141–2144.
Psenner, R., Sattler, B., Wille, A., Fritsen, C.H., Priscu, J.C.,Felip, M., and Catalan, J. (1999) Lake ice microbial com-munities in alpine and antarctic lakes. In Cold AdaptedOrganisms. Margesin, R., and Schinner, F. (eds). Heidel-berg, Germany: Springer-Verlag, pp. 17–31.
Reche, I., Ortega-Retuerta, E., Romera, O., Pulido-Villena,E., Morales-Baquero, R., and Casamayor, E.O. (2009)Effect of Saharan dust inputs on bacterial activity and com-munity composition in Mediterranean lakes and reservoirs.Limnol Oceanogr 54: 869–879.
Sangwan, P., Chen, X.L., Hugenholtz, P., and Janssen, P.H.(2004) Chthoniobacter flavus gen. nov., sp nov., the firstpure-culture representative of subdivision two, Spartobac-teria classis nov., of the phylum Verrucomicrobia. ApplEnviron Microbiol 70: 5875–5881.
Simek, K., Hornak, K., Jezbera, J., Masin, M., Nedoma, J.,Gasol, J.M., and Schauer, M. (2005) Influence of top-downand bottom-up manipulations on the R-BT065 subcluster ofbeta-proteobacteria, an abundant group in bacterioplank-ton of a freshwater reservoir. Appl Environ Microbiol 71:2381–2390.
Sommaruga, R., and Casamayor, E.O. (2009) Bacterial ‘cos-mopolitanism’ and importance of local environmentalfactors for community composition in remote high-altitudelakes. Freshw Biol 54: 994–1005.
Teira, E., Gasol, J.M., Aranguren-Gassis, M., Fernandez, A.,Gonzalez, J., Lekunberri, I., and Alvarez-Salgado, X.A.(2008) Linkages between bacterioplankton communitycomposition, heterotrophic carbon cycling and environ-mental conditions in a highly dynamic coastal ecosystem.Environ Microbiol 10: 906–917.
Wharton, R.A., Lyons, W.B., and Marais, D.J.D. (1993) Stableisotopic biogeochemistry of carbon and nitrogen in aperennially ice-covered Antartic lake. Chem Geol 107:159–172.
Xiang, S.R., Shang, T.C., Chen, Y., Jing, Z.F., and Yao, T.D.(2009) Dominant bacteria and biomass in the kuytun 51glacier. Appl Environ Microbiol 75: 7287–7290.
Zeder, M., Peter, S., Shabarova, T., and Pernthaler, J. (2009)A small population of planktonic Flavobacteria with dispro-portionally high growth during the spring phytoplanktonbloom in a prealpine lake. Environ Microbiol 11: 2676–2686.
Zhang, X.F., Yao, T.D., Tian, L.D., Xu, S.J., and An, L.Z. (2008)Phylogenetic and physiological diversity of bacteria isolatedfrom Puruogangri ice core. Microbial Ecol 55: 476–488.
Slush bacterial composition 55
© 2011 Society for Applied Microbiology and Blackwell Publishing Ltd, Environmental Microbiology Reports, 4, 50–56

Zhang, X.J., Ma, X.J., Wang, N.L., and Yao, T.D. (2009) Newsubgroup of Bacteroidetes and diverse microorganisms inTibetan plateau glacial ice provide a biological record ofenvironmental conditions. FEMS Microbiol Ecol 67: 21–29.
Zwart, G., Hiorns, W.D., Methe, B.A., Van Agterveld, M.P.,Huismans, R., Nold, S.C., et al. (1998) Nearly identical 16SrRNA sequences recovered from lakes in North Americaand Europe indicate the existence of clades of globallydistributed freshwater bacteria. Syst Appl Microbiol 21:546–556.
Zwart, G., Crump, B.C., Agterveld, M., Hagen, F., and Han,S.K. (2002) Typical freshwater bacteria: an analysis ofavailable 16S rRNA gene sequences from plankton oflakes and rivers. Aquat Microb Ecol 28: 141–155.
Supporting information
Additional Supporting Information may be found in the onlineversion of this article:Fig. S1. Maximum-parsimony phylogenetic tree of 16SrRNA gene bacterial sequences recovered from slush (SL),
underlying water column (WC) and pond (P) of Lake Redonduring winter (blue) and spring (red). The tree is based onmaximum parsimony analysis of the data set in the ARBprogram package (http://www.arb-home.de). Sequences ofc. 900 nt were inserted into the optimized tree by using par-simony criteria without allowing changes in the overall treetopology. Sequences from this study are in bold and arerepresentatives of each OTU at 97% identity (the number ofsequences within each OTU is also shown). GenBankaccession numbers are provided and the closest culturedrelatives are included. The scale bar represents 10% esti-mated divergence.Table S1. Closest BLASTs of slush (SL), water column (WC)and pond (P) 16S rRNA gene OTUs. The isolation sourceof the closest BLAST was retrieved from the GenBankdatabase.
Please note: Wiley-Blackwell are not responsible for thecontent or functionality of any supporting materials suppliedby the authors. Any queries (other than missing material)should be directed to the corresponding author for the article.
56 T. Llorens-Marès, J.-C. Auguet and E. O. Casamayor
© 2011 Society for Applied Microbiology and Blackwell Publishing Ltd, Environmental Microbiology Reports, 4, 50–56


OPEN
ORIGINAL ARTICLE
Connecting biodiversity and potential functional rolein modern euxinic environments by microbialmetagenomics
Tomas Llorens-Mares1, Shibu Yooseph2, Johannes Goll3, Jeff Hoffman4, Maria Vila-Costa1,Carles M Borrego5,6, Chris L Dupont4 and Emilio O Casamayor1
1Integrative Freshwater Ecology Group, Center of Advanced Studies of Blanes–Spanish Council for Research(CEAB-CSIC), Blanes, Girona, Spain; 2Informatics Group, J Craig Venter Institute, San Diego, CA, USA;3Informatics Group, J Craig Venter Institute, Rockville, MD, USA; 4Microbial and Environmental GenomicsGroup, J Craig Venter Institute, San Diego, CA, USA; 5Water Quality and Microbial Diversity, Catalan Institutefor Water Research (ICRA), Girona, Spain and 6Group of Molecular Microbial Ecology, Institute of AquaticEcology, University of Girona, Girona, Spain
Stratified sulfurous lakes are appropriate environments for studying the links between compositionand functionality in microbial communities and are potentially modern analogs of anoxic conditionsprevailing in the ancient ocean. We explored these aspects in the Lake Banyoles karstic area (NESpain) through metagenomics and in silico reconstruction of carbon, nitrogen and sulfur metabolicpathways that were tightly coupled through a few bacterial groups. The potential for nitrogenfixation and denitrification was detected in both autotrophs and heterotrophs, with a major role fornitrogen and carbon fixations in Chlorobiaceae. Campylobacterales accounted for a largepercentage of denitrification genes, while Gallionellales were putatively involved in denitrification,iron oxidation and carbon fixation and may have a major role in the biogeochemistry of the ironcycle. Bacteroidales were also abundant and showed potential for dissimilatory nitrate reduction toammonium. The very low abundance of genes for nitrification, the minor presence of anammoxgenes, the high potential for nitrogen fixation and mineralization and the potential for chemotrophicCO2 fixation and CO oxidation all provide potential clues on the anoxic zones functioning. Weobserved higher gene abundance of ammonia-oxidizing bacteria than ammonia-oxidizing archaeathat may have a geochemical and evolutionary link related to the dominance of Fe in theseenvironments. Overall, these results offer a more detailed perspective on the microbial ecology ofanoxic environments and may help to develop new geochemical proxies to infer biology andchemistry interactions in ancient ecosystems.The ISME Journal (2015) 9, 1648–1661; doi:10.1038/ismej.2014.254; published online 9 January 2015
Introduction
Linking microbial community composition andecological processes such as carbon (CO2 fixationand respiration), nitrogen (nitrification, denitrifica-tion and N2 fixation) and sulfur cycling (sulfurassimilation, anaerobic sulfate respiration andsulfide oxidation) is a primary goal for microbialecologists. This information is needed to improve
our understanding on the structure and functioningof microbial communities, to properly guide experi-mental research efforts, to promote our ability tounderstand fundamental mechanisms controllingmicrobial processes and interactions in situ(Prosser, 2012) and to approach the study of earlierinteractions of biosphere–hydrosphere–geosphere(Severmann and Anbar, 2009). However, a detailedcomprehension of biological interactions in highlycomplex systems is however difficult (Bascompteand Sole, 1995).
Stratified lakes with euxinic (anoxic and sulfur-ous) bottom waters are simplified study systems toexplore current biodiversity–biogeochemistry inter-actions because of their high activity, large biomassand low microbial diversity (Guerrero et al., 1985).Usually, oxic–anoxic interfaces contain conspi-cuous blooms of photosynthetic bacteria that areoften macroscopically visible because of the high
Correspondence: EO Casamayor, Integrative Freshwater EcologyGroup, Center of Advanced Studies of Blanes–Spanish Councilfor Research (CEAB-CSIC), Acces Cala Sant Francesc, 14, Blanes,Girona 17300, Spain.E-mail: [email protected] CL Dupont, Microbial and Environmental Genomics Group,J Craig Venter Institute, San Diego, CA 92037, USA.E-mail: [email protected] 19 March 2014; revised 17 November 2014; accepted24 November 2014; published online 9 January 2015
The ISME Journal (2015) 9, 1648–1661& 2015 International Society for Microbial Ecology All rights reserved 1751-7362/15
www.nature.com/ismej

intracellular content of pigments, and additionalmicrobial populations also tend to accumulate(Pedros-Alio and Guerrero, 1993). These bloomsare, in fact, natural enrichment cultures that facil-itate physiological studies in situ (Van Gemerdenet al., 1985). At such interfaces fine gradients ofphysicochemical conditions are present and tightcoupling between different biogeochemical cycles(mainly carbon, nitrogen and sulfur) are established.Microbes adapted to such gradients are difficult toculture because in situ conditions are very difficultto mimic in the laboratory, and their study hasimproved perceptibly by culture-independent meth-ods (Casamayor et al., 2000).
Stratified euxinic lake systems may also providepotential modern day analogue ecosystems for theoceans during long periods of Earth history. Theplanet was essentially anoxic until 2.7–2.4 billionyears ago, with a ferruginous ocean (Anbar, 2008;Reinhard et al., 2013). With the advent of oxygenicphotosynthesis, atmospheric oxygen began to rise,as did the oxygen content in the surface oceans. Thedeep oceans remained anoxic, but entered a periodof temporal and spatial heterogeneity. Strong euxi-nic conditions might be expected in ancient coastalareas, with merely anoxic conditions in the openocean, although high Fe deep ocean conditionswould have been maintained (Reinhard et al., 2013).In contrast, Fe is low in the deep waters of themodern ocean and, therefore, it is difficult to findappropriate ancient ocean analogue in the currentmarine realm. With this in mind, stratified aquaticsystems with high Fe concentrations in deep waterscould be more appropriate modern day analogues ofthe Proterozoic ocean. Karstic lacustrine systemswith a gradient of organic carbon delivery andsulfide concentrations generated by sulfate reduc-tion, and usually rich in iron, would providereasonable biogeochemical analogues for ancientcoastal to open ocean gradients.
In this study, we explored the oxic–anoxic inter-face (metalimnion) and bottom waters (hypolim-nion) from two sulfurous lakes in the Banyoleskarstic area (NE Spain) through shotgun metage-nomics and in silico analysis of several metabolicpathways. In the framework of paleoreconstructionof anoxic conditions in ancient marine systems, onelake would be representative of strong euxinicconditions (Lake Ciso) and the other of low euxiniaand an active iron cycle (basin III of Lake Banyoles).We explore the links between microbial compositionand functionality for the carbon, nitrogen and sulfurcycling after phylogenetic and functional identifi-cation. The taxonomic identity assigned to eachfunctional step was determined by the closest matchin databases, and the relative abundance anddistribution of marker genes was comparativelyanalyzed among samples as a proxy of the potentialin situ relevance of these pathways under thespecific environmental conditions studied. Becauseof the lack of oxygen, large microbial biomass and
high contribution of deep dark fixation processes tooverall CO2 incorporation (Casamayor et al., 2008,2012; Casamayor, 2010), we hypothesized a highgenetic potential for chemotrophic CO2 fixation anda tight redox coupling between carbon, nitrogen andsulfur biogeochemical cycling. In addition, becauseof its euxinic nature we also expected a lowcontribution of both methanogens and ammoniaoxidizers in the biogeochemical cycles prevailing inthese environments.
Materials and methods
Environment and samples collectionLake Ciso and basin III of Lake Banyoles (BanyolesC-III) are in the Banyoles karstic area, northeasternSpain (4218’N, 2145’E), and the microbial commu-nities inhabiting these water bodies have beenextensively studied by limnologists and microbialecologists (see, for example, Guerrero et al., 1980;Garcia-Gil and Abella, 1992; Pedros-Alio andGuerrero, 1993). The lakes were sampled on 8–9May 2010. Vertical profiles of temperature, conduc-tivity, oxygen and redox potential were measuredin situ with a multiparametric probe OTT-HydrolabMS5 (Hatch Hydromet, Loveland, CO, USA). Thedifferent water compartments (oxic epilimnion,metalimnion with the oxic–anoxic interface andanoxic hypolimnion) were determined for each lakeaccording to the physicochemical profiles recordedin situ (Figure 1). For sulfide analyses, 10 ml ofsubsamples were collected in screw-capped glasstubes and immediately alkalinized by adding 0.1 mlof 1 M NaOH and fixed by adding 0.1 ml of 1 M zincacetate. Sulfide was analyzed in the laboratoryaccording to Truper and Schlegel (1964). Forpigments, water samples were processed asdescribed by Guerrero et al. (1985) and analyzedby HPLC as previously reported (Borrego et al.,1999). Iron (Feþ2) concentrations were obtainedfrom Garcia-Gil (1990).
These lakes are stratified and have incomingsulfate-rich water seeping in through bottomsprings, resulting in deep waters rich in reducedsulfur compounds. An oxic–anoxic interface, orredoxcline, is established in the water columnwhere light and sulfide usually coexist. LakeBanyoles is a gypsum karst spring area consistingof six main basins covering a surface area of 1.1 km2.The basin III (C-III) is meromictic with a maximaldepth of 32 m, and a redoxcline between 18 and21 m, depending on the season. Blooms ofbrown-colored photosynthetic green sulfur bacteria(Chlorobiaceae) and purple sulfur bacteria (Chro-matiaceae) have been periodically reported(Garcia-Gil and Abella, 1992). Lake Ciso is a smallmonomictic lake (650 m2), located 1 km away fromLake Banyoles with a maximum depth of 6.5 m.The thermocline is at 1.5 m, where differentbacterial populations accumulate (Casamayor et al.,2000). The presence of aerobic chemoautotrophic
Biodiversity and biogeochemistry in euxinic lakesT Llorens-Mares et al
1649
The ISME Journal
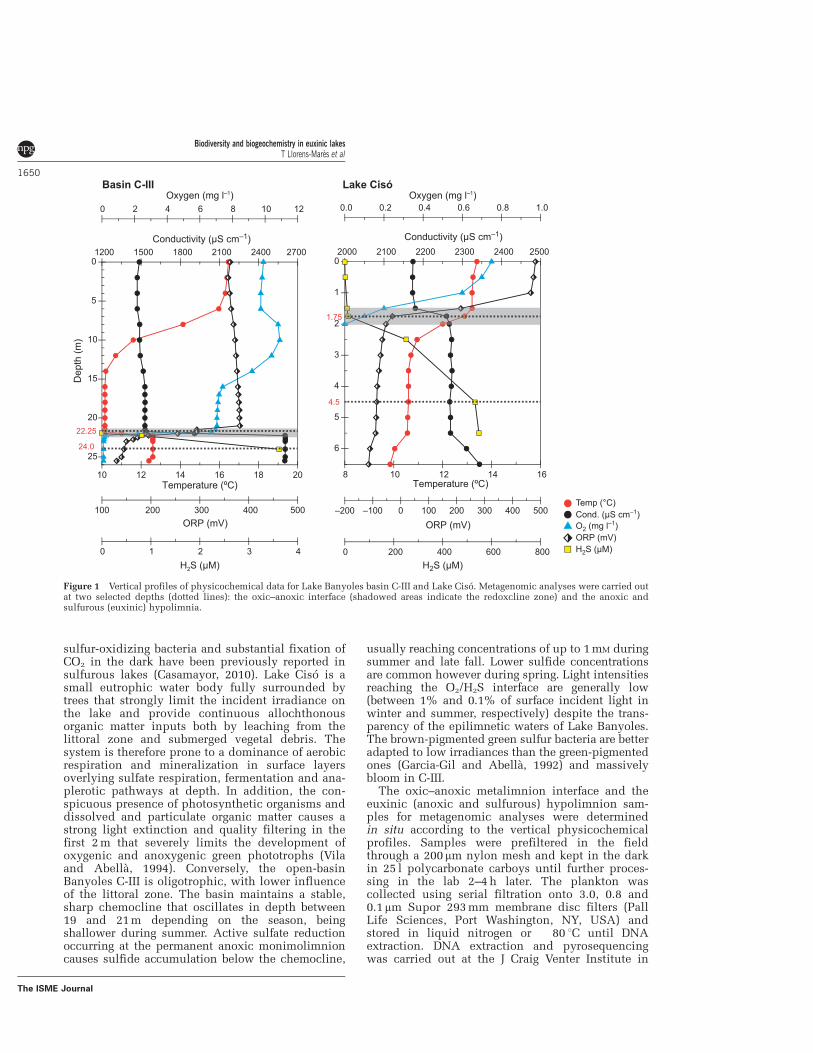
sulfur-oxidizing bacteria and substantial fixation ofCO2 in the dark have been previously reported insulfurous lakes (Casamayor, 2010). Lake Ciso is asmall eutrophic water body fully surrounded bytrees that strongly limit the incident irradiance onthe lake and provide continuous allochthonousorganic matter inputs both by leaching from thelittoral zone and submerged vegetal debris. Thesystem is therefore prone to a dominance of aerobicrespiration and mineralization in surface layersoverlying sulfate respiration, fermentation and ana-plerotic pathways at depth. In addition, the con-spicuous presence of photosynthetic organisms anddissolved and particulate organic matter causes astrong light extinction and quality filtering in thefirst 2 m that severely limits the development ofoxygenic and anoxygenic green phototrophs (Vilaand Abella, 1994). Conversely, the open-basinBanyoles C-III is oligotrophic, with lower influenceof the littoral zone. The basin maintains a stable,sharp chemocline that oscillates in depth between19 and 21 m depending on the season, beingshallower during summer. Active sulfate reductionoccurring at the permanent anoxic monimolimnioncauses sulfide accumulation below the chemocline,
usually reaching concentrations of up to 1 mM duringsummer and late fall. Lower sulfide concentrationsare common however during spring. Light intensitiesreaching the O2/H2S interface are generally low(between 1% and 0.1% of surface incident light inwinter and summer, respectively) despite the trans-parency of the epilimnetic waters of Lake Banyoles.The brown-pigmented green sulfur bacteria are betteradapted to low irradiances than the green-pigmentedones (Garcia-Gil and Abella, 1992) and massivelybloom in C-III.
The oxic–anoxic metalimnion interface and theeuxinic (anoxic and sulfurous) hypolimnion sam-ples for metagenomic analyses were determinedin situ according to the vertical physicochemicalprofiles. Samples were prefiltered in the fieldthrough a 200 mm nylon mesh and kept in the darkin 25 l polycarbonate carboys until further proces-sing in the lab 2–4 h later. The plankton wascollected using serial filtration onto 3.0, 0.8 and0.1 mm Supor 293 mm membrane disc filters (PallLife Sciences, Port Washington, NY, USA) andstored in liquid nitrogen or ! 80 1C until DNAextraction. DNA extraction and pyrosequencingwas carried out at the J Craig Venter Institute in
Temperature (ºC)10 12 14 16 18 20
Dep
th (m
)
0
5
10
15
20
25
1200 1500 1800 2100 2400 2700
Oxygen (mg l–1) Oxygen (mg l–1)0 2 4 6 8 10 12
ORP (mV)100 200 300 400 500
0 1 2 3 4
Temperature (ºC)8 10 12 14 16
0
1
2
3
4
5
6
Conductivity (µS cm–1) Conductivity (µS cm–1)2000 2100 2200 2300 2400 2500
0.0 0.2 0.4 0.6 0.8 1.0
–200 –100 0 100 200 300 400 500ORP (mV)
0 200 400 600 800
Basin C-III Lake Cisó
22.25
24.0
1.75
4.5
H2S (µM) H2S (µM)
Temp (°C)Cond. (µS cm–1)O2 (mg l–1) ORP (mV)H2S (µM)
Figure 1 Vertical profiles of physicochemical data for Lake Banyoles basin C-III and Lake Ciso. Metagenomic analyses were carried outat two selected depths (dotted lines): the oxic–anoxic interface (shadowed areas indicate the redoxcline zone) and the anoxic andsulfurous (euxinic) hypolimnia.
Biodiversity and biogeochemistry in euxinic lakesT Llorens-Mares et al
1650
The ISME Journal

Rockville, MD, USA as recently reported (ZeiglerAllen et al., 2012).
DNA sequences analysesA shotgun metagenomics approach was applied onall three size fractions of four samples from LakesCiso and Banyoles C-III. Identical reads wereremoved using CD-HIT (Li and Godzik, 2006).Annotation of metagenomic reads was conductedthrough the JCVI prokaryotic annotation pipeline(Tanenbaum et al., 2010) using Uniref100, PFAM,TIGRfam and KEGG (Kyoto Encyclopedia of Genesand Genomes) Orthologs (KO) databases for taxo-nomic and functional annotation. JCVI Metage-nomics reports (http://jcvi.org/metarep) were usedfor analysis and comparative metagenomics (Gollet al., 2010). KO annotation was used for functionalanalysis and KO counts were normalized accordingto the length of the read and the length of the targetgene (Sharon et al., 2009). The communities andfunctional profiles found in each size fraction werehighly similar (Supplementary Figure S1) and,therefore, we pooled all reads after normalizing forsequencing depth for subsequent analyses, whichallows for a better comparison of metagenomes.
The functional analyses focused on the three mainbiogeochemical cycles for this type of lakes, that is,carbon (C), nitrogen (N) and sulfur (S) cycling. Thegenetic potential of the microbial community wasanalyzed following the C, N, and S marker genes(KOs) as reported by Lauro et al. (2011) with a fewmodifications. We amended this previous rubric byadding the anaerobic carbon fixation carried outthrough the Calvin cycle by Chromatiaceae, andadditional genes for polysulfide reduction, nitratereduction and nitrite oxidation. In addition, thegenes pyruvate:ferredoxin oxidoreductase (porA/B)were not considered as marker genes for fermenta-tion as in Lauro et al. (2011), because they are keygenes in the reverse tricarboxylic acid cycle used forcarbon fixation by Epsilonproteobacteria abundantin our study lakes (Campbell and Cary, 2004; Takaiet al., 2005). Because both sulfide oxidation anddissimilatory sulfate reduction pathways aremediated by the same set of genes (aprA, aprB anddsrA) but are found in different families of bacteria,we assigned metagenomic reads to each pathwayaccording to phylogeny, that is, sulfate reduction forFirmicutes and Deltaproteobacteria reads, and sul-fide oxidation for Alphaproteobacteria, Betaproteo-bacteria, Chlorobiaceae and Chromatiaceae. Finally,for the sulfur-oxidizing Epsilonproteobacteria of theorder Campylobacterales we specifically searchedfor sox genes (coding for thiosulfate oxidation) notcurrently available in the KEGG database. Markergenes used in the present work are shownin Supplementary Table S1. Hierarchical clus-tering and heatmap plots were generated withR (R Development Core Team, 2012) using thelibrary ‘seriation’. Metagenomic data have been
deposited at CAMERA (Sun et al., 2011) underaccession number CAM_P_0001174.
Results
Environmental parametersAt the time of sampling (spring 2010), the watercolumn was thermally stratified with thermoclinesspanning from 1.5 to 3 m in Lake Ciso, and 7–14 m inbasin C-III (Figure 1). Chemical stratification wasdisconnected from thermal stratification in basinC-III, where a sharp chemocline was detected at21 m depth based on the higher conductivity ofincoming sulfate-rich waters. The epilimnion ofC-III showed oxygen concentrations of 46 mg l–1,with rapid drawdowns in the hypolimnion, and thesharp oxic–anoxic interface caused an abruptdecrease in the redox potential and generation of apronounced redoxcline (Figure 1, shaded area). InLake Ciso, the epilimnion (0–1.5 m depth) wasoxygen deficient (0.2 ! 1 mg l–1) and the watercolumn became completely anoxic below 2 m depth.In this case, the redoxcline and the oxic–anoxicinterface were located in a narrow water layer of0.5 m width (1.5–2 m depth). The concentration ofnitrogen and sulfur species changed according tothese physicochemical gradients with high concen-trations of ammonia mainly in the hypolimnia (up to60 mM) and sulfide concentrations ranging between532 mM in Lake Ciso and o1mM in C-III in agreementwith redox potential (Eh) measurements (Table 1,and Supplementary Figure S2). The concentration ofChl a measured in the lakes agreed with theirtraditional trophic status (oligotrophic for C-III and
Table 1 Biogeochemical data for Lake Ciso and Banyoles basinC-III
Ciso ML Ciso HL C-III ML C-III HL
Depth (m) 1.75 4.5 22.25 24Temperature (1C) 12.9 10.6 12.6 12.6Conductivity (mS cm-1) 2260 2268 2603 2604Eh (mV) ! 30 ! 86 195 145Oxygen (mg l!1) 0.10 0 0.25 0H2S (mM) 12.8 531.9 0.8 3.6Light (% incident) 1% o0.1% 1% o0.1%TOC (mg l!1) 5 3 1.5 3pH 7.40 7.23 7.14 7.15TDP (mM) 1.05 2.83 0.33 0.37NH4 (mM) 44.39 50.99 25.04 37.52NO2 (mM) 0.75 b.d.l. 0.21 0.00NO3 (mM) 2.20 1.44 6.20 0.54Urea (mM) 4.84 0.17 1.91 1.08Si (mM) 185.0 168.1 144.8 114.5Chl a (mg l!1) 1.7 22.5 1.1 0.8BChl a (mg l!1) 2.4 123.7 1.1 1.6BChl c and d (mg l!1) 5.4 39.3 0 0BChl e (mg l! 1) 0.8 13.6 25.8 40.6
Abbreviations: BChl, bacteriochlorophyll; b.d.l., below detectionlimits; Chla, chlorophyll a; HL, hypolimnion; Eh, redox potential;ML, metalimnion; TOC, total organic carbon; TDP, total dissolvedphosphorus.
Biodiversity and biogeochemistry in euxinic lakesT Llorens-Mares et al
1651
The ISME Journal

mesotrophic for Lake Ciso). Biomarker pigments forgreen sulfur (BChl c, d and e) and purple sulfurbacteria (BChl a) were detected in the metalimnionand hypolimnion of Lake Ciso and basin C-III.Particularly, conspicuous concentrations of BChl e,the characteristic pigment of brown-colored speciesof Chlorobium, were measured between 22 and 24 mdepth in basin C-III (Table 1). An active Fe2þ cyclehas been previously reported in Lake Banyoles withconcentrations of 8–10 mM in both the resurgence ofgroundwater (bottom spring) and water column ofbasin C-III, inflow velocity of 0.8 mmol total Fe perh, and concentrations of up to 8 mg total Fe per g ofsediment (dw) (Garcia-Gil, 1990). Interestingly,we also observed substantial concentrations ofnitrate in the bottom of the basin, coming from thegroundwater, and high concentration in surfacewaters originated from the surrounding crop fieldsand farms (Supplementary Figure S2).
Taxonomic structure of the microbial communitiesThe overall taxonomic breakdown of the commu-nities was assessed using the phylogenetic annota-tion of the metagenomic reads. The domain Bacterianumerically dominated the genetic composition ofthe microbial communities, both at the oxic–anoxicinterfaces and at the anoxic hypolimnia (Table 2).More than 95% of all taxonomically assignedmetagenomic reads matched bacteria, with a fewrepresentatives of archaea (range 0.7–3.5%), phages(0.8–4.0%) and eukaryotes (0.7–2.8%). Archaealmetagenomic reads were more abundant in thehypolimnion (2.67±1.21% of total reads) than inthe metalimnion (1.09±0.47%). Most of thearchaeal metagenomics reads matched methano-gens within Euryarchaeota (c. 88%), with a fewadditional representatives within Thermococci,Thermoplasmata, Archaeoglobi and Haloarchaea(Supplementary Figure S3). The 16S rRNA gene inthe metagenomics data set agreed with the broadtaxonomic picture provided by the functional genes(Table 2), that is, 98–100% of the 16S rRNA geneaffiliated to Bacteria, whereas Archaea were a minor
component more abundant in the hypolimnion(1.4±0.7%) than in the metalimnion (0.2±0.2%).
Interestingly, we observed higher proportion offunctional reads affiliated to Crenarchaeota–Thaumarchaeota at the oxic–anoxic interface(12.3±0.4% of total archaeal reads) than at theanoxic and sulfurous bottom of the lakes(8.6±0.5%). Thaumarchaeota metagenomic readsputatively assigned to ammonia oxidizers were0.03% of total reads but were not detected in the16S rRNA pool. Conversely, ammonia-oxidizingbacteria (AOB, Nitrosomonadales- and Nitrosococ-cus-like) and nitrite-oxidizing bacteria (Nitrospirae-like) metagenomic reads were detected at 10 timeshigher concentration (0.3% of total reads). AOBwere also detected in the 16S rRNA pool at similarconcentrations (0.1% of total 16S rRNA gene).Overall, the most abundantly recovered 16S rRNAgene from the metagenomic data set matchedChlorobiales (green sulfur bacteria; 20%, range5–50%), Campylobacterales (Epsilonproteobacteria;14%, range 11–21%), Burkholderiales (Betaproteo-bacteria; 12%, range 0.5–35%), OD1 (8%, range4–13%) and Frankiales (Actinobacteria; 5%,range 0.3–12%), among others (Figure 2, andSupplementary Table S2). These populations weredifferentially distributed between layers and lakes(Figure 2, and see details in Supplementary TableS2) and yielded a taxonomic clustering according tothe redox potential, with samples with higher redox(4" 30 mV) and lower sulfide concentrations (sul-fide o13 mM) closer to each other than to the mosteuxinic sample (Lake Ciso hypolimnion, sulfide4500 mM, redox " 86 mV; Table 1).
Functional structure of the microbial communitiesThe metagenomic data set comprised four millionreads of average length 377 bp and 54% of themetagenomic reads were taxonomically assignedbased on the APIS or BLAST, whereas 22% couldbe assigned KO numbers and thus putative func-tions (e-value 10"5). From the identified KOs, weselected marker genes related to C, N and S cycling
Table 2 Total number of metagenomic reads (averaged c. 1 million per sample) for Lake Ciso and Banyoles basin C-III
Ciso ML Ciso HL C-III ML C-III HL
Total number of reads 869 947 991 056 1 071 206 1 077 431Taxonomically assigned reads (%) 46.7 53.5 54.2 62.4Bacteria (%) 92.5 94.6 91.9 93.7Archaea (%) 0.7 3.5 1.4 1.7Eukarya (%) 2.8 1.1 2.7 0.7Viruses (%) 4.0 0.8 4.0 3.916S rRNA genes in the metagenomic pool 465 578 690 787Bacteria (%) 99.6 97.9 100 99.4Archaea (%) 0.4 2.1 0 0.6Functionally assigned metagenomic reads (%) 25.8 27.5 30.5 32.6Reads of key genes in C, N and S cycles 2392 3574 4773 5162
Abbreviations: HL, hypolimnion; ML, metalimnion.
Biodiversity and biogeochemistry in euxinic lakesT Llorens-Mares et al
1652
The ISME Journal

(Supplementary Table S1). Anaerobic C fixation,nitrogen fixation and assimilatory sulfate reductiongenes accounted for a substantial percentage ofannotated reads in the hypolimnia, whereas genesfor aerobic respiration, nitrogen assimilation andsulfur mineralization were more abundant at theoxic–anoxic interfaces (Supplementary Table S3).Other less abundant metabolic pathways such asammonification, anammox–SRAO (sulfate-reducinganaerobic ammonia oxidation; Rikmann et al., 2012)and dissimilatory sulfate reduction were detected,mostly in the hypolimnion of Lake Ciso. Suchdifferences were globally captured by a functional-level (C, N and S pathways examined) hierarchicalanalysis that grouped the samples according topresence/absence of oxygen (Figure 3). This cluster-ing analysis produced the same result using multi-ple other functional annotations, including KEGG(EC), Gene Ontology terms and MetaCyc. Similarly,repeating this analysis with all size fractions asseparate libraries (data not shown) and housekeep-ing genes (Supplementary Figure S4) gave similarresults, with redox being a more structuring factorthan geographical distribution.
As Bacteria and Archaea accounted for most oftotal metagenomic reads, we focused on the prokar-yotes for a comparative study of the geochemistryof carbon (Figure 4), nitrogen (Figure 5) and sulfur(Figure 6) along the redoxcline. We used the relativeabundance of the detected functional genes as aproxy of the potential relevance of each pathwayin situ without considering the role of microscopicalgae. For the C cycling, the main pathway detectedin the oxic–anoxic interface was aerobic respirationby heterotrophic Actinomycetales and Burkholder-iales in Lake Ciso, and by Actinomycetales andPelagibacterales (SAR11-like) in Lake BanyolesC-III. In the hypolimnion, the abundant pathways
were various forms of anaerobic carbon fixation: byChromatiales (anoxygenic phototrophy by theCalvin cycle), Bacteroidales (probably anaplerotic)and sulfate-reducing bacteria (SRB) (probably thereductive citric acid cycle/Arnon pathway; Fuchs,2011) in Lake Ciso, and Chlorobiales (anoxygenicphototrophy by the Arnon cycle) in Banyoles C-III(Table 3). Chemolithotrophic aerobic carbon fixationvia the Calvin cycle, which was rare, was mostlyrelated to Betaproteobacteria of the genus Hydro-genophilales (Thiobacillus-like) and Gallionellales(Syderoxydans-like). Chemolithotrophic Epsilonpro-teobacteria with genes for the Arnon cycle (Campy-lobacterales on Figure 4) were found related to thegenera Arcobacter, Sulfuricurvum and Sulfurimonas(Table 3). Carbon monoxide (CO) oxidation markergenes were also present (3–14% of those targetedmarker genes selected for the carbon cycle,Supplementary Table S3) and related to hetero-trophic bacteria. The potential for fermentation wasmostly observed in Lake Ciso. Both methanogenesisand methane oxidation-specific marker genes hadlow abundances in all four environments, and evenin those samples where such genes were notspecifically detected (Figure 4, dotted lines) wefound additional metagenomic reads taxonomicallymatching methanogens and methane oxidizersclades.
For the nitrogen cycle, most of the detectedmarker genes catalyzed N assimilation and miner-alization (Figure 5 and Supplementary Table S3).Denitrification was observed in low abundance inall the cases (c. 3% of the nitrogen functional readsselected), and the main taxa involved wereCampylobacterales (autotrophic Sulfurimonas andArcobacter), Oceanospirillales (heterotrophs) andGallionellales (autotrophic Sideroxydans). Conver-sely, the potential for nitrogen fixation (nif genes)
0 25 50 75 100
%
CIII−Metalimnion
CIII−Hypolimnion
Cisó−Metalimnion
Cisó−Hypolimnion
0.52 0.50 0.48 0.46 0.44 0.42l
l
l
l
l
llll
l
l
l
l
l
l
l
l
ll
l l
l
l
l
l
ll
ll
l l
l l
ll
l
l
l
l
l
l
ll
l
l
l
ll
l
l
Figure 2 Prokaryotic community structure (relative abundances at the Order level) of Lake Banyoles basin C-III and Lake Ciso obtainedfrom the 16S rRNA gene present in the metagenomic pool. See detailed information in Supplementary Table S2. Hierarchical clusteringbased on Bray–Curtis dissimilarity matrices.
Biodiversity and biogeochemistry in euxinic lakesT Llorens-Mares et al
1653
The ISME Journal

was observed in all the cases, although in higherabundance under euxinia (18±11%) than in theoxic–anoxic interfaces (4±4%). The nif genes weremost related to Chlorobium in Lake Banyoles,whereas in Lake Ciso they were most similar toSyntrophobacterales. Under the most euxinic con-ditions, c. 6% of the total nitrogen marker genesexamined were the anammox catalyzing enzymehydrazine oxidoreductase, although these wereassociated with Syntrophobacterales instead of theplanctomycetales found in oceanic anoxic zones.Both aerobic ammonia oxidation and nitrificationmarker genes had very low abundance, and wereonly properly detected in Lake Banyoles C-IIIhypolimnion (amoC gene 97% identical toNitrosospira multiformis). However, metagenomicreads matching Thaumarchaeota (ammonia-oxidiz-ing archaea (AOA)), Nitrosomonadales and Nitroso-coccus (AOB) and Nitrospirae nitrite-oxidizing
bacteria were detected in all lakes and water layers(Figure 5, dotted lines), pointing out that the geneticpotential to close the nitrogen cycle was there, butat very low abundance as compared with otherpathways in the cycle.
Finally, in the S cycle (Figure 6 andSupplementary Table S3) the highest percentage ofthe reads matched assimilatory sulfate reduction(28±9% of those targeted sulfur marker genes) andsulfur mineralization (35±25%), mostly driven bythe predominant heterotrophic organisms found ineach water layer (Actinomycetales and Burkholder-iales). Most sulfide oxidation genes likely origi-nated from Chlorobiales in Lake Banyoles C-III,and Chromatiales in Lake Ciso, with furthercontributions from chemolithotrophs Gallionellales,Hydrogenophilales and Campylobacterales. Thepotential for planktonic sulfate reduction wasonly observed in strong euxinia (Lake Ciso
CisMetalimnion
CIIIMetalimnion
CIIIHypolimnion
CisHypolimnion
Aerobic C fixation
Aerobic CH4 oxidation
Aerobic respiration
Anaerobic C fixation
CO oxidation
Fermentation
Methanogenesis
Ammonification
Anammox (SRAO)
Denitrification
Nitrification
Nitrogen assimilation
Nitrogen Fixation
Nitrogen Mineralization
Assimilatory sulfate reduction
Sulfur Mineralization
Sulfur oxidation
Dissimilatory sulfate reduction Sulfur
Nitrogen
Carbon
0 0.02 0.04 0.06 0.08
Normalized abundance
Color Key
Polysulfide reduction
Nitrate reduction + Nitrite oxidation
Nitrate reduction
Figure 3 Heatmap plot and functional clustering of the selected KEGG Orthologs for the predicted open reading frames (ORFs) from themetagenomic reads for Lake Ciso and Banyoles basin C-III.
Biodiversity and biogeochemistry in euxinic lakesT Llorens-Mares et al
1654
The ISME Journal

hypolimnion, 16% of targeted sulfur reads ascompared with 1.4±1% in the remaining samples),with reads likely originating from Desulfobacteralesand most probably Syntrophobacterales, althoughmembers of this group may carry out both reductiveand oxidative parts of the sulfur cycle. Interestingly,we observed a high richness of sulfate-reducingbacteria genera (Table 3) with the potential todegrade a wide variety of carbon compounds tohelp to maintain the high sulfide concentrationsfound in Lake Ciso.
Although the metagenomic data set does notcontain transcriptome or proteome data, and thusonly indicates potential function, we observed adirect linear relationship between relative abun-dance of dissimilatory sulfate reduction genes andin situ sulfide concentrations (r¼ 0.998, P¼ 0.002).Although this comparison should be carefullyinterpreted because of the low number of samplescompared, it suggests a close link between boththe abundance of planktonic SRB and sulfide
production. We also observed significant directlinear relationships between the relative abundanceof anaerobic carbon fixation genes from bacterialchemotrophs and denitrification (r¼ 0.958, P¼ 0.042),suggesting a close link between chemoautotrophyand the nitrogen cycle.
Discussion
Stratified planktonic environments with sharp che-mical gradients and sulfide-rich bottom waters arevaluable current windows on past Earth conditions.Anoxic and euxinic conditions were common butspatially and temporally heterogeneous in ancientoceans during Proterozoic (Reinhard et al., 2013;Lyons et al., 2014), and may have played animportant role in mass extinctions during Phaner-ozoic (Meyer and Kump, 2008). The presence ofmarker pigments for photosynthetic sulfur bacteria(that is, isorenieratene and okenone) have been often
Carbon cycle: CISÓ
ANAEROBIC AEROBICFACULTATIVE
Calvin cycle carbon fixationAnaerobic carbon fixation
Aerobic respiration
Fermentation
Methanogenesis
Aerobic methane oxidation
(Aerobic)CO oxidation
CO
CO2
METALIMNION
Organic matter(CH2O)
H2
CH4
CO2
CIII
ANAEROBIC AEROBICFACULTATIVE
Calvin cycle carbon fixationAnaerobic carbon fixation
Aerobic respiration
Fermentation
Methanogenesis
Aerobic methane oxidation
(Aerobic)CO oxidation
CO
CO2Organic matter
(CH2O)
H2
CH4
CO2
ANAEROBIC AEROBICFACULTATIVE
Calvin cycle carbon fixationAnaerobic carbon fixation
Aerobic respirationFermentation
Methanogenesis
Aerobic methane oxidation
(Anaerobic)CO oxidation
CO
CO2
HYPOLIMNION
Organic matter(CH2O)
H2
CH4
CO2 ANAEROBIC AEROBICFACULTATIVE
Calvin cycle carbon fixationAnaerobic carbon fixation
Aerobic respiration
Fermentation
Methanogenesis
Aerobic methane oxidation
(Anaerobic)CO oxidation
CO
CO2Organic matter
(CH2O)
H2
CH4
CO2
Hydrogenophillales 24%*Chromatiales 3%
Actinomycetales 42%Burkholderiales 36%
Burkholderiales 48%Actinomycetales 21%
MethanomicrobialesMethanosarcinales
RhodocyclalesBurkholderia
BurkholderiaRhodocyclales
Rhodocyclales
Actinomycetales 50%
Burkholderiales 22%Sphingobacteriales 13%Campylobacterales12%
AcholeplasmatalesClostridialesSpirochaetales
AcholeplasmatalesBacillalesClostridiales
Actinomycetales 23%Spirochaetales 23%
Bacteroidales 12%Desulfarculales 12%Desulfobacterales 10%
Chlorobiales 9%Clostridiales 5%Syntrophobacterales 4%
Actinomycetales 40%Rickettsiales (SAR11) 15%
Actinomycetales 26%
Actinomycetales 54%Actinomycetales 57%
Clostridiales 26%Syntrophobacterales 15%
DesulfuromonadalesThermotogales
*Chromatiales 21%
Gallionellales 29%Hydrogenophillales 8%
Gallionellales 78%
Chlorobiales 78%Campylobacterales 4%
Chlorobiales 70%Campylobacterales 3%
Figure 4 Genetic potential for several steps of the carbon cycle in Lake Ciso and Banyoles basin C-III using a combination of normalizedmarker genes. Arrow size proportional to the potential flux of the carbon pathways (100% value, see Supplementary Table S3). Dottedlines: not detected marked genes but putative presence of the pathway (see main text). Relative abundances for the main microbespotentially driving each conversion step are shown (only for those that contributed 41% of the marker genes mixture). *Chromatiales:anoxygenic phototrophy through the Calvin cycle.
Biodiversity and biogeochemistry in euxinic lakesT Llorens-Mares et al
1655
The ISME Journal

reported as evidence of euxinic conditions inancient oceans (Damste and Koster, 1998; Brockset al., 2005). These conditions are not commonnowadays, although persistent euxinia can be foundin deep silled basins such as the Black Sea, BalticSea and Cariaco Basin (Millero, 1991; Stewart et al.,2007). Future climate change scenarios predict,however, an increasing of euxinia phenomena,mainly in coastal marine ecosystems (Diaz andRosenberg, 2008). The study of stratified sulfurouslakes has, therefore, an additional interest to predictbiogeochemical functioning and microbial interac-tions in such future scenarios. In the present study,we explored the community composition and func-tional gene content along a gradient of redoxconditions in a karstic sulfurous area. Continentalsystems are cheaper and easier to sample thanmarine basins, and a large variety of photo- andchemolithotrophs organisms, sulfide-oxidizing andsulfate-reducing bacteria, fermenters, denitrifyingmicrobes, methanogens and methane oxidizers areexpected to be found, among others, according toprevious studies (see, for example, Casamayor et al.,2000; Barberan and Casamayor, 2011). The metabo-lisms harbored by these microorganisms have the
potential to provide insights into the ecosystemsoperating in euxinic early stages of Earth. The strongeuxinic conditions found in Lake Ciso may matchbiogeochemistry in ancient coastal areas, whereasbasin C-III in Lake Banyoles may represent thetransition from euxinic coastal areas to merelyanoxic and rich Fe conditions in the ancient openocean (Figure 7).
The very low abundance of genes for nitrification,the minor presence of anammox genes, the highpotential for nitrogen fixation and mineralizationand the potential for chemotrophic CO2 fixation andCO oxidation all provide potential clues on theancient oceanic anoxic zones functioning. The lowabundance of ammonia oxidizers (AOA and AOB)agrees with the high ammonia accumulation in theanoxic bottom of the lakes, the lack of oxygen andpresence of potentially toxic sulfide. We observed,however, a higher gene abundance of AOB relativeto AOA in the metagenomic pool that may have ageochemical link related to the abundance of Fe inthese environments. AOA have a highly copper-dependent system for ammonia oxidation andelectron transport (Walker et al., 2010), completelydifferent from the iron-dependent system present in
METALIMNION
Nitrogen cycle: CISÓNO3
-
NO2-
NH4+
N2+N2OOrganic N
NO3-
NO2-
NH4+
N2+N2OOrganic N
CIII
HYPOLIMNION
NO3-
NO2-
NH4+
N2+N2OOrganic N
NO3-
NO2-
NH4+
N2+N2OOrganic N
Bacteroidales 57%
BacteroidalesBacteroidales
BacteroidalesDesulfuromonadalesCampylobacterales
Campylobacterales 47%Syntrophobacteales 23%
Campylobacterales 35%Oceanospirillales 29% Campylobacterales 63%
Desulfovibrionales 56%Deferribacterales 16%
Campylobacterales 69%
Campylobacterales 85%
Campylobacterales 27%Oceanospirillales 19%Gallionellales 17%
Campylobacterales 39%Oceanospirillales 26%Gallionellales 16%
Actinomycetales 57%
l
l
l
l l
l
l
l
Burkholderiales 23%
Burkholderiales 53%**Nitrospirae (NOB)
Burkholderiales 94%**Nitrospirae (NOB)
Actinomycetales 45%Burkholderiales 31%**Nitrospirae (NOB)
Burkholderiales 33%Rhodobacterales 33%**Nitrospirae (NOB)
**Nitrosomonadales**Nitrosococcus**Thaumarchaeota
**Nitrosomonadales**Nitrosococcus**Thaumarchaeota
**Nitrosomonadales**Nitrosococcus**Thaumarchaeota
**Nitrosomonadales**Nitrosococcus**Thaumarchaeota
Actinomycetales 12%Burkholderiales 9%
Actinomycetales 43%Chlorobiales 17%Rickettsiales 7%Campylobacterales 6%
Chlorobiales 59%Campylobacterales 19%Gallionellales 4%
Syntrophobacterales 51%Chlorobiales 19%
DesulfovibrionalesSyntrophobacteralesChlorobiales
Syntrophobacterales
SyntrophobacteralesDesulfuromonadales
SyntrophobacteralesDesulfobacterales
Chlorobiales 88%
Chlorobiales 89%
Actinomycetales 13%
Bacteroidales 14%Clostridiales 8%
Thermotogales 11%Actinomycetales 9%Rickettsiales 8%
Campylobacterales 23%Chlorobiales 12%
Figure 5 Genetic potential for several steps of the nitrogen cycle in Lake Ciso and Banyoles basin C-III using a combination ofnormalized marker genes. Arrow size proportional to the potential flux of the nitrogen pathways (100% value, see Supplementary TableS3). Dotted lines: not detected marked genes but putative presence of the pathway (see main text). Relative abundances for the mainmicrobes potentially driving each conversion step are shown (only for those that contributed 41% of the marker genes mixture).**Presence of AOA, AOB and nitrite-oxidizing bacteria (NOB) reads in the metagenomic pool.
Biodiversity and biogeochemistry in euxinic lakesT Llorens-Mares et al
1656
The ISME Journal

Sulfur cycle: CISÓ
METALIMNION
SO42-
H2S
Organic sulfur
CIIISO4
2-
H2S
Organic sulfur
HYPOLIMNION
SO42-
H2S
Organic sulfur
RSN
RSN RSN
RSN
SO42-
H2S
Organic sulfur
Burkholderiales 64%Actinomycetales 9%Desulfuromonadales 9%
Rickettsilaes 33%Actinomycetales 23%Burkholderiales 17%Chlorobiales 15%
Chlorobiales 63%
ChlorobialesHydrogenophilales**Campylobacterales
Chromatiales 54%Hydrogenophilales 23%**Campylobacterales
Chlorobiales 74%Gallionellales 19%Hydrogenophilales 4%**Campylobacterales
Chlorobiales 83%Gallionellales 14%Hydrogenophilales 2%**Campylobacterales
Syntrophobacterales 59%Desulfobacterales 27%Desulfarculales 10%
Desulfobacterales
Chlorobiales
Desulfovibrionales 33%Desulfobacterales 17%Selenomonadales 14%Chlorobiales 9%
Chlorobiales 60%Desulfovibrionales 27%
Chlorobiales 56%Desulfobacterales 10%Desulfovibrionales 7%
Desulfobacterales
SyntrophobacteralesDesulfobacterales
Burkholderiales 51%l l
l l l l
l
ll
l l l
l l l l
l l
l l
ll
l
l l l l
l ll
ll
Rhizobiales 10%
Burkholderiales 32%Bacteroidales 12%
Actinomycetales 21%Alteromonadales 9%Thizobiales 7%
Gallionellales 22%Bacteroidales 9%
Burkholderiales 43%Actinomycetales 36%
Figure 6 Genetic potential for several steps of the sulfur cycle in Lake Ciso and Banyoles basin C-III using a combination of normalizedmarker genes. Arrow size proportional to the potential flux of the sulfur pathways (100% value, see Supplementary Table S3). Relativeabundances for the main microbes potentially driving each conversion step are shown (only for those that contributed 41% of themarker genes mixture). **Campylobacteraceae contributed through sox genes not reported in KEGG database.
Table 3 Carbon fixation cycles and main metabolic traits of the C-fixing microorganisms found in this study
Taxa/phylogeny C-fixationpathway
Traits Main genera identified in Lakes Ciso and C-III fromthe 16S rRNA gene present in the metagenomic pool
GallionellalesBetaproteobacteria
Calvin FacultativeChemolithoautotrophEnergy sources: Fe(II)/sulfideDenitrification
Sideroxydans
HydrogenophilalesBetaproteobacteria
Calvin ChemolithoautotrophSulfide oxidation
CampylobacteralesEpsilonproteobacteria
Arnona ChemolithoautotrophDenitrificationSulfide oxidation
Arcobacter, Sulfuricurvum, Sulfurimonas
ChromatialesGammaproteobacteria
Calvin Photolithoautotroph AnaerobicTolerates oxygen
Lamprocystis
ChlorobialesChlorobi
Arnona PhotolithoautotrophAnaerobic (strict)N fixation
Chlorobium luteolum
DesulfobacteralesDeltaproteobacteria
Arnona
Reductiveacetyl-CoAb
HeterotrophSulfate reducers
Desulfatiferula, Desulfobulbus, Desulfocapsa,Desulfosalsimonas
SyntrophobacteralesDeltaproteobacteria
Arnona
Reductiveacetyl-CoA(?)b
HeterotrophSulfate reducer/sulfide oxidationSRAO
Desulfomonile
DesulfuromonadalesDeltaproteobacteria
Reductiveacetyl-CoAb
Nitrate dependent Fe(II) oxidation withproduction of ammonium (Weber et al.,2006)
Abbreviation: SRAO, sulfate-reducing ammonium oxidation.aAlso known as reverse Krebs cycle, reverse tricarboxylic acid cycle (rTCA) and reverse citric acid cycle.bAlso known as Wood–Ljungdahl pathway.
Biodiversity and biogeochemistry in euxinic lakesT Llorens-Mares et al
1657
The ISME Journal

AOB. The tradeoff in Fe- vs Cu-rich ammoniaoxidation enzymatic systems would suggest thatAOA evolved relatively recently (o550 millionyears ago) and that the Proterozoic oceans, whichwould have been Fe rich, would have been AOBdominated. Interestingly, the evolutionary dynamicsof the amoA gene cladogenesis events visualizedusing lineage through time plots displays a differentscenario for AOA and AOB, with AOB showing amore constant cladogenesis through the evolution-ary time, whereas AOA experienced two fastdiversification events separated by a long steady-state period (Fernandez-Guerra and Casamayor,2012).
The potential for nitrogen fixation and denitrifica-tion was detected in both autotroph and heterotrophmicrobial lineages, suggesting a diverse range ofpotential overlaps between carbon and nitrogencycling in the ancient ocean, and an active nitrogencycle in anoxic systems. Our results show apotential major contribution to nitrogen fixation byChlorobiaceae under euxinic conditions. Chlorobia-ceae were also the major contributors to carbonfixation in Banyoles C-III coupled to sulfide oxida-tion through the Arnon cycle. Therefore, thereported presence of Chlorobiaceae in the ancientocean (Damste and Koster, 1998; Brocks et al., 2005)would have been of major relevance not only for thecarbon but also for the nitrogen cycling. Campylo-bacterales (Epsilonproteobacteria) accounted for alarge percentage of the denitrification genes in theanaerobic layers of both lakes, but were taxonomi-cally segregated (Arcobacter dominated in Ciso,Sulfurimonas was present in C-III). Both generarespire nitrate coupled to C fixation in the dark
through the reverse tricarboxylic acid cycle (Labrenzet al., 2005; Burgin and Hamilton, 2007; Grote et al.,2012), being potentially able to couple denitrifica-tion to sulfur oxidation (Ghosh and Dam, 2009).The other important group involved in denitrifica-tion was the chemolithoautotrophic Gallionellalesoxidizing sulfide or Fe2þ while respiring nitrate andproducing NH4
þ or N2. The presence of Gallionel-lales exclusively in C-III is probably because of theirclose relation with the iron cycle (Weber et al.,2006), and by the fact that an active Fe2þ cycle hasbeen previously detected in Lake Banyoles (Garcia-Gil et al., 1990). The potential role of Gallionellalesin ancient oceans with an active iron cycle istherefore of major interest.
The case of Bacteroidales also deserves to bementioned. Bacteroidales have been typically con-sidered aerobic or microaerophilic chemoorganohe-terotrophic bacteria (Reichenbach, 2006), and havebeen recurrently detected in the Banyoles area(Casamayor et al., 2000; Casamayor et al., 2002;Casamayor et al., 2012) and in the marine realm(Fernandez-Gomez et al., 2013). However, their rolein anaerobic, sulfide-rich layers was not elucidated.Here, we assigned Bacteroidales as potentiallycatalyzing DNRA (dissimilatory nitrate reductionto ammonium), coupling the electron flow fromorganic matter to the reduction of nitrate. Thus, wewould expect a potential gradient of distribution foranaerobic Bacteroidales in the ancient ocean beingmore abundant in the organic carbon- and sulfide-rich coastal zones (Figure 7) than in the anoxic andmore oligotrophic open ocean. We also noticed thelow abundance of key processes in the anaerobiccarbon cycle such as CH4 cycling, probably because
Organic carbon inputs
Lake Ciso:High C input, high sulfide
Metaliminion (A) and Hypoliminion (B)
Lake Banyoles:Low C input, minimal sulfide
Metaliminion (A) and Hypoliminion (B)
AB A
B
OxygenFe (II)HS-
Continental Shelf Slope Open ocean
Mod
ern
Anal
og
Figure 7 Lake Ciso and basin C-III of Lake Banyoles as modern analogs of anoxic conditions prevailing in the ancient ocean. Theillustration shows the geochemical distributions of Fe, S, C and O2 in depth profiles and along different oceanic regimes (shelf, slope,open ocean) during Proterozoic (Lyons et al., 2014). Lake Ciso would be closer to coastal and continental shelf areas, whereas BanyolesC-III would be a more open ocean analogue.
Biodiversity and biogeochemistry in euxinic lakesT Llorens-Mares et al
1658
The ISME Journal

in the presence of high levels of sulfate, methano-gens are generally poor competitors with sulfatereducers in stratified natural environments (Raskinet al., 1996). Sulfate reduction normally occursin fully anoxic sediments by SRB (Holmer andStorkholm, 2001). However, as shown here, a watercolumn with euxinic conditions and a high avail-ability of organic carbon is also suitable for the growthof an important community of planktonic SRB.
Previous studies in Banyoles area measuredunexpected high rates of dark carbon fixation atthe oxic–anoxic interface and the hypolimneticwaters, accounting for 58% of total annual fixedcarbon in Lake Ciso (Garcia-Cantizano et al., 2005).It was proposed that photosynthetic bacteria couldbe partly carrying out dark carbon incorporationin situ (Casamayor et al., 2008), and Thiobacilli mayactively fix CO2 at certain depths (Casamayor, 2010).However, the ecological factors modulating theprocess and the microbial populations performingdark carbon fixation are still not well understood(Casamayor et al., 2012). In the present investiga-tion, we detected the potential for chemotrophicCO2 fixation mainly through the reverse tricar-boxylic acid cycle (K00174, K00175 and K00244from KEGG Orthology) in Bacteroidales, Campylo-bacterales and Desulfarculales. In addition, otherSRB such as Desulfobacterales may also participatethrough the anaerobic C1-pathway (Wood–Ljung-dahl pathway, K00194 and K00197) yielding formateassimilation and CO2 fixation (Hugler et al., 2003;Sun et al., 2010; Fuchs, 2011). Interestingly, thediversity of taxa potentially participating in carbonfixation in the dark was larger in Lake Ciso than inC-III, in agreement with in situ measurementscarried out in former investigations (Garcia-Cantizano et al., 2005; Casamayor, 2010). Thesefindings would suggest an active carbon-fixingactivity in ancient euxinic oceans beyond theeuphotic zone that certainly deserves furtherinvestigations.
In addition, the oxidation of CO generates adeno-sine triphosphate and CO2 that may be furtherprocessed through one of the reductive CO2 fixationpathways to be used as C source (Ragsdale, 2004;King and Weber, 2007). Some studies indicate thatorganisms using CO as both energy and C source canbe viewed as the extant survivors of early metabolicprocesses (Huber and Wachtershauser, 1997). In thehypoxic layers we found that the heterotrophicgroup of Actinomycetales accounted for most ofmonooxygenase CO genes in agreement with theirmixotrophic lifestyle (Schmidt and Conrad, 1993).More interestingly, in the anoxic depths of Lake Cisowe found that CO oxidation genes were mainlyrelated to SRB from Deltaproteobacteria group(Geobacter and deltaproteobacterium NaphS2) andto Firmicutes (Carboxidothermus hydrogenofor-mans, Moorella thermoacetica and Clostridiumspp.). This finding suggests that the fate of thereducing equivalents from CO oxidation in
anaerobic conditions could be coupled to sulfatereduction (carried out by SRB) to produce sulfide, orto CO2 reduction to produce acetate (SRB andFirmicutes) (Roberts et al., 2004; King and Weber,2007). To check whether CO oxidation could becoupled to CO2 reduction to yield acetate (Ragsdale,2004; Roberts et al., 2004), we identified thephylogenetic affiliation of acetyl-CoA synthasegenes (ACS, K14138), and found that Desulfobacter-ales and Firmicutes had the potential to use theWood–Ljungdahl pathway to obtain energy and fixcarbon from CO in the hypolimnion of Lake Ciso.However, although the CO-oxidizing genes weredetected, we cannot assess their relevance in thelake or the ancient oceans because CO-oxidizingbacteria carry out a facultative mixotrophic metabo-lism (Gadkari et al., 1990).
Overall, the metagenomics approach unveiled theinterrelationships between microbes and biogeo-chemical cycling in a comparative framework oftwo lakes that are modern analogs of ancient oceanconditions. These results may also help to developnew geochemical proxies to infer ancient oceanbiology and chemistry. A major pitfall in ourmetagenomic approach is the reliance on theassumption that the genes come from a particularbacteria or archaea according to phylogentic annota-tion; lateral gene transfer would compromise thedirect link of phylogeny to a metabolic pathway. Inmost of the cases we found the 16S rRNA genecounterpart present in the metagenomic data pool,giving additional support to such links. Obviousnext steps include an experimental quantification ofthe energy and matter fluxes involved in each of themetabolic pathways to get a complete picture on thetight coupling between microbes and biogeochem-ical cycling in anoxic ecosystems.
Conflict of Interest
The authors declare no conflict of interest.
Acknowledgements
JC Auguet, M Lliros, F Gich, FM Lauro and JM Gasol areacknowledged for field and lab assistance and ancillarydata. We sincerely appreciate insightful comments andsuggestions from anonymous reviewers and the editor.This research was funded by Grants GOS-LAKESCGL2009-08523-E and DARKNESS CGL2012-32747 toEOC from the Spanish Office of Science (MINECO), fromfinancial support by the Beyster Family Fund of the SanDiego Foundation and the Life Technologies Foundationto the J Craig Venter Institute, and the NASA AstrobiologyInstitute to CLD.
References
Anbar AD. (2008). Oceans elements and evolution.Science 322: 1481–1483.
Biodiversity and biogeochemistry in euxinic lakesT Llorens-Mares et al
1659
The ISME Journal
Barberan A, Casamayor EO. (2011). Euxinic freshwaterhypolimnia promote bacterial endemicity in continen-tal areas. Microb Ecol 61: 465–472.
Bascompte J, Sole RV. (1995). Rethinking complexity -modeling spatiotemporal dynamics in ecology. TrendsEcol Evol 10: 361–366.
Borrego CM, Baneras L, Garcia-Gil J. (1999). Temporalvariability of Chlorobium phaeobacteroides antennapigments in a meromictic karstic lake. Aquat MicrobEcol 17: 121–129.
Brocks JJ, Love GD, Summons RE, Knoll AH, Logan GA,Bowden SA. (2005). Biomarker evidence for green andpurple sulphur bacteria in a stratified Palaeoproter-ozoic sea. Nature 437: 866–870.
Burgin AJ, Hamilton SK. (2007). Have we overemphasizedthe role of denitrification in aquatic ecosystems? Areview of nitrate removal pathways. Front EcolEnviron 5: 89–96.
Campbell BJ, Cary SC. (2004). Abundance of reversetricarboxylic acid cycle genes in free-living micro-organisms at deep-sea hydrothermal vents. ApplEnviron Microbiol 70: 6282–6289.
Casamayor EO, Schafer H, Baneras L, Pedros-Alio C,Muyzer G. (2000). Identification of and spatio-tem-poral differences between microbial assemblages fromtwo neighboring sulfurous lakes: comparison bymicroscopy and denaturing gradient gel electrophor-esis. Appl Environ Microbiol 66: 499–508.
Casamayor EO, Pedros-Alio C, Muyzer G, Amann R.(2002). Microheterogeneity in 16S ribosomal DNA-defined bacterial populations from a stratified plank-tonic environment is related to temporal changes andto ecological adaptations. Appl Environ Microbiol 68:1706–1714.
Casamayor EO, Garcia-Cantizano J, Pedros-Alio C. (2008).Carbon dioxide fixation in the dark by photosyntheticbacteria in sulfide-rich stratified lakes with oxic-anoxic interfaces. Limnol Oceanogr 53: 1193–1203.
Casamayor EO. (2010). Vertical distribution of planktonicautotrophic thiobacilli and dark CO2 fixation rates inlakes with oxygen-sulfide interfaces. Aquat MicrobEcol 59: 217–228.
Casamayor EO, Lliros M, Picazo A, Barberan A, BorregoCM, Camacho A. (2012). Contribution of deep darkfixation processes to overall CO2 incorporation andlarge vertical changes of microbial populations instratified karstic lakes. Aquat Sci 74: 61–75.
Damste JSS, Koster J. (1998). A euxinic southern NorthAtlantic Ocean during the Cenomanian/Turonian ocea-nic anoxic event. Earth Planet Sci Lett 158: 165–173.
Diaz RJ, Rosenberg R. (2008). Spreading dead zones andconsequences for marine ecosystems. Science 321:926–929.
Fernandez-Gomez B, Richter M, Schuler M, Pinhassi J,Acinas SG, Gonzalez JM et al. (2013). Ecology ofmarine Bacteroidetes: a comparative genomicsapproach. ISME J 7: 1026–1037.
Fernandez-Guerra A, Casamayor EO. (2012). Habitat-associated phylogenetic community patterns of micro-bial ammonia oxidizers. PLoS One 7: e47330.
Fuchs G. (2011). Alternative pathways of carbon dioxidefixation: insights into the early evolution of life? In:Gottesman S, Harwood CS (eds) Annual Review ofMicrobiology vol. 65. Annual Reviews: Palo Alto,p 631.
Gadkari D, Schricker K, Acker G, Kroppenstedt RM, MeyerO. (1990). Streptomyces thermoautotrophicus sp. nov.,
a thermophilic CO- and H(2)-oxidizing obligate che-molithoautotroph. Appl Environ Microbiol 56:3727–3734.
Garcia-Cantizano J, Casamayor EO, Gasol JM, Guerrero R,Pedros-Alio C. (2005). Partitioning of CO2 incorpora-tion among planktonic microbial guilds and estima-tion of in situ specific growth rates. Microb Ecol 50:230–241.
Garcia-Gil LJ. (1990). Phototrophic bacteria and iron cyclein Lake Banyoles. PhD thesis. Autonomous Universityof Barcelona, (in Spanish).
Garcia-Gil LJ, Salagenoher L, Esteva JV, Abella CA. (1990).Distribution of iron in lake Banyoles in relation to theecology of purple and green sulur bacteria. Hydro-biologia 192: 259–270.
Garcia-Gil LJ, Abella CA. (1992). Population dynamics ofphototrophic bacteria in three basins of Lake Banyoles(Spain). In: Ilmavirta V, Jones R (eds) The Dynamicsand Use of Lacustrine Ecosystems. Springer: TheNetherlands, pp 87–94.
Ghosh W, Dam B. (2009). Biochemistry and molecularbiology of lithotrophic sulfur oxidation by taxonomi-cally and ecologically diverse bacteria and archaea.FEMS Microbiol Rev 33: 999–1043.
Goll J, Rusch DB, Tanenbaum DM, Thiagarajan M, Li K,Methe BA et al. (2010). METAREP: JCVI metagenomicsreports–an open source tool for high-performance com-parative metagenomics. Bioinformatics 26: 2631–2632.
Grote J, Schott T, Bruckner CG, Glockner FO, Jost G,Teeling H et al. (2012). Genome and physiology of amodel Epsilonproteobacterium responsible for sulfidedetoxification in marine oxygen depletion zones. ProcNatl Acad Sci USA 109: 506–510.
Guerrero R, Montesinos E, Esteve I, Abella C. (1980).Physiological adaptation and growth of purple andgreen sulfur bacteria in a meromictic lake (Vila) ascompared to a holomictic lake (Siso). In: Dokulil M,Metz H, Jewson D (eds) Shallow Lakes Contributionsto their Limnology. Springer: The Netherlands, pp161–171.
Guerrero R, Montesinos E, Pedros-Alio C, Esteve I, Mas J,Van Gemerden H et al. (1985). Phototrophic sulfurbacteria in two Spanish lakes: vertical distribution andlimiting factors. Limnol Oceanogr 30: 919–931.
Holmer M, Storkholm P. (2001). Sulphate reduction andsulphur cycling in lake sediments: a review. FreshwBiol 46: 431–451.
Huber C, Wachtershauser G. (1997). Activated acetic acidby carbon fixation on (Fe,Ni)S under primordialconditions. Science 276: 245–247.
Hugler M, Huber H, Stetter KO, Fuchs G. (2003).Autotrophic CO2 fixation pathways in archaea (Cre-narchaeota). Arch Microbiol 179: 160–173.
King GM, Weber CF. (2007). Distribution, diversity andecology of aerobic CO-oxidizing bacteria. Nat RevMicrobiol 5: 107–118.
Labrenz M, Jost G, Pohl C, Beckmann S, Martens-HabbenaW, Jurgens K. (2005). Impact of different in vitroelectron donor/acceptor conditions on potential che-molithoautotrophic communities from marine pelagicredoxclines. Appl Environ Microbiol 71: 6664–6672.
Lauro FM, DeMaere MZ, Yau S, Brown MV, Ng C, WilkinsD et al. (2011). An integrative study of a meromicticlake ecosystem in Antarctica. ISME J 5: 879–895.
Li WZ, Godzik A. (2006). Cd-hit: a fast program forclustering and comparing large sets of protein ornucleotide sequences. Bioinformatics 22: 1658–1659.
Biodiversity and biogeochemistry in euxinic lakesT Llorens-Mares et al
1660
The ISME Journal
Lyons TW, Reinhard CT, Planavsky NJ. (2014). The rise ofoxygen in Earth’s early ocean and atmosphere. Nature506: 307–315.
Meyer KM, Kump LR. (2008). Oceanic euxinia in Earthhistory: causes and consequences. Annu Rev EarthPlanet Sci 36: 251–288.
Millero FJ. (1991). The oxidation of H2S in Framvarenfjord. Limnol Oceanogr 36: 1006–1014.
Pedros-Alio C, Guerrero R. (1993). Microbial ecology inLake Ciso. Adv Microb Ecol 13: 155–209.
Prosser JI. (2012). Ecosystem processes and interactionsin a morass of diversity. FEMS Microbiol Ecol 81:507–519.
R Develppment Core Team (2012). R: A Language andEnvironment for Statistical Computing. R Foundationfor Statistical Computing: Vienna, Austria.
Ragsdale SW. (2004). Life with carbon monoxide. Crit RevBiochem Mol Biol 39: 165–195.
Raskin L, Rittmann BE, Stahl DA. (1996). Competition andcoexistence of sulfate-reducing and methanogenicpopulations in anaerobic biofilms. Appl EnvironMicrobiol 62: 3847–3857.
Reichenbach H. (2006). The order Cytophagales. In:Dworkin M, Falkow S, Rosenberg E, Schleifer K-H,Stackebrandt E (eds) Prokaryotes. Springer: Berlin, pp549–590.
Reinhard CT, Planavsky NJ, Robbins LJ, Partin CA, GillBC, Lalonde SV et al. (2013). Proterozoic ocean redoxand biogeochemical stasis. Proc Natl Acad Sci USA110: 5357–5362.
Rikmann E, Zekker I, Tomingas M, Tenno T, Menert A,Loorits L et al. (2012). Sulfate-reducing anaerobicammonium oxidation as a potential treatment methodfor high nitrogen-content wastewater. Biodegradation23: 509–524.
Roberts GP, Youn H, Kerby RL. (2004). CO-sensingmechanisms. Microbiol Mol Biol Rev 68: 453–473.
Schmidt U, Conrad R. (1993). Hydrogen, carbon-monox-ide, and methane dynamics in Lake Constance. LimnolOceanogr 38: 1214–1226.
Severmann S, Anbar AD. (2009). Reconstructingpaleoredox conditions through a multitracer approach:the key to the past is the present. Elements 5: 359–364.
Sharon I, Pati A, Markowitz VM, Pinter RY. (2009).A statistical framework for the functional analysisof metagenomes. In: Batzoglou S (ed) Researchin Computational Molecular Biology, Proceedings.Springer: Berlin, Heidelberg, Germany, pp 496–511.
Stewart K, Kassakian S, Krynytzky M, DiJulio D, Murray J.(2007). Oxic, suboxic, and anoxic conditions in theBlack Sea. In: Yanko-Hombach V, Gilbert A, Panin N,Dolukhanov P (eds) The Black Sea Flood Question:Changes in Coastline, Climate, and Human Settle-ment. Springer: The Netherlands, pp 1–21.
Sun H, Spring S, Lapidus A, Davenport K, Del Rio TG,Tice H et al. (2010). Complete genome sequence of
Desulfarculus baarsii type strain (2st14(T)). StandGenomic Sci 3: 276–284.
Sun SL, Chen J, Li WZ, Altintas I, Lin A, Peltier S et al.(2011). Community cyberinfrastructure forAdvanced Microbial Ecology Research and Analysis:the CAMERA resource. Nucleic Acids Res 39:D546–D551.
Takai K, Campbell BJ, Cary SC, Suzuki M, Oida H,Nunoura T et al. (2005). Enzymatic and geneticcharacterization of carbon and energy metabolismsby deep-sea hydrothermal chemolithoautotrophic iso-lates of Epsilonproteobacteria. Appl Environ Microbiol71: 7310–7320.
Tanenbaum DM, Goll J, Murphy S, Kumar P, Zafar N,Thiagarajan M et al. (2010). The JCVI standardoperating procedure for annotating prokaryotic meta-genomic shotgun sequencing data. Stand Genomic Sci2: 229–237.
Truper HG, Schlegel HG. (1964). Sulphur metabolism inThiorhodaceae.1. Quantitative measurements ongrowing cells of Chromatium Okenii. Anton Van LeeJ M S 30: 225–22.
Van Gemerden H, Montesinos E, Mas J, Guerrero R. (1985).Diel cycle of metabolism of phototrophic purple sulfurbacteria in Lake Ciso (Spain). Limnol Oceanogr 30:932–943.
Vila X, Abella CA. (1994). Effects of light quality on thephysiology and the ecology of planktonic green sulfurbacteria in lakes. Photosynthesis Res 41: 53–65.
Walker CB, de la Torre JR, Klotz MG, Urakawa H, Pinel Net al. (2010). Nitrosopumilus maritimus genomereveals unique mechanisms for nitrification andautotrophy in globally distributed marine crenarchaea.Proc Natl Acad Sci USA 107: 8818–8823.
Weber KA, Achenbach LA, Coates JD. (2006). Microorgan-isms pumping iron: anaerobic microbial ironoxidation and reduction. Nat Rev Microbiol 4:752–764.
Zeigler Allen L, Allen EE, Badger JH, McCrow JP, PaulsenIT, Elbourne LD et al. (2012). Influence of nutrientsand currents on the genomic composition of microbesacross an upwelling mosaic. ISME J 6: 1403–1414.
This work is licensed under a CreativeCommons Attribution-NonCommercial-
NoDerivs 3.0 Unported License. The images or otherthird party material in this article are included in thearticle’s Creative Commons license, unless indicatedotherwise in the credit line; if the material is notincluded under the Creative Commons license, userswill need to obtain permission from the license holderto reproduce the material. To view a copyof this license, visit http://creativecommons.org/licenses/by-nc-nd/3.0/
Supplementary Information accompanies this paper on The ISME Journal website (http://www.nature.com/ismej)
Biodiversity and biogeochemistry in euxinic lakesT Llorens-Mares et al
1661
The ISME Journal