Modeling household discrete choice behavior incorporating heterogeneous group decision-making...
21
Modeling household discrete choice behavior incorporating heterogeneous group decision-making mechanisms Junyi Zhang a, * , Masashi Kuwano b , Backjin Lee c , Akimasa Fujiwara a a Transportation Engineering Laboratory, Graduate School for International Development and Cooperation, Hiroshima University, 1-5-1 Kagamiyama, Higashi-Hiroshima 739-8529, Japan b Infrastructure and Transportation Planning Laboratory, Graduate School of Engineering, Hiroshima University, 1-4-1 Kagamiyama, Higashi-Hiroshima 739-8529, Japan c Infrastructure and Construction Economics Research Division, Korea Research Institute for Human Settlements, 1591-6 Kwanyang-Dong, Dongan-Gu, Anyang-si, Kyounggi-Do 431-712, South Korea article info Keywords: Intra-household interaction Group decision-making mechanisms Latent class modeling Heterogeneity Bayesian approach EM algorithm Car ownership abstract To represent heterogeneous group decision-making mechanisms in choice behavior, this paper attempts to develop a new household discrete choice model by integrating different types of household choice models based on latent class modeling approach under the prin- ciple of random utility maximization, where household utility function at each model is defined to theoretically reflect its members’ preferences and intra-household interaction. A latent class corresponds to a particular group decision-making mechanism. The proposed model can deal with not only the choice situations where multiple household members involved in joint decision are known a priori, but also the situations where the involved members are unknown. As a case study, three types of household utility functions are dealt with: multi-linear, maximum and minimum types, in the context of couples’ car ownership behaviors. Due to the limited sample size, paired combinations of the three utilities are examined and compared. Using the data collected in two Japanese cities in 2004, the effec- tiveness of the proposed household decision model is empirically confirmed. It is found that changes of utility combinations result in very complicated variations in both signs and values of the model parameters and choice probabilities by multi-linear utility show small variations across different combinations. Ó 2008 Elsevier Ltd. All rights reserved. 1. Introduction In transportation research, individuals have been traditionally regarded as decision-making units or as representative and independent agents. This is evidenced by the fact that various types of discrete choice models incorporating individual deci- sion-making mechanisms have been dominating in transportation (e.g., Daganzo, 1979; Sugie et al., 1999; Fujiwara et al., 2000; Koppelman and Wen, 2000; McFadden and Train, 2000; McFadden, 2001; Swait, 2001; Wen and Koppelman, 2001; Bierlaire, 2002; Swait et al., 2004; Zhang et al., 2004a; Fujiwara and Zhang, 2005). It is well known however that individual choice behavior is often influenced by the existence, opinions, and/or behaviors of other people, and in some cases choices are made jointly by a group of people (Thorndike, 1938; Davis, 1976; Corfman and Gupta, 1993; Rose and Hensher, 2004). Many group-based models have been developed in other disciplines, such as social psychology, marketing research and eco- nomics, to describe different decision aspects (e.g., decision processes and outcomes) of group decisions Corfman and Gupta, 1993). However, even though joint activity participation, household resource allocation (e.g., car ownership and use), task 0191-2615/$ - see front matter Ó 2008 Elsevier Ltd. All rights reserved. doi:10.1016/j.trb.2008.05.002 * Corresponding author. Tel./fax: +81 82 424 6919. E-mail address: [email protected] (J. Zhang). Transportation Research Part B 43 (2009) 230–250 Contents lists available at ScienceDirect Transportation Research Part B journal homepage: www.elsevier.com/locate/trb
-
Upload
independent -
Category
Documents
-
view
1 -
download
0
Transcript of Modeling household discrete choice behavior incorporating heterogeneous group decision-making...

Transportation Research Part B 43 (2009) 230–250
Contents lists available at ScienceDirect
Transportation Research Part B
journal homepage: www.elsevier .com/ locate / t rb
Modeling household discrete choice behavior incorporatingheterogeneous group decision-making mechanisms
Junyi Zhang a,*, Masashi Kuwano b, Backjin Lee c, Akimasa Fujiwara a
a Transportation Engineering Laboratory, Graduate School for International Development and Cooperation, Hiroshima University, 1-5-1 Kagamiyama,Higashi-Hiroshima 739-8529, Japanb Infrastructure and Transportation Planning Laboratory, Graduate School of Engineering, Hiroshima University, 1-4-1 Kagamiyama, Higashi-Hiroshima739-8529, Japanc Infrastructure and Construction Economics Research Division, Korea Research Institute for Human Settlements, 1591-6 Kwanyang-Dong, Dongan-Gu,Anyang-si, Kyounggi-Do 431-712, South Korea
a r t i c l e i n f o
Keywords:Intra-household interactionGroup decision-making mechanismsLatent class modelingHeterogeneityBayesian approachEM algorithmCar ownership
0191-2615/$ - see front matter � 2008 Elsevier Ltddoi:10.1016/j.trb.2008.05.002
* Corresponding author. Tel./fax: +81 82 424 691E-mail address: [email protected] (J. Zhang)
a b s t r a c t
To represent heterogeneous group decision-making mechanisms in choice behavior, thispaper attempts to develop a new household discrete choice model by integrating differenttypes of household choice models based on latent class modeling approach under the prin-ciple of random utility maximization, where household utility function at each model isdefined to theoretically reflect its members’ preferences and intra-household interaction.A latent class corresponds to a particular group decision-making mechanism. The proposedmodel can deal with not only the choice situations where multiple household membersinvolved in joint decision are known a priori, but also the situations where the involvedmembers are unknown. As a case study, three types of household utility functions are dealtwith: multi-linear, maximum and minimum types, in the context of couples’ car ownershipbehaviors. Due to the limited sample size, paired combinations of the three utilities areexamined and compared. Using the data collected in two Japanese cities in 2004, the effec-tiveness of the proposed household decision model is empirically confirmed. It is foundthat changes of utility combinations result in very complicated variations in both signsand values of the model parameters and choice probabilities by multi-linear utility showsmall variations across different combinations.
� 2008 Elsevier Ltd. All rights reserved.
1. Introduction
In transportation research, individuals have been traditionally regarded as decision-making units or as representative andindependent agents. This is evidenced by the fact that various types of discrete choice models incorporating individual deci-sion-making mechanisms have been dominating in transportation (e.g., Daganzo, 1979; Sugie et al., 1999; Fujiwara et al.,2000; Koppelman and Wen, 2000; McFadden and Train, 2000; McFadden, 2001; Swait, 2001; Wen and Koppelman, 2001;Bierlaire, 2002; Swait et al., 2004; Zhang et al., 2004a; Fujiwara and Zhang, 2005). It is well known however that individualchoice behavior is often influenced by the existence, opinions, and/or behaviors of other people, and in some cases choicesare made jointly by a group of people (Thorndike, 1938; Davis, 1976; Corfman and Gupta, 1993; Rose and Hensher, 2004).Many group-based models have been developed in other disciplines, such as social psychology, marketing research and eco-nomics, to describe different decision aspects (e.g., decision processes and outcomes) of group decisions Corfman and Gupta,1993). However, even though joint activity participation, household resource allocation (e.g., car ownership and use), task
. All rights reserved.
9..

J. Zhang et al. / Transportation Research Part B 43 (2009) 230–250 231
and time allocation all likely involve group decisions, research on group decision-making mechanisms is still very limited intransportation (Timmermans, 2006). Studies of modeling such group decisions in transportation based on group decision-making theories have been conducted since 1990s (e.g., Timmermans et al., 1992; Borgers and Timmermans, 1993). Thesedays, increasingly more researchers have been showing interest in studying group decision-making mechanisms in variouscontexts of activity–travel behavior and confirmed the effectiveness of incorporating group decision-making mechanisms bycomparing with traditional models (e.g., Brewer and Hensher, 2000; Badoe, 2002; Zhang et al., 2002, 2003, 2004b, 2005a,b;Vovsha et al., 2003, 2004a,b,c; Hensher, 2003, 2004; Rose and Hensher, 2004; Bhat and Pendyala, 2005; Bradley and Vovsha,2005; Gliebe and Koppelman, 2005; Meister et al., 2005; Srinivasan and Athuru, 2005; Srinivasan and Bhat, 2005; Zhang andFujiwara, 2006).
The existing household travel behavior models usually assume that decision-making mechanisms are invariant acrosshouseholds. As pointed out however by McFadden (2001) in the context of individual-based decisions, choice behavior ishighly adaptive and context-dependent. For group-based decisions, Wilson et al. (1989) identified three factors influencingthe use of group choice rules, i.e., choice task (e.g., modified re-choice and new task decisions), financial commitment or per-ceived risk and technical complexity. One of the remarkable differences between individual and group behaviors might beobserved in the complexity of decision-making rules and mechanisms due to the presence of two or more members in agroup. More importantly, different members in the group may show different preferences for the same decision target. Thisleads to conflicts among members and forces the members to apply strategies such as bargaining and compromise duringdecision-making process (Davis, 1976). Under such circumstances, instead of exploring a superior and absolutely dominatinggroup decision-making rule/mechanism, it might be wise to find some better ways to accommodate various decision rules/mechanisms in the same modeling framework.
Under such circumstances, this study first adopts random utility maximization (RUM) as decision-making rule at house-hold level, and then proposes a discrete choice model to represent heterogeneous group decision-making mechanisms in thecontext of household car ownership behavior. Latent class modeling approach is used to integrate different types of house-hold choice models, where the household utility function at each class is defined such as to theoretically reflect preferencesof its members and intra-household interaction. A latent class corresponds to a particular group decision-making mechanism(i.e., a household utility function). The originality of this paper concerns the integration of different types of group decision-making mechanisms using the latent class modeling approach to represent heterogeneous household choice behaviors. The-oretically, the resulting household choice model can be used to represent any type of household defined, for example, byhousehold composition and size. To the authors’ knowledge, such heterogeneous group decision-making mechanisms havenot been examined in transportation before. The proposed choice model will be applied to an analysis of household car own-ership behavior using data collected in 2004 in Hiroshima, Japan.
The reminder of this paper is organized as follows. Section 2 gives a brief review of group (mainly household) choice mod-els developed in transportation. Section 3 describes the newly developed household choice model incorporating heteroge-neous group decision-making mechanisms. Section 4 empirically examines the developed model in the context of couples’car ownership behaviors. Finally, the paper is concluded and some future research issues are discussed in Section 5.
2. Review
The study of group decisions has its roots in the field of social psychology (see Thorndike, 1938). Earlier studies, whichwere more or less related to transportation, include the analyses of household shopping behavior, automobile ownershipbehavior and tourism decisions (Davis, 1976). Even though the importance of incorporating group decision-making mech-anisms in household travel behavior analysis has been recognized since the early 1980s (e.g., Jones et al., 1983), developmentof group choice models, especially in the context of household travel behavior, only started in the early 1990s. For example,Timmermans et al. (1992) and Borgers and Timmermans (1993) developed a model with multi-person choice processes toevaluate the influence of transport facilities on household residential choice behavior. Their research is unique in the sensethat group decision-making mechanisms are represented based on the theory of hierarchical information integration. Imple-menting such models requires the construction of two-stage experimental designs. At the first stage, choice behavior at indi-vidual level is examined, and at the second stage, husband utility and wife utility are combined based on a linear-additiveaggregation rule, to express the household utility. Molin et al. (1997, 2000) proposed a general framework for modelinggroup preference in the context of household residential choice behavior and derived five modeling approaches by allowingfor different decision-making mechanisms. All these approaches assume an additive-type utility function. Different from theabove-mentioned approaches, this study adopts a one-stage modeling method and integrates different types of householdutility functions together.
In their integrated model system of stop generation and tour formation, Wen and Koppelman (1999) incorporated theintra-household interaction based on a nested logit (NL) model. The resulting model structure meets the requirements ofrandom utility maximization. Based on empirical results, it is shown that the upper level is choice of the number of house-hold maintenance stops and the lower level is allocation of these stops to household members. Note that such nested struc-ture could vary with application contexts. However, this structure does not allow for intra-household interaction at thelower level. Another example using the NL model is to represent car allocation and trip allocation within a household(see Algers et al., 1997). Srinivasan and Athuru (2005) used a nested mixed logit model to analyze within-household effectsin maintenance activity allocation. Two inter-related decisions are incorporated: (i) whether the given activity episode is

232 J. Zhang et al. / Transportation Research Part B 43 (2009) 230–250
performed individually (solo) or jointly, and (ii) the person who participates in the activity, if it is a solo activity. These stud-ies apply individual-based modeling approach, but improve the specification of choice alternatives and/or error terms toaccommodate intra-household interaction based on a statistically-oriented way. Similar examples include the studies byRich (2001), Brewer and Hensher (2000), Hensher (2003, 2004), and Rose and Hensher (2004).
In contrast, their activity-based regional travel demand model, Vovsha et al. (2003, 2004a,b) adopted a sequential mod-eling approach to comprehensively incorporate group decision-making mechanisms existing in joint household tour gener-ation, and individual maintenance tours that are first modeled at the household level and then allocated to each householdmember. Their approach is very attractive as a practical application, but lacks the theoretical support from the group deci-sion-making theory because it is based on traditional discrete choice models developed under the assumption of individualdecision-making process. Interestingly, Vovsha et al. (2004c) proposed several theoretical models with intra-householdinteraction. Empirically examining the model performance is however required.
The most recent review can be found in a review paper by Timmermans (2006). All of these studies mentioned abovesurely reveals that some behaviorally-oriented household choice models have been well developed and applied to explainhousehold behaviors in transportation. At the same time, however, it can be pointed out that in most of these studies, utilityfunctions do not reflect group decision-making mechanisms. This suggests that innovative studies are required to furtherexplore group decision-making mechanisms in a more behaviorally-oriented way. Another assumption made in these exist-ing studies is that all households follow the same type of strategy (i.e., the same type of utility function) during decision-making process in order to achieve final group solution. Such homogeneity should be relaxed, because in reality, differenttypes of household utilities could be applicable to different households in different contexts.
3. Model development
A group may consist of various members, such as household members, friends or colleagues, car-pooling users, and orga-nizations. This paper focuses on multi-person households. For household decisions, there are several methodological issuesthat should be clarified, including decision rules, members’ involvements and relative influences in joint decisions, and intra-household interaction. And this paper attempts to propose a new model to represent some of these issues.
3.1. Who are decision makers within a household?
In transportation, group decision-making mechanisms have been represented mainly through use of existing individualdecision-making choice models. Examples include the studies by Rich (2001), Hensher (2003, 2004) and Gliebe and Kopp-elman (2005). If analysts can clearly identify which household member makes the decisions, these models are acceptableand applicable. Joint trip-making and activity participation might be two exceptional cases. However, in many cases analystsdo not know exactly who is the final decision maker or the decisive person in the household. Sometimes, even for the deci-sion makers themselves, they do not know it exactly. In this sense, this paper attempts to propose a modeling method, whichcan deal with not only the choice situations where multiple household members involved in joint decision are known a pri-ori, but also the situations where the involved members are unknown.
It has been long recognized that the involvement of household members varies with decision types (e.g., Davis, 1976) andhousehold types (e.g., Cosenza and Davis, 1981). To identify which member would be involved in joint decision, several deci-sion situations related to this study should be distinguished. For example, in case of joint trip-making behavior, it is clear thatall the members in travel party will be involved. This is also true for the case of joint activity participation. However, this doesnot means that other members are not relevant to this joint decision. For example, a wife may ask her husband to pick up theirkids from school on the way home, even though she does not join the trip. In case of household residential choice or car own-ership decision, because of its long-lasting influence on all household members, it is usually difficult for a single member tomake the decision about all the choice aspects. At least both husband and wife would be involved to take other members’ pref-erences into account. In case of household shopping activity, even though a single member (e.g., wife) takes the responsibility,he/she has to think of other members’ tastes and requirements to decide the contents of shopping. The above examples sug-gest that it is usually difficult to clearly identity which household members are actually involved in joint decision. In otherwords, any household member could be the decision maker, but the degree of involvement might be different across mem-bers. In these cases, applying the choice models with individual decision-making mechanisms, which assume a pre-specifiedrepresentative decision maker within a household, to describe group decision-making mechanisms might be problematic.Therefore, it is necessary to propose a new modeling approach to accommodate such behavioral mechanisms.
This paper deals with group choice behavior in the context of household travel behavior analysis, where any memberwithin a household could be decision makers in joint decision, but the degree and the way of member’s involvement, andconsequently relative influence could vary across members.
3.2. Household decision-making rules
Different from individual decision-making (IDM), household decision-making (HDM) usually involves several persons.Some of IDM rules could be applicable at some stages of HDM process, but existence of other person(s) might force the

J. Zhang et al. / Transportation Research Part B 43 (2009) 230–250 233
individual member to change his/her decision-making strategies/rules and consequently result in different decision out-comes. Davis (1976) argues that HDM could be either consensual or accommodative. In the case of consensual decision-mak-ing, a household will continue to search for alternatives until one is found that satisfies the minimum level of expectations ofall members. If HDM is accommodative, there will be no way that one alternative can be satisfying to all. According to decisioncontexts, household members might use various strategies (e.g., bargaining and compromise) at different decision stages. Ineither case, individual household members might not maximize their own utilities. Even though it is difficult to realize max-imal utility for each household member, as a whole household, Kirchler (1995) argues that for allocating its scarce resourcesand intensifying the emotional bonds between its members, a household will seek to minimize social and economic costs indecision situations by trying to make an optimal choice after passing through a commonly satisfying interaction process. Inthis sense, random utility maximization (RUM) theory could be applicable to household decisions, or at least, it can be saidthat RUM theory could be applied to approximate the complicated household decisions. In the field of econometrics, Chiapporiand his colleagues (e.g., Chiappori, 1988; Browning and Chiappori, 1998) have also applied utility-maximizing theory in theirstudies about household behavior in various contexts including marriage, labor supply, and income allocation.
This study deals with household decisions by focusing on the group decision-making mechanisms at the level of choicealternatives. Note that group decision might be observed with respect to some attributes of the alternatives. For example,tourism behavior research shows that husbands play predominant role in mentioning the initial idea to take a trip, suggest-ing a destination and selecting an airline, and the decision on where to go, however, is a mutual decision (Cosenza and Davis,1981). It is also observed that in case of buying house, husband mainly decides price range and residential location whilewife takes the responsibility to determine the number of bedrooms and other house features; and in case of purchasing pri-vate cars, in most of households, husbands decide the makes of vehicles and other members decides the color of vehicles(Davis, 1976). Modeling group decision-making at the level of attributes of the choice alternatives could be a promising re-search topic. One of the difficulties to model such behavior at the attribute level is that decisions could be made with respectto not only single attribute, but also combinations of different attributes. In the latter case, when the number of attributesbecomes larger, the number of attribute combinations will increase dramatically and consequently bring more difficulties tomodeling task. Since different household might show different group decision-making mechanisms, to flexibly and opera-tionally model such decision mechanisms, this study assumes that group decision only occurs at the level of alternativesin choice set.
In the context of individual decision-making, as argued by Olshavsky (1979), Payne (1976), Payne et al. (1988, 1993) andDe Palma et al. (1994), when decisions become complicated, there is no single heuristic, which will be well applicable acrossall tasks and contexts, and decision makers might use simple, local and myopic choice strategies. The authors recognize thatsuch decision-making mechanisms could also be observed in case of household decisions. For example, in the context of cou-ple’s decision-making, Kim and Khoury (1987) confirmed based on protocol analysis that as decision task becomes morecomplex, couples use a multistage strategy more often, a smaller proportion of available information and attributes, anda shorter time per unit of available information. Considering that RUM theory is still widely applied in transportation, itis worth examining how to incorporate different types of HDM mechanisms under the RUM theory.
3.3. Specification of household utility function
To represent household choice behavior with clear consideration of group decision-making mechanisms, two major typesof modeling approaches have been proposed and examined in various contexts.
3.3.1. Aggregating individual choices into household choiceThis method first specifies the utility of an alternative in each choice set with respect to each member within the house-
hold, derives choice probability for each member, and then aggregate individual choice probabilities into household choiceprobability. Theory of social decision schemes (Davis, 1973) and family-buying, organizational-buying behavior modelsdeveloped in marketing (e.g., Sheth, 1974; Wilson et al., 1989) support this kind of model specification. Various aggrega-tion rules could be applicable, such as proportionality rule, weighted probability rule, minimum endorsement and prefer-ence perturbation rule. To the authors’ knowledge, there is no study adopting such modeling approach in travel behavioranalysis.
3.3.2. Modeling household choice with altruismAnother promising method is proposed by Chiappoir and his colleagues (e.g. Browning and Chiappori, 1998), who argue
that during joint household decision-making process, each member takes other members’ utilities into account and thehousehold maximizes the weighted members’ utilities. The adopted household utility is an additive type. Intra-householdinteraction is represented by introducing one member’s utility into other members’ utilities. They have conducted variousresearch topics in the field of home economics. Kobayashi et al. (1996) propose a random matching model to representpick-up/deliver behavior within a two-member household in transportation. They define the utility of each member in a tra-vel party as a linear function of another member’s utility. In other words, altruistic behavior is incorporated into the model.In this sense, Kobayashi et al.’s approach is similar to that by Browning and Chiappori (1998). Different from the approach byBrowning and Chiappori, Kobayashi et al. further argue that choice behavior is conditional on consensus between twomembers.

234 J. Zhang et al. / Transportation Research Part B 43 (2009) 230–250
In addition to the above-mentioned modeling approaches, this study argues that another approach could be applicable,too. Concretely speaking, one could first define the utility of the alternative with respect to the household rather than itsmembers, and then directly calculate household choice probability, but household utility is defined to reflect the preferencesof all the members involved in joint decision. The effectiveness of such method has been examined and empirically con-firmed in our previous studies about household time allocation (Zhang et al., 2002, 2003, 2004b, 2005a,b; Zhang and Fujiwara,2006).
It is not an easy task to conclude which modeling approach is more superior to others in a single paper. In fact, researchabout group decision rules is still a hot topic in other disciplines. Considering these matters, this paper leaves comparisonsamong the three modeling approaches for future research, and only examines the applicability of the last modeling approachin representing household discrete choice behavior with group decision-making mechanisms.
To define household utility function, it should be noted that during joint decision-making process, each household mem-ber expresses his/her own preferences, and adopts various decision-making strategies to communicate and negotiate withother members. This study defines household utility Ugj using Eq. (1):
Ugj ¼ f ðug1j; . . . ; ugij; . . . ; ugnjÞ; ð1Þ
where, g, i, j indicate household (g = 1,2, . . . ,G), its member (i = 1,2, . . . ,n) and alternative j (j = 1,2, . . . , J) in choice set, ugij isthe utility that member i in household g obtains from choosing alternative j.
Various types of household utilities have been proposed in the disciplines beyond transportation and some of them havebeen examined in our previous studies in the context of household time allocation. They can be roughly classified into twomajor types: multi-linear utility and iso-elastic utility (see Zhang et al., 2002, 2003, 2004b, 2005a,b; Zhang and Fujiwara,2006). Note that these two types of household utility functions are all supported by formal group decision theories (e.g.,Harsanyi, 1955; Atkinson, 1970; Keeney, 1972; Messer and Emery, 1980; Eliashberg and Winkler, 1981, 1986; Corfmanand Gupta, 1993). Because of limited space, this paper will not repeat the detailed discussion about their rationalities, whichcan be found in the literature given above. Definitions of these two utility functions differ in the way to represent intra-household interaction, and as a result, they represent different types of group decision-making mechanisms.
3.3.2.1. Multi-linear household utility function. The multi-linear household utility function finds its theoretical roots in groupdecision theory (e.g., Harsanyi, 1955; Keeney, 1972; Messer and Emery, 1980; Eliashberg and Winkler, 1981, 1986; Corfmanand Gupta, 1993). It is defined as the sum of weighted members’ utilities and intra-household interaction (see Eq. (2)). Theintra-household interaction is defined in a multiplicative form of members’ utilities. Eq. (2) only shows a binary type of inter-action, but it can be easily extended to represent other higher-order interactions:
Ugj ¼Xn
i¼1
wgijugij þ kXn
i¼1
Xi0>i
ðwgijwgi0jugijugi0 jÞ; ð2Þ
wgij P 0 andX
i
wgij ¼ 1; ð3Þ
where k is a parameter representing intra-household interaction, and wgij is member i’s weight parameter representing rel-ative influence in joint decision.
Here, the number of members involved in household decisions is given a priori, but it can be different across households.The weight parameter wgij is used to measure each member’s relative influence within the household, which reflects theinfluence of the degree and the way of involvement, and/or types of strategies adopted during household decision-makingprocess. The interaction parameter k, which could be any real value, reflects household members’ concerns for achievingequality of utilities. Excluding the term of intra-household interaction from Eq. (2) results in additive-type household utilityfunction (Eq. (4)), which can further include compromise-type (Eq. (5)) and capitulation-type (Eq. (6)) as special cases. Com-promise-type utility function assumes equal weight for each member (e.g., Davis and Rigeaux, 1974; Munsinger et al., 1975;Curry and Menasco, 1979; Krishnamurthi, 1988). In contrast, capitulation-type function assumes that each member usesother members’ weights or utilities as his/her own weight or utility for joint decisions, and weight or utility of a memberis defined as average weight or utility of other members (e.g., Curry and Menasco, 1979). In this sense, the capitulation-typefunction clearly takes altruistic behavior of each member into account. If weight of a particular member within householdbecomes unity, additive-type function becomes autocracy-type in the sense that one member made decision on behalf ofhouseholds.
Additive-type household utility function
n
Ugj ¼Xi¼1
wgijugij: ð4Þ
Compromise-type household utility function
Xn
Ugj ¼i¼1
ugij=n; wgij ¼ 1=n: ð5Þ

J. Zhang et al. / Transportation Research Part B 43 (2009) 230–250 235
Capitulation-type household utility function
Xn X
Ugj ¼i¼1
�wgijugij; �wgij ¼ ðn� 1Þ�1
i0–i
wgij; ð6Þ
Ugj ¼Xn
i¼1
wgij�ugij; �ugij ¼ ðn� 1Þ�1Xn
i0–i
ugij: ð7Þ
3.3.2.2. Iso-elastic household utility function. This type of utility function introduces intra-household interaction using Eq. (8),where a is a parameter indicating intra-household interaction and other notations are the same as in Eqs. (2) and (3). Theparameter a is also called Atkinson’s (1970, 1983) measure of aversion to inequality. It is the inverse of the elasticity of sub-stitution along social indifference curves, and reflects households’ preferences for trading off utilities among their members.When a is equal to zero, Eq. (8) returns to the above-mentioned additive-type of function.
Ugj ¼1
1� aX
i
wgiju1�agij ; wgij P 0 and
Xi
wgij ¼ 1: ð8Þ
As mentioned above, multi-linear and iso-elastic utility functions commonly include additive-type, compromise-type,capitulation-type and autocracy-type of utility functions as special cases. On the other hand, when parameter a in Eq. (8)reaches to positive infinity, minimum-type function (Eq. (9)) can be derived and negative infinity of a results in maxi-mum-type function (Eq. (10)). Furthermore, when parameter a is equal to unity, Nash-type function (Eq. (11)) is derived.In this case, each member first identifies his/her most preferred outcome of household decisions and the household thencompromises by averaging along the resulting negotiation frontier.
Minimum-type household utility function
Ugj ¼minðugijji ¼ 1;2; . . . ; nÞ: ð9Þ
Maximum-type household utility function
Ugj ¼maxðugijji ¼ 1;2; . . . ;nÞ: ð10Þ
Nash-type household utility functionYw
Ugj ¼i
ðugijÞ gij : ð11Þ
Remember that ugij is member i’s utility derived from choosing alternative j, as in case of individual decisions, it can in-clude a deterministic term (vgij) and an error term (egij), as shown below:
ugij ¼ vgij þ egij: ð12Þ
Obviously, it is difficult to directly estimate either minimum-type function or maximum-type function as it is. Note thatmaximum-type function also implies that a household tries to choose a member with the highest utility from all of its mem-bers. Such a situation is similar to the choice of an alternative from a given choice set under the principle of random utilitymaximization. Assuming that error terms (egij: i = 1, . . . ,n) follow an identical and independent Gumbel distribution acrosshousehold members leads to that maximal utility among all the household members can be derived as the following LOG-SUM variable, which is similar to that in traditional multinomial logit model. Different from the traditional LOGSUM variable,an error term ~egj specific to household g and alternative j is introduced to explain possible specification error due to theassumption of identical and independent Gumbel distribution mentioned above.
Approximation of maximum-type household utility functionX
maxðugijji ¼ 1;2; . . . ;nÞ ¼ lni
expðvgijÞ þ ~egj: ð13Þ
One of the assumptions made in this study is that a household first forms its utility and then maximizes it to reach finaljoint decision. In other words, utility formation with respect to each alternative in choice set and choice of the alternative aretwo different stages in decision-making process. In this sense, it can be interpreted that specification of household utility isindependent from that of final choice probability. It seems that assumption of independent distribution of error terms acrosshousehold members is contradictory to the stance of this study dealing with group decisions. However, different from exist-ing approaches such as Browning and Chiappori’s (1998) study and Kobayashi et al.’s (1996) study, household utility func-tions defined in this study all assume that individual members’ utilities are independent each other. In other words, it isassumed that formation of individual member’s utility does not require the involvement or consideration of other members(note that the capitulation-type household utility function is an exception). Under such assumption, using Eq. (13) to calcu-late the maximum-type household utility has its rationality. Of course, the authors recognize that Eq. (13) is nothing but anapproximation to the complicated process of household utility formation. Having discussed the rationality of deriving max-imum-type household utility function, specification of minimum-type utility function is straightforward. It is shown below.

236 J. Zhang et al. / Transportation Research Part B 43 (2009) 230–250
Approximation of minimum-type household utility function
minðvgijji ¼ 1;2; . . . ;nÞ ¼ � lnX
i
expð�vgijÞ þ ~egj: ð14Þ
3.4. Kernel model structure
Since each of the above-described household utility functions is composed of members’ utilities, which usually includeboth non-stochastic (or deterministic) and stochastic factors (or error terms), to reflect such stochastic characteristics,household utility Ugj is re-written as follows:
Ugj ¼ f ðug1j; . . . ; ugij; . . . ; ugnjÞ ¼ f ðvg1j; . . . ; vgij; . . . ; vgnjÞ þ egj; ð15Þ
where vgij is non-stochastic term of the utility ugij, and egj is stochastic term or error term.Theoretically, error terms (egj) can follow any type of probability distribution, and various choice models can be derived
from Eq. (15). One important feature of Eq. (15) is that it can incorporate any number of household members. It can also dealwith the case that different households have different number of members. Looking at Eq. (15), one can recognize that Ugj is atype of meta-utility, which consists of members’ utilities. Swait et al. (2004) initially proposed such concept of meta-utilityin the development of a dynamic discrete choice model to evaluate temporal welfare impacts. They adopt the meta-utility torelate previous utilities to current utility and also simultaneously incorporated initial conditions, future expectation, statedependence, and temporally changing scale and taste parameters and covariance. McFadden et al.’s mother logit model(1977) and Zhang et al.’s relative utility choice model (2004a) can be also regarded as the models derived from the meta-utility functions. Applying such meta-utility, one can easily establish the relevant choice models. For example, if error terms(egj) follows an independent and identical Weibull distribution (i.i.d.) across alternatives in choice set, the following logit-type household discrete choice model with group decision-making mechanisms can be obtained under the principle of ran-dom utility maximization:
Pgj ¼expff ðvg1j; . . . ; vgij; . . . ; vgnjÞgPk expff ðvg1k; . . . ; vgik; . . . ; vgnkÞg
; ð16Þ
where Pgj is the probability that household g chooses alternative j.Needless to say, adopting a more general distribution of error term could further strengthen the accountability about
group choice behavior mechanisms. To simplify the discussion about group behavior, this paper only examines the applica-bility of household utility functions examined in the analysis of household time allocation to the analysis of household dis-crete choice behavior, using Eq. (16) as a kernel model structure. Relaxing the i.i.d. assumption in Eq. (16) is left as a futureresearch issue.
3.5. Applying latent class modeling approach
As argued by Curry et al. (1991), there is no clear a priori criterion to select which type of group decision-making mech-anism is more suitable than others; rather, the selection should be made on the basis of a good match between model andproblem and on relevant empirical evidence. Considering the diversity of group decision contexts (Corfman and Gupta,1993), various group decision-making mechanisms could be observed in reality, and it is expected that such mechanismscould vary with households, which are the analysis unit in this study. Here, it is proposed to apply latent class modeling ap-proach to represent such heterogeneity in group decision-making mechanisms, where each latent class corresponds to a par-ticular type of the mechanisms. First, substituting the household utility functions described previously into Eq. (16), one canobtain various types of household discrete choice models with group decision-making mechanisms. Considering the gener-ality of multi-linear and iso-elastic household utilities, it is desirable to integrate these two utility functions in the samemodeling framework. Unfortunately, it is still difficult to estimate the choice model with iso-elastic utility. Remember thatthese two utility functions commonly include additive-type, compromise-type, capitulation-type and autocracy-type utili-ties as special cases, while maximum-type and minimum-type utilities can be derived only from iso-elastic function. In mul-ti-linear utility function, intra-household interaction is expressed in a multiplicative form of members’ utilities, which arequite similar to the Nash-type utility derived from iso-elastic utility function. Considering these matters, instead of integrat-ing multi-linear and iso-elastic utility functions, this paper attempts to integrate multi-linear, maximum-type and mini-mum-type household utilities. The resulting household choice model with respect to each type of household utility isshown below.
� Multi-linear utility (MUL) model
Pgj ¼expf
Pni¼1wgijvgij þ k
Pni¼1
Pi0>iwgijwgi0 jvgijvgi0 jgP
k expPn
i¼1wgikvgik þ kPn
i¼1
Pi0>iwgikwgi0kvgikvgi0k
� � : ð17Þ

J. Zhang et al. / Transportation Research Part B 43 (2009) 230–250 237
� Maximum utility (MAX) model
Pgj ¼expfln
Pi expðvgijÞgP
k expðlnP
i expðvgikÞÞ: ð18Þ
� Minimum utility (MIN) model
Pgj ¼expf� ln
Pi expð�vgijÞgP
k expð� lnP
i expð�vgikÞÞ: ð19Þ
Note that Eq. (18) or Eq. (19) is derived by assuming that a household maximizes the utility of its member who has eithermaximal or minimal utility among all the members. Rationality of such extreme group decision-making mechanisms is sup-ported by group decision theory (e.g., Atkinson, 1970). In the context of household car ownership decision, a member withmaximal utility refers to, for example, the member (e.g., husband) who most prefers large-sized car, and all the householdmembers agree to choose a car that could most satisfy this member’s preference. In contrast, a member with minimal utilitycould be, for example, the member (e.g., wife) who least prefers the large-sized car, and all the household members agree tomaximize this member’s utility in choosing the large-sized car in order to reduce negative impacts (e.g., difficult to drive andexpensive in price) and to increase positive impacts (e.g., by purchasing some option of automatic parking function or rear-mirror function at the screen of navigation system).
Because there are diverse group decision-making mechanisms in reality, instead of exploring the best model to fit thedata, this paper takes a more liberal view and argues that all the above-mentioned models with different group decision-making mechanisms might be used to describe actual behavior to some degrees. The research issue is how to incorporateall these mechanisms into the same model system. This paper suggests applying latent class (LC) modeling approach to inte-grate all the above-mentioned choice probabilities. This is described below in detail.
It is known that LC modeling approach provides an attractive platform for modeling the unobserved heterogeneity. Toformulate household choice model, it is assumed that there exist s group decision-making mechanisms. Let Mgs denotethe probability (i.e., latent class (LC) membership probability) that household g belongs to latent class s (s = 1,2, . . . ,S) cor-responding to a specific group decision-making mechanism. This probability might be influenced by various factors. Gener-ally speaking, socio-demographic attributes are adopted to represent such probability in existing literature in the context ofindividual decision-making (Bucklin and Gupta, 1992; Gupta and Chintagunta, 1994). This paper also adopts socio-demo-graphic attributes to define the LC membership probability. Various functional forms have been proposed to representthe LC membership probability. This paper adopts the most convenient form, i.e., the multinomial logit-type function (Zenorand Srivastava, 1993; Bhat, 1997; Swait and Sweeney, 2000), and defines the LC membership probability as follows:
Mgs ¼expðas þ csDgÞ
1þPS�1
s0¼1 expðas0 þ cs0DgÞ; ð20Þ
where, as is LC-specific constant term and cs (s = 1,2, . . . ,S) is an unknown parameter vector and represents the influence ofsocio-demographic attributes (Dg) on the probability of LC membership.
Needless to say, LC membership probabilities must meet the conditionP
sMgs = 1. In order to estimate the probabilities, itis necessary to fix the parameters as and cs to zero for a pre-specified latent class S (a reference latent class), which can be anycandidate latent class. To incorporate all possible group decision-making mechanisms in the same modeling framework, thefollowing log-likelihood function is adopted
ln L ¼X
g
lnX
s
ðMgsLgjsÞ( )
; ð21Þ
Lgjs ¼Y
j
ðPgjjsÞdgj ; ð22Þ
where dgj is a dummy variable being equal to 1 when the alternative j is chosen, and 0 otherwise. Pgj|s is the choice probabilityof alternative j under group decision-making mechanism (latent class) s, and Lg|s is the likelihood related to the householdchoice behavior.
3.6. Estimation: Bayesian approach and EM algorithm
The above LC-based household choice model is estimated using the Expectation–Maximum (EM) algorithm. The EM algo-rithm is a general method for the analysis of missing data and the models with latent variables incorporating heterogeneity,but it has been rarely used in transportation. Zenor and Srivastava (1993) shows that estimates obtained from the EM algo-rithm represent the best latent partitioning for any desired number of segments in the context of the logit model. Dempsteret al. (1977) show that the EM algorithm constantly increases the value of the likelihood iteration by iteration, provided thatthe likelihood function is convex and unimodal. Bhat (1997) develops a hybrid EM-DFP technique to get stable and efficientestimations. Although the EM algorithm has been successfully applied in a variety of contexts, it is time-consuming to reachconvergence in many cases. In contrast, the time taken to the estimation based on EM algorithm is usually short (Green,
238 J. Zhang et al. / Transportation Research Part B 43 (2009) 230–250
2001). One issue is that as normal non-linear optimization, estimates obtained from the EM algorithm are sensitive to start-ing values (Laird, 1978). But, in general, there is no optimization algorithm that can guarantee to reach a global maximum.Mclachlan and Krishnan (1997) and Cox and Lakes (1984) give an extensive discussion of the EM algorithm.
To implement the EM algorithm, let Rgs = 1 if household g belongs to latent class s, and Rgs = 0 otherwise. Rgs is treated asthe unobservable or missing data to be estimated. If Rgs becomes observable, the following log-likelihood function can beused to estimate the model instead of Eq. (21):
ln LðtÞ ¼X
g
Xs
RgsðtÞ ln MgsðtÞ þX
g
Xs
RgsðtÞ lnðLgjsðtÞÞ: ð23Þ
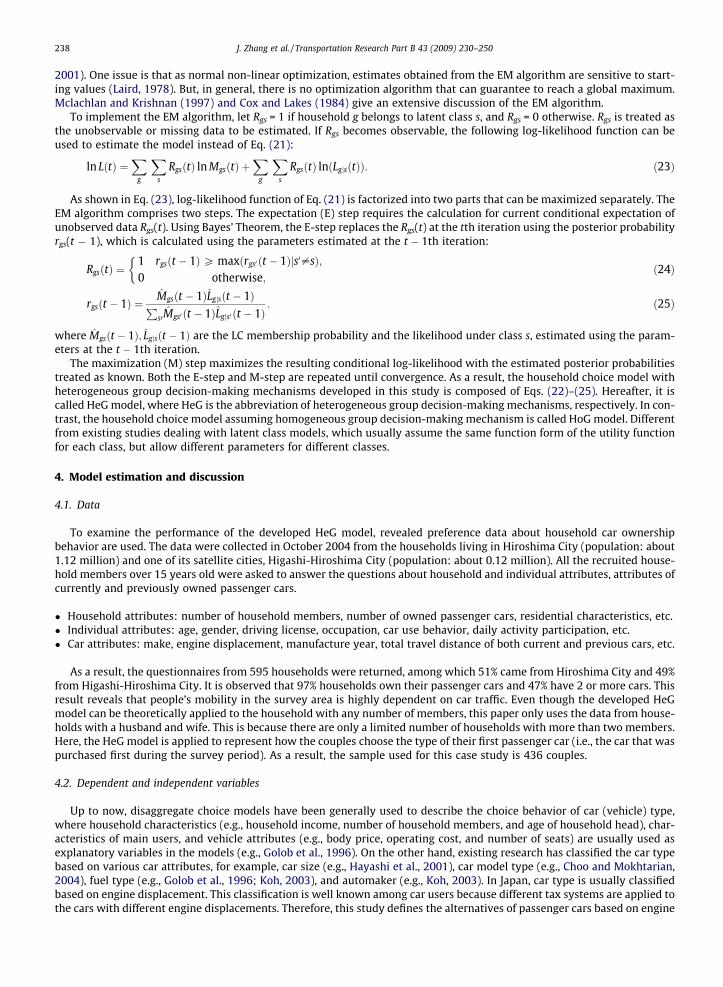
As shown in Eq. (23), log-likelihood function of Eq. (21) is factorized into two parts that can be maximized separately. TheEM algorithm comprises two steps. The expectation (E) step requires the calculation for current conditional expectation ofunobserved data Rgs(t). Using Bayes’ Theorem, the E-step replaces the Rgs(t) at the tth iteration using the posterior probabilityrgs(t � 1), which is calculated using the parameters estimated at the t � 1th iteration:
RgsðtÞ ¼1 rgsðt � 1ÞP maxðrgs0 ðt � 1Þjs0–sÞ;0 otherwise;
�ð24Þ
rgsðt � 1Þ ¼ M̂gsðt � 1ÞL̂gjsðt � 1ÞPs0M̂gs0 ðt � 1ÞL̂gjs0 ðt � 1Þ
: ð25Þ
where M̂gsðt � 1Þ; L̂gjsðt � 1Þ are the LC membership probability and the likelihood under class s, estimated using the param-eters at the t � 1th iteration.
The maximization (M) step maximizes the resulting conditional log-likelihood with the estimated posterior probabilitiestreated as known. Both the E-step and M-step are repeated until convergence. As a result, the household choice model withheterogeneous group decision-making mechanisms developed in this study is composed of Eqs. (22)–(25). Hereafter, it iscalled HeG model, where HeG is the abbreviation of heterogeneous group decision-making mechanisms, respectively. In con-trast, the household choice model assuming homogeneous group decision-making mechanism is called HoG model. Differentfrom existing studies dealing with latent class models, which usually assume the same function form of the utility functionfor each class, but allow different parameters for different classes.
4. Model estimation and discussion
4.1. Data
To examine the performance of the developed HeG model, revealed preference data about household car ownershipbehavior are used. The data were collected in October 2004 from the households living in Hiroshima City (population: about1.12 million) and one of its satellite cities, Higashi-Hiroshima City (population: about 0.12 million). All the recruited house-hold members over 15 years old were asked to answer the questions about household and individual attributes, attributes ofcurrently and previously owned passenger cars.
� Household attributes: number of household members, number of owned passenger cars, residential characteristics, etc.� Individual attributes: age, gender, driving license, occupation, car use behavior, daily activity participation, etc.� Car attributes: make, engine displacement, manufacture year, total travel distance of both current and previous cars, etc.
As a result, the questionnaires from 595 households were returned, among which 51% came from Hiroshima City and 49%from Higashi-Hiroshima City. It is observed that 97% households own their passenger cars and 47% have 2 or more cars. Thisresult reveals that people’s mobility in the survey area is highly dependent on car traffic. Even though the developed HeGmodel can be theoretically applied to the household with any number of members, this paper only uses the data from house-holds with a husband and wife. This is because there are only a limited number of households with more than two members.Here, the HeG model is applied to represent how the couples choose the type of their first passenger car (i.e., the car that waspurchased first during the survey period). As a result, the sample used for this case study is 436 couples.
4.2. Dependent and independent variables
Up to now, disaggregate choice models have been generally used to describe the choice behavior of car (vehicle) type,where household characteristics (e.g., household income, number of household members, and age of household head), char-acteristics of main users, and vehicle attributes (e.g., body price, operating cost, and number of seats) are usually used asexplanatory variables in the models (e.g., Golob et al., 1996). On the other hand, existing research has classified the car typebased on various car attributes, for example, car size (e.g., Hayashi et al., 2001), car model type (e.g., Choo and Mokhtarian,2004), fuel type (e.g., Golob et al., 1996; Koh, 2003), and automaker (e.g., Koh, 2003). In Japan, car type is usually classifiedbased on engine displacement. This classification is well known among car users because different tax systems are applied tothe cars with different engine displacements. Therefore, this study defines the alternatives of passenger cars based on engine

J. Zhang et al. / Transportation Research Part B 43 (2009) 230–250 239
displacement, considering that this category is directly related to evaluation of fuel consumption, emissions and effects ofcar-related taxation. Exploring the choice behavior of passenger car types is important for both marketers and public policymakers, especially considering that more and more people are showing concerns about environmental issues.
Table 1 shows the household distribution by engine displacement. Based on this distribution, the following three choicealternatives are adopted, considering the influence of sample size on the model estimation.
� Alternative 1 (small-sized car): passenger car with engine displacement equal or smaller than 1500 cc (39% in the sample).� Alternative 2 (middle-sized car): passenger car with engine displacement larger than 1500 cc and equal or smaller than
2000 cc (37% in the sample).� Alternative 3 (large-sized car): passenger car with engine displacement larger than 2000 cc (24% in the sample).
Here, utility function of the alternative in choice set with respect to a particular household member is defined as follows:
Table 1Sample
Engine
Numbe
Table 2Househ
Variabl
HousehN_HHOIncomeCar attrSeatPrice
vgij ¼X
m
bmzgim þX
q
cqxgijq; ð26Þ
where zgim is the mth attributes of member i in household g, xgijq is the qth attribute of alternative j for member i in householdg, and bm,cq are the unknown parameters.
In addition, it is obvious that theoretically, weight parameters in multi-linear utility model (Eq. (17)) are specific to bothhousehold members and alternatives. To simplify model specification, it is assumed here that weight parameter of eachhousehold member is the same across alternatives. Since this case study only deals with husband and wife in a household,husband’s weight parameter in Eq. (17) is re-written as wgh, which is further defined below, using a logit-type function of hisattributes. It is straightforward that wife’s weight parameter is 1 � wgh.
� Husband’s weight parameter
wgh ¼expð
PmumAghmÞ
1þ expðP
mumAghmÞ; ð27Þ
where Aghm is the mth attributes of husband in household g (could be different from zgim in Eq. (26), and um is the unknownparameter.
In this case study, the following independent variables are selected based on preliminary analysis: car body price (PRICE),household income (INCOME: category data), number of passenger seats (SEAT: legally permitted passengers within a car),age (AGE), and status of employment (JOB: employed, 1; unemployed, 0). Since price of purchased car is strongly influencedby household income, car price divided by household income level, i.e., ‘‘PRICE/INCOME” is introduced as a composite var-iable. Since number of passenger seats might be influenced by number of household members (N_HHOLD), another compos-ite variable is also defined, i.e., ‘‘SEAT/N_HHOLD” in order to avoid the multicollinearity issue existing in the specification ofutility function. The variables for weight parameter function include member’s age (AGE), status of employment (JOB), mainuser dummy variable (M_USER: yes, 1; no, 0). Tables 2 and 3 show variable definitions, household and individual attributes,and car attributes.
For the non-chosen alternative cars in choice set, it’s better to ask respondents to report the attributes of those alterna-tives in the survey. In this study, to reduce respondents’ reporting burdens, these attributes were not investigated in the sur-vey. Therefore, it is necessary to impute these attributes in a proper way. Relevant information could be provided in two
(household) distribution by engine displacement
displacement �660 cc �1000 cc �1500 cc �2000 cc �2500 cc �3000 cc 3001 cc�
r of households 74(17%) 4(1%) 90(21%) 165(37%) 61(14%) 33(8%) 9(2%)
old attributes, car attributes and their statistical characteristics
e name Definition Mean Standard deviation
old attributesLD Number of household members 3.58 1.13
Household income (10,000 yen) 747.72 280.50ibutes
Number of passenger seats 5.33 1.27Car price (10,000 yen) 202.94 140.85

Table 3Attributes of household members and their statistical characteristics
Variable name Definition Mean (standard deviation)
Husband Wife
Age Age of household member 50.89 (11.36) 47.95Job Dummy variable (equal to 1 for the employed member, 0 otherwise) 0.84 (0.37) 0.43 (0.50)M_USER Dummy variable (equal to 1 if the member is main user of a car, 0 otherwise) 0.64 (0.48) 0.29 (0.45)License Dummy variable (equal to 1 if the member has a car driving license, 0 otherwise) 0.99 (0.10) 0.80 (0.40)
240 J. Zhang et al. / Transportation Research Part B 43 (2009) 230–250
ways: one is to use the information from the collected samples, and another is to make use of the information from externaldata sources. Unfortunately, the latter data sources are not available for the attributes used in this study. Therefore, theattributes of non-chosen alternatives have to be imputed using the relevant average values in the collected samples. Suchimputation assumes that the respondents in this study all have the same choice sets and share the same values of alterna-tive-specific attributes as those having the same household attributes. One of the problems using such imputation methodis that it reduces the inherent variations of alternative-specific attributes and might consequently result in lower good-ness-of-fit of the established choice model. Another problem is that it arbitrarily generates high similarities in attributesamong the samples, which are not actually existent in original data. Since focus of this paper is to explore the applicabilityof a new household choice model with heterogeneous group decision-making mechanisms, the problems of such imputationproblems are ignored in this study. The average values of alternative-specific attributes are calculated with respect to residen-tial locations (Hiroshima city or Higashi-Hiroshima city), housing type (rental or own house; apartment or detached house),number of household members, number of license holders, age of household head, and main purposes of using cars. As a re-sult, it is found that average values calculated with respect to residential locations leads to the highest model accuracy for anyof the three HoG models, and are consequently used to impute the missing alternative-specific attributes in this case study.
4.3. Performance of HoG models
Before the estimation of the proposed latent class choice model with group decision-making mechanisms (i.e., HeG mod-el), it is necessary to first examine the performance of the three choice sub-models included in the HeG model, i.e., multi-linear utility (MUL) model, maximum utility (MAX) model and minimum utility (MIN) model. Estimation results are shownin Table 4. The adjusted McFadden’s Rho-squared is 0.151 for MIN model, 0.171 for MAX model, and 0.186 for MUL model,respectively. Among these three sub-models, MUL model shows the highest model accuracy. On the other hand, observingthe values of Rho-squared, the goodness-of-fit indices are not high enough and the differences across the models are not solarge, either. This suggests that all these sub-models can represent household car ownership behaviors to some extent and it
Table 4Estimation results of HoG models
Explanatory variable Minimum utility (MIN) model Maximum utility (MAX) model Multi-linear utility (MUL) model
Husband Wife Husband Wife Husband Wife
Household member-specific attributePrice/income (1,2,3) �1.306* (�1.68) �0.380 (�0.61) 2.514** (1.97) �8.473** (�4.11) 1.983** (2.56) �1.389* (�1.81)Seat/N_HHOLD (1,2,3) 1.864** (2.44) �0.805** (�2.49) �0.633 (�1.32) 0.781** (2.14) �2.344** (�5.67) 0.506** (2.31)Age (2,3) 0.049* (1.89) �0.068** (�2.84) �0.033** (�2.06) 0.004 (0.27) �0.003 (�0.19) �0.048** (�3.32)Job (2,3) �9.816** (�5.04) �1.582** (�3.80) �0.765 (�1.54) �1.348** (�3.33) �0.807* (�1.83) �0.889** (�2.74)Constant term (2) 6.406** (4.29) 2.707 ** (3.53) 3.506 ** (3.68)Constant term (3) 5.575** (3.73) 2.180** (2.76) 2.743** (3.36)Variable for weight parameter of member in joint decisionAge – – �0.057 (�1.24)Job – – 0.682* (1.96)M_USER – – 1.805** (3.79)Intra-household
interaction-– – �3.579** (�2.18)
Sample size(households)
436 436 436
Initial log-likelihood �478.995 �478.995 �478.995Converged log-
likelihood�401.769 �392.564 �383.546
Adjusted McFadden’sRho-squared
0.151 0.171 0.186
(1) Integer numbers 1, 2, 3 in parentheses shown in the first column indicate alternatives associated with the variable: (1) �1500 cc, (2) 1501–2000 cc, (3)2001 cc�.(2) t-Score is shown in parenthesis after estimated parameter.(3) *Significant at the 10% level, **significant at the 5% level.

J. Zhang et al. / Transportation Research Part B 43 (2009) 230–250 241
is difficult to say that either of them is absolutely superior to other two sub-models. In other words, it is risky for analysts touse only one of these sub-models to represent household decisions in real world. This emphasizes the importance of inte-grating different decision-making mechanisms.
Concerning the parameters of explanatory variables, except for PRICE/INCOME for wife in MIN model (1 out of 10 param-eters), SEAT/N_HHOLD for husband and AGE for wife in Max model (2 out of 10 parameters), AGE for husband in MUL model(2 out of 14 parameters), all other parameters are statistically significant. It is further confirmed that in MUL model, the in-tra-household interaction parameter is estimated to be negative and statistically significant, suggesting that intra-householdinteraction is surely influential to household’s choice of car type. Among the three introduced factors to explain relativeinfluence of husband, parameters of JOB and M_USER are significant and positive, suggesting that preferences of main usersand members with jobs play major roles in determining relative influences of household members in joint decision, espe-cially value of M_USER parameter is higher three times than that of JOB (Note these two variables are all dummy variables).Husband being main user with job shows higher relative influence on joint decision. As a result, average weight of husbandin joint decision is 0.634.
4.3.1. Consistent observations among different group decision-making mechanismsMUL, MAX and MIN models all estimate positive and statistically significant constant terms with respect to alternative 2
(middle-sized car) and alternative 3 (large-sized car). In other words, all the three models show that on average, the samplehouseholds prefer vehicles with larger engine displacements. This implies that at least in this case study, change of decision-making mechanisms does not lead to a change of households’ latent preferences. The three models also estimate consistentinfluences of employment status (JOB) on choice behavior with respect to both husband and wife. All the JOB parameter val-ues are negative and statistically significant, meaning that household members with job prefer small-sized vehicles.
4.3.2. Inconsistent observations among different group decision-making mechanismsIn spite of this behavioral consistency, it is also confirmed that some of influential factors and the ways of these factors to
influence choice behavior surely vary with group decision-making mechanisms. The alternative-specific attributes PRICE/IN-COME and SEAT/N_HHOLD show consistent influences on choice behavior in MAX and MUL models, but not in MIN model.The estimation results from MAX and MUL models show that husbands prefer expensive cars with few seats (e.g., sports car)while wives prefer cheap cars with more seats (e.g., van of SUV). In other words, wives attempt to trade off car price and seatcapacity while husband adhere to high-grade cars. In contrast, MIN model estimates that under the principle of maximizingthe member’s utility with the lowest value among household members, husband and wife show opposite preferences tothose observed in MAX and MUL models (exception: the parameter of PRICE/INCOME is not significant). For the individualattribute AGE, wives show consistent preferences for different alternatives, i.e., aging leads to higher preference for small-
Table 5Estimation results of HeG model: Minimum and maximum utilities
Explanatory variable Minimum utility (MIN) Maximum utility (MAX)
Husband Wife Husband Wife
Household member-specific attributePrice/income (1,2,3) �24.821 (�4.19)** �9.841 (�6.27)** �11.584 (�3.02)** 8.712 (2.88)**
Seat/N_HHOLD (1,2,3) 7.266 (3.90)** 5.327 (6.69)** �14.051 (�5.93)** �15.310 (�5.78)**
Age (2,3) 0.295 (0.14) �0.171 (�4.88)** �0.108 (�2.09)** 0.392 (4.73)**
Job (2,3) �6.439 (�0.09) �1.410 (�2.61)** 23.555 (5.88)** �3.127 (�3.06)**
Constant term (2) 7.455 (3.50)** �10.924 (�3.43)**
Constant term (3) 8.526 (4.14)** �11.312 (�3.35)
Variable for latent class membership probability introduced to explain maximum utility (MAX)N_HHOLD �0.424 (�4.13)**
Income 0.002 (4.30)**
Husband’s job �0.692 (�2.08)**
Wife’s job �0.192 (�0.87)**
Wife’s license 0.594 (1.96)*
Constant term 0.850 (1.91)*
Latent class membership probability 39.9% 59.1%
Sample size (households) 436Initial log-likelihood �478.995Converged log-likelihood �196.650Adjusted McFadden’s Rho-squared 0.580
(1) Integer numbers 1, 2, 3 in parentheses in the first column indicate alternatives associated with the variable: (1) �1500 cc, (2) 1501–2000 cc, (3)2001 cc�.(2) t-Score is shown in parenthesis under estimated parameter.(3) *Significant at the 10% level; **significant at the 5% level.

242 J. Zhang et al. / Transportation Research Part B 43 (2009) 230–250
sized car (exception: AGE is not significant in MAX model) while husbands show opposite preferences for the alternatives:MIN model estimates higher preference for large-sized car, but MAX model estimates lower preference for large-sized car.
4.4. Performance of HeG models
As discussed above, none of the targeted household utility functions is dominant in representing household decision-making mechanism and consequently, it is necessary to integrate different household utilities together in order to representhousehold behavior in a more accurate way. To that effect, a latent class modeling approach was adopted. Due to the limitedsample size in this case study, this paper deals with the HeG model with only two latent classes, i.e., two types of householdutilities. In this study, three types of household utilities are discussed and their paired combinations result in three HeGmodels: i.e., MAX + MIN, MAX + MUL and MIN + MUL models. In addition to examining the performance of each HeG model,comparative analyses among models are also done.
Tables 5–7 show the estimation results. The adjusted McFadden’s Rho-squared is 0.580 for MAX + MIN model, 0.585 forMAX + MUL model and 0.627 for MIN + MUL model, respectively. All these three models are clearly superior to the above-mentioned three HoG models. This implies that introducing different (heterogeneous) group decision-making mechanismsinto the household choice model can significantly improve model accuracy. Among the three HeG models, MIN + MUL modelshow the highest model accuracy, meaning that as a whole, households tend to balance different members’ preferences withclear consideration of the weak within households.
Concerning the variables introduced to explain members’ relative influences (weights) in joint decision and latent classmemberships, most of the parameters are statistically significant. Further observing the LC membership probabilities, it isobvious that the differences between the two latent classes are all less than 20% (MAX �MIN = 19.2%, MAX �MUL = 15.6%,MUL �MIN = 2.4%), meaning that none of the two household decision-making mechanisms is dominating. This supports themodeling strategy adopted in this study, i.e., to integrate different group decision-making mechanisms in the same modelingframework.
Comparing the estimated choice probabilities (average values in Table 8 and distribution in Fig. 1) by the three HeG mod-els, it is found that the choice probabilities estimated with respect to multi-linear utility show smaller variations, comparedwith the other two HeG models. One of possible reasons might be that multi-linear utility represents a more general groupdecision-making mechanism while maximum-type and minimum-type utilities indicate two extreme cases of group deci-sion-making mechanisms. Observing the choice probabilities from the three HeG models by the samples sorted with respect
Table 6Estimation results of HeG model: minimum & multi-linear utilities
Explanatory variable Minimum utility (MIN) Multi-linear utility (MUL)
Husband Wife Husband Wife
Household member-specific attributePrice/Income (1,2,3) 13.439 (3.87)** 12.697 (3.16)** �42.141 (�4.23)** �14.671 (�1.59)Seat/N_HHOLD (1,2,3) �8.721 (�6.18)** �16.424 (�9.31)** 6.638 (2.96)** 23.505 (6.20)**
AGE (2,3) �0.315 (�5.50)** �0.020 (�0.46) 0.727 (5.49)** �0.877 (�2.89)**
JOB (2,3) 2.087 (2.31)** 7.053 (0.55) �14.454 (�3.85)** �0.113 (�0.03)Constant term (2) 9.829 (4.40)** 8.129 (2.13)**
Constant term (3) 7.183 (3.47)** 5.281 (1.34)
Variable for weight parameter of member in joint decisionAge �0.025 (�3.90)**
Job 0.251 (2.38)**
M_USER 0.059 (1.83)*
Intra-household interaction �0.039 (�5.34)**
Variable for latent class membership probability introduced to explain multi-linear utility (MUL)N_HHOLD 0.285 (3.15)**
Income �3.5E�4 (�0.99)Husband’s job �0.128 (�0.43)Wife’s job 0.294 (1.69)*
Wife’s license �0.131 (�0.50)Constant term �0.706 (�1.69)*
Latent class membership probability 48.8% 51.2%
Sample size (households) 436Initial log-likelihood �478.995Converged log-likelihood �173.820Adjusted McFadden’s Rho-squared 0.627
(1) Integer numbers 1, 2, 3 in parentheses in the first column indicate alternatives associated with the variable: (1) �1500 cc, (2) 1501–2000 cc, (3)2001 cc�.(2) t-Score is shown in parenthesis under estimated parameter.(3) *Significant at the 10% level; **significant at the 5% level.

J. Zhang et al. / Transportation Research Part B 43 (2009) 230–250 243
to the alternatives, respectively (Fig. 2), it is obvious that, in MAX + MIN model, choice probabilities by the two sub-modelsshow similar trends in the sense that the probabilities in MIN sub-model increase with the increase of those in MAX sub-model for all the three car types, even though the increasing patterns are not the same. In contrast, the HeG models withMUL utility show quite different variation patterns. With the change of choice probabilities estimated from MAX or MINsub-model, there is no clear increasing or decreasing trend in choice probabilities from MUL sub-models and variations ofchoice probabilities are very large, especially for the MIN + MUL model. Large variations of choice probabilities in the HeG
Table 7Estimation result of HeG model: maximum & multi-linear utilities
Explanatory variable Maximum utility (MAX) Multi-linear utility (MUL)
Husband Wife Husband Wife
Household member-specific attributePrice/income (1,2,3) �8.147 (�2.13)** 0.529 (0.37) 31.962 (3.62)** �69.327 (�4.68)**
Seat/N_HHOLD (1,2,3) �5.829 (�6.66)** �5.941 (�5.83)** �12.179 (�3.56)** 29.552 (5.93)**
Age (2,3) 0.207 (5.58)** 0.105 (3.65)** 0.390 (3.11)** �0.730 (�5.24)**
Job (2,3) 2.028 (2.32)** 4.017 (2.65)** �28.472 (�4.87)** �7.496 (�2.52)**
Constant term (2) �4.954 (�3.29)** 24.994 (5.96)**
Constant term (3) �5.472 (�3.33)** 26.616 (6.32)**
Variable for weight parameter of member in joint decisionAge �0.018 (�1.03)Job �0.19 (�1.34)M_USER 0.104 (2.48)Intra-household interaction �0.040 (�3.74)
Variable for latent class membership probability introduced to explain multi-linear utility (MUL)N_HHOLD �8.147 (�2.13)**
Income �5.829 (�6.66)**
Husband’s job 0.207 (5.58)**
Wife’s job 2.028 (2.32)**
Wife’s license �5.472 (�3.33)**
Constant term �4.954 (�3.29)**
Latent class membership probability 57.8% 42.2%
Sample size (households) 436Initial log-likelihood �478.995Converged log-likelihood �193.128Adjusted McFadden’s Rho-squared 0.585
(1) Integer numbers 1, 2, 3 in parentheses in the first column indicate alternatives associated with the variable: (1) �1500 cc, (2) 1501–2000 cc, (3)2001 cc�.(2) t-Score is shown in parenthesis under estimated parameter.(3) *Significant at the 10% level; **significant at the 5% level.
Table 8Choice probabilities estimated by HeG models: means
Maximum & minimum utilities Minimum utility Maximum utility
Latent class membership probability 0.399 0.591
Choice probability(1) 1500 cc 0.221 0.437(2) 1501–2000 cc 0.602 0.347(3) 2001 cc� 0.177 0.216
Minimum & multi-linear utilities Minimum utility Multi-linear utility
Latent class membership probability 0.488 0.512
Choice probability(1) 1500 cc 0.103 0.266(2) 1501–2000 cc 0.532 0.371(3) 2001 cc� 0.366 0.362
Maximum & multi-linear utility Maximum utility Multi-linear utility
Latent class membership probability 0.578 0.422
Choice probability(1) 1500 cc 0.157 0.333(2) 1501–2000 cc 0.686 0.266(3) 2001 cc� 0.157 0.401

244 J. Zhang et al. / Transportation Research Part B 43 (2009) 230–250
models with MUL utility mean that MUL and MIN (or MUL and MAX) utilities representing different group decision-makingmechanisms could supplement their roles played in capturing behavioral variations across households. Since in the HeGmodel with MAX and MIN utilities, the two types of utilities show similar performance in predicting the choice probabilities,combination of MAX and MIN utilities contributes less to the improvement of model accuracy.
Concerning explanatory variables, most of the parameters are statistically significant in all the three HeG models, but theyshow very complicated variations in both signs and values among the three HeG models. Obviously, such variations arecaused by different combinations of household utility functions. It is true that such variations make model interpretationvery difficult. But this also implies that it is important to properly incorporate group decision-making mechanisms intochoice model. Improper specification of such mechanisms could lead to seriously wrong policy-making. In this case study,since choice results by husband and wife are not observable, there is no direct observations to support the interpretationsabout the meaning of each parameter with respect to each household member. The only information that can be used is the
0
50
100
150
200
250
0-0.1 0.1- 0.2 0.2-0.3 0.3- 0.4 0.4-0.5 0.5-0 .6 0.6- 0.7 0.7-0 .8 0.8- 0.9 0.9- 1Choice probability
Num
ber o
f sam
ples
Alternative1
Alternative2
Alternative3
0
50
100
150
200
250
0-0.1 0.1-0.2 0.2-0.3 0.3-0.4 0.4-0.5 0.5-0.6 0.6-0.7 0.7-0.8 0.8-0.9 0.9-1Choice probability
Num
ber o
f sam
ples
Alternative1
Alternative2
Alternative3
Minimum Utility
0
50
100
150
200
250
0-0.1 0.1-0.2 0.2-0.3 0.3-0.4 0.4-0.5 0.5-0.6 0.6-0.7 0.7-0.8 0.8-0.9 0.9-1Choice probability
Num
ber o
f sam
ples
Alternative1
Alternative2
Alternative3
0
50
100
150
200
250
0-0.1 0.1-0.2 0.2-0.3 0.3-0.4 0.4-0.5 0.5-0.6 0.6-0.7 0.7-0.8 0.8-0.9 0.9-1Choice probability
Num
ber o
f sam
ples
Alternative1
Alternative2
Alternative3
Minimum Utility Multi-linear Utility
Multi-linear Utility
Multi-linear Utility
0
50
100
150
200
250
0- 0.1 0.1- 0.2 0.2- 0.3 0.3- 0.4 0.4- 0.5 0.5- 0.6 0.6- 0.7 0.7- 0.8 0.8- 0.9 0.9- 1
Choice probability
Num
ber o
f sam
ples
Alternative1
Alternative2
Alternative3
0
50
100
150
200
250
0-0.1 0.1-0.2 0.2-0.3 0.3-0.4 0.4-0.5 0.5-0.6 0.6-0.7 0.7-0.8 0.8-0.9 0.9-1
Choice probability
Num
ber o
f sam
ples
Alternative1
Alternative2
Alternative3
Maximum Utility
Fig. 1. Choice probabilities by HeG models: distributions.

0
0.1
0.2
0.3
0.4
0.5
0.6
0.7
0.8
0.9
1
1 51 101 151 201 251 301 351 401
Sorted samples
Cho
ice
prob
abili
ty
0
0.1
0.2
0.3
0.4
0.5
0.6
0.7
0.8
0.9
1
1 51 101 151 201 251 301 351 401
Sorted samples
Cho
ice
prob
abili
ty
0
0.1
0.2
0.3
0.4
0.5
0.6
0.7
0.8
0.9
1
1 51 101 151 201 251 301 351 401
Sorted samples
Cho
ice
prob
abili
ty
0
0.1
0.2
0.3
0.4
0.5
0.6
0.7
0.8
0.9
1
1 51 101 151 201 251 301 351 401
Sorted samples
Cho
ice
prob
abili
ty
0
0.1
0.2
0.3
0.4
0.5
0.6
0.7
0.8
0.9
1
1 51 101 151 201 251 301 351 401
Sorted samples
Cho
ice
prob
abili
ty
0
0.1
0.2
0.3
0.4
0.5
0.6
0.7
0.8
0.9
1
1 51 101 151 201 251 301 351 401
Sorted samples
Cho
ice
prob
abilit
y
0
0.1
0.2
0.3
0.4
0.5
0.6
0.7
0.8
0.9
1
1 51 101 151 201 251 301 351 401
Sorted samples
Cho
ice
prob
abili
ty
0
0.1
0.2
0.3
0.4
0.5
0.6
0.7
0.8
0.9
1
1 51 101 151 201 251 301 351 401
Sorted samples
Cho
ice
prob
abili
ty
0
0.1
0.2
0.3
0.4
0.5
0.6
0.7
0.8
0.9
1
1 51 101 151 201 251 301 351 401
Sorted samples
Cho
ice
prob
abili
ty
HeG Model: Maximum Utility (MAX) + Minimum Utility (MIN)
rac dezis-egraL
rac dezis-egraL
rac dezis-egraL
MAX MIN
HeG Model: Minimum Utility (MAX) + Multi-linear Utility (MUL)
HeG Model: Maximum Utility (MAX) + Multi-linear Utility (MUL)
Medium-sized car
Medium-sized car
Medium-sized car
Small-sized car
Small-sized car
Small-sized car
MIN MUL
MAX MUL
Fig. 2. Distribution of choice probability from HeG model by the samples sorted for alternatives respectively.
J.Zhanget
al./TransportationR
esearchPart
B43
(2009)230–
250245

246 J. Zhang et al. / Transportation Research Part B 43 (2009) 230–250
choice results by the household. In other words, it is necessary to make use of the relationship between choice results byhousehold and explanatory variables for the alternatives to confirm if the resultant parameters show logical influences onhousehold choice behavior. Figs. 3 and 4 show the results of a sensitivity analysis with respect to change of price ofsmall-sized car estimated by HoG and HeG models, respectively. On average, choice probabilities of small-sized car calcu-lated by the HeG models are more sensitive to its price than those by the HoG models (direct elasticity). This seems to beconsistent with observations (see Fig. 5). As for cross-elasticity, the HoG models estimate that choices of medium-sizedcar are more sensitive to change of price of small-sized car while the HeG models support higher sensitivity of large-sizedcar.
Since MIN + MUL model shows the highest model accuracy, hereafter, meanings of parameters are discussed with respectto those from MIN + MUL model. Constant terms of medium- and large-sized cars all show positive values, which are con-sistent with the estimation results in three HoG models (note that these constant terms are commonly introduced into bothhusband’s and wife’s utility functions). In other words, unobserved factors show that the small-sized car is not the preferredcar type by the couple.
-0.06%
-0.04%
-0.02%
0.00%
0.02%
0.04%
0.06%
-5.0% -4.0% -3.0% -2.0% -1.0% 0.0% 1.0% 2.0% 3.0% 4.0% 5.0%
Change of price of small-sized car
Choi
cePr
obab
ility
Small-sized car Medium-sized car Large-sized car
Minimum Utility (MIN) Model
-0.30%
-0.20%
-0.10%
0.00%
0.10%
0.20%
0.30%
-5.0% -4.0% -3.0% -2.0% -1.0% 0.0% 1.0% 2.0% 3.0% 4.0% 5.0%
Change of price of small-sized car
Cho
ice
Prob
abilit
y
Small-sized car Medium-sized car Large-sized car
Maximum Utility (MAX) Model
-0.20%
-0.15%
-0.10%
-0.05%
0.00%
0.05%
0.10%
0.15%
0.20%
-5.0% -4.0% -3.0% -2.0% -1.0% 0.0% 1.0% 2.0% 3.0% 4.0% 5.0%
Change of price of small-sized car
Choi
cePr
obab
ility
Small-sized car Medium-sized car Large-sized car
Multi-linear Utility (MUL) Model
Fig. 3. Sensitivity analysis results of car price of small-sized cars in HoG models.

J. Zhang et al. / Transportation Research Part B 43 (2009) 230–250 247
4.4.1. Variables describing the utilities of alternatives in choice setThe parameters of husband members show opposite signs at MIN sub-model and MUL sub-model, except for the AGE
parameter of the wife, which has the same signs at the two sub-models, but is not statistically significant. This might be be-cause that MUL sub-model estimates the parameters by reflecting the preferences of household members with higher rel-ative influence in joint decisions. In contrast, MIN sub-model estimates the relevant parameters in a completely oppositeway, i.e., it estimates the parameters by maximizing the utility of member with lowest preference. At the same time, sincealternative-specific constant terms are significant, other influential factors should be introduced into the model. Since thisstudy attempts to examine the applicability of incorporating different group decision-making mechanisms into the latentclass modeling approach, further examination is left for future research.
4.4.2. Variables describing household decision-making mechanismsAll variables introduced to measure relative influence, including AGE, JOB and M_USER are statistically significant. Esti-
mation results show that the husbands, who are young, employed and main users of cars, tend to dominate the joint deci-sion. Concerning the variables describing latent class membership probabilities, half of the relevant variables (including
-0.40%
-0.30%
-0.20%
-0.10%
0.00%
0.10%
0.20%
0.30%
0.40%
0.50%
-5.0% -4.0% -3.0% -2.0% -1.0% 0.0% 1.0% 2.0% 3.0% 4.0% 5.0%
Cho
ice
Prob
abili
ty
Small-sized car Medium-sized car Large-sized car
MAX+MIN Model
-0.25%
-0.20%
-0.15%
-0.10%
-0.05%
0.00%
0.05%
0.10%
0.15%
0.20%
0.25%
-5.0% -4.0% -3.0% -2.0% -1.0% 0.0% 1.0% 2.0% 3.0% 4.0% 5.0%
Change of price of small-sized car
Change of price of small-sized car
Cho
ice
Pro
babi
lity
Small-sized car Medium-sized car Large-sized car
MIN+MUL Model
-1.50%
-1.00%
-0.50%
0.00%
0.50%
1.00%
1.50%
-5.0% -4.0% -3.0% -2.0% -1.0% 0.0% 1.0% 2.0% 3.0% 4.0% 5.0%
Change of price of small-sized car
Cho
ice
Prob
abili
ty
Small-sized car Medium-sized car Large-sized car
MAX+MUL Model
Fig. 4. Sensitivity analysis results of car price of small-sized cars in HeG models.

0 %
10%
20%
30%
40%
50%
60%
70%
80%
0.0
0.1
0.1
0.2
0.2
0.3
0.3
0.4
0.4
0.5
0.5
0.6
0.6
Price/Income
Small-sized car Middle-sized car Large-sized car
Car
ow
ners
hip
rate
Fig. 5. Car ownership rate by price/income.
248 J. Zhang et al. / Transportation Research Part B 43 (2009) 230–250
constant term) have significant parameters. It is found that households with more members, the employed wives tend toadopt the minimum-type decision strategy with a higher probability. The significant and negative constant term suggeststhat the unobserved factors contribute more to adopt a multi-linear decision strategy.
5. Conclusions and future research issues
Because different members in households might apply different decision strategies to reach final decision outcomes, thispaper developed a latent class specification of a household choice model, applied to the problem of car ownership. House-hold utilities, drawn on from group decision theories, are defined to reflect its members’ preferences and intra-householdinteraction. The resulting household choice model is derived by assuming that a household maximize its utility. Differenthousehold utility functions are defined with respect to different latent classes. The proposed model can deal not only withchoice situations where household members involved in the joint decision are known a priori (e.g., travel party of joint trip-making), but also with the situations where they are not known (e.g., residential choice and car ownership decision).
As the first case study to examine the effectiveness of the HeG model, this study deals with the multi-linear, maximumand minimum utilities to approximately cover the group decision-making mechanisms captured by multi-linear andiso-elastic types of utilities. The HeG model is applied to the analysis of household car ownership behavior. The choicealternatives are passenger car types defined by engine displacement (i.e., small-sized, medium-sized and large-sized cars).Estimation results confirmed the effectiveness of the proposed HeG model from both model performance and applicability toanalysis of household car ownership behavior. Small variation of latent class probabilities across group decision-makingmechanisms supports the modeling strategy adopted in this study. It is found that changes of utility combinations resultin very complicated variations in both signs and values of the model parameters and choice probabilities by multi-linear util-ity show small variations across different utility combinations.
There are some limitations in this study. For simplifying the discussion about modeling heterogeneous group decision-making mechanisms, it is assumed that error terms of household utilities follow an identical and independent Gumbel dis-tribution across alternatives and household members. This assumption may be relaxed. It is also worth exploring how toestimate the iso-elastic type of household utility considering its generality. Some simulation-based estimation methodsmight be applicable to deal with these two issues. Robustness of the proposed modeling approach should be further exam-ined using some large-scale datasets related to various contexts of household decisions. Comparisons between the proposedmodeling approach and the existing approaches proposed in other disciplines might provide some new insights about groupdecision-making mechanisms in household activity–travel behavior. Validation of the confirmed group decision-makingmechanisms is also required by developing some innovative survey methods (e.g., stated preference survey). Finally, it is alsoworth exploring group decision-making mechanisms at the attribute level.
Acknowledgement
This research is financially supported by the Grand-in-Aid for Scientific Research, Japan Society for the Promotion of Sci-ence (No. 16610008: 2004–2005; No. 16760429: 2004–2006; No. 19560536: 2007–2009).
References
Atkinson, A.B., 1970. On the measurement of inequality. Journal of Economic Theory 2, 244–263.Atkinson, A.B., 1983. The Economics of Inequality. Clarendon Press, Oxford (Chapter 3).Algers, S., Daly, A., Widlert, S., 1997. Modeling travel behaviour to support policy making. In: Stopher, P., Lee-Gosselin, M. (Eds.), Understanding Travel
Behaviour in an Era of Change. Pergamon, Stockholm, pp. 547–569.Badoe, D.A., 2002. Modelling work-trip mode choice decisions in two-worker households. Transportation Planning and Technology 25, 49–73.Bhat, C.R., 1997. An endogenous segmentation mode choice model with an application to intercity travel. Transportation Science 31 (1), 34–48.

J. Zhang et al. / Transportation Research Part B 43 (2009) 230–250 249
Bhat, C.R., Pendyala, R.M., 2005. Modeling intra-household interactions and group decision-making. Transportation 32 (5), 443–448.Bierlaire, M., 2002. The network GEV model. In: Proceedings of Swiss Transport Research Conference, Monte Verita, March 20–22.Borgers, A., Timmermans, H.J.P., 1993. Transport facilities and residential choice behaviour: a model of multi-person choice processes. Papers in Regional
Science 72 (1), 45–61.Bradley, M., Vovsha, P., 2005. A model for joint choice of daily activity pattern types of household members. Transportation 32 (5), 545–571.Brewer, A.M., Hensher, D.A., 2000. Distributed work and travel behaviour: the dynamics of interactive agency choices between employers and employees.
Transportation 27, 117–148.Browning, M., Chiappori, P.A., 1998. Efficient intra-household allocations: a general characterization and empirical test. Econometrica 66, 1241–1278.Bucklin, R.E., Gupta, S., 1992. Brand choice, purchase incidence, and segmentation: an integrated modeling approach. Journal of Marketing Research 29 (2),
201–215.Chiappori, P.A., 1988. Rational household labor supply. Econometrica 56 (1), 63–90.Choo, S., Mokhtarian, P.L., 2004. What type of vehicle do people drive? the role of attitude and lifestyle in influencing vehicle type choice. Transportation
Research Part A 38, 201–222.Corfman, K.P., Gupta, S., 1993. Mathematical models of group choice and negotiations. In: Handbooks in Operations Research and Management Science,
Marketing, vol. 5, pp. 83–142.Cosenza, R.M., Davis, D.L., 1981. Family vacation decision making over the family life cycle: a decision and influence structure analysis. Journal of Travel
Research 17, 17–23.Cox, D.R., Lakes, D., 1984. Analysis of Survival Data. Chapman & Hall, Cambridge.Curry, D.J., Menasco, M.B., 1979. Some effects of differing information processing strategies on husband–wife joint decision. Journal of Consumer Research 6,
192–203.Curry, D.J., Menasco, M.B., van Ark, J.W., 1991. Multiattribute dyadic choice: models and tests. Journal of Marketing Research 28, 259–267.Daganzo, C., 1979. Multinomial Probit: The Theory and its Applications to Demand Forecasting. Academic Press, New York.Davis, J.H., 1973. Group decision and social interaction: a theory of social decision schemes. Psychological Review 80 (2), 97–125.Davis, H.L., 1976. Decision making within the household. Journal of Consumer Research 2, 241–260.Davis, H.L., Rigeaux, B.P., 1974. Perception of marital roles in decision processes. Journal of Consumer Research 1, 51–61.Dempster, A., Laird, N., Rubin, D., 1977. Maximum likelihood from incomplete data via the EM algorithm. Journal of the Royal Statistical Society B 39, 1–38.De Palma, A., Meyer, G.M., Papageorgiou, Y.Y., 1994. Rational choice under an imperfect ability to choose. American Economic Review 84, 419–440.Eliashberg, J., Winkler, R.L., 1981. Risk sharing and group decision making. Management Science 7 (11), 1221–1235.Eliashberg, J., Winkler, R.L., 1986. Assessing the predictive accuracy of two utility-based theories in a marketing channel negotiation context. Journal of
Marketing Research 23, 101–110.Fujiwara, A., Sugie, Y., Moriyama, M., 2000. Nested paired combinatorial logit model to analyze recreational touring behaviour. In: Paper presented at the
Ninth International Association for Travel Behaviour Research Conference, Gold Coast, Queensland, Australia, July 2–7.Fujiwara, A., Zhang, J., 2005. Development of car tourists’ scheduling model for 1-day tour. Transportation Research Record 1921, 100–111.Gliebe, J.P., Koppelman, F.S., 2005. Modeling household activity–travel interactions as parallel constrained choices. Transportation 32 (5), 449–471.Golob, T.F., Bunch, D.S., Brownstone, D., 1996. A vehicle use forecasting model based on revealed and stated vehicle type choice and utilization data. Journal
of Transport economics and Policy 30, 69–92.Green, W., 2001. Fixed and random effects in nonlinear models. Working paper EC-01-01, Stern Scholld of Business, Department of Economics.Gupta, S., Chintagunta, P.K., 1994. On using demographic variables to determine segment membership in logit mixture models. Journal of Marketing
Research 31 (1), 128–136.Harsanyi, J.C., 1955. Cardinal welfare, individualistic ethics, and interpersonal comparisons of utility. Journal of Political Economy 63, 309–321.Hayashi, Y., Kato, H., Teodoro, R.V.R., 2001. A model system for the assessment of the effects of car and fuel green taxes on CO2 emission. Transportation
Research Part D 6, 123–139.Hensher, D.A., 2003. Models of organizational and agency choices for passengers and freight-related travel choices: notions of inter-activity and influence.
In: Papers Presented in the Eighth International Association for Travel Behaviour Research Conference, Switzerland, August 10–15.Hensher, D.A., 2004. Modeling agent interdependency in group decision making. Transportation Research Part E 40, 63–79.Jones, P., Dix, M.C., Clarke, M.I., Heggie, I.G., 1983. Understanding Travel Behavior. Gower, Aldershot.Keeney, R.L., 1972. Utility functions for multi-attributed consequences. Management Science 18, 209–222.Kim, C., Khoury, M., 1987. Task complexity and contingent information processing in the case of couple’s decision making. Academy of Marketing Science 15
(3), 32–43.Kirchler, E., 1995. Studying economic decisions within private households: a critical review and design for a ‘‘couple experiences diary”. Journal of Economic
Psychology 16, 393–419.Kobayashi, K., Kita, H., Tatano, H., 1996. A random matching model for joint trips production within households. Journal of Infrastructure Planning and
Management 536 (IV-31), 59–68 (in Japanese).Koh, W.T.H., 2003. Control of vehicle ownership and market competition: theory and Singapore’s experience with the vehicle quota system. Transportation
Research Part A 37, 749–770.Koppelman, F.S., Wen, C.H., 2000. The paired combinatorial logit model: properties, estimation and application. Transportation Research Part B 34 (2), 75–
89.Krishnamurthi, L., 1988. Conjoint models of family decision making. International Journal of Research in Marketing 5, 185–198.Laird, N., 1978. Nonparametric maximum likelihood estimation of a mix distribution. Journal of the American Statistical Association 73, 805–811.McFadden, D., 2001. Economic choices. American Economic Review 91 (3), 351–378.McFadden, D., Train, K., 2000. Mixed MNL models for discrete response. Journal of Applied Econometrics 15 (5), 447–470.McFadden, D., Train, K., Tye, W.B., 1977. An application of diagnostics tests for the independence from irrelevant alternatives property of the multinomial
logit model. Transportation Research Record 637, 39–46.Mclachlan, G.J., Krishnan, T., 1997. The EM Algorithm and Extensions. John Wiley & Sons, New York.Messer, W.F., Emery, D.R., 1980. Some cautionary notes on the use of conjoint measurement for human judgement modelling. Decision Sciences 11, 678–
690.Meister, K., Frick, M., Axhausen, K.W., 2005. A GA-based household scheduler. Transportation 32 (5), 473–494.Molin, E.J.E., Oppewal, H., Timmermans, H.J.P., 1997. Modeling group preferences using a decompositional preference approach. Group Decision and
Negotiation 6, 339–350.Molin, E.J.E., Oppewal, H., Timmermans, H.J.P., 2000. A comparison of full profile and hierarchical information conjoint methods in modeling group
preferences. Marketing Letters 11, 165–172.Munsinger, G.M., Weber, J.E., Hansen, R.W., 1975. Joint home purchasing decisions by husbands and wives. Journal of Consumer Research 1, 60–66.Olshavsky, R.W., 1979. Task complexity and contingent processing in decision making: a replication and extension. Organizational Behavior and Human
Performance 24, 300–316.Payne, J., 1976. Task complexity and contingent processing in decision making: an information search and protocol analysis. Organizational Behavior and
Human Performance 16, 366–387.Payne, J., Bettman, J., Johnson, E., 1988. Adaptive strategy in decision making. Journal of Experimental Psychology: Learning, Memory and Cognition 14, 534–
552.Payne, J., Bettman, J., Johnson, E., 1993. The Adaptive Decision Maker. Cambridge University Press, New York.

250 J. Zhang et al. / Transportation Research Part B 43 (2009) 230–250
Rich, J.H., 2001. Modeling two-worker households. In: Paper Presented at the Ninth International Association for Travel Behaviour Conference, Gold Coast,Queensland, Australia, July 2–7.
Rose, J., Hensher, D.A., 2004. Modeling agent interdependency in group decision making. Transportation Research Part E 40, 63–79.Sheth, J.N., 1974. Models of Buying Behavior. Harper and Row, New York.Srinivasan, K.K., Athuru, S.R., 2005. Analysis of within-household effects and between-household differences in maintenance activity allocation.
Transportation 32 (5), 495–521.Srinivasan, S., Bhat, C.R., 2005. Modeling household interactions in daily in-home and out-of-home maintenance activity participation. Transportation 32
(5), 523–544.Sugie, Y., Zhang, J., Fujiwara, A., 1999. Dynamic discrete choice models considering unobserved heterogeneity with mass point approach. Journal of the
Eastern Asia Society for Transportation Studies 3 (5), 245–260.Swait, J., 2001. Choice set generation within the generalized extreme value family of discrete choice models. Transportation Research Part B 35 (7), 643–666.Swait, J., Adamowicz, W., van Bueren, M., 2004. Choice and temporal welfare impacts: incorporating history into discrete choice models. Journal of
Environmental Economics and Management 47, 94–116.Swait, J., Sweeney, J.C., 2000. Perceived value and its impact on choice behaviour in a retail setting. Journal of Retailing and Consumer Services 7 (2), 77–88.Thorndike, R.L., 1938. On what type of task will a group do well? Journal of Abnormal and Social Psychology 33, 409–413.Timmermans, H.J.P., 2006. Analyses and models of household decision making processes. In: Resource Paper for the Workshop ‘‘Group Behavior” at the 11th
International Conference on Travel Behaviour Research, Kyoto, Japan, August 16–20.Timmermans, H.J.P., Borgers, A., van Dijk, J., Oppewal, H., 1992. Residential choice behaviour of dual-earner households: a decompositional joint choice
model. Environment and Planning A 24, 517–533.Vovsha, P., Petersen, E., Donnelly, R., 2003. Explicit modeling of joint travel by household members: statistical evidence and applied research. In: Papers
Presented at the 82nd Annual Meeting of Transportation Research Board, Washington DC.Vovsha, P., Petersen, E., Donnelly, R., 2004a. A model for allocation of maintenance activities to the household members. In: Papers Presented at the 83rd
Annual Meeting of Transportation Research Board, Washington DC.Vovsha, P., Petersen, E., Donnelly, R., 2004b. Impact of intra-household interaction on individual daily activity–travel patterns. In: Papers Presented at the
83rd Annual Meeting of Transportation Research Board, Washington DC.Vovsha, P., Gliebe, J., Petersen, E., Koppelman, F., 2004c. Sequential and simultaneous choice structures for modeling intra-household interactions in
regional travel models. In: Timmermans, H.J.P. (Ed.), Progress in Activity-Based Analysis. Elsevier, pp. 223–257.Wen, C.H., Koppelman, F.S., 1999. An integrated model system of stop generation and tour formation for the analysis of activity and travel patterns. In: Paper
Presented at the 78th Annual Meeting of Transportation Research Board, Washington, DC.Wen, C.H., Koppelman, F.S., 2001. The generalized nested logit model. Transportation Research Part B 35 (7), 627–641.Wilson, E.J., Lilien, G.L., Wilson, D.T., 1989. Formal models of group choice in organizational buying: toward a contingency paradigm. Advances in Consumer
Research 16 (1), 548–554.Zenor, M.J., Srivastava, R., 1993. Inferring market structure with aggregate data: a latent segment logit approach. Journal of Marking Research 30, 369–379.Zhang, J., Fujiwara, A., 2006. Representing household time allocation behavior by endogenously incorporating diverse intra-household interactions: a case
study in the context of elderly couples. Transportation Research Part B 40 (1), 54–74.Zhang, J., Timmermans, H.J.P., Borgers, A., 2002. A utility-maximizing model of household time use for independent, shared and allocated activities
incorporating group decision mechanisms. Transportation Research Record 1807, 1–8.Zhang, J., Timmermans, H.J.P., Borgers, A., 2003. Comparative analysis of married couples’ task and time allocation behaviour on weekdays vs. weekends. In:
Paper Presented at the 84th Annual Meeting of Transportation Research Board, Washington DC.Zhang, J., Timmermans, H.J.P., Borgers, A., Wang, D., 2004a. Modeling traveler choice behaviour using the concepts of relative utility and relative interest.
Transportation Research Part B 38 (3), 215–234.Zhang, J., Timmermans, H.J.P., Borgers, A., 2004b. Model structure kernel for household task and time allocation incorporating household interaction and
inter-activity dependency. In: Papers Presented at the 83rd Annual Meeting of Transportation Research Board, Washington DC, January, pp. 11–15.Zhang, J., Fujiwara, A., Timmermans, H.J.P., Borgers, A., 2005a. An empirical comparison of alternative models of household time allocation. In: Timmermans,
H.J.P. (Ed.), Progress in Activity-Based Analysis. Elsevier, pp. 259–283.Zhang, J., Timmermans, H.J.P., Borgers, A., 2005b. A model of household task allocation and time use. Transportation Research Part B 39, 81–95.