Are self-description scales better than agree/disagree scales?
Copyright copy 2011 by the author(s) Published here under license by the Resilience AllianceKuhn A J Copeland J Cooley H Vogel K Taylor D Nacci and P August 2011 Modeling habitatassociations for the Common Loon (Gavia immer) at multiple scales in northeastern North America AvianConservation and Ecology 6(1) 4 [online] URL httpwwwace-ecoorgvol6iss1art4httpdxdoiorg105751ACE-00451-060104
Research PapersModeling Habitat Associations for the Common Loon (Gavia immer) atMultiple Scales in Northeastern North AmericaModeacutelisation des relations du Plongeon huard (Gavia immer) aveclrsquohabitat agrave diffeacuterentes eacutechelles dans le nord-est de lrsquoAmeacuterique du Nord
Anne Kuhn 1 Jane Copeland 2 John Cooley 3 Harry Vogel 3 Kate Taylor 4 Diane Nacci 1 and Peter August 5
ABSTRACT Common Loon (Gavia immer) is considered an emblematic and ecologically importantexample of aquatic-dependent wildlife in North America The northern breeding range of Common Loonhas contracted over the last century as a result of habitat degradation from human disturbance and lakeshoredevelopment We focused on the state of New Hampshire USA where a long-term monitoring programconducted by the Loon Preservation Committee has been collecting biological data on Common Loon since1976 The Common Loon population in New Hampshire is distributed throughout the state across a widerange of lake-specific habitats water quality conditions and levels of human disturbance We used amultiscale approach to evaluate the association of Common Loon and breeding habitat within three naturalphysiographic ecoregions of New Hampshire These multiple scales reflect Common Loon-specific extentssuch as territories home ranges and lake-landscape influences We developed ecoregional multiscalemodels and compared them to single-scale models to evaluate model performance in distinguishingCommon Loon breeding habitat Based on information-theoretic criteria there is empirical support forboth multiscale and single-scale models across all three ecoregions warranting a model-averaging approachOur results suggest that the Common Loon responds to both ecological and anthropogenic factors at multiplescales when selecting breeding sites These multiscale models can be used to identify and prioritize theconservation of preferred nesting habitat for Common Loon populations
REacuteSUMEacute Le Plongeon huard (Gavia immer) est consideacutereacute comme un repreacutesentant embleacutematique eteacutecologiquement important de la faune deacutependante du milieu aquatique en Ameacuterique du Nord Lrsquoaire dereproduction du Plongeon huard a subi une contraction depuis le siegravecle passeacute en raison de la deacutegradationde son habitat conseacutecutive au deacuterangement humain et agrave lrsquoaugmentation de lrsquooccupation humaine sur lesbords de lacs Nous avons choisi le cas du New Hampshire Eacute-U car il y existe un programme de suivi agravelong terme effectueacute par le Loon Preservation Committee qui collige les donneacutees biologiques sur lrsquoespegravecedepuis 1976 La population du Plongeon huard est reacutepartie partout dans cet Eacutetat selon une grande varieacuteteacutede milieux lacustres de conditions de qualiteacute drsquoeau et de degreacutes de deacuterangement humain Nous avons utiliseacuteune approche multi-eacutechelles afin drsquoeacutevaluer la relation entre le Plongeon huard et son habitat de nidificationdans trois eacutecoreacutegions physiographiques naturelles au New Hampshire Ces diffeacuterentes eacutechelles reflegravetentdrsquoautres caracteacuteristiques relatives au Plongeon huard comme les territoires les domaines vitaux et lesinfluences lac-paysage Nous avons eacutelaboreacute des modegraveles multi-eacutechelles eacutecoreacutegionaux et les avons compareacutesagrave des modegraveles tenant compte drsquoune seule eacutechelle pour eacutevaluer leur performance agrave distinguer correctementlrsquohabitat de nidification du Plongeon huard Drsquoapregraves les critegraveres de la theacuteorie de lrsquoinformation lesobservations empiriques soutiennent les modegraveles multi-eacutechelles tout comme les modegraveles agrave une seule eacutechelledans les trois eacutecoreacutegions reacutesultat qui justifie une approche fondeacutee sur la moyenne des modegraveles Nos reacutesultats
1US Environmental Protection Agency Atlantic Ecology Division 2SRAInternational Inc 3The Loon Preservation Committee 4BioDiversityResearch Institute 5University of Rhode Island Department of NaturalResources Coastal Institute in Kingston
Avian Conservation and Ecology 6(1) 4httpwwwace-ecoorgvol6iss1art4
laissent croire qursquoau moment de seacutelectionner son site de nidification le Plongeon huard reacuteagit tout autantaux facteurs eacutecologiques qursquoaux facteurs anthropiques agrave diffeacuterentes eacutechelles Il est possible drsquoutiliser cesmodegraveles multi-eacutechelles pour deacuteterminer lrsquohabitat de nidification de preacutedilection des populations de Plongeonhuard et pour en prioriser la conservation
Key Words ecoregion Gavia immer human disturbance lake water quality landscape context multiscalelandscape habitat models
INTRODUCTION
Habitat loss and alteration have been identified asmajor causes of endangerment for many speciesworldwide (Stein and Flack 1997 Wilcove et al1998 Johnson 2007) Wildlife habitat models areimportant management tools for predicting speciespresence and identifying suitable habitat to informconservation decisions and priorities (Scott et al2002 Austin 2007 Strauss and Biedermann 2007)The integration of landscape and wildlife ecologyhas led to considerable research focused ondescribing the influence of landscape pattern onwildlife and how these relationships vary with scale(Thompson and McGarigal 2002 Edwards et al2003 Wu 2004 Turner 2005 Li et al 2006) Muchof this research has resulted in a more organism-centered perspective allowing the focal species todefine the scale of analysis (Garshellis 2000 Meyeret al 2002 Thompson and McGarigal 2002)Recognizing that there is no single correct spatialscale at which to describe species-habitatrelationships multiscale approaches provideimportant information about how landscape-scaleprocesses influence observed species distributionpatterns (Wiens 1989 Riitters et al 1997 Graf etal 2005)
In avian ecology hierarchical patterns andprocesses are generally believed to be common inboth habitats and bird responses to habitats(Gutzwiller and Anderson 1987 Saab 1999Cushman and McGarigal 2002 2004 Luck 2002Kristan and Scott 2006 Lawler and Edwards 2006)A hierarchical approach is warranted andrecommended for developing evaluating andimplementing conservation plans for avian speciesto provide a broader understanding of avian-habitatassociations within a landscape context (Saab 1999Freemark et al 2002 Earnst et al 2006 Thogmartinand Knutson 2007)
Multiscale habitat association studies evaluated ata landscape scale are typically correlative wherebyhabitat preferences are inferred by comparingoccupied or ldquouserdquo sites with randomly selectedunoccupied or ldquononuserdquo sites across a wide rangeof spatial scales varying from individual nest sitesto habitat selection across a heterogeneouslandscape The goal of many multiscale habitatstudies is to determine how multiple scales ofvariation combine to produce the observed patternsof species distribution and abundance (Penhollowand Stauffer 2000 Driscoll et al 2005 Trocki andPaton 2006) Scale-dependent habitat associationsand avian responses to scale-dependent patterns intheir habitat need to be accurately represented inhabitat models to enhance the ecological relevanceof these models for management and conservationapplications (Graf et al 2005 Turner 2005 Kristan2006 Li et al 2006 Deppe and Rotenberry 2008Nocera et al 2008)
A number of multiscale habitat studies haveemphasized the need to address the hierarchicalstructure of habitat variables that are componentsof other variables in a nested hierarchy (Goldstein2003 Battin and Lawler 2006 Kristan and Scott2006 Lawler and Edwards 2006) Kristan (2006)describes two ways in which multiple scales ofvariation in the environment could result inhierarchical structure in avian-habitat associationshierarchical structure in habitat and hierarchicalresponses by birds to multiple scales of variation inhabitat It is generally thought that when there ishierarchical structure in habitat variables bird-habitat associations will reflect this hierarchicalstructure and habitat models must correctlyrepresent the avian habitat selection process(Kristan 2006) The scales at which avianpopulation studies are conducted can be generallydivided into local landscape and regional howeverthey should be ecologically relevant to the focalspecies
Avian Conservation and Ecology 6(1) 4httpwwwace-ecoorgvol6iss1art4
Common Loon (Gavia immer) hereafter loonbreeds on freshwater lakes in Iceland Greenlandand across Canada and the northern United Statesfrom early spring through autumn Common Loonwinters along both the Atlantic and Pacific coastsbefore returning each spring to its natal breedinglakes soon after ice-out Loons are consideredhabitat specialists during the breeding season (Evers2007) They prefer relatively large lakes containingboth shallow and deep-water areas Loons are visualpredators and feed mostly on fish but also onamphibians and invertebrates Water clarity is animportant component of breeding habitat selectionand loons typically prefer lakes with at least 3ndash4 mvisibility (Vermeer 1973 McIntyre 1983 1988Blair 1992)
Anthropogenic disturbances that affect loons on thebreeding lakes include habitat degradation fromshoreline development encroachment of buildingson traditional nesting sites decreased water clarityfrom erosion and surface runoff nutrientenrichment increased predator densities changesin fish species composition and increased humanrecreational activity (Titus and VanDruff 1981Heimberger et al 1983 Jung 1991 Newbrey et al2005 Desorbo et al 2007 Found et al 2008) Lakeacidification accidental ingestion of lead fishingtackle and bioaccumulation of environmentalcontaminants such as methylmercury are othersignificant stressors threatening loon productivityand overall fitness (Barr 1986 Alvo et al 1988Meyer et al 1998 Burgess et al 2005 Kamman etal 2005 Evers et al 2008) Common Loon iscurrently listed as a threatened species in NewHampshire and Michigan and is a species of specialconcern in Connecticut Idaho MassachusettsMontana New York Washington and Wisconsin(Evers 2007) A conservative estimate of the adultloon population in the northeastern United States isroughly 5250 individuals based on a 5-yr averagefrom 2004 to 2008 (Northeast Loon Study WorkingGroup 2008 Fig 1)
Historical records indicate that throughoutnortheastern North America there has been a 50reduction in loon populations from the early 1900sto the 1970s (McIntyre and Barr 1997) In NewEngland loon populations declined 35ndash75between 1965 and 1985 (Rimmer 1992 McIntyreand Barr 1997) A northward breeding rangecontraction has also been documented within thelast 100ndash150 yr suggesting that loons may befinding less suitable habitat than previously existed
(McIntyre 1988 McIntyre and Barr 1997) The NewHampshire Loon Preservation Committee (LPC)was formed in 1975 as a result of concerns aboutdeclines in the presence and productivity ofCommon Loon in the state The LPC comprises anetwork of biologists and volunteers that have beenmonitoring loon populations and managing theirrecovery within the state of New Hampshire for gt30 yr (Loon Preservation Committee 2005)
From the 1970s to 2000s New Hampshire had thelargest growth in human population of any state inthe nine-state US Northeast region From 1990 to2004 the population growth rate was 172 twicethat of the rest of New England (Society for theProtection of New Hampshire Forests 2005) Thehuman population of New Hampshire is expectedto grow by 358000 residents between 2000 and2025 an increase of gt 28 (Society for Protectionof New Hampshire Forests 2005) The fastest rateof population change is projected to occur in theLakes Region where a significant portion of theloon population of New Hampshire resides duringbreeding season These projected populationgrowth estimates for New Hampshire highlight theurgency of targeting breeding habitat of theCommon Loon for conservation and protection
Our primary objective was to develop predictivebreeding habitat suitability models for CommonLoon populations in New Hampshire that includemetrics of anthropogenic change and influence asexplanatory factors We hypothesized that the loonis using both ecological and anthropogenic cueswhen selecting breeding habitat Our secondobjective was to assess the effects of scale on habitatassociations for breeding loon populations and tocompare efficacies of single-scale and multiscalehabitat models for describing loon distributions
METHODS
Study area
Demographic data for Common Loon in NewHampshire have been collected by the NewHampshire LPC during the breeding season (Maythrough August) each year since 1976 Fieldbiologists follow a standardized data collectionprotocol (Taylor and Vogel 2000 LoonPreservation Committee 2004) to document loonpresence and abundance nesting and brooding sitesnesting attempts nest site and type and nest success
Avian Conservation and Ecology 6(1) 4httpwwwace-ecoorgvol6iss1art4
Fig 1 Average number of adult Common Loon in the northeastern United States from 2004 to 2008Data sources New York Adirondack Center for Loon Conservation (httpwwwbriloonorgscience-andconservationcentersadirondackloonsphp) Vermont Center for Ecostudies (2007 breeding status ofCommon Loon in Vermont httpwwwvtecostudiesorgPDFLoonreport0720finalpdf) NewHampshire Loon Preservation Committee Maine Audubon Society (The Maine Loon Project httpwwwmaineaudubonorgconserveloonindexshtml) and Massachusetts Department of Conservationand Recreation (httpwwwmassgovdcrindexhtm)
and failure The LPC monitoring program involvesa complete annual census of the entire breeding loonpopulation in the state of New Hampshire includingpresence and absence of loons on gt 750 lakes (Fig2)
Habitat water quality data were obtained from theNew Hampshire Department of EnvironmentalServices (DES) state-wide water quality programthat includes 775 lakes (New HampshireDepartment of Environmental Services 2005)There are three main physiographic ecoregions inNew Hampshire (42deg40rsquondashdeg18rsquo N 70deg37rsquondash72deg W)based on broad geological climatic and landformcharacteristics ecoregion 1 Northern WhiteMountain ecoregion 2 New Hampshire-VermontUpland and ecoregion 3 Southern New EnglandCoastal Hills and Plain (Sperduto and Nichols 2004Fig 2) The LPC uses these ecoregions along withan estimated maximum loon dispersal distance of
20 km (Evers 2001) to divide the New HampshireCommon Loon population into subpopulations formanagement purposes
We used these three physiographic classificationsas the broadest scale for analysis with increasinglyfiner scales within each of the ecoregions Multiplescales reflecting loon-specific ecologically relevantextents such as Common Loon territories homeranges and lake-landscape influences within eachof these ecoregions were chosen for our assessmentMultiscale habitat models were developed using theoccurrence (presence and absence) of breedingCommon Loon on lakes within each of theecoregions (Table 1) Analyses were nested withinthe three physiographic ecoregions with eachecoregion spanning gt 160 km from north to southand ranging from approximately 40ndash60 km east towest (Table 1 Fig 2)
Avian Conservation and Ecology 6(1) 4httpwwwace-ecoorgvol6iss1art4
Fig 2 Land cover map for the State of New Hampshire indicating ecological sections (ecoregions) thedistribution of lakes and Common Loon nest site locations
Spatial scales
Spatial scale is described by grain size and spatialextent (Wiens 1989 2002) Grain is the resolutionor minimum mapping unit of the data whereasextent is the size of a mapped area Grain and extenthave ecological relevance for organisms forexample the smallest size of habitat element that aspecies can resolve (Freemark et al 2002) We useda lake-landscape context to characterize the spatialstructure of lake variation by varying the spatialextent surrounding each lake from local to regionalscale (Soranno et al 2009) We examined fourbiologically relevant spatial scales within eachecoregion catchment scale riparian scale foragingscale and nesting scale Catchment scale includesthe landscape features influencing habitat and waterquality within 500 m of a lake Riparian scalemeasures landscape features within 150 m of thelake shoreline (Johnston and Shmagin 2006 Martinand Soranno 2006 Fraterrigo and Downing 2008)Loon home range is limited to the breeding territory
with mean size ranging from 6ndash8 ha to up to 200 ha(Meyer and Woodford 1996 McIntyre and Barr1997) depending on lake size territory type (wholepartial or multiple lakes) and number of loon pairson larger lakes The foraging scale or estimatedhome range of breeding loons encompassed habitatfeatures within a 500-m radius of the nest location(approximately 78 ha) The finest scale the nestingscale or breeding territory measures habitat withina 150-m radius of the nest location (approximately7 ha Fig 3) This distance was chosen becauseprevious research demonstrated a negativerelationship in chick survival with presence oflakeshore cottage development within 150 m ofCommon Loon nest sites (Heimberger et al 1983Strong and Bissonette 1989) Features from each ofthese four scales were measured on lakes where loonoccurrence has been monitored regularly
Common Loon nest site locations were recorded inthe field using GPS units with accuracy of at least10 m and mapped in GIS using ArcInfo version 91
Avian Conservation and Ecology 6(1) 4httpwwwace-ecoorgvol6iss1art4
Table 1 Monitored frequency of occurrence of breeding Common Loon in three New Hampshirephysiographic ecoregions
Territorial Common Loon
Ecoregion Number of lakes monitored Present Absent
1 Northern White Mountain 59 44 15
2 New Hampshire-Vermont Upland 130 58 72
3 Southern New England Coastal Hills and Plain 133 79 54
Statewide combined multiscale model 322 181 141
software (Environmental Systems ResearchInstitute 2009)
Environmental variables
Based on discussions with Common Loon fieldexperts from the LPC and on published habitatinformation a suite of environmental habitatvariables were considered for inclusion in a priorimodels to describe breeding loon habitatpreferences Twenty-one variables (Table 2) weremeasured for 322 lakes that were consistentlymonitored from 1995 through 2006 by the LPC(Table 1) The variables chosen are thought to havebiological relevance for loons by directly orindirectly influencing habitat associations andpreferences Habitat data were acquired from theNew Hampshire state GIS databases (NH GRANIThttpwwwgranitunhedu) The most recent waterquality values for each lake were obtained from theNew Hampshire DES lake monitoring program(New Hampshire Department of EnvironmentalServices 2005) The 2001 New Hampshire landcover data (30-m cell size 2001) represent 23 landcover classes that we aggregated and re-classifiedto seven land cover types following an AndersonLevel I classification system (Anderson et al 1976Table 2) The proportions of each land cover classand road data (124000 scale 2005) were assessedwithin 150- and 500-m zones around each lake
The LPC monitoring program requires a minimumof three visits to each lake during the breedingseason and repeated visits to lakes over multipleyears The large size (27ndash63 kg) and aggressive
and conspicuous territorial behavior of loons resultsin high detection probability (Hammond 2008)Therefore monitoring data were not adjusted forfalse absences (MacKenzie et al 2003 Tyre et al2003 Stauffer et al 2004 MacKenzie 2005) Non-nesting sites were randomly located on the 141 lakesthat had been monitored multiple times over at leastone decade but where loons were never observedThese verified absence lakes were at least 10 ha insize which is generally considered a minimum forCommon Loon habitat suitability (Evers 2007) Weused verified absence lakes for random non-nestingsites instead of using unoccupied portions of lakesoccupied by loons to avoid violating statisticalassumptions of independence and because of theloonrsquos highly territorial behavior during thebreeding season We developed a GIS program torandomly locate a non-nesting point along anabsence lakersquos perimeter The program allows forthe possibility that the random non-nest point maybe placed on an island shoreline (Fig 4) GISbuffering tools were then used to quantify the landcover and road density within 150- and 500-m radiisurrounding the nest and random non-nest locations(Fig 3) There was no overlap among nest or non-nest site locations for any of the radius regions
The minimum distance from the nest or non-nestpoint location to the nearest human populationcenter was computed to evaluate potential effectsof human disturbance This metric provides ameasure of a nestrsquos or non-nestrsquos proximity to high-density residential development and municipalcommunity centers (defined by New HampshireDepartment of Environmental Services 2006)Other lake-specific variables that were evaluated as
Avian Conservation and Ecology 6(1) 4httpwwwace-ecoorgvol6iss1art4
Fig 3 Maps illustrating land cover and road density within 150- and 500-m zones of each lake andwithin 150- and 500-m radii of a Common Loon nest site and a randomly chosen non-nest site Red andblue lines represent the 150- and 500-m radii areas respectively surrounding each nest and non-nestsite Purple and black lines represent the 150- and 500-m zones respectively surrounding each lake
indicators of human activity included totalphosphorus conductivity and water clarity (Table2) Each of these is associated with the culturaleutrophication of lakes (Johnston and Shmagin2006 Murtagh and Pooler 2006)
Lake occupancy appears to be spatially correlated(Piper et al 2006 Kuhn-Hines 2008) Two distancemetrics were developed to reflect this behavior onewas the distance to the closest lake and the other
was the distance to the closest lake with CommonLoon present (Table 2 Fig 5) Loons also prefernesting in quiet protective coves found alongconvoluted shorelines (Vermeer 1973 McIntyre1983 1988) Lake perimeter and lake area were usedto develop a lake shape index (shorelinedevelopment index) that describes the irregularityof the shoreline (Hutchinson 1957 Patton 1975McGarigal and Marks 1995 Meyer 2006) Lakeshape was calculated as a ratio of shore length to
Avian Conservation and Ecology 6(1) 4httpwwwace-ecoorgvol6iss1art4
Table 2 Summary of explanatory variables for breeding Common Loon presence and absence lakes acrossNew Hampshire N = 322 lakes Means were measured for the 150-m zone surrounding each lake Allvariables are included to highlight the range of variables considered during the modeling process Wemodeled only variables indicated as included at each of the four scales within each ecoregion and statewide
Mean (SD)
Habitat variable Description Presence Absence Reason for inclusionexclusion
Lake area Lake surface area excluding islands (ha) 209 (1125) 33 (34) Included loons prefer larger lakes for avariety of reasons
Lake perimeter Lake shoreline length (km) 11 (23) 4 (3) Excluded correlated with lake area
Lake shape Lake configuration and shorelinecomplexity
2 (1) 2 (1) Excluded correlated with lake area andperimeter
Maximum depth Maximum lake depth (m) 14 (11) 6 (4) Included important for fishprey habitat
Islands Number of islands per lake 4 (13) 1 (2) Included loons prefer small islands fornesting
Elevation Lake elevation (m) 296 (154) 251 (152) Included estimate of geographicspecification
Lake flushing rate Total volume of water entering a lakeper unit time (msup3yr) divided by lakevolume (msup3)
12 (43) 39 (82) Included important factor in nestsurvivorship
Water clarity Secchi depth transparency reading (m) 45 (21) 26 (12) Included loons are visual predators
Total phosphorous Organic and inorganic forms ofphosphorus (mgL)
0009(0005)
0017(0011)
Included estimate of human disturbance
pH Hydrogen ions in the water or acidity(units)
66 (04) 64 (06) Included indicator of fish habitat
Trophic status Categorical 1 = oligotrophic 5 =mesotrophic 10 = eutrophic
3 (3) 6 (3) Excluded correlated with phosphorous
Conductivity Number of ionic particles present (micromhoscm)
48 (33) 66 (53) Excluded negatively correlated with clarity
Loon distancemetrics
Distance to nearest loon presence lake(upper numbers) and distance to nearestloon absence lake (lower numbers km)
2 (24)6 (45)
5 (52)5 (42)
Included hypothesized loon dispersalfactor
Developed-residentialurban
Proportion of residential and urbandeveloped land within 150- and 500-mzones surrounding each lake and nestnon-nest site ()
3 (4) 4 (7) Included estimate of human disturbance
Agriculture Proportion of pasture hay andcultivated cropland cover within 150-and 500-m zones surrounding each lakeand nestnon-nest site ()
1 (2) 2 (3) Included estimate of human disturbance
Forested Proportion of forested land cover within150- and 500-m zones surrounding eachlake and nestnon-nest site ()
36 (13) 45 (17) Included hypothesized habitat factor
(cond)
Avian Conservation and Ecology 6(1) 4httpwwwace-ecoorgvol6iss1art4
Wetland Proportion of forested and nonforestedwetland cover within 150- and 500-mzones surrounding each lake and nestnon-nest site ()
4 (7) 10 (13) Included hypothesized habitat factor
Open water Proportion of open water with lt 25vegetation or soil within 150- and 500-mzones surrounding each lake and nestnon-nest site ()
54 (12) 35 (13) Included hypothesized habitat factor
Cleared and disturbed Proportion of cleared or disturbed landwithin 150- and 500-m zonessurrounding each lake and nestnon-nestsite ()
3 (4) 4 (6) Excluded correlated with Developed
Road density Density of roads within 150- and 500-mzones surrounding each lake and nestnon-nest site (mmsup2)
1798(1255)
2132(1759)
Included estimate of human disturbance
Minimum distance tohuman populationcenter
Minimum distance to high-densityresidential areas and municipalcommunity centers from nestnon-nestsite (km)
4 (4) 3 (3) Included estimate of human disturbance
the circumference of a circle with the same area asthe lake (Table 2) All GIS metrics were computedusing ArcInfo version 91 (Environmental SystemsResearch Institute 2009)
Single- and multiscale habitat modeldevelopment
We developed Common Loon breeding habitatsuitability index (HSI) models for each spatial scalewithin each of the ecoregions and for all lakescombined for a set of statewide models (n = 322)Prior to model development we screenedexplanatory variables within each spatial scale forstrong correlations because multicollinearity ofindependent explanatory variables can causeproblems in logistic regression models (Menard2002) Explanatory variables used to build the singleand multiscale models were checked formulticollinearity using Pearsonrsquos correlation matrixand variance inflation factors (VIFs) We includedonly covariates that were not highly correlated (| r | lt 06) and made sure that explanatory variablesdisplayed VIFs lt 10 (Graham 2003 OrsquoBrien 2007Table 2)
We used an information theoretic approach formodel development and assessment We followedthe common practice of developing a general globalmodel ie the most complex model of the set ofplausible models using logistic regression andmaximum likelihood estimation to describe loon
nesting habitat at the broadest scale (statewide) andfor each ecoregion and then creating alternativemodels as nested subsets of the global model(Burnham and Anderson 2002) For ease of modelinterpretation and application we modeled onlyadditive terms and did not consider interactionterms We then used various criteria to select themost parsimonious models based on nested subsetsof the habitat variables in the global model that wereassociated with nesting territories at each scale Themodel-fitting statistics included results frommaximum likelihood analyses such as the deviance(minus2logL) and the max-rescaled Rsup2 for each of thecompeting models (Agresti 1996 Hosmer andLemeshow 2000) Max-rescaled Rsup2 is a likelihood-based measure of the strength of associationbetween the dichotomous dependent variable (egCommon Loon nest presence) and the explanatoryvariables (Cox and Snell 1989 Estrella 1998 Heinzet al 2005)
The corrected Akaike Information Criterion forsmall sample size (AICc) was used to evaluate therelative strength of competing plausible models(Burnham and Anderson 2002) within each spatialscale within each region An information criterionestimates the amount of information lost when usinga particular model compared with other possiblemodels Better models lose less information(Burnham and Anderson 2002) AICc values canonly be used to compare models when the responsevariable data sets are exactly the same therefore itis only appropriate to compare competing models
Avian Conservation and Ecology 6(1) 4httpwwwace-ecoorgvol6iss1art4
Fig 4 Maps illustrating how using GIS route feature classes were generated along the perimeter ofeach lake so that all features of a lake including islands are treated as a single entity Along each routea randomly chosen non-nest site was located on lakes that were monitored for loons but had no loonoccurrences
within each region The model with the lowest AICc value of a set of candidate models is considered thebest approximating model ie the mostparsimonious model that achieves a balancebetween bias and variance (Burnham and Anderson2002)
The explanatory variables in the best approximatingmodels at each single spatial scale were then usedto build a multiscale habitat model (Graf et al 2005Lawler and Edwards 2006) for each ecoregion andfor a statewide multiscale model The differencebetween the AICc of a given model and theminimum AICc of the candidate set (∆iAICc) andAICc weights wi (the weight of evidence in favorof a given model relative to the set of candidatemodels) were used to rank the models within eachecoregion (Burnham and Anderson 2002 Anderson2008) When it is not clear which of the models fromthe set of candidate models is best as measured byAICc wi (ie wi gt 09 for any given model) aninformation theoretic-based model average approachis warranted In this case each of the candidatemodels with substantial empirical support (ie∆iAICc le 2) was weighted by its Akaike weight andcombined into a single averaged model by
generating weighted parameter estimates (ieparameter estimate multiplied by wi and thensummed across all models) for each parametermaking an ldquoaveragedrdquo prediction from thecombined model (Burnham and Anderson 2002Hollister et al 2008) Parameter estimates obtainedby model averaging reduce model selection bias andaccount for model selection uncertainty (Johnsonand Omland 2004)
We used odds ratios to examine the magnitude ofthe effect of an explanatory variable on theprobability of Common Loon nest presence at fixedvalues of other variables The odds ratio representsthe change in odds of observing loon nest presencefor a unit change in the explanatory variable Theodds ratio of an explanatory variable is calculatedas e(b times unit change) where b is the parameterrsquoscoefficient in the multivariable model and the testof whether b gt 0 is equivalent to testing whether theconfidence interval of the odds ratio crosses 10(Earnst et al 2006)
Once the most parsimonious models for each dataset were chosen we used classification tables toassess the accuracy of habitat models (Fielding and
Avian Conservation and Ecology 6(1) 4httpwwwace-ecoorgvol6iss1art4
Fig 5 Development of minimum Euclidian distance measured from the edge of a lake to the edge of thenearest lake with and without loons using GIS
Bell 1997) The area under the curve statistic (AUC)was derived from the receiver operatingcharacteristics (ROC) curve and was calculated foreach model as an additional measure of modelperformance AUC values range from 05 (scoresfor presenceabsence do not differ poor classifier)to 10 (complete distinction of presence fromabsence perfect classifier) For example an AUCof 088 means that a randomly chosen case from thepresence group will have a greater classifier scorethan a random selection from the absence group witha probability of 088 (Fielding and Bell 1997 Grafet al 2005 Hames et al 2006)
Residual analyses of the final fitted models wereused to test for spatial autocorrelation using theMoranrsquos Index method (Moran 1950 Fortin andDale 2005) The Pearson residuals from the fittedprobability (HSI) for each lake and its geographiccoordinates were used to assess spatialautocorrelation in the final models Statisticalanalyses were performed using the softwarepackages SAS 91 (SAS Institute Inc 2003) SPSS120 (SPSS Inc 1999) and GS+ Geostatistics forEnvironmental Sciences (Gamma Design Software2001)
RESULTS
Comparing general summary statistics for CommonLoon presence and absence at lakes across the entirestate of New Hampshire highlighted variablesassociated with loon habitat preferences (Table 2)Loons were found on lakes that were larger deeperand clearer with more islands and shorelineperimeter closer to nearby lakes inhabited by otherloons Loons also selected lakes with reducedconductivity and total phosphorus higher pH athigher elevations with lower flushing rates andfurther away from human community centers Landcover within the 150-m zone surrounding each lakewith loon nests was less developed and cleared hadlower road density less agricultural land forest andwetland and contained more open water comparedto the land cover surrounding the random non-nestsite locations (Table 2)
Ecoregional models
The three physiographic ecoregions of NewHampshire differed in landscape composition for anumber of the measured habitat types Most notably
Avian Conservation and Ecology 6(1) 4httpwwwace-ecoorgvol6iss1art4
there was a higher proportion of human-alteredlandscape in the two ecoregions south of the WhiteMountains (ecoregions 2 and 3 Fig 6) These twosouthern ecoregions have lakes surrounded bygreater areas of developed land and higher roaddensity with higher measured values forconductivity and total phosphorous and closer tohuman population centers (high-density residentialareas and municipal community centers Table 3Fig 6) Lakes in the Northern White Mountainecoregion are found at higher elevations on averagewith greater areas of surrounding forested andwetland habitat far from human population centersThe southwestern ecoregion New Hampshire-Vermont Upland has greater areas of agriculturalland and smaller lakes on average distinguishingthis ecoregion from the other two The southeasternecoregion Southern New England Coastal Hills andPlain has more open water surrounding the lakeslarger and deeper lakes with more shorelineperimeter and more islands per lake on averagecompared to the two other ecoregions (Table 3)
The best approximating model designation withineach data set has the highest AICc weight highestmax-rescaled Rsup2 and highest AUC classificationvalue For ecoregions 1 and 3 the multiscale modelshad the highest AICc weights and highest max-rescaled Rsup2 values compared to each of the singlescale models within each respective ecoregionsuggesting that breeding habitat selection by loonsis occurring at multiple scales It is important to notethat in the Northern White Mountain ecoregion(ecoregion 1) all five models (the four single-scalemodels and the multiscale model) have substantialempirical support (ie ∆iAICc le 2) warranting amultimodel inference or model averaging approachespecially when a particular parameter (ie lakesize) occurs in many of the candidate models(Burnham and Anderson 2002) This is also relevantfor the models in the Southern New England CoastalHills and Plain ecoregion (ecoregion 3) where allfour of the single-scale models have manyparameters in common Therefore model averagingwas performed for all of the candidate models inecoregion 1 and for the two highest ranking modelsin ecoregion 3 by weighting each model by itsAkaike weight and combining into a compositeaveraged model for each of these ecoregions (Tables4 and 5 respectively)
In ecoregion 2 (New Hampshire-Vermont Upland)the best approximating model was the modelmeasured at the catchment scale (landscape features
within 500 m of a lake) However the multiscalemodel also had substantial empirical support Thusmodel averaging was performed with these twomodels to produce a composite averaged model forecoregion 2 (Table 6)
Statewide models
The statewide models had a number of habitatcharacteristics in common describing breeding loonpreferences at each scale positive associations withdistance to human population centers water clarityelevation and lake size and negative associationswith road density and distance to nearby lakes withloon presence The most parsimonious and bestapproximating model was the single riparian-scalemodel developed with environmental variablesmeasured within the 150-m zone of the lake (model22 Table 7) This model describes loon preferencesfor clearer lakes nearby other lakes with loons athigher elevations with less surrounding roaddensity and further from human population centersNotably this was the only model within thestatewide model set that contained the explanatoryvariable islands and the only model with substantialempirical support based on information-theoreticstatistics (∆AICc le 2 Burnham and Anderson 2002)
It is important to note that all of the final modelsacross all three ecoregions including the statewidemodels achieved a high level of overall accuracybased on AUC values which ranged from 0914 to0989 indicating that all of these models predictloon nest presence fairly well The residuals of thebest approximating single-scale and multiscalemodels showed no significant spatial correlationbased on the Moranrsquos Index scores Given the weakspatial dependence of the residuals we did notfurther investigate spatial autocorrelation
DISCUSSION
General habitat suitability model for CommonLoon
Based on information-theoretic statistics the bestapproximating model among the statewide modelsis the single lake scale model describing theenvironment immediately surrounding the lakewithin a 150-m riparian buffer zone Overall optimalbreeding habitat for Common Loon across NewHampshire was identified as having the following
Avian Conservation and Ecology 6(1) 4httpwwwace-ecoorgvol6iss1art4
Fig 6 Proportion of developed land cover composition within 150- and 500-m zones surrounding lakeswithin each ecoregion Blue diamond = 25 quartile red square = minimum value green triangle =median value purple x = maximum value blue star = 75 quartile
Avian Conservation and Ecology 6(1) 4httpwwwace-ecoorgvol6iss1art4
Table 3 Summary of lake habitat for the three ecoregions for selected explanatory variables Means includeboth Common Loon nest presence and absence lakes
Habitat Variable Ecoregion Mean SE Min Max
Lake area (ha) 123
13796303
019010012
101012
32621819
20128
Lake perimeter (km) 123
131842
013007008
019048015
257048710
3019995
Lake maximum depth (m) 123
10195121
142080087
131115
497555549
Islands (numberlake) 123
214
093025121
000
5117128
Elevation (m) 123
465330145
594289207
1551135
728722601
Lake flushing rate (number of turnoversyr) 123
213100341
772277
030202
267176504
Water Clarity Secchi depth(m) 123
313841
022020018
090809
97116102
Total phosphorous (mgL) 123
001200120012
lt00010001
lt0001
000300010001
003800590052
Conductivity (micromhoscm) 123
339248216905
271299477
151016511664
112601827030600
Distance to loon lake (km) 123
253236
035026046
001001001
136174287
Distance to community center (km) 123
852529
075002023
001001001
24266213
Avian Conservation and Ecology 6(1) 4httpwwwace-ecoorgvol6iss1art4
Table 4 Summary of results for ecoregion 1 (Northern White Mountain) habitat models with their associatedAkaike weights N = 59 lakes Models with empirical support ie ∆iAICc le 2 are indicated in bold
Model Scale Rsup2 Kdagger Log likelihood AICc ∆iAICc Weightwi
AUC
2 Multiscale 087 3 minus668 1980 lt 0001 02444 0989
5 Foraging 073 2 minus786 1993 014 02281 0968
3 Catchment 072 2 minus820 2061 081 01627 0951
4 Riparian 072 2 minus826 2074 094 01526 0952
6 Nesting 150-m radius 076 2 minus846 2114 134 01249 0959
1 Global model 086 5 minus536 2185 206 00874 0988
Explanatory variables for each fitted modelDagger
2 Multiscale lake size (+) open water 500N (+)
5 Foraging open water 500N (+)
3 Catchment lake size (+)
4 Riparian lake size (+)
6 Nesting 150-m radius lake size (+)
1 Global model elevation (+) lake size (+) clarity (+) open water 500N (+)
Composite model Nest presence = minus8655 + 3127 (lake size) + 1570 (open water 500N)
daggerK indicates the total number of parameters ie the intercept and explanatory variablesDagger(+) = positive association (minus) = negative association L = lake scale N = nest scale
characteristics clear higher elevation lakes withislands further away from human populationcenters with lower surrounding road densities andwith nearby lakes occupied by other loons Waterclarity has long been associated with loon habitatpreference and our results are consistent withprevious studies (Vermeer 1973 McIntyre 19831988 Blair 1992 Meyer 2006) The significance ofthe minimum-distance-to-nearest-lake-with-loon-presence metric supports anecdotal observationsand published research describing loon nataldispersal This biotic interaction metric describesthe philopatric and conspecific attraction loonsdisplay and reveals the importance of the spatial
configuration of lakes in the selection of loonbreeding habitat (Strong et al 1987 Evers 2001Piper et al 2006 2008)
The unique habitat feature that distinguishes the bestmodel among the statewide models is theexplanatory variable islands which indicates high-quality breeding habitat for loons (Vermeer 1973Jung 1991 McIntyre and Barr 1997 Piper et al2006 Evers 2007) Based on odds ratio estimatesislands and lake clarity were the most importantfactors distinguishing loon breeding habitat for thestatewide data set (Table 8) The best statewidemodel also describes loon preferences for open
Avian Conservation and Ecology 6(1) 4httpwwwace-ecoorgvol6iss1art4
Table 5 Summary of results for ecoregion 3 (Southern New England Coastal Hills and Plain) habitatmodels with their associated Akaike weights N = 133 lakes Models with empirical support ie ∆iAICc le 2 are indicated in bold
Model Scale Rsup2 Kdagger Loglikelihood
AICc ∆iAICc Weight wi AUC
14 Multiscale 072 6 minus3284 7835 lt 0001 04282 0940
18 Nesting 069 4 minus3530 7892 057 03220 0931
15 Catchment 066 5 minus3565 8178 343 00772 0931
16 Riparian 066 5 minus3565 8178 343 00772 0931
17 Foraging 066 5 minus3565 8178 343 00772 0931
13 Globalmodel
075 11 minus3025 8467 632 00181 0949
Explanatory variables for each fitted modelDagger
14 Multiscale lake size (+) elevation (+) clarity (+) distance to loon (minus) phosphorous (minus)
18 Nesting elevation (+) lake size (+) phosphorous (minus)
15 Catchment distance to loon (minus) elevation (+) lake size (+) clarity (+)
16 Riparian distance to loon (minus) elevation (+) lake size (+) clarity (+)
17 Foraging distance to loon (minus) elevation (+) lake size (+) clarity (+)
13 Globalmodel
developed 150L (minus) open water 150L (+) road 150L (minus) islands (+) distance to loon (minus)elevation (+) lake size (+) phosphorous (minus) clarity (+) open water 500N (+)
Composite model Nest presence = minus4550 + 0006 (elevation) + 1180 (lake size) + 01714 (clarity) minus 02183 (distance toloon) minus 179503 (phosphorus)
daggerK indicates the total number of parameters ie the intercept and explanatory variablesDagger(+) = positive association (minus) = negative association L = lake scale N = nest scale
water surrounding the lake (eg hydrologicalconnectivity) Earnst et al (2006) also found thatYellow-billed Loon in northern Alaska selectbreeding habitat based on landscape-scale featuressuch as hydrological connectivity The explanatoryvariable minimum-distance-to-human-population-center was featured at every scale in the statewidemodels providing evidence that loons prefer tosituate nests on lakes further from humandisturbance A lake habitat selection study forwaterbirds in Canada also found that loons prefer
lakes that are farther from human activity or havemore forested land within a 500-m zone (Found etal 2008)
Effects of scale on Common Loon habitatassociations
Another of our objectives was to investigatewhether Common Loon selects breeding habitat atmultiple scales and to determine which scales are
Avian Conservation and Ecology 6(1) 4httpwwwace-ecoorgvol6iss1art4
Table 6 Summary of results for ecoregion 2 (New Hampshire-Vermont Upland) habitat models with theirassociated Akaike weights N = 130 lakes Models with empirical support ie ∆iAICc le 2 are indicatedin bold
Model Scale Rsup2 Kdagger Loglikelihood
AICc ∆iAICc Weight wi AUC
9 Catchment 081 8 minus2437 6593 lt 0001 06757 0971
8 Multiscale 083 10 minus2310 6806 213 02331 0973
10 Riparian 075 6 minus2872 7011 418 00834 0952
7 Globalmodel
079 11 minus2595 7613 1020 00041 0963
11 Foraging 073 7 minus3331 7930 1337 00008 0945
12 Nesting 068 7 minus3627 8745 2153 lt 000001 0930
Explanatory variables for each fitted modelDagger
9 Catchment open water 500L (+) road 500L (minus) islands (+) pH (+) elevation (+) clarity (+)agricultural 500L (minus)
8 Multiscale open water 150L (+) open water 500N (+) islands (+) clarity( +) road density 500L (minus)road density 150N (minus) distance to loon (minus) forest 150N (minus) wetland 150N (minus)
10 Riparian open water 150L (+) islands (+) distance to loon (minus) elevation (+) clarity (+)
7 Globalmodel
open water 150L (+) islands (+) distance to loon (minus) elevation (+) pH (+) clarity (+)agricultural 500L (minus) open water 500L (+) road density 500L (minus) forest 500 (minus)
11 Foraging open water 500N (+) agricultural 500N (minus) clarity (+) elevation (+) lake size (+)
12 Nesting road density 150N (minus) forest 150N (minus) wetland 150N (minus) elevation (+) lake size (+) flushingrate (minus)
Composite model Nest presence = minus22579 + 3179 (islands) + 1047 (clarity) + 0004 (elevation) + 0287 (open water150L) + 0405 (open water 500L) + 01064 (open water 500N) + 272 (pH) minus 0158 (road density 500L) minus 0362 (distanceto loon) minus 0314 (agricultural 500L) minus 0086 (forest 150N) minus 0079 (wetland 150N) minus 0065 (road density 150N)
daggerK indicates the total number of parameters ie the intercept and explanatory variablesDagger(+) = positive association (minus) = negative association L = lake scale N = nest scale
most important Using information theoreticstatistics the multiscale models for two of the threeecoregions were designated the best approximatingmodels and had substantial empirical support in allthree ecoregions Distinct differences are apparentwhen comparing models across ecoregions (Tables4 5 and 6) Loons in New Hampshire appear to be
selecting breeding habitat differently based onphysiographic ecoregion and at multiple scalesThese differences may be a reflection of theoccurrence of different environmental conditionsand ranges of variables in the three different regionsIn the Northern White Mountain ecoregion loonsare selecting breeding territories on the basis of lake
Avian Conservation and Ecology 6(1) 4httpwwwace-ecoorgvol6iss1art4
Table 7 Summary of results for New Hampshire statewide habitat models with their associated Akaikeweights N = 322 lakes Models with empirical support ie ∆iAICc le 2 are indicated in bold
Model Scale Rsup2 Kdagger Log likelihood AICc ∆iAICc Weight wi AUC
22 Riparian 065 8 minus8615 188764 000 08315 0926
21 Catchment 064 8 minus8843 193315 455 00854 0921
23 Foraging 063 7 minus8996 194269 561 00504 0919
19 Global model 070 15 minus8287 197304 854 00115 0941
24 Nesting 062 7 minus9192 198196 954 00071 0914
20 Multiscale 065 8 minus9365 203769 1501 00005 0926
Explanatory variables for each fitted modelDagger
22 Riparian open water 150L (+) elevation (+) islands (+) clarity (+) distance tohuman population (+) distance to loon (minus) road density 150L (minus)
21 Catchment distance to loon (minus) open water 500L (+) road density 500L (minus) elevation (+)lake size (+) clarity (+) distance to human population (+)
23 Foraging distance to loon (minus) open water 500N (+) elevation (+) lake size (+) clarity(+) distance to human population (+)
19 Global model open water 500L (minus) road density 500L (minus) road density 150N (minus) open water500N (+) road density 150L (minus) open water 150L (+) islands (+) distance toloon (minus) elevation (+) lake size (+) pH (+) phosphorous (minus) clarity (+)distance to human population (+)
24 Nesting distance to loon (minus) road density 150N (minus) elevation (+) lake size (+) clarity(+) distance to human population (+)
20 Multiscale distance to loon (minus) open water 500N (+) road density 150L (minus) elevation (+)lake size (+) clarity (+) distance to human population (+)
Statewide model Nest presence = minus7328 + 0115 (open water 150L) + 0001 (elevation) + 1067 (islands) + 0595 (clarity)+ 0211 (distance to human population) minus 0233 (distance to loon) minus 0033 (road density 150 L)
daggerK indicates the total number of parameters ie the intercept and explanatory variablesDagger(+) = positive association (minus) = negative association L = lake scale N = nest scale
size and the amount of open water surrounding thenest (eg island nest sites) In this ecoregion therewas no distinction between loon presence andabsence lakes based on human-altered variablessuch as road density and developed land or waterquality variables associated with human activitiesThe Northern White Mountain ecoregion has lowerroad densities surrounding the lakes and a less
human-dominated landscape in general Thereforethe loonsrsquo apparent selection based on a few lakemorphological factors may be more a reflection ofthe general environmental conditions and lack ofhuman-altered variables to select against It is alsointeresting to note that loons in this northernecoregion do not appear to be using the presence ofother loons on nearby lakes as a habitat selection
Avian Conservation and Ecology 6(1) 4httpwwwace-ecoorgvol6iss1art4
factor as is the case in the two more southerlyecoregions
The results for the Northern White Mountainecoregion suggest that prior to human alteration ofthe landscape loons may have chosen breedinghabitat based primarily on lake morphologicalfactors such as lake size and the amount of openwater surrounding the nest The catchment riparianforaging and nest scale-based models within theNorthern White Mountain ecoregion includeinformation describing the selection of loonbreeding habitat (Table 4) Three of these final fittedsingle-scale models had explanatory variables incommon (ie lake size) and were combined in themultiscale model for this ecoregion to determine thebest approximating model given the data set basedon the model probability Akaike weights wi (Table4) However using evidence ratios (Burnham andAnderson 2002) to compare the two best modelsthe best model (model 1) has only 19 times theweight of evidence relative to the second-best model(model 4) This relatively weak support for any ofthe models being the best model suggests that thesemodels are good candidates for model averaging ormultimodel inference Model averaging increasesparameter estimate precision and reduces biasassociated with model selection especially when allof the models have substantial support and areclosely related as in ecoregion 1
In the southwestern New Hampshire-VermontUpland loons appear to be avoiding human-alteredlandscapes such as those with high road density andgreater areas of agriculture (Table 6) This regionof New Hampshire contains the highest percentageof prime agricultural soils in the state and hasexperienced the highest amount of agriculturalconversion to developed land in the state over the5-yr period from 1997 to 2002 (Society for theProtection of New Hampshire Forests 2005) Withinthis ecoregion loons are selecting lakes with moreislands higher water clarity and more open watersurrounding the lakes and that are nearby otherlakes with loons present The catchment-scalemodel describing features within a 500-m zone ofthe lake best describes the data in this region (model9 Table 6) the only other model that has substantialempirical support for describing this data set is themultiscale model (model 8 Table 6) Thecatchment-scale model differs from the multiscalemodel by identifying positive associations of loonswith pH (an indicator of fishprey habitat) and lakeelevation and a negative association of loons with
agricultural land within 500 m of the lake Insteadof relying on a single best model for this ecoregionwe used model averaging to combine these twohighest ranking models to obtain robust estimatesof model parameters reduce model selection biasand account for model selection uncertainty(Johnson and Omland 2004) Based on the modelaveraged results and using odds ratios to identifyinfluential factors in this region islands pH andwater clarity appear to be the most influential habitatfeatures (Table 8)
Loons in the southeastern Southern New EnglandCoastal Hills and Plain appear to be selectingbreeding habitat similarly across all scales based ona few key elements larger lakes at increasingelevations with lower levels of phosphorous nearbyother lakes with loons (Table 5) Other studies havefound that loons avoid lakes with higherphosphorous and primary productivity (Blair 1992)which can reduce water clarity Total phosphoruswhich is associated with anthropogenic activitiesappears to be an important avoidance factor forloons selecting breeding habitat at multiple scalesbased on the multiscale and nesting-scale modelswhich are the two highest-ranking models for thisregion The two most influential factors in thisregion appear to be lake size and water clarity basedon odds ratio estimates (Table 8)
The natural arrangement of lakes in NewHampshire especially in the southeastern portionof the state (referred to as the Lakes Region) is ofparticular concern because this area has the fastestrate of human population change in NewHampshire The entire state population is projectedto grow by 358000 between 2000 and 2025 withan estimated 80 of that growth in the foursoutheastern counties of New Hampshire along theInterstate Highway 89 corridor and in the LakesRegion (Society for Protection of New HampshireForests 2005) Loons are responding to human-induced pressures on these lakes and across the stateby selecting against anthropogenic features such asroad density total phosphorous and conductivitydeveloped and agricultural lands and humanpopulation centers
CONCLUSION
Our results support the increasing evidence formultiscale habitat associations most commonlyfound in avian species (Gutzwiller and Anderson
Avian Conservation and Ecology 6(1) 4httpwwwace-ecoorgvol6iss1art4
Table 8 Model averaged parameter estimates and odds ratio estimates with confidence intervals forecoregional composite models and the statewide model These parameters constitute the final averagedmodels for each ecoregion and may be used directly to predict Common Loon nest presence regionally andthroughout the state of New Hampshire
Region Variable Theta SE Odds ratio 95 Wald confidence limits
Ecoregion 1 Northern White Mountain
Intercept minus8655 0704
Lake size 3127 0096 6935 0934 51509
Open water 500 nest 1570 0034 1482 1066 2062
Ecoregion 2 New Hampshire-Vermont Upland
Intercept minus22579 10485
Islands 3179 1120 18045 2760 117970
Clarity 1047 0349 2952 1500 5810
Elevation 0004 0002 1004 1000 1007
Open water 150 lake 0287 0136 1383 1153 1658
Open water 500 lake 0405 01145 1499 1198 1877
Open water 500 nest 01064 00485 0890 0810 0979
pH 272 10139 15195 2083 110844
Road density 500 lake minus0158 0064 0880 0789 0983
Distance to loon lake minus03619 0129 0691 0491 0971
Agricultural 500 lake minus03143 01489 0730 0545 0978
Forest 150 nest minus00856 00346 0913 0853 0977
Wetland 150 nest minus00793 00346 0920 0859 0985
Road density 150 nest minus00647 00286 0927 0877 0980
Ecoregion 3 Southern New England Coastal Hills and Plain
Intercept minus4550 0217
Elevation 0006 0001 1004 1000 1009
Lake size 1180 0158 3254 1640 6456
Clarity 01714 02835 1187 0681 2069
Distance to loon lake minus02183 0124 1000 1000 1000
Phosphorous minus179503 3190 lt 0001 lt 0001 lt 0001
(cond)
Avian Conservation and Ecology 6(1) 4httpwwwace-ecoorgvol6iss1art4
New Hampshire Statewide
Intercept minus73821 12467
Open water 150 lake 01150 00200 1122 1079 1167
Elevation 0001 0001 1001 1000 1002
Islands 10674 04210 2908 1274 6637
Clarity 05948 01503 1813 1350 2434
Distance to population center 02105 00797 1234 1056 1443
Distance to loon lake minus02331 00732 0792 0686 0914
Road density 150 lake minus00327 00148 0968 0940 0996
1987 Wiens et al 1987 Saab 1999 Meyer et al2002 Graf et al 2005 Kristan 2006 Lawler andEdwards 2006 Thogmartin 2007) The multiscalemodels within each ecoregion have substantialempirical support in describing breeding habitatsuggesting that Common Loon in New Hampshireis responding to environmental cues at scalesranging from broad catchment to finer riparian areassurrounding lakes as well as within lakes at thenesting scale Loons also appear to be selectinghabitat differently across the ecoregions based onthe varying landscape conditions they encounteracross New Hampshire This differential selectionof breeding habitat across ecoregions providesinformation for prioritizing conservation andfocusing management efforts in New HampshireConservation efforts in the northern ecoregionshould be focused on preserving the relatively lowerlevels of human activity and disturbance pressuressurrounding these northern lakes by preventingincreases in road density and construction nearlakes especially within the immediate shoreline oflarger lakes Loon conservation and managementactivities in the two southern ecoregions shouldfocus on reducing the effects of already existinghuman disturbances on water quality by mitigatingsources of phosphorous that can also directly affectclarity Other activities in these regions shouldinclude the prioritization for protection of high-quality nesting habitat such as small islands andundisturbed areas of lakes and preventingdevelopment in critical loon habitat Our resultssuggest that conservation strategies for CommonLoon should also consider environmental
influences beyond the immediate lake or riparianscale as the analysis demonstrates that loons arealso responding to landscape-level and catchment-scale conditions surrounding lakes
Responses to this article can be read online athttpwwwace-ecoorgvol6iss1art4responses
Acknowledgments
We thank the many people who share our interest inCommon Loon research and conservation Weappreciate the statistical assistance and advice ofDr James Heltshe and helpful advice fromreviewers of early drafts Drs James Lake BryanMilstead and Rick McKinney as well as that of theanonymous reviewers who contributed to the finalversion of this manuscript This is contributionnumber AED-10-048 of the Atlantic EcologyDivision National Health and EnvironmentalEffects Research Laboratory Office of Researchand Development US Environmental ProtectionAgency Although the research described in thiscontribution has been funded wholly by the USEnvironmental Protection Agency it has not beensubjected to Agency-level review Therefore it doesnot necessarily reflect the views of the AgencyMention of trade names products or services doesnot constitute endorsement or recommendation foruse
Avian Conservation and Ecology 6(1) 4httpwwwace-ecoorgvol6iss1art4
LITERATURE CITED
Agresti A 1996 An introduction to categoricaldata analysisWiley New York New York USA
Alvo R D J T Hussell and M Berrill 1988 Thebreeding success of common loons (Gavia immer)in relation to alkalinity and other lake characteristicsin Ontario Canadian Journal of Zoology 66(3)746-752
Anderson D R 2008 Model based inferences inthe life sciences a primer on evidence SpringerNew York New York USA doi101007978-0-387-74075-1
Anderson J R E E Hardy J T Roach and R EWitmer 1976 A land use and land coverclassification system for use with remote sensordata Geological Survey Professional Paper 964 US Geological Survey Washington DC USA
Austin M 2007 Species distribution models andecological theory a critical assessment and somepossible new approaches Ecological Modelling 200(1-2)1-19 doi101016jecolmodel200607005
Barr J F 1986 Population dynamics of thecommon loon associated with mercury-contaminatedwaters in northwestern Ontario Occasional PaperNumber 56 Canadian Wildlife Service OttawaCanada
Battin J and J J Lawler 2006 Cross-scalecorrelations and the design of avian-habitatselection studies Condor 10859-70 doi1016500010-5422(2006)108[0059CCATDA]20CO2
Blair R B 1992 Lake features water quality andthe summer distribution of Common Loons in NewHampshire Journal of Field Ornithology 63(1)1-9
Burgess N M D C Evers and J D Kaplan 2005Mercury and other contaminants in Common Loonsbreeding in Atlantic Canada Ecotoxicology 14(1-2)241-252 doi101007s10646-004-6271-0
Burnham K P and D R Anderson 2002 Modelselection and multimodel inference a practicalinformation-theoretic approach Second editionSpringer New York New York USA
Cox D R and E J Snell 1989 Analysis of binarydata Second edition Chapman amp Hall LondonUK
Cushman S A and K McGarigal 2002Hierarchical multi-scale decomposition of species-environment relationships Landscape Ecology 17(7)637-646 doi101023A1021571603605
Cushman S A and K McGarigal 2004Hierarchical analysis of forest bird species-environment relationships in the Oregon CoastRange Ecological Applications 14(4)1090-1105 doi10189003-5131
Deppe J L and J T Rotenberry 2008 Scale-dependent habitat use by fall migratory birdsvegetation structure floristics and geographyEcological Monographs 78(3)461-487 doi10189007-01631
Desorbo C R K M Taylor D E Kramer J FairJ H Cooley Jr D C Evers W Hanson H SVogel and J L Atwood 2007 Reproductiveadvantages for Common Loons using rafts Journalof Wildlife Management 71(4)1206-1213 doi1021932006-422
Driscoll M J L T Donovan R Mickey AHoward and K K Fleming 2005 Determinants ofwood thrush nest success a multi-scale modelselection approach Journal of Wildlife Management 69(2)699-709 doi1021930022-541X(2005)069[0699DOWTNS]20CO2
Earnst S L R Platte and L Bond 2006 Alandscape-scale model of yellow-billed loon (Gaviaadamsii) habitat preferences in northern AlaskaHydrobiologia 567(1)227-236 doi101007s10750-006-0042-2
Edwards T C Jr G G Moisen T S Frescinoand J J Lawler 2003 Modeling multipleecological scales to link landscape theory to wildlifeconservation Pages 153-172 in J A Bissonette andI Storch editors Landscape ecology and resourcemanagement linking theory with practice IslandPress Washington DC USA
Environmental Systems Research Institute 2009ArcInfo geographic information system (GIS)software Version 91 Redlands California USA
Avian Conservation and Ecology 6(1) 4httpwwwace-ecoorgvol6iss1art4
Estrella A 1998 A new measure of fit for equationswith dichotomous dependent variables Journal ofBusiness and Economic Statistics 16(2)198-205 doi1023071392575
Evers D C 2001 Common Loon populationstudies continental mercury patterns and breedingterritory philopatry Dissertation University ofMinnesota St Paul Minnesota USA
Evers D C 2007 Status assessment andconservation plan for the Common Loon (Gaviaimmer) in North America BRI Report 2007-20 US Fish and Wildlife Service Hadley MassachusettsUSA
Evers D C L J Savoy C R DeSorbo D EYates W Hanson K M Taylor L Siegel J HCooley M S Bank A Major K Munney BMower H S Vogel N Schoch M Pokras M WGoodale and J Fair 2008 Adverse effects fromenvironmental mercury loads on breeding commonloons Ecotoxicology 17(2)69-81 doi101007s10646-007-0168-7
Fielding A H and J F Bell 1997 A review ofmethods for the assessment of prediction errors inconservation presenceabsence models EnvironmentalConservation 24(1)38-49 doi101017S0376892997000088
Fortin M-J and M R T Dale 2005 Spatialanalysis a guide for ecologists CambridgeUniversity Press Cambridge UK
Found C S M Webb and M S Boyce 2008Selection of lake habitats by waterbirds in the borealtransition zone of northeastern Alberta CanadianJournal of Zoology 86(4)277-285 doi101139Z07-137
Fraterrigo J M and J A Downing 2008 Theinfluence of land use on lake nutrients varies withwatershed transport capacity Ecosystems 11(7)1021-1034 doi101007s10021-008-9176-6
Freemark K E D Bert and M A Villard 2002Patch- landscape- and regional-scale effects onbiota Pages 58-83 in K J Gutzwiller editorApplying landscape ecology in biologicalconservation Springer New York New YorkUSA
Gamma Design Software 2001 GS+ geostatisticsfor the environmental sciences PlainwellMichigan USA
Garshellis D L 2000 Delusions in habitatevaluation measuring use selection andimportance Pages 111-153 in L Boitani and T KFuller editors Research techniques in animalecology controversies and consequences ColumbiaUniversity Press New York New York USA
Goldstein H 2003 Multilevel statistical models Third edition Hodder Arnold London UK
Graf R F K Bollmann W Suter and HBugmann 2005 The importance of spatial scale inhabitat models Capercaillie in the Swiss AlpsLandscape Ecology 20(6)703-717 doi101007s10980-005-0063-7
Graham M H 2003 Confronting multicollinearityin ecological multiple regression Ecology 842809-2815 doi10189002-3114
Gutzwiller K J and S H Anderson 1987Multiscale associations between cavity-nestingbirds and features of Wyoming streamsidewoodlands Condor 89534-548 doi1023071368643
Hames R S J D Lowe S Barker Swarthout andK V Rosenberg 2006 Understanding the risk toneotropical migrant bird species of multiple human-caused stressors elucidating processes behindpatterns Ecology and Society 11(1) 24 [online]URL httpwwwecologyandsocietyorgvol11iss1art24
Hammond C A M 2008 A demographic andlandscape analysis for common loons in northwestMontana Thesis University of Montana MissoulaMontana USA [online] URL httpetdlibumteduthesesavailableetd-04242008-130448
Heimberger M D Euler and J Barr 1983 Theimpact of cottage development on Common Loonreproductive success in central Ontario WilsonBulletin 95(3)431-439
Heinz H T Waldhoumlr and M Mittlboumlck 2005Careful use of pseudo R-squared measures inepidemiological studies Statistics in Medicine 24(18)2867-2872 doi101002sim2168
Avian Conservation and Ecology 6(1) 4httpwwwace-ecoorgvol6iss1art4
Hollister J W P V August J F Paul and H AWalker 2008 Predicting estuarine sediment metalconcentrations and inferred ecological conditionsan information theoretic approach Journal ofEnvironmental Quality 37(1)234-244 doi102134jeq20070105
Hosmer D W and S Lemeshow 2000 Appliedlogistic regression analysis Second edition WileyNew York New York USA doi1010020471722146
Hutchinson G E 1957 A treatise of limnologyVolume 1 geography physics and chemistry WileyNew York New York USA
Johnson J B and K S Omland 2004 Modelselection in ecology and evolution Trends inEcology and Evolution 19(2)101-108 doi101016jtree200310013
Johnson M D 2007 Measuring habitat quality areview Condor 109(3)489-504 doi10165083471
Johnston C A and B A Shmagin 2006 Scaleissues in lake-watershed interactions assessingshoreline development impacts on water clarityPages 297-313 in J Wu K B Jones H Li and OL Loucks editors Scaling and uncertainty analysisin ecology methods and applications SpringerDordrecht The Netherlands
Jung R E 1991 Effects of human activities andlake characteristics on the behavior and breedingsuccess of Common Loons Passenger Pigeon 53207-218
Kamman N C N M Burgess C T Driscoll HA Simonin W Goodale J Linehan R EstabrookM Hutcheson A Major A M Scheuhammer andD A Scruton 2005 Mercury in freshwater fish ofnortheast North America a geographic perspectivebased on fish tissue monitoring databasesEcotoxicology 14(1-2)163-180 doi101007s10646-004-6267-9
Kristan W B III 2006 Sources and expectationsfor hierarchical structure in bird-habitat associationsCondor 108(1)5-12 doi1016500010-5422(2006)108[0005SAEFHS]20CO2
Kristan W B III and J M Scott 2006Hierarchical models for avian ecologists Condor 108(1)1-4 doi1016500010-5422(2006)108[0001HMFAE]20CO2
Kuhn-Hines A 2008 A multiscale approach tobreeding habitat model development and evaluationfor the common loon Gavia immer in NewHampshire USA ETD Collection for University ofRhode Island Paper AAI3346850 [online] URL httpdigitalcommonsuriedudissertationsAAI3346850
Lawler J J and T C Edwards Jr 2006 Avariance-decomposition approach to investigatingmultiscale habitat associations Condor 108(1)47-58 doi1016500010-5422(2006)108[0047AVATIM]20CO2
Li X D Li Z Ma and D Schneider 2006 Nestsite use by crested ibis dependence of a multifactormodel on spatial scale Landscape Ecology 21(8)1207-1216 doi101007s10980-006-0021-z
Loon Preservation Committee 2004 Fieldcollection protocol for surveying and managingCommon Loons in New Hampshire LoonPreservation Committee Moultonborough NewHampshire USA
Loon Preservation Committee 2005 Meeting thechallenge thirty years of preserving loons and theirhabitats in New Hampshire Loon PreservationCommittee Moultonborough New HampshireUSA
Luck G W 2002 The habitat requirements of therufous treecreeper (Climacteris rufa) 1 Preferentialhabitat use demonstrated at multiple spatial scalesBiological Conservation 105(3)383-394 doi101016S0006-3207(01)00222-1
MacKenzie D I 2005 Was it there Dealing withimperfect detection for species presenceabsencedata Australian and New Zealand Journal ofStatistics 47(1)65-74 doi101111j1467-842X200500372x
MacKenzie D I J D Nichols J E Hines M GKnutson and A B Franklin 2003 Estimating siteoccupancy colonization and local extinction whena species is detected imperfectly Ecology 84(8)2200-2207 doi10189002-3090
Avian Conservation and Ecology 6(1) 4httpwwwace-ecoorgvol6iss1art4
Martin S L and P A Soranno 2006 Lakelandscape position relationships to hydrologicconnectivity and landscape features Limnology andOceanography 51(2)801-814 doi104319lo20065120801
McGarigal K and B J Marks 1995 FRAGSTATSspatial pattern analysis program for quantifyinglandscape structure General Technical ReportPNW-GTR-351 US Department of AgricultureForest Service Washington DC USA
McIntyre J W 1983 Nurseries a consideration ofhabitat requirements during the early chick-rearingperiod in common loons Journal of FieldOrnithology 54(3)247-253
McIntyre J W 1988 The Common Loon spirit ofnorthern lakes University of Minnesota PressMinneapolis Minnesota USA
McIntyre J W and J F Barr 1997 Common loonGavia immer In A Poole and F Gill editors TheBirds of North America 313 Academy of NaturalSciences of Philadelphia and American OrnithologistsUnion Washington DC USA
Menard S 2002 Applied logistic regressionanalysis Second edition Sage PublicationsThousand Oaks California USA
Meyer C B S L Miller and C J Ralph 2002Multi-scale landscape and seascape patternsassociated with marbeled murrelet nesting areas onthe US west coast Landscape Ecology 17(2)95-115 doi101023A1016574928706
Meyer M W 2006 Evaluating the impact ofmultiple stressors on Common Loon populationdemographics-an integrated laboratory and fieldapproach EPA STAR Co-operative AgreementNumber R82-9085 Environmental ProtectionAgency Washington DC USA
Meyer M W D C Evers J J Hartigan and P SRasmussen 1998 Patterns of common loon (Gaviaimmer) mercury exposure reproduction andsurvival in Wisconsin USA EnvironmentalToxicology and Chemistry 17(2)184-190
Meyer M W and J E Woodford 1996Enhancing osprey (Pandion haliaetus) and commonloon (Gavia immer) reproduction on impacted
Wisconsin waterways Final report US Fish andWildlife Service Washington DC USA
Moran P A P 1950 Notes on continuousstochastic phenomena Biometrika 37(1-2)17-23 doi101093biomet371-217
Murtagh P A and P S Pooler 2006 Evaluatingecological indicators lakes in the northeasternUnited States Environmental Monitoring andAssessment 119(1-3)83-96 doi101007s10661-005-9011-x
New Hampshire Department of EnvironmentalServices 2005 Water quality data survey summaryfor New Hampshire lakes and ponds NewHampshire Department of Environmental ServicesNew Hampshire USA [online] URL httpdesnhgovorganizationdivisionswaterwmblakestrophic_summaryhtm
New Hampshire Department of EnvironmentalServices 2006 Community center areas NewHampshire Department of Environmental ServicesNew Hampshire USA [online] URL httpwwwgranitunhedudatadatacatpagescommunitycenterareaspdf
Newbrey J L M A Bozek and N D Niemuth2005 Effects of lake characteristics and humandisturbance on the presence of piscivorous birds innorthern Wisconsin USA Waterbirds 28(4)478-486 doi1016751524-4695(2005)28[478EOLCAH]20CO2
Nocera J J G J Forbes and G R Milton 2008The relevance of local-scale relationships to habitatmanagement and landscape patterns AvianConservation and Ecology - Eacutecologie etconservation des oiseaux 3(1) 4 [online] URL httpwwwace-ecoorgvol3iss1art4
Northeast Loon Study Work Group 2008 [online]URL httpwwwbriloonorgscience-and-conservationcentersNELSWGphp
OrsquoBrien R M 2007 A caution regarding rules ofthumb for variance inflation factors Quality ampQuantity 41(5)673-690 doi101007s11135-006-9018-6
Patton D R 1975 A diversity index for quantifyinghabitat lsquoedgersquo Wildlife Society Bulletin 3171-173
Avian Conservation and Ecology 6(1) 4httpwwwace-ecoorgvol6iss1art4
Penhollow M E and D F Stauffer 2000 Large-scale habitat relationships of neotropical migratorybirds in Virginia Journal of Wildlife Management 64(2)362-373 doi1023073803234
Piper W H C Walcott J N Mager III M PeralaK B Tischler E Harrington A J Turcotte MSchwabenlander and N Banfield 2006 Prospectingin a solitary breeder chick production elicitsterritorial intrusions in common loons BehavioralEcology 17(6)881-888 doi101093behecoarl021
Piper W H C Walcott J N Mager and F JSpilker 2008 Nestsite selection by male loons leadsto sex-biased site familiarity Journal of AnimalEcology 77(2)205-210 doi101111j1365-2656200701334x
Rimmer C C 1992 Common Loon Gavia immer Pages 3-30 in K J Schneider and D M Penceeditors Migratory nongame birds managementconcern in the Northeast US Fish and WildlifeService Newton Corner Massachusetts USA
Riitters K H R V OrsquoNeill and K B Jones 1997Assessing habitat suitability at multiple scales alandscape-level approach Biological Conservation 81(1-2)191-202 doi101016S0006-3207(96)00145-0
Saab V 1999 Importance of spatial scale to habitatuse by breeding birds in riparian forests ahierarchical analysis Ecological Applications 9(1)135-151 doi1018901051-0761(1999)009[0135IOSSTH]20CO2
SAS Institute Inc 2003 SAS 91 Cary NorthCarolina USA
Scott J M P J Heglund M L Morrison J BHaufler M G Raphael W A Wall and F BSamson editors 2002 Predicting speciesoccurrences issues of accuracy and scale IslandPress Washington DC USA
Society for Protection of New Hampshire Forests2005 New Hampshirersquos changing landscapepopulation growth and land use changes Societyfor Protection of New Hampshire Forests [online]URL httpwwwforestsocietyorgresearchresearch-projectsasp
Soranno P A K E Webster K S Cheruvelil andM T Bremigan 2009 The lake landscape-contextframework linking aquatic connections terrestrialfeatures and human effects at multiple scalesVerhandlungen des Internationalen Verein Limnologie 30(5)695-700
Sperduto D D and W F Nichols 2004 Naturalcommunities of New Hampshire New HampshireNatural Heritage Bureau Concord New HampshireUSA and University of New HampshireCooperative Extension Durham New HampshireUSA
SPSS Inc 1999 SPSS 100 Chicago Illinois USA
Stauffer H B C J Ralph and S L Miller 2004Ranking habitat for marbled murrelets a newconservation approach for species with uncertaindetection Ecological Applications 14(5)1374-1383doi10189003-5068
Stein B A and S R Flack 1997 1997 speciesreport card the status of US plants and animals The Nature Conservancy Arlington VirginiaUSA [online] URL httpwwwnatureserveorglibrary1997speciesreportcardpdf
Strauss B and R Biedermann 2007 Evaluatingtemporal and spatial generality How valid arespecies-habitat relationship models EcologicalModeling 204104-114 doi101016jecolmodel200612027
Strong P I V and J A Bissonette 1989 Feedingand chick-rearing areas of common loons Journalof Wildlife Management 5372-76 doi1023073801308
Strong P I V J A Bissonette and J S Fair 1987Reuse of nesting and nursery areas by CommonLoons Journal of Wildlife Management 51123-127doi1023073801642
Taylor K M and H S Vogel 2000 NewHampshire report Pages 110-113 in J McIntyre andD C Evers editors Loons old history and newfindings Proceedings symposium 1997 meetingAmerican Ornithologists Union North AmericanLoon Fund Holderness New Hampshire USA
Thogmartin W E 2007 Effects at the landscapescale may constrain habitat relations at finer scales
Avian Conservation and Ecology 6(1) 4httpwwwace-ecoorgvol6iss1art4
Avian Conservation and Ecology - Eacutecologie etconservation des oiseaux 2(2) 6 [online] URL URL httpwwwace-ecoorgvol2iss2art6
Thogmartin W E and M G Knutson 2007Scaling local species-habitat relations to the largerlandscape with a hierarchical spatial count modelLandscape Ecology 22(1)61-75 doi101007s10980-006-9005-2
Thompson C M and K McGarigal 2002 Theinfluence of research scale on bald eagle habitatselection along the lower Hudson River New York(USA) Landscape Ecology 17(6)569-586 doi101023A1021501231182
Titus J R and L W VanDruff 1981 Responseof the common loon to recreational pressure in theBoundary Waters Canoe Area northeasternMinnesota Wildlife Monographs 791-60
Trocki C L and P W C Paton 2006 Assessinghabitat selection by foraging egrets in salt marshesat multiple spatial scales Wetlands 26(2)307-312 doi1016720277-5212(2006)26[307AHSBFE]20CO2
Turner M G 2005 Landscape ecology What isthe state of the science Annual Review of EcologyEvolution and Systematics 36319-344 doi101146annurevecolsys36102003152614
Tyre A J B Tenhumberg S A Field D NiejalkeK Parris and H P Possingham 2003 Improvingprecision and reducing bias in biological surveysestimating false-negative error rates EcologicalApplications 13(6)1790-1801 doi10189002-5078
Vermeer K 1973 Some aspects of the nestingrequirements of common loons in Alberta WilsonBulletin 85429-435
Wiens J A 1989 Spatial scaling in ecologyFunctional Ecology 3385-397 doi1023072389612
Wiens J A 2002 Riverine landscapes takinglandscape ecology into the water FreshwaterBiology 47(4)501-515 doi101046j1365-2427200200887x
Wiens J A J T Rotenberry and B van Horne1987 Habitat occupancy patterns of North
American shrubsteppe birds the effects of spatialscale Oikos 48132-147 doi1023073565849
Wilcove D S D Rothstein J Dubow A Phillipsand E Losos 1998 Quantifying threats to imperiledspecies in the United States Bioscience 48607-615doi1023071313420
Wu J 2004 Effects of changing scale on landscapepattern analysis scaling relations LandscapeEcology 19(2)125-138 doi101023BLAND000002171140074ae

Avian Conservation and Ecology 6(1) 4httpwwwace-ecoorgvol6iss1art4
Common Loon (Gavia immer) hereafter loonbreeds on freshwater lakes in Iceland Greenlandand across Canada and the northern United Statesfrom early spring through autumn Common Loonwinters along both the Atlantic and Pacific coastsbefore returning each spring to its natal breedinglakes soon after ice-out Loons are consideredhabitat specialists during the breeding season (Evers2007) They prefer relatively large lakes containingboth shallow and deep-water areas Loons are visualpredators and feed mostly on fish but also onamphibians and invertebrates Water clarity is animportant component of breeding habitat selectionand loons typically prefer lakes with at least 3ndash4 mvisibility (Vermeer 1973 McIntyre 1983 1988Blair 1992)
Anthropogenic disturbances that affect loons on thebreeding lakes include habitat degradation fromshoreline development encroachment of buildingson traditional nesting sites decreased water clarityfrom erosion and surface runoff nutrientenrichment increased predator densities changesin fish species composition and increased humanrecreational activity (Titus and VanDruff 1981Heimberger et al 1983 Jung 1991 Newbrey et al2005 Desorbo et al 2007 Found et al 2008) Lakeacidification accidental ingestion of lead fishingtackle and bioaccumulation of environmentalcontaminants such as methylmercury are othersignificant stressors threatening loon productivityand overall fitness (Barr 1986 Alvo et al 1988Meyer et al 1998 Burgess et al 2005 Kamman etal 2005 Evers et al 2008) Common Loon iscurrently listed as a threatened species in NewHampshire and Michigan and is a species of specialconcern in Connecticut Idaho MassachusettsMontana New York Washington and Wisconsin(Evers 2007) A conservative estimate of the adultloon population in the northeastern United States isroughly 5250 individuals based on a 5-yr averagefrom 2004 to 2008 (Northeast Loon Study WorkingGroup 2008 Fig 1)
Historical records indicate that throughoutnortheastern North America there has been a 50reduction in loon populations from the early 1900sto the 1970s (McIntyre and Barr 1997) In NewEngland loon populations declined 35ndash75between 1965 and 1985 (Rimmer 1992 McIntyreand Barr 1997) A northward breeding rangecontraction has also been documented within thelast 100ndash150 yr suggesting that loons may befinding less suitable habitat than previously existed
(McIntyre 1988 McIntyre and Barr 1997) The NewHampshire Loon Preservation Committee (LPC)was formed in 1975 as a result of concerns aboutdeclines in the presence and productivity ofCommon Loon in the state The LPC comprises anetwork of biologists and volunteers that have beenmonitoring loon populations and managing theirrecovery within the state of New Hampshire for gt30 yr (Loon Preservation Committee 2005)
From the 1970s to 2000s New Hampshire had thelargest growth in human population of any state inthe nine-state US Northeast region From 1990 to2004 the population growth rate was 172 twicethat of the rest of New England (Society for theProtection of New Hampshire Forests 2005) Thehuman population of New Hampshire is expectedto grow by 358000 residents between 2000 and2025 an increase of gt 28 (Society for Protectionof New Hampshire Forests 2005) The fastest rateof population change is projected to occur in theLakes Region where a significant portion of theloon population of New Hampshire resides duringbreeding season These projected populationgrowth estimates for New Hampshire highlight theurgency of targeting breeding habitat of theCommon Loon for conservation and protection
Our primary objective was to develop predictivebreeding habitat suitability models for CommonLoon populations in New Hampshire that includemetrics of anthropogenic change and influence asexplanatory factors We hypothesized that the loonis using both ecological and anthropogenic cueswhen selecting breeding habitat Our secondobjective was to assess the effects of scale on habitatassociations for breeding loon populations and tocompare efficacies of single-scale and multiscalehabitat models for describing loon distributions
METHODS
Study area
Demographic data for Common Loon in NewHampshire have been collected by the NewHampshire LPC during the breeding season (Maythrough August) each year since 1976 Fieldbiologists follow a standardized data collectionprotocol (Taylor and Vogel 2000 LoonPreservation Committee 2004) to document loonpresence and abundance nesting and brooding sitesnesting attempts nest site and type and nest success
Avian Conservation and Ecology 6(1) 4httpwwwace-ecoorgvol6iss1art4
Fig 1 Average number of adult Common Loon in the northeastern United States from 2004 to 2008Data sources New York Adirondack Center for Loon Conservation (httpwwwbriloonorgscience-andconservationcentersadirondackloonsphp) Vermont Center for Ecostudies (2007 breeding status ofCommon Loon in Vermont httpwwwvtecostudiesorgPDFLoonreport0720finalpdf) NewHampshire Loon Preservation Committee Maine Audubon Society (The Maine Loon Project httpwwwmaineaudubonorgconserveloonindexshtml) and Massachusetts Department of Conservationand Recreation (httpwwwmassgovdcrindexhtm)
and failure The LPC monitoring program involvesa complete annual census of the entire breeding loonpopulation in the state of New Hampshire includingpresence and absence of loons on gt 750 lakes (Fig2)
Habitat water quality data were obtained from theNew Hampshire Department of EnvironmentalServices (DES) state-wide water quality programthat includes 775 lakes (New HampshireDepartment of Environmental Services 2005)There are three main physiographic ecoregions inNew Hampshire (42deg40rsquondashdeg18rsquo N 70deg37rsquondash72deg W)based on broad geological climatic and landformcharacteristics ecoregion 1 Northern WhiteMountain ecoregion 2 New Hampshire-VermontUpland and ecoregion 3 Southern New EnglandCoastal Hills and Plain (Sperduto and Nichols 2004Fig 2) The LPC uses these ecoregions along withan estimated maximum loon dispersal distance of
20 km (Evers 2001) to divide the New HampshireCommon Loon population into subpopulations formanagement purposes
We used these three physiographic classificationsas the broadest scale for analysis with increasinglyfiner scales within each of the ecoregions Multiplescales reflecting loon-specific ecologically relevantextents such as Common Loon territories homeranges and lake-landscape influences within eachof these ecoregions were chosen for our assessmentMultiscale habitat models were developed using theoccurrence (presence and absence) of breedingCommon Loon on lakes within each of theecoregions (Table 1) Analyses were nested withinthe three physiographic ecoregions with eachecoregion spanning gt 160 km from north to southand ranging from approximately 40ndash60 km east towest (Table 1 Fig 2)
Avian Conservation and Ecology 6(1) 4httpwwwace-ecoorgvol6iss1art4
Fig 2 Land cover map for the State of New Hampshire indicating ecological sections (ecoregions) thedistribution of lakes and Common Loon nest site locations
Spatial scales
Spatial scale is described by grain size and spatialextent (Wiens 1989 2002) Grain is the resolutionor minimum mapping unit of the data whereasextent is the size of a mapped area Grain and extenthave ecological relevance for organisms forexample the smallest size of habitat element that aspecies can resolve (Freemark et al 2002) We useda lake-landscape context to characterize the spatialstructure of lake variation by varying the spatialextent surrounding each lake from local to regionalscale (Soranno et al 2009) We examined fourbiologically relevant spatial scales within eachecoregion catchment scale riparian scale foragingscale and nesting scale Catchment scale includesthe landscape features influencing habitat and waterquality within 500 m of a lake Riparian scalemeasures landscape features within 150 m of thelake shoreline (Johnston and Shmagin 2006 Martinand Soranno 2006 Fraterrigo and Downing 2008)Loon home range is limited to the breeding territory
with mean size ranging from 6ndash8 ha to up to 200 ha(Meyer and Woodford 1996 McIntyre and Barr1997) depending on lake size territory type (wholepartial or multiple lakes) and number of loon pairson larger lakes The foraging scale or estimatedhome range of breeding loons encompassed habitatfeatures within a 500-m radius of the nest location(approximately 78 ha) The finest scale the nestingscale or breeding territory measures habitat withina 150-m radius of the nest location (approximately7 ha Fig 3) This distance was chosen becauseprevious research demonstrated a negativerelationship in chick survival with presence oflakeshore cottage development within 150 m ofCommon Loon nest sites (Heimberger et al 1983Strong and Bissonette 1989) Features from each ofthese four scales were measured on lakes where loonoccurrence has been monitored regularly
Common Loon nest site locations were recorded inthe field using GPS units with accuracy of at least10 m and mapped in GIS using ArcInfo version 91
Avian Conservation and Ecology 6(1) 4httpwwwace-ecoorgvol6iss1art4
Table 1 Monitored frequency of occurrence of breeding Common Loon in three New Hampshirephysiographic ecoregions
Territorial Common Loon
Ecoregion Number of lakes monitored Present Absent
1 Northern White Mountain 59 44 15
2 New Hampshire-Vermont Upland 130 58 72
3 Southern New England Coastal Hills and Plain 133 79 54
Statewide combined multiscale model 322 181 141
software (Environmental Systems ResearchInstitute 2009)
Environmental variables
Based on discussions with Common Loon fieldexperts from the LPC and on published habitatinformation a suite of environmental habitatvariables were considered for inclusion in a priorimodels to describe breeding loon habitatpreferences Twenty-one variables (Table 2) weremeasured for 322 lakes that were consistentlymonitored from 1995 through 2006 by the LPC(Table 1) The variables chosen are thought to havebiological relevance for loons by directly orindirectly influencing habitat associations andpreferences Habitat data were acquired from theNew Hampshire state GIS databases (NH GRANIThttpwwwgranitunhedu) The most recent waterquality values for each lake were obtained from theNew Hampshire DES lake monitoring program(New Hampshire Department of EnvironmentalServices 2005) The 2001 New Hampshire landcover data (30-m cell size 2001) represent 23 landcover classes that we aggregated and re-classifiedto seven land cover types following an AndersonLevel I classification system (Anderson et al 1976Table 2) The proportions of each land cover classand road data (124000 scale 2005) were assessedwithin 150- and 500-m zones around each lake
The LPC monitoring program requires a minimumof three visits to each lake during the breedingseason and repeated visits to lakes over multipleyears The large size (27ndash63 kg) and aggressive
and conspicuous territorial behavior of loons resultsin high detection probability (Hammond 2008)Therefore monitoring data were not adjusted forfalse absences (MacKenzie et al 2003 Tyre et al2003 Stauffer et al 2004 MacKenzie 2005) Non-nesting sites were randomly located on the 141 lakesthat had been monitored multiple times over at leastone decade but where loons were never observedThese verified absence lakes were at least 10 ha insize which is generally considered a minimum forCommon Loon habitat suitability (Evers 2007) Weused verified absence lakes for random non-nestingsites instead of using unoccupied portions of lakesoccupied by loons to avoid violating statisticalassumptions of independence and because of theloonrsquos highly territorial behavior during thebreeding season We developed a GIS program torandomly locate a non-nesting point along anabsence lakersquos perimeter The program allows forthe possibility that the random non-nest point maybe placed on an island shoreline (Fig 4) GISbuffering tools were then used to quantify the landcover and road density within 150- and 500-m radiisurrounding the nest and random non-nest locations(Fig 3) There was no overlap among nest or non-nest site locations for any of the radius regions
The minimum distance from the nest or non-nestpoint location to the nearest human populationcenter was computed to evaluate potential effectsof human disturbance This metric provides ameasure of a nestrsquos or non-nestrsquos proximity to high-density residential development and municipalcommunity centers (defined by New HampshireDepartment of Environmental Services 2006)Other lake-specific variables that were evaluated as
Avian Conservation and Ecology 6(1) 4httpwwwace-ecoorgvol6iss1art4
Fig 3 Maps illustrating land cover and road density within 150- and 500-m zones of each lake andwithin 150- and 500-m radii of a Common Loon nest site and a randomly chosen non-nest site Red andblue lines represent the 150- and 500-m radii areas respectively surrounding each nest and non-nestsite Purple and black lines represent the 150- and 500-m zones respectively surrounding each lake
indicators of human activity included totalphosphorus conductivity and water clarity (Table2) Each of these is associated with the culturaleutrophication of lakes (Johnston and Shmagin2006 Murtagh and Pooler 2006)
Lake occupancy appears to be spatially correlated(Piper et al 2006 Kuhn-Hines 2008) Two distancemetrics were developed to reflect this behavior onewas the distance to the closest lake and the other
was the distance to the closest lake with CommonLoon present (Table 2 Fig 5) Loons also prefernesting in quiet protective coves found alongconvoluted shorelines (Vermeer 1973 McIntyre1983 1988) Lake perimeter and lake area were usedto develop a lake shape index (shorelinedevelopment index) that describes the irregularityof the shoreline (Hutchinson 1957 Patton 1975McGarigal and Marks 1995 Meyer 2006) Lakeshape was calculated as a ratio of shore length to
Avian Conservation and Ecology 6(1) 4httpwwwace-ecoorgvol6iss1art4
Table 2 Summary of explanatory variables for breeding Common Loon presence and absence lakes acrossNew Hampshire N = 322 lakes Means were measured for the 150-m zone surrounding each lake Allvariables are included to highlight the range of variables considered during the modeling process Wemodeled only variables indicated as included at each of the four scales within each ecoregion and statewide
Mean (SD)
Habitat variable Description Presence Absence Reason for inclusionexclusion
Lake area Lake surface area excluding islands (ha) 209 (1125) 33 (34) Included loons prefer larger lakes for avariety of reasons
Lake perimeter Lake shoreline length (km) 11 (23) 4 (3) Excluded correlated with lake area
Lake shape Lake configuration and shorelinecomplexity
2 (1) 2 (1) Excluded correlated with lake area andperimeter
Maximum depth Maximum lake depth (m) 14 (11) 6 (4) Included important for fishprey habitat
Islands Number of islands per lake 4 (13) 1 (2) Included loons prefer small islands fornesting
Elevation Lake elevation (m) 296 (154) 251 (152) Included estimate of geographicspecification
Lake flushing rate Total volume of water entering a lakeper unit time (msup3yr) divided by lakevolume (msup3)
12 (43) 39 (82) Included important factor in nestsurvivorship
Water clarity Secchi depth transparency reading (m) 45 (21) 26 (12) Included loons are visual predators
Total phosphorous Organic and inorganic forms ofphosphorus (mgL)
0009(0005)
0017(0011)
Included estimate of human disturbance
pH Hydrogen ions in the water or acidity(units)
66 (04) 64 (06) Included indicator of fish habitat
Trophic status Categorical 1 = oligotrophic 5 =mesotrophic 10 = eutrophic
3 (3) 6 (3) Excluded correlated with phosphorous
Conductivity Number of ionic particles present (micromhoscm)
48 (33) 66 (53) Excluded negatively correlated with clarity
Loon distancemetrics
Distance to nearest loon presence lake(upper numbers) and distance to nearestloon absence lake (lower numbers km)
2 (24)6 (45)
5 (52)5 (42)
Included hypothesized loon dispersalfactor
Developed-residentialurban
Proportion of residential and urbandeveloped land within 150- and 500-mzones surrounding each lake and nestnon-nest site ()
3 (4) 4 (7) Included estimate of human disturbance
Agriculture Proportion of pasture hay andcultivated cropland cover within 150-and 500-m zones surrounding each lakeand nestnon-nest site ()
1 (2) 2 (3) Included estimate of human disturbance
Forested Proportion of forested land cover within150- and 500-m zones surrounding eachlake and nestnon-nest site ()
36 (13) 45 (17) Included hypothesized habitat factor
(cond)
Avian Conservation and Ecology 6(1) 4httpwwwace-ecoorgvol6iss1art4
Wetland Proportion of forested and nonforestedwetland cover within 150- and 500-mzones surrounding each lake and nestnon-nest site ()
4 (7) 10 (13) Included hypothesized habitat factor
Open water Proportion of open water with lt 25vegetation or soil within 150- and 500-mzones surrounding each lake and nestnon-nest site ()
54 (12) 35 (13) Included hypothesized habitat factor
Cleared and disturbed Proportion of cleared or disturbed landwithin 150- and 500-m zonessurrounding each lake and nestnon-nestsite ()
3 (4) 4 (6) Excluded correlated with Developed
Road density Density of roads within 150- and 500-mzones surrounding each lake and nestnon-nest site (mmsup2)
1798(1255)
2132(1759)
Included estimate of human disturbance
Minimum distance tohuman populationcenter
Minimum distance to high-densityresidential areas and municipalcommunity centers from nestnon-nestsite (km)
4 (4) 3 (3) Included estimate of human disturbance
the circumference of a circle with the same area asthe lake (Table 2) All GIS metrics were computedusing ArcInfo version 91 (Environmental SystemsResearch Institute 2009)
Single- and multiscale habitat modeldevelopment
We developed Common Loon breeding habitatsuitability index (HSI) models for each spatial scalewithin each of the ecoregions and for all lakescombined for a set of statewide models (n = 322)Prior to model development we screenedexplanatory variables within each spatial scale forstrong correlations because multicollinearity ofindependent explanatory variables can causeproblems in logistic regression models (Menard2002) Explanatory variables used to build the singleand multiscale models were checked formulticollinearity using Pearsonrsquos correlation matrixand variance inflation factors (VIFs) We includedonly covariates that were not highly correlated (| r | lt 06) and made sure that explanatory variablesdisplayed VIFs lt 10 (Graham 2003 OrsquoBrien 2007Table 2)
We used an information theoretic approach formodel development and assessment We followedthe common practice of developing a general globalmodel ie the most complex model of the set ofplausible models using logistic regression andmaximum likelihood estimation to describe loon
nesting habitat at the broadest scale (statewide) andfor each ecoregion and then creating alternativemodels as nested subsets of the global model(Burnham and Anderson 2002) For ease of modelinterpretation and application we modeled onlyadditive terms and did not consider interactionterms We then used various criteria to select themost parsimonious models based on nested subsetsof the habitat variables in the global model that wereassociated with nesting territories at each scale Themodel-fitting statistics included results frommaximum likelihood analyses such as the deviance(minus2logL) and the max-rescaled Rsup2 for each of thecompeting models (Agresti 1996 Hosmer andLemeshow 2000) Max-rescaled Rsup2 is a likelihood-based measure of the strength of associationbetween the dichotomous dependent variable (egCommon Loon nest presence) and the explanatoryvariables (Cox and Snell 1989 Estrella 1998 Heinzet al 2005)
The corrected Akaike Information Criterion forsmall sample size (AICc) was used to evaluate therelative strength of competing plausible models(Burnham and Anderson 2002) within each spatialscale within each region An information criterionestimates the amount of information lost when usinga particular model compared with other possiblemodels Better models lose less information(Burnham and Anderson 2002) AICc values canonly be used to compare models when the responsevariable data sets are exactly the same therefore itis only appropriate to compare competing models
Avian Conservation and Ecology 6(1) 4httpwwwace-ecoorgvol6iss1art4
Fig 4 Maps illustrating how using GIS route feature classes were generated along the perimeter ofeach lake so that all features of a lake including islands are treated as a single entity Along each routea randomly chosen non-nest site was located on lakes that were monitored for loons but had no loonoccurrences
within each region The model with the lowest AICc value of a set of candidate models is considered thebest approximating model ie the mostparsimonious model that achieves a balancebetween bias and variance (Burnham and Anderson2002)
The explanatory variables in the best approximatingmodels at each single spatial scale were then usedto build a multiscale habitat model (Graf et al 2005Lawler and Edwards 2006) for each ecoregion andfor a statewide multiscale model The differencebetween the AICc of a given model and theminimum AICc of the candidate set (∆iAICc) andAICc weights wi (the weight of evidence in favorof a given model relative to the set of candidatemodels) were used to rank the models within eachecoregion (Burnham and Anderson 2002 Anderson2008) When it is not clear which of the models fromthe set of candidate models is best as measured byAICc wi (ie wi gt 09 for any given model) aninformation theoretic-based model average approachis warranted In this case each of the candidatemodels with substantial empirical support (ie∆iAICc le 2) was weighted by its Akaike weight andcombined into a single averaged model by
generating weighted parameter estimates (ieparameter estimate multiplied by wi and thensummed across all models) for each parametermaking an ldquoaveragedrdquo prediction from thecombined model (Burnham and Anderson 2002Hollister et al 2008) Parameter estimates obtainedby model averaging reduce model selection bias andaccount for model selection uncertainty (Johnsonand Omland 2004)
We used odds ratios to examine the magnitude ofthe effect of an explanatory variable on theprobability of Common Loon nest presence at fixedvalues of other variables The odds ratio representsthe change in odds of observing loon nest presencefor a unit change in the explanatory variable Theodds ratio of an explanatory variable is calculatedas e(b times unit change) where b is the parameterrsquoscoefficient in the multivariable model and the testof whether b gt 0 is equivalent to testing whether theconfidence interval of the odds ratio crosses 10(Earnst et al 2006)
Once the most parsimonious models for each dataset were chosen we used classification tables toassess the accuracy of habitat models (Fielding and
Avian Conservation and Ecology 6(1) 4httpwwwace-ecoorgvol6iss1art4
Fig 5 Development of minimum Euclidian distance measured from the edge of a lake to the edge of thenearest lake with and without loons using GIS
Bell 1997) The area under the curve statistic (AUC)was derived from the receiver operatingcharacteristics (ROC) curve and was calculated foreach model as an additional measure of modelperformance AUC values range from 05 (scoresfor presenceabsence do not differ poor classifier)to 10 (complete distinction of presence fromabsence perfect classifier) For example an AUCof 088 means that a randomly chosen case from thepresence group will have a greater classifier scorethan a random selection from the absence group witha probability of 088 (Fielding and Bell 1997 Grafet al 2005 Hames et al 2006)
Residual analyses of the final fitted models wereused to test for spatial autocorrelation using theMoranrsquos Index method (Moran 1950 Fortin andDale 2005) The Pearson residuals from the fittedprobability (HSI) for each lake and its geographiccoordinates were used to assess spatialautocorrelation in the final models Statisticalanalyses were performed using the softwarepackages SAS 91 (SAS Institute Inc 2003) SPSS120 (SPSS Inc 1999) and GS+ Geostatistics forEnvironmental Sciences (Gamma Design Software2001)
RESULTS
Comparing general summary statistics for CommonLoon presence and absence at lakes across the entirestate of New Hampshire highlighted variablesassociated with loon habitat preferences (Table 2)Loons were found on lakes that were larger deeperand clearer with more islands and shorelineperimeter closer to nearby lakes inhabited by otherloons Loons also selected lakes with reducedconductivity and total phosphorus higher pH athigher elevations with lower flushing rates andfurther away from human community centers Landcover within the 150-m zone surrounding each lakewith loon nests was less developed and cleared hadlower road density less agricultural land forest andwetland and contained more open water comparedto the land cover surrounding the random non-nestsite locations (Table 2)
Ecoregional models
The three physiographic ecoregions of NewHampshire differed in landscape composition for anumber of the measured habitat types Most notably
Avian Conservation and Ecology 6(1) 4httpwwwace-ecoorgvol6iss1art4
there was a higher proportion of human-alteredlandscape in the two ecoregions south of the WhiteMountains (ecoregions 2 and 3 Fig 6) These twosouthern ecoregions have lakes surrounded bygreater areas of developed land and higher roaddensity with higher measured values forconductivity and total phosphorous and closer tohuman population centers (high-density residentialareas and municipal community centers Table 3Fig 6) Lakes in the Northern White Mountainecoregion are found at higher elevations on averagewith greater areas of surrounding forested andwetland habitat far from human population centersThe southwestern ecoregion New Hampshire-Vermont Upland has greater areas of agriculturalland and smaller lakes on average distinguishingthis ecoregion from the other two The southeasternecoregion Southern New England Coastal Hills andPlain has more open water surrounding the lakeslarger and deeper lakes with more shorelineperimeter and more islands per lake on averagecompared to the two other ecoregions (Table 3)
The best approximating model designation withineach data set has the highest AICc weight highestmax-rescaled Rsup2 and highest AUC classificationvalue For ecoregions 1 and 3 the multiscale modelshad the highest AICc weights and highest max-rescaled Rsup2 values compared to each of the singlescale models within each respective ecoregionsuggesting that breeding habitat selection by loonsis occurring at multiple scales It is important to notethat in the Northern White Mountain ecoregion(ecoregion 1) all five models (the four single-scalemodels and the multiscale model) have substantialempirical support (ie ∆iAICc le 2) warranting amultimodel inference or model averaging approachespecially when a particular parameter (ie lakesize) occurs in many of the candidate models(Burnham and Anderson 2002) This is also relevantfor the models in the Southern New England CoastalHills and Plain ecoregion (ecoregion 3) where allfour of the single-scale models have manyparameters in common Therefore model averagingwas performed for all of the candidate models inecoregion 1 and for the two highest ranking modelsin ecoregion 3 by weighting each model by itsAkaike weight and combining into a compositeaveraged model for each of these ecoregions (Tables4 and 5 respectively)
In ecoregion 2 (New Hampshire-Vermont Upland)the best approximating model was the modelmeasured at the catchment scale (landscape features
within 500 m of a lake) However the multiscalemodel also had substantial empirical support Thusmodel averaging was performed with these twomodels to produce a composite averaged model forecoregion 2 (Table 6)
Statewide models
The statewide models had a number of habitatcharacteristics in common describing breeding loonpreferences at each scale positive associations withdistance to human population centers water clarityelevation and lake size and negative associationswith road density and distance to nearby lakes withloon presence The most parsimonious and bestapproximating model was the single riparian-scalemodel developed with environmental variablesmeasured within the 150-m zone of the lake (model22 Table 7) This model describes loon preferencesfor clearer lakes nearby other lakes with loons athigher elevations with less surrounding roaddensity and further from human population centersNotably this was the only model within thestatewide model set that contained the explanatoryvariable islands and the only model with substantialempirical support based on information-theoreticstatistics (∆AICc le 2 Burnham and Anderson 2002)
It is important to note that all of the final modelsacross all three ecoregions including the statewidemodels achieved a high level of overall accuracybased on AUC values which ranged from 0914 to0989 indicating that all of these models predictloon nest presence fairly well The residuals of thebest approximating single-scale and multiscalemodels showed no significant spatial correlationbased on the Moranrsquos Index scores Given the weakspatial dependence of the residuals we did notfurther investigate spatial autocorrelation
DISCUSSION
General habitat suitability model for CommonLoon
Based on information-theoretic statistics the bestapproximating model among the statewide modelsis the single lake scale model describing theenvironment immediately surrounding the lakewithin a 150-m riparian buffer zone Overall optimalbreeding habitat for Common Loon across NewHampshire was identified as having the following
Avian Conservation and Ecology 6(1) 4httpwwwace-ecoorgvol6iss1art4
Fig 6 Proportion of developed land cover composition within 150- and 500-m zones surrounding lakeswithin each ecoregion Blue diamond = 25 quartile red square = minimum value green triangle =median value purple x = maximum value blue star = 75 quartile
Avian Conservation and Ecology 6(1) 4httpwwwace-ecoorgvol6iss1art4
Table 3 Summary of lake habitat for the three ecoregions for selected explanatory variables Means includeboth Common Loon nest presence and absence lakes
Habitat Variable Ecoregion Mean SE Min Max
Lake area (ha) 123
13796303
019010012
101012
32621819
20128
Lake perimeter (km) 123
131842
013007008
019048015
257048710
3019995
Lake maximum depth (m) 123
10195121
142080087
131115
497555549
Islands (numberlake) 123
214
093025121
000
5117128
Elevation (m) 123
465330145
594289207
1551135
728722601
Lake flushing rate (number of turnoversyr) 123
213100341
772277
030202
267176504
Water Clarity Secchi depth(m) 123
313841
022020018
090809
97116102
Total phosphorous (mgL) 123
001200120012
lt00010001
lt0001
000300010001
003800590052
Conductivity (micromhoscm) 123
339248216905
271299477
151016511664
112601827030600
Distance to loon lake (km) 123
253236
035026046
001001001
136174287
Distance to community center (km) 123
852529
075002023
001001001
24266213
Avian Conservation and Ecology 6(1) 4httpwwwace-ecoorgvol6iss1art4
Table 4 Summary of results for ecoregion 1 (Northern White Mountain) habitat models with their associatedAkaike weights N = 59 lakes Models with empirical support ie ∆iAICc le 2 are indicated in bold
Model Scale Rsup2 Kdagger Log likelihood AICc ∆iAICc Weightwi
AUC
2 Multiscale 087 3 minus668 1980 lt 0001 02444 0989
5 Foraging 073 2 minus786 1993 014 02281 0968
3 Catchment 072 2 minus820 2061 081 01627 0951
4 Riparian 072 2 minus826 2074 094 01526 0952
6 Nesting 150-m radius 076 2 minus846 2114 134 01249 0959
1 Global model 086 5 minus536 2185 206 00874 0988
Explanatory variables for each fitted modelDagger
2 Multiscale lake size (+) open water 500N (+)
5 Foraging open water 500N (+)
3 Catchment lake size (+)
4 Riparian lake size (+)
6 Nesting 150-m radius lake size (+)
1 Global model elevation (+) lake size (+) clarity (+) open water 500N (+)
Composite model Nest presence = minus8655 + 3127 (lake size) + 1570 (open water 500N)
daggerK indicates the total number of parameters ie the intercept and explanatory variablesDagger(+) = positive association (minus) = negative association L = lake scale N = nest scale
characteristics clear higher elevation lakes withislands further away from human populationcenters with lower surrounding road densities andwith nearby lakes occupied by other loons Waterclarity has long been associated with loon habitatpreference and our results are consistent withprevious studies (Vermeer 1973 McIntyre 19831988 Blair 1992 Meyer 2006) The significance ofthe minimum-distance-to-nearest-lake-with-loon-presence metric supports anecdotal observationsand published research describing loon nataldispersal This biotic interaction metric describesthe philopatric and conspecific attraction loonsdisplay and reveals the importance of the spatial
configuration of lakes in the selection of loonbreeding habitat (Strong et al 1987 Evers 2001Piper et al 2006 2008)
The unique habitat feature that distinguishes the bestmodel among the statewide models is theexplanatory variable islands which indicates high-quality breeding habitat for loons (Vermeer 1973Jung 1991 McIntyre and Barr 1997 Piper et al2006 Evers 2007) Based on odds ratio estimatesislands and lake clarity were the most importantfactors distinguishing loon breeding habitat for thestatewide data set (Table 8) The best statewidemodel also describes loon preferences for open
Avian Conservation and Ecology 6(1) 4httpwwwace-ecoorgvol6iss1art4
Table 5 Summary of results for ecoregion 3 (Southern New England Coastal Hills and Plain) habitatmodels with their associated Akaike weights N = 133 lakes Models with empirical support ie ∆iAICc le 2 are indicated in bold
Model Scale Rsup2 Kdagger Loglikelihood
AICc ∆iAICc Weight wi AUC
14 Multiscale 072 6 minus3284 7835 lt 0001 04282 0940
18 Nesting 069 4 minus3530 7892 057 03220 0931
15 Catchment 066 5 minus3565 8178 343 00772 0931
16 Riparian 066 5 minus3565 8178 343 00772 0931
17 Foraging 066 5 minus3565 8178 343 00772 0931
13 Globalmodel
075 11 minus3025 8467 632 00181 0949
Explanatory variables for each fitted modelDagger
14 Multiscale lake size (+) elevation (+) clarity (+) distance to loon (minus) phosphorous (minus)
18 Nesting elevation (+) lake size (+) phosphorous (minus)
15 Catchment distance to loon (minus) elevation (+) lake size (+) clarity (+)
16 Riparian distance to loon (minus) elevation (+) lake size (+) clarity (+)
17 Foraging distance to loon (minus) elevation (+) lake size (+) clarity (+)
13 Globalmodel
developed 150L (minus) open water 150L (+) road 150L (minus) islands (+) distance to loon (minus)elevation (+) lake size (+) phosphorous (minus) clarity (+) open water 500N (+)
Composite model Nest presence = minus4550 + 0006 (elevation) + 1180 (lake size) + 01714 (clarity) minus 02183 (distance toloon) minus 179503 (phosphorus)
daggerK indicates the total number of parameters ie the intercept and explanatory variablesDagger(+) = positive association (minus) = negative association L = lake scale N = nest scale
water surrounding the lake (eg hydrologicalconnectivity) Earnst et al (2006) also found thatYellow-billed Loon in northern Alaska selectbreeding habitat based on landscape-scale featuressuch as hydrological connectivity The explanatoryvariable minimum-distance-to-human-population-center was featured at every scale in the statewidemodels providing evidence that loons prefer tosituate nests on lakes further from humandisturbance A lake habitat selection study forwaterbirds in Canada also found that loons prefer
lakes that are farther from human activity or havemore forested land within a 500-m zone (Found etal 2008)
Effects of scale on Common Loon habitatassociations
Another of our objectives was to investigatewhether Common Loon selects breeding habitat atmultiple scales and to determine which scales are
Avian Conservation and Ecology 6(1) 4httpwwwace-ecoorgvol6iss1art4
Table 6 Summary of results for ecoregion 2 (New Hampshire-Vermont Upland) habitat models with theirassociated Akaike weights N = 130 lakes Models with empirical support ie ∆iAICc le 2 are indicatedin bold
Model Scale Rsup2 Kdagger Loglikelihood
AICc ∆iAICc Weight wi AUC
9 Catchment 081 8 minus2437 6593 lt 0001 06757 0971
8 Multiscale 083 10 minus2310 6806 213 02331 0973
10 Riparian 075 6 minus2872 7011 418 00834 0952
7 Globalmodel
079 11 minus2595 7613 1020 00041 0963
11 Foraging 073 7 minus3331 7930 1337 00008 0945
12 Nesting 068 7 minus3627 8745 2153 lt 000001 0930
Explanatory variables for each fitted modelDagger
9 Catchment open water 500L (+) road 500L (minus) islands (+) pH (+) elevation (+) clarity (+)agricultural 500L (minus)
8 Multiscale open water 150L (+) open water 500N (+) islands (+) clarity( +) road density 500L (minus)road density 150N (minus) distance to loon (minus) forest 150N (minus) wetland 150N (minus)
10 Riparian open water 150L (+) islands (+) distance to loon (minus) elevation (+) clarity (+)
7 Globalmodel
open water 150L (+) islands (+) distance to loon (minus) elevation (+) pH (+) clarity (+)agricultural 500L (minus) open water 500L (+) road density 500L (minus) forest 500 (minus)
11 Foraging open water 500N (+) agricultural 500N (minus) clarity (+) elevation (+) lake size (+)
12 Nesting road density 150N (minus) forest 150N (minus) wetland 150N (minus) elevation (+) lake size (+) flushingrate (minus)
Composite model Nest presence = minus22579 + 3179 (islands) + 1047 (clarity) + 0004 (elevation) + 0287 (open water150L) + 0405 (open water 500L) + 01064 (open water 500N) + 272 (pH) minus 0158 (road density 500L) minus 0362 (distanceto loon) minus 0314 (agricultural 500L) minus 0086 (forest 150N) minus 0079 (wetland 150N) minus 0065 (road density 150N)
daggerK indicates the total number of parameters ie the intercept and explanatory variablesDagger(+) = positive association (minus) = negative association L = lake scale N = nest scale
most important Using information theoreticstatistics the multiscale models for two of the threeecoregions were designated the best approximatingmodels and had substantial empirical support in allthree ecoregions Distinct differences are apparentwhen comparing models across ecoregions (Tables4 5 and 6) Loons in New Hampshire appear to be
selecting breeding habitat differently based onphysiographic ecoregion and at multiple scalesThese differences may be a reflection of theoccurrence of different environmental conditionsand ranges of variables in the three different regionsIn the Northern White Mountain ecoregion loonsare selecting breeding territories on the basis of lake
Avian Conservation and Ecology 6(1) 4httpwwwace-ecoorgvol6iss1art4
Table 7 Summary of results for New Hampshire statewide habitat models with their associated Akaikeweights N = 322 lakes Models with empirical support ie ∆iAICc le 2 are indicated in bold
Model Scale Rsup2 Kdagger Log likelihood AICc ∆iAICc Weight wi AUC
22 Riparian 065 8 minus8615 188764 000 08315 0926
21 Catchment 064 8 minus8843 193315 455 00854 0921
23 Foraging 063 7 minus8996 194269 561 00504 0919
19 Global model 070 15 minus8287 197304 854 00115 0941
24 Nesting 062 7 minus9192 198196 954 00071 0914
20 Multiscale 065 8 minus9365 203769 1501 00005 0926
Explanatory variables for each fitted modelDagger
22 Riparian open water 150L (+) elevation (+) islands (+) clarity (+) distance tohuman population (+) distance to loon (minus) road density 150L (minus)
21 Catchment distance to loon (minus) open water 500L (+) road density 500L (minus) elevation (+)lake size (+) clarity (+) distance to human population (+)
23 Foraging distance to loon (minus) open water 500N (+) elevation (+) lake size (+) clarity(+) distance to human population (+)
19 Global model open water 500L (minus) road density 500L (minus) road density 150N (minus) open water500N (+) road density 150L (minus) open water 150L (+) islands (+) distance toloon (minus) elevation (+) lake size (+) pH (+) phosphorous (minus) clarity (+)distance to human population (+)
24 Nesting distance to loon (minus) road density 150N (minus) elevation (+) lake size (+) clarity(+) distance to human population (+)
20 Multiscale distance to loon (minus) open water 500N (+) road density 150L (minus) elevation (+)lake size (+) clarity (+) distance to human population (+)
Statewide model Nest presence = minus7328 + 0115 (open water 150L) + 0001 (elevation) + 1067 (islands) + 0595 (clarity)+ 0211 (distance to human population) minus 0233 (distance to loon) minus 0033 (road density 150 L)
daggerK indicates the total number of parameters ie the intercept and explanatory variablesDagger(+) = positive association (minus) = negative association L = lake scale N = nest scale
size and the amount of open water surrounding thenest (eg island nest sites) In this ecoregion therewas no distinction between loon presence andabsence lakes based on human-altered variablessuch as road density and developed land or waterquality variables associated with human activitiesThe Northern White Mountain ecoregion has lowerroad densities surrounding the lakes and a less
human-dominated landscape in general Thereforethe loonsrsquo apparent selection based on a few lakemorphological factors may be more a reflection ofthe general environmental conditions and lack ofhuman-altered variables to select against It is alsointeresting to note that loons in this northernecoregion do not appear to be using the presence ofother loons on nearby lakes as a habitat selection
Avian Conservation and Ecology 6(1) 4httpwwwace-ecoorgvol6iss1art4
factor as is the case in the two more southerlyecoregions
The results for the Northern White Mountainecoregion suggest that prior to human alteration ofthe landscape loons may have chosen breedinghabitat based primarily on lake morphologicalfactors such as lake size and the amount of openwater surrounding the nest The catchment riparianforaging and nest scale-based models within theNorthern White Mountain ecoregion includeinformation describing the selection of loonbreeding habitat (Table 4) Three of these final fittedsingle-scale models had explanatory variables incommon (ie lake size) and were combined in themultiscale model for this ecoregion to determine thebest approximating model given the data set basedon the model probability Akaike weights wi (Table4) However using evidence ratios (Burnham andAnderson 2002) to compare the two best modelsthe best model (model 1) has only 19 times theweight of evidence relative to the second-best model(model 4) This relatively weak support for any ofthe models being the best model suggests that thesemodels are good candidates for model averaging ormultimodel inference Model averaging increasesparameter estimate precision and reduces biasassociated with model selection especially when allof the models have substantial support and areclosely related as in ecoregion 1
In the southwestern New Hampshire-VermontUpland loons appear to be avoiding human-alteredlandscapes such as those with high road density andgreater areas of agriculture (Table 6) This regionof New Hampshire contains the highest percentageof prime agricultural soils in the state and hasexperienced the highest amount of agriculturalconversion to developed land in the state over the5-yr period from 1997 to 2002 (Society for theProtection of New Hampshire Forests 2005) Withinthis ecoregion loons are selecting lakes with moreislands higher water clarity and more open watersurrounding the lakes and that are nearby otherlakes with loons present The catchment-scalemodel describing features within a 500-m zone ofthe lake best describes the data in this region (model9 Table 6) the only other model that has substantialempirical support for describing this data set is themultiscale model (model 8 Table 6) Thecatchment-scale model differs from the multiscalemodel by identifying positive associations of loonswith pH (an indicator of fishprey habitat) and lakeelevation and a negative association of loons with
agricultural land within 500 m of the lake Insteadof relying on a single best model for this ecoregionwe used model averaging to combine these twohighest ranking models to obtain robust estimatesof model parameters reduce model selection biasand account for model selection uncertainty(Johnson and Omland 2004) Based on the modelaveraged results and using odds ratios to identifyinfluential factors in this region islands pH andwater clarity appear to be the most influential habitatfeatures (Table 8)
Loons in the southeastern Southern New EnglandCoastal Hills and Plain appear to be selectingbreeding habitat similarly across all scales based ona few key elements larger lakes at increasingelevations with lower levels of phosphorous nearbyother lakes with loons (Table 5) Other studies havefound that loons avoid lakes with higherphosphorous and primary productivity (Blair 1992)which can reduce water clarity Total phosphoruswhich is associated with anthropogenic activitiesappears to be an important avoidance factor forloons selecting breeding habitat at multiple scalesbased on the multiscale and nesting-scale modelswhich are the two highest-ranking models for thisregion The two most influential factors in thisregion appear to be lake size and water clarity basedon odds ratio estimates (Table 8)
The natural arrangement of lakes in NewHampshire especially in the southeastern portionof the state (referred to as the Lakes Region) is ofparticular concern because this area has the fastestrate of human population change in NewHampshire The entire state population is projectedto grow by 358000 between 2000 and 2025 withan estimated 80 of that growth in the foursoutheastern counties of New Hampshire along theInterstate Highway 89 corridor and in the LakesRegion (Society for Protection of New HampshireForests 2005) Loons are responding to human-induced pressures on these lakes and across the stateby selecting against anthropogenic features such asroad density total phosphorous and conductivitydeveloped and agricultural lands and humanpopulation centers
CONCLUSION
Our results support the increasing evidence formultiscale habitat associations most commonlyfound in avian species (Gutzwiller and Anderson
Avian Conservation and Ecology 6(1) 4httpwwwace-ecoorgvol6iss1art4
Table 8 Model averaged parameter estimates and odds ratio estimates with confidence intervals forecoregional composite models and the statewide model These parameters constitute the final averagedmodels for each ecoregion and may be used directly to predict Common Loon nest presence regionally andthroughout the state of New Hampshire
Region Variable Theta SE Odds ratio 95 Wald confidence limits
Ecoregion 1 Northern White Mountain
Intercept minus8655 0704
Lake size 3127 0096 6935 0934 51509
Open water 500 nest 1570 0034 1482 1066 2062
Ecoregion 2 New Hampshire-Vermont Upland
Intercept minus22579 10485
Islands 3179 1120 18045 2760 117970
Clarity 1047 0349 2952 1500 5810
Elevation 0004 0002 1004 1000 1007
Open water 150 lake 0287 0136 1383 1153 1658
Open water 500 lake 0405 01145 1499 1198 1877
Open water 500 nest 01064 00485 0890 0810 0979
pH 272 10139 15195 2083 110844
Road density 500 lake minus0158 0064 0880 0789 0983
Distance to loon lake minus03619 0129 0691 0491 0971
Agricultural 500 lake minus03143 01489 0730 0545 0978
Forest 150 nest minus00856 00346 0913 0853 0977
Wetland 150 nest minus00793 00346 0920 0859 0985
Road density 150 nest minus00647 00286 0927 0877 0980
Ecoregion 3 Southern New England Coastal Hills and Plain
Intercept minus4550 0217
Elevation 0006 0001 1004 1000 1009
Lake size 1180 0158 3254 1640 6456
Clarity 01714 02835 1187 0681 2069
Distance to loon lake minus02183 0124 1000 1000 1000
Phosphorous minus179503 3190 lt 0001 lt 0001 lt 0001
(cond)
Avian Conservation and Ecology 6(1) 4httpwwwace-ecoorgvol6iss1art4
New Hampshire Statewide
Intercept minus73821 12467
Open water 150 lake 01150 00200 1122 1079 1167
Elevation 0001 0001 1001 1000 1002
Islands 10674 04210 2908 1274 6637
Clarity 05948 01503 1813 1350 2434
Distance to population center 02105 00797 1234 1056 1443
Distance to loon lake minus02331 00732 0792 0686 0914
Road density 150 lake minus00327 00148 0968 0940 0996
1987 Wiens et al 1987 Saab 1999 Meyer et al2002 Graf et al 2005 Kristan 2006 Lawler andEdwards 2006 Thogmartin 2007) The multiscalemodels within each ecoregion have substantialempirical support in describing breeding habitatsuggesting that Common Loon in New Hampshireis responding to environmental cues at scalesranging from broad catchment to finer riparian areassurrounding lakes as well as within lakes at thenesting scale Loons also appear to be selectinghabitat differently across the ecoregions based onthe varying landscape conditions they encounteracross New Hampshire This differential selectionof breeding habitat across ecoregions providesinformation for prioritizing conservation andfocusing management efforts in New HampshireConservation efforts in the northern ecoregionshould be focused on preserving the relatively lowerlevels of human activity and disturbance pressuressurrounding these northern lakes by preventingincreases in road density and construction nearlakes especially within the immediate shoreline oflarger lakes Loon conservation and managementactivities in the two southern ecoregions shouldfocus on reducing the effects of already existinghuman disturbances on water quality by mitigatingsources of phosphorous that can also directly affectclarity Other activities in these regions shouldinclude the prioritization for protection of high-quality nesting habitat such as small islands andundisturbed areas of lakes and preventingdevelopment in critical loon habitat Our resultssuggest that conservation strategies for CommonLoon should also consider environmental
influences beyond the immediate lake or riparianscale as the analysis demonstrates that loons arealso responding to landscape-level and catchment-scale conditions surrounding lakes
Responses to this article can be read online athttpwwwace-ecoorgvol6iss1art4responses
Acknowledgments
We thank the many people who share our interest inCommon Loon research and conservation Weappreciate the statistical assistance and advice ofDr James Heltshe and helpful advice fromreviewers of early drafts Drs James Lake BryanMilstead and Rick McKinney as well as that of theanonymous reviewers who contributed to the finalversion of this manuscript This is contributionnumber AED-10-048 of the Atlantic EcologyDivision National Health and EnvironmentalEffects Research Laboratory Office of Researchand Development US Environmental ProtectionAgency Although the research described in thiscontribution has been funded wholly by the USEnvironmental Protection Agency it has not beensubjected to Agency-level review Therefore it doesnot necessarily reflect the views of the AgencyMention of trade names products or services doesnot constitute endorsement or recommendation foruse
Avian Conservation and Ecology 6(1) 4httpwwwace-ecoorgvol6iss1art4
LITERATURE CITED
Agresti A 1996 An introduction to categoricaldata analysisWiley New York New York USA
Alvo R D J T Hussell and M Berrill 1988 Thebreeding success of common loons (Gavia immer)in relation to alkalinity and other lake characteristicsin Ontario Canadian Journal of Zoology 66(3)746-752
Anderson D R 2008 Model based inferences inthe life sciences a primer on evidence SpringerNew York New York USA doi101007978-0-387-74075-1
Anderson J R E E Hardy J T Roach and R EWitmer 1976 A land use and land coverclassification system for use with remote sensordata Geological Survey Professional Paper 964 US Geological Survey Washington DC USA
Austin M 2007 Species distribution models andecological theory a critical assessment and somepossible new approaches Ecological Modelling 200(1-2)1-19 doi101016jecolmodel200607005
Barr J F 1986 Population dynamics of thecommon loon associated with mercury-contaminatedwaters in northwestern Ontario Occasional PaperNumber 56 Canadian Wildlife Service OttawaCanada
Battin J and J J Lawler 2006 Cross-scalecorrelations and the design of avian-habitatselection studies Condor 10859-70 doi1016500010-5422(2006)108[0059CCATDA]20CO2
Blair R B 1992 Lake features water quality andthe summer distribution of Common Loons in NewHampshire Journal of Field Ornithology 63(1)1-9
Burgess N M D C Evers and J D Kaplan 2005Mercury and other contaminants in Common Loonsbreeding in Atlantic Canada Ecotoxicology 14(1-2)241-252 doi101007s10646-004-6271-0
Burnham K P and D R Anderson 2002 Modelselection and multimodel inference a practicalinformation-theoretic approach Second editionSpringer New York New York USA
Cox D R and E J Snell 1989 Analysis of binarydata Second edition Chapman amp Hall LondonUK
Cushman S A and K McGarigal 2002Hierarchical multi-scale decomposition of species-environment relationships Landscape Ecology 17(7)637-646 doi101023A1021571603605
Cushman S A and K McGarigal 2004Hierarchical analysis of forest bird species-environment relationships in the Oregon CoastRange Ecological Applications 14(4)1090-1105 doi10189003-5131
Deppe J L and J T Rotenberry 2008 Scale-dependent habitat use by fall migratory birdsvegetation structure floristics and geographyEcological Monographs 78(3)461-487 doi10189007-01631
Desorbo C R K M Taylor D E Kramer J FairJ H Cooley Jr D C Evers W Hanson H SVogel and J L Atwood 2007 Reproductiveadvantages for Common Loons using rafts Journalof Wildlife Management 71(4)1206-1213 doi1021932006-422
Driscoll M J L T Donovan R Mickey AHoward and K K Fleming 2005 Determinants ofwood thrush nest success a multi-scale modelselection approach Journal of Wildlife Management 69(2)699-709 doi1021930022-541X(2005)069[0699DOWTNS]20CO2
Earnst S L R Platte and L Bond 2006 Alandscape-scale model of yellow-billed loon (Gaviaadamsii) habitat preferences in northern AlaskaHydrobiologia 567(1)227-236 doi101007s10750-006-0042-2
Edwards T C Jr G G Moisen T S Frescinoand J J Lawler 2003 Modeling multipleecological scales to link landscape theory to wildlifeconservation Pages 153-172 in J A Bissonette andI Storch editors Landscape ecology and resourcemanagement linking theory with practice IslandPress Washington DC USA
Environmental Systems Research Institute 2009ArcInfo geographic information system (GIS)software Version 91 Redlands California USA
Avian Conservation and Ecology 6(1) 4httpwwwace-ecoorgvol6iss1art4
Estrella A 1998 A new measure of fit for equationswith dichotomous dependent variables Journal ofBusiness and Economic Statistics 16(2)198-205 doi1023071392575
Evers D C 2001 Common Loon populationstudies continental mercury patterns and breedingterritory philopatry Dissertation University ofMinnesota St Paul Minnesota USA
Evers D C 2007 Status assessment andconservation plan for the Common Loon (Gaviaimmer) in North America BRI Report 2007-20 US Fish and Wildlife Service Hadley MassachusettsUSA
Evers D C L J Savoy C R DeSorbo D EYates W Hanson K M Taylor L Siegel J HCooley M S Bank A Major K Munney BMower H S Vogel N Schoch M Pokras M WGoodale and J Fair 2008 Adverse effects fromenvironmental mercury loads on breeding commonloons Ecotoxicology 17(2)69-81 doi101007s10646-007-0168-7
Fielding A H and J F Bell 1997 A review ofmethods for the assessment of prediction errors inconservation presenceabsence models EnvironmentalConservation 24(1)38-49 doi101017S0376892997000088
Fortin M-J and M R T Dale 2005 Spatialanalysis a guide for ecologists CambridgeUniversity Press Cambridge UK
Found C S M Webb and M S Boyce 2008Selection of lake habitats by waterbirds in the borealtransition zone of northeastern Alberta CanadianJournal of Zoology 86(4)277-285 doi101139Z07-137
Fraterrigo J M and J A Downing 2008 Theinfluence of land use on lake nutrients varies withwatershed transport capacity Ecosystems 11(7)1021-1034 doi101007s10021-008-9176-6
Freemark K E D Bert and M A Villard 2002Patch- landscape- and regional-scale effects onbiota Pages 58-83 in K J Gutzwiller editorApplying landscape ecology in biologicalconservation Springer New York New YorkUSA
Gamma Design Software 2001 GS+ geostatisticsfor the environmental sciences PlainwellMichigan USA
Garshellis D L 2000 Delusions in habitatevaluation measuring use selection andimportance Pages 111-153 in L Boitani and T KFuller editors Research techniques in animalecology controversies and consequences ColumbiaUniversity Press New York New York USA
Goldstein H 2003 Multilevel statistical models Third edition Hodder Arnold London UK
Graf R F K Bollmann W Suter and HBugmann 2005 The importance of spatial scale inhabitat models Capercaillie in the Swiss AlpsLandscape Ecology 20(6)703-717 doi101007s10980-005-0063-7
Graham M H 2003 Confronting multicollinearityin ecological multiple regression Ecology 842809-2815 doi10189002-3114
Gutzwiller K J and S H Anderson 1987Multiscale associations between cavity-nestingbirds and features of Wyoming streamsidewoodlands Condor 89534-548 doi1023071368643
Hames R S J D Lowe S Barker Swarthout andK V Rosenberg 2006 Understanding the risk toneotropical migrant bird species of multiple human-caused stressors elucidating processes behindpatterns Ecology and Society 11(1) 24 [online]URL httpwwwecologyandsocietyorgvol11iss1art24
Hammond C A M 2008 A demographic andlandscape analysis for common loons in northwestMontana Thesis University of Montana MissoulaMontana USA [online] URL httpetdlibumteduthesesavailableetd-04242008-130448
Heimberger M D Euler and J Barr 1983 Theimpact of cottage development on Common Loonreproductive success in central Ontario WilsonBulletin 95(3)431-439
Heinz H T Waldhoumlr and M Mittlboumlck 2005Careful use of pseudo R-squared measures inepidemiological studies Statistics in Medicine 24(18)2867-2872 doi101002sim2168
Avian Conservation and Ecology 6(1) 4httpwwwace-ecoorgvol6iss1art4
Hollister J W P V August J F Paul and H AWalker 2008 Predicting estuarine sediment metalconcentrations and inferred ecological conditionsan information theoretic approach Journal ofEnvironmental Quality 37(1)234-244 doi102134jeq20070105
Hosmer D W and S Lemeshow 2000 Appliedlogistic regression analysis Second edition WileyNew York New York USA doi1010020471722146
Hutchinson G E 1957 A treatise of limnologyVolume 1 geography physics and chemistry WileyNew York New York USA
Johnson J B and K S Omland 2004 Modelselection in ecology and evolution Trends inEcology and Evolution 19(2)101-108 doi101016jtree200310013
Johnson M D 2007 Measuring habitat quality areview Condor 109(3)489-504 doi10165083471
Johnston C A and B A Shmagin 2006 Scaleissues in lake-watershed interactions assessingshoreline development impacts on water clarityPages 297-313 in J Wu K B Jones H Li and OL Loucks editors Scaling and uncertainty analysisin ecology methods and applications SpringerDordrecht The Netherlands
Jung R E 1991 Effects of human activities andlake characteristics on the behavior and breedingsuccess of Common Loons Passenger Pigeon 53207-218
Kamman N C N M Burgess C T Driscoll HA Simonin W Goodale J Linehan R EstabrookM Hutcheson A Major A M Scheuhammer andD A Scruton 2005 Mercury in freshwater fish ofnortheast North America a geographic perspectivebased on fish tissue monitoring databasesEcotoxicology 14(1-2)163-180 doi101007s10646-004-6267-9
Kristan W B III 2006 Sources and expectationsfor hierarchical structure in bird-habitat associationsCondor 108(1)5-12 doi1016500010-5422(2006)108[0005SAEFHS]20CO2
Kristan W B III and J M Scott 2006Hierarchical models for avian ecologists Condor 108(1)1-4 doi1016500010-5422(2006)108[0001HMFAE]20CO2
Kuhn-Hines A 2008 A multiscale approach tobreeding habitat model development and evaluationfor the common loon Gavia immer in NewHampshire USA ETD Collection for University ofRhode Island Paper AAI3346850 [online] URL httpdigitalcommonsuriedudissertationsAAI3346850
Lawler J J and T C Edwards Jr 2006 Avariance-decomposition approach to investigatingmultiscale habitat associations Condor 108(1)47-58 doi1016500010-5422(2006)108[0047AVATIM]20CO2
Li X D Li Z Ma and D Schneider 2006 Nestsite use by crested ibis dependence of a multifactormodel on spatial scale Landscape Ecology 21(8)1207-1216 doi101007s10980-006-0021-z
Loon Preservation Committee 2004 Fieldcollection protocol for surveying and managingCommon Loons in New Hampshire LoonPreservation Committee Moultonborough NewHampshire USA
Loon Preservation Committee 2005 Meeting thechallenge thirty years of preserving loons and theirhabitats in New Hampshire Loon PreservationCommittee Moultonborough New HampshireUSA
Luck G W 2002 The habitat requirements of therufous treecreeper (Climacteris rufa) 1 Preferentialhabitat use demonstrated at multiple spatial scalesBiological Conservation 105(3)383-394 doi101016S0006-3207(01)00222-1
MacKenzie D I 2005 Was it there Dealing withimperfect detection for species presenceabsencedata Australian and New Zealand Journal ofStatistics 47(1)65-74 doi101111j1467-842X200500372x
MacKenzie D I J D Nichols J E Hines M GKnutson and A B Franklin 2003 Estimating siteoccupancy colonization and local extinction whena species is detected imperfectly Ecology 84(8)2200-2207 doi10189002-3090
Avian Conservation and Ecology 6(1) 4httpwwwace-ecoorgvol6iss1art4
Martin S L and P A Soranno 2006 Lakelandscape position relationships to hydrologicconnectivity and landscape features Limnology andOceanography 51(2)801-814 doi104319lo20065120801
McGarigal K and B J Marks 1995 FRAGSTATSspatial pattern analysis program for quantifyinglandscape structure General Technical ReportPNW-GTR-351 US Department of AgricultureForest Service Washington DC USA
McIntyre J W 1983 Nurseries a consideration ofhabitat requirements during the early chick-rearingperiod in common loons Journal of FieldOrnithology 54(3)247-253
McIntyre J W 1988 The Common Loon spirit ofnorthern lakes University of Minnesota PressMinneapolis Minnesota USA
McIntyre J W and J F Barr 1997 Common loonGavia immer In A Poole and F Gill editors TheBirds of North America 313 Academy of NaturalSciences of Philadelphia and American OrnithologistsUnion Washington DC USA
Menard S 2002 Applied logistic regressionanalysis Second edition Sage PublicationsThousand Oaks California USA
Meyer C B S L Miller and C J Ralph 2002Multi-scale landscape and seascape patternsassociated with marbeled murrelet nesting areas onthe US west coast Landscape Ecology 17(2)95-115 doi101023A1016574928706
Meyer M W 2006 Evaluating the impact ofmultiple stressors on Common Loon populationdemographics-an integrated laboratory and fieldapproach EPA STAR Co-operative AgreementNumber R82-9085 Environmental ProtectionAgency Washington DC USA
Meyer M W D C Evers J J Hartigan and P SRasmussen 1998 Patterns of common loon (Gaviaimmer) mercury exposure reproduction andsurvival in Wisconsin USA EnvironmentalToxicology and Chemistry 17(2)184-190
Meyer M W and J E Woodford 1996Enhancing osprey (Pandion haliaetus) and commonloon (Gavia immer) reproduction on impacted
Wisconsin waterways Final report US Fish andWildlife Service Washington DC USA
Moran P A P 1950 Notes on continuousstochastic phenomena Biometrika 37(1-2)17-23 doi101093biomet371-217
Murtagh P A and P S Pooler 2006 Evaluatingecological indicators lakes in the northeasternUnited States Environmental Monitoring andAssessment 119(1-3)83-96 doi101007s10661-005-9011-x
New Hampshire Department of EnvironmentalServices 2005 Water quality data survey summaryfor New Hampshire lakes and ponds NewHampshire Department of Environmental ServicesNew Hampshire USA [online] URL httpdesnhgovorganizationdivisionswaterwmblakestrophic_summaryhtm
New Hampshire Department of EnvironmentalServices 2006 Community center areas NewHampshire Department of Environmental ServicesNew Hampshire USA [online] URL httpwwwgranitunhedudatadatacatpagescommunitycenterareaspdf
Newbrey J L M A Bozek and N D Niemuth2005 Effects of lake characteristics and humandisturbance on the presence of piscivorous birds innorthern Wisconsin USA Waterbirds 28(4)478-486 doi1016751524-4695(2005)28[478EOLCAH]20CO2
Nocera J J G J Forbes and G R Milton 2008The relevance of local-scale relationships to habitatmanagement and landscape patterns AvianConservation and Ecology - Eacutecologie etconservation des oiseaux 3(1) 4 [online] URL httpwwwace-ecoorgvol3iss1art4
Northeast Loon Study Work Group 2008 [online]URL httpwwwbriloonorgscience-and-conservationcentersNELSWGphp
OrsquoBrien R M 2007 A caution regarding rules ofthumb for variance inflation factors Quality ampQuantity 41(5)673-690 doi101007s11135-006-9018-6
Patton D R 1975 A diversity index for quantifyinghabitat lsquoedgersquo Wildlife Society Bulletin 3171-173
Avian Conservation and Ecology 6(1) 4httpwwwace-ecoorgvol6iss1art4
Penhollow M E and D F Stauffer 2000 Large-scale habitat relationships of neotropical migratorybirds in Virginia Journal of Wildlife Management 64(2)362-373 doi1023073803234
Piper W H C Walcott J N Mager III M PeralaK B Tischler E Harrington A J Turcotte MSchwabenlander and N Banfield 2006 Prospectingin a solitary breeder chick production elicitsterritorial intrusions in common loons BehavioralEcology 17(6)881-888 doi101093behecoarl021
Piper W H C Walcott J N Mager and F JSpilker 2008 Nestsite selection by male loons leadsto sex-biased site familiarity Journal of AnimalEcology 77(2)205-210 doi101111j1365-2656200701334x
Rimmer C C 1992 Common Loon Gavia immer Pages 3-30 in K J Schneider and D M Penceeditors Migratory nongame birds managementconcern in the Northeast US Fish and WildlifeService Newton Corner Massachusetts USA
Riitters K H R V OrsquoNeill and K B Jones 1997Assessing habitat suitability at multiple scales alandscape-level approach Biological Conservation 81(1-2)191-202 doi101016S0006-3207(96)00145-0
Saab V 1999 Importance of spatial scale to habitatuse by breeding birds in riparian forests ahierarchical analysis Ecological Applications 9(1)135-151 doi1018901051-0761(1999)009[0135IOSSTH]20CO2
SAS Institute Inc 2003 SAS 91 Cary NorthCarolina USA
Scott J M P J Heglund M L Morrison J BHaufler M G Raphael W A Wall and F BSamson editors 2002 Predicting speciesoccurrences issues of accuracy and scale IslandPress Washington DC USA
Society for Protection of New Hampshire Forests2005 New Hampshirersquos changing landscapepopulation growth and land use changes Societyfor Protection of New Hampshire Forests [online]URL httpwwwforestsocietyorgresearchresearch-projectsasp
Soranno P A K E Webster K S Cheruvelil andM T Bremigan 2009 The lake landscape-contextframework linking aquatic connections terrestrialfeatures and human effects at multiple scalesVerhandlungen des Internationalen Verein Limnologie 30(5)695-700
Sperduto D D and W F Nichols 2004 Naturalcommunities of New Hampshire New HampshireNatural Heritage Bureau Concord New HampshireUSA and University of New HampshireCooperative Extension Durham New HampshireUSA
SPSS Inc 1999 SPSS 100 Chicago Illinois USA
Stauffer H B C J Ralph and S L Miller 2004Ranking habitat for marbled murrelets a newconservation approach for species with uncertaindetection Ecological Applications 14(5)1374-1383doi10189003-5068
Stein B A and S R Flack 1997 1997 speciesreport card the status of US plants and animals The Nature Conservancy Arlington VirginiaUSA [online] URL httpwwwnatureserveorglibrary1997speciesreportcardpdf
Strauss B and R Biedermann 2007 Evaluatingtemporal and spatial generality How valid arespecies-habitat relationship models EcologicalModeling 204104-114 doi101016jecolmodel200612027
Strong P I V and J A Bissonette 1989 Feedingand chick-rearing areas of common loons Journalof Wildlife Management 5372-76 doi1023073801308
Strong P I V J A Bissonette and J S Fair 1987Reuse of nesting and nursery areas by CommonLoons Journal of Wildlife Management 51123-127doi1023073801642
Taylor K M and H S Vogel 2000 NewHampshire report Pages 110-113 in J McIntyre andD C Evers editors Loons old history and newfindings Proceedings symposium 1997 meetingAmerican Ornithologists Union North AmericanLoon Fund Holderness New Hampshire USA
Thogmartin W E 2007 Effects at the landscapescale may constrain habitat relations at finer scales
Avian Conservation and Ecology 6(1) 4httpwwwace-ecoorgvol6iss1art4
Avian Conservation and Ecology - Eacutecologie etconservation des oiseaux 2(2) 6 [online] URL URL httpwwwace-ecoorgvol2iss2art6
Thogmartin W E and M G Knutson 2007Scaling local species-habitat relations to the largerlandscape with a hierarchical spatial count modelLandscape Ecology 22(1)61-75 doi101007s10980-006-9005-2
Thompson C M and K McGarigal 2002 Theinfluence of research scale on bald eagle habitatselection along the lower Hudson River New York(USA) Landscape Ecology 17(6)569-586 doi101023A1021501231182
Titus J R and L W VanDruff 1981 Responseof the common loon to recreational pressure in theBoundary Waters Canoe Area northeasternMinnesota Wildlife Monographs 791-60
Trocki C L and P W C Paton 2006 Assessinghabitat selection by foraging egrets in salt marshesat multiple spatial scales Wetlands 26(2)307-312 doi1016720277-5212(2006)26[307AHSBFE]20CO2
Turner M G 2005 Landscape ecology What isthe state of the science Annual Review of EcologyEvolution and Systematics 36319-344 doi101146annurevecolsys36102003152614
Tyre A J B Tenhumberg S A Field D NiejalkeK Parris and H P Possingham 2003 Improvingprecision and reducing bias in biological surveysestimating false-negative error rates EcologicalApplications 13(6)1790-1801 doi10189002-5078
Vermeer K 1973 Some aspects of the nestingrequirements of common loons in Alberta WilsonBulletin 85429-435
Wiens J A 1989 Spatial scaling in ecologyFunctional Ecology 3385-397 doi1023072389612
Wiens J A 2002 Riverine landscapes takinglandscape ecology into the water FreshwaterBiology 47(4)501-515 doi101046j1365-2427200200887x
Wiens J A J T Rotenberry and B van Horne1987 Habitat occupancy patterns of North
American shrubsteppe birds the effects of spatialscale Oikos 48132-147 doi1023073565849
Wilcove D S D Rothstein J Dubow A Phillipsand E Losos 1998 Quantifying threats to imperiledspecies in the United States Bioscience 48607-615doi1023071313420
Wu J 2004 Effects of changing scale on landscapepattern analysis scaling relations LandscapeEcology 19(2)125-138 doi101023BLAND000002171140074ae
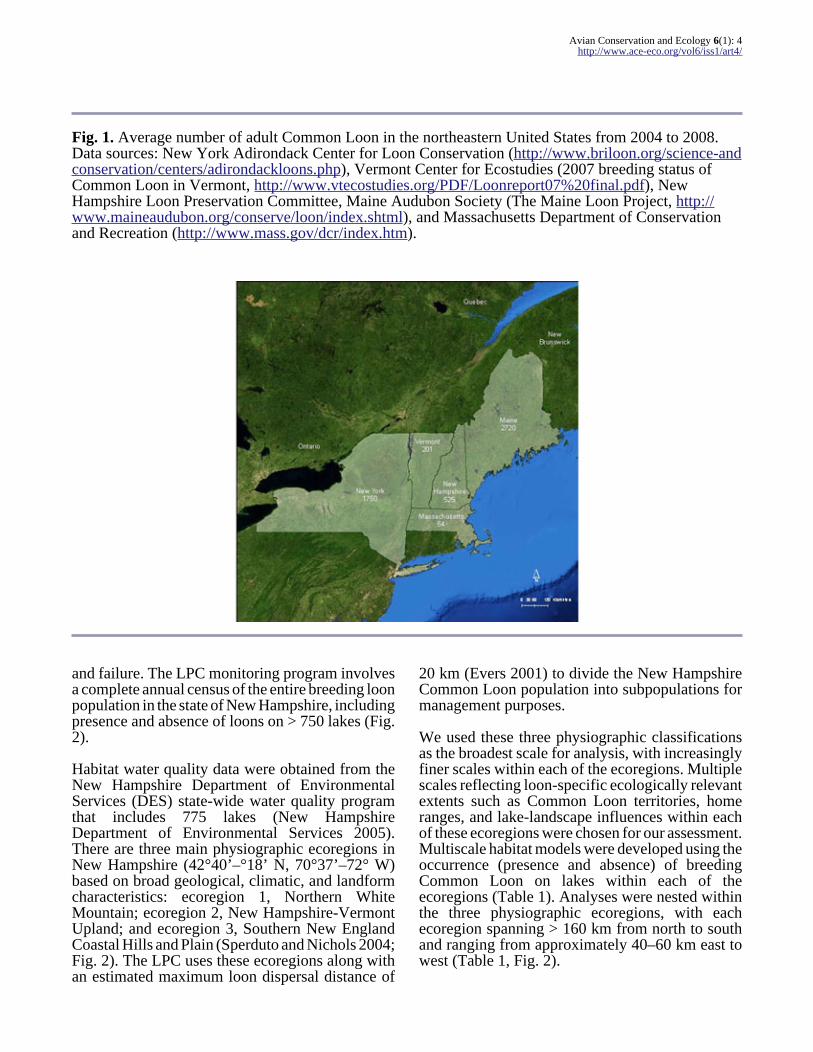
Avian Conservation and Ecology 6(1) 4httpwwwace-ecoorgvol6iss1art4
Fig 1 Average number of adult Common Loon in the northeastern United States from 2004 to 2008Data sources New York Adirondack Center for Loon Conservation (httpwwwbriloonorgscience-andconservationcentersadirondackloonsphp) Vermont Center for Ecostudies (2007 breeding status ofCommon Loon in Vermont httpwwwvtecostudiesorgPDFLoonreport0720finalpdf) NewHampshire Loon Preservation Committee Maine Audubon Society (The Maine Loon Project httpwwwmaineaudubonorgconserveloonindexshtml) and Massachusetts Department of Conservationand Recreation (httpwwwmassgovdcrindexhtm)
and failure The LPC monitoring program involvesa complete annual census of the entire breeding loonpopulation in the state of New Hampshire includingpresence and absence of loons on gt 750 lakes (Fig2)
Habitat water quality data were obtained from theNew Hampshire Department of EnvironmentalServices (DES) state-wide water quality programthat includes 775 lakes (New HampshireDepartment of Environmental Services 2005)There are three main physiographic ecoregions inNew Hampshire (42deg40rsquondashdeg18rsquo N 70deg37rsquondash72deg W)based on broad geological climatic and landformcharacteristics ecoregion 1 Northern WhiteMountain ecoregion 2 New Hampshire-VermontUpland and ecoregion 3 Southern New EnglandCoastal Hills and Plain (Sperduto and Nichols 2004Fig 2) The LPC uses these ecoregions along withan estimated maximum loon dispersal distance of
20 km (Evers 2001) to divide the New HampshireCommon Loon population into subpopulations formanagement purposes
We used these three physiographic classificationsas the broadest scale for analysis with increasinglyfiner scales within each of the ecoregions Multiplescales reflecting loon-specific ecologically relevantextents such as Common Loon territories homeranges and lake-landscape influences within eachof these ecoregions were chosen for our assessmentMultiscale habitat models were developed using theoccurrence (presence and absence) of breedingCommon Loon on lakes within each of theecoregions (Table 1) Analyses were nested withinthe three physiographic ecoregions with eachecoregion spanning gt 160 km from north to southand ranging from approximately 40ndash60 km east towest (Table 1 Fig 2)
Avian Conservation and Ecology 6(1) 4httpwwwace-ecoorgvol6iss1art4
Fig 2 Land cover map for the State of New Hampshire indicating ecological sections (ecoregions) thedistribution of lakes and Common Loon nest site locations
Spatial scales
Spatial scale is described by grain size and spatialextent (Wiens 1989 2002) Grain is the resolutionor minimum mapping unit of the data whereasextent is the size of a mapped area Grain and extenthave ecological relevance for organisms forexample the smallest size of habitat element that aspecies can resolve (Freemark et al 2002) We useda lake-landscape context to characterize the spatialstructure of lake variation by varying the spatialextent surrounding each lake from local to regionalscale (Soranno et al 2009) We examined fourbiologically relevant spatial scales within eachecoregion catchment scale riparian scale foragingscale and nesting scale Catchment scale includesthe landscape features influencing habitat and waterquality within 500 m of a lake Riparian scalemeasures landscape features within 150 m of thelake shoreline (Johnston and Shmagin 2006 Martinand Soranno 2006 Fraterrigo and Downing 2008)Loon home range is limited to the breeding territory
with mean size ranging from 6ndash8 ha to up to 200 ha(Meyer and Woodford 1996 McIntyre and Barr1997) depending on lake size territory type (wholepartial or multiple lakes) and number of loon pairson larger lakes The foraging scale or estimatedhome range of breeding loons encompassed habitatfeatures within a 500-m radius of the nest location(approximately 78 ha) The finest scale the nestingscale or breeding territory measures habitat withina 150-m radius of the nest location (approximately7 ha Fig 3) This distance was chosen becauseprevious research demonstrated a negativerelationship in chick survival with presence oflakeshore cottage development within 150 m ofCommon Loon nest sites (Heimberger et al 1983Strong and Bissonette 1989) Features from each ofthese four scales were measured on lakes where loonoccurrence has been monitored regularly
Common Loon nest site locations were recorded inthe field using GPS units with accuracy of at least10 m and mapped in GIS using ArcInfo version 91
Avian Conservation and Ecology 6(1) 4httpwwwace-ecoorgvol6iss1art4
Table 1 Monitored frequency of occurrence of breeding Common Loon in three New Hampshirephysiographic ecoregions
Territorial Common Loon
Ecoregion Number of lakes monitored Present Absent
1 Northern White Mountain 59 44 15
2 New Hampshire-Vermont Upland 130 58 72
3 Southern New England Coastal Hills and Plain 133 79 54
Statewide combined multiscale model 322 181 141
software (Environmental Systems ResearchInstitute 2009)
Environmental variables
Based on discussions with Common Loon fieldexperts from the LPC and on published habitatinformation a suite of environmental habitatvariables were considered for inclusion in a priorimodels to describe breeding loon habitatpreferences Twenty-one variables (Table 2) weremeasured for 322 lakes that were consistentlymonitored from 1995 through 2006 by the LPC(Table 1) The variables chosen are thought to havebiological relevance for loons by directly orindirectly influencing habitat associations andpreferences Habitat data were acquired from theNew Hampshire state GIS databases (NH GRANIThttpwwwgranitunhedu) The most recent waterquality values for each lake were obtained from theNew Hampshire DES lake monitoring program(New Hampshire Department of EnvironmentalServices 2005) The 2001 New Hampshire landcover data (30-m cell size 2001) represent 23 landcover classes that we aggregated and re-classifiedto seven land cover types following an AndersonLevel I classification system (Anderson et al 1976Table 2) The proportions of each land cover classand road data (124000 scale 2005) were assessedwithin 150- and 500-m zones around each lake
The LPC monitoring program requires a minimumof three visits to each lake during the breedingseason and repeated visits to lakes over multipleyears The large size (27ndash63 kg) and aggressive
and conspicuous territorial behavior of loons resultsin high detection probability (Hammond 2008)Therefore monitoring data were not adjusted forfalse absences (MacKenzie et al 2003 Tyre et al2003 Stauffer et al 2004 MacKenzie 2005) Non-nesting sites were randomly located on the 141 lakesthat had been monitored multiple times over at leastone decade but where loons were never observedThese verified absence lakes were at least 10 ha insize which is generally considered a minimum forCommon Loon habitat suitability (Evers 2007) Weused verified absence lakes for random non-nestingsites instead of using unoccupied portions of lakesoccupied by loons to avoid violating statisticalassumptions of independence and because of theloonrsquos highly territorial behavior during thebreeding season We developed a GIS program torandomly locate a non-nesting point along anabsence lakersquos perimeter The program allows forthe possibility that the random non-nest point maybe placed on an island shoreline (Fig 4) GISbuffering tools were then used to quantify the landcover and road density within 150- and 500-m radiisurrounding the nest and random non-nest locations(Fig 3) There was no overlap among nest or non-nest site locations for any of the radius regions
The minimum distance from the nest or non-nestpoint location to the nearest human populationcenter was computed to evaluate potential effectsof human disturbance This metric provides ameasure of a nestrsquos or non-nestrsquos proximity to high-density residential development and municipalcommunity centers (defined by New HampshireDepartment of Environmental Services 2006)Other lake-specific variables that were evaluated as
Avian Conservation and Ecology 6(1) 4httpwwwace-ecoorgvol6iss1art4
Fig 3 Maps illustrating land cover and road density within 150- and 500-m zones of each lake andwithin 150- and 500-m radii of a Common Loon nest site and a randomly chosen non-nest site Red andblue lines represent the 150- and 500-m radii areas respectively surrounding each nest and non-nestsite Purple and black lines represent the 150- and 500-m zones respectively surrounding each lake
indicators of human activity included totalphosphorus conductivity and water clarity (Table2) Each of these is associated with the culturaleutrophication of lakes (Johnston and Shmagin2006 Murtagh and Pooler 2006)
Lake occupancy appears to be spatially correlated(Piper et al 2006 Kuhn-Hines 2008) Two distancemetrics were developed to reflect this behavior onewas the distance to the closest lake and the other
was the distance to the closest lake with CommonLoon present (Table 2 Fig 5) Loons also prefernesting in quiet protective coves found alongconvoluted shorelines (Vermeer 1973 McIntyre1983 1988) Lake perimeter and lake area were usedto develop a lake shape index (shorelinedevelopment index) that describes the irregularityof the shoreline (Hutchinson 1957 Patton 1975McGarigal and Marks 1995 Meyer 2006) Lakeshape was calculated as a ratio of shore length to
Avian Conservation and Ecology 6(1) 4httpwwwace-ecoorgvol6iss1art4
Table 2 Summary of explanatory variables for breeding Common Loon presence and absence lakes acrossNew Hampshire N = 322 lakes Means were measured for the 150-m zone surrounding each lake Allvariables are included to highlight the range of variables considered during the modeling process Wemodeled only variables indicated as included at each of the four scales within each ecoregion and statewide
Mean (SD)
Habitat variable Description Presence Absence Reason for inclusionexclusion
Lake area Lake surface area excluding islands (ha) 209 (1125) 33 (34) Included loons prefer larger lakes for avariety of reasons
Lake perimeter Lake shoreline length (km) 11 (23) 4 (3) Excluded correlated with lake area
Lake shape Lake configuration and shorelinecomplexity
2 (1) 2 (1) Excluded correlated with lake area andperimeter
Maximum depth Maximum lake depth (m) 14 (11) 6 (4) Included important for fishprey habitat
Islands Number of islands per lake 4 (13) 1 (2) Included loons prefer small islands fornesting
Elevation Lake elevation (m) 296 (154) 251 (152) Included estimate of geographicspecification
Lake flushing rate Total volume of water entering a lakeper unit time (msup3yr) divided by lakevolume (msup3)
12 (43) 39 (82) Included important factor in nestsurvivorship
Water clarity Secchi depth transparency reading (m) 45 (21) 26 (12) Included loons are visual predators
Total phosphorous Organic and inorganic forms ofphosphorus (mgL)
0009(0005)
0017(0011)
Included estimate of human disturbance
pH Hydrogen ions in the water or acidity(units)
66 (04) 64 (06) Included indicator of fish habitat
Trophic status Categorical 1 = oligotrophic 5 =mesotrophic 10 = eutrophic
3 (3) 6 (3) Excluded correlated with phosphorous
Conductivity Number of ionic particles present (micromhoscm)
48 (33) 66 (53) Excluded negatively correlated with clarity
Loon distancemetrics
Distance to nearest loon presence lake(upper numbers) and distance to nearestloon absence lake (lower numbers km)
2 (24)6 (45)
5 (52)5 (42)
Included hypothesized loon dispersalfactor
Developed-residentialurban
Proportion of residential and urbandeveloped land within 150- and 500-mzones surrounding each lake and nestnon-nest site ()
3 (4) 4 (7) Included estimate of human disturbance
Agriculture Proportion of pasture hay andcultivated cropland cover within 150-and 500-m zones surrounding each lakeand nestnon-nest site ()
1 (2) 2 (3) Included estimate of human disturbance
Forested Proportion of forested land cover within150- and 500-m zones surrounding eachlake and nestnon-nest site ()
36 (13) 45 (17) Included hypothesized habitat factor
(cond)
Avian Conservation and Ecology 6(1) 4httpwwwace-ecoorgvol6iss1art4
Wetland Proportion of forested and nonforestedwetland cover within 150- and 500-mzones surrounding each lake and nestnon-nest site ()
4 (7) 10 (13) Included hypothesized habitat factor
Open water Proportion of open water with lt 25vegetation or soil within 150- and 500-mzones surrounding each lake and nestnon-nest site ()
54 (12) 35 (13) Included hypothesized habitat factor
Cleared and disturbed Proportion of cleared or disturbed landwithin 150- and 500-m zonessurrounding each lake and nestnon-nestsite ()
3 (4) 4 (6) Excluded correlated with Developed
Road density Density of roads within 150- and 500-mzones surrounding each lake and nestnon-nest site (mmsup2)
1798(1255)
2132(1759)
Included estimate of human disturbance
Minimum distance tohuman populationcenter
Minimum distance to high-densityresidential areas and municipalcommunity centers from nestnon-nestsite (km)
4 (4) 3 (3) Included estimate of human disturbance
the circumference of a circle with the same area asthe lake (Table 2) All GIS metrics were computedusing ArcInfo version 91 (Environmental SystemsResearch Institute 2009)
Single- and multiscale habitat modeldevelopment
We developed Common Loon breeding habitatsuitability index (HSI) models for each spatial scalewithin each of the ecoregions and for all lakescombined for a set of statewide models (n = 322)Prior to model development we screenedexplanatory variables within each spatial scale forstrong correlations because multicollinearity ofindependent explanatory variables can causeproblems in logistic regression models (Menard2002) Explanatory variables used to build the singleand multiscale models were checked formulticollinearity using Pearsonrsquos correlation matrixand variance inflation factors (VIFs) We includedonly covariates that were not highly correlated (| r | lt 06) and made sure that explanatory variablesdisplayed VIFs lt 10 (Graham 2003 OrsquoBrien 2007Table 2)
We used an information theoretic approach formodel development and assessment We followedthe common practice of developing a general globalmodel ie the most complex model of the set ofplausible models using logistic regression andmaximum likelihood estimation to describe loon
nesting habitat at the broadest scale (statewide) andfor each ecoregion and then creating alternativemodels as nested subsets of the global model(Burnham and Anderson 2002) For ease of modelinterpretation and application we modeled onlyadditive terms and did not consider interactionterms We then used various criteria to select themost parsimonious models based on nested subsetsof the habitat variables in the global model that wereassociated with nesting territories at each scale Themodel-fitting statistics included results frommaximum likelihood analyses such as the deviance(minus2logL) and the max-rescaled Rsup2 for each of thecompeting models (Agresti 1996 Hosmer andLemeshow 2000) Max-rescaled Rsup2 is a likelihood-based measure of the strength of associationbetween the dichotomous dependent variable (egCommon Loon nest presence) and the explanatoryvariables (Cox and Snell 1989 Estrella 1998 Heinzet al 2005)
The corrected Akaike Information Criterion forsmall sample size (AICc) was used to evaluate therelative strength of competing plausible models(Burnham and Anderson 2002) within each spatialscale within each region An information criterionestimates the amount of information lost when usinga particular model compared with other possiblemodels Better models lose less information(Burnham and Anderson 2002) AICc values canonly be used to compare models when the responsevariable data sets are exactly the same therefore itis only appropriate to compare competing models
Avian Conservation and Ecology 6(1) 4httpwwwace-ecoorgvol6iss1art4
Fig 4 Maps illustrating how using GIS route feature classes were generated along the perimeter ofeach lake so that all features of a lake including islands are treated as a single entity Along each routea randomly chosen non-nest site was located on lakes that were monitored for loons but had no loonoccurrences
within each region The model with the lowest AICc value of a set of candidate models is considered thebest approximating model ie the mostparsimonious model that achieves a balancebetween bias and variance (Burnham and Anderson2002)
The explanatory variables in the best approximatingmodels at each single spatial scale were then usedto build a multiscale habitat model (Graf et al 2005Lawler and Edwards 2006) for each ecoregion andfor a statewide multiscale model The differencebetween the AICc of a given model and theminimum AICc of the candidate set (∆iAICc) andAICc weights wi (the weight of evidence in favorof a given model relative to the set of candidatemodels) were used to rank the models within eachecoregion (Burnham and Anderson 2002 Anderson2008) When it is not clear which of the models fromthe set of candidate models is best as measured byAICc wi (ie wi gt 09 for any given model) aninformation theoretic-based model average approachis warranted In this case each of the candidatemodels with substantial empirical support (ie∆iAICc le 2) was weighted by its Akaike weight andcombined into a single averaged model by
generating weighted parameter estimates (ieparameter estimate multiplied by wi and thensummed across all models) for each parametermaking an ldquoaveragedrdquo prediction from thecombined model (Burnham and Anderson 2002Hollister et al 2008) Parameter estimates obtainedby model averaging reduce model selection bias andaccount for model selection uncertainty (Johnsonand Omland 2004)
We used odds ratios to examine the magnitude ofthe effect of an explanatory variable on theprobability of Common Loon nest presence at fixedvalues of other variables The odds ratio representsthe change in odds of observing loon nest presencefor a unit change in the explanatory variable Theodds ratio of an explanatory variable is calculatedas e(b times unit change) where b is the parameterrsquoscoefficient in the multivariable model and the testof whether b gt 0 is equivalent to testing whether theconfidence interval of the odds ratio crosses 10(Earnst et al 2006)
Once the most parsimonious models for each dataset were chosen we used classification tables toassess the accuracy of habitat models (Fielding and
Avian Conservation and Ecology 6(1) 4httpwwwace-ecoorgvol6iss1art4
Fig 5 Development of minimum Euclidian distance measured from the edge of a lake to the edge of thenearest lake with and without loons using GIS
Bell 1997) The area under the curve statistic (AUC)was derived from the receiver operatingcharacteristics (ROC) curve and was calculated foreach model as an additional measure of modelperformance AUC values range from 05 (scoresfor presenceabsence do not differ poor classifier)to 10 (complete distinction of presence fromabsence perfect classifier) For example an AUCof 088 means that a randomly chosen case from thepresence group will have a greater classifier scorethan a random selection from the absence group witha probability of 088 (Fielding and Bell 1997 Grafet al 2005 Hames et al 2006)
Residual analyses of the final fitted models wereused to test for spatial autocorrelation using theMoranrsquos Index method (Moran 1950 Fortin andDale 2005) The Pearson residuals from the fittedprobability (HSI) for each lake and its geographiccoordinates were used to assess spatialautocorrelation in the final models Statisticalanalyses were performed using the softwarepackages SAS 91 (SAS Institute Inc 2003) SPSS120 (SPSS Inc 1999) and GS+ Geostatistics forEnvironmental Sciences (Gamma Design Software2001)
RESULTS
Comparing general summary statistics for CommonLoon presence and absence at lakes across the entirestate of New Hampshire highlighted variablesassociated with loon habitat preferences (Table 2)Loons were found on lakes that were larger deeperand clearer with more islands and shorelineperimeter closer to nearby lakes inhabited by otherloons Loons also selected lakes with reducedconductivity and total phosphorus higher pH athigher elevations with lower flushing rates andfurther away from human community centers Landcover within the 150-m zone surrounding each lakewith loon nests was less developed and cleared hadlower road density less agricultural land forest andwetland and contained more open water comparedto the land cover surrounding the random non-nestsite locations (Table 2)
Ecoregional models
The three physiographic ecoregions of NewHampshire differed in landscape composition for anumber of the measured habitat types Most notably
Avian Conservation and Ecology 6(1) 4httpwwwace-ecoorgvol6iss1art4
there was a higher proportion of human-alteredlandscape in the two ecoregions south of the WhiteMountains (ecoregions 2 and 3 Fig 6) These twosouthern ecoregions have lakes surrounded bygreater areas of developed land and higher roaddensity with higher measured values forconductivity and total phosphorous and closer tohuman population centers (high-density residentialareas and municipal community centers Table 3Fig 6) Lakes in the Northern White Mountainecoregion are found at higher elevations on averagewith greater areas of surrounding forested andwetland habitat far from human population centersThe southwestern ecoregion New Hampshire-Vermont Upland has greater areas of agriculturalland and smaller lakes on average distinguishingthis ecoregion from the other two The southeasternecoregion Southern New England Coastal Hills andPlain has more open water surrounding the lakeslarger and deeper lakes with more shorelineperimeter and more islands per lake on averagecompared to the two other ecoregions (Table 3)
The best approximating model designation withineach data set has the highest AICc weight highestmax-rescaled Rsup2 and highest AUC classificationvalue For ecoregions 1 and 3 the multiscale modelshad the highest AICc weights and highest max-rescaled Rsup2 values compared to each of the singlescale models within each respective ecoregionsuggesting that breeding habitat selection by loonsis occurring at multiple scales It is important to notethat in the Northern White Mountain ecoregion(ecoregion 1) all five models (the four single-scalemodels and the multiscale model) have substantialempirical support (ie ∆iAICc le 2) warranting amultimodel inference or model averaging approachespecially when a particular parameter (ie lakesize) occurs in many of the candidate models(Burnham and Anderson 2002) This is also relevantfor the models in the Southern New England CoastalHills and Plain ecoregion (ecoregion 3) where allfour of the single-scale models have manyparameters in common Therefore model averagingwas performed for all of the candidate models inecoregion 1 and for the two highest ranking modelsin ecoregion 3 by weighting each model by itsAkaike weight and combining into a compositeaveraged model for each of these ecoregions (Tables4 and 5 respectively)
In ecoregion 2 (New Hampshire-Vermont Upland)the best approximating model was the modelmeasured at the catchment scale (landscape features
within 500 m of a lake) However the multiscalemodel also had substantial empirical support Thusmodel averaging was performed with these twomodels to produce a composite averaged model forecoregion 2 (Table 6)
Statewide models
The statewide models had a number of habitatcharacteristics in common describing breeding loonpreferences at each scale positive associations withdistance to human population centers water clarityelevation and lake size and negative associationswith road density and distance to nearby lakes withloon presence The most parsimonious and bestapproximating model was the single riparian-scalemodel developed with environmental variablesmeasured within the 150-m zone of the lake (model22 Table 7) This model describes loon preferencesfor clearer lakes nearby other lakes with loons athigher elevations with less surrounding roaddensity and further from human population centersNotably this was the only model within thestatewide model set that contained the explanatoryvariable islands and the only model with substantialempirical support based on information-theoreticstatistics (∆AICc le 2 Burnham and Anderson 2002)
It is important to note that all of the final modelsacross all three ecoregions including the statewidemodels achieved a high level of overall accuracybased on AUC values which ranged from 0914 to0989 indicating that all of these models predictloon nest presence fairly well The residuals of thebest approximating single-scale and multiscalemodels showed no significant spatial correlationbased on the Moranrsquos Index scores Given the weakspatial dependence of the residuals we did notfurther investigate spatial autocorrelation
DISCUSSION
General habitat suitability model for CommonLoon
Based on information-theoretic statistics the bestapproximating model among the statewide modelsis the single lake scale model describing theenvironment immediately surrounding the lakewithin a 150-m riparian buffer zone Overall optimalbreeding habitat for Common Loon across NewHampshire was identified as having the following
Avian Conservation and Ecology 6(1) 4httpwwwace-ecoorgvol6iss1art4
Fig 6 Proportion of developed land cover composition within 150- and 500-m zones surrounding lakeswithin each ecoregion Blue diamond = 25 quartile red square = minimum value green triangle =median value purple x = maximum value blue star = 75 quartile
Avian Conservation and Ecology 6(1) 4httpwwwace-ecoorgvol6iss1art4
Table 3 Summary of lake habitat for the three ecoregions for selected explanatory variables Means includeboth Common Loon nest presence and absence lakes
Habitat Variable Ecoregion Mean SE Min Max
Lake area (ha) 123
13796303
019010012
101012
32621819
20128
Lake perimeter (km) 123
131842
013007008
019048015
257048710
3019995
Lake maximum depth (m) 123
10195121
142080087
131115
497555549
Islands (numberlake) 123
214
093025121
000
5117128
Elevation (m) 123
465330145
594289207
1551135
728722601
Lake flushing rate (number of turnoversyr) 123
213100341
772277
030202
267176504
Water Clarity Secchi depth(m) 123
313841
022020018
090809
97116102
Total phosphorous (mgL) 123
001200120012
lt00010001
lt0001
000300010001
003800590052
Conductivity (micromhoscm) 123
339248216905
271299477
151016511664
112601827030600
Distance to loon lake (km) 123
253236
035026046
001001001
136174287
Distance to community center (km) 123
852529
075002023
001001001
24266213
Avian Conservation and Ecology 6(1) 4httpwwwace-ecoorgvol6iss1art4
Table 4 Summary of results for ecoregion 1 (Northern White Mountain) habitat models with their associatedAkaike weights N = 59 lakes Models with empirical support ie ∆iAICc le 2 are indicated in bold
Model Scale Rsup2 Kdagger Log likelihood AICc ∆iAICc Weightwi
AUC
2 Multiscale 087 3 minus668 1980 lt 0001 02444 0989
5 Foraging 073 2 minus786 1993 014 02281 0968
3 Catchment 072 2 minus820 2061 081 01627 0951
4 Riparian 072 2 minus826 2074 094 01526 0952
6 Nesting 150-m radius 076 2 minus846 2114 134 01249 0959
1 Global model 086 5 minus536 2185 206 00874 0988
Explanatory variables for each fitted modelDagger
2 Multiscale lake size (+) open water 500N (+)
5 Foraging open water 500N (+)
3 Catchment lake size (+)
4 Riparian lake size (+)
6 Nesting 150-m radius lake size (+)
1 Global model elevation (+) lake size (+) clarity (+) open water 500N (+)
Composite model Nest presence = minus8655 + 3127 (lake size) + 1570 (open water 500N)
daggerK indicates the total number of parameters ie the intercept and explanatory variablesDagger(+) = positive association (minus) = negative association L = lake scale N = nest scale
characteristics clear higher elevation lakes withislands further away from human populationcenters with lower surrounding road densities andwith nearby lakes occupied by other loons Waterclarity has long been associated with loon habitatpreference and our results are consistent withprevious studies (Vermeer 1973 McIntyre 19831988 Blair 1992 Meyer 2006) The significance ofthe minimum-distance-to-nearest-lake-with-loon-presence metric supports anecdotal observationsand published research describing loon nataldispersal This biotic interaction metric describesthe philopatric and conspecific attraction loonsdisplay and reveals the importance of the spatial
configuration of lakes in the selection of loonbreeding habitat (Strong et al 1987 Evers 2001Piper et al 2006 2008)
The unique habitat feature that distinguishes the bestmodel among the statewide models is theexplanatory variable islands which indicates high-quality breeding habitat for loons (Vermeer 1973Jung 1991 McIntyre and Barr 1997 Piper et al2006 Evers 2007) Based on odds ratio estimatesislands and lake clarity were the most importantfactors distinguishing loon breeding habitat for thestatewide data set (Table 8) The best statewidemodel also describes loon preferences for open
Avian Conservation and Ecology 6(1) 4httpwwwace-ecoorgvol6iss1art4
Table 5 Summary of results for ecoregion 3 (Southern New England Coastal Hills and Plain) habitatmodels with their associated Akaike weights N = 133 lakes Models with empirical support ie ∆iAICc le 2 are indicated in bold
Model Scale Rsup2 Kdagger Loglikelihood
AICc ∆iAICc Weight wi AUC
14 Multiscale 072 6 minus3284 7835 lt 0001 04282 0940
18 Nesting 069 4 minus3530 7892 057 03220 0931
15 Catchment 066 5 minus3565 8178 343 00772 0931
16 Riparian 066 5 minus3565 8178 343 00772 0931
17 Foraging 066 5 minus3565 8178 343 00772 0931
13 Globalmodel
075 11 minus3025 8467 632 00181 0949
Explanatory variables for each fitted modelDagger
14 Multiscale lake size (+) elevation (+) clarity (+) distance to loon (minus) phosphorous (minus)
18 Nesting elevation (+) lake size (+) phosphorous (minus)
15 Catchment distance to loon (minus) elevation (+) lake size (+) clarity (+)
16 Riparian distance to loon (minus) elevation (+) lake size (+) clarity (+)
17 Foraging distance to loon (minus) elevation (+) lake size (+) clarity (+)
13 Globalmodel
developed 150L (minus) open water 150L (+) road 150L (minus) islands (+) distance to loon (minus)elevation (+) lake size (+) phosphorous (minus) clarity (+) open water 500N (+)
Composite model Nest presence = minus4550 + 0006 (elevation) + 1180 (lake size) + 01714 (clarity) minus 02183 (distance toloon) minus 179503 (phosphorus)
daggerK indicates the total number of parameters ie the intercept and explanatory variablesDagger(+) = positive association (minus) = negative association L = lake scale N = nest scale
water surrounding the lake (eg hydrologicalconnectivity) Earnst et al (2006) also found thatYellow-billed Loon in northern Alaska selectbreeding habitat based on landscape-scale featuressuch as hydrological connectivity The explanatoryvariable minimum-distance-to-human-population-center was featured at every scale in the statewidemodels providing evidence that loons prefer tosituate nests on lakes further from humandisturbance A lake habitat selection study forwaterbirds in Canada also found that loons prefer
lakes that are farther from human activity or havemore forested land within a 500-m zone (Found etal 2008)
Effects of scale on Common Loon habitatassociations
Another of our objectives was to investigatewhether Common Loon selects breeding habitat atmultiple scales and to determine which scales are
Avian Conservation and Ecology 6(1) 4httpwwwace-ecoorgvol6iss1art4
Table 6 Summary of results for ecoregion 2 (New Hampshire-Vermont Upland) habitat models with theirassociated Akaike weights N = 130 lakes Models with empirical support ie ∆iAICc le 2 are indicatedin bold
Model Scale Rsup2 Kdagger Loglikelihood
AICc ∆iAICc Weight wi AUC
9 Catchment 081 8 minus2437 6593 lt 0001 06757 0971
8 Multiscale 083 10 minus2310 6806 213 02331 0973
10 Riparian 075 6 minus2872 7011 418 00834 0952
7 Globalmodel
079 11 minus2595 7613 1020 00041 0963
11 Foraging 073 7 minus3331 7930 1337 00008 0945
12 Nesting 068 7 minus3627 8745 2153 lt 000001 0930
Explanatory variables for each fitted modelDagger
9 Catchment open water 500L (+) road 500L (minus) islands (+) pH (+) elevation (+) clarity (+)agricultural 500L (minus)
8 Multiscale open water 150L (+) open water 500N (+) islands (+) clarity( +) road density 500L (minus)road density 150N (minus) distance to loon (minus) forest 150N (minus) wetland 150N (minus)
10 Riparian open water 150L (+) islands (+) distance to loon (minus) elevation (+) clarity (+)
7 Globalmodel
open water 150L (+) islands (+) distance to loon (minus) elevation (+) pH (+) clarity (+)agricultural 500L (minus) open water 500L (+) road density 500L (minus) forest 500 (minus)
11 Foraging open water 500N (+) agricultural 500N (minus) clarity (+) elevation (+) lake size (+)
12 Nesting road density 150N (minus) forest 150N (minus) wetland 150N (minus) elevation (+) lake size (+) flushingrate (minus)
Composite model Nest presence = minus22579 + 3179 (islands) + 1047 (clarity) + 0004 (elevation) + 0287 (open water150L) + 0405 (open water 500L) + 01064 (open water 500N) + 272 (pH) minus 0158 (road density 500L) minus 0362 (distanceto loon) minus 0314 (agricultural 500L) minus 0086 (forest 150N) minus 0079 (wetland 150N) minus 0065 (road density 150N)
daggerK indicates the total number of parameters ie the intercept and explanatory variablesDagger(+) = positive association (minus) = negative association L = lake scale N = nest scale
most important Using information theoreticstatistics the multiscale models for two of the threeecoregions were designated the best approximatingmodels and had substantial empirical support in allthree ecoregions Distinct differences are apparentwhen comparing models across ecoregions (Tables4 5 and 6) Loons in New Hampshire appear to be
selecting breeding habitat differently based onphysiographic ecoregion and at multiple scalesThese differences may be a reflection of theoccurrence of different environmental conditionsand ranges of variables in the three different regionsIn the Northern White Mountain ecoregion loonsare selecting breeding territories on the basis of lake
Avian Conservation and Ecology 6(1) 4httpwwwace-ecoorgvol6iss1art4
Table 7 Summary of results for New Hampshire statewide habitat models with their associated Akaikeweights N = 322 lakes Models with empirical support ie ∆iAICc le 2 are indicated in bold
Model Scale Rsup2 Kdagger Log likelihood AICc ∆iAICc Weight wi AUC
22 Riparian 065 8 minus8615 188764 000 08315 0926
21 Catchment 064 8 minus8843 193315 455 00854 0921
23 Foraging 063 7 minus8996 194269 561 00504 0919
19 Global model 070 15 minus8287 197304 854 00115 0941
24 Nesting 062 7 minus9192 198196 954 00071 0914
20 Multiscale 065 8 minus9365 203769 1501 00005 0926
Explanatory variables for each fitted modelDagger
22 Riparian open water 150L (+) elevation (+) islands (+) clarity (+) distance tohuman population (+) distance to loon (minus) road density 150L (minus)
21 Catchment distance to loon (minus) open water 500L (+) road density 500L (minus) elevation (+)lake size (+) clarity (+) distance to human population (+)
23 Foraging distance to loon (minus) open water 500N (+) elevation (+) lake size (+) clarity(+) distance to human population (+)
19 Global model open water 500L (minus) road density 500L (minus) road density 150N (minus) open water500N (+) road density 150L (minus) open water 150L (+) islands (+) distance toloon (minus) elevation (+) lake size (+) pH (+) phosphorous (minus) clarity (+)distance to human population (+)
24 Nesting distance to loon (minus) road density 150N (minus) elevation (+) lake size (+) clarity(+) distance to human population (+)
20 Multiscale distance to loon (minus) open water 500N (+) road density 150L (minus) elevation (+)lake size (+) clarity (+) distance to human population (+)
Statewide model Nest presence = minus7328 + 0115 (open water 150L) + 0001 (elevation) + 1067 (islands) + 0595 (clarity)+ 0211 (distance to human population) minus 0233 (distance to loon) minus 0033 (road density 150 L)
daggerK indicates the total number of parameters ie the intercept and explanatory variablesDagger(+) = positive association (minus) = negative association L = lake scale N = nest scale
size and the amount of open water surrounding thenest (eg island nest sites) In this ecoregion therewas no distinction between loon presence andabsence lakes based on human-altered variablessuch as road density and developed land or waterquality variables associated with human activitiesThe Northern White Mountain ecoregion has lowerroad densities surrounding the lakes and a less
human-dominated landscape in general Thereforethe loonsrsquo apparent selection based on a few lakemorphological factors may be more a reflection ofthe general environmental conditions and lack ofhuman-altered variables to select against It is alsointeresting to note that loons in this northernecoregion do not appear to be using the presence ofother loons on nearby lakes as a habitat selection
Avian Conservation and Ecology 6(1) 4httpwwwace-ecoorgvol6iss1art4
factor as is the case in the two more southerlyecoregions
The results for the Northern White Mountainecoregion suggest that prior to human alteration ofthe landscape loons may have chosen breedinghabitat based primarily on lake morphologicalfactors such as lake size and the amount of openwater surrounding the nest The catchment riparianforaging and nest scale-based models within theNorthern White Mountain ecoregion includeinformation describing the selection of loonbreeding habitat (Table 4) Three of these final fittedsingle-scale models had explanatory variables incommon (ie lake size) and were combined in themultiscale model for this ecoregion to determine thebest approximating model given the data set basedon the model probability Akaike weights wi (Table4) However using evidence ratios (Burnham andAnderson 2002) to compare the two best modelsthe best model (model 1) has only 19 times theweight of evidence relative to the second-best model(model 4) This relatively weak support for any ofthe models being the best model suggests that thesemodels are good candidates for model averaging ormultimodel inference Model averaging increasesparameter estimate precision and reduces biasassociated with model selection especially when allof the models have substantial support and areclosely related as in ecoregion 1
In the southwestern New Hampshire-VermontUpland loons appear to be avoiding human-alteredlandscapes such as those with high road density andgreater areas of agriculture (Table 6) This regionof New Hampshire contains the highest percentageof prime agricultural soils in the state and hasexperienced the highest amount of agriculturalconversion to developed land in the state over the5-yr period from 1997 to 2002 (Society for theProtection of New Hampshire Forests 2005) Withinthis ecoregion loons are selecting lakes with moreislands higher water clarity and more open watersurrounding the lakes and that are nearby otherlakes with loons present The catchment-scalemodel describing features within a 500-m zone ofthe lake best describes the data in this region (model9 Table 6) the only other model that has substantialempirical support for describing this data set is themultiscale model (model 8 Table 6) Thecatchment-scale model differs from the multiscalemodel by identifying positive associations of loonswith pH (an indicator of fishprey habitat) and lakeelevation and a negative association of loons with
agricultural land within 500 m of the lake Insteadof relying on a single best model for this ecoregionwe used model averaging to combine these twohighest ranking models to obtain robust estimatesof model parameters reduce model selection biasand account for model selection uncertainty(Johnson and Omland 2004) Based on the modelaveraged results and using odds ratios to identifyinfluential factors in this region islands pH andwater clarity appear to be the most influential habitatfeatures (Table 8)
Loons in the southeastern Southern New EnglandCoastal Hills and Plain appear to be selectingbreeding habitat similarly across all scales based ona few key elements larger lakes at increasingelevations with lower levels of phosphorous nearbyother lakes with loons (Table 5) Other studies havefound that loons avoid lakes with higherphosphorous and primary productivity (Blair 1992)which can reduce water clarity Total phosphoruswhich is associated with anthropogenic activitiesappears to be an important avoidance factor forloons selecting breeding habitat at multiple scalesbased on the multiscale and nesting-scale modelswhich are the two highest-ranking models for thisregion The two most influential factors in thisregion appear to be lake size and water clarity basedon odds ratio estimates (Table 8)
The natural arrangement of lakes in NewHampshire especially in the southeastern portionof the state (referred to as the Lakes Region) is ofparticular concern because this area has the fastestrate of human population change in NewHampshire The entire state population is projectedto grow by 358000 between 2000 and 2025 withan estimated 80 of that growth in the foursoutheastern counties of New Hampshire along theInterstate Highway 89 corridor and in the LakesRegion (Society for Protection of New HampshireForests 2005) Loons are responding to human-induced pressures on these lakes and across the stateby selecting against anthropogenic features such asroad density total phosphorous and conductivitydeveloped and agricultural lands and humanpopulation centers
CONCLUSION
Our results support the increasing evidence formultiscale habitat associations most commonlyfound in avian species (Gutzwiller and Anderson
Avian Conservation and Ecology 6(1) 4httpwwwace-ecoorgvol6iss1art4
Table 8 Model averaged parameter estimates and odds ratio estimates with confidence intervals forecoregional composite models and the statewide model These parameters constitute the final averagedmodels for each ecoregion and may be used directly to predict Common Loon nest presence regionally andthroughout the state of New Hampshire
Region Variable Theta SE Odds ratio 95 Wald confidence limits
Ecoregion 1 Northern White Mountain
Intercept minus8655 0704
Lake size 3127 0096 6935 0934 51509
Open water 500 nest 1570 0034 1482 1066 2062
Ecoregion 2 New Hampshire-Vermont Upland
Intercept minus22579 10485
Islands 3179 1120 18045 2760 117970
Clarity 1047 0349 2952 1500 5810
Elevation 0004 0002 1004 1000 1007
Open water 150 lake 0287 0136 1383 1153 1658
Open water 500 lake 0405 01145 1499 1198 1877
Open water 500 nest 01064 00485 0890 0810 0979
pH 272 10139 15195 2083 110844
Road density 500 lake minus0158 0064 0880 0789 0983
Distance to loon lake minus03619 0129 0691 0491 0971
Agricultural 500 lake minus03143 01489 0730 0545 0978
Forest 150 nest minus00856 00346 0913 0853 0977
Wetland 150 nest minus00793 00346 0920 0859 0985
Road density 150 nest minus00647 00286 0927 0877 0980
Ecoregion 3 Southern New England Coastal Hills and Plain
Intercept minus4550 0217
Elevation 0006 0001 1004 1000 1009
Lake size 1180 0158 3254 1640 6456
Clarity 01714 02835 1187 0681 2069
Distance to loon lake minus02183 0124 1000 1000 1000
Phosphorous minus179503 3190 lt 0001 lt 0001 lt 0001
(cond)
Avian Conservation and Ecology 6(1) 4httpwwwace-ecoorgvol6iss1art4
New Hampshire Statewide
Intercept minus73821 12467
Open water 150 lake 01150 00200 1122 1079 1167
Elevation 0001 0001 1001 1000 1002
Islands 10674 04210 2908 1274 6637
Clarity 05948 01503 1813 1350 2434
Distance to population center 02105 00797 1234 1056 1443
Distance to loon lake minus02331 00732 0792 0686 0914
Road density 150 lake minus00327 00148 0968 0940 0996
1987 Wiens et al 1987 Saab 1999 Meyer et al2002 Graf et al 2005 Kristan 2006 Lawler andEdwards 2006 Thogmartin 2007) The multiscalemodels within each ecoregion have substantialempirical support in describing breeding habitatsuggesting that Common Loon in New Hampshireis responding to environmental cues at scalesranging from broad catchment to finer riparian areassurrounding lakes as well as within lakes at thenesting scale Loons also appear to be selectinghabitat differently across the ecoregions based onthe varying landscape conditions they encounteracross New Hampshire This differential selectionof breeding habitat across ecoregions providesinformation for prioritizing conservation andfocusing management efforts in New HampshireConservation efforts in the northern ecoregionshould be focused on preserving the relatively lowerlevels of human activity and disturbance pressuressurrounding these northern lakes by preventingincreases in road density and construction nearlakes especially within the immediate shoreline oflarger lakes Loon conservation and managementactivities in the two southern ecoregions shouldfocus on reducing the effects of already existinghuman disturbances on water quality by mitigatingsources of phosphorous that can also directly affectclarity Other activities in these regions shouldinclude the prioritization for protection of high-quality nesting habitat such as small islands andundisturbed areas of lakes and preventingdevelopment in critical loon habitat Our resultssuggest that conservation strategies for CommonLoon should also consider environmental
influences beyond the immediate lake or riparianscale as the analysis demonstrates that loons arealso responding to landscape-level and catchment-scale conditions surrounding lakes
Responses to this article can be read online athttpwwwace-ecoorgvol6iss1art4responses
Acknowledgments
We thank the many people who share our interest inCommon Loon research and conservation Weappreciate the statistical assistance and advice ofDr James Heltshe and helpful advice fromreviewers of early drafts Drs James Lake BryanMilstead and Rick McKinney as well as that of theanonymous reviewers who contributed to the finalversion of this manuscript This is contributionnumber AED-10-048 of the Atlantic EcologyDivision National Health and EnvironmentalEffects Research Laboratory Office of Researchand Development US Environmental ProtectionAgency Although the research described in thiscontribution has been funded wholly by the USEnvironmental Protection Agency it has not beensubjected to Agency-level review Therefore it doesnot necessarily reflect the views of the AgencyMention of trade names products or services doesnot constitute endorsement or recommendation foruse
Avian Conservation and Ecology 6(1) 4httpwwwace-ecoorgvol6iss1art4
LITERATURE CITED
Agresti A 1996 An introduction to categoricaldata analysisWiley New York New York USA
Alvo R D J T Hussell and M Berrill 1988 Thebreeding success of common loons (Gavia immer)in relation to alkalinity and other lake characteristicsin Ontario Canadian Journal of Zoology 66(3)746-752
Anderson D R 2008 Model based inferences inthe life sciences a primer on evidence SpringerNew York New York USA doi101007978-0-387-74075-1
Anderson J R E E Hardy J T Roach and R EWitmer 1976 A land use and land coverclassification system for use with remote sensordata Geological Survey Professional Paper 964 US Geological Survey Washington DC USA
Austin M 2007 Species distribution models andecological theory a critical assessment and somepossible new approaches Ecological Modelling 200(1-2)1-19 doi101016jecolmodel200607005
Barr J F 1986 Population dynamics of thecommon loon associated with mercury-contaminatedwaters in northwestern Ontario Occasional PaperNumber 56 Canadian Wildlife Service OttawaCanada
Battin J and J J Lawler 2006 Cross-scalecorrelations and the design of avian-habitatselection studies Condor 10859-70 doi1016500010-5422(2006)108[0059CCATDA]20CO2
Blair R B 1992 Lake features water quality andthe summer distribution of Common Loons in NewHampshire Journal of Field Ornithology 63(1)1-9
Burgess N M D C Evers and J D Kaplan 2005Mercury and other contaminants in Common Loonsbreeding in Atlantic Canada Ecotoxicology 14(1-2)241-252 doi101007s10646-004-6271-0
Burnham K P and D R Anderson 2002 Modelselection and multimodel inference a practicalinformation-theoretic approach Second editionSpringer New York New York USA
Cox D R and E J Snell 1989 Analysis of binarydata Second edition Chapman amp Hall LondonUK
Cushman S A and K McGarigal 2002Hierarchical multi-scale decomposition of species-environment relationships Landscape Ecology 17(7)637-646 doi101023A1021571603605
Cushman S A and K McGarigal 2004Hierarchical analysis of forest bird species-environment relationships in the Oregon CoastRange Ecological Applications 14(4)1090-1105 doi10189003-5131
Deppe J L and J T Rotenberry 2008 Scale-dependent habitat use by fall migratory birdsvegetation structure floristics and geographyEcological Monographs 78(3)461-487 doi10189007-01631
Desorbo C R K M Taylor D E Kramer J FairJ H Cooley Jr D C Evers W Hanson H SVogel and J L Atwood 2007 Reproductiveadvantages for Common Loons using rafts Journalof Wildlife Management 71(4)1206-1213 doi1021932006-422
Driscoll M J L T Donovan R Mickey AHoward and K K Fleming 2005 Determinants ofwood thrush nest success a multi-scale modelselection approach Journal of Wildlife Management 69(2)699-709 doi1021930022-541X(2005)069[0699DOWTNS]20CO2
Earnst S L R Platte and L Bond 2006 Alandscape-scale model of yellow-billed loon (Gaviaadamsii) habitat preferences in northern AlaskaHydrobiologia 567(1)227-236 doi101007s10750-006-0042-2
Edwards T C Jr G G Moisen T S Frescinoand J J Lawler 2003 Modeling multipleecological scales to link landscape theory to wildlifeconservation Pages 153-172 in J A Bissonette andI Storch editors Landscape ecology and resourcemanagement linking theory with practice IslandPress Washington DC USA
Environmental Systems Research Institute 2009ArcInfo geographic information system (GIS)software Version 91 Redlands California USA
Avian Conservation and Ecology 6(1) 4httpwwwace-ecoorgvol6iss1art4
Estrella A 1998 A new measure of fit for equationswith dichotomous dependent variables Journal ofBusiness and Economic Statistics 16(2)198-205 doi1023071392575
Evers D C 2001 Common Loon populationstudies continental mercury patterns and breedingterritory philopatry Dissertation University ofMinnesota St Paul Minnesota USA
Evers D C 2007 Status assessment andconservation plan for the Common Loon (Gaviaimmer) in North America BRI Report 2007-20 US Fish and Wildlife Service Hadley MassachusettsUSA
Evers D C L J Savoy C R DeSorbo D EYates W Hanson K M Taylor L Siegel J HCooley M S Bank A Major K Munney BMower H S Vogel N Schoch M Pokras M WGoodale and J Fair 2008 Adverse effects fromenvironmental mercury loads on breeding commonloons Ecotoxicology 17(2)69-81 doi101007s10646-007-0168-7
Fielding A H and J F Bell 1997 A review ofmethods for the assessment of prediction errors inconservation presenceabsence models EnvironmentalConservation 24(1)38-49 doi101017S0376892997000088
Fortin M-J and M R T Dale 2005 Spatialanalysis a guide for ecologists CambridgeUniversity Press Cambridge UK
Found C S M Webb and M S Boyce 2008Selection of lake habitats by waterbirds in the borealtransition zone of northeastern Alberta CanadianJournal of Zoology 86(4)277-285 doi101139Z07-137
Fraterrigo J M and J A Downing 2008 Theinfluence of land use on lake nutrients varies withwatershed transport capacity Ecosystems 11(7)1021-1034 doi101007s10021-008-9176-6
Freemark K E D Bert and M A Villard 2002Patch- landscape- and regional-scale effects onbiota Pages 58-83 in K J Gutzwiller editorApplying landscape ecology in biologicalconservation Springer New York New YorkUSA
Gamma Design Software 2001 GS+ geostatisticsfor the environmental sciences PlainwellMichigan USA
Garshellis D L 2000 Delusions in habitatevaluation measuring use selection andimportance Pages 111-153 in L Boitani and T KFuller editors Research techniques in animalecology controversies and consequences ColumbiaUniversity Press New York New York USA
Goldstein H 2003 Multilevel statistical models Third edition Hodder Arnold London UK
Graf R F K Bollmann W Suter and HBugmann 2005 The importance of spatial scale inhabitat models Capercaillie in the Swiss AlpsLandscape Ecology 20(6)703-717 doi101007s10980-005-0063-7
Graham M H 2003 Confronting multicollinearityin ecological multiple regression Ecology 842809-2815 doi10189002-3114
Gutzwiller K J and S H Anderson 1987Multiscale associations between cavity-nestingbirds and features of Wyoming streamsidewoodlands Condor 89534-548 doi1023071368643
Hames R S J D Lowe S Barker Swarthout andK V Rosenberg 2006 Understanding the risk toneotropical migrant bird species of multiple human-caused stressors elucidating processes behindpatterns Ecology and Society 11(1) 24 [online]URL httpwwwecologyandsocietyorgvol11iss1art24
Hammond C A M 2008 A demographic andlandscape analysis for common loons in northwestMontana Thesis University of Montana MissoulaMontana USA [online] URL httpetdlibumteduthesesavailableetd-04242008-130448
Heimberger M D Euler and J Barr 1983 Theimpact of cottage development on Common Loonreproductive success in central Ontario WilsonBulletin 95(3)431-439
Heinz H T Waldhoumlr and M Mittlboumlck 2005Careful use of pseudo R-squared measures inepidemiological studies Statistics in Medicine 24(18)2867-2872 doi101002sim2168
Avian Conservation and Ecology 6(1) 4httpwwwace-ecoorgvol6iss1art4
Hollister J W P V August J F Paul and H AWalker 2008 Predicting estuarine sediment metalconcentrations and inferred ecological conditionsan information theoretic approach Journal ofEnvironmental Quality 37(1)234-244 doi102134jeq20070105
Hosmer D W and S Lemeshow 2000 Appliedlogistic regression analysis Second edition WileyNew York New York USA doi1010020471722146
Hutchinson G E 1957 A treatise of limnologyVolume 1 geography physics and chemistry WileyNew York New York USA
Johnson J B and K S Omland 2004 Modelselection in ecology and evolution Trends inEcology and Evolution 19(2)101-108 doi101016jtree200310013
Johnson M D 2007 Measuring habitat quality areview Condor 109(3)489-504 doi10165083471
Johnston C A and B A Shmagin 2006 Scaleissues in lake-watershed interactions assessingshoreline development impacts on water clarityPages 297-313 in J Wu K B Jones H Li and OL Loucks editors Scaling and uncertainty analysisin ecology methods and applications SpringerDordrecht The Netherlands
Jung R E 1991 Effects of human activities andlake characteristics on the behavior and breedingsuccess of Common Loons Passenger Pigeon 53207-218
Kamman N C N M Burgess C T Driscoll HA Simonin W Goodale J Linehan R EstabrookM Hutcheson A Major A M Scheuhammer andD A Scruton 2005 Mercury in freshwater fish ofnortheast North America a geographic perspectivebased on fish tissue monitoring databasesEcotoxicology 14(1-2)163-180 doi101007s10646-004-6267-9
Kristan W B III 2006 Sources and expectationsfor hierarchical structure in bird-habitat associationsCondor 108(1)5-12 doi1016500010-5422(2006)108[0005SAEFHS]20CO2
Kristan W B III and J M Scott 2006Hierarchical models for avian ecologists Condor 108(1)1-4 doi1016500010-5422(2006)108[0001HMFAE]20CO2
Kuhn-Hines A 2008 A multiscale approach tobreeding habitat model development and evaluationfor the common loon Gavia immer in NewHampshire USA ETD Collection for University ofRhode Island Paper AAI3346850 [online] URL httpdigitalcommonsuriedudissertationsAAI3346850
Lawler J J and T C Edwards Jr 2006 Avariance-decomposition approach to investigatingmultiscale habitat associations Condor 108(1)47-58 doi1016500010-5422(2006)108[0047AVATIM]20CO2
Li X D Li Z Ma and D Schneider 2006 Nestsite use by crested ibis dependence of a multifactormodel on spatial scale Landscape Ecology 21(8)1207-1216 doi101007s10980-006-0021-z
Loon Preservation Committee 2004 Fieldcollection protocol for surveying and managingCommon Loons in New Hampshire LoonPreservation Committee Moultonborough NewHampshire USA
Loon Preservation Committee 2005 Meeting thechallenge thirty years of preserving loons and theirhabitats in New Hampshire Loon PreservationCommittee Moultonborough New HampshireUSA
Luck G W 2002 The habitat requirements of therufous treecreeper (Climacteris rufa) 1 Preferentialhabitat use demonstrated at multiple spatial scalesBiological Conservation 105(3)383-394 doi101016S0006-3207(01)00222-1
MacKenzie D I 2005 Was it there Dealing withimperfect detection for species presenceabsencedata Australian and New Zealand Journal ofStatistics 47(1)65-74 doi101111j1467-842X200500372x
MacKenzie D I J D Nichols J E Hines M GKnutson and A B Franklin 2003 Estimating siteoccupancy colonization and local extinction whena species is detected imperfectly Ecology 84(8)2200-2207 doi10189002-3090
Avian Conservation and Ecology 6(1) 4httpwwwace-ecoorgvol6iss1art4
Martin S L and P A Soranno 2006 Lakelandscape position relationships to hydrologicconnectivity and landscape features Limnology andOceanography 51(2)801-814 doi104319lo20065120801
McGarigal K and B J Marks 1995 FRAGSTATSspatial pattern analysis program for quantifyinglandscape structure General Technical ReportPNW-GTR-351 US Department of AgricultureForest Service Washington DC USA
McIntyre J W 1983 Nurseries a consideration ofhabitat requirements during the early chick-rearingperiod in common loons Journal of FieldOrnithology 54(3)247-253
McIntyre J W 1988 The Common Loon spirit ofnorthern lakes University of Minnesota PressMinneapolis Minnesota USA
McIntyre J W and J F Barr 1997 Common loonGavia immer In A Poole and F Gill editors TheBirds of North America 313 Academy of NaturalSciences of Philadelphia and American OrnithologistsUnion Washington DC USA
Menard S 2002 Applied logistic regressionanalysis Second edition Sage PublicationsThousand Oaks California USA
Meyer C B S L Miller and C J Ralph 2002Multi-scale landscape and seascape patternsassociated with marbeled murrelet nesting areas onthe US west coast Landscape Ecology 17(2)95-115 doi101023A1016574928706
Meyer M W 2006 Evaluating the impact ofmultiple stressors on Common Loon populationdemographics-an integrated laboratory and fieldapproach EPA STAR Co-operative AgreementNumber R82-9085 Environmental ProtectionAgency Washington DC USA
Meyer M W D C Evers J J Hartigan and P SRasmussen 1998 Patterns of common loon (Gaviaimmer) mercury exposure reproduction andsurvival in Wisconsin USA EnvironmentalToxicology and Chemistry 17(2)184-190
Meyer M W and J E Woodford 1996Enhancing osprey (Pandion haliaetus) and commonloon (Gavia immer) reproduction on impacted
Wisconsin waterways Final report US Fish andWildlife Service Washington DC USA
Moran P A P 1950 Notes on continuousstochastic phenomena Biometrika 37(1-2)17-23 doi101093biomet371-217
Murtagh P A and P S Pooler 2006 Evaluatingecological indicators lakes in the northeasternUnited States Environmental Monitoring andAssessment 119(1-3)83-96 doi101007s10661-005-9011-x
New Hampshire Department of EnvironmentalServices 2005 Water quality data survey summaryfor New Hampshire lakes and ponds NewHampshire Department of Environmental ServicesNew Hampshire USA [online] URL httpdesnhgovorganizationdivisionswaterwmblakestrophic_summaryhtm
New Hampshire Department of EnvironmentalServices 2006 Community center areas NewHampshire Department of Environmental ServicesNew Hampshire USA [online] URL httpwwwgranitunhedudatadatacatpagescommunitycenterareaspdf
Newbrey J L M A Bozek and N D Niemuth2005 Effects of lake characteristics and humandisturbance on the presence of piscivorous birds innorthern Wisconsin USA Waterbirds 28(4)478-486 doi1016751524-4695(2005)28[478EOLCAH]20CO2
Nocera J J G J Forbes and G R Milton 2008The relevance of local-scale relationships to habitatmanagement and landscape patterns AvianConservation and Ecology - Eacutecologie etconservation des oiseaux 3(1) 4 [online] URL httpwwwace-ecoorgvol3iss1art4
Northeast Loon Study Work Group 2008 [online]URL httpwwwbriloonorgscience-and-conservationcentersNELSWGphp
OrsquoBrien R M 2007 A caution regarding rules ofthumb for variance inflation factors Quality ampQuantity 41(5)673-690 doi101007s11135-006-9018-6
Patton D R 1975 A diversity index for quantifyinghabitat lsquoedgersquo Wildlife Society Bulletin 3171-173
Avian Conservation and Ecology 6(1) 4httpwwwace-ecoorgvol6iss1art4
Penhollow M E and D F Stauffer 2000 Large-scale habitat relationships of neotropical migratorybirds in Virginia Journal of Wildlife Management 64(2)362-373 doi1023073803234
Piper W H C Walcott J N Mager III M PeralaK B Tischler E Harrington A J Turcotte MSchwabenlander and N Banfield 2006 Prospectingin a solitary breeder chick production elicitsterritorial intrusions in common loons BehavioralEcology 17(6)881-888 doi101093behecoarl021
Piper W H C Walcott J N Mager and F JSpilker 2008 Nestsite selection by male loons leadsto sex-biased site familiarity Journal of AnimalEcology 77(2)205-210 doi101111j1365-2656200701334x
Rimmer C C 1992 Common Loon Gavia immer Pages 3-30 in K J Schneider and D M Penceeditors Migratory nongame birds managementconcern in the Northeast US Fish and WildlifeService Newton Corner Massachusetts USA
Riitters K H R V OrsquoNeill and K B Jones 1997Assessing habitat suitability at multiple scales alandscape-level approach Biological Conservation 81(1-2)191-202 doi101016S0006-3207(96)00145-0
Saab V 1999 Importance of spatial scale to habitatuse by breeding birds in riparian forests ahierarchical analysis Ecological Applications 9(1)135-151 doi1018901051-0761(1999)009[0135IOSSTH]20CO2
SAS Institute Inc 2003 SAS 91 Cary NorthCarolina USA
Scott J M P J Heglund M L Morrison J BHaufler M G Raphael W A Wall and F BSamson editors 2002 Predicting speciesoccurrences issues of accuracy and scale IslandPress Washington DC USA
Society for Protection of New Hampshire Forests2005 New Hampshirersquos changing landscapepopulation growth and land use changes Societyfor Protection of New Hampshire Forests [online]URL httpwwwforestsocietyorgresearchresearch-projectsasp
Soranno P A K E Webster K S Cheruvelil andM T Bremigan 2009 The lake landscape-contextframework linking aquatic connections terrestrialfeatures and human effects at multiple scalesVerhandlungen des Internationalen Verein Limnologie 30(5)695-700
Sperduto D D and W F Nichols 2004 Naturalcommunities of New Hampshire New HampshireNatural Heritage Bureau Concord New HampshireUSA and University of New HampshireCooperative Extension Durham New HampshireUSA
SPSS Inc 1999 SPSS 100 Chicago Illinois USA
Stauffer H B C J Ralph and S L Miller 2004Ranking habitat for marbled murrelets a newconservation approach for species with uncertaindetection Ecological Applications 14(5)1374-1383doi10189003-5068
Stein B A and S R Flack 1997 1997 speciesreport card the status of US plants and animals The Nature Conservancy Arlington VirginiaUSA [online] URL httpwwwnatureserveorglibrary1997speciesreportcardpdf
Strauss B and R Biedermann 2007 Evaluatingtemporal and spatial generality How valid arespecies-habitat relationship models EcologicalModeling 204104-114 doi101016jecolmodel200612027
Strong P I V and J A Bissonette 1989 Feedingand chick-rearing areas of common loons Journalof Wildlife Management 5372-76 doi1023073801308
Strong P I V J A Bissonette and J S Fair 1987Reuse of nesting and nursery areas by CommonLoons Journal of Wildlife Management 51123-127doi1023073801642
Taylor K M and H S Vogel 2000 NewHampshire report Pages 110-113 in J McIntyre andD C Evers editors Loons old history and newfindings Proceedings symposium 1997 meetingAmerican Ornithologists Union North AmericanLoon Fund Holderness New Hampshire USA
Thogmartin W E 2007 Effects at the landscapescale may constrain habitat relations at finer scales
Avian Conservation and Ecology 6(1) 4httpwwwace-ecoorgvol6iss1art4
Avian Conservation and Ecology - Eacutecologie etconservation des oiseaux 2(2) 6 [online] URL URL httpwwwace-ecoorgvol2iss2art6
Thogmartin W E and M G Knutson 2007Scaling local species-habitat relations to the largerlandscape with a hierarchical spatial count modelLandscape Ecology 22(1)61-75 doi101007s10980-006-9005-2
Thompson C M and K McGarigal 2002 Theinfluence of research scale on bald eagle habitatselection along the lower Hudson River New York(USA) Landscape Ecology 17(6)569-586 doi101023A1021501231182
Titus J R and L W VanDruff 1981 Responseof the common loon to recreational pressure in theBoundary Waters Canoe Area northeasternMinnesota Wildlife Monographs 791-60
Trocki C L and P W C Paton 2006 Assessinghabitat selection by foraging egrets in salt marshesat multiple spatial scales Wetlands 26(2)307-312 doi1016720277-5212(2006)26[307AHSBFE]20CO2
Turner M G 2005 Landscape ecology What isthe state of the science Annual Review of EcologyEvolution and Systematics 36319-344 doi101146annurevecolsys36102003152614
Tyre A J B Tenhumberg S A Field D NiejalkeK Parris and H P Possingham 2003 Improvingprecision and reducing bias in biological surveysestimating false-negative error rates EcologicalApplications 13(6)1790-1801 doi10189002-5078
Vermeer K 1973 Some aspects of the nestingrequirements of common loons in Alberta WilsonBulletin 85429-435
Wiens J A 1989 Spatial scaling in ecologyFunctional Ecology 3385-397 doi1023072389612
Wiens J A 2002 Riverine landscapes takinglandscape ecology into the water FreshwaterBiology 47(4)501-515 doi101046j1365-2427200200887x
Wiens J A J T Rotenberry and B van Horne1987 Habitat occupancy patterns of North
American shrubsteppe birds the effects of spatialscale Oikos 48132-147 doi1023073565849
Wilcove D S D Rothstein J Dubow A Phillipsand E Losos 1998 Quantifying threats to imperiledspecies in the United States Bioscience 48607-615doi1023071313420
Wu J 2004 Effects of changing scale on landscapepattern analysis scaling relations LandscapeEcology 19(2)125-138 doi101023BLAND000002171140074ae
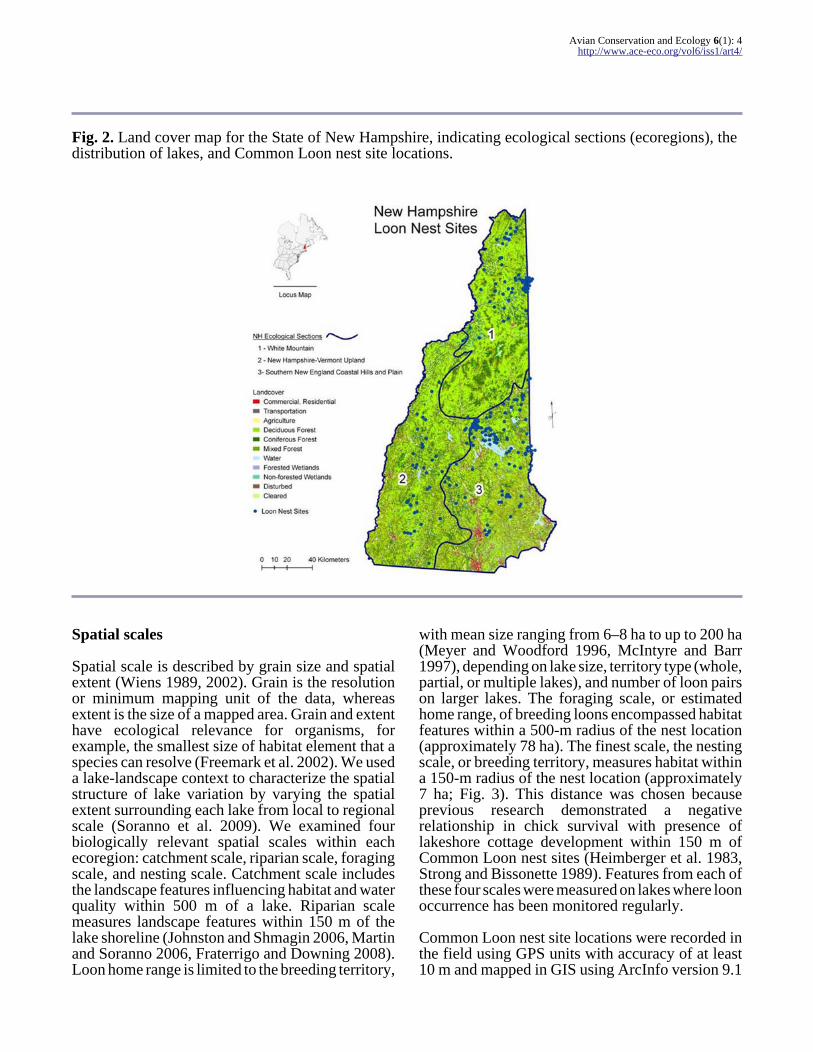
Avian Conservation and Ecology 6(1) 4httpwwwace-ecoorgvol6iss1art4
Fig 2 Land cover map for the State of New Hampshire indicating ecological sections (ecoregions) thedistribution of lakes and Common Loon nest site locations
Spatial scales
Spatial scale is described by grain size and spatialextent (Wiens 1989 2002) Grain is the resolutionor minimum mapping unit of the data whereasextent is the size of a mapped area Grain and extenthave ecological relevance for organisms forexample the smallest size of habitat element that aspecies can resolve (Freemark et al 2002) We useda lake-landscape context to characterize the spatialstructure of lake variation by varying the spatialextent surrounding each lake from local to regionalscale (Soranno et al 2009) We examined fourbiologically relevant spatial scales within eachecoregion catchment scale riparian scale foragingscale and nesting scale Catchment scale includesthe landscape features influencing habitat and waterquality within 500 m of a lake Riparian scalemeasures landscape features within 150 m of thelake shoreline (Johnston and Shmagin 2006 Martinand Soranno 2006 Fraterrigo and Downing 2008)Loon home range is limited to the breeding territory
with mean size ranging from 6ndash8 ha to up to 200 ha(Meyer and Woodford 1996 McIntyre and Barr1997) depending on lake size territory type (wholepartial or multiple lakes) and number of loon pairson larger lakes The foraging scale or estimatedhome range of breeding loons encompassed habitatfeatures within a 500-m radius of the nest location(approximately 78 ha) The finest scale the nestingscale or breeding territory measures habitat withina 150-m radius of the nest location (approximately7 ha Fig 3) This distance was chosen becauseprevious research demonstrated a negativerelationship in chick survival with presence oflakeshore cottage development within 150 m ofCommon Loon nest sites (Heimberger et al 1983Strong and Bissonette 1989) Features from each ofthese four scales were measured on lakes where loonoccurrence has been monitored regularly
Common Loon nest site locations were recorded inthe field using GPS units with accuracy of at least10 m and mapped in GIS using ArcInfo version 91
Avian Conservation and Ecology 6(1) 4httpwwwace-ecoorgvol6iss1art4
Table 1 Monitored frequency of occurrence of breeding Common Loon in three New Hampshirephysiographic ecoregions
Territorial Common Loon
Ecoregion Number of lakes monitored Present Absent
1 Northern White Mountain 59 44 15
2 New Hampshire-Vermont Upland 130 58 72
3 Southern New England Coastal Hills and Plain 133 79 54
Statewide combined multiscale model 322 181 141
software (Environmental Systems ResearchInstitute 2009)
Environmental variables
Based on discussions with Common Loon fieldexperts from the LPC and on published habitatinformation a suite of environmental habitatvariables were considered for inclusion in a priorimodels to describe breeding loon habitatpreferences Twenty-one variables (Table 2) weremeasured for 322 lakes that were consistentlymonitored from 1995 through 2006 by the LPC(Table 1) The variables chosen are thought to havebiological relevance for loons by directly orindirectly influencing habitat associations andpreferences Habitat data were acquired from theNew Hampshire state GIS databases (NH GRANIThttpwwwgranitunhedu) The most recent waterquality values for each lake were obtained from theNew Hampshire DES lake monitoring program(New Hampshire Department of EnvironmentalServices 2005) The 2001 New Hampshire landcover data (30-m cell size 2001) represent 23 landcover classes that we aggregated and re-classifiedto seven land cover types following an AndersonLevel I classification system (Anderson et al 1976Table 2) The proportions of each land cover classand road data (124000 scale 2005) were assessedwithin 150- and 500-m zones around each lake
The LPC monitoring program requires a minimumof three visits to each lake during the breedingseason and repeated visits to lakes over multipleyears The large size (27ndash63 kg) and aggressive
and conspicuous territorial behavior of loons resultsin high detection probability (Hammond 2008)Therefore monitoring data were not adjusted forfalse absences (MacKenzie et al 2003 Tyre et al2003 Stauffer et al 2004 MacKenzie 2005) Non-nesting sites were randomly located on the 141 lakesthat had been monitored multiple times over at leastone decade but where loons were never observedThese verified absence lakes were at least 10 ha insize which is generally considered a minimum forCommon Loon habitat suitability (Evers 2007) Weused verified absence lakes for random non-nestingsites instead of using unoccupied portions of lakesoccupied by loons to avoid violating statisticalassumptions of independence and because of theloonrsquos highly territorial behavior during thebreeding season We developed a GIS program torandomly locate a non-nesting point along anabsence lakersquos perimeter The program allows forthe possibility that the random non-nest point maybe placed on an island shoreline (Fig 4) GISbuffering tools were then used to quantify the landcover and road density within 150- and 500-m radiisurrounding the nest and random non-nest locations(Fig 3) There was no overlap among nest or non-nest site locations for any of the radius regions
The minimum distance from the nest or non-nestpoint location to the nearest human populationcenter was computed to evaluate potential effectsof human disturbance This metric provides ameasure of a nestrsquos or non-nestrsquos proximity to high-density residential development and municipalcommunity centers (defined by New HampshireDepartment of Environmental Services 2006)Other lake-specific variables that were evaluated as
Avian Conservation and Ecology 6(1) 4httpwwwace-ecoorgvol6iss1art4
Fig 3 Maps illustrating land cover and road density within 150- and 500-m zones of each lake andwithin 150- and 500-m radii of a Common Loon nest site and a randomly chosen non-nest site Red andblue lines represent the 150- and 500-m radii areas respectively surrounding each nest and non-nestsite Purple and black lines represent the 150- and 500-m zones respectively surrounding each lake
indicators of human activity included totalphosphorus conductivity and water clarity (Table2) Each of these is associated with the culturaleutrophication of lakes (Johnston and Shmagin2006 Murtagh and Pooler 2006)
Lake occupancy appears to be spatially correlated(Piper et al 2006 Kuhn-Hines 2008) Two distancemetrics were developed to reflect this behavior onewas the distance to the closest lake and the other
was the distance to the closest lake with CommonLoon present (Table 2 Fig 5) Loons also prefernesting in quiet protective coves found alongconvoluted shorelines (Vermeer 1973 McIntyre1983 1988) Lake perimeter and lake area were usedto develop a lake shape index (shorelinedevelopment index) that describes the irregularityof the shoreline (Hutchinson 1957 Patton 1975McGarigal and Marks 1995 Meyer 2006) Lakeshape was calculated as a ratio of shore length to
Avian Conservation and Ecology 6(1) 4httpwwwace-ecoorgvol6iss1art4
Table 2 Summary of explanatory variables for breeding Common Loon presence and absence lakes acrossNew Hampshire N = 322 lakes Means were measured for the 150-m zone surrounding each lake Allvariables are included to highlight the range of variables considered during the modeling process Wemodeled only variables indicated as included at each of the four scales within each ecoregion and statewide
Mean (SD)
Habitat variable Description Presence Absence Reason for inclusionexclusion
Lake area Lake surface area excluding islands (ha) 209 (1125) 33 (34) Included loons prefer larger lakes for avariety of reasons
Lake perimeter Lake shoreline length (km) 11 (23) 4 (3) Excluded correlated with lake area
Lake shape Lake configuration and shorelinecomplexity
2 (1) 2 (1) Excluded correlated with lake area andperimeter
Maximum depth Maximum lake depth (m) 14 (11) 6 (4) Included important for fishprey habitat
Islands Number of islands per lake 4 (13) 1 (2) Included loons prefer small islands fornesting
Elevation Lake elevation (m) 296 (154) 251 (152) Included estimate of geographicspecification
Lake flushing rate Total volume of water entering a lakeper unit time (msup3yr) divided by lakevolume (msup3)
12 (43) 39 (82) Included important factor in nestsurvivorship
Water clarity Secchi depth transparency reading (m) 45 (21) 26 (12) Included loons are visual predators
Total phosphorous Organic and inorganic forms ofphosphorus (mgL)
0009(0005)
0017(0011)
Included estimate of human disturbance
pH Hydrogen ions in the water or acidity(units)
66 (04) 64 (06) Included indicator of fish habitat
Trophic status Categorical 1 = oligotrophic 5 =mesotrophic 10 = eutrophic
3 (3) 6 (3) Excluded correlated with phosphorous
Conductivity Number of ionic particles present (micromhoscm)
48 (33) 66 (53) Excluded negatively correlated with clarity
Loon distancemetrics
Distance to nearest loon presence lake(upper numbers) and distance to nearestloon absence lake (lower numbers km)
2 (24)6 (45)
5 (52)5 (42)
Included hypothesized loon dispersalfactor
Developed-residentialurban
Proportion of residential and urbandeveloped land within 150- and 500-mzones surrounding each lake and nestnon-nest site ()
3 (4) 4 (7) Included estimate of human disturbance
Agriculture Proportion of pasture hay andcultivated cropland cover within 150-and 500-m zones surrounding each lakeand nestnon-nest site ()
1 (2) 2 (3) Included estimate of human disturbance
Forested Proportion of forested land cover within150- and 500-m zones surrounding eachlake and nestnon-nest site ()
36 (13) 45 (17) Included hypothesized habitat factor
(cond)
Avian Conservation and Ecology 6(1) 4httpwwwace-ecoorgvol6iss1art4
Wetland Proportion of forested and nonforestedwetland cover within 150- and 500-mzones surrounding each lake and nestnon-nest site ()
4 (7) 10 (13) Included hypothesized habitat factor
Open water Proportion of open water with lt 25vegetation or soil within 150- and 500-mzones surrounding each lake and nestnon-nest site ()
54 (12) 35 (13) Included hypothesized habitat factor
Cleared and disturbed Proportion of cleared or disturbed landwithin 150- and 500-m zonessurrounding each lake and nestnon-nestsite ()
3 (4) 4 (6) Excluded correlated with Developed
Road density Density of roads within 150- and 500-mzones surrounding each lake and nestnon-nest site (mmsup2)
1798(1255)
2132(1759)
Included estimate of human disturbance
Minimum distance tohuman populationcenter
Minimum distance to high-densityresidential areas and municipalcommunity centers from nestnon-nestsite (km)
4 (4) 3 (3) Included estimate of human disturbance
the circumference of a circle with the same area asthe lake (Table 2) All GIS metrics were computedusing ArcInfo version 91 (Environmental SystemsResearch Institute 2009)
Single- and multiscale habitat modeldevelopment
We developed Common Loon breeding habitatsuitability index (HSI) models for each spatial scalewithin each of the ecoregions and for all lakescombined for a set of statewide models (n = 322)Prior to model development we screenedexplanatory variables within each spatial scale forstrong correlations because multicollinearity ofindependent explanatory variables can causeproblems in logistic regression models (Menard2002) Explanatory variables used to build the singleand multiscale models were checked formulticollinearity using Pearsonrsquos correlation matrixand variance inflation factors (VIFs) We includedonly covariates that were not highly correlated (| r | lt 06) and made sure that explanatory variablesdisplayed VIFs lt 10 (Graham 2003 OrsquoBrien 2007Table 2)
We used an information theoretic approach formodel development and assessment We followedthe common practice of developing a general globalmodel ie the most complex model of the set ofplausible models using logistic regression andmaximum likelihood estimation to describe loon
nesting habitat at the broadest scale (statewide) andfor each ecoregion and then creating alternativemodels as nested subsets of the global model(Burnham and Anderson 2002) For ease of modelinterpretation and application we modeled onlyadditive terms and did not consider interactionterms We then used various criteria to select themost parsimonious models based on nested subsetsof the habitat variables in the global model that wereassociated with nesting territories at each scale Themodel-fitting statistics included results frommaximum likelihood analyses such as the deviance(minus2logL) and the max-rescaled Rsup2 for each of thecompeting models (Agresti 1996 Hosmer andLemeshow 2000) Max-rescaled Rsup2 is a likelihood-based measure of the strength of associationbetween the dichotomous dependent variable (egCommon Loon nest presence) and the explanatoryvariables (Cox and Snell 1989 Estrella 1998 Heinzet al 2005)
The corrected Akaike Information Criterion forsmall sample size (AICc) was used to evaluate therelative strength of competing plausible models(Burnham and Anderson 2002) within each spatialscale within each region An information criterionestimates the amount of information lost when usinga particular model compared with other possiblemodels Better models lose less information(Burnham and Anderson 2002) AICc values canonly be used to compare models when the responsevariable data sets are exactly the same therefore itis only appropriate to compare competing models
Avian Conservation and Ecology 6(1) 4httpwwwace-ecoorgvol6iss1art4
Fig 4 Maps illustrating how using GIS route feature classes were generated along the perimeter ofeach lake so that all features of a lake including islands are treated as a single entity Along each routea randomly chosen non-nest site was located on lakes that were monitored for loons but had no loonoccurrences
within each region The model with the lowest AICc value of a set of candidate models is considered thebest approximating model ie the mostparsimonious model that achieves a balancebetween bias and variance (Burnham and Anderson2002)
The explanatory variables in the best approximatingmodels at each single spatial scale were then usedto build a multiscale habitat model (Graf et al 2005Lawler and Edwards 2006) for each ecoregion andfor a statewide multiscale model The differencebetween the AICc of a given model and theminimum AICc of the candidate set (∆iAICc) andAICc weights wi (the weight of evidence in favorof a given model relative to the set of candidatemodels) were used to rank the models within eachecoregion (Burnham and Anderson 2002 Anderson2008) When it is not clear which of the models fromthe set of candidate models is best as measured byAICc wi (ie wi gt 09 for any given model) aninformation theoretic-based model average approachis warranted In this case each of the candidatemodels with substantial empirical support (ie∆iAICc le 2) was weighted by its Akaike weight andcombined into a single averaged model by
generating weighted parameter estimates (ieparameter estimate multiplied by wi and thensummed across all models) for each parametermaking an ldquoaveragedrdquo prediction from thecombined model (Burnham and Anderson 2002Hollister et al 2008) Parameter estimates obtainedby model averaging reduce model selection bias andaccount for model selection uncertainty (Johnsonand Omland 2004)
We used odds ratios to examine the magnitude ofthe effect of an explanatory variable on theprobability of Common Loon nest presence at fixedvalues of other variables The odds ratio representsthe change in odds of observing loon nest presencefor a unit change in the explanatory variable Theodds ratio of an explanatory variable is calculatedas e(b times unit change) where b is the parameterrsquoscoefficient in the multivariable model and the testof whether b gt 0 is equivalent to testing whether theconfidence interval of the odds ratio crosses 10(Earnst et al 2006)
Once the most parsimonious models for each dataset were chosen we used classification tables toassess the accuracy of habitat models (Fielding and
Avian Conservation and Ecology 6(1) 4httpwwwace-ecoorgvol6iss1art4
Fig 5 Development of minimum Euclidian distance measured from the edge of a lake to the edge of thenearest lake with and without loons using GIS
Bell 1997) The area under the curve statistic (AUC)was derived from the receiver operatingcharacteristics (ROC) curve and was calculated foreach model as an additional measure of modelperformance AUC values range from 05 (scoresfor presenceabsence do not differ poor classifier)to 10 (complete distinction of presence fromabsence perfect classifier) For example an AUCof 088 means that a randomly chosen case from thepresence group will have a greater classifier scorethan a random selection from the absence group witha probability of 088 (Fielding and Bell 1997 Grafet al 2005 Hames et al 2006)
Residual analyses of the final fitted models wereused to test for spatial autocorrelation using theMoranrsquos Index method (Moran 1950 Fortin andDale 2005) The Pearson residuals from the fittedprobability (HSI) for each lake and its geographiccoordinates were used to assess spatialautocorrelation in the final models Statisticalanalyses were performed using the softwarepackages SAS 91 (SAS Institute Inc 2003) SPSS120 (SPSS Inc 1999) and GS+ Geostatistics forEnvironmental Sciences (Gamma Design Software2001)
RESULTS
Comparing general summary statistics for CommonLoon presence and absence at lakes across the entirestate of New Hampshire highlighted variablesassociated with loon habitat preferences (Table 2)Loons were found on lakes that were larger deeperand clearer with more islands and shorelineperimeter closer to nearby lakes inhabited by otherloons Loons also selected lakes with reducedconductivity and total phosphorus higher pH athigher elevations with lower flushing rates andfurther away from human community centers Landcover within the 150-m zone surrounding each lakewith loon nests was less developed and cleared hadlower road density less agricultural land forest andwetland and contained more open water comparedto the land cover surrounding the random non-nestsite locations (Table 2)
Ecoregional models
The three physiographic ecoregions of NewHampshire differed in landscape composition for anumber of the measured habitat types Most notably
Avian Conservation and Ecology 6(1) 4httpwwwace-ecoorgvol6iss1art4
there was a higher proportion of human-alteredlandscape in the two ecoregions south of the WhiteMountains (ecoregions 2 and 3 Fig 6) These twosouthern ecoregions have lakes surrounded bygreater areas of developed land and higher roaddensity with higher measured values forconductivity and total phosphorous and closer tohuman population centers (high-density residentialareas and municipal community centers Table 3Fig 6) Lakes in the Northern White Mountainecoregion are found at higher elevations on averagewith greater areas of surrounding forested andwetland habitat far from human population centersThe southwestern ecoregion New Hampshire-Vermont Upland has greater areas of agriculturalland and smaller lakes on average distinguishingthis ecoregion from the other two The southeasternecoregion Southern New England Coastal Hills andPlain has more open water surrounding the lakeslarger and deeper lakes with more shorelineperimeter and more islands per lake on averagecompared to the two other ecoregions (Table 3)
The best approximating model designation withineach data set has the highest AICc weight highestmax-rescaled Rsup2 and highest AUC classificationvalue For ecoregions 1 and 3 the multiscale modelshad the highest AICc weights and highest max-rescaled Rsup2 values compared to each of the singlescale models within each respective ecoregionsuggesting that breeding habitat selection by loonsis occurring at multiple scales It is important to notethat in the Northern White Mountain ecoregion(ecoregion 1) all five models (the four single-scalemodels and the multiscale model) have substantialempirical support (ie ∆iAICc le 2) warranting amultimodel inference or model averaging approachespecially when a particular parameter (ie lakesize) occurs in many of the candidate models(Burnham and Anderson 2002) This is also relevantfor the models in the Southern New England CoastalHills and Plain ecoregion (ecoregion 3) where allfour of the single-scale models have manyparameters in common Therefore model averagingwas performed for all of the candidate models inecoregion 1 and for the two highest ranking modelsin ecoregion 3 by weighting each model by itsAkaike weight and combining into a compositeaveraged model for each of these ecoregions (Tables4 and 5 respectively)
In ecoregion 2 (New Hampshire-Vermont Upland)the best approximating model was the modelmeasured at the catchment scale (landscape features
within 500 m of a lake) However the multiscalemodel also had substantial empirical support Thusmodel averaging was performed with these twomodels to produce a composite averaged model forecoregion 2 (Table 6)
Statewide models
The statewide models had a number of habitatcharacteristics in common describing breeding loonpreferences at each scale positive associations withdistance to human population centers water clarityelevation and lake size and negative associationswith road density and distance to nearby lakes withloon presence The most parsimonious and bestapproximating model was the single riparian-scalemodel developed with environmental variablesmeasured within the 150-m zone of the lake (model22 Table 7) This model describes loon preferencesfor clearer lakes nearby other lakes with loons athigher elevations with less surrounding roaddensity and further from human population centersNotably this was the only model within thestatewide model set that contained the explanatoryvariable islands and the only model with substantialempirical support based on information-theoreticstatistics (∆AICc le 2 Burnham and Anderson 2002)
It is important to note that all of the final modelsacross all three ecoregions including the statewidemodels achieved a high level of overall accuracybased on AUC values which ranged from 0914 to0989 indicating that all of these models predictloon nest presence fairly well The residuals of thebest approximating single-scale and multiscalemodels showed no significant spatial correlationbased on the Moranrsquos Index scores Given the weakspatial dependence of the residuals we did notfurther investigate spatial autocorrelation
DISCUSSION
General habitat suitability model for CommonLoon
Based on information-theoretic statistics the bestapproximating model among the statewide modelsis the single lake scale model describing theenvironment immediately surrounding the lakewithin a 150-m riparian buffer zone Overall optimalbreeding habitat for Common Loon across NewHampshire was identified as having the following
Avian Conservation and Ecology 6(1) 4httpwwwace-ecoorgvol6iss1art4
Fig 6 Proportion of developed land cover composition within 150- and 500-m zones surrounding lakeswithin each ecoregion Blue diamond = 25 quartile red square = minimum value green triangle =median value purple x = maximum value blue star = 75 quartile
Avian Conservation and Ecology 6(1) 4httpwwwace-ecoorgvol6iss1art4
Table 3 Summary of lake habitat for the three ecoregions for selected explanatory variables Means includeboth Common Loon nest presence and absence lakes
Habitat Variable Ecoregion Mean SE Min Max
Lake area (ha) 123
13796303
019010012
101012
32621819
20128
Lake perimeter (km) 123
131842
013007008
019048015
257048710
3019995
Lake maximum depth (m) 123
10195121
142080087
131115
497555549
Islands (numberlake) 123
214
093025121
000
5117128
Elevation (m) 123
465330145
594289207
1551135
728722601
Lake flushing rate (number of turnoversyr) 123
213100341
772277
030202
267176504
Water Clarity Secchi depth(m) 123
313841
022020018
090809
97116102
Total phosphorous (mgL) 123
001200120012
lt00010001
lt0001
000300010001
003800590052
Conductivity (micromhoscm) 123
339248216905
271299477
151016511664
112601827030600
Distance to loon lake (km) 123
253236
035026046
001001001
136174287
Distance to community center (km) 123
852529
075002023
001001001
24266213
Avian Conservation and Ecology 6(1) 4httpwwwace-ecoorgvol6iss1art4
Table 4 Summary of results for ecoregion 1 (Northern White Mountain) habitat models with their associatedAkaike weights N = 59 lakes Models with empirical support ie ∆iAICc le 2 are indicated in bold
Model Scale Rsup2 Kdagger Log likelihood AICc ∆iAICc Weightwi
AUC
2 Multiscale 087 3 minus668 1980 lt 0001 02444 0989
5 Foraging 073 2 minus786 1993 014 02281 0968
3 Catchment 072 2 minus820 2061 081 01627 0951
4 Riparian 072 2 minus826 2074 094 01526 0952
6 Nesting 150-m radius 076 2 minus846 2114 134 01249 0959
1 Global model 086 5 minus536 2185 206 00874 0988
Explanatory variables for each fitted modelDagger
2 Multiscale lake size (+) open water 500N (+)
5 Foraging open water 500N (+)
3 Catchment lake size (+)
4 Riparian lake size (+)
6 Nesting 150-m radius lake size (+)
1 Global model elevation (+) lake size (+) clarity (+) open water 500N (+)
Composite model Nest presence = minus8655 + 3127 (lake size) + 1570 (open water 500N)
daggerK indicates the total number of parameters ie the intercept and explanatory variablesDagger(+) = positive association (minus) = negative association L = lake scale N = nest scale
characteristics clear higher elevation lakes withislands further away from human populationcenters with lower surrounding road densities andwith nearby lakes occupied by other loons Waterclarity has long been associated with loon habitatpreference and our results are consistent withprevious studies (Vermeer 1973 McIntyre 19831988 Blair 1992 Meyer 2006) The significance ofthe minimum-distance-to-nearest-lake-with-loon-presence metric supports anecdotal observationsand published research describing loon nataldispersal This biotic interaction metric describesthe philopatric and conspecific attraction loonsdisplay and reveals the importance of the spatial
configuration of lakes in the selection of loonbreeding habitat (Strong et al 1987 Evers 2001Piper et al 2006 2008)
The unique habitat feature that distinguishes the bestmodel among the statewide models is theexplanatory variable islands which indicates high-quality breeding habitat for loons (Vermeer 1973Jung 1991 McIntyre and Barr 1997 Piper et al2006 Evers 2007) Based on odds ratio estimatesislands and lake clarity were the most importantfactors distinguishing loon breeding habitat for thestatewide data set (Table 8) The best statewidemodel also describes loon preferences for open
Avian Conservation and Ecology 6(1) 4httpwwwace-ecoorgvol6iss1art4
Table 5 Summary of results for ecoregion 3 (Southern New England Coastal Hills and Plain) habitatmodels with their associated Akaike weights N = 133 lakes Models with empirical support ie ∆iAICc le 2 are indicated in bold
Model Scale Rsup2 Kdagger Loglikelihood
AICc ∆iAICc Weight wi AUC
14 Multiscale 072 6 minus3284 7835 lt 0001 04282 0940
18 Nesting 069 4 minus3530 7892 057 03220 0931
15 Catchment 066 5 minus3565 8178 343 00772 0931
16 Riparian 066 5 minus3565 8178 343 00772 0931
17 Foraging 066 5 minus3565 8178 343 00772 0931
13 Globalmodel
075 11 minus3025 8467 632 00181 0949
Explanatory variables for each fitted modelDagger
14 Multiscale lake size (+) elevation (+) clarity (+) distance to loon (minus) phosphorous (minus)
18 Nesting elevation (+) lake size (+) phosphorous (minus)
15 Catchment distance to loon (minus) elevation (+) lake size (+) clarity (+)
16 Riparian distance to loon (minus) elevation (+) lake size (+) clarity (+)
17 Foraging distance to loon (minus) elevation (+) lake size (+) clarity (+)
13 Globalmodel
developed 150L (minus) open water 150L (+) road 150L (minus) islands (+) distance to loon (minus)elevation (+) lake size (+) phosphorous (minus) clarity (+) open water 500N (+)
Composite model Nest presence = minus4550 + 0006 (elevation) + 1180 (lake size) + 01714 (clarity) minus 02183 (distance toloon) minus 179503 (phosphorus)
daggerK indicates the total number of parameters ie the intercept and explanatory variablesDagger(+) = positive association (minus) = negative association L = lake scale N = nest scale
water surrounding the lake (eg hydrologicalconnectivity) Earnst et al (2006) also found thatYellow-billed Loon in northern Alaska selectbreeding habitat based on landscape-scale featuressuch as hydrological connectivity The explanatoryvariable minimum-distance-to-human-population-center was featured at every scale in the statewidemodels providing evidence that loons prefer tosituate nests on lakes further from humandisturbance A lake habitat selection study forwaterbirds in Canada also found that loons prefer
lakes that are farther from human activity or havemore forested land within a 500-m zone (Found etal 2008)
Effects of scale on Common Loon habitatassociations
Another of our objectives was to investigatewhether Common Loon selects breeding habitat atmultiple scales and to determine which scales are
Avian Conservation and Ecology 6(1) 4httpwwwace-ecoorgvol6iss1art4
Table 6 Summary of results for ecoregion 2 (New Hampshire-Vermont Upland) habitat models with theirassociated Akaike weights N = 130 lakes Models with empirical support ie ∆iAICc le 2 are indicatedin bold
Model Scale Rsup2 Kdagger Loglikelihood
AICc ∆iAICc Weight wi AUC
9 Catchment 081 8 minus2437 6593 lt 0001 06757 0971
8 Multiscale 083 10 minus2310 6806 213 02331 0973
10 Riparian 075 6 minus2872 7011 418 00834 0952
7 Globalmodel
079 11 minus2595 7613 1020 00041 0963
11 Foraging 073 7 minus3331 7930 1337 00008 0945
12 Nesting 068 7 minus3627 8745 2153 lt 000001 0930
Explanatory variables for each fitted modelDagger
9 Catchment open water 500L (+) road 500L (minus) islands (+) pH (+) elevation (+) clarity (+)agricultural 500L (minus)
8 Multiscale open water 150L (+) open water 500N (+) islands (+) clarity( +) road density 500L (minus)road density 150N (minus) distance to loon (minus) forest 150N (minus) wetland 150N (minus)
10 Riparian open water 150L (+) islands (+) distance to loon (minus) elevation (+) clarity (+)
7 Globalmodel
open water 150L (+) islands (+) distance to loon (minus) elevation (+) pH (+) clarity (+)agricultural 500L (minus) open water 500L (+) road density 500L (minus) forest 500 (minus)
11 Foraging open water 500N (+) agricultural 500N (minus) clarity (+) elevation (+) lake size (+)
12 Nesting road density 150N (minus) forest 150N (minus) wetland 150N (minus) elevation (+) lake size (+) flushingrate (minus)
Composite model Nest presence = minus22579 + 3179 (islands) + 1047 (clarity) + 0004 (elevation) + 0287 (open water150L) + 0405 (open water 500L) + 01064 (open water 500N) + 272 (pH) minus 0158 (road density 500L) minus 0362 (distanceto loon) minus 0314 (agricultural 500L) minus 0086 (forest 150N) minus 0079 (wetland 150N) minus 0065 (road density 150N)
daggerK indicates the total number of parameters ie the intercept and explanatory variablesDagger(+) = positive association (minus) = negative association L = lake scale N = nest scale
most important Using information theoreticstatistics the multiscale models for two of the threeecoregions were designated the best approximatingmodels and had substantial empirical support in allthree ecoregions Distinct differences are apparentwhen comparing models across ecoregions (Tables4 5 and 6) Loons in New Hampshire appear to be
selecting breeding habitat differently based onphysiographic ecoregion and at multiple scalesThese differences may be a reflection of theoccurrence of different environmental conditionsand ranges of variables in the three different regionsIn the Northern White Mountain ecoregion loonsare selecting breeding territories on the basis of lake
Avian Conservation and Ecology 6(1) 4httpwwwace-ecoorgvol6iss1art4
Table 7 Summary of results for New Hampshire statewide habitat models with their associated Akaikeweights N = 322 lakes Models with empirical support ie ∆iAICc le 2 are indicated in bold
Model Scale Rsup2 Kdagger Log likelihood AICc ∆iAICc Weight wi AUC
22 Riparian 065 8 minus8615 188764 000 08315 0926
21 Catchment 064 8 minus8843 193315 455 00854 0921
23 Foraging 063 7 minus8996 194269 561 00504 0919
19 Global model 070 15 minus8287 197304 854 00115 0941
24 Nesting 062 7 minus9192 198196 954 00071 0914
20 Multiscale 065 8 minus9365 203769 1501 00005 0926
Explanatory variables for each fitted modelDagger
22 Riparian open water 150L (+) elevation (+) islands (+) clarity (+) distance tohuman population (+) distance to loon (minus) road density 150L (minus)
21 Catchment distance to loon (minus) open water 500L (+) road density 500L (minus) elevation (+)lake size (+) clarity (+) distance to human population (+)
23 Foraging distance to loon (minus) open water 500N (+) elevation (+) lake size (+) clarity(+) distance to human population (+)
19 Global model open water 500L (minus) road density 500L (minus) road density 150N (minus) open water500N (+) road density 150L (minus) open water 150L (+) islands (+) distance toloon (minus) elevation (+) lake size (+) pH (+) phosphorous (minus) clarity (+)distance to human population (+)
24 Nesting distance to loon (minus) road density 150N (minus) elevation (+) lake size (+) clarity(+) distance to human population (+)
20 Multiscale distance to loon (minus) open water 500N (+) road density 150L (minus) elevation (+)lake size (+) clarity (+) distance to human population (+)
Statewide model Nest presence = minus7328 + 0115 (open water 150L) + 0001 (elevation) + 1067 (islands) + 0595 (clarity)+ 0211 (distance to human population) minus 0233 (distance to loon) minus 0033 (road density 150 L)
daggerK indicates the total number of parameters ie the intercept and explanatory variablesDagger(+) = positive association (minus) = negative association L = lake scale N = nest scale
size and the amount of open water surrounding thenest (eg island nest sites) In this ecoregion therewas no distinction between loon presence andabsence lakes based on human-altered variablessuch as road density and developed land or waterquality variables associated with human activitiesThe Northern White Mountain ecoregion has lowerroad densities surrounding the lakes and a less
human-dominated landscape in general Thereforethe loonsrsquo apparent selection based on a few lakemorphological factors may be more a reflection ofthe general environmental conditions and lack ofhuman-altered variables to select against It is alsointeresting to note that loons in this northernecoregion do not appear to be using the presence ofother loons on nearby lakes as a habitat selection
Avian Conservation and Ecology 6(1) 4httpwwwace-ecoorgvol6iss1art4
factor as is the case in the two more southerlyecoregions
The results for the Northern White Mountainecoregion suggest that prior to human alteration ofthe landscape loons may have chosen breedinghabitat based primarily on lake morphologicalfactors such as lake size and the amount of openwater surrounding the nest The catchment riparianforaging and nest scale-based models within theNorthern White Mountain ecoregion includeinformation describing the selection of loonbreeding habitat (Table 4) Three of these final fittedsingle-scale models had explanatory variables incommon (ie lake size) and were combined in themultiscale model for this ecoregion to determine thebest approximating model given the data set basedon the model probability Akaike weights wi (Table4) However using evidence ratios (Burnham andAnderson 2002) to compare the two best modelsthe best model (model 1) has only 19 times theweight of evidence relative to the second-best model(model 4) This relatively weak support for any ofthe models being the best model suggests that thesemodels are good candidates for model averaging ormultimodel inference Model averaging increasesparameter estimate precision and reduces biasassociated with model selection especially when allof the models have substantial support and areclosely related as in ecoregion 1
In the southwestern New Hampshire-VermontUpland loons appear to be avoiding human-alteredlandscapes such as those with high road density andgreater areas of agriculture (Table 6) This regionof New Hampshire contains the highest percentageof prime agricultural soils in the state and hasexperienced the highest amount of agriculturalconversion to developed land in the state over the5-yr period from 1997 to 2002 (Society for theProtection of New Hampshire Forests 2005) Withinthis ecoregion loons are selecting lakes with moreislands higher water clarity and more open watersurrounding the lakes and that are nearby otherlakes with loons present The catchment-scalemodel describing features within a 500-m zone ofthe lake best describes the data in this region (model9 Table 6) the only other model that has substantialempirical support for describing this data set is themultiscale model (model 8 Table 6) Thecatchment-scale model differs from the multiscalemodel by identifying positive associations of loonswith pH (an indicator of fishprey habitat) and lakeelevation and a negative association of loons with
agricultural land within 500 m of the lake Insteadof relying on a single best model for this ecoregionwe used model averaging to combine these twohighest ranking models to obtain robust estimatesof model parameters reduce model selection biasand account for model selection uncertainty(Johnson and Omland 2004) Based on the modelaveraged results and using odds ratios to identifyinfluential factors in this region islands pH andwater clarity appear to be the most influential habitatfeatures (Table 8)
Loons in the southeastern Southern New EnglandCoastal Hills and Plain appear to be selectingbreeding habitat similarly across all scales based ona few key elements larger lakes at increasingelevations with lower levels of phosphorous nearbyother lakes with loons (Table 5) Other studies havefound that loons avoid lakes with higherphosphorous and primary productivity (Blair 1992)which can reduce water clarity Total phosphoruswhich is associated with anthropogenic activitiesappears to be an important avoidance factor forloons selecting breeding habitat at multiple scalesbased on the multiscale and nesting-scale modelswhich are the two highest-ranking models for thisregion The two most influential factors in thisregion appear to be lake size and water clarity basedon odds ratio estimates (Table 8)
The natural arrangement of lakes in NewHampshire especially in the southeastern portionof the state (referred to as the Lakes Region) is ofparticular concern because this area has the fastestrate of human population change in NewHampshire The entire state population is projectedto grow by 358000 between 2000 and 2025 withan estimated 80 of that growth in the foursoutheastern counties of New Hampshire along theInterstate Highway 89 corridor and in the LakesRegion (Society for Protection of New HampshireForests 2005) Loons are responding to human-induced pressures on these lakes and across the stateby selecting against anthropogenic features such asroad density total phosphorous and conductivitydeveloped and agricultural lands and humanpopulation centers
CONCLUSION
Our results support the increasing evidence formultiscale habitat associations most commonlyfound in avian species (Gutzwiller and Anderson
Avian Conservation and Ecology 6(1) 4httpwwwace-ecoorgvol6iss1art4
Table 8 Model averaged parameter estimates and odds ratio estimates with confidence intervals forecoregional composite models and the statewide model These parameters constitute the final averagedmodels for each ecoregion and may be used directly to predict Common Loon nest presence regionally andthroughout the state of New Hampshire
Region Variable Theta SE Odds ratio 95 Wald confidence limits
Ecoregion 1 Northern White Mountain
Intercept minus8655 0704
Lake size 3127 0096 6935 0934 51509
Open water 500 nest 1570 0034 1482 1066 2062
Ecoregion 2 New Hampshire-Vermont Upland
Intercept minus22579 10485
Islands 3179 1120 18045 2760 117970
Clarity 1047 0349 2952 1500 5810
Elevation 0004 0002 1004 1000 1007
Open water 150 lake 0287 0136 1383 1153 1658
Open water 500 lake 0405 01145 1499 1198 1877
Open water 500 nest 01064 00485 0890 0810 0979
pH 272 10139 15195 2083 110844
Road density 500 lake minus0158 0064 0880 0789 0983
Distance to loon lake minus03619 0129 0691 0491 0971
Agricultural 500 lake minus03143 01489 0730 0545 0978
Forest 150 nest minus00856 00346 0913 0853 0977
Wetland 150 nest minus00793 00346 0920 0859 0985
Road density 150 nest minus00647 00286 0927 0877 0980
Ecoregion 3 Southern New England Coastal Hills and Plain
Intercept minus4550 0217
Elevation 0006 0001 1004 1000 1009
Lake size 1180 0158 3254 1640 6456
Clarity 01714 02835 1187 0681 2069
Distance to loon lake minus02183 0124 1000 1000 1000
Phosphorous minus179503 3190 lt 0001 lt 0001 lt 0001
(cond)
Avian Conservation and Ecology 6(1) 4httpwwwace-ecoorgvol6iss1art4
New Hampshire Statewide
Intercept minus73821 12467
Open water 150 lake 01150 00200 1122 1079 1167
Elevation 0001 0001 1001 1000 1002
Islands 10674 04210 2908 1274 6637
Clarity 05948 01503 1813 1350 2434
Distance to population center 02105 00797 1234 1056 1443
Distance to loon lake minus02331 00732 0792 0686 0914
Road density 150 lake minus00327 00148 0968 0940 0996
1987 Wiens et al 1987 Saab 1999 Meyer et al2002 Graf et al 2005 Kristan 2006 Lawler andEdwards 2006 Thogmartin 2007) The multiscalemodels within each ecoregion have substantialempirical support in describing breeding habitatsuggesting that Common Loon in New Hampshireis responding to environmental cues at scalesranging from broad catchment to finer riparian areassurrounding lakes as well as within lakes at thenesting scale Loons also appear to be selectinghabitat differently across the ecoregions based onthe varying landscape conditions they encounteracross New Hampshire This differential selectionof breeding habitat across ecoregions providesinformation for prioritizing conservation andfocusing management efforts in New HampshireConservation efforts in the northern ecoregionshould be focused on preserving the relatively lowerlevels of human activity and disturbance pressuressurrounding these northern lakes by preventingincreases in road density and construction nearlakes especially within the immediate shoreline oflarger lakes Loon conservation and managementactivities in the two southern ecoregions shouldfocus on reducing the effects of already existinghuman disturbances on water quality by mitigatingsources of phosphorous that can also directly affectclarity Other activities in these regions shouldinclude the prioritization for protection of high-quality nesting habitat such as small islands andundisturbed areas of lakes and preventingdevelopment in critical loon habitat Our resultssuggest that conservation strategies for CommonLoon should also consider environmental
influences beyond the immediate lake or riparianscale as the analysis demonstrates that loons arealso responding to landscape-level and catchment-scale conditions surrounding lakes
Responses to this article can be read online athttpwwwace-ecoorgvol6iss1art4responses
Acknowledgments
We thank the many people who share our interest inCommon Loon research and conservation Weappreciate the statistical assistance and advice ofDr James Heltshe and helpful advice fromreviewers of early drafts Drs James Lake BryanMilstead and Rick McKinney as well as that of theanonymous reviewers who contributed to the finalversion of this manuscript This is contributionnumber AED-10-048 of the Atlantic EcologyDivision National Health and EnvironmentalEffects Research Laboratory Office of Researchand Development US Environmental ProtectionAgency Although the research described in thiscontribution has been funded wholly by the USEnvironmental Protection Agency it has not beensubjected to Agency-level review Therefore it doesnot necessarily reflect the views of the AgencyMention of trade names products or services doesnot constitute endorsement or recommendation foruse
Avian Conservation and Ecology 6(1) 4httpwwwace-ecoorgvol6iss1art4
LITERATURE CITED
Agresti A 1996 An introduction to categoricaldata analysisWiley New York New York USA
Alvo R D J T Hussell and M Berrill 1988 Thebreeding success of common loons (Gavia immer)in relation to alkalinity and other lake characteristicsin Ontario Canadian Journal of Zoology 66(3)746-752
Anderson D R 2008 Model based inferences inthe life sciences a primer on evidence SpringerNew York New York USA doi101007978-0-387-74075-1
Anderson J R E E Hardy J T Roach and R EWitmer 1976 A land use and land coverclassification system for use with remote sensordata Geological Survey Professional Paper 964 US Geological Survey Washington DC USA
Austin M 2007 Species distribution models andecological theory a critical assessment and somepossible new approaches Ecological Modelling 200(1-2)1-19 doi101016jecolmodel200607005
Barr J F 1986 Population dynamics of thecommon loon associated with mercury-contaminatedwaters in northwestern Ontario Occasional PaperNumber 56 Canadian Wildlife Service OttawaCanada
Battin J and J J Lawler 2006 Cross-scalecorrelations and the design of avian-habitatselection studies Condor 10859-70 doi1016500010-5422(2006)108[0059CCATDA]20CO2
Blair R B 1992 Lake features water quality andthe summer distribution of Common Loons in NewHampshire Journal of Field Ornithology 63(1)1-9
Burgess N M D C Evers and J D Kaplan 2005Mercury and other contaminants in Common Loonsbreeding in Atlantic Canada Ecotoxicology 14(1-2)241-252 doi101007s10646-004-6271-0
Burnham K P and D R Anderson 2002 Modelselection and multimodel inference a practicalinformation-theoretic approach Second editionSpringer New York New York USA
Cox D R and E J Snell 1989 Analysis of binarydata Second edition Chapman amp Hall LondonUK
Cushman S A and K McGarigal 2002Hierarchical multi-scale decomposition of species-environment relationships Landscape Ecology 17(7)637-646 doi101023A1021571603605
Cushman S A and K McGarigal 2004Hierarchical analysis of forest bird species-environment relationships in the Oregon CoastRange Ecological Applications 14(4)1090-1105 doi10189003-5131
Deppe J L and J T Rotenberry 2008 Scale-dependent habitat use by fall migratory birdsvegetation structure floristics and geographyEcological Monographs 78(3)461-487 doi10189007-01631
Desorbo C R K M Taylor D E Kramer J FairJ H Cooley Jr D C Evers W Hanson H SVogel and J L Atwood 2007 Reproductiveadvantages for Common Loons using rafts Journalof Wildlife Management 71(4)1206-1213 doi1021932006-422
Driscoll M J L T Donovan R Mickey AHoward and K K Fleming 2005 Determinants ofwood thrush nest success a multi-scale modelselection approach Journal of Wildlife Management 69(2)699-709 doi1021930022-541X(2005)069[0699DOWTNS]20CO2
Earnst S L R Platte and L Bond 2006 Alandscape-scale model of yellow-billed loon (Gaviaadamsii) habitat preferences in northern AlaskaHydrobiologia 567(1)227-236 doi101007s10750-006-0042-2
Edwards T C Jr G G Moisen T S Frescinoand J J Lawler 2003 Modeling multipleecological scales to link landscape theory to wildlifeconservation Pages 153-172 in J A Bissonette andI Storch editors Landscape ecology and resourcemanagement linking theory with practice IslandPress Washington DC USA
Environmental Systems Research Institute 2009ArcInfo geographic information system (GIS)software Version 91 Redlands California USA
Avian Conservation and Ecology 6(1) 4httpwwwace-ecoorgvol6iss1art4
Estrella A 1998 A new measure of fit for equationswith dichotomous dependent variables Journal ofBusiness and Economic Statistics 16(2)198-205 doi1023071392575
Evers D C 2001 Common Loon populationstudies continental mercury patterns and breedingterritory philopatry Dissertation University ofMinnesota St Paul Minnesota USA
Evers D C 2007 Status assessment andconservation plan for the Common Loon (Gaviaimmer) in North America BRI Report 2007-20 US Fish and Wildlife Service Hadley MassachusettsUSA
Evers D C L J Savoy C R DeSorbo D EYates W Hanson K M Taylor L Siegel J HCooley M S Bank A Major K Munney BMower H S Vogel N Schoch M Pokras M WGoodale and J Fair 2008 Adverse effects fromenvironmental mercury loads on breeding commonloons Ecotoxicology 17(2)69-81 doi101007s10646-007-0168-7
Fielding A H and J F Bell 1997 A review ofmethods for the assessment of prediction errors inconservation presenceabsence models EnvironmentalConservation 24(1)38-49 doi101017S0376892997000088
Fortin M-J and M R T Dale 2005 Spatialanalysis a guide for ecologists CambridgeUniversity Press Cambridge UK
Found C S M Webb and M S Boyce 2008Selection of lake habitats by waterbirds in the borealtransition zone of northeastern Alberta CanadianJournal of Zoology 86(4)277-285 doi101139Z07-137
Fraterrigo J M and J A Downing 2008 Theinfluence of land use on lake nutrients varies withwatershed transport capacity Ecosystems 11(7)1021-1034 doi101007s10021-008-9176-6
Freemark K E D Bert and M A Villard 2002Patch- landscape- and regional-scale effects onbiota Pages 58-83 in K J Gutzwiller editorApplying landscape ecology in biologicalconservation Springer New York New YorkUSA
Gamma Design Software 2001 GS+ geostatisticsfor the environmental sciences PlainwellMichigan USA
Garshellis D L 2000 Delusions in habitatevaluation measuring use selection andimportance Pages 111-153 in L Boitani and T KFuller editors Research techniques in animalecology controversies and consequences ColumbiaUniversity Press New York New York USA
Goldstein H 2003 Multilevel statistical models Third edition Hodder Arnold London UK
Graf R F K Bollmann W Suter and HBugmann 2005 The importance of spatial scale inhabitat models Capercaillie in the Swiss AlpsLandscape Ecology 20(6)703-717 doi101007s10980-005-0063-7
Graham M H 2003 Confronting multicollinearityin ecological multiple regression Ecology 842809-2815 doi10189002-3114
Gutzwiller K J and S H Anderson 1987Multiscale associations between cavity-nestingbirds and features of Wyoming streamsidewoodlands Condor 89534-548 doi1023071368643
Hames R S J D Lowe S Barker Swarthout andK V Rosenberg 2006 Understanding the risk toneotropical migrant bird species of multiple human-caused stressors elucidating processes behindpatterns Ecology and Society 11(1) 24 [online]URL httpwwwecologyandsocietyorgvol11iss1art24
Hammond C A M 2008 A demographic andlandscape analysis for common loons in northwestMontana Thesis University of Montana MissoulaMontana USA [online] URL httpetdlibumteduthesesavailableetd-04242008-130448
Heimberger M D Euler and J Barr 1983 Theimpact of cottage development on Common Loonreproductive success in central Ontario WilsonBulletin 95(3)431-439
Heinz H T Waldhoumlr and M Mittlboumlck 2005Careful use of pseudo R-squared measures inepidemiological studies Statistics in Medicine 24(18)2867-2872 doi101002sim2168
Avian Conservation and Ecology 6(1) 4httpwwwace-ecoorgvol6iss1art4
Hollister J W P V August J F Paul and H AWalker 2008 Predicting estuarine sediment metalconcentrations and inferred ecological conditionsan information theoretic approach Journal ofEnvironmental Quality 37(1)234-244 doi102134jeq20070105
Hosmer D W and S Lemeshow 2000 Appliedlogistic regression analysis Second edition WileyNew York New York USA doi1010020471722146
Hutchinson G E 1957 A treatise of limnologyVolume 1 geography physics and chemistry WileyNew York New York USA
Johnson J B and K S Omland 2004 Modelselection in ecology and evolution Trends inEcology and Evolution 19(2)101-108 doi101016jtree200310013
Johnson M D 2007 Measuring habitat quality areview Condor 109(3)489-504 doi10165083471
Johnston C A and B A Shmagin 2006 Scaleissues in lake-watershed interactions assessingshoreline development impacts on water clarityPages 297-313 in J Wu K B Jones H Li and OL Loucks editors Scaling and uncertainty analysisin ecology methods and applications SpringerDordrecht The Netherlands
Jung R E 1991 Effects of human activities andlake characteristics on the behavior and breedingsuccess of Common Loons Passenger Pigeon 53207-218
Kamman N C N M Burgess C T Driscoll HA Simonin W Goodale J Linehan R EstabrookM Hutcheson A Major A M Scheuhammer andD A Scruton 2005 Mercury in freshwater fish ofnortheast North America a geographic perspectivebased on fish tissue monitoring databasesEcotoxicology 14(1-2)163-180 doi101007s10646-004-6267-9
Kristan W B III 2006 Sources and expectationsfor hierarchical structure in bird-habitat associationsCondor 108(1)5-12 doi1016500010-5422(2006)108[0005SAEFHS]20CO2
Kristan W B III and J M Scott 2006Hierarchical models for avian ecologists Condor 108(1)1-4 doi1016500010-5422(2006)108[0001HMFAE]20CO2
Kuhn-Hines A 2008 A multiscale approach tobreeding habitat model development and evaluationfor the common loon Gavia immer in NewHampshire USA ETD Collection for University ofRhode Island Paper AAI3346850 [online] URL httpdigitalcommonsuriedudissertationsAAI3346850
Lawler J J and T C Edwards Jr 2006 Avariance-decomposition approach to investigatingmultiscale habitat associations Condor 108(1)47-58 doi1016500010-5422(2006)108[0047AVATIM]20CO2
Li X D Li Z Ma and D Schneider 2006 Nestsite use by crested ibis dependence of a multifactormodel on spatial scale Landscape Ecology 21(8)1207-1216 doi101007s10980-006-0021-z
Loon Preservation Committee 2004 Fieldcollection protocol for surveying and managingCommon Loons in New Hampshire LoonPreservation Committee Moultonborough NewHampshire USA
Loon Preservation Committee 2005 Meeting thechallenge thirty years of preserving loons and theirhabitats in New Hampshire Loon PreservationCommittee Moultonborough New HampshireUSA
Luck G W 2002 The habitat requirements of therufous treecreeper (Climacteris rufa) 1 Preferentialhabitat use demonstrated at multiple spatial scalesBiological Conservation 105(3)383-394 doi101016S0006-3207(01)00222-1
MacKenzie D I 2005 Was it there Dealing withimperfect detection for species presenceabsencedata Australian and New Zealand Journal ofStatistics 47(1)65-74 doi101111j1467-842X200500372x
MacKenzie D I J D Nichols J E Hines M GKnutson and A B Franklin 2003 Estimating siteoccupancy colonization and local extinction whena species is detected imperfectly Ecology 84(8)2200-2207 doi10189002-3090
Avian Conservation and Ecology 6(1) 4httpwwwace-ecoorgvol6iss1art4
Martin S L and P A Soranno 2006 Lakelandscape position relationships to hydrologicconnectivity and landscape features Limnology andOceanography 51(2)801-814 doi104319lo20065120801
McGarigal K and B J Marks 1995 FRAGSTATSspatial pattern analysis program for quantifyinglandscape structure General Technical ReportPNW-GTR-351 US Department of AgricultureForest Service Washington DC USA
McIntyre J W 1983 Nurseries a consideration ofhabitat requirements during the early chick-rearingperiod in common loons Journal of FieldOrnithology 54(3)247-253
McIntyre J W 1988 The Common Loon spirit ofnorthern lakes University of Minnesota PressMinneapolis Minnesota USA
McIntyre J W and J F Barr 1997 Common loonGavia immer In A Poole and F Gill editors TheBirds of North America 313 Academy of NaturalSciences of Philadelphia and American OrnithologistsUnion Washington DC USA
Menard S 2002 Applied logistic regressionanalysis Second edition Sage PublicationsThousand Oaks California USA
Meyer C B S L Miller and C J Ralph 2002Multi-scale landscape and seascape patternsassociated with marbeled murrelet nesting areas onthe US west coast Landscape Ecology 17(2)95-115 doi101023A1016574928706
Meyer M W 2006 Evaluating the impact ofmultiple stressors on Common Loon populationdemographics-an integrated laboratory and fieldapproach EPA STAR Co-operative AgreementNumber R82-9085 Environmental ProtectionAgency Washington DC USA
Meyer M W D C Evers J J Hartigan and P SRasmussen 1998 Patterns of common loon (Gaviaimmer) mercury exposure reproduction andsurvival in Wisconsin USA EnvironmentalToxicology and Chemistry 17(2)184-190
Meyer M W and J E Woodford 1996Enhancing osprey (Pandion haliaetus) and commonloon (Gavia immer) reproduction on impacted
Wisconsin waterways Final report US Fish andWildlife Service Washington DC USA
Moran P A P 1950 Notes on continuousstochastic phenomena Biometrika 37(1-2)17-23 doi101093biomet371-217
Murtagh P A and P S Pooler 2006 Evaluatingecological indicators lakes in the northeasternUnited States Environmental Monitoring andAssessment 119(1-3)83-96 doi101007s10661-005-9011-x
New Hampshire Department of EnvironmentalServices 2005 Water quality data survey summaryfor New Hampshire lakes and ponds NewHampshire Department of Environmental ServicesNew Hampshire USA [online] URL httpdesnhgovorganizationdivisionswaterwmblakestrophic_summaryhtm
New Hampshire Department of EnvironmentalServices 2006 Community center areas NewHampshire Department of Environmental ServicesNew Hampshire USA [online] URL httpwwwgranitunhedudatadatacatpagescommunitycenterareaspdf
Newbrey J L M A Bozek and N D Niemuth2005 Effects of lake characteristics and humandisturbance on the presence of piscivorous birds innorthern Wisconsin USA Waterbirds 28(4)478-486 doi1016751524-4695(2005)28[478EOLCAH]20CO2
Nocera J J G J Forbes and G R Milton 2008The relevance of local-scale relationships to habitatmanagement and landscape patterns AvianConservation and Ecology - Eacutecologie etconservation des oiseaux 3(1) 4 [online] URL httpwwwace-ecoorgvol3iss1art4
Northeast Loon Study Work Group 2008 [online]URL httpwwwbriloonorgscience-and-conservationcentersNELSWGphp
OrsquoBrien R M 2007 A caution regarding rules ofthumb for variance inflation factors Quality ampQuantity 41(5)673-690 doi101007s11135-006-9018-6
Patton D R 1975 A diversity index for quantifyinghabitat lsquoedgersquo Wildlife Society Bulletin 3171-173
Avian Conservation and Ecology 6(1) 4httpwwwace-ecoorgvol6iss1art4
Penhollow M E and D F Stauffer 2000 Large-scale habitat relationships of neotropical migratorybirds in Virginia Journal of Wildlife Management 64(2)362-373 doi1023073803234
Piper W H C Walcott J N Mager III M PeralaK B Tischler E Harrington A J Turcotte MSchwabenlander and N Banfield 2006 Prospectingin a solitary breeder chick production elicitsterritorial intrusions in common loons BehavioralEcology 17(6)881-888 doi101093behecoarl021
Piper W H C Walcott J N Mager and F JSpilker 2008 Nestsite selection by male loons leadsto sex-biased site familiarity Journal of AnimalEcology 77(2)205-210 doi101111j1365-2656200701334x
Rimmer C C 1992 Common Loon Gavia immer Pages 3-30 in K J Schneider and D M Penceeditors Migratory nongame birds managementconcern in the Northeast US Fish and WildlifeService Newton Corner Massachusetts USA
Riitters K H R V OrsquoNeill and K B Jones 1997Assessing habitat suitability at multiple scales alandscape-level approach Biological Conservation 81(1-2)191-202 doi101016S0006-3207(96)00145-0
Saab V 1999 Importance of spatial scale to habitatuse by breeding birds in riparian forests ahierarchical analysis Ecological Applications 9(1)135-151 doi1018901051-0761(1999)009[0135IOSSTH]20CO2
SAS Institute Inc 2003 SAS 91 Cary NorthCarolina USA
Scott J M P J Heglund M L Morrison J BHaufler M G Raphael W A Wall and F BSamson editors 2002 Predicting speciesoccurrences issues of accuracy and scale IslandPress Washington DC USA
Society for Protection of New Hampshire Forests2005 New Hampshirersquos changing landscapepopulation growth and land use changes Societyfor Protection of New Hampshire Forests [online]URL httpwwwforestsocietyorgresearchresearch-projectsasp
Soranno P A K E Webster K S Cheruvelil andM T Bremigan 2009 The lake landscape-contextframework linking aquatic connections terrestrialfeatures and human effects at multiple scalesVerhandlungen des Internationalen Verein Limnologie 30(5)695-700
Sperduto D D and W F Nichols 2004 Naturalcommunities of New Hampshire New HampshireNatural Heritage Bureau Concord New HampshireUSA and University of New HampshireCooperative Extension Durham New HampshireUSA
SPSS Inc 1999 SPSS 100 Chicago Illinois USA
Stauffer H B C J Ralph and S L Miller 2004Ranking habitat for marbled murrelets a newconservation approach for species with uncertaindetection Ecological Applications 14(5)1374-1383doi10189003-5068
Stein B A and S R Flack 1997 1997 speciesreport card the status of US plants and animals The Nature Conservancy Arlington VirginiaUSA [online] URL httpwwwnatureserveorglibrary1997speciesreportcardpdf
Strauss B and R Biedermann 2007 Evaluatingtemporal and spatial generality How valid arespecies-habitat relationship models EcologicalModeling 204104-114 doi101016jecolmodel200612027
Strong P I V and J A Bissonette 1989 Feedingand chick-rearing areas of common loons Journalof Wildlife Management 5372-76 doi1023073801308
Strong P I V J A Bissonette and J S Fair 1987Reuse of nesting and nursery areas by CommonLoons Journal of Wildlife Management 51123-127doi1023073801642
Taylor K M and H S Vogel 2000 NewHampshire report Pages 110-113 in J McIntyre andD C Evers editors Loons old history and newfindings Proceedings symposium 1997 meetingAmerican Ornithologists Union North AmericanLoon Fund Holderness New Hampshire USA
Thogmartin W E 2007 Effects at the landscapescale may constrain habitat relations at finer scales
Avian Conservation and Ecology 6(1) 4httpwwwace-ecoorgvol6iss1art4
Avian Conservation and Ecology - Eacutecologie etconservation des oiseaux 2(2) 6 [online] URL URL httpwwwace-ecoorgvol2iss2art6
Thogmartin W E and M G Knutson 2007Scaling local species-habitat relations to the largerlandscape with a hierarchical spatial count modelLandscape Ecology 22(1)61-75 doi101007s10980-006-9005-2
Thompson C M and K McGarigal 2002 Theinfluence of research scale on bald eagle habitatselection along the lower Hudson River New York(USA) Landscape Ecology 17(6)569-586 doi101023A1021501231182
Titus J R and L W VanDruff 1981 Responseof the common loon to recreational pressure in theBoundary Waters Canoe Area northeasternMinnesota Wildlife Monographs 791-60
Trocki C L and P W C Paton 2006 Assessinghabitat selection by foraging egrets in salt marshesat multiple spatial scales Wetlands 26(2)307-312 doi1016720277-5212(2006)26[307AHSBFE]20CO2
Turner M G 2005 Landscape ecology What isthe state of the science Annual Review of EcologyEvolution and Systematics 36319-344 doi101146annurevecolsys36102003152614
Tyre A J B Tenhumberg S A Field D NiejalkeK Parris and H P Possingham 2003 Improvingprecision and reducing bias in biological surveysestimating false-negative error rates EcologicalApplications 13(6)1790-1801 doi10189002-5078
Vermeer K 1973 Some aspects of the nestingrequirements of common loons in Alberta WilsonBulletin 85429-435
Wiens J A 1989 Spatial scaling in ecologyFunctional Ecology 3385-397 doi1023072389612
Wiens J A 2002 Riverine landscapes takinglandscape ecology into the water FreshwaterBiology 47(4)501-515 doi101046j1365-2427200200887x
Wiens J A J T Rotenberry and B van Horne1987 Habitat occupancy patterns of North
American shrubsteppe birds the effects of spatialscale Oikos 48132-147 doi1023073565849
Wilcove D S D Rothstein J Dubow A Phillipsand E Losos 1998 Quantifying threats to imperiledspecies in the United States Bioscience 48607-615doi1023071313420
Wu J 2004 Effects of changing scale on landscapepattern analysis scaling relations LandscapeEcology 19(2)125-138 doi101023BLAND000002171140074ae
Avian Conservation and Ecology 6(1) 4httpwwwace-ecoorgvol6iss1art4
Table 1 Monitored frequency of occurrence of breeding Common Loon in three New Hampshirephysiographic ecoregions
Territorial Common Loon
Ecoregion Number of lakes monitored Present Absent
1 Northern White Mountain 59 44 15
2 New Hampshire-Vermont Upland 130 58 72
3 Southern New England Coastal Hills and Plain 133 79 54
Statewide combined multiscale model 322 181 141
software (Environmental Systems ResearchInstitute 2009)
Environmental variables
Based on discussions with Common Loon fieldexperts from the LPC and on published habitatinformation a suite of environmental habitatvariables were considered for inclusion in a priorimodels to describe breeding loon habitatpreferences Twenty-one variables (Table 2) weremeasured for 322 lakes that were consistentlymonitored from 1995 through 2006 by the LPC(Table 1) The variables chosen are thought to havebiological relevance for loons by directly orindirectly influencing habitat associations andpreferences Habitat data were acquired from theNew Hampshire state GIS databases (NH GRANIThttpwwwgranitunhedu) The most recent waterquality values for each lake were obtained from theNew Hampshire DES lake monitoring program(New Hampshire Department of EnvironmentalServices 2005) The 2001 New Hampshire landcover data (30-m cell size 2001) represent 23 landcover classes that we aggregated and re-classifiedto seven land cover types following an AndersonLevel I classification system (Anderson et al 1976Table 2) The proportions of each land cover classand road data (124000 scale 2005) were assessedwithin 150- and 500-m zones around each lake
The LPC monitoring program requires a minimumof three visits to each lake during the breedingseason and repeated visits to lakes over multipleyears The large size (27ndash63 kg) and aggressive
and conspicuous territorial behavior of loons resultsin high detection probability (Hammond 2008)Therefore monitoring data were not adjusted forfalse absences (MacKenzie et al 2003 Tyre et al2003 Stauffer et al 2004 MacKenzie 2005) Non-nesting sites were randomly located on the 141 lakesthat had been monitored multiple times over at leastone decade but where loons were never observedThese verified absence lakes were at least 10 ha insize which is generally considered a minimum forCommon Loon habitat suitability (Evers 2007) Weused verified absence lakes for random non-nestingsites instead of using unoccupied portions of lakesoccupied by loons to avoid violating statisticalassumptions of independence and because of theloonrsquos highly territorial behavior during thebreeding season We developed a GIS program torandomly locate a non-nesting point along anabsence lakersquos perimeter The program allows forthe possibility that the random non-nest point maybe placed on an island shoreline (Fig 4) GISbuffering tools were then used to quantify the landcover and road density within 150- and 500-m radiisurrounding the nest and random non-nest locations(Fig 3) There was no overlap among nest or non-nest site locations for any of the radius regions
The minimum distance from the nest or non-nestpoint location to the nearest human populationcenter was computed to evaluate potential effectsof human disturbance This metric provides ameasure of a nestrsquos or non-nestrsquos proximity to high-density residential development and municipalcommunity centers (defined by New HampshireDepartment of Environmental Services 2006)Other lake-specific variables that were evaluated as
Avian Conservation and Ecology 6(1) 4httpwwwace-ecoorgvol6iss1art4
Fig 3 Maps illustrating land cover and road density within 150- and 500-m zones of each lake andwithin 150- and 500-m radii of a Common Loon nest site and a randomly chosen non-nest site Red andblue lines represent the 150- and 500-m radii areas respectively surrounding each nest and non-nestsite Purple and black lines represent the 150- and 500-m zones respectively surrounding each lake
indicators of human activity included totalphosphorus conductivity and water clarity (Table2) Each of these is associated with the culturaleutrophication of lakes (Johnston and Shmagin2006 Murtagh and Pooler 2006)
Lake occupancy appears to be spatially correlated(Piper et al 2006 Kuhn-Hines 2008) Two distancemetrics were developed to reflect this behavior onewas the distance to the closest lake and the other
was the distance to the closest lake with CommonLoon present (Table 2 Fig 5) Loons also prefernesting in quiet protective coves found alongconvoluted shorelines (Vermeer 1973 McIntyre1983 1988) Lake perimeter and lake area were usedto develop a lake shape index (shorelinedevelopment index) that describes the irregularityof the shoreline (Hutchinson 1957 Patton 1975McGarigal and Marks 1995 Meyer 2006) Lakeshape was calculated as a ratio of shore length to
Avian Conservation and Ecology 6(1) 4httpwwwace-ecoorgvol6iss1art4
Table 2 Summary of explanatory variables for breeding Common Loon presence and absence lakes acrossNew Hampshire N = 322 lakes Means were measured for the 150-m zone surrounding each lake Allvariables are included to highlight the range of variables considered during the modeling process Wemodeled only variables indicated as included at each of the four scales within each ecoregion and statewide
Mean (SD)
Habitat variable Description Presence Absence Reason for inclusionexclusion
Lake area Lake surface area excluding islands (ha) 209 (1125) 33 (34) Included loons prefer larger lakes for avariety of reasons
Lake perimeter Lake shoreline length (km) 11 (23) 4 (3) Excluded correlated with lake area
Lake shape Lake configuration and shorelinecomplexity
2 (1) 2 (1) Excluded correlated with lake area andperimeter
Maximum depth Maximum lake depth (m) 14 (11) 6 (4) Included important for fishprey habitat
Islands Number of islands per lake 4 (13) 1 (2) Included loons prefer small islands fornesting
Elevation Lake elevation (m) 296 (154) 251 (152) Included estimate of geographicspecification
Lake flushing rate Total volume of water entering a lakeper unit time (msup3yr) divided by lakevolume (msup3)
12 (43) 39 (82) Included important factor in nestsurvivorship
Water clarity Secchi depth transparency reading (m) 45 (21) 26 (12) Included loons are visual predators
Total phosphorous Organic and inorganic forms ofphosphorus (mgL)
0009(0005)
0017(0011)
Included estimate of human disturbance
pH Hydrogen ions in the water or acidity(units)
66 (04) 64 (06) Included indicator of fish habitat
Trophic status Categorical 1 = oligotrophic 5 =mesotrophic 10 = eutrophic
3 (3) 6 (3) Excluded correlated with phosphorous
Conductivity Number of ionic particles present (micromhoscm)
48 (33) 66 (53) Excluded negatively correlated with clarity
Loon distancemetrics
Distance to nearest loon presence lake(upper numbers) and distance to nearestloon absence lake (lower numbers km)
2 (24)6 (45)
5 (52)5 (42)
Included hypothesized loon dispersalfactor
Developed-residentialurban
Proportion of residential and urbandeveloped land within 150- and 500-mzones surrounding each lake and nestnon-nest site ()
3 (4) 4 (7) Included estimate of human disturbance
Agriculture Proportion of pasture hay andcultivated cropland cover within 150-and 500-m zones surrounding each lakeand nestnon-nest site ()
1 (2) 2 (3) Included estimate of human disturbance
Forested Proportion of forested land cover within150- and 500-m zones surrounding eachlake and nestnon-nest site ()
36 (13) 45 (17) Included hypothesized habitat factor
(cond)
Avian Conservation and Ecology 6(1) 4httpwwwace-ecoorgvol6iss1art4
Wetland Proportion of forested and nonforestedwetland cover within 150- and 500-mzones surrounding each lake and nestnon-nest site ()
4 (7) 10 (13) Included hypothesized habitat factor
Open water Proportion of open water with lt 25vegetation or soil within 150- and 500-mzones surrounding each lake and nestnon-nest site ()
54 (12) 35 (13) Included hypothesized habitat factor
Cleared and disturbed Proportion of cleared or disturbed landwithin 150- and 500-m zonessurrounding each lake and nestnon-nestsite ()
3 (4) 4 (6) Excluded correlated with Developed
Road density Density of roads within 150- and 500-mzones surrounding each lake and nestnon-nest site (mmsup2)
1798(1255)
2132(1759)
Included estimate of human disturbance
Minimum distance tohuman populationcenter
Minimum distance to high-densityresidential areas and municipalcommunity centers from nestnon-nestsite (km)
4 (4) 3 (3) Included estimate of human disturbance
the circumference of a circle with the same area asthe lake (Table 2) All GIS metrics were computedusing ArcInfo version 91 (Environmental SystemsResearch Institute 2009)
Single- and multiscale habitat modeldevelopment
We developed Common Loon breeding habitatsuitability index (HSI) models for each spatial scalewithin each of the ecoregions and for all lakescombined for a set of statewide models (n = 322)Prior to model development we screenedexplanatory variables within each spatial scale forstrong correlations because multicollinearity ofindependent explanatory variables can causeproblems in logistic regression models (Menard2002) Explanatory variables used to build the singleand multiscale models were checked formulticollinearity using Pearsonrsquos correlation matrixand variance inflation factors (VIFs) We includedonly covariates that were not highly correlated (| r | lt 06) and made sure that explanatory variablesdisplayed VIFs lt 10 (Graham 2003 OrsquoBrien 2007Table 2)
We used an information theoretic approach formodel development and assessment We followedthe common practice of developing a general globalmodel ie the most complex model of the set ofplausible models using logistic regression andmaximum likelihood estimation to describe loon
nesting habitat at the broadest scale (statewide) andfor each ecoregion and then creating alternativemodels as nested subsets of the global model(Burnham and Anderson 2002) For ease of modelinterpretation and application we modeled onlyadditive terms and did not consider interactionterms We then used various criteria to select themost parsimonious models based on nested subsetsof the habitat variables in the global model that wereassociated with nesting territories at each scale Themodel-fitting statistics included results frommaximum likelihood analyses such as the deviance(minus2logL) and the max-rescaled Rsup2 for each of thecompeting models (Agresti 1996 Hosmer andLemeshow 2000) Max-rescaled Rsup2 is a likelihood-based measure of the strength of associationbetween the dichotomous dependent variable (egCommon Loon nest presence) and the explanatoryvariables (Cox and Snell 1989 Estrella 1998 Heinzet al 2005)
The corrected Akaike Information Criterion forsmall sample size (AICc) was used to evaluate therelative strength of competing plausible models(Burnham and Anderson 2002) within each spatialscale within each region An information criterionestimates the amount of information lost when usinga particular model compared with other possiblemodels Better models lose less information(Burnham and Anderson 2002) AICc values canonly be used to compare models when the responsevariable data sets are exactly the same therefore itis only appropriate to compare competing models
Avian Conservation and Ecology 6(1) 4httpwwwace-ecoorgvol6iss1art4
Fig 4 Maps illustrating how using GIS route feature classes were generated along the perimeter ofeach lake so that all features of a lake including islands are treated as a single entity Along each routea randomly chosen non-nest site was located on lakes that were monitored for loons but had no loonoccurrences
within each region The model with the lowest AICc value of a set of candidate models is considered thebest approximating model ie the mostparsimonious model that achieves a balancebetween bias and variance (Burnham and Anderson2002)
The explanatory variables in the best approximatingmodels at each single spatial scale were then usedto build a multiscale habitat model (Graf et al 2005Lawler and Edwards 2006) for each ecoregion andfor a statewide multiscale model The differencebetween the AICc of a given model and theminimum AICc of the candidate set (∆iAICc) andAICc weights wi (the weight of evidence in favorof a given model relative to the set of candidatemodels) were used to rank the models within eachecoregion (Burnham and Anderson 2002 Anderson2008) When it is not clear which of the models fromthe set of candidate models is best as measured byAICc wi (ie wi gt 09 for any given model) aninformation theoretic-based model average approachis warranted In this case each of the candidatemodels with substantial empirical support (ie∆iAICc le 2) was weighted by its Akaike weight andcombined into a single averaged model by
generating weighted parameter estimates (ieparameter estimate multiplied by wi and thensummed across all models) for each parametermaking an ldquoaveragedrdquo prediction from thecombined model (Burnham and Anderson 2002Hollister et al 2008) Parameter estimates obtainedby model averaging reduce model selection bias andaccount for model selection uncertainty (Johnsonand Omland 2004)
We used odds ratios to examine the magnitude ofthe effect of an explanatory variable on theprobability of Common Loon nest presence at fixedvalues of other variables The odds ratio representsthe change in odds of observing loon nest presencefor a unit change in the explanatory variable Theodds ratio of an explanatory variable is calculatedas e(b times unit change) where b is the parameterrsquoscoefficient in the multivariable model and the testof whether b gt 0 is equivalent to testing whether theconfidence interval of the odds ratio crosses 10(Earnst et al 2006)
Once the most parsimonious models for each dataset were chosen we used classification tables toassess the accuracy of habitat models (Fielding and
Avian Conservation and Ecology 6(1) 4httpwwwace-ecoorgvol6iss1art4
Fig 5 Development of minimum Euclidian distance measured from the edge of a lake to the edge of thenearest lake with and without loons using GIS
Bell 1997) The area under the curve statistic (AUC)was derived from the receiver operatingcharacteristics (ROC) curve and was calculated foreach model as an additional measure of modelperformance AUC values range from 05 (scoresfor presenceabsence do not differ poor classifier)to 10 (complete distinction of presence fromabsence perfect classifier) For example an AUCof 088 means that a randomly chosen case from thepresence group will have a greater classifier scorethan a random selection from the absence group witha probability of 088 (Fielding and Bell 1997 Grafet al 2005 Hames et al 2006)
Residual analyses of the final fitted models wereused to test for spatial autocorrelation using theMoranrsquos Index method (Moran 1950 Fortin andDale 2005) The Pearson residuals from the fittedprobability (HSI) for each lake and its geographiccoordinates were used to assess spatialautocorrelation in the final models Statisticalanalyses were performed using the softwarepackages SAS 91 (SAS Institute Inc 2003) SPSS120 (SPSS Inc 1999) and GS+ Geostatistics forEnvironmental Sciences (Gamma Design Software2001)
RESULTS
Comparing general summary statistics for CommonLoon presence and absence at lakes across the entirestate of New Hampshire highlighted variablesassociated with loon habitat preferences (Table 2)Loons were found on lakes that were larger deeperand clearer with more islands and shorelineperimeter closer to nearby lakes inhabited by otherloons Loons also selected lakes with reducedconductivity and total phosphorus higher pH athigher elevations with lower flushing rates andfurther away from human community centers Landcover within the 150-m zone surrounding each lakewith loon nests was less developed and cleared hadlower road density less agricultural land forest andwetland and contained more open water comparedto the land cover surrounding the random non-nestsite locations (Table 2)
Ecoregional models
The three physiographic ecoregions of NewHampshire differed in landscape composition for anumber of the measured habitat types Most notably
Avian Conservation and Ecology 6(1) 4httpwwwace-ecoorgvol6iss1art4
there was a higher proportion of human-alteredlandscape in the two ecoregions south of the WhiteMountains (ecoregions 2 and 3 Fig 6) These twosouthern ecoregions have lakes surrounded bygreater areas of developed land and higher roaddensity with higher measured values forconductivity and total phosphorous and closer tohuman population centers (high-density residentialareas and municipal community centers Table 3Fig 6) Lakes in the Northern White Mountainecoregion are found at higher elevations on averagewith greater areas of surrounding forested andwetland habitat far from human population centersThe southwestern ecoregion New Hampshire-Vermont Upland has greater areas of agriculturalland and smaller lakes on average distinguishingthis ecoregion from the other two The southeasternecoregion Southern New England Coastal Hills andPlain has more open water surrounding the lakeslarger and deeper lakes with more shorelineperimeter and more islands per lake on averagecompared to the two other ecoregions (Table 3)
The best approximating model designation withineach data set has the highest AICc weight highestmax-rescaled Rsup2 and highest AUC classificationvalue For ecoregions 1 and 3 the multiscale modelshad the highest AICc weights and highest max-rescaled Rsup2 values compared to each of the singlescale models within each respective ecoregionsuggesting that breeding habitat selection by loonsis occurring at multiple scales It is important to notethat in the Northern White Mountain ecoregion(ecoregion 1) all five models (the four single-scalemodels and the multiscale model) have substantialempirical support (ie ∆iAICc le 2) warranting amultimodel inference or model averaging approachespecially when a particular parameter (ie lakesize) occurs in many of the candidate models(Burnham and Anderson 2002) This is also relevantfor the models in the Southern New England CoastalHills and Plain ecoregion (ecoregion 3) where allfour of the single-scale models have manyparameters in common Therefore model averagingwas performed for all of the candidate models inecoregion 1 and for the two highest ranking modelsin ecoregion 3 by weighting each model by itsAkaike weight and combining into a compositeaveraged model for each of these ecoregions (Tables4 and 5 respectively)
In ecoregion 2 (New Hampshire-Vermont Upland)the best approximating model was the modelmeasured at the catchment scale (landscape features
within 500 m of a lake) However the multiscalemodel also had substantial empirical support Thusmodel averaging was performed with these twomodels to produce a composite averaged model forecoregion 2 (Table 6)
Statewide models
The statewide models had a number of habitatcharacteristics in common describing breeding loonpreferences at each scale positive associations withdistance to human population centers water clarityelevation and lake size and negative associationswith road density and distance to nearby lakes withloon presence The most parsimonious and bestapproximating model was the single riparian-scalemodel developed with environmental variablesmeasured within the 150-m zone of the lake (model22 Table 7) This model describes loon preferencesfor clearer lakes nearby other lakes with loons athigher elevations with less surrounding roaddensity and further from human population centersNotably this was the only model within thestatewide model set that contained the explanatoryvariable islands and the only model with substantialempirical support based on information-theoreticstatistics (∆AICc le 2 Burnham and Anderson 2002)
It is important to note that all of the final modelsacross all three ecoregions including the statewidemodels achieved a high level of overall accuracybased on AUC values which ranged from 0914 to0989 indicating that all of these models predictloon nest presence fairly well The residuals of thebest approximating single-scale and multiscalemodels showed no significant spatial correlationbased on the Moranrsquos Index scores Given the weakspatial dependence of the residuals we did notfurther investigate spatial autocorrelation
DISCUSSION
General habitat suitability model for CommonLoon
Based on information-theoretic statistics the bestapproximating model among the statewide modelsis the single lake scale model describing theenvironment immediately surrounding the lakewithin a 150-m riparian buffer zone Overall optimalbreeding habitat for Common Loon across NewHampshire was identified as having the following
Avian Conservation and Ecology 6(1) 4httpwwwace-ecoorgvol6iss1art4
Fig 6 Proportion of developed land cover composition within 150- and 500-m zones surrounding lakeswithin each ecoregion Blue diamond = 25 quartile red square = minimum value green triangle =median value purple x = maximum value blue star = 75 quartile
Avian Conservation and Ecology 6(1) 4httpwwwace-ecoorgvol6iss1art4
Table 3 Summary of lake habitat for the three ecoregions for selected explanatory variables Means includeboth Common Loon nest presence and absence lakes
Habitat Variable Ecoregion Mean SE Min Max
Lake area (ha) 123
13796303
019010012
101012
32621819
20128
Lake perimeter (km) 123
131842
013007008
019048015
257048710
3019995
Lake maximum depth (m) 123
10195121
142080087
131115
497555549
Islands (numberlake) 123
214
093025121
000
5117128
Elevation (m) 123
465330145
594289207
1551135
728722601
Lake flushing rate (number of turnoversyr) 123
213100341
772277
030202
267176504
Water Clarity Secchi depth(m) 123
313841
022020018
090809
97116102
Total phosphorous (mgL) 123
001200120012
lt00010001
lt0001
000300010001
003800590052
Conductivity (micromhoscm) 123
339248216905
271299477
151016511664
112601827030600
Distance to loon lake (km) 123
253236
035026046
001001001
136174287
Distance to community center (km) 123
852529
075002023
001001001
24266213
Avian Conservation and Ecology 6(1) 4httpwwwace-ecoorgvol6iss1art4
Table 4 Summary of results for ecoregion 1 (Northern White Mountain) habitat models with their associatedAkaike weights N = 59 lakes Models with empirical support ie ∆iAICc le 2 are indicated in bold
Model Scale Rsup2 Kdagger Log likelihood AICc ∆iAICc Weightwi
AUC
2 Multiscale 087 3 minus668 1980 lt 0001 02444 0989
5 Foraging 073 2 minus786 1993 014 02281 0968
3 Catchment 072 2 minus820 2061 081 01627 0951
4 Riparian 072 2 minus826 2074 094 01526 0952
6 Nesting 150-m radius 076 2 minus846 2114 134 01249 0959
1 Global model 086 5 minus536 2185 206 00874 0988
Explanatory variables for each fitted modelDagger
2 Multiscale lake size (+) open water 500N (+)
5 Foraging open water 500N (+)
3 Catchment lake size (+)
4 Riparian lake size (+)
6 Nesting 150-m radius lake size (+)
1 Global model elevation (+) lake size (+) clarity (+) open water 500N (+)
Composite model Nest presence = minus8655 + 3127 (lake size) + 1570 (open water 500N)
daggerK indicates the total number of parameters ie the intercept and explanatory variablesDagger(+) = positive association (minus) = negative association L = lake scale N = nest scale
characteristics clear higher elevation lakes withislands further away from human populationcenters with lower surrounding road densities andwith nearby lakes occupied by other loons Waterclarity has long been associated with loon habitatpreference and our results are consistent withprevious studies (Vermeer 1973 McIntyre 19831988 Blair 1992 Meyer 2006) The significance ofthe minimum-distance-to-nearest-lake-with-loon-presence metric supports anecdotal observationsand published research describing loon nataldispersal This biotic interaction metric describesthe philopatric and conspecific attraction loonsdisplay and reveals the importance of the spatial
configuration of lakes in the selection of loonbreeding habitat (Strong et al 1987 Evers 2001Piper et al 2006 2008)
The unique habitat feature that distinguishes the bestmodel among the statewide models is theexplanatory variable islands which indicates high-quality breeding habitat for loons (Vermeer 1973Jung 1991 McIntyre and Barr 1997 Piper et al2006 Evers 2007) Based on odds ratio estimatesislands and lake clarity were the most importantfactors distinguishing loon breeding habitat for thestatewide data set (Table 8) The best statewidemodel also describes loon preferences for open
Avian Conservation and Ecology 6(1) 4httpwwwace-ecoorgvol6iss1art4
Table 5 Summary of results for ecoregion 3 (Southern New England Coastal Hills and Plain) habitatmodels with their associated Akaike weights N = 133 lakes Models with empirical support ie ∆iAICc le 2 are indicated in bold
Model Scale Rsup2 Kdagger Loglikelihood
AICc ∆iAICc Weight wi AUC
14 Multiscale 072 6 minus3284 7835 lt 0001 04282 0940
18 Nesting 069 4 minus3530 7892 057 03220 0931
15 Catchment 066 5 minus3565 8178 343 00772 0931
16 Riparian 066 5 minus3565 8178 343 00772 0931
17 Foraging 066 5 minus3565 8178 343 00772 0931
13 Globalmodel
075 11 minus3025 8467 632 00181 0949
Explanatory variables for each fitted modelDagger
14 Multiscale lake size (+) elevation (+) clarity (+) distance to loon (minus) phosphorous (minus)
18 Nesting elevation (+) lake size (+) phosphorous (minus)
15 Catchment distance to loon (minus) elevation (+) lake size (+) clarity (+)
16 Riparian distance to loon (minus) elevation (+) lake size (+) clarity (+)
17 Foraging distance to loon (minus) elevation (+) lake size (+) clarity (+)
13 Globalmodel
developed 150L (minus) open water 150L (+) road 150L (minus) islands (+) distance to loon (minus)elevation (+) lake size (+) phosphorous (minus) clarity (+) open water 500N (+)
Composite model Nest presence = minus4550 + 0006 (elevation) + 1180 (lake size) + 01714 (clarity) minus 02183 (distance toloon) minus 179503 (phosphorus)
daggerK indicates the total number of parameters ie the intercept and explanatory variablesDagger(+) = positive association (minus) = negative association L = lake scale N = nest scale
water surrounding the lake (eg hydrologicalconnectivity) Earnst et al (2006) also found thatYellow-billed Loon in northern Alaska selectbreeding habitat based on landscape-scale featuressuch as hydrological connectivity The explanatoryvariable minimum-distance-to-human-population-center was featured at every scale in the statewidemodels providing evidence that loons prefer tosituate nests on lakes further from humandisturbance A lake habitat selection study forwaterbirds in Canada also found that loons prefer
lakes that are farther from human activity or havemore forested land within a 500-m zone (Found etal 2008)
Effects of scale on Common Loon habitatassociations
Another of our objectives was to investigatewhether Common Loon selects breeding habitat atmultiple scales and to determine which scales are
Avian Conservation and Ecology 6(1) 4httpwwwace-ecoorgvol6iss1art4
Table 6 Summary of results for ecoregion 2 (New Hampshire-Vermont Upland) habitat models with theirassociated Akaike weights N = 130 lakes Models with empirical support ie ∆iAICc le 2 are indicatedin bold
Model Scale Rsup2 Kdagger Loglikelihood
AICc ∆iAICc Weight wi AUC
9 Catchment 081 8 minus2437 6593 lt 0001 06757 0971
8 Multiscale 083 10 minus2310 6806 213 02331 0973
10 Riparian 075 6 minus2872 7011 418 00834 0952
7 Globalmodel
079 11 minus2595 7613 1020 00041 0963
11 Foraging 073 7 minus3331 7930 1337 00008 0945
12 Nesting 068 7 minus3627 8745 2153 lt 000001 0930
Explanatory variables for each fitted modelDagger
9 Catchment open water 500L (+) road 500L (minus) islands (+) pH (+) elevation (+) clarity (+)agricultural 500L (minus)
8 Multiscale open water 150L (+) open water 500N (+) islands (+) clarity( +) road density 500L (minus)road density 150N (minus) distance to loon (minus) forest 150N (minus) wetland 150N (minus)
10 Riparian open water 150L (+) islands (+) distance to loon (minus) elevation (+) clarity (+)
7 Globalmodel
open water 150L (+) islands (+) distance to loon (minus) elevation (+) pH (+) clarity (+)agricultural 500L (minus) open water 500L (+) road density 500L (minus) forest 500 (minus)
11 Foraging open water 500N (+) agricultural 500N (minus) clarity (+) elevation (+) lake size (+)
12 Nesting road density 150N (minus) forest 150N (minus) wetland 150N (minus) elevation (+) lake size (+) flushingrate (minus)
Composite model Nest presence = minus22579 + 3179 (islands) + 1047 (clarity) + 0004 (elevation) + 0287 (open water150L) + 0405 (open water 500L) + 01064 (open water 500N) + 272 (pH) minus 0158 (road density 500L) minus 0362 (distanceto loon) minus 0314 (agricultural 500L) minus 0086 (forest 150N) minus 0079 (wetland 150N) minus 0065 (road density 150N)
daggerK indicates the total number of parameters ie the intercept and explanatory variablesDagger(+) = positive association (minus) = negative association L = lake scale N = nest scale
most important Using information theoreticstatistics the multiscale models for two of the threeecoregions were designated the best approximatingmodels and had substantial empirical support in allthree ecoregions Distinct differences are apparentwhen comparing models across ecoregions (Tables4 5 and 6) Loons in New Hampshire appear to be
selecting breeding habitat differently based onphysiographic ecoregion and at multiple scalesThese differences may be a reflection of theoccurrence of different environmental conditionsand ranges of variables in the three different regionsIn the Northern White Mountain ecoregion loonsare selecting breeding territories on the basis of lake
Avian Conservation and Ecology 6(1) 4httpwwwace-ecoorgvol6iss1art4
Table 7 Summary of results for New Hampshire statewide habitat models with their associated Akaikeweights N = 322 lakes Models with empirical support ie ∆iAICc le 2 are indicated in bold
Model Scale Rsup2 Kdagger Log likelihood AICc ∆iAICc Weight wi AUC
22 Riparian 065 8 minus8615 188764 000 08315 0926
21 Catchment 064 8 minus8843 193315 455 00854 0921
23 Foraging 063 7 minus8996 194269 561 00504 0919
19 Global model 070 15 minus8287 197304 854 00115 0941
24 Nesting 062 7 minus9192 198196 954 00071 0914
20 Multiscale 065 8 minus9365 203769 1501 00005 0926
Explanatory variables for each fitted modelDagger
22 Riparian open water 150L (+) elevation (+) islands (+) clarity (+) distance tohuman population (+) distance to loon (minus) road density 150L (minus)
21 Catchment distance to loon (minus) open water 500L (+) road density 500L (minus) elevation (+)lake size (+) clarity (+) distance to human population (+)
23 Foraging distance to loon (minus) open water 500N (+) elevation (+) lake size (+) clarity(+) distance to human population (+)
19 Global model open water 500L (minus) road density 500L (minus) road density 150N (minus) open water500N (+) road density 150L (minus) open water 150L (+) islands (+) distance toloon (minus) elevation (+) lake size (+) pH (+) phosphorous (minus) clarity (+)distance to human population (+)
24 Nesting distance to loon (minus) road density 150N (minus) elevation (+) lake size (+) clarity(+) distance to human population (+)
20 Multiscale distance to loon (minus) open water 500N (+) road density 150L (minus) elevation (+)lake size (+) clarity (+) distance to human population (+)
Statewide model Nest presence = minus7328 + 0115 (open water 150L) + 0001 (elevation) + 1067 (islands) + 0595 (clarity)+ 0211 (distance to human population) minus 0233 (distance to loon) minus 0033 (road density 150 L)
daggerK indicates the total number of parameters ie the intercept and explanatory variablesDagger(+) = positive association (minus) = negative association L = lake scale N = nest scale
size and the amount of open water surrounding thenest (eg island nest sites) In this ecoregion therewas no distinction between loon presence andabsence lakes based on human-altered variablessuch as road density and developed land or waterquality variables associated with human activitiesThe Northern White Mountain ecoregion has lowerroad densities surrounding the lakes and a less
human-dominated landscape in general Thereforethe loonsrsquo apparent selection based on a few lakemorphological factors may be more a reflection ofthe general environmental conditions and lack ofhuman-altered variables to select against It is alsointeresting to note that loons in this northernecoregion do not appear to be using the presence ofother loons on nearby lakes as a habitat selection
Avian Conservation and Ecology 6(1) 4httpwwwace-ecoorgvol6iss1art4
factor as is the case in the two more southerlyecoregions
The results for the Northern White Mountainecoregion suggest that prior to human alteration ofthe landscape loons may have chosen breedinghabitat based primarily on lake morphologicalfactors such as lake size and the amount of openwater surrounding the nest The catchment riparianforaging and nest scale-based models within theNorthern White Mountain ecoregion includeinformation describing the selection of loonbreeding habitat (Table 4) Three of these final fittedsingle-scale models had explanatory variables incommon (ie lake size) and were combined in themultiscale model for this ecoregion to determine thebest approximating model given the data set basedon the model probability Akaike weights wi (Table4) However using evidence ratios (Burnham andAnderson 2002) to compare the two best modelsthe best model (model 1) has only 19 times theweight of evidence relative to the second-best model(model 4) This relatively weak support for any ofthe models being the best model suggests that thesemodels are good candidates for model averaging ormultimodel inference Model averaging increasesparameter estimate precision and reduces biasassociated with model selection especially when allof the models have substantial support and areclosely related as in ecoregion 1
In the southwestern New Hampshire-VermontUpland loons appear to be avoiding human-alteredlandscapes such as those with high road density andgreater areas of agriculture (Table 6) This regionof New Hampshire contains the highest percentageof prime agricultural soils in the state and hasexperienced the highest amount of agriculturalconversion to developed land in the state over the5-yr period from 1997 to 2002 (Society for theProtection of New Hampshire Forests 2005) Withinthis ecoregion loons are selecting lakes with moreislands higher water clarity and more open watersurrounding the lakes and that are nearby otherlakes with loons present The catchment-scalemodel describing features within a 500-m zone ofthe lake best describes the data in this region (model9 Table 6) the only other model that has substantialempirical support for describing this data set is themultiscale model (model 8 Table 6) Thecatchment-scale model differs from the multiscalemodel by identifying positive associations of loonswith pH (an indicator of fishprey habitat) and lakeelevation and a negative association of loons with
agricultural land within 500 m of the lake Insteadof relying on a single best model for this ecoregionwe used model averaging to combine these twohighest ranking models to obtain robust estimatesof model parameters reduce model selection biasand account for model selection uncertainty(Johnson and Omland 2004) Based on the modelaveraged results and using odds ratios to identifyinfluential factors in this region islands pH andwater clarity appear to be the most influential habitatfeatures (Table 8)
Loons in the southeastern Southern New EnglandCoastal Hills and Plain appear to be selectingbreeding habitat similarly across all scales based ona few key elements larger lakes at increasingelevations with lower levels of phosphorous nearbyother lakes with loons (Table 5) Other studies havefound that loons avoid lakes with higherphosphorous and primary productivity (Blair 1992)which can reduce water clarity Total phosphoruswhich is associated with anthropogenic activitiesappears to be an important avoidance factor forloons selecting breeding habitat at multiple scalesbased on the multiscale and nesting-scale modelswhich are the two highest-ranking models for thisregion The two most influential factors in thisregion appear to be lake size and water clarity basedon odds ratio estimates (Table 8)
The natural arrangement of lakes in NewHampshire especially in the southeastern portionof the state (referred to as the Lakes Region) is ofparticular concern because this area has the fastestrate of human population change in NewHampshire The entire state population is projectedto grow by 358000 between 2000 and 2025 withan estimated 80 of that growth in the foursoutheastern counties of New Hampshire along theInterstate Highway 89 corridor and in the LakesRegion (Society for Protection of New HampshireForests 2005) Loons are responding to human-induced pressures on these lakes and across the stateby selecting against anthropogenic features such asroad density total phosphorous and conductivitydeveloped and agricultural lands and humanpopulation centers
CONCLUSION
Our results support the increasing evidence formultiscale habitat associations most commonlyfound in avian species (Gutzwiller and Anderson
Avian Conservation and Ecology 6(1) 4httpwwwace-ecoorgvol6iss1art4
Table 8 Model averaged parameter estimates and odds ratio estimates with confidence intervals forecoregional composite models and the statewide model These parameters constitute the final averagedmodels for each ecoregion and may be used directly to predict Common Loon nest presence regionally andthroughout the state of New Hampshire
Region Variable Theta SE Odds ratio 95 Wald confidence limits
Ecoregion 1 Northern White Mountain
Intercept minus8655 0704
Lake size 3127 0096 6935 0934 51509
Open water 500 nest 1570 0034 1482 1066 2062
Ecoregion 2 New Hampshire-Vermont Upland
Intercept minus22579 10485
Islands 3179 1120 18045 2760 117970
Clarity 1047 0349 2952 1500 5810
Elevation 0004 0002 1004 1000 1007
Open water 150 lake 0287 0136 1383 1153 1658
Open water 500 lake 0405 01145 1499 1198 1877
Open water 500 nest 01064 00485 0890 0810 0979
pH 272 10139 15195 2083 110844
Road density 500 lake minus0158 0064 0880 0789 0983
Distance to loon lake minus03619 0129 0691 0491 0971
Agricultural 500 lake minus03143 01489 0730 0545 0978
Forest 150 nest minus00856 00346 0913 0853 0977
Wetland 150 nest minus00793 00346 0920 0859 0985
Road density 150 nest minus00647 00286 0927 0877 0980
Ecoregion 3 Southern New England Coastal Hills and Plain
Intercept minus4550 0217
Elevation 0006 0001 1004 1000 1009
Lake size 1180 0158 3254 1640 6456
Clarity 01714 02835 1187 0681 2069
Distance to loon lake minus02183 0124 1000 1000 1000
Phosphorous minus179503 3190 lt 0001 lt 0001 lt 0001
(cond)
Avian Conservation and Ecology 6(1) 4httpwwwace-ecoorgvol6iss1art4
New Hampshire Statewide
Intercept minus73821 12467
Open water 150 lake 01150 00200 1122 1079 1167
Elevation 0001 0001 1001 1000 1002
Islands 10674 04210 2908 1274 6637
Clarity 05948 01503 1813 1350 2434
Distance to population center 02105 00797 1234 1056 1443
Distance to loon lake minus02331 00732 0792 0686 0914
Road density 150 lake minus00327 00148 0968 0940 0996
1987 Wiens et al 1987 Saab 1999 Meyer et al2002 Graf et al 2005 Kristan 2006 Lawler andEdwards 2006 Thogmartin 2007) The multiscalemodels within each ecoregion have substantialempirical support in describing breeding habitatsuggesting that Common Loon in New Hampshireis responding to environmental cues at scalesranging from broad catchment to finer riparian areassurrounding lakes as well as within lakes at thenesting scale Loons also appear to be selectinghabitat differently across the ecoregions based onthe varying landscape conditions they encounteracross New Hampshire This differential selectionof breeding habitat across ecoregions providesinformation for prioritizing conservation andfocusing management efforts in New HampshireConservation efforts in the northern ecoregionshould be focused on preserving the relatively lowerlevels of human activity and disturbance pressuressurrounding these northern lakes by preventingincreases in road density and construction nearlakes especially within the immediate shoreline oflarger lakes Loon conservation and managementactivities in the two southern ecoregions shouldfocus on reducing the effects of already existinghuman disturbances on water quality by mitigatingsources of phosphorous that can also directly affectclarity Other activities in these regions shouldinclude the prioritization for protection of high-quality nesting habitat such as small islands andundisturbed areas of lakes and preventingdevelopment in critical loon habitat Our resultssuggest that conservation strategies for CommonLoon should also consider environmental
influences beyond the immediate lake or riparianscale as the analysis demonstrates that loons arealso responding to landscape-level and catchment-scale conditions surrounding lakes
Responses to this article can be read online athttpwwwace-ecoorgvol6iss1art4responses
Acknowledgments
We thank the many people who share our interest inCommon Loon research and conservation Weappreciate the statistical assistance and advice ofDr James Heltshe and helpful advice fromreviewers of early drafts Drs James Lake BryanMilstead and Rick McKinney as well as that of theanonymous reviewers who contributed to the finalversion of this manuscript This is contributionnumber AED-10-048 of the Atlantic EcologyDivision National Health and EnvironmentalEffects Research Laboratory Office of Researchand Development US Environmental ProtectionAgency Although the research described in thiscontribution has been funded wholly by the USEnvironmental Protection Agency it has not beensubjected to Agency-level review Therefore it doesnot necessarily reflect the views of the AgencyMention of trade names products or services doesnot constitute endorsement or recommendation foruse
Avian Conservation and Ecology 6(1) 4httpwwwace-ecoorgvol6iss1art4
LITERATURE CITED
Agresti A 1996 An introduction to categoricaldata analysisWiley New York New York USA
Alvo R D J T Hussell and M Berrill 1988 Thebreeding success of common loons (Gavia immer)in relation to alkalinity and other lake characteristicsin Ontario Canadian Journal of Zoology 66(3)746-752
Anderson D R 2008 Model based inferences inthe life sciences a primer on evidence SpringerNew York New York USA doi101007978-0-387-74075-1
Anderson J R E E Hardy J T Roach and R EWitmer 1976 A land use and land coverclassification system for use with remote sensordata Geological Survey Professional Paper 964 US Geological Survey Washington DC USA
Austin M 2007 Species distribution models andecological theory a critical assessment and somepossible new approaches Ecological Modelling 200(1-2)1-19 doi101016jecolmodel200607005
Barr J F 1986 Population dynamics of thecommon loon associated with mercury-contaminatedwaters in northwestern Ontario Occasional PaperNumber 56 Canadian Wildlife Service OttawaCanada
Battin J and J J Lawler 2006 Cross-scalecorrelations and the design of avian-habitatselection studies Condor 10859-70 doi1016500010-5422(2006)108[0059CCATDA]20CO2
Blair R B 1992 Lake features water quality andthe summer distribution of Common Loons in NewHampshire Journal of Field Ornithology 63(1)1-9
Burgess N M D C Evers and J D Kaplan 2005Mercury and other contaminants in Common Loonsbreeding in Atlantic Canada Ecotoxicology 14(1-2)241-252 doi101007s10646-004-6271-0
Burnham K P and D R Anderson 2002 Modelselection and multimodel inference a practicalinformation-theoretic approach Second editionSpringer New York New York USA
Cox D R and E J Snell 1989 Analysis of binarydata Second edition Chapman amp Hall LondonUK
Cushman S A and K McGarigal 2002Hierarchical multi-scale decomposition of species-environment relationships Landscape Ecology 17(7)637-646 doi101023A1021571603605
Cushman S A and K McGarigal 2004Hierarchical analysis of forest bird species-environment relationships in the Oregon CoastRange Ecological Applications 14(4)1090-1105 doi10189003-5131
Deppe J L and J T Rotenberry 2008 Scale-dependent habitat use by fall migratory birdsvegetation structure floristics and geographyEcological Monographs 78(3)461-487 doi10189007-01631
Desorbo C R K M Taylor D E Kramer J FairJ H Cooley Jr D C Evers W Hanson H SVogel and J L Atwood 2007 Reproductiveadvantages for Common Loons using rafts Journalof Wildlife Management 71(4)1206-1213 doi1021932006-422
Driscoll M J L T Donovan R Mickey AHoward and K K Fleming 2005 Determinants ofwood thrush nest success a multi-scale modelselection approach Journal of Wildlife Management 69(2)699-709 doi1021930022-541X(2005)069[0699DOWTNS]20CO2
Earnst S L R Platte and L Bond 2006 Alandscape-scale model of yellow-billed loon (Gaviaadamsii) habitat preferences in northern AlaskaHydrobiologia 567(1)227-236 doi101007s10750-006-0042-2
Edwards T C Jr G G Moisen T S Frescinoand J J Lawler 2003 Modeling multipleecological scales to link landscape theory to wildlifeconservation Pages 153-172 in J A Bissonette andI Storch editors Landscape ecology and resourcemanagement linking theory with practice IslandPress Washington DC USA
Environmental Systems Research Institute 2009ArcInfo geographic information system (GIS)software Version 91 Redlands California USA
Avian Conservation and Ecology 6(1) 4httpwwwace-ecoorgvol6iss1art4
Estrella A 1998 A new measure of fit for equationswith dichotomous dependent variables Journal ofBusiness and Economic Statistics 16(2)198-205 doi1023071392575
Evers D C 2001 Common Loon populationstudies continental mercury patterns and breedingterritory philopatry Dissertation University ofMinnesota St Paul Minnesota USA
Evers D C 2007 Status assessment andconservation plan for the Common Loon (Gaviaimmer) in North America BRI Report 2007-20 US Fish and Wildlife Service Hadley MassachusettsUSA
Evers D C L J Savoy C R DeSorbo D EYates W Hanson K M Taylor L Siegel J HCooley M S Bank A Major K Munney BMower H S Vogel N Schoch M Pokras M WGoodale and J Fair 2008 Adverse effects fromenvironmental mercury loads on breeding commonloons Ecotoxicology 17(2)69-81 doi101007s10646-007-0168-7
Fielding A H and J F Bell 1997 A review ofmethods for the assessment of prediction errors inconservation presenceabsence models EnvironmentalConservation 24(1)38-49 doi101017S0376892997000088
Fortin M-J and M R T Dale 2005 Spatialanalysis a guide for ecologists CambridgeUniversity Press Cambridge UK
Found C S M Webb and M S Boyce 2008Selection of lake habitats by waterbirds in the borealtransition zone of northeastern Alberta CanadianJournal of Zoology 86(4)277-285 doi101139Z07-137
Fraterrigo J M and J A Downing 2008 Theinfluence of land use on lake nutrients varies withwatershed transport capacity Ecosystems 11(7)1021-1034 doi101007s10021-008-9176-6
Freemark K E D Bert and M A Villard 2002Patch- landscape- and regional-scale effects onbiota Pages 58-83 in K J Gutzwiller editorApplying landscape ecology in biologicalconservation Springer New York New YorkUSA
Gamma Design Software 2001 GS+ geostatisticsfor the environmental sciences PlainwellMichigan USA
Garshellis D L 2000 Delusions in habitatevaluation measuring use selection andimportance Pages 111-153 in L Boitani and T KFuller editors Research techniques in animalecology controversies and consequences ColumbiaUniversity Press New York New York USA
Goldstein H 2003 Multilevel statistical models Third edition Hodder Arnold London UK
Graf R F K Bollmann W Suter and HBugmann 2005 The importance of spatial scale inhabitat models Capercaillie in the Swiss AlpsLandscape Ecology 20(6)703-717 doi101007s10980-005-0063-7
Graham M H 2003 Confronting multicollinearityin ecological multiple regression Ecology 842809-2815 doi10189002-3114
Gutzwiller K J and S H Anderson 1987Multiscale associations between cavity-nestingbirds and features of Wyoming streamsidewoodlands Condor 89534-548 doi1023071368643
Hames R S J D Lowe S Barker Swarthout andK V Rosenberg 2006 Understanding the risk toneotropical migrant bird species of multiple human-caused stressors elucidating processes behindpatterns Ecology and Society 11(1) 24 [online]URL httpwwwecologyandsocietyorgvol11iss1art24
Hammond C A M 2008 A demographic andlandscape analysis for common loons in northwestMontana Thesis University of Montana MissoulaMontana USA [online] URL httpetdlibumteduthesesavailableetd-04242008-130448
Heimberger M D Euler and J Barr 1983 Theimpact of cottage development on Common Loonreproductive success in central Ontario WilsonBulletin 95(3)431-439
Heinz H T Waldhoumlr and M Mittlboumlck 2005Careful use of pseudo R-squared measures inepidemiological studies Statistics in Medicine 24(18)2867-2872 doi101002sim2168
Avian Conservation and Ecology 6(1) 4httpwwwace-ecoorgvol6iss1art4
Hollister J W P V August J F Paul and H AWalker 2008 Predicting estuarine sediment metalconcentrations and inferred ecological conditionsan information theoretic approach Journal ofEnvironmental Quality 37(1)234-244 doi102134jeq20070105
Hosmer D W and S Lemeshow 2000 Appliedlogistic regression analysis Second edition WileyNew York New York USA doi1010020471722146
Hutchinson G E 1957 A treatise of limnologyVolume 1 geography physics and chemistry WileyNew York New York USA
Johnson J B and K S Omland 2004 Modelselection in ecology and evolution Trends inEcology and Evolution 19(2)101-108 doi101016jtree200310013
Johnson M D 2007 Measuring habitat quality areview Condor 109(3)489-504 doi10165083471
Johnston C A and B A Shmagin 2006 Scaleissues in lake-watershed interactions assessingshoreline development impacts on water clarityPages 297-313 in J Wu K B Jones H Li and OL Loucks editors Scaling and uncertainty analysisin ecology methods and applications SpringerDordrecht The Netherlands
Jung R E 1991 Effects of human activities andlake characteristics on the behavior and breedingsuccess of Common Loons Passenger Pigeon 53207-218
Kamman N C N M Burgess C T Driscoll HA Simonin W Goodale J Linehan R EstabrookM Hutcheson A Major A M Scheuhammer andD A Scruton 2005 Mercury in freshwater fish ofnortheast North America a geographic perspectivebased on fish tissue monitoring databasesEcotoxicology 14(1-2)163-180 doi101007s10646-004-6267-9
Kristan W B III 2006 Sources and expectationsfor hierarchical structure in bird-habitat associationsCondor 108(1)5-12 doi1016500010-5422(2006)108[0005SAEFHS]20CO2
Kristan W B III and J M Scott 2006Hierarchical models for avian ecologists Condor 108(1)1-4 doi1016500010-5422(2006)108[0001HMFAE]20CO2
Kuhn-Hines A 2008 A multiscale approach tobreeding habitat model development and evaluationfor the common loon Gavia immer in NewHampshire USA ETD Collection for University ofRhode Island Paper AAI3346850 [online] URL httpdigitalcommonsuriedudissertationsAAI3346850
Lawler J J and T C Edwards Jr 2006 Avariance-decomposition approach to investigatingmultiscale habitat associations Condor 108(1)47-58 doi1016500010-5422(2006)108[0047AVATIM]20CO2
Li X D Li Z Ma and D Schneider 2006 Nestsite use by crested ibis dependence of a multifactormodel on spatial scale Landscape Ecology 21(8)1207-1216 doi101007s10980-006-0021-z
Loon Preservation Committee 2004 Fieldcollection protocol for surveying and managingCommon Loons in New Hampshire LoonPreservation Committee Moultonborough NewHampshire USA
Loon Preservation Committee 2005 Meeting thechallenge thirty years of preserving loons and theirhabitats in New Hampshire Loon PreservationCommittee Moultonborough New HampshireUSA
Luck G W 2002 The habitat requirements of therufous treecreeper (Climacteris rufa) 1 Preferentialhabitat use demonstrated at multiple spatial scalesBiological Conservation 105(3)383-394 doi101016S0006-3207(01)00222-1
MacKenzie D I 2005 Was it there Dealing withimperfect detection for species presenceabsencedata Australian and New Zealand Journal ofStatistics 47(1)65-74 doi101111j1467-842X200500372x
MacKenzie D I J D Nichols J E Hines M GKnutson and A B Franklin 2003 Estimating siteoccupancy colonization and local extinction whena species is detected imperfectly Ecology 84(8)2200-2207 doi10189002-3090
Avian Conservation and Ecology 6(1) 4httpwwwace-ecoorgvol6iss1art4
Martin S L and P A Soranno 2006 Lakelandscape position relationships to hydrologicconnectivity and landscape features Limnology andOceanography 51(2)801-814 doi104319lo20065120801
McGarigal K and B J Marks 1995 FRAGSTATSspatial pattern analysis program for quantifyinglandscape structure General Technical ReportPNW-GTR-351 US Department of AgricultureForest Service Washington DC USA
McIntyre J W 1983 Nurseries a consideration ofhabitat requirements during the early chick-rearingperiod in common loons Journal of FieldOrnithology 54(3)247-253
McIntyre J W 1988 The Common Loon spirit ofnorthern lakes University of Minnesota PressMinneapolis Minnesota USA
McIntyre J W and J F Barr 1997 Common loonGavia immer In A Poole and F Gill editors TheBirds of North America 313 Academy of NaturalSciences of Philadelphia and American OrnithologistsUnion Washington DC USA
Menard S 2002 Applied logistic regressionanalysis Second edition Sage PublicationsThousand Oaks California USA
Meyer C B S L Miller and C J Ralph 2002Multi-scale landscape and seascape patternsassociated with marbeled murrelet nesting areas onthe US west coast Landscape Ecology 17(2)95-115 doi101023A1016574928706
Meyer M W 2006 Evaluating the impact ofmultiple stressors on Common Loon populationdemographics-an integrated laboratory and fieldapproach EPA STAR Co-operative AgreementNumber R82-9085 Environmental ProtectionAgency Washington DC USA
Meyer M W D C Evers J J Hartigan and P SRasmussen 1998 Patterns of common loon (Gaviaimmer) mercury exposure reproduction andsurvival in Wisconsin USA EnvironmentalToxicology and Chemistry 17(2)184-190
Meyer M W and J E Woodford 1996Enhancing osprey (Pandion haliaetus) and commonloon (Gavia immer) reproduction on impacted
Wisconsin waterways Final report US Fish andWildlife Service Washington DC USA
Moran P A P 1950 Notes on continuousstochastic phenomena Biometrika 37(1-2)17-23 doi101093biomet371-217
Murtagh P A and P S Pooler 2006 Evaluatingecological indicators lakes in the northeasternUnited States Environmental Monitoring andAssessment 119(1-3)83-96 doi101007s10661-005-9011-x
New Hampshire Department of EnvironmentalServices 2005 Water quality data survey summaryfor New Hampshire lakes and ponds NewHampshire Department of Environmental ServicesNew Hampshire USA [online] URL httpdesnhgovorganizationdivisionswaterwmblakestrophic_summaryhtm
New Hampshire Department of EnvironmentalServices 2006 Community center areas NewHampshire Department of Environmental ServicesNew Hampshire USA [online] URL httpwwwgranitunhedudatadatacatpagescommunitycenterareaspdf
Newbrey J L M A Bozek and N D Niemuth2005 Effects of lake characteristics and humandisturbance on the presence of piscivorous birds innorthern Wisconsin USA Waterbirds 28(4)478-486 doi1016751524-4695(2005)28[478EOLCAH]20CO2
Nocera J J G J Forbes and G R Milton 2008The relevance of local-scale relationships to habitatmanagement and landscape patterns AvianConservation and Ecology - Eacutecologie etconservation des oiseaux 3(1) 4 [online] URL httpwwwace-ecoorgvol3iss1art4
Northeast Loon Study Work Group 2008 [online]URL httpwwwbriloonorgscience-and-conservationcentersNELSWGphp
OrsquoBrien R M 2007 A caution regarding rules ofthumb for variance inflation factors Quality ampQuantity 41(5)673-690 doi101007s11135-006-9018-6
Patton D R 1975 A diversity index for quantifyinghabitat lsquoedgersquo Wildlife Society Bulletin 3171-173
Avian Conservation and Ecology 6(1) 4httpwwwace-ecoorgvol6iss1art4
Penhollow M E and D F Stauffer 2000 Large-scale habitat relationships of neotropical migratorybirds in Virginia Journal of Wildlife Management 64(2)362-373 doi1023073803234
Piper W H C Walcott J N Mager III M PeralaK B Tischler E Harrington A J Turcotte MSchwabenlander and N Banfield 2006 Prospectingin a solitary breeder chick production elicitsterritorial intrusions in common loons BehavioralEcology 17(6)881-888 doi101093behecoarl021
Piper W H C Walcott J N Mager and F JSpilker 2008 Nestsite selection by male loons leadsto sex-biased site familiarity Journal of AnimalEcology 77(2)205-210 doi101111j1365-2656200701334x
Rimmer C C 1992 Common Loon Gavia immer Pages 3-30 in K J Schneider and D M Penceeditors Migratory nongame birds managementconcern in the Northeast US Fish and WildlifeService Newton Corner Massachusetts USA
Riitters K H R V OrsquoNeill and K B Jones 1997Assessing habitat suitability at multiple scales alandscape-level approach Biological Conservation 81(1-2)191-202 doi101016S0006-3207(96)00145-0
Saab V 1999 Importance of spatial scale to habitatuse by breeding birds in riparian forests ahierarchical analysis Ecological Applications 9(1)135-151 doi1018901051-0761(1999)009[0135IOSSTH]20CO2
SAS Institute Inc 2003 SAS 91 Cary NorthCarolina USA
Scott J M P J Heglund M L Morrison J BHaufler M G Raphael W A Wall and F BSamson editors 2002 Predicting speciesoccurrences issues of accuracy and scale IslandPress Washington DC USA
Society for Protection of New Hampshire Forests2005 New Hampshirersquos changing landscapepopulation growth and land use changes Societyfor Protection of New Hampshire Forests [online]URL httpwwwforestsocietyorgresearchresearch-projectsasp
Soranno P A K E Webster K S Cheruvelil andM T Bremigan 2009 The lake landscape-contextframework linking aquatic connections terrestrialfeatures and human effects at multiple scalesVerhandlungen des Internationalen Verein Limnologie 30(5)695-700
Sperduto D D and W F Nichols 2004 Naturalcommunities of New Hampshire New HampshireNatural Heritage Bureau Concord New HampshireUSA and University of New HampshireCooperative Extension Durham New HampshireUSA
SPSS Inc 1999 SPSS 100 Chicago Illinois USA
Stauffer H B C J Ralph and S L Miller 2004Ranking habitat for marbled murrelets a newconservation approach for species with uncertaindetection Ecological Applications 14(5)1374-1383doi10189003-5068
Stein B A and S R Flack 1997 1997 speciesreport card the status of US plants and animals The Nature Conservancy Arlington VirginiaUSA [online] URL httpwwwnatureserveorglibrary1997speciesreportcardpdf
Strauss B and R Biedermann 2007 Evaluatingtemporal and spatial generality How valid arespecies-habitat relationship models EcologicalModeling 204104-114 doi101016jecolmodel200612027
Strong P I V and J A Bissonette 1989 Feedingand chick-rearing areas of common loons Journalof Wildlife Management 5372-76 doi1023073801308
Strong P I V J A Bissonette and J S Fair 1987Reuse of nesting and nursery areas by CommonLoons Journal of Wildlife Management 51123-127doi1023073801642
Taylor K M and H S Vogel 2000 NewHampshire report Pages 110-113 in J McIntyre andD C Evers editors Loons old history and newfindings Proceedings symposium 1997 meetingAmerican Ornithologists Union North AmericanLoon Fund Holderness New Hampshire USA
Thogmartin W E 2007 Effects at the landscapescale may constrain habitat relations at finer scales
Avian Conservation and Ecology 6(1) 4httpwwwace-ecoorgvol6iss1art4
Avian Conservation and Ecology - Eacutecologie etconservation des oiseaux 2(2) 6 [online] URL URL httpwwwace-ecoorgvol2iss2art6
Thogmartin W E and M G Knutson 2007Scaling local species-habitat relations to the largerlandscape with a hierarchical spatial count modelLandscape Ecology 22(1)61-75 doi101007s10980-006-9005-2
Thompson C M and K McGarigal 2002 Theinfluence of research scale on bald eagle habitatselection along the lower Hudson River New York(USA) Landscape Ecology 17(6)569-586 doi101023A1021501231182
Titus J R and L W VanDruff 1981 Responseof the common loon to recreational pressure in theBoundary Waters Canoe Area northeasternMinnesota Wildlife Monographs 791-60
Trocki C L and P W C Paton 2006 Assessinghabitat selection by foraging egrets in salt marshesat multiple spatial scales Wetlands 26(2)307-312 doi1016720277-5212(2006)26[307AHSBFE]20CO2
Turner M G 2005 Landscape ecology What isthe state of the science Annual Review of EcologyEvolution and Systematics 36319-344 doi101146annurevecolsys36102003152614
Tyre A J B Tenhumberg S A Field D NiejalkeK Parris and H P Possingham 2003 Improvingprecision and reducing bias in biological surveysestimating false-negative error rates EcologicalApplications 13(6)1790-1801 doi10189002-5078
Vermeer K 1973 Some aspects of the nestingrequirements of common loons in Alberta WilsonBulletin 85429-435
Wiens J A 1989 Spatial scaling in ecologyFunctional Ecology 3385-397 doi1023072389612
Wiens J A 2002 Riverine landscapes takinglandscape ecology into the water FreshwaterBiology 47(4)501-515 doi101046j1365-2427200200887x
Wiens J A J T Rotenberry and B van Horne1987 Habitat occupancy patterns of North
American shrubsteppe birds the effects of spatialscale Oikos 48132-147 doi1023073565849
Wilcove D S D Rothstein J Dubow A Phillipsand E Losos 1998 Quantifying threats to imperiledspecies in the United States Bioscience 48607-615doi1023071313420
Wu J 2004 Effects of changing scale on landscapepattern analysis scaling relations LandscapeEcology 19(2)125-138 doi101023BLAND000002171140074ae

Avian Conservation and Ecology 6(1) 4httpwwwace-ecoorgvol6iss1art4
Table 2 Summary of explanatory variables for breeding Common Loon presence and absence lakes acrossNew Hampshire N = 322 lakes Means were measured for the 150-m zone surrounding each lake Allvariables are included to highlight the range of variables considered during the modeling process Wemodeled only variables indicated as included at each of the four scales within each ecoregion and statewide
Mean (SD)
Habitat variable Description Presence Absence Reason for inclusionexclusion
Lake area Lake surface area excluding islands (ha) 209 (1125) 33 (34) Included loons prefer larger lakes for avariety of reasons
Lake perimeter Lake shoreline length (km) 11 (23) 4 (3) Excluded correlated with lake area
Lake shape Lake configuration and shorelinecomplexity
2 (1) 2 (1) Excluded correlated with lake area andperimeter
Maximum depth Maximum lake depth (m) 14 (11) 6 (4) Included important for fishprey habitat
Islands Number of islands per lake 4 (13) 1 (2) Included loons prefer small islands fornesting
Elevation Lake elevation (m) 296 (154) 251 (152) Included estimate of geographicspecification
Lake flushing rate Total volume of water entering a lakeper unit time (msup3yr) divided by lakevolume (msup3)
12 (43) 39 (82) Included important factor in nestsurvivorship
Water clarity Secchi depth transparency reading (m) 45 (21) 26 (12) Included loons are visual predators
Total phosphorous Organic and inorganic forms ofphosphorus (mgL)
0009(0005)
0017(0011)
Included estimate of human disturbance
pH Hydrogen ions in the water or acidity(units)
66 (04) 64 (06) Included indicator of fish habitat
Trophic status Categorical 1 = oligotrophic 5 =mesotrophic 10 = eutrophic
3 (3) 6 (3) Excluded correlated with phosphorous
Conductivity Number of ionic particles present (micromhoscm)
48 (33) 66 (53) Excluded negatively correlated with clarity
Loon distancemetrics
Distance to nearest loon presence lake(upper numbers) and distance to nearestloon absence lake (lower numbers km)
2 (24)6 (45)
5 (52)5 (42)
Included hypothesized loon dispersalfactor
Developed-residentialurban
Proportion of residential and urbandeveloped land within 150- and 500-mzones surrounding each lake and nestnon-nest site ()
3 (4) 4 (7) Included estimate of human disturbance
Agriculture Proportion of pasture hay andcultivated cropland cover within 150-and 500-m zones surrounding each lakeand nestnon-nest site ()
1 (2) 2 (3) Included estimate of human disturbance
Forested Proportion of forested land cover within150- and 500-m zones surrounding eachlake and nestnon-nest site ()
36 (13) 45 (17) Included hypothesized habitat factor
(cond)
Avian Conservation and Ecology 6(1) 4httpwwwace-ecoorgvol6iss1art4
Wetland Proportion of forested and nonforestedwetland cover within 150- and 500-mzones surrounding each lake and nestnon-nest site ()
4 (7) 10 (13) Included hypothesized habitat factor
Open water Proportion of open water with lt 25vegetation or soil within 150- and 500-mzones surrounding each lake and nestnon-nest site ()
54 (12) 35 (13) Included hypothesized habitat factor
Cleared and disturbed Proportion of cleared or disturbed landwithin 150- and 500-m zonessurrounding each lake and nestnon-nestsite ()
3 (4) 4 (6) Excluded correlated with Developed
Road density Density of roads within 150- and 500-mzones surrounding each lake and nestnon-nest site (mmsup2)
1798(1255)
2132(1759)
Included estimate of human disturbance
Minimum distance tohuman populationcenter
Minimum distance to high-densityresidential areas and municipalcommunity centers from nestnon-nestsite (km)
4 (4) 3 (3) Included estimate of human disturbance
the circumference of a circle with the same area asthe lake (Table 2) All GIS metrics were computedusing ArcInfo version 91 (Environmental SystemsResearch Institute 2009)
Single- and multiscale habitat modeldevelopment
We developed Common Loon breeding habitatsuitability index (HSI) models for each spatial scalewithin each of the ecoregions and for all lakescombined for a set of statewide models (n = 322)Prior to model development we screenedexplanatory variables within each spatial scale forstrong correlations because multicollinearity ofindependent explanatory variables can causeproblems in logistic regression models (Menard2002) Explanatory variables used to build the singleand multiscale models were checked formulticollinearity using Pearsonrsquos correlation matrixand variance inflation factors (VIFs) We includedonly covariates that were not highly correlated (| r | lt 06) and made sure that explanatory variablesdisplayed VIFs lt 10 (Graham 2003 OrsquoBrien 2007Table 2)
We used an information theoretic approach formodel development and assessment We followedthe common practice of developing a general globalmodel ie the most complex model of the set ofplausible models using logistic regression andmaximum likelihood estimation to describe loon
nesting habitat at the broadest scale (statewide) andfor each ecoregion and then creating alternativemodels as nested subsets of the global model(Burnham and Anderson 2002) For ease of modelinterpretation and application we modeled onlyadditive terms and did not consider interactionterms We then used various criteria to select themost parsimonious models based on nested subsetsof the habitat variables in the global model that wereassociated with nesting territories at each scale Themodel-fitting statistics included results frommaximum likelihood analyses such as the deviance(minus2logL) and the max-rescaled Rsup2 for each of thecompeting models (Agresti 1996 Hosmer andLemeshow 2000) Max-rescaled Rsup2 is a likelihood-based measure of the strength of associationbetween the dichotomous dependent variable (egCommon Loon nest presence) and the explanatoryvariables (Cox and Snell 1989 Estrella 1998 Heinzet al 2005)
The corrected Akaike Information Criterion forsmall sample size (AICc) was used to evaluate therelative strength of competing plausible models(Burnham and Anderson 2002) within each spatialscale within each region An information criterionestimates the amount of information lost when usinga particular model compared with other possiblemodels Better models lose less information(Burnham and Anderson 2002) AICc values canonly be used to compare models when the responsevariable data sets are exactly the same therefore itis only appropriate to compare competing models
Avian Conservation and Ecology 6(1) 4httpwwwace-ecoorgvol6iss1art4
Fig 4 Maps illustrating how using GIS route feature classes were generated along the perimeter ofeach lake so that all features of a lake including islands are treated as a single entity Along each routea randomly chosen non-nest site was located on lakes that were monitored for loons but had no loonoccurrences
within each region The model with the lowest AICc value of a set of candidate models is considered thebest approximating model ie the mostparsimonious model that achieves a balancebetween bias and variance (Burnham and Anderson2002)
The explanatory variables in the best approximatingmodels at each single spatial scale were then usedto build a multiscale habitat model (Graf et al 2005Lawler and Edwards 2006) for each ecoregion andfor a statewide multiscale model The differencebetween the AICc of a given model and theminimum AICc of the candidate set (∆iAICc) andAICc weights wi (the weight of evidence in favorof a given model relative to the set of candidatemodels) were used to rank the models within eachecoregion (Burnham and Anderson 2002 Anderson2008) When it is not clear which of the models fromthe set of candidate models is best as measured byAICc wi (ie wi gt 09 for any given model) aninformation theoretic-based model average approachis warranted In this case each of the candidatemodels with substantial empirical support (ie∆iAICc le 2) was weighted by its Akaike weight andcombined into a single averaged model by
generating weighted parameter estimates (ieparameter estimate multiplied by wi and thensummed across all models) for each parametermaking an ldquoaveragedrdquo prediction from thecombined model (Burnham and Anderson 2002Hollister et al 2008) Parameter estimates obtainedby model averaging reduce model selection bias andaccount for model selection uncertainty (Johnsonand Omland 2004)
We used odds ratios to examine the magnitude ofthe effect of an explanatory variable on theprobability of Common Loon nest presence at fixedvalues of other variables The odds ratio representsthe change in odds of observing loon nest presencefor a unit change in the explanatory variable Theodds ratio of an explanatory variable is calculatedas e(b times unit change) where b is the parameterrsquoscoefficient in the multivariable model and the testof whether b gt 0 is equivalent to testing whether theconfidence interval of the odds ratio crosses 10(Earnst et al 2006)
Once the most parsimonious models for each dataset were chosen we used classification tables toassess the accuracy of habitat models (Fielding and
Avian Conservation and Ecology 6(1) 4httpwwwace-ecoorgvol6iss1art4
Fig 5 Development of minimum Euclidian distance measured from the edge of a lake to the edge of thenearest lake with and without loons using GIS
Bell 1997) The area under the curve statistic (AUC)was derived from the receiver operatingcharacteristics (ROC) curve and was calculated foreach model as an additional measure of modelperformance AUC values range from 05 (scoresfor presenceabsence do not differ poor classifier)to 10 (complete distinction of presence fromabsence perfect classifier) For example an AUCof 088 means that a randomly chosen case from thepresence group will have a greater classifier scorethan a random selection from the absence group witha probability of 088 (Fielding and Bell 1997 Grafet al 2005 Hames et al 2006)
Residual analyses of the final fitted models wereused to test for spatial autocorrelation using theMoranrsquos Index method (Moran 1950 Fortin andDale 2005) The Pearson residuals from the fittedprobability (HSI) for each lake and its geographiccoordinates were used to assess spatialautocorrelation in the final models Statisticalanalyses were performed using the softwarepackages SAS 91 (SAS Institute Inc 2003) SPSS120 (SPSS Inc 1999) and GS+ Geostatistics forEnvironmental Sciences (Gamma Design Software2001)
RESULTS
Comparing general summary statistics for CommonLoon presence and absence at lakes across the entirestate of New Hampshire highlighted variablesassociated with loon habitat preferences (Table 2)Loons were found on lakes that were larger deeperand clearer with more islands and shorelineperimeter closer to nearby lakes inhabited by otherloons Loons also selected lakes with reducedconductivity and total phosphorus higher pH athigher elevations with lower flushing rates andfurther away from human community centers Landcover within the 150-m zone surrounding each lakewith loon nests was less developed and cleared hadlower road density less agricultural land forest andwetland and contained more open water comparedto the land cover surrounding the random non-nestsite locations (Table 2)
Ecoregional models
The three physiographic ecoregions of NewHampshire differed in landscape composition for anumber of the measured habitat types Most notably
Avian Conservation and Ecology 6(1) 4httpwwwace-ecoorgvol6iss1art4
there was a higher proportion of human-alteredlandscape in the two ecoregions south of the WhiteMountains (ecoregions 2 and 3 Fig 6) These twosouthern ecoregions have lakes surrounded bygreater areas of developed land and higher roaddensity with higher measured values forconductivity and total phosphorous and closer tohuman population centers (high-density residentialareas and municipal community centers Table 3Fig 6) Lakes in the Northern White Mountainecoregion are found at higher elevations on averagewith greater areas of surrounding forested andwetland habitat far from human population centersThe southwestern ecoregion New Hampshire-Vermont Upland has greater areas of agriculturalland and smaller lakes on average distinguishingthis ecoregion from the other two The southeasternecoregion Southern New England Coastal Hills andPlain has more open water surrounding the lakeslarger and deeper lakes with more shorelineperimeter and more islands per lake on averagecompared to the two other ecoregions (Table 3)
The best approximating model designation withineach data set has the highest AICc weight highestmax-rescaled Rsup2 and highest AUC classificationvalue For ecoregions 1 and 3 the multiscale modelshad the highest AICc weights and highest max-rescaled Rsup2 values compared to each of the singlescale models within each respective ecoregionsuggesting that breeding habitat selection by loonsis occurring at multiple scales It is important to notethat in the Northern White Mountain ecoregion(ecoregion 1) all five models (the four single-scalemodels and the multiscale model) have substantialempirical support (ie ∆iAICc le 2) warranting amultimodel inference or model averaging approachespecially when a particular parameter (ie lakesize) occurs in many of the candidate models(Burnham and Anderson 2002) This is also relevantfor the models in the Southern New England CoastalHills and Plain ecoregion (ecoregion 3) where allfour of the single-scale models have manyparameters in common Therefore model averagingwas performed for all of the candidate models inecoregion 1 and for the two highest ranking modelsin ecoregion 3 by weighting each model by itsAkaike weight and combining into a compositeaveraged model for each of these ecoregions (Tables4 and 5 respectively)
In ecoregion 2 (New Hampshire-Vermont Upland)the best approximating model was the modelmeasured at the catchment scale (landscape features
within 500 m of a lake) However the multiscalemodel also had substantial empirical support Thusmodel averaging was performed with these twomodels to produce a composite averaged model forecoregion 2 (Table 6)
Statewide models
The statewide models had a number of habitatcharacteristics in common describing breeding loonpreferences at each scale positive associations withdistance to human population centers water clarityelevation and lake size and negative associationswith road density and distance to nearby lakes withloon presence The most parsimonious and bestapproximating model was the single riparian-scalemodel developed with environmental variablesmeasured within the 150-m zone of the lake (model22 Table 7) This model describes loon preferencesfor clearer lakes nearby other lakes with loons athigher elevations with less surrounding roaddensity and further from human population centersNotably this was the only model within thestatewide model set that contained the explanatoryvariable islands and the only model with substantialempirical support based on information-theoreticstatistics (∆AICc le 2 Burnham and Anderson 2002)
It is important to note that all of the final modelsacross all three ecoregions including the statewidemodels achieved a high level of overall accuracybased on AUC values which ranged from 0914 to0989 indicating that all of these models predictloon nest presence fairly well The residuals of thebest approximating single-scale and multiscalemodels showed no significant spatial correlationbased on the Moranrsquos Index scores Given the weakspatial dependence of the residuals we did notfurther investigate spatial autocorrelation
DISCUSSION
General habitat suitability model for CommonLoon
Based on information-theoretic statistics the bestapproximating model among the statewide modelsis the single lake scale model describing theenvironment immediately surrounding the lakewithin a 150-m riparian buffer zone Overall optimalbreeding habitat for Common Loon across NewHampshire was identified as having the following
Avian Conservation and Ecology 6(1) 4httpwwwace-ecoorgvol6iss1art4
Fig 6 Proportion of developed land cover composition within 150- and 500-m zones surrounding lakeswithin each ecoregion Blue diamond = 25 quartile red square = minimum value green triangle =median value purple x = maximum value blue star = 75 quartile
Avian Conservation and Ecology 6(1) 4httpwwwace-ecoorgvol6iss1art4
Table 3 Summary of lake habitat for the three ecoregions for selected explanatory variables Means includeboth Common Loon nest presence and absence lakes
Habitat Variable Ecoregion Mean SE Min Max
Lake area (ha) 123
13796303
019010012
101012
32621819
20128
Lake perimeter (km) 123
131842
013007008
019048015
257048710
3019995
Lake maximum depth (m) 123
10195121
142080087
131115
497555549
Islands (numberlake) 123
214
093025121
000
5117128
Elevation (m) 123
465330145
594289207
1551135
728722601
Lake flushing rate (number of turnoversyr) 123
213100341
772277
030202
267176504
Water Clarity Secchi depth(m) 123
313841
022020018
090809
97116102
Total phosphorous (mgL) 123
001200120012
lt00010001
lt0001
000300010001
003800590052
Conductivity (micromhoscm) 123
339248216905
271299477
151016511664
112601827030600
Distance to loon lake (km) 123
253236
035026046
001001001
136174287
Distance to community center (km) 123
852529
075002023
001001001
24266213
Avian Conservation and Ecology 6(1) 4httpwwwace-ecoorgvol6iss1art4
Table 4 Summary of results for ecoregion 1 (Northern White Mountain) habitat models with their associatedAkaike weights N = 59 lakes Models with empirical support ie ∆iAICc le 2 are indicated in bold
Model Scale Rsup2 Kdagger Log likelihood AICc ∆iAICc Weightwi
AUC
2 Multiscale 087 3 minus668 1980 lt 0001 02444 0989
5 Foraging 073 2 minus786 1993 014 02281 0968
3 Catchment 072 2 minus820 2061 081 01627 0951
4 Riparian 072 2 minus826 2074 094 01526 0952
6 Nesting 150-m radius 076 2 minus846 2114 134 01249 0959
1 Global model 086 5 minus536 2185 206 00874 0988
Explanatory variables for each fitted modelDagger
2 Multiscale lake size (+) open water 500N (+)
5 Foraging open water 500N (+)
3 Catchment lake size (+)
4 Riparian lake size (+)
6 Nesting 150-m radius lake size (+)
1 Global model elevation (+) lake size (+) clarity (+) open water 500N (+)
Composite model Nest presence = minus8655 + 3127 (lake size) + 1570 (open water 500N)
daggerK indicates the total number of parameters ie the intercept and explanatory variablesDagger(+) = positive association (minus) = negative association L = lake scale N = nest scale
characteristics clear higher elevation lakes withislands further away from human populationcenters with lower surrounding road densities andwith nearby lakes occupied by other loons Waterclarity has long been associated with loon habitatpreference and our results are consistent withprevious studies (Vermeer 1973 McIntyre 19831988 Blair 1992 Meyer 2006) The significance ofthe minimum-distance-to-nearest-lake-with-loon-presence metric supports anecdotal observationsand published research describing loon nataldispersal This biotic interaction metric describesthe philopatric and conspecific attraction loonsdisplay and reveals the importance of the spatial
configuration of lakes in the selection of loonbreeding habitat (Strong et al 1987 Evers 2001Piper et al 2006 2008)
The unique habitat feature that distinguishes the bestmodel among the statewide models is theexplanatory variable islands which indicates high-quality breeding habitat for loons (Vermeer 1973Jung 1991 McIntyre and Barr 1997 Piper et al2006 Evers 2007) Based on odds ratio estimatesislands and lake clarity were the most importantfactors distinguishing loon breeding habitat for thestatewide data set (Table 8) The best statewidemodel also describes loon preferences for open
Avian Conservation and Ecology 6(1) 4httpwwwace-ecoorgvol6iss1art4
Table 5 Summary of results for ecoregion 3 (Southern New England Coastal Hills and Plain) habitatmodels with their associated Akaike weights N = 133 lakes Models with empirical support ie ∆iAICc le 2 are indicated in bold
Model Scale Rsup2 Kdagger Loglikelihood
AICc ∆iAICc Weight wi AUC
14 Multiscale 072 6 minus3284 7835 lt 0001 04282 0940
18 Nesting 069 4 minus3530 7892 057 03220 0931
15 Catchment 066 5 minus3565 8178 343 00772 0931
16 Riparian 066 5 minus3565 8178 343 00772 0931
17 Foraging 066 5 minus3565 8178 343 00772 0931
13 Globalmodel
075 11 minus3025 8467 632 00181 0949
Explanatory variables for each fitted modelDagger
14 Multiscale lake size (+) elevation (+) clarity (+) distance to loon (minus) phosphorous (minus)
18 Nesting elevation (+) lake size (+) phosphorous (minus)
15 Catchment distance to loon (minus) elevation (+) lake size (+) clarity (+)
16 Riparian distance to loon (minus) elevation (+) lake size (+) clarity (+)
17 Foraging distance to loon (minus) elevation (+) lake size (+) clarity (+)
13 Globalmodel
developed 150L (minus) open water 150L (+) road 150L (minus) islands (+) distance to loon (minus)elevation (+) lake size (+) phosphorous (minus) clarity (+) open water 500N (+)
Composite model Nest presence = minus4550 + 0006 (elevation) + 1180 (lake size) + 01714 (clarity) minus 02183 (distance toloon) minus 179503 (phosphorus)
daggerK indicates the total number of parameters ie the intercept and explanatory variablesDagger(+) = positive association (minus) = negative association L = lake scale N = nest scale
water surrounding the lake (eg hydrologicalconnectivity) Earnst et al (2006) also found thatYellow-billed Loon in northern Alaska selectbreeding habitat based on landscape-scale featuressuch as hydrological connectivity The explanatoryvariable minimum-distance-to-human-population-center was featured at every scale in the statewidemodels providing evidence that loons prefer tosituate nests on lakes further from humandisturbance A lake habitat selection study forwaterbirds in Canada also found that loons prefer
lakes that are farther from human activity or havemore forested land within a 500-m zone (Found etal 2008)
Effects of scale on Common Loon habitatassociations
Another of our objectives was to investigatewhether Common Loon selects breeding habitat atmultiple scales and to determine which scales are
Avian Conservation and Ecology 6(1) 4httpwwwace-ecoorgvol6iss1art4
Table 6 Summary of results for ecoregion 2 (New Hampshire-Vermont Upland) habitat models with theirassociated Akaike weights N = 130 lakes Models with empirical support ie ∆iAICc le 2 are indicatedin bold
Model Scale Rsup2 Kdagger Loglikelihood
AICc ∆iAICc Weight wi AUC
9 Catchment 081 8 minus2437 6593 lt 0001 06757 0971
8 Multiscale 083 10 minus2310 6806 213 02331 0973
10 Riparian 075 6 minus2872 7011 418 00834 0952
7 Globalmodel
079 11 minus2595 7613 1020 00041 0963
11 Foraging 073 7 minus3331 7930 1337 00008 0945
12 Nesting 068 7 minus3627 8745 2153 lt 000001 0930
Explanatory variables for each fitted modelDagger
9 Catchment open water 500L (+) road 500L (minus) islands (+) pH (+) elevation (+) clarity (+)agricultural 500L (minus)
8 Multiscale open water 150L (+) open water 500N (+) islands (+) clarity( +) road density 500L (minus)road density 150N (minus) distance to loon (minus) forest 150N (minus) wetland 150N (minus)
10 Riparian open water 150L (+) islands (+) distance to loon (minus) elevation (+) clarity (+)
7 Globalmodel
open water 150L (+) islands (+) distance to loon (minus) elevation (+) pH (+) clarity (+)agricultural 500L (minus) open water 500L (+) road density 500L (minus) forest 500 (minus)
11 Foraging open water 500N (+) agricultural 500N (minus) clarity (+) elevation (+) lake size (+)
12 Nesting road density 150N (minus) forest 150N (minus) wetland 150N (minus) elevation (+) lake size (+) flushingrate (minus)
Composite model Nest presence = minus22579 + 3179 (islands) + 1047 (clarity) + 0004 (elevation) + 0287 (open water150L) + 0405 (open water 500L) + 01064 (open water 500N) + 272 (pH) minus 0158 (road density 500L) minus 0362 (distanceto loon) minus 0314 (agricultural 500L) minus 0086 (forest 150N) minus 0079 (wetland 150N) minus 0065 (road density 150N)
daggerK indicates the total number of parameters ie the intercept and explanatory variablesDagger(+) = positive association (minus) = negative association L = lake scale N = nest scale
most important Using information theoreticstatistics the multiscale models for two of the threeecoregions were designated the best approximatingmodels and had substantial empirical support in allthree ecoregions Distinct differences are apparentwhen comparing models across ecoregions (Tables4 5 and 6) Loons in New Hampshire appear to be
selecting breeding habitat differently based onphysiographic ecoregion and at multiple scalesThese differences may be a reflection of theoccurrence of different environmental conditionsand ranges of variables in the three different regionsIn the Northern White Mountain ecoregion loonsare selecting breeding territories on the basis of lake
Avian Conservation and Ecology 6(1) 4httpwwwace-ecoorgvol6iss1art4
Table 7 Summary of results for New Hampshire statewide habitat models with their associated Akaikeweights N = 322 lakes Models with empirical support ie ∆iAICc le 2 are indicated in bold
Model Scale Rsup2 Kdagger Log likelihood AICc ∆iAICc Weight wi AUC
22 Riparian 065 8 minus8615 188764 000 08315 0926
21 Catchment 064 8 minus8843 193315 455 00854 0921
23 Foraging 063 7 minus8996 194269 561 00504 0919
19 Global model 070 15 minus8287 197304 854 00115 0941
24 Nesting 062 7 minus9192 198196 954 00071 0914
20 Multiscale 065 8 minus9365 203769 1501 00005 0926
Explanatory variables for each fitted modelDagger
22 Riparian open water 150L (+) elevation (+) islands (+) clarity (+) distance tohuman population (+) distance to loon (minus) road density 150L (minus)
21 Catchment distance to loon (minus) open water 500L (+) road density 500L (minus) elevation (+)lake size (+) clarity (+) distance to human population (+)
23 Foraging distance to loon (minus) open water 500N (+) elevation (+) lake size (+) clarity(+) distance to human population (+)
19 Global model open water 500L (minus) road density 500L (minus) road density 150N (minus) open water500N (+) road density 150L (minus) open water 150L (+) islands (+) distance toloon (minus) elevation (+) lake size (+) pH (+) phosphorous (minus) clarity (+)distance to human population (+)
24 Nesting distance to loon (minus) road density 150N (minus) elevation (+) lake size (+) clarity(+) distance to human population (+)
20 Multiscale distance to loon (minus) open water 500N (+) road density 150L (minus) elevation (+)lake size (+) clarity (+) distance to human population (+)
Statewide model Nest presence = minus7328 + 0115 (open water 150L) + 0001 (elevation) + 1067 (islands) + 0595 (clarity)+ 0211 (distance to human population) minus 0233 (distance to loon) minus 0033 (road density 150 L)
daggerK indicates the total number of parameters ie the intercept and explanatory variablesDagger(+) = positive association (minus) = negative association L = lake scale N = nest scale
size and the amount of open water surrounding thenest (eg island nest sites) In this ecoregion therewas no distinction between loon presence andabsence lakes based on human-altered variablessuch as road density and developed land or waterquality variables associated with human activitiesThe Northern White Mountain ecoregion has lowerroad densities surrounding the lakes and a less
human-dominated landscape in general Thereforethe loonsrsquo apparent selection based on a few lakemorphological factors may be more a reflection ofthe general environmental conditions and lack ofhuman-altered variables to select against It is alsointeresting to note that loons in this northernecoregion do not appear to be using the presence ofother loons on nearby lakes as a habitat selection
Avian Conservation and Ecology 6(1) 4httpwwwace-ecoorgvol6iss1art4
factor as is the case in the two more southerlyecoregions
The results for the Northern White Mountainecoregion suggest that prior to human alteration ofthe landscape loons may have chosen breedinghabitat based primarily on lake morphologicalfactors such as lake size and the amount of openwater surrounding the nest The catchment riparianforaging and nest scale-based models within theNorthern White Mountain ecoregion includeinformation describing the selection of loonbreeding habitat (Table 4) Three of these final fittedsingle-scale models had explanatory variables incommon (ie lake size) and were combined in themultiscale model for this ecoregion to determine thebest approximating model given the data set basedon the model probability Akaike weights wi (Table4) However using evidence ratios (Burnham andAnderson 2002) to compare the two best modelsthe best model (model 1) has only 19 times theweight of evidence relative to the second-best model(model 4) This relatively weak support for any ofthe models being the best model suggests that thesemodels are good candidates for model averaging ormultimodel inference Model averaging increasesparameter estimate precision and reduces biasassociated with model selection especially when allof the models have substantial support and areclosely related as in ecoregion 1
In the southwestern New Hampshire-VermontUpland loons appear to be avoiding human-alteredlandscapes such as those with high road density andgreater areas of agriculture (Table 6) This regionof New Hampshire contains the highest percentageof prime agricultural soils in the state and hasexperienced the highest amount of agriculturalconversion to developed land in the state over the5-yr period from 1997 to 2002 (Society for theProtection of New Hampshire Forests 2005) Withinthis ecoregion loons are selecting lakes with moreislands higher water clarity and more open watersurrounding the lakes and that are nearby otherlakes with loons present The catchment-scalemodel describing features within a 500-m zone ofthe lake best describes the data in this region (model9 Table 6) the only other model that has substantialempirical support for describing this data set is themultiscale model (model 8 Table 6) Thecatchment-scale model differs from the multiscalemodel by identifying positive associations of loonswith pH (an indicator of fishprey habitat) and lakeelevation and a negative association of loons with
agricultural land within 500 m of the lake Insteadof relying on a single best model for this ecoregionwe used model averaging to combine these twohighest ranking models to obtain robust estimatesof model parameters reduce model selection biasand account for model selection uncertainty(Johnson and Omland 2004) Based on the modelaveraged results and using odds ratios to identifyinfluential factors in this region islands pH andwater clarity appear to be the most influential habitatfeatures (Table 8)
Loons in the southeastern Southern New EnglandCoastal Hills and Plain appear to be selectingbreeding habitat similarly across all scales based ona few key elements larger lakes at increasingelevations with lower levels of phosphorous nearbyother lakes with loons (Table 5) Other studies havefound that loons avoid lakes with higherphosphorous and primary productivity (Blair 1992)which can reduce water clarity Total phosphoruswhich is associated with anthropogenic activitiesappears to be an important avoidance factor forloons selecting breeding habitat at multiple scalesbased on the multiscale and nesting-scale modelswhich are the two highest-ranking models for thisregion The two most influential factors in thisregion appear to be lake size and water clarity basedon odds ratio estimates (Table 8)
The natural arrangement of lakes in NewHampshire especially in the southeastern portionof the state (referred to as the Lakes Region) is ofparticular concern because this area has the fastestrate of human population change in NewHampshire The entire state population is projectedto grow by 358000 between 2000 and 2025 withan estimated 80 of that growth in the foursoutheastern counties of New Hampshire along theInterstate Highway 89 corridor and in the LakesRegion (Society for Protection of New HampshireForests 2005) Loons are responding to human-induced pressures on these lakes and across the stateby selecting against anthropogenic features such asroad density total phosphorous and conductivitydeveloped and agricultural lands and humanpopulation centers
CONCLUSION
Our results support the increasing evidence formultiscale habitat associations most commonlyfound in avian species (Gutzwiller and Anderson
Avian Conservation and Ecology 6(1) 4httpwwwace-ecoorgvol6iss1art4
Table 8 Model averaged parameter estimates and odds ratio estimates with confidence intervals forecoregional composite models and the statewide model These parameters constitute the final averagedmodels for each ecoregion and may be used directly to predict Common Loon nest presence regionally andthroughout the state of New Hampshire
Region Variable Theta SE Odds ratio 95 Wald confidence limits
Ecoregion 1 Northern White Mountain
Intercept minus8655 0704
Lake size 3127 0096 6935 0934 51509
Open water 500 nest 1570 0034 1482 1066 2062
Ecoregion 2 New Hampshire-Vermont Upland
Intercept minus22579 10485
Islands 3179 1120 18045 2760 117970
Clarity 1047 0349 2952 1500 5810
Elevation 0004 0002 1004 1000 1007
Open water 150 lake 0287 0136 1383 1153 1658
Open water 500 lake 0405 01145 1499 1198 1877
Open water 500 nest 01064 00485 0890 0810 0979
pH 272 10139 15195 2083 110844
Road density 500 lake minus0158 0064 0880 0789 0983
Distance to loon lake minus03619 0129 0691 0491 0971
Agricultural 500 lake minus03143 01489 0730 0545 0978
Forest 150 nest minus00856 00346 0913 0853 0977
Wetland 150 nest minus00793 00346 0920 0859 0985
Road density 150 nest minus00647 00286 0927 0877 0980
Ecoregion 3 Southern New England Coastal Hills and Plain
Intercept minus4550 0217
Elevation 0006 0001 1004 1000 1009
Lake size 1180 0158 3254 1640 6456
Clarity 01714 02835 1187 0681 2069
Distance to loon lake minus02183 0124 1000 1000 1000
Phosphorous minus179503 3190 lt 0001 lt 0001 lt 0001
(cond)
Avian Conservation and Ecology 6(1) 4httpwwwace-ecoorgvol6iss1art4
New Hampshire Statewide
Intercept minus73821 12467
Open water 150 lake 01150 00200 1122 1079 1167
Elevation 0001 0001 1001 1000 1002
Islands 10674 04210 2908 1274 6637
Clarity 05948 01503 1813 1350 2434
Distance to population center 02105 00797 1234 1056 1443
Distance to loon lake minus02331 00732 0792 0686 0914
Road density 150 lake minus00327 00148 0968 0940 0996
1987 Wiens et al 1987 Saab 1999 Meyer et al2002 Graf et al 2005 Kristan 2006 Lawler andEdwards 2006 Thogmartin 2007) The multiscalemodels within each ecoregion have substantialempirical support in describing breeding habitatsuggesting that Common Loon in New Hampshireis responding to environmental cues at scalesranging from broad catchment to finer riparian areassurrounding lakes as well as within lakes at thenesting scale Loons also appear to be selectinghabitat differently across the ecoregions based onthe varying landscape conditions they encounteracross New Hampshire This differential selectionof breeding habitat across ecoregions providesinformation for prioritizing conservation andfocusing management efforts in New HampshireConservation efforts in the northern ecoregionshould be focused on preserving the relatively lowerlevels of human activity and disturbance pressuressurrounding these northern lakes by preventingincreases in road density and construction nearlakes especially within the immediate shoreline oflarger lakes Loon conservation and managementactivities in the two southern ecoregions shouldfocus on reducing the effects of already existinghuman disturbances on water quality by mitigatingsources of phosphorous that can also directly affectclarity Other activities in these regions shouldinclude the prioritization for protection of high-quality nesting habitat such as small islands andundisturbed areas of lakes and preventingdevelopment in critical loon habitat Our resultssuggest that conservation strategies for CommonLoon should also consider environmental
influences beyond the immediate lake or riparianscale as the analysis demonstrates that loons arealso responding to landscape-level and catchment-scale conditions surrounding lakes
Responses to this article can be read online athttpwwwace-ecoorgvol6iss1art4responses
Acknowledgments
We thank the many people who share our interest inCommon Loon research and conservation Weappreciate the statistical assistance and advice ofDr James Heltshe and helpful advice fromreviewers of early drafts Drs James Lake BryanMilstead and Rick McKinney as well as that of theanonymous reviewers who contributed to the finalversion of this manuscript This is contributionnumber AED-10-048 of the Atlantic EcologyDivision National Health and EnvironmentalEffects Research Laboratory Office of Researchand Development US Environmental ProtectionAgency Although the research described in thiscontribution has been funded wholly by the USEnvironmental Protection Agency it has not beensubjected to Agency-level review Therefore it doesnot necessarily reflect the views of the AgencyMention of trade names products or services doesnot constitute endorsement or recommendation foruse
Avian Conservation and Ecology 6(1) 4httpwwwace-ecoorgvol6iss1art4
LITERATURE CITED
Agresti A 1996 An introduction to categoricaldata analysisWiley New York New York USA
Alvo R D J T Hussell and M Berrill 1988 Thebreeding success of common loons (Gavia immer)in relation to alkalinity and other lake characteristicsin Ontario Canadian Journal of Zoology 66(3)746-752
Anderson D R 2008 Model based inferences inthe life sciences a primer on evidence SpringerNew York New York USA doi101007978-0-387-74075-1
Anderson J R E E Hardy J T Roach and R EWitmer 1976 A land use and land coverclassification system for use with remote sensordata Geological Survey Professional Paper 964 US Geological Survey Washington DC USA
Austin M 2007 Species distribution models andecological theory a critical assessment and somepossible new approaches Ecological Modelling 200(1-2)1-19 doi101016jecolmodel200607005
Barr J F 1986 Population dynamics of thecommon loon associated with mercury-contaminatedwaters in northwestern Ontario Occasional PaperNumber 56 Canadian Wildlife Service OttawaCanada
Battin J and J J Lawler 2006 Cross-scalecorrelations and the design of avian-habitatselection studies Condor 10859-70 doi1016500010-5422(2006)108[0059CCATDA]20CO2
Blair R B 1992 Lake features water quality andthe summer distribution of Common Loons in NewHampshire Journal of Field Ornithology 63(1)1-9
Burgess N M D C Evers and J D Kaplan 2005Mercury and other contaminants in Common Loonsbreeding in Atlantic Canada Ecotoxicology 14(1-2)241-252 doi101007s10646-004-6271-0
Burnham K P and D R Anderson 2002 Modelselection and multimodel inference a practicalinformation-theoretic approach Second editionSpringer New York New York USA
Cox D R and E J Snell 1989 Analysis of binarydata Second edition Chapman amp Hall LondonUK
Cushman S A and K McGarigal 2002Hierarchical multi-scale decomposition of species-environment relationships Landscape Ecology 17(7)637-646 doi101023A1021571603605
Cushman S A and K McGarigal 2004Hierarchical analysis of forest bird species-environment relationships in the Oregon CoastRange Ecological Applications 14(4)1090-1105 doi10189003-5131
Deppe J L and J T Rotenberry 2008 Scale-dependent habitat use by fall migratory birdsvegetation structure floristics and geographyEcological Monographs 78(3)461-487 doi10189007-01631
Desorbo C R K M Taylor D E Kramer J FairJ H Cooley Jr D C Evers W Hanson H SVogel and J L Atwood 2007 Reproductiveadvantages for Common Loons using rafts Journalof Wildlife Management 71(4)1206-1213 doi1021932006-422
Driscoll M J L T Donovan R Mickey AHoward and K K Fleming 2005 Determinants ofwood thrush nest success a multi-scale modelselection approach Journal of Wildlife Management 69(2)699-709 doi1021930022-541X(2005)069[0699DOWTNS]20CO2
Earnst S L R Platte and L Bond 2006 Alandscape-scale model of yellow-billed loon (Gaviaadamsii) habitat preferences in northern AlaskaHydrobiologia 567(1)227-236 doi101007s10750-006-0042-2
Edwards T C Jr G G Moisen T S Frescinoand J J Lawler 2003 Modeling multipleecological scales to link landscape theory to wildlifeconservation Pages 153-172 in J A Bissonette andI Storch editors Landscape ecology and resourcemanagement linking theory with practice IslandPress Washington DC USA
Environmental Systems Research Institute 2009ArcInfo geographic information system (GIS)software Version 91 Redlands California USA
Avian Conservation and Ecology 6(1) 4httpwwwace-ecoorgvol6iss1art4
Estrella A 1998 A new measure of fit for equationswith dichotomous dependent variables Journal ofBusiness and Economic Statistics 16(2)198-205 doi1023071392575
Evers D C 2001 Common Loon populationstudies continental mercury patterns and breedingterritory philopatry Dissertation University ofMinnesota St Paul Minnesota USA
Evers D C 2007 Status assessment andconservation plan for the Common Loon (Gaviaimmer) in North America BRI Report 2007-20 US Fish and Wildlife Service Hadley MassachusettsUSA
Evers D C L J Savoy C R DeSorbo D EYates W Hanson K M Taylor L Siegel J HCooley M S Bank A Major K Munney BMower H S Vogel N Schoch M Pokras M WGoodale and J Fair 2008 Adverse effects fromenvironmental mercury loads on breeding commonloons Ecotoxicology 17(2)69-81 doi101007s10646-007-0168-7
Fielding A H and J F Bell 1997 A review ofmethods for the assessment of prediction errors inconservation presenceabsence models EnvironmentalConservation 24(1)38-49 doi101017S0376892997000088
Fortin M-J and M R T Dale 2005 Spatialanalysis a guide for ecologists CambridgeUniversity Press Cambridge UK
Found C S M Webb and M S Boyce 2008Selection of lake habitats by waterbirds in the borealtransition zone of northeastern Alberta CanadianJournal of Zoology 86(4)277-285 doi101139Z07-137
Fraterrigo J M and J A Downing 2008 Theinfluence of land use on lake nutrients varies withwatershed transport capacity Ecosystems 11(7)1021-1034 doi101007s10021-008-9176-6
Freemark K E D Bert and M A Villard 2002Patch- landscape- and regional-scale effects onbiota Pages 58-83 in K J Gutzwiller editorApplying landscape ecology in biologicalconservation Springer New York New YorkUSA
Gamma Design Software 2001 GS+ geostatisticsfor the environmental sciences PlainwellMichigan USA
Garshellis D L 2000 Delusions in habitatevaluation measuring use selection andimportance Pages 111-153 in L Boitani and T KFuller editors Research techniques in animalecology controversies and consequences ColumbiaUniversity Press New York New York USA
Goldstein H 2003 Multilevel statistical models Third edition Hodder Arnold London UK
Graf R F K Bollmann W Suter and HBugmann 2005 The importance of spatial scale inhabitat models Capercaillie in the Swiss AlpsLandscape Ecology 20(6)703-717 doi101007s10980-005-0063-7
Graham M H 2003 Confronting multicollinearityin ecological multiple regression Ecology 842809-2815 doi10189002-3114
Gutzwiller K J and S H Anderson 1987Multiscale associations between cavity-nestingbirds and features of Wyoming streamsidewoodlands Condor 89534-548 doi1023071368643
Hames R S J D Lowe S Barker Swarthout andK V Rosenberg 2006 Understanding the risk toneotropical migrant bird species of multiple human-caused stressors elucidating processes behindpatterns Ecology and Society 11(1) 24 [online]URL httpwwwecologyandsocietyorgvol11iss1art24
Hammond C A M 2008 A demographic andlandscape analysis for common loons in northwestMontana Thesis University of Montana MissoulaMontana USA [online] URL httpetdlibumteduthesesavailableetd-04242008-130448
Heimberger M D Euler and J Barr 1983 Theimpact of cottage development on Common Loonreproductive success in central Ontario WilsonBulletin 95(3)431-439
Heinz H T Waldhoumlr and M Mittlboumlck 2005Careful use of pseudo R-squared measures inepidemiological studies Statistics in Medicine 24(18)2867-2872 doi101002sim2168
Avian Conservation and Ecology 6(1) 4httpwwwace-ecoorgvol6iss1art4
Hollister J W P V August J F Paul and H AWalker 2008 Predicting estuarine sediment metalconcentrations and inferred ecological conditionsan information theoretic approach Journal ofEnvironmental Quality 37(1)234-244 doi102134jeq20070105
Hosmer D W and S Lemeshow 2000 Appliedlogistic regression analysis Second edition WileyNew York New York USA doi1010020471722146
Hutchinson G E 1957 A treatise of limnologyVolume 1 geography physics and chemistry WileyNew York New York USA
Johnson J B and K S Omland 2004 Modelselection in ecology and evolution Trends inEcology and Evolution 19(2)101-108 doi101016jtree200310013
Johnson M D 2007 Measuring habitat quality areview Condor 109(3)489-504 doi10165083471
Johnston C A and B A Shmagin 2006 Scaleissues in lake-watershed interactions assessingshoreline development impacts on water clarityPages 297-313 in J Wu K B Jones H Li and OL Loucks editors Scaling and uncertainty analysisin ecology methods and applications SpringerDordrecht The Netherlands
Jung R E 1991 Effects of human activities andlake characteristics on the behavior and breedingsuccess of Common Loons Passenger Pigeon 53207-218
Kamman N C N M Burgess C T Driscoll HA Simonin W Goodale J Linehan R EstabrookM Hutcheson A Major A M Scheuhammer andD A Scruton 2005 Mercury in freshwater fish ofnortheast North America a geographic perspectivebased on fish tissue monitoring databasesEcotoxicology 14(1-2)163-180 doi101007s10646-004-6267-9
Kristan W B III 2006 Sources and expectationsfor hierarchical structure in bird-habitat associationsCondor 108(1)5-12 doi1016500010-5422(2006)108[0005SAEFHS]20CO2
Kristan W B III and J M Scott 2006Hierarchical models for avian ecologists Condor 108(1)1-4 doi1016500010-5422(2006)108[0001HMFAE]20CO2
Kuhn-Hines A 2008 A multiscale approach tobreeding habitat model development and evaluationfor the common loon Gavia immer in NewHampshire USA ETD Collection for University ofRhode Island Paper AAI3346850 [online] URL httpdigitalcommonsuriedudissertationsAAI3346850
Lawler J J and T C Edwards Jr 2006 Avariance-decomposition approach to investigatingmultiscale habitat associations Condor 108(1)47-58 doi1016500010-5422(2006)108[0047AVATIM]20CO2
Li X D Li Z Ma and D Schneider 2006 Nestsite use by crested ibis dependence of a multifactormodel on spatial scale Landscape Ecology 21(8)1207-1216 doi101007s10980-006-0021-z
Loon Preservation Committee 2004 Fieldcollection protocol for surveying and managingCommon Loons in New Hampshire LoonPreservation Committee Moultonborough NewHampshire USA
Loon Preservation Committee 2005 Meeting thechallenge thirty years of preserving loons and theirhabitats in New Hampshire Loon PreservationCommittee Moultonborough New HampshireUSA
Luck G W 2002 The habitat requirements of therufous treecreeper (Climacteris rufa) 1 Preferentialhabitat use demonstrated at multiple spatial scalesBiological Conservation 105(3)383-394 doi101016S0006-3207(01)00222-1
MacKenzie D I 2005 Was it there Dealing withimperfect detection for species presenceabsencedata Australian and New Zealand Journal ofStatistics 47(1)65-74 doi101111j1467-842X200500372x
MacKenzie D I J D Nichols J E Hines M GKnutson and A B Franklin 2003 Estimating siteoccupancy colonization and local extinction whena species is detected imperfectly Ecology 84(8)2200-2207 doi10189002-3090
Avian Conservation and Ecology 6(1) 4httpwwwace-ecoorgvol6iss1art4
Martin S L and P A Soranno 2006 Lakelandscape position relationships to hydrologicconnectivity and landscape features Limnology andOceanography 51(2)801-814 doi104319lo20065120801
McGarigal K and B J Marks 1995 FRAGSTATSspatial pattern analysis program for quantifyinglandscape structure General Technical ReportPNW-GTR-351 US Department of AgricultureForest Service Washington DC USA
McIntyre J W 1983 Nurseries a consideration ofhabitat requirements during the early chick-rearingperiod in common loons Journal of FieldOrnithology 54(3)247-253
McIntyre J W 1988 The Common Loon spirit ofnorthern lakes University of Minnesota PressMinneapolis Minnesota USA
McIntyre J W and J F Barr 1997 Common loonGavia immer In A Poole and F Gill editors TheBirds of North America 313 Academy of NaturalSciences of Philadelphia and American OrnithologistsUnion Washington DC USA
Menard S 2002 Applied logistic regressionanalysis Second edition Sage PublicationsThousand Oaks California USA
Meyer C B S L Miller and C J Ralph 2002Multi-scale landscape and seascape patternsassociated with marbeled murrelet nesting areas onthe US west coast Landscape Ecology 17(2)95-115 doi101023A1016574928706
Meyer M W 2006 Evaluating the impact ofmultiple stressors on Common Loon populationdemographics-an integrated laboratory and fieldapproach EPA STAR Co-operative AgreementNumber R82-9085 Environmental ProtectionAgency Washington DC USA
Meyer M W D C Evers J J Hartigan and P SRasmussen 1998 Patterns of common loon (Gaviaimmer) mercury exposure reproduction andsurvival in Wisconsin USA EnvironmentalToxicology and Chemistry 17(2)184-190
Meyer M W and J E Woodford 1996Enhancing osprey (Pandion haliaetus) and commonloon (Gavia immer) reproduction on impacted
Wisconsin waterways Final report US Fish andWildlife Service Washington DC USA
Moran P A P 1950 Notes on continuousstochastic phenomena Biometrika 37(1-2)17-23 doi101093biomet371-217
Murtagh P A and P S Pooler 2006 Evaluatingecological indicators lakes in the northeasternUnited States Environmental Monitoring andAssessment 119(1-3)83-96 doi101007s10661-005-9011-x
New Hampshire Department of EnvironmentalServices 2005 Water quality data survey summaryfor New Hampshire lakes and ponds NewHampshire Department of Environmental ServicesNew Hampshire USA [online] URL httpdesnhgovorganizationdivisionswaterwmblakestrophic_summaryhtm
New Hampshire Department of EnvironmentalServices 2006 Community center areas NewHampshire Department of Environmental ServicesNew Hampshire USA [online] URL httpwwwgranitunhedudatadatacatpagescommunitycenterareaspdf
Newbrey J L M A Bozek and N D Niemuth2005 Effects of lake characteristics and humandisturbance on the presence of piscivorous birds innorthern Wisconsin USA Waterbirds 28(4)478-486 doi1016751524-4695(2005)28[478EOLCAH]20CO2
Nocera J J G J Forbes and G R Milton 2008The relevance of local-scale relationships to habitatmanagement and landscape patterns AvianConservation and Ecology - Eacutecologie etconservation des oiseaux 3(1) 4 [online] URL httpwwwace-ecoorgvol3iss1art4
Northeast Loon Study Work Group 2008 [online]URL httpwwwbriloonorgscience-and-conservationcentersNELSWGphp
OrsquoBrien R M 2007 A caution regarding rules ofthumb for variance inflation factors Quality ampQuantity 41(5)673-690 doi101007s11135-006-9018-6
Patton D R 1975 A diversity index for quantifyinghabitat lsquoedgersquo Wildlife Society Bulletin 3171-173
Avian Conservation and Ecology 6(1) 4httpwwwace-ecoorgvol6iss1art4
Penhollow M E and D F Stauffer 2000 Large-scale habitat relationships of neotropical migratorybirds in Virginia Journal of Wildlife Management 64(2)362-373 doi1023073803234
Piper W H C Walcott J N Mager III M PeralaK B Tischler E Harrington A J Turcotte MSchwabenlander and N Banfield 2006 Prospectingin a solitary breeder chick production elicitsterritorial intrusions in common loons BehavioralEcology 17(6)881-888 doi101093behecoarl021
Piper W H C Walcott J N Mager and F JSpilker 2008 Nestsite selection by male loons leadsto sex-biased site familiarity Journal of AnimalEcology 77(2)205-210 doi101111j1365-2656200701334x
Rimmer C C 1992 Common Loon Gavia immer Pages 3-30 in K J Schneider and D M Penceeditors Migratory nongame birds managementconcern in the Northeast US Fish and WildlifeService Newton Corner Massachusetts USA
Riitters K H R V OrsquoNeill and K B Jones 1997Assessing habitat suitability at multiple scales alandscape-level approach Biological Conservation 81(1-2)191-202 doi101016S0006-3207(96)00145-0
Saab V 1999 Importance of spatial scale to habitatuse by breeding birds in riparian forests ahierarchical analysis Ecological Applications 9(1)135-151 doi1018901051-0761(1999)009[0135IOSSTH]20CO2
SAS Institute Inc 2003 SAS 91 Cary NorthCarolina USA
Scott J M P J Heglund M L Morrison J BHaufler M G Raphael W A Wall and F BSamson editors 2002 Predicting speciesoccurrences issues of accuracy and scale IslandPress Washington DC USA
Society for Protection of New Hampshire Forests2005 New Hampshirersquos changing landscapepopulation growth and land use changes Societyfor Protection of New Hampshire Forests [online]URL httpwwwforestsocietyorgresearchresearch-projectsasp
Soranno P A K E Webster K S Cheruvelil andM T Bremigan 2009 The lake landscape-contextframework linking aquatic connections terrestrialfeatures and human effects at multiple scalesVerhandlungen des Internationalen Verein Limnologie 30(5)695-700
Sperduto D D and W F Nichols 2004 Naturalcommunities of New Hampshire New HampshireNatural Heritage Bureau Concord New HampshireUSA and University of New HampshireCooperative Extension Durham New HampshireUSA
SPSS Inc 1999 SPSS 100 Chicago Illinois USA
Stauffer H B C J Ralph and S L Miller 2004Ranking habitat for marbled murrelets a newconservation approach for species with uncertaindetection Ecological Applications 14(5)1374-1383doi10189003-5068
Stein B A and S R Flack 1997 1997 speciesreport card the status of US plants and animals The Nature Conservancy Arlington VirginiaUSA [online] URL httpwwwnatureserveorglibrary1997speciesreportcardpdf
Strauss B and R Biedermann 2007 Evaluatingtemporal and spatial generality How valid arespecies-habitat relationship models EcologicalModeling 204104-114 doi101016jecolmodel200612027
Strong P I V and J A Bissonette 1989 Feedingand chick-rearing areas of common loons Journalof Wildlife Management 5372-76 doi1023073801308
Strong P I V J A Bissonette and J S Fair 1987Reuse of nesting and nursery areas by CommonLoons Journal of Wildlife Management 51123-127doi1023073801642
Taylor K M and H S Vogel 2000 NewHampshire report Pages 110-113 in J McIntyre andD C Evers editors Loons old history and newfindings Proceedings symposium 1997 meetingAmerican Ornithologists Union North AmericanLoon Fund Holderness New Hampshire USA
Thogmartin W E 2007 Effects at the landscapescale may constrain habitat relations at finer scales
Avian Conservation and Ecology 6(1) 4httpwwwace-ecoorgvol6iss1art4
Avian Conservation and Ecology - Eacutecologie etconservation des oiseaux 2(2) 6 [online] URL URL httpwwwace-ecoorgvol2iss2art6
Thogmartin W E and M G Knutson 2007Scaling local species-habitat relations to the largerlandscape with a hierarchical spatial count modelLandscape Ecology 22(1)61-75 doi101007s10980-006-9005-2
Thompson C M and K McGarigal 2002 Theinfluence of research scale on bald eagle habitatselection along the lower Hudson River New York(USA) Landscape Ecology 17(6)569-586 doi101023A1021501231182
Titus J R and L W VanDruff 1981 Responseof the common loon to recreational pressure in theBoundary Waters Canoe Area northeasternMinnesota Wildlife Monographs 791-60
Trocki C L and P W C Paton 2006 Assessinghabitat selection by foraging egrets in salt marshesat multiple spatial scales Wetlands 26(2)307-312 doi1016720277-5212(2006)26[307AHSBFE]20CO2
Turner M G 2005 Landscape ecology What isthe state of the science Annual Review of EcologyEvolution and Systematics 36319-344 doi101146annurevecolsys36102003152614
Tyre A J B Tenhumberg S A Field D NiejalkeK Parris and H P Possingham 2003 Improvingprecision and reducing bias in biological surveysestimating false-negative error rates EcologicalApplications 13(6)1790-1801 doi10189002-5078
Vermeer K 1973 Some aspects of the nestingrequirements of common loons in Alberta WilsonBulletin 85429-435
Wiens J A 1989 Spatial scaling in ecologyFunctional Ecology 3385-397 doi1023072389612
Wiens J A 2002 Riverine landscapes takinglandscape ecology into the water FreshwaterBiology 47(4)501-515 doi101046j1365-2427200200887x
Wiens J A J T Rotenberry and B van Horne1987 Habitat occupancy patterns of North
American shrubsteppe birds the effects of spatialscale Oikos 48132-147 doi1023073565849
Wilcove D S D Rothstein J Dubow A Phillipsand E Losos 1998 Quantifying threats to imperiledspecies in the United States Bioscience 48607-615doi1023071313420
Wu J 2004 Effects of changing scale on landscapepattern analysis scaling relations LandscapeEcology 19(2)125-138 doi101023BLAND000002171140074ae
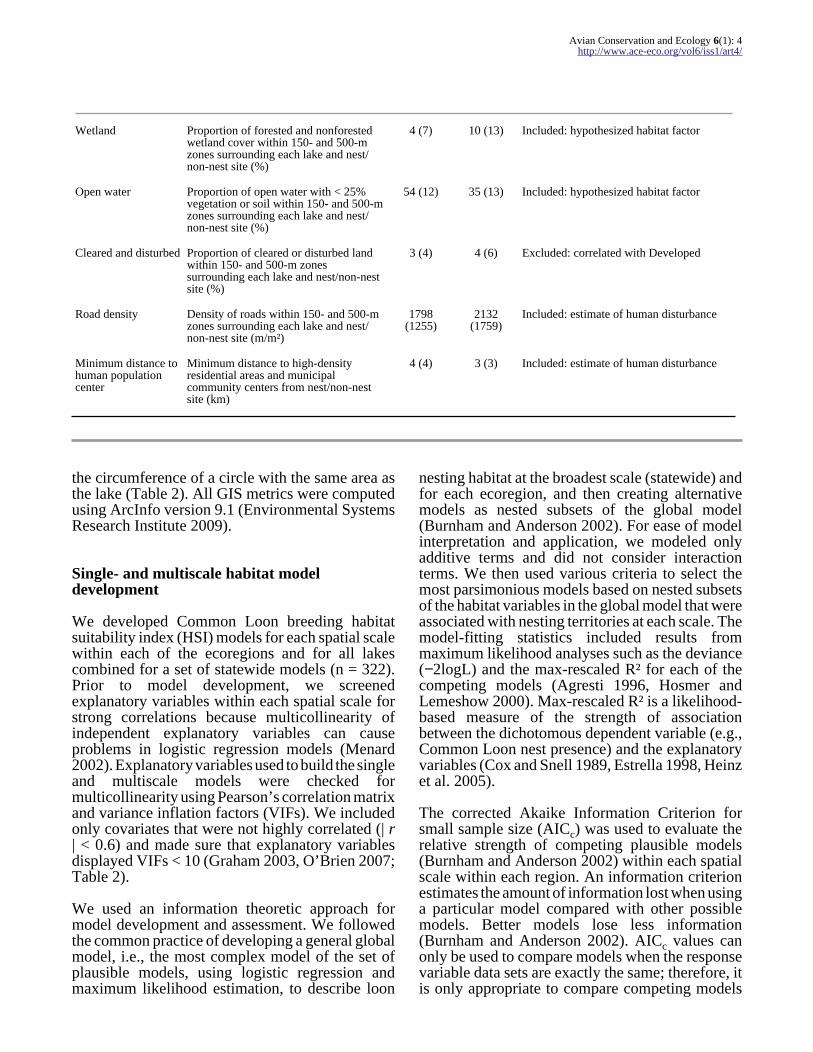
Avian Conservation and Ecology 6(1) 4httpwwwace-ecoorgvol6iss1art4
Fig 4 Maps illustrating how using GIS route feature classes were generated along the perimeter ofeach lake so that all features of a lake including islands are treated as a single entity Along each routea randomly chosen non-nest site was located on lakes that were monitored for loons but had no loonoccurrences
within each region The model with the lowest AICc value of a set of candidate models is considered thebest approximating model ie the mostparsimonious model that achieves a balancebetween bias and variance (Burnham and Anderson2002)
The explanatory variables in the best approximatingmodels at each single spatial scale were then usedto build a multiscale habitat model (Graf et al 2005Lawler and Edwards 2006) for each ecoregion andfor a statewide multiscale model The differencebetween the AICc of a given model and theminimum AICc of the candidate set (∆iAICc) andAICc weights wi (the weight of evidence in favorof a given model relative to the set of candidatemodels) were used to rank the models within eachecoregion (Burnham and Anderson 2002 Anderson2008) When it is not clear which of the models fromthe set of candidate models is best as measured byAICc wi (ie wi gt 09 for any given model) aninformation theoretic-based model average approachis warranted In this case each of the candidatemodels with substantial empirical support (ie∆iAICc le 2) was weighted by its Akaike weight andcombined into a single averaged model by
generating weighted parameter estimates (ieparameter estimate multiplied by wi and thensummed across all models) for each parametermaking an ldquoaveragedrdquo prediction from thecombined model (Burnham and Anderson 2002Hollister et al 2008) Parameter estimates obtainedby model averaging reduce model selection bias andaccount for model selection uncertainty (Johnsonand Omland 2004)
We used odds ratios to examine the magnitude ofthe effect of an explanatory variable on theprobability of Common Loon nest presence at fixedvalues of other variables The odds ratio representsthe change in odds of observing loon nest presencefor a unit change in the explanatory variable Theodds ratio of an explanatory variable is calculatedas e(b times unit change) where b is the parameterrsquoscoefficient in the multivariable model and the testof whether b gt 0 is equivalent to testing whether theconfidence interval of the odds ratio crosses 10(Earnst et al 2006)
Once the most parsimonious models for each dataset were chosen we used classification tables toassess the accuracy of habitat models (Fielding and
Avian Conservation and Ecology 6(1) 4httpwwwace-ecoorgvol6iss1art4
Fig 5 Development of minimum Euclidian distance measured from the edge of a lake to the edge of thenearest lake with and without loons using GIS
Bell 1997) The area under the curve statistic (AUC)was derived from the receiver operatingcharacteristics (ROC) curve and was calculated foreach model as an additional measure of modelperformance AUC values range from 05 (scoresfor presenceabsence do not differ poor classifier)to 10 (complete distinction of presence fromabsence perfect classifier) For example an AUCof 088 means that a randomly chosen case from thepresence group will have a greater classifier scorethan a random selection from the absence group witha probability of 088 (Fielding and Bell 1997 Grafet al 2005 Hames et al 2006)
Residual analyses of the final fitted models wereused to test for spatial autocorrelation using theMoranrsquos Index method (Moran 1950 Fortin andDale 2005) The Pearson residuals from the fittedprobability (HSI) for each lake and its geographiccoordinates were used to assess spatialautocorrelation in the final models Statisticalanalyses were performed using the softwarepackages SAS 91 (SAS Institute Inc 2003) SPSS120 (SPSS Inc 1999) and GS+ Geostatistics forEnvironmental Sciences (Gamma Design Software2001)
RESULTS
Comparing general summary statistics for CommonLoon presence and absence at lakes across the entirestate of New Hampshire highlighted variablesassociated with loon habitat preferences (Table 2)Loons were found on lakes that were larger deeperand clearer with more islands and shorelineperimeter closer to nearby lakes inhabited by otherloons Loons also selected lakes with reducedconductivity and total phosphorus higher pH athigher elevations with lower flushing rates andfurther away from human community centers Landcover within the 150-m zone surrounding each lakewith loon nests was less developed and cleared hadlower road density less agricultural land forest andwetland and contained more open water comparedto the land cover surrounding the random non-nestsite locations (Table 2)
Ecoregional models
The three physiographic ecoregions of NewHampshire differed in landscape composition for anumber of the measured habitat types Most notably
Avian Conservation and Ecology 6(1) 4httpwwwace-ecoorgvol6iss1art4
there was a higher proportion of human-alteredlandscape in the two ecoregions south of the WhiteMountains (ecoregions 2 and 3 Fig 6) These twosouthern ecoregions have lakes surrounded bygreater areas of developed land and higher roaddensity with higher measured values forconductivity and total phosphorous and closer tohuman population centers (high-density residentialareas and municipal community centers Table 3Fig 6) Lakes in the Northern White Mountainecoregion are found at higher elevations on averagewith greater areas of surrounding forested andwetland habitat far from human population centersThe southwestern ecoregion New Hampshire-Vermont Upland has greater areas of agriculturalland and smaller lakes on average distinguishingthis ecoregion from the other two The southeasternecoregion Southern New England Coastal Hills andPlain has more open water surrounding the lakeslarger and deeper lakes with more shorelineperimeter and more islands per lake on averagecompared to the two other ecoregions (Table 3)
The best approximating model designation withineach data set has the highest AICc weight highestmax-rescaled Rsup2 and highest AUC classificationvalue For ecoregions 1 and 3 the multiscale modelshad the highest AICc weights and highest max-rescaled Rsup2 values compared to each of the singlescale models within each respective ecoregionsuggesting that breeding habitat selection by loonsis occurring at multiple scales It is important to notethat in the Northern White Mountain ecoregion(ecoregion 1) all five models (the four single-scalemodels and the multiscale model) have substantialempirical support (ie ∆iAICc le 2) warranting amultimodel inference or model averaging approachespecially when a particular parameter (ie lakesize) occurs in many of the candidate models(Burnham and Anderson 2002) This is also relevantfor the models in the Southern New England CoastalHills and Plain ecoregion (ecoregion 3) where allfour of the single-scale models have manyparameters in common Therefore model averagingwas performed for all of the candidate models inecoregion 1 and for the two highest ranking modelsin ecoregion 3 by weighting each model by itsAkaike weight and combining into a compositeaveraged model for each of these ecoregions (Tables4 and 5 respectively)
In ecoregion 2 (New Hampshire-Vermont Upland)the best approximating model was the modelmeasured at the catchment scale (landscape features
within 500 m of a lake) However the multiscalemodel also had substantial empirical support Thusmodel averaging was performed with these twomodels to produce a composite averaged model forecoregion 2 (Table 6)
Statewide models
The statewide models had a number of habitatcharacteristics in common describing breeding loonpreferences at each scale positive associations withdistance to human population centers water clarityelevation and lake size and negative associationswith road density and distance to nearby lakes withloon presence The most parsimonious and bestapproximating model was the single riparian-scalemodel developed with environmental variablesmeasured within the 150-m zone of the lake (model22 Table 7) This model describes loon preferencesfor clearer lakes nearby other lakes with loons athigher elevations with less surrounding roaddensity and further from human population centersNotably this was the only model within thestatewide model set that contained the explanatoryvariable islands and the only model with substantialempirical support based on information-theoreticstatistics (∆AICc le 2 Burnham and Anderson 2002)
It is important to note that all of the final modelsacross all three ecoregions including the statewidemodels achieved a high level of overall accuracybased on AUC values which ranged from 0914 to0989 indicating that all of these models predictloon nest presence fairly well The residuals of thebest approximating single-scale and multiscalemodels showed no significant spatial correlationbased on the Moranrsquos Index scores Given the weakspatial dependence of the residuals we did notfurther investigate spatial autocorrelation
DISCUSSION
General habitat suitability model for CommonLoon
Based on information-theoretic statistics the bestapproximating model among the statewide modelsis the single lake scale model describing theenvironment immediately surrounding the lakewithin a 150-m riparian buffer zone Overall optimalbreeding habitat for Common Loon across NewHampshire was identified as having the following
Avian Conservation and Ecology 6(1) 4httpwwwace-ecoorgvol6iss1art4
Fig 6 Proportion of developed land cover composition within 150- and 500-m zones surrounding lakeswithin each ecoregion Blue diamond = 25 quartile red square = minimum value green triangle =median value purple x = maximum value blue star = 75 quartile
Avian Conservation and Ecology 6(1) 4httpwwwace-ecoorgvol6iss1art4
Table 3 Summary of lake habitat for the three ecoregions for selected explanatory variables Means includeboth Common Loon nest presence and absence lakes
Habitat Variable Ecoregion Mean SE Min Max
Lake area (ha) 123
13796303
019010012
101012
32621819
20128
Lake perimeter (km) 123
131842
013007008
019048015
257048710
3019995
Lake maximum depth (m) 123
10195121
142080087
131115
497555549
Islands (numberlake) 123
214
093025121
000
5117128
Elevation (m) 123
465330145
594289207
1551135
728722601
Lake flushing rate (number of turnoversyr) 123
213100341
772277
030202
267176504
Water Clarity Secchi depth(m) 123
313841
022020018
090809
97116102
Total phosphorous (mgL) 123
001200120012
lt00010001
lt0001
000300010001
003800590052
Conductivity (micromhoscm) 123
339248216905
271299477
151016511664
112601827030600
Distance to loon lake (km) 123
253236
035026046
001001001
136174287
Distance to community center (km) 123
852529
075002023
001001001
24266213
Avian Conservation and Ecology 6(1) 4httpwwwace-ecoorgvol6iss1art4
Table 4 Summary of results for ecoregion 1 (Northern White Mountain) habitat models with their associatedAkaike weights N = 59 lakes Models with empirical support ie ∆iAICc le 2 are indicated in bold
Model Scale Rsup2 Kdagger Log likelihood AICc ∆iAICc Weightwi
AUC
2 Multiscale 087 3 minus668 1980 lt 0001 02444 0989
5 Foraging 073 2 minus786 1993 014 02281 0968
3 Catchment 072 2 minus820 2061 081 01627 0951
4 Riparian 072 2 minus826 2074 094 01526 0952
6 Nesting 150-m radius 076 2 minus846 2114 134 01249 0959
1 Global model 086 5 minus536 2185 206 00874 0988
Explanatory variables for each fitted modelDagger
2 Multiscale lake size (+) open water 500N (+)
5 Foraging open water 500N (+)
3 Catchment lake size (+)
4 Riparian lake size (+)
6 Nesting 150-m radius lake size (+)
1 Global model elevation (+) lake size (+) clarity (+) open water 500N (+)
Composite model Nest presence = minus8655 + 3127 (lake size) + 1570 (open water 500N)
daggerK indicates the total number of parameters ie the intercept and explanatory variablesDagger(+) = positive association (minus) = negative association L = lake scale N = nest scale
characteristics clear higher elevation lakes withislands further away from human populationcenters with lower surrounding road densities andwith nearby lakes occupied by other loons Waterclarity has long been associated with loon habitatpreference and our results are consistent withprevious studies (Vermeer 1973 McIntyre 19831988 Blair 1992 Meyer 2006) The significance ofthe minimum-distance-to-nearest-lake-with-loon-presence metric supports anecdotal observationsand published research describing loon nataldispersal This biotic interaction metric describesthe philopatric and conspecific attraction loonsdisplay and reveals the importance of the spatial
configuration of lakes in the selection of loonbreeding habitat (Strong et al 1987 Evers 2001Piper et al 2006 2008)
The unique habitat feature that distinguishes the bestmodel among the statewide models is theexplanatory variable islands which indicates high-quality breeding habitat for loons (Vermeer 1973Jung 1991 McIntyre and Barr 1997 Piper et al2006 Evers 2007) Based on odds ratio estimatesislands and lake clarity were the most importantfactors distinguishing loon breeding habitat for thestatewide data set (Table 8) The best statewidemodel also describes loon preferences for open
Avian Conservation and Ecology 6(1) 4httpwwwace-ecoorgvol6iss1art4
Table 5 Summary of results for ecoregion 3 (Southern New England Coastal Hills and Plain) habitatmodels with their associated Akaike weights N = 133 lakes Models with empirical support ie ∆iAICc le 2 are indicated in bold
Model Scale Rsup2 Kdagger Loglikelihood
AICc ∆iAICc Weight wi AUC
14 Multiscale 072 6 minus3284 7835 lt 0001 04282 0940
18 Nesting 069 4 minus3530 7892 057 03220 0931
15 Catchment 066 5 minus3565 8178 343 00772 0931
16 Riparian 066 5 minus3565 8178 343 00772 0931
17 Foraging 066 5 minus3565 8178 343 00772 0931
13 Globalmodel
075 11 minus3025 8467 632 00181 0949
Explanatory variables for each fitted modelDagger
14 Multiscale lake size (+) elevation (+) clarity (+) distance to loon (minus) phosphorous (minus)
18 Nesting elevation (+) lake size (+) phosphorous (minus)
15 Catchment distance to loon (minus) elevation (+) lake size (+) clarity (+)
16 Riparian distance to loon (minus) elevation (+) lake size (+) clarity (+)
17 Foraging distance to loon (minus) elevation (+) lake size (+) clarity (+)
13 Globalmodel
developed 150L (minus) open water 150L (+) road 150L (minus) islands (+) distance to loon (minus)elevation (+) lake size (+) phosphorous (minus) clarity (+) open water 500N (+)
Composite model Nest presence = minus4550 + 0006 (elevation) + 1180 (lake size) + 01714 (clarity) minus 02183 (distance toloon) minus 179503 (phosphorus)
daggerK indicates the total number of parameters ie the intercept and explanatory variablesDagger(+) = positive association (minus) = negative association L = lake scale N = nest scale
water surrounding the lake (eg hydrologicalconnectivity) Earnst et al (2006) also found thatYellow-billed Loon in northern Alaska selectbreeding habitat based on landscape-scale featuressuch as hydrological connectivity The explanatoryvariable minimum-distance-to-human-population-center was featured at every scale in the statewidemodels providing evidence that loons prefer tosituate nests on lakes further from humandisturbance A lake habitat selection study forwaterbirds in Canada also found that loons prefer
lakes that are farther from human activity or havemore forested land within a 500-m zone (Found etal 2008)
Effects of scale on Common Loon habitatassociations
Another of our objectives was to investigatewhether Common Loon selects breeding habitat atmultiple scales and to determine which scales are
Avian Conservation and Ecology 6(1) 4httpwwwace-ecoorgvol6iss1art4
Table 6 Summary of results for ecoregion 2 (New Hampshire-Vermont Upland) habitat models with theirassociated Akaike weights N = 130 lakes Models with empirical support ie ∆iAICc le 2 are indicatedin bold
Model Scale Rsup2 Kdagger Loglikelihood
AICc ∆iAICc Weight wi AUC
9 Catchment 081 8 minus2437 6593 lt 0001 06757 0971
8 Multiscale 083 10 minus2310 6806 213 02331 0973
10 Riparian 075 6 minus2872 7011 418 00834 0952
7 Globalmodel
079 11 minus2595 7613 1020 00041 0963
11 Foraging 073 7 minus3331 7930 1337 00008 0945
12 Nesting 068 7 minus3627 8745 2153 lt 000001 0930
Explanatory variables for each fitted modelDagger
9 Catchment open water 500L (+) road 500L (minus) islands (+) pH (+) elevation (+) clarity (+)agricultural 500L (minus)
8 Multiscale open water 150L (+) open water 500N (+) islands (+) clarity( +) road density 500L (minus)road density 150N (minus) distance to loon (minus) forest 150N (minus) wetland 150N (minus)
10 Riparian open water 150L (+) islands (+) distance to loon (minus) elevation (+) clarity (+)
7 Globalmodel
open water 150L (+) islands (+) distance to loon (minus) elevation (+) pH (+) clarity (+)agricultural 500L (minus) open water 500L (+) road density 500L (minus) forest 500 (minus)
11 Foraging open water 500N (+) agricultural 500N (minus) clarity (+) elevation (+) lake size (+)
12 Nesting road density 150N (minus) forest 150N (minus) wetland 150N (minus) elevation (+) lake size (+) flushingrate (minus)
Composite model Nest presence = minus22579 + 3179 (islands) + 1047 (clarity) + 0004 (elevation) + 0287 (open water150L) + 0405 (open water 500L) + 01064 (open water 500N) + 272 (pH) minus 0158 (road density 500L) minus 0362 (distanceto loon) minus 0314 (agricultural 500L) minus 0086 (forest 150N) minus 0079 (wetland 150N) minus 0065 (road density 150N)
daggerK indicates the total number of parameters ie the intercept and explanatory variablesDagger(+) = positive association (minus) = negative association L = lake scale N = nest scale
most important Using information theoreticstatistics the multiscale models for two of the threeecoregions were designated the best approximatingmodels and had substantial empirical support in allthree ecoregions Distinct differences are apparentwhen comparing models across ecoregions (Tables4 5 and 6) Loons in New Hampshire appear to be
selecting breeding habitat differently based onphysiographic ecoregion and at multiple scalesThese differences may be a reflection of theoccurrence of different environmental conditionsand ranges of variables in the three different regionsIn the Northern White Mountain ecoregion loonsare selecting breeding territories on the basis of lake
Avian Conservation and Ecology 6(1) 4httpwwwace-ecoorgvol6iss1art4
Table 7 Summary of results for New Hampshire statewide habitat models with their associated Akaikeweights N = 322 lakes Models with empirical support ie ∆iAICc le 2 are indicated in bold
Model Scale Rsup2 Kdagger Log likelihood AICc ∆iAICc Weight wi AUC
22 Riparian 065 8 minus8615 188764 000 08315 0926
21 Catchment 064 8 minus8843 193315 455 00854 0921
23 Foraging 063 7 minus8996 194269 561 00504 0919
19 Global model 070 15 minus8287 197304 854 00115 0941
24 Nesting 062 7 minus9192 198196 954 00071 0914
20 Multiscale 065 8 minus9365 203769 1501 00005 0926
Explanatory variables for each fitted modelDagger
22 Riparian open water 150L (+) elevation (+) islands (+) clarity (+) distance tohuman population (+) distance to loon (minus) road density 150L (minus)
21 Catchment distance to loon (minus) open water 500L (+) road density 500L (minus) elevation (+)lake size (+) clarity (+) distance to human population (+)
23 Foraging distance to loon (minus) open water 500N (+) elevation (+) lake size (+) clarity(+) distance to human population (+)
19 Global model open water 500L (minus) road density 500L (minus) road density 150N (minus) open water500N (+) road density 150L (minus) open water 150L (+) islands (+) distance toloon (minus) elevation (+) lake size (+) pH (+) phosphorous (minus) clarity (+)distance to human population (+)
24 Nesting distance to loon (minus) road density 150N (minus) elevation (+) lake size (+) clarity(+) distance to human population (+)
20 Multiscale distance to loon (minus) open water 500N (+) road density 150L (minus) elevation (+)lake size (+) clarity (+) distance to human population (+)
Statewide model Nest presence = minus7328 + 0115 (open water 150L) + 0001 (elevation) + 1067 (islands) + 0595 (clarity)+ 0211 (distance to human population) minus 0233 (distance to loon) minus 0033 (road density 150 L)
daggerK indicates the total number of parameters ie the intercept and explanatory variablesDagger(+) = positive association (minus) = negative association L = lake scale N = nest scale
size and the amount of open water surrounding thenest (eg island nest sites) In this ecoregion therewas no distinction between loon presence andabsence lakes based on human-altered variablessuch as road density and developed land or waterquality variables associated with human activitiesThe Northern White Mountain ecoregion has lowerroad densities surrounding the lakes and a less
human-dominated landscape in general Thereforethe loonsrsquo apparent selection based on a few lakemorphological factors may be more a reflection ofthe general environmental conditions and lack ofhuman-altered variables to select against It is alsointeresting to note that loons in this northernecoregion do not appear to be using the presence ofother loons on nearby lakes as a habitat selection
Avian Conservation and Ecology 6(1) 4httpwwwace-ecoorgvol6iss1art4
factor as is the case in the two more southerlyecoregions
The results for the Northern White Mountainecoregion suggest that prior to human alteration ofthe landscape loons may have chosen breedinghabitat based primarily on lake morphologicalfactors such as lake size and the amount of openwater surrounding the nest The catchment riparianforaging and nest scale-based models within theNorthern White Mountain ecoregion includeinformation describing the selection of loonbreeding habitat (Table 4) Three of these final fittedsingle-scale models had explanatory variables incommon (ie lake size) and were combined in themultiscale model for this ecoregion to determine thebest approximating model given the data set basedon the model probability Akaike weights wi (Table4) However using evidence ratios (Burnham andAnderson 2002) to compare the two best modelsthe best model (model 1) has only 19 times theweight of evidence relative to the second-best model(model 4) This relatively weak support for any ofthe models being the best model suggests that thesemodels are good candidates for model averaging ormultimodel inference Model averaging increasesparameter estimate precision and reduces biasassociated with model selection especially when allof the models have substantial support and areclosely related as in ecoregion 1
In the southwestern New Hampshire-VermontUpland loons appear to be avoiding human-alteredlandscapes such as those with high road density andgreater areas of agriculture (Table 6) This regionof New Hampshire contains the highest percentageof prime agricultural soils in the state and hasexperienced the highest amount of agriculturalconversion to developed land in the state over the5-yr period from 1997 to 2002 (Society for theProtection of New Hampshire Forests 2005) Withinthis ecoregion loons are selecting lakes with moreislands higher water clarity and more open watersurrounding the lakes and that are nearby otherlakes with loons present The catchment-scalemodel describing features within a 500-m zone ofthe lake best describes the data in this region (model9 Table 6) the only other model that has substantialempirical support for describing this data set is themultiscale model (model 8 Table 6) Thecatchment-scale model differs from the multiscalemodel by identifying positive associations of loonswith pH (an indicator of fishprey habitat) and lakeelevation and a negative association of loons with
agricultural land within 500 m of the lake Insteadof relying on a single best model for this ecoregionwe used model averaging to combine these twohighest ranking models to obtain robust estimatesof model parameters reduce model selection biasand account for model selection uncertainty(Johnson and Omland 2004) Based on the modelaveraged results and using odds ratios to identifyinfluential factors in this region islands pH andwater clarity appear to be the most influential habitatfeatures (Table 8)
Loons in the southeastern Southern New EnglandCoastal Hills and Plain appear to be selectingbreeding habitat similarly across all scales based ona few key elements larger lakes at increasingelevations with lower levels of phosphorous nearbyother lakes with loons (Table 5) Other studies havefound that loons avoid lakes with higherphosphorous and primary productivity (Blair 1992)which can reduce water clarity Total phosphoruswhich is associated with anthropogenic activitiesappears to be an important avoidance factor forloons selecting breeding habitat at multiple scalesbased on the multiscale and nesting-scale modelswhich are the two highest-ranking models for thisregion The two most influential factors in thisregion appear to be lake size and water clarity basedon odds ratio estimates (Table 8)
The natural arrangement of lakes in NewHampshire especially in the southeastern portionof the state (referred to as the Lakes Region) is ofparticular concern because this area has the fastestrate of human population change in NewHampshire The entire state population is projectedto grow by 358000 between 2000 and 2025 withan estimated 80 of that growth in the foursoutheastern counties of New Hampshire along theInterstate Highway 89 corridor and in the LakesRegion (Society for Protection of New HampshireForests 2005) Loons are responding to human-induced pressures on these lakes and across the stateby selecting against anthropogenic features such asroad density total phosphorous and conductivitydeveloped and agricultural lands and humanpopulation centers
CONCLUSION
Our results support the increasing evidence formultiscale habitat associations most commonlyfound in avian species (Gutzwiller and Anderson
Avian Conservation and Ecology 6(1) 4httpwwwace-ecoorgvol6iss1art4
Table 8 Model averaged parameter estimates and odds ratio estimates with confidence intervals forecoregional composite models and the statewide model These parameters constitute the final averagedmodels for each ecoregion and may be used directly to predict Common Loon nest presence regionally andthroughout the state of New Hampshire
Region Variable Theta SE Odds ratio 95 Wald confidence limits
Ecoregion 1 Northern White Mountain
Intercept minus8655 0704
Lake size 3127 0096 6935 0934 51509
Open water 500 nest 1570 0034 1482 1066 2062
Ecoregion 2 New Hampshire-Vermont Upland
Intercept minus22579 10485
Islands 3179 1120 18045 2760 117970
Clarity 1047 0349 2952 1500 5810
Elevation 0004 0002 1004 1000 1007
Open water 150 lake 0287 0136 1383 1153 1658
Open water 500 lake 0405 01145 1499 1198 1877
Open water 500 nest 01064 00485 0890 0810 0979
pH 272 10139 15195 2083 110844
Road density 500 lake minus0158 0064 0880 0789 0983
Distance to loon lake minus03619 0129 0691 0491 0971
Agricultural 500 lake minus03143 01489 0730 0545 0978
Forest 150 nest minus00856 00346 0913 0853 0977
Wetland 150 nest minus00793 00346 0920 0859 0985
Road density 150 nest minus00647 00286 0927 0877 0980
Ecoregion 3 Southern New England Coastal Hills and Plain
Intercept minus4550 0217
Elevation 0006 0001 1004 1000 1009
Lake size 1180 0158 3254 1640 6456
Clarity 01714 02835 1187 0681 2069
Distance to loon lake minus02183 0124 1000 1000 1000
Phosphorous minus179503 3190 lt 0001 lt 0001 lt 0001
(cond)
Avian Conservation and Ecology 6(1) 4httpwwwace-ecoorgvol6iss1art4
New Hampshire Statewide
Intercept minus73821 12467
Open water 150 lake 01150 00200 1122 1079 1167
Elevation 0001 0001 1001 1000 1002
Islands 10674 04210 2908 1274 6637
Clarity 05948 01503 1813 1350 2434
Distance to population center 02105 00797 1234 1056 1443
Distance to loon lake minus02331 00732 0792 0686 0914
Road density 150 lake minus00327 00148 0968 0940 0996
1987 Wiens et al 1987 Saab 1999 Meyer et al2002 Graf et al 2005 Kristan 2006 Lawler andEdwards 2006 Thogmartin 2007) The multiscalemodels within each ecoregion have substantialempirical support in describing breeding habitatsuggesting that Common Loon in New Hampshireis responding to environmental cues at scalesranging from broad catchment to finer riparian areassurrounding lakes as well as within lakes at thenesting scale Loons also appear to be selectinghabitat differently across the ecoregions based onthe varying landscape conditions they encounteracross New Hampshire This differential selectionof breeding habitat across ecoregions providesinformation for prioritizing conservation andfocusing management efforts in New HampshireConservation efforts in the northern ecoregionshould be focused on preserving the relatively lowerlevels of human activity and disturbance pressuressurrounding these northern lakes by preventingincreases in road density and construction nearlakes especially within the immediate shoreline oflarger lakes Loon conservation and managementactivities in the two southern ecoregions shouldfocus on reducing the effects of already existinghuman disturbances on water quality by mitigatingsources of phosphorous that can also directly affectclarity Other activities in these regions shouldinclude the prioritization for protection of high-quality nesting habitat such as small islands andundisturbed areas of lakes and preventingdevelopment in critical loon habitat Our resultssuggest that conservation strategies for CommonLoon should also consider environmental
influences beyond the immediate lake or riparianscale as the analysis demonstrates that loons arealso responding to landscape-level and catchment-scale conditions surrounding lakes
Responses to this article can be read online athttpwwwace-ecoorgvol6iss1art4responses
Acknowledgments
We thank the many people who share our interest inCommon Loon research and conservation Weappreciate the statistical assistance and advice ofDr James Heltshe and helpful advice fromreviewers of early drafts Drs James Lake BryanMilstead and Rick McKinney as well as that of theanonymous reviewers who contributed to the finalversion of this manuscript This is contributionnumber AED-10-048 of the Atlantic EcologyDivision National Health and EnvironmentalEffects Research Laboratory Office of Researchand Development US Environmental ProtectionAgency Although the research described in thiscontribution has been funded wholly by the USEnvironmental Protection Agency it has not beensubjected to Agency-level review Therefore it doesnot necessarily reflect the views of the AgencyMention of trade names products or services doesnot constitute endorsement or recommendation foruse
Avian Conservation and Ecology 6(1) 4httpwwwace-ecoorgvol6iss1art4
LITERATURE CITED
Agresti A 1996 An introduction to categoricaldata analysisWiley New York New York USA
Alvo R D J T Hussell and M Berrill 1988 Thebreeding success of common loons (Gavia immer)in relation to alkalinity and other lake characteristicsin Ontario Canadian Journal of Zoology 66(3)746-752
Anderson D R 2008 Model based inferences inthe life sciences a primer on evidence SpringerNew York New York USA doi101007978-0-387-74075-1
Anderson J R E E Hardy J T Roach and R EWitmer 1976 A land use and land coverclassification system for use with remote sensordata Geological Survey Professional Paper 964 US Geological Survey Washington DC USA
Austin M 2007 Species distribution models andecological theory a critical assessment and somepossible new approaches Ecological Modelling 200(1-2)1-19 doi101016jecolmodel200607005
Barr J F 1986 Population dynamics of thecommon loon associated with mercury-contaminatedwaters in northwestern Ontario Occasional PaperNumber 56 Canadian Wildlife Service OttawaCanada
Battin J and J J Lawler 2006 Cross-scalecorrelations and the design of avian-habitatselection studies Condor 10859-70 doi1016500010-5422(2006)108[0059CCATDA]20CO2
Blair R B 1992 Lake features water quality andthe summer distribution of Common Loons in NewHampshire Journal of Field Ornithology 63(1)1-9
Burgess N M D C Evers and J D Kaplan 2005Mercury and other contaminants in Common Loonsbreeding in Atlantic Canada Ecotoxicology 14(1-2)241-252 doi101007s10646-004-6271-0
Burnham K P and D R Anderson 2002 Modelselection and multimodel inference a practicalinformation-theoretic approach Second editionSpringer New York New York USA
Cox D R and E J Snell 1989 Analysis of binarydata Second edition Chapman amp Hall LondonUK
Cushman S A and K McGarigal 2002Hierarchical multi-scale decomposition of species-environment relationships Landscape Ecology 17(7)637-646 doi101023A1021571603605
Cushman S A and K McGarigal 2004Hierarchical analysis of forest bird species-environment relationships in the Oregon CoastRange Ecological Applications 14(4)1090-1105 doi10189003-5131
Deppe J L and J T Rotenberry 2008 Scale-dependent habitat use by fall migratory birdsvegetation structure floristics and geographyEcological Monographs 78(3)461-487 doi10189007-01631
Desorbo C R K M Taylor D E Kramer J FairJ H Cooley Jr D C Evers W Hanson H SVogel and J L Atwood 2007 Reproductiveadvantages for Common Loons using rafts Journalof Wildlife Management 71(4)1206-1213 doi1021932006-422
Driscoll M J L T Donovan R Mickey AHoward and K K Fleming 2005 Determinants ofwood thrush nest success a multi-scale modelselection approach Journal of Wildlife Management 69(2)699-709 doi1021930022-541X(2005)069[0699DOWTNS]20CO2
Earnst S L R Platte and L Bond 2006 Alandscape-scale model of yellow-billed loon (Gaviaadamsii) habitat preferences in northern AlaskaHydrobiologia 567(1)227-236 doi101007s10750-006-0042-2
Edwards T C Jr G G Moisen T S Frescinoand J J Lawler 2003 Modeling multipleecological scales to link landscape theory to wildlifeconservation Pages 153-172 in J A Bissonette andI Storch editors Landscape ecology and resourcemanagement linking theory with practice IslandPress Washington DC USA
Environmental Systems Research Institute 2009ArcInfo geographic information system (GIS)software Version 91 Redlands California USA
Avian Conservation and Ecology 6(1) 4httpwwwace-ecoorgvol6iss1art4
Estrella A 1998 A new measure of fit for equationswith dichotomous dependent variables Journal ofBusiness and Economic Statistics 16(2)198-205 doi1023071392575
Evers D C 2001 Common Loon populationstudies continental mercury patterns and breedingterritory philopatry Dissertation University ofMinnesota St Paul Minnesota USA
Evers D C 2007 Status assessment andconservation plan for the Common Loon (Gaviaimmer) in North America BRI Report 2007-20 US Fish and Wildlife Service Hadley MassachusettsUSA
Evers D C L J Savoy C R DeSorbo D EYates W Hanson K M Taylor L Siegel J HCooley M S Bank A Major K Munney BMower H S Vogel N Schoch M Pokras M WGoodale and J Fair 2008 Adverse effects fromenvironmental mercury loads on breeding commonloons Ecotoxicology 17(2)69-81 doi101007s10646-007-0168-7
Fielding A H and J F Bell 1997 A review ofmethods for the assessment of prediction errors inconservation presenceabsence models EnvironmentalConservation 24(1)38-49 doi101017S0376892997000088
Fortin M-J and M R T Dale 2005 Spatialanalysis a guide for ecologists CambridgeUniversity Press Cambridge UK
Found C S M Webb and M S Boyce 2008Selection of lake habitats by waterbirds in the borealtransition zone of northeastern Alberta CanadianJournal of Zoology 86(4)277-285 doi101139Z07-137
Fraterrigo J M and J A Downing 2008 Theinfluence of land use on lake nutrients varies withwatershed transport capacity Ecosystems 11(7)1021-1034 doi101007s10021-008-9176-6
Freemark K E D Bert and M A Villard 2002Patch- landscape- and regional-scale effects onbiota Pages 58-83 in K J Gutzwiller editorApplying landscape ecology in biologicalconservation Springer New York New YorkUSA
Gamma Design Software 2001 GS+ geostatisticsfor the environmental sciences PlainwellMichigan USA
Garshellis D L 2000 Delusions in habitatevaluation measuring use selection andimportance Pages 111-153 in L Boitani and T KFuller editors Research techniques in animalecology controversies and consequences ColumbiaUniversity Press New York New York USA
Goldstein H 2003 Multilevel statistical models Third edition Hodder Arnold London UK
Graf R F K Bollmann W Suter and HBugmann 2005 The importance of spatial scale inhabitat models Capercaillie in the Swiss AlpsLandscape Ecology 20(6)703-717 doi101007s10980-005-0063-7
Graham M H 2003 Confronting multicollinearityin ecological multiple regression Ecology 842809-2815 doi10189002-3114
Gutzwiller K J and S H Anderson 1987Multiscale associations between cavity-nestingbirds and features of Wyoming streamsidewoodlands Condor 89534-548 doi1023071368643
Hames R S J D Lowe S Barker Swarthout andK V Rosenberg 2006 Understanding the risk toneotropical migrant bird species of multiple human-caused stressors elucidating processes behindpatterns Ecology and Society 11(1) 24 [online]URL httpwwwecologyandsocietyorgvol11iss1art24
Hammond C A M 2008 A demographic andlandscape analysis for common loons in northwestMontana Thesis University of Montana MissoulaMontana USA [online] URL httpetdlibumteduthesesavailableetd-04242008-130448
Heimberger M D Euler and J Barr 1983 Theimpact of cottage development on Common Loonreproductive success in central Ontario WilsonBulletin 95(3)431-439
Heinz H T Waldhoumlr and M Mittlboumlck 2005Careful use of pseudo R-squared measures inepidemiological studies Statistics in Medicine 24(18)2867-2872 doi101002sim2168
Avian Conservation and Ecology 6(1) 4httpwwwace-ecoorgvol6iss1art4
Hollister J W P V August J F Paul and H AWalker 2008 Predicting estuarine sediment metalconcentrations and inferred ecological conditionsan information theoretic approach Journal ofEnvironmental Quality 37(1)234-244 doi102134jeq20070105
Hosmer D W and S Lemeshow 2000 Appliedlogistic regression analysis Second edition WileyNew York New York USA doi1010020471722146
Hutchinson G E 1957 A treatise of limnologyVolume 1 geography physics and chemistry WileyNew York New York USA
Johnson J B and K S Omland 2004 Modelselection in ecology and evolution Trends inEcology and Evolution 19(2)101-108 doi101016jtree200310013
Johnson M D 2007 Measuring habitat quality areview Condor 109(3)489-504 doi10165083471
Johnston C A and B A Shmagin 2006 Scaleissues in lake-watershed interactions assessingshoreline development impacts on water clarityPages 297-313 in J Wu K B Jones H Li and OL Loucks editors Scaling and uncertainty analysisin ecology methods and applications SpringerDordrecht The Netherlands
Jung R E 1991 Effects of human activities andlake characteristics on the behavior and breedingsuccess of Common Loons Passenger Pigeon 53207-218
Kamman N C N M Burgess C T Driscoll HA Simonin W Goodale J Linehan R EstabrookM Hutcheson A Major A M Scheuhammer andD A Scruton 2005 Mercury in freshwater fish ofnortheast North America a geographic perspectivebased on fish tissue monitoring databasesEcotoxicology 14(1-2)163-180 doi101007s10646-004-6267-9
Kristan W B III 2006 Sources and expectationsfor hierarchical structure in bird-habitat associationsCondor 108(1)5-12 doi1016500010-5422(2006)108[0005SAEFHS]20CO2
Kristan W B III and J M Scott 2006Hierarchical models for avian ecologists Condor 108(1)1-4 doi1016500010-5422(2006)108[0001HMFAE]20CO2
Kuhn-Hines A 2008 A multiscale approach tobreeding habitat model development and evaluationfor the common loon Gavia immer in NewHampshire USA ETD Collection for University ofRhode Island Paper AAI3346850 [online] URL httpdigitalcommonsuriedudissertationsAAI3346850
Lawler J J and T C Edwards Jr 2006 Avariance-decomposition approach to investigatingmultiscale habitat associations Condor 108(1)47-58 doi1016500010-5422(2006)108[0047AVATIM]20CO2
Li X D Li Z Ma and D Schneider 2006 Nestsite use by crested ibis dependence of a multifactormodel on spatial scale Landscape Ecology 21(8)1207-1216 doi101007s10980-006-0021-z
Loon Preservation Committee 2004 Fieldcollection protocol for surveying and managingCommon Loons in New Hampshire LoonPreservation Committee Moultonborough NewHampshire USA
Loon Preservation Committee 2005 Meeting thechallenge thirty years of preserving loons and theirhabitats in New Hampshire Loon PreservationCommittee Moultonborough New HampshireUSA
Luck G W 2002 The habitat requirements of therufous treecreeper (Climacteris rufa) 1 Preferentialhabitat use demonstrated at multiple spatial scalesBiological Conservation 105(3)383-394 doi101016S0006-3207(01)00222-1
MacKenzie D I 2005 Was it there Dealing withimperfect detection for species presenceabsencedata Australian and New Zealand Journal ofStatistics 47(1)65-74 doi101111j1467-842X200500372x
MacKenzie D I J D Nichols J E Hines M GKnutson and A B Franklin 2003 Estimating siteoccupancy colonization and local extinction whena species is detected imperfectly Ecology 84(8)2200-2207 doi10189002-3090
Avian Conservation and Ecology 6(1) 4httpwwwace-ecoorgvol6iss1art4
Martin S L and P A Soranno 2006 Lakelandscape position relationships to hydrologicconnectivity and landscape features Limnology andOceanography 51(2)801-814 doi104319lo20065120801
McGarigal K and B J Marks 1995 FRAGSTATSspatial pattern analysis program for quantifyinglandscape structure General Technical ReportPNW-GTR-351 US Department of AgricultureForest Service Washington DC USA
McIntyre J W 1983 Nurseries a consideration ofhabitat requirements during the early chick-rearingperiod in common loons Journal of FieldOrnithology 54(3)247-253
McIntyre J W 1988 The Common Loon spirit ofnorthern lakes University of Minnesota PressMinneapolis Minnesota USA
McIntyre J W and J F Barr 1997 Common loonGavia immer In A Poole and F Gill editors TheBirds of North America 313 Academy of NaturalSciences of Philadelphia and American OrnithologistsUnion Washington DC USA
Menard S 2002 Applied logistic regressionanalysis Second edition Sage PublicationsThousand Oaks California USA
Meyer C B S L Miller and C J Ralph 2002Multi-scale landscape and seascape patternsassociated with marbeled murrelet nesting areas onthe US west coast Landscape Ecology 17(2)95-115 doi101023A1016574928706
Meyer M W 2006 Evaluating the impact ofmultiple stressors on Common Loon populationdemographics-an integrated laboratory and fieldapproach EPA STAR Co-operative AgreementNumber R82-9085 Environmental ProtectionAgency Washington DC USA
Meyer M W D C Evers J J Hartigan and P SRasmussen 1998 Patterns of common loon (Gaviaimmer) mercury exposure reproduction andsurvival in Wisconsin USA EnvironmentalToxicology and Chemistry 17(2)184-190
Meyer M W and J E Woodford 1996Enhancing osprey (Pandion haliaetus) and commonloon (Gavia immer) reproduction on impacted
Wisconsin waterways Final report US Fish andWildlife Service Washington DC USA
Moran P A P 1950 Notes on continuousstochastic phenomena Biometrika 37(1-2)17-23 doi101093biomet371-217
Murtagh P A and P S Pooler 2006 Evaluatingecological indicators lakes in the northeasternUnited States Environmental Monitoring andAssessment 119(1-3)83-96 doi101007s10661-005-9011-x
New Hampshire Department of EnvironmentalServices 2005 Water quality data survey summaryfor New Hampshire lakes and ponds NewHampshire Department of Environmental ServicesNew Hampshire USA [online] URL httpdesnhgovorganizationdivisionswaterwmblakestrophic_summaryhtm
New Hampshire Department of EnvironmentalServices 2006 Community center areas NewHampshire Department of Environmental ServicesNew Hampshire USA [online] URL httpwwwgranitunhedudatadatacatpagescommunitycenterareaspdf
Newbrey J L M A Bozek and N D Niemuth2005 Effects of lake characteristics and humandisturbance on the presence of piscivorous birds innorthern Wisconsin USA Waterbirds 28(4)478-486 doi1016751524-4695(2005)28[478EOLCAH]20CO2
Nocera J J G J Forbes and G R Milton 2008The relevance of local-scale relationships to habitatmanagement and landscape patterns AvianConservation and Ecology - Eacutecologie etconservation des oiseaux 3(1) 4 [online] URL httpwwwace-ecoorgvol3iss1art4
Northeast Loon Study Work Group 2008 [online]URL httpwwwbriloonorgscience-and-conservationcentersNELSWGphp
OrsquoBrien R M 2007 A caution regarding rules ofthumb for variance inflation factors Quality ampQuantity 41(5)673-690 doi101007s11135-006-9018-6
Patton D R 1975 A diversity index for quantifyinghabitat lsquoedgersquo Wildlife Society Bulletin 3171-173
Avian Conservation and Ecology 6(1) 4httpwwwace-ecoorgvol6iss1art4
Penhollow M E and D F Stauffer 2000 Large-scale habitat relationships of neotropical migratorybirds in Virginia Journal of Wildlife Management 64(2)362-373 doi1023073803234
Piper W H C Walcott J N Mager III M PeralaK B Tischler E Harrington A J Turcotte MSchwabenlander and N Banfield 2006 Prospectingin a solitary breeder chick production elicitsterritorial intrusions in common loons BehavioralEcology 17(6)881-888 doi101093behecoarl021
Piper W H C Walcott J N Mager and F JSpilker 2008 Nestsite selection by male loons leadsto sex-biased site familiarity Journal of AnimalEcology 77(2)205-210 doi101111j1365-2656200701334x
Rimmer C C 1992 Common Loon Gavia immer Pages 3-30 in K J Schneider and D M Penceeditors Migratory nongame birds managementconcern in the Northeast US Fish and WildlifeService Newton Corner Massachusetts USA
Riitters K H R V OrsquoNeill and K B Jones 1997Assessing habitat suitability at multiple scales alandscape-level approach Biological Conservation 81(1-2)191-202 doi101016S0006-3207(96)00145-0
Saab V 1999 Importance of spatial scale to habitatuse by breeding birds in riparian forests ahierarchical analysis Ecological Applications 9(1)135-151 doi1018901051-0761(1999)009[0135IOSSTH]20CO2
SAS Institute Inc 2003 SAS 91 Cary NorthCarolina USA
Scott J M P J Heglund M L Morrison J BHaufler M G Raphael W A Wall and F BSamson editors 2002 Predicting speciesoccurrences issues of accuracy and scale IslandPress Washington DC USA
Society for Protection of New Hampshire Forests2005 New Hampshirersquos changing landscapepopulation growth and land use changes Societyfor Protection of New Hampshire Forests [online]URL httpwwwforestsocietyorgresearchresearch-projectsasp
Soranno P A K E Webster K S Cheruvelil andM T Bremigan 2009 The lake landscape-contextframework linking aquatic connections terrestrialfeatures and human effects at multiple scalesVerhandlungen des Internationalen Verein Limnologie 30(5)695-700
Sperduto D D and W F Nichols 2004 Naturalcommunities of New Hampshire New HampshireNatural Heritage Bureau Concord New HampshireUSA and University of New HampshireCooperative Extension Durham New HampshireUSA
SPSS Inc 1999 SPSS 100 Chicago Illinois USA
Stauffer H B C J Ralph and S L Miller 2004Ranking habitat for marbled murrelets a newconservation approach for species with uncertaindetection Ecological Applications 14(5)1374-1383doi10189003-5068
Stein B A and S R Flack 1997 1997 speciesreport card the status of US plants and animals The Nature Conservancy Arlington VirginiaUSA [online] URL httpwwwnatureserveorglibrary1997speciesreportcardpdf
Strauss B and R Biedermann 2007 Evaluatingtemporal and spatial generality How valid arespecies-habitat relationship models EcologicalModeling 204104-114 doi101016jecolmodel200612027
Strong P I V and J A Bissonette 1989 Feedingand chick-rearing areas of common loons Journalof Wildlife Management 5372-76 doi1023073801308
Strong P I V J A Bissonette and J S Fair 1987Reuse of nesting and nursery areas by CommonLoons Journal of Wildlife Management 51123-127doi1023073801642
Taylor K M and H S Vogel 2000 NewHampshire report Pages 110-113 in J McIntyre andD C Evers editors Loons old history and newfindings Proceedings symposium 1997 meetingAmerican Ornithologists Union North AmericanLoon Fund Holderness New Hampshire USA
Thogmartin W E 2007 Effects at the landscapescale may constrain habitat relations at finer scales
Avian Conservation and Ecology 6(1) 4httpwwwace-ecoorgvol6iss1art4
Avian Conservation and Ecology - Eacutecologie etconservation des oiseaux 2(2) 6 [online] URL URL httpwwwace-ecoorgvol2iss2art6
Thogmartin W E and M G Knutson 2007Scaling local species-habitat relations to the largerlandscape with a hierarchical spatial count modelLandscape Ecology 22(1)61-75 doi101007s10980-006-9005-2
Thompson C M and K McGarigal 2002 Theinfluence of research scale on bald eagle habitatselection along the lower Hudson River New York(USA) Landscape Ecology 17(6)569-586 doi101023A1021501231182
Titus J R and L W VanDruff 1981 Responseof the common loon to recreational pressure in theBoundary Waters Canoe Area northeasternMinnesota Wildlife Monographs 791-60
Trocki C L and P W C Paton 2006 Assessinghabitat selection by foraging egrets in salt marshesat multiple spatial scales Wetlands 26(2)307-312 doi1016720277-5212(2006)26[307AHSBFE]20CO2
Turner M G 2005 Landscape ecology What isthe state of the science Annual Review of EcologyEvolution and Systematics 36319-344 doi101146annurevecolsys36102003152614
Tyre A J B Tenhumberg S A Field D NiejalkeK Parris and H P Possingham 2003 Improvingprecision and reducing bias in biological surveysestimating false-negative error rates EcologicalApplications 13(6)1790-1801 doi10189002-5078
Vermeer K 1973 Some aspects of the nestingrequirements of common loons in Alberta WilsonBulletin 85429-435
Wiens J A 1989 Spatial scaling in ecologyFunctional Ecology 3385-397 doi1023072389612
Wiens J A 2002 Riverine landscapes takinglandscape ecology into the water FreshwaterBiology 47(4)501-515 doi101046j1365-2427200200887x
Wiens J A J T Rotenberry and B van Horne1987 Habitat occupancy patterns of North
American shrubsteppe birds the effects of spatialscale Oikos 48132-147 doi1023073565849
Wilcove D S D Rothstein J Dubow A Phillipsand E Losos 1998 Quantifying threats to imperiledspecies in the United States Bioscience 48607-615doi1023071313420
Wu J 2004 Effects of changing scale on landscapepattern analysis scaling relations LandscapeEcology 19(2)125-138 doi101023BLAND000002171140074ae
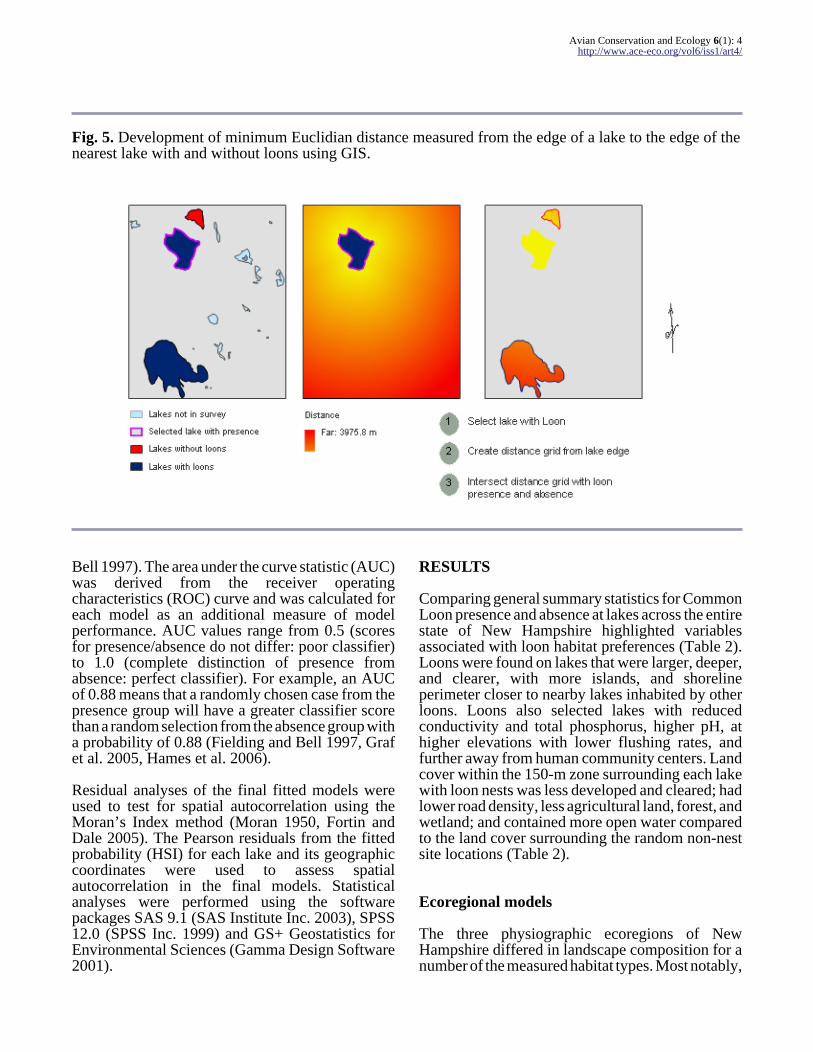
Avian Conservation and Ecology 6(1) 4httpwwwace-ecoorgvol6iss1art4
Fig 5 Development of minimum Euclidian distance measured from the edge of a lake to the edge of thenearest lake with and without loons using GIS
Bell 1997) The area under the curve statistic (AUC)was derived from the receiver operatingcharacteristics (ROC) curve and was calculated foreach model as an additional measure of modelperformance AUC values range from 05 (scoresfor presenceabsence do not differ poor classifier)to 10 (complete distinction of presence fromabsence perfect classifier) For example an AUCof 088 means that a randomly chosen case from thepresence group will have a greater classifier scorethan a random selection from the absence group witha probability of 088 (Fielding and Bell 1997 Grafet al 2005 Hames et al 2006)
Residual analyses of the final fitted models wereused to test for spatial autocorrelation using theMoranrsquos Index method (Moran 1950 Fortin andDale 2005) The Pearson residuals from the fittedprobability (HSI) for each lake and its geographiccoordinates were used to assess spatialautocorrelation in the final models Statisticalanalyses were performed using the softwarepackages SAS 91 (SAS Institute Inc 2003) SPSS120 (SPSS Inc 1999) and GS+ Geostatistics forEnvironmental Sciences (Gamma Design Software2001)
RESULTS
Comparing general summary statistics for CommonLoon presence and absence at lakes across the entirestate of New Hampshire highlighted variablesassociated with loon habitat preferences (Table 2)Loons were found on lakes that were larger deeperand clearer with more islands and shorelineperimeter closer to nearby lakes inhabited by otherloons Loons also selected lakes with reducedconductivity and total phosphorus higher pH athigher elevations with lower flushing rates andfurther away from human community centers Landcover within the 150-m zone surrounding each lakewith loon nests was less developed and cleared hadlower road density less agricultural land forest andwetland and contained more open water comparedto the land cover surrounding the random non-nestsite locations (Table 2)
Ecoregional models
The three physiographic ecoregions of NewHampshire differed in landscape composition for anumber of the measured habitat types Most notably
Avian Conservation and Ecology 6(1) 4httpwwwace-ecoorgvol6iss1art4
there was a higher proportion of human-alteredlandscape in the two ecoregions south of the WhiteMountains (ecoregions 2 and 3 Fig 6) These twosouthern ecoregions have lakes surrounded bygreater areas of developed land and higher roaddensity with higher measured values forconductivity and total phosphorous and closer tohuman population centers (high-density residentialareas and municipal community centers Table 3Fig 6) Lakes in the Northern White Mountainecoregion are found at higher elevations on averagewith greater areas of surrounding forested andwetland habitat far from human population centersThe southwestern ecoregion New Hampshire-Vermont Upland has greater areas of agriculturalland and smaller lakes on average distinguishingthis ecoregion from the other two The southeasternecoregion Southern New England Coastal Hills andPlain has more open water surrounding the lakeslarger and deeper lakes with more shorelineperimeter and more islands per lake on averagecompared to the two other ecoregions (Table 3)
The best approximating model designation withineach data set has the highest AICc weight highestmax-rescaled Rsup2 and highest AUC classificationvalue For ecoregions 1 and 3 the multiscale modelshad the highest AICc weights and highest max-rescaled Rsup2 values compared to each of the singlescale models within each respective ecoregionsuggesting that breeding habitat selection by loonsis occurring at multiple scales It is important to notethat in the Northern White Mountain ecoregion(ecoregion 1) all five models (the four single-scalemodels and the multiscale model) have substantialempirical support (ie ∆iAICc le 2) warranting amultimodel inference or model averaging approachespecially when a particular parameter (ie lakesize) occurs in many of the candidate models(Burnham and Anderson 2002) This is also relevantfor the models in the Southern New England CoastalHills and Plain ecoregion (ecoregion 3) where allfour of the single-scale models have manyparameters in common Therefore model averagingwas performed for all of the candidate models inecoregion 1 and for the two highest ranking modelsin ecoregion 3 by weighting each model by itsAkaike weight and combining into a compositeaveraged model for each of these ecoregions (Tables4 and 5 respectively)
In ecoregion 2 (New Hampshire-Vermont Upland)the best approximating model was the modelmeasured at the catchment scale (landscape features
within 500 m of a lake) However the multiscalemodel also had substantial empirical support Thusmodel averaging was performed with these twomodels to produce a composite averaged model forecoregion 2 (Table 6)
Statewide models
The statewide models had a number of habitatcharacteristics in common describing breeding loonpreferences at each scale positive associations withdistance to human population centers water clarityelevation and lake size and negative associationswith road density and distance to nearby lakes withloon presence The most parsimonious and bestapproximating model was the single riparian-scalemodel developed with environmental variablesmeasured within the 150-m zone of the lake (model22 Table 7) This model describes loon preferencesfor clearer lakes nearby other lakes with loons athigher elevations with less surrounding roaddensity and further from human population centersNotably this was the only model within thestatewide model set that contained the explanatoryvariable islands and the only model with substantialempirical support based on information-theoreticstatistics (∆AICc le 2 Burnham and Anderson 2002)
It is important to note that all of the final modelsacross all three ecoregions including the statewidemodels achieved a high level of overall accuracybased on AUC values which ranged from 0914 to0989 indicating that all of these models predictloon nest presence fairly well The residuals of thebest approximating single-scale and multiscalemodels showed no significant spatial correlationbased on the Moranrsquos Index scores Given the weakspatial dependence of the residuals we did notfurther investigate spatial autocorrelation
DISCUSSION
General habitat suitability model for CommonLoon
Based on information-theoretic statistics the bestapproximating model among the statewide modelsis the single lake scale model describing theenvironment immediately surrounding the lakewithin a 150-m riparian buffer zone Overall optimalbreeding habitat for Common Loon across NewHampshire was identified as having the following
Avian Conservation and Ecology 6(1) 4httpwwwace-ecoorgvol6iss1art4
Fig 6 Proportion of developed land cover composition within 150- and 500-m zones surrounding lakeswithin each ecoregion Blue diamond = 25 quartile red square = minimum value green triangle =median value purple x = maximum value blue star = 75 quartile
Avian Conservation and Ecology 6(1) 4httpwwwace-ecoorgvol6iss1art4
Table 3 Summary of lake habitat for the three ecoregions for selected explanatory variables Means includeboth Common Loon nest presence and absence lakes
Habitat Variable Ecoregion Mean SE Min Max
Lake area (ha) 123
13796303
019010012
101012
32621819
20128
Lake perimeter (km) 123
131842
013007008
019048015
257048710
3019995
Lake maximum depth (m) 123
10195121
142080087
131115
497555549
Islands (numberlake) 123
214
093025121
000
5117128
Elevation (m) 123
465330145
594289207
1551135
728722601
Lake flushing rate (number of turnoversyr) 123
213100341
772277
030202
267176504
Water Clarity Secchi depth(m) 123
313841
022020018
090809
97116102
Total phosphorous (mgL) 123
001200120012
lt00010001
lt0001
000300010001
003800590052
Conductivity (micromhoscm) 123
339248216905
271299477
151016511664
112601827030600
Distance to loon lake (km) 123
253236
035026046
001001001
136174287
Distance to community center (km) 123
852529
075002023
001001001
24266213
Avian Conservation and Ecology 6(1) 4httpwwwace-ecoorgvol6iss1art4
Table 4 Summary of results for ecoregion 1 (Northern White Mountain) habitat models with their associatedAkaike weights N = 59 lakes Models with empirical support ie ∆iAICc le 2 are indicated in bold
Model Scale Rsup2 Kdagger Log likelihood AICc ∆iAICc Weightwi
AUC
2 Multiscale 087 3 minus668 1980 lt 0001 02444 0989
5 Foraging 073 2 minus786 1993 014 02281 0968
3 Catchment 072 2 minus820 2061 081 01627 0951
4 Riparian 072 2 minus826 2074 094 01526 0952
6 Nesting 150-m radius 076 2 minus846 2114 134 01249 0959
1 Global model 086 5 minus536 2185 206 00874 0988
Explanatory variables for each fitted modelDagger
2 Multiscale lake size (+) open water 500N (+)
5 Foraging open water 500N (+)
3 Catchment lake size (+)
4 Riparian lake size (+)
6 Nesting 150-m radius lake size (+)
1 Global model elevation (+) lake size (+) clarity (+) open water 500N (+)
Composite model Nest presence = minus8655 + 3127 (lake size) + 1570 (open water 500N)
daggerK indicates the total number of parameters ie the intercept and explanatory variablesDagger(+) = positive association (minus) = negative association L = lake scale N = nest scale
characteristics clear higher elevation lakes withislands further away from human populationcenters with lower surrounding road densities andwith nearby lakes occupied by other loons Waterclarity has long been associated with loon habitatpreference and our results are consistent withprevious studies (Vermeer 1973 McIntyre 19831988 Blair 1992 Meyer 2006) The significance ofthe minimum-distance-to-nearest-lake-with-loon-presence metric supports anecdotal observationsand published research describing loon nataldispersal This biotic interaction metric describesthe philopatric and conspecific attraction loonsdisplay and reveals the importance of the spatial
configuration of lakes in the selection of loonbreeding habitat (Strong et al 1987 Evers 2001Piper et al 2006 2008)
The unique habitat feature that distinguishes the bestmodel among the statewide models is theexplanatory variable islands which indicates high-quality breeding habitat for loons (Vermeer 1973Jung 1991 McIntyre and Barr 1997 Piper et al2006 Evers 2007) Based on odds ratio estimatesislands and lake clarity were the most importantfactors distinguishing loon breeding habitat for thestatewide data set (Table 8) The best statewidemodel also describes loon preferences for open
Avian Conservation and Ecology 6(1) 4httpwwwace-ecoorgvol6iss1art4
Table 5 Summary of results for ecoregion 3 (Southern New England Coastal Hills and Plain) habitatmodels with their associated Akaike weights N = 133 lakes Models with empirical support ie ∆iAICc le 2 are indicated in bold
Model Scale Rsup2 Kdagger Loglikelihood
AICc ∆iAICc Weight wi AUC
14 Multiscale 072 6 minus3284 7835 lt 0001 04282 0940
18 Nesting 069 4 minus3530 7892 057 03220 0931
15 Catchment 066 5 minus3565 8178 343 00772 0931
16 Riparian 066 5 minus3565 8178 343 00772 0931
17 Foraging 066 5 minus3565 8178 343 00772 0931
13 Globalmodel
075 11 minus3025 8467 632 00181 0949
Explanatory variables for each fitted modelDagger
14 Multiscale lake size (+) elevation (+) clarity (+) distance to loon (minus) phosphorous (minus)
18 Nesting elevation (+) lake size (+) phosphorous (minus)
15 Catchment distance to loon (minus) elevation (+) lake size (+) clarity (+)
16 Riparian distance to loon (minus) elevation (+) lake size (+) clarity (+)
17 Foraging distance to loon (minus) elevation (+) lake size (+) clarity (+)
13 Globalmodel
developed 150L (minus) open water 150L (+) road 150L (minus) islands (+) distance to loon (minus)elevation (+) lake size (+) phosphorous (minus) clarity (+) open water 500N (+)
Composite model Nest presence = minus4550 + 0006 (elevation) + 1180 (lake size) + 01714 (clarity) minus 02183 (distance toloon) minus 179503 (phosphorus)
daggerK indicates the total number of parameters ie the intercept and explanatory variablesDagger(+) = positive association (minus) = negative association L = lake scale N = nest scale
water surrounding the lake (eg hydrologicalconnectivity) Earnst et al (2006) also found thatYellow-billed Loon in northern Alaska selectbreeding habitat based on landscape-scale featuressuch as hydrological connectivity The explanatoryvariable minimum-distance-to-human-population-center was featured at every scale in the statewidemodels providing evidence that loons prefer tosituate nests on lakes further from humandisturbance A lake habitat selection study forwaterbirds in Canada also found that loons prefer
lakes that are farther from human activity or havemore forested land within a 500-m zone (Found etal 2008)
Effects of scale on Common Loon habitatassociations
Another of our objectives was to investigatewhether Common Loon selects breeding habitat atmultiple scales and to determine which scales are
Avian Conservation and Ecology 6(1) 4httpwwwace-ecoorgvol6iss1art4
Table 6 Summary of results for ecoregion 2 (New Hampshire-Vermont Upland) habitat models with theirassociated Akaike weights N = 130 lakes Models with empirical support ie ∆iAICc le 2 are indicatedin bold
Model Scale Rsup2 Kdagger Loglikelihood
AICc ∆iAICc Weight wi AUC
9 Catchment 081 8 minus2437 6593 lt 0001 06757 0971
8 Multiscale 083 10 minus2310 6806 213 02331 0973
10 Riparian 075 6 minus2872 7011 418 00834 0952
7 Globalmodel
079 11 minus2595 7613 1020 00041 0963
11 Foraging 073 7 minus3331 7930 1337 00008 0945
12 Nesting 068 7 minus3627 8745 2153 lt 000001 0930
Explanatory variables for each fitted modelDagger
9 Catchment open water 500L (+) road 500L (minus) islands (+) pH (+) elevation (+) clarity (+)agricultural 500L (minus)
8 Multiscale open water 150L (+) open water 500N (+) islands (+) clarity( +) road density 500L (minus)road density 150N (minus) distance to loon (minus) forest 150N (minus) wetland 150N (minus)
10 Riparian open water 150L (+) islands (+) distance to loon (minus) elevation (+) clarity (+)
7 Globalmodel
open water 150L (+) islands (+) distance to loon (minus) elevation (+) pH (+) clarity (+)agricultural 500L (minus) open water 500L (+) road density 500L (minus) forest 500 (minus)
11 Foraging open water 500N (+) agricultural 500N (minus) clarity (+) elevation (+) lake size (+)
12 Nesting road density 150N (minus) forest 150N (minus) wetland 150N (minus) elevation (+) lake size (+) flushingrate (minus)
Composite model Nest presence = minus22579 + 3179 (islands) + 1047 (clarity) + 0004 (elevation) + 0287 (open water150L) + 0405 (open water 500L) + 01064 (open water 500N) + 272 (pH) minus 0158 (road density 500L) minus 0362 (distanceto loon) minus 0314 (agricultural 500L) minus 0086 (forest 150N) minus 0079 (wetland 150N) minus 0065 (road density 150N)
daggerK indicates the total number of parameters ie the intercept and explanatory variablesDagger(+) = positive association (minus) = negative association L = lake scale N = nest scale
most important Using information theoreticstatistics the multiscale models for two of the threeecoregions were designated the best approximatingmodels and had substantial empirical support in allthree ecoregions Distinct differences are apparentwhen comparing models across ecoregions (Tables4 5 and 6) Loons in New Hampshire appear to be
selecting breeding habitat differently based onphysiographic ecoregion and at multiple scalesThese differences may be a reflection of theoccurrence of different environmental conditionsand ranges of variables in the three different regionsIn the Northern White Mountain ecoregion loonsare selecting breeding territories on the basis of lake
Avian Conservation and Ecology 6(1) 4httpwwwace-ecoorgvol6iss1art4
Table 7 Summary of results for New Hampshire statewide habitat models with their associated Akaikeweights N = 322 lakes Models with empirical support ie ∆iAICc le 2 are indicated in bold
Model Scale Rsup2 Kdagger Log likelihood AICc ∆iAICc Weight wi AUC
22 Riparian 065 8 minus8615 188764 000 08315 0926
21 Catchment 064 8 minus8843 193315 455 00854 0921
23 Foraging 063 7 minus8996 194269 561 00504 0919
19 Global model 070 15 minus8287 197304 854 00115 0941
24 Nesting 062 7 minus9192 198196 954 00071 0914
20 Multiscale 065 8 minus9365 203769 1501 00005 0926
Explanatory variables for each fitted modelDagger
22 Riparian open water 150L (+) elevation (+) islands (+) clarity (+) distance tohuman population (+) distance to loon (minus) road density 150L (minus)
21 Catchment distance to loon (minus) open water 500L (+) road density 500L (minus) elevation (+)lake size (+) clarity (+) distance to human population (+)
23 Foraging distance to loon (minus) open water 500N (+) elevation (+) lake size (+) clarity(+) distance to human population (+)
19 Global model open water 500L (minus) road density 500L (minus) road density 150N (minus) open water500N (+) road density 150L (minus) open water 150L (+) islands (+) distance toloon (minus) elevation (+) lake size (+) pH (+) phosphorous (minus) clarity (+)distance to human population (+)
24 Nesting distance to loon (minus) road density 150N (minus) elevation (+) lake size (+) clarity(+) distance to human population (+)
20 Multiscale distance to loon (minus) open water 500N (+) road density 150L (minus) elevation (+)lake size (+) clarity (+) distance to human population (+)
Statewide model Nest presence = minus7328 + 0115 (open water 150L) + 0001 (elevation) + 1067 (islands) + 0595 (clarity)+ 0211 (distance to human population) minus 0233 (distance to loon) minus 0033 (road density 150 L)
daggerK indicates the total number of parameters ie the intercept and explanatory variablesDagger(+) = positive association (minus) = negative association L = lake scale N = nest scale
size and the amount of open water surrounding thenest (eg island nest sites) In this ecoregion therewas no distinction between loon presence andabsence lakes based on human-altered variablessuch as road density and developed land or waterquality variables associated with human activitiesThe Northern White Mountain ecoregion has lowerroad densities surrounding the lakes and a less
human-dominated landscape in general Thereforethe loonsrsquo apparent selection based on a few lakemorphological factors may be more a reflection ofthe general environmental conditions and lack ofhuman-altered variables to select against It is alsointeresting to note that loons in this northernecoregion do not appear to be using the presence ofother loons on nearby lakes as a habitat selection
Avian Conservation and Ecology 6(1) 4httpwwwace-ecoorgvol6iss1art4
factor as is the case in the two more southerlyecoregions
The results for the Northern White Mountainecoregion suggest that prior to human alteration ofthe landscape loons may have chosen breedinghabitat based primarily on lake morphologicalfactors such as lake size and the amount of openwater surrounding the nest The catchment riparianforaging and nest scale-based models within theNorthern White Mountain ecoregion includeinformation describing the selection of loonbreeding habitat (Table 4) Three of these final fittedsingle-scale models had explanatory variables incommon (ie lake size) and were combined in themultiscale model for this ecoregion to determine thebest approximating model given the data set basedon the model probability Akaike weights wi (Table4) However using evidence ratios (Burnham andAnderson 2002) to compare the two best modelsthe best model (model 1) has only 19 times theweight of evidence relative to the second-best model(model 4) This relatively weak support for any ofthe models being the best model suggests that thesemodels are good candidates for model averaging ormultimodel inference Model averaging increasesparameter estimate precision and reduces biasassociated with model selection especially when allof the models have substantial support and areclosely related as in ecoregion 1
In the southwestern New Hampshire-VermontUpland loons appear to be avoiding human-alteredlandscapes such as those with high road density andgreater areas of agriculture (Table 6) This regionof New Hampshire contains the highest percentageof prime agricultural soils in the state and hasexperienced the highest amount of agriculturalconversion to developed land in the state over the5-yr period from 1997 to 2002 (Society for theProtection of New Hampshire Forests 2005) Withinthis ecoregion loons are selecting lakes with moreislands higher water clarity and more open watersurrounding the lakes and that are nearby otherlakes with loons present The catchment-scalemodel describing features within a 500-m zone ofthe lake best describes the data in this region (model9 Table 6) the only other model that has substantialempirical support for describing this data set is themultiscale model (model 8 Table 6) Thecatchment-scale model differs from the multiscalemodel by identifying positive associations of loonswith pH (an indicator of fishprey habitat) and lakeelevation and a negative association of loons with
agricultural land within 500 m of the lake Insteadof relying on a single best model for this ecoregionwe used model averaging to combine these twohighest ranking models to obtain robust estimatesof model parameters reduce model selection biasand account for model selection uncertainty(Johnson and Omland 2004) Based on the modelaveraged results and using odds ratios to identifyinfluential factors in this region islands pH andwater clarity appear to be the most influential habitatfeatures (Table 8)
Loons in the southeastern Southern New EnglandCoastal Hills and Plain appear to be selectingbreeding habitat similarly across all scales based ona few key elements larger lakes at increasingelevations with lower levels of phosphorous nearbyother lakes with loons (Table 5) Other studies havefound that loons avoid lakes with higherphosphorous and primary productivity (Blair 1992)which can reduce water clarity Total phosphoruswhich is associated with anthropogenic activitiesappears to be an important avoidance factor forloons selecting breeding habitat at multiple scalesbased on the multiscale and nesting-scale modelswhich are the two highest-ranking models for thisregion The two most influential factors in thisregion appear to be lake size and water clarity basedon odds ratio estimates (Table 8)
The natural arrangement of lakes in NewHampshire especially in the southeastern portionof the state (referred to as the Lakes Region) is ofparticular concern because this area has the fastestrate of human population change in NewHampshire The entire state population is projectedto grow by 358000 between 2000 and 2025 withan estimated 80 of that growth in the foursoutheastern counties of New Hampshire along theInterstate Highway 89 corridor and in the LakesRegion (Society for Protection of New HampshireForests 2005) Loons are responding to human-induced pressures on these lakes and across the stateby selecting against anthropogenic features such asroad density total phosphorous and conductivitydeveloped and agricultural lands and humanpopulation centers
CONCLUSION
Our results support the increasing evidence formultiscale habitat associations most commonlyfound in avian species (Gutzwiller and Anderson
Avian Conservation and Ecology 6(1) 4httpwwwace-ecoorgvol6iss1art4
Table 8 Model averaged parameter estimates and odds ratio estimates with confidence intervals forecoregional composite models and the statewide model These parameters constitute the final averagedmodels for each ecoregion and may be used directly to predict Common Loon nest presence regionally andthroughout the state of New Hampshire
Region Variable Theta SE Odds ratio 95 Wald confidence limits
Ecoregion 1 Northern White Mountain
Intercept minus8655 0704
Lake size 3127 0096 6935 0934 51509
Open water 500 nest 1570 0034 1482 1066 2062
Ecoregion 2 New Hampshire-Vermont Upland
Intercept minus22579 10485
Islands 3179 1120 18045 2760 117970
Clarity 1047 0349 2952 1500 5810
Elevation 0004 0002 1004 1000 1007
Open water 150 lake 0287 0136 1383 1153 1658
Open water 500 lake 0405 01145 1499 1198 1877
Open water 500 nest 01064 00485 0890 0810 0979
pH 272 10139 15195 2083 110844
Road density 500 lake minus0158 0064 0880 0789 0983
Distance to loon lake minus03619 0129 0691 0491 0971
Agricultural 500 lake minus03143 01489 0730 0545 0978
Forest 150 nest minus00856 00346 0913 0853 0977
Wetland 150 nest minus00793 00346 0920 0859 0985
Road density 150 nest minus00647 00286 0927 0877 0980
Ecoregion 3 Southern New England Coastal Hills and Plain
Intercept minus4550 0217
Elevation 0006 0001 1004 1000 1009
Lake size 1180 0158 3254 1640 6456
Clarity 01714 02835 1187 0681 2069
Distance to loon lake minus02183 0124 1000 1000 1000
Phosphorous minus179503 3190 lt 0001 lt 0001 lt 0001
(cond)
Avian Conservation and Ecology 6(1) 4httpwwwace-ecoorgvol6iss1art4
New Hampshire Statewide
Intercept minus73821 12467
Open water 150 lake 01150 00200 1122 1079 1167
Elevation 0001 0001 1001 1000 1002
Islands 10674 04210 2908 1274 6637
Clarity 05948 01503 1813 1350 2434
Distance to population center 02105 00797 1234 1056 1443
Distance to loon lake minus02331 00732 0792 0686 0914
Road density 150 lake minus00327 00148 0968 0940 0996
1987 Wiens et al 1987 Saab 1999 Meyer et al2002 Graf et al 2005 Kristan 2006 Lawler andEdwards 2006 Thogmartin 2007) The multiscalemodels within each ecoregion have substantialempirical support in describing breeding habitatsuggesting that Common Loon in New Hampshireis responding to environmental cues at scalesranging from broad catchment to finer riparian areassurrounding lakes as well as within lakes at thenesting scale Loons also appear to be selectinghabitat differently across the ecoregions based onthe varying landscape conditions they encounteracross New Hampshire This differential selectionof breeding habitat across ecoregions providesinformation for prioritizing conservation andfocusing management efforts in New HampshireConservation efforts in the northern ecoregionshould be focused on preserving the relatively lowerlevels of human activity and disturbance pressuressurrounding these northern lakes by preventingincreases in road density and construction nearlakes especially within the immediate shoreline oflarger lakes Loon conservation and managementactivities in the two southern ecoregions shouldfocus on reducing the effects of already existinghuman disturbances on water quality by mitigatingsources of phosphorous that can also directly affectclarity Other activities in these regions shouldinclude the prioritization for protection of high-quality nesting habitat such as small islands andundisturbed areas of lakes and preventingdevelopment in critical loon habitat Our resultssuggest that conservation strategies for CommonLoon should also consider environmental
influences beyond the immediate lake or riparianscale as the analysis demonstrates that loons arealso responding to landscape-level and catchment-scale conditions surrounding lakes
Responses to this article can be read online athttpwwwace-ecoorgvol6iss1art4responses
Acknowledgments
We thank the many people who share our interest inCommon Loon research and conservation Weappreciate the statistical assistance and advice ofDr James Heltshe and helpful advice fromreviewers of early drafts Drs James Lake BryanMilstead and Rick McKinney as well as that of theanonymous reviewers who contributed to the finalversion of this manuscript This is contributionnumber AED-10-048 of the Atlantic EcologyDivision National Health and EnvironmentalEffects Research Laboratory Office of Researchand Development US Environmental ProtectionAgency Although the research described in thiscontribution has been funded wholly by the USEnvironmental Protection Agency it has not beensubjected to Agency-level review Therefore it doesnot necessarily reflect the views of the AgencyMention of trade names products or services doesnot constitute endorsement or recommendation foruse
Avian Conservation and Ecology 6(1) 4httpwwwace-ecoorgvol6iss1art4
LITERATURE CITED
Agresti A 1996 An introduction to categoricaldata analysisWiley New York New York USA
Alvo R D J T Hussell and M Berrill 1988 Thebreeding success of common loons (Gavia immer)in relation to alkalinity and other lake characteristicsin Ontario Canadian Journal of Zoology 66(3)746-752
Anderson D R 2008 Model based inferences inthe life sciences a primer on evidence SpringerNew York New York USA doi101007978-0-387-74075-1
Anderson J R E E Hardy J T Roach and R EWitmer 1976 A land use and land coverclassification system for use with remote sensordata Geological Survey Professional Paper 964 US Geological Survey Washington DC USA
Austin M 2007 Species distribution models andecological theory a critical assessment and somepossible new approaches Ecological Modelling 200(1-2)1-19 doi101016jecolmodel200607005
Barr J F 1986 Population dynamics of thecommon loon associated with mercury-contaminatedwaters in northwestern Ontario Occasional PaperNumber 56 Canadian Wildlife Service OttawaCanada
Battin J and J J Lawler 2006 Cross-scalecorrelations and the design of avian-habitatselection studies Condor 10859-70 doi1016500010-5422(2006)108[0059CCATDA]20CO2
Blair R B 1992 Lake features water quality andthe summer distribution of Common Loons in NewHampshire Journal of Field Ornithology 63(1)1-9
Burgess N M D C Evers and J D Kaplan 2005Mercury and other contaminants in Common Loonsbreeding in Atlantic Canada Ecotoxicology 14(1-2)241-252 doi101007s10646-004-6271-0
Burnham K P and D R Anderson 2002 Modelselection and multimodel inference a practicalinformation-theoretic approach Second editionSpringer New York New York USA
Cox D R and E J Snell 1989 Analysis of binarydata Second edition Chapman amp Hall LondonUK
Cushman S A and K McGarigal 2002Hierarchical multi-scale decomposition of species-environment relationships Landscape Ecology 17(7)637-646 doi101023A1021571603605
Cushman S A and K McGarigal 2004Hierarchical analysis of forest bird species-environment relationships in the Oregon CoastRange Ecological Applications 14(4)1090-1105 doi10189003-5131
Deppe J L and J T Rotenberry 2008 Scale-dependent habitat use by fall migratory birdsvegetation structure floristics and geographyEcological Monographs 78(3)461-487 doi10189007-01631
Desorbo C R K M Taylor D E Kramer J FairJ H Cooley Jr D C Evers W Hanson H SVogel and J L Atwood 2007 Reproductiveadvantages for Common Loons using rafts Journalof Wildlife Management 71(4)1206-1213 doi1021932006-422
Driscoll M J L T Donovan R Mickey AHoward and K K Fleming 2005 Determinants ofwood thrush nest success a multi-scale modelselection approach Journal of Wildlife Management 69(2)699-709 doi1021930022-541X(2005)069[0699DOWTNS]20CO2
Earnst S L R Platte and L Bond 2006 Alandscape-scale model of yellow-billed loon (Gaviaadamsii) habitat preferences in northern AlaskaHydrobiologia 567(1)227-236 doi101007s10750-006-0042-2
Edwards T C Jr G G Moisen T S Frescinoand J J Lawler 2003 Modeling multipleecological scales to link landscape theory to wildlifeconservation Pages 153-172 in J A Bissonette andI Storch editors Landscape ecology and resourcemanagement linking theory with practice IslandPress Washington DC USA
Environmental Systems Research Institute 2009ArcInfo geographic information system (GIS)software Version 91 Redlands California USA
Avian Conservation and Ecology 6(1) 4httpwwwace-ecoorgvol6iss1art4
Estrella A 1998 A new measure of fit for equationswith dichotomous dependent variables Journal ofBusiness and Economic Statistics 16(2)198-205 doi1023071392575
Evers D C 2001 Common Loon populationstudies continental mercury patterns and breedingterritory philopatry Dissertation University ofMinnesota St Paul Minnesota USA
Evers D C 2007 Status assessment andconservation plan for the Common Loon (Gaviaimmer) in North America BRI Report 2007-20 US Fish and Wildlife Service Hadley MassachusettsUSA
Evers D C L J Savoy C R DeSorbo D EYates W Hanson K M Taylor L Siegel J HCooley M S Bank A Major K Munney BMower H S Vogel N Schoch M Pokras M WGoodale and J Fair 2008 Adverse effects fromenvironmental mercury loads on breeding commonloons Ecotoxicology 17(2)69-81 doi101007s10646-007-0168-7
Fielding A H and J F Bell 1997 A review ofmethods for the assessment of prediction errors inconservation presenceabsence models EnvironmentalConservation 24(1)38-49 doi101017S0376892997000088
Fortin M-J and M R T Dale 2005 Spatialanalysis a guide for ecologists CambridgeUniversity Press Cambridge UK
Found C S M Webb and M S Boyce 2008Selection of lake habitats by waterbirds in the borealtransition zone of northeastern Alberta CanadianJournal of Zoology 86(4)277-285 doi101139Z07-137
Fraterrigo J M and J A Downing 2008 Theinfluence of land use on lake nutrients varies withwatershed transport capacity Ecosystems 11(7)1021-1034 doi101007s10021-008-9176-6
Freemark K E D Bert and M A Villard 2002Patch- landscape- and regional-scale effects onbiota Pages 58-83 in K J Gutzwiller editorApplying landscape ecology in biologicalconservation Springer New York New YorkUSA
Gamma Design Software 2001 GS+ geostatisticsfor the environmental sciences PlainwellMichigan USA
Garshellis D L 2000 Delusions in habitatevaluation measuring use selection andimportance Pages 111-153 in L Boitani and T KFuller editors Research techniques in animalecology controversies and consequences ColumbiaUniversity Press New York New York USA
Goldstein H 2003 Multilevel statistical models Third edition Hodder Arnold London UK
Graf R F K Bollmann W Suter and HBugmann 2005 The importance of spatial scale inhabitat models Capercaillie in the Swiss AlpsLandscape Ecology 20(6)703-717 doi101007s10980-005-0063-7
Graham M H 2003 Confronting multicollinearityin ecological multiple regression Ecology 842809-2815 doi10189002-3114
Gutzwiller K J and S H Anderson 1987Multiscale associations between cavity-nestingbirds and features of Wyoming streamsidewoodlands Condor 89534-548 doi1023071368643
Hames R S J D Lowe S Barker Swarthout andK V Rosenberg 2006 Understanding the risk toneotropical migrant bird species of multiple human-caused stressors elucidating processes behindpatterns Ecology and Society 11(1) 24 [online]URL httpwwwecologyandsocietyorgvol11iss1art24
Hammond C A M 2008 A demographic andlandscape analysis for common loons in northwestMontana Thesis University of Montana MissoulaMontana USA [online] URL httpetdlibumteduthesesavailableetd-04242008-130448
Heimberger M D Euler and J Barr 1983 Theimpact of cottage development on Common Loonreproductive success in central Ontario WilsonBulletin 95(3)431-439
Heinz H T Waldhoumlr and M Mittlboumlck 2005Careful use of pseudo R-squared measures inepidemiological studies Statistics in Medicine 24(18)2867-2872 doi101002sim2168
Avian Conservation and Ecology 6(1) 4httpwwwace-ecoorgvol6iss1art4
Hollister J W P V August J F Paul and H AWalker 2008 Predicting estuarine sediment metalconcentrations and inferred ecological conditionsan information theoretic approach Journal ofEnvironmental Quality 37(1)234-244 doi102134jeq20070105
Hosmer D W and S Lemeshow 2000 Appliedlogistic regression analysis Second edition WileyNew York New York USA doi1010020471722146
Hutchinson G E 1957 A treatise of limnologyVolume 1 geography physics and chemistry WileyNew York New York USA
Johnson J B and K S Omland 2004 Modelselection in ecology and evolution Trends inEcology and Evolution 19(2)101-108 doi101016jtree200310013
Johnson M D 2007 Measuring habitat quality areview Condor 109(3)489-504 doi10165083471
Johnston C A and B A Shmagin 2006 Scaleissues in lake-watershed interactions assessingshoreline development impacts on water clarityPages 297-313 in J Wu K B Jones H Li and OL Loucks editors Scaling and uncertainty analysisin ecology methods and applications SpringerDordrecht The Netherlands
Jung R E 1991 Effects of human activities andlake characteristics on the behavior and breedingsuccess of Common Loons Passenger Pigeon 53207-218
Kamman N C N M Burgess C T Driscoll HA Simonin W Goodale J Linehan R EstabrookM Hutcheson A Major A M Scheuhammer andD A Scruton 2005 Mercury in freshwater fish ofnortheast North America a geographic perspectivebased on fish tissue monitoring databasesEcotoxicology 14(1-2)163-180 doi101007s10646-004-6267-9
Kristan W B III 2006 Sources and expectationsfor hierarchical structure in bird-habitat associationsCondor 108(1)5-12 doi1016500010-5422(2006)108[0005SAEFHS]20CO2
Kristan W B III and J M Scott 2006Hierarchical models for avian ecologists Condor 108(1)1-4 doi1016500010-5422(2006)108[0001HMFAE]20CO2
Kuhn-Hines A 2008 A multiscale approach tobreeding habitat model development and evaluationfor the common loon Gavia immer in NewHampshire USA ETD Collection for University ofRhode Island Paper AAI3346850 [online] URL httpdigitalcommonsuriedudissertationsAAI3346850
Lawler J J and T C Edwards Jr 2006 Avariance-decomposition approach to investigatingmultiscale habitat associations Condor 108(1)47-58 doi1016500010-5422(2006)108[0047AVATIM]20CO2
Li X D Li Z Ma and D Schneider 2006 Nestsite use by crested ibis dependence of a multifactormodel on spatial scale Landscape Ecology 21(8)1207-1216 doi101007s10980-006-0021-z
Loon Preservation Committee 2004 Fieldcollection protocol for surveying and managingCommon Loons in New Hampshire LoonPreservation Committee Moultonborough NewHampshire USA
Loon Preservation Committee 2005 Meeting thechallenge thirty years of preserving loons and theirhabitats in New Hampshire Loon PreservationCommittee Moultonborough New HampshireUSA
Luck G W 2002 The habitat requirements of therufous treecreeper (Climacteris rufa) 1 Preferentialhabitat use demonstrated at multiple spatial scalesBiological Conservation 105(3)383-394 doi101016S0006-3207(01)00222-1
MacKenzie D I 2005 Was it there Dealing withimperfect detection for species presenceabsencedata Australian and New Zealand Journal ofStatistics 47(1)65-74 doi101111j1467-842X200500372x
MacKenzie D I J D Nichols J E Hines M GKnutson and A B Franklin 2003 Estimating siteoccupancy colonization and local extinction whena species is detected imperfectly Ecology 84(8)2200-2207 doi10189002-3090
Avian Conservation and Ecology 6(1) 4httpwwwace-ecoorgvol6iss1art4
Martin S L and P A Soranno 2006 Lakelandscape position relationships to hydrologicconnectivity and landscape features Limnology andOceanography 51(2)801-814 doi104319lo20065120801
McGarigal K and B J Marks 1995 FRAGSTATSspatial pattern analysis program for quantifyinglandscape structure General Technical ReportPNW-GTR-351 US Department of AgricultureForest Service Washington DC USA
McIntyre J W 1983 Nurseries a consideration ofhabitat requirements during the early chick-rearingperiod in common loons Journal of FieldOrnithology 54(3)247-253
McIntyre J W 1988 The Common Loon spirit ofnorthern lakes University of Minnesota PressMinneapolis Minnesota USA
McIntyre J W and J F Barr 1997 Common loonGavia immer In A Poole and F Gill editors TheBirds of North America 313 Academy of NaturalSciences of Philadelphia and American OrnithologistsUnion Washington DC USA
Menard S 2002 Applied logistic regressionanalysis Second edition Sage PublicationsThousand Oaks California USA
Meyer C B S L Miller and C J Ralph 2002Multi-scale landscape and seascape patternsassociated with marbeled murrelet nesting areas onthe US west coast Landscape Ecology 17(2)95-115 doi101023A1016574928706
Meyer M W 2006 Evaluating the impact ofmultiple stressors on Common Loon populationdemographics-an integrated laboratory and fieldapproach EPA STAR Co-operative AgreementNumber R82-9085 Environmental ProtectionAgency Washington DC USA
Meyer M W D C Evers J J Hartigan and P SRasmussen 1998 Patterns of common loon (Gaviaimmer) mercury exposure reproduction andsurvival in Wisconsin USA EnvironmentalToxicology and Chemistry 17(2)184-190
Meyer M W and J E Woodford 1996Enhancing osprey (Pandion haliaetus) and commonloon (Gavia immer) reproduction on impacted
Wisconsin waterways Final report US Fish andWildlife Service Washington DC USA
Moran P A P 1950 Notes on continuousstochastic phenomena Biometrika 37(1-2)17-23 doi101093biomet371-217
Murtagh P A and P S Pooler 2006 Evaluatingecological indicators lakes in the northeasternUnited States Environmental Monitoring andAssessment 119(1-3)83-96 doi101007s10661-005-9011-x
New Hampshire Department of EnvironmentalServices 2005 Water quality data survey summaryfor New Hampshire lakes and ponds NewHampshire Department of Environmental ServicesNew Hampshire USA [online] URL httpdesnhgovorganizationdivisionswaterwmblakestrophic_summaryhtm
New Hampshire Department of EnvironmentalServices 2006 Community center areas NewHampshire Department of Environmental ServicesNew Hampshire USA [online] URL httpwwwgranitunhedudatadatacatpagescommunitycenterareaspdf
Newbrey J L M A Bozek and N D Niemuth2005 Effects of lake characteristics and humandisturbance on the presence of piscivorous birds innorthern Wisconsin USA Waterbirds 28(4)478-486 doi1016751524-4695(2005)28[478EOLCAH]20CO2
Nocera J J G J Forbes and G R Milton 2008The relevance of local-scale relationships to habitatmanagement and landscape patterns AvianConservation and Ecology - Eacutecologie etconservation des oiseaux 3(1) 4 [online] URL httpwwwace-ecoorgvol3iss1art4
Northeast Loon Study Work Group 2008 [online]URL httpwwwbriloonorgscience-and-conservationcentersNELSWGphp
OrsquoBrien R M 2007 A caution regarding rules ofthumb for variance inflation factors Quality ampQuantity 41(5)673-690 doi101007s11135-006-9018-6
Patton D R 1975 A diversity index for quantifyinghabitat lsquoedgersquo Wildlife Society Bulletin 3171-173
Avian Conservation and Ecology 6(1) 4httpwwwace-ecoorgvol6iss1art4
Penhollow M E and D F Stauffer 2000 Large-scale habitat relationships of neotropical migratorybirds in Virginia Journal of Wildlife Management 64(2)362-373 doi1023073803234
Piper W H C Walcott J N Mager III M PeralaK B Tischler E Harrington A J Turcotte MSchwabenlander and N Banfield 2006 Prospectingin a solitary breeder chick production elicitsterritorial intrusions in common loons BehavioralEcology 17(6)881-888 doi101093behecoarl021
Piper W H C Walcott J N Mager and F JSpilker 2008 Nestsite selection by male loons leadsto sex-biased site familiarity Journal of AnimalEcology 77(2)205-210 doi101111j1365-2656200701334x
Rimmer C C 1992 Common Loon Gavia immer Pages 3-30 in K J Schneider and D M Penceeditors Migratory nongame birds managementconcern in the Northeast US Fish and WildlifeService Newton Corner Massachusetts USA
Riitters K H R V OrsquoNeill and K B Jones 1997Assessing habitat suitability at multiple scales alandscape-level approach Biological Conservation 81(1-2)191-202 doi101016S0006-3207(96)00145-0
Saab V 1999 Importance of spatial scale to habitatuse by breeding birds in riparian forests ahierarchical analysis Ecological Applications 9(1)135-151 doi1018901051-0761(1999)009[0135IOSSTH]20CO2
SAS Institute Inc 2003 SAS 91 Cary NorthCarolina USA
Scott J M P J Heglund M L Morrison J BHaufler M G Raphael W A Wall and F BSamson editors 2002 Predicting speciesoccurrences issues of accuracy and scale IslandPress Washington DC USA
Society for Protection of New Hampshire Forests2005 New Hampshirersquos changing landscapepopulation growth and land use changes Societyfor Protection of New Hampshire Forests [online]URL httpwwwforestsocietyorgresearchresearch-projectsasp
Soranno P A K E Webster K S Cheruvelil andM T Bremigan 2009 The lake landscape-contextframework linking aquatic connections terrestrialfeatures and human effects at multiple scalesVerhandlungen des Internationalen Verein Limnologie 30(5)695-700
Sperduto D D and W F Nichols 2004 Naturalcommunities of New Hampshire New HampshireNatural Heritage Bureau Concord New HampshireUSA and University of New HampshireCooperative Extension Durham New HampshireUSA
SPSS Inc 1999 SPSS 100 Chicago Illinois USA
Stauffer H B C J Ralph and S L Miller 2004Ranking habitat for marbled murrelets a newconservation approach for species with uncertaindetection Ecological Applications 14(5)1374-1383doi10189003-5068
Stein B A and S R Flack 1997 1997 speciesreport card the status of US plants and animals The Nature Conservancy Arlington VirginiaUSA [online] URL httpwwwnatureserveorglibrary1997speciesreportcardpdf
Strauss B and R Biedermann 2007 Evaluatingtemporal and spatial generality How valid arespecies-habitat relationship models EcologicalModeling 204104-114 doi101016jecolmodel200612027
Strong P I V and J A Bissonette 1989 Feedingand chick-rearing areas of common loons Journalof Wildlife Management 5372-76 doi1023073801308
Strong P I V J A Bissonette and J S Fair 1987Reuse of nesting and nursery areas by CommonLoons Journal of Wildlife Management 51123-127doi1023073801642
Taylor K M and H S Vogel 2000 NewHampshire report Pages 110-113 in J McIntyre andD C Evers editors Loons old history and newfindings Proceedings symposium 1997 meetingAmerican Ornithologists Union North AmericanLoon Fund Holderness New Hampshire USA
Thogmartin W E 2007 Effects at the landscapescale may constrain habitat relations at finer scales
Avian Conservation and Ecology 6(1) 4httpwwwace-ecoorgvol6iss1art4
Avian Conservation and Ecology - Eacutecologie etconservation des oiseaux 2(2) 6 [online] URL URL httpwwwace-ecoorgvol2iss2art6
Thogmartin W E and M G Knutson 2007Scaling local species-habitat relations to the largerlandscape with a hierarchical spatial count modelLandscape Ecology 22(1)61-75 doi101007s10980-006-9005-2
Thompson C M and K McGarigal 2002 Theinfluence of research scale on bald eagle habitatselection along the lower Hudson River New York(USA) Landscape Ecology 17(6)569-586 doi101023A1021501231182
Titus J R and L W VanDruff 1981 Responseof the common loon to recreational pressure in theBoundary Waters Canoe Area northeasternMinnesota Wildlife Monographs 791-60
Trocki C L and P W C Paton 2006 Assessinghabitat selection by foraging egrets in salt marshesat multiple spatial scales Wetlands 26(2)307-312 doi1016720277-5212(2006)26[307AHSBFE]20CO2
Turner M G 2005 Landscape ecology What isthe state of the science Annual Review of EcologyEvolution and Systematics 36319-344 doi101146annurevecolsys36102003152614
Tyre A J B Tenhumberg S A Field D NiejalkeK Parris and H P Possingham 2003 Improvingprecision and reducing bias in biological surveysestimating false-negative error rates EcologicalApplications 13(6)1790-1801 doi10189002-5078
Vermeer K 1973 Some aspects of the nestingrequirements of common loons in Alberta WilsonBulletin 85429-435
Wiens J A 1989 Spatial scaling in ecologyFunctional Ecology 3385-397 doi1023072389612
Wiens J A 2002 Riverine landscapes takinglandscape ecology into the water FreshwaterBiology 47(4)501-515 doi101046j1365-2427200200887x
Wiens J A J T Rotenberry and B van Horne1987 Habitat occupancy patterns of North
American shrubsteppe birds the effects of spatialscale Oikos 48132-147 doi1023073565849
Wilcove D S D Rothstein J Dubow A Phillipsand E Losos 1998 Quantifying threats to imperiledspecies in the United States Bioscience 48607-615doi1023071313420
Wu J 2004 Effects of changing scale on landscapepattern analysis scaling relations LandscapeEcology 19(2)125-138 doi101023BLAND000002171140074ae
Avian Conservation and Ecology 6(1) 4httpwwwace-ecoorgvol6iss1art4
there was a higher proportion of human-alteredlandscape in the two ecoregions south of the WhiteMountains (ecoregions 2 and 3 Fig 6) These twosouthern ecoregions have lakes surrounded bygreater areas of developed land and higher roaddensity with higher measured values forconductivity and total phosphorous and closer tohuman population centers (high-density residentialareas and municipal community centers Table 3Fig 6) Lakes in the Northern White Mountainecoregion are found at higher elevations on averagewith greater areas of surrounding forested andwetland habitat far from human population centersThe southwestern ecoregion New Hampshire-Vermont Upland has greater areas of agriculturalland and smaller lakes on average distinguishingthis ecoregion from the other two The southeasternecoregion Southern New England Coastal Hills andPlain has more open water surrounding the lakeslarger and deeper lakes with more shorelineperimeter and more islands per lake on averagecompared to the two other ecoregions (Table 3)
The best approximating model designation withineach data set has the highest AICc weight highestmax-rescaled Rsup2 and highest AUC classificationvalue For ecoregions 1 and 3 the multiscale modelshad the highest AICc weights and highest max-rescaled Rsup2 values compared to each of the singlescale models within each respective ecoregionsuggesting that breeding habitat selection by loonsis occurring at multiple scales It is important to notethat in the Northern White Mountain ecoregion(ecoregion 1) all five models (the four single-scalemodels and the multiscale model) have substantialempirical support (ie ∆iAICc le 2) warranting amultimodel inference or model averaging approachespecially when a particular parameter (ie lakesize) occurs in many of the candidate models(Burnham and Anderson 2002) This is also relevantfor the models in the Southern New England CoastalHills and Plain ecoregion (ecoregion 3) where allfour of the single-scale models have manyparameters in common Therefore model averagingwas performed for all of the candidate models inecoregion 1 and for the two highest ranking modelsin ecoregion 3 by weighting each model by itsAkaike weight and combining into a compositeaveraged model for each of these ecoregions (Tables4 and 5 respectively)
In ecoregion 2 (New Hampshire-Vermont Upland)the best approximating model was the modelmeasured at the catchment scale (landscape features
within 500 m of a lake) However the multiscalemodel also had substantial empirical support Thusmodel averaging was performed with these twomodels to produce a composite averaged model forecoregion 2 (Table 6)
Statewide models
The statewide models had a number of habitatcharacteristics in common describing breeding loonpreferences at each scale positive associations withdistance to human population centers water clarityelevation and lake size and negative associationswith road density and distance to nearby lakes withloon presence The most parsimonious and bestapproximating model was the single riparian-scalemodel developed with environmental variablesmeasured within the 150-m zone of the lake (model22 Table 7) This model describes loon preferencesfor clearer lakes nearby other lakes with loons athigher elevations with less surrounding roaddensity and further from human population centersNotably this was the only model within thestatewide model set that contained the explanatoryvariable islands and the only model with substantialempirical support based on information-theoreticstatistics (∆AICc le 2 Burnham and Anderson 2002)
It is important to note that all of the final modelsacross all three ecoregions including the statewidemodels achieved a high level of overall accuracybased on AUC values which ranged from 0914 to0989 indicating that all of these models predictloon nest presence fairly well The residuals of thebest approximating single-scale and multiscalemodels showed no significant spatial correlationbased on the Moranrsquos Index scores Given the weakspatial dependence of the residuals we did notfurther investigate spatial autocorrelation
DISCUSSION
General habitat suitability model for CommonLoon
Based on information-theoretic statistics the bestapproximating model among the statewide modelsis the single lake scale model describing theenvironment immediately surrounding the lakewithin a 150-m riparian buffer zone Overall optimalbreeding habitat for Common Loon across NewHampshire was identified as having the following
Avian Conservation and Ecology 6(1) 4httpwwwace-ecoorgvol6iss1art4
Fig 6 Proportion of developed land cover composition within 150- and 500-m zones surrounding lakeswithin each ecoregion Blue diamond = 25 quartile red square = minimum value green triangle =median value purple x = maximum value blue star = 75 quartile
Avian Conservation and Ecology 6(1) 4httpwwwace-ecoorgvol6iss1art4
Table 3 Summary of lake habitat for the three ecoregions for selected explanatory variables Means includeboth Common Loon nest presence and absence lakes
Habitat Variable Ecoregion Mean SE Min Max
Lake area (ha) 123
13796303
019010012
101012
32621819
20128
Lake perimeter (km) 123
131842
013007008
019048015
257048710
3019995
Lake maximum depth (m) 123
10195121
142080087
131115
497555549
Islands (numberlake) 123
214
093025121
000
5117128
Elevation (m) 123
465330145
594289207
1551135
728722601
Lake flushing rate (number of turnoversyr) 123
213100341
772277
030202
267176504
Water Clarity Secchi depth(m) 123
313841
022020018
090809
97116102
Total phosphorous (mgL) 123
001200120012
lt00010001
lt0001
000300010001
003800590052
Conductivity (micromhoscm) 123
339248216905
271299477
151016511664
112601827030600
Distance to loon lake (km) 123
253236
035026046
001001001
136174287
Distance to community center (km) 123
852529
075002023
001001001
24266213
Avian Conservation and Ecology 6(1) 4httpwwwace-ecoorgvol6iss1art4
Table 4 Summary of results for ecoregion 1 (Northern White Mountain) habitat models with their associatedAkaike weights N = 59 lakes Models with empirical support ie ∆iAICc le 2 are indicated in bold
Model Scale Rsup2 Kdagger Log likelihood AICc ∆iAICc Weightwi
AUC
2 Multiscale 087 3 minus668 1980 lt 0001 02444 0989
5 Foraging 073 2 minus786 1993 014 02281 0968
3 Catchment 072 2 minus820 2061 081 01627 0951
4 Riparian 072 2 minus826 2074 094 01526 0952
6 Nesting 150-m radius 076 2 minus846 2114 134 01249 0959
1 Global model 086 5 minus536 2185 206 00874 0988
Explanatory variables for each fitted modelDagger
2 Multiscale lake size (+) open water 500N (+)
5 Foraging open water 500N (+)
3 Catchment lake size (+)
4 Riparian lake size (+)
6 Nesting 150-m radius lake size (+)
1 Global model elevation (+) lake size (+) clarity (+) open water 500N (+)
Composite model Nest presence = minus8655 + 3127 (lake size) + 1570 (open water 500N)
daggerK indicates the total number of parameters ie the intercept and explanatory variablesDagger(+) = positive association (minus) = negative association L = lake scale N = nest scale
characteristics clear higher elevation lakes withislands further away from human populationcenters with lower surrounding road densities andwith nearby lakes occupied by other loons Waterclarity has long been associated with loon habitatpreference and our results are consistent withprevious studies (Vermeer 1973 McIntyre 19831988 Blair 1992 Meyer 2006) The significance ofthe minimum-distance-to-nearest-lake-with-loon-presence metric supports anecdotal observationsand published research describing loon nataldispersal This biotic interaction metric describesthe philopatric and conspecific attraction loonsdisplay and reveals the importance of the spatial
configuration of lakes in the selection of loonbreeding habitat (Strong et al 1987 Evers 2001Piper et al 2006 2008)
The unique habitat feature that distinguishes the bestmodel among the statewide models is theexplanatory variable islands which indicates high-quality breeding habitat for loons (Vermeer 1973Jung 1991 McIntyre and Barr 1997 Piper et al2006 Evers 2007) Based on odds ratio estimatesislands and lake clarity were the most importantfactors distinguishing loon breeding habitat for thestatewide data set (Table 8) The best statewidemodel also describes loon preferences for open
Avian Conservation and Ecology 6(1) 4httpwwwace-ecoorgvol6iss1art4
Table 5 Summary of results for ecoregion 3 (Southern New England Coastal Hills and Plain) habitatmodels with their associated Akaike weights N = 133 lakes Models with empirical support ie ∆iAICc le 2 are indicated in bold
Model Scale Rsup2 Kdagger Loglikelihood
AICc ∆iAICc Weight wi AUC
14 Multiscale 072 6 minus3284 7835 lt 0001 04282 0940
18 Nesting 069 4 minus3530 7892 057 03220 0931
15 Catchment 066 5 minus3565 8178 343 00772 0931
16 Riparian 066 5 minus3565 8178 343 00772 0931
17 Foraging 066 5 minus3565 8178 343 00772 0931
13 Globalmodel
075 11 minus3025 8467 632 00181 0949
Explanatory variables for each fitted modelDagger
14 Multiscale lake size (+) elevation (+) clarity (+) distance to loon (minus) phosphorous (minus)
18 Nesting elevation (+) lake size (+) phosphorous (minus)
15 Catchment distance to loon (minus) elevation (+) lake size (+) clarity (+)
16 Riparian distance to loon (minus) elevation (+) lake size (+) clarity (+)
17 Foraging distance to loon (minus) elevation (+) lake size (+) clarity (+)
13 Globalmodel
developed 150L (minus) open water 150L (+) road 150L (minus) islands (+) distance to loon (minus)elevation (+) lake size (+) phosphorous (minus) clarity (+) open water 500N (+)
Composite model Nest presence = minus4550 + 0006 (elevation) + 1180 (lake size) + 01714 (clarity) minus 02183 (distance toloon) minus 179503 (phosphorus)
daggerK indicates the total number of parameters ie the intercept and explanatory variablesDagger(+) = positive association (minus) = negative association L = lake scale N = nest scale
water surrounding the lake (eg hydrologicalconnectivity) Earnst et al (2006) also found thatYellow-billed Loon in northern Alaska selectbreeding habitat based on landscape-scale featuressuch as hydrological connectivity The explanatoryvariable minimum-distance-to-human-population-center was featured at every scale in the statewidemodels providing evidence that loons prefer tosituate nests on lakes further from humandisturbance A lake habitat selection study forwaterbirds in Canada also found that loons prefer
lakes that are farther from human activity or havemore forested land within a 500-m zone (Found etal 2008)
Effects of scale on Common Loon habitatassociations
Another of our objectives was to investigatewhether Common Loon selects breeding habitat atmultiple scales and to determine which scales are
Avian Conservation and Ecology 6(1) 4httpwwwace-ecoorgvol6iss1art4
Table 6 Summary of results for ecoregion 2 (New Hampshire-Vermont Upland) habitat models with theirassociated Akaike weights N = 130 lakes Models with empirical support ie ∆iAICc le 2 are indicatedin bold
Model Scale Rsup2 Kdagger Loglikelihood
AICc ∆iAICc Weight wi AUC
9 Catchment 081 8 minus2437 6593 lt 0001 06757 0971
8 Multiscale 083 10 minus2310 6806 213 02331 0973
10 Riparian 075 6 minus2872 7011 418 00834 0952
7 Globalmodel
079 11 minus2595 7613 1020 00041 0963
11 Foraging 073 7 minus3331 7930 1337 00008 0945
12 Nesting 068 7 minus3627 8745 2153 lt 000001 0930
Explanatory variables for each fitted modelDagger
9 Catchment open water 500L (+) road 500L (minus) islands (+) pH (+) elevation (+) clarity (+)agricultural 500L (minus)
8 Multiscale open water 150L (+) open water 500N (+) islands (+) clarity( +) road density 500L (minus)road density 150N (minus) distance to loon (minus) forest 150N (minus) wetland 150N (minus)
10 Riparian open water 150L (+) islands (+) distance to loon (minus) elevation (+) clarity (+)
7 Globalmodel
open water 150L (+) islands (+) distance to loon (minus) elevation (+) pH (+) clarity (+)agricultural 500L (minus) open water 500L (+) road density 500L (minus) forest 500 (minus)
11 Foraging open water 500N (+) agricultural 500N (minus) clarity (+) elevation (+) lake size (+)
12 Nesting road density 150N (minus) forest 150N (minus) wetland 150N (minus) elevation (+) lake size (+) flushingrate (minus)
Composite model Nest presence = minus22579 + 3179 (islands) + 1047 (clarity) + 0004 (elevation) + 0287 (open water150L) + 0405 (open water 500L) + 01064 (open water 500N) + 272 (pH) minus 0158 (road density 500L) minus 0362 (distanceto loon) minus 0314 (agricultural 500L) minus 0086 (forest 150N) minus 0079 (wetland 150N) minus 0065 (road density 150N)
daggerK indicates the total number of parameters ie the intercept and explanatory variablesDagger(+) = positive association (minus) = negative association L = lake scale N = nest scale
most important Using information theoreticstatistics the multiscale models for two of the threeecoregions were designated the best approximatingmodels and had substantial empirical support in allthree ecoregions Distinct differences are apparentwhen comparing models across ecoregions (Tables4 5 and 6) Loons in New Hampshire appear to be
selecting breeding habitat differently based onphysiographic ecoregion and at multiple scalesThese differences may be a reflection of theoccurrence of different environmental conditionsand ranges of variables in the three different regionsIn the Northern White Mountain ecoregion loonsare selecting breeding territories on the basis of lake
Avian Conservation and Ecology 6(1) 4httpwwwace-ecoorgvol6iss1art4
Table 7 Summary of results for New Hampshire statewide habitat models with their associated Akaikeweights N = 322 lakes Models with empirical support ie ∆iAICc le 2 are indicated in bold
Model Scale Rsup2 Kdagger Log likelihood AICc ∆iAICc Weight wi AUC
22 Riparian 065 8 minus8615 188764 000 08315 0926
21 Catchment 064 8 minus8843 193315 455 00854 0921
23 Foraging 063 7 minus8996 194269 561 00504 0919
19 Global model 070 15 minus8287 197304 854 00115 0941
24 Nesting 062 7 minus9192 198196 954 00071 0914
20 Multiscale 065 8 minus9365 203769 1501 00005 0926
Explanatory variables for each fitted modelDagger
22 Riparian open water 150L (+) elevation (+) islands (+) clarity (+) distance tohuman population (+) distance to loon (minus) road density 150L (minus)
21 Catchment distance to loon (minus) open water 500L (+) road density 500L (minus) elevation (+)lake size (+) clarity (+) distance to human population (+)
23 Foraging distance to loon (minus) open water 500N (+) elevation (+) lake size (+) clarity(+) distance to human population (+)
19 Global model open water 500L (minus) road density 500L (minus) road density 150N (minus) open water500N (+) road density 150L (minus) open water 150L (+) islands (+) distance toloon (minus) elevation (+) lake size (+) pH (+) phosphorous (minus) clarity (+)distance to human population (+)
24 Nesting distance to loon (minus) road density 150N (minus) elevation (+) lake size (+) clarity(+) distance to human population (+)
20 Multiscale distance to loon (minus) open water 500N (+) road density 150L (minus) elevation (+)lake size (+) clarity (+) distance to human population (+)
Statewide model Nest presence = minus7328 + 0115 (open water 150L) + 0001 (elevation) + 1067 (islands) + 0595 (clarity)+ 0211 (distance to human population) minus 0233 (distance to loon) minus 0033 (road density 150 L)
daggerK indicates the total number of parameters ie the intercept and explanatory variablesDagger(+) = positive association (minus) = negative association L = lake scale N = nest scale
size and the amount of open water surrounding thenest (eg island nest sites) In this ecoregion therewas no distinction between loon presence andabsence lakes based on human-altered variablessuch as road density and developed land or waterquality variables associated with human activitiesThe Northern White Mountain ecoregion has lowerroad densities surrounding the lakes and a less
human-dominated landscape in general Thereforethe loonsrsquo apparent selection based on a few lakemorphological factors may be more a reflection ofthe general environmental conditions and lack ofhuman-altered variables to select against It is alsointeresting to note that loons in this northernecoregion do not appear to be using the presence ofother loons on nearby lakes as a habitat selection
Avian Conservation and Ecology 6(1) 4httpwwwace-ecoorgvol6iss1art4
factor as is the case in the two more southerlyecoregions
The results for the Northern White Mountainecoregion suggest that prior to human alteration ofthe landscape loons may have chosen breedinghabitat based primarily on lake morphologicalfactors such as lake size and the amount of openwater surrounding the nest The catchment riparianforaging and nest scale-based models within theNorthern White Mountain ecoregion includeinformation describing the selection of loonbreeding habitat (Table 4) Three of these final fittedsingle-scale models had explanatory variables incommon (ie lake size) and were combined in themultiscale model for this ecoregion to determine thebest approximating model given the data set basedon the model probability Akaike weights wi (Table4) However using evidence ratios (Burnham andAnderson 2002) to compare the two best modelsthe best model (model 1) has only 19 times theweight of evidence relative to the second-best model(model 4) This relatively weak support for any ofthe models being the best model suggests that thesemodels are good candidates for model averaging ormultimodel inference Model averaging increasesparameter estimate precision and reduces biasassociated with model selection especially when allof the models have substantial support and areclosely related as in ecoregion 1
In the southwestern New Hampshire-VermontUpland loons appear to be avoiding human-alteredlandscapes such as those with high road density andgreater areas of agriculture (Table 6) This regionof New Hampshire contains the highest percentageof prime agricultural soils in the state and hasexperienced the highest amount of agriculturalconversion to developed land in the state over the5-yr period from 1997 to 2002 (Society for theProtection of New Hampshire Forests 2005) Withinthis ecoregion loons are selecting lakes with moreislands higher water clarity and more open watersurrounding the lakes and that are nearby otherlakes with loons present The catchment-scalemodel describing features within a 500-m zone ofthe lake best describes the data in this region (model9 Table 6) the only other model that has substantialempirical support for describing this data set is themultiscale model (model 8 Table 6) Thecatchment-scale model differs from the multiscalemodel by identifying positive associations of loonswith pH (an indicator of fishprey habitat) and lakeelevation and a negative association of loons with
agricultural land within 500 m of the lake Insteadof relying on a single best model for this ecoregionwe used model averaging to combine these twohighest ranking models to obtain robust estimatesof model parameters reduce model selection biasand account for model selection uncertainty(Johnson and Omland 2004) Based on the modelaveraged results and using odds ratios to identifyinfluential factors in this region islands pH andwater clarity appear to be the most influential habitatfeatures (Table 8)
Loons in the southeastern Southern New EnglandCoastal Hills and Plain appear to be selectingbreeding habitat similarly across all scales based ona few key elements larger lakes at increasingelevations with lower levels of phosphorous nearbyother lakes with loons (Table 5) Other studies havefound that loons avoid lakes with higherphosphorous and primary productivity (Blair 1992)which can reduce water clarity Total phosphoruswhich is associated with anthropogenic activitiesappears to be an important avoidance factor forloons selecting breeding habitat at multiple scalesbased on the multiscale and nesting-scale modelswhich are the two highest-ranking models for thisregion The two most influential factors in thisregion appear to be lake size and water clarity basedon odds ratio estimates (Table 8)
The natural arrangement of lakes in NewHampshire especially in the southeastern portionof the state (referred to as the Lakes Region) is ofparticular concern because this area has the fastestrate of human population change in NewHampshire The entire state population is projectedto grow by 358000 between 2000 and 2025 withan estimated 80 of that growth in the foursoutheastern counties of New Hampshire along theInterstate Highway 89 corridor and in the LakesRegion (Society for Protection of New HampshireForests 2005) Loons are responding to human-induced pressures on these lakes and across the stateby selecting against anthropogenic features such asroad density total phosphorous and conductivitydeveloped and agricultural lands and humanpopulation centers
CONCLUSION
Our results support the increasing evidence formultiscale habitat associations most commonlyfound in avian species (Gutzwiller and Anderson
Avian Conservation and Ecology 6(1) 4httpwwwace-ecoorgvol6iss1art4
Table 8 Model averaged parameter estimates and odds ratio estimates with confidence intervals forecoregional composite models and the statewide model These parameters constitute the final averagedmodels for each ecoregion and may be used directly to predict Common Loon nest presence regionally andthroughout the state of New Hampshire
Region Variable Theta SE Odds ratio 95 Wald confidence limits
Ecoregion 1 Northern White Mountain
Intercept minus8655 0704
Lake size 3127 0096 6935 0934 51509
Open water 500 nest 1570 0034 1482 1066 2062
Ecoregion 2 New Hampshire-Vermont Upland
Intercept minus22579 10485
Islands 3179 1120 18045 2760 117970
Clarity 1047 0349 2952 1500 5810
Elevation 0004 0002 1004 1000 1007
Open water 150 lake 0287 0136 1383 1153 1658
Open water 500 lake 0405 01145 1499 1198 1877
Open water 500 nest 01064 00485 0890 0810 0979
pH 272 10139 15195 2083 110844
Road density 500 lake minus0158 0064 0880 0789 0983
Distance to loon lake minus03619 0129 0691 0491 0971
Agricultural 500 lake minus03143 01489 0730 0545 0978
Forest 150 nest minus00856 00346 0913 0853 0977
Wetland 150 nest minus00793 00346 0920 0859 0985
Road density 150 nest minus00647 00286 0927 0877 0980
Ecoregion 3 Southern New England Coastal Hills and Plain
Intercept minus4550 0217
Elevation 0006 0001 1004 1000 1009
Lake size 1180 0158 3254 1640 6456
Clarity 01714 02835 1187 0681 2069
Distance to loon lake minus02183 0124 1000 1000 1000
Phosphorous minus179503 3190 lt 0001 lt 0001 lt 0001
(cond)
Avian Conservation and Ecology 6(1) 4httpwwwace-ecoorgvol6iss1art4
New Hampshire Statewide
Intercept minus73821 12467
Open water 150 lake 01150 00200 1122 1079 1167
Elevation 0001 0001 1001 1000 1002
Islands 10674 04210 2908 1274 6637
Clarity 05948 01503 1813 1350 2434
Distance to population center 02105 00797 1234 1056 1443
Distance to loon lake minus02331 00732 0792 0686 0914
Road density 150 lake minus00327 00148 0968 0940 0996
1987 Wiens et al 1987 Saab 1999 Meyer et al2002 Graf et al 2005 Kristan 2006 Lawler andEdwards 2006 Thogmartin 2007) The multiscalemodels within each ecoregion have substantialempirical support in describing breeding habitatsuggesting that Common Loon in New Hampshireis responding to environmental cues at scalesranging from broad catchment to finer riparian areassurrounding lakes as well as within lakes at thenesting scale Loons also appear to be selectinghabitat differently across the ecoregions based onthe varying landscape conditions they encounteracross New Hampshire This differential selectionof breeding habitat across ecoregions providesinformation for prioritizing conservation andfocusing management efforts in New HampshireConservation efforts in the northern ecoregionshould be focused on preserving the relatively lowerlevels of human activity and disturbance pressuressurrounding these northern lakes by preventingincreases in road density and construction nearlakes especially within the immediate shoreline oflarger lakes Loon conservation and managementactivities in the two southern ecoregions shouldfocus on reducing the effects of already existinghuman disturbances on water quality by mitigatingsources of phosphorous that can also directly affectclarity Other activities in these regions shouldinclude the prioritization for protection of high-quality nesting habitat such as small islands andundisturbed areas of lakes and preventingdevelopment in critical loon habitat Our resultssuggest that conservation strategies for CommonLoon should also consider environmental
influences beyond the immediate lake or riparianscale as the analysis demonstrates that loons arealso responding to landscape-level and catchment-scale conditions surrounding lakes
Responses to this article can be read online athttpwwwace-ecoorgvol6iss1art4responses
Acknowledgments
We thank the many people who share our interest inCommon Loon research and conservation Weappreciate the statistical assistance and advice ofDr James Heltshe and helpful advice fromreviewers of early drafts Drs James Lake BryanMilstead and Rick McKinney as well as that of theanonymous reviewers who contributed to the finalversion of this manuscript This is contributionnumber AED-10-048 of the Atlantic EcologyDivision National Health and EnvironmentalEffects Research Laboratory Office of Researchand Development US Environmental ProtectionAgency Although the research described in thiscontribution has been funded wholly by the USEnvironmental Protection Agency it has not beensubjected to Agency-level review Therefore it doesnot necessarily reflect the views of the AgencyMention of trade names products or services doesnot constitute endorsement or recommendation foruse
Avian Conservation and Ecology 6(1) 4httpwwwace-ecoorgvol6iss1art4
LITERATURE CITED
Agresti A 1996 An introduction to categoricaldata analysisWiley New York New York USA
Alvo R D J T Hussell and M Berrill 1988 Thebreeding success of common loons (Gavia immer)in relation to alkalinity and other lake characteristicsin Ontario Canadian Journal of Zoology 66(3)746-752
Anderson D R 2008 Model based inferences inthe life sciences a primer on evidence SpringerNew York New York USA doi101007978-0-387-74075-1
Anderson J R E E Hardy J T Roach and R EWitmer 1976 A land use and land coverclassification system for use with remote sensordata Geological Survey Professional Paper 964 US Geological Survey Washington DC USA
Austin M 2007 Species distribution models andecological theory a critical assessment and somepossible new approaches Ecological Modelling 200(1-2)1-19 doi101016jecolmodel200607005
Barr J F 1986 Population dynamics of thecommon loon associated with mercury-contaminatedwaters in northwestern Ontario Occasional PaperNumber 56 Canadian Wildlife Service OttawaCanada
Battin J and J J Lawler 2006 Cross-scalecorrelations and the design of avian-habitatselection studies Condor 10859-70 doi1016500010-5422(2006)108[0059CCATDA]20CO2
Blair R B 1992 Lake features water quality andthe summer distribution of Common Loons in NewHampshire Journal of Field Ornithology 63(1)1-9
Burgess N M D C Evers and J D Kaplan 2005Mercury and other contaminants in Common Loonsbreeding in Atlantic Canada Ecotoxicology 14(1-2)241-252 doi101007s10646-004-6271-0
Burnham K P and D R Anderson 2002 Modelselection and multimodel inference a practicalinformation-theoretic approach Second editionSpringer New York New York USA
Cox D R and E J Snell 1989 Analysis of binarydata Second edition Chapman amp Hall LondonUK
Cushman S A and K McGarigal 2002Hierarchical multi-scale decomposition of species-environment relationships Landscape Ecology 17(7)637-646 doi101023A1021571603605
Cushman S A and K McGarigal 2004Hierarchical analysis of forest bird species-environment relationships in the Oregon CoastRange Ecological Applications 14(4)1090-1105 doi10189003-5131
Deppe J L and J T Rotenberry 2008 Scale-dependent habitat use by fall migratory birdsvegetation structure floristics and geographyEcological Monographs 78(3)461-487 doi10189007-01631
Desorbo C R K M Taylor D E Kramer J FairJ H Cooley Jr D C Evers W Hanson H SVogel and J L Atwood 2007 Reproductiveadvantages for Common Loons using rafts Journalof Wildlife Management 71(4)1206-1213 doi1021932006-422
Driscoll M J L T Donovan R Mickey AHoward and K K Fleming 2005 Determinants ofwood thrush nest success a multi-scale modelselection approach Journal of Wildlife Management 69(2)699-709 doi1021930022-541X(2005)069[0699DOWTNS]20CO2
Earnst S L R Platte and L Bond 2006 Alandscape-scale model of yellow-billed loon (Gaviaadamsii) habitat preferences in northern AlaskaHydrobiologia 567(1)227-236 doi101007s10750-006-0042-2
Edwards T C Jr G G Moisen T S Frescinoand J J Lawler 2003 Modeling multipleecological scales to link landscape theory to wildlifeconservation Pages 153-172 in J A Bissonette andI Storch editors Landscape ecology and resourcemanagement linking theory with practice IslandPress Washington DC USA
Environmental Systems Research Institute 2009ArcInfo geographic information system (GIS)software Version 91 Redlands California USA
Avian Conservation and Ecology 6(1) 4httpwwwace-ecoorgvol6iss1art4
Estrella A 1998 A new measure of fit for equationswith dichotomous dependent variables Journal ofBusiness and Economic Statistics 16(2)198-205 doi1023071392575
Evers D C 2001 Common Loon populationstudies continental mercury patterns and breedingterritory philopatry Dissertation University ofMinnesota St Paul Minnesota USA
Evers D C 2007 Status assessment andconservation plan for the Common Loon (Gaviaimmer) in North America BRI Report 2007-20 US Fish and Wildlife Service Hadley MassachusettsUSA
Evers D C L J Savoy C R DeSorbo D EYates W Hanson K M Taylor L Siegel J HCooley M S Bank A Major K Munney BMower H S Vogel N Schoch M Pokras M WGoodale and J Fair 2008 Adverse effects fromenvironmental mercury loads on breeding commonloons Ecotoxicology 17(2)69-81 doi101007s10646-007-0168-7
Fielding A H and J F Bell 1997 A review ofmethods for the assessment of prediction errors inconservation presenceabsence models EnvironmentalConservation 24(1)38-49 doi101017S0376892997000088
Fortin M-J and M R T Dale 2005 Spatialanalysis a guide for ecologists CambridgeUniversity Press Cambridge UK
Found C S M Webb and M S Boyce 2008Selection of lake habitats by waterbirds in the borealtransition zone of northeastern Alberta CanadianJournal of Zoology 86(4)277-285 doi101139Z07-137
Fraterrigo J M and J A Downing 2008 Theinfluence of land use on lake nutrients varies withwatershed transport capacity Ecosystems 11(7)1021-1034 doi101007s10021-008-9176-6
Freemark K E D Bert and M A Villard 2002Patch- landscape- and regional-scale effects onbiota Pages 58-83 in K J Gutzwiller editorApplying landscape ecology in biologicalconservation Springer New York New YorkUSA
Gamma Design Software 2001 GS+ geostatisticsfor the environmental sciences PlainwellMichigan USA
Garshellis D L 2000 Delusions in habitatevaluation measuring use selection andimportance Pages 111-153 in L Boitani and T KFuller editors Research techniques in animalecology controversies and consequences ColumbiaUniversity Press New York New York USA
Goldstein H 2003 Multilevel statistical models Third edition Hodder Arnold London UK
Graf R F K Bollmann W Suter and HBugmann 2005 The importance of spatial scale inhabitat models Capercaillie in the Swiss AlpsLandscape Ecology 20(6)703-717 doi101007s10980-005-0063-7
Graham M H 2003 Confronting multicollinearityin ecological multiple regression Ecology 842809-2815 doi10189002-3114
Gutzwiller K J and S H Anderson 1987Multiscale associations between cavity-nestingbirds and features of Wyoming streamsidewoodlands Condor 89534-548 doi1023071368643
Hames R S J D Lowe S Barker Swarthout andK V Rosenberg 2006 Understanding the risk toneotropical migrant bird species of multiple human-caused stressors elucidating processes behindpatterns Ecology and Society 11(1) 24 [online]URL httpwwwecologyandsocietyorgvol11iss1art24
Hammond C A M 2008 A demographic andlandscape analysis for common loons in northwestMontana Thesis University of Montana MissoulaMontana USA [online] URL httpetdlibumteduthesesavailableetd-04242008-130448
Heimberger M D Euler and J Barr 1983 Theimpact of cottage development on Common Loonreproductive success in central Ontario WilsonBulletin 95(3)431-439
Heinz H T Waldhoumlr and M Mittlboumlck 2005Careful use of pseudo R-squared measures inepidemiological studies Statistics in Medicine 24(18)2867-2872 doi101002sim2168
Avian Conservation and Ecology 6(1) 4httpwwwace-ecoorgvol6iss1art4
Hollister J W P V August J F Paul and H AWalker 2008 Predicting estuarine sediment metalconcentrations and inferred ecological conditionsan information theoretic approach Journal ofEnvironmental Quality 37(1)234-244 doi102134jeq20070105
Hosmer D W and S Lemeshow 2000 Appliedlogistic regression analysis Second edition WileyNew York New York USA doi1010020471722146
Hutchinson G E 1957 A treatise of limnologyVolume 1 geography physics and chemistry WileyNew York New York USA
Johnson J B and K S Omland 2004 Modelselection in ecology and evolution Trends inEcology and Evolution 19(2)101-108 doi101016jtree200310013
Johnson M D 2007 Measuring habitat quality areview Condor 109(3)489-504 doi10165083471
Johnston C A and B A Shmagin 2006 Scaleissues in lake-watershed interactions assessingshoreline development impacts on water clarityPages 297-313 in J Wu K B Jones H Li and OL Loucks editors Scaling and uncertainty analysisin ecology methods and applications SpringerDordrecht The Netherlands
Jung R E 1991 Effects of human activities andlake characteristics on the behavior and breedingsuccess of Common Loons Passenger Pigeon 53207-218
Kamman N C N M Burgess C T Driscoll HA Simonin W Goodale J Linehan R EstabrookM Hutcheson A Major A M Scheuhammer andD A Scruton 2005 Mercury in freshwater fish ofnortheast North America a geographic perspectivebased on fish tissue monitoring databasesEcotoxicology 14(1-2)163-180 doi101007s10646-004-6267-9
Kristan W B III 2006 Sources and expectationsfor hierarchical structure in bird-habitat associationsCondor 108(1)5-12 doi1016500010-5422(2006)108[0005SAEFHS]20CO2
Kristan W B III and J M Scott 2006Hierarchical models for avian ecologists Condor 108(1)1-4 doi1016500010-5422(2006)108[0001HMFAE]20CO2
Kuhn-Hines A 2008 A multiscale approach tobreeding habitat model development and evaluationfor the common loon Gavia immer in NewHampshire USA ETD Collection for University ofRhode Island Paper AAI3346850 [online] URL httpdigitalcommonsuriedudissertationsAAI3346850
Lawler J J and T C Edwards Jr 2006 Avariance-decomposition approach to investigatingmultiscale habitat associations Condor 108(1)47-58 doi1016500010-5422(2006)108[0047AVATIM]20CO2
Li X D Li Z Ma and D Schneider 2006 Nestsite use by crested ibis dependence of a multifactormodel on spatial scale Landscape Ecology 21(8)1207-1216 doi101007s10980-006-0021-z
Loon Preservation Committee 2004 Fieldcollection protocol for surveying and managingCommon Loons in New Hampshire LoonPreservation Committee Moultonborough NewHampshire USA
Loon Preservation Committee 2005 Meeting thechallenge thirty years of preserving loons and theirhabitats in New Hampshire Loon PreservationCommittee Moultonborough New HampshireUSA
Luck G W 2002 The habitat requirements of therufous treecreeper (Climacteris rufa) 1 Preferentialhabitat use demonstrated at multiple spatial scalesBiological Conservation 105(3)383-394 doi101016S0006-3207(01)00222-1
MacKenzie D I 2005 Was it there Dealing withimperfect detection for species presenceabsencedata Australian and New Zealand Journal ofStatistics 47(1)65-74 doi101111j1467-842X200500372x
MacKenzie D I J D Nichols J E Hines M GKnutson and A B Franklin 2003 Estimating siteoccupancy colonization and local extinction whena species is detected imperfectly Ecology 84(8)2200-2207 doi10189002-3090
Avian Conservation and Ecology 6(1) 4httpwwwace-ecoorgvol6iss1art4
Martin S L and P A Soranno 2006 Lakelandscape position relationships to hydrologicconnectivity and landscape features Limnology andOceanography 51(2)801-814 doi104319lo20065120801
McGarigal K and B J Marks 1995 FRAGSTATSspatial pattern analysis program for quantifyinglandscape structure General Technical ReportPNW-GTR-351 US Department of AgricultureForest Service Washington DC USA
McIntyre J W 1983 Nurseries a consideration ofhabitat requirements during the early chick-rearingperiod in common loons Journal of FieldOrnithology 54(3)247-253
McIntyre J W 1988 The Common Loon spirit ofnorthern lakes University of Minnesota PressMinneapolis Minnesota USA
McIntyre J W and J F Barr 1997 Common loonGavia immer In A Poole and F Gill editors TheBirds of North America 313 Academy of NaturalSciences of Philadelphia and American OrnithologistsUnion Washington DC USA
Menard S 2002 Applied logistic regressionanalysis Second edition Sage PublicationsThousand Oaks California USA
Meyer C B S L Miller and C J Ralph 2002Multi-scale landscape and seascape patternsassociated with marbeled murrelet nesting areas onthe US west coast Landscape Ecology 17(2)95-115 doi101023A1016574928706
Meyer M W 2006 Evaluating the impact ofmultiple stressors on Common Loon populationdemographics-an integrated laboratory and fieldapproach EPA STAR Co-operative AgreementNumber R82-9085 Environmental ProtectionAgency Washington DC USA
Meyer M W D C Evers J J Hartigan and P SRasmussen 1998 Patterns of common loon (Gaviaimmer) mercury exposure reproduction andsurvival in Wisconsin USA EnvironmentalToxicology and Chemistry 17(2)184-190
Meyer M W and J E Woodford 1996Enhancing osprey (Pandion haliaetus) and commonloon (Gavia immer) reproduction on impacted
Wisconsin waterways Final report US Fish andWildlife Service Washington DC USA
Moran P A P 1950 Notes on continuousstochastic phenomena Biometrika 37(1-2)17-23 doi101093biomet371-217
Murtagh P A and P S Pooler 2006 Evaluatingecological indicators lakes in the northeasternUnited States Environmental Monitoring andAssessment 119(1-3)83-96 doi101007s10661-005-9011-x
New Hampshire Department of EnvironmentalServices 2005 Water quality data survey summaryfor New Hampshire lakes and ponds NewHampshire Department of Environmental ServicesNew Hampshire USA [online] URL httpdesnhgovorganizationdivisionswaterwmblakestrophic_summaryhtm
New Hampshire Department of EnvironmentalServices 2006 Community center areas NewHampshire Department of Environmental ServicesNew Hampshire USA [online] URL httpwwwgranitunhedudatadatacatpagescommunitycenterareaspdf
Newbrey J L M A Bozek and N D Niemuth2005 Effects of lake characteristics and humandisturbance on the presence of piscivorous birds innorthern Wisconsin USA Waterbirds 28(4)478-486 doi1016751524-4695(2005)28[478EOLCAH]20CO2
Nocera J J G J Forbes and G R Milton 2008The relevance of local-scale relationships to habitatmanagement and landscape patterns AvianConservation and Ecology - Eacutecologie etconservation des oiseaux 3(1) 4 [online] URL httpwwwace-ecoorgvol3iss1art4
Northeast Loon Study Work Group 2008 [online]URL httpwwwbriloonorgscience-and-conservationcentersNELSWGphp
OrsquoBrien R M 2007 A caution regarding rules ofthumb for variance inflation factors Quality ampQuantity 41(5)673-690 doi101007s11135-006-9018-6
Patton D R 1975 A diversity index for quantifyinghabitat lsquoedgersquo Wildlife Society Bulletin 3171-173
Avian Conservation and Ecology 6(1) 4httpwwwace-ecoorgvol6iss1art4
Penhollow M E and D F Stauffer 2000 Large-scale habitat relationships of neotropical migratorybirds in Virginia Journal of Wildlife Management 64(2)362-373 doi1023073803234
Piper W H C Walcott J N Mager III M PeralaK B Tischler E Harrington A J Turcotte MSchwabenlander and N Banfield 2006 Prospectingin a solitary breeder chick production elicitsterritorial intrusions in common loons BehavioralEcology 17(6)881-888 doi101093behecoarl021
Piper W H C Walcott J N Mager and F JSpilker 2008 Nestsite selection by male loons leadsto sex-biased site familiarity Journal of AnimalEcology 77(2)205-210 doi101111j1365-2656200701334x
Rimmer C C 1992 Common Loon Gavia immer Pages 3-30 in K J Schneider and D M Penceeditors Migratory nongame birds managementconcern in the Northeast US Fish and WildlifeService Newton Corner Massachusetts USA
Riitters K H R V OrsquoNeill and K B Jones 1997Assessing habitat suitability at multiple scales alandscape-level approach Biological Conservation 81(1-2)191-202 doi101016S0006-3207(96)00145-0
Saab V 1999 Importance of spatial scale to habitatuse by breeding birds in riparian forests ahierarchical analysis Ecological Applications 9(1)135-151 doi1018901051-0761(1999)009[0135IOSSTH]20CO2
SAS Institute Inc 2003 SAS 91 Cary NorthCarolina USA
Scott J M P J Heglund M L Morrison J BHaufler M G Raphael W A Wall and F BSamson editors 2002 Predicting speciesoccurrences issues of accuracy and scale IslandPress Washington DC USA
Society for Protection of New Hampshire Forests2005 New Hampshirersquos changing landscapepopulation growth and land use changes Societyfor Protection of New Hampshire Forests [online]URL httpwwwforestsocietyorgresearchresearch-projectsasp
Soranno P A K E Webster K S Cheruvelil andM T Bremigan 2009 The lake landscape-contextframework linking aquatic connections terrestrialfeatures and human effects at multiple scalesVerhandlungen des Internationalen Verein Limnologie 30(5)695-700
Sperduto D D and W F Nichols 2004 Naturalcommunities of New Hampshire New HampshireNatural Heritage Bureau Concord New HampshireUSA and University of New HampshireCooperative Extension Durham New HampshireUSA
SPSS Inc 1999 SPSS 100 Chicago Illinois USA
Stauffer H B C J Ralph and S L Miller 2004Ranking habitat for marbled murrelets a newconservation approach for species with uncertaindetection Ecological Applications 14(5)1374-1383doi10189003-5068
Stein B A and S R Flack 1997 1997 speciesreport card the status of US plants and animals The Nature Conservancy Arlington VirginiaUSA [online] URL httpwwwnatureserveorglibrary1997speciesreportcardpdf
Strauss B and R Biedermann 2007 Evaluatingtemporal and spatial generality How valid arespecies-habitat relationship models EcologicalModeling 204104-114 doi101016jecolmodel200612027
Strong P I V and J A Bissonette 1989 Feedingand chick-rearing areas of common loons Journalof Wildlife Management 5372-76 doi1023073801308
Strong P I V J A Bissonette and J S Fair 1987Reuse of nesting and nursery areas by CommonLoons Journal of Wildlife Management 51123-127doi1023073801642
Taylor K M and H S Vogel 2000 NewHampshire report Pages 110-113 in J McIntyre andD C Evers editors Loons old history and newfindings Proceedings symposium 1997 meetingAmerican Ornithologists Union North AmericanLoon Fund Holderness New Hampshire USA
Thogmartin W E 2007 Effects at the landscapescale may constrain habitat relations at finer scales
Avian Conservation and Ecology 6(1) 4httpwwwace-ecoorgvol6iss1art4
Avian Conservation and Ecology - Eacutecologie etconservation des oiseaux 2(2) 6 [online] URL URL httpwwwace-ecoorgvol2iss2art6
Thogmartin W E and M G Knutson 2007Scaling local species-habitat relations to the largerlandscape with a hierarchical spatial count modelLandscape Ecology 22(1)61-75 doi101007s10980-006-9005-2
Thompson C M and K McGarigal 2002 Theinfluence of research scale on bald eagle habitatselection along the lower Hudson River New York(USA) Landscape Ecology 17(6)569-586 doi101023A1021501231182
Titus J R and L W VanDruff 1981 Responseof the common loon to recreational pressure in theBoundary Waters Canoe Area northeasternMinnesota Wildlife Monographs 791-60
Trocki C L and P W C Paton 2006 Assessinghabitat selection by foraging egrets in salt marshesat multiple spatial scales Wetlands 26(2)307-312 doi1016720277-5212(2006)26[307AHSBFE]20CO2
Turner M G 2005 Landscape ecology What isthe state of the science Annual Review of EcologyEvolution and Systematics 36319-344 doi101146annurevecolsys36102003152614
Tyre A J B Tenhumberg S A Field D NiejalkeK Parris and H P Possingham 2003 Improvingprecision and reducing bias in biological surveysestimating false-negative error rates EcologicalApplications 13(6)1790-1801 doi10189002-5078
Vermeer K 1973 Some aspects of the nestingrequirements of common loons in Alberta WilsonBulletin 85429-435
Wiens J A 1989 Spatial scaling in ecologyFunctional Ecology 3385-397 doi1023072389612
Wiens J A 2002 Riverine landscapes takinglandscape ecology into the water FreshwaterBiology 47(4)501-515 doi101046j1365-2427200200887x
Wiens J A J T Rotenberry and B van Horne1987 Habitat occupancy patterns of North
American shrubsteppe birds the effects of spatialscale Oikos 48132-147 doi1023073565849
Wilcove D S D Rothstein J Dubow A Phillipsand E Losos 1998 Quantifying threats to imperiledspecies in the United States Bioscience 48607-615doi1023071313420
Wu J 2004 Effects of changing scale on landscapepattern analysis scaling relations LandscapeEcology 19(2)125-138 doi101023BLAND000002171140074ae
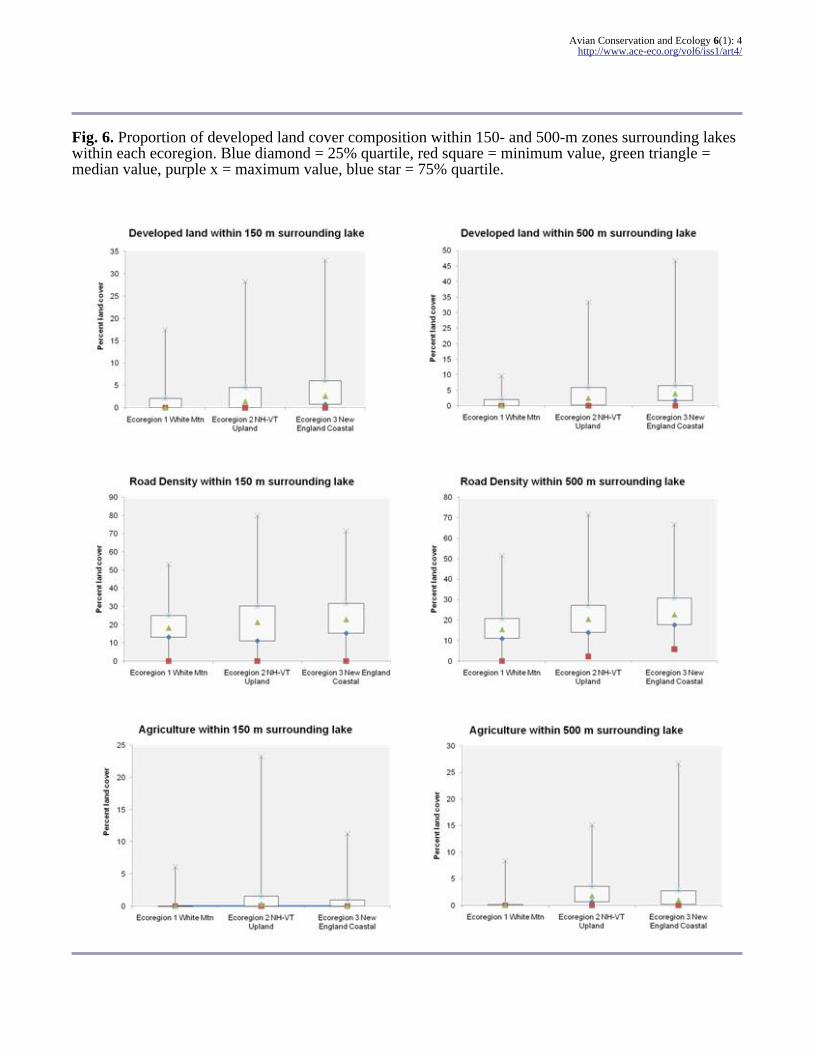
Avian Conservation and Ecology 6(1) 4httpwwwace-ecoorgvol6iss1art4
Fig 6 Proportion of developed land cover composition within 150- and 500-m zones surrounding lakeswithin each ecoregion Blue diamond = 25 quartile red square = minimum value green triangle =median value purple x = maximum value blue star = 75 quartile
Avian Conservation and Ecology 6(1) 4httpwwwace-ecoorgvol6iss1art4
Table 3 Summary of lake habitat for the three ecoregions for selected explanatory variables Means includeboth Common Loon nest presence and absence lakes
Habitat Variable Ecoregion Mean SE Min Max
Lake area (ha) 123
13796303
019010012
101012
32621819
20128
Lake perimeter (km) 123
131842
013007008
019048015
257048710
3019995
Lake maximum depth (m) 123
10195121
142080087
131115
497555549
Islands (numberlake) 123
214
093025121
000
5117128
Elevation (m) 123
465330145
594289207
1551135
728722601
Lake flushing rate (number of turnoversyr) 123
213100341
772277
030202
267176504
Water Clarity Secchi depth(m) 123
313841
022020018
090809
97116102
Total phosphorous (mgL) 123
001200120012
lt00010001
lt0001
000300010001
003800590052
Conductivity (micromhoscm) 123
339248216905
271299477
151016511664
112601827030600
Distance to loon lake (km) 123
253236
035026046
001001001
136174287
Distance to community center (km) 123
852529
075002023
001001001
24266213
Avian Conservation and Ecology 6(1) 4httpwwwace-ecoorgvol6iss1art4
Table 4 Summary of results for ecoregion 1 (Northern White Mountain) habitat models with their associatedAkaike weights N = 59 lakes Models with empirical support ie ∆iAICc le 2 are indicated in bold
Model Scale Rsup2 Kdagger Log likelihood AICc ∆iAICc Weightwi
AUC
2 Multiscale 087 3 minus668 1980 lt 0001 02444 0989
5 Foraging 073 2 minus786 1993 014 02281 0968
3 Catchment 072 2 minus820 2061 081 01627 0951
4 Riparian 072 2 minus826 2074 094 01526 0952
6 Nesting 150-m radius 076 2 minus846 2114 134 01249 0959
1 Global model 086 5 minus536 2185 206 00874 0988
Explanatory variables for each fitted modelDagger
2 Multiscale lake size (+) open water 500N (+)
5 Foraging open water 500N (+)
3 Catchment lake size (+)
4 Riparian lake size (+)
6 Nesting 150-m radius lake size (+)
1 Global model elevation (+) lake size (+) clarity (+) open water 500N (+)
Composite model Nest presence = minus8655 + 3127 (lake size) + 1570 (open water 500N)
daggerK indicates the total number of parameters ie the intercept and explanatory variablesDagger(+) = positive association (minus) = negative association L = lake scale N = nest scale
characteristics clear higher elevation lakes withislands further away from human populationcenters with lower surrounding road densities andwith nearby lakes occupied by other loons Waterclarity has long been associated with loon habitatpreference and our results are consistent withprevious studies (Vermeer 1973 McIntyre 19831988 Blair 1992 Meyer 2006) The significance ofthe minimum-distance-to-nearest-lake-with-loon-presence metric supports anecdotal observationsand published research describing loon nataldispersal This biotic interaction metric describesthe philopatric and conspecific attraction loonsdisplay and reveals the importance of the spatial
configuration of lakes in the selection of loonbreeding habitat (Strong et al 1987 Evers 2001Piper et al 2006 2008)
The unique habitat feature that distinguishes the bestmodel among the statewide models is theexplanatory variable islands which indicates high-quality breeding habitat for loons (Vermeer 1973Jung 1991 McIntyre and Barr 1997 Piper et al2006 Evers 2007) Based on odds ratio estimatesislands and lake clarity were the most importantfactors distinguishing loon breeding habitat for thestatewide data set (Table 8) The best statewidemodel also describes loon preferences for open
Avian Conservation and Ecology 6(1) 4httpwwwace-ecoorgvol6iss1art4
Table 5 Summary of results for ecoregion 3 (Southern New England Coastal Hills and Plain) habitatmodels with their associated Akaike weights N = 133 lakes Models with empirical support ie ∆iAICc le 2 are indicated in bold
Model Scale Rsup2 Kdagger Loglikelihood
AICc ∆iAICc Weight wi AUC
14 Multiscale 072 6 minus3284 7835 lt 0001 04282 0940
18 Nesting 069 4 minus3530 7892 057 03220 0931
15 Catchment 066 5 minus3565 8178 343 00772 0931
16 Riparian 066 5 minus3565 8178 343 00772 0931
17 Foraging 066 5 minus3565 8178 343 00772 0931
13 Globalmodel
075 11 minus3025 8467 632 00181 0949
Explanatory variables for each fitted modelDagger
14 Multiscale lake size (+) elevation (+) clarity (+) distance to loon (minus) phosphorous (minus)
18 Nesting elevation (+) lake size (+) phosphorous (minus)
15 Catchment distance to loon (minus) elevation (+) lake size (+) clarity (+)
16 Riparian distance to loon (minus) elevation (+) lake size (+) clarity (+)
17 Foraging distance to loon (minus) elevation (+) lake size (+) clarity (+)
13 Globalmodel
developed 150L (minus) open water 150L (+) road 150L (minus) islands (+) distance to loon (minus)elevation (+) lake size (+) phosphorous (minus) clarity (+) open water 500N (+)
Composite model Nest presence = minus4550 + 0006 (elevation) + 1180 (lake size) + 01714 (clarity) minus 02183 (distance toloon) minus 179503 (phosphorus)
daggerK indicates the total number of parameters ie the intercept and explanatory variablesDagger(+) = positive association (minus) = negative association L = lake scale N = nest scale
water surrounding the lake (eg hydrologicalconnectivity) Earnst et al (2006) also found thatYellow-billed Loon in northern Alaska selectbreeding habitat based on landscape-scale featuressuch as hydrological connectivity The explanatoryvariable minimum-distance-to-human-population-center was featured at every scale in the statewidemodels providing evidence that loons prefer tosituate nests on lakes further from humandisturbance A lake habitat selection study forwaterbirds in Canada also found that loons prefer
lakes that are farther from human activity or havemore forested land within a 500-m zone (Found etal 2008)
Effects of scale on Common Loon habitatassociations
Another of our objectives was to investigatewhether Common Loon selects breeding habitat atmultiple scales and to determine which scales are
Avian Conservation and Ecology 6(1) 4httpwwwace-ecoorgvol6iss1art4
Table 6 Summary of results for ecoregion 2 (New Hampshire-Vermont Upland) habitat models with theirassociated Akaike weights N = 130 lakes Models with empirical support ie ∆iAICc le 2 are indicatedin bold
Model Scale Rsup2 Kdagger Loglikelihood
AICc ∆iAICc Weight wi AUC
9 Catchment 081 8 minus2437 6593 lt 0001 06757 0971
8 Multiscale 083 10 minus2310 6806 213 02331 0973
10 Riparian 075 6 minus2872 7011 418 00834 0952
7 Globalmodel
079 11 minus2595 7613 1020 00041 0963
11 Foraging 073 7 minus3331 7930 1337 00008 0945
12 Nesting 068 7 minus3627 8745 2153 lt 000001 0930
Explanatory variables for each fitted modelDagger
9 Catchment open water 500L (+) road 500L (minus) islands (+) pH (+) elevation (+) clarity (+)agricultural 500L (minus)
8 Multiscale open water 150L (+) open water 500N (+) islands (+) clarity( +) road density 500L (minus)road density 150N (minus) distance to loon (minus) forest 150N (minus) wetland 150N (minus)
10 Riparian open water 150L (+) islands (+) distance to loon (minus) elevation (+) clarity (+)
7 Globalmodel
open water 150L (+) islands (+) distance to loon (minus) elevation (+) pH (+) clarity (+)agricultural 500L (minus) open water 500L (+) road density 500L (minus) forest 500 (minus)
11 Foraging open water 500N (+) agricultural 500N (minus) clarity (+) elevation (+) lake size (+)
12 Nesting road density 150N (minus) forest 150N (minus) wetland 150N (minus) elevation (+) lake size (+) flushingrate (minus)
Composite model Nest presence = minus22579 + 3179 (islands) + 1047 (clarity) + 0004 (elevation) + 0287 (open water150L) + 0405 (open water 500L) + 01064 (open water 500N) + 272 (pH) minus 0158 (road density 500L) minus 0362 (distanceto loon) minus 0314 (agricultural 500L) minus 0086 (forest 150N) minus 0079 (wetland 150N) minus 0065 (road density 150N)
daggerK indicates the total number of parameters ie the intercept and explanatory variablesDagger(+) = positive association (minus) = negative association L = lake scale N = nest scale
most important Using information theoreticstatistics the multiscale models for two of the threeecoregions were designated the best approximatingmodels and had substantial empirical support in allthree ecoregions Distinct differences are apparentwhen comparing models across ecoregions (Tables4 5 and 6) Loons in New Hampshire appear to be
selecting breeding habitat differently based onphysiographic ecoregion and at multiple scalesThese differences may be a reflection of theoccurrence of different environmental conditionsand ranges of variables in the three different regionsIn the Northern White Mountain ecoregion loonsare selecting breeding territories on the basis of lake
Avian Conservation and Ecology 6(1) 4httpwwwace-ecoorgvol6iss1art4
Table 7 Summary of results for New Hampshire statewide habitat models with their associated Akaikeweights N = 322 lakes Models with empirical support ie ∆iAICc le 2 are indicated in bold
Model Scale Rsup2 Kdagger Log likelihood AICc ∆iAICc Weight wi AUC
22 Riparian 065 8 minus8615 188764 000 08315 0926
21 Catchment 064 8 minus8843 193315 455 00854 0921
23 Foraging 063 7 minus8996 194269 561 00504 0919
19 Global model 070 15 minus8287 197304 854 00115 0941
24 Nesting 062 7 minus9192 198196 954 00071 0914
20 Multiscale 065 8 minus9365 203769 1501 00005 0926
Explanatory variables for each fitted modelDagger
22 Riparian open water 150L (+) elevation (+) islands (+) clarity (+) distance tohuman population (+) distance to loon (minus) road density 150L (minus)
21 Catchment distance to loon (minus) open water 500L (+) road density 500L (minus) elevation (+)lake size (+) clarity (+) distance to human population (+)
23 Foraging distance to loon (minus) open water 500N (+) elevation (+) lake size (+) clarity(+) distance to human population (+)
19 Global model open water 500L (minus) road density 500L (minus) road density 150N (minus) open water500N (+) road density 150L (minus) open water 150L (+) islands (+) distance toloon (minus) elevation (+) lake size (+) pH (+) phosphorous (minus) clarity (+)distance to human population (+)
24 Nesting distance to loon (minus) road density 150N (minus) elevation (+) lake size (+) clarity(+) distance to human population (+)
20 Multiscale distance to loon (minus) open water 500N (+) road density 150L (minus) elevation (+)lake size (+) clarity (+) distance to human population (+)
Statewide model Nest presence = minus7328 + 0115 (open water 150L) + 0001 (elevation) + 1067 (islands) + 0595 (clarity)+ 0211 (distance to human population) minus 0233 (distance to loon) minus 0033 (road density 150 L)
daggerK indicates the total number of parameters ie the intercept and explanatory variablesDagger(+) = positive association (minus) = negative association L = lake scale N = nest scale
size and the amount of open water surrounding thenest (eg island nest sites) In this ecoregion therewas no distinction between loon presence andabsence lakes based on human-altered variablessuch as road density and developed land or waterquality variables associated with human activitiesThe Northern White Mountain ecoregion has lowerroad densities surrounding the lakes and a less
human-dominated landscape in general Thereforethe loonsrsquo apparent selection based on a few lakemorphological factors may be more a reflection ofthe general environmental conditions and lack ofhuman-altered variables to select against It is alsointeresting to note that loons in this northernecoregion do not appear to be using the presence ofother loons on nearby lakes as a habitat selection
Avian Conservation and Ecology 6(1) 4httpwwwace-ecoorgvol6iss1art4
factor as is the case in the two more southerlyecoregions
The results for the Northern White Mountainecoregion suggest that prior to human alteration ofthe landscape loons may have chosen breedinghabitat based primarily on lake morphologicalfactors such as lake size and the amount of openwater surrounding the nest The catchment riparianforaging and nest scale-based models within theNorthern White Mountain ecoregion includeinformation describing the selection of loonbreeding habitat (Table 4) Three of these final fittedsingle-scale models had explanatory variables incommon (ie lake size) and were combined in themultiscale model for this ecoregion to determine thebest approximating model given the data set basedon the model probability Akaike weights wi (Table4) However using evidence ratios (Burnham andAnderson 2002) to compare the two best modelsthe best model (model 1) has only 19 times theweight of evidence relative to the second-best model(model 4) This relatively weak support for any ofthe models being the best model suggests that thesemodels are good candidates for model averaging ormultimodel inference Model averaging increasesparameter estimate precision and reduces biasassociated with model selection especially when allof the models have substantial support and areclosely related as in ecoregion 1
In the southwestern New Hampshire-VermontUpland loons appear to be avoiding human-alteredlandscapes such as those with high road density andgreater areas of agriculture (Table 6) This regionof New Hampshire contains the highest percentageof prime agricultural soils in the state and hasexperienced the highest amount of agriculturalconversion to developed land in the state over the5-yr period from 1997 to 2002 (Society for theProtection of New Hampshire Forests 2005) Withinthis ecoregion loons are selecting lakes with moreislands higher water clarity and more open watersurrounding the lakes and that are nearby otherlakes with loons present The catchment-scalemodel describing features within a 500-m zone ofthe lake best describes the data in this region (model9 Table 6) the only other model that has substantialempirical support for describing this data set is themultiscale model (model 8 Table 6) Thecatchment-scale model differs from the multiscalemodel by identifying positive associations of loonswith pH (an indicator of fishprey habitat) and lakeelevation and a negative association of loons with
agricultural land within 500 m of the lake Insteadof relying on a single best model for this ecoregionwe used model averaging to combine these twohighest ranking models to obtain robust estimatesof model parameters reduce model selection biasand account for model selection uncertainty(Johnson and Omland 2004) Based on the modelaveraged results and using odds ratios to identifyinfluential factors in this region islands pH andwater clarity appear to be the most influential habitatfeatures (Table 8)
Loons in the southeastern Southern New EnglandCoastal Hills and Plain appear to be selectingbreeding habitat similarly across all scales based ona few key elements larger lakes at increasingelevations with lower levels of phosphorous nearbyother lakes with loons (Table 5) Other studies havefound that loons avoid lakes with higherphosphorous and primary productivity (Blair 1992)which can reduce water clarity Total phosphoruswhich is associated with anthropogenic activitiesappears to be an important avoidance factor forloons selecting breeding habitat at multiple scalesbased on the multiscale and nesting-scale modelswhich are the two highest-ranking models for thisregion The two most influential factors in thisregion appear to be lake size and water clarity basedon odds ratio estimates (Table 8)
The natural arrangement of lakes in NewHampshire especially in the southeastern portionof the state (referred to as the Lakes Region) is ofparticular concern because this area has the fastestrate of human population change in NewHampshire The entire state population is projectedto grow by 358000 between 2000 and 2025 withan estimated 80 of that growth in the foursoutheastern counties of New Hampshire along theInterstate Highway 89 corridor and in the LakesRegion (Society for Protection of New HampshireForests 2005) Loons are responding to human-induced pressures on these lakes and across the stateby selecting against anthropogenic features such asroad density total phosphorous and conductivitydeveloped and agricultural lands and humanpopulation centers
CONCLUSION
Our results support the increasing evidence formultiscale habitat associations most commonlyfound in avian species (Gutzwiller and Anderson
Avian Conservation and Ecology 6(1) 4httpwwwace-ecoorgvol6iss1art4
Table 8 Model averaged parameter estimates and odds ratio estimates with confidence intervals forecoregional composite models and the statewide model These parameters constitute the final averagedmodels for each ecoregion and may be used directly to predict Common Loon nest presence regionally andthroughout the state of New Hampshire
Region Variable Theta SE Odds ratio 95 Wald confidence limits
Ecoregion 1 Northern White Mountain
Intercept minus8655 0704
Lake size 3127 0096 6935 0934 51509
Open water 500 nest 1570 0034 1482 1066 2062
Ecoregion 2 New Hampshire-Vermont Upland
Intercept minus22579 10485
Islands 3179 1120 18045 2760 117970
Clarity 1047 0349 2952 1500 5810
Elevation 0004 0002 1004 1000 1007
Open water 150 lake 0287 0136 1383 1153 1658
Open water 500 lake 0405 01145 1499 1198 1877
Open water 500 nest 01064 00485 0890 0810 0979
pH 272 10139 15195 2083 110844
Road density 500 lake minus0158 0064 0880 0789 0983
Distance to loon lake minus03619 0129 0691 0491 0971
Agricultural 500 lake minus03143 01489 0730 0545 0978
Forest 150 nest minus00856 00346 0913 0853 0977
Wetland 150 nest minus00793 00346 0920 0859 0985
Road density 150 nest minus00647 00286 0927 0877 0980
Ecoregion 3 Southern New England Coastal Hills and Plain
Intercept minus4550 0217
Elevation 0006 0001 1004 1000 1009
Lake size 1180 0158 3254 1640 6456
Clarity 01714 02835 1187 0681 2069
Distance to loon lake minus02183 0124 1000 1000 1000
Phosphorous minus179503 3190 lt 0001 lt 0001 lt 0001
(cond)
Avian Conservation and Ecology 6(1) 4httpwwwace-ecoorgvol6iss1art4
New Hampshire Statewide
Intercept minus73821 12467
Open water 150 lake 01150 00200 1122 1079 1167
Elevation 0001 0001 1001 1000 1002
Islands 10674 04210 2908 1274 6637
Clarity 05948 01503 1813 1350 2434
Distance to population center 02105 00797 1234 1056 1443
Distance to loon lake minus02331 00732 0792 0686 0914
Road density 150 lake minus00327 00148 0968 0940 0996
1987 Wiens et al 1987 Saab 1999 Meyer et al2002 Graf et al 2005 Kristan 2006 Lawler andEdwards 2006 Thogmartin 2007) The multiscalemodels within each ecoregion have substantialempirical support in describing breeding habitatsuggesting that Common Loon in New Hampshireis responding to environmental cues at scalesranging from broad catchment to finer riparian areassurrounding lakes as well as within lakes at thenesting scale Loons also appear to be selectinghabitat differently across the ecoregions based onthe varying landscape conditions they encounteracross New Hampshire This differential selectionof breeding habitat across ecoregions providesinformation for prioritizing conservation andfocusing management efforts in New HampshireConservation efforts in the northern ecoregionshould be focused on preserving the relatively lowerlevels of human activity and disturbance pressuressurrounding these northern lakes by preventingincreases in road density and construction nearlakes especially within the immediate shoreline oflarger lakes Loon conservation and managementactivities in the two southern ecoregions shouldfocus on reducing the effects of already existinghuman disturbances on water quality by mitigatingsources of phosphorous that can also directly affectclarity Other activities in these regions shouldinclude the prioritization for protection of high-quality nesting habitat such as small islands andundisturbed areas of lakes and preventingdevelopment in critical loon habitat Our resultssuggest that conservation strategies for CommonLoon should also consider environmental
influences beyond the immediate lake or riparianscale as the analysis demonstrates that loons arealso responding to landscape-level and catchment-scale conditions surrounding lakes
Responses to this article can be read online athttpwwwace-ecoorgvol6iss1art4responses
Acknowledgments
We thank the many people who share our interest inCommon Loon research and conservation Weappreciate the statistical assistance and advice ofDr James Heltshe and helpful advice fromreviewers of early drafts Drs James Lake BryanMilstead and Rick McKinney as well as that of theanonymous reviewers who contributed to the finalversion of this manuscript This is contributionnumber AED-10-048 of the Atlantic EcologyDivision National Health and EnvironmentalEffects Research Laboratory Office of Researchand Development US Environmental ProtectionAgency Although the research described in thiscontribution has been funded wholly by the USEnvironmental Protection Agency it has not beensubjected to Agency-level review Therefore it doesnot necessarily reflect the views of the AgencyMention of trade names products or services doesnot constitute endorsement or recommendation foruse
Avian Conservation and Ecology 6(1) 4httpwwwace-ecoorgvol6iss1art4
LITERATURE CITED
Agresti A 1996 An introduction to categoricaldata analysisWiley New York New York USA
Alvo R D J T Hussell and M Berrill 1988 Thebreeding success of common loons (Gavia immer)in relation to alkalinity and other lake characteristicsin Ontario Canadian Journal of Zoology 66(3)746-752
Anderson D R 2008 Model based inferences inthe life sciences a primer on evidence SpringerNew York New York USA doi101007978-0-387-74075-1
Anderson J R E E Hardy J T Roach and R EWitmer 1976 A land use and land coverclassification system for use with remote sensordata Geological Survey Professional Paper 964 US Geological Survey Washington DC USA
Austin M 2007 Species distribution models andecological theory a critical assessment and somepossible new approaches Ecological Modelling 200(1-2)1-19 doi101016jecolmodel200607005
Barr J F 1986 Population dynamics of thecommon loon associated with mercury-contaminatedwaters in northwestern Ontario Occasional PaperNumber 56 Canadian Wildlife Service OttawaCanada
Battin J and J J Lawler 2006 Cross-scalecorrelations and the design of avian-habitatselection studies Condor 10859-70 doi1016500010-5422(2006)108[0059CCATDA]20CO2
Blair R B 1992 Lake features water quality andthe summer distribution of Common Loons in NewHampshire Journal of Field Ornithology 63(1)1-9
Burgess N M D C Evers and J D Kaplan 2005Mercury and other contaminants in Common Loonsbreeding in Atlantic Canada Ecotoxicology 14(1-2)241-252 doi101007s10646-004-6271-0
Burnham K P and D R Anderson 2002 Modelselection and multimodel inference a practicalinformation-theoretic approach Second editionSpringer New York New York USA
Cox D R and E J Snell 1989 Analysis of binarydata Second edition Chapman amp Hall LondonUK
Cushman S A and K McGarigal 2002Hierarchical multi-scale decomposition of species-environment relationships Landscape Ecology 17(7)637-646 doi101023A1021571603605
Cushman S A and K McGarigal 2004Hierarchical analysis of forest bird species-environment relationships in the Oregon CoastRange Ecological Applications 14(4)1090-1105 doi10189003-5131
Deppe J L and J T Rotenberry 2008 Scale-dependent habitat use by fall migratory birdsvegetation structure floristics and geographyEcological Monographs 78(3)461-487 doi10189007-01631
Desorbo C R K M Taylor D E Kramer J FairJ H Cooley Jr D C Evers W Hanson H SVogel and J L Atwood 2007 Reproductiveadvantages for Common Loons using rafts Journalof Wildlife Management 71(4)1206-1213 doi1021932006-422
Driscoll M J L T Donovan R Mickey AHoward and K K Fleming 2005 Determinants ofwood thrush nest success a multi-scale modelselection approach Journal of Wildlife Management 69(2)699-709 doi1021930022-541X(2005)069[0699DOWTNS]20CO2
Earnst S L R Platte and L Bond 2006 Alandscape-scale model of yellow-billed loon (Gaviaadamsii) habitat preferences in northern AlaskaHydrobiologia 567(1)227-236 doi101007s10750-006-0042-2
Edwards T C Jr G G Moisen T S Frescinoand J J Lawler 2003 Modeling multipleecological scales to link landscape theory to wildlifeconservation Pages 153-172 in J A Bissonette andI Storch editors Landscape ecology and resourcemanagement linking theory with practice IslandPress Washington DC USA
Environmental Systems Research Institute 2009ArcInfo geographic information system (GIS)software Version 91 Redlands California USA
Avian Conservation and Ecology 6(1) 4httpwwwace-ecoorgvol6iss1art4
Estrella A 1998 A new measure of fit for equationswith dichotomous dependent variables Journal ofBusiness and Economic Statistics 16(2)198-205 doi1023071392575
Evers D C 2001 Common Loon populationstudies continental mercury patterns and breedingterritory philopatry Dissertation University ofMinnesota St Paul Minnesota USA
Evers D C 2007 Status assessment andconservation plan for the Common Loon (Gaviaimmer) in North America BRI Report 2007-20 US Fish and Wildlife Service Hadley MassachusettsUSA
Evers D C L J Savoy C R DeSorbo D EYates W Hanson K M Taylor L Siegel J HCooley M S Bank A Major K Munney BMower H S Vogel N Schoch M Pokras M WGoodale and J Fair 2008 Adverse effects fromenvironmental mercury loads on breeding commonloons Ecotoxicology 17(2)69-81 doi101007s10646-007-0168-7
Fielding A H and J F Bell 1997 A review ofmethods for the assessment of prediction errors inconservation presenceabsence models EnvironmentalConservation 24(1)38-49 doi101017S0376892997000088
Fortin M-J and M R T Dale 2005 Spatialanalysis a guide for ecologists CambridgeUniversity Press Cambridge UK
Found C S M Webb and M S Boyce 2008Selection of lake habitats by waterbirds in the borealtransition zone of northeastern Alberta CanadianJournal of Zoology 86(4)277-285 doi101139Z07-137
Fraterrigo J M and J A Downing 2008 Theinfluence of land use on lake nutrients varies withwatershed transport capacity Ecosystems 11(7)1021-1034 doi101007s10021-008-9176-6
Freemark K E D Bert and M A Villard 2002Patch- landscape- and regional-scale effects onbiota Pages 58-83 in K J Gutzwiller editorApplying landscape ecology in biologicalconservation Springer New York New YorkUSA
Gamma Design Software 2001 GS+ geostatisticsfor the environmental sciences PlainwellMichigan USA
Garshellis D L 2000 Delusions in habitatevaluation measuring use selection andimportance Pages 111-153 in L Boitani and T KFuller editors Research techniques in animalecology controversies and consequences ColumbiaUniversity Press New York New York USA
Goldstein H 2003 Multilevel statistical models Third edition Hodder Arnold London UK
Graf R F K Bollmann W Suter and HBugmann 2005 The importance of spatial scale inhabitat models Capercaillie in the Swiss AlpsLandscape Ecology 20(6)703-717 doi101007s10980-005-0063-7
Graham M H 2003 Confronting multicollinearityin ecological multiple regression Ecology 842809-2815 doi10189002-3114
Gutzwiller K J and S H Anderson 1987Multiscale associations between cavity-nestingbirds and features of Wyoming streamsidewoodlands Condor 89534-548 doi1023071368643
Hames R S J D Lowe S Barker Swarthout andK V Rosenberg 2006 Understanding the risk toneotropical migrant bird species of multiple human-caused stressors elucidating processes behindpatterns Ecology and Society 11(1) 24 [online]URL httpwwwecologyandsocietyorgvol11iss1art24
Hammond C A M 2008 A demographic andlandscape analysis for common loons in northwestMontana Thesis University of Montana MissoulaMontana USA [online] URL httpetdlibumteduthesesavailableetd-04242008-130448
Heimberger M D Euler and J Barr 1983 Theimpact of cottage development on Common Loonreproductive success in central Ontario WilsonBulletin 95(3)431-439
Heinz H T Waldhoumlr and M Mittlboumlck 2005Careful use of pseudo R-squared measures inepidemiological studies Statistics in Medicine 24(18)2867-2872 doi101002sim2168
Avian Conservation and Ecology 6(1) 4httpwwwace-ecoorgvol6iss1art4
Hollister J W P V August J F Paul and H AWalker 2008 Predicting estuarine sediment metalconcentrations and inferred ecological conditionsan information theoretic approach Journal ofEnvironmental Quality 37(1)234-244 doi102134jeq20070105
Hosmer D W and S Lemeshow 2000 Appliedlogistic regression analysis Second edition WileyNew York New York USA doi1010020471722146
Hutchinson G E 1957 A treatise of limnologyVolume 1 geography physics and chemistry WileyNew York New York USA
Johnson J B and K S Omland 2004 Modelselection in ecology and evolution Trends inEcology and Evolution 19(2)101-108 doi101016jtree200310013
Johnson M D 2007 Measuring habitat quality areview Condor 109(3)489-504 doi10165083471
Johnston C A and B A Shmagin 2006 Scaleissues in lake-watershed interactions assessingshoreline development impacts on water clarityPages 297-313 in J Wu K B Jones H Li and OL Loucks editors Scaling and uncertainty analysisin ecology methods and applications SpringerDordrecht The Netherlands
Jung R E 1991 Effects of human activities andlake characteristics on the behavior and breedingsuccess of Common Loons Passenger Pigeon 53207-218
Kamman N C N M Burgess C T Driscoll HA Simonin W Goodale J Linehan R EstabrookM Hutcheson A Major A M Scheuhammer andD A Scruton 2005 Mercury in freshwater fish ofnortheast North America a geographic perspectivebased on fish tissue monitoring databasesEcotoxicology 14(1-2)163-180 doi101007s10646-004-6267-9
Kristan W B III 2006 Sources and expectationsfor hierarchical structure in bird-habitat associationsCondor 108(1)5-12 doi1016500010-5422(2006)108[0005SAEFHS]20CO2
Kristan W B III and J M Scott 2006Hierarchical models for avian ecologists Condor 108(1)1-4 doi1016500010-5422(2006)108[0001HMFAE]20CO2
Kuhn-Hines A 2008 A multiscale approach tobreeding habitat model development and evaluationfor the common loon Gavia immer in NewHampshire USA ETD Collection for University ofRhode Island Paper AAI3346850 [online] URL httpdigitalcommonsuriedudissertationsAAI3346850
Lawler J J and T C Edwards Jr 2006 Avariance-decomposition approach to investigatingmultiscale habitat associations Condor 108(1)47-58 doi1016500010-5422(2006)108[0047AVATIM]20CO2
Li X D Li Z Ma and D Schneider 2006 Nestsite use by crested ibis dependence of a multifactormodel on spatial scale Landscape Ecology 21(8)1207-1216 doi101007s10980-006-0021-z
Loon Preservation Committee 2004 Fieldcollection protocol for surveying and managingCommon Loons in New Hampshire LoonPreservation Committee Moultonborough NewHampshire USA
Loon Preservation Committee 2005 Meeting thechallenge thirty years of preserving loons and theirhabitats in New Hampshire Loon PreservationCommittee Moultonborough New HampshireUSA
Luck G W 2002 The habitat requirements of therufous treecreeper (Climacteris rufa) 1 Preferentialhabitat use demonstrated at multiple spatial scalesBiological Conservation 105(3)383-394 doi101016S0006-3207(01)00222-1
MacKenzie D I 2005 Was it there Dealing withimperfect detection for species presenceabsencedata Australian and New Zealand Journal ofStatistics 47(1)65-74 doi101111j1467-842X200500372x
MacKenzie D I J D Nichols J E Hines M GKnutson and A B Franklin 2003 Estimating siteoccupancy colonization and local extinction whena species is detected imperfectly Ecology 84(8)2200-2207 doi10189002-3090
Avian Conservation and Ecology 6(1) 4httpwwwace-ecoorgvol6iss1art4
Martin S L and P A Soranno 2006 Lakelandscape position relationships to hydrologicconnectivity and landscape features Limnology andOceanography 51(2)801-814 doi104319lo20065120801
McGarigal K and B J Marks 1995 FRAGSTATSspatial pattern analysis program for quantifyinglandscape structure General Technical ReportPNW-GTR-351 US Department of AgricultureForest Service Washington DC USA
McIntyre J W 1983 Nurseries a consideration ofhabitat requirements during the early chick-rearingperiod in common loons Journal of FieldOrnithology 54(3)247-253
McIntyre J W 1988 The Common Loon spirit ofnorthern lakes University of Minnesota PressMinneapolis Minnesota USA
McIntyre J W and J F Barr 1997 Common loonGavia immer In A Poole and F Gill editors TheBirds of North America 313 Academy of NaturalSciences of Philadelphia and American OrnithologistsUnion Washington DC USA
Menard S 2002 Applied logistic regressionanalysis Second edition Sage PublicationsThousand Oaks California USA
Meyer C B S L Miller and C J Ralph 2002Multi-scale landscape and seascape patternsassociated with marbeled murrelet nesting areas onthe US west coast Landscape Ecology 17(2)95-115 doi101023A1016574928706
Meyer M W 2006 Evaluating the impact ofmultiple stressors on Common Loon populationdemographics-an integrated laboratory and fieldapproach EPA STAR Co-operative AgreementNumber R82-9085 Environmental ProtectionAgency Washington DC USA
Meyer M W D C Evers J J Hartigan and P SRasmussen 1998 Patterns of common loon (Gaviaimmer) mercury exposure reproduction andsurvival in Wisconsin USA EnvironmentalToxicology and Chemistry 17(2)184-190
Meyer M W and J E Woodford 1996Enhancing osprey (Pandion haliaetus) and commonloon (Gavia immer) reproduction on impacted
Wisconsin waterways Final report US Fish andWildlife Service Washington DC USA
Moran P A P 1950 Notes on continuousstochastic phenomena Biometrika 37(1-2)17-23 doi101093biomet371-217
Murtagh P A and P S Pooler 2006 Evaluatingecological indicators lakes in the northeasternUnited States Environmental Monitoring andAssessment 119(1-3)83-96 doi101007s10661-005-9011-x
New Hampshire Department of EnvironmentalServices 2005 Water quality data survey summaryfor New Hampshire lakes and ponds NewHampshire Department of Environmental ServicesNew Hampshire USA [online] URL httpdesnhgovorganizationdivisionswaterwmblakestrophic_summaryhtm
New Hampshire Department of EnvironmentalServices 2006 Community center areas NewHampshire Department of Environmental ServicesNew Hampshire USA [online] URL httpwwwgranitunhedudatadatacatpagescommunitycenterareaspdf
Newbrey J L M A Bozek and N D Niemuth2005 Effects of lake characteristics and humandisturbance on the presence of piscivorous birds innorthern Wisconsin USA Waterbirds 28(4)478-486 doi1016751524-4695(2005)28[478EOLCAH]20CO2
Nocera J J G J Forbes and G R Milton 2008The relevance of local-scale relationships to habitatmanagement and landscape patterns AvianConservation and Ecology - Eacutecologie etconservation des oiseaux 3(1) 4 [online] URL httpwwwace-ecoorgvol3iss1art4
Northeast Loon Study Work Group 2008 [online]URL httpwwwbriloonorgscience-and-conservationcentersNELSWGphp
OrsquoBrien R M 2007 A caution regarding rules ofthumb for variance inflation factors Quality ampQuantity 41(5)673-690 doi101007s11135-006-9018-6
Patton D R 1975 A diversity index for quantifyinghabitat lsquoedgersquo Wildlife Society Bulletin 3171-173
Avian Conservation and Ecology 6(1) 4httpwwwace-ecoorgvol6iss1art4
Penhollow M E and D F Stauffer 2000 Large-scale habitat relationships of neotropical migratorybirds in Virginia Journal of Wildlife Management 64(2)362-373 doi1023073803234
Piper W H C Walcott J N Mager III M PeralaK B Tischler E Harrington A J Turcotte MSchwabenlander and N Banfield 2006 Prospectingin a solitary breeder chick production elicitsterritorial intrusions in common loons BehavioralEcology 17(6)881-888 doi101093behecoarl021
Piper W H C Walcott J N Mager and F JSpilker 2008 Nestsite selection by male loons leadsto sex-biased site familiarity Journal of AnimalEcology 77(2)205-210 doi101111j1365-2656200701334x
Rimmer C C 1992 Common Loon Gavia immer Pages 3-30 in K J Schneider and D M Penceeditors Migratory nongame birds managementconcern in the Northeast US Fish and WildlifeService Newton Corner Massachusetts USA
Riitters K H R V OrsquoNeill and K B Jones 1997Assessing habitat suitability at multiple scales alandscape-level approach Biological Conservation 81(1-2)191-202 doi101016S0006-3207(96)00145-0
Saab V 1999 Importance of spatial scale to habitatuse by breeding birds in riparian forests ahierarchical analysis Ecological Applications 9(1)135-151 doi1018901051-0761(1999)009[0135IOSSTH]20CO2
SAS Institute Inc 2003 SAS 91 Cary NorthCarolina USA
Scott J M P J Heglund M L Morrison J BHaufler M G Raphael W A Wall and F BSamson editors 2002 Predicting speciesoccurrences issues of accuracy and scale IslandPress Washington DC USA
Society for Protection of New Hampshire Forests2005 New Hampshirersquos changing landscapepopulation growth and land use changes Societyfor Protection of New Hampshire Forests [online]URL httpwwwforestsocietyorgresearchresearch-projectsasp
Soranno P A K E Webster K S Cheruvelil andM T Bremigan 2009 The lake landscape-contextframework linking aquatic connections terrestrialfeatures and human effects at multiple scalesVerhandlungen des Internationalen Verein Limnologie 30(5)695-700
Sperduto D D and W F Nichols 2004 Naturalcommunities of New Hampshire New HampshireNatural Heritage Bureau Concord New HampshireUSA and University of New HampshireCooperative Extension Durham New HampshireUSA
SPSS Inc 1999 SPSS 100 Chicago Illinois USA
Stauffer H B C J Ralph and S L Miller 2004Ranking habitat for marbled murrelets a newconservation approach for species with uncertaindetection Ecological Applications 14(5)1374-1383doi10189003-5068
Stein B A and S R Flack 1997 1997 speciesreport card the status of US plants and animals The Nature Conservancy Arlington VirginiaUSA [online] URL httpwwwnatureserveorglibrary1997speciesreportcardpdf
Strauss B and R Biedermann 2007 Evaluatingtemporal and spatial generality How valid arespecies-habitat relationship models EcologicalModeling 204104-114 doi101016jecolmodel200612027
Strong P I V and J A Bissonette 1989 Feedingand chick-rearing areas of common loons Journalof Wildlife Management 5372-76 doi1023073801308
Strong P I V J A Bissonette and J S Fair 1987Reuse of nesting and nursery areas by CommonLoons Journal of Wildlife Management 51123-127doi1023073801642
Taylor K M and H S Vogel 2000 NewHampshire report Pages 110-113 in J McIntyre andD C Evers editors Loons old history and newfindings Proceedings symposium 1997 meetingAmerican Ornithologists Union North AmericanLoon Fund Holderness New Hampshire USA
Thogmartin W E 2007 Effects at the landscapescale may constrain habitat relations at finer scales
Avian Conservation and Ecology 6(1) 4httpwwwace-ecoorgvol6iss1art4
Avian Conservation and Ecology - Eacutecologie etconservation des oiseaux 2(2) 6 [online] URL URL httpwwwace-ecoorgvol2iss2art6
Thogmartin W E and M G Knutson 2007Scaling local species-habitat relations to the largerlandscape with a hierarchical spatial count modelLandscape Ecology 22(1)61-75 doi101007s10980-006-9005-2
Thompson C M and K McGarigal 2002 Theinfluence of research scale on bald eagle habitatselection along the lower Hudson River New York(USA) Landscape Ecology 17(6)569-586 doi101023A1021501231182
Titus J R and L W VanDruff 1981 Responseof the common loon to recreational pressure in theBoundary Waters Canoe Area northeasternMinnesota Wildlife Monographs 791-60
Trocki C L and P W C Paton 2006 Assessinghabitat selection by foraging egrets in salt marshesat multiple spatial scales Wetlands 26(2)307-312 doi1016720277-5212(2006)26[307AHSBFE]20CO2
Turner M G 2005 Landscape ecology What isthe state of the science Annual Review of EcologyEvolution and Systematics 36319-344 doi101146annurevecolsys36102003152614
Tyre A J B Tenhumberg S A Field D NiejalkeK Parris and H P Possingham 2003 Improvingprecision and reducing bias in biological surveysestimating false-negative error rates EcologicalApplications 13(6)1790-1801 doi10189002-5078
Vermeer K 1973 Some aspects of the nestingrequirements of common loons in Alberta WilsonBulletin 85429-435
Wiens J A 1989 Spatial scaling in ecologyFunctional Ecology 3385-397 doi1023072389612
Wiens J A 2002 Riverine landscapes takinglandscape ecology into the water FreshwaterBiology 47(4)501-515 doi101046j1365-2427200200887x
Wiens J A J T Rotenberry and B van Horne1987 Habitat occupancy patterns of North
American shrubsteppe birds the effects of spatialscale Oikos 48132-147 doi1023073565849
Wilcove D S D Rothstein J Dubow A Phillipsand E Losos 1998 Quantifying threats to imperiledspecies in the United States Bioscience 48607-615doi1023071313420
Wu J 2004 Effects of changing scale on landscapepattern analysis scaling relations LandscapeEcology 19(2)125-138 doi101023BLAND000002171140074ae
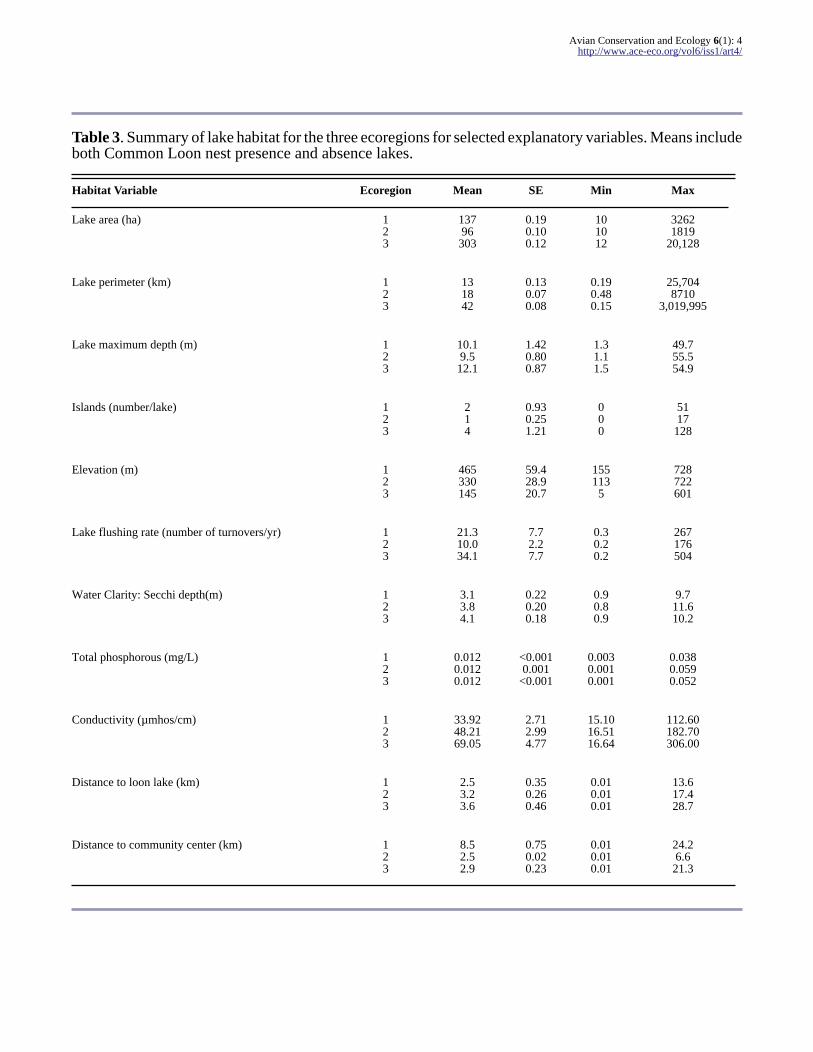
Avian Conservation and Ecology 6(1) 4httpwwwace-ecoorgvol6iss1art4
Table 4 Summary of results for ecoregion 1 (Northern White Mountain) habitat models with their associatedAkaike weights N = 59 lakes Models with empirical support ie ∆iAICc le 2 are indicated in bold
Model Scale Rsup2 Kdagger Log likelihood AICc ∆iAICc Weightwi
AUC
2 Multiscale 087 3 minus668 1980 lt 0001 02444 0989
5 Foraging 073 2 minus786 1993 014 02281 0968
3 Catchment 072 2 minus820 2061 081 01627 0951
4 Riparian 072 2 minus826 2074 094 01526 0952
6 Nesting 150-m radius 076 2 minus846 2114 134 01249 0959
1 Global model 086 5 minus536 2185 206 00874 0988
Explanatory variables for each fitted modelDagger
2 Multiscale lake size (+) open water 500N (+)
5 Foraging open water 500N (+)
3 Catchment lake size (+)
4 Riparian lake size (+)
6 Nesting 150-m radius lake size (+)
1 Global model elevation (+) lake size (+) clarity (+) open water 500N (+)
Composite model Nest presence = minus8655 + 3127 (lake size) + 1570 (open water 500N)
daggerK indicates the total number of parameters ie the intercept and explanatory variablesDagger(+) = positive association (minus) = negative association L = lake scale N = nest scale
characteristics clear higher elevation lakes withislands further away from human populationcenters with lower surrounding road densities andwith nearby lakes occupied by other loons Waterclarity has long been associated with loon habitatpreference and our results are consistent withprevious studies (Vermeer 1973 McIntyre 19831988 Blair 1992 Meyer 2006) The significance ofthe minimum-distance-to-nearest-lake-with-loon-presence metric supports anecdotal observationsand published research describing loon nataldispersal This biotic interaction metric describesthe philopatric and conspecific attraction loonsdisplay and reveals the importance of the spatial
configuration of lakes in the selection of loonbreeding habitat (Strong et al 1987 Evers 2001Piper et al 2006 2008)
The unique habitat feature that distinguishes the bestmodel among the statewide models is theexplanatory variable islands which indicates high-quality breeding habitat for loons (Vermeer 1973Jung 1991 McIntyre and Barr 1997 Piper et al2006 Evers 2007) Based on odds ratio estimatesislands and lake clarity were the most importantfactors distinguishing loon breeding habitat for thestatewide data set (Table 8) The best statewidemodel also describes loon preferences for open
Avian Conservation and Ecology 6(1) 4httpwwwace-ecoorgvol6iss1art4
Table 5 Summary of results for ecoregion 3 (Southern New England Coastal Hills and Plain) habitatmodels with their associated Akaike weights N = 133 lakes Models with empirical support ie ∆iAICc le 2 are indicated in bold
Model Scale Rsup2 Kdagger Loglikelihood
AICc ∆iAICc Weight wi AUC
14 Multiscale 072 6 minus3284 7835 lt 0001 04282 0940
18 Nesting 069 4 minus3530 7892 057 03220 0931
15 Catchment 066 5 minus3565 8178 343 00772 0931
16 Riparian 066 5 minus3565 8178 343 00772 0931
17 Foraging 066 5 minus3565 8178 343 00772 0931
13 Globalmodel
075 11 minus3025 8467 632 00181 0949
Explanatory variables for each fitted modelDagger
14 Multiscale lake size (+) elevation (+) clarity (+) distance to loon (minus) phosphorous (minus)
18 Nesting elevation (+) lake size (+) phosphorous (minus)
15 Catchment distance to loon (minus) elevation (+) lake size (+) clarity (+)
16 Riparian distance to loon (minus) elevation (+) lake size (+) clarity (+)
17 Foraging distance to loon (minus) elevation (+) lake size (+) clarity (+)
13 Globalmodel
developed 150L (minus) open water 150L (+) road 150L (minus) islands (+) distance to loon (minus)elevation (+) lake size (+) phosphorous (minus) clarity (+) open water 500N (+)
Composite model Nest presence = minus4550 + 0006 (elevation) + 1180 (lake size) + 01714 (clarity) minus 02183 (distance toloon) minus 179503 (phosphorus)
daggerK indicates the total number of parameters ie the intercept and explanatory variablesDagger(+) = positive association (minus) = negative association L = lake scale N = nest scale
water surrounding the lake (eg hydrologicalconnectivity) Earnst et al (2006) also found thatYellow-billed Loon in northern Alaska selectbreeding habitat based on landscape-scale featuressuch as hydrological connectivity The explanatoryvariable minimum-distance-to-human-population-center was featured at every scale in the statewidemodels providing evidence that loons prefer tosituate nests on lakes further from humandisturbance A lake habitat selection study forwaterbirds in Canada also found that loons prefer
lakes that are farther from human activity or havemore forested land within a 500-m zone (Found etal 2008)
Effects of scale on Common Loon habitatassociations
Another of our objectives was to investigatewhether Common Loon selects breeding habitat atmultiple scales and to determine which scales are
Avian Conservation and Ecology 6(1) 4httpwwwace-ecoorgvol6iss1art4
Table 6 Summary of results for ecoregion 2 (New Hampshire-Vermont Upland) habitat models with theirassociated Akaike weights N = 130 lakes Models with empirical support ie ∆iAICc le 2 are indicatedin bold
Model Scale Rsup2 Kdagger Loglikelihood
AICc ∆iAICc Weight wi AUC
9 Catchment 081 8 minus2437 6593 lt 0001 06757 0971
8 Multiscale 083 10 minus2310 6806 213 02331 0973
10 Riparian 075 6 minus2872 7011 418 00834 0952
7 Globalmodel
079 11 minus2595 7613 1020 00041 0963
11 Foraging 073 7 minus3331 7930 1337 00008 0945
12 Nesting 068 7 minus3627 8745 2153 lt 000001 0930
Explanatory variables for each fitted modelDagger
9 Catchment open water 500L (+) road 500L (minus) islands (+) pH (+) elevation (+) clarity (+)agricultural 500L (minus)
8 Multiscale open water 150L (+) open water 500N (+) islands (+) clarity( +) road density 500L (minus)road density 150N (minus) distance to loon (minus) forest 150N (minus) wetland 150N (minus)
10 Riparian open water 150L (+) islands (+) distance to loon (minus) elevation (+) clarity (+)
7 Globalmodel
open water 150L (+) islands (+) distance to loon (minus) elevation (+) pH (+) clarity (+)agricultural 500L (minus) open water 500L (+) road density 500L (minus) forest 500 (minus)
11 Foraging open water 500N (+) agricultural 500N (minus) clarity (+) elevation (+) lake size (+)
12 Nesting road density 150N (minus) forest 150N (minus) wetland 150N (minus) elevation (+) lake size (+) flushingrate (minus)
Composite model Nest presence = minus22579 + 3179 (islands) + 1047 (clarity) + 0004 (elevation) + 0287 (open water150L) + 0405 (open water 500L) + 01064 (open water 500N) + 272 (pH) minus 0158 (road density 500L) minus 0362 (distanceto loon) minus 0314 (agricultural 500L) minus 0086 (forest 150N) minus 0079 (wetland 150N) minus 0065 (road density 150N)
daggerK indicates the total number of parameters ie the intercept and explanatory variablesDagger(+) = positive association (minus) = negative association L = lake scale N = nest scale
most important Using information theoreticstatistics the multiscale models for two of the threeecoregions were designated the best approximatingmodels and had substantial empirical support in allthree ecoregions Distinct differences are apparentwhen comparing models across ecoregions (Tables4 5 and 6) Loons in New Hampshire appear to be
selecting breeding habitat differently based onphysiographic ecoregion and at multiple scalesThese differences may be a reflection of theoccurrence of different environmental conditionsand ranges of variables in the three different regionsIn the Northern White Mountain ecoregion loonsare selecting breeding territories on the basis of lake
Avian Conservation and Ecology 6(1) 4httpwwwace-ecoorgvol6iss1art4
Table 7 Summary of results for New Hampshire statewide habitat models with their associated Akaikeweights N = 322 lakes Models with empirical support ie ∆iAICc le 2 are indicated in bold
Model Scale Rsup2 Kdagger Log likelihood AICc ∆iAICc Weight wi AUC
22 Riparian 065 8 minus8615 188764 000 08315 0926
21 Catchment 064 8 minus8843 193315 455 00854 0921
23 Foraging 063 7 minus8996 194269 561 00504 0919
19 Global model 070 15 minus8287 197304 854 00115 0941
24 Nesting 062 7 minus9192 198196 954 00071 0914
20 Multiscale 065 8 minus9365 203769 1501 00005 0926
Explanatory variables for each fitted modelDagger
22 Riparian open water 150L (+) elevation (+) islands (+) clarity (+) distance tohuman population (+) distance to loon (minus) road density 150L (minus)
21 Catchment distance to loon (minus) open water 500L (+) road density 500L (minus) elevation (+)lake size (+) clarity (+) distance to human population (+)
23 Foraging distance to loon (minus) open water 500N (+) elevation (+) lake size (+) clarity(+) distance to human population (+)
19 Global model open water 500L (minus) road density 500L (minus) road density 150N (minus) open water500N (+) road density 150L (minus) open water 150L (+) islands (+) distance toloon (minus) elevation (+) lake size (+) pH (+) phosphorous (minus) clarity (+)distance to human population (+)
24 Nesting distance to loon (minus) road density 150N (minus) elevation (+) lake size (+) clarity(+) distance to human population (+)
20 Multiscale distance to loon (minus) open water 500N (+) road density 150L (minus) elevation (+)lake size (+) clarity (+) distance to human population (+)
Statewide model Nest presence = minus7328 + 0115 (open water 150L) + 0001 (elevation) + 1067 (islands) + 0595 (clarity)+ 0211 (distance to human population) minus 0233 (distance to loon) minus 0033 (road density 150 L)
daggerK indicates the total number of parameters ie the intercept and explanatory variablesDagger(+) = positive association (minus) = negative association L = lake scale N = nest scale
size and the amount of open water surrounding thenest (eg island nest sites) In this ecoregion therewas no distinction between loon presence andabsence lakes based on human-altered variablessuch as road density and developed land or waterquality variables associated with human activitiesThe Northern White Mountain ecoregion has lowerroad densities surrounding the lakes and a less
human-dominated landscape in general Thereforethe loonsrsquo apparent selection based on a few lakemorphological factors may be more a reflection ofthe general environmental conditions and lack ofhuman-altered variables to select against It is alsointeresting to note that loons in this northernecoregion do not appear to be using the presence ofother loons on nearby lakes as a habitat selection
Avian Conservation and Ecology 6(1) 4httpwwwace-ecoorgvol6iss1art4
factor as is the case in the two more southerlyecoregions
The results for the Northern White Mountainecoregion suggest that prior to human alteration ofthe landscape loons may have chosen breedinghabitat based primarily on lake morphologicalfactors such as lake size and the amount of openwater surrounding the nest The catchment riparianforaging and nest scale-based models within theNorthern White Mountain ecoregion includeinformation describing the selection of loonbreeding habitat (Table 4) Three of these final fittedsingle-scale models had explanatory variables incommon (ie lake size) and were combined in themultiscale model for this ecoregion to determine thebest approximating model given the data set basedon the model probability Akaike weights wi (Table4) However using evidence ratios (Burnham andAnderson 2002) to compare the two best modelsthe best model (model 1) has only 19 times theweight of evidence relative to the second-best model(model 4) This relatively weak support for any ofthe models being the best model suggests that thesemodels are good candidates for model averaging ormultimodel inference Model averaging increasesparameter estimate precision and reduces biasassociated with model selection especially when allof the models have substantial support and areclosely related as in ecoregion 1
In the southwestern New Hampshire-VermontUpland loons appear to be avoiding human-alteredlandscapes such as those with high road density andgreater areas of agriculture (Table 6) This regionof New Hampshire contains the highest percentageof prime agricultural soils in the state and hasexperienced the highest amount of agriculturalconversion to developed land in the state over the5-yr period from 1997 to 2002 (Society for theProtection of New Hampshire Forests 2005) Withinthis ecoregion loons are selecting lakes with moreislands higher water clarity and more open watersurrounding the lakes and that are nearby otherlakes with loons present The catchment-scalemodel describing features within a 500-m zone ofthe lake best describes the data in this region (model9 Table 6) the only other model that has substantialempirical support for describing this data set is themultiscale model (model 8 Table 6) Thecatchment-scale model differs from the multiscalemodel by identifying positive associations of loonswith pH (an indicator of fishprey habitat) and lakeelevation and a negative association of loons with
agricultural land within 500 m of the lake Insteadof relying on a single best model for this ecoregionwe used model averaging to combine these twohighest ranking models to obtain robust estimatesof model parameters reduce model selection biasand account for model selection uncertainty(Johnson and Omland 2004) Based on the modelaveraged results and using odds ratios to identifyinfluential factors in this region islands pH andwater clarity appear to be the most influential habitatfeatures (Table 8)
Loons in the southeastern Southern New EnglandCoastal Hills and Plain appear to be selectingbreeding habitat similarly across all scales based ona few key elements larger lakes at increasingelevations with lower levels of phosphorous nearbyother lakes with loons (Table 5) Other studies havefound that loons avoid lakes with higherphosphorous and primary productivity (Blair 1992)which can reduce water clarity Total phosphoruswhich is associated with anthropogenic activitiesappears to be an important avoidance factor forloons selecting breeding habitat at multiple scalesbased on the multiscale and nesting-scale modelswhich are the two highest-ranking models for thisregion The two most influential factors in thisregion appear to be lake size and water clarity basedon odds ratio estimates (Table 8)
The natural arrangement of lakes in NewHampshire especially in the southeastern portionof the state (referred to as the Lakes Region) is ofparticular concern because this area has the fastestrate of human population change in NewHampshire The entire state population is projectedto grow by 358000 between 2000 and 2025 withan estimated 80 of that growth in the foursoutheastern counties of New Hampshire along theInterstate Highway 89 corridor and in the LakesRegion (Society for Protection of New HampshireForests 2005) Loons are responding to human-induced pressures on these lakes and across the stateby selecting against anthropogenic features such asroad density total phosphorous and conductivitydeveloped and agricultural lands and humanpopulation centers
CONCLUSION
Our results support the increasing evidence formultiscale habitat associations most commonlyfound in avian species (Gutzwiller and Anderson
Avian Conservation and Ecology 6(1) 4httpwwwace-ecoorgvol6iss1art4
Table 8 Model averaged parameter estimates and odds ratio estimates with confidence intervals forecoregional composite models and the statewide model These parameters constitute the final averagedmodels for each ecoregion and may be used directly to predict Common Loon nest presence regionally andthroughout the state of New Hampshire
Region Variable Theta SE Odds ratio 95 Wald confidence limits
Ecoregion 1 Northern White Mountain
Intercept minus8655 0704
Lake size 3127 0096 6935 0934 51509
Open water 500 nest 1570 0034 1482 1066 2062
Ecoregion 2 New Hampshire-Vermont Upland
Intercept minus22579 10485
Islands 3179 1120 18045 2760 117970
Clarity 1047 0349 2952 1500 5810
Elevation 0004 0002 1004 1000 1007
Open water 150 lake 0287 0136 1383 1153 1658
Open water 500 lake 0405 01145 1499 1198 1877
Open water 500 nest 01064 00485 0890 0810 0979
pH 272 10139 15195 2083 110844
Road density 500 lake minus0158 0064 0880 0789 0983
Distance to loon lake minus03619 0129 0691 0491 0971
Agricultural 500 lake minus03143 01489 0730 0545 0978
Forest 150 nest minus00856 00346 0913 0853 0977
Wetland 150 nest minus00793 00346 0920 0859 0985
Road density 150 nest minus00647 00286 0927 0877 0980
Ecoregion 3 Southern New England Coastal Hills and Plain
Intercept minus4550 0217
Elevation 0006 0001 1004 1000 1009
Lake size 1180 0158 3254 1640 6456
Clarity 01714 02835 1187 0681 2069
Distance to loon lake minus02183 0124 1000 1000 1000
Phosphorous minus179503 3190 lt 0001 lt 0001 lt 0001
(cond)
Avian Conservation and Ecology 6(1) 4httpwwwace-ecoorgvol6iss1art4
New Hampshire Statewide
Intercept minus73821 12467
Open water 150 lake 01150 00200 1122 1079 1167
Elevation 0001 0001 1001 1000 1002
Islands 10674 04210 2908 1274 6637
Clarity 05948 01503 1813 1350 2434
Distance to population center 02105 00797 1234 1056 1443
Distance to loon lake minus02331 00732 0792 0686 0914
Road density 150 lake minus00327 00148 0968 0940 0996
1987 Wiens et al 1987 Saab 1999 Meyer et al2002 Graf et al 2005 Kristan 2006 Lawler andEdwards 2006 Thogmartin 2007) The multiscalemodels within each ecoregion have substantialempirical support in describing breeding habitatsuggesting that Common Loon in New Hampshireis responding to environmental cues at scalesranging from broad catchment to finer riparian areassurrounding lakes as well as within lakes at thenesting scale Loons also appear to be selectinghabitat differently across the ecoregions based onthe varying landscape conditions they encounteracross New Hampshire This differential selectionof breeding habitat across ecoregions providesinformation for prioritizing conservation andfocusing management efforts in New HampshireConservation efforts in the northern ecoregionshould be focused on preserving the relatively lowerlevels of human activity and disturbance pressuressurrounding these northern lakes by preventingincreases in road density and construction nearlakes especially within the immediate shoreline oflarger lakes Loon conservation and managementactivities in the two southern ecoregions shouldfocus on reducing the effects of already existinghuman disturbances on water quality by mitigatingsources of phosphorous that can also directly affectclarity Other activities in these regions shouldinclude the prioritization for protection of high-quality nesting habitat such as small islands andundisturbed areas of lakes and preventingdevelopment in critical loon habitat Our resultssuggest that conservation strategies for CommonLoon should also consider environmental
influences beyond the immediate lake or riparianscale as the analysis demonstrates that loons arealso responding to landscape-level and catchment-scale conditions surrounding lakes
Responses to this article can be read online athttpwwwace-ecoorgvol6iss1art4responses
Acknowledgments
We thank the many people who share our interest inCommon Loon research and conservation Weappreciate the statistical assistance and advice ofDr James Heltshe and helpful advice fromreviewers of early drafts Drs James Lake BryanMilstead and Rick McKinney as well as that of theanonymous reviewers who contributed to the finalversion of this manuscript This is contributionnumber AED-10-048 of the Atlantic EcologyDivision National Health and EnvironmentalEffects Research Laboratory Office of Researchand Development US Environmental ProtectionAgency Although the research described in thiscontribution has been funded wholly by the USEnvironmental Protection Agency it has not beensubjected to Agency-level review Therefore it doesnot necessarily reflect the views of the AgencyMention of trade names products or services doesnot constitute endorsement or recommendation foruse
Avian Conservation and Ecology 6(1) 4httpwwwace-ecoorgvol6iss1art4
LITERATURE CITED
Agresti A 1996 An introduction to categoricaldata analysisWiley New York New York USA
Alvo R D J T Hussell and M Berrill 1988 Thebreeding success of common loons (Gavia immer)in relation to alkalinity and other lake characteristicsin Ontario Canadian Journal of Zoology 66(3)746-752
Anderson D R 2008 Model based inferences inthe life sciences a primer on evidence SpringerNew York New York USA doi101007978-0-387-74075-1
Anderson J R E E Hardy J T Roach and R EWitmer 1976 A land use and land coverclassification system for use with remote sensordata Geological Survey Professional Paper 964 US Geological Survey Washington DC USA
Austin M 2007 Species distribution models andecological theory a critical assessment and somepossible new approaches Ecological Modelling 200(1-2)1-19 doi101016jecolmodel200607005
Barr J F 1986 Population dynamics of thecommon loon associated with mercury-contaminatedwaters in northwestern Ontario Occasional PaperNumber 56 Canadian Wildlife Service OttawaCanada
Battin J and J J Lawler 2006 Cross-scalecorrelations and the design of avian-habitatselection studies Condor 10859-70 doi1016500010-5422(2006)108[0059CCATDA]20CO2
Blair R B 1992 Lake features water quality andthe summer distribution of Common Loons in NewHampshire Journal of Field Ornithology 63(1)1-9
Burgess N M D C Evers and J D Kaplan 2005Mercury and other contaminants in Common Loonsbreeding in Atlantic Canada Ecotoxicology 14(1-2)241-252 doi101007s10646-004-6271-0
Burnham K P and D R Anderson 2002 Modelselection and multimodel inference a practicalinformation-theoretic approach Second editionSpringer New York New York USA
Cox D R and E J Snell 1989 Analysis of binarydata Second edition Chapman amp Hall LondonUK
Cushman S A and K McGarigal 2002Hierarchical multi-scale decomposition of species-environment relationships Landscape Ecology 17(7)637-646 doi101023A1021571603605
Cushman S A and K McGarigal 2004Hierarchical analysis of forest bird species-environment relationships in the Oregon CoastRange Ecological Applications 14(4)1090-1105 doi10189003-5131
Deppe J L and J T Rotenberry 2008 Scale-dependent habitat use by fall migratory birdsvegetation structure floristics and geographyEcological Monographs 78(3)461-487 doi10189007-01631
Desorbo C R K M Taylor D E Kramer J FairJ H Cooley Jr D C Evers W Hanson H SVogel and J L Atwood 2007 Reproductiveadvantages for Common Loons using rafts Journalof Wildlife Management 71(4)1206-1213 doi1021932006-422
Driscoll M J L T Donovan R Mickey AHoward and K K Fleming 2005 Determinants ofwood thrush nest success a multi-scale modelselection approach Journal of Wildlife Management 69(2)699-709 doi1021930022-541X(2005)069[0699DOWTNS]20CO2
Earnst S L R Platte and L Bond 2006 Alandscape-scale model of yellow-billed loon (Gaviaadamsii) habitat preferences in northern AlaskaHydrobiologia 567(1)227-236 doi101007s10750-006-0042-2
Edwards T C Jr G G Moisen T S Frescinoand J J Lawler 2003 Modeling multipleecological scales to link landscape theory to wildlifeconservation Pages 153-172 in J A Bissonette andI Storch editors Landscape ecology and resourcemanagement linking theory with practice IslandPress Washington DC USA
Environmental Systems Research Institute 2009ArcInfo geographic information system (GIS)software Version 91 Redlands California USA
Avian Conservation and Ecology 6(1) 4httpwwwace-ecoorgvol6iss1art4
Estrella A 1998 A new measure of fit for equationswith dichotomous dependent variables Journal ofBusiness and Economic Statistics 16(2)198-205 doi1023071392575
Evers D C 2001 Common Loon populationstudies continental mercury patterns and breedingterritory philopatry Dissertation University ofMinnesota St Paul Minnesota USA
Evers D C 2007 Status assessment andconservation plan for the Common Loon (Gaviaimmer) in North America BRI Report 2007-20 US Fish and Wildlife Service Hadley MassachusettsUSA
Evers D C L J Savoy C R DeSorbo D EYates W Hanson K M Taylor L Siegel J HCooley M S Bank A Major K Munney BMower H S Vogel N Schoch M Pokras M WGoodale and J Fair 2008 Adverse effects fromenvironmental mercury loads on breeding commonloons Ecotoxicology 17(2)69-81 doi101007s10646-007-0168-7
Fielding A H and J F Bell 1997 A review ofmethods for the assessment of prediction errors inconservation presenceabsence models EnvironmentalConservation 24(1)38-49 doi101017S0376892997000088
Fortin M-J and M R T Dale 2005 Spatialanalysis a guide for ecologists CambridgeUniversity Press Cambridge UK
Found C S M Webb and M S Boyce 2008Selection of lake habitats by waterbirds in the borealtransition zone of northeastern Alberta CanadianJournal of Zoology 86(4)277-285 doi101139Z07-137
Fraterrigo J M and J A Downing 2008 Theinfluence of land use on lake nutrients varies withwatershed transport capacity Ecosystems 11(7)1021-1034 doi101007s10021-008-9176-6
Freemark K E D Bert and M A Villard 2002Patch- landscape- and regional-scale effects onbiota Pages 58-83 in K J Gutzwiller editorApplying landscape ecology in biologicalconservation Springer New York New YorkUSA
Gamma Design Software 2001 GS+ geostatisticsfor the environmental sciences PlainwellMichigan USA
Garshellis D L 2000 Delusions in habitatevaluation measuring use selection andimportance Pages 111-153 in L Boitani and T KFuller editors Research techniques in animalecology controversies and consequences ColumbiaUniversity Press New York New York USA
Goldstein H 2003 Multilevel statistical models Third edition Hodder Arnold London UK
Graf R F K Bollmann W Suter and HBugmann 2005 The importance of spatial scale inhabitat models Capercaillie in the Swiss AlpsLandscape Ecology 20(6)703-717 doi101007s10980-005-0063-7
Graham M H 2003 Confronting multicollinearityin ecological multiple regression Ecology 842809-2815 doi10189002-3114
Gutzwiller K J and S H Anderson 1987Multiscale associations between cavity-nestingbirds and features of Wyoming streamsidewoodlands Condor 89534-548 doi1023071368643
Hames R S J D Lowe S Barker Swarthout andK V Rosenberg 2006 Understanding the risk toneotropical migrant bird species of multiple human-caused stressors elucidating processes behindpatterns Ecology and Society 11(1) 24 [online]URL httpwwwecologyandsocietyorgvol11iss1art24
Hammond C A M 2008 A demographic andlandscape analysis for common loons in northwestMontana Thesis University of Montana MissoulaMontana USA [online] URL httpetdlibumteduthesesavailableetd-04242008-130448
Heimberger M D Euler and J Barr 1983 Theimpact of cottage development on Common Loonreproductive success in central Ontario WilsonBulletin 95(3)431-439
Heinz H T Waldhoumlr and M Mittlboumlck 2005Careful use of pseudo R-squared measures inepidemiological studies Statistics in Medicine 24(18)2867-2872 doi101002sim2168
Avian Conservation and Ecology 6(1) 4httpwwwace-ecoorgvol6iss1art4
Hollister J W P V August J F Paul and H AWalker 2008 Predicting estuarine sediment metalconcentrations and inferred ecological conditionsan information theoretic approach Journal ofEnvironmental Quality 37(1)234-244 doi102134jeq20070105
Hosmer D W and S Lemeshow 2000 Appliedlogistic regression analysis Second edition WileyNew York New York USA doi1010020471722146
Hutchinson G E 1957 A treatise of limnologyVolume 1 geography physics and chemistry WileyNew York New York USA
Johnson J B and K S Omland 2004 Modelselection in ecology and evolution Trends inEcology and Evolution 19(2)101-108 doi101016jtree200310013
Johnson M D 2007 Measuring habitat quality areview Condor 109(3)489-504 doi10165083471
Johnston C A and B A Shmagin 2006 Scaleissues in lake-watershed interactions assessingshoreline development impacts on water clarityPages 297-313 in J Wu K B Jones H Li and OL Loucks editors Scaling and uncertainty analysisin ecology methods and applications SpringerDordrecht The Netherlands
Jung R E 1991 Effects of human activities andlake characteristics on the behavior and breedingsuccess of Common Loons Passenger Pigeon 53207-218
Kamman N C N M Burgess C T Driscoll HA Simonin W Goodale J Linehan R EstabrookM Hutcheson A Major A M Scheuhammer andD A Scruton 2005 Mercury in freshwater fish ofnortheast North America a geographic perspectivebased on fish tissue monitoring databasesEcotoxicology 14(1-2)163-180 doi101007s10646-004-6267-9
Kristan W B III 2006 Sources and expectationsfor hierarchical structure in bird-habitat associationsCondor 108(1)5-12 doi1016500010-5422(2006)108[0005SAEFHS]20CO2
Kristan W B III and J M Scott 2006Hierarchical models for avian ecologists Condor 108(1)1-4 doi1016500010-5422(2006)108[0001HMFAE]20CO2
Kuhn-Hines A 2008 A multiscale approach tobreeding habitat model development and evaluationfor the common loon Gavia immer in NewHampshire USA ETD Collection for University ofRhode Island Paper AAI3346850 [online] URL httpdigitalcommonsuriedudissertationsAAI3346850
Lawler J J and T C Edwards Jr 2006 Avariance-decomposition approach to investigatingmultiscale habitat associations Condor 108(1)47-58 doi1016500010-5422(2006)108[0047AVATIM]20CO2
Li X D Li Z Ma and D Schneider 2006 Nestsite use by crested ibis dependence of a multifactormodel on spatial scale Landscape Ecology 21(8)1207-1216 doi101007s10980-006-0021-z
Loon Preservation Committee 2004 Fieldcollection protocol for surveying and managingCommon Loons in New Hampshire LoonPreservation Committee Moultonborough NewHampshire USA
Loon Preservation Committee 2005 Meeting thechallenge thirty years of preserving loons and theirhabitats in New Hampshire Loon PreservationCommittee Moultonborough New HampshireUSA
Luck G W 2002 The habitat requirements of therufous treecreeper (Climacteris rufa) 1 Preferentialhabitat use demonstrated at multiple spatial scalesBiological Conservation 105(3)383-394 doi101016S0006-3207(01)00222-1
MacKenzie D I 2005 Was it there Dealing withimperfect detection for species presenceabsencedata Australian and New Zealand Journal ofStatistics 47(1)65-74 doi101111j1467-842X200500372x
MacKenzie D I J D Nichols J E Hines M GKnutson and A B Franklin 2003 Estimating siteoccupancy colonization and local extinction whena species is detected imperfectly Ecology 84(8)2200-2207 doi10189002-3090
Avian Conservation and Ecology 6(1) 4httpwwwace-ecoorgvol6iss1art4
Martin S L and P A Soranno 2006 Lakelandscape position relationships to hydrologicconnectivity and landscape features Limnology andOceanography 51(2)801-814 doi104319lo20065120801
McGarigal K and B J Marks 1995 FRAGSTATSspatial pattern analysis program for quantifyinglandscape structure General Technical ReportPNW-GTR-351 US Department of AgricultureForest Service Washington DC USA
McIntyre J W 1983 Nurseries a consideration ofhabitat requirements during the early chick-rearingperiod in common loons Journal of FieldOrnithology 54(3)247-253
McIntyre J W 1988 The Common Loon spirit ofnorthern lakes University of Minnesota PressMinneapolis Minnesota USA
McIntyre J W and J F Barr 1997 Common loonGavia immer In A Poole and F Gill editors TheBirds of North America 313 Academy of NaturalSciences of Philadelphia and American OrnithologistsUnion Washington DC USA
Menard S 2002 Applied logistic regressionanalysis Second edition Sage PublicationsThousand Oaks California USA
Meyer C B S L Miller and C J Ralph 2002Multi-scale landscape and seascape patternsassociated with marbeled murrelet nesting areas onthe US west coast Landscape Ecology 17(2)95-115 doi101023A1016574928706
Meyer M W 2006 Evaluating the impact ofmultiple stressors on Common Loon populationdemographics-an integrated laboratory and fieldapproach EPA STAR Co-operative AgreementNumber R82-9085 Environmental ProtectionAgency Washington DC USA
Meyer M W D C Evers J J Hartigan and P SRasmussen 1998 Patterns of common loon (Gaviaimmer) mercury exposure reproduction andsurvival in Wisconsin USA EnvironmentalToxicology and Chemistry 17(2)184-190
Meyer M W and J E Woodford 1996Enhancing osprey (Pandion haliaetus) and commonloon (Gavia immer) reproduction on impacted
Wisconsin waterways Final report US Fish andWildlife Service Washington DC USA
Moran P A P 1950 Notes on continuousstochastic phenomena Biometrika 37(1-2)17-23 doi101093biomet371-217
Murtagh P A and P S Pooler 2006 Evaluatingecological indicators lakes in the northeasternUnited States Environmental Monitoring andAssessment 119(1-3)83-96 doi101007s10661-005-9011-x
New Hampshire Department of EnvironmentalServices 2005 Water quality data survey summaryfor New Hampshire lakes and ponds NewHampshire Department of Environmental ServicesNew Hampshire USA [online] URL httpdesnhgovorganizationdivisionswaterwmblakestrophic_summaryhtm
New Hampshire Department of EnvironmentalServices 2006 Community center areas NewHampshire Department of Environmental ServicesNew Hampshire USA [online] URL httpwwwgranitunhedudatadatacatpagescommunitycenterareaspdf
Newbrey J L M A Bozek and N D Niemuth2005 Effects of lake characteristics and humandisturbance on the presence of piscivorous birds innorthern Wisconsin USA Waterbirds 28(4)478-486 doi1016751524-4695(2005)28[478EOLCAH]20CO2
Nocera J J G J Forbes and G R Milton 2008The relevance of local-scale relationships to habitatmanagement and landscape patterns AvianConservation and Ecology - Eacutecologie etconservation des oiseaux 3(1) 4 [online] URL httpwwwace-ecoorgvol3iss1art4
Northeast Loon Study Work Group 2008 [online]URL httpwwwbriloonorgscience-and-conservationcentersNELSWGphp
OrsquoBrien R M 2007 A caution regarding rules ofthumb for variance inflation factors Quality ampQuantity 41(5)673-690 doi101007s11135-006-9018-6
Patton D R 1975 A diversity index for quantifyinghabitat lsquoedgersquo Wildlife Society Bulletin 3171-173
Avian Conservation and Ecology 6(1) 4httpwwwace-ecoorgvol6iss1art4
Penhollow M E and D F Stauffer 2000 Large-scale habitat relationships of neotropical migratorybirds in Virginia Journal of Wildlife Management 64(2)362-373 doi1023073803234
Piper W H C Walcott J N Mager III M PeralaK B Tischler E Harrington A J Turcotte MSchwabenlander and N Banfield 2006 Prospectingin a solitary breeder chick production elicitsterritorial intrusions in common loons BehavioralEcology 17(6)881-888 doi101093behecoarl021
Piper W H C Walcott J N Mager and F JSpilker 2008 Nestsite selection by male loons leadsto sex-biased site familiarity Journal of AnimalEcology 77(2)205-210 doi101111j1365-2656200701334x
Rimmer C C 1992 Common Loon Gavia immer Pages 3-30 in K J Schneider and D M Penceeditors Migratory nongame birds managementconcern in the Northeast US Fish and WildlifeService Newton Corner Massachusetts USA
Riitters K H R V OrsquoNeill and K B Jones 1997Assessing habitat suitability at multiple scales alandscape-level approach Biological Conservation 81(1-2)191-202 doi101016S0006-3207(96)00145-0
Saab V 1999 Importance of spatial scale to habitatuse by breeding birds in riparian forests ahierarchical analysis Ecological Applications 9(1)135-151 doi1018901051-0761(1999)009[0135IOSSTH]20CO2
SAS Institute Inc 2003 SAS 91 Cary NorthCarolina USA
Scott J M P J Heglund M L Morrison J BHaufler M G Raphael W A Wall and F BSamson editors 2002 Predicting speciesoccurrences issues of accuracy and scale IslandPress Washington DC USA
Society for Protection of New Hampshire Forests2005 New Hampshirersquos changing landscapepopulation growth and land use changes Societyfor Protection of New Hampshire Forests [online]URL httpwwwforestsocietyorgresearchresearch-projectsasp
Soranno P A K E Webster K S Cheruvelil andM T Bremigan 2009 The lake landscape-contextframework linking aquatic connections terrestrialfeatures and human effects at multiple scalesVerhandlungen des Internationalen Verein Limnologie 30(5)695-700
Sperduto D D and W F Nichols 2004 Naturalcommunities of New Hampshire New HampshireNatural Heritage Bureau Concord New HampshireUSA and University of New HampshireCooperative Extension Durham New HampshireUSA
SPSS Inc 1999 SPSS 100 Chicago Illinois USA
Stauffer H B C J Ralph and S L Miller 2004Ranking habitat for marbled murrelets a newconservation approach for species with uncertaindetection Ecological Applications 14(5)1374-1383doi10189003-5068
Stein B A and S R Flack 1997 1997 speciesreport card the status of US plants and animals The Nature Conservancy Arlington VirginiaUSA [online] URL httpwwwnatureserveorglibrary1997speciesreportcardpdf
Strauss B and R Biedermann 2007 Evaluatingtemporal and spatial generality How valid arespecies-habitat relationship models EcologicalModeling 204104-114 doi101016jecolmodel200612027
Strong P I V and J A Bissonette 1989 Feedingand chick-rearing areas of common loons Journalof Wildlife Management 5372-76 doi1023073801308
Strong P I V J A Bissonette and J S Fair 1987Reuse of nesting and nursery areas by CommonLoons Journal of Wildlife Management 51123-127doi1023073801642
Taylor K M and H S Vogel 2000 NewHampshire report Pages 110-113 in J McIntyre andD C Evers editors Loons old history and newfindings Proceedings symposium 1997 meetingAmerican Ornithologists Union North AmericanLoon Fund Holderness New Hampshire USA
Thogmartin W E 2007 Effects at the landscapescale may constrain habitat relations at finer scales
Avian Conservation and Ecology 6(1) 4httpwwwace-ecoorgvol6iss1art4
Avian Conservation and Ecology - Eacutecologie etconservation des oiseaux 2(2) 6 [online] URL URL httpwwwace-ecoorgvol2iss2art6
Thogmartin W E and M G Knutson 2007Scaling local species-habitat relations to the largerlandscape with a hierarchical spatial count modelLandscape Ecology 22(1)61-75 doi101007s10980-006-9005-2
Thompson C M and K McGarigal 2002 Theinfluence of research scale on bald eagle habitatselection along the lower Hudson River New York(USA) Landscape Ecology 17(6)569-586 doi101023A1021501231182
Titus J R and L W VanDruff 1981 Responseof the common loon to recreational pressure in theBoundary Waters Canoe Area northeasternMinnesota Wildlife Monographs 791-60
Trocki C L and P W C Paton 2006 Assessinghabitat selection by foraging egrets in salt marshesat multiple spatial scales Wetlands 26(2)307-312 doi1016720277-5212(2006)26[307AHSBFE]20CO2
Turner M G 2005 Landscape ecology What isthe state of the science Annual Review of EcologyEvolution and Systematics 36319-344 doi101146annurevecolsys36102003152614
Tyre A J B Tenhumberg S A Field D NiejalkeK Parris and H P Possingham 2003 Improvingprecision and reducing bias in biological surveysestimating false-negative error rates EcologicalApplications 13(6)1790-1801 doi10189002-5078
Vermeer K 1973 Some aspects of the nestingrequirements of common loons in Alberta WilsonBulletin 85429-435
Wiens J A 1989 Spatial scaling in ecologyFunctional Ecology 3385-397 doi1023072389612
Wiens J A 2002 Riverine landscapes takinglandscape ecology into the water FreshwaterBiology 47(4)501-515 doi101046j1365-2427200200887x
Wiens J A J T Rotenberry and B van Horne1987 Habitat occupancy patterns of North
American shrubsteppe birds the effects of spatialscale Oikos 48132-147 doi1023073565849
Wilcove D S D Rothstein J Dubow A Phillipsand E Losos 1998 Quantifying threats to imperiledspecies in the United States Bioscience 48607-615doi1023071313420
Wu J 2004 Effects of changing scale on landscapepattern analysis scaling relations LandscapeEcology 19(2)125-138 doi101023BLAND000002171140074ae
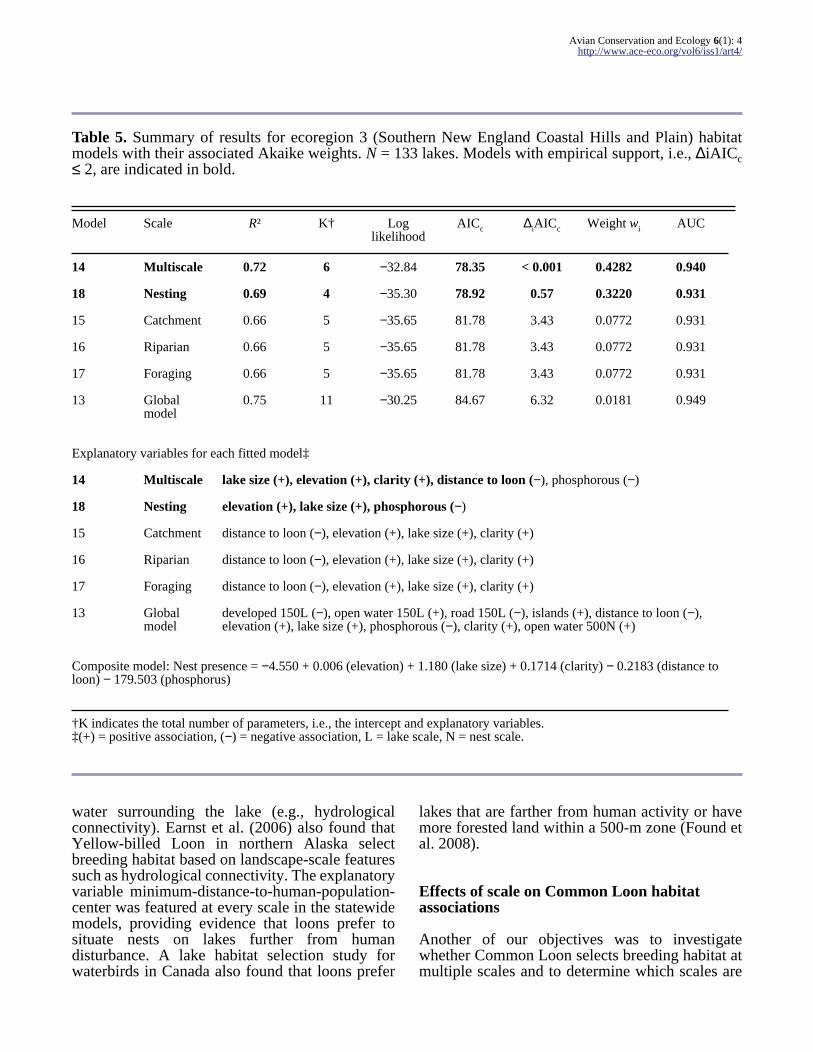
Avian Conservation and Ecology 6(1) 4httpwwwace-ecoorgvol6iss1art4
Table 5 Summary of results for ecoregion 3 (Southern New England Coastal Hills and Plain) habitatmodels with their associated Akaike weights N = 133 lakes Models with empirical support ie ∆iAICc le 2 are indicated in bold
Model Scale Rsup2 Kdagger Loglikelihood
AICc ∆iAICc Weight wi AUC
14 Multiscale 072 6 minus3284 7835 lt 0001 04282 0940
18 Nesting 069 4 minus3530 7892 057 03220 0931
15 Catchment 066 5 minus3565 8178 343 00772 0931
16 Riparian 066 5 minus3565 8178 343 00772 0931
17 Foraging 066 5 minus3565 8178 343 00772 0931
13 Globalmodel
075 11 minus3025 8467 632 00181 0949
Explanatory variables for each fitted modelDagger
14 Multiscale lake size (+) elevation (+) clarity (+) distance to loon (minus) phosphorous (minus)
18 Nesting elevation (+) lake size (+) phosphorous (minus)
15 Catchment distance to loon (minus) elevation (+) lake size (+) clarity (+)
16 Riparian distance to loon (minus) elevation (+) lake size (+) clarity (+)
17 Foraging distance to loon (minus) elevation (+) lake size (+) clarity (+)
13 Globalmodel
developed 150L (minus) open water 150L (+) road 150L (minus) islands (+) distance to loon (minus)elevation (+) lake size (+) phosphorous (minus) clarity (+) open water 500N (+)
Composite model Nest presence = minus4550 + 0006 (elevation) + 1180 (lake size) + 01714 (clarity) minus 02183 (distance toloon) minus 179503 (phosphorus)
daggerK indicates the total number of parameters ie the intercept and explanatory variablesDagger(+) = positive association (minus) = negative association L = lake scale N = nest scale
water surrounding the lake (eg hydrologicalconnectivity) Earnst et al (2006) also found thatYellow-billed Loon in northern Alaska selectbreeding habitat based on landscape-scale featuressuch as hydrological connectivity The explanatoryvariable minimum-distance-to-human-population-center was featured at every scale in the statewidemodels providing evidence that loons prefer tosituate nests on lakes further from humandisturbance A lake habitat selection study forwaterbirds in Canada also found that loons prefer
lakes that are farther from human activity or havemore forested land within a 500-m zone (Found etal 2008)
Effects of scale on Common Loon habitatassociations
Another of our objectives was to investigatewhether Common Loon selects breeding habitat atmultiple scales and to determine which scales are
Avian Conservation and Ecology 6(1) 4httpwwwace-ecoorgvol6iss1art4
Table 6 Summary of results for ecoregion 2 (New Hampshire-Vermont Upland) habitat models with theirassociated Akaike weights N = 130 lakes Models with empirical support ie ∆iAICc le 2 are indicatedin bold
Model Scale Rsup2 Kdagger Loglikelihood
AICc ∆iAICc Weight wi AUC
9 Catchment 081 8 minus2437 6593 lt 0001 06757 0971
8 Multiscale 083 10 minus2310 6806 213 02331 0973
10 Riparian 075 6 minus2872 7011 418 00834 0952
7 Globalmodel
079 11 minus2595 7613 1020 00041 0963
11 Foraging 073 7 minus3331 7930 1337 00008 0945
12 Nesting 068 7 minus3627 8745 2153 lt 000001 0930
Explanatory variables for each fitted modelDagger
9 Catchment open water 500L (+) road 500L (minus) islands (+) pH (+) elevation (+) clarity (+)agricultural 500L (minus)
8 Multiscale open water 150L (+) open water 500N (+) islands (+) clarity( +) road density 500L (minus)road density 150N (minus) distance to loon (minus) forest 150N (minus) wetland 150N (minus)
10 Riparian open water 150L (+) islands (+) distance to loon (minus) elevation (+) clarity (+)
7 Globalmodel
open water 150L (+) islands (+) distance to loon (minus) elevation (+) pH (+) clarity (+)agricultural 500L (minus) open water 500L (+) road density 500L (minus) forest 500 (minus)
11 Foraging open water 500N (+) agricultural 500N (minus) clarity (+) elevation (+) lake size (+)
12 Nesting road density 150N (minus) forest 150N (minus) wetland 150N (minus) elevation (+) lake size (+) flushingrate (minus)
Composite model Nest presence = minus22579 + 3179 (islands) + 1047 (clarity) + 0004 (elevation) + 0287 (open water150L) + 0405 (open water 500L) + 01064 (open water 500N) + 272 (pH) minus 0158 (road density 500L) minus 0362 (distanceto loon) minus 0314 (agricultural 500L) minus 0086 (forest 150N) minus 0079 (wetland 150N) minus 0065 (road density 150N)
daggerK indicates the total number of parameters ie the intercept and explanatory variablesDagger(+) = positive association (minus) = negative association L = lake scale N = nest scale
most important Using information theoreticstatistics the multiscale models for two of the threeecoregions were designated the best approximatingmodels and had substantial empirical support in allthree ecoregions Distinct differences are apparentwhen comparing models across ecoregions (Tables4 5 and 6) Loons in New Hampshire appear to be
selecting breeding habitat differently based onphysiographic ecoregion and at multiple scalesThese differences may be a reflection of theoccurrence of different environmental conditionsand ranges of variables in the three different regionsIn the Northern White Mountain ecoregion loonsare selecting breeding territories on the basis of lake
Avian Conservation and Ecology 6(1) 4httpwwwace-ecoorgvol6iss1art4
Table 7 Summary of results for New Hampshire statewide habitat models with their associated Akaikeweights N = 322 lakes Models with empirical support ie ∆iAICc le 2 are indicated in bold
Model Scale Rsup2 Kdagger Log likelihood AICc ∆iAICc Weight wi AUC
22 Riparian 065 8 minus8615 188764 000 08315 0926
21 Catchment 064 8 minus8843 193315 455 00854 0921
23 Foraging 063 7 minus8996 194269 561 00504 0919
19 Global model 070 15 minus8287 197304 854 00115 0941
24 Nesting 062 7 minus9192 198196 954 00071 0914
20 Multiscale 065 8 minus9365 203769 1501 00005 0926
Explanatory variables for each fitted modelDagger
22 Riparian open water 150L (+) elevation (+) islands (+) clarity (+) distance tohuman population (+) distance to loon (minus) road density 150L (minus)
21 Catchment distance to loon (minus) open water 500L (+) road density 500L (minus) elevation (+)lake size (+) clarity (+) distance to human population (+)
23 Foraging distance to loon (minus) open water 500N (+) elevation (+) lake size (+) clarity(+) distance to human population (+)
19 Global model open water 500L (minus) road density 500L (minus) road density 150N (minus) open water500N (+) road density 150L (minus) open water 150L (+) islands (+) distance toloon (minus) elevation (+) lake size (+) pH (+) phosphorous (minus) clarity (+)distance to human population (+)
24 Nesting distance to loon (minus) road density 150N (minus) elevation (+) lake size (+) clarity(+) distance to human population (+)
20 Multiscale distance to loon (minus) open water 500N (+) road density 150L (minus) elevation (+)lake size (+) clarity (+) distance to human population (+)
Statewide model Nest presence = minus7328 + 0115 (open water 150L) + 0001 (elevation) + 1067 (islands) + 0595 (clarity)+ 0211 (distance to human population) minus 0233 (distance to loon) minus 0033 (road density 150 L)
daggerK indicates the total number of parameters ie the intercept and explanatory variablesDagger(+) = positive association (minus) = negative association L = lake scale N = nest scale
size and the amount of open water surrounding thenest (eg island nest sites) In this ecoregion therewas no distinction between loon presence andabsence lakes based on human-altered variablessuch as road density and developed land or waterquality variables associated with human activitiesThe Northern White Mountain ecoregion has lowerroad densities surrounding the lakes and a less
human-dominated landscape in general Thereforethe loonsrsquo apparent selection based on a few lakemorphological factors may be more a reflection ofthe general environmental conditions and lack ofhuman-altered variables to select against It is alsointeresting to note that loons in this northernecoregion do not appear to be using the presence ofother loons on nearby lakes as a habitat selection
Avian Conservation and Ecology 6(1) 4httpwwwace-ecoorgvol6iss1art4
factor as is the case in the two more southerlyecoregions
The results for the Northern White Mountainecoregion suggest that prior to human alteration ofthe landscape loons may have chosen breedinghabitat based primarily on lake morphologicalfactors such as lake size and the amount of openwater surrounding the nest The catchment riparianforaging and nest scale-based models within theNorthern White Mountain ecoregion includeinformation describing the selection of loonbreeding habitat (Table 4) Three of these final fittedsingle-scale models had explanatory variables incommon (ie lake size) and were combined in themultiscale model for this ecoregion to determine thebest approximating model given the data set basedon the model probability Akaike weights wi (Table4) However using evidence ratios (Burnham andAnderson 2002) to compare the two best modelsthe best model (model 1) has only 19 times theweight of evidence relative to the second-best model(model 4) This relatively weak support for any ofthe models being the best model suggests that thesemodels are good candidates for model averaging ormultimodel inference Model averaging increasesparameter estimate precision and reduces biasassociated with model selection especially when allof the models have substantial support and areclosely related as in ecoregion 1
In the southwestern New Hampshire-VermontUpland loons appear to be avoiding human-alteredlandscapes such as those with high road density andgreater areas of agriculture (Table 6) This regionof New Hampshire contains the highest percentageof prime agricultural soils in the state and hasexperienced the highest amount of agriculturalconversion to developed land in the state over the5-yr period from 1997 to 2002 (Society for theProtection of New Hampshire Forests 2005) Withinthis ecoregion loons are selecting lakes with moreislands higher water clarity and more open watersurrounding the lakes and that are nearby otherlakes with loons present The catchment-scalemodel describing features within a 500-m zone ofthe lake best describes the data in this region (model9 Table 6) the only other model that has substantialempirical support for describing this data set is themultiscale model (model 8 Table 6) Thecatchment-scale model differs from the multiscalemodel by identifying positive associations of loonswith pH (an indicator of fishprey habitat) and lakeelevation and a negative association of loons with
agricultural land within 500 m of the lake Insteadof relying on a single best model for this ecoregionwe used model averaging to combine these twohighest ranking models to obtain robust estimatesof model parameters reduce model selection biasand account for model selection uncertainty(Johnson and Omland 2004) Based on the modelaveraged results and using odds ratios to identifyinfluential factors in this region islands pH andwater clarity appear to be the most influential habitatfeatures (Table 8)
Loons in the southeastern Southern New EnglandCoastal Hills and Plain appear to be selectingbreeding habitat similarly across all scales based ona few key elements larger lakes at increasingelevations with lower levels of phosphorous nearbyother lakes with loons (Table 5) Other studies havefound that loons avoid lakes with higherphosphorous and primary productivity (Blair 1992)which can reduce water clarity Total phosphoruswhich is associated with anthropogenic activitiesappears to be an important avoidance factor forloons selecting breeding habitat at multiple scalesbased on the multiscale and nesting-scale modelswhich are the two highest-ranking models for thisregion The two most influential factors in thisregion appear to be lake size and water clarity basedon odds ratio estimates (Table 8)
The natural arrangement of lakes in NewHampshire especially in the southeastern portionof the state (referred to as the Lakes Region) is ofparticular concern because this area has the fastestrate of human population change in NewHampshire The entire state population is projectedto grow by 358000 between 2000 and 2025 withan estimated 80 of that growth in the foursoutheastern counties of New Hampshire along theInterstate Highway 89 corridor and in the LakesRegion (Society for Protection of New HampshireForests 2005) Loons are responding to human-induced pressures on these lakes and across the stateby selecting against anthropogenic features such asroad density total phosphorous and conductivitydeveloped and agricultural lands and humanpopulation centers
CONCLUSION
Our results support the increasing evidence formultiscale habitat associations most commonlyfound in avian species (Gutzwiller and Anderson
Avian Conservation and Ecology 6(1) 4httpwwwace-ecoorgvol6iss1art4
Table 8 Model averaged parameter estimates and odds ratio estimates with confidence intervals forecoregional composite models and the statewide model These parameters constitute the final averagedmodels for each ecoregion and may be used directly to predict Common Loon nest presence regionally andthroughout the state of New Hampshire
Region Variable Theta SE Odds ratio 95 Wald confidence limits
Ecoregion 1 Northern White Mountain
Intercept minus8655 0704
Lake size 3127 0096 6935 0934 51509
Open water 500 nest 1570 0034 1482 1066 2062
Ecoregion 2 New Hampshire-Vermont Upland
Intercept minus22579 10485
Islands 3179 1120 18045 2760 117970
Clarity 1047 0349 2952 1500 5810
Elevation 0004 0002 1004 1000 1007
Open water 150 lake 0287 0136 1383 1153 1658
Open water 500 lake 0405 01145 1499 1198 1877
Open water 500 nest 01064 00485 0890 0810 0979
pH 272 10139 15195 2083 110844
Road density 500 lake minus0158 0064 0880 0789 0983
Distance to loon lake minus03619 0129 0691 0491 0971
Agricultural 500 lake minus03143 01489 0730 0545 0978
Forest 150 nest minus00856 00346 0913 0853 0977
Wetland 150 nest minus00793 00346 0920 0859 0985
Road density 150 nest minus00647 00286 0927 0877 0980
Ecoregion 3 Southern New England Coastal Hills and Plain
Intercept minus4550 0217
Elevation 0006 0001 1004 1000 1009
Lake size 1180 0158 3254 1640 6456
Clarity 01714 02835 1187 0681 2069
Distance to loon lake minus02183 0124 1000 1000 1000
Phosphorous minus179503 3190 lt 0001 lt 0001 lt 0001
(cond)
Avian Conservation and Ecology 6(1) 4httpwwwace-ecoorgvol6iss1art4
New Hampshire Statewide
Intercept minus73821 12467
Open water 150 lake 01150 00200 1122 1079 1167
Elevation 0001 0001 1001 1000 1002
Islands 10674 04210 2908 1274 6637
Clarity 05948 01503 1813 1350 2434
Distance to population center 02105 00797 1234 1056 1443
Distance to loon lake minus02331 00732 0792 0686 0914
Road density 150 lake minus00327 00148 0968 0940 0996
1987 Wiens et al 1987 Saab 1999 Meyer et al2002 Graf et al 2005 Kristan 2006 Lawler andEdwards 2006 Thogmartin 2007) The multiscalemodels within each ecoregion have substantialempirical support in describing breeding habitatsuggesting that Common Loon in New Hampshireis responding to environmental cues at scalesranging from broad catchment to finer riparian areassurrounding lakes as well as within lakes at thenesting scale Loons also appear to be selectinghabitat differently across the ecoregions based onthe varying landscape conditions they encounteracross New Hampshire This differential selectionof breeding habitat across ecoregions providesinformation for prioritizing conservation andfocusing management efforts in New HampshireConservation efforts in the northern ecoregionshould be focused on preserving the relatively lowerlevels of human activity and disturbance pressuressurrounding these northern lakes by preventingincreases in road density and construction nearlakes especially within the immediate shoreline oflarger lakes Loon conservation and managementactivities in the two southern ecoregions shouldfocus on reducing the effects of already existinghuman disturbances on water quality by mitigatingsources of phosphorous that can also directly affectclarity Other activities in these regions shouldinclude the prioritization for protection of high-quality nesting habitat such as small islands andundisturbed areas of lakes and preventingdevelopment in critical loon habitat Our resultssuggest that conservation strategies for CommonLoon should also consider environmental
influences beyond the immediate lake or riparianscale as the analysis demonstrates that loons arealso responding to landscape-level and catchment-scale conditions surrounding lakes
Responses to this article can be read online athttpwwwace-ecoorgvol6iss1art4responses
Acknowledgments
We thank the many people who share our interest inCommon Loon research and conservation Weappreciate the statistical assistance and advice ofDr James Heltshe and helpful advice fromreviewers of early drafts Drs James Lake BryanMilstead and Rick McKinney as well as that of theanonymous reviewers who contributed to the finalversion of this manuscript This is contributionnumber AED-10-048 of the Atlantic EcologyDivision National Health and EnvironmentalEffects Research Laboratory Office of Researchand Development US Environmental ProtectionAgency Although the research described in thiscontribution has been funded wholly by the USEnvironmental Protection Agency it has not beensubjected to Agency-level review Therefore it doesnot necessarily reflect the views of the AgencyMention of trade names products or services doesnot constitute endorsement or recommendation foruse
Avian Conservation and Ecology 6(1) 4httpwwwace-ecoorgvol6iss1art4
LITERATURE CITED
Agresti A 1996 An introduction to categoricaldata analysisWiley New York New York USA
Alvo R D J T Hussell and M Berrill 1988 Thebreeding success of common loons (Gavia immer)in relation to alkalinity and other lake characteristicsin Ontario Canadian Journal of Zoology 66(3)746-752
Anderson D R 2008 Model based inferences inthe life sciences a primer on evidence SpringerNew York New York USA doi101007978-0-387-74075-1
Anderson J R E E Hardy J T Roach and R EWitmer 1976 A land use and land coverclassification system for use with remote sensordata Geological Survey Professional Paper 964 US Geological Survey Washington DC USA
Austin M 2007 Species distribution models andecological theory a critical assessment and somepossible new approaches Ecological Modelling 200(1-2)1-19 doi101016jecolmodel200607005
Barr J F 1986 Population dynamics of thecommon loon associated with mercury-contaminatedwaters in northwestern Ontario Occasional PaperNumber 56 Canadian Wildlife Service OttawaCanada
Battin J and J J Lawler 2006 Cross-scalecorrelations and the design of avian-habitatselection studies Condor 10859-70 doi1016500010-5422(2006)108[0059CCATDA]20CO2
Blair R B 1992 Lake features water quality andthe summer distribution of Common Loons in NewHampshire Journal of Field Ornithology 63(1)1-9
Burgess N M D C Evers and J D Kaplan 2005Mercury and other contaminants in Common Loonsbreeding in Atlantic Canada Ecotoxicology 14(1-2)241-252 doi101007s10646-004-6271-0
Burnham K P and D R Anderson 2002 Modelselection and multimodel inference a practicalinformation-theoretic approach Second editionSpringer New York New York USA
Cox D R and E J Snell 1989 Analysis of binarydata Second edition Chapman amp Hall LondonUK
Cushman S A and K McGarigal 2002Hierarchical multi-scale decomposition of species-environment relationships Landscape Ecology 17(7)637-646 doi101023A1021571603605
Cushman S A and K McGarigal 2004Hierarchical analysis of forest bird species-environment relationships in the Oregon CoastRange Ecological Applications 14(4)1090-1105 doi10189003-5131
Deppe J L and J T Rotenberry 2008 Scale-dependent habitat use by fall migratory birdsvegetation structure floristics and geographyEcological Monographs 78(3)461-487 doi10189007-01631
Desorbo C R K M Taylor D E Kramer J FairJ H Cooley Jr D C Evers W Hanson H SVogel and J L Atwood 2007 Reproductiveadvantages for Common Loons using rafts Journalof Wildlife Management 71(4)1206-1213 doi1021932006-422
Driscoll M J L T Donovan R Mickey AHoward and K K Fleming 2005 Determinants ofwood thrush nest success a multi-scale modelselection approach Journal of Wildlife Management 69(2)699-709 doi1021930022-541X(2005)069[0699DOWTNS]20CO2
Earnst S L R Platte and L Bond 2006 Alandscape-scale model of yellow-billed loon (Gaviaadamsii) habitat preferences in northern AlaskaHydrobiologia 567(1)227-236 doi101007s10750-006-0042-2
Edwards T C Jr G G Moisen T S Frescinoand J J Lawler 2003 Modeling multipleecological scales to link landscape theory to wildlifeconservation Pages 153-172 in J A Bissonette andI Storch editors Landscape ecology and resourcemanagement linking theory with practice IslandPress Washington DC USA
Environmental Systems Research Institute 2009ArcInfo geographic information system (GIS)software Version 91 Redlands California USA
Avian Conservation and Ecology 6(1) 4httpwwwace-ecoorgvol6iss1art4
Estrella A 1998 A new measure of fit for equationswith dichotomous dependent variables Journal ofBusiness and Economic Statistics 16(2)198-205 doi1023071392575
Evers D C 2001 Common Loon populationstudies continental mercury patterns and breedingterritory philopatry Dissertation University ofMinnesota St Paul Minnesota USA
Evers D C 2007 Status assessment andconservation plan for the Common Loon (Gaviaimmer) in North America BRI Report 2007-20 US Fish and Wildlife Service Hadley MassachusettsUSA
Evers D C L J Savoy C R DeSorbo D EYates W Hanson K M Taylor L Siegel J HCooley M S Bank A Major K Munney BMower H S Vogel N Schoch M Pokras M WGoodale and J Fair 2008 Adverse effects fromenvironmental mercury loads on breeding commonloons Ecotoxicology 17(2)69-81 doi101007s10646-007-0168-7
Fielding A H and J F Bell 1997 A review ofmethods for the assessment of prediction errors inconservation presenceabsence models EnvironmentalConservation 24(1)38-49 doi101017S0376892997000088
Fortin M-J and M R T Dale 2005 Spatialanalysis a guide for ecologists CambridgeUniversity Press Cambridge UK
Found C S M Webb and M S Boyce 2008Selection of lake habitats by waterbirds in the borealtransition zone of northeastern Alberta CanadianJournal of Zoology 86(4)277-285 doi101139Z07-137
Fraterrigo J M and J A Downing 2008 Theinfluence of land use on lake nutrients varies withwatershed transport capacity Ecosystems 11(7)1021-1034 doi101007s10021-008-9176-6
Freemark K E D Bert and M A Villard 2002Patch- landscape- and regional-scale effects onbiota Pages 58-83 in K J Gutzwiller editorApplying landscape ecology in biologicalconservation Springer New York New YorkUSA
Gamma Design Software 2001 GS+ geostatisticsfor the environmental sciences PlainwellMichigan USA
Garshellis D L 2000 Delusions in habitatevaluation measuring use selection andimportance Pages 111-153 in L Boitani and T KFuller editors Research techniques in animalecology controversies and consequences ColumbiaUniversity Press New York New York USA
Goldstein H 2003 Multilevel statistical models Third edition Hodder Arnold London UK
Graf R F K Bollmann W Suter and HBugmann 2005 The importance of spatial scale inhabitat models Capercaillie in the Swiss AlpsLandscape Ecology 20(6)703-717 doi101007s10980-005-0063-7
Graham M H 2003 Confronting multicollinearityin ecological multiple regression Ecology 842809-2815 doi10189002-3114
Gutzwiller K J and S H Anderson 1987Multiscale associations between cavity-nestingbirds and features of Wyoming streamsidewoodlands Condor 89534-548 doi1023071368643
Hames R S J D Lowe S Barker Swarthout andK V Rosenberg 2006 Understanding the risk toneotropical migrant bird species of multiple human-caused stressors elucidating processes behindpatterns Ecology and Society 11(1) 24 [online]URL httpwwwecologyandsocietyorgvol11iss1art24
Hammond C A M 2008 A demographic andlandscape analysis for common loons in northwestMontana Thesis University of Montana MissoulaMontana USA [online] URL httpetdlibumteduthesesavailableetd-04242008-130448
Heimberger M D Euler and J Barr 1983 Theimpact of cottage development on Common Loonreproductive success in central Ontario WilsonBulletin 95(3)431-439
Heinz H T Waldhoumlr and M Mittlboumlck 2005Careful use of pseudo R-squared measures inepidemiological studies Statistics in Medicine 24(18)2867-2872 doi101002sim2168
Avian Conservation and Ecology 6(1) 4httpwwwace-ecoorgvol6iss1art4
Hollister J W P V August J F Paul and H AWalker 2008 Predicting estuarine sediment metalconcentrations and inferred ecological conditionsan information theoretic approach Journal ofEnvironmental Quality 37(1)234-244 doi102134jeq20070105
Hosmer D W and S Lemeshow 2000 Appliedlogistic regression analysis Second edition WileyNew York New York USA doi1010020471722146
Hutchinson G E 1957 A treatise of limnologyVolume 1 geography physics and chemistry WileyNew York New York USA
Johnson J B and K S Omland 2004 Modelselection in ecology and evolution Trends inEcology and Evolution 19(2)101-108 doi101016jtree200310013
Johnson M D 2007 Measuring habitat quality areview Condor 109(3)489-504 doi10165083471
Johnston C A and B A Shmagin 2006 Scaleissues in lake-watershed interactions assessingshoreline development impacts on water clarityPages 297-313 in J Wu K B Jones H Li and OL Loucks editors Scaling and uncertainty analysisin ecology methods and applications SpringerDordrecht The Netherlands
Jung R E 1991 Effects of human activities andlake characteristics on the behavior and breedingsuccess of Common Loons Passenger Pigeon 53207-218
Kamman N C N M Burgess C T Driscoll HA Simonin W Goodale J Linehan R EstabrookM Hutcheson A Major A M Scheuhammer andD A Scruton 2005 Mercury in freshwater fish ofnortheast North America a geographic perspectivebased on fish tissue monitoring databasesEcotoxicology 14(1-2)163-180 doi101007s10646-004-6267-9
Kristan W B III 2006 Sources and expectationsfor hierarchical structure in bird-habitat associationsCondor 108(1)5-12 doi1016500010-5422(2006)108[0005SAEFHS]20CO2
Kristan W B III and J M Scott 2006Hierarchical models for avian ecologists Condor 108(1)1-4 doi1016500010-5422(2006)108[0001HMFAE]20CO2
Kuhn-Hines A 2008 A multiscale approach tobreeding habitat model development and evaluationfor the common loon Gavia immer in NewHampshire USA ETD Collection for University ofRhode Island Paper AAI3346850 [online] URL httpdigitalcommonsuriedudissertationsAAI3346850
Lawler J J and T C Edwards Jr 2006 Avariance-decomposition approach to investigatingmultiscale habitat associations Condor 108(1)47-58 doi1016500010-5422(2006)108[0047AVATIM]20CO2
Li X D Li Z Ma and D Schneider 2006 Nestsite use by crested ibis dependence of a multifactormodel on spatial scale Landscape Ecology 21(8)1207-1216 doi101007s10980-006-0021-z
Loon Preservation Committee 2004 Fieldcollection protocol for surveying and managingCommon Loons in New Hampshire LoonPreservation Committee Moultonborough NewHampshire USA
Loon Preservation Committee 2005 Meeting thechallenge thirty years of preserving loons and theirhabitats in New Hampshire Loon PreservationCommittee Moultonborough New HampshireUSA
Luck G W 2002 The habitat requirements of therufous treecreeper (Climacteris rufa) 1 Preferentialhabitat use demonstrated at multiple spatial scalesBiological Conservation 105(3)383-394 doi101016S0006-3207(01)00222-1
MacKenzie D I 2005 Was it there Dealing withimperfect detection for species presenceabsencedata Australian and New Zealand Journal ofStatistics 47(1)65-74 doi101111j1467-842X200500372x
MacKenzie D I J D Nichols J E Hines M GKnutson and A B Franklin 2003 Estimating siteoccupancy colonization and local extinction whena species is detected imperfectly Ecology 84(8)2200-2207 doi10189002-3090
Avian Conservation and Ecology 6(1) 4httpwwwace-ecoorgvol6iss1art4
Martin S L and P A Soranno 2006 Lakelandscape position relationships to hydrologicconnectivity and landscape features Limnology andOceanography 51(2)801-814 doi104319lo20065120801
McGarigal K and B J Marks 1995 FRAGSTATSspatial pattern analysis program for quantifyinglandscape structure General Technical ReportPNW-GTR-351 US Department of AgricultureForest Service Washington DC USA
McIntyre J W 1983 Nurseries a consideration ofhabitat requirements during the early chick-rearingperiod in common loons Journal of FieldOrnithology 54(3)247-253
McIntyre J W 1988 The Common Loon spirit ofnorthern lakes University of Minnesota PressMinneapolis Minnesota USA
McIntyre J W and J F Barr 1997 Common loonGavia immer In A Poole and F Gill editors TheBirds of North America 313 Academy of NaturalSciences of Philadelphia and American OrnithologistsUnion Washington DC USA
Menard S 2002 Applied logistic regressionanalysis Second edition Sage PublicationsThousand Oaks California USA
Meyer C B S L Miller and C J Ralph 2002Multi-scale landscape and seascape patternsassociated with marbeled murrelet nesting areas onthe US west coast Landscape Ecology 17(2)95-115 doi101023A1016574928706
Meyer M W 2006 Evaluating the impact ofmultiple stressors on Common Loon populationdemographics-an integrated laboratory and fieldapproach EPA STAR Co-operative AgreementNumber R82-9085 Environmental ProtectionAgency Washington DC USA
Meyer M W D C Evers J J Hartigan and P SRasmussen 1998 Patterns of common loon (Gaviaimmer) mercury exposure reproduction andsurvival in Wisconsin USA EnvironmentalToxicology and Chemistry 17(2)184-190
Meyer M W and J E Woodford 1996Enhancing osprey (Pandion haliaetus) and commonloon (Gavia immer) reproduction on impacted
Wisconsin waterways Final report US Fish andWildlife Service Washington DC USA
Moran P A P 1950 Notes on continuousstochastic phenomena Biometrika 37(1-2)17-23 doi101093biomet371-217
Murtagh P A and P S Pooler 2006 Evaluatingecological indicators lakes in the northeasternUnited States Environmental Monitoring andAssessment 119(1-3)83-96 doi101007s10661-005-9011-x
New Hampshire Department of EnvironmentalServices 2005 Water quality data survey summaryfor New Hampshire lakes and ponds NewHampshire Department of Environmental ServicesNew Hampshire USA [online] URL httpdesnhgovorganizationdivisionswaterwmblakestrophic_summaryhtm
New Hampshire Department of EnvironmentalServices 2006 Community center areas NewHampshire Department of Environmental ServicesNew Hampshire USA [online] URL httpwwwgranitunhedudatadatacatpagescommunitycenterareaspdf
Newbrey J L M A Bozek and N D Niemuth2005 Effects of lake characteristics and humandisturbance on the presence of piscivorous birds innorthern Wisconsin USA Waterbirds 28(4)478-486 doi1016751524-4695(2005)28[478EOLCAH]20CO2
Nocera J J G J Forbes and G R Milton 2008The relevance of local-scale relationships to habitatmanagement and landscape patterns AvianConservation and Ecology - Eacutecologie etconservation des oiseaux 3(1) 4 [online] URL httpwwwace-ecoorgvol3iss1art4
Northeast Loon Study Work Group 2008 [online]URL httpwwwbriloonorgscience-and-conservationcentersNELSWGphp
OrsquoBrien R M 2007 A caution regarding rules ofthumb for variance inflation factors Quality ampQuantity 41(5)673-690 doi101007s11135-006-9018-6
Patton D R 1975 A diversity index for quantifyinghabitat lsquoedgersquo Wildlife Society Bulletin 3171-173
Avian Conservation and Ecology 6(1) 4httpwwwace-ecoorgvol6iss1art4
Penhollow M E and D F Stauffer 2000 Large-scale habitat relationships of neotropical migratorybirds in Virginia Journal of Wildlife Management 64(2)362-373 doi1023073803234
Piper W H C Walcott J N Mager III M PeralaK B Tischler E Harrington A J Turcotte MSchwabenlander and N Banfield 2006 Prospectingin a solitary breeder chick production elicitsterritorial intrusions in common loons BehavioralEcology 17(6)881-888 doi101093behecoarl021
Piper W H C Walcott J N Mager and F JSpilker 2008 Nestsite selection by male loons leadsto sex-biased site familiarity Journal of AnimalEcology 77(2)205-210 doi101111j1365-2656200701334x
Rimmer C C 1992 Common Loon Gavia immer Pages 3-30 in K J Schneider and D M Penceeditors Migratory nongame birds managementconcern in the Northeast US Fish and WildlifeService Newton Corner Massachusetts USA
Riitters K H R V OrsquoNeill and K B Jones 1997Assessing habitat suitability at multiple scales alandscape-level approach Biological Conservation 81(1-2)191-202 doi101016S0006-3207(96)00145-0
Saab V 1999 Importance of spatial scale to habitatuse by breeding birds in riparian forests ahierarchical analysis Ecological Applications 9(1)135-151 doi1018901051-0761(1999)009[0135IOSSTH]20CO2
SAS Institute Inc 2003 SAS 91 Cary NorthCarolina USA
Scott J M P J Heglund M L Morrison J BHaufler M G Raphael W A Wall and F BSamson editors 2002 Predicting speciesoccurrences issues of accuracy and scale IslandPress Washington DC USA
Society for Protection of New Hampshire Forests2005 New Hampshirersquos changing landscapepopulation growth and land use changes Societyfor Protection of New Hampshire Forests [online]URL httpwwwforestsocietyorgresearchresearch-projectsasp
Soranno P A K E Webster K S Cheruvelil andM T Bremigan 2009 The lake landscape-contextframework linking aquatic connections terrestrialfeatures and human effects at multiple scalesVerhandlungen des Internationalen Verein Limnologie 30(5)695-700
Sperduto D D and W F Nichols 2004 Naturalcommunities of New Hampshire New HampshireNatural Heritage Bureau Concord New HampshireUSA and University of New HampshireCooperative Extension Durham New HampshireUSA
SPSS Inc 1999 SPSS 100 Chicago Illinois USA
Stauffer H B C J Ralph and S L Miller 2004Ranking habitat for marbled murrelets a newconservation approach for species with uncertaindetection Ecological Applications 14(5)1374-1383doi10189003-5068
Stein B A and S R Flack 1997 1997 speciesreport card the status of US plants and animals The Nature Conservancy Arlington VirginiaUSA [online] URL httpwwwnatureserveorglibrary1997speciesreportcardpdf
Strauss B and R Biedermann 2007 Evaluatingtemporal and spatial generality How valid arespecies-habitat relationship models EcologicalModeling 204104-114 doi101016jecolmodel200612027
Strong P I V and J A Bissonette 1989 Feedingand chick-rearing areas of common loons Journalof Wildlife Management 5372-76 doi1023073801308
Strong P I V J A Bissonette and J S Fair 1987Reuse of nesting and nursery areas by CommonLoons Journal of Wildlife Management 51123-127doi1023073801642
Taylor K M and H S Vogel 2000 NewHampshire report Pages 110-113 in J McIntyre andD C Evers editors Loons old history and newfindings Proceedings symposium 1997 meetingAmerican Ornithologists Union North AmericanLoon Fund Holderness New Hampshire USA
Thogmartin W E 2007 Effects at the landscapescale may constrain habitat relations at finer scales
Avian Conservation and Ecology 6(1) 4httpwwwace-ecoorgvol6iss1art4
Avian Conservation and Ecology - Eacutecologie etconservation des oiseaux 2(2) 6 [online] URL URL httpwwwace-ecoorgvol2iss2art6
Thogmartin W E and M G Knutson 2007Scaling local species-habitat relations to the largerlandscape with a hierarchical spatial count modelLandscape Ecology 22(1)61-75 doi101007s10980-006-9005-2
Thompson C M and K McGarigal 2002 Theinfluence of research scale on bald eagle habitatselection along the lower Hudson River New York(USA) Landscape Ecology 17(6)569-586 doi101023A1021501231182
Titus J R and L W VanDruff 1981 Responseof the common loon to recreational pressure in theBoundary Waters Canoe Area northeasternMinnesota Wildlife Monographs 791-60
Trocki C L and P W C Paton 2006 Assessinghabitat selection by foraging egrets in salt marshesat multiple spatial scales Wetlands 26(2)307-312 doi1016720277-5212(2006)26[307AHSBFE]20CO2
Turner M G 2005 Landscape ecology What isthe state of the science Annual Review of EcologyEvolution and Systematics 36319-344 doi101146annurevecolsys36102003152614
Tyre A J B Tenhumberg S A Field D NiejalkeK Parris and H P Possingham 2003 Improvingprecision and reducing bias in biological surveysestimating false-negative error rates EcologicalApplications 13(6)1790-1801 doi10189002-5078
Vermeer K 1973 Some aspects of the nestingrequirements of common loons in Alberta WilsonBulletin 85429-435
Wiens J A 1989 Spatial scaling in ecologyFunctional Ecology 3385-397 doi1023072389612
Wiens J A 2002 Riverine landscapes takinglandscape ecology into the water FreshwaterBiology 47(4)501-515 doi101046j1365-2427200200887x
Wiens J A J T Rotenberry and B van Horne1987 Habitat occupancy patterns of North
American shrubsteppe birds the effects of spatialscale Oikos 48132-147 doi1023073565849
Wilcove D S D Rothstein J Dubow A Phillipsand E Losos 1998 Quantifying threats to imperiledspecies in the United States Bioscience 48607-615doi1023071313420
Wu J 2004 Effects of changing scale on landscapepattern analysis scaling relations LandscapeEcology 19(2)125-138 doi101023BLAND000002171140074ae
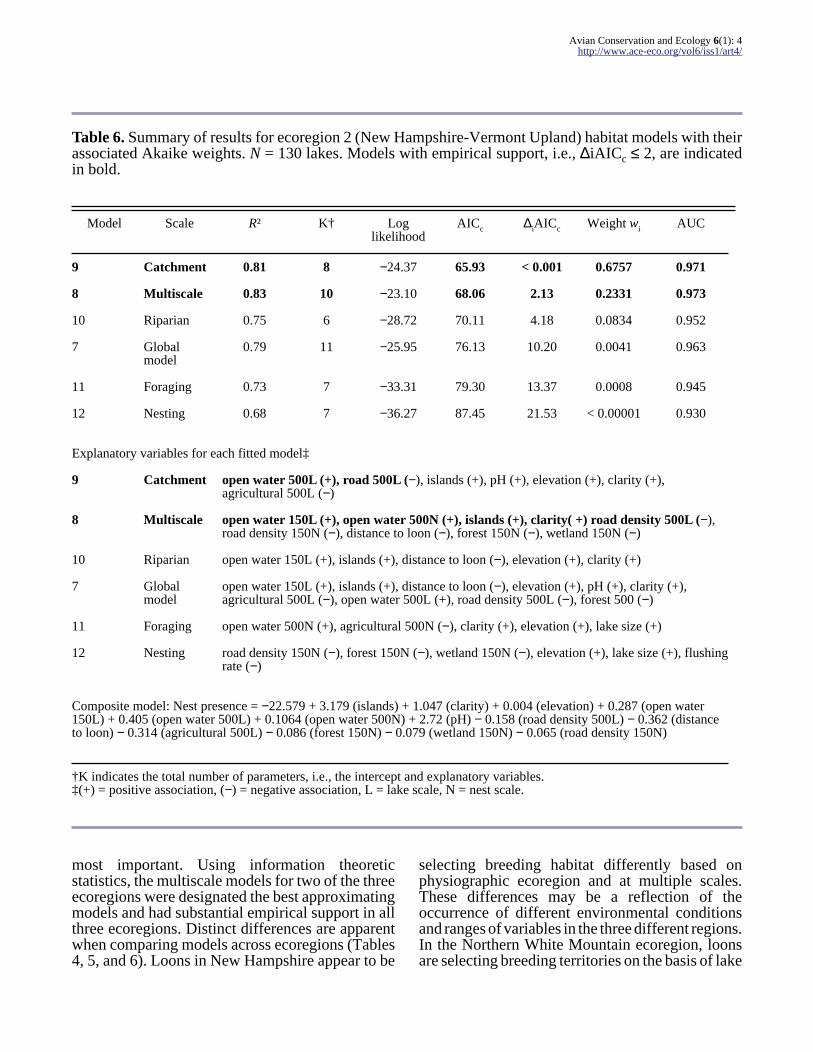
Avian Conservation and Ecology 6(1) 4httpwwwace-ecoorgvol6iss1art4
Table 6 Summary of results for ecoregion 2 (New Hampshire-Vermont Upland) habitat models with theirassociated Akaike weights N = 130 lakes Models with empirical support ie ∆iAICc le 2 are indicatedin bold
Model Scale Rsup2 Kdagger Loglikelihood
AICc ∆iAICc Weight wi AUC
9 Catchment 081 8 minus2437 6593 lt 0001 06757 0971
8 Multiscale 083 10 minus2310 6806 213 02331 0973
10 Riparian 075 6 minus2872 7011 418 00834 0952
7 Globalmodel
079 11 minus2595 7613 1020 00041 0963
11 Foraging 073 7 minus3331 7930 1337 00008 0945
12 Nesting 068 7 minus3627 8745 2153 lt 000001 0930
Explanatory variables for each fitted modelDagger
9 Catchment open water 500L (+) road 500L (minus) islands (+) pH (+) elevation (+) clarity (+)agricultural 500L (minus)
8 Multiscale open water 150L (+) open water 500N (+) islands (+) clarity( +) road density 500L (minus)road density 150N (minus) distance to loon (minus) forest 150N (minus) wetland 150N (minus)
10 Riparian open water 150L (+) islands (+) distance to loon (minus) elevation (+) clarity (+)
7 Globalmodel
open water 150L (+) islands (+) distance to loon (minus) elevation (+) pH (+) clarity (+)agricultural 500L (minus) open water 500L (+) road density 500L (minus) forest 500 (minus)
11 Foraging open water 500N (+) agricultural 500N (minus) clarity (+) elevation (+) lake size (+)
12 Nesting road density 150N (minus) forest 150N (minus) wetland 150N (minus) elevation (+) lake size (+) flushingrate (minus)
Composite model Nest presence = minus22579 + 3179 (islands) + 1047 (clarity) + 0004 (elevation) + 0287 (open water150L) + 0405 (open water 500L) + 01064 (open water 500N) + 272 (pH) minus 0158 (road density 500L) minus 0362 (distanceto loon) minus 0314 (agricultural 500L) minus 0086 (forest 150N) minus 0079 (wetland 150N) minus 0065 (road density 150N)
daggerK indicates the total number of parameters ie the intercept and explanatory variablesDagger(+) = positive association (minus) = negative association L = lake scale N = nest scale
most important Using information theoreticstatistics the multiscale models for two of the threeecoregions were designated the best approximatingmodels and had substantial empirical support in allthree ecoregions Distinct differences are apparentwhen comparing models across ecoregions (Tables4 5 and 6) Loons in New Hampshire appear to be
selecting breeding habitat differently based onphysiographic ecoregion and at multiple scalesThese differences may be a reflection of theoccurrence of different environmental conditionsand ranges of variables in the three different regionsIn the Northern White Mountain ecoregion loonsare selecting breeding territories on the basis of lake
Avian Conservation and Ecology 6(1) 4httpwwwace-ecoorgvol6iss1art4
Table 7 Summary of results for New Hampshire statewide habitat models with their associated Akaikeweights N = 322 lakes Models with empirical support ie ∆iAICc le 2 are indicated in bold
Model Scale Rsup2 Kdagger Log likelihood AICc ∆iAICc Weight wi AUC
22 Riparian 065 8 minus8615 188764 000 08315 0926
21 Catchment 064 8 minus8843 193315 455 00854 0921
23 Foraging 063 7 minus8996 194269 561 00504 0919
19 Global model 070 15 minus8287 197304 854 00115 0941
24 Nesting 062 7 minus9192 198196 954 00071 0914
20 Multiscale 065 8 minus9365 203769 1501 00005 0926
Explanatory variables for each fitted modelDagger
22 Riparian open water 150L (+) elevation (+) islands (+) clarity (+) distance tohuman population (+) distance to loon (minus) road density 150L (minus)
21 Catchment distance to loon (minus) open water 500L (+) road density 500L (minus) elevation (+)lake size (+) clarity (+) distance to human population (+)
23 Foraging distance to loon (minus) open water 500N (+) elevation (+) lake size (+) clarity(+) distance to human population (+)
19 Global model open water 500L (minus) road density 500L (minus) road density 150N (minus) open water500N (+) road density 150L (minus) open water 150L (+) islands (+) distance toloon (minus) elevation (+) lake size (+) pH (+) phosphorous (minus) clarity (+)distance to human population (+)
24 Nesting distance to loon (minus) road density 150N (minus) elevation (+) lake size (+) clarity(+) distance to human population (+)
20 Multiscale distance to loon (minus) open water 500N (+) road density 150L (minus) elevation (+)lake size (+) clarity (+) distance to human population (+)
Statewide model Nest presence = minus7328 + 0115 (open water 150L) + 0001 (elevation) + 1067 (islands) + 0595 (clarity)+ 0211 (distance to human population) minus 0233 (distance to loon) minus 0033 (road density 150 L)
daggerK indicates the total number of parameters ie the intercept and explanatory variablesDagger(+) = positive association (minus) = negative association L = lake scale N = nest scale
size and the amount of open water surrounding thenest (eg island nest sites) In this ecoregion therewas no distinction between loon presence andabsence lakes based on human-altered variablessuch as road density and developed land or waterquality variables associated with human activitiesThe Northern White Mountain ecoregion has lowerroad densities surrounding the lakes and a less
human-dominated landscape in general Thereforethe loonsrsquo apparent selection based on a few lakemorphological factors may be more a reflection ofthe general environmental conditions and lack ofhuman-altered variables to select against It is alsointeresting to note that loons in this northernecoregion do not appear to be using the presence ofother loons on nearby lakes as a habitat selection
Avian Conservation and Ecology 6(1) 4httpwwwace-ecoorgvol6iss1art4
factor as is the case in the two more southerlyecoregions
The results for the Northern White Mountainecoregion suggest that prior to human alteration ofthe landscape loons may have chosen breedinghabitat based primarily on lake morphologicalfactors such as lake size and the amount of openwater surrounding the nest The catchment riparianforaging and nest scale-based models within theNorthern White Mountain ecoregion includeinformation describing the selection of loonbreeding habitat (Table 4) Three of these final fittedsingle-scale models had explanatory variables incommon (ie lake size) and were combined in themultiscale model for this ecoregion to determine thebest approximating model given the data set basedon the model probability Akaike weights wi (Table4) However using evidence ratios (Burnham andAnderson 2002) to compare the two best modelsthe best model (model 1) has only 19 times theweight of evidence relative to the second-best model(model 4) This relatively weak support for any ofthe models being the best model suggests that thesemodels are good candidates for model averaging ormultimodel inference Model averaging increasesparameter estimate precision and reduces biasassociated with model selection especially when allof the models have substantial support and areclosely related as in ecoregion 1
In the southwestern New Hampshire-VermontUpland loons appear to be avoiding human-alteredlandscapes such as those with high road density andgreater areas of agriculture (Table 6) This regionof New Hampshire contains the highest percentageof prime agricultural soils in the state and hasexperienced the highest amount of agriculturalconversion to developed land in the state over the5-yr period from 1997 to 2002 (Society for theProtection of New Hampshire Forests 2005) Withinthis ecoregion loons are selecting lakes with moreislands higher water clarity and more open watersurrounding the lakes and that are nearby otherlakes with loons present The catchment-scalemodel describing features within a 500-m zone ofthe lake best describes the data in this region (model9 Table 6) the only other model that has substantialempirical support for describing this data set is themultiscale model (model 8 Table 6) Thecatchment-scale model differs from the multiscalemodel by identifying positive associations of loonswith pH (an indicator of fishprey habitat) and lakeelevation and a negative association of loons with
agricultural land within 500 m of the lake Insteadof relying on a single best model for this ecoregionwe used model averaging to combine these twohighest ranking models to obtain robust estimatesof model parameters reduce model selection biasand account for model selection uncertainty(Johnson and Omland 2004) Based on the modelaveraged results and using odds ratios to identifyinfluential factors in this region islands pH andwater clarity appear to be the most influential habitatfeatures (Table 8)
Loons in the southeastern Southern New EnglandCoastal Hills and Plain appear to be selectingbreeding habitat similarly across all scales based ona few key elements larger lakes at increasingelevations with lower levels of phosphorous nearbyother lakes with loons (Table 5) Other studies havefound that loons avoid lakes with higherphosphorous and primary productivity (Blair 1992)which can reduce water clarity Total phosphoruswhich is associated with anthropogenic activitiesappears to be an important avoidance factor forloons selecting breeding habitat at multiple scalesbased on the multiscale and nesting-scale modelswhich are the two highest-ranking models for thisregion The two most influential factors in thisregion appear to be lake size and water clarity basedon odds ratio estimates (Table 8)
The natural arrangement of lakes in NewHampshire especially in the southeastern portionof the state (referred to as the Lakes Region) is ofparticular concern because this area has the fastestrate of human population change in NewHampshire The entire state population is projectedto grow by 358000 between 2000 and 2025 withan estimated 80 of that growth in the foursoutheastern counties of New Hampshire along theInterstate Highway 89 corridor and in the LakesRegion (Society for Protection of New HampshireForests 2005) Loons are responding to human-induced pressures on these lakes and across the stateby selecting against anthropogenic features such asroad density total phosphorous and conductivitydeveloped and agricultural lands and humanpopulation centers
CONCLUSION
Our results support the increasing evidence formultiscale habitat associations most commonlyfound in avian species (Gutzwiller and Anderson
Avian Conservation and Ecology 6(1) 4httpwwwace-ecoorgvol6iss1art4
Table 8 Model averaged parameter estimates and odds ratio estimates with confidence intervals forecoregional composite models and the statewide model These parameters constitute the final averagedmodels for each ecoregion and may be used directly to predict Common Loon nest presence regionally andthroughout the state of New Hampshire
Region Variable Theta SE Odds ratio 95 Wald confidence limits
Ecoregion 1 Northern White Mountain
Intercept minus8655 0704
Lake size 3127 0096 6935 0934 51509
Open water 500 nest 1570 0034 1482 1066 2062
Ecoregion 2 New Hampshire-Vermont Upland
Intercept minus22579 10485
Islands 3179 1120 18045 2760 117970
Clarity 1047 0349 2952 1500 5810
Elevation 0004 0002 1004 1000 1007
Open water 150 lake 0287 0136 1383 1153 1658
Open water 500 lake 0405 01145 1499 1198 1877
Open water 500 nest 01064 00485 0890 0810 0979
pH 272 10139 15195 2083 110844
Road density 500 lake minus0158 0064 0880 0789 0983
Distance to loon lake minus03619 0129 0691 0491 0971
Agricultural 500 lake minus03143 01489 0730 0545 0978
Forest 150 nest minus00856 00346 0913 0853 0977
Wetland 150 nest minus00793 00346 0920 0859 0985
Road density 150 nest minus00647 00286 0927 0877 0980
Ecoregion 3 Southern New England Coastal Hills and Plain
Intercept minus4550 0217
Elevation 0006 0001 1004 1000 1009
Lake size 1180 0158 3254 1640 6456
Clarity 01714 02835 1187 0681 2069
Distance to loon lake minus02183 0124 1000 1000 1000
Phosphorous minus179503 3190 lt 0001 lt 0001 lt 0001
(cond)
Avian Conservation and Ecology 6(1) 4httpwwwace-ecoorgvol6iss1art4
New Hampshire Statewide
Intercept minus73821 12467
Open water 150 lake 01150 00200 1122 1079 1167
Elevation 0001 0001 1001 1000 1002
Islands 10674 04210 2908 1274 6637
Clarity 05948 01503 1813 1350 2434
Distance to population center 02105 00797 1234 1056 1443
Distance to loon lake minus02331 00732 0792 0686 0914
Road density 150 lake minus00327 00148 0968 0940 0996
1987 Wiens et al 1987 Saab 1999 Meyer et al2002 Graf et al 2005 Kristan 2006 Lawler andEdwards 2006 Thogmartin 2007) The multiscalemodels within each ecoregion have substantialempirical support in describing breeding habitatsuggesting that Common Loon in New Hampshireis responding to environmental cues at scalesranging from broad catchment to finer riparian areassurrounding lakes as well as within lakes at thenesting scale Loons also appear to be selectinghabitat differently across the ecoregions based onthe varying landscape conditions they encounteracross New Hampshire This differential selectionof breeding habitat across ecoregions providesinformation for prioritizing conservation andfocusing management efforts in New HampshireConservation efforts in the northern ecoregionshould be focused on preserving the relatively lowerlevels of human activity and disturbance pressuressurrounding these northern lakes by preventingincreases in road density and construction nearlakes especially within the immediate shoreline oflarger lakes Loon conservation and managementactivities in the two southern ecoregions shouldfocus on reducing the effects of already existinghuman disturbances on water quality by mitigatingsources of phosphorous that can also directly affectclarity Other activities in these regions shouldinclude the prioritization for protection of high-quality nesting habitat such as small islands andundisturbed areas of lakes and preventingdevelopment in critical loon habitat Our resultssuggest that conservation strategies for CommonLoon should also consider environmental
influences beyond the immediate lake or riparianscale as the analysis demonstrates that loons arealso responding to landscape-level and catchment-scale conditions surrounding lakes
Responses to this article can be read online athttpwwwace-ecoorgvol6iss1art4responses
Acknowledgments
We thank the many people who share our interest inCommon Loon research and conservation Weappreciate the statistical assistance and advice ofDr James Heltshe and helpful advice fromreviewers of early drafts Drs James Lake BryanMilstead and Rick McKinney as well as that of theanonymous reviewers who contributed to the finalversion of this manuscript This is contributionnumber AED-10-048 of the Atlantic EcologyDivision National Health and EnvironmentalEffects Research Laboratory Office of Researchand Development US Environmental ProtectionAgency Although the research described in thiscontribution has been funded wholly by the USEnvironmental Protection Agency it has not beensubjected to Agency-level review Therefore it doesnot necessarily reflect the views of the AgencyMention of trade names products or services doesnot constitute endorsement or recommendation foruse
Avian Conservation and Ecology 6(1) 4httpwwwace-ecoorgvol6iss1art4
LITERATURE CITED
Agresti A 1996 An introduction to categoricaldata analysisWiley New York New York USA
Alvo R D J T Hussell and M Berrill 1988 Thebreeding success of common loons (Gavia immer)in relation to alkalinity and other lake characteristicsin Ontario Canadian Journal of Zoology 66(3)746-752
Anderson D R 2008 Model based inferences inthe life sciences a primer on evidence SpringerNew York New York USA doi101007978-0-387-74075-1
Anderson J R E E Hardy J T Roach and R EWitmer 1976 A land use and land coverclassification system for use with remote sensordata Geological Survey Professional Paper 964 US Geological Survey Washington DC USA
Austin M 2007 Species distribution models andecological theory a critical assessment and somepossible new approaches Ecological Modelling 200(1-2)1-19 doi101016jecolmodel200607005
Barr J F 1986 Population dynamics of thecommon loon associated with mercury-contaminatedwaters in northwestern Ontario Occasional PaperNumber 56 Canadian Wildlife Service OttawaCanada
Battin J and J J Lawler 2006 Cross-scalecorrelations and the design of avian-habitatselection studies Condor 10859-70 doi1016500010-5422(2006)108[0059CCATDA]20CO2
Blair R B 1992 Lake features water quality andthe summer distribution of Common Loons in NewHampshire Journal of Field Ornithology 63(1)1-9
Burgess N M D C Evers and J D Kaplan 2005Mercury and other contaminants in Common Loonsbreeding in Atlantic Canada Ecotoxicology 14(1-2)241-252 doi101007s10646-004-6271-0
Burnham K P and D R Anderson 2002 Modelselection and multimodel inference a practicalinformation-theoretic approach Second editionSpringer New York New York USA
Cox D R and E J Snell 1989 Analysis of binarydata Second edition Chapman amp Hall LondonUK
Cushman S A and K McGarigal 2002Hierarchical multi-scale decomposition of species-environment relationships Landscape Ecology 17(7)637-646 doi101023A1021571603605
Cushman S A and K McGarigal 2004Hierarchical analysis of forest bird species-environment relationships in the Oregon CoastRange Ecological Applications 14(4)1090-1105 doi10189003-5131
Deppe J L and J T Rotenberry 2008 Scale-dependent habitat use by fall migratory birdsvegetation structure floristics and geographyEcological Monographs 78(3)461-487 doi10189007-01631
Desorbo C R K M Taylor D E Kramer J FairJ H Cooley Jr D C Evers W Hanson H SVogel and J L Atwood 2007 Reproductiveadvantages for Common Loons using rafts Journalof Wildlife Management 71(4)1206-1213 doi1021932006-422
Driscoll M J L T Donovan R Mickey AHoward and K K Fleming 2005 Determinants ofwood thrush nest success a multi-scale modelselection approach Journal of Wildlife Management 69(2)699-709 doi1021930022-541X(2005)069[0699DOWTNS]20CO2
Earnst S L R Platte and L Bond 2006 Alandscape-scale model of yellow-billed loon (Gaviaadamsii) habitat preferences in northern AlaskaHydrobiologia 567(1)227-236 doi101007s10750-006-0042-2
Edwards T C Jr G G Moisen T S Frescinoand J J Lawler 2003 Modeling multipleecological scales to link landscape theory to wildlifeconservation Pages 153-172 in J A Bissonette andI Storch editors Landscape ecology and resourcemanagement linking theory with practice IslandPress Washington DC USA
Environmental Systems Research Institute 2009ArcInfo geographic information system (GIS)software Version 91 Redlands California USA
Avian Conservation and Ecology 6(1) 4httpwwwace-ecoorgvol6iss1art4
Estrella A 1998 A new measure of fit for equationswith dichotomous dependent variables Journal ofBusiness and Economic Statistics 16(2)198-205 doi1023071392575
Evers D C 2001 Common Loon populationstudies continental mercury patterns and breedingterritory philopatry Dissertation University ofMinnesota St Paul Minnesota USA
Evers D C 2007 Status assessment andconservation plan for the Common Loon (Gaviaimmer) in North America BRI Report 2007-20 US Fish and Wildlife Service Hadley MassachusettsUSA
Evers D C L J Savoy C R DeSorbo D EYates W Hanson K M Taylor L Siegel J HCooley M S Bank A Major K Munney BMower H S Vogel N Schoch M Pokras M WGoodale and J Fair 2008 Adverse effects fromenvironmental mercury loads on breeding commonloons Ecotoxicology 17(2)69-81 doi101007s10646-007-0168-7
Fielding A H and J F Bell 1997 A review ofmethods for the assessment of prediction errors inconservation presenceabsence models EnvironmentalConservation 24(1)38-49 doi101017S0376892997000088
Fortin M-J and M R T Dale 2005 Spatialanalysis a guide for ecologists CambridgeUniversity Press Cambridge UK
Found C S M Webb and M S Boyce 2008Selection of lake habitats by waterbirds in the borealtransition zone of northeastern Alberta CanadianJournal of Zoology 86(4)277-285 doi101139Z07-137
Fraterrigo J M and J A Downing 2008 Theinfluence of land use on lake nutrients varies withwatershed transport capacity Ecosystems 11(7)1021-1034 doi101007s10021-008-9176-6
Freemark K E D Bert and M A Villard 2002Patch- landscape- and regional-scale effects onbiota Pages 58-83 in K J Gutzwiller editorApplying landscape ecology in biologicalconservation Springer New York New YorkUSA
Gamma Design Software 2001 GS+ geostatisticsfor the environmental sciences PlainwellMichigan USA
Garshellis D L 2000 Delusions in habitatevaluation measuring use selection andimportance Pages 111-153 in L Boitani and T KFuller editors Research techniques in animalecology controversies and consequences ColumbiaUniversity Press New York New York USA
Goldstein H 2003 Multilevel statistical models Third edition Hodder Arnold London UK
Graf R F K Bollmann W Suter and HBugmann 2005 The importance of spatial scale inhabitat models Capercaillie in the Swiss AlpsLandscape Ecology 20(6)703-717 doi101007s10980-005-0063-7
Graham M H 2003 Confronting multicollinearityin ecological multiple regression Ecology 842809-2815 doi10189002-3114
Gutzwiller K J and S H Anderson 1987Multiscale associations between cavity-nestingbirds and features of Wyoming streamsidewoodlands Condor 89534-548 doi1023071368643
Hames R S J D Lowe S Barker Swarthout andK V Rosenberg 2006 Understanding the risk toneotropical migrant bird species of multiple human-caused stressors elucidating processes behindpatterns Ecology and Society 11(1) 24 [online]URL httpwwwecologyandsocietyorgvol11iss1art24
Hammond C A M 2008 A demographic andlandscape analysis for common loons in northwestMontana Thesis University of Montana MissoulaMontana USA [online] URL httpetdlibumteduthesesavailableetd-04242008-130448
Heimberger M D Euler and J Barr 1983 Theimpact of cottage development on Common Loonreproductive success in central Ontario WilsonBulletin 95(3)431-439
Heinz H T Waldhoumlr and M Mittlboumlck 2005Careful use of pseudo R-squared measures inepidemiological studies Statistics in Medicine 24(18)2867-2872 doi101002sim2168
Avian Conservation and Ecology 6(1) 4httpwwwace-ecoorgvol6iss1art4
Hollister J W P V August J F Paul and H AWalker 2008 Predicting estuarine sediment metalconcentrations and inferred ecological conditionsan information theoretic approach Journal ofEnvironmental Quality 37(1)234-244 doi102134jeq20070105
Hosmer D W and S Lemeshow 2000 Appliedlogistic regression analysis Second edition WileyNew York New York USA doi1010020471722146
Hutchinson G E 1957 A treatise of limnologyVolume 1 geography physics and chemistry WileyNew York New York USA
Johnson J B and K S Omland 2004 Modelselection in ecology and evolution Trends inEcology and Evolution 19(2)101-108 doi101016jtree200310013
Johnson M D 2007 Measuring habitat quality areview Condor 109(3)489-504 doi10165083471
Johnston C A and B A Shmagin 2006 Scaleissues in lake-watershed interactions assessingshoreline development impacts on water clarityPages 297-313 in J Wu K B Jones H Li and OL Loucks editors Scaling and uncertainty analysisin ecology methods and applications SpringerDordrecht The Netherlands
Jung R E 1991 Effects of human activities andlake characteristics on the behavior and breedingsuccess of Common Loons Passenger Pigeon 53207-218
Kamman N C N M Burgess C T Driscoll HA Simonin W Goodale J Linehan R EstabrookM Hutcheson A Major A M Scheuhammer andD A Scruton 2005 Mercury in freshwater fish ofnortheast North America a geographic perspectivebased on fish tissue monitoring databasesEcotoxicology 14(1-2)163-180 doi101007s10646-004-6267-9
Kristan W B III 2006 Sources and expectationsfor hierarchical structure in bird-habitat associationsCondor 108(1)5-12 doi1016500010-5422(2006)108[0005SAEFHS]20CO2
Kristan W B III and J M Scott 2006Hierarchical models for avian ecologists Condor 108(1)1-4 doi1016500010-5422(2006)108[0001HMFAE]20CO2
Kuhn-Hines A 2008 A multiscale approach tobreeding habitat model development and evaluationfor the common loon Gavia immer in NewHampshire USA ETD Collection for University ofRhode Island Paper AAI3346850 [online] URL httpdigitalcommonsuriedudissertationsAAI3346850
Lawler J J and T C Edwards Jr 2006 Avariance-decomposition approach to investigatingmultiscale habitat associations Condor 108(1)47-58 doi1016500010-5422(2006)108[0047AVATIM]20CO2
Li X D Li Z Ma and D Schneider 2006 Nestsite use by crested ibis dependence of a multifactormodel on spatial scale Landscape Ecology 21(8)1207-1216 doi101007s10980-006-0021-z
Loon Preservation Committee 2004 Fieldcollection protocol for surveying and managingCommon Loons in New Hampshire LoonPreservation Committee Moultonborough NewHampshire USA
Loon Preservation Committee 2005 Meeting thechallenge thirty years of preserving loons and theirhabitats in New Hampshire Loon PreservationCommittee Moultonborough New HampshireUSA
Luck G W 2002 The habitat requirements of therufous treecreeper (Climacteris rufa) 1 Preferentialhabitat use demonstrated at multiple spatial scalesBiological Conservation 105(3)383-394 doi101016S0006-3207(01)00222-1
MacKenzie D I 2005 Was it there Dealing withimperfect detection for species presenceabsencedata Australian and New Zealand Journal ofStatistics 47(1)65-74 doi101111j1467-842X200500372x
MacKenzie D I J D Nichols J E Hines M GKnutson and A B Franklin 2003 Estimating siteoccupancy colonization and local extinction whena species is detected imperfectly Ecology 84(8)2200-2207 doi10189002-3090
Avian Conservation and Ecology 6(1) 4httpwwwace-ecoorgvol6iss1art4
Martin S L and P A Soranno 2006 Lakelandscape position relationships to hydrologicconnectivity and landscape features Limnology andOceanography 51(2)801-814 doi104319lo20065120801
McGarigal K and B J Marks 1995 FRAGSTATSspatial pattern analysis program for quantifyinglandscape structure General Technical ReportPNW-GTR-351 US Department of AgricultureForest Service Washington DC USA
McIntyre J W 1983 Nurseries a consideration ofhabitat requirements during the early chick-rearingperiod in common loons Journal of FieldOrnithology 54(3)247-253
McIntyre J W 1988 The Common Loon spirit ofnorthern lakes University of Minnesota PressMinneapolis Minnesota USA
McIntyre J W and J F Barr 1997 Common loonGavia immer In A Poole and F Gill editors TheBirds of North America 313 Academy of NaturalSciences of Philadelphia and American OrnithologistsUnion Washington DC USA
Menard S 2002 Applied logistic regressionanalysis Second edition Sage PublicationsThousand Oaks California USA
Meyer C B S L Miller and C J Ralph 2002Multi-scale landscape and seascape patternsassociated with marbeled murrelet nesting areas onthe US west coast Landscape Ecology 17(2)95-115 doi101023A1016574928706
Meyer M W 2006 Evaluating the impact ofmultiple stressors on Common Loon populationdemographics-an integrated laboratory and fieldapproach EPA STAR Co-operative AgreementNumber R82-9085 Environmental ProtectionAgency Washington DC USA
Meyer M W D C Evers J J Hartigan and P SRasmussen 1998 Patterns of common loon (Gaviaimmer) mercury exposure reproduction andsurvival in Wisconsin USA EnvironmentalToxicology and Chemistry 17(2)184-190
Meyer M W and J E Woodford 1996Enhancing osprey (Pandion haliaetus) and commonloon (Gavia immer) reproduction on impacted
Wisconsin waterways Final report US Fish andWildlife Service Washington DC USA
Moran P A P 1950 Notes on continuousstochastic phenomena Biometrika 37(1-2)17-23 doi101093biomet371-217
Murtagh P A and P S Pooler 2006 Evaluatingecological indicators lakes in the northeasternUnited States Environmental Monitoring andAssessment 119(1-3)83-96 doi101007s10661-005-9011-x
New Hampshire Department of EnvironmentalServices 2005 Water quality data survey summaryfor New Hampshire lakes and ponds NewHampshire Department of Environmental ServicesNew Hampshire USA [online] URL httpdesnhgovorganizationdivisionswaterwmblakestrophic_summaryhtm
New Hampshire Department of EnvironmentalServices 2006 Community center areas NewHampshire Department of Environmental ServicesNew Hampshire USA [online] URL httpwwwgranitunhedudatadatacatpagescommunitycenterareaspdf
Newbrey J L M A Bozek and N D Niemuth2005 Effects of lake characteristics and humandisturbance on the presence of piscivorous birds innorthern Wisconsin USA Waterbirds 28(4)478-486 doi1016751524-4695(2005)28[478EOLCAH]20CO2
Nocera J J G J Forbes and G R Milton 2008The relevance of local-scale relationships to habitatmanagement and landscape patterns AvianConservation and Ecology - Eacutecologie etconservation des oiseaux 3(1) 4 [online] URL httpwwwace-ecoorgvol3iss1art4
Northeast Loon Study Work Group 2008 [online]URL httpwwwbriloonorgscience-and-conservationcentersNELSWGphp
OrsquoBrien R M 2007 A caution regarding rules ofthumb for variance inflation factors Quality ampQuantity 41(5)673-690 doi101007s11135-006-9018-6
Patton D R 1975 A diversity index for quantifyinghabitat lsquoedgersquo Wildlife Society Bulletin 3171-173
Avian Conservation and Ecology 6(1) 4httpwwwace-ecoorgvol6iss1art4
Penhollow M E and D F Stauffer 2000 Large-scale habitat relationships of neotropical migratorybirds in Virginia Journal of Wildlife Management 64(2)362-373 doi1023073803234
Piper W H C Walcott J N Mager III M PeralaK B Tischler E Harrington A J Turcotte MSchwabenlander and N Banfield 2006 Prospectingin a solitary breeder chick production elicitsterritorial intrusions in common loons BehavioralEcology 17(6)881-888 doi101093behecoarl021
Piper W H C Walcott J N Mager and F JSpilker 2008 Nestsite selection by male loons leadsto sex-biased site familiarity Journal of AnimalEcology 77(2)205-210 doi101111j1365-2656200701334x
Rimmer C C 1992 Common Loon Gavia immer Pages 3-30 in K J Schneider and D M Penceeditors Migratory nongame birds managementconcern in the Northeast US Fish and WildlifeService Newton Corner Massachusetts USA
Riitters K H R V OrsquoNeill and K B Jones 1997Assessing habitat suitability at multiple scales alandscape-level approach Biological Conservation 81(1-2)191-202 doi101016S0006-3207(96)00145-0
Saab V 1999 Importance of spatial scale to habitatuse by breeding birds in riparian forests ahierarchical analysis Ecological Applications 9(1)135-151 doi1018901051-0761(1999)009[0135IOSSTH]20CO2
SAS Institute Inc 2003 SAS 91 Cary NorthCarolina USA
Scott J M P J Heglund M L Morrison J BHaufler M G Raphael W A Wall and F BSamson editors 2002 Predicting speciesoccurrences issues of accuracy and scale IslandPress Washington DC USA
Society for Protection of New Hampshire Forests2005 New Hampshirersquos changing landscapepopulation growth and land use changes Societyfor Protection of New Hampshire Forests [online]URL httpwwwforestsocietyorgresearchresearch-projectsasp
Soranno P A K E Webster K S Cheruvelil andM T Bremigan 2009 The lake landscape-contextframework linking aquatic connections terrestrialfeatures and human effects at multiple scalesVerhandlungen des Internationalen Verein Limnologie 30(5)695-700
Sperduto D D and W F Nichols 2004 Naturalcommunities of New Hampshire New HampshireNatural Heritage Bureau Concord New HampshireUSA and University of New HampshireCooperative Extension Durham New HampshireUSA
SPSS Inc 1999 SPSS 100 Chicago Illinois USA
Stauffer H B C J Ralph and S L Miller 2004Ranking habitat for marbled murrelets a newconservation approach for species with uncertaindetection Ecological Applications 14(5)1374-1383doi10189003-5068
Stein B A and S R Flack 1997 1997 speciesreport card the status of US plants and animals The Nature Conservancy Arlington VirginiaUSA [online] URL httpwwwnatureserveorglibrary1997speciesreportcardpdf
Strauss B and R Biedermann 2007 Evaluatingtemporal and spatial generality How valid arespecies-habitat relationship models EcologicalModeling 204104-114 doi101016jecolmodel200612027
Strong P I V and J A Bissonette 1989 Feedingand chick-rearing areas of common loons Journalof Wildlife Management 5372-76 doi1023073801308
Strong P I V J A Bissonette and J S Fair 1987Reuse of nesting and nursery areas by CommonLoons Journal of Wildlife Management 51123-127doi1023073801642
Taylor K M and H S Vogel 2000 NewHampshire report Pages 110-113 in J McIntyre andD C Evers editors Loons old history and newfindings Proceedings symposium 1997 meetingAmerican Ornithologists Union North AmericanLoon Fund Holderness New Hampshire USA
Thogmartin W E 2007 Effects at the landscapescale may constrain habitat relations at finer scales
Avian Conservation and Ecology 6(1) 4httpwwwace-ecoorgvol6iss1art4
Avian Conservation and Ecology - Eacutecologie etconservation des oiseaux 2(2) 6 [online] URL URL httpwwwace-ecoorgvol2iss2art6
Thogmartin W E and M G Knutson 2007Scaling local species-habitat relations to the largerlandscape with a hierarchical spatial count modelLandscape Ecology 22(1)61-75 doi101007s10980-006-9005-2
Thompson C M and K McGarigal 2002 Theinfluence of research scale on bald eagle habitatselection along the lower Hudson River New York(USA) Landscape Ecology 17(6)569-586 doi101023A1021501231182
Titus J R and L W VanDruff 1981 Responseof the common loon to recreational pressure in theBoundary Waters Canoe Area northeasternMinnesota Wildlife Monographs 791-60
Trocki C L and P W C Paton 2006 Assessinghabitat selection by foraging egrets in salt marshesat multiple spatial scales Wetlands 26(2)307-312 doi1016720277-5212(2006)26[307AHSBFE]20CO2
Turner M G 2005 Landscape ecology What isthe state of the science Annual Review of EcologyEvolution and Systematics 36319-344 doi101146annurevecolsys36102003152614
Tyre A J B Tenhumberg S A Field D NiejalkeK Parris and H P Possingham 2003 Improvingprecision and reducing bias in biological surveysestimating false-negative error rates EcologicalApplications 13(6)1790-1801 doi10189002-5078
Vermeer K 1973 Some aspects of the nestingrequirements of common loons in Alberta WilsonBulletin 85429-435
Wiens J A 1989 Spatial scaling in ecologyFunctional Ecology 3385-397 doi1023072389612
Wiens J A 2002 Riverine landscapes takinglandscape ecology into the water FreshwaterBiology 47(4)501-515 doi101046j1365-2427200200887x
Wiens J A J T Rotenberry and B van Horne1987 Habitat occupancy patterns of North
American shrubsteppe birds the effects of spatialscale Oikos 48132-147 doi1023073565849
Wilcove D S D Rothstein J Dubow A Phillipsand E Losos 1998 Quantifying threats to imperiledspecies in the United States Bioscience 48607-615doi1023071313420
Wu J 2004 Effects of changing scale on landscapepattern analysis scaling relations LandscapeEcology 19(2)125-138 doi101023BLAND000002171140074ae
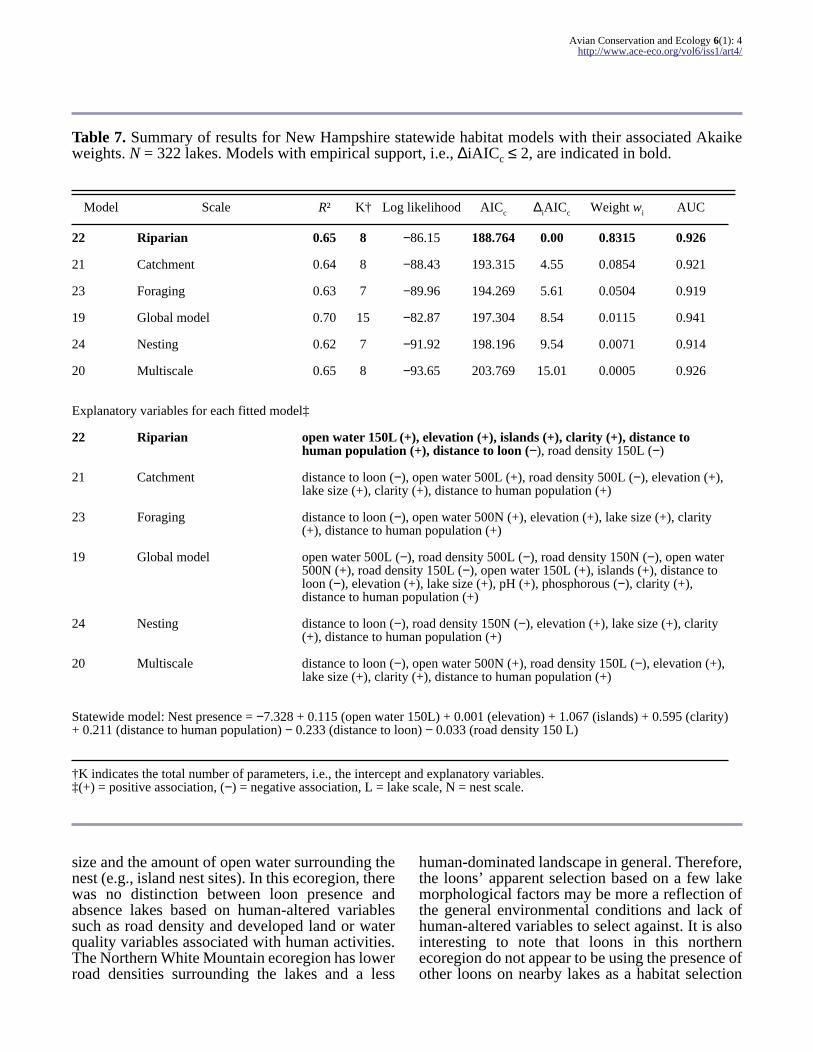
Avian Conservation and Ecology 6(1) 4httpwwwace-ecoorgvol6iss1art4
Table 7 Summary of results for New Hampshire statewide habitat models with their associated Akaikeweights N = 322 lakes Models with empirical support ie ∆iAICc le 2 are indicated in bold
Model Scale Rsup2 Kdagger Log likelihood AICc ∆iAICc Weight wi AUC
22 Riparian 065 8 minus8615 188764 000 08315 0926
21 Catchment 064 8 minus8843 193315 455 00854 0921
23 Foraging 063 7 minus8996 194269 561 00504 0919
19 Global model 070 15 minus8287 197304 854 00115 0941
24 Nesting 062 7 minus9192 198196 954 00071 0914
20 Multiscale 065 8 minus9365 203769 1501 00005 0926
Explanatory variables for each fitted modelDagger
22 Riparian open water 150L (+) elevation (+) islands (+) clarity (+) distance tohuman population (+) distance to loon (minus) road density 150L (minus)
21 Catchment distance to loon (minus) open water 500L (+) road density 500L (minus) elevation (+)lake size (+) clarity (+) distance to human population (+)
23 Foraging distance to loon (minus) open water 500N (+) elevation (+) lake size (+) clarity(+) distance to human population (+)
19 Global model open water 500L (minus) road density 500L (minus) road density 150N (minus) open water500N (+) road density 150L (minus) open water 150L (+) islands (+) distance toloon (minus) elevation (+) lake size (+) pH (+) phosphorous (minus) clarity (+)distance to human population (+)
24 Nesting distance to loon (minus) road density 150N (minus) elevation (+) lake size (+) clarity(+) distance to human population (+)
20 Multiscale distance to loon (minus) open water 500N (+) road density 150L (minus) elevation (+)lake size (+) clarity (+) distance to human population (+)
Statewide model Nest presence = minus7328 + 0115 (open water 150L) + 0001 (elevation) + 1067 (islands) + 0595 (clarity)+ 0211 (distance to human population) minus 0233 (distance to loon) minus 0033 (road density 150 L)
daggerK indicates the total number of parameters ie the intercept and explanatory variablesDagger(+) = positive association (minus) = negative association L = lake scale N = nest scale
size and the amount of open water surrounding thenest (eg island nest sites) In this ecoregion therewas no distinction between loon presence andabsence lakes based on human-altered variablessuch as road density and developed land or waterquality variables associated with human activitiesThe Northern White Mountain ecoregion has lowerroad densities surrounding the lakes and a less
human-dominated landscape in general Thereforethe loonsrsquo apparent selection based on a few lakemorphological factors may be more a reflection ofthe general environmental conditions and lack ofhuman-altered variables to select against It is alsointeresting to note that loons in this northernecoregion do not appear to be using the presence ofother loons on nearby lakes as a habitat selection
Avian Conservation and Ecology 6(1) 4httpwwwace-ecoorgvol6iss1art4
factor as is the case in the two more southerlyecoregions
The results for the Northern White Mountainecoregion suggest that prior to human alteration ofthe landscape loons may have chosen breedinghabitat based primarily on lake morphologicalfactors such as lake size and the amount of openwater surrounding the nest The catchment riparianforaging and nest scale-based models within theNorthern White Mountain ecoregion includeinformation describing the selection of loonbreeding habitat (Table 4) Three of these final fittedsingle-scale models had explanatory variables incommon (ie lake size) and were combined in themultiscale model for this ecoregion to determine thebest approximating model given the data set basedon the model probability Akaike weights wi (Table4) However using evidence ratios (Burnham andAnderson 2002) to compare the two best modelsthe best model (model 1) has only 19 times theweight of evidence relative to the second-best model(model 4) This relatively weak support for any ofthe models being the best model suggests that thesemodels are good candidates for model averaging ormultimodel inference Model averaging increasesparameter estimate precision and reduces biasassociated with model selection especially when allof the models have substantial support and areclosely related as in ecoregion 1
In the southwestern New Hampshire-VermontUpland loons appear to be avoiding human-alteredlandscapes such as those with high road density andgreater areas of agriculture (Table 6) This regionof New Hampshire contains the highest percentageof prime agricultural soils in the state and hasexperienced the highest amount of agriculturalconversion to developed land in the state over the5-yr period from 1997 to 2002 (Society for theProtection of New Hampshire Forests 2005) Withinthis ecoregion loons are selecting lakes with moreislands higher water clarity and more open watersurrounding the lakes and that are nearby otherlakes with loons present The catchment-scalemodel describing features within a 500-m zone ofthe lake best describes the data in this region (model9 Table 6) the only other model that has substantialempirical support for describing this data set is themultiscale model (model 8 Table 6) Thecatchment-scale model differs from the multiscalemodel by identifying positive associations of loonswith pH (an indicator of fishprey habitat) and lakeelevation and a negative association of loons with
agricultural land within 500 m of the lake Insteadof relying on a single best model for this ecoregionwe used model averaging to combine these twohighest ranking models to obtain robust estimatesof model parameters reduce model selection biasand account for model selection uncertainty(Johnson and Omland 2004) Based on the modelaveraged results and using odds ratios to identifyinfluential factors in this region islands pH andwater clarity appear to be the most influential habitatfeatures (Table 8)
Loons in the southeastern Southern New EnglandCoastal Hills and Plain appear to be selectingbreeding habitat similarly across all scales based ona few key elements larger lakes at increasingelevations with lower levels of phosphorous nearbyother lakes with loons (Table 5) Other studies havefound that loons avoid lakes with higherphosphorous and primary productivity (Blair 1992)which can reduce water clarity Total phosphoruswhich is associated with anthropogenic activitiesappears to be an important avoidance factor forloons selecting breeding habitat at multiple scalesbased on the multiscale and nesting-scale modelswhich are the two highest-ranking models for thisregion The two most influential factors in thisregion appear to be lake size and water clarity basedon odds ratio estimates (Table 8)
The natural arrangement of lakes in NewHampshire especially in the southeastern portionof the state (referred to as the Lakes Region) is ofparticular concern because this area has the fastestrate of human population change in NewHampshire The entire state population is projectedto grow by 358000 between 2000 and 2025 withan estimated 80 of that growth in the foursoutheastern counties of New Hampshire along theInterstate Highway 89 corridor and in the LakesRegion (Society for Protection of New HampshireForests 2005) Loons are responding to human-induced pressures on these lakes and across the stateby selecting against anthropogenic features such asroad density total phosphorous and conductivitydeveloped and agricultural lands and humanpopulation centers
CONCLUSION
Our results support the increasing evidence formultiscale habitat associations most commonlyfound in avian species (Gutzwiller and Anderson
Avian Conservation and Ecology 6(1) 4httpwwwace-ecoorgvol6iss1art4
Table 8 Model averaged parameter estimates and odds ratio estimates with confidence intervals forecoregional composite models and the statewide model These parameters constitute the final averagedmodels for each ecoregion and may be used directly to predict Common Loon nest presence regionally andthroughout the state of New Hampshire
Region Variable Theta SE Odds ratio 95 Wald confidence limits
Ecoregion 1 Northern White Mountain
Intercept minus8655 0704
Lake size 3127 0096 6935 0934 51509
Open water 500 nest 1570 0034 1482 1066 2062
Ecoregion 2 New Hampshire-Vermont Upland
Intercept minus22579 10485
Islands 3179 1120 18045 2760 117970
Clarity 1047 0349 2952 1500 5810
Elevation 0004 0002 1004 1000 1007
Open water 150 lake 0287 0136 1383 1153 1658
Open water 500 lake 0405 01145 1499 1198 1877
Open water 500 nest 01064 00485 0890 0810 0979
pH 272 10139 15195 2083 110844
Road density 500 lake minus0158 0064 0880 0789 0983
Distance to loon lake minus03619 0129 0691 0491 0971
Agricultural 500 lake minus03143 01489 0730 0545 0978
Forest 150 nest minus00856 00346 0913 0853 0977
Wetland 150 nest minus00793 00346 0920 0859 0985
Road density 150 nest minus00647 00286 0927 0877 0980
Ecoregion 3 Southern New England Coastal Hills and Plain
Intercept minus4550 0217
Elevation 0006 0001 1004 1000 1009
Lake size 1180 0158 3254 1640 6456
Clarity 01714 02835 1187 0681 2069
Distance to loon lake minus02183 0124 1000 1000 1000
Phosphorous minus179503 3190 lt 0001 lt 0001 lt 0001
(cond)
Avian Conservation and Ecology 6(1) 4httpwwwace-ecoorgvol6iss1art4
New Hampshire Statewide
Intercept minus73821 12467
Open water 150 lake 01150 00200 1122 1079 1167
Elevation 0001 0001 1001 1000 1002
Islands 10674 04210 2908 1274 6637
Clarity 05948 01503 1813 1350 2434
Distance to population center 02105 00797 1234 1056 1443
Distance to loon lake minus02331 00732 0792 0686 0914
Road density 150 lake minus00327 00148 0968 0940 0996
1987 Wiens et al 1987 Saab 1999 Meyer et al2002 Graf et al 2005 Kristan 2006 Lawler andEdwards 2006 Thogmartin 2007) The multiscalemodels within each ecoregion have substantialempirical support in describing breeding habitatsuggesting that Common Loon in New Hampshireis responding to environmental cues at scalesranging from broad catchment to finer riparian areassurrounding lakes as well as within lakes at thenesting scale Loons also appear to be selectinghabitat differently across the ecoregions based onthe varying landscape conditions they encounteracross New Hampshire This differential selectionof breeding habitat across ecoregions providesinformation for prioritizing conservation andfocusing management efforts in New HampshireConservation efforts in the northern ecoregionshould be focused on preserving the relatively lowerlevels of human activity and disturbance pressuressurrounding these northern lakes by preventingincreases in road density and construction nearlakes especially within the immediate shoreline oflarger lakes Loon conservation and managementactivities in the two southern ecoregions shouldfocus on reducing the effects of already existinghuman disturbances on water quality by mitigatingsources of phosphorous that can also directly affectclarity Other activities in these regions shouldinclude the prioritization for protection of high-quality nesting habitat such as small islands andundisturbed areas of lakes and preventingdevelopment in critical loon habitat Our resultssuggest that conservation strategies for CommonLoon should also consider environmental
influences beyond the immediate lake or riparianscale as the analysis demonstrates that loons arealso responding to landscape-level and catchment-scale conditions surrounding lakes
Responses to this article can be read online athttpwwwace-ecoorgvol6iss1art4responses
Acknowledgments
We thank the many people who share our interest inCommon Loon research and conservation Weappreciate the statistical assistance and advice ofDr James Heltshe and helpful advice fromreviewers of early drafts Drs James Lake BryanMilstead and Rick McKinney as well as that of theanonymous reviewers who contributed to the finalversion of this manuscript This is contributionnumber AED-10-048 of the Atlantic EcologyDivision National Health and EnvironmentalEffects Research Laboratory Office of Researchand Development US Environmental ProtectionAgency Although the research described in thiscontribution has been funded wholly by the USEnvironmental Protection Agency it has not beensubjected to Agency-level review Therefore it doesnot necessarily reflect the views of the AgencyMention of trade names products or services doesnot constitute endorsement or recommendation foruse
Avian Conservation and Ecology 6(1) 4httpwwwace-ecoorgvol6iss1art4
LITERATURE CITED
Agresti A 1996 An introduction to categoricaldata analysisWiley New York New York USA
Alvo R D J T Hussell and M Berrill 1988 Thebreeding success of common loons (Gavia immer)in relation to alkalinity and other lake characteristicsin Ontario Canadian Journal of Zoology 66(3)746-752
Anderson D R 2008 Model based inferences inthe life sciences a primer on evidence SpringerNew York New York USA doi101007978-0-387-74075-1
Anderson J R E E Hardy J T Roach and R EWitmer 1976 A land use and land coverclassification system for use with remote sensordata Geological Survey Professional Paper 964 US Geological Survey Washington DC USA
Austin M 2007 Species distribution models andecological theory a critical assessment and somepossible new approaches Ecological Modelling 200(1-2)1-19 doi101016jecolmodel200607005
Barr J F 1986 Population dynamics of thecommon loon associated with mercury-contaminatedwaters in northwestern Ontario Occasional PaperNumber 56 Canadian Wildlife Service OttawaCanada
Battin J and J J Lawler 2006 Cross-scalecorrelations and the design of avian-habitatselection studies Condor 10859-70 doi1016500010-5422(2006)108[0059CCATDA]20CO2
Blair R B 1992 Lake features water quality andthe summer distribution of Common Loons in NewHampshire Journal of Field Ornithology 63(1)1-9
Burgess N M D C Evers and J D Kaplan 2005Mercury and other contaminants in Common Loonsbreeding in Atlantic Canada Ecotoxicology 14(1-2)241-252 doi101007s10646-004-6271-0
Burnham K P and D R Anderson 2002 Modelselection and multimodel inference a practicalinformation-theoretic approach Second editionSpringer New York New York USA
Cox D R and E J Snell 1989 Analysis of binarydata Second edition Chapman amp Hall LondonUK
Cushman S A and K McGarigal 2002Hierarchical multi-scale decomposition of species-environment relationships Landscape Ecology 17(7)637-646 doi101023A1021571603605
Cushman S A and K McGarigal 2004Hierarchical analysis of forest bird species-environment relationships in the Oregon CoastRange Ecological Applications 14(4)1090-1105 doi10189003-5131
Deppe J L and J T Rotenberry 2008 Scale-dependent habitat use by fall migratory birdsvegetation structure floristics and geographyEcological Monographs 78(3)461-487 doi10189007-01631
Desorbo C R K M Taylor D E Kramer J FairJ H Cooley Jr D C Evers W Hanson H SVogel and J L Atwood 2007 Reproductiveadvantages for Common Loons using rafts Journalof Wildlife Management 71(4)1206-1213 doi1021932006-422
Driscoll M J L T Donovan R Mickey AHoward and K K Fleming 2005 Determinants ofwood thrush nest success a multi-scale modelselection approach Journal of Wildlife Management 69(2)699-709 doi1021930022-541X(2005)069[0699DOWTNS]20CO2
Earnst S L R Platte and L Bond 2006 Alandscape-scale model of yellow-billed loon (Gaviaadamsii) habitat preferences in northern AlaskaHydrobiologia 567(1)227-236 doi101007s10750-006-0042-2
Edwards T C Jr G G Moisen T S Frescinoand J J Lawler 2003 Modeling multipleecological scales to link landscape theory to wildlifeconservation Pages 153-172 in J A Bissonette andI Storch editors Landscape ecology and resourcemanagement linking theory with practice IslandPress Washington DC USA
Environmental Systems Research Institute 2009ArcInfo geographic information system (GIS)software Version 91 Redlands California USA
Avian Conservation and Ecology 6(1) 4httpwwwace-ecoorgvol6iss1art4
Estrella A 1998 A new measure of fit for equationswith dichotomous dependent variables Journal ofBusiness and Economic Statistics 16(2)198-205 doi1023071392575
Evers D C 2001 Common Loon populationstudies continental mercury patterns and breedingterritory philopatry Dissertation University ofMinnesota St Paul Minnesota USA
Evers D C 2007 Status assessment andconservation plan for the Common Loon (Gaviaimmer) in North America BRI Report 2007-20 US Fish and Wildlife Service Hadley MassachusettsUSA
Evers D C L J Savoy C R DeSorbo D EYates W Hanson K M Taylor L Siegel J HCooley M S Bank A Major K Munney BMower H S Vogel N Schoch M Pokras M WGoodale and J Fair 2008 Adverse effects fromenvironmental mercury loads on breeding commonloons Ecotoxicology 17(2)69-81 doi101007s10646-007-0168-7
Fielding A H and J F Bell 1997 A review ofmethods for the assessment of prediction errors inconservation presenceabsence models EnvironmentalConservation 24(1)38-49 doi101017S0376892997000088
Fortin M-J and M R T Dale 2005 Spatialanalysis a guide for ecologists CambridgeUniversity Press Cambridge UK
Found C S M Webb and M S Boyce 2008Selection of lake habitats by waterbirds in the borealtransition zone of northeastern Alberta CanadianJournal of Zoology 86(4)277-285 doi101139Z07-137
Fraterrigo J M and J A Downing 2008 Theinfluence of land use on lake nutrients varies withwatershed transport capacity Ecosystems 11(7)1021-1034 doi101007s10021-008-9176-6
Freemark K E D Bert and M A Villard 2002Patch- landscape- and regional-scale effects onbiota Pages 58-83 in K J Gutzwiller editorApplying landscape ecology in biologicalconservation Springer New York New YorkUSA
Gamma Design Software 2001 GS+ geostatisticsfor the environmental sciences PlainwellMichigan USA
Garshellis D L 2000 Delusions in habitatevaluation measuring use selection andimportance Pages 111-153 in L Boitani and T KFuller editors Research techniques in animalecology controversies and consequences ColumbiaUniversity Press New York New York USA
Goldstein H 2003 Multilevel statistical models Third edition Hodder Arnold London UK
Graf R F K Bollmann W Suter and HBugmann 2005 The importance of spatial scale inhabitat models Capercaillie in the Swiss AlpsLandscape Ecology 20(6)703-717 doi101007s10980-005-0063-7
Graham M H 2003 Confronting multicollinearityin ecological multiple regression Ecology 842809-2815 doi10189002-3114
Gutzwiller K J and S H Anderson 1987Multiscale associations between cavity-nestingbirds and features of Wyoming streamsidewoodlands Condor 89534-548 doi1023071368643
Hames R S J D Lowe S Barker Swarthout andK V Rosenberg 2006 Understanding the risk toneotropical migrant bird species of multiple human-caused stressors elucidating processes behindpatterns Ecology and Society 11(1) 24 [online]URL httpwwwecologyandsocietyorgvol11iss1art24
Hammond C A M 2008 A demographic andlandscape analysis for common loons in northwestMontana Thesis University of Montana MissoulaMontana USA [online] URL httpetdlibumteduthesesavailableetd-04242008-130448
Heimberger M D Euler and J Barr 1983 Theimpact of cottage development on Common Loonreproductive success in central Ontario WilsonBulletin 95(3)431-439
Heinz H T Waldhoumlr and M Mittlboumlck 2005Careful use of pseudo R-squared measures inepidemiological studies Statistics in Medicine 24(18)2867-2872 doi101002sim2168
Avian Conservation and Ecology 6(1) 4httpwwwace-ecoorgvol6iss1art4
Hollister J W P V August J F Paul and H AWalker 2008 Predicting estuarine sediment metalconcentrations and inferred ecological conditionsan information theoretic approach Journal ofEnvironmental Quality 37(1)234-244 doi102134jeq20070105
Hosmer D W and S Lemeshow 2000 Appliedlogistic regression analysis Second edition WileyNew York New York USA doi1010020471722146
Hutchinson G E 1957 A treatise of limnologyVolume 1 geography physics and chemistry WileyNew York New York USA
Johnson J B and K S Omland 2004 Modelselection in ecology and evolution Trends inEcology and Evolution 19(2)101-108 doi101016jtree200310013
Johnson M D 2007 Measuring habitat quality areview Condor 109(3)489-504 doi10165083471
Johnston C A and B A Shmagin 2006 Scaleissues in lake-watershed interactions assessingshoreline development impacts on water clarityPages 297-313 in J Wu K B Jones H Li and OL Loucks editors Scaling and uncertainty analysisin ecology methods and applications SpringerDordrecht The Netherlands
Jung R E 1991 Effects of human activities andlake characteristics on the behavior and breedingsuccess of Common Loons Passenger Pigeon 53207-218
Kamman N C N M Burgess C T Driscoll HA Simonin W Goodale J Linehan R EstabrookM Hutcheson A Major A M Scheuhammer andD A Scruton 2005 Mercury in freshwater fish ofnortheast North America a geographic perspectivebased on fish tissue monitoring databasesEcotoxicology 14(1-2)163-180 doi101007s10646-004-6267-9
Kristan W B III 2006 Sources and expectationsfor hierarchical structure in bird-habitat associationsCondor 108(1)5-12 doi1016500010-5422(2006)108[0005SAEFHS]20CO2
Kristan W B III and J M Scott 2006Hierarchical models for avian ecologists Condor 108(1)1-4 doi1016500010-5422(2006)108[0001HMFAE]20CO2
Kuhn-Hines A 2008 A multiscale approach tobreeding habitat model development and evaluationfor the common loon Gavia immer in NewHampshire USA ETD Collection for University ofRhode Island Paper AAI3346850 [online] URL httpdigitalcommonsuriedudissertationsAAI3346850
Lawler J J and T C Edwards Jr 2006 Avariance-decomposition approach to investigatingmultiscale habitat associations Condor 108(1)47-58 doi1016500010-5422(2006)108[0047AVATIM]20CO2
Li X D Li Z Ma and D Schneider 2006 Nestsite use by crested ibis dependence of a multifactormodel on spatial scale Landscape Ecology 21(8)1207-1216 doi101007s10980-006-0021-z
Loon Preservation Committee 2004 Fieldcollection protocol for surveying and managingCommon Loons in New Hampshire LoonPreservation Committee Moultonborough NewHampshire USA
Loon Preservation Committee 2005 Meeting thechallenge thirty years of preserving loons and theirhabitats in New Hampshire Loon PreservationCommittee Moultonborough New HampshireUSA
Luck G W 2002 The habitat requirements of therufous treecreeper (Climacteris rufa) 1 Preferentialhabitat use demonstrated at multiple spatial scalesBiological Conservation 105(3)383-394 doi101016S0006-3207(01)00222-1
MacKenzie D I 2005 Was it there Dealing withimperfect detection for species presenceabsencedata Australian and New Zealand Journal ofStatistics 47(1)65-74 doi101111j1467-842X200500372x
MacKenzie D I J D Nichols J E Hines M GKnutson and A B Franklin 2003 Estimating siteoccupancy colonization and local extinction whena species is detected imperfectly Ecology 84(8)2200-2207 doi10189002-3090
Avian Conservation and Ecology 6(1) 4httpwwwace-ecoorgvol6iss1art4
Martin S L and P A Soranno 2006 Lakelandscape position relationships to hydrologicconnectivity and landscape features Limnology andOceanography 51(2)801-814 doi104319lo20065120801
McGarigal K and B J Marks 1995 FRAGSTATSspatial pattern analysis program for quantifyinglandscape structure General Technical ReportPNW-GTR-351 US Department of AgricultureForest Service Washington DC USA
McIntyre J W 1983 Nurseries a consideration ofhabitat requirements during the early chick-rearingperiod in common loons Journal of FieldOrnithology 54(3)247-253
McIntyre J W 1988 The Common Loon spirit ofnorthern lakes University of Minnesota PressMinneapolis Minnesota USA
McIntyre J W and J F Barr 1997 Common loonGavia immer In A Poole and F Gill editors TheBirds of North America 313 Academy of NaturalSciences of Philadelphia and American OrnithologistsUnion Washington DC USA
Menard S 2002 Applied logistic regressionanalysis Second edition Sage PublicationsThousand Oaks California USA
Meyer C B S L Miller and C J Ralph 2002Multi-scale landscape and seascape patternsassociated with marbeled murrelet nesting areas onthe US west coast Landscape Ecology 17(2)95-115 doi101023A1016574928706
Meyer M W 2006 Evaluating the impact ofmultiple stressors on Common Loon populationdemographics-an integrated laboratory and fieldapproach EPA STAR Co-operative AgreementNumber R82-9085 Environmental ProtectionAgency Washington DC USA
Meyer M W D C Evers J J Hartigan and P SRasmussen 1998 Patterns of common loon (Gaviaimmer) mercury exposure reproduction andsurvival in Wisconsin USA EnvironmentalToxicology and Chemistry 17(2)184-190
Meyer M W and J E Woodford 1996Enhancing osprey (Pandion haliaetus) and commonloon (Gavia immer) reproduction on impacted
Wisconsin waterways Final report US Fish andWildlife Service Washington DC USA
Moran P A P 1950 Notes on continuousstochastic phenomena Biometrika 37(1-2)17-23 doi101093biomet371-217
Murtagh P A and P S Pooler 2006 Evaluatingecological indicators lakes in the northeasternUnited States Environmental Monitoring andAssessment 119(1-3)83-96 doi101007s10661-005-9011-x
New Hampshire Department of EnvironmentalServices 2005 Water quality data survey summaryfor New Hampshire lakes and ponds NewHampshire Department of Environmental ServicesNew Hampshire USA [online] URL httpdesnhgovorganizationdivisionswaterwmblakestrophic_summaryhtm
New Hampshire Department of EnvironmentalServices 2006 Community center areas NewHampshire Department of Environmental ServicesNew Hampshire USA [online] URL httpwwwgranitunhedudatadatacatpagescommunitycenterareaspdf
Newbrey J L M A Bozek and N D Niemuth2005 Effects of lake characteristics and humandisturbance on the presence of piscivorous birds innorthern Wisconsin USA Waterbirds 28(4)478-486 doi1016751524-4695(2005)28[478EOLCAH]20CO2
Nocera J J G J Forbes and G R Milton 2008The relevance of local-scale relationships to habitatmanagement and landscape patterns AvianConservation and Ecology - Eacutecologie etconservation des oiseaux 3(1) 4 [online] URL httpwwwace-ecoorgvol3iss1art4
Northeast Loon Study Work Group 2008 [online]URL httpwwwbriloonorgscience-and-conservationcentersNELSWGphp
OrsquoBrien R M 2007 A caution regarding rules ofthumb for variance inflation factors Quality ampQuantity 41(5)673-690 doi101007s11135-006-9018-6
Patton D R 1975 A diversity index for quantifyinghabitat lsquoedgersquo Wildlife Society Bulletin 3171-173
Avian Conservation and Ecology 6(1) 4httpwwwace-ecoorgvol6iss1art4
Penhollow M E and D F Stauffer 2000 Large-scale habitat relationships of neotropical migratorybirds in Virginia Journal of Wildlife Management 64(2)362-373 doi1023073803234
Piper W H C Walcott J N Mager III M PeralaK B Tischler E Harrington A J Turcotte MSchwabenlander and N Banfield 2006 Prospectingin a solitary breeder chick production elicitsterritorial intrusions in common loons BehavioralEcology 17(6)881-888 doi101093behecoarl021
Piper W H C Walcott J N Mager and F JSpilker 2008 Nestsite selection by male loons leadsto sex-biased site familiarity Journal of AnimalEcology 77(2)205-210 doi101111j1365-2656200701334x
Rimmer C C 1992 Common Loon Gavia immer Pages 3-30 in K J Schneider and D M Penceeditors Migratory nongame birds managementconcern in the Northeast US Fish and WildlifeService Newton Corner Massachusetts USA
Riitters K H R V OrsquoNeill and K B Jones 1997Assessing habitat suitability at multiple scales alandscape-level approach Biological Conservation 81(1-2)191-202 doi101016S0006-3207(96)00145-0
Saab V 1999 Importance of spatial scale to habitatuse by breeding birds in riparian forests ahierarchical analysis Ecological Applications 9(1)135-151 doi1018901051-0761(1999)009[0135IOSSTH]20CO2
SAS Institute Inc 2003 SAS 91 Cary NorthCarolina USA
Scott J M P J Heglund M L Morrison J BHaufler M G Raphael W A Wall and F BSamson editors 2002 Predicting speciesoccurrences issues of accuracy and scale IslandPress Washington DC USA
Society for Protection of New Hampshire Forests2005 New Hampshirersquos changing landscapepopulation growth and land use changes Societyfor Protection of New Hampshire Forests [online]URL httpwwwforestsocietyorgresearchresearch-projectsasp
Soranno P A K E Webster K S Cheruvelil andM T Bremigan 2009 The lake landscape-contextframework linking aquatic connections terrestrialfeatures and human effects at multiple scalesVerhandlungen des Internationalen Verein Limnologie 30(5)695-700
Sperduto D D and W F Nichols 2004 Naturalcommunities of New Hampshire New HampshireNatural Heritage Bureau Concord New HampshireUSA and University of New HampshireCooperative Extension Durham New HampshireUSA
SPSS Inc 1999 SPSS 100 Chicago Illinois USA
Stauffer H B C J Ralph and S L Miller 2004Ranking habitat for marbled murrelets a newconservation approach for species with uncertaindetection Ecological Applications 14(5)1374-1383doi10189003-5068
Stein B A and S R Flack 1997 1997 speciesreport card the status of US plants and animals The Nature Conservancy Arlington VirginiaUSA [online] URL httpwwwnatureserveorglibrary1997speciesreportcardpdf
Strauss B and R Biedermann 2007 Evaluatingtemporal and spatial generality How valid arespecies-habitat relationship models EcologicalModeling 204104-114 doi101016jecolmodel200612027
Strong P I V and J A Bissonette 1989 Feedingand chick-rearing areas of common loons Journalof Wildlife Management 5372-76 doi1023073801308
Strong P I V J A Bissonette and J S Fair 1987Reuse of nesting and nursery areas by CommonLoons Journal of Wildlife Management 51123-127doi1023073801642
Taylor K M and H S Vogel 2000 NewHampshire report Pages 110-113 in J McIntyre andD C Evers editors Loons old history and newfindings Proceedings symposium 1997 meetingAmerican Ornithologists Union North AmericanLoon Fund Holderness New Hampshire USA
Thogmartin W E 2007 Effects at the landscapescale may constrain habitat relations at finer scales
Avian Conservation and Ecology 6(1) 4httpwwwace-ecoorgvol6iss1art4
Avian Conservation and Ecology - Eacutecologie etconservation des oiseaux 2(2) 6 [online] URL URL httpwwwace-ecoorgvol2iss2art6
Thogmartin W E and M G Knutson 2007Scaling local species-habitat relations to the largerlandscape with a hierarchical spatial count modelLandscape Ecology 22(1)61-75 doi101007s10980-006-9005-2
Thompson C M and K McGarigal 2002 Theinfluence of research scale on bald eagle habitatselection along the lower Hudson River New York(USA) Landscape Ecology 17(6)569-586 doi101023A1021501231182
Titus J R and L W VanDruff 1981 Responseof the common loon to recreational pressure in theBoundary Waters Canoe Area northeasternMinnesota Wildlife Monographs 791-60
Trocki C L and P W C Paton 2006 Assessinghabitat selection by foraging egrets in salt marshesat multiple spatial scales Wetlands 26(2)307-312 doi1016720277-5212(2006)26[307AHSBFE]20CO2
Turner M G 2005 Landscape ecology What isthe state of the science Annual Review of EcologyEvolution and Systematics 36319-344 doi101146annurevecolsys36102003152614
Tyre A J B Tenhumberg S A Field D NiejalkeK Parris and H P Possingham 2003 Improvingprecision and reducing bias in biological surveysestimating false-negative error rates EcologicalApplications 13(6)1790-1801 doi10189002-5078
Vermeer K 1973 Some aspects of the nestingrequirements of common loons in Alberta WilsonBulletin 85429-435
Wiens J A 1989 Spatial scaling in ecologyFunctional Ecology 3385-397 doi1023072389612
Wiens J A 2002 Riverine landscapes takinglandscape ecology into the water FreshwaterBiology 47(4)501-515 doi101046j1365-2427200200887x
Wiens J A J T Rotenberry and B van Horne1987 Habitat occupancy patterns of North
American shrubsteppe birds the effects of spatialscale Oikos 48132-147 doi1023073565849
Wilcove D S D Rothstein J Dubow A Phillipsand E Losos 1998 Quantifying threats to imperiledspecies in the United States Bioscience 48607-615doi1023071313420
Wu J 2004 Effects of changing scale on landscapepattern analysis scaling relations LandscapeEcology 19(2)125-138 doi101023BLAND000002171140074ae
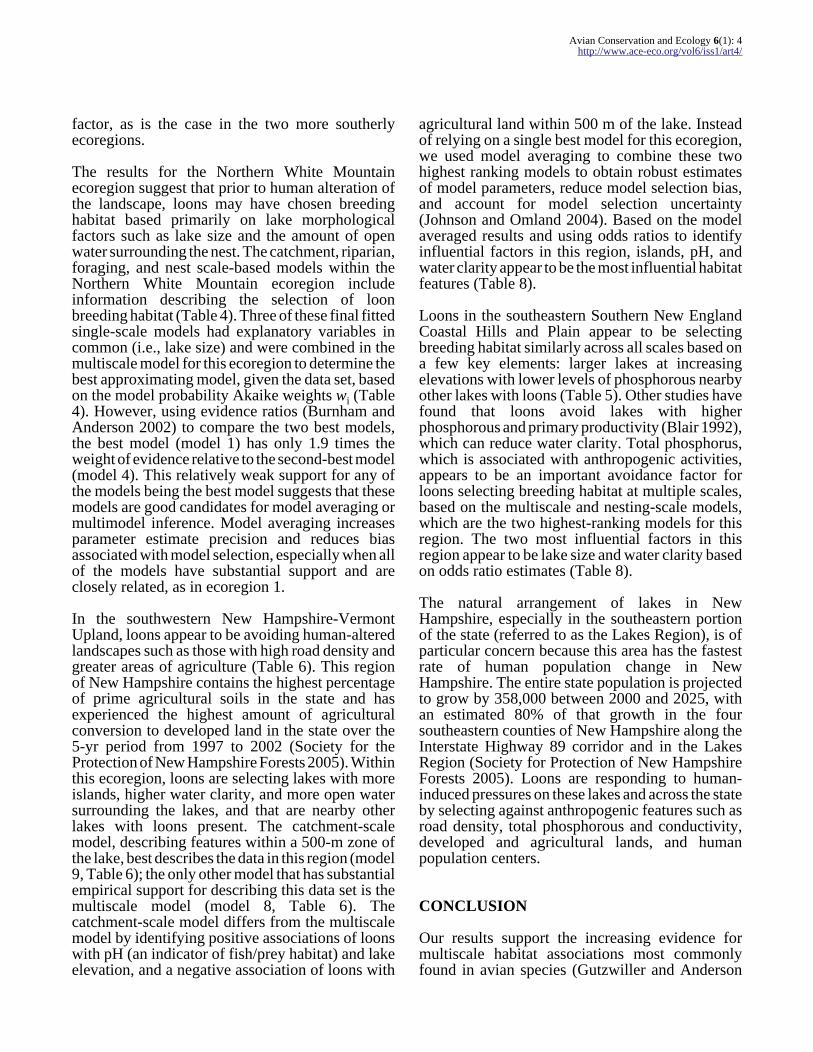
Avian Conservation and Ecology 6(1) 4httpwwwace-ecoorgvol6iss1art4
factor as is the case in the two more southerlyecoregions
The results for the Northern White Mountainecoregion suggest that prior to human alteration ofthe landscape loons may have chosen breedinghabitat based primarily on lake morphologicalfactors such as lake size and the amount of openwater surrounding the nest The catchment riparianforaging and nest scale-based models within theNorthern White Mountain ecoregion includeinformation describing the selection of loonbreeding habitat (Table 4) Three of these final fittedsingle-scale models had explanatory variables incommon (ie lake size) and were combined in themultiscale model for this ecoregion to determine thebest approximating model given the data set basedon the model probability Akaike weights wi (Table4) However using evidence ratios (Burnham andAnderson 2002) to compare the two best modelsthe best model (model 1) has only 19 times theweight of evidence relative to the second-best model(model 4) This relatively weak support for any ofthe models being the best model suggests that thesemodels are good candidates for model averaging ormultimodel inference Model averaging increasesparameter estimate precision and reduces biasassociated with model selection especially when allof the models have substantial support and areclosely related as in ecoregion 1
In the southwestern New Hampshire-VermontUpland loons appear to be avoiding human-alteredlandscapes such as those with high road density andgreater areas of agriculture (Table 6) This regionof New Hampshire contains the highest percentageof prime agricultural soils in the state and hasexperienced the highest amount of agriculturalconversion to developed land in the state over the5-yr period from 1997 to 2002 (Society for theProtection of New Hampshire Forests 2005) Withinthis ecoregion loons are selecting lakes with moreislands higher water clarity and more open watersurrounding the lakes and that are nearby otherlakes with loons present The catchment-scalemodel describing features within a 500-m zone ofthe lake best describes the data in this region (model9 Table 6) the only other model that has substantialempirical support for describing this data set is themultiscale model (model 8 Table 6) Thecatchment-scale model differs from the multiscalemodel by identifying positive associations of loonswith pH (an indicator of fishprey habitat) and lakeelevation and a negative association of loons with
agricultural land within 500 m of the lake Insteadof relying on a single best model for this ecoregionwe used model averaging to combine these twohighest ranking models to obtain robust estimatesof model parameters reduce model selection biasand account for model selection uncertainty(Johnson and Omland 2004) Based on the modelaveraged results and using odds ratios to identifyinfluential factors in this region islands pH andwater clarity appear to be the most influential habitatfeatures (Table 8)
Loons in the southeastern Southern New EnglandCoastal Hills and Plain appear to be selectingbreeding habitat similarly across all scales based ona few key elements larger lakes at increasingelevations with lower levels of phosphorous nearbyother lakes with loons (Table 5) Other studies havefound that loons avoid lakes with higherphosphorous and primary productivity (Blair 1992)which can reduce water clarity Total phosphoruswhich is associated with anthropogenic activitiesappears to be an important avoidance factor forloons selecting breeding habitat at multiple scalesbased on the multiscale and nesting-scale modelswhich are the two highest-ranking models for thisregion The two most influential factors in thisregion appear to be lake size and water clarity basedon odds ratio estimates (Table 8)
The natural arrangement of lakes in NewHampshire especially in the southeastern portionof the state (referred to as the Lakes Region) is ofparticular concern because this area has the fastestrate of human population change in NewHampshire The entire state population is projectedto grow by 358000 between 2000 and 2025 withan estimated 80 of that growth in the foursoutheastern counties of New Hampshire along theInterstate Highway 89 corridor and in the LakesRegion (Society for Protection of New HampshireForests 2005) Loons are responding to human-induced pressures on these lakes and across the stateby selecting against anthropogenic features such asroad density total phosphorous and conductivitydeveloped and agricultural lands and humanpopulation centers
CONCLUSION
Our results support the increasing evidence formultiscale habitat associations most commonlyfound in avian species (Gutzwiller and Anderson
Avian Conservation and Ecology 6(1) 4httpwwwace-ecoorgvol6iss1art4
Table 8 Model averaged parameter estimates and odds ratio estimates with confidence intervals forecoregional composite models and the statewide model These parameters constitute the final averagedmodels for each ecoregion and may be used directly to predict Common Loon nest presence regionally andthroughout the state of New Hampshire
Region Variable Theta SE Odds ratio 95 Wald confidence limits
Ecoregion 1 Northern White Mountain
Intercept minus8655 0704
Lake size 3127 0096 6935 0934 51509
Open water 500 nest 1570 0034 1482 1066 2062
Ecoregion 2 New Hampshire-Vermont Upland
Intercept minus22579 10485
Islands 3179 1120 18045 2760 117970
Clarity 1047 0349 2952 1500 5810
Elevation 0004 0002 1004 1000 1007
Open water 150 lake 0287 0136 1383 1153 1658
Open water 500 lake 0405 01145 1499 1198 1877
Open water 500 nest 01064 00485 0890 0810 0979
pH 272 10139 15195 2083 110844
Road density 500 lake minus0158 0064 0880 0789 0983
Distance to loon lake minus03619 0129 0691 0491 0971
Agricultural 500 lake minus03143 01489 0730 0545 0978
Forest 150 nest minus00856 00346 0913 0853 0977
Wetland 150 nest minus00793 00346 0920 0859 0985
Road density 150 nest minus00647 00286 0927 0877 0980
Ecoregion 3 Southern New England Coastal Hills and Plain
Intercept minus4550 0217
Elevation 0006 0001 1004 1000 1009
Lake size 1180 0158 3254 1640 6456
Clarity 01714 02835 1187 0681 2069
Distance to loon lake minus02183 0124 1000 1000 1000
Phosphorous minus179503 3190 lt 0001 lt 0001 lt 0001
(cond)
Avian Conservation and Ecology 6(1) 4httpwwwace-ecoorgvol6iss1art4
New Hampshire Statewide
Intercept minus73821 12467
Open water 150 lake 01150 00200 1122 1079 1167
Elevation 0001 0001 1001 1000 1002
Islands 10674 04210 2908 1274 6637
Clarity 05948 01503 1813 1350 2434
Distance to population center 02105 00797 1234 1056 1443
Distance to loon lake minus02331 00732 0792 0686 0914
Road density 150 lake minus00327 00148 0968 0940 0996
1987 Wiens et al 1987 Saab 1999 Meyer et al2002 Graf et al 2005 Kristan 2006 Lawler andEdwards 2006 Thogmartin 2007) The multiscalemodels within each ecoregion have substantialempirical support in describing breeding habitatsuggesting that Common Loon in New Hampshireis responding to environmental cues at scalesranging from broad catchment to finer riparian areassurrounding lakes as well as within lakes at thenesting scale Loons also appear to be selectinghabitat differently across the ecoregions based onthe varying landscape conditions they encounteracross New Hampshire This differential selectionof breeding habitat across ecoregions providesinformation for prioritizing conservation andfocusing management efforts in New HampshireConservation efforts in the northern ecoregionshould be focused on preserving the relatively lowerlevels of human activity and disturbance pressuressurrounding these northern lakes by preventingincreases in road density and construction nearlakes especially within the immediate shoreline oflarger lakes Loon conservation and managementactivities in the two southern ecoregions shouldfocus on reducing the effects of already existinghuman disturbances on water quality by mitigatingsources of phosphorous that can also directly affectclarity Other activities in these regions shouldinclude the prioritization for protection of high-quality nesting habitat such as small islands andundisturbed areas of lakes and preventingdevelopment in critical loon habitat Our resultssuggest that conservation strategies for CommonLoon should also consider environmental
influences beyond the immediate lake or riparianscale as the analysis demonstrates that loons arealso responding to landscape-level and catchment-scale conditions surrounding lakes
Responses to this article can be read online athttpwwwace-ecoorgvol6iss1art4responses
Acknowledgments
We thank the many people who share our interest inCommon Loon research and conservation Weappreciate the statistical assistance and advice ofDr James Heltshe and helpful advice fromreviewers of early drafts Drs James Lake BryanMilstead and Rick McKinney as well as that of theanonymous reviewers who contributed to the finalversion of this manuscript This is contributionnumber AED-10-048 of the Atlantic EcologyDivision National Health and EnvironmentalEffects Research Laboratory Office of Researchand Development US Environmental ProtectionAgency Although the research described in thiscontribution has been funded wholly by the USEnvironmental Protection Agency it has not beensubjected to Agency-level review Therefore it doesnot necessarily reflect the views of the AgencyMention of trade names products or services doesnot constitute endorsement or recommendation foruse
Avian Conservation and Ecology 6(1) 4httpwwwace-ecoorgvol6iss1art4
LITERATURE CITED
Agresti A 1996 An introduction to categoricaldata analysisWiley New York New York USA
Alvo R D J T Hussell and M Berrill 1988 Thebreeding success of common loons (Gavia immer)in relation to alkalinity and other lake characteristicsin Ontario Canadian Journal of Zoology 66(3)746-752
Anderson D R 2008 Model based inferences inthe life sciences a primer on evidence SpringerNew York New York USA doi101007978-0-387-74075-1
Anderson J R E E Hardy J T Roach and R EWitmer 1976 A land use and land coverclassification system for use with remote sensordata Geological Survey Professional Paper 964 US Geological Survey Washington DC USA
Austin M 2007 Species distribution models andecological theory a critical assessment and somepossible new approaches Ecological Modelling 200(1-2)1-19 doi101016jecolmodel200607005
Barr J F 1986 Population dynamics of thecommon loon associated with mercury-contaminatedwaters in northwestern Ontario Occasional PaperNumber 56 Canadian Wildlife Service OttawaCanada
Battin J and J J Lawler 2006 Cross-scalecorrelations and the design of avian-habitatselection studies Condor 10859-70 doi1016500010-5422(2006)108[0059CCATDA]20CO2
Blair R B 1992 Lake features water quality andthe summer distribution of Common Loons in NewHampshire Journal of Field Ornithology 63(1)1-9
Burgess N M D C Evers and J D Kaplan 2005Mercury and other contaminants in Common Loonsbreeding in Atlantic Canada Ecotoxicology 14(1-2)241-252 doi101007s10646-004-6271-0
Burnham K P and D R Anderson 2002 Modelselection and multimodel inference a practicalinformation-theoretic approach Second editionSpringer New York New York USA
Cox D R and E J Snell 1989 Analysis of binarydata Second edition Chapman amp Hall LondonUK
Cushman S A and K McGarigal 2002Hierarchical multi-scale decomposition of species-environment relationships Landscape Ecology 17(7)637-646 doi101023A1021571603605
Cushman S A and K McGarigal 2004Hierarchical analysis of forest bird species-environment relationships in the Oregon CoastRange Ecological Applications 14(4)1090-1105 doi10189003-5131
Deppe J L and J T Rotenberry 2008 Scale-dependent habitat use by fall migratory birdsvegetation structure floristics and geographyEcological Monographs 78(3)461-487 doi10189007-01631
Desorbo C R K M Taylor D E Kramer J FairJ H Cooley Jr D C Evers W Hanson H SVogel and J L Atwood 2007 Reproductiveadvantages for Common Loons using rafts Journalof Wildlife Management 71(4)1206-1213 doi1021932006-422
Driscoll M J L T Donovan R Mickey AHoward and K K Fleming 2005 Determinants ofwood thrush nest success a multi-scale modelselection approach Journal of Wildlife Management 69(2)699-709 doi1021930022-541X(2005)069[0699DOWTNS]20CO2
Earnst S L R Platte and L Bond 2006 Alandscape-scale model of yellow-billed loon (Gaviaadamsii) habitat preferences in northern AlaskaHydrobiologia 567(1)227-236 doi101007s10750-006-0042-2
Edwards T C Jr G G Moisen T S Frescinoand J J Lawler 2003 Modeling multipleecological scales to link landscape theory to wildlifeconservation Pages 153-172 in J A Bissonette andI Storch editors Landscape ecology and resourcemanagement linking theory with practice IslandPress Washington DC USA
Environmental Systems Research Institute 2009ArcInfo geographic information system (GIS)software Version 91 Redlands California USA
Avian Conservation and Ecology 6(1) 4httpwwwace-ecoorgvol6iss1art4
Estrella A 1998 A new measure of fit for equationswith dichotomous dependent variables Journal ofBusiness and Economic Statistics 16(2)198-205 doi1023071392575
Evers D C 2001 Common Loon populationstudies continental mercury patterns and breedingterritory philopatry Dissertation University ofMinnesota St Paul Minnesota USA
Evers D C 2007 Status assessment andconservation plan for the Common Loon (Gaviaimmer) in North America BRI Report 2007-20 US Fish and Wildlife Service Hadley MassachusettsUSA
Evers D C L J Savoy C R DeSorbo D EYates W Hanson K M Taylor L Siegel J HCooley M S Bank A Major K Munney BMower H S Vogel N Schoch M Pokras M WGoodale and J Fair 2008 Adverse effects fromenvironmental mercury loads on breeding commonloons Ecotoxicology 17(2)69-81 doi101007s10646-007-0168-7
Fielding A H and J F Bell 1997 A review ofmethods for the assessment of prediction errors inconservation presenceabsence models EnvironmentalConservation 24(1)38-49 doi101017S0376892997000088
Fortin M-J and M R T Dale 2005 Spatialanalysis a guide for ecologists CambridgeUniversity Press Cambridge UK
Found C S M Webb and M S Boyce 2008Selection of lake habitats by waterbirds in the borealtransition zone of northeastern Alberta CanadianJournal of Zoology 86(4)277-285 doi101139Z07-137
Fraterrigo J M and J A Downing 2008 Theinfluence of land use on lake nutrients varies withwatershed transport capacity Ecosystems 11(7)1021-1034 doi101007s10021-008-9176-6
Freemark K E D Bert and M A Villard 2002Patch- landscape- and regional-scale effects onbiota Pages 58-83 in K J Gutzwiller editorApplying landscape ecology in biologicalconservation Springer New York New YorkUSA
Gamma Design Software 2001 GS+ geostatisticsfor the environmental sciences PlainwellMichigan USA
Garshellis D L 2000 Delusions in habitatevaluation measuring use selection andimportance Pages 111-153 in L Boitani and T KFuller editors Research techniques in animalecology controversies and consequences ColumbiaUniversity Press New York New York USA
Goldstein H 2003 Multilevel statistical models Third edition Hodder Arnold London UK
Graf R F K Bollmann W Suter and HBugmann 2005 The importance of spatial scale inhabitat models Capercaillie in the Swiss AlpsLandscape Ecology 20(6)703-717 doi101007s10980-005-0063-7
Graham M H 2003 Confronting multicollinearityin ecological multiple regression Ecology 842809-2815 doi10189002-3114
Gutzwiller K J and S H Anderson 1987Multiscale associations between cavity-nestingbirds and features of Wyoming streamsidewoodlands Condor 89534-548 doi1023071368643
Hames R S J D Lowe S Barker Swarthout andK V Rosenberg 2006 Understanding the risk toneotropical migrant bird species of multiple human-caused stressors elucidating processes behindpatterns Ecology and Society 11(1) 24 [online]URL httpwwwecologyandsocietyorgvol11iss1art24
Hammond C A M 2008 A demographic andlandscape analysis for common loons in northwestMontana Thesis University of Montana MissoulaMontana USA [online] URL httpetdlibumteduthesesavailableetd-04242008-130448
Heimberger M D Euler and J Barr 1983 Theimpact of cottage development on Common Loonreproductive success in central Ontario WilsonBulletin 95(3)431-439
Heinz H T Waldhoumlr and M Mittlboumlck 2005Careful use of pseudo R-squared measures inepidemiological studies Statistics in Medicine 24(18)2867-2872 doi101002sim2168
Avian Conservation and Ecology 6(1) 4httpwwwace-ecoorgvol6iss1art4
Hollister J W P V August J F Paul and H AWalker 2008 Predicting estuarine sediment metalconcentrations and inferred ecological conditionsan information theoretic approach Journal ofEnvironmental Quality 37(1)234-244 doi102134jeq20070105
Hosmer D W and S Lemeshow 2000 Appliedlogistic regression analysis Second edition WileyNew York New York USA doi1010020471722146
Hutchinson G E 1957 A treatise of limnologyVolume 1 geography physics and chemistry WileyNew York New York USA
Johnson J B and K S Omland 2004 Modelselection in ecology and evolution Trends inEcology and Evolution 19(2)101-108 doi101016jtree200310013
Johnson M D 2007 Measuring habitat quality areview Condor 109(3)489-504 doi10165083471
Johnston C A and B A Shmagin 2006 Scaleissues in lake-watershed interactions assessingshoreline development impacts on water clarityPages 297-313 in J Wu K B Jones H Li and OL Loucks editors Scaling and uncertainty analysisin ecology methods and applications SpringerDordrecht The Netherlands
Jung R E 1991 Effects of human activities andlake characteristics on the behavior and breedingsuccess of Common Loons Passenger Pigeon 53207-218
Kamman N C N M Burgess C T Driscoll HA Simonin W Goodale J Linehan R EstabrookM Hutcheson A Major A M Scheuhammer andD A Scruton 2005 Mercury in freshwater fish ofnortheast North America a geographic perspectivebased on fish tissue monitoring databasesEcotoxicology 14(1-2)163-180 doi101007s10646-004-6267-9
Kristan W B III 2006 Sources and expectationsfor hierarchical structure in bird-habitat associationsCondor 108(1)5-12 doi1016500010-5422(2006)108[0005SAEFHS]20CO2
Kristan W B III and J M Scott 2006Hierarchical models for avian ecologists Condor 108(1)1-4 doi1016500010-5422(2006)108[0001HMFAE]20CO2
Kuhn-Hines A 2008 A multiscale approach tobreeding habitat model development and evaluationfor the common loon Gavia immer in NewHampshire USA ETD Collection for University ofRhode Island Paper AAI3346850 [online] URL httpdigitalcommonsuriedudissertationsAAI3346850
Lawler J J and T C Edwards Jr 2006 Avariance-decomposition approach to investigatingmultiscale habitat associations Condor 108(1)47-58 doi1016500010-5422(2006)108[0047AVATIM]20CO2
Li X D Li Z Ma and D Schneider 2006 Nestsite use by crested ibis dependence of a multifactormodel on spatial scale Landscape Ecology 21(8)1207-1216 doi101007s10980-006-0021-z
Loon Preservation Committee 2004 Fieldcollection protocol for surveying and managingCommon Loons in New Hampshire LoonPreservation Committee Moultonborough NewHampshire USA
Loon Preservation Committee 2005 Meeting thechallenge thirty years of preserving loons and theirhabitats in New Hampshire Loon PreservationCommittee Moultonborough New HampshireUSA
Luck G W 2002 The habitat requirements of therufous treecreeper (Climacteris rufa) 1 Preferentialhabitat use demonstrated at multiple spatial scalesBiological Conservation 105(3)383-394 doi101016S0006-3207(01)00222-1
MacKenzie D I 2005 Was it there Dealing withimperfect detection for species presenceabsencedata Australian and New Zealand Journal ofStatistics 47(1)65-74 doi101111j1467-842X200500372x
MacKenzie D I J D Nichols J E Hines M GKnutson and A B Franklin 2003 Estimating siteoccupancy colonization and local extinction whena species is detected imperfectly Ecology 84(8)2200-2207 doi10189002-3090
Avian Conservation and Ecology 6(1) 4httpwwwace-ecoorgvol6iss1art4
Martin S L and P A Soranno 2006 Lakelandscape position relationships to hydrologicconnectivity and landscape features Limnology andOceanography 51(2)801-814 doi104319lo20065120801
McGarigal K and B J Marks 1995 FRAGSTATSspatial pattern analysis program for quantifyinglandscape structure General Technical ReportPNW-GTR-351 US Department of AgricultureForest Service Washington DC USA
McIntyre J W 1983 Nurseries a consideration ofhabitat requirements during the early chick-rearingperiod in common loons Journal of FieldOrnithology 54(3)247-253
McIntyre J W 1988 The Common Loon spirit ofnorthern lakes University of Minnesota PressMinneapolis Minnesota USA
McIntyre J W and J F Barr 1997 Common loonGavia immer In A Poole and F Gill editors TheBirds of North America 313 Academy of NaturalSciences of Philadelphia and American OrnithologistsUnion Washington DC USA
Menard S 2002 Applied logistic regressionanalysis Second edition Sage PublicationsThousand Oaks California USA
Meyer C B S L Miller and C J Ralph 2002Multi-scale landscape and seascape patternsassociated with marbeled murrelet nesting areas onthe US west coast Landscape Ecology 17(2)95-115 doi101023A1016574928706
Meyer M W 2006 Evaluating the impact ofmultiple stressors on Common Loon populationdemographics-an integrated laboratory and fieldapproach EPA STAR Co-operative AgreementNumber R82-9085 Environmental ProtectionAgency Washington DC USA
Meyer M W D C Evers J J Hartigan and P SRasmussen 1998 Patterns of common loon (Gaviaimmer) mercury exposure reproduction andsurvival in Wisconsin USA EnvironmentalToxicology and Chemistry 17(2)184-190
Meyer M W and J E Woodford 1996Enhancing osprey (Pandion haliaetus) and commonloon (Gavia immer) reproduction on impacted
Wisconsin waterways Final report US Fish andWildlife Service Washington DC USA
Moran P A P 1950 Notes on continuousstochastic phenomena Biometrika 37(1-2)17-23 doi101093biomet371-217
Murtagh P A and P S Pooler 2006 Evaluatingecological indicators lakes in the northeasternUnited States Environmental Monitoring andAssessment 119(1-3)83-96 doi101007s10661-005-9011-x
New Hampshire Department of EnvironmentalServices 2005 Water quality data survey summaryfor New Hampshire lakes and ponds NewHampshire Department of Environmental ServicesNew Hampshire USA [online] URL httpdesnhgovorganizationdivisionswaterwmblakestrophic_summaryhtm
New Hampshire Department of EnvironmentalServices 2006 Community center areas NewHampshire Department of Environmental ServicesNew Hampshire USA [online] URL httpwwwgranitunhedudatadatacatpagescommunitycenterareaspdf
Newbrey J L M A Bozek and N D Niemuth2005 Effects of lake characteristics and humandisturbance on the presence of piscivorous birds innorthern Wisconsin USA Waterbirds 28(4)478-486 doi1016751524-4695(2005)28[478EOLCAH]20CO2
Nocera J J G J Forbes and G R Milton 2008The relevance of local-scale relationships to habitatmanagement and landscape patterns AvianConservation and Ecology - Eacutecologie etconservation des oiseaux 3(1) 4 [online] URL httpwwwace-ecoorgvol3iss1art4
Northeast Loon Study Work Group 2008 [online]URL httpwwwbriloonorgscience-and-conservationcentersNELSWGphp
OrsquoBrien R M 2007 A caution regarding rules ofthumb for variance inflation factors Quality ampQuantity 41(5)673-690 doi101007s11135-006-9018-6
Patton D R 1975 A diversity index for quantifyinghabitat lsquoedgersquo Wildlife Society Bulletin 3171-173
Avian Conservation and Ecology 6(1) 4httpwwwace-ecoorgvol6iss1art4
Penhollow M E and D F Stauffer 2000 Large-scale habitat relationships of neotropical migratorybirds in Virginia Journal of Wildlife Management 64(2)362-373 doi1023073803234
Piper W H C Walcott J N Mager III M PeralaK B Tischler E Harrington A J Turcotte MSchwabenlander and N Banfield 2006 Prospectingin a solitary breeder chick production elicitsterritorial intrusions in common loons BehavioralEcology 17(6)881-888 doi101093behecoarl021
Piper W H C Walcott J N Mager and F JSpilker 2008 Nestsite selection by male loons leadsto sex-biased site familiarity Journal of AnimalEcology 77(2)205-210 doi101111j1365-2656200701334x
Rimmer C C 1992 Common Loon Gavia immer Pages 3-30 in K J Schneider and D M Penceeditors Migratory nongame birds managementconcern in the Northeast US Fish and WildlifeService Newton Corner Massachusetts USA
Riitters K H R V OrsquoNeill and K B Jones 1997Assessing habitat suitability at multiple scales alandscape-level approach Biological Conservation 81(1-2)191-202 doi101016S0006-3207(96)00145-0
Saab V 1999 Importance of spatial scale to habitatuse by breeding birds in riparian forests ahierarchical analysis Ecological Applications 9(1)135-151 doi1018901051-0761(1999)009[0135IOSSTH]20CO2
SAS Institute Inc 2003 SAS 91 Cary NorthCarolina USA
Scott J M P J Heglund M L Morrison J BHaufler M G Raphael W A Wall and F BSamson editors 2002 Predicting speciesoccurrences issues of accuracy and scale IslandPress Washington DC USA
Society for Protection of New Hampshire Forests2005 New Hampshirersquos changing landscapepopulation growth and land use changes Societyfor Protection of New Hampshire Forests [online]URL httpwwwforestsocietyorgresearchresearch-projectsasp
Soranno P A K E Webster K S Cheruvelil andM T Bremigan 2009 The lake landscape-contextframework linking aquatic connections terrestrialfeatures and human effects at multiple scalesVerhandlungen des Internationalen Verein Limnologie 30(5)695-700
Sperduto D D and W F Nichols 2004 Naturalcommunities of New Hampshire New HampshireNatural Heritage Bureau Concord New HampshireUSA and University of New HampshireCooperative Extension Durham New HampshireUSA
SPSS Inc 1999 SPSS 100 Chicago Illinois USA
Stauffer H B C J Ralph and S L Miller 2004Ranking habitat for marbled murrelets a newconservation approach for species with uncertaindetection Ecological Applications 14(5)1374-1383doi10189003-5068
Stein B A and S R Flack 1997 1997 speciesreport card the status of US plants and animals The Nature Conservancy Arlington VirginiaUSA [online] URL httpwwwnatureserveorglibrary1997speciesreportcardpdf
Strauss B and R Biedermann 2007 Evaluatingtemporal and spatial generality How valid arespecies-habitat relationship models EcologicalModeling 204104-114 doi101016jecolmodel200612027
Strong P I V and J A Bissonette 1989 Feedingand chick-rearing areas of common loons Journalof Wildlife Management 5372-76 doi1023073801308
Strong P I V J A Bissonette and J S Fair 1987Reuse of nesting and nursery areas by CommonLoons Journal of Wildlife Management 51123-127doi1023073801642
Taylor K M and H S Vogel 2000 NewHampshire report Pages 110-113 in J McIntyre andD C Evers editors Loons old history and newfindings Proceedings symposium 1997 meetingAmerican Ornithologists Union North AmericanLoon Fund Holderness New Hampshire USA
Thogmartin W E 2007 Effects at the landscapescale may constrain habitat relations at finer scales
Avian Conservation and Ecology 6(1) 4httpwwwace-ecoorgvol6iss1art4
Avian Conservation and Ecology - Eacutecologie etconservation des oiseaux 2(2) 6 [online] URL URL httpwwwace-ecoorgvol2iss2art6
Thogmartin W E and M G Knutson 2007Scaling local species-habitat relations to the largerlandscape with a hierarchical spatial count modelLandscape Ecology 22(1)61-75 doi101007s10980-006-9005-2
Thompson C M and K McGarigal 2002 Theinfluence of research scale on bald eagle habitatselection along the lower Hudson River New York(USA) Landscape Ecology 17(6)569-586 doi101023A1021501231182
Titus J R and L W VanDruff 1981 Responseof the common loon to recreational pressure in theBoundary Waters Canoe Area northeasternMinnesota Wildlife Monographs 791-60
Trocki C L and P W C Paton 2006 Assessinghabitat selection by foraging egrets in salt marshesat multiple spatial scales Wetlands 26(2)307-312 doi1016720277-5212(2006)26[307AHSBFE]20CO2
Turner M G 2005 Landscape ecology What isthe state of the science Annual Review of EcologyEvolution and Systematics 36319-344 doi101146annurevecolsys36102003152614
Tyre A J B Tenhumberg S A Field D NiejalkeK Parris and H P Possingham 2003 Improvingprecision and reducing bias in biological surveysestimating false-negative error rates EcologicalApplications 13(6)1790-1801 doi10189002-5078
Vermeer K 1973 Some aspects of the nestingrequirements of common loons in Alberta WilsonBulletin 85429-435
Wiens J A 1989 Spatial scaling in ecologyFunctional Ecology 3385-397 doi1023072389612
Wiens J A 2002 Riverine landscapes takinglandscape ecology into the water FreshwaterBiology 47(4)501-515 doi101046j1365-2427200200887x
Wiens J A J T Rotenberry and B van Horne1987 Habitat occupancy patterns of North
American shrubsteppe birds the effects of spatialscale Oikos 48132-147 doi1023073565849
Wilcove D S D Rothstein J Dubow A Phillipsand E Losos 1998 Quantifying threats to imperiledspecies in the United States Bioscience 48607-615doi1023071313420
Wu J 2004 Effects of changing scale on landscapepattern analysis scaling relations LandscapeEcology 19(2)125-138 doi101023BLAND000002171140074ae
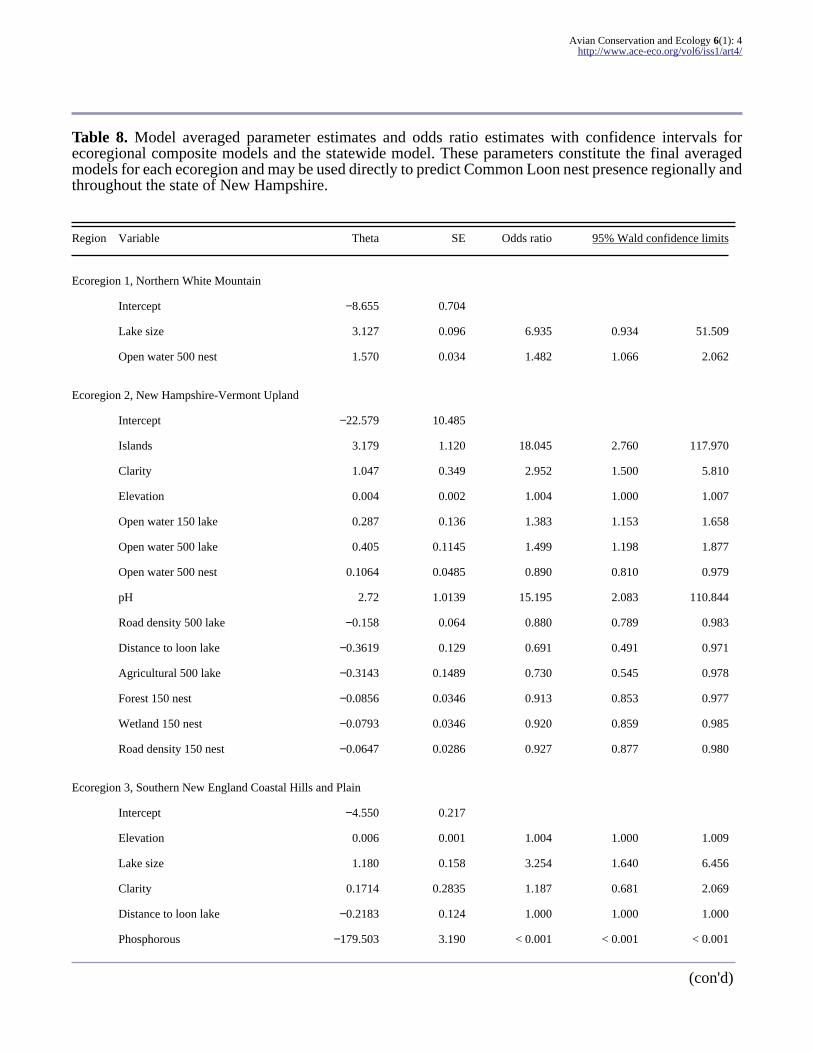
Avian Conservation and Ecology 6(1) 4httpwwwace-ecoorgvol6iss1art4
Table 8 Model averaged parameter estimates and odds ratio estimates with confidence intervals forecoregional composite models and the statewide model These parameters constitute the final averagedmodels for each ecoregion and may be used directly to predict Common Loon nest presence regionally andthroughout the state of New Hampshire
Region Variable Theta SE Odds ratio 95 Wald confidence limits
Ecoregion 1 Northern White Mountain
Intercept minus8655 0704
Lake size 3127 0096 6935 0934 51509
Open water 500 nest 1570 0034 1482 1066 2062
Ecoregion 2 New Hampshire-Vermont Upland
Intercept minus22579 10485
Islands 3179 1120 18045 2760 117970
Clarity 1047 0349 2952 1500 5810
Elevation 0004 0002 1004 1000 1007
Open water 150 lake 0287 0136 1383 1153 1658
Open water 500 lake 0405 01145 1499 1198 1877
Open water 500 nest 01064 00485 0890 0810 0979
pH 272 10139 15195 2083 110844
Road density 500 lake minus0158 0064 0880 0789 0983
Distance to loon lake minus03619 0129 0691 0491 0971
Agricultural 500 lake minus03143 01489 0730 0545 0978
Forest 150 nest minus00856 00346 0913 0853 0977
Wetland 150 nest minus00793 00346 0920 0859 0985
Road density 150 nest minus00647 00286 0927 0877 0980
Ecoregion 3 Southern New England Coastal Hills and Plain
Intercept minus4550 0217
Elevation 0006 0001 1004 1000 1009
Lake size 1180 0158 3254 1640 6456
Clarity 01714 02835 1187 0681 2069
Distance to loon lake minus02183 0124 1000 1000 1000
Phosphorous minus179503 3190 lt 0001 lt 0001 lt 0001
(cond)
Avian Conservation and Ecology 6(1) 4httpwwwace-ecoorgvol6iss1art4
New Hampshire Statewide
Intercept minus73821 12467
Open water 150 lake 01150 00200 1122 1079 1167
Elevation 0001 0001 1001 1000 1002
Islands 10674 04210 2908 1274 6637
Clarity 05948 01503 1813 1350 2434
Distance to population center 02105 00797 1234 1056 1443
Distance to loon lake minus02331 00732 0792 0686 0914
Road density 150 lake minus00327 00148 0968 0940 0996
1987 Wiens et al 1987 Saab 1999 Meyer et al2002 Graf et al 2005 Kristan 2006 Lawler andEdwards 2006 Thogmartin 2007) The multiscalemodels within each ecoregion have substantialempirical support in describing breeding habitatsuggesting that Common Loon in New Hampshireis responding to environmental cues at scalesranging from broad catchment to finer riparian areassurrounding lakes as well as within lakes at thenesting scale Loons also appear to be selectinghabitat differently across the ecoregions based onthe varying landscape conditions they encounteracross New Hampshire This differential selectionof breeding habitat across ecoregions providesinformation for prioritizing conservation andfocusing management efforts in New HampshireConservation efforts in the northern ecoregionshould be focused on preserving the relatively lowerlevels of human activity and disturbance pressuressurrounding these northern lakes by preventingincreases in road density and construction nearlakes especially within the immediate shoreline oflarger lakes Loon conservation and managementactivities in the two southern ecoregions shouldfocus on reducing the effects of already existinghuman disturbances on water quality by mitigatingsources of phosphorous that can also directly affectclarity Other activities in these regions shouldinclude the prioritization for protection of high-quality nesting habitat such as small islands andundisturbed areas of lakes and preventingdevelopment in critical loon habitat Our resultssuggest that conservation strategies for CommonLoon should also consider environmental
influences beyond the immediate lake or riparianscale as the analysis demonstrates that loons arealso responding to landscape-level and catchment-scale conditions surrounding lakes
Responses to this article can be read online athttpwwwace-ecoorgvol6iss1art4responses
Acknowledgments
We thank the many people who share our interest inCommon Loon research and conservation Weappreciate the statistical assistance and advice ofDr James Heltshe and helpful advice fromreviewers of early drafts Drs James Lake BryanMilstead and Rick McKinney as well as that of theanonymous reviewers who contributed to the finalversion of this manuscript This is contributionnumber AED-10-048 of the Atlantic EcologyDivision National Health and EnvironmentalEffects Research Laboratory Office of Researchand Development US Environmental ProtectionAgency Although the research described in thiscontribution has been funded wholly by the USEnvironmental Protection Agency it has not beensubjected to Agency-level review Therefore it doesnot necessarily reflect the views of the AgencyMention of trade names products or services doesnot constitute endorsement or recommendation foruse
Avian Conservation and Ecology 6(1) 4httpwwwace-ecoorgvol6iss1art4
LITERATURE CITED
Agresti A 1996 An introduction to categoricaldata analysisWiley New York New York USA
Alvo R D J T Hussell and M Berrill 1988 Thebreeding success of common loons (Gavia immer)in relation to alkalinity and other lake characteristicsin Ontario Canadian Journal of Zoology 66(3)746-752
Anderson D R 2008 Model based inferences inthe life sciences a primer on evidence SpringerNew York New York USA doi101007978-0-387-74075-1
Anderson J R E E Hardy J T Roach and R EWitmer 1976 A land use and land coverclassification system for use with remote sensordata Geological Survey Professional Paper 964 US Geological Survey Washington DC USA
Austin M 2007 Species distribution models andecological theory a critical assessment and somepossible new approaches Ecological Modelling 200(1-2)1-19 doi101016jecolmodel200607005
Barr J F 1986 Population dynamics of thecommon loon associated with mercury-contaminatedwaters in northwestern Ontario Occasional PaperNumber 56 Canadian Wildlife Service OttawaCanada
Battin J and J J Lawler 2006 Cross-scalecorrelations and the design of avian-habitatselection studies Condor 10859-70 doi1016500010-5422(2006)108[0059CCATDA]20CO2
Blair R B 1992 Lake features water quality andthe summer distribution of Common Loons in NewHampshire Journal of Field Ornithology 63(1)1-9
Burgess N M D C Evers and J D Kaplan 2005Mercury and other contaminants in Common Loonsbreeding in Atlantic Canada Ecotoxicology 14(1-2)241-252 doi101007s10646-004-6271-0
Burnham K P and D R Anderson 2002 Modelselection and multimodel inference a practicalinformation-theoretic approach Second editionSpringer New York New York USA
Cox D R and E J Snell 1989 Analysis of binarydata Second edition Chapman amp Hall LondonUK
Cushman S A and K McGarigal 2002Hierarchical multi-scale decomposition of species-environment relationships Landscape Ecology 17(7)637-646 doi101023A1021571603605
Cushman S A and K McGarigal 2004Hierarchical analysis of forest bird species-environment relationships in the Oregon CoastRange Ecological Applications 14(4)1090-1105 doi10189003-5131
Deppe J L and J T Rotenberry 2008 Scale-dependent habitat use by fall migratory birdsvegetation structure floristics and geographyEcological Monographs 78(3)461-487 doi10189007-01631
Desorbo C R K M Taylor D E Kramer J FairJ H Cooley Jr D C Evers W Hanson H SVogel and J L Atwood 2007 Reproductiveadvantages for Common Loons using rafts Journalof Wildlife Management 71(4)1206-1213 doi1021932006-422
Driscoll M J L T Donovan R Mickey AHoward and K K Fleming 2005 Determinants ofwood thrush nest success a multi-scale modelselection approach Journal of Wildlife Management 69(2)699-709 doi1021930022-541X(2005)069[0699DOWTNS]20CO2
Earnst S L R Platte and L Bond 2006 Alandscape-scale model of yellow-billed loon (Gaviaadamsii) habitat preferences in northern AlaskaHydrobiologia 567(1)227-236 doi101007s10750-006-0042-2
Edwards T C Jr G G Moisen T S Frescinoand J J Lawler 2003 Modeling multipleecological scales to link landscape theory to wildlifeconservation Pages 153-172 in J A Bissonette andI Storch editors Landscape ecology and resourcemanagement linking theory with practice IslandPress Washington DC USA
Environmental Systems Research Institute 2009ArcInfo geographic information system (GIS)software Version 91 Redlands California USA
Avian Conservation and Ecology 6(1) 4httpwwwace-ecoorgvol6iss1art4
Estrella A 1998 A new measure of fit for equationswith dichotomous dependent variables Journal ofBusiness and Economic Statistics 16(2)198-205 doi1023071392575
Evers D C 2001 Common Loon populationstudies continental mercury patterns and breedingterritory philopatry Dissertation University ofMinnesota St Paul Minnesota USA
Evers D C 2007 Status assessment andconservation plan for the Common Loon (Gaviaimmer) in North America BRI Report 2007-20 US Fish and Wildlife Service Hadley MassachusettsUSA
Evers D C L J Savoy C R DeSorbo D EYates W Hanson K M Taylor L Siegel J HCooley M S Bank A Major K Munney BMower H S Vogel N Schoch M Pokras M WGoodale and J Fair 2008 Adverse effects fromenvironmental mercury loads on breeding commonloons Ecotoxicology 17(2)69-81 doi101007s10646-007-0168-7
Fielding A H and J F Bell 1997 A review ofmethods for the assessment of prediction errors inconservation presenceabsence models EnvironmentalConservation 24(1)38-49 doi101017S0376892997000088
Fortin M-J and M R T Dale 2005 Spatialanalysis a guide for ecologists CambridgeUniversity Press Cambridge UK
Found C S M Webb and M S Boyce 2008Selection of lake habitats by waterbirds in the borealtransition zone of northeastern Alberta CanadianJournal of Zoology 86(4)277-285 doi101139Z07-137
Fraterrigo J M and J A Downing 2008 Theinfluence of land use on lake nutrients varies withwatershed transport capacity Ecosystems 11(7)1021-1034 doi101007s10021-008-9176-6
Freemark K E D Bert and M A Villard 2002Patch- landscape- and regional-scale effects onbiota Pages 58-83 in K J Gutzwiller editorApplying landscape ecology in biologicalconservation Springer New York New YorkUSA
Gamma Design Software 2001 GS+ geostatisticsfor the environmental sciences PlainwellMichigan USA
Garshellis D L 2000 Delusions in habitatevaluation measuring use selection andimportance Pages 111-153 in L Boitani and T KFuller editors Research techniques in animalecology controversies and consequences ColumbiaUniversity Press New York New York USA
Goldstein H 2003 Multilevel statistical models Third edition Hodder Arnold London UK
Graf R F K Bollmann W Suter and HBugmann 2005 The importance of spatial scale inhabitat models Capercaillie in the Swiss AlpsLandscape Ecology 20(6)703-717 doi101007s10980-005-0063-7
Graham M H 2003 Confronting multicollinearityin ecological multiple regression Ecology 842809-2815 doi10189002-3114
Gutzwiller K J and S H Anderson 1987Multiscale associations between cavity-nestingbirds and features of Wyoming streamsidewoodlands Condor 89534-548 doi1023071368643
Hames R S J D Lowe S Barker Swarthout andK V Rosenberg 2006 Understanding the risk toneotropical migrant bird species of multiple human-caused stressors elucidating processes behindpatterns Ecology and Society 11(1) 24 [online]URL httpwwwecologyandsocietyorgvol11iss1art24
Hammond C A M 2008 A demographic andlandscape analysis for common loons in northwestMontana Thesis University of Montana MissoulaMontana USA [online] URL httpetdlibumteduthesesavailableetd-04242008-130448
Heimberger M D Euler and J Barr 1983 Theimpact of cottage development on Common Loonreproductive success in central Ontario WilsonBulletin 95(3)431-439
Heinz H T Waldhoumlr and M Mittlboumlck 2005Careful use of pseudo R-squared measures inepidemiological studies Statistics in Medicine 24(18)2867-2872 doi101002sim2168
Avian Conservation and Ecology 6(1) 4httpwwwace-ecoorgvol6iss1art4
Hollister J W P V August J F Paul and H AWalker 2008 Predicting estuarine sediment metalconcentrations and inferred ecological conditionsan information theoretic approach Journal ofEnvironmental Quality 37(1)234-244 doi102134jeq20070105
Hosmer D W and S Lemeshow 2000 Appliedlogistic regression analysis Second edition WileyNew York New York USA doi1010020471722146
Hutchinson G E 1957 A treatise of limnologyVolume 1 geography physics and chemistry WileyNew York New York USA
Johnson J B and K S Omland 2004 Modelselection in ecology and evolution Trends inEcology and Evolution 19(2)101-108 doi101016jtree200310013
Johnson M D 2007 Measuring habitat quality areview Condor 109(3)489-504 doi10165083471
Johnston C A and B A Shmagin 2006 Scaleissues in lake-watershed interactions assessingshoreline development impacts on water clarityPages 297-313 in J Wu K B Jones H Li and OL Loucks editors Scaling and uncertainty analysisin ecology methods and applications SpringerDordrecht The Netherlands
Jung R E 1991 Effects of human activities andlake characteristics on the behavior and breedingsuccess of Common Loons Passenger Pigeon 53207-218
Kamman N C N M Burgess C T Driscoll HA Simonin W Goodale J Linehan R EstabrookM Hutcheson A Major A M Scheuhammer andD A Scruton 2005 Mercury in freshwater fish ofnortheast North America a geographic perspectivebased on fish tissue monitoring databasesEcotoxicology 14(1-2)163-180 doi101007s10646-004-6267-9
Kristan W B III 2006 Sources and expectationsfor hierarchical structure in bird-habitat associationsCondor 108(1)5-12 doi1016500010-5422(2006)108[0005SAEFHS]20CO2
Kristan W B III and J M Scott 2006Hierarchical models for avian ecologists Condor 108(1)1-4 doi1016500010-5422(2006)108[0001HMFAE]20CO2
Kuhn-Hines A 2008 A multiscale approach tobreeding habitat model development and evaluationfor the common loon Gavia immer in NewHampshire USA ETD Collection for University ofRhode Island Paper AAI3346850 [online] URL httpdigitalcommonsuriedudissertationsAAI3346850
Lawler J J and T C Edwards Jr 2006 Avariance-decomposition approach to investigatingmultiscale habitat associations Condor 108(1)47-58 doi1016500010-5422(2006)108[0047AVATIM]20CO2
Li X D Li Z Ma and D Schneider 2006 Nestsite use by crested ibis dependence of a multifactormodel on spatial scale Landscape Ecology 21(8)1207-1216 doi101007s10980-006-0021-z
Loon Preservation Committee 2004 Fieldcollection protocol for surveying and managingCommon Loons in New Hampshire LoonPreservation Committee Moultonborough NewHampshire USA
Loon Preservation Committee 2005 Meeting thechallenge thirty years of preserving loons and theirhabitats in New Hampshire Loon PreservationCommittee Moultonborough New HampshireUSA
Luck G W 2002 The habitat requirements of therufous treecreeper (Climacteris rufa) 1 Preferentialhabitat use demonstrated at multiple spatial scalesBiological Conservation 105(3)383-394 doi101016S0006-3207(01)00222-1
MacKenzie D I 2005 Was it there Dealing withimperfect detection for species presenceabsencedata Australian and New Zealand Journal ofStatistics 47(1)65-74 doi101111j1467-842X200500372x
MacKenzie D I J D Nichols J E Hines M GKnutson and A B Franklin 2003 Estimating siteoccupancy colonization and local extinction whena species is detected imperfectly Ecology 84(8)2200-2207 doi10189002-3090
Avian Conservation and Ecology 6(1) 4httpwwwace-ecoorgvol6iss1art4
Martin S L and P A Soranno 2006 Lakelandscape position relationships to hydrologicconnectivity and landscape features Limnology andOceanography 51(2)801-814 doi104319lo20065120801
McGarigal K and B J Marks 1995 FRAGSTATSspatial pattern analysis program for quantifyinglandscape structure General Technical ReportPNW-GTR-351 US Department of AgricultureForest Service Washington DC USA
McIntyre J W 1983 Nurseries a consideration ofhabitat requirements during the early chick-rearingperiod in common loons Journal of FieldOrnithology 54(3)247-253
McIntyre J W 1988 The Common Loon spirit ofnorthern lakes University of Minnesota PressMinneapolis Minnesota USA
McIntyre J W and J F Barr 1997 Common loonGavia immer In A Poole and F Gill editors TheBirds of North America 313 Academy of NaturalSciences of Philadelphia and American OrnithologistsUnion Washington DC USA
Menard S 2002 Applied logistic regressionanalysis Second edition Sage PublicationsThousand Oaks California USA
Meyer C B S L Miller and C J Ralph 2002Multi-scale landscape and seascape patternsassociated with marbeled murrelet nesting areas onthe US west coast Landscape Ecology 17(2)95-115 doi101023A1016574928706
Meyer M W 2006 Evaluating the impact ofmultiple stressors on Common Loon populationdemographics-an integrated laboratory and fieldapproach EPA STAR Co-operative AgreementNumber R82-9085 Environmental ProtectionAgency Washington DC USA
Meyer M W D C Evers J J Hartigan and P SRasmussen 1998 Patterns of common loon (Gaviaimmer) mercury exposure reproduction andsurvival in Wisconsin USA EnvironmentalToxicology and Chemistry 17(2)184-190
Meyer M W and J E Woodford 1996Enhancing osprey (Pandion haliaetus) and commonloon (Gavia immer) reproduction on impacted
Wisconsin waterways Final report US Fish andWildlife Service Washington DC USA
Moran P A P 1950 Notes on continuousstochastic phenomena Biometrika 37(1-2)17-23 doi101093biomet371-217
Murtagh P A and P S Pooler 2006 Evaluatingecological indicators lakes in the northeasternUnited States Environmental Monitoring andAssessment 119(1-3)83-96 doi101007s10661-005-9011-x
New Hampshire Department of EnvironmentalServices 2005 Water quality data survey summaryfor New Hampshire lakes and ponds NewHampshire Department of Environmental ServicesNew Hampshire USA [online] URL httpdesnhgovorganizationdivisionswaterwmblakestrophic_summaryhtm
New Hampshire Department of EnvironmentalServices 2006 Community center areas NewHampshire Department of Environmental ServicesNew Hampshire USA [online] URL httpwwwgranitunhedudatadatacatpagescommunitycenterareaspdf
Newbrey J L M A Bozek and N D Niemuth2005 Effects of lake characteristics and humandisturbance on the presence of piscivorous birds innorthern Wisconsin USA Waterbirds 28(4)478-486 doi1016751524-4695(2005)28[478EOLCAH]20CO2
Nocera J J G J Forbes and G R Milton 2008The relevance of local-scale relationships to habitatmanagement and landscape patterns AvianConservation and Ecology - Eacutecologie etconservation des oiseaux 3(1) 4 [online] URL httpwwwace-ecoorgvol3iss1art4
Northeast Loon Study Work Group 2008 [online]URL httpwwwbriloonorgscience-and-conservationcentersNELSWGphp
OrsquoBrien R M 2007 A caution regarding rules ofthumb for variance inflation factors Quality ampQuantity 41(5)673-690 doi101007s11135-006-9018-6
Patton D R 1975 A diversity index for quantifyinghabitat lsquoedgersquo Wildlife Society Bulletin 3171-173
Avian Conservation and Ecology 6(1) 4httpwwwace-ecoorgvol6iss1art4
Penhollow M E and D F Stauffer 2000 Large-scale habitat relationships of neotropical migratorybirds in Virginia Journal of Wildlife Management 64(2)362-373 doi1023073803234
Piper W H C Walcott J N Mager III M PeralaK B Tischler E Harrington A J Turcotte MSchwabenlander and N Banfield 2006 Prospectingin a solitary breeder chick production elicitsterritorial intrusions in common loons BehavioralEcology 17(6)881-888 doi101093behecoarl021
Piper W H C Walcott J N Mager and F JSpilker 2008 Nestsite selection by male loons leadsto sex-biased site familiarity Journal of AnimalEcology 77(2)205-210 doi101111j1365-2656200701334x
Rimmer C C 1992 Common Loon Gavia immer Pages 3-30 in K J Schneider and D M Penceeditors Migratory nongame birds managementconcern in the Northeast US Fish and WildlifeService Newton Corner Massachusetts USA
Riitters K H R V OrsquoNeill and K B Jones 1997Assessing habitat suitability at multiple scales alandscape-level approach Biological Conservation 81(1-2)191-202 doi101016S0006-3207(96)00145-0
Saab V 1999 Importance of spatial scale to habitatuse by breeding birds in riparian forests ahierarchical analysis Ecological Applications 9(1)135-151 doi1018901051-0761(1999)009[0135IOSSTH]20CO2
SAS Institute Inc 2003 SAS 91 Cary NorthCarolina USA
Scott J M P J Heglund M L Morrison J BHaufler M G Raphael W A Wall and F BSamson editors 2002 Predicting speciesoccurrences issues of accuracy and scale IslandPress Washington DC USA
Society for Protection of New Hampshire Forests2005 New Hampshirersquos changing landscapepopulation growth and land use changes Societyfor Protection of New Hampshire Forests [online]URL httpwwwforestsocietyorgresearchresearch-projectsasp
Soranno P A K E Webster K S Cheruvelil andM T Bremigan 2009 The lake landscape-contextframework linking aquatic connections terrestrialfeatures and human effects at multiple scalesVerhandlungen des Internationalen Verein Limnologie 30(5)695-700
Sperduto D D and W F Nichols 2004 Naturalcommunities of New Hampshire New HampshireNatural Heritage Bureau Concord New HampshireUSA and University of New HampshireCooperative Extension Durham New HampshireUSA
SPSS Inc 1999 SPSS 100 Chicago Illinois USA
Stauffer H B C J Ralph and S L Miller 2004Ranking habitat for marbled murrelets a newconservation approach for species with uncertaindetection Ecological Applications 14(5)1374-1383doi10189003-5068
Stein B A and S R Flack 1997 1997 speciesreport card the status of US plants and animals The Nature Conservancy Arlington VirginiaUSA [online] URL httpwwwnatureserveorglibrary1997speciesreportcardpdf
Strauss B and R Biedermann 2007 Evaluatingtemporal and spatial generality How valid arespecies-habitat relationship models EcologicalModeling 204104-114 doi101016jecolmodel200612027
Strong P I V and J A Bissonette 1989 Feedingand chick-rearing areas of common loons Journalof Wildlife Management 5372-76 doi1023073801308
Strong P I V J A Bissonette and J S Fair 1987Reuse of nesting and nursery areas by CommonLoons Journal of Wildlife Management 51123-127doi1023073801642
Taylor K M and H S Vogel 2000 NewHampshire report Pages 110-113 in J McIntyre andD C Evers editors Loons old history and newfindings Proceedings symposium 1997 meetingAmerican Ornithologists Union North AmericanLoon Fund Holderness New Hampshire USA
Thogmartin W E 2007 Effects at the landscapescale may constrain habitat relations at finer scales
Avian Conservation and Ecology 6(1) 4httpwwwace-ecoorgvol6iss1art4
Avian Conservation and Ecology - Eacutecologie etconservation des oiseaux 2(2) 6 [online] URL URL httpwwwace-ecoorgvol2iss2art6
Thogmartin W E and M G Knutson 2007Scaling local species-habitat relations to the largerlandscape with a hierarchical spatial count modelLandscape Ecology 22(1)61-75 doi101007s10980-006-9005-2
Thompson C M and K McGarigal 2002 Theinfluence of research scale on bald eagle habitatselection along the lower Hudson River New York(USA) Landscape Ecology 17(6)569-586 doi101023A1021501231182
Titus J R and L W VanDruff 1981 Responseof the common loon to recreational pressure in theBoundary Waters Canoe Area northeasternMinnesota Wildlife Monographs 791-60
Trocki C L and P W C Paton 2006 Assessinghabitat selection by foraging egrets in salt marshesat multiple spatial scales Wetlands 26(2)307-312 doi1016720277-5212(2006)26[307AHSBFE]20CO2
Turner M G 2005 Landscape ecology What isthe state of the science Annual Review of EcologyEvolution and Systematics 36319-344 doi101146annurevecolsys36102003152614
Tyre A J B Tenhumberg S A Field D NiejalkeK Parris and H P Possingham 2003 Improvingprecision and reducing bias in biological surveysestimating false-negative error rates EcologicalApplications 13(6)1790-1801 doi10189002-5078
Vermeer K 1973 Some aspects of the nestingrequirements of common loons in Alberta WilsonBulletin 85429-435
Wiens J A 1989 Spatial scaling in ecologyFunctional Ecology 3385-397 doi1023072389612
Wiens J A 2002 Riverine landscapes takinglandscape ecology into the water FreshwaterBiology 47(4)501-515 doi101046j1365-2427200200887x
Wiens J A J T Rotenberry and B van Horne1987 Habitat occupancy patterns of North
American shrubsteppe birds the effects of spatialscale Oikos 48132-147 doi1023073565849
Wilcove D S D Rothstein J Dubow A Phillipsand E Losos 1998 Quantifying threats to imperiledspecies in the United States Bioscience 48607-615doi1023071313420
Wu J 2004 Effects of changing scale on landscapepattern analysis scaling relations LandscapeEcology 19(2)125-138 doi101023BLAND000002171140074ae
Avian Conservation and Ecology 6(1) 4httpwwwace-ecoorgvol6iss1art4
New Hampshire Statewide
Intercept minus73821 12467
Open water 150 lake 01150 00200 1122 1079 1167
Elevation 0001 0001 1001 1000 1002
Islands 10674 04210 2908 1274 6637
Clarity 05948 01503 1813 1350 2434
Distance to population center 02105 00797 1234 1056 1443
Distance to loon lake minus02331 00732 0792 0686 0914
Road density 150 lake minus00327 00148 0968 0940 0996
1987 Wiens et al 1987 Saab 1999 Meyer et al2002 Graf et al 2005 Kristan 2006 Lawler andEdwards 2006 Thogmartin 2007) The multiscalemodels within each ecoregion have substantialempirical support in describing breeding habitatsuggesting that Common Loon in New Hampshireis responding to environmental cues at scalesranging from broad catchment to finer riparian areassurrounding lakes as well as within lakes at thenesting scale Loons also appear to be selectinghabitat differently across the ecoregions based onthe varying landscape conditions they encounteracross New Hampshire This differential selectionof breeding habitat across ecoregions providesinformation for prioritizing conservation andfocusing management efforts in New HampshireConservation efforts in the northern ecoregionshould be focused on preserving the relatively lowerlevels of human activity and disturbance pressuressurrounding these northern lakes by preventingincreases in road density and construction nearlakes especially within the immediate shoreline oflarger lakes Loon conservation and managementactivities in the two southern ecoregions shouldfocus on reducing the effects of already existinghuman disturbances on water quality by mitigatingsources of phosphorous that can also directly affectclarity Other activities in these regions shouldinclude the prioritization for protection of high-quality nesting habitat such as small islands andundisturbed areas of lakes and preventingdevelopment in critical loon habitat Our resultssuggest that conservation strategies for CommonLoon should also consider environmental
influences beyond the immediate lake or riparianscale as the analysis demonstrates that loons arealso responding to landscape-level and catchment-scale conditions surrounding lakes
Responses to this article can be read online athttpwwwace-ecoorgvol6iss1art4responses
Acknowledgments
We thank the many people who share our interest inCommon Loon research and conservation Weappreciate the statistical assistance and advice ofDr James Heltshe and helpful advice fromreviewers of early drafts Drs James Lake BryanMilstead and Rick McKinney as well as that of theanonymous reviewers who contributed to the finalversion of this manuscript This is contributionnumber AED-10-048 of the Atlantic EcologyDivision National Health and EnvironmentalEffects Research Laboratory Office of Researchand Development US Environmental ProtectionAgency Although the research described in thiscontribution has been funded wholly by the USEnvironmental Protection Agency it has not beensubjected to Agency-level review Therefore it doesnot necessarily reflect the views of the AgencyMention of trade names products or services doesnot constitute endorsement or recommendation foruse
Avian Conservation and Ecology 6(1) 4httpwwwace-ecoorgvol6iss1art4
LITERATURE CITED
Agresti A 1996 An introduction to categoricaldata analysisWiley New York New York USA
Alvo R D J T Hussell and M Berrill 1988 Thebreeding success of common loons (Gavia immer)in relation to alkalinity and other lake characteristicsin Ontario Canadian Journal of Zoology 66(3)746-752
Anderson D R 2008 Model based inferences inthe life sciences a primer on evidence SpringerNew York New York USA doi101007978-0-387-74075-1
Anderson J R E E Hardy J T Roach and R EWitmer 1976 A land use and land coverclassification system for use with remote sensordata Geological Survey Professional Paper 964 US Geological Survey Washington DC USA
Austin M 2007 Species distribution models andecological theory a critical assessment and somepossible new approaches Ecological Modelling 200(1-2)1-19 doi101016jecolmodel200607005
Barr J F 1986 Population dynamics of thecommon loon associated with mercury-contaminatedwaters in northwestern Ontario Occasional PaperNumber 56 Canadian Wildlife Service OttawaCanada
Battin J and J J Lawler 2006 Cross-scalecorrelations and the design of avian-habitatselection studies Condor 10859-70 doi1016500010-5422(2006)108[0059CCATDA]20CO2
Blair R B 1992 Lake features water quality andthe summer distribution of Common Loons in NewHampshire Journal of Field Ornithology 63(1)1-9
Burgess N M D C Evers and J D Kaplan 2005Mercury and other contaminants in Common Loonsbreeding in Atlantic Canada Ecotoxicology 14(1-2)241-252 doi101007s10646-004-6271-0
Burnham K P and D R Anderson 2002 Modelselection and multimodel inference a practicalinformation-theoretic approach Second editionSpringer New York New York USA
Cox D R and E J Snell 1989 Analysis of binarydata Second edition Chapman amp Hall LondonUK
Cushman S A and K McGarigal 2002Hierarchical multi-scale decomposition of species-environment relationships Landscape Ecology 17(7)637-646 doi101023A1021571603605
Cushman S A and K McGarigal 2004Hierarchical analysis of forest bird species-environment relationships in the Oregon CoastRange Ecological Applications 14(4)1090-1105 doi10189003-5131
Deppe J L and J T Rotenberry 2008 Scale-dependent habitat use by fall migratory birdsvegetation structure floristics and geographyEcological Monographs 78(3)461-487 doi10189007-01631
Desorbo C R K M Taylor D E Kramer J FairJ H Cooley Jr D C Evers W Hanson H SVogel and J L Atwood 2007 Reproductiveadvantages for Common Loons using rafts Journalof Wildlife Management 71(4)1206-1213 doi1021932006-422
Driscoll M J L T Donovan R Mickey AHoward and K K Fleming 2005 Determinants ofwood thrush nest success a multi-scale modelselection approach Journal of Wildlife Management 69(2)699-709 doi1021930022-541X(2005)069[0699DOWTNS]20CO2
Earnst S L R Platte and L Bond 2006 Alandscape-scale model of yellow-billed loon (Gaviaadamsii) habitat preferences in northern AlaskaHydrobiologia 567(1)227-236 doi101007s10750-006-0042-2
Edwards T C Jr G G Moisen T S Frescinoand J J Lawler 2003 Modeling multipleecological scales to link landscape theory to wildlifeconservation Pages 153-172 in J A Bissonette andI Storch editors Landscape ecology and resourcemanagement linking theory with practice IslandPress Washington DC USA
Environmental Systems Research Institute 2009ArcInfo geographic information system (GIS)software Version 91 Redlands California USA
Avian Conservation and Ecology 6(1) 4httpwwwace-ecoorgvol6iss1art4
Estrella A 1998 A new measure of fit for equationswith dichotomous dependent variables Journal ofBusiness and Economic Statistics 16(2)198-205 doi1023071392575
Evers D C 2001 Common Loon populationstudies continental mercury patterns and breedingterritory philopatry Dissertation University ofMinnesota St Paul Minnesota USA
Evers D C 2007 Status assessment andconservation plan for the Common Loon (Gaviaimmer) in North America BRI Report 2007-20 US Fish and Wildlife Service Hadley MassachusettsUSA
Evers D C L J Savoy C R DeSorbo D EYates W Hanson K M Taylor L Siegel J HCooley M S Bank A Major K Munney BMower H S Vogel N Schoch M Pokras M WGoodale and J Fair 2008 Adverse effects fromenvironmental mercury loads on breeding commonloons Ecotoxicology 17(2)69-81 doi101007s10646-007-0168-7
Fielding A H and J F Bell 1997 A review ofmethods for the assessment of prediction errors inconservation presenceabsence models EnvironmentalConservation 24(1)38-49 doi101017S0376892997000088
Fortin M-J and M R T Dale 2005 Spatialanalysis a guide for ecologists CambridgeUniversity Press Cambridge UK
Found C S M Webb and M S Boyce 2008Selection of lake habitats by waterbirds in the borealtransition zone of northeastern Alberta CanadianJournal of Zoology 86(4)277-285 doi101139Z07-137
Fraterrigo J M and J A Downing 2008 Theinfluence of land use on lake nutrients varies withwatershed transport capacity Ecosystems 11(7)1021-1034 doi101007s10021-008-9176-6
Freemark K E D Bert and M A Villard 2002Patch- landscape- and regional-scale effects onbiota Pages 58-83 in K J Gutzwiller editorApplying landscape ecology in biologicalconservation Springer New York New YorkUSA
Gamma Design Software 2001 GS+ geostatisticsfor the environmental sciences PlainwellMichigan USA
Garshellis D L 2000 Delusions in habitatevaluation measuring use selection andimportance Pages 111-153 in L Boitani and T KFuller editors Research techniques in animalecology controversies and consequences ColumbiaUniversity Press New York New York USA
Goldstein H 2003 Multilevel statistical models Third edition Hodder Arnold London UK
Graf R F K Bollmann W Suter and HBugmann 2005 The importance of spatial scale inhabitat models Capercaillie in the Swiss AlpsLandscape Ecology 20(6)703-717 doi101007s10980-005-0063-7
Graham M H 2003 Confronting multicollinearityin ecological multiple regression Ecology 842809-2815 doi10189002-3114
Gutzwiller K J and S H Anderson 1987Multiscale associations between cavity-nestingbirds and features of Wyoming streamsidewoodlands Condor 89534-548 doi1023071368643
Hames R S J D Lowe S Barker Swarthout andK V Rosenberg 2006 Understanding the risk toneotropical migrant bird species of multiple human-caused stressors elucidating processes behindpatterns Ecology and Society 11(1) 24 [online]URL httpwwwecologyandsocietyorgvol11iss1art24
Hammond C A M 2008 A demographic andlandscape analysis for common loons in northwestMontana Thesis University of Montana MissoulaMontana USA [online] URL httpetdlibumteduthesesavailableetd-04242008-130448
Heimberger M D Euler and J Barr 1983 Theimpact of cottage development on Common Loonreproductive success in central Ontario WilsonBulletin 95(3)431-439
Heinz H T Waldhoumlr and M Mittlboumlck 2005Careful use of pseudo R-squared measures inepidemiological studies Statistics in Medicine 24(18)2867-2872 doi101002sim2168
Avian Conservation and Ecology 6(1) 4httpwwwace-ecoorgvol6iss1art4
Hollister J W P V August J F Paul and H AWalker 2008 Predicting estuarine sediment metalconcentrations and inferred ecological conditionsan information theoretic approach Journal ofEnvironmental Quality 37(1)234-244 doi102134jeq20070105
Hosmer D W and S Lemeshow 2000 Appliedlogistic regression analysis Second edition WileyNew York New York USA doi1010020471722146
Hutchinson G E 1957 A treatise of limnologyVolume 1 geography physics and chemistry WileyNew York New York USA
Johnson J B and K S Omland 2004 Modelselection in ecology and evolution Trends inEcology and Evolution 19(2)101-108 doi101016jtree200310013
Johnson M D 2007 Measuring habitat quality areview Condor 109(3)489-504 doi10165083471
Johnston C A and B A Shmagin 2006 Scaleissues in lake-watershed interactions assessingshoreline development impacts on water clarityPages 297-313 in J Wu K B Jones H Li and OL Loucks editors Scaling and uncertainty analysisin ecology methods and applications SpringerDordrecht The Netherlands
Jung R E 1991 Effects of human activities andlake characteristics on the behavior and breedingsuccess of Common Loons Passenger Pigeon 53207-218
Kamman N C N M Burgess C T Driscoll HA Simonin W Goodale J Linehan R EstabrookM Hutcheson A Major A M Scheuhammer andD A Scruton 2005 Mercury in freshwater fish ofnortheast North America a geographic perspectivebased on fish tissue monitoring databasesEcotoxicology 14(1-2)163-180 doi101007s10646-004-6267-9
Kristan W B III 2006 Sources and expectationsfor hierarchical structure in bird-habitat associationsCondor 108(1)5-12 doi1016500010-5422(2006)108[0005SAEFHS]20CO2
Kristan W B III and J M Scott 2006Hierarchical models for avian ecologists Condor 108(1)1-4 doi1016500010-5422(2006)108[0001HMFAE]20CO2
Kuhn-Hines A 2008 A multiscale approach tobreeding habitat model development and evaluationfor the common loon Gavia immer in NewHampshire USA ETD Collection for University ofRhode Island Paper AAI3346850 [online] URL httpdigitalcommonsuriedudissertationsAAI3346850
Lawler J J and T C Edwards Jr 2006 Avariance-decomposition approach to investigatingmultiscale habitat associations Condor 108(1)47-58 doi1016500010-5422(2006)108[0047AVATIM]20CO2
Li X D Li Z Ma and D Schneider 2006 Nestsite use by crested ibis dependence of a multifactormodel on spatial scale Landscape Ecology 21(8)1207-1216 doi101007s10980-006-0021-z
Loon Preservation Committee 2004 Fieldcollection protocol for surveying and managingCommon Loons in New Hampshire LoonPreservation Committee Moultonborough NewHampshire USA
Loon Preservation Committee 2005 Meeting thechallenge thirty years of preserving loons and theirhabitats in New Hampshire Loon PreservationCommittee Moultonborough New HampshireUSA
Luck G W 2002 The habitat requirements of therufous treecreeper (Climacteris rufa) 1 Preferentialhabitat use demonstrated at multiple spatial scalesBiological Conservation 105(3)383-394 doi101016S0006-3207(01)00222-1
MacKenzie D I 2005 Was it there Dealing withimperfect detection for species presenceabsencedata Australian and New Zealand Journal ofStatistics 47(1)65-74 doi101111j1467-842X200500372x
MacKenzie D I J D Nichols J E Hines M GKnutson and A B Franklin 2003 Estimating siteoccupancy colonization and local extinction whena species is detected imperfectly Ecology 84(8)2200-2207 doi10189002-3090
Avian Conservation and Ecology 6(1) 4httpwwwace-ecoorgvol6iss1art4
Martin S L and P A Soranno 2006 Lakelandscape position relationships to hydrologicconnectivity and landscape features Limnology andOceanography 51(2)801-814 doi104319lo20065120801
McGarigal K and B J Marks 1995 FRAGSTATSspatial pattern analysis program for quantifyinglandscape structure General Technical ReportPNW-GTR-351 US Department of AgricultureForest Service Washington DC USA
McIntyre J W 1983 Nurseries a consideration ofhabitat requirements during the early chick-rearingperiod in common loons Journal of FieldOrnithology 54(3)247-253
McIntyre J W 1988 The Common Loon spirit ofnorthern lakes University of Minnesota PressMinneapolis Minnesota USA
McIntyre J W and J F Barr 1997 Common loonGavia immer In A Poole and F Gill editors TheBirds of North America 313 Academy of NaturalSciences of Philadelphia and American OrnithologistsUnion Washington DC USA
Menard S 2002 Applied logistic regressionanalysis Second edition Sage PublicationsThousand Oaks California USA
Meyer C B S L Miller and C J Ralph 2002Multi-scale landscape and seascape patternsassociated with marbeled murrelet nesting areas onthe US west coast Landscape Ecology 17(2)95-115 doi101023A1016574928706
Meyer M W 2006 Evaluating the impact ofmultiple stressors on Common Loon populationdemographics-an integrated laboratory and fieldapproach EPA STAR Co-operative AgreementNumber R82-9085 Environmental ProtectionAgency Washington DC USA
Meyer M W D C Evers J J Hartigan and P SRasmussen 1998 Patterns of common loon (Gaviaimmer) mercury exposure reproduction andsurvival in Wisconsin USA EnvironmentalToxicology and Chemistry 17(2)184-190
Meyer M W and J E Woodford 1996Enhancing osprey (Pandion haliaetus) and commonloon (Gavia immer) reproduction on impacted
Wisconsin waterways Final report US Fish andWildlife Service Washington DC USA
Moran P A P 1950 Notes on continuousstochastic phenomena Biometrika 37(1-2)17-23 doi101093biomet371-217
Murtagh P A and P S Pooler 2006 Evaluatingecological indicators lakes in the northeasternUnited States Environmental Monitoring andAssessment 119(1-3)83-96 doi101007s10661-005-9011-x
New Hampshire Department of EnvironmentalServices 2005 Water quality data survey summaryfor New Hampshire lakes and ponds NewHampshire Department of Environmental ServicesNew Hampshire USA [online] URL httpdesnhgovorganizationdivisionswaterwmblakestrophic_summaryhtm
New Hampshire Department of EnvironmentalServices 2006 Community center areas NewHampshire Department of Environmental ServicesNew Hampshire USA [online] URL httpwwwgranitunhedudatadatacatpagescommunitycenterareaspdf
Newbrey J L M A Bozek and N D Niemuth2005 Effects of lake characteristics and humandisturbance on the presence of piscivorous birds innorthern Wisconsin USA Waterbirds 28(4)478-486 doi1016751524-4695(2005)28[478EOLCAH]20CO2
Nocera J J G J Forbes and G R Milton 2008The relevance of local-scale relationships to habitatmanagement and landscape patterns AvianConservation and Ecology - Eacutecologie etconservation des oiseaux 3(1) 4 [online] URL httpwwwace-ecoorgvol3iss1art4
Northeast Loon Study Work Group 2008 [online]URL httpwwwbriloonorgscience-and-conservationcentersNELSWGphp
OrsquoBrien R M 2007 A caution regarding rules ofthumb for variance inflation factors Quality ampQuantity 41(5)673-690 doi101007s11135-006-9018-6
Patton D R 1975 A diversity index for quantifyinghabitat lsquoedgersquo Wildlife Society Bulletin 3171-173
Avian Conservation and Ecology 6(1) 4httpwwwace-ecoorgvol6iss1art4
Penhollow M E and D F Stauffer 2000 Large-scale habitat relationships of neotropical migratorybirds in Virginia Journal of Wildlife Management 64(2)362-373 doi1023073803234
Piper W H C Walcott J N Mager III M PeralaK B Tischler E Harrington A J Turcotte MSchwabenlander and N Banfield 2006 Prospectingin a solitary breeder chick production elicitsterritorial intrusions in common loons BehavioralEcology 17(6)881-888 doi101093behecoarl021
Piper W H C Walcott J N Mager and F JSpilker 2008 Nestsite selection by male loons leadsto sex-biased site familiarity Journal of AnimalEcology 77(2)205-210 doi101111j1365-2656200701334x
Rimmer C C 1992 Common Loon Gavia immer Pages 3-30 in K J Schneider and D M Penceeditors Migratory nongame birds managementconcern in the Northeast US Fish and WildlifeService Newton Corner Massachusetts USA
Riitters K H R V OrsquoNeill and K B Jones 1997Assessing habitat suitability at multiple scales alandscape-level approach Biological Conservation 81(1-2)191-202 doi101016S0006-3207(96)00145-0
Saab V 1999 Importance of spatial scale to habitatuse by breeding birds in riparian forests ahierarchical analysis Ecological Applications 9(1)135-151 doi1018901051-0761(1999)009[0135IOSSTH]20CO2
SAS Institute Inc 2003 SAS 91 Cary NorthCarolina USA
Scott J M P J Heglund M L Morrison J BHaufler M G Raphael W A Wall and F BSamson editors 2002 Predicting speciesoccurrences issues of accuracy and scale IslandPress Washington DC USA
Society for Protection of New Hampshire Forests2005 New Hampshirersquos changing landscapepopulation growth and land use changes Societyfor Protection of New Hampshire Forests [online]URL httpwwwforestsocietyorgresearchresearch-projectsasp
Soranno P A K E Webster K S Cheruvelil andM T Bremigan 2009 The lake landscape-contextframework linking aquatic connections terrestrialfeatures and human effects at multiple scalesVerhandlungen des Internationalen Verein Limnologie 30(5)695-700
Sperduto D D and W F Nichols 2004 Naturalcommunities of New Hampshire New HampshireNatural Heritage Bureau Concord New HampshireUSA and University of New HampshireCooperative Extension Durham New HampshireUSA
SPSS Inc 1999 SPSS 100 Chicago Illinois USA
Stauffer H B C J Ralph and S L Miller 2004Ranking habitat for marbled murrelets a newconservation approach for species with uncertaindetection Ecological Applications 14(5)1374-1383doi10189003-5068
Stein B A and S R Flack 1997 1997 speciesreport card the status of US plants and animals The Nature Conservancy Arlington VirginiaUSA [online] URL httpwwwnatureserveorglibrary1997speciesreportcardpdf
Strauss B and R Biedermann 2007 Evaluatingtemporal and spatial generality How valid arespecies-habitat relationship models EcologicalModeling 204104-114 doi101016jecolmodel200612027
Strong P I V and J A Bissonette 1989 Feedingand chick-rearing areas of common loons Journalof Wildlife Management 5372-76 doi1023073801308
Strong P I V J A Bissonette and J S Fair 1987Reuse of nesting and nursery areas by CommonLoons Journal of Wildlife Management 51123-127doi1023073801642
Taylor K M and H S Vogel 2000 NewHampshire report Pages 110-113 in J McIntyre andD C Evers editors Loons old history and newfindings Proceedings symposium 1997 meetingAmerican Ornithologists Union North AmericanLoon Fund Holderness New Hampshire USA
Thogmartin W E 2007 Effects at the landscapescale may constrain habitat relations at finer scales
Avian Conservation and Ecology 6(1) 4httpwwwace-ecoorgvol6iss1art4
Avian Conservation and Ecology - Eacutecologie etconservation des oiseaux 2(2) 6 [online] URL URL httpwwwace-ecoorgvol2iss2art6
Thogmartin W E and M G Knutson 2007Scaling local species-habitat relations to the largerlandscape with a hierarchical spatial count modelLandscape Ecology 22(1)61-75 doi101007s10980-006-9005-2
Thompson C M and K McGarigal 2002 Theinfluence of research scale on bald eagle habitatselection along the lower Hudson River New York(USA) Landscape Ecology 17(6)569-586 doi101023A1021501231182
Titus J R and L W VanDruff 1981 Responseof the common loon to recreational pressure in theBoundary Waters Canoe Area northeasternMinnesota Wildlife Monographs 791-60
Trocki C L and P W C Paton 2006 Assessinghabitat selection by foraging egrets in salt marshesat multiple spatial scales Wetlands 26(2)307-312 doi1016720277-5212(2006)26[307AHSBFE]20CO2
Turner M G 2005 Landscape ecology What isthe state of the science Annual Review of EcologyEvolution and Systematics 36319-344 doi101146annurevecolsys36102003152614
Tyre A J B Tenhumberg S A Field D NiejalkeK Parris and H P Possingham 2003 Improvingprecision and reducing bias in biological surveysestimating false-negative error rates EcologicalApplications 13(6)1790-1801 doi10189002-5078
Vermeer K 1973 Some aspects of the nestingrequirements of common loons in Alberta WilsonBulletin 85429-435
Wiens J A 1989 Spatial scaling in ecologyFunctional Ecology 3385-397 doi1023072389612
Wiens J A 2002 Riverine landscapes takinglandscape ecology into the water FreshwaterBiology 47(4)501-515 doi101046j1365-2427200200887x
Wiens J A J T Rotenberry and B van Horne1987 Habitat occupancy patterns of North
American shrubsteppe birds the effects of spatialscale Oikos 48132-147 doi1023073565849
Wilcove D S D Rothstein J Dubow A Phillipsand E Losos 1998 Quantifying threats to imperiledspecies in the United States Bioscience 48607-615doi1023071313420
Wu J 2004 Effects of changing scale on landscapepattern analysis scaling relations LandscapeEcology 19(2)125-138 doi101023BLAND000002171140074ae

Avian Conservation and Ecology 6(1) 4httpwwwace-ecoorgvol6iss1art4
LITERATURE CITED
Agresti A 1996 An introduction to categoricaldata analysisWiley New York New York USA
Alvo R D J T Hussell and M Berrill 1988 Thebreeding success of common loons (Gavia immer)in relation to alkalinity and other lake characteristicsin Ontario Canadian Journal of Zoology 66(3)746-752
Anderson D R 2008 Model based inferences inthe life sciences a primer on evidence SpringerNew York New York USA doi101007978-0-387-74075-1
Anderson J R E E Hardy J T Roach and R EWitmer 1976 A land use and land coverclassification system for use with remote sensordata Geological Survey Professional Paper 964 US Geological Survey Washington DC USA
Austin M 2007 Species distribution models andecological theory a critical assessment and somepossible new approaches Ecological Modelling 200(1-2)1-19 doi101016jecolmodel200607005
Barr J F 1986 Population dynamics of thecommon loon associated with mercury-contaminatedwaters in northwestern Ontario Occasional PaperNumber 56 Canadian Wildlife Service OttawaCanada
Battin J and J J Lawler 2006 Cross-scalecorrelations and the design of avian-habitatselection studies Condor 10859-70 doi1016500010-5422(2006)108[0059CCATDA]20CO2
Blair R B 1992 Lake features water quality andthe summer distribution of Common Loons in NewHampshire Journal of Field Ornithology 63(1)1-9
Burgess N M D C Evers and J D Kaplan 2005Mercury and other contaminants in Common Loonsbreeding in Atlantic Canada Ecotoxicology 14(1-2)241-252 doi101007s10646-004-6271-0
Burnham K P and D R Anderson 2002 Modelselection and multimodel inference a practicalinformation-theoretic approach Second editionSpringer New York New York USA
Cox D R and E J Snell 1989 Analysis of binarydata Second edition Chapman amp Hall LondonUK
Cushman S A and K McGarigal 2002Hierarchical multi-scale decomposition of species-environment relationships Landscape Ecology 17(7)637-646 doi101023A1021571603605
Cushman S A and K McGarigal 2004Hierarchical analysis of forest bird species-environment relationships in the Oregon CoastRange Ecological Applications 14(4)1090-1105 doi10189003-5131
Deppe J L and J T Rotenberry 2008 Scale-dependent habitat use by fall migratory birdsvegetation structure floristics and geographyEcological Monographs 78(3)461-487 doi10189007-01631
Desorbo C R K M Taylor D E Kramer J FairJ H Cooley Jr D C Evers W Hanson H SVogel and J L Atwood 2007 Reproductiveadvantages for Common Loons using rafts Journalof Wildlife Management 71(4)1206-1213 doi1021932006-422
Driscoll M J L T Donovan R Mickey AHoward and K K Fleming 2005 Determinants ofwood thrush nest success a multi-scale modelselection approach Journal of Wildlife Management 69(2)699-709 doi1021930022-541X(2005)069[0699DOWTNS]20CO2
Earnst S L R Platte and L Bond 2006 Alandscape-scale model of yellow-billed loon (Gaviaadamsii) habitat preferences in northern AlaskaHydrobiologia 567(1)227-236 doi101007s10750-006-0042-2
Edwards T C Jr G G Moisen T S Frescinoand J J Lawler 2003 Modeling multipleecological scales to link landscape theory to wildlifeconservation Pages 153-172 in J A Bissonette andI Storch editors Landscape ecology and resourcemanagement linking theory with practice IslandPress Washington DC USA
Environmental Systems Research Institute 2009ArcInfo geographic information system (GIS)software Version 91 Redlands California USA
Avian Conservation and Ecology 6(1) 4httpwwwace-ecoorgvol6iss1art4
Estrella A 1998 A new measure of fit for equationswith dichotomous dependent variables Journal ofBusiness and Economic Statistics 16(2)198-205 doi1023071392575
Evers D C 2001 Common Loon populationstudies continental mercury patterns and breedingterritory philopatry Dissertation University ofMinnesota St Paul Minnesota USA
Evers D C 2007 Status assessment andconservation plan for the Common Loon (Gaviaimmer) in North America BRI Report 2007-20 US Fish and Wildlife Service Hadley MassachusettsUSA
Evers D C L J Savoy C R DeSorbo D EYates W Hanson K M Taylor L Siegel J HCooley M S Bank A Major K Munney BMower H S Vogel N Schoch M Pokras M WGoodale and J Fair 2008 Adverse effects fromenvironmental mercury loads on breeding commonloons Ecotoxicology 17(2)69-81 doi101007s10646-007-0168-7
Fielding A H and J F Bell 1997 A review ofmethods for the assessment of prediction errors inconservation presenceabsence models EnvironmentalConservation 24(1)38-49 doi101017S0376892997000088
Fortin M-J and M R T Dale 2005 Spatialanalysis a guide for ecologists CambridgeUniversity Press Cambridge UK
Found C S M Webb and M S Boyce 2008Selection of lake habitats by waterbirds in the borealtransition zone of northeastern Alberta CanadianJournal of Zoology 86(4)277-285 doi101139Z07-137
Fraterrigo J M and J A Downing 2008 Theinfluence of land use on lake nutrients varies withwatershed transport capacity Ecosystems 11(7)1021-1034 doi101007s10021-008-9176-6
Freemark K E D Bert and M A Villard 2002Patch- landscape- and regional-scale effects onbiota Pages 58-83 in K J Gutzwiller editorApplying landscape ecology in biologicalconservation Springer New York New YorkUSA
Gamma Design Software 2001 GS+ geostatisticsfor the environmental sciences PlainwellMichigan USA
Garshellis D L 2000 Delusions in habitatevaluation measuring use selection andimportance Pages 111-153 in L Boitani and T KFuller editors Research techniques in animalecology controversies and consequences ColumbiaUniversity Press New York New York USA
Goldstein H 2003 Multilevel statistical models Third edition Hodder Arnold London UK
Graf R F K Bollmann W Suter and HBugmann 2005 The importance of spatial scale inhabitat models Capercaillie in the Swiss AlpsLandscape Ecology 20(6)703-717 doi101007s10980-005-0063-7
Graham M H 2003 Confronting multicollinearityin ecological multiple regression Ecology 842809-2815 doi10189002-3114
Gutzwiller K J and S H Anderson 1987Multiscale associations between cavity-nestingbirds and features of Wyoming streamsidewoodlands Condor 89534-548 doi1023071368643
Hames R S J D Lowe S Barker Swarthout andK V Rosenberg 2006 Understanding the risk toneotropical migrant bird species of multiple human-caused stressors elucidating processes behindpatterns Ecology and Society 11(1) 24 [online]URL httpwwwecologyandsocietyorgvol11iss1art24
Hammond C A M 2008 A demographic andlandscape analysis for common loons in northwestMontana Thesis University of Montana MissoulaMontana USA [online] URL httpetdlibumteduthesesavailableetd-04242008-130448
Heimberger M D Euler and J Barr 1983 Theimpact of cottage development on Common Loonreproductive success in central Ontario WilsonBulletin 95(3)431-439
Heinz H T Waldhoumlr and M Mittlboumlck 2005Careful use of pseudo R-squared measures inepidemiological studies Statistics in Medicine 24(18)2867-2872 doi101002sim2168
Avian Conservation and Ecology 6(1) 4httpwwwace-ecoorgvol6iss1art4
Hollister J W P V August J F Paul and H AWalker 2008 Predicting estuarine sediment metalconcentrations and inferred ecological conditionsan information theoretic approach Journal ofEnvironmental Quality 37(1)234-244 doi102134jeq20070105
Hosmer D W and S Lemeshow 2000 Appliedlogistic regression analysis Second edition WileyNew York New York USA doi1010020471722146
Hutchinson G E 1957 A treatise of limnologyVolume 1 geography physics and chemistry WileyNew York New York USA
Johnson J B and K S Omland 2004 Modelselection in ecology and evolution Trends inEcology and Evolution 19(2)101-108 doi101016jtree200310013
Johnson M D 2007 Measuring habitat quality areview Condor 109(3)489-504 doi10165083471
Johnston C A and B A Shmagin 2006 Scaleissues in lake-watershed interactions assessingshoreline development impacts on water clarityPages 297-313 in J Wu K B Jones H Li and OL Loucks editors Scaling and uncertainty analysisin ecology methods and applications SpringerDordrecht The Netherlands
Jung R E 1991 Effects of human activities andlake characteristics on the behavior and breedingsuccess of Common Loons Passenger Pigeon 53207-218
Kamman N C N M Burgess C T Driscoll HA Simonin W Goodale J Linehan R EstabrookM Hutcheson A Major A M Scheuhammer andD A Scruton 2005 Mercury in freshwater fish ofnortheast North America a geographic perspectivebased on fish tissue monitoring databasesEcotoxicology 14(1-2)163-180 doi101007s10646-004-6267-9
Kristan W B III 2006 Sources and expectationsfor hierarchical structure in bird-habitat associationsCondor 108(1)5-12 doi1016500010-5422(2006)108[0005SAEFHS]20CO2
Kristan W B III and J M Scott 2006Hierarchical models for avian ecologists Condor 108(1)1-4 doi1016500010-5422(2006)108[0001HMFAE]20CO2
Kuhn-Hines A 2008 A multiscale approach tobreeding habitat model development and evaluationfor the common loon Gavia immer in NewHampshire USA ETD Collection for University ofRhode Island Paper AAI3346850 [online] URL httpdigitalcommonsuriedudissertationsAAI3346850
Lawler J J and T C Edwards Jr 2006 Avariance-decomposition approach to investigatingmultiscale habitat associations Condor 108(1)47-58 doi1016500010-5422(2006)108[0047AVATIM]20CO2
Li X D Li Z Ma and D Schneider 2006 Nestsite use by crested ibis dependence of a multifactormodel on spatial scale Landscape Ecology 21(8)1207-1216 doi101007s10980-006-0021-z
Loon Preservation Committee 2004 Fieldcollection protocol for surveying and managingCommon Loons in New Hampshire LoonPreservation Committee Moultonborough NewHampshire USA
Loon Preservation Committee 2005 Meeting thechallenge thirty years of preserving loons and theirhabitats in New Hampshire Loon PreservationCommittee Moultonborough New HampshireUSA
Luck G W 2002 The habitat requirements of therufous treecreeper (Climacteris rufa) 1 Preferentialhabitat use demonstrated at multiple spatial scalesBiological Conservation 105(3)383-394 doi101016S0006-3207(01)00222-1
MacKenzie D I 2005 Was it there Dealing withimperfect detection for species presenceabsencedata Australian and New Zealand Journal ofStatistics 47(1)65-74 doi101111j1467-842X200500372x
MacKenzie D I J D Nichols J E Hines M GKnutson and A B Franklin 2003 Estimating siteoccupancy colonization and local extinction whena species is detected imperfectly Ecology 84(8)2200-2207 doi10189002-3090
Avian Conservation and Ecology 6(1) 4httpwwwace-ecoorgvol6iss1art4
Martin S L and P A Soranno 2006 Lakelandscape position relationships to hydrologicconnectivity and landscape features Limnology andOceanography 51(2)801-814 doi104319lo20065120801
McGarigal K and B J Marks 1995 FRAGSTATSspatial pattern analysis program for quantifyinglandscape structure General Technical ReportPNW-GTR-351 US Department of AgricultureForest Service Washington DC USA
McIntyre J W 1983 Nurseries a consideration ofhabitat requirements during the early chick-rearingperiod in common loons Journal of FieldOrnithology 54(3)247-253
McIntyre J W 1988 The Common Loon spirit ofnorthern lakes University of Minnesota PressMinneapolis Minnesota USA
McIntyre J W and J F Barr 1997 Common loonGavia immer In A Poole and F Gill editors TheBirds of North America 313 Academy of NaturalSciences of Philadelphia and American OrnithologistsUnion Washington DC USA
Menard S 2002 Applied logistic regressionanalysis Second edition Sage PublicationsThousand Oaks California USA
Meyer C B S L Miller and C J Ralph 2002Multi-scale landscape and seascape patternsassociated with marbeled murrelet nesting areas onthe US west coast Landscape Ecology 17(2)95-115 doi101023A1016574928706
Meyer M W 2006 Evaluating the impact ofmultiple stressors on Common Loon populationdemographics-an integrated laboratory and fieldapproach EPA STAR Co-operative AgreementNumber R82-9085 Environmental ProtectionAgency Washington DC USA
Meyer M W D C Evers J J Hartigan and P SRasmussen 1998 Patterns of common loon (Gaviaimmer) mercury exposure reproduction andsurvival in Wisconsin USA EnvironmentalToxicology and Chemistry 17(2)184-190
Meyer M W and J E Woodford 1996Enhancing osprey (Pandion haliaetus) and commonloon (Gavia immer) reproduction on impacted
Wisconsin waterways Final report US Fish andWildlife Service Washington DC USA
Moran P A P 1950 Notes on continuousstochastic phenomena Biometrika 37(1-2)17-23 doi101093biomet371-217
Murtagh P A and P S Pooler 2006 Evaluatingecological indicators lakes in the northeasternUnited States Environmental Monitoring andAssessment 119(1-3)83-96 doi101007s10661-005-9011-x
New Hampshire Department of EnvironmentalServices 2005 Water quality data survey summaryfor New Hampshire lakes and ponds NewHampshire Department of Environmental ServicesNew Hampshire USA [online] URL httpdesnhgovorganizationdivisionswaterwmblakestrophic_summaryhtm
New Hampshire Department of EnvironmentalServices 2006 Community center areas NewHampshire Department of Environmental ServicesNew Hampshire USA [online] URL httpwwwgranitunhedudatadatacatpagescommunitycenterareaspdf
Newbrey J L M A Bozek and N D Niemuth2005 Effects of lake characteristics and humandisturbance on the presence of piscivorous birds innorthern Wisconsin USA Waterbirds 28(4)478-486 doi1016751524-4695(2005)28[478EOLCAH]20CO2
Nocera J J G J Forbes and G R Milton 2008The relevance of local-scale relationships to habitatmanagement and landscape patterns AvianConservation and Ecology - Eacutecologie etconservation des oiseaux 3(1) 4 [online] URL httpwwwace-ecoorgvol3iss1art4
Northeast Loon Study Work Group 2008 [online]URL httpwwwbriloonorgscience-and-conservationcentersNELSWGphp
OrsquoBrien R M 2007 A caution regarding rules ofthumb for variance inflation factors Quality ampQuantity 41(5)673-690 doi101007s11135-006-9018-6
Patton D R 1975 A diversity index for quantifyinghabitat lsquoedgersquo Wildlife Society Bulletin 3171-173
Avian Conservation and Ecology 6(1) 4httpwwwace-ecoorgvol6iss1art4
Penhollow M E and D F Stauffer 2000 Large-scale habitat relationships of neotropical migratorybirds in Virginia Journal of Wildlife Management 64(2)362-373 doi1023073803234
Piper W H C Walcott J N Mager III M PeralaK B Tischler E Harrington A J Turcotte MSchwabenlander and N Banfield 2006 Prospectingin a solitary breeder chick production elicitsterritorial intrusions in common loons BehavioralEcology 17(6)881-888 doi101093behecoarl021
Piper W H C Walcott J N Mager and F JSpilker 2008 Nestsite selection by male loons leadsto sex-biased site familiarity Journal of AnimalEcology 77(2)205-210 doi101111j1365-2656200701334x
Rimmer C C 1992 Common Loon Gavia immer Pages 3-30 in K J Schneider and D M Penceeditors Migratory nongame birds managementconcern in the Northeast US Fish and WildlifeService Newton Corner Massachusetts USA
Riitters K H R V OrsquoNeill and K B Jones 1997Assessing habitat suitability at multiple scales alandscape-level approach Biological Conservation 81(1-2)191-202 doi101016S0006-3207(96)00145-0
Saab V 1999 Importance of spatial scale to habitatuse by breeding birds in riparian forests ahierarchical analysis Ecological Applications 9(1)135-151 doi1018901051-0761(1999)009[0135IOSSTH]20CO2
SAS Institute Inc 2003 SAS 91 Cary NorthCarolina USA
Scott J M P J Heglund M L Morrison J BHaufler M G Raphael W A Wall and F BSamson editors 2002 Predicting speciesoccurrences issues of accuracy and scale IslandPress Washington DC USA
Society for Protection of New Hampshire Forests2005 New Hampshirersquos changing landscapepopulation growth and land use changes Societyfor Protection of New Hampshire Forests [online]URL httpwwwforestsocietyorgresearchresearch-projectsasp
Soranno P A K E Webster K S Cheruvelil andM T Bremigan 2009 The lake landscape-contextframework linking aquatic connections terrestrialfeatures and human effects at multiple scalesVerhandlungen des Internationalen Verein Limnologie 30(5)695-700
Sperduto D D and W F Nichols 2004 Naturalcommunities of New Hampshire New HampshireNatural Heritage Bureau Concord New HampshireUSA and University of New HampshireCooperative Extension Durham New HampshireUSA
SPSS Inc 1999 SPSS 100 Chicago Illinois USA
Stauffer H B C J Ralph and S L Miller 2004Ranking habitat for marbled murrelets a newconservation approach for species with uncertaindetection Ecological Applications 14(5)1374-1383doi10189003-5068
Stein B A and S R Flack 1997 1997 speciesreport card the status of US plants and animals The Nature Conservancy Arlington VirginiaUSA [online] URL httpwwwnatureserveorglibrary1997speciesreportcardpdf
Strauss B and R Biedermann 2007 Evaluatingtemporal and spatial generality How valid arespecies-habitat relationship models EcologicalModeling 204104-114 doi101016jecolmodel200612027
Strong P I V and J A Bissonette 1989 Feedingand chick-rearing areas of common loons Journalof Wildlife Management 5372-76 doi1023073801308
Strong P I V J A Bissonette and J S Fair 1987Reuse of nesting and nursery areas by CommonLoons Journal of Wildlife Management 51123-127doi1023073801642
Taylor K M and H S Vogel 2000 NewHampshire report Pages 110-113 in J McIntyre andD C Evers editors Loons old history and newfindings Proceedings symposium 1997 meetingAmerican Ornithologists Union North AmericanLoon Fund Holderness New Hampshire USA
Thogmartin W E 2007 Effects at the landscapescale may constrain habitat relations at finer scales
Avian Conservation and Ecology 6(1) 4httpwwwace-ecoorgvol6iss1art4
Avian Conservation and Ecology - Eacutecologie etconservation des oiseaux 2(2) 6 [online] URL URL httpwwwace-ecoorgvol2iss2art6
Thogmartin W E and M G Knutson 2007Scaling local species-habitat relations to the largerlandscape with a hierarchical spatial count modelLandscape Ecology 22(1)61-75 doi101007s10980-006-9005-2
Thompson C M and K McGarigal 2002 Theinfluence of research scale on bald eagle habitatselection along the lower Hudson River New York(USA) Landscape Ecology 17(6)569-586 doi101023A1021501231182
Titus J R and L W VanDruff 1981 Responseof the common loon to recreational pressure in theBoundary Waters Canoe Area northeasternMinnesota Wildlife Monographs 791-60
Trocki C L and P W C Paton 2006 Assessinghabitat selection by foraging egrets in salt marshesat multiple spatial scales Wetlands 26(2)307-312 doi1016720277-5212(2006)26[307AHSBFE]20CO2
Turner M G 2005 Landscape ecology What isthe state of the science Annual Review of EcologyEvolution and Systematics 36319-344 doi101146annurevecolsys36102003152614
Tyre A J B Tenhumberg S A Field D NiejalkeK Parris and H P Possingham 2003 Improvingprecision and reducing bias in biological surveysestimating false-negative error rates EcologicalApplications 13(6)1790-1801 doi10189002-5078
Vermeer K 1973 Some aspects of the nestingrequirements of common loons in Alberta WilsonBulletin 85429-435
Wiens J A 1989 Spatial scaling in ecologyFunctional Ecology 3385-397 doi1023072389612
Wiens J A 2002 Riverine landscapes takinglandscape ecology into the water FreshwaterBiology 47(4)501-515 doi101046j1365-2427200200887x
Wiens J A J T Rotenberry and B van Horne1987 Habitat occupancy patterns of North
American shrubsteppe birds the effects of spatialscale Oikos 48132-147 doi1023073565849
Wilcove D S D Rothstein J Dubow A Phillipsand E Losos 1998 Quantifying threats to imperiledspecies in the United States Bioscience 48607-615doi1023071313420
Wu J 2004 Effects of changing scale on landscapepattern analysis scaling relations LandscapeEcology 19(2)125-138 doi101023BLAND000002171140074ae
Avian Conservation and Ecology 6(1) 4httpwwwace-ecoorgvol6iss1art4
Estrella A 1998 A new measure of fit for equationswith dichotomous dependent variables Journal ofBusiness and Economic Statistics 16(2)198-205 doi1023071392575
Evers D C 2001 Common Loon populationstudies continental mercury patterns and breedingterritory philopatry Dissertation University ofMinnesota St Paul Minnesota USA
Evers D C 2007 Status assessment andconservation plan for the Common Loon (Gaviaimmer) in North America BRI Report 2007-20 US Fish and Wildlife Service Hadley MassachusettsUSA
Evers D C L J Savoy C R DeSorbo D EYates W Hanson K M Taylor L Siegel J HCooley M S Bank A Major K Munney BMower H S Vogel N Schoch M Pokras M WGoodale and J Fair 2008 Adverse effects fromenvironmental mercury loads on breeding commonloons Ecotoxicology 17(2)69-81 doi101007s10646-007-0168-7
Fielding A H and J F Bell 1997 A review ofmethods for the assessment of prediction errors inconservation presenceabsence models EnvironmentalConservation 24(1)38-49 doi101017S0376892997000088
Fortin M-J and M R T Dale 2005 Spatialanalysis a guide for ecologists CambridgeUniversity Press Cambridge UK
Found C S M Webb and M S Boyce 2008Selection of lake habitats by waterbirds in the borealtransition zone of northeastern Alberta CanadianJournal of Zoology 86(4)277-285 doi101139Z07-137
Fraterrigo J M and J A Downing 2008 Theinfluence of land use on lake nutrients varies withwatershed transport capacity Ecosystems 11(7)1021-1034 doi101007s10021-008-9176-6
Freemark K E D Bert and M A Villard 2002Patch- landscape- and regional-scale effects onbiota Pages 58-83 in K J Gutzwiller editorApplying landscape ecology in biologicalconservation Springer New York New YorkUSA
Gamma Design Software 2001 GS+ geostatisticsfor the environmental sciences PlainwellMichigan USA
Garshellis D L 2000 Delusions in habitatevaluation measuring use selection andimportance Pages 111-153 in L Boitani and T KFuller editors Research techniques in animalecology controversies and consequences ColumbiaUniversity Press New York New York USA
Goldstein H 2003 Multilevel statistical models Third edition Hodder Arnold London UK
Graf R F K Bollmann W Suter and HBugmann 2005 The importance of spatial scale inhabitat models Capercaillie in the Swiss AlpsLandscape Ecology 20(6)703-717 doi101007s10980-005-0063-7
Graham M H 2003 Confronting multicollinearityin ecological multiple regression Ecology 842809-2815 doi10189002-3114
Gutzwiller K J and S H Anderson 1987Multiscale associations between cavity-nestingbirds and features of Wyoming streamsidewoodlands Condor 89534-548 doi1023071368643
Hames R S J D Lowe S Barker Swarthout andK V Rosenberg 2006 Understanding the risk toneotropical migrant bird species of multiple human-caused stressors elucidating processes behindpatterns Ecology and Society 11(1) 24 [online]URL httpwwwecologyandsocietyorgvol11iss1art24
Hammond C A M 2008 A demographic andlandscape analysis for common loons in northwestMontana Thesis University of Montana MissoulaMontana USA [online] URL httpetdlibumteduthesesavailableetd-04242008-130448
Heimberger M D Euler and J Barr 1983 Theimpact of cottage development on Common Loonreproductive success in central Ontario WilsonBulletin 95(3)431-439
Heinz H T Waldhoumlr and M Mittlboumlck 2005Careful use of pseudo R-squared measures inepidemiological studies Statistics in Medicine 24(18)2867-2872 doi101002sim2168
Avian Conservation and Ecology 6(1) 4httpwwwace-ecoorgvol6iss1art4
Hollister J W P V August J F Paul and H AWalker 2008 Predicting estuarine sediment metalconcentrations and inferred ecological conditionsan information theoretic approach Journal ofEnvironmental Quality 37(1)234-244 doi102134jeq20070105
Hosmer D W and S Lemeshow 2000 Appliedlogistic regression analysis Second edition WileyNew York New York USA doi1010020471722146
Hutchinson G E 1957 A treatise of limnologyVolume 1 geography physics and chemistry WileyNew York New York USA
Johnson J B and K S Omland 2004 Modelselection in ecology and evolution Trends inEcology and Evolution 19(2)101-108 doi101016jtree200310013
Johnson M D 2007 Measuring habitat quality areview Condor 109(3)489-504 doi10165083471
Johnston C A and B A Shmagin 2006 Scaleissues in lake-watershed interactions assessingshoreline development impacts on water clarityPages 297-313 in J Wu K B Jones H Li and OL Loucks editors Scaling and uncertainty analysisin ecology methods and applications SpringerDordrecht The Netherlands
Jung R E 1991 Effects of human activities andlake characteristics on the behavior and breedingsuccess of Common Loons Passenger Pigeon 53207-218
Kamman N C N M Burgess C T Driscoll HA Simonin W Goodale J Linehan R EstabrookM Hutcheson A Major A M Scheuhammer andD A Scruton 2005 Mercury in freshwater fish ofnortheast North America a geographic perspectivebased on fish tissue monitoring databasesEcotoxicology 14(1-2)163-180 doi101007s10646-004-6267-9
Kristan W B III 2006 Sources and expectationsfor hierarchical structure in bird-habitat associationsCondor 108(1)5-12 doi1016500010-5422(2006)108[0005SAEFHS]20CO2
Kristan W B III and J M Scott 2006Hierarchical models for avian ecologists Condor 108(1)1-4 doi1016500010-5422(2006)108[0001HMFAE]20CO2
Kuhn-Hines A 2008 A multiscale approach tobreeding habitat model development and evaluationfor the common loon Gavia immer in NewHampshire USA ETD Collection for University ofRhode Island Paper AAI3346850 [online] URL httpdigitalcommonsuriedudissertationsAAI3346850
Lawler J J and T C Edwards Jr 2006 Avariance-decomposition approach to investigatingmultiscale habitat associations Condor 108(1)47-58 doi1016500010-5422(2006)108[0047AVATIM]20CO2
Li X D Li Z Ma and D Schneider 2006 Nestsite use by crested ibis dependence of a multifactormodel on spatial scale Landscape Ecology 21(8)1207-1216 doi101007s10980-006-0021-z
Loon Preservation Committee 2004 Fieldcollection protocol for surveying and managingCommon Loons in New Hampshire LoonPreservation Committee Moultonborough NewHampshire USA
Loon Preservation Committee 2005 Meeting thechallenge thirty years of preserving loons and theirhabitats in New Hampshire Loon PreservationCommittee Moultonborough New HampshireUSA
Luck G W 2002 The habitat requirements of therufous treecreeper (Climacteris rufa) 1 Preferentialhabitat use demonstrated at multiple spatial scalesBiological Conservation 105(3)383-394 doi101016S0006-3207(01)00222-1
MacKenzie D I 2005 Was it there Dealing withimperfect detection for species presenceabsencedata Australian and New Zealand Journal ofStatistics 47(1)65-74 doi101111j1467-842X200500372x
MacKenzie D I J D Nichols J E Hines M GKnutson and A B Franklin 2003 Estimating siteoccupancy colonization and local extinction whena species is detected imperfectly Ecology 84(8)2200-2207 doi10189002-3090
Avian Conservation and Ecology 6(1) 4httpwwwace-ecoorgvol6iss1art4
Martin S L and P A Soranno 2006 Lakelandscape position relationships to hydrologicconnectivity and landscape features Limnology andOceanography 51(2)801-814 doi104319lo20065120801
McGarigal K and B J Marks 1995 FRAGSTATSspatial pattern analysis program for quantifyinglandscape structure General Technical ReportPNW-GTR-351 US Department of AgricultureForest Service Washington DC USA
McIntyre J W 1983 Nurseries a consideration ofhabitat requirements during the early chick-rearingperiod in common loons Journal of FieldOrnithology 54(3)247-253
McIntyre J W 1988 The Common Loon spirit ofnorthern lakes University of Minnesota PressMinneapolis Minnesota USA
McIntyre J W and J F Barr 1997 Common loonGavia immer In A Poole and F Gill editors TheBirds of North America 313 Academy of NaturalSciences of Philadelphia and American OrnithologistsUnion Washington DC USA
Menard S 2002 Applied logistic regressionanalysis Second edition Sage PublicationsThousand Oaks California USA
Meyer C B S L Miller and C J Ralph 2002Multi-scale landscape and seascape patternsassociated with marbeled murrelet nesting areas onthe US west coast Landscape Ecology 17(2)95-115 doi101023A1016574928706
Meyer M W 2006 Evaluating the impact ofmultiple stressors on Common Loon populationdemographics-an integrated laboratory and fieldapproach EPA STAR Co-operative AgreementNumber R82-9085 Environmental ProtectionAgency Washington DC USA
Meyer M W D C Evers J J Hartigan and P SRasmussen 1998 Patterns of common loon (Gaviaimmer) mercury exposure reproduction andsurvival in Wisconsin USA EnvironmentalToxicology and Chemistry 17(2)184-190
Meyer M W and J E Woodford 1996Enhancing osprey (Pandion haliaetus) and commonloon (Gavia immer) reproduction on impacted
Wisconsin waterways Final report US Fish andWildlife Service Washington DC USA
Moran P A P 1950 Notes on continuousstochastic phenomena Biometrika 37(1-2)17-23 doi101093biomet371-217
Murtagh P A and P S Pooler 2006 Evaluatingecological indicators lakes in the northeasternUnited States Environmental Monitoring andAssessment 119(1-3)83-96 doi101007s10661-005-9011-x
New Hampshire Department of EnvironmentalServices 2005 Water quality data survey summaryfor New Hampshire lakes and ponds NewHampshire Department of Environmental ServicesNew Hampshire USA [online] URL httpdesnhgovorganizationdivisionswaterwmblakestrophic_summaryhtm
New Hampshire Department of EnvironmentalServices 2006 Community center areas NewHampshire Department of Environmental ServicesNew Hampshire USA [online] URL httpwwwgranitunhedudatadatacatpagescommunitycenterareaspdf
Newbrey J L M A Bozek and N D Niemuth2005 Effects of lake characteristics and humandisturbance on the presence of piscivorous birds innorthern Wisconsin USA Waterbirds 28(4)478-486 doi1016751524-4695(2005)28[478EOLCAH]20CO2
Nocera J J G J Forbes and G R Milton 2008The relevance of local-scale relationships to habitatmanagement and landscape patterns AvianConservation and Ecology - Eacutecologie etconservation des oiseaux 3(1) 4 [online] URL httpwwwace-ecoorgvol3iss1art4
Northeast Loon Study Work Group 2008 [online]URL httpwwwbriloonorgscience-and-conservationcentersNELSWGphp
OrsquoBrien R M 2007 A caution regarding rules ofthumb for variance inflation factors Quality ampQuantity 41(5)673-690 doi101007s11135-006-9018-6
Patton D R 1975 A diversity index for quantifyinghabitat lsquoedgersquo Wildlife Society Bulletin 3171-173
Avian Conservation and Ecology 6(1) 4httpwwwace-ecoorgvol6iss1art4
Penhollow M E and D F Stauffer 2000 Large-scale habitat relationships of neotropical migratorybirds in Virginia Journal of Wildlife Management 64(2)362-373 doi1023073803234
Piper W H C Walcott J N Mager III M PeralaK B Tischler E Harrington A J Turcotte MSchwabenlander and N Banfield 2006 Prospectingin a solitary breeder chick production elicitsterritorial intrusions in common loons BehavioralEcology 17(6)881-888 doi101093behecoarl021
Piper W H C Walcott J N Mager and F JSpilker 2008 Nestsite selection by male loons leadsto sex-biased site familiarity Journal of AnimalEcology 77(2)205-210 doi101111j1365-2656200701334x
Rimmer C C 1992 Common Loon Gavia immer Pages 3-30 in K J Schneider and D M Penceeditors Migratory nongame birds managementconcern in the Northeast US Fish and WildlifeService Newton Corner Massachusetts USA
Riitters K H R V OrsquoNeill and K B Jones 1997Assessing habitat suitability at multiple scales alandscape-level approach Biological Conservation 81(1-2)191-202 doi101016S0006-3207(96)00145-0
Saab V 1999 Importance of spatial scale to habitatuse by breeding birds in riparian forests ahierarchical analysis Ecological Applications 9(1)135-151 doi1018901051-0761(1999)009[0135IOSSTH]20CO2
SAS Institute Inc 2003 SAS 91 Cary NorthCarolina USA
Scott J M P J Heglund M L Morrison J BHaufler M G Raphael W A Wall and F BSamson editors 2002 Predicting speciesoccurrences issues of accuracy and scale IslandPress Washington DC USA
Society for Protection of New Hampshire Forests2005 New Hampshirersquos changing landscapepopulation growth and land use changes Societyfor Protection of New Hampshire Forests [online]URL httpwwwforestsocietyorgresearchresearch-projectsasp
Soranno P A K E Webster K S Cheruvelil andM T Bremigan 2009 The lake landscape-contextframework linking aquatic connections terrestrialfeatures and human effects at multiple scalesVerhandlungen des Internationalen Verein Limnologie 30(5)695-700
Sperduto D D and W F Nichols 2004 Naturalcommunities of New Hampshire New HampshireNatural Heritage Bureau Concord New HampshireUSA and University of New HampshireCooperative Extension Durham New HampshireUSA
SPSS Inc 1999 SPSS 100 Chicago Illinois USA
Stauffer H B C J Ralph and S L Miller 2004Ranking habitat for marbled murrelets a newconservation approach for species with uncertaindetection Ecological Applications 14(5)1374-1383doi10189003-5068
Stein B A and S R Flack 1997 1997 speciesreport card the status of US plants and animals The Nature Conservancy Arlington VirginiaUSA [online] URL httpwwwnatureserveorglibrary1997speciesreportcardpdf
Strauss B and R Biedermann 2007 Evaluatingtemporal and spatial generality How valid arespecies-habitat relationship models EcologicalModeling 204104-114 doi101016jecolmodel200612027
Strong P I V and J A Bissonette 1989 Feedingand chick-rearing areas of common loons Journalof Wildlife Management 5372-76 doi1023073801308
Strong P I V J A Bissonette and J S Fair 1987Reuse of nesting and nursery areas by CommonLoons Journal of Wildlife Management 51123-127doi1023073801642
Taylor K M and H S Vogel 2000 NewHampshire report Pages 110-113 in J McIntyre andD C Evers editors Loons old history and newfindings Proceedings symposium 1997 meetingAmerican Ornithologists Union North AmericanLoon Fund Holderness New Hampshire USA
Thogmartin W E 2007 Effects at the landscapescale may constrain habitat relations at finer scales
Avian Conservation and Ecology 6(1) 4httpwwwace-ecoorgvol6iss1art4
Avian Conservation and Ecology - Eacutecologie etconservation des oiseaux 2(2) 6 [online] URL URL httpwwwace-ecoorgvol2iss2art6
Thogmartin W E and M G Knutson 2007Scaling local species-habitat relations to the largerlandscape with a hierarchical spatial count modelLandscape Ecology 22(1)61-75 doi101007s10980-006-9005-2
Thompson C M and K McGarigal 2002 Theinfluence of research scale on bald eagle habitatselection along the lower Hudson River New York(USA) Landscape Ecology 17(6)569-586 doi101023A1021501231182
Titus J R and L W VanDruff 1981 Responseof the common loon to recreational pressure in theBoundary Waters Canoe Area northeasternMinnesota Wildlife Monographs 791-60
Trocki C L and P W C Paton 2006 Assessinghabitat selection by foraging egrets in salt marshesat multiple spatial scales Wetlands 26(2)307-312 doi1016720277-5212(2006)26[307AHSBFE]20CO2
Turner M G 2005 Landscape ecology What isthe state of the science Annual Review of EcologyEvolution and Systematics 36319-344 doi101146annurevecolsys36102003152614
Tyre A J B Tenhumberg S A Field D NiejalkeK Parris and H P Possingham 2003 Improvingprecision and reducing bias in biological surveysestimating false-negative error rates EcologicalApplications 13(6)1790-1801 doi10189002-5078
Vermeer K 1973 Some aspects of the nestingrequirements of common loons in Alberta WilsonBulletin 85429-435
Wiens J A 1989 Spatial scaling in ecologyFunctional Ecology 3385-397 doi1023072389612
Wiens J A 2002 Riverine landscapes takinglandscape ecology into the water FreshwaterBiology 47(4)501-515 doi101046j1365-2427200200887x
Wiens J A J T Rotenberry and B van Horne1987 Habitat occupancy patterns of North
American shrubsteppe birds the effects of spatialscale Oikos 48132-147 doi1023073565849
Wilcove D S D Rothstein J Dubow A Phillipsand E Losos 1998 Quantifying threats to imperiledspecies in the United States Bioscience 48607-615doi1023071313420
Wu J 2004 Effects of changing scale on landscapepattern analysis scaling relations LandscapeEcology 19(2)125-138 doi101023BLAND000002171140074ae

Avian Conservation and Ecology 6(1) 4httpwwwace-ecoorgvol6iss1art4
Hollister J W P V August J F Paul and H AWalker 2008 Predicting estuarine sediment metalconcentrations and inferred ecological conditionsan information theoretic approach Journal ofEnvironmental Quality 37(1)234-244 doi102134jeq20070105
Hosmer D W and S Lemeshow 2000 Appliedlogistic regression analysis Second edition WileyNew York New York USA doi1010020471722146
Hutchinson G E 1957 A treatise of limnologyVolume 1 geography physics and chemistry WileyNew York New York USA
Johnson J B and K S Omland 2004 Modelselection in ecology and evolution Trends inEcology and Evolution 19(2)101-108 doi101016jtree200310013
Johnson M D 2007 Measuring habitat quality areview Condor 109(3)489-504 doi10165083471
Johnston C A and B A Shmagin 2006 Scaleissues in lake-watershed interactions assessingshoreline development impacts on water clarityPages 297-313 in J Wu K B Jones H Li and OL Loucks editors Scaling and uncertainty analysisin ecology methods and applications SpringerDordrecht The Netherlands
Jung R E 1991 Effects of human activities andlake characteristics on the behavior and breedingsuccess of Common Loons Passenger Pigeon 53207-218
Kamman N C N M Burgess C T Driscoll HA Simonin W Goodale J Linehan R EstabrookM Hutcheson A Major A M Scheuhammer andD A Scruton 2005 Mercury in freshwater fish ofnortheast North America a geographic perspectivebased on fish tissue monitoring databasesEcotoxicology 14(1-2)163-180 doi101007s10646-004-6267-9
Kristan W B III 2006 Sources and expectationsfor hierarchical structure in bird-habitat associationsCondor 108(1)5-12 doi1016500010-5422(2006)108[0005SAEFHS]20CO2
Kristan W B III and J M Scott 2006Hierarchical models for avian ecologists Condor 108(1)1-4 doi1016500010-5422(2006)108[0001HMFAE]20CO2
Kuhn-Hines A 2008 A multiscale approach tobreeding habitat model development and evaluationfor the common loon Gavia immer in NewHampshire USA ETD Collection for University ofRhode Island Paper AAI3346850 [online] URL httpdigitalcommonsuriedudissertationsAAI3346850
Lawler J J and T C Edwards Jr 2006 Avariance-decomposition approach to investigatingmultiscale habitat associations Condor 108(1)47-58 doi1016500010-5422(2006)108[0047AVATIM]20CO2
Li X D Li Z Ma and D Schneider 2006 Nestsite use by crested ibis dependence of a multifactormodel on spatial scale Landscape Ecology 21(8)1207-1216 doi101007s10980-006-0021-z
Loon Preservation Committee 2004 Fieldcollection protocol for surveying and managingCommon Loons in New Hampshire LoonPreservation Committee Moultonborough NewHampshire USA
Loon Preservation Committee 2005 Meeting thechallenge thirty years of preserving loons and theirhabitats in New Hampshire Loon PreservationCommittee Moultonborough New HampshireUSA
Luck G W 2002 The habitat requirements of therufous treecreeper (Climacteris rufa) 1 Preferentialhabitat use demonstrated at multiple spatial scalesBiological Conservation 105(3)383-394 doi101016S0006-3207(01)00222-1
MacKenzie D I 2005 Was it there Dealing withimperfect detection for species presenceabsencedata Australian and New Zealand Journal ofStatistics 47(1)65-74 doi101111j1467-842X200500372x
MacKenzie D I J D Nichols J E Hines M GKnutson and A B Franklin 2003 Estimating siteoccupancy colonization and local extinction whena species is detected imperfectly Ecology 84(8)2200-2207 doi10189002-3090
Avian Conservation and Ecology 6(1) 4httpwwwace-ecoorgvol6iss1art4
Martin S L and P A Soranno 2006 Lakelandscape position relationships to hydrologicconnectivity and landscape features Limnology andOceanography 51(2)801-814 doi104319lo20065120801
McGarigal K and B J Marks 1995 FRAGSTATSspatial pattern analysis program for quantifyinglandscape structure General Technical ReportPNW-GTR-351 US Department of AgricultureForest Service Washington DC USA
McIntyre J W 1983 Nurseries a consideration ofhabitat requirements during the early chick-rearingperiod in common loons Journal of FieldOrnithology 54(3)247-253
McIntyre J W 1988 The Common Loon spirit ofnorthern lakes University of Minnesota PressMinneapolis Minnesota USA
McIntyre J W and J F Barr 1997 Common loonGavia immer In A Poole and F Gill editors TheBirds of North America 313 Academy of NaturalSciences of Philadelphia and American OrnithologistsUnion Washington DC USA
Menard S 2002 Applied logistic regressionanalysis Second edition Sage PublicationsThousand Oaks California USA
Meyer C B S L Miller and C J Ralph 2002Multi-scale landscape and seascape patternsassociated with marbeled murrelet nesting areas onthe US west coast Landscape Ecology 17(2)95-115 doi101023A1016574928706
Meyer M W 2006 Evaluating the impact ofmultiple stressors on Common Loon populationdemographics-an integrated laboratory and fieldapproach EPA STAR Co-operative AgreementNumber R82-9085 Environmental ProtectionAgency Washington DC USA
Meyer M W D C Evers J J Hartigan and P SRasmussen 1998 Patterns of common loon (Gaviaimmer) mercury exposure reproduction andsurvival in Wisconsin USA EnvironmentalToxicology and Chemistry 17(2)184-190
Meyer M W and J E Woodford 1996Enhancing osprey (Pandion haliaetus) and commonloon (Gavia immer) reproduction on impacted
Wisconsin waterways Final report US Fish andWildlife Service Washington DC USA
Moran P A P 1950 Notes on continuousstochastic phenomena Biometrika 37(1-2)17-23 doi101093biomet371-217
Murtagh P A and P S Pooler 2006 Evaluatingecological indicators lakes in the northeasternUnited States Environmental Monitoring andAssessment 119(1-3)83-96 doi101007s10661-005-9011-x
New Hampshire Department of EnvironmentalServices 2005 Water quality data survey summaryfor New Hampshire lakes and ponds NewHampshire Department of Environmental ServicesNew Hampshire USA [online] URL httpdesnhgovorganizationdivisionswaterwmblakestrophic_summaryhtm
New Hampshire Department of EnvironmentalServices 2006 Community center areas NewHampshire Department of Environmental ServicesNew Hampshire USA [online] URL httpwwwgranitunhedudatadatacatpagescommunitycenterareaspdf
Newbrey J L M A Bozek and N D Niemuth2005 Effects of lake characteristics and humandisturbance on the presence of piscivorous birds innorthern Wisconsin USA Waterbirds 28(4)478-486 doi1016751524-4695(2005)28[478EOLCAH]20CO2
Nocera J J G J Forbes and G R Milton 2008The relevance of local-scale relationships to habitatmanagement and landscape patterns AvianConservation and Ecology - Eacutecologie etconservation des oiseaux 3(1) 4 [online] URL httpwwwace-ecoorgvol3iss1art4
Northeast Loon Study Work Group 2008 [online]URL httpwwwbriloonorgscience-and-conservationcentersNELSWGphp
OrsquoBrien R M 2007 A caution regarding rules ofthumb for variance inflation factors Quality ampQuantity 41(5)673-690 doi101007s11135-006-9018-6
Patton D R 1975 A diversity index for quantifyinghabitat lsquoedgersquo Wildlife Society Bulletin 3171-173
Avian Conservation and Ecology 6(1) 4httpwwwace-ecoorgvol6iss1art4
Penhollow M E and D F Stauffer 2000 Large-scale habitat relationships of neotropical migratorybirds in Virginia Journal of Wildlife Management 64(2)362-373 doi1023073803234
Piper W H C Walcott J N Mager III M PeralaK B Tischler E Harrington A J Turcotte MSchwabenlander and N Banfield 2006 Prospectingin a solitary breeder chick production elicitsterritorial intrusions in common loons BehavioralEcology 17(6)881-888 doi101093behecoarl021
Piper W H C Walcott J N Mager and F JSpilker 2008 Nestsite selection by male loons leadsto sex-biased site familiarity Journal of AnimalEcology 77(2)205-210 doi101111j1365-2656200701334x
Rimmer C C 1992 Common Loon Gavia immer Pages 3-30 in K J Schneider and D M Penceeditors Migratory nongame birds managementconcern in the Northeast US Fish and WildlifeService Newton Corner Massachusetts USA
Riitters K H R V OrsquoNeill and K B Jones 1997Assessing habitat suitability at multiple scales alandscape-level approach Biological Conservation 81(1-2)191-202 doi101016S0006-3207(96)00145-0
Saab V 1999 Importance of spatial scale to habitatuse by breeding birds in riparian forests ahierarchical analysis Ecological Applications 9(1)135-151 doi1018901051-0761(1999)009[0135IOSSTH]20CO2
SAS Institute Inc 2003 SAS 91 Cary NorthCarolina USA
Scott J M P J Heglund M L Morrison J BHaufler M G Raphael W A Wall and F BSamson editors 2002 Predicting speciesoccurrences issues of accuracy and scale IslandPress Washington DC USA
Society for Protection of New Hampshire Forests2005 New Hampshirersquos changing landscapepopulation growth and land use changes Societyfor Protection of New Hampshire Forests [online]URL httpwwwforestsocietyorgresearchresearch-projectsasp
Soranno P A K E Webster K S Cheruvelil andM T Bremigan 2009 The lake landscape-contextframework linking aquatic connections terrestrialfeatures and human effects at multiple scalesVerhandlungen des Internationalen Verein Limnologie 30(5)695-700
Sperduto D D and W F Nichols 2004 Naturalcommunities of New Hampshire New HampshireNatural Heritage Bureau Concord New HampshireUSA and University of New HampshireCooperative Extension Durham New HampshireUSA
SPSS Inc 1999 SPSS 100 Chicago Illinois USA
Stauffer H B C J Ralph and S L Miller 2004Ranking habitat for marbled murrelets a newconservation approach for species with uncertaindetection Ecological Applications 14(5)1374-1383doi10189003-5068
Stein B A and S R Flack 1997 1997 speciesreport card the status of US plants and animals The Nature Conservancy Arlington VirginiaUSA [online] URL httpwwwnatureserveorglibrary1997speciesreportcardpdf
Strauss B and R Biedermann 2007 Evaluatingtemporal and spatial generality How valid arespecies-habitat relationship models EcologicalModeling 204104-114 doi101016jecolmodel200612027
Strong P I V and J A Bissonette 1989 Feedingand chick-rearing areas of common loons Journalof Wildlife Management 5372-76 doi1023073801308
Strong P I V J A Bissonette and J S Fair 1987Reuse of nesting and nursery areas by CommonLoons Journal of Wildlife Management 51123-127doi1023073801642
Taylor K M and H S Vogel 2000 NewHampshire report Pages 110-113 in J McIntyre andD C Evers editors Loons old history and newfindings Proceedings symposium 1997 meetingAmerican Ornithologists Union North AmericanLoon Fund Holderness New Hampshire USA
Thogmartin W E 2007 Effects at the landscapescale may constrain habitat relations at finer scales
Avian Conservation and Ecology 6(1) 4httpwwwace-ecoorgvol6iss1art4
Avian Conservation and Ecology - Eacutecologie etconservation des oiseaux 2(2) 6 [online] URL URL httpwwwace-ecoorgvol2iss2art6
Thogmartin W E and M G Knutson 2007Scaling local species-habitat relations to the largerlandscape with a hierarchical spatial count modelLandscape Ecology 22(1)61-75 doi101007s10980-006-9005-2
Thompson C M and K McGarigal 2002 Theinfluence of research scale on bald eagle habitatselection along the lower Hudson River New York(USA) Landscape Ecology 17(6)569-586 doi101023A1021501231182
Titus J R and L W VanDruff 1981 Responseof the common loon to recreational pressure in theBoundary Waters Canoe Area northeasternMinnesota Wildlife Monographs 791-60
Trocki C L and P W C Paton 2006 Assessinghabitat selection by foraging egrets in salt marshesat multiple spatial scales Wetlands 26(2)307-312 doi1016720277-5212(2006)26[307AHSBFE]20CO2
Turner M G 2005 Landscape ecology What isthe state of the science Annual Review of EcologyEvolution and Systematics 36319-344 doi101146annurevecolsys36102003152614
Tyre A J B Tenhumberg S A Field D NiejalkeK Parris and H P Possingham 2003 Improvingprecision and reducing bias in biological surveysestimating false-negative error rates EcologicalApplications 13(6)1790-1801 doi10189002-5078
Vermeer K 1973 Some aspects of the nestingrequirements of common loons in Alberta WilsonBulletin 85429-435
Wiens J A 1989 Spatial scaling in ecologyFunctional Ecology 3385-397 doi1023072389612
Wiens J A 2002 Riverine landscapes takinglandscape ecology into the water FreshwaterBiology 47(4)501-515 doi101046j1365-2427200200887x
Wiens J A J T Rotenberry and B van Horne1987 Habitat occupancy patterns of North
American shrubsteppe birds the effects of spatialscale Oikos 48132-147 doi1023073565849
Wilcove D S D Rothstein J Dubow A Phillipsand E Losos 1998 Quantifying threats to imperiledspecies in the United States Bioscience 48607-615doi1023071313420
Wu J 2004 Effects of changing scale on landscapepattern analysis scaling relations LandscapeEcology 19(2)125-138 doi101023BLAND000002171140074ae
Avian Conservation and Ecology 6(1) 4httpwwwace-ecoorgvol6iss1art4
Avian Conservation and Ecology - Eacutecologie etconservation des oiseaux 2(2) 6 [online] URL URL httpwwwace-ecoorgvol2iss2art6
Thogmartin W E and M G Knutson 2007Scaling local species-habitat relations to the largerlandscape with a hierarchical spatial count modelLandscape Ecology 22(1)61-75 doi101007s10980-006-9005-2
Thompson C M and K McGarigal 2002 Theinfluence of research scale on bald eagle habitatselection along the lower Hudson River New York(USA) Landscape Ecology 17(6)569-586 doi101023A1021501231182
Titus J R and L W VanDruff 1981 Responseof the common loon to recreational pressure in theBoundary Waters Canoe Area northeasternMinnesota Wildlife Monographs 791-60
Trocki C L and P W C Paton 2006 Assessinghabitat selection by foraging egrets in salt marshesat multiple spatial scales Wetlands 26(2)307-312 doi1016720277-5212(2006)26[307AHSBFE]20CO2
Turner M G 2005 Landscape ecology What isthe state of the science Annual Review of EcologyEvolution and Systematics 36319-344 doi101146annurevecolsys36102003152614
Tyre A J B Tenhumberg S A Field D NiejalkeK Parris and H P Possingham 2003 Improvingprecision and reducing bias in biological surveysestimating false-negative error rates EcologicalApplications 13(6)1790-1801 doi10189002-5078
Vermeer K 1973 Some aspects of the nestingrequirements of common loons in Alberta WilsonBulletin 85429-435
Wiens J A 1989 Spatial scaling in ecologyFunctional Ecology 3385-397 doi1023072389612
Wiens J A 2002 Riverine landscapes takinglandscape ecology into the water FreshwaterBiology 47(4)501-515 doi101046j1365-2427200200887x
Wiens J A J T Rotenberry and B van Horne1987 Habitat occupancy patterns of North
American shrubsteppe birds the effects of spatialscale Oikos 48132-147 doi1023073565849
Wilcove D S D Rothstein J Dubow A Phillipsand E Losos 1998 Quantifying threats to imperiledspecies in the United States Bioscience 48607-615doi1023071313420
Wu J 2004 Effects of changing scale on landscapepattern analysis scaling relations LandscapeEcology 19(2)125-138 doi101023BLAND000002171140074ae
Copyright © 2022 FDOKUMEN