
Modeling and validation of a photocatalytic oxidation reactor for indoor environment applications
10
Modeling and validation of a photocatalytic oxidation reactor for indoor environment applications Lexuan Zhong, Fariborz Haghighat n Department of Building, Civil and Environmental Engineering, Concordia University, Montreal, Quebec, Canada H3G 1M8 article info Article history: Received 2 March 2011 Received in revised form 5 August 2011 Accepted 8 August 2011 Available online 19 August 2011 Keywords: Ultraviolet photocatalytic oxidation Model Irradiance Energy Efficiency Air purification abstract Modern building ventilation design must take into account the health, safety and comfort of the occupants, as well as energy consumption and the environment. The system needs to protect occupants against chemical contaminants from numerous internal sources—office equipment, furniture, building materials, appliances, as well as intentional release. A promising technology which has great potential in this respect is UV photocatalytic oxidation (UV-PCO). Designing a UV-PCO system for a building requires full understanding of its performance, which strongly depends on the UV intensity field, types and concentration levels of reactants, oxygen and moisture levels, temperature, reflectance of duct surfaces, system configuration, orientation, air stream characteristics like temperature, humidity, air velocity and mixing, just to mention a few. This paper reports the development of a mathematical model for predicting the performance of a honeycomb monolith PCO reactor used in building mechanical ventilation systems. The model is validated by comparing its prediction with experimental data and with the prediction made by an existing model. The influence of several kinetic parameters such as airflow rate, pollutant inlet concentration, light intensity, humidity and catalyst deactivation has been investigated. The developed model can be used as a practical tool to simulate and optimize a UV-PCO system for application in building mechanical ventilation system. & 2011 Elsevier Ltd. All rights reserved. 1. Introduction The needs to provide a healthy, safe and comfortable indoor environment and to reduce building energy consumption have all increased the interest in systems to filter gaseous contaminants from the air. Ultraviolet photocatalytic oxidation (UV-PCO) is a promising technology, which has great potential for such an application (Zhong et al., 2010). Such devices use titanium dioxide (a semiconductor) where electron transition from the valence band to the conduction band results from the absorption of light in the near UV range. The subsequent generation of positive holes and their interactions lead to the formation of hydroxyl radicals. These act as powerful oxidizing agents and can be used in the mineralization of organic molecules on the surface of titanium dioxide. In addition, claims have been made with respect to the use of UV-PCO devices in enhanced inactivation rate of micro- organism (Wang et al., 2009). However, it must be noted that in case of incomplete oxidation, the pollutants may be transformed into other by-products that can also pose health hazards. There is little reliable information available in the literature about the performance of this system. Although a number of devices such as chemical filtration, UVGI and UV-PCO are available in the market, no systematic studies have been carried out regarding their comparative performance. In the quest for more successful commercial applications of UV-PCO technology in buildings, more attention is being brought to the modeling and simulation of reactors in order to obtain a more comprehensive and systematic understanding of the UV-PCO system. Nicolella and Rovatti (1998) proposed a mathematical model- ing of monolith reactors, which predicted the rate of chemical reaction and energy transfer. This model provided the distribution of photo-flux along the channels, and defined the contributions of thermal and pure photonic effect on the overall rate of conver- sion. Although enthalpy balance was an innovative aspect in their modeling, they neglected the contribution of molecular diffusion transfer in the mass balance, and therefore their model cannot accurately account for the behavior of PCO under the case of continuous injection of contaminants. Changrani and Raupp (2000) presented the development of a two-dimensional heterogeneous convection-reaction model for an annular reticulated monolithic gas–solid photo-reactor. This model was developed on the basis of efficient utilization of UV irradiance, and it evaluated the reaction rate with local volu- metric rate of energy absorption (LVREA). The magnitude of Contents lists available at SciVerse ScienceDirect journal homepage: www.elsevier.com/locate/ces Chemical Engineering Science 0009-2509/$ - see front matter & 2011 Elsevier Ltd. All rights reserved. doi:10.1016/j.ces.2011.08.017 n Corresponding author. E-mail address: [email protected] (F. Haghighat). Chemical Engineering Science 66 (2011) 5945–5954
Transcript of Modeling and validation of a photocatalytic oxidation reactor for indoor environment applications
Chemical Engineering Science 66 (2011) 5945–5954
Contents lists available at SciVerse ScienceDirect
Chemical Engineering Science
0009-25
doi:10.1
n Corr
E-m
journal homepage: www.elsevier.com/locate/ces
Modeling and validation of a photocatalytic oxidation reactor for indoorenvironment applications
Lexuan Zhong, Fariborz Haghighat n
Department of Building, Civil and Environmental Engineering, Concordia University, Montreal, Quebec, Canada H3G 1M8
a r t i c l e i n f o
Article history:
Received 2 March 2011
Received in revised form
5 August 2011
Accepted 8 August 2011Available online 19 August 2011
Keywords:
Ultraviolet photocatalytic oxidation
Model
Irradiance
Energy
Efficiency
Air purification
09/$ - see front matter & 2011 Elsevier Ltd. A
016/j.ces.2011.08.017
esponding author.
ail address: [email protected] (F. Hagh
a b s t r a c t
Modern building ventilation design must take into account the health, safety and comfort of the
occupants, as well as energy consumption and the environment. The system needs to protect occupants
against chemical contaminants from numerous internal sources—office equipment, furniture, building
materials, appliances, as well as intentional release. A promising technology which has great potential
in this respect is UV photocatalytic oxidation (UV-PCO). Designing a UV-PCO system for a building
requires full understanding of its performance, which strongly depends on the UV intensity field, types
and concentration levels of reactants, oxygen and moisture levels, temperature, reflectance of duct
surfaces, system configuration, orientation, air stream characteristics like temperature, humidity, air
velocity and mixing, just to mention a few.
This paper reports the development of a mathematical model for predicting the performance of a
honeycomb monolith PCO reactor used in building mechanical ventilation systems. The model is
validated by comparing its prediction with experimental data and with the prediction made by an
existing model. The influence of several kinetic parameters such as airflow rate, pollutant inlet
concentration, light intensity, humidity and catalyst deactivation has been investigated. The developed
model can be used as a practical tool to simulate and optimize a UV-PCO system for application in
building mechanical ventilation system.
& 2011 Elsevier Ltd. All rights reserved.
1. Introduction
The needs to provide a healthy, safe and comfortable indoorenvironment and to reduce building energy consumption have allincreased the interest in systems to filter gaseous contaminantsfrom the air. Ultraviolet photocatalytic oxidation (UV-PCO) is apromising technology, which has great potential for such anapplication (Zhong et al., 2010). Such devices use titanium dioxide(a semiconductor) where electron transition from the valenceband to the conduction band results from the absorption of lightin the near UV range. The subsequent generation of positive holesand their interactions lead to the formation of hydroxyl radicals.These act as powerful oxidizing agents and can be used in themineralization of organic molecules on the surface of titaniumdioxide. In addition, claims have been made with respect to theuse of UV-PCO devices in enhanced inactivation rate of micro-organism (Wang et al., 2009). However, it must be noted that incase of incomplete oxidation, the pollutants may be transformedinto other by-products that can also pose health hazards. There islittle reliable information available in the literature about the
ll rights reserved.
ighat).
performance of this system. Although a number of devices such aschemical filtration, UVGI and UV-PCO are available in the market,no systematic studies have been carried out regarding theircomparative performance. In the quest for more successfulcommercial applications of UV-PCO technology in buildings, moreattention is being brought to the modeling and simulation ofreactors in order to obtain a more comprehensive and systematicunderstanding of the UV-PCO system.
Nicolella and Rovatti (1998) proposed a mathematical model-ing of monolith reactors, which predicted the rate of chemicalreaction and energy transfer. This model provided the distributionof photo-flux along the channels, and defined the contributions ofthermal and pure photonic effect on the overall rate of conver-sion. Although enthalpy balance was an innovative aspect in theirmodeling, they neglected the contribution of molecular diffusiontransfer in the mass balance, and therefore their model cannotaccurately account for the behavior of PCO under the case ofcontinuous injection of contaminants.
Changrani and Raupp (2000) presented the development of atwo-dimensional heterogeneous convection-reaction model foran annular reticulated monolithic gas–solid photo-reactor. Thismodel was developed on the basis of efficient utilization of UVirradiance, and it evaluated the reaction rate with local volu-metric rate of energy absorption (LVREA). The magnitude of
L. Zhong, F. Haghighat / Chemical Engineering Science 66 (2011) 5945–59545946
LVREA mainly determined the influence of mass transfer when itwas a limiting process. At the same time, LVREA was affected bythe catalyst loading and porosity of the porous catalyst support.However, this model assumed steady state conditions, whichmakes it difficult to be applied to practical usage due to thevariation of numerous properties, such as the pollutant concen-tration in the inter-fibers or at the surface of fibers as functionof time.
Yang et al. (2004) proposed an improved PCO model based onthree main parameters: the average total removing factor, Kt, thenumber of mass transfer units, NTUm and the fractional conversion,e. This model can be applied to predict the controlling process of aPCO reactor under specific conditions. The controlling process couldbe mass-transfer-controlled process, reaction-controlled process, orcombined-controlled process. The limitation of this model is that themass conservation equation was constructed only in air-phase andthe effect of irradiance on PCO performance was not clearly reflectedin their mathematical model.
Developed one-dimensional and two-dimensional models,based respectively on plug flow and laminar flow, are used tostudy the effect of the key parameters on the performance of anannular reactor (Tomasic et al., 2008). Through simulation analy-sis, they concluded that the inter-phase mass transfer was thedominating process, which determined the behavior of theannular photocatalytic reactor. Nevertheless, the kinetic ratemodel they developed does not consider the light intensity andinterference effects.
In the past two decades, although different prediction modelsfor PCO reactors have been developed, most of them are notintended for mechanical ventilation applications and cannotcorrectly simulate the behavior of a PCO reactor under theconditions encountered in buildings (Vincent et al., 2009; Pumaet al., 2009). In addition, most reported models consider massbalance of pollutants in either air-phase or solid-phase (Hossainet al., 1999; Zhang et al., 2003; Lewandowski and Ollis, 2003;Yang et al., 2004; Estivill et al., 2007). Only few models considerpollutants mass balance for both air-phase and solid-phase, andthose which take it into account assume a steady state condition(Nicolella and Rovatti, 1998; Changrani and Raupp, 2000; Tomasicet al., 2008).
This paper reports the development of a reliable time-depen-dent PCO model to simulate an in-duct PCO air cleaner under theconditions relevant to the actual applications. The proposed two-phase model incorporates the influences of properties of lightsources and catalyst, reactor geometry, mass transfer parameters,kinetic parameters as well as operational conditions, such as theairflow rate, inlet pollutant concentration, relative humidity andirradiance. The comprehensive PCO model is then used to analyzethe effects of key parameters on PCO performance, to predict thesingle-pass removal efficiency of the in-duct UV-PCO air cleaners,and to estimate the dominating process between physical inter-actions and photochemical interactions.
2. Model development
Photocatalytic degradation of gaseous pollutants is a complexphysico-chemical process and the catalytic reaction rate is anessential gage of the efficiency of UV-PCO system. Simple kineticmodels are different order empirical models, which assume theconcentrations of reacting species in air as the driving force forreaction. The effects of the rest of aforementioned UV-PCOparameters are lump-summed into a reaction rate constant aswell as the order of reaction (Zhang et al., 2003; Yang et al., 2004).In contrast, the models that assume the concentrations ofadsorbed species on the catalyst as the driving force can
separately account for the effects of pollutant mixture, oxygenand moisture levels, as well as the concentration of reactants.Several studies (Obee, 1996; Chen et al., 2005) applied differentforms (e.g., unimolecular with or without interference effects ofmixture, and bimolecular) of Langmuir–Hinshelwood (L–H)model, which retains the assumptions underlying the Langmuiradsorption isotherm. L–H model, however, cannot explicitlydescribe UV irradiation or mass transfer of reactants in the bulkfluid and porous structure of the catalyst. In this research, an L–Hmodel combined with a proper light scattering model and a masstransfer model will be developed to closely reflect the actuality ofthe photocatalytic reaction.
The considered PCO reactor is integrated into a mechanicalventilation system, and UV lamps with peak wavelengths of UVA,UVB and UVC are positioned in front of and parallel to the filtersurface coated with titanium dioxide (TiO2). The following funda-mental mechanisms are considered in the development of in-ductUV-PCO:
1.
The distribution of photo-energy within ducts and interactionbetween light and matter at the surface of catalyst.2.
Convection, diffusion and boundary transfer of contaminantsin the air-phase;3.
Inter-phase mass transfer of reactant species. 4. Adsorption and photocatalytic oxidation reaction in the solid-phase.
The following assumptions are made in the development ofthe model:
1.
Irradiance emitted from UV lamp is constant, stable in theimaged plane of a light source and independent of specifieddirectionality.2.
The inner geometries of ducts are identical and inner walls areuniformly irradiated by UV lamps asymmetrically mounted inthe duct.3.
Absorption, reflection, refraction and diffraction of light bymixed gases are negligible.4.
TiO2 catalysts are uniformly coated at the fibrous support. 5. Reflectivity of inner walls is a function of light wavelength, andindependent of the light incidence angle;
6. Air flow in duct is regarded as ideal plug flow. 7. PCO reaction occurs at the surface of catalyst fibers illumi-nated with UV-lights.
2.1. UV irradiance field model
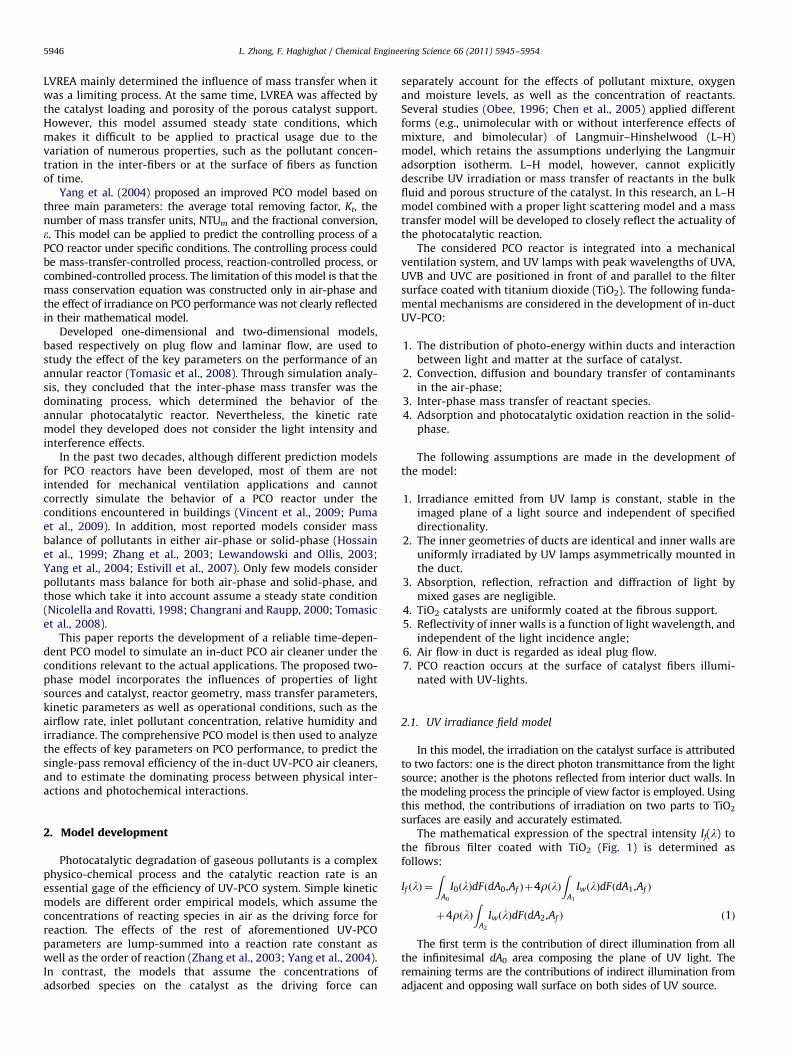
In this model, the irradiation on the catalyst surface is attributedto two factors: one is the direct photon transmittance from the lightsource; another is the photons reflected from interior duct walls. Inthe modeling process the principle of view factor is employed. Usingthis method, the contributions of irradiation on two parts to TiO2
surfaces are easily and accurately estimated.The mathematical expression of the spectral intensity If(l) to
the fibrous filter coated with TiO2 (Fig. 1) is determined asfollows:
If ðlÞ ¼Z
A0
I0ðlÞdFðdA0,Af Þþ4rðlÞZ
A1
IwðlÞdFðdA1,Af Þ
þ4rðlÞZ
A2
IwðlÞdFðdA2,Af Þ ð1Þ
The first term is the contribution of direct illumination from allthe infinitesimal dA0 area composing the plane of UV light. Theremaining terms are the contributions of indirect illumination fromadjacent and opposing wall surface on both sides of UV source.
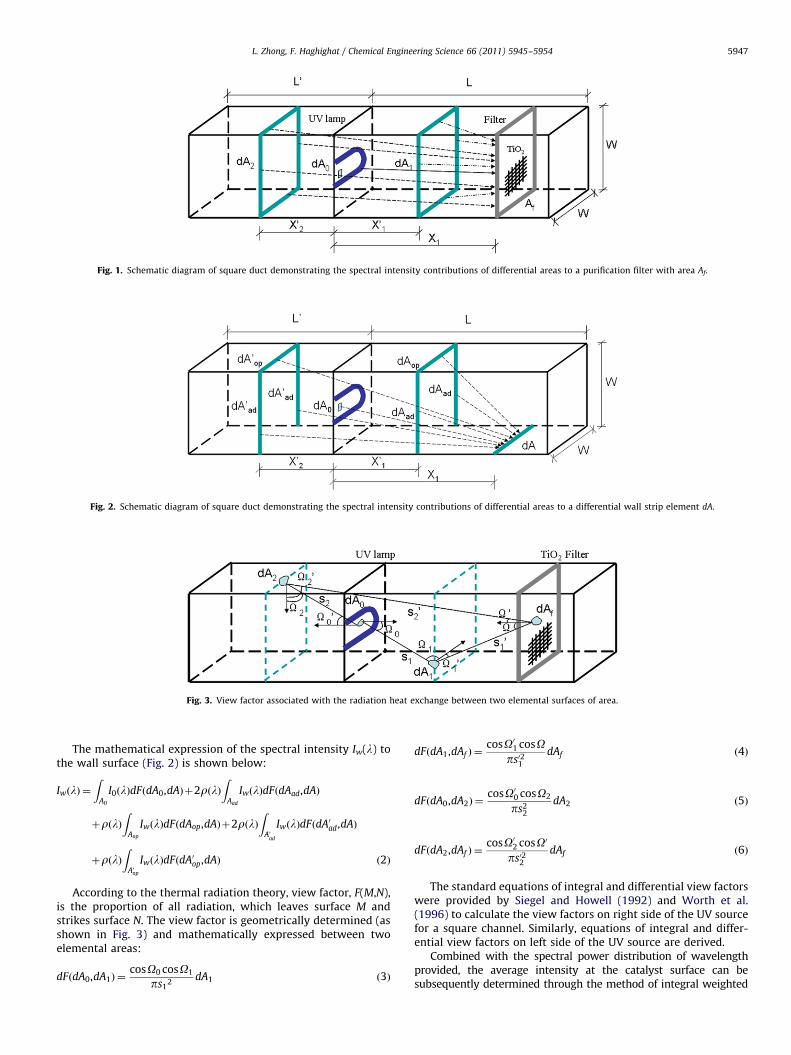
Fig. 2. Schematic diagram of square duct demonstrating the spectral intensity contributions of differential areas to a differential wall strip element dA.
Fig. 3. View factor associated with the radiation heat exchange between two elemental surfaces of area.
Fig. 1. Schematic diagram of square duct demonstrating the spectral intensity contributions of differential areas to a purification filter with area Af.
L. Zhong, F. Haghighat / Chemical Engineering Science 66 (2011) 5945–5954 5947
The mathematical expression of the spectral intensity Iw(l) tothe wall surface (Fig. 2) is shown below:
IwðlÞ ¼Z
A0
I0ðlÞdFðdA0,dAÞþ2rðlÞZ
Aad
IwðlÞdFðdAad,dAÞ
þrðlÞZ
Aop
IwðlÞdFðdAop,dAÞþ2rðlÞZ
A0ad
IwðlÞdFðdA0ad,dAÞ
þrðlÞZ
A0op
IwðlÞdFðdA0op,dAÞ ð2Þ
According to the thermal radiation theory, view factor, F(M,N),is the proportion of all radiation, which leaves surface M andstrikes surface N. The view factor is geometrically determined (asshown in Fig. 3) and mathematically expressed between twoelemental areas:
dFðdA0,dA1Þ ¼cosO0 cosO1
ps12
dA1 ð3Þ
dFðdA1,dAf Þ ¼cosO01 cosO
ps021dAf ð4Þ
dFðdA0,dA2Þ ¼cosO00 cosO2
ps22
dA2 ð5Þ
dFðdA2,dAf Þ ¼cosO02 cosO0
ps022dAf ð6Þ
The standard equations of integral and differential view factorswere provided by Siegel and Howell (1992) and Worth et al.(1996) to calculate the view factors on right side of the UV sourcefor a square channel. Similarly, equations of integral and differ-ential view factors on left side of the UV source are derived.
Combined with the spectral power distribution of wavelengthprovided, the average intensity at the catalyst surface can besubsequently determined through the method of integral weighted

L. Zhong, F. Haghighat / Chemical Engineering Science 66 (2011) 5945–59545948
mean. The expression is shown as follows:
I ¼
R lmax
lminPðlÞIf ðlÞdlR lmax
lminPðlÞdl
ð7Þ
Compared with the previously developed irradiance models(Hossain and Raupp, 1998, 1999; Hossain et al., 1999; Alexiadis,2006), the advantage of this new UV irradiance model is that thecontributions of wall surface on left and right side of UV light areconsidered, because UV sources are always mounted within a duct ofHVAC system. Therefore, this model accurately simulates the actualdistribution of UV irradiation in an in-duct air purification system.
2.2. Reaction kinetic model
The determination and evaluation of kinetic parameters inphotocatalytic reaction rate model is based on the fundamentalmechanism of PCO, and is one of the main obstacles for practicalapplication of mathematical model of PCO reaction. The simplerepresentation of photochemical process is
iþhv-ðx1i1þ � � � þxjijþ � � � þxmimÞþCO2þH2O
Based on this mechanism, developed Langmuir-Hinshelwoodreaction rate equation is used for modeling the mean PCOreaction rate of species i removal, which is given by
�ri ¼ sðIf Þb ki0KiCiB
1þKiCiBþPm
j ¼ 1 KijCiBj
ð8Þ
Considering the irradiance distribution within the catalyst asnon-uniform, meaning that the irradiance within the catalyst issmaller than that at the external surface, the effectiveness factor,s, of the photocatalyst, defined by Hill (1977), is used to evaluatethe mean efficiency of the entire catalyst. Assuming irradiancewithin the catalyst varies exponentially; the effectiveness factor sof the geometry of interest is expressed as
s ¼R Lf
0 ðe�mLf xÞ
bdx
Lfð9Þ
2.3. Mass balance
The PCO dynamics of contaminants in fibrous TiO2 film isdescribed by two equations, one representing the mass balance ofthe contaminant in the inter-fiber air-phase and the other
Fig. 4. Schematic diagram of gas molecule transfer in the inter-fiber (air-phase)
and at the surface of fibers (solid-phase).
representing the mass balance at the surface of catalyst fibers(Fig. 4):
dCiB
dt¼etDmi
d2CiB
dx2�ux
dCiB
dx�kgaðCiB�CiSÞ ð10Þ
dCiS
dt¼ kgaðCiB�CiSÞ
�
R Lf
0 ðe�mLf xÞ
bdx
LfðIf Þ
b ki0KiCiS
1þKiCiSþKH2OCH2OþPm
j ¼ 1 KijCiSj
ð11Þ
where the initial and boundary conditions are
CiB ¼ CiS ¼ 0 at t¼ 0 ð12Þ
CiB0 ¼ Cin at x¼ 0 ð13Þ
CiBn ¼ Cout at x¼ Lf ð14Þ
3. Model implementation
To numerically solve the problem, the TiO2 film is discretizedinto n elemental cells connected in series in the airflow direction.Since the fibrous diffusion inside the fibers is not considered, onlyone fiber element is needed for each film node, and the concen-trations CB and CS are assumed to be uniform within a same cell(Fig. 5). Each of the film cells was implemented as a masstransport component solving with the Matlab R2009b using finitedifference method.
The PCO model is then used to simulate photocatalytic oxida-tion of toluene without intermediates generated. The parametersin the PCO model are summarized in Table 2 (column a). Oncethese parameters are obtained/estimated from the existing litera-ture (column b), the predicted performance of PCO air cleanerscan be evaluated for given values of the operational conditions.
Miyayama et al. (2004) found that the porosity of TiO2 filmwas controllable in the range from 30% to 56% by changingtrehalose concentration in the dip-coating solution. Ould-Mameet al. (2000) mentioned that the typical values of porosity andturtuosity of TiO2 film were 0.5 and 3, respectively. These twotypical values were also taken in this study. The thickness of TiO2
film is linearly proportional to deposition time, but photocatalyticactivity has nonlinear relationship with the film thickness. Theoptimum thickness of TiO2 catalyst film grown by the low-pressure metal-organic chemical vapor deposition is between3 and 5 mm (Jung et al., 2005). In this study we select a filmthickness of 5 mm.
The method developed by Wilke and Lee (1955) is commonlyused to estimate gaseous diffusion coefficients for a wide range oftemperatures. The value of 8.6�10�6 m2/s for toluene at roomtemperature is calculated using Wilke/Lee’s correlation, that is,the diffusion of gases is a function of temperature, the molecularweight, the collision integral, the pressure, and the characteristiclength of molecules.
Fig. 5. Discrete representation of TiO2 filter.

L. Zhong, F. Haghighat / Chemical Engineering Science 66 (2011) 5945–5954 5949
Votruba et al.’s (1975) developed Sherwood number (Sh) isused to calculate the inter-phase mass transfer coefficient, kg:
Sh¼ 0:705 ReD
Lf
� �0:43
Sc0:56ð15Þ
where Sc is the Schmidt number and Re is the Reynoldsnumber, D is the characteristic length of fibrous media, and itwas taken as 3�10–7 (m). Considering Reynolds number isassociated with the airflow rate, Sherwood number is a functionof the airflow rate and characteristic length of TiO2 particle.In addition, Sherwood number integrates the convective masstransfer coefficient in its definition, Sh¼kgD/Dm, then the con-vective mass transfer coefficient can be determined from thecomputed Sherwood number. The mass transfer coefficients forthe three airflow rates were presented in Tables 1 and 2.
Kinetic parameters have been evaluated by many researchers, anddifferent results have been reported for different models undervarious reaction conditions. For example, in literature, various valuesof reaction rate constant k0 and absorption coefficient K for toluenewith a concentration range 0.064–98 mg/m3 (0.02–26 ppm) havebeen reported. They include 13.388 mg/m3 s and 0.0049 m3/mg(Bouzaza et al., 2006), 6.77�10�7 mol/m2 s and 0.24 m3/mg(Zhang et al., 2007), 0.026 mg/m3 s and 0.0266 m3/mg (Shiraishiand Ishimatsu, 2009), as well as 0.0134 mg/m3 s and 0.66 m3/mg(Sleiman et al., 2009). It is very hard to compare these values, partlybecause most of experimental setups and reaction conditions aretotally different, partly because the kinetic parameters have differentunits. In this study, reaction rate coefficient of 1 mg/m3
� s andabsorption coefficient of 0.24 m3/mg were selected, which are withinthe range of aforementioned reported values. Obee (1996) investi-gated the effect of moisture on photo-oxidation of sub-ppm toluene,and obtained the value of 4.9�10�4 m3/mg (0.00036 ppm�1) for
Table 1Mass transfer coefficients for different airflow rates.
Empirical estimation Airflow rate (m/s)
0.5 1.0 1.5
kg (m/s) 1.39 1.87 2.23
Table 2Simulation parameters for UV-PCO tests.
Parameters (a)
Catalyst property TiO2 film porosity, eTiO2 film tortuosity factor, tTiO2 film thickness, Lf
Mass transfer Molecular diffusion coefficient, D
Inter-phase mass transfer coeffic
Geometric surface area per unit
volume, a
UV-PCO reaction Synthetic kinetic rate coefficient
Absorption coefficient, K
Water absorption coefficient, KH2
UV irradiance extinction coefficie
Reaction order with respect to UV
b
Operation
conditions
Concentration range, Cin
UV irradiance range, If
Velocity range, ux
Humidity, CH2 O
water absorption coefficient using the least-squares optimization. Weused this value in our simulation.
Taking into account the fact that the irradiance distributionwithin the catalyst follows exponential decay, the extinctioncoefficient of catalyst was set to a typical value of 0.3 mm�1
(Hill, 1977; Changrani and Raupp, 2000).In this study, the irradiance at the surface of TiO2 filter was
always greater than 1–2 mW/cm2. According to the empiricalcorrelation between the reaction rate and the light intensity(Obee and Brown, 1995), the power exponent value of 0.5 isconsidered in our simulation.
A value of 0.6 m�1, apparent catalyst surface area per unit PCOreactor volume, has been calculated on the basis of knowngeometrical size of the rectangular PCO reactor (Fig. 6). Thecontaminant concentration, UV irradiance, airflow velocity andrelative humidity were assumed to be controllable in the range of0.038–37.7 mg/m3 (0.01–10 ppm), 2–20 mW/cm2, 0.5–1.5 m/s(100–300 cfm) and 6990–18,940 mg/m3 (30–80%), respectively.
4. Model validation
To validate the PCO model prediction, simulation results arecompared with the prediction made by two-site kinetic modeldeveloped by Lewandowski and Ollis (2003). Two-site kineticmodel is established on the basis of the presumed presence of twodifferent types of adsorption sites, hydrophobic adsorption sites(type I) and hydrophilic adsorption sites (type II). For the reactanti, it is assumed to be only accessible to hydrophobic adsorptionsites (type I). The site balance is given as follows:
dyi
dt¼ kads,iPiyS1�kdes,iyi�kIyi ð16Þ
Compared with the PCO model, the two-site kinetic modelonly considers the mass balance of a reactant at the fiber surface,but gives a more detailed description (including adsorption anddesorption) on mass transfer.
Fig. 7 compares the PCO model simulation results with bothexperimental data and the two-site kinetic model simulation resultsfor two cases. Two models provide reasonable fits for experimentaldata collected during the photocatalytic oxidation of toluene in asingle-pass, powder layer PCO reactor under operational conditions of
Compound: toluene (b)
0.5
3
5 mm
m 8.6�10–6 m2/s
ient, kg 1.39, 1.87, 2.23 m/s
reactor 0.6 m�1
, k0 1 mg/m3 s
0.24 m3/mg
O 4.9�10�4 m3/mg
(0.00036 ppm�1)
nt, m 0.3 mm�1
light applied, 0.5
0.038–37.7 mg/m3 (0.01–
10 ppm)
2–20 mW/cm2
0.5–1.5 m/s (100–300 cfm)
6990–18,940 mg/m3 (30–80%)

Pre-filter
UV-PCO reactor
Fan
30.5cm(1 feet)
Injection port Upstream concentration measurement port
Downstream concentration measurement port
Pressure dropmeasurement port
UV lamp
PCO
Filter
Lab exhaust duct
Light intensity measurement port
15.2cm(6 inch)
Static pressure measurement port
Total pressure measurement port
3.45m
1.70m
Fig. 6. Schematic diagram of experimental setup.
Two-site Kinetic Model
Proposed PCO Model
Inlet concentration
Experiment data of outlet concentration
0 20 40 60 80 100 120 140 160 1800
5
10
15
20
Exi
t Con
cent
ratio
n (m
g/m
3 )
Time (min)
0 20 40 60 80 100 120 140 160 1800
10
20
30
Exi
t Con
cent
ratio
n (m
g/m
3 )
Time (min)
Two-site Kinetic Model
Proposed PCO Model
Inlet concentration
Experiment data of outlet concentration
Fig. 7. Comparison of model prediction with the prediction of two-site kinetic
model (Lewandowski and Ollis, 2003) for toluene with inlet concentration of
(a) 20 mg/m3 (b) 30 mg/m3. (Simulation conditions: Cin¼20 mg/m3 and 30 mg/m3;
CH2 O ¼ 1000mg=m3; u¼0.011 m/s; If¼16.5 mW/cm2.)
L. Zhong, F. Haghighat / Chemical Engineering Science 66 (2011) 5945–59545950
20 mg/m3 and 30 mg/m3 of feed concentration, 1000 mg/m3 of watervapor concentration and 1�10–6 m3/s (2 cfm) of gas flow rate.In Lewandowski and Ollis (2003), a 100 W blacklight was used as aUV energy provider, but no information about the irradiance wasprovided. So the value of irradiance is the only adjusted parameter inthe simulation, and finally 16.5 mW/cm2 is found to be a correct
value to simulate the trend of the toluene concentration forboth cases.
It is worthwhile to mention that in their experimental work,Lewandowski and Ollis (2003) did not turn on UV lights until theadsorption of toluene and water by the regenerated catalyst reachedequilibrium. In other words, the first part of the experimental datareflects the adsorption process taking place, whereas the latter partshows the UV-PCO photochemical process being underway. This isthe reason for the discrepancy between experimental data and thePCO model predictions at the initial stage. After 60 min, howeverone can see that the exit concentration profile predicted by the PCOmodel for both cases seems to be more consistent with theexperimental data than that predicted by the two-site kinetic model.The good agreement between the predictions from the proposedPCO model and previous experimental results indicates the PCOmodel can correctly capture the trend of efficiency as a function oftime. Hence, the validated model can be applied to describe thebehavior of a PCO for application in the in-duct UV-PCO air cleaners.
5. Parametric simulations analysis
The simulation program is then used to predict the reactorbehavior under different operational conditions, as well as toaccount for the PCO performance changes resulting from theinfluencing design parameters. Moreover, it can provide informa-tion regarding limiting case tests beyond experimental possibi-lities. For example, it is of great interest to investigate the impactof operational conditions on the PCO efficiency. Fig. 8 demon-strates the interrelationships between different influencingelements in the PCO reactor model.
5.1. Effect of airflow rate
Fig. 9a shows the single-pass efficiency decays as function oftime. It also shows that as the airflow rate increases, the efficiencydrops. In other words, as the air velocity increases, the exposuretime to the PCO is so short that the decomposition of VOCs isgreatly compromised. More precisely, it means that the PCOreaction time is longer than the residence time and that thepollutants cannot fully participate in PCO reaction. Therefore, thelower the airflow rate, the higher the single-pass efficiency.
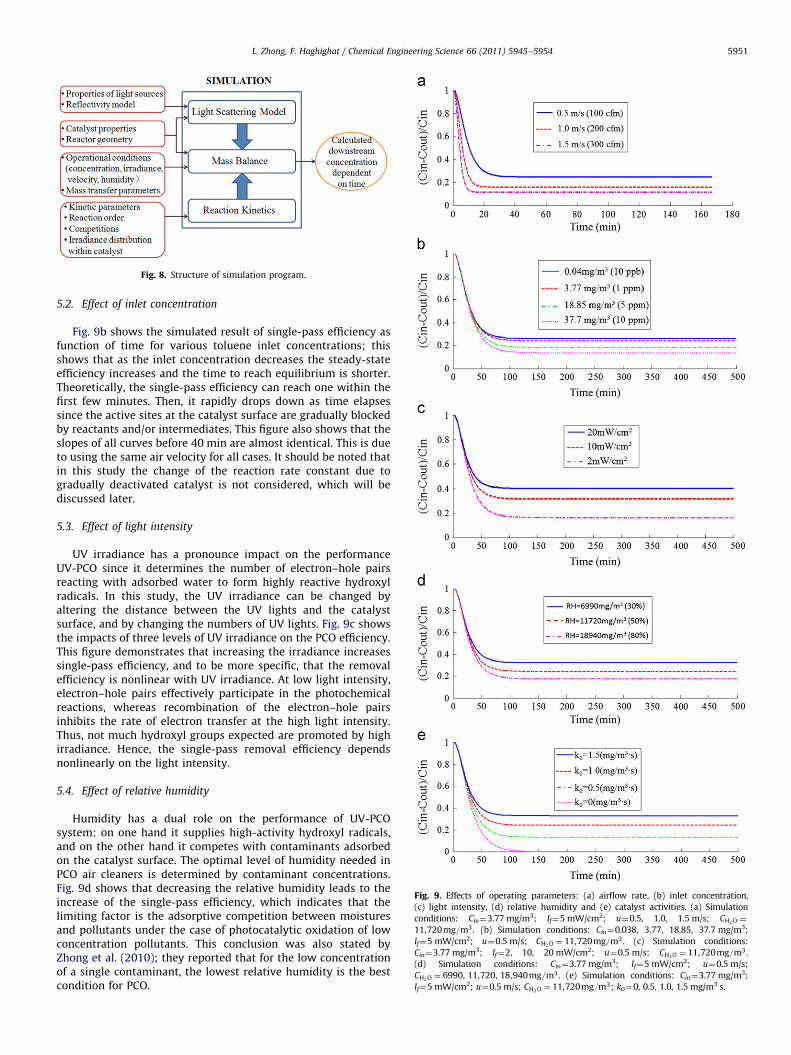
Fig. 8. Structure of simulation program.
Fig. 9. Effects of operating parameters: (a) airflow rate, (b) inlet concentration,
(c) light intensity, (d) relative humidity and (e) catalyst activities. (a) Simulation
conditions: Cin¼3.77 mg/m3; If¼5 mW/cm2; u¼0.5, 1.0, 1.5 m/s; CH2 O ¼
11,720mg=m3. (b) Simulation conditions: Cin¼0.038, 3.77, 18.85, 37.7 mg/m3;
If¼5 mW/cm2; u¼0.5 m/s; CH2 O ¼ 11,720mg=m3. (c) Simulation conditions:
Cin¼3.77 mg/m3; If¼2, 10, 20 mW/cm2; u¼0.5 m/s; CH2 O ¼ 11,720mg=m3.
(d) Simulation conditions: Cin¼3.77 mg/m3; If¼5 mW/cm2; u¼0.5 m/s;
CH2 O ¼ 6990, 11,720, 18,940mg=m3. (e) Simulation conditions: Cin¼3.77 mg/m3;
If¼5 mW/cm2; u¼0.5 m/s; CH2 O ¼ 11,720mg=m3; k0¼0, 0.5, 1.0, 1.5 mg/m3 s.
L. Zhong, F. Haghighat / Chemical Engineering Science 66 (2011) 5945–5954 5951
5.2. Effect of inlet concentration
Fig. 9b shows the simulated result of single-pass efficiency asfunction of time for various toluene inlet concentrations; thisshows that as the inlet concentration decreases the steady-stateefficiency increases and the time to reach equilibrium is shorter.Theoretically, the single-pass efficiency can reach one within thefirst few minutes. Then, it rapidly drops down as time elapsessince the active sites at the catalyst surface are gradually blockedby reactants and/or intermediates. This figure also shows that theslopes of all curves before 40 min are almost identical. This is dueto using the same air velocity for all cases. It should be noted thatin this study the change of the reaction rate constant due togradually deactivated catalyst is not considered, which will bediscussed later.
5.3. Effect of light intensity
UV irradiance has a pronounce impact on the performanceUV-PCO since it determines the number of electron–hole pairsreacting with adsorbed water to form highly reactive hydroxylradicals. In this study, the UV irradiance can be changed byaltering the distance between the UV lights and the catalystsurface, and by changing the numbers of UV lights. Fig. 9c showsthe impacts of three levels of UV irradiance on the PCO efficiency.This figure demonstrates that increasing the irradiance increasessingle-pass efficiency, and to be more specific, that the removalefficiency is nonlinear with UV irradiance. At low light intensity,electron–hole pairs effectively participate in the photochemicalreactions, whereas recombination of the electron–hole pairsinhibits the rate of electron transfer at the high light intensity.Thus, not much hydroxyl groups expected are promoted by highirradiance. Hence, the single-pass removal efficiency dependsnonlinearly on the light intensity.
5.4. Effect of relative humidity
Humidity has a dual role on the performance of UV-PCOsystem: on one hand it supplies high-activity hydroxyl radicals,and on the other hand it competes with contaminants adsorbedon the catalyst surface. The optimal level of humidity needed inPCO air cleaners is determined by contaminant concentrations.Fig. 9d shows that decreasing the relative humidity leads to theincrease of the single-pass efficiency, which indicates that thelimiting factor is the adsorptive competition between moisturesand pollutants under the case of photocatalytic oxidation of lowconcentration pollutants. This conclusion was also stated byZhong et al. (2010); they reported that for the low concentrationof a single contaminant, the lowest relative humidity is the bestcondition for PCO.
L. Zhong, F. Haghighat / Chemical Engineering Science 66 (2011) 5945–59545952
5.5. Effect of catalyst activities
Catalyst deactivation is a common phenomenon reported inprevious work (D’Hennezel et al., 1998; Alberici and Jardim, 1997;Ameen and Raupp, 1999). The effect of assumed reaction rateconstants on the efficiency of PCO was simulated to study the catalystwith different levels of deactivation. Fig. 9e shows that single-passefficiency after 25 min decreases when TiO2 catalyst has loweractivity. The efficiency curves in the first 25 min have nearly identicalslopes because the PCO process at initial stage is mainly controlled byadvection and mass transfer, which brings reactants into the catalystbed. After a certain amount of reactant accumulation at the surface ofTiO2 fibers, PCO reaction is the limiting process which controls allother PCO processes. Therefore, after PCO works for a certain periodof time and reaches equilibrium, the single-pass efficiency curve iscloser to zero as the reaction rate constant becomes smaller. It shouldbe mentioned that the kinetic rate coefficient, which in this study isassumed to be constant, changes with time.
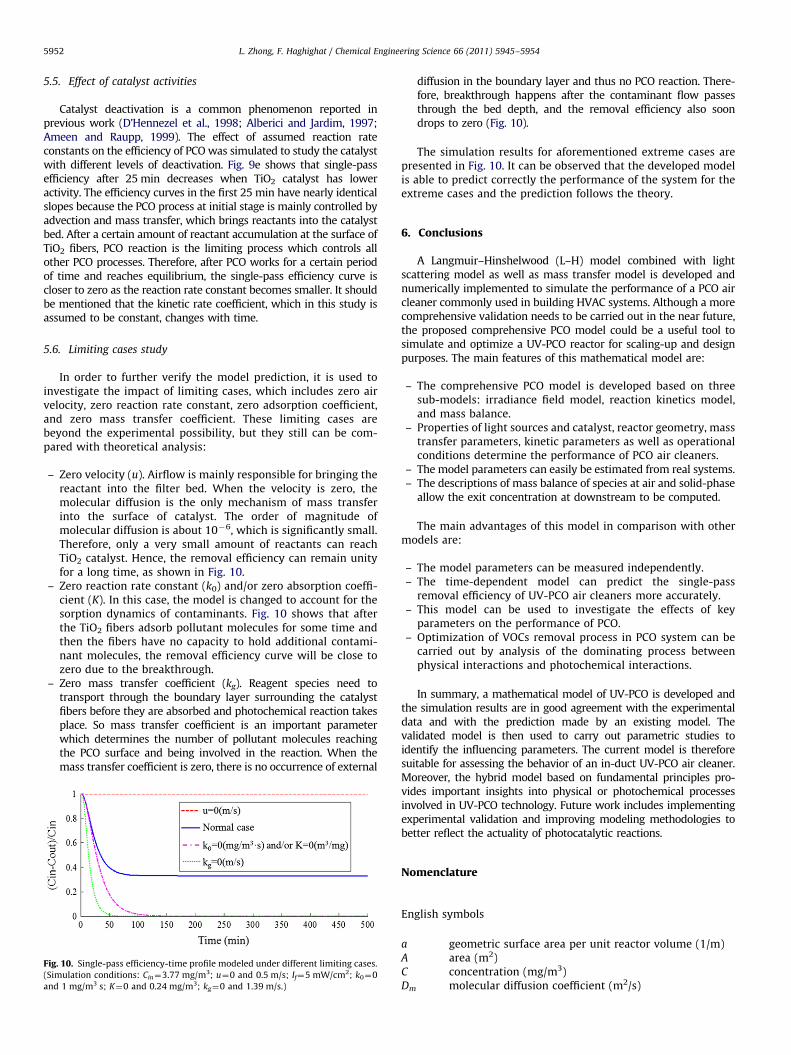
5.6. Limiting cases study
In order to further verify the model prediction, it is used toinvestigate the impact of limiting cases, which includes zero airvelocity, zero reaction rate constant, zero adsorption coefficient,and zero mass transfer coefficient. These limiting cases arebeyond the experimental possibility, but they still can be com-pared with theoretical analysis:
–
Fig(Sim
and
Zero velocity (u). Airflow is mainly responsible for bringing thereactant into the filter bed. When the velocity is zero, themolecular diffusion is the only mechanism of mass transferinto the surface of catalyst. The order of magnitude ofmolecular diffusion is about 10�6, which is significantly small.Therefore, only a very small amount of reactants can reachTiO2 catalyst. Hence, the removal efficiency can remain unityfor a long time, as shown in Fig. 10.
–
Zero reaction rate constant (k0) and/or zero absorption coeffi-cient (K). In this case, the model is changed to account for thesorption dynamics of contaminants. Fig. 10 shows that afterthe TiO2 fibers adsorb pollutant molecules for some time andthen the fibers have no capacity to hold additional contami-nant molecules, the removal efficiency curve will be close tozero due to the breakthrough.–
Zero mass transfer coefficient (kg). Reagent species need totransport through the boundary layer surrounding the catalystfibers before they are absorbed and photochemical reaction takesplace. So mass transfer coefficient is an important parameterwhich determines the number of pollutant molecules reachingthe PCO surface and being involved in the reaction. When themass transfer coefficient is zero, there is no occurrence of external. 10. Single-pass efficiency-time profile modeled under different limiting cases.
ulation conditions: Cin¼3.77 mg/m3; u¼0 and 0.5 m/s; If¼5 mW/cm2; k0¼0
1 mg/m3 s; K¼0 and 0.24 mg/m3; kg¼0 and 1.39 m/s.)
diffusion in the boundary layer and thus no PCO reaction. There-fore, breakthrough happens after the contaminant flow passesthrough the bed depth, and the removal efficiency also soondrops to zero (Fig. 10).
The simulation results for aforementioned extreme cases arepresented in Fig. 10. It can be observed that the developed modelis able to predict correctly the performance of the system for theextreme cases and the prediction follows the theory.
6. Conclusions
A Langmuir–Hinshelwood (L–H) model combined with lightscattering model as well as mass transfer model is developed andnumerically implemented to simulate the performance of a PCO aircleaner commonly used in building HVAC systems. Although a morecomprehensive validation needs to be carried out in the near future,the proposed comprehensive PCO model could be a useful tool tosimulate and optimize a UV-PCO reactor for scaling-up and designpurposes. The main features of this mathematical model are:
–
The comprehensive PCO model is developed based on threesub-models: irradiance field model, reaction kinetics model,and mass balance.–
Properties of light sources and catalyst, reactor geometry, masstransfer parameters, kinetic parameters as well as operationalconditions determine the performance of PCO air cleaners.–
The model parameters can easily be estimated from real systems. – The descriptions of mass balance of species at air and solid-phaseallow the exit concentration at downstream to be computed.
The main advantages of this model in comparison with othermodels are:
–
The model parameters can be measured independently. – The time-dependent model can predict the single-passremoval efficiency of UV-PCO air cleaners more accurately.
– This model can be used to investigate the effects of keyparameters on the performance of PCO.
– Optimization of VOCs removal process in PCO system can becarried out by analysis of the dominating process betweenphysical interactions and photochemical interactions.
In summary, a mathematical model of UV-PCO is developed andthe simulation results are in good agreement with the experimentaldata and with the prediction made by an existing model. Thevalidated model is then used to carry out parametric studies toidentify the influencing parameters. The current model is thereforesuitable for assessing the behavior of an in-duct UV-PCO air cleaner.Moreover, the hybrid model based on fundamental principles pro-vides important insights into physical or photochemical processesinvolved in UV-PCO technology. Future work includes implementingexperimental validation and improving modeling methodologies tobetter reflect the actuality of photocatalytic reactions.
Nomenclature
English symbols
a geometric surface area per unit reactor volume (1/m)A area (m2)C concentration (mg/m3)Dm molecular diffusion coefficient (m2/s)

L. Zhong, F. Haghighat / Chemical Engineering Science 66 (2011) 5945–5954 5953
D characteristic length of fibrous media (m)F view factorI UV irradiance (mW/cm2)K Langmuir’s absorption parameter (m3/mg)k0 synthetic kinetic rate coefficient (s�1)kg inter-phase mass transfer coefficient (m/s)kads,i adsorption rate constant for species i on type I sites
(atm�1 s�1)kdes,i desorption rate constant for species i on type I sites (s�1)kI reaction rate constant for conversion of species i to an
intermediate on type I sitesLf TiO2 film thickness (nm)P distribution function of spectral powerPi partial pressure of species i in reactor (atm)r PCO reaction rate (mol/m3 s)s length of the connecting line (m)t time (min)u velocity (m/s)
Greek letters
b reaction order with respect to UV light appliedx stoichiometric coefficient of the compound in the
reactionr wall reflectivity (%)O anglel wavelength (nm)e porosity of the catalystt tortuosity of the catalystu air viscosity (m2/s)s effectiveness factor of the photocatalystm UV irradiance extinction coefficientyi coverage of species i on type I sitesyS1
coverage of vacancies on type I sites
Dimensionless parameters
Re Reynolds number, Re¼uD/euSc Schmidt number, Sc¼u/Dm
Sh Sherwood number, Sh¼kgD/Dm
Subscripts
0 plane occupied by UV lights1 duct wall at the right side of UV light2 duct wall at the left side of UV lightad adjacent wallsB bulkf filterH2O humidityi speciesin inletj intermediates converted from i
min minimum wavelength providedop opposing wallout outletS sorbed-phasew wallx, vector
Superscripts
max maximum wavelength provided
Special symbols
¯average value
Acknowledgements
The authors would like to express their gratitude to theNatural Sciences and Engineering Research Council of Canadafor the financial support through the strategic grant program andArvin Haghighat for his valuable inputs.
References
Alberici, R.M., Jardim, W.E., 1997. Photocatalytic destruction of VOCs in the gas-phase using titanium dioxide. Applied Catalysis B—Environmental 14, 55–68.
Alexiadis, A., 2006. 2-D radiation field in photocatalytic channels of square,rectangular, equilateral triangular and isosceles triangular sections. ChemicalEngineering Science 61, 516–525.
Ameen, M.M., Raupp, G.B., 1999. Reversible catalyst deactivation in the photo-catalytic oxidation of dilute o-xylene in air. Journal of Catalysis 184, 112–122.
Bouzaza, A., Vallet, C., Laplanche, A., 2006. Photocatalytic degradation of some VOCsin the gas phase using an annular flow reactor—determination of the contribu-tion of mass transfer and chemical reaction steps in the photo-degradationprocess. Journal of Photochemistry and Photobiology A—Chemistry 177,212–217.
Changrani, R.G., Raupp, G.B., 2000. Two-dimentional heterogeneous model for areticulated-foam photocatalytic reactor. AIChE Journal 46 (4), 829–842.
Chen, W., Zhang, J.S., Zhang, Z., 2005. Performance of air cleaners for removingmultiple volatile organic compounds in indoor air. ASHRAE Transactions,1101–1114.
D’Hennezel, O., Pichat, P., Ollis, D.F., 1998. Benzene and toluene gas-phasephotocatalytic degradation over H2O and HCL pretreated TiO2: by-productsand mechanisms. Journal of Photochemistry and Photobiology A—Chemistry118, 197–204.
Estivill, I.S., Brucato, A., Puma, G.L., 2007. Two-dimensional modeling of a flat-platephotocatalytic reactor for oxidation of indoor air pollutants. Industrial andEngineering Chemistry Research 46, 7489–7496.
Hill, C.G., 1977. An Introduction to Chemical Engineering Kinetics and ReactorDesignWiley, New York.
Hossain, M.M., Raupp, G.B., 1998. Radiation field modeling in a photocatalyticmonolith reactor. Chemical Engineering Science 53, 3771–3780.
Hossain, M.M., Raupp, G.B., 1999. Polychromatic radiation field model for ahoneycomb monolith photocatalytic reactor. Chemical Engineering Science54, 3027–3034.
Hossain, M.M., Raupp, G.B., Hay, S.O., Obee, T.N., 1999. Three-dimensionaldeveloping flow model for photocatalytic monolith reactor. AIChE Journal 45(6), 1309–1321.
Jung, S.C., Kim, S.J., Imaishi, N., Cho, Y.I., 2005. Effect of TiO2 thin film thickness andspecific surface area by low-pressure metal-organic chemical vapour depositionon photocatalytic activities. Applied Catalysis B: Environmental 55, 253–257.
Lewandowski, M., Ollis, D.F., 2003. Extension of a two-site transient kinetic modelof TiO2 deactivation during photocatalytic oxidation of aromatics: concentra-tion variations and catalyst regeneration studies. Applied Catalysis B: Envir-onmental 45, 223–238.
Miyayama, M., Takenaka, T., Takata, M., Shinozaki, K., 2004. Preparation ofnanoporous TiO2 film using aqueous sol with trehalose. In: Proceedings of23rd Electronics Division Meeting of the Ceramic-Society-of-Japan, October23–24, 2003, Kawasaki, Japan. Source: Electroceramics in Japan VII, BookSeries: Key Engineering Materials, vol. 269, pp. 87–90.
Nicolella, C., Rovatti, M., 1998. Mathematical modeling of monolith reactors forphotocatalytic oxidation of air contaminants. Chemical Engineering Journal 69,119–126.
Obee, T.N., 1996. Photooxidation of sub-parts-million toluene and formaldehydelevels on titania using a glass-plate reactor. Environmental Science andTechnology 30, 3578–3584.
Obee, T.N., Brown, R.T., 1995. TiO2 photocatalysis for indoor air applications:effects of humidity and trace contaminant levels on the oxidation rates offormaldehyde, toluene and 1,3-butadiene. Environmental Science and Tech-nology 29, 1223–1231.
Ould-Mame, S.M., Zahraa, O., Bouchy, M., 2000. Photocatalytic degradation ofsalicylic acid on fixed TiO2-kinetic studies. International Journal of Photo-energy 2, 59–66.
Puma, G.L., Estivill, I.S., Obee, T.N., Hay, S.O., 2009. Kinetics rate model of thephotocatalytic oxidation of trichloroethylene in air over TiO2 thin films.Separation and Purification Technology 67, 226–232.
Shiraishi, F., Ishimatsu, T., 2009. Toluene removal from indoor air using aminiaturized photocatalytic air purifier including a preceding adsorption/desorption unit. Chemical Engineering Science 64, 2466–2472.

L. Zhong, F. Haghighat / Chemical Engineering Science 66 (2011) 5945–59545954
Siegel, R., Howell, J.R., 1992. Thermal Radiation Heat Transferthird ed. McGraw-Hill, New York.
Sleiman, M., Conchon, P., Ferronato, C., Chovelon, J.M., 2009. Photocatalytic
oxidation of toluene at indoor air levels (ppbv): towards a better assessmentof conversion, reaction intermediates and mineralization. Applied Catalysis B:Environmental 86, 159–165.
Tomasic, v., Jovic, F., Gomzi, Z., 2008. Photocatalytic oxidation of toluene in the gasphase: modeling an annular photocatalytic reactor. Catalysis Today 137,350–356.
Vincent, G., Marquaire, P.M., Zahraa, O., 2009. Photocatalytic degradation ofgaseous 1-propanol using an annular reactor: kinetic modeling and pathways.
Journal of Hazardous Materials 161, 1173–1181.Votruba, J., Mikus, O., Nguen, K., Hlavacek, V., Skrivanek, J., 1975. Heat and mass
transfer in honeycomb catalysis II. Chemical Engineering Science 30, 201–206.
Wang, B., Mortazavi, R., Haghighat, F., 2009. Evaluation of modeling and measure-ment techniques of ultraviolet germicidal irradiation effectiveness—towardsdesign of immune buildings. Indoor and Built Environment 18, 101–112.
Wilke, C.R., Lee, C.Y., 1955. Estimation of diffusion coefficients for gases andvapors. Industrial Engineering Chemistry 47, 1253–1257.
Worth, D.J., Spence, A., Crumpton, P.I., 1996. Radiative exchange between squareparallel channels in a concentric monolith structure. International Journal ofHeat Mass Transfer 39 (7), 1463.
Yang, R., Zhang, Y.P., Zhao, R.Y., 2004. An improved model for analyzing theperformance of photocatalytic oxidation reactors in removing volatile organiccompounds and its application. Journal of the Air and Waste ManagementAssociation 54, 1516–1524.
Zhang, Y.P., Yang, R., Zhao, R.Y., 2003. A model for analyzing the performance ofphotocatalytic air cleaner in removing volatile organic compounds. Atmo-spheric Environment 37, 3395–3399.
Zhang, Y.P., Yang, R., Xu, Q.J., Mo, J.H., 2007. Characteristics of photocatalyticoxidation of toluene, benzene, and their mixture. Air and Waste ManagementAssociation 57, 94–101.
Zhong, L., Haghighat, F., Blondeau, P., Kozinski, J., 2010. Modeling and physicalinterpretation of photocatalytic oxidation efficiency in indoor air applications.Building and Environment 45, 2689–2697.