Modeling and stochastic simulation of the Ras/cAMP/PKA pathway in the yeast Saccharomyces cerevisiae...
9
Available online at www.sciencedirect.com Journal of Biotechnology 133 (2008) 377–385 Modeling and stochastic simulation of the Ras/cAMP/PKA pathway in the yeast Saccharomyces cerevisiae evidences a key regulatory function for intracellular guanine nucleotides pools Paolo Cazzaniga a , Dario Pescini a , Daniela Besozzi b , Giancarlo Mauri a , Sonia Colombo c , Enzo Martegani c,∗ a Universit` a degli Studi di Milano-Bicocca, Dipartimento di Informatica, Sistemistica e Comunicazione, Viale Sarca 336, 20126 Milano, Italy b Universit` a degli Studi di Milano, Dipartimento di Informatica e Comunicazione, Via Comelico 39, 20135 Milano, Italy c Universit` a degli Studi di Milano-Bicocca, Dipartimento di Biotecnologie e Bioscienze, Piazza della Scienza 2, 20126 Milano, Italy Received 9 July 2007; received in revised form 6 September 2007; accepted 29 September 2007 Abstract In the yeast Saccharomyces cerevisiae, the Ras/cAMP/PKA pathway is involved in the regulation of metabolism and cell cycle progression. The pathway is tightly regulated by several control mechanisms, as the feedback cycle ruled by the activity of phosphodiesterase. Here, we present a discrete mathematical model for the Ras/cAMP/PKA pathway that considers its principal cytoplasmic components and their mutual interactions. The tau-leaping algorithm is then used to perform stochastic simulations of the model. We investigate this system under various conditions, and we test how different values of several stochastic reaction constants affect the pathway behaviour. Finally, we show that the level of guanine nucleotides, GTP and GDP, could be relevant metabolic signals for the regulation of the whole pathway. © 2007 Elsevier B.V. All rights reserved. Keywords: cAMP; Protein kinase A; Tau-leaping; Phosphodiesterase 1. Introduction Cellular processes are characterized by peculiar features which make them both fascinating and challenging to be studied, either with experimental or computational approaches. To the aim of understanding the complex topology of a biological sys- tem and its dynamics, mathematical modeling has extensively proven to represent an indispensable tool (Meng et al., 2004; Turner et al., 2004). Mathematical modeling can be broadly classified into deterministic continuous approaches, based on the laws of mass action, and into stochastic discrete approaches, which take into consideration the discrete character of the bio- ∗ Corresponding author. Tel.: +39 0264483533; fax: +39 0264483565. E-mail addresses: [email protected] (P. Cazzaniga), [email protected] (D. Pescini), [email protected] (D. Besozzi), [email protected] (G. Mauri), [email protected] (S. Colombo), [email protected] (E. Martegani). chemical components and the intrinsic randomness of biological phenomena. Indeed, biological systems can involve a huge num- ber of processes, but the amount of many molecular species can be very low. Under these conditions, deterministic approaches are pushed to their limits and cannot always be relied on, while stochastic methods are able to account for the randomness that emerges and dominates the global behaviour of the system, thus inducing substantial cell–cell phenotypic variations and cellular heterogeneity (Elowitz et al., 2002; Longo and Hasty, 2006). One key algorithm able to replicate the noisy behaviour of biological systems is Gillespie’s stochastic simulation algorithm (SSA) (Gillespie, 1977), an exact numerical simulation method – equivalent to the Chemical Master Equation – that keeps track of every reaction event occurring in a single, fixed and well-stirred volume. SSA has been widely used as the reference procedure for performing discrete and stochastic simulations of biolog- ical systems (Arkin et al., 1998; Gibson and Bruck, 2000). Though characterized by exactness, this approach is lacking 0168-1656/$ – see front matter © 2007 Elsevier B.V. All rights reserved. doi:10.1016/j.jbiotec.2007.09.019
-
Upload
independent -
Category
Documents
-
view
0 -
download
0
Transcript of Modeling and stochastic simulation of the Ras/cAMP/PKA pathway in the yeast Saccharomyces cerevisiae...
A
pdTwn©
K
1
weatpTctw
pme
0d
Available online at www.sciencedirect.com
Journal of Biotechnology 133 (2008) 377–385
Modeling and stochastic simulation of the Ras/cAMP/PKA pathwayin the yeast Saccharomyces cerevisiae evidences a key regulatory
function for intracellular guanine nucleotides pools
Paolo Cazzaniga a, Dario Pescini a, Daniela Besozzi b, Giancarlo Mauri a,Sonia Colombo c, Enzo Martegani c,∗
a Universita degli Studi di Milano-Bicocca, Dipartimento di Informatica, Sistemistica e Comunicazione,Viale Sarca 336, 20126 Milano, Italy
b Universita degli Studi di Milano, Dipartimento di Informatica e Comunicazione,Via Comelico 39, 20135 Milano, Italy
c Universita degli Studi di Milano-Bicocca, Dipartimento di Biotecnologie e Bioscienze,Piazza della Scienza 2, 20126 Milano, Italy
Received 9 July 2007; received in revised form 6 September 2007; accepted 29 September 2007
bstract
In the yeast Saccharomyces cerevisiae, the Ras/cAMP/PKA pathway is involved in the regulation of metabolism and cell cycle progression. Theathway is tightly regulated by several control mechanisms, as the feedback cycle ruled by the activity of phosphodiesterase. Here, we present aiscrete mathematical model for the Ras/cAMP/PKA pathway that considers its principal cytoplasmic components and their mutual interactions.
he tau-leaping algorithm is then used to perform stochastic simulations of the model. We investigate this system under various conditions, ande test how different values of several stochastic reaction constants affect the pathway behaviour. Finally, we show that the level of guanineucleotides, GTP and GDP, could be relevant metabolic signals for the regulation of the whole pathway.2007 Elsevier B.V. All rights reserved.
cpbbaseih
eywords: cAMP; Protein kinase A; Tau-leaping; Phosphodiesterase
. Introduction
Cellular processes are characterized by peculiar featureshich make them both fascinating and challenging to be studied,
ither with experimental or computational approaches. To theim of understanding the complex topology of a biological sys-em and its dynamics, mathematical modeling has extensivelyroven to represent an indispensable tool (Meng et al., 2004;urner et al., 2004). Mathematical modeling can be broadly
lassified into deterministic continuous approaches, based onhe laws of mass action, and into stochastic discrete approaches,hich take into consideration the discrete character of the bio-∗ Corresponding author. Tel.: +39 0264483533; fax: +39 0264483565.E-mail addresses: [email protected] (P. Cazzaniga),
[email protected] (D. Pescini), [email protected] (D. Besozzi),[email protected] (G. Mauri), [email protected] (S. Colombo),
[email protected] (E. Martegani).
b(eevfiT
168-1656/$ – see front matter © 2007 Elsevier B.V. All rights reserved.oi:10.1016/j.jbiotec.2007.09.019
hemical components and the intrinsic randomness of biologicalhenomena. Indeed, biological systems can involve a huge num-er of processes, but the amount of many molecular species cane very low. Under these conditions, deterministic approachesre pushed to their limits and cannot always be relied on, whiletochastic methods are able to account for the randomness thatmerges and dominates the global behaviour of the system, thusnducing substantial cell–cell phenotypic variations and cellulareterogeneity (Elowitz et al., 2002; Longo and Hasty, 2006).
One key algorithm able to replicate the noisy behaviour ofiological systems is Gillespie’s stochastic simulation algorithmSSA) (Gillespie, 1977), an exact numerical simulation method –quivalent to the Chemical Master Equation – that keeps track ofvery reaction event occurring in a single, fixed and well-stirred
olume. SSA has been widely used as the reference procedureor performing discrete and stochastic simulations of biolog-cal systems (Arkin et al., 1998; Gibson and Bruck, 2000).hough characterized by exactness, this approach is lacking
3 Biotechnology 133 (2008) 377–385
isasrltttnyssmiiema2
msoate
ceTnbspciositobdin
2
cigaibp
pr
wtmoci
sowinsuI
mb(
wrM(sva2
fPy
78 P. Cazzaniga et al. / Journal of
n computational efficiency, and recently several approximatetrategies (Gibson and Bruck, 2000; Gillespie, 2001; Cao etl., 2006; Cazzaniga et al., 2006a,b) have been proposed topeed up the computations. Among these, the tau-leaping algo-ithm defined in Cao et al. (2006) is a strategy that allows toeap over many reaction events, thus reducing the computa-ional time, while preserving a good accuracy with respect tohe exact SSA. In this paper, we propose the application of theau-leaping procedure for investigating some regulatory mecha-isms in the Ras/cAMP/PKA signal transduction pathway ineast, giving further evidence that it represents an efficienttrategy to perform stochastic simulations of noisy biologicalystems. Recently, a large-scale study has been performed toeasure the relationship between noise and protein abundance
n Saccharomyces cerevisiae (Newman et al., 2006), suggest-ng that the “intrinsic noise” can dominate the noise in genexpression. Other similar works have corroborated the experi-ental evidence of noise at single-cell level in yeast, as well
s in other microorganisms (reviewed in Longo and Hasty,006).
In S. cerevisiae, the intracellular signaling molecule (secondessenger) cyclic adenosine monophosphate (cAMP) is synthe-
ized by the adenylate cyclase protein, and induces the activationf the cAMP-dependent protein kinase A (PKA). In turn, PKA isble to phosphorylate a variety of proteins involved in transcrip-ion, energy metabolism and cell cycle progression (Theveleint al., 2000; Muller et al., 2003).
The Ras/cAMP/PKA pathway plays an important role in theontrol of yeast cell metabolism, stress resistance and prolif-ration, in relation to the available nutrients (Thevelein, 1994;hevelein et al., 2000) and the comprehension of the mecha-isms that control this pathway is a relevant question either forasic science or for biotechnological application. The wholeignaling cascade is tightly regulated, and the complex inter-lay between cascade components naturally determines thehallenging aspects of the (computational and experimental)nvestigations on this pathway. Here, we present some resultsbtained from stochastic simulations of the Ras/cAMP/PKAignaling pathway in a single yeast cell, proving that our models able to simulate properly the Ras protein cycle, the activa-ion of adenylate cyclase, the synthesis of cAMP, the activationf cAMP-dependent protein kinase PKA and the main feed-ack. The results have been compared with the experimentalata (Rolland et al., 2000; Colombo et al., 2004), and providenformation on the key regulatory elements of this signalingetwork.
. The Ras/cAMP/PKA pathway in S. cerevisiae
In yeast, Ras and cyclic AMP (cAMP) signaling coordinatesell growth and proliferation with nutritional sensing (reviewedn Thevelein and de Winde, 1999). During the exponentialrowth phase, the cAMP/PKA pathway downregulates glycogen
nd trehalose content, stress tolerance, cell-wall resistance to lyt-case digestion, and expression of the genes that are controlledy STRE-boxes in their promoters. Moreover, the cAMP/PKAathway is involved in the control of cell-cycle progression atRTpi
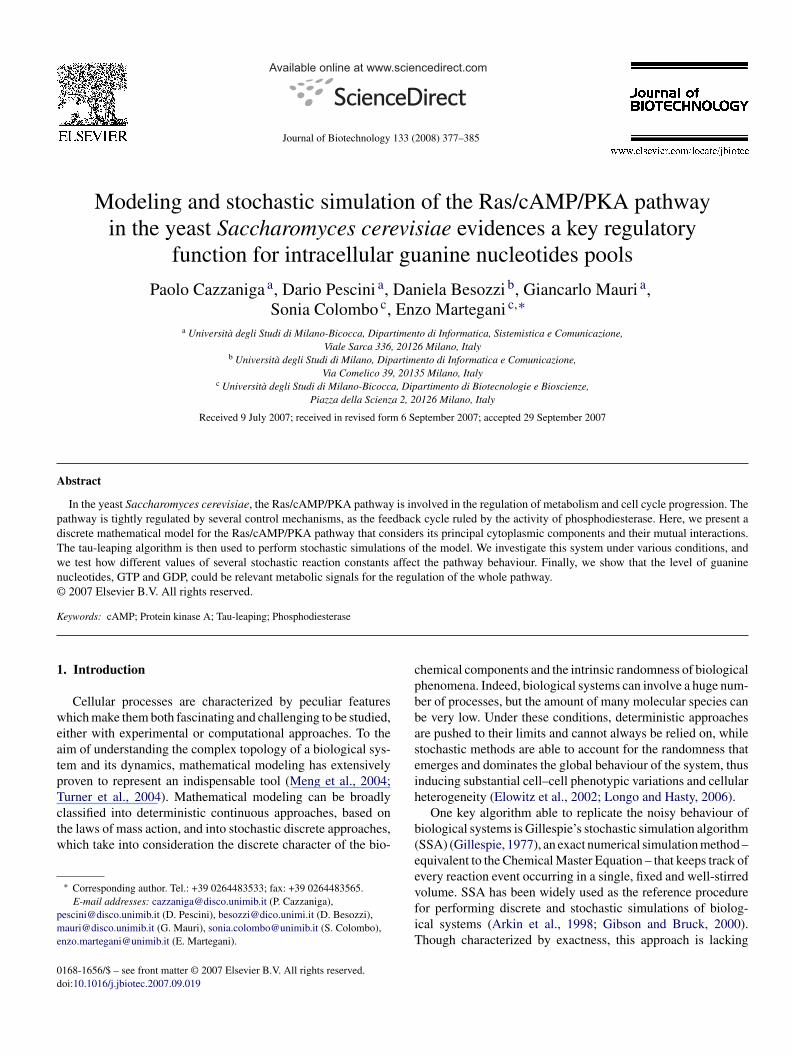
Fig. 1. The cAMP pathway in yeast.
hases G1 or G0, with a modulation of the critical cell size,equired both for budding and for mitosis (Baroni et al., 1989).
Different components of the Ras/cAMP/PKA signaling path-ay can be affected by stress, and contribute to the control of
he cellular response. The feeding of glucose (or a related fer-entable sugar) to starved S. cerevisiae cells, or the induction
f intracellular acidification, increase the activity of adenylateyclase protein, which then triggers a rapid and transient increasen cAMP levels (Thevelein, 1994).
In yeast this pathway is tightly regulated (Fig. 1). The synthe-is of cAMP by adenylate cyclase, CYR1, requires the activationf the small GTPases Ras1 and Ras2, two monomeric G proteinshich are inactive in the GDP-bound state and active when GTP
s bound. Ras proteins are positively controlled by the guanineucleotide exchange factor (GEFs), Cdc25 and Sdc25, whichtimulate the GDP–GTP exchange on Ras, and negatively reg-lated by the two GTPase activating proteins (GAPs), Ira1 andra2, which promote the intrinsically low Ras GTPase activity.
Additionally, adenylate cyclase activity is also positivelyodulated by the heterotrimeric GTPase subunit Gpa2 and
y the cognate receptor Gpr1, in response to glucose additionColombo et al., 1998; Rolland et al., 2000) (see Fig. 1).
The protein kinase A (PKA) is the regulatory target of cAMP,hich activates the two catalytic subunits of PKA encoded
edundantly by TPK1, TPK2 and TPK3 genes (Toda et al., 1987;uller et al., 2003) by binding to its two regulatory subunits
encoded by BCY1 gene). The active PKA operates in down-tream intracellular signaling, through the phosphorylation of aariety of proteins involved in transcription, energy metabolismnd cell cycle progression (Thevelein et al., 2000; Muller et al.,003) (Fig. 1).
The inactivation of cAMP (i.e., the conversion to theorm AMP) is governed by the phosphodiesterases Pde1 andde2, two enzymes which act as antagonists in signaling ineast and which constitute the major feedback control in the
as/cAMP/PKA pathway (Ma et al., 1999; Santangelo, 2006).his strong mechanism operates to rapidly downregulate theathway, and S. cerevisiae mutant cells in which this feedbacks inactivated can accumulate large amounts of cAMP (Nikawa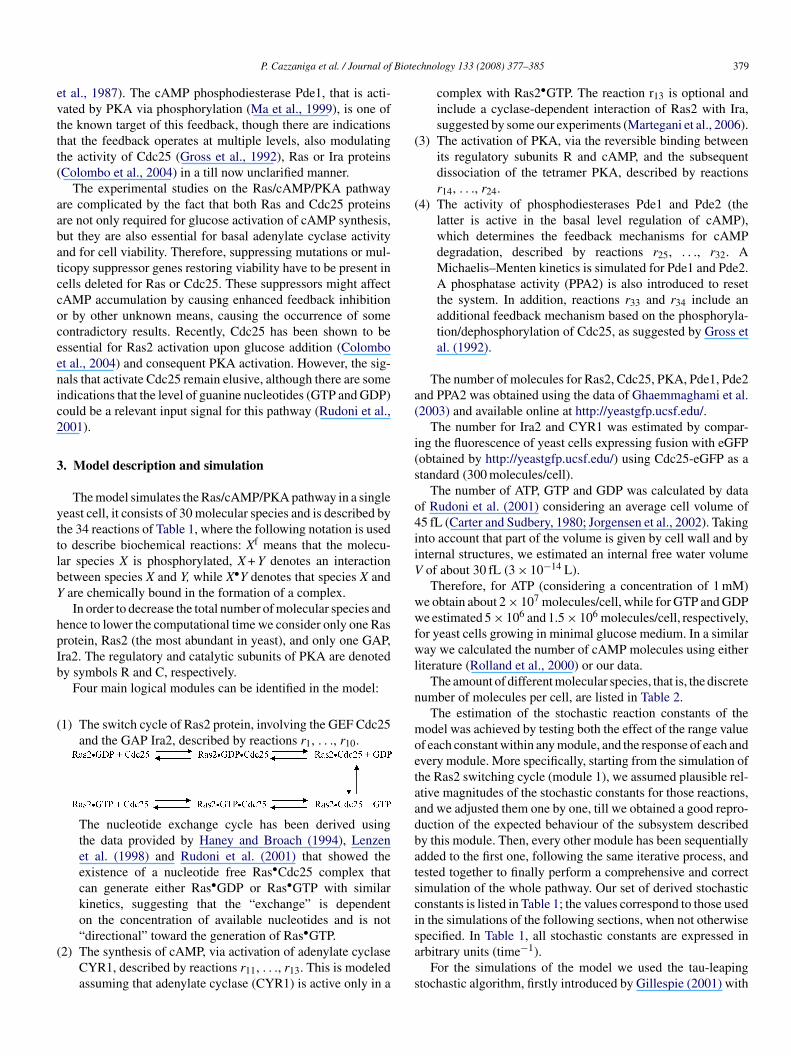
Biote
evttt(
aabatccoceenic2
3
yttlbY
hpIb
(
(
(
(
a(
i(s
o4iiV
wwfwl
n
moetaadbatsci
P. Cazzaniga et al. / Journal of
t al., 1987). The cAMP phosphodiesterase Pde1, that is acti-ated by PKA via phosphorylation (Ma et al., 1999), is one ofhe known target of this feedback, though there are indicationshat the feedback operates at multiple levels, also modulatinghe activity of Cdc25 (Gross et al., 1992), Ras or Ira proteinsColombo et al., 2004) in a till now unclarified manner.
The experimental studies on the Ras/cAMP/PKA pathwayre complicated by the fact that both Ras and Cdc25 proteinsre not only required for glucose activation of cAMP synthesis,ut they are also essential for basal adenylate cyclase activitynd for cell viability. Therefore, suppressing mutations or mul-icopy suppressor genes restoring viability have to be present inells deleted for Ras or Cdc25. These suppressors might affectAMP accumulation by causing enhanced feedback inhibitionr by other unknown means, causing the occurrence of someontradictory results. Recently, Cdc25 has been shown to bessential for Ras2 activation upon glucose addition (Colombot al., 2004) and consequent PKA activation. However, the sig-als that activate Cdc25 remain elusive, although there are somendications that the level of guanine nucleotides (GTP and GDP)ould be a relevant input signal for this pathway (Rudoni et al.,001).
. Model description and simulation
The model simulates the Ras/cAMP/PKA pathway in a singleeast cell, it consists of 30 molecular species and is described byhe 34 reactions of Table 1, where the following notation is usedo describe biochemical reactions: Xf means that the molecu-ar species X is phosphorylated, X + Y denotes an interactionetween species X and Y, while X•Y denotes that species X andare chemically bound in the formation of a complex.In order to decrease the total number of molecular species and
ence to lower the computational time we consider only one Rasrotein, Ras2 (the most abundant in yeast), and only one GAP,ra2. The regulatory and catalytic subunits of PKA are denotedy symbols R and C, respectively.
Four main logical modules can be identified in the model:
1) The switch cycle of Ras2 protein, involving the GEF Cdc25and the GAP Ira2, described by reactions r1, . . ., r10.
The nucleotide exchange cycle has been derived usingthe data provided by Haney and Broach (1994), Lenzenet al. (1998) and Rudoni et al. (2001) that showed theexistence of a nucleotide free Ras•Cdc25 complex thatcan generate either Ras•GDP or Ras•GTP with similarkinetics, suggesting that the “exchange” is dependenton the concentration of available nucleotides and is not
“directional” toward the generation of Ras•GTP.2) The synthesis of cAMP, via activation of adenylate cyclaseCYR1, described by reactions r11, . . ., r13. This is modeledassuming that adenylate cyclase (CYR1) is active only in a
sa
s
chnology 133 (2008) 377–385 379
complex with Ras2•GTP. The reaction r13 is optional andinclude a cyclase-dependent interaction of Ras2 with Ira,suggested by some our experiments (Martegani et al., 2006).
3) The activation of PKA, via the reversible binding betweenits regulatory subunits R and cAMP, and the subsequentdissociation of the tetramer PKA, described by reactionsr14, . . ., r24.
4) The activity of phosphodiesterases Pde1 and Pde2 (thelatter is active in the basal level regulation of cAMP),which determines the feedback mechanisms for cAMPdegradation, described by reactions r25, . . ., r32. AMichaelis–Menten kinetics is simulated for Pde1 and Pde2.A phosphatase activity (PPA2) is also introduced to resetthe system. In addition, reactions r33 and r34 include anadditional feedback mechanism based on the phosphoryla-tion/dephosphorylation of Cdc25, as suggested by Gross etal. (1992).
The number of molecules for Ras2, Cdc25, PKA, Pde1, Pde2nd PPA2 was obtained using the data of Ghaemmaghami et al.2003) and available online at http://yeastgfp.ucsf.edu/.
The number for Ira2 and CYR1 was estimated by compar-ng the fluorescence of yeast cells expressing fusion with eGFPobtained by http://yeastgfp.ucsf.edu/) using Cdc25-eGFP as atandard (300 molecules/cell).
The number of ATP, GTP and GDP was calculated by dataf Rudoni et al. (2001) considering an average cell volume of5 fL (Carter and Sudbery, 1980; Jorgensen et al., 2002). Takingnto account that part of the volume is given by cell wall and bynternal structures, we estimated an internal free water volume
of about 30 fL (3 × 10⁻¹⁴ L).Therefore, for ATP (considering a concentration of 1 mM)
e obtain about 2 × 10⁷ molecules/cell, while for GTP and GDPe estimated 5 × 10⁶ and 1.5 × 10⁶ molecules/cell, respectively,
or yeast cells growing in minimal glucose medium. In a similaray we calculated the number of cAMP molecules using either
iterature (Rolland et al., 2000) or our data.The amount of different molecular species, that is, the discrete
umber of molecules per cell, are listed in Table 2.The estimation of the stochastic reaction constants of the
odel was achieved by testing both the effect of the range valuef each constant within any module, and the response of each andvery module. More specifically, starting from the simulation ofhe Ras2 switching cycle (module 1), we assumed plausible rel-tive magnitudes of the stochastic constants for those reactions,nd we adjusted them one by one, till we obtained a good repro-uction of the expected behaviour of the subsystem describedy this module. Then, every other module has been sequentiallydded to the first one, following the same iterative process, andested together to finally perform a comprehensive and correctimulation of the whole pathway. Our set of derived stochasticonstants is listed in Table 1; the values correspond to those usedn the simulations of the following sections, when not otherwise
pecified. In Table 1, all stochastic constants are expressed inrbitrary units (time−1).For the simulations of the model we used the tau-leapingtochastic algorithm, firstly introduced by Gillespie (2001) with
380 P. Cazzaniga et al. / Journal of Biotechnology 133 (2008) 377–385
Table 1The model for the Ras/cAMP/PKA pathway consisting of 34 reactions, given in the form “reagents → products”, and the corresponding stochastic reaction constants
Reaction Reagents Products Constant (time−1)
r1 Ras2•GDP + Cdc25 Ras2•GDP•Cdc25 1.0r2 Ras2•GDP•Cdc25 Ras2•GDP + Cdc25 1.0r3 Ras2•GDP•Cdc25 Ras2•Cdc25 + GDP 1.5r4 Ras2•Cdc25 + GDP Ras2•GDP•Cdc25 1.0r5 Ras2•Cdc25 + GTP Ras2•GTP•Cdc25 1.0r6 Ras2•GTP•Cdc25 Ras2•Cdc25 + GTP 1.0r7 Ras2•GTP•Cdc25 Ras2•GTP + Cdc25 1.0r8 Ras2•GTP + Cdc25 Ras2•GTP•Cdc25 1.0r9 Ras2•GTP + Ira2 Ras2•GTP•Ira2 3.0 × 10⁻²
r10 Ras2•GTP•Ira2 Ras2•GDP + Ira2 7.0 × 10⁻¹
r11 Ras2•GTP + CYR1 Ras2•GTP•CYR1 1.0 × 10⁻³
r12 Ras2•GTP•CYR1 + ATP Ras2•GTP•CYR1 + cAMP 1.0 × 10⁻⁵
r13 Ras2•GTP•CYR1 + Ira2 Ras2•GDP + CYR1 + Ira2 1.0 × 10⁻³
r14 cAMP + PKA cAMP•PKA 1.0 × 10⁻⁵
r15 cAMP + cAMP•PKA (2cAMP)•PKA 1.0 × 10⁻⁵
r16 cAMP + (2cAMP)•PKA (3cAMP)•PKA 1.0 × 10⁻⁵
r17 cAMP + (3cAMP)•PKA (4cAMP)•PKA 1.0 × 10⁻⁵
r18 (4cAMP)•PKA cAMP + (3cAMP)•PKA 1.0 × 10⁻¹
r19 (3cAMP)•PKA cAMP + (2cAMP)•PKA 1.0 × 10⁻¹
r20 (2cAMP)•PKA cAMP + cAMP•PKA 1.0 × 10⁻¹
r21 cAMP•PKA cAMP + PKA 1.0 × 10⁻¹
r22 (4cAMP)•PKA 2C + 2(R•2cAMP) 1.0r23 R•2cAMP R + 2cAMP 1.0r24 2R + 2C PKA 1.0r25 C + Pde1 C + Pde1f 1.0 × 10⁻⁶
r26 cAMP + Pde1f cAMP•Pde1f 1.0 × 10⁻¹
r27 cAMP•Pde1f cAMP + Pde1f 1.0 × 10⁻¹
r28 cAMP•Pde1f AMP + Pde1f 7.5r29 Pdef + PPA2 Pde1 + PPA2 1.0 × 10⁻⁴
r30 cAMP + Pde2 cAMP•Pde2 1.0 × 10⁻⁴
r31 cAMP•Pde2 cAMP + Pde2 1.0r32 cAMP•Pde2 AMP + Pde2 1.7rr
tcva
TT
M
CCIPPPPRGGA
TGReo
33 C + Cdc25
34 Cdc25f + PPA2
he aim of reproducing the behaviour of chemical or biologi-al systems enclosed in a single fixed volume. Several differentersions of the tau-leaping procedure have been proposed (Tiannd Burrage, 2004; Chatterjee et al., 2005); the results presented
able 2he copy numbers of molecular species initially occurring in the system
olecular species Copy numbers Reference
YR1 200 This workdc25 300 Ghaemmaghami et al., 2003
ra2 200 This workde1 1400 Ghaemmaghami et al., 2003KA 2500 Ghaemmaghami et al., 2003PA2 4000 Ghaemmaghami et al., 2003de2 6500 Ghaemmaghami et al., 2003as2•GDP 20000 Ghaemmaghami et al., 2003DP 1.5 × 10⁶ Rudoni et al., 2001TP 5.0 × 10⁶ Rudoni et al., 2001TP 2.4 × 10⁷ Rudoni et al., 2001
he copy number for Cdc25, Pde1, PKA, PPA2, Pde2 and Ras2 were taken byhaemmaghami et al., 2003, we assumed that at the beginning of simulation allas2 is associated with GDP (Ras2•GDP); the number of CYR1 and Ira2 wasstimated by the fluorescence of GFP fusions; the number of molecule per cellf GDP, GTP and ATP were derived by data reported in Rudoni et al., 2001.
iv
bststmrArdc
tXNcn
ts
C + Cdc25f 10.0Cdc25 + PPA2 1.0 × 10⁻²
n this paper have been obtained using the modified Poissonersion, introduced by Cao et al. (2006).
The method adopted in tau-leaping to evaluate the proba-ilities related to the reactions of the system, is identical to thetochastic simulation algorithm (SSA) (Gillespie, 1976), thoughhe execution of the reactions is different: instead of tracing everyingle reaction event taking place in the system (as SSA does),he tau-leaping algorithm is able to determine the time incre-
ent, according to the system state, and then to select severaleactions to apply at each step, thus speeding up the simulations.s a consequence, however, the tau-leaping is not guaranteed to
eproduce the exact behaviour of the system (as SSA insteadoes), even if the accuracy of the simulation results can beontrolled, as explained later on.
To be more explicit, we report the main definitions neededo describe how the modified Poisson tau-leaping works. Let
be a well stirred system in thermal equilibrium consisting ofmolecular species S1, . . ., SN, which can interact through M
hemical reaction channels R1, . . ., RM. Let also Xi(t) be the
umber of molecules of the species Si at time t.The aim of the procedure is to fire several reactions for eachime interval [t, t + τ]. In order to find out which reactions of theystem will be executed, the probability that a reaction Rj will
Biote
ofctwbR
tiEecatr
n[viiicptHsa
X
ws(rR
1
2
3
4
(gsI
otaotTigs
4
cpet
marwtWa2(
tt
gwTrt
5f
P. Cazzaniga et al. / Journal of
ccur in the next infinitesimal time interval [t, t + dt], startingrom the system state x = X(t) ≡ (X1(t), . . ., XN(t)), has to be cal-ulated. This probability is given by aj(x)dt, where aj(x) is calledhe propensity function of Rj and is defined as aj(x) = hj(x)cj,here hj(x) is the number of distinct reactant molecules com-inations and cj is the stochastic rate constant associated toj.
Since the evaluation of the exact probability distribution ofhe reactions execution – within a generic step of length τ –s as difficult as resolving the corresponding Chemical Masterquation, the algorithm proceeds by approximating the exactvolution of the system. This is achieved by bounding thehanges in the reaction propensity functions, which turns out,s a consequence, in a limitation of the time increment τ. Oncehe value of τ has been chosen, it is then possible to guess theeactions to be executed by using a Poisson distribution.
Given a state x of the system X, let Kj(τ, x, t) be the exactumber of times that a reaction Rj will be fired in the time intervalt, t + τ], so that K(τ, x, t) is the exact probability distributionector (having Kj(τ, x, t) as elements). For arbitrary values of τ,t is difficult to compute the values of Kj(τ, x, t). On the contrary,f τ is small enough that the change in the state x during [t, t + τ]s so slight that no propensity function will suffer an appreciablehange in its value (this is called the leap condition), then it isossible to evaluate a good approximation of Kj(τ, x, t) by usinghe Poisson random variable with mean and variance aj(x)τ.ence, starting from the state x and choosing a value τ that
atisfies the leap condition, we can update the state of the systemt time t + τ according to:
(t + τ) = x +M∑
j=1
vjPj(aj(x), τ)
here Pj(aj(x), τ) denotes an independent sample of the Pois-on random variable with mean and variance aj(x)τ, and vj ≡v1j, . . . , vNj) is the state change vector whose element vij rep-esents the multiplicity change of the species Si due to reactionj.
Each iterative step of the algorithm consists of four stages:
. Generate the maximum changes of each species that satisfythe leap condition.
In order to obtain a good approximation of the systembehaviour it is necessary to estimate the maximum changesin the species and, therefore, in the propensity functions ofthe reactions.
. Compute the mean and variance of the changes of the propen-sity functions.
The mean and variance of the changes will then be usedto estimate the length of the leap. Hence, these two auxiliaryquantities for each species of the system have to be computed.
. Evaluate the leap value τ.Exploiting the maximum changes in the propensity func-
tions and the mean and variance computed over the set ofspecies, it is possible to estimate the length of the currentstep.
. Toss the reactions to apply.
aah
chnology 133 (2008) 377–385 381
Once τ has been evaluated, it is possible to select the reac-tions that will be executed (in a parallel manner) to updatethe system. The selection is accomplished by sampling, foreach reaction, a random number from a Poissonian distribu-tion with mean and variance equal to the product of τ timesthe propensity function of the reaction.
This algorithm has been implemented in our laboratoryCazzaniga et al., 2006a,b); the program is written in C lan-uage, compiled under Linux using the GCC compiler. All theimulations were performed using a Personal Computer with anntel Core2 CPU (2.66 GHz) running Linux.
The accuracy of this algorithm can be fixed a priori by meansf an error control parameter ε, such that 0 < ε � 1, which is usedo uniformly bound the changes of the molecular species and, asconsequence, to bound the changes of the propensity functionsf the reactions during each step of the evolution. This meanshat ε is closely related to the leap condition defined above.herefore, as ε decreases, the approximation of the algorithm is
mproved, though the time required to perform the simulationsets increased. In our simulations, we use the value ε = 0.03, asuggested by Cao et al. (2006).
. The Ras2•GTP generation module
The starting point of our stochastic simulations is the moduleorresponding to the switching (activation/inactivation) cycle ofrotein Ras2, that is, reactions r1, . . ., r10 in Table 1. The gen-ration of the complex Ras2•GTP turns out to be very sensitiveo the concentration of guanine nucleotides (GTP).
The system starts with only Ras2•GDP complex (20,000olecules), and with GTP and GDP amounts equal to 5 × 10⁶
nd 1.5 × 10⁶ molecules, respectively. This situation is compa-able with that found during yeast growth on minimal media,here the Ras2•GTP level increases to a value of 4% of the
otal Ras2 value (Rudoni et al., 2001; Colombo et al., 2004).hen the GTP level is decreased from 5 × 10⁶ to 1.5 × 10⁶,level that mimics a situation of starved cells (Rudoni et al.,
001), then the amount of Ras2•GTP drops to very low levelless than 0.5%) (Fig. 2).
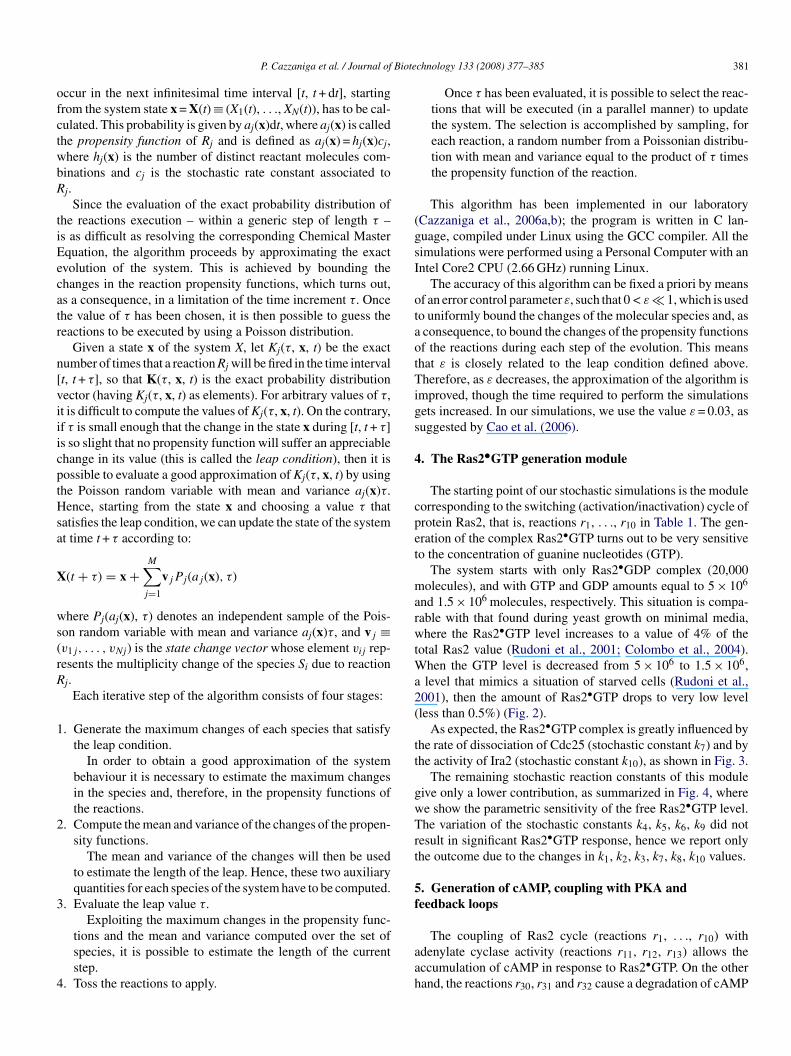
As expected, the Ras2•GTP complex is greatly influenced byhe rate of dissociation of Cdc25 (stochastic constant k7) and byhe activity of Ira2 (stochastic constant k10), as shown in Fig. 3.
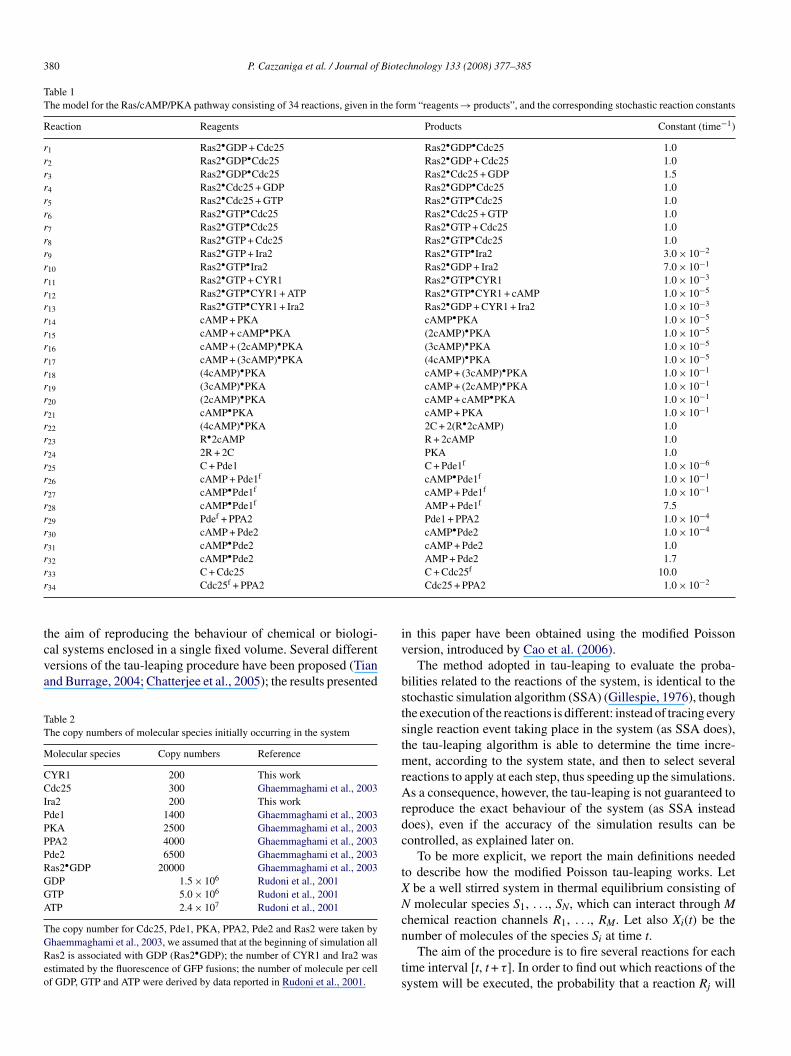
The remaining stochastic reaction constants of this moduleive only a lower contribution, as summarized in Fig. 4, wheree show the parametric sensitivity of the free Ras2•GTP level.he variation of the stochastic constants k4, k5, k6, k9 did not
esult in significant Ras2•GTP response, hence we report onlyhe outcome due to the changes in k1, k2, k3, k7, k8, k10 values.
. Generation of cAMP, coupling with PKA andeedback loops
The coupling of Ras2 cycle (reactions r1, . . ., r10) withdenylate cyclase activity (reactions r11, r12, r13) allows theccumulation of cAMP in response to Ras2•GTP. On the otherand, the reactions r30, r31 and r32 cause a degradation of cAMP
382 P. Cazzaniga et al. / Journal of Biotechnology 133 (2008) 377–385
F(
tMTlytftrl
.
paun
cl
ooac
Fig. 4. Sensitivity of Ras2•GTP module.
F(
T
F(
ig. 2. Variation of Ras2•GTP dependent on a step decrease of GTP amountfrom 5 × 10⁶ to 1.5 × 10⁶ molecules) taking place at time 1500.
o AMP by the cAMP-high-affinity phosphodiesterase, Pde2 (aichaelis–Menten kinetics is used to describe this interaction).
his allows the accumulation of cAMP (Fig. 5) to very highevels, comparable to those experimentally observed in mutanteast cells where the feedback mechanism is attenuated or inac-ivated (that is, in cells where phosphodiesterase Pde1 is notully working) (Nikawa et al., 1987). In this simulation, in ordero switch off the activity of Pde1, we set to zero the values ofule constants k25, . . ., k29. As expected, the steady-state cAMPevel depends upon the activity of Pde2 (Fig. 5).
If we add the basic feedback mechanism (reactions r25,. ., r29) based on the activity of the cAMP low affinity phos-hodiesterase Pde1 (Ma et al., 1999), we obtain a transientccumulation of cAMP (Fig. 6). Moreover, the catalytic sub-nits of PKA are clearly modulated by the level of cAMP (dataot shown).
In Fig. 7 we also show how the variation of affinity betweenAMP and PKA modifies the PKA activity, as well as the cAMPevel (reactions r14, . . ., r24).
We then simulate a transition in GTP amount by means of
ne step increase, which mimics the glucose induced increasef intracellular GTP (Rudoni et al., 2001). As shown in Fig. 8,response close to the one observed in vivo is achieved (for aomparison see Fig. 2A of the paper of Rolland et al., 2000).
si
a
ig. 3. Sensitivity of Ras2•GTP. (Left figure) Dependence on the rate of dissociatioRight figure) Dependence on the activity of Ira2: (a) k10 = 0.25; (b) k10 = 0.5; (c) k10
ig. 5. Effect of Pde2 activity on cAMP accumulation: (a) k32 = 1.6; (b) k32 = 1.7;c) k32 = 1.8; (d) k32 = 1.9 and (e) k32 = 2.0.
his can be considered as an additional proof that our model
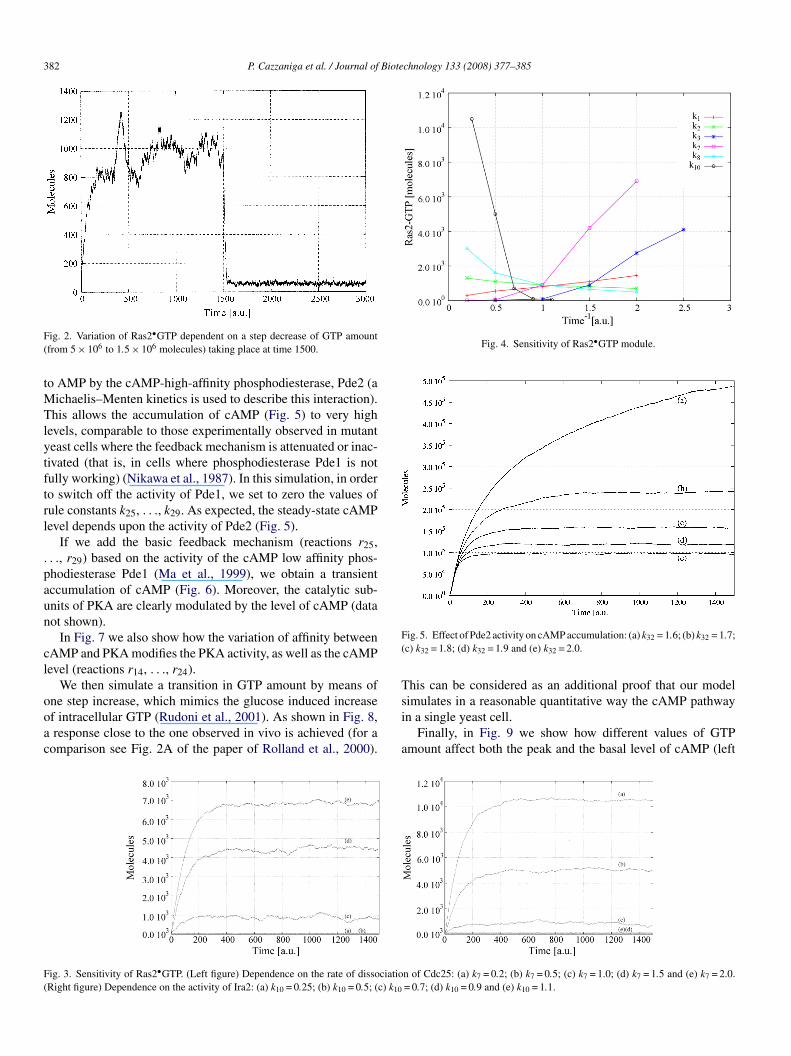
imulates in a reasonable quantitative way the cAMP pathwayn a single yeast cell.Finally, in Fig. 9 we show how different values of GTPmount affect both the peak and the basal level of cAMP (left
n of Cdc25: (a) k7 = 0.2; (b) k7 = 0.5; (c) k7 = 1.0; (d) k7 = 1.5 and (e) k7 = 2.0.= 0.7; (d) k10 = 0.9 and (e) k10 = 1.1.
P. Cazzaniga et al. / Journal of Biote
F(
fiHnGba2
6
tooims2tsmsivaop
lemtranscription or translation rates, etc. Except for few special
Fc
F
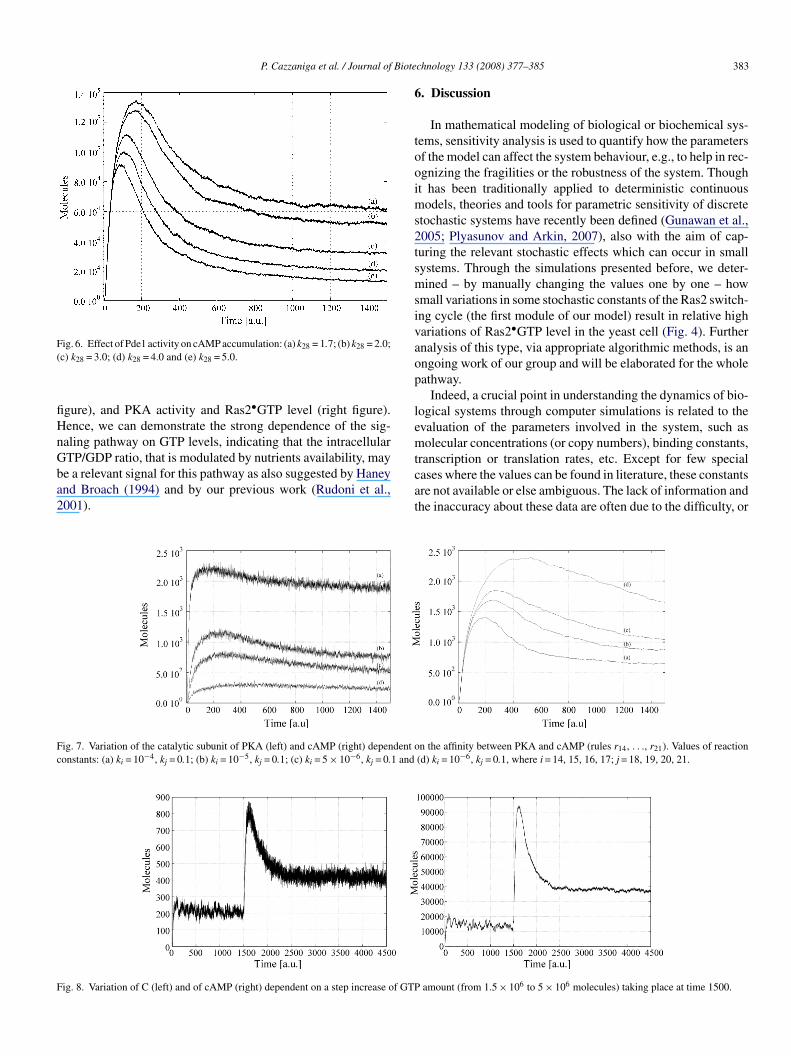
ig. 6. Effect of Pde1 activity on cAMP accumulation: (a) k28 = 1.7; (b) k28 = 2.0;c) k28 = 3.0; (d) k28 = 4.0 and (e) k28 = 5.0.
gure), and PKA activity and Ras2•GTP level (right figure).ence, we can demonstrate the strong dependence of the sig-aling pathway on GTP levels, indicating that the intracellularTP/GDP ratio, that is modulated by nutrients availability, may
e a relevant signal for this pathway as also suggested by Haneynd Broach (1994) and by our previous work (Rudoni et al.,001).cat
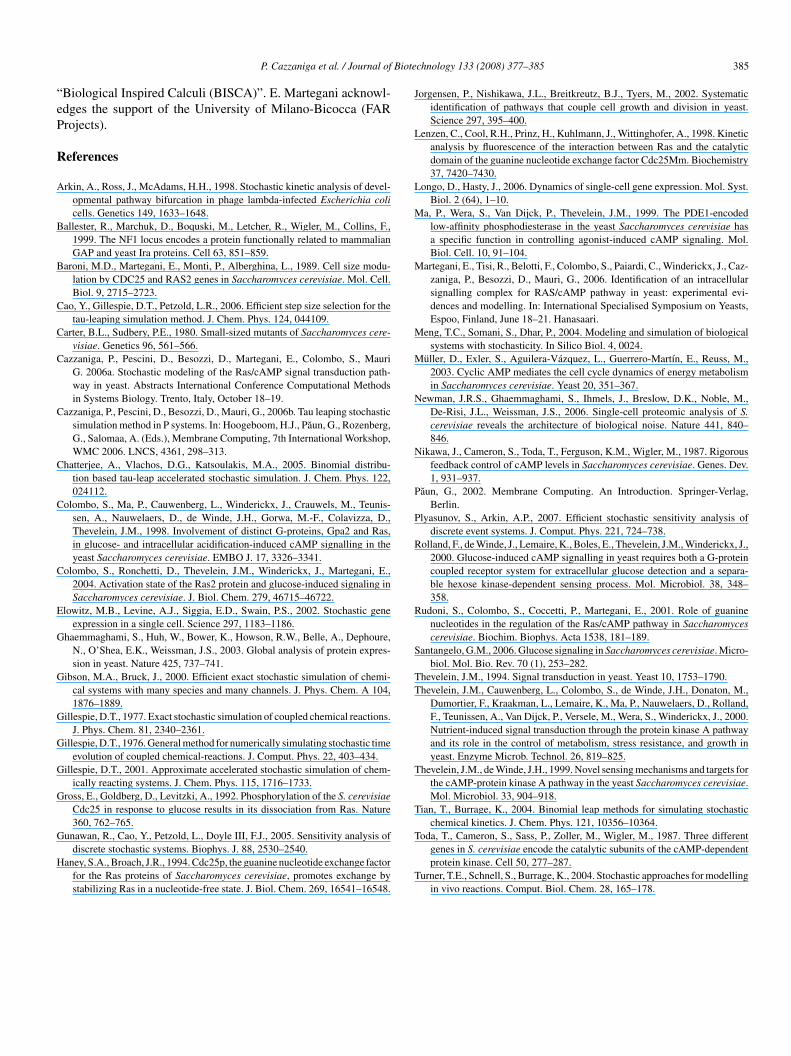
ig. 7. Variation of the catalytic subunit of PKA (left) and cAMP (right) dependent oonstants: (a) ki = 10−4, kj = 0.1; (b) ki = 10−5, kj = 0.1; (c) ki = 5 × 10⁻⁶, kj = 0.1 and
ig. 8. Variation of C (left) and of cAMP (right) dependent on a step increase of GTP
chnology 133 (2008) 377–385 383
. Discussion
In mathematical modeling of biological or biochemical sys-ems, sensitivity analysis is used to quantify how the parametersf the model can affect the system behaviour, e.g., to help in rec-gnizing the fragilities or the robustness of the system. Thought has been traditionally applied to deterministic continuous
odels, theories and tools for parametric sensitivity of discretetochastic systems have recently been defined (Gunawan et al.,005; Plyasunov and Arkin, 2007), also with the aim of cap-uring the relevant stochastic effects which can occur in smallystems. Through the simulations presented before, we deter-ined – by manually changing the values one by one – how
mall variations in some stochastic constants of the Ras2 switch-ng cycle (the first module of our model) result in relative highariations of Ras2•GTP level in the yeast cell (Fig. 4). Furthernalysis of this type, via appropriate algorithmic methods, is anngoing work of our group and will be elaborated for the wholeathway.
Indeed, a crucial point in understanding the dynamics of bio-ogical systems through computer simulations is related to thevaluation of the parameters involved in the system, such asolecular concentrations (or copy numbers), binding constants,
ases where the values can be found in literature, these constantsre not available or else ambiguous. The lack of information andhe inaccuracy about these data are often due to the difficulty, or
n the affinity between PKA and cAMP (rules r14, . . ., r21). Values of reaction(d) ki = 10−6, kj = 0.1, where i = 14, 15, 16, 17; j = 18, 19, 20, 21.
amount (from 1.5 × 10⁶ to 5 × 10⁶ molecules) taking place at time 1500.

384 P. Cazzaniga et al. / Journal of Biotechnology 133 (2008) 377–385
cumu
ti
ar
atfbatieoaqei
R(s
RopcaagglnsceamccR
Rtt
timntbi
mtwihoiapte
dmctpfwiaaiaf
Fig. 9. Effect of different GTP input values on cAMP ac
he impossibility, to perform correct measures during in vivo orn vitro experiments.
This fact then results in the challenging problem of assigningreasonable temporal dimension to the (stochastic) simulation
esults.For the simulations of the Ras/cAMP/PKA pathway, we were
ble to make a direct comparison between the simulations andhe experimental results. In yeast, cAMP was experimentallyound to be around 2 × 10⁵ molecules after stimulation, whileasal levels were around 2–5 × 10⁴ molecules/cell. In addition,fter stimulation, a cAMP peak was observed after 45–60 s,hen a decrease was observed and a new steady-state reachedn 3–5 min (for a direct comparison see the paper of Rollandt al., 2000, Fig. 2). These experimental data fit very well withur stochastic simulations, hence, we are in the condition tossign a reasonable temporal scale to our simulations. A similaruantitative comparison can be done for Ras2•GTP, which wasxperimentally found to be in the range of 2–4% of total Ras2n growing cells (equivalent to 400–800 molecules/cell).
In addition, after stimulation of starved cells with glucose,as2•GTP increased from 0.5 to 4% of total Ras2 in about 1 min
Rudoni et al., 2001), and again these data fit very well with ourimulations.
In this paper, we focused on the cytoplasmic regulators of theas/cAMP/PKA pathway, and provided stochastic simulationsf the synthesis of cAMP and of the cytoplasmic quantities of theivotal complexes. As a future development of our work, we willonstruct an accurate map of related cellular phenomena, suchs the response of this pathway to nutrients and to intracellularcidification, its connections with other pathways co-involved inlucose signaling, and the downhill nuclear expression of targetenes. Here, we have used as an input of the level intracellu-ar GTP, that was experimentally found to quickly respond toutrients availability (Rudoni et al., 2001), but we could alsoimulate the effect of a decrease of intracellular pH (that likelyauses an inhibition of GAP activity of the Ira proteins, Colombot al., 1998), or a fast increase of Cdc25 activity (Colombo etl., 2004). In order to gain a higher biological relevance of our
odel, we will include the Gpr1/Gpa2 pathway, which is a spe-ific signaling mechanism that responds only to high glucoseoncentration, and operates in an addictive redundant way withas2•GTP to activate adenylate cyclase (Colombo et al., 1998;
A
I
lation (left) and on Ras2•GTP and PKA activity (right).
olland et al., 2000). Finally, we will also test the effect of addi-ional feedback mechanisms, such as the inactivation of Cdc25,he activation of Ira, etc.
We also expect that our computational studies will supporthe experimental work aimed at characterizing the actual local-zations (that is, either bound to plasma membrane or to internal
embranes, or diffused within the cell) of the central compo-ents of this pathway, since there exists evidence that most ofhe Cdc25, CYR1, Ira2, Ras2 proteins localize in internal mem-ranes, suggesting the presence of large signaling complexesnside the yeast cells (Martegani et al., 2006).
Investigations about the topological distribution of theolecular species in distinct cellular regions, the introduc-
ion of additional components and of other external inputs,ill be performed by means of tau-DPP systems, presented
n Cazzaniga et al. (2006a,b) (available for download atttp://psystems.disco.unimib.it/). Tau-DPP allows the modelingf biological systems consisting of several volumes, by exploit-ng the topological structure of membrane systems (Paun, 2002)s well as the execution of stochastic simulations, by using (inde-endent) tau-leaping engines working inside each volume. Withau-DPP it is, therefore, possible to trace the behaviour insideach single volume, as well as the behaviour of the whole system.
Finally, we believe that establishing the pivotal roles of theifferent components in the Ras/cAMP/PKA pathway in yeastight have a positive outcome for the elucidation of similar
omponents in higher eukaryotes. For instance, it is well knownhat the protein neurofibromin 1 (NF1), acting as tumor sup-ressor in human cells, is homologous to the proteins of the Iraamily, and it has been shown to contain a GAP related domainhich regulates Ras (Ballester et al., 1999). Though its evident
mportance, biochemical and cellular characterizations of NF1re still on the way, and very few knowledge is currently avail-ble about NF1-interacting proteins. Therefore, the synergisticntegration of pathway modeling and of deletion experimentsbout Ira proteins in yeast could probably provide useful hintsor further interdisciplinary investigations of NF1.
cknowledgments
P. Cazzaniga and D. Pescini acknowledge the support oftalian Ministry of University (MIUR), under project PRIN-06
Biote
“eP
R
A
B
B
C
C
C
C
C
C
C
E
G
G
G
G
G
G
G
H
J
L
L
M
M
M
M
N
N
P
P
R
R
S
TT
T
T
P. Cazzaniga et al. / Journal of
Biological Inspired Calculi (BISCA)”. E. Martegani acknowl-dges the support of the University of Milano-Bicocca (FARrojects).
eferences
rkin, A., Ross, J., McAdams, H.H., 1998. Stochastic kinetic analysis of devel-opmental pathway bifurcation in phage lambda-infected Escherichia colicells. Genetics 149, 1633–1648.
allester, R., Marchuk, D., Boquski, M., Letcher, R., Wigler, M., Collins, F.,1999. The NF1 locus encodes a protein functionally related to mammalianGAP and yeast Ira proteins. Cell 63, 851–859.
aroni, M.D., Martegani, E., Monti, P., Alberghina, L., 1989. Cell size modu-lation by CDC25 and RAS2 genes in Saccharomyces cerevisiae. Mol. Cell.Biol. 9, 2715–2723.
ao, Y., Gillespie, D.T., Petzold, L.R., 2006. Efficient step size selection for thetau-leaping simulation method. J. Chem. Phys. 124, 044109.
arter, B.L., Sudbery, P.E., 1980. Small-sized mutants of Saccharomyces cere-visiae. Genetics 96, 561–566.
azzaniga, P., Pescini, D., Besozzi, D., Martegani, E., Colombo, S., MauriG. 2006a. Stochastic modeling of the Ras/cAMP signal transduction path-way in yeast. Abstracts International Conference Computational Methodsin Systems Biology. Trento, Italy, October 18–19.
azzaniga, P., Pescini, D., Besozzi, D., Mauri, G., 2006b. Tau leaping stochasticsimulation method in P systems. In: Hoogeboom, H.J., Paun, G., Rozenberg,G., Salomaa, A. (Eds.), Membrane Computing, 7th International Workshop,WMC 2006. LNCS, 4361, 298–313.
hatterjee, A., Vlachos, D.G., Katsoulakis, M.A., 2005. Binomial distribu-tion based tau-leap accelerated stochastic simulation. J. Chem. Phys. 122,024112.
olombo, S., Ma, P., Cauwenberg, L., Winderickx, J., Crauwels, M., Teunis-sen, A., Nauwelaers, D., de Winde, J.H., Gorwa, M.-F., Colavizza, D.,Thevelein, J.M., 1998. Involvement of distinct G-proteins, Gpa2 and Ras,in glucose- and intracellular acidification-induced cAMP signalling in theyeast Saccharomyces cerevisiae. EMBO J. 17, 3326–3341.
olombo, S., Ronchetti, D., Thevelein, J.M., Winderickx, J., Martegani, E.,2004. Activation state of the Ras2 protein and glucose-induced signaling inSaccharomyces cerevisiae. J. Biol. Chem. 279, 46715–46722.
lowitz, M.B., Levine, A.J., Siggia, E.D., Swain, P.S., 2002. Stochastic geneexpression in a single cell. Science 297, 1183–1186.
haemmaghami, S., Huh, W., Bower, K., Howson, R.W., Belle, A., Dephoure,N., O’Shea, E.K., Weissman, J.S., 2003. Global analysis of protein expres-sion in yeast. Nature 425, 737–741.
ibson, M.A., Bruck, J., 2000. Efficient exact stochastic simulation of chemi-cal systems with many species and many channels. J. Phys. Chem. A 104,1876–1889.
illespie, D.T., 1977. Exact stochastic simulation of coupled chemical reactions.J. Phys. Chem. 81, 2340–2361.
illespie, D.T., 1976. General method for numerically simulating stochastic timeevolution of coupled chemical-reactions. J. Comput. Phys. 22, 403–434.
illespie, D.T., 2001. Approximate accelerated stochastic simulation of chem-ically reacting systems. J. Chem. Phys. 115, 1716–1733.
ross, E., Goldberg, D., Levitzki, A., 1992. Phosphorylation of the S. cerevisiaeCdc25 in response to glucose results in its dissociation from Ras. Nature360, 762–765.
unawan, R., Cao, Y., Petzold, L., Doyle III, F.J., 2005. Sensitivity analysis ofdiscrete stochastic systems. Biophys. J. 88, 2530–2540.
aney, S.A., Broach, J.R., 1994. Cdc25p, the guanine nucleotide exchange factorfor the Ras proteins of Saccharomyces cerevisiae, promotes exchange bystabilizing Ras in a nucleotide-free state. J. Biol. Chem. 269, 16541–16548.
T
T
chnology 133 (2008) 377–385 385
orgensen, P., Nishikawa, J.L., Breitkreutz, B.J., Tyers, M., 2002. Systematicidentification of pathways that couple cell growth and division in yeast.Science 297, 395–400.
enzen, C., Cool, R.H., Prinz, H., Kuhlmann, J., Wittinghofer, A., 1998. Kineticanalysis by fluorescence of the interaction between Ras and the catalyticdomain of the guanine nucleotide exchange factor Cdc25Mm. Biochemistry37, 7420–7430.
ongo, D., Hasty, J., 2006. Dynamics of single-cell gene expression. Mol. Syst.Biol. 2 (64), 1–10.
a, P., Wera, S., Van Dijck, P., Thevelein, J.M., 1999. The PDE1-encodedlow-affinity phosphodiesterase in the yeast Saccharomyces cerevisiae hasa specific function in controlling agonist-induced cAMP signaling. Mol.Biol. Cell. 10, 91–104.
artegani, E., Tisi, R., Belotti, F., Colombo, S., Paiardi, C., Winderickx, J., Caz-zaniga, P., Besozzi, D., Mauri, G., 2006. Identification of an intracellularsignalling complex for RAS/cAMP pathway in yeast: experimental evi-dences and modelling. In: International Specialised Symposium on Yeasts,Espoo, Finland, June 18–21. Hanasaari.
eng, T.C., Somani, S., Dhar, P., 2004. Modeling and simulation of biologicalsystems with stochasticity. In Silico Biol. 4, 0024.
uller, D., Exler, S., Aguilera-Vazquez, L., Guerrero-Martın, E., Reuss, M.,2003. Cyclic AMP mediates the cell cycle dynamics of energy metabolismin Saccharomyces cerevisiae. Yeast 20, 351–367.
ewman, J.R.S., Ghaemmaghami, S., Ihmels, J., Breslow, D.K., Noble, M.,De-Risi, J.L., Weissman, J.S., 2006. Single-cell proteomic analysis of S.cerevisiae reveals the architecture of biological noise. Nature 441, 840–846.
ikawa, J., Cameron, S., Toda, T., Ferguson, K.M., Wigler, M., 1987. Rigorousfeedback control of cAMP levels in Saccharomyces cerevisiae. Genes. Dev.1, 931–937.
aun, G., 2002. Membrane Computing. An Introduction. Springer-Verlag,Berlin.
lyasunov, S., Arkin, A.P., 2007. Efficient stochastic sensitivity analysis ofdiscrete event systems. J. Comput. Phys. 221, 724–738.
olland, F., de Winde, J., Lemaire, K., Boles, E., Thevelein, J.M., Winderickx, J.,2000. Glucose-induced cAMP signalling in yeast requires both a G-proteincoupled receptor system for extracellular glucose detection and a separa-ble hexose kinase-dependent sensing process. Mol. Microbiol. 38, 348–358.
udoni, S., Colombo, S., Coccetti, P., Martegani, E., 2001. Role of guaninenucleotides in the regulation of the Ras/cAMP pathway in Saccharomycescerevisiae. Biochim. Biophys. Acta 1538, 181–189.
antangelo, G.M., 2006. Glucose signaling in Saccharomyces cerevisiae. Micro-biol. Mol. Bio. Rev. 70 (1), 253–282.
hevelein, J.M., 1994. Signal transduction in yeast. Yeast 10, 1753–1790.hevelein, J.M., Cauwenberg, L., Colombo, S., de Winde, J.H., Donaton, M.,
Dumortier, F., Kraakman, L., Lemaire, K., Ma, P., Nauwelaers, D., Rolland,F., Teunissen, A., Van Dijck, P., Versele, M., Wera, S., Winderickx, J., 2000.Nutrient-induced signal transduction through the protein kinase A pathwayand its role in the control of metabolism, stress resistance, and growth inyeast. Enzyme Microb. Technol. 26, 819–825.
hevelein, J.M., de Winde, J.H., 1999. Novel sensing mechanisms and targets forthe cAMP-protein kinase A pathway in the yeast Saccharomyces cerevisiae.Mol. Microbiol. 33, 904–918.
ian, T., Burrage, K., 2004. Binomial leap methods for simulating stochasticchemical kinetics. J. Chem. Phys. 121, 10356–10364.
oda, T., Cameron, S., Sass, P., Zoller, M., Wigler, M., 1987. Three differentgenes in S. cerevisiae encode the catalytic subunits of the cAMP-dependentprotein kinase. Cell 50, 277–287.
urner, T.E., Schnell, S., Burrage, K., 2004. Stochastic approaches for modellingin vivo reactions. Comput. Biol. Chem. 28, 165–178.


![Solution Structure of the Na+ form of the Dimeric Guanine Quadruplex [d(G3T4G3)]2](https://static.fdokumen.com/doc/165x107/6318f44265e4a6af370f95cf/solution-structure-of-the-na-form-of-the-dimeric-guanine-quadruplex-dg3t4g32.jpg)