Digital image processing techniques for detecting, quantifying and classifying plant diseases
Upload
khangminh22Category
view
0download
0
1
Modeling and risk assessment of plant diseases:
concepts and examples
Emerson(Del(Ponte(Departamento(de(Fitopatologia(UFV((www.dfp.ufv.br/epidemiology((((
Disease and epidemics in plants Concepts on risk assessment and models Approaches to develop and test models Examples: soybean and wheat diseases
Outline
2
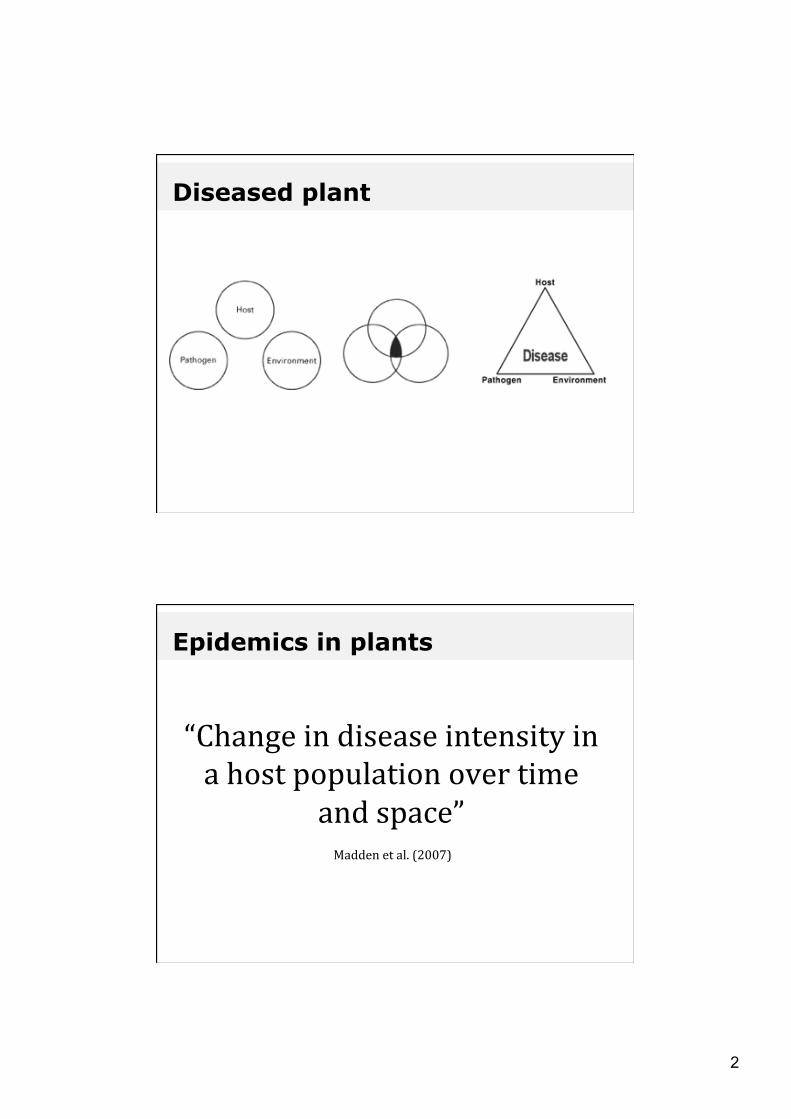
Diseased plant
Epidemics in plants
“Change(in(disease(intensity(in(a(host(population(over(time(
and(space”((Madden(et(al.((2007)(
3
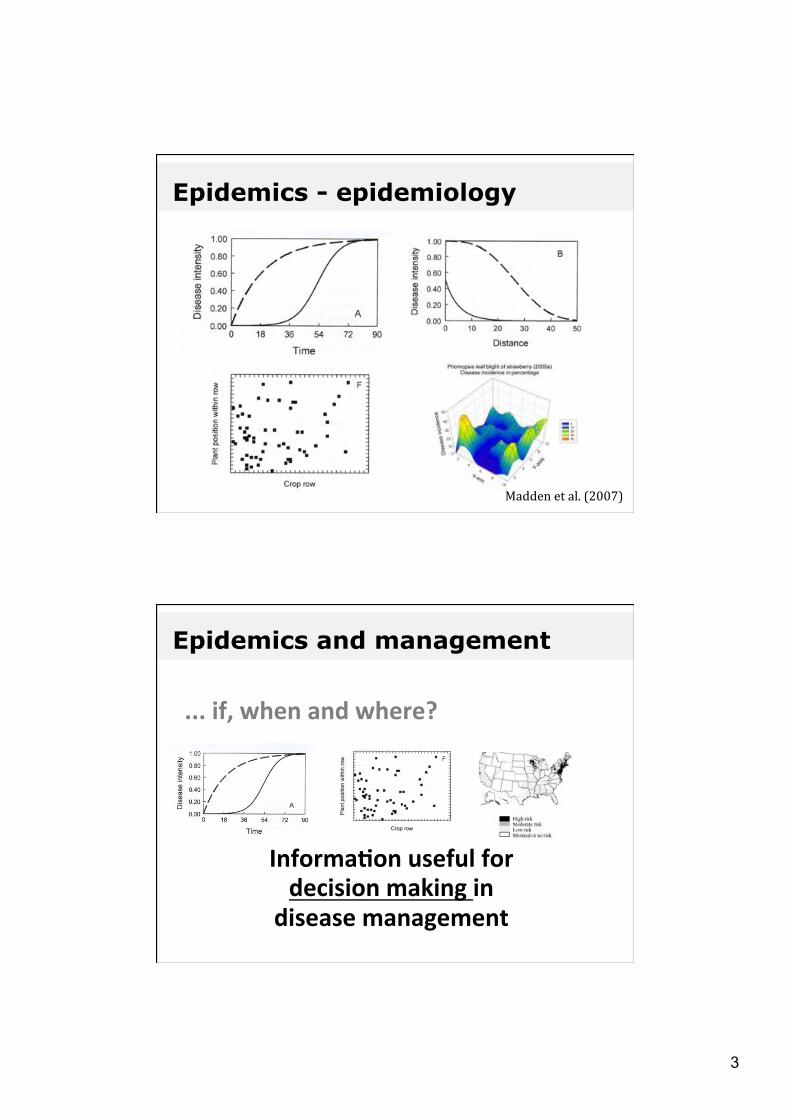
Epidemics - epidemiology
Madden(et(al.((2007)(
Epidemics and management
..."if,"when"and"where?!
Informa1on"useful"for""decision"making"in""
disease"management"
4
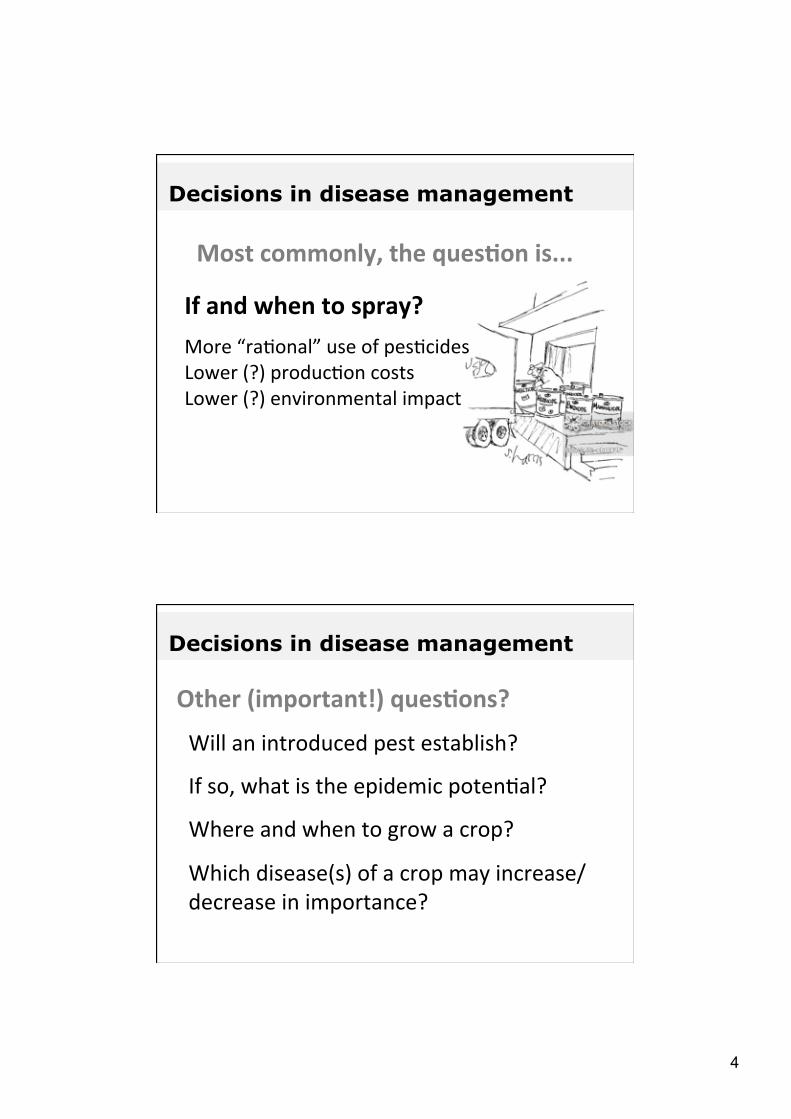
Decisions in disease management
If"and"when"to"spray?"
More!“ra(onal”!use!of!pes(cides!Lower!(?)!produc(on!costs!Lower!(?)!environmental!impact!
Most"commonly,"the"ques1on"is..."
Decisions in disease management
Will!an!introduced!pest!establish?!
If!so,!what!is!the!epidemic!poten(al?!
Where!and!when!to!grow!a!crop?!
Which!disease(s)!of!a!crop!may!increase/decrease!in!importance?!
Other"(important!)"ques1ons?"
5
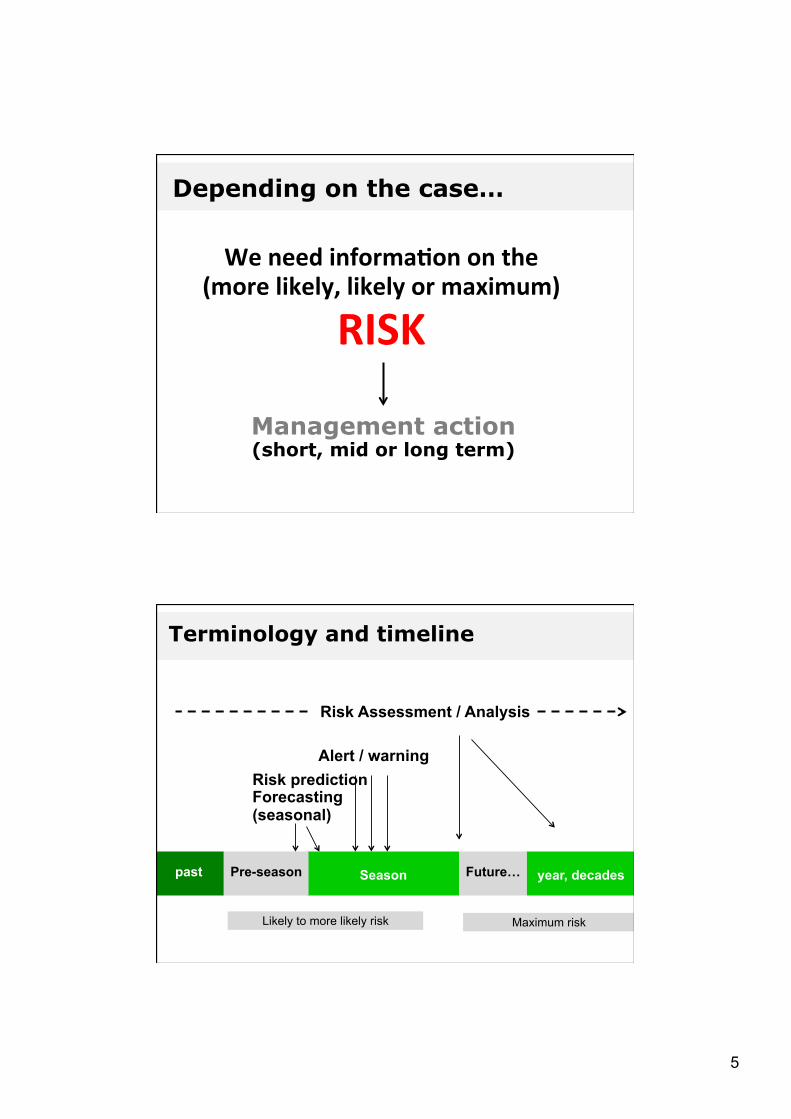
Depending on the case…
9!
We"need"informa1on"on"the"(more"likely,"likely"or"maximum)"
RISK"
Management action (short, mid or long term)
Terminology and timeline
Season
Pre-season
Risk prediction Forecasting (seasonal)
past
Alert / warning
Future…
year, decades
Risk Assessment / Analysis
Likely to more likely risk Maximum risk
6
Risk assessment
Models
Have several definitions... Here, operationally, those providing
estimates of RISK
Disease models? Disease!is!complex!(patho)system!Model!of!the!system:!complex!or!simple!Mimic!and!predict!behaviour!of!the!system!
Modeling plant epidemics
7
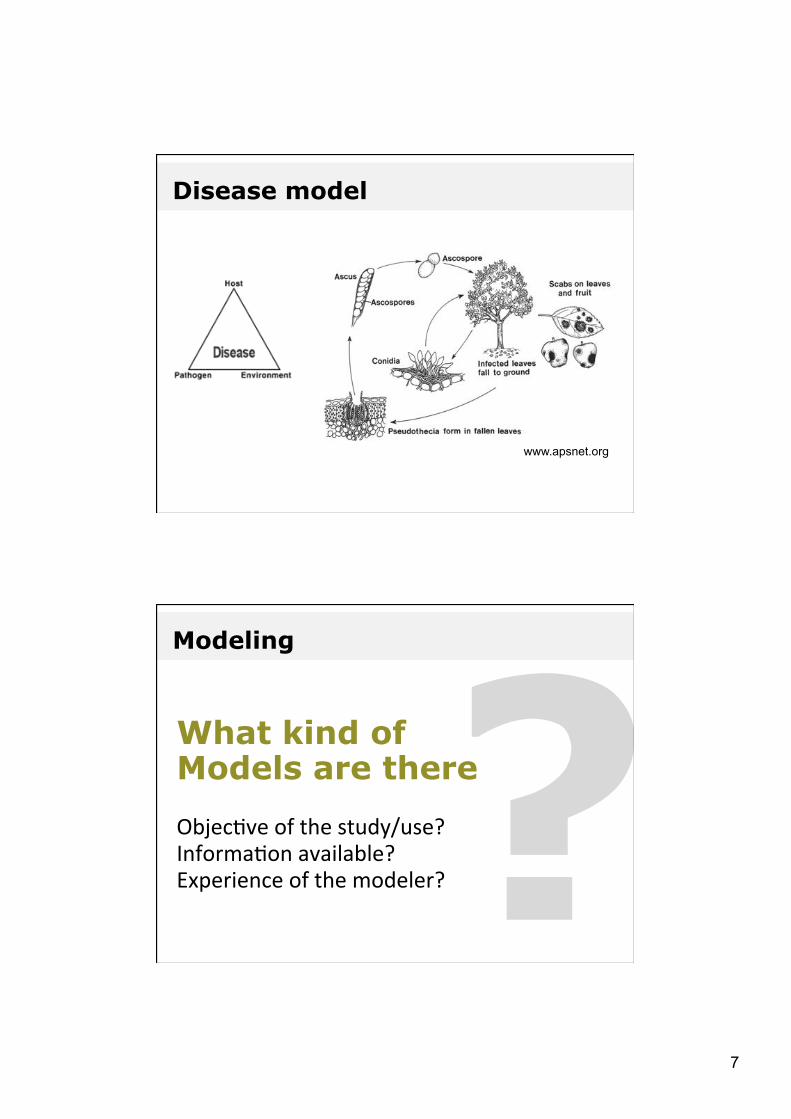
Disease model
www.apsnet.org
Modeling
What kind of Models are there !Objec(ve!of!the!study/use?!Informa(on!available?!Experience!of!the!modeler?!?
8
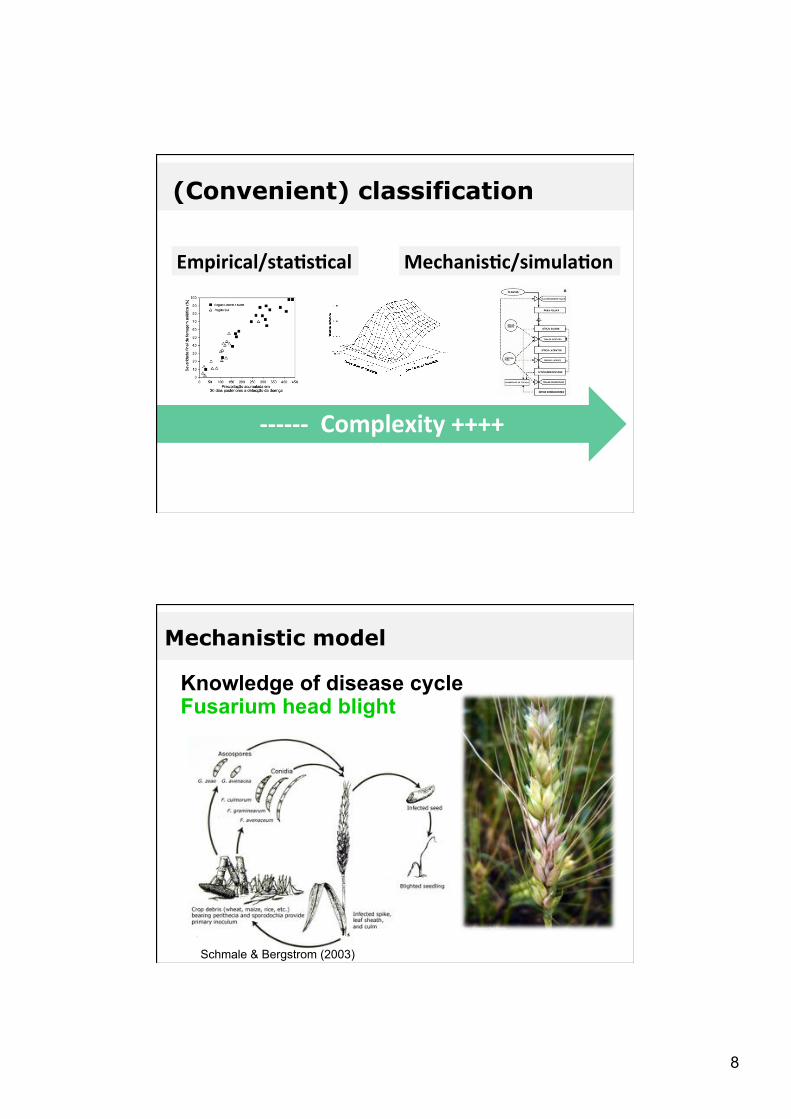
(Convenient) classification
FFFFFF""Complexity"++++"
Mechanis1c/simula1on"Empirical/sta1s1cal"
Mechanistic model
Knowledge of disease cycle Fusarium head blight
Schmale & Bergstrom (2003)

9
Model representation
Flowchart (model)
Del Ponte, E. M., Fernandes, J. M. C., & Pavan, W. (2005). A risk infection simulation model for Fusarium head blight of wheat. Fitopatologia Brasileira, 30(6), 634-642.
Model building
Linking submodels (empirically-derived)
(Del"Ponte"et"al.,"2005)

10
Submodels of the simulation model
dias apÛs o espigamento0 2 4 6 8 10 12
n∫ r
elat
ivo
de e
spig
as e
mer
gida
s / 1
m.d
ia
0.0
0.2
0.4
0.6
0.8
1.0
R 2 = 0,89n=237
Y= 1 - exp (-0,0127 X 2,4352)
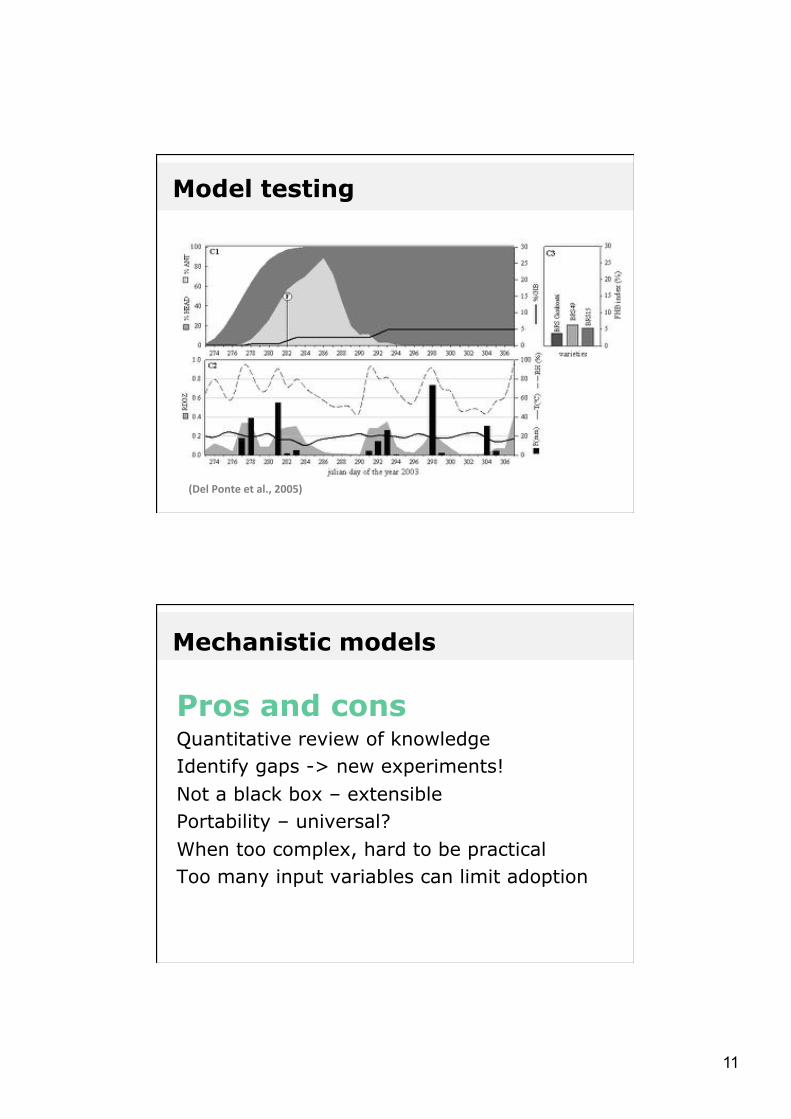
Model testing
(Del"Ponte"et"al.,"2005)
11
Model testing
(Del"Ponte"et"al.,"2005)
Mechanistic models
Pros and cons Quantitative review of knowledge Identify gaps -> new experiments! Not a black box – extensible Portability – universal? When too complex, hard to be practical Too many input variables can limit adoption
12
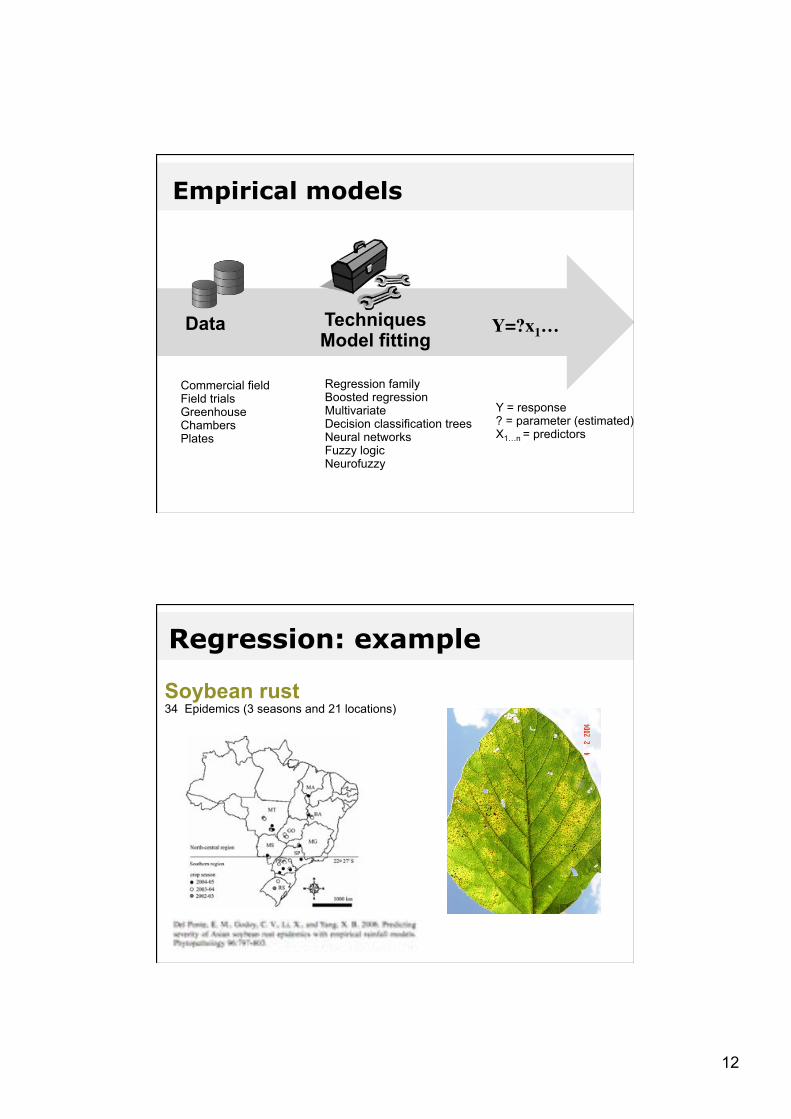
Empirical models
Regression family Boosted regression Multivariate Decision classification trees Neural networks Fuzzy logic Neurofuzzy
Techniques Model fitting
Y=?x1…
Y = response ? = parameter (estimated) X1…n = predictors
Data
Commercial field Field trials Greenhouse Chambers Plates
Regression: example
Soybean rust 34 Epidemics (3 seasons and 21 locations)
13
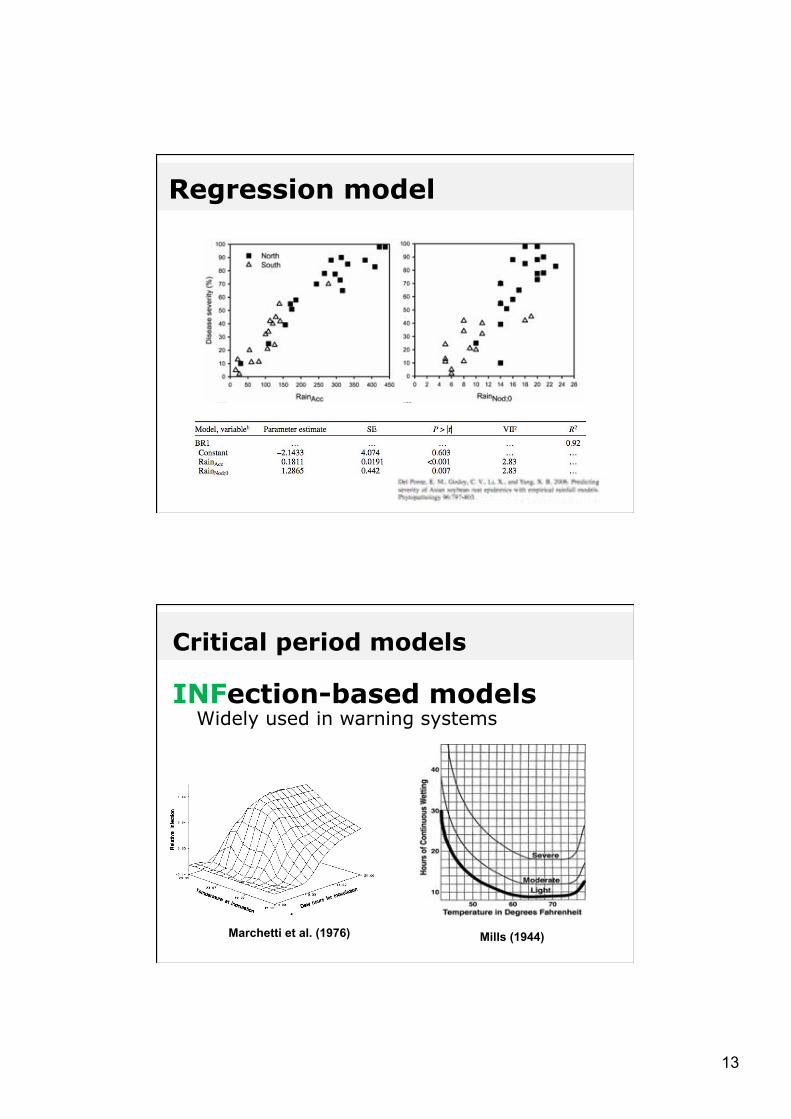
Regression model
INFection-based models Widely used in warning systems
Marchetti et al. (1976)
Critical period models
Mills (1944)

14
Empirical models
Pros and cons Simpler models – less predictor variables Data mining -> new knowledge Model is as good as the data Explain well the data – overfitting! Portability issues
Word of caution ...

15
Examples: our work
Fusarium head blight Soybean rust Risk assessment - historical data Risk prediction - Real time weather - Forecast weather - Risk maps
Fusarium head blight of wheat Is the resurge of the disease related to climate variability?
Is there an influence of El Niño events on the risk?
Del Ponte, E. M., Fernandes, J., Pavan, W., & Baethgen, W. E. (2009). A Model�based Assessment of the Impacts of Climate Variability on Fusarium Head Blight Seasonal Risk in Southern Brazil. Journal of Phytopathology, 157(11�12), 675-681.!
Risk assessment: example 1
16
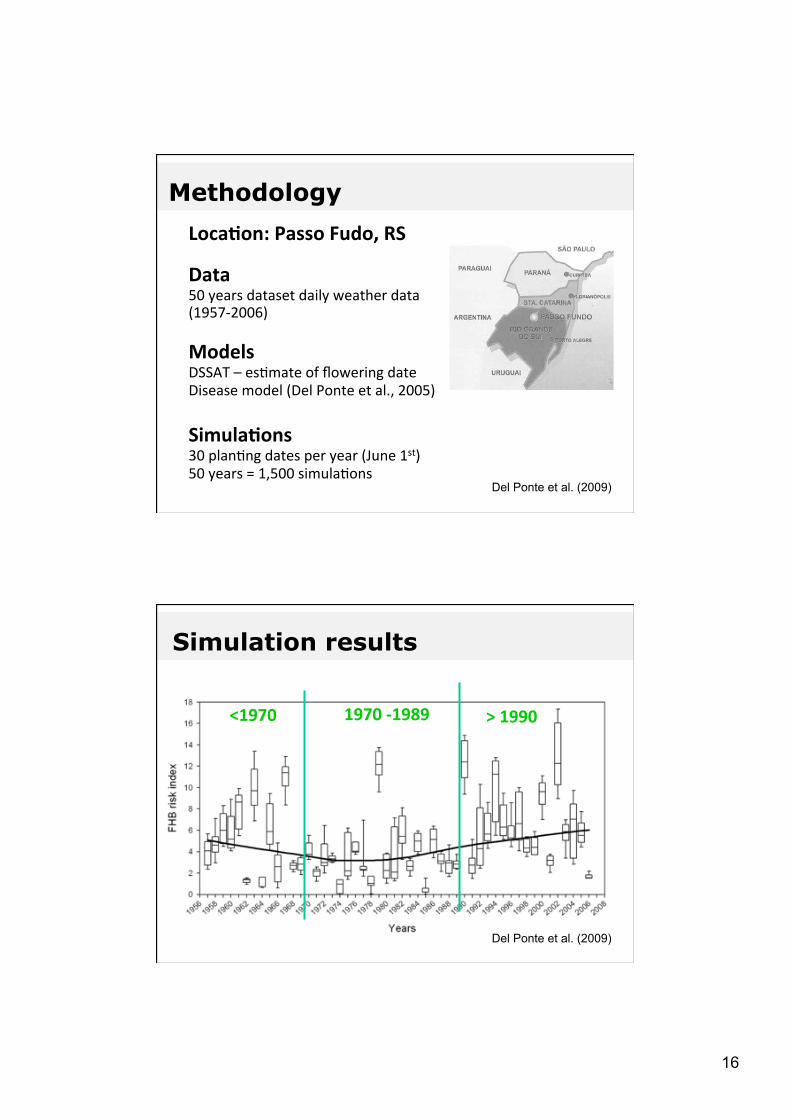
Loca1on:"Passo"Fudo,"RS"!Data"50!years!dataset!daily!weather!data!(1957N2006)!!Models"DSSAT!–!es(mate!of!flowering!date!Disease!model!(Del!Ponte!et!al.,!2005)!!Simula1ons"30!plan(ng!dates!per!year!(June!1st)!50!years!=!1,500!simula(ons!!!
Methodology
Del Ponte et al. (2009)
<1970" 1970"F1989" >"1990"
Simulation results
Del Ponte et al. (2009)
17
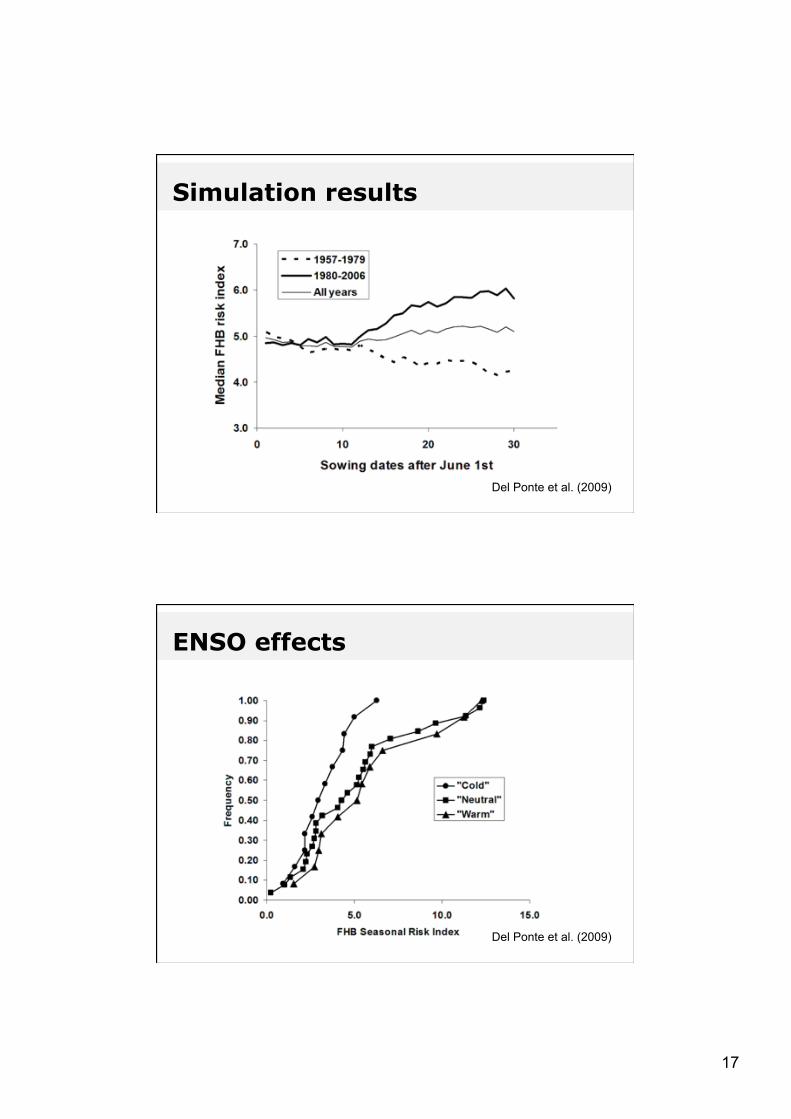
Simulation results
Del Ponte et al. (2009)
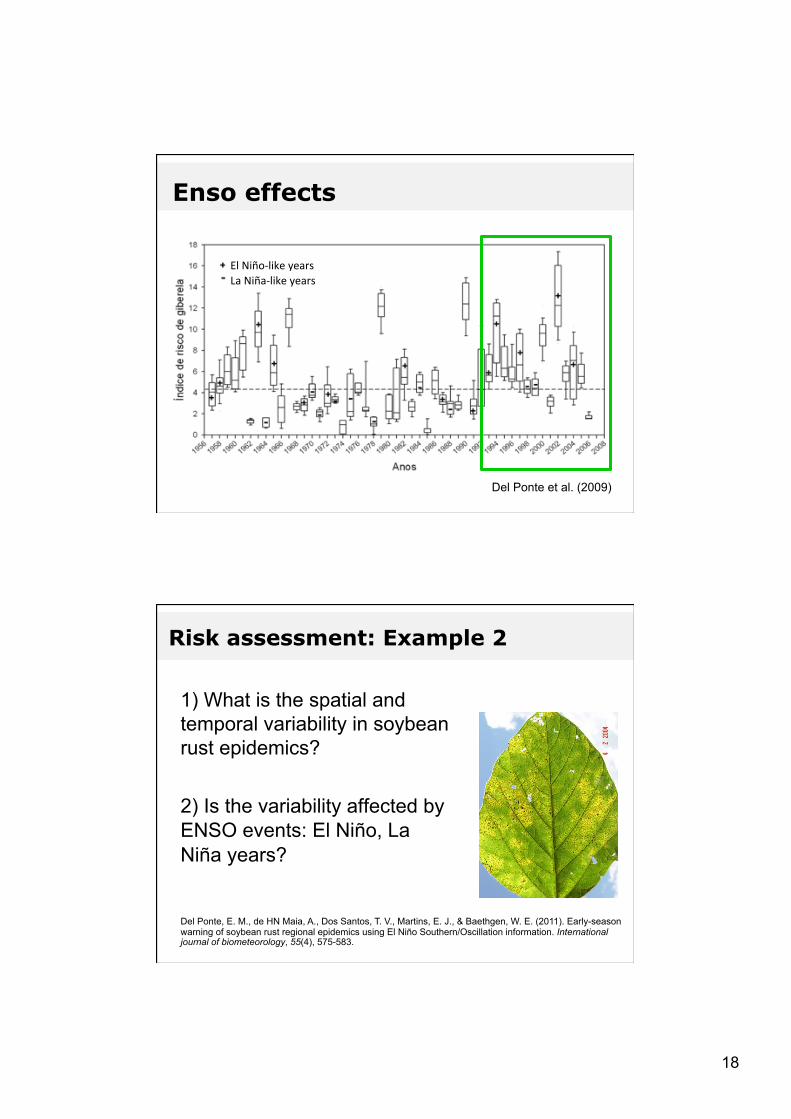
ENSO effects
Del Ponte et al. (2009)
18
El!NiñoNlike!years!La!NiñaNlike!years!
Enso effects
Del Ponte et al. (2009)
Risk assessment: Example 2
1) What is the spatial and temporal variability in soybean rust epidemics?
2) Is the variability affected by ENSO events: El Niño, La Niña years?
Del Ponte, E. M., de HN Maia, A., Dos Santos, T. V., Martins, E. J., & Baethgen, W. E. (2011). Early-season warning of soybean rust regional epidemics using El Niño Southern/Oscillation information. International journal of biometeorology, 55(4), 575-583.
19
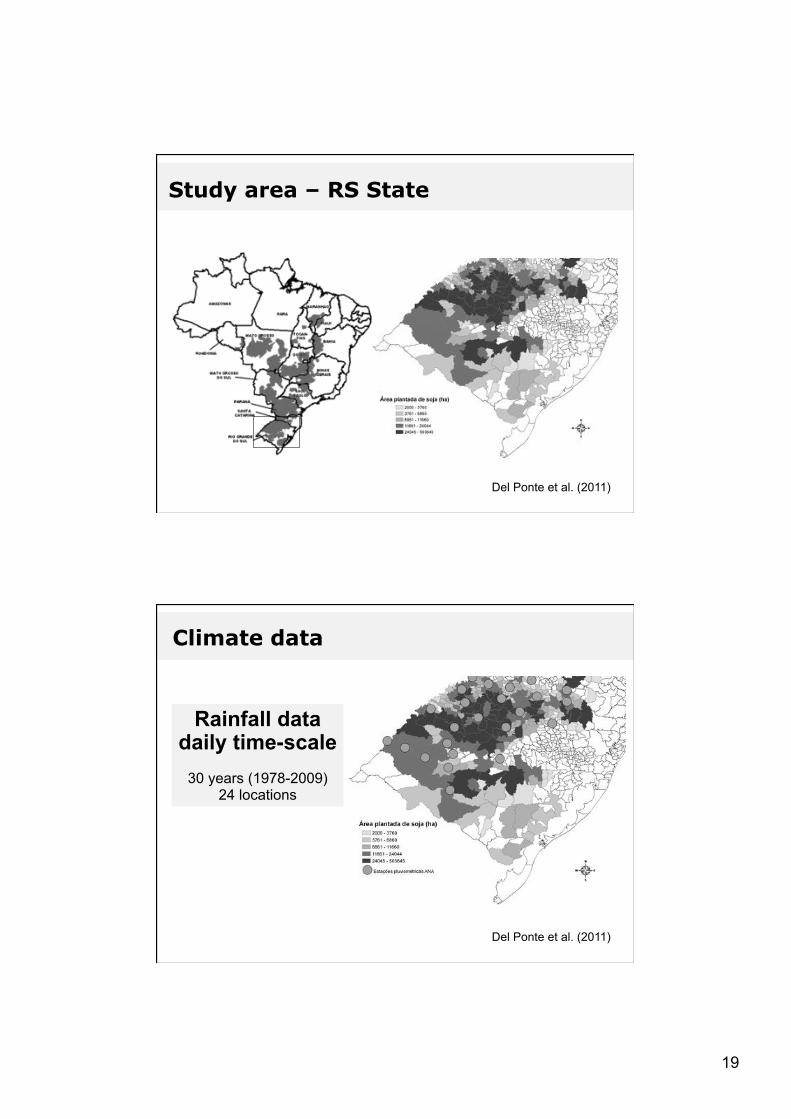
Study area – RS State
Del Ponte et al. (2011)
Climate data
Rainfall data daily time-scale
30 years (1978-2009)
24 locations
Del Ponte et al. (2011)
20
0"
50"
100"
150"
200"
250"
300"
350"
400"
1" 4" 7"10"13"16"19"22"25"28"31"34"37"40"43"46"49"52"55"58"61"64"67"70"73"76"79"82"85"88"
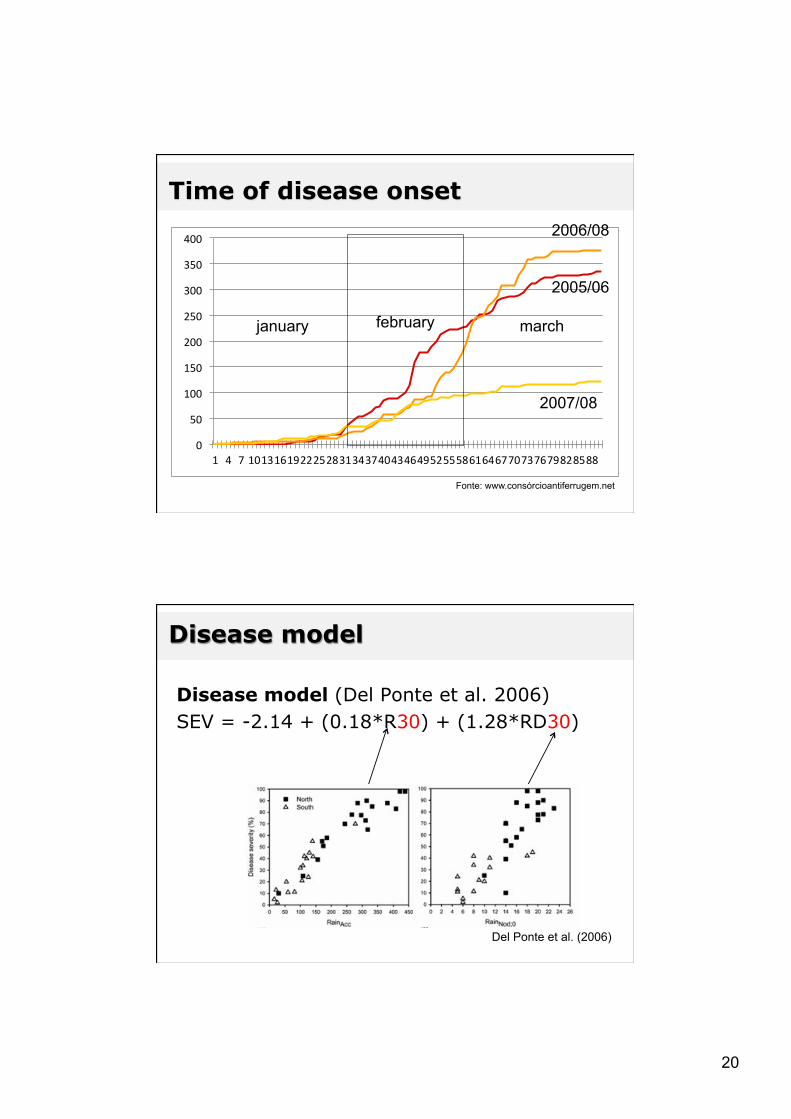
Time of disease onset
Fonte: www.consórcioantiferrugem.net
january february march
2007/08
2006/08
2005/06
Disease model
Disease model (Del Ponte et al. 2006) SEV = -2.14 + (0.18*R30) + (1.28*RD30)
Del Ponte et al. (2006)
21
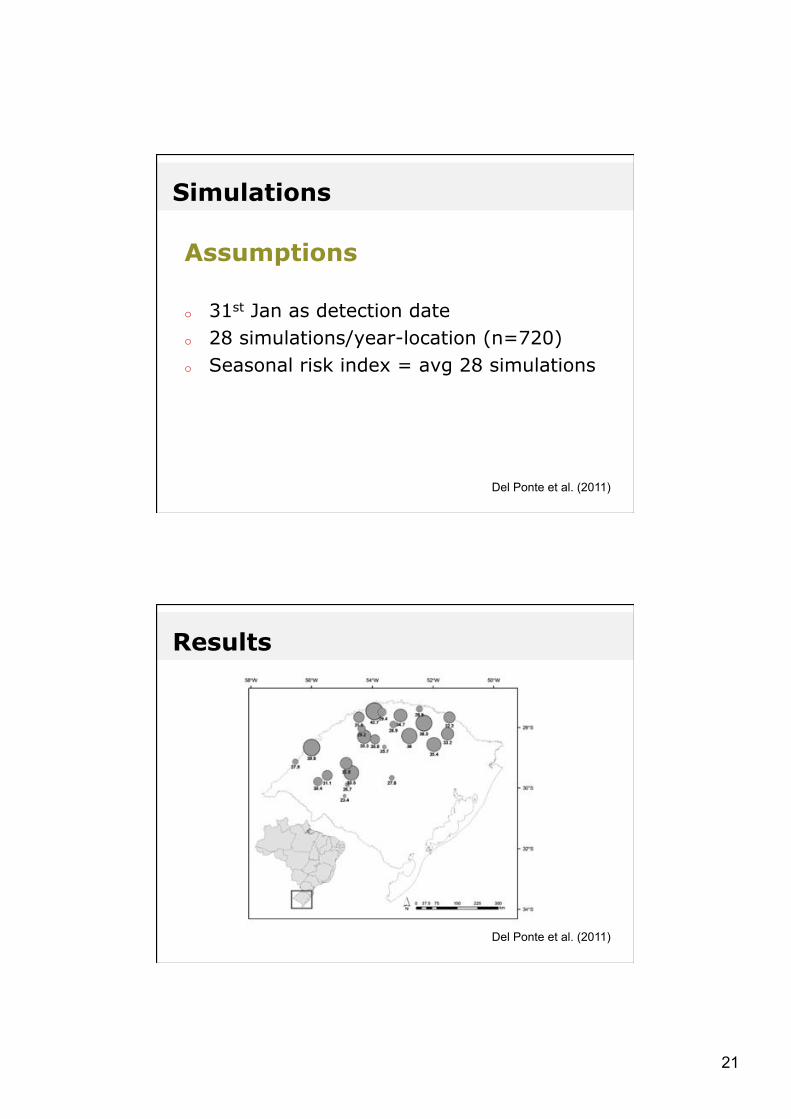
Simulations
Assumptions o 31st Jan as detection date o 28 simulations/year-location (n=720) o Seasonal risk index = avg 28 simulations
Del Ponte et al. (2011)
Results
Del Ponte et al. (2011)

22
Results
Del Ponte et al. (2011)
Results
Del Ponte et al. (2011)

23
Results
Del Ponte et al. (2011)
Warning system
Risk prediction: example 3

24
Choose location
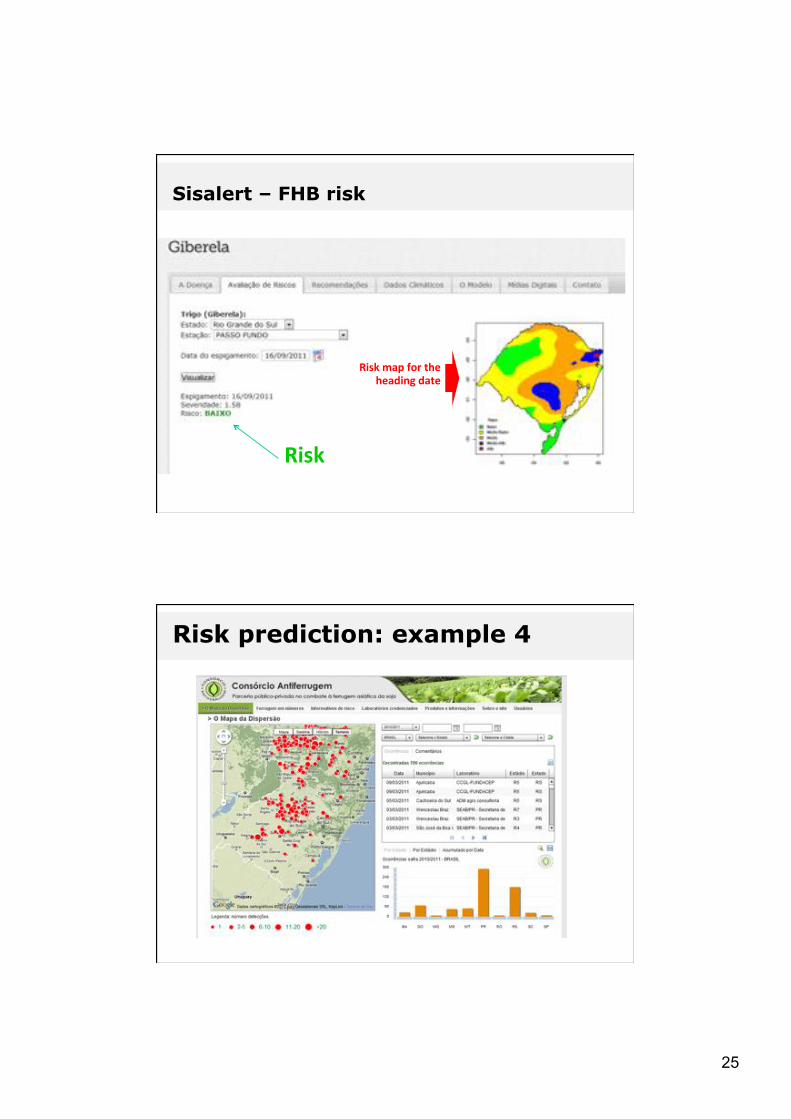
Sisalert – FHB risk
Choose!a!heading!date!
Sisalert – FHB risk
25
Risk"
Risk"map"for"the"heading"date"
Sisalert – FHB risk
Risk prediction: example 4

26
Weekly reports of risk
15 reports during 3 growing seasons 2010 to 2012
30-day rainfall grid (CPTEC)
Severity estimated for each grid cell
Risk map
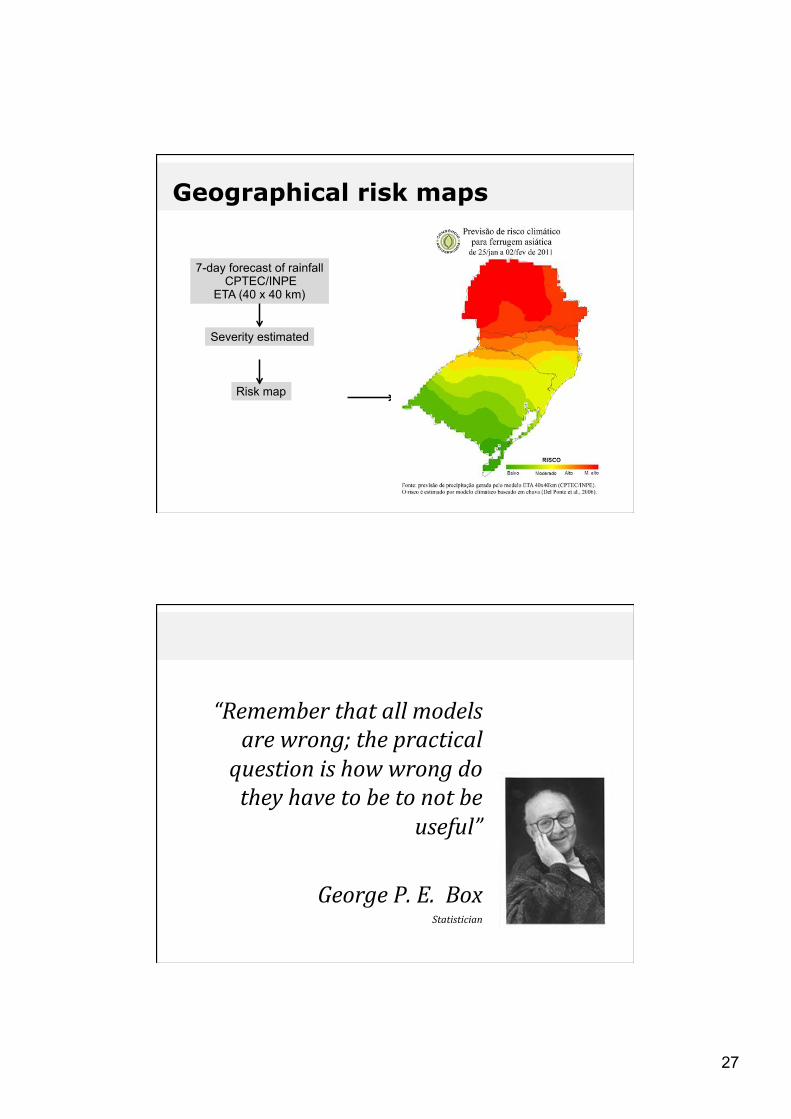
Geographical risk maps
27
Geographical risk maps
7-day forecast of rainfall CPTEC/INPE
ETA (40 x 40 km)
Severity estimated
Risk map
“Remember'that'all'models'are'wrong;'the'practical'question'is'how'wrong'do'they'have'to'be'to'not'be'
useful”''
George'P.'E.''Box'Statistician'
'

28
www.dfp.ufv.br/epidemiology
Copyright © 2022 FDOKUMEN