Immunology and Infectious Diseases
359
Transcript of Immunology and Infectious Diseases

Immunology
and Evolution ofInfectious Disease
STEVEN A. FRANK
Princeton University Press
Princeton and Oxford
Steven Frank
Text Box
This is a full PDF copy of: Frank, S. A. 2002. Immunology and Evolution of Infectious Disease. Princeton University Press. This PDF is a trial version of the book. If you intend to read and use the book, you should buy a copy at: http://pup.princeton.edu http://amazon.com http://bn.com or your local bookseller. A copy of this PDF and other information about the book is available at: http://stevefrank.org

Copyright © 2002 by Steven A. FrankPublished by Princeton University Press,41 William Street, Princeton, New Jersey 08540In the United Kingdom: Princeton University Press,3 Market Place, Woodstock, Oxfordshire OX20 1SY
All Rights Reserved
Library of Congress Cataloging-in-Publication Data
Frank, Steven A., 1957–Immunology and Evolution of Infectious Disease /Steven A. Frank. p. cm.Includes bibliographic references and index.ISBN 0–691–09594–9 (cloth : alk. paper)ISBN 0–691–09595–7 (pbk. : alk. paper)1. Immunogenetics. 2. Host-parasite relationships—Genetic aspects. 3. Microorganisms—Evolution.4. Antigens. 5. Molecular evolution.6. Parasite antigens—Variation. I. Title.[DNLM: 1. Communicable Diseases—immunology.2. Evolution, Molecular. 3. Genetics, Population.4. Immunity—genetics. WC 100 F828i 2002]QR184 .F73 2002616.9′0479—dc21 2002018384
British Library Cataloging-in-Publication Data is available
Typeset by the author with TEXComposed in Lucida Bright
Printed on acid-free paper. ∞
www.pupress.princeton.edu
Printed in the United States of America
10 9 8 7 6 5 4 3 2 1
10 9 8 7 6 5 4 3 2 1(Pbk.)

Contents
Acknowledgments xi
1 Introduction 3
PART I: BACKGROUND
2 Vertebrate Immunity 13
2.1 Nonspecific Immunity 14
2.2 Specific Immunity:Antigens and Epitopes 15
2.3 B Cells and Antibodies 162.4 T Cells and MHC 19
2.5 Summary 20
3 Benefits of Antigenic Variation 22
3.1 Extend Length of Infection 233.2 Infect Hosts with Prior Exposure 24
3.3 Infect Hosts with GeneticallyVariable Resistance 26
3.4 Vary Attachment Characters 263.5 Antigenic Interference 28
3.6 Problems for Future Research 29
PART II: MOLECULAR PROCESSES
4 Specificity and Cross-Reactivity 33
4.1 Antigens and Antibody Epitopes 35
4.2 Antibody Paratopes 364.3 Antibody Affinity Maturation 38

vi CONTENTS
4.4 Natural Antibodies—Low-AffinityBinding to Diverse Antigens 39
4.5 Affinity versus Specificity 404.6 Cross-Reaction of Polyclonal
Antibodies to DivergentAntigens 42
4.7 T Cell Epitopes 44
4.8 Every Host Differs 52
4.9 Problems for Future Research 54
5 Generative Mechanisms 57
5.1 Mutation and Hypermutation 58
5.2 Stochastic Switching betweenArchival Copies 61
5.3 New Variants by IntragenomicRecombination 66
5.4 Mixing between Genomes 67
5.5 Problems for Future Research 68
PART III: INDIVIDUAL INTERACTIONS
6 Immunodominance within Hosts 73
6.1 Antibody Immunodominance 74
6.2 CTL Immunodominance 79
6.3 Sequence of Exposure toAntigens: Original Antigenic Sin 87
6.4 Problems for Future Research 89
7 Parasite Escape within Hosts 93
7.1 Natural Selection of AntigenicVariants 94
7.2 Pathogen Manipulation of HostImmune Dynamics 97
7.3 Sequence of Variants in ActiveSwitching from Archives 98
CONTENTS vii
7.4 Ecological Coexistence ofVariants within a Host 102
7.5 Problems for Future Research 106
PART IV: POPULATION CONSEQUENCES
8 Genetic Variability of Hosts 111
8.1 Polymorphisms in Specificity 112
8.2 Polymorphisms in ImmuneRegulation 115
8.3 Problems for Future Research 121
9 Immunological Variability ofHosts 124
9.1 Immunological Memory 125
9.2 Kinds of Parasites 1299.3 Immunodominance of Memory 132
9.4 Cross-Reactivity and Interference 1359.5 Distribution of Immune Profiles
among Hosts 136
9.6 Problems for Future Research 144
10 Genetic Structure of ParasitePopulations 148
10.1 Kinds of Genetic Structure 149
10.2 Pattern and Process 15110.3 Genome-wide Linkage
Disequilibrium 153
10.4 Antigenic Linkage Disequilibrium 164
10.5 Population Structure: Hosts asIslands 166
10.6 Problems for Future Research 168
viii CONTENTS
PART V: STUDYING EVOLUTION
11 Classifications by Antigenicityand Phylogeny 175
11.1 Immunological Measures ofAntigenicity 176
11.2 Phylogeny 178
11.3 Hypothetical Relations betweenImmunology and Phylogeny 179
11.4 Immunology Matches Phylogenyover Long Genetic Distances 181
11.5 Immunology-PhylogenyMismatch with Radiations intoNew Hosts 181
11.6 Short-Term PhylogeneticDiversification Driven byImmunological Selection 183
11.7 Discordant Patterns ofPhylogeny and AntigenicityCreated by Within-HostImmune Pressure 183
11.8 Problems for Future Research 186
12 Experimental Evolution:Foot-and-Mouth Disease Virus 18812.1 Overview of Antigenicity and
Structure 189
12.2 Antibody Escape Mutants 192
12.3 Cell Binding and Tropism 19612.4 Fitness Consequences of
Substitutions 200
12.5 Problems for Future Research 202
13 Experimental Evolution:Influenza 20513.1 Overview of Antigenicity and
Structure 206
13.2 Antibody Escape Mutants 21413.3 Cell Binding and Tropism 216
CONTENTS ix
13.4 Fitness Consequences ofSubstitutions 218
13.5 Experimental Evolution of OtherPathogens 224
13.6 Problems for Future Research 227
14 Experimental Evolution: CTLEscape 230
14.1 Cleavage and Transport ofPeptides 231
14.2 MHC Binding 232
14.3 TCR Binding 23714.4 Functional Consequences of
Escape 239
14.5 Kinetics of Escape 240
14.6 Problems for Future Research 243
15 Measuring Selection withPopulation Samples 246
15.1 Kinds of Natural Selection 24715.2 Positive Selection to Avoid
Host Recognition 24915.3 Phylogenetic Analysis of
Nucleotide Substitutions 251
15.4 Predicting Evolution 255
15.5 Problems for Future Research 260
16 Recap of Some InterestingProblems 26516.1 Population-Level Explanation for
Low Molecular Variability 26516.2 Molecular-Level Explanation for
Population Dynamics 26616.3 Binding Kinetics and the
Dynamics of Immunodominance 26616.4 Diversity and Regulation of
Archival Repertoires 267
16.5 Final Note 268

x CONTENTS
References 269
Author Index 313
Subject Index 337

Acknowledgments
My wife, Robin Bush, read earlier drafts and helped in every way. Camille
Barr provided comments on the entire manuscript. My department, led
by Chair Al Bennett, gave me the freedom to read and write over nearly
two years. The National Science Foundation and the National Institutes
of Health funded my research. My web pages at http://stevefrank.org/
provide information and updates for this book.


Immunology
and Evolution of
Infectious Disease

1 Introduction
Multidisciplinary has become the watchword of modern biology. Surely,
the argument goes, a biologist interested in the biochemical pathways
by which genetic variants cause disease would also want to understand
the population processes that determine the distribution of genetic vari-
ants. And how can one expect to understand the interacting parts of
complex immune responses without knowing something of the histori-
cal and adaptive processes that built the immune system?
Working in the other direction, evolutionary biologists have often
treated amino acid substitutions within a parasite lineage as simply
statistical marks to be counted and analyzed by the latest mathemat-
ical techniques. More interesting work certainly follows when hypothe-
ses about evolutionary change consider the different selective pressures
caused by antibody memory, variation among hosts in MHC genotype,
and the epidemiological contrasts between rapidly and slowly spreading
infectious diseases.
Synthesis between the details of molecular biology and the lives of
organisms in populations will proceed slowly. It is now hard enough
to keep up in one’s own field, and more difficult to follow the foreign
concepts and language of other subjects. The typical approach to syn-
thesis uses an academic discipline to focus a biological subject. I use the
biological problem of parasite variation to tie together many different
approaches and levels of analysis.
Why should parasite variation be the touchstone for the integration
of disciplines in modern biology? On the practical side, infectious dis-
ease remains a major cause of morbidity and mortality. Consequently,
great research effort has been devoted to parasites and to host immune
responses that fight parasites. This has led to rapid progress in under-
standing the biology of parasites, including the molecular details about
how parasites invade hosts and escape host immune defenses. Vaccines
have followed, sometimes with spectacular success.
But many parasites escape host defense by varying their antigenic
molecules recognized by host immunity. Put another way, rapid evo-
lution of antigenic molecules all too often prevents control of parasite
4 CHAPTER 1
populations. The challenge has been to link molecular understanding
of parasite molecules to their evolutionary change and to the antigenic
variation in populations of parasites.
On the academic side, the growth of information about antigenic vari-
ation provides a special opportunity. For example, one can find in the
literature details about how single amino acid changes in parasite mol-
ecules allow escape from antibody binding, and how that escape pro-
motes the spread of variant parasites. Evolutionary studies no longer
depend on abstractions—one can pinpoint the physical basis for success
or failure and the consequences for change in populations.
Molecular understanding of host-parasite recognition leads to a com-
parative question about the forces that shape variability. Why do some
viruses escape host immunity by varying so rapidly over a few years,
whereas other viruses hardly change their antigens? The answer leads
to the processes that shape genetic variability and evolutionary change.
The causes of variability and change provide the basis for understanding
why simple vaccines work well against some viruses, whereas complex
vaccine strategies achieve only limited success against other viruses.
I did not start out by seeking a topic for multidisciplinary synthesis.
Rather, I have long been interested in how the molecular basis of rec-
ognition between attackers and defenders sets the temporal and spatial
scale of the battle. Attack and defense occur between insects and the
plants they eat, between fungi and the crop plants they destroy, between
viruses and the bacteria they kill, between different chromosomes com-
peting for transmission through gametes, and between vertebrate hosts
and their parasites. The battle often comes down to the rates at which
attacker and defender molecules bind or evade each other. The bio-
chemical details of binding and recognition set the rules of engagement
that shape the pacing, scale, and pattern of diversity and the nature of
evolutionary change.
Of the many cases of attack and defense across all of biology, the
major parasites of humans and their domestic animals provide the most
information ranging from the molecular to the population levels. New
advances in the conceptual understanding of attack and defense will
likely rise from the facts and the puzzles of this subject. I begin by
putting the diverse, multidisciplinary facts into a coherent whole. From
that foundation, I describe new puzzles and define the key problems for
the future study of parasite variation and escape from host recognition.

INTRODUCTION 5
I start at the most basic level, the nature of binding and recognition
between host and parasite molecules. I summarize the many different
ways in which parasites generate new variants in order to escape molec-
ular recognition.
Next, I build up the individual molecular interactions into the dynam-
ics of a single infection within a host. The parasites spread in the host,
triggering immune attack against dominant antigens. The battle within
the host develops through changes in population numbers—the num-
bers of parasites with particular antigens and the numbers of immune
cells that specifically bind to particular antigens.
I then discuss how the successes and failures of different parasite
antigens within each host determine the rise and fall of parasite vari-
ants over space and time. The distribution of parasite variants sets the
immune memory profiles of different hosts, which in turn shape the
landscape in which parasite variants succeed or fail. These coevolution-
ary processes determine the natural selection of antigenic variants and
the course of evolution in the parasite population.
Finally, I consider different ways to study the evolution of antigenic
variation. Experimental evolution of parasites under controlled condi-
tions provides one way to study the relations between molecular rec-
ognition, the dynamics of infections within hosts, and the evolution-
ary changes in parasite antigens. Sampling of parasites from evolving
populations provides another way to test ideas about what shapes the
distribution of parasite variants.
My primary goal is to synthesize across different levels of analysis.
How do the molecular details of recognition and specificity shape the
changing patterns of variants in populations? How does the epidemio-
logical spread of parasites between hosts shape the kinds and amounts
of molecular variation in parasite antigens?
I compare different types of parasites because comparative biology
provides insight into evolutionary process. For example, parasites that
spread rapidly and widely in host populations create a higher density of
immune memory in their hosts than do parasites that spread slowly and
sporadically. Host species that quickly replace their populations with
offspring decay their population-wide memory of antigens faster than do
host species that reproduce more slowly. How do these epidemiological
and demographic processes influence molecular variation of parasite
antigens?
6 CHAPTER 1
I end each chapter with a set of problems for future research. These
problems emphasize the great opportunities of modern biology. At the
molecular level, new technologies provide structural data on the three-
dimensional shape of host antibody molecules bound to parasite anti-
gens. At the population level, genomic sequencing methods provide
detailed data on the variations in parasite antigens. One can now map
the nucleotide variations of antigens and their associated amino acid
substitutions with regard to the three-dimensional location of antibody
binding. Thus, the spread of nucleotide variations in populations can
be directly associated with the changes in molecular binding that allow
escape from antibody recognition.
No other subject provides such opportunity for integrating the re-
cent progress in structural and molecular analysis with the conceptual
and methodological advances in population dynamics and evolutionary
biology. My problems for future research at the end of each chapter
emphasize the new kinds of questions that one can ask by integrating
different levels of biological analysis.
Part I of the book gives general background. Chapter 2 summarizes
the main features of vertebrate immunity. I present enough about the
key cells and molecules so that one can understand how immune recog-
nition shapes the diversity of parasites.
Chapter 3 describes various benefits that antigenic variation provides
to parasites. These benefits explain why parasites vary in certain ways.
For example, antigenic variation can help to escape host immunity dur-
ing a single infection, extending the time a parasite can live within a
particular host. Or antigenic variation may avoid the immunological
memory of hosts, allowing the variant to spread in a population that
previously encountered a different variant of that parasite. Different
benefits favor different patterns of antigenic variation.
Part II introduces molecular processes. Chapter 4 describes the at-
tributes of host and parasite molecules that contribute to immune rec-
ognition. The nature of recognition depends on specificity, the degree
to which the immune system distinguishes between different antigens.
Sometimes two different antigens bind to the same immune receptors,
perhaps with different binding strength. This cross-reactivity protects
INTRODUCTION 7
hosts against certain antigenic variants, and sets the molecular dis-
tance by which antigenic types must vary to escape recognition. Cross-
reactivity may also interfere with immune recognition when immune
receptors bind a variant sufficiently to prevent a new response but not
strongly enough to clear the variant.
Chapter 5 summarizes the different ways in which parasites gener-
ate antigenic variants. Many parasites generate variants by the stan-
dard process of rare mutations during replication. Baseline mutation
rates vary greatly, from about 10−5 per nucleotide per generation for
the small genomes of some RNA viruses to about 10−11 for larger ge-
nomes. Although mutations occur rarely at any particular site during
replication, large populations generate significant numbers of mutations
in each generation. Some parasites focus hypermutation directly on
antigenic loci. Other parasites store within each genome many genetic
variants for an antigenic molecule. These parasites express only one
genetic variant at a time and use specialized molecular mechanisms to
switch gene expression between the variants.
Part III focuses on the dynamics of a single infection within a par-
ticular host. Chapter 6 emphasizes the host side, describing how the
immune response develops strongly against only a few of the many dif-
ferent antigens that occur in each parasite. This immunodominance
arises from interactions between the populations of immune cells with
different recognition specificities and the population of parasites within
the host. Immunodominance determines which parasite antigens face
strong pressure from natural selection and therefore which antigens are
likely to vary over space and time. To understand immunodominance, I
step through the dynamic processes that regulate an immune response
and determine which recognition specificities become amplified.
Chapter 7 considers the ways in which parasites escape recognition
during an infection and the consequences for antigenic diversity within
hosts. The chapter begins with the role of escape by mutation in persis-
tent infections by HIV and hepatitis C virus. I then discuss how other
parasites extend infection by switching gene expression between vari-
ants stored within each genome. This switching leads to interesting
population dynamics within the host. The different variants rise and
fall in abundance according to the rate of switching between variants,
the time lag in the expansion of parasite lineages expressing a particular
variant, and the time lag in the host immune response to each variant.

8 CHAPTER 1
Part IV examines variability in hosts and parasites across entire pop-
ulations. Chapter 8 considers genetic differences among hosts in im-
mune response. Hosts differ widely in their major histocompatibility
complex (MHC) alleles, which cause different hosts to recognize and fo-
cus their immune responses on different parasite antigens. This host
variability can strongly affect the relative success of antigenic variants
as they attempt to spread from host to host. Hosts also differ in mi-
nor ways in other genetic components of specific recognition. Finally,
host polymorphisms occur in the regulation of the immune response.
These quantitative differences in the timing and intensity of immune
reactions provide an interesting model system for studying the genetics
of regulatory control.
Chapter 9 describes differences among hosts in their molecular mem-
ory of antigens. Each host typically retains the ability to respond quickly
to antigens that it encountered in prior infections. This memory pro-
tects the host against reinfection by the same antigens, but not against
antigenic variants that escape recognition. Each host has a particular
memory profile based on past infections. The distribution of memory
profiles in the host population determines the ability of particular anti-
genic variants to spread between hosts. Hosts retain different kinds of
immunological memory (antibody versus T cell), which affect different
kinds of parasites in distinct ways.
Chapter 10 reviews the genetic structure of parasite populations. The
genetic structure of nonantigenic loci provides information about the
spatial distribution of genetic variability, the mixing of parasite lineages
by transmission between hosts, and the mixing of genomes by sexual
processes. The genetic structure of antigenic loci can additionally be
affected by the distribution of host immunological memory, because
parasites must avoid the antigen sets stored in immunological memory.
Host selection on antigenic sets could potentially structure the parasite
population into distinct antigenic strains. Finally, each host forms a
separate island that divides the parasite population from other islands
(hosts). This island structuring of parasite populations can limit the
exchange of parasite genes by sexual processes, causing a highly inbred
structure. Island structuring also means that each host receives a small
and stochastically variable sample of the parasite population. Stochastic
fluctuations may play an important role in the spatial distribution of
antigenic variation.
INTRODUCTION 9
Part V considers different methods to study the evolutionary pro-
cesses that shape antigenic variation. Chapter 11 contrasts two differ-
ent ways to classify parasite variants sampled from populations. Im-
munological assays compare the binding of parasite isolates to differ-
ent immune molecules. The reactions of each isolate with each immune
specificity form a matrix from which one can classify antigenic variants
according to the degree to which they share recognition by immunity.
Alternatively, one can classify isolates phylogenetically, that is, by time
since divergence from a common ancestor. Concordant immunological
and phylogenetic classifications frequently arise because immunological
distance often increases with time since a common ancestor, reflecting
the natural tendency for similarity by common descent. Discordant pat-
terns of immunological and phylogenetic classifications indicate some
evolutionary pressure on antigens that distorts immunological similar-
ity. I show how various concordant and discordant relations point to
particular hypotheses about the natural selection of antigenic proper-
ties in influenza and HIV.
Chapter 12 introduces experimental evolution, a controlled method to
test hypotheses about the natural selection of antigenic diversity. This
chapter focuses on foot-and-mouth disease virus. This well-studied vi-
rus illustrates how one can measure multiple selective forces on partic-
ular amino acids. Selective forces on amino acids in viral surface mole-
cules include altered binding to host-cell receptors and changed binding
to host antibodies. The selective forces imposed by antibodies and by at-
tachment to host-cell receptors can be varied in experimental evolution
studies to test their effects on amino acid change in the parasite. The
amino acid substitutions can also be mapped onto three-dimensional
structural models of the virus to analyze how particular changes alter
binding properties.
Chapter 13 continues with experimental evolution of influenza A vi-
ruses. Experimental evolution has shown how altering the host species
favors specific amino acid changes in the influenza surface protein that
binds to host cells. Experimental manipulation of host-cell receptors
and antibody pressure can be combined with structural data to under-
stand selection on the viral surface amino acids. These mechanistic
analyses of selection can be combined with observations on evolution-
ary change in natural populations to gain a better understanding of how
selection shapes the observed patterns of antigenic variation.
10 CHAPTER 1
Chapter 14 discusses experimental evolution of antigenic escape from
host T cells. The host T cells can potentially bind to any short peptide
of an intracellular parasite, whereas antibodies typically bind only to
the surface molecules of parasites. T cell binding to parasite peptides
depends on a sequence of steps by which hosts cut up parasite proteins
and present the resulting peptides on the surfaces of host cells. Para-
site escape from T cell recognition can occur at any of the processing
steps, including the digestion of proteins, the transport of peptides, the
binding of peptides by the highly specific host MHC molecules, and the
binding of peptide-MHC complexes to receptors on the T cells. One or
two amino acid substitutions in a parasite protein can often abrogate
binding to MHC molecules or to the T cell receptors. Experimental evo-
lution has helped us to understand escape from T cells because many
of the steps can be controlled, such as the MHC alleles carried by the
host and the specificities of the T cell receptors. Parasite proteins may
be shaped by opposing pressures on physiological performance and es-
cape from recognition.
Chapter 15 turns to samples of nucleotide sequences from natural
populations. A phylogenetic classification of sequences provides a his-
torical reconstruction of evolutionary relatedness and descent. Against
the backdrop of ancestry, one can measure how natural selection has
changed particular attributes of parasite antigens. For example, one can
study whether selection caused particular amino acids to change rapidly
or slowly. The rates of change for particular amino acids can be com-
pared with the three-dimensional structural location of the amino acid
site, the effects on immunological recognition, and the consequences
for binding to host cells. The changes in natural populations can also
be compared with patterns of change in experimental evolution, in which
one controls particular selective forces. Past evolutionary change in pop-
ulation samples may be used to predict which amino acid variants in
antigens are likely to spread in the future.
The last chapter recaps some interesting problems for future research
that highlight the potential to study parasites across multiple levels of
analysis.

PART I
BACKGROUND

2 VertebrateImmunity
“The CTLs destroy host cells when their TCRs bind matching MHC-pep-
tide complexes.” This sort of jargon-filled sentence dominates discus-
sions of the immune response to parasites. I had initially intended this
book to avoid such jargon, so that any reasonably trained biologist could
read any chapter without getting caught up in technical terms. I failed—
the quoted sentence comes from a later section in this chapter.
The vertebrate immune system has many specialized cells and mole-
cules that interact in particular ways. One has to talk about those cells
and molecules, which means that they must be named. I could have
tried a simpler or more logically organized naming system, but then I
would have created a private language that does not match the rest of
the literature. Thus, I use the standard technical terms.
In this chapter, I introduce the major features of immunity shared by
vertebrates. I present enough about the key cells and molecules so that
one can understand how immune recognition shapes the diversity of
parasites. I have not attempted a complete introduction to immunology,
because many excellent ones already exist. I recommend starting with
Sompayrac’s (1999) How the Immune System Works, which is a short,
wonderfully written primer. One should keep a good textbook by one’s
side—I particularly like Janeway et al. (1999). Mims’s texts also pro-
vide good background because they describe immunology in relation to
parasite biology (Mims et al. 1998, 2001).
The first section of this chapter describes nonspecific components of
immunity. Nonspecific recognition depends on generic signals of par-
asites such as common polysaccharides in bacterial cell walls. These
signals trigger various killing mechanisms, including the complement
system, which punches holes in the membranes of invading cells, and
the phagocytes, which engulf invaders.
The second section introduces specific immunity, the recognition of
small regions on particular parasite molecules. Specific recognition oc-
curs when molecules of the host immune system bind to a molecular
shape on the parasite that is not shared by other parasites. Sometimes
all parasites of the same species share the specificity, and recognition
14 CHAPTER 2
differentiates between different kinds of parasites. Other times, differ-
ent parasite genotypes vary in molecular shape, so that the host mole-
cules that bind specifically to one parasite molecule do not bind another
parasite molecule that differs by as little as one amino acid. A parasite
molecule that stimulates specific recognition is called an antigen. The
small region of the parasite molecule recognized by the host is called
an epitope. Antigenic variation occurs when a specific immune response
against one antigenic molecule fails to recognize a variant antigenic mol-
ecule.
The third section presents the B cells, which secrete antibodies. An-
tibodies are globular proteins that fight infection by binding to small
regions (epitopes) on the surface molecules of parasites. Different an-
tibodies bind to different epitopes. An individual can make billions of
different antibodies, each with different binding specificity. Diverse an-
tibodies provide recognition and defense against different kinds of par-
asites, and against particular parasites that vary genetically in the struc-
ture of their surface molecules. Antibodies bind to surface molecules
and help to clear parasites outside of host cells.
The fourth section focuses on specific recognition by the T cells. Host
cells continually break up intracellular proteins into small peptides. The
hosts’ major histocompatibility complex (MHC) molecules bind short
peptides in the cell. The cell then transports the bound peptide-MHC
pair to the cell surface for presentation to roving T cells. Each T cell
has receptors that can bind only to particular peptide-MHC combina-
tions presented on the surface of cells. Different T cell clones produce
different receptors. When a T cell binds to a peptide-MHC complex on
the cell surface and also receives stimulatory signals suggesting para-
site invasion, the T cell can trigger the death of the infected cell. T cells
bind to parasite peptides digested in infected cells and presented on the
infected cell’s surface, helping to clear intracellular infections.
The final section summarizes the roles of antibodies and T cells in
specific immunity.
2.1 Nonspecific Immunity
Nonspecific immunity recognizes parasites by generic signs that in-
dicate the parasite is an invader rather than a part of the host. The
nonspecific complement system consists of different proteins that work
VERTEBRATE IMMUNITY 15
together to punch holes in the surfaces of cells. Host cells have several
surface molecules that shut off complement attack, causing complement
to be directed only against invading cells. Common structural carbo-
hydrates found on the surfaces of many parasites trigger complement
attack, whereas the host cells’ carbohydrate molecules do not trigger
complement.
Phagocytic cells such as macrophages and neutrophils engulf invad-
ing parasite cells. Various signals indicate to the phagocytes that nearby
cells are invaders. For example, certain lipopolysaccharides commonly
occur in the outer walls of gram-negative bacteria such as E. coli. Man-
nose, which occurs in the cell walls of many invaders, also stimulates
phagocytes. In addition, phagocytes respond to signs of tissue damage
and inflammation.
Nonspecific defense by itself may not entirely clear an infection, and
in some cases parasites can avoid nonspecific defense. For example,
the protective capsules of staphylococci and the surface polysaccharide
side chains of salmonellae protect those bacteria from attachment by
nonspecific killing molecules (Mims et al. 1993, p. 12.2).
2.2 Specific Immunity: Antigens and Epitopes
Nonspecific immunity recognizes common, repetitive structural fea-
tures that distinguish parasites from the host’s cells. By contrast, spe-
cific immunity recognizes small regions of particular parasite molecules.
Specific recognition may depend on just five or ten amino acids of a para-
site protein. Such specificity means that different parasite species often
differ at recognition sites. Indeed, different parasite genotypes may vary
such that a host can recognize particular sites on one genotype but not
on another.
This book is about parasite variation in regard to specific immunity, so
it is important to get the jargon right. Specific host immunity recognizes
and binds to an epitope, which is a small molecular site within a larger
parasite molecule. An antigen is a parasite molecule that stimulates
a specific immune response because it contains one or more epitopes.
For example, if one injects a large foreign protein into a host, the host
recognizes thousands of different epitopes on the surface of the protein
antigen.
16 CHAPTER 2
Antigenic variation occurs when a specific immune response against
one antigenic molecule fails to recognize a variant antigenic molecule.
The antigenic variants differ at one or more epitopes, the sites recog-
nized by specific immunity.
2.3 B Cells and Antibodies
B cells mature in the bone marrow (bursa in birds). They then develop
into lymphocytes, immune cells that circulate in the blood and lymph
systems. B cells express globular proteins (immunoglobulins) on their
cell surfaces. These immunoglobulins form the B cell receptors (BCRs).
B cells also secrete those same immunoglobulins, which circulate as an-
tibodies. In other words, antibodies are simply secreted BCRs. I will
often use the word antibody for B cell immunoglobulin, but it is impor-
tant to remember that the same immunoglobulins can be either BCRs or
antibodies. Immunoglobulin is usually abbreviated as Ig.
The B cells generate alternative antibody specificities by specially con-
trolled recombination and mutation processes (fig. 2.1). The host main-
tains a huge diversity of antibody specificities, each specificity in low
abundance. Novel parasite epitopes often bind to at least one rare an-
tibody specificity. Binding stimulates the B cells to divide, forming an
expanded clonal lineage that increases production of the matching an-
tibody.
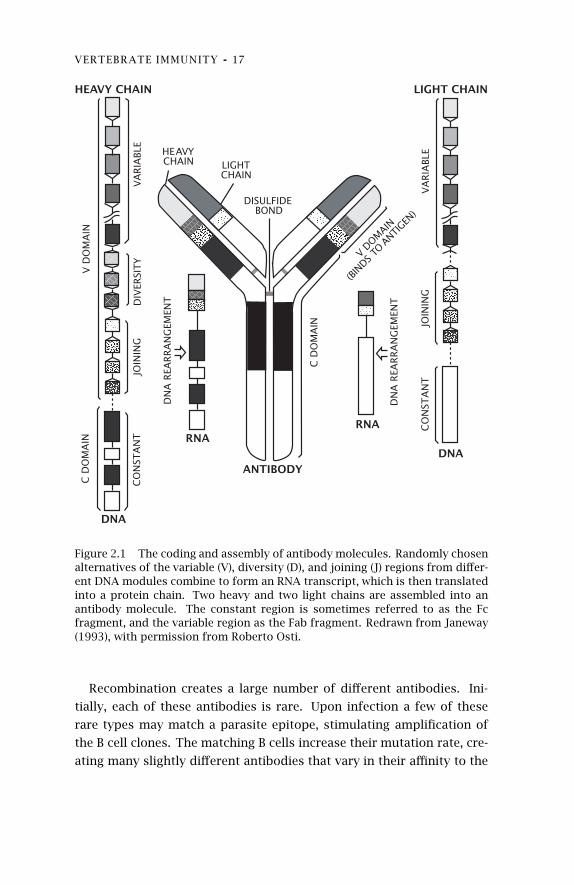
Each antibody molecule has two kinds of amino acid chains, the heavy
chains and the light chains (fig. 2.1). A heavy chain has three regions that
affect recognition, variable (V), diversity (D), and joining (J). A light chain
has only the V and J regions. In humans, there are approximately one
hundred different V genes, twelve D genes, and four J genes (Janeway
1993).
Each progenitor of a B cell clone undergoes a special type of DNA
recombination that brings together a V-D-J combination to form a heavy
chain coding region. There are 100×12×4 = 4,800 V-D-J combinations.
A separate recombination event creates a V-J combination for the light
chain, of which there are 100×4 = 400 combinations. The independent
formation of heavy and light chains creates the potential for 4,800 ×400 = 1,920,000 different antibodies. In addition, randomly chosen
DNA bases are added between the segments that are brought together
by recombination, greatly increasing the total number of antibody types.
VERTEBRATE IMMUNITY 17
HEAVY CHAIN LIGHT CHAIN
DNA
DNARNA
RNA
DISULFIDEBOND
LIGHTCHAIN
HEAVYCHAIN
ANTIBODY
VA
RIA
BLE
VA
RIA
BLE
DIV
ERSI
TY
JOIN
ING
JOIN
ING
CO
NST
AN
T
CO
NST
AN
T
DN
A R
EAR
RA
NG
EMEN
T
DN
A R
EAR
RA
NG
EMEN
T
C D
OM
AIN
V D
OM
AIN
C D
OM
AIN
V DOM
AIN
(BIN
DS TO
ANTI
GEN)
Figure 2.1 The coding and assembly of antibody molecules. Randomly chosenalternatives of the variable (V), diversity (D), and joining (J) regions from differ-ent DNA modules combine to form an RNA transcript, which is then translatedinto a protein chain. Two heavy and two light chains are assembled into anantibody molecule. The constant region is sometimes referred to as the Fcfragment, and the variable region as the Fab fragment. Redrawn from Janeway(1993), with permission from Roberto Osti.
Recombination creates a large number of different antibodies. Ini-
tially, each of these antibodies is rare. Upon infection a few of these
rare types may match a parasite epitope, stimulating amplification of
the B cell clones. The matching B cells increase their mutation rate, cre-
ating many slightly different antibodies that vary in their affinity to the
18 CHAPTER 2
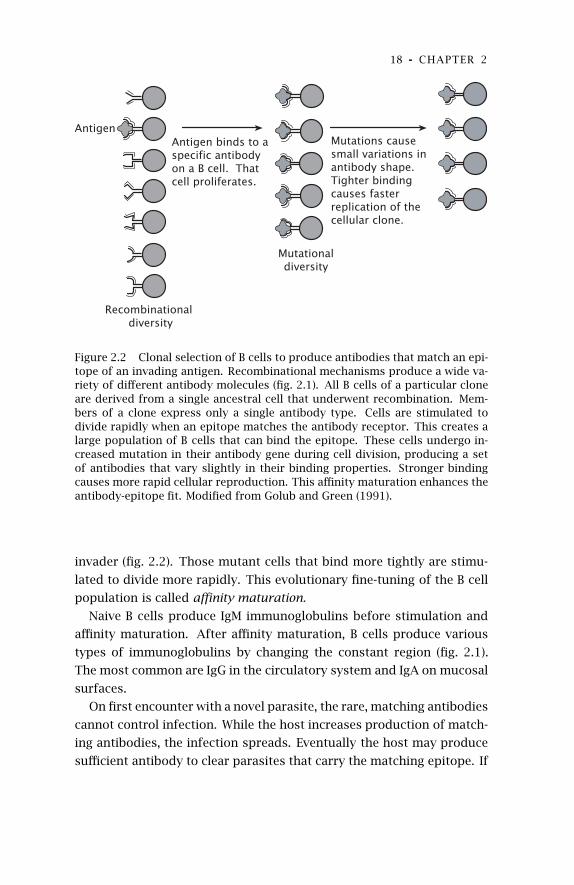
AntigenAntigen binds to a specific antibody on a B cell. That cell proliferates.
Recombinationaldiversity
Mutationaldiversity
Mutations cause small variations in antibody shape. Tighter binding causes faster replication of the cellular clone.
Figure 2.2 Clonal selection of B cells to produce antibodies that match an epi-tope of an invading antigen. Recombinational mechanisms produce a wide va-riety of different antibody molecules (fig. 2.1). All B cells of a particular cloneare derived from a single ancestral cell that underwent recombination. Mem-bers of a clone express only a single antibody type. Cells are stimulated todivide rapidly when an epitope matches the antibody receptor. This creates alarge population of B cells that can bind the epitope. These cells undergo in-creased mutation in their antibody gene during cell division, producing a setof antibodies that vary slightly in their binding properties. Stronger bindingcauses more rapid cellular reproduction. This affinity maturation enhances theantibody-epitope fit. Modified from Golub and Green (1991).
invader (fig. 2.2). Those mutant cells that bind more tightly are stimu-
lated to divide more rapidly. This evolutionary fine-tuning of the B cell
population is called affinity maturation.
Naive B cells produce IgM immunoglobulins before stimulation and
affinity maturation. After affinity maturation, B cells produce various
types of immunoglobulins by changing the constant region (fig. 2.1).
The most common are IgG in the circulatory system and IgA on mucosal
surfaces.
On first encounter with a novel parasite, the rare, matching antibodies
cannot control infection. While the host increases production of match-
ing antibodies, the infection spreads. Eventually the host may produce
sufficient antibody to clear parasites that carry the matching epitope. If
VERTEBRATE IMMUNITY 19
the parasites, in turn, vary the matched epitope, the host must expand
new antibody types to clear the variant parasites.
Once the host expands an antibody specificity against a matching epi-
tope, it maintains a memory of that epitope. Upon later exposure to the
same epitope, the host can quickly produce large numbers of matching
antibodies. This memory allows the host to clear subsequent reinfection
without noticeable symptoms.
Antibodies typically bind to surface epitopes of parasites. Thus, an-
tibodies aid clearance of parasites circulating in the blood or otherwise
exposed to direct attack. Once an intracellular parasite enters a host
cell, the host must use other defenses such as T cells.
2.4 T Cells and MHC
Host cells continually break up intracellular proteins into small pep-
tides. The host’s major histocompatibility complex (MHC) molecules
bind these short peptides within the cell. The cell then transports the
bound peptide-MHC pair to the cell surface for presentation to roving T
cells. T cells are lymphocytes that mature in the thymus.
T cell receptors (TCRs) vary in binding specificity. Each T cell recep-
tor can bind only to particular peptide-MHC combinations presented on
the surface of cells. Different T cell clones produce different TCRs. The
TCR variability is generated by a process similar to the recombinational
mechanisms that produce antibody diversity in B cells. However, T cells
do not go through affinity maturation, so once the recombination pro-
cess sets the TCR for a T cell lineage, the TCR does not change much for
that lineage.
A parasite peptide is called an epitope when it binds to MHC and a
TCR. In this case, an antigen is the protein from the which the epitope
is digested.
There are two different kinds of MHC molecules and two main classes
of T cells. Most cells of the body express the MHC class I molecules,
presenting class I peptide-MHC complexes on their surface. The class
I molecules bind a subset of T cells that have the cellular determinant
protein CD8 on their surface, the CD8+ T cells. When the CD8+ T cells
are stimulated by various signals of attack, they become armed with
killing function and are known as cytotoxic T lymphocytes (CTLs). The
CTLs destroy host cells when their TCRs bind matching peptide-MHC
20 CHAPTER 2
complexes. The CTLs play a central role in clearing intracellular infec-
tions.
Specialized antigen-presenting cells (APCs) take up external proteins
including parasite proteins, digest those proteins into short peptides,
and present the peptides bound to MHC class II molecules. T cells with
the cellular determinant protein CD4 on their surface, the CD4+ T cells,
can bind to class II peptide-MHC complexes presented on the surfaces
of APCs if they have matching TCRs. The CD4+ cells are often called
helper T cells because they frequently provide a helping signal needed
to stimulate an antibody or CTL response.
Upon first exposure to a parasite, some of the parasite epitopes pre-
sented by MHC will match rare TCR specificities. TCR binding along
with other stimulatory signals trigger rapid division of T cell clones with
matching TCR specificities. The first infection by a parasite may spread
widely in the host before matching T cells can be amplified. After am-
plification, eventual clearance of parasites with matching epitopes may
end the infection or may favor the rise of variant epitopes, which must
also be recognized and cleared. Once the host expands a TCR speci-
ficity against a matching epitope, it often maintains a memory of that
epitope. Upon later exposure to the same epitope, the host produces
large numbers of matching T cells more quickly than on first exposure.
T cells can recognize only those epitopes that bind to MHC for pre-
sentation. MHC class I binding specificity depends on short peptides
of about 8–10 amino acids; class II binds to a sequence of about 13–17
amino acids (Janeway et al. 1999). The highly polymorphic MHC alleles
vary between host individuals, causing each individual to have a partic-
ular spectrum of presentation efficiencies for different peptides. Thus,
the strength of a host’s response to a particular epitope depends on its
MHC genotype.
2.5 Summary
I have greatly simplified the immune response. For example, differ-
ent kinds of “helper” T cells regulate B cell stimulation, antibody affinity
maturation, deployment and maintenance of CTLs, and other immune
responses. Among antibodies, specialized types stimulate different in-
flammatory responses or killing mechanisms.

VERTEBRATE IMMUNITY 21
In spite of this complexity, antibodies do play a key role in clearing
parasites located outside of cells, and MHC presentation to specific T
cell receptors plays a key role in defense against parasites located within
cells. B and T cell recognition is highly specific to particular epitopes,
which are often small sets of amino acids. Parasites can escape that
specific recognition by varying only one or two amino acids in an epitope.
This recognition and escape provides the basis for antigenic variation.

3 Benefits ofAntigenic Variation
In this chapter, I describe the benefits that antigenic variation provides
to parasites. These benefits help to explain why parasites vary in certain
ways.
The first section examines how antigenic variants can extend the time
a parasite maintains an infection within a host. The initial parasite type
stimulates an immune response against its dominant antigens. If the
parasite changes those antigens to new variants, it escapes immunity
and continues a vigorous infection until the host generates a new re-
sponse against the variants. Some parasites generate novel antigens by
random mutations during replication. Other parasites store in their ge-
nomes alternative genes encoding variants of dominant antigens. Such
parasites occasionally switch expression between the archived variants,
allowing escape from specific immunity.
The second section presents how antigenic variants can reinfect hosts
with immune memory. Host immune memory recognizes and mounts
a rapid response against previously encountered antigens. Antigenic
variants that differ from a host’s previous infections escape that host’s
memory response. The distribution of immune memory profiles be-
tween hosts determines the success of each parasite variant.
The third section suggests that particular antigenic variants can at-
tack some host genotypes but not others. For example, hosts vary in
their MHC genotype, which determines the T cell epitopes each host
can recognize. An epitope often can be recognized by one rare MHC
allele but not by others. Each antigenic variant has its own distribution
of host genotypes on which it does best at avoiding MHC recognition.
Hosts also vary in the cellular receptors used for attachment by para-
site surface antigens. Variation in surface antigens may allow parasites
to attach with variable success to cellular receptors of different host
genotypes.
The fourth section proposes that variable surface antigens sometimes
enhance parasite fitness by allowing colonization of different host tis-
sues. For example, certain antigenic variants of the blood-borne spiro-
chete Borrelia turicatae sequester in the brain, protected from immune
BENEFITS OF ANTIGENIC VARIATION 23
pressure. Antigenic variants of Plasmodium falciparum affect cytoad-
herence to capillary endothelia, which influences the tendency of the
parasite to be hidden from sites of powerful immune activity. Sequester-
ed variants may prolong infection or provide a source for reestablishing
infection after the majority of parasites have been cleared from other
body compartments. Many antigenic variants of B. turicatae and P. falci-
parum arise during a single infection because both species change sur-
face antigens by switching gene expression between loci in a genomic
archive of variants. Those surface variants stimulate strong antibody
responses, suggesting that both immune escape and variable tissue tro-
pism can provide important benefits for antigenic variation.
The fifth section describes how some antigenic variants interfere with
the immune response to other variants. For example, a host may first
encounter a particular antigenic type and then later become infected by
a cross-reacting variant. The second infection sometimes stimulates a
host memory response to the first variant rather than a new, specific
response to the second variant. The memory response to the first vari-
ant may not clear the second variant effectively. Thus, hosts’ memory
profiles can benefit certain cross-reacting variants. In other cases, one
variant may interfere with a host’s ability to respond to another variant.
This antagonism may cause the interacting variants to occur together
because one or both variants enjoy the protection created by the pres-
ence of the other variant.
The final section outlines promising topics of study for future re-
search.
3.1 Extend Length of Infection
Many parasites follow a simple pattern of infection and clearance. The
measles virus, for example, multiplies and develops a large population
in the host upon first infection (Griffin 2001). As the initial parasitemia
builds, the host develops a specific immune response that eventually
clears the infection. That same host rapidly clears later measles rein-
fections by specific immunity against the measles virus. Immunity that
protects against reinfection develops from special memory components
of the immune system. The immune system attacks conserved epitopes
of the measles virus that do not vary significantly between viruses. Thus,
measles does not escape immunity by changing its dominant antigens.
24 CHAPTER 3
Other parasites begin their infection cycle in the same way—a large
initial parasitemia followed by reduction when the host mounts a spe-
cific immune response against a dominant epitope. But some parasites
can alter their dominant epitope. Antigenic variants escape recognition
by the first wave of specific host defense against the initial antigenic
type, extending the length of infection.
Trypanosoma brucei changes its dominant antigenic surface glyco-
protein at a rate of 10−3 to 10−2 per cell division (Turner 1997). The
trypanosome changes to another surface coat by altering expression be-
tween different genes already present in the genome. Infections lead to
successive waves of parasitemia and clearance as novel antigenic types
spread and are then checked by specific immunity.
Some viruses, such as HIV, escape immune attack by mutating their
dominant epitopes (McMichael and Phillips 1997). Mutational changes
to new, successful epitopes may be rare in each replication of the virus.
But the very large population size of viruses within a host means that
mutations, rare in each replication, often occur at least once in the host
in each parasite generation.
For parasites that produce antigenic variants within hosts, the infec-
tion continues until the host controls all variants, raises an immune
response against a nonvarying epitope, or clears the parasite by non-
specific defenses.
Antigenic variation can extend the total time before clearance (Moxon
et al. 1994; Deitsch et al. 1997; Fussenegger 1997). Extended infection
benefits the parasite by increasing the chances for transmission to new
hosts.
3.2 Infect Hosts with Prior Exposure
Hosts often maintain memory against antigens from prior infections.
Host memory of particular antigens blocks reinfection by parasites car-
rying those antigens. Parasites can escape host memory by varying their
antigens.
Cross-reaction between antigenic variants occurs when a host can use
its specific recognition from exposure to a prior variant to fight against
a later, slightly different variant. Cross-reactive protection may provide
only partial defense, allowing infection but clearing the parasite more
rapidly than in naive hosts.

BENEFITS OF ANTIGENIC VARIATION 25
In the simplest case, each antigenic type acts like a separate parasite
that does not cross-react with other variants. The distribution of anti-
genic variants will be influenced by the rate at which new variants arise
and spread and the rate at which old variants are lost from the popula-
tion. As host individuals age, they become infected by and recover from
different antigenic variants. Thus, the host population can be classified
by resistance profiles based on the past infection and recovery of each
individual (Andreasen et al. 1997).
Two extreme cases define the range of outcomes. On the one hand,
each variant may occasionally spread epidemically through the host pop-
ulation. This leaves a large fraction of the hosts resistant upon recov-
ery, driving that particular variant down in frequency because it has few
hosts it can infect. The variant can spread again only after many resis-
tant hosts die and are replaced by young hosts without prior exposure
to that antigen. In this case, three factors set the temporal pacing for
each antigenic variant: host age structure, the rapidity with which vari-
ants can spread and be cleared, and the waiting time until a potentially
successful variant arises.
Variants may, on the other hand, be maintained endemically in the
host population. This requires a balance between the rate at which in-
fections lead to host death or recovery and the rate at which new suscep-
tible hosts enter the population. The parasite population maintains as
many variants as arise and do not cross-react, subject to “birth-death”
processes governing the stochastic origin of new variants and the loss
of existing variants.
These extreme cases set highly simplified end points. In reality, vari-
ants may differ in their ability to transmit between hosts and to grow
within hosts. Nonspecific immunity or partial resistance to nonvarying
or secondary epitopes also complicate the dynamics. Nonetheless, the
epidemiology of the parasite, the host age structure and resistance pro-
files, and the processes that generate new variants drive many aspects
of the dynamics.
Cross-reactivity between variants adds another dimension (Andrea-
sen et al. 1997; Lin et al. 1999). The resistance profiles of individual
hosts can still be described by history of exposure. However, a new
variant’s ability to infect a particular host depends on the impedance to
the variant caused by the host’s exposure profile and the cross-reactivity
between antigens.
26 CHAPTER 3
3.3 Infect Hosts with Genetically Variable Resistance
Host genotype can influence susceptibility to different parasite vari-
ants. For example, MHC genotype determines the host’s efficiency in
presenting particular epitopes to T cells. From the parasite’s point of
view, a particular antigenic variant may be able to attack some host ge-
notypes but not others.
Hill (1998) pointed out that hepatitis B virus provides a good model
for studying the interaction between MHC and parasite epitopes. Prelim-
inary reports found associations between MHC genotype and whether
infections were cleared or became persistent (van Hattum et al. 1987;
Almarri and Batchelor 1994; Thursz et al. 1995; Hohler et al. 1997). The
hepatitis B virus genome is very small (about 3,000 base pairs, or bp),
which should allow direct study of how variation in viral epitopes inter-
acts with the host’s MHC genotype.
Host genotype can also affect the structure of the cellular receptors
to which parasites attach. For example, the human CCR5 gene encodes
a coreceptor required for HIV-1 to enter macrophages. A 32bp deletion
of this gene occurs at a frequency of 0.1 in European populations. This
deletion prevents the virus from entering macrophages (Martinson et al.
1997; O’Brien and Dean 1997; Smith et al. 1997).
It is not clear whether minor variants of cellular receptors occur suf-
ficiently frequently to favor widespread matching variation of parasite
surface antigens. Several cases of this sort may eventually be found,
but in vertebrate hosts genetic variation of cellular receptors may be a
relatively minor cause of parasite diversity.
3.4 Vary Attachment Characters
Parasite surface antigens often play a role in attachment and entry
into host cells or attachment to particular types of host tissue. Varying
these attachment characters allows attack of different cell types or ad-
hesion to various tissues. Such variability can provide the parasite with
additional resources or protection from host defenses.
Several species of the spirochete genus Borrelia cause relapsing fever
(Barbour and Hayes 1986; Barbour 1987, 1993). Relapses occur because
the parasite switches expression between different genetic copies of the
major surface antigen. The host develops fever and then clears the initial
BENEFITS OF ANTIGENIC VARIATION 27
parasitemia, but suffers a few rounds of relapse as the antigenic variants
rise and fall. A subset of antigenic variants of these blood-borne bacteria
have a tendency to accumulate in the brain, where they can avoid the
host’s immune response (Cadavid et al. 2001). Those bacteria in the
brain may cause later relapses after the host has cleared the pathogens
from the blood. The differing tissue tropisms of the antigenic variants
may combine to increase the total parasitemia.
Protozoan parasites of the genus Plasmodium cause malaria in a va-
riety of vertebrate hosts. Several Plasmodium species switch antigenic
type (Brannan et al. 1994). Switching has been studied most extensively
in P. falciparum (Reeder and Brown 1996). Programmed mechanisms of
gene expression choose a single gene from among many archival genetic
copies for the P. falciparum erythrocyte membrane protein 1 (PfEMP1)
(Chen et al. 1998). As its name implies, the parasite expresses this anti-
gen on the surface of infected erythrocytes. PfEMP1 induces an antibody
response, which likely plays a role in the host’s ability to control infec-
tion (Reeder and Brown 1996).
PfEMP1 influences cytoadherence of infected erythrocytes to capil-
lary endothelia (Reeder and Brown 1996). This adherence may help the
parasite to avoid clearance in the spleen. Thus, antigenic variants can
influence the course of infection by escaping specific recognition and by
hiding from host defenses (Reeder and Brown 1996). Full understanding
of the forces that have shaped the archival repertoire, switching process,
and course of infection requires study of both specific immune recogni-
tion and cytoadherence properties of the different antigenic variants.
The bacteria that cause gonorrhea and a type of meningitis have anti-
genically varying surface molecules. The variable Opa proteins form a
family that influences the colony opacity (Malorny et al. 1998). Neis-
seria gonorrhoeae has eleven to twelve opa loci in its genome, and N.
meningitidis has three to four opa loci. Any particular bacterial cell typ-
ically expresses only one or two of the opa loci; cellular lineages change
expression in the opa loci (Stern et al. 1986). Both conserved and hy-
pervariable regions occur among the loci. The bacteria expose the hy-
pervariable regions on the cell surface (Malorny et al. 1998; Virji et al.
1999). The exposed regions contain domains that affect binding to host
cells and to antibody epitopes.
The different antigenic variants within the Opa of proteins family af-
fect tropism for particular classes of host cells (Gray-Owen et al. 1997;
28 CHAPTER 3
Virji et al. 1999). For N. gonorrhoeae, some Opa proteins have an affinity
for the host cell surface protein CD66e found on the squamous epithe-
lium of the uterine portio. Other Opa variants bind more effectively to
CD66a found on the epithelium of the cervix, uterus, and colon tissues.
Thus, the CD66-specific Opa variants may mediate the colonization of
different tissues encountered during gonococcal infection (Gray-Owen
et al. 1997).
HIV provides the final example for this section. This virus links its
surface protein gp120 to two host-cell receptors before it enters the
cell (O’Brien and Dean 1997). One host-cell receptor, CD4, appears to
be required by most HIV variants (but see Saha et al. 2001). The second
host-cell receptor can be CCR5 or CXCR4. Macrophages express CCR5. A
host that lacks functional CCR5 proteins apparently can avoid infection
by HIV, suggesting that the initial invasion requires infection of macro-
phages. HIV isolates with tropism for CCR5 can be found throughout
the infection; this HIV variant is probably the transmissive form that
infects new hosts.
As an infection proceeds within a host, HIV variants with tropism for
CXCR4 emerge (O’Brien and Dean 1997). This host-cell receptor occurs
on the surface of the CD4+ (helper) T lymphocytes. The emergence of
viral variants with tropism for CXCR4 coincides with a drop in CD4+ T
cells and onset of the immunosuppression that characterizes AIDS.
These examples show that variable surface antigens may sometimes
occur because they provide alternative cell or tissue tropisms rather
than, or in addition to, escape from immune recognition.
3.5 Antigenic Interference
Prior exposure of the host to particular epitopes sometimes reduces
the host’s ability to raise an immune response against slightly altered
parasite variants. This interference was first observed in influenza (Faze-
kas de St. Groth and Webster 1966a, 1966b). In this case, if a host first
encounters a variant, x, then a later cross-reacting variant, y , restimu-
lates an antibody response against x rather than stimulating a specific
response against y . This phenomenon is called original antigenic sin be-
cause the host tends to restimulate antibodies against the first antigen
encountered. A similar pattern has been observed for the cytotoxic T
BENEFITS OF ANTIGENIC VARIATION 29
cell response of mice against lymphocytic choriomeningitis virus (Kle-
nerman and Zinkernagel 1998).
In some cases, antibodies from a first infection appear to enhance the
success of infection by later, cross-reacting strains (see references in
Ferguson et al. 1999). The mechanisms are not clear for many of these
cases, but the potential consequences are important. If cross-reactive
strains interfere with each other’s success, then populations of para-
sites tend to become organized into nonoverlapping antigenic variants
that define strains (Gupta et al. 1998). By contrast, if similar epitopes
enhance each other’s success, then well-defined strain clustering is less
likely (Ferguson et al. 1999).
Simultaneous infection by two related epitopes sometimes interferes
with binding by cytotoxic T cells. This interference, called altered pep-
tide ligand antagonism, has been observed in HIV, hepatitis B virus, and
Plasmodium falciparum (Bertoletti et al. 1994; Klenerman et al. 1994;
Gilbert et al. 1998). In P. falciparum, the MHC molecule HLA-B35 binds
two common epitopes of the circumsporozoite protein, cp26 and cp29,
but does not bind two other epitopes, cp27 and cp28 (Gilbert et al. 1998).
In hosts with HLA-B35, simultaneous infection with cp26 and cp29 ap-
pears to limit T cell responsiveness. In natural infections, hosts har-
bored both cp26 and cp29 variants more often than expected if epitopes
were distributed randomly between hosts. Gilbert et al. (1998) suggest
that the excess cp26-cp29 infections may have occurred because these
two epitopes act synergistically to interfere with T cell response.
3.6 Problems for Future Research
1. Measures of parasite fitness. The first section of this chapter de-
scribed how antigenic variation potentially extends the length of infec-
tion within a single host. Longer infections probably increase the trans-
mission of the parasites to new hosts, increasing the fitness of the par-
asites. Other attributes of infection dynamics may also contribute to
transmission and fitness. For example, the density of parasites in the
host may affect the numbers of parasites transmitted by vectors. If so,
then a good measure of fitness may be the number of parasites in the
host summed over the total length of infection. It would be interesting
to study experimentally the relations between infection length, parasite
abundance, and transmission success. These relations between parasite

30 CHAPTER 3
characters and fitness strongly influence how selection shapes antigenic
variation within hosts.
2. Interference between antigens in archival libraries of variants. Re-
ports of original antigenic sin and altered peptide ligand antagonism
have come from observations of antigenic variants generated by muta-
tion. It would be interesting to learn whether parasites with archival
variants also induce these phenomena. One might, for example, find
that some variants induce a memory response that interferes with the
host’s ability to generate a specific response to other variants. Thus,
the antigenic repertoire in archival libraries may be shaped both by the
tendency to avoid cross-reaction and by the degree to which variants
can interfere with the immune response to other variants.

PART II
MOLECULARPROCESSES

4 Specificity andCross-Reactivity
In this chapter, I describe the attributes of host and parasite molecules
that determine immune recognition. Two terms frequently arise in dis-
cussions of recognition. Specificity measures the degree to which the im-
mune system differentiates between different antigens. Cross-reactivity
measures the extent to which different antigens appear similar to the
immune system. The molecular determinants of specificity and cross-
reactivity define the nature of antigenic variation and the selective pro-
cesses that shape the distribution of variants in populations.
The first section discusses antibody recognition. The surfaces of par-
asite molecules contain many overlapping antibody-binding sites (epi-
topes). An antibody bound to an epitope covers about 15 amino acids
on the surface of a parasite molecule. However, only about 5 of the par-
asite’s amino acids contribute to the binding energy. A change in any
of those 5 key amino acids can greatly reduce the strength of antibody
binding.
The second section focuses on the paratope, the part of the antibody
molecule that binds to an epitope. Antibodies have a variable region of
about 50 amino acids that contains many overlapping paratopes. Each
paratope has about 15 amino acids, of which about 5 contribute most of
the binding energy for epitopes. Paratopes and epitopes define comple-
mentary regions of shape and charge rather than particular amino acid
compositions. A single paratope can bind to unrelated epitopes, and a
single epitope can bind to unrelated paratopes.
The third section introduces the different stages in the maturation
of antibody specificity. Naive B cells make IgM antibodies that typic-
ally bind with low affinity to epitopes. A particular epitope stimulates
division of B cells with relatively higher-affinity IgM antibodies for the
epitope. As the stimulated B cell clones divide rapidly, they also mu-
tate their antibody-binding regions at a high rate. Mutant lineages that
bind with higher affinity to the target antigen divide more rapidly and
outcompete weaker-binding lineages. This mutation and selection pro-
duces high-affinity antibodies, typically of type IgA or IgG.
34 CHAPTER 4
The fourth section describes “natural” antibodies, a class of naive IgM
antibodies. Each natural antibody can bind with low affinity to many dif-
ferent epitopes. Natural antibodies from different B cell lineages form
a diverse set that binds with low affinity to almost any antigen. One
in vitro study of HIV suggested that these background antibodies bind
to the viruses with such low affinity that they do not interfere with in-
fection. By contrast, in vivo inoculations with several different patho-
gens showed that the initial binding by natural antibodies lowered the
concentrations of pathogens early in infection by one or two orders of
magnitude.
The fifth section contrasts affinity and specificity. Poor binding condi-
tions cause low-affinity binding to be highly specific because detectable
bonds form only between the strongest complementary partners. By
contrast, favorable binding conditions cause low-affinity binding to de-
velop a relatively broad set of complementary partners, causing rela-
tively low specificity. The appropriate measure of affinity varies with
the particular immune process. Early stimulation of B cells appears to
depend on the equilibrium binding affinity for antigens. By contrast,
competition between B cell clones for producing affinity-matured anti-
bodies appears to depend on the dynamic rates of association between
B cell receptors and antigens.
The sixth section compares the cross-reactivity of an in vivo, poly-
clonal immune response with the cross-reactivity of a purified, mono-
clonal antibody. Polyclonal immune responses raise antibodies against
many epitopes on the surface of an antigen. Cross-reactivity declines lin-
early with the number of amino acid substitutions between variant anti-
gens because each exposed amino acid contributes only a small amount
to the total binding between all antibodies and all epitopes. By contrast,
a monoclonal antibody usually binds to a single epitope on the antigen
surface. Cross-reactivity declines rapidly and nonlinearly with the num-
ber of amino acid substitutions in the target epitope because a small
number of amino acids control most of the binding energy.
The seventh section discusses the specificity and cross-reactivity of
T cell responses. Four steps determine the interaction between para-
site proteins and T cells: the cellular digestion of parasite proteins, the
transport of the resulting peptides to the endoplasmic reticulum, the
binding of peptides to MHC molecules, and the binding of peptide-MHC
complexes to the T cell receptor (TCR). Mason (1999) estimates that each
SPECIFICITY AND CROSS-REACTIVITY 35
TCR cross-reacts with ∼105 different peptides. If a TCR reacts with a
specific peptide, then the probability that it will react with a second,
randomly chosen peptide is only ∼10−4. Thus, the TCR can be thought
of as highly cross-reactive or highly specific depending on the point of
view.
The eighth section lists the ways in which hosts vary genetically in
their responses to antigens. MHC alleles are highly polymorphic. The
germline genes that contribute to the T cell receptor have some poly-
morphisms that influence recognition, but the germline B cell receptor
genes do not carry any known polymorphisms.
The final section takes up promising lines of study for future research.
4.1 Antigens and Antibody Epitopes
An antigenic molecule stimulates an immune response. Each specific
subset of an antigenic molecule recognized by an antibody or a T cell
receptor defines an epitope. Each antigen typically has many epitopes.
For example, insulin, a dimeric protein with 51 amino acids, has on its
surface at least 115 antibody epitopes (Schroer et al. 1983). Nearly the
entire surface of an antigen presents many overlapping domains that
antibodies can discriminate as distinct epitopes (Benjamin et al. 1984).
Epitopes have approximately 15 amino acids when defined by spatial
contact of antibody and epitope during binding (Benjamin and Perdue
1996). Almost all naturally occurring antibody epitopes studied so far
are composed of amino acids that are discontinuous in the primary se-
quence but brought together in space by the folding of the protein.
The relative binding of a native and a mutant antigen to a purified
(monoclonal) antibody defines one common measure of cross-reactivity.
The native antigen is first used to raise the monoclonal antibody. C50mut
is the concentration of the mutant antigen required to cause 50% inhibi-
tion of the reaction between the native antigen and the antibody. Simi-
larly, C50nat is the concentration of the native antigen required to cause
50% inhibition of the reaction between the native antigen and the an-
tibody (self-inhibition). Then the relative equilibrium binding constant
for the variant antigen, C50nat/C50mut, measures cross-reactivity (Ben-
jamin and Perdue 1996).
Site-directed mutagenesis has been used to create epitopes that vary
by only a single amino acid. This allows measurement of relative binding
36 CHAPTER 4
caused by an amino acid substitution. Studies differ considerably in the
methods used to identify the amino acid sites defining an epitope, the
choice of sites to mutate, the amino acids used for substitution, and
the calculation of changes in equilibrium binding constants or the free-
energy of binding. Benjamin and Perdue (1996) discuss these general
issues and summarize analyses of epitopes on four proteins.
Five tentative conclusions about amino acid substitutions suffice for
this review. First, approximately 5 of the 15 amino acids in each epitope
strongly influence binding. Certain substitutions at each of these strong
sites can reduce the relative binding constant by two or three orders of
magnitude. These strong sites may contribute about one-half of the total
free-energy of the reaction (Dougan et al. 1998).
Second, the other 10 or so amino acids in contact with the antibody
may each influence the binding constant by up to one order of magni-
tude. Some sites may have no detectable effect.
Third, the consequences of mutation at a particular site depend, not
surprisingly, on the original amino acid and the amino acid used for
substitution.
Fourth, theoretical predictions about the free-energy consequences of
substitutions based on physical structure and charge can sometimes be
highly misleading. This problem often occurs when the binding location
between the antibody and a particular amino acid is highly accessible to
solvent, a factor that theoretical calculations have had difficulty incor-
porating accurately.
Fifth, antibodies raised against a particular epitope might not bind
optimally to that epitope—the antibodies sometimes bind more strongly
to mutated epitopes. In addition, antibodies with low affinity for an
antigen can have higher affinity for related antigens (van Regenmortel
1998).
4.2 Antibody Paratopes
An antibody contains a variety of binding sites. Each antibody binding
site defines a paratope, composed of the particular amino acids of that
antibody that physically bind to a specific epitope. Approximately 50
variable amino acids make up the potential binding area of an antibody
(van Regenmortel 1998). Typically, only about 15 of these 50 amino

SPECIFICITY AND CROSS-REACTIVITY 37
acids physically contact a particular epitope. These 15 or so contact
residues define the structural paratope. Only 5 or so of these amino
acids dominate in terms of binding energy. However, in both epitope
and paratope, substitutions both in and away from the binding site can
change the spatial conformation of the binding region and affect the
binding reaction (Wedemayer et al. 1997; van Regenmortel et al. 1998;
Lavoie et al. 1999).
The antibody’s 50 or so variable amino acids in its binding region
define many overlapping groups of 15 amino acids. Thus, an antibody
has a large number of potential paratopes. A paratope does not define
a single complementary epitope; rather it presents certain molecular
characteristics that bind antigenic sites with varying affinity. This leads
to four aspects of antibody-antigen specificity.
First, an antibody can have two completely independent binding sites
(paratopes) for unrelated epitopes (Richards et al. 1975). Bhattachar-
jee and Glaudemans (1978) showed that two purified mouse antibodies
(M384 and M870) each bind methyl α D-galactopyranoside and phos-
phorylcholine at two different sites in the antigen-binding region of the
antibody.
Second, an antibody presumably has many overlapping paratopes
that can potentially bind to a variety of related or unrelated epitopes. I
did not, however, find any studies that defined for a particular antibody
the paratope map relative to a set of variable epitopes. The potential
distribution of paratopes may change as a B cell clone matures in re-
sponse to challenge by a matching antigen—I take this up in the next
section (4.3), on Antibody Affinity Maturation.
Third, a single paratope can bind two unrelated epitopes (mimotopes,
Pinilla et al. 1999; Gras-Masse et al. 1999). Kramer et al. (1997) scanned a
library of synthetically generated peptides for competition in binding to
a monoclonal (purified) antibody. X-ray diffraction of three competing
peptides showed that they all bound to the same site on the antibody
(Keitel et al. 1997).
Fourth, a particular epitope can be recognized by two different par-
atopes with no sequence similarity. For example, Lescar et al. (1995)
used x-ray diffraction to study the physical contact between guinea fowl
lysozyme and two different antibodies. The two antibodies contact the
same 12 amino acids of the antigen. However, the antibodies have
38 CHAPTER 4
different paratopes with no identical amino acids in the region that binds
the antigen. The two antibodies also have different patterns of cross-
reactivity with other antigens.
Experimental studies of specificity frequently compare pairwise affini-
ties between an epitope and various paratopes or between a paratope
and various epitopes. In these pairwise measures, one first raises anti-
body to a monomorphic (nonvarying) antigenic molecule and then iso-
lates a single epitope-paratope binding—in other words, one raises a
monoclonal antibody that binds to a single antigenic site. Variations in
affinity are then measured for different epitopes holding the paratope
constant or for different paratopes holding the epitope constant.
Alternatively, one can challenge a host with a polymorphic popula-
tion of antigens. One controlled approach varies the antigens only in
a small region that defines a few epitopes (Gras-Masse et al. 1999). If
exact replicas of each epitope occur rarely, then antibodies will be se-
lected according to their binding affinity for the aggregate set of varying
epitopes (mixotopes) to which they match. This method may be a good
approach for finding antibodies with high cross-reactivity to antigenic
variants of a particular epitope.
4.3 Antibody Affinity Maturation
The host’s naive B cells make antibodies of the immunoglobulin M
class (IgM). An antibody is a secreted form of a receptor that occurs
on the surfaces of B cells. Each B cell clone makes IgM with different
binding characteristics—that is, the variable binding regions of the IgMs
differ. The host has a large repertoire of naive B cells that produce a
diverse array of IgM specificities.
An antigen on first exposure to a host will often bind rather weakly to
several of the naive IgM. Those B cell clones with relatively high-affinity
IgM for the antigen divide rapidly and come to dominate the antibody
response to the antigen.
The dividing B cell clones undergo affinity maturation for particular
epitopes. During this process, elevated mutation rates occur in the DNA
that encodes the antibody binding region. This hypermutation in divid-
ing B cell lineages creates a diversity of binding affinities. Those B cells
with relatively higher binding affinities are stimulated to divide more
SPECIFICITY AND CROSS-REACTIVITY 39
rapidly than B cells with lower affinities. This process of mutation and
selection creates high-affinity antibodies for the antigen.
The B cells that win the competition and produce affinity matured
antibodies switch from producing IgM to immunoglobulin G (IgG). This
class switch occurs by a change in the nonvariable region of the antibody
that is distinct from the variable binding region.
Wedemayer et al. (1997) studied the changes in the variable antibody
binding region during affinity maturation to a particular epitope. The
matured antibody had an affinity for the epitope 30,000 times higher
than the original, naive antibody. This increased affinity resulted from
nine amino acid substitutions during affinity maturation. Wedemayer
et al. (1997) found that the naive antibody significantly changed its shape
during binding with the epitope. By contrast, the mature antibody had
a well-defined binding region that provided a lock-and-key fit to the epi-
tope. Wedemayer et al. (1997) speculated that naive antibodies may have
more flexible binding regions in order to recognize a wide diversity of
antigens, whereas matured antibodies may develop relatively rigid and
highly specific binding sites.
Wedemayer et al.’s (1997) study suggests that naive IgM may bind a
broader array of antigens at lower affinity, whereas matured IgG may
bind a narrower array of antigens at higher affinity. Most analyses of
epitope binding focus on IgG antibodies that have been refined by affin-
ity maturation. Recently, attention has turned to the binding charac-
teristics and different types within the IgM class, including the natural
antibodies.
4.4 Natural Antibodies—Low-AffinityBinding to Diverse Antigens
Some purified antibodies bind to a wide array of self- and nonself-
antigens. These polyreactive antibodies are sometimes referred to as
natural or background antibodies because they occur at low abundance
independently of antigen stimulation (Avrameas 1991). Natural anti-
bodies are typically of the IgM class and have few mutations relative to
the germline genotype, suggesting that natural antibodies usually have
not gone through hypermutation and affinity maturation to particular
antigens (Harindranath et al. 1993).
40 CHAPTER 4
Chen et al. (1998) sampled the antibody repertoire of adult and new-
born humans. They tested B cells for ability to bind insulin and β-
galactosidase. Among adults, 21% of B cells bound insulin, 28% bound
β-galactosidase, and 11% bound both antigens. Among newborns, 49%
bound insulin, 54% bound β-galactosidase, and 33% bound both anti-
gens. They concluded that low-affinity background reactivity commonly
occurs in antibodies. Not surprisingly, newborns have a higher percent-
age of polyreactive antibodies than adults because adults have been ex-
posed to many challenges and have a higher percentage of specific IgG
antibodies.
Llorente et al. (1999) studied the natural antibody repertoire against
the gp120 antigen of HIV-1. Among uninfected human blood donors,
gp120 bound 2–5% of peripheral B cells. Llorente et al. (1999) analyzed
in more detail the full repertoire of a single uninfected donor. None of
the IgG isolates bound gp120, whereas 86% of the IgM clones bound the
HIV-1 antigen. The IgM binding affinities were low, about an order of
magnitude lower than a specific IgG antibody for gp120 that has been
through the affinity maturation process. The low-affinity IgM antibodies
did not inhibit in vitro infection by HIV-1. The authors suggested that
these polyreactive antibodies do not provide protection against infection
in vivo.
Ochsenbein et al. (1999) tested the role of natural antibodies in immu-
nity against infection. They compared the ability of antibody-free and
antibody-competent mice to resist infection against various viruses and
the bacterium Listerium monocytogenes. In early infection kinetics, the
pathogens were detected in concentrations one to two orders of magni-
tude lower in antibody-competent mice. Natural IgM but not IgG were
found against most of the pathogens tested. By contrast with Llorente
et al.’s (1999) conclusions, Ochsenbein et al. (1999) suggest that natu-
ral antibodies can help to contain infection during the early stages of
invasion.
4.5 Affinity versus Specificity
The consequences of antigenic variation depend on how the host’s
immune system recognizes and reacts to variants. For example, if host
immunity reacts in the same way to two parasite genotypes, then the

SPECIFICITY AND CROSS-REACTIVITY 41
host immune response does not exert differential effects of natural se-
lection on those variants.
The ability of host immunity to discriminate between antigenic vari-
ants can be measured in different ways. For the sake of discussion, I
focus on antibody-antigen binding. The same issues apply to any bind-
ing reaction.
An antibody’s equilibrium affinity for different antigens can be com-
pared by the relative inhibition tests described above in section 4.1,
Antigens and Antibody Epitopes. Measures of relative inhibition can be
easily translated into the free-energy difference in binding between an
antibody and two different antigens (Benjamin and Perdue 1996).
Dynamic rather than equilibrium aspects of affinity drive certain pro-
cesses in host immunity. For example, B cells compete for antigen to
stimulate clonal expansion and enhanced expression of the associated
antibodies. Several authors have argued that different processes influ-
ence the selection and maturation of antibodies during different phases
of the immune response (reviewed by Lavoie et al. 1999; Rao 1999).
Rao (1999) summarizes the argument as follows. The early stimula-
tion of B cells in response to initial exposure to an antigen depends on
relative equilibrium binding affinities of the B cell receptors and asso-
ciated antibodies. Those B cells that receive a threshold level of stim-
ulation increase secretion of antibodies. Typically, a variety of B cells
receive threshold stimulation. Thus, the early immune response tends
to produce diverse antibodies that recognize various epitopes.
By contrast, dynamic association rates of reaction rather than equi-
librium binding constants may determine the next phase of antibody
response. Rao’s (1999) lab compared antibodies that had developed in
response to two related antigens. These antibodies were isolated from
the later stages of the immune response and had therefore been through
affinity maturation. They found no detectable difference in the equilib-
rium binding affinities of an antibody to the antigen to which it was
raised versus the other antigenic variant. By contrast, the on-rates of
antigen binding did differ.
Apparently, those B cell receptors with higher rates of antigen acqui-
sition outcompete B cell receptors with lower rates of acquisition. This
makes sense because affinity maturation occurs when the B cell clones
are highly prone to apoptosis (suicide) unless they receive positive stim-
ulation. Thus, the selection process during affinity maturation tends
42 CHAPTER 4
to optimize antigen acquisition rates rather than equilibrium binding
constants.
Other studies have also analyzed the maturation of antibody binding
properties during the course of an immune response (reviewed by Lavoie
et al. 1999). Those studies also found differences in how the affinity
constants and rates of association and dissociation changed over time.
The appropriate type of affinity and measure of immune recognition
depend on the dynamic processes of the immune response. I take this
up in more detail in chapter 6.
Specificity defines another dimension of immune recognition. Speci-
ficity is the degree to which an immune response discriminates between
antigenic variants. A simple approach measures the relative binding
affinities of purified antibodies or T cell receptors for different antigens.
Discrimination depends on the range of parasite variants bound, on the
binding affinity, and on the stringency of the conditions under which
one conducts the assay.
Figure 4.1 shows that relatively low-affinity binding can often pro-
vide greater specificity when measured at intermediate stringency. This
occurs because low-affinity receptors bind fewer kinds of antigens as
conditions limit the assay’s sensitivity for low-affinity binding. Thus,
the relative specificity of different antibodies or T cells depends on both
affinity and conditions of measurement.
4.6 Cross-Reaction of PolyclonalAntibodies to Divergent Antigens
I have discussed the cross-reactivity of a particular antibody to anti-
genic variants and the extent to which a particular antigenic variant re-
acts with different antibodies. These issues focus on the affinity and
specificity of particular binding reactions when one perturbs either the
antibody or the antigen. For example, affinity decreases in a highly non-
linear way with amino acid substitutions in either the antibody or the
antigen. Substitutions in just a few key amino acids can reduce the equi-
librium binding constants by several orders of magnitude.
Those studies of affinity and specificity were typically conducted with
purified (monoclonal) antibodies of a single type. By contrast, the im-
mune response to an antigen often raises many different antibodies to
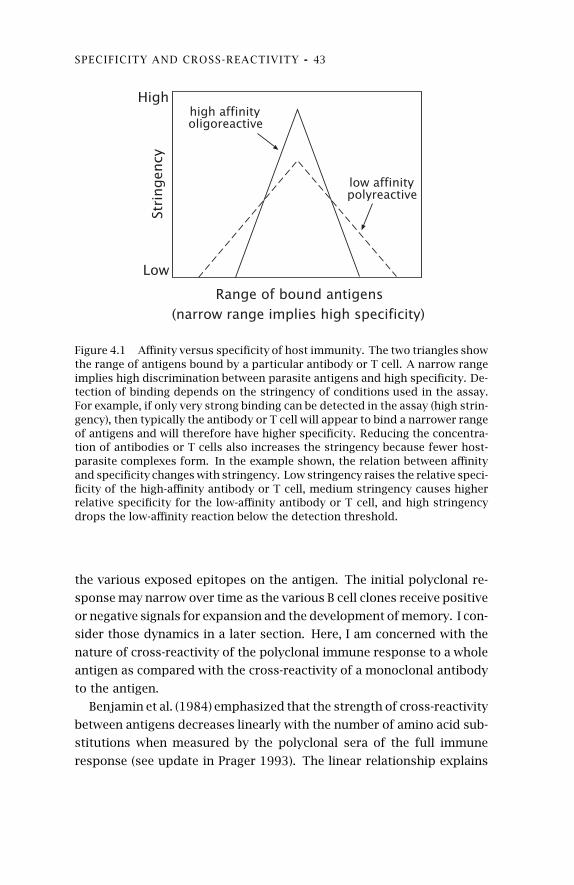
SPECIFICITY AND CROSS-REACTIVITY 43
Range of bound antigens(narrow range implies high specificity)
Stri
ngen
cy
Low
High
low affinitypolyreactive
high affinityoligoreactive
Figure 4.1 Affinity versus specificity of host immunity. The two triangles showthe range of antigens bound by a particular antibody or T cell. A narrow rangeimplies high discrimination between parasite antigens and high specificity. De-tection of binding depends on the stringency of conditions used in the assay.For example, if only very strong binding can be detected in the assay (high strin-gency), then typically the antibody or T cell will appear to bind a narrower rangeof antigens and will therefore have higher specificity. Reducing the concentra-tion of antibodies or T cells also increases the stringency because fewer host-parasite complexes form. In the example shown, the relation between affinityand specificity changes with stringency. Low stringency raises the relative speci-ficity of the high-affinity antibody or T cell, medium stringency causes higherrelative specificity for the low-affinity antibody or T cell, and high stringencydrops the low-affinity reaction below the detection threshold.
the various exposed epitopes on the antigen. The initial polyclonal re-
sponse may narrow over time as the various B cell clones receive positive
or negative signals for expansion and the development of memory. I con-
sider those dynamics in a later section. Here, I am concerned with the
nature of cross-reactivity of the polyclonal immune response to a whole
antigen as compared with the cross-reactivity of a monoclonal antibody
to the antigen.
Benjamin et al. (1984) emphasized that the strength of cross-reactivity
between antigens decreases linearly with the number of amino acid sub-
stitutions when measured by the polyclonal sera of the full immune
response (see update in Prager 1993). The linear relationship explains
44 CHAPTER 4
80% or more of the total variation in cross-reactivity between phyloge-
netically diverged variants of proteins such as myoglobin. Other major
studies have focused on lysozyme c and cytochrome c.
The linear relationship between polyclonal cross-reactivity and amino
acid substitutions arises because the surface of a protein antigen ap-
pears to present a nearly continuous and overlapping set of epitopes.
Each exposed amino acid probably contributes only a small amount to
the total binding between all antibodies and all epitopes.
4.7 T Cell Epitopes
Antibodies bind directly to free pathogens in the blood, lymph, or
mucosal surfaces. Antibodies cannot get at intracellular pathogens. To
fight intracellular infections, the host uses cell-mediated defenses spear-
headed by the cytotoxic T lymphocytes (CTL), also referred to as CD8+ T
cells. The entire pathway leading to a CTL response against a pathogen
has several components that act as regulatory checks and balances. But
the bottom line often amounts to CTLs killing host cells that contain
specific epitopes of intracellular pathogens.
I start with a brief outline of specific recognition and then expand
on the key issues. First, host cells cut up the proteins of an intracellu-
lar pathogen. Second, transporter of antigen presentation (TAP) moves
peptides from the cytosol to the endoplasmic reticulum. Third, some
of these cut-up peptides bind to the host cell’s major histocompatibility
complex (MHC) class I molecules. Fourth, peptide-MHC complexes move
to the cell surface, exposing the bound peptide to the outside. Fifth, the
T cell receptors (TCR) on free T cells can bind to certain peptide-MHC
combinations. Sixth, if the TCRs of some CTLs bind pathogen peptide-
MHC complexes on the surface of a cell, and some supporting signals
prevail, then the CTLs kill the host cell.
Several variations on T cell immunity occur. But this scenario cap-
tures the essential features of specific recognition: cutting pathogen
peptides, transporting peptides to the endoplasmic reticulum, binding
of pathogen peptides to class I MHC, presentation on cell surfaces, and
binding of specific TCRs to the peptide-MHC complex (Deng et al. 1997;
Davis et al. 1998; Germain and Štefanová 1999).
The last part of this section addresses the relation between specificity
and cross-reactivity for the TCR. On the one hand, each TCR probably
SPECIFICITY AND CROSS-REACTIVITY 45
cross-reacts widely with different epitopes. On the other hand, T cell
responses appear to be highly specific—variant epitopes often avoid the
T cell response generated against the initial challenge. The resolution
may follow from numerical considerations. Each TCR reacts with many
different epitopes, perhaps as many as 105 different peptides. However,
if a TCR reacts with one epitope, then the probability that it reacts with
another, randomly chosen epitope may be as low as 10−4 because of
the large number of possible epitopes. In terms of the total number of
epitopes bound, TCRs appear widely cross-reactive, but in terms of the
frequency of epitopes bound, TCRs appear highly specific.
INTRACELLULAR PEPTIDE PROCESSING AND TRANSPORT
MHC class I molecules typically bind peptides with 8–10 amino acids.
Any short peptide within any pathogen protein is a candidate for MHC
binding. Peptides have polarity, with carboxyl (C-terminal) and amino
(N-terminal) ends. Many processes cut proteins into shorter peptides,
but the proteasomes seem to be particularly important for generating
peptides of the right length for MHC presentation (Rock and Goldberg
1999; York et al. 1999). Proteasome digestion creates a nonrandom pop-
ulation of peptides relative to the potential set defined by the amino acid
sequence of whole proteins. Digestion appears to be particularly spe-
cific for the C-terminal cut, less so for the N-terminal cut (Niedermann
et al. 1999).
The MHC class I molecules have biases for certain amino acids at the
C-terminal site of peptides (Rammensee et al. 1995). Niedermann et al.
(1999) have shown a correlation between the preferred C-terminal cuts
of proteasome digestion and the favored C-terminal amino acids bound
by MHC class I molecules. Thus, the proteasomes appear to be prefer-
entially generating peptides that can be presented by MHC.
A peptide that binds MHC with relatively high affinity may not be
generated in sufficient quantity to be a dominant epitope for immune
recognition. In vitro studies of proteasome digestion provide the easiest
way to quantify peptide generation. Although in vivo results may differ,
the preliminary data from in vitro studies provide interesting hints. For
example, mice were immunized with chicken ovalbumin, and the CTL
response was studied by in vitro reactions with peptides presented by
the class I MHC molecule Kb. The peptide Ova257SIINFEKL264 dominated
46 CHAPTER 4
the CTL response (Chen et al. 1994; Niedermann et al. 1995), where the
capital letters define the peptide sequence based on the single-letter
amino acid code and the subscripts give the location of the peptide
within the primary sequence of the protein. A secondary, weaker re-
sponse to Ova55KVVRFDKL62 can be generated under some conditions.
Dick et al. (1994) found that proteasome digestion of full-length oval-
bumin proteins yielded Ova257SIINFEKL264 but not Ova55KVVRFDKL62.
Niedermann et al. (1995, 1996) studied in detail the proteasome diges-
tion patterns of synthetic peptides with 22 or 44 amino acids contain-
ing the two potential epitopes. They found major cleavage sites at the
two ends of the dominant Ova257SIINFEKL264 epitope and relatively lit-
tle cleavage within the epitope. By contrast, a dominant cleavage site
occurred between amino acids 58 and 59 of Ova55KVVRFDKL62, yield-
ing only traces of the intact epitope. Several other studies reviewed by
Niedermann et al. (1999) support the hypothesis that proteasomal di-
gestion frequently reduces the number of copies of potential epitopes
sufficiently to prevent a strong CTL response.
It may eventually be possible to predict the probabilities of protea-
somal cleavage sites (Niedermann et al. 1999). However, many factors
influence the concentration of different peptides available for MHC bind-
ing. For example, sequences flanking antigenic peptides influence cleav-
age (Yewdell and Bennink 1999). Interferon-γ changes the distribution
of proteases affecting antigenic peptide production, perhaps enhancing
peptides with MHC binding motifs (York et al. 1999). TAP transports
different peptides at different rates from the cytosol to the endoplas-
mic reticulum, where MHC class I binding of peptides occurs (Yewdell
and Bennink 1999).
I have focused on the MHC class I molecules, which are present in
many cell types. By contrast, MHC class II molecules operate in spe-
cialized antigen-presenting cells. Those cells take in antigen from the
outside environment, process the proteins into peptides, bind peptides
to MHC class II molecules, and present the peptide-MHC complexes on
the cell surface. These peptide–class II complexes bind to a subset of
CD4+ T cells with specific, matching T cell receptors. The CD4+ cells
are often called helper T cells because they provide stimulation to CTLs
or to B cells and antibody production.
Different cellular locations and proteases occur in the MHC class I
and class II pathways. Nakagawa and Rudensky (1999) and Villadangos
SPECIFICITY AND CROSS-REACTIVITY 47
et al. (1999) review the proteases involved in class II peptide processing.
Kropshofer et al. (1999) review transport and loading of peptides onto
class II molecules.
INTRACELLULAR PRODUCTION AND EXOGENOUS UPTAKE OF ANTIGENS
The timing and quantity of production for different antigens in in-
fected cells has received relatively little attention (Schubert et al. 2000),
but certainly affects the influx of peptides available for MHC binding.
In addition, exogenous antigens may be taken up by antigen-presenting
cells and carried to lymphoid tissue for presentation to T cells (Schu-
macher 1999; Sigal et al. 1999). Intracellular production and exogenous
uptake of antigens most likely influence the distribution of epitopes
presented to T cells.
PEPTIDE-MHC BINDING
The class I MHC molecules bind peptides of 8–10 amino acids. For
peptides with 9 amino acids (nonamers), the 20 different amino acids
that can occur at each site combine to make 209 = 512× 109 different
peptide sequences. The human genome has three loci with class I mol-
ecules that present to CTLs. These loci are highly polymorphic; thus,
each diploid individual typically carries six different class I alleles for
CTL presentation. Clearly, if the molecules encoded by these six alleles
are to bind and present a reasonable fraction of parasite peptides, then
each molecule must bind to a large diversity of peptides.
Class I binding is indeed highly degenerate with regard to peptide se-
quence. Yewdell and Bennink (1999) estimate that each molecule binds
approximately 1/200 of the possible peptide sequences, or on the or-
der of roughly 107 different nonamers. An individual with six different
alleles binds approximately 6/200 = 3% of candidate peptides. Here,
binding means with sufficient affinity to stimulate a CTL response.
The specificity of MHC binding influences which parasite epitopes
dominate an immune response. Current understanding of MHC bind-
ing is rather crude. Prediction of which parasite sequences would bind
strongly to MHC molecules might help in vaccine design and in under-
standing the different patterns in immune response between different
individuals. Given this widespread interest, the field is moving rapidly.

48 CHAPTER 4
The three human class I loci that present to CTLs have 614 currently
known alleles (http://www.anthonynolan.com/HIG/index.html). Many
of the MHC molecules have been characterized by a specific binding
motif—the amino acid sequence pattern to which they typically bind
(Marsh et al. 2000).
Buus (1999) reviews the different methods to estimate binding motif
and alternative techniques for prediction of binding. Details vary for the
different alleles, but often an MHC class I molecule has two anchor posi-
tions near the ends of the peptide among the 9 or so amino acids of the
peptide. Each anchor position has a favored amino acid or sometimes
a limited set of alternatives. However, prediction based on anchor posi-
tions is only moderately successful; about 30% of peptides carrying the
predicted motif actually bind, and sequences lacking anchor residues
can bind. More complex statistical approaches have improved predic-
tion above 70%.
Class II molecules also bind a region of about 10 amino acids. How-
ever, by contrast to class I molecules, the class II molecules have open-
ended binding grooves, allowing class II molecules to bind peptides of
varying lengths in which differing numbers of amino acids hang out of
each end of the groove (Marsh et al. 2000). These varying peptide lengths
have made it difficult to establish binding motifs; thus relatively less is
known about class II binding.
Class II molecules appear to be less specific (more degenerate) in their
binding compared with class I molecules (Marsh et al. 2000). A few
detailed studies of class II binding have been developed (e.g., Latek and
Unanue 1999). It may be that class II’s relatively less specific binding
has to do with its role in stimulating helper T cells that regulate the
immune response rather than in directly killing parasites, but there is
little evidence for this at present.
The class I and class II molecules bind only to peptides. Recent work
has shown that the CD1 MHC system presents lipids and glycolipids
to T cells, providing an opportunity for T cell response to nonprotein
antigens (Porcelli and Modlin 1999; Prigozy et al. 2001). No doubt this
system plays some role in immunity, but its relative importance is not
clear at present.

SPECIFICITY AND CROSS-REACTIVITY 49
T CELL RECEPTOR BINDING TO PEPTIDE-MHC COMPLEXES
The immune system can generate highly specific memory responses
against particular antigens. For example, first infection by a measles
virus typically leads to symptomatic infection and eventual clearance.
Second infection rapidly induces specific antibody and T cell responses
based on a pool of memory cells from prior infection. This type of ob-
served memory response naturally led to the belief that TCR recognition
is highly specific for particular epitopes. However, recent work demon-
strated that the TCR binds in a highly degenerate way, each TCR binding
on the order of 104–107 different epitopes (Mason 1999). In addition,
limited data suggest that a single peptide stimulates several different T
cell clones (Maryanski et al. 1997; Mason 1999). However, different stud-
ies and different methods have given variable estimates for the number
of clones stimulated by a single peptide (Yewdell and Bennink 1999).
How can the TCR binding be so degenerate, yet the immune response
be so specific? Most of the details are not understood at present, but
some reasonable hypotheses are beginning to take shape.
I first review relevant aspects of T cell binding. The TCR on CTLs
(CD8+ T cells) binds to peptide-MHC class I complexes presented on the
surface of most cell types. The TCR on the helper (CD4+) T cells binds to
peptide-MHC class II complexes presented on the surface of specialized
antigen-presenting cells. Binding and signal strength are quantitative
factors, but again I use binding qualitatively to mean sufficient signal
strength to stimulate a T cell response against an epitope.
Now consider some magnitudes with regard to the problem of rec-
ognition (Mason 1999). Define T as the number of T cell clones with
different TCRs in the naive T cell repertoire, T(p) as the number of T
cell clones that respond to the same peptide, N as the number of pos-
sible peptides to be recognized, and P(t) as the number of different
peptide-MHC complexes recognized by a particular TCR. Thus,
T (p)×N = P (t)× T, (4.1)
because both sides describe the total number of recognition specificities
over all T cell clones. Immune response probably depends more on the
frequencies of T cell clones that respond to particular peptides, F(p) =T(p)/T , rather than total numbers of clones in the body, so it is also

50 CHAPTER 4
useful to write
F (p) = P (t) /N, (4.2)
which shows that the frequency of T cell clones responding to a partic-
ular peptide equals the frequency of presented peptides stimulating a
particular T cell clone. If we assume that, in the naive T cell repertoire,
each clone with a unique TCR has about the same number of cells, then
F(p) is also the frequency of individual T cells that respond to a particu-
lar peptide. Equation (4.2) can be rewritten to emphasize cross-reactivity
of the TCR as
P (t) = F (p)×N, (4.3)
which is the probability that if a T cell receptor binds one epitope, then
it also binds to a second, randomly chosen epitope.
The number of possible specificities, N, for peptides with n amino
acids, is 20n×S, where S is the fraction of peptides that can be presented
by MHC alleles. Considering nonamers with n = 9, and setting S ≈ 10−2
as discussed above for MHC binding, we have N ≈ 209×10−2 = 5×10⁹.
The lower bound for F(p), the frequency of T cell clones that respond
to a peptide, occurs when every T cell is unique and each peptide stim-
ulates only a single T cell. Mice have about 108 T cells, so the minimum
value of F(p) is 10−8, and thus, from equation (4.3), the minimum value
for the number of peptides bound by a TCR is P(t) ≈ 50. This is cer-
tainly a gross underestimate, because each TCR clone has more than
one cell on average, and each peptide likely stimulates more than one
clone. Nonetheless, this extreme case shows that the magnitude of the
recognition problem demands some degeneracy in TCR binding in mice.
Mason (1999) suggests that a more realistic description follows if one
accepts the experimental estimate by Butz and Bevan (1998) that, in
the naive repertoire, three different viral epitopes each stimulated a fre-
quency F(p) ≈ 10−4 of mouse CTL cells. In a mouse with 107–108 naive
CTLs, this gives an estimate of 103–104 CTLs potentially responding to
each epitope. Using F(p) = 10−4 in equation (4.3) gives the number of
peptides bound by a single TCR as P(t) ≈ 5× 10⁵, a value that is in line
with other estimates obtained by various methods (Mason 1999).
The estimated frequency F(p) ≈ 10−4 based on Butz and Bevan (1998)
refers to the frequency of individual T cells responding to a peptide. It
was not clear from that study how many different T cell clones were
involved. It is challenging to estimate the number of different clones
SPECIFICITY AND CROSS-REACTIVITY 51
from the naive repertoire that respond to a particular peptide, although
recent technical breakthroughs may soon provide more data (Yewdell
and Bennink 1999). Among the better studies available, Maryanski et al.
(1996) estimated that an epitope from the human class I molecule HLA-
CW3 stimulated fifteen to thirty different T cell clones in a mouse. The
response in this case may have been limited because the human MHC
molecule is similar to mouse MHC molecules, causing the tested peptide
to be seen as similar to a self-peptide of the mouse. In another study
by the same research group, the clonal diversity of CTLs responding to
a Plasmodium berghei peptide was much higher than against HLA-CW3,
but the methods did not permit a comparable estimate for the number
of clones (Jaulin et al. 1992).
Humans have about 1011 T cells compared with about 108 T cells in
mice. If the frequency, F(p), of T cells responding to a peptide is about
the same in humans as in mice, then, from equation (4.3), the cross-
reactivity of each TCR receptor, P(t), is about the same in humans as
in mice. The value estimated above is each TCR binding P(t) ≈ 5× 10⁵
different peptides.
How can such high cross-reactivity be reconciled with observed speci-
ficity? First, the probability of any particular T cell cross-reacting with
two different epitopes remains low. If a T cell reacts with one epitope,
the probability that it reacts with a second, randomly chosen epitope is
P(t)/N ≈ 10−4.
Second, the observed specificity has to do with the number of differ-
ent T cell clones that actually expand in response to an epitope. The
number of expanding clones is certainly lower than the potential set of
clones that bind sufficiently strongly to stimulate a response (Yewdell
and Bennink 1999). Competition between clones for the epitope and
for other stimulatory signals limits clonal expansion. I return to this
topic in chapter 6. Here I simply note that the broad and highly cross-
reactive repertoire of the naive T cells may be important for fighting
primary exposure, much as the natural antibodies provide background
protection against first infection. The secondary or memory response
may be much narrower because it is limited to those binding clones that
received additional stimulatory signals during primary infection.
52 CHAPTER 4
SUMMARY OF T CELL EPITOPES
Yewdell and Bennink (1999) calculate an overall probability of 1/2,000
for a peptide of a foreign antigen to stimulate a dominant CTL response.
By their calculation only ∼1/5 of potential epitopes survive proteolytic
digestion and transport to the endoplasmic reticulum for loading onto
MHC molecules; of these, only ∼1/200 bind MHC molecules above the
threshold affinity required for immunogenicity; finally, limitations in
the TCR repertoire for binding peptide-MHC complexes cause ∼1/2 of
presented peptides to stimulate a response. This is only a very rough
approximation based on the limited data available.
MHC presentation and TCR binding are just the first steps in a T cell
response. Typically, several TCRs may receive sufficient stimulation, but
only a subset continue to develop strong clonal expansion. I discuss the
factors that influence which clones do and do not expand in chapter 6.
4.8 Every Host Differs
The epitopes that stimulate an immune response depend on an inter-
action between the host and parasite. Different hosts vary in several at-
tributes of immune recognition; thus the dominant epitopes will change
from one host to the next even for an unvarying parasite.
The MHC class I and II molecules are the most strikingly polymor-
phic of all human loci. The three main class I loci for presenting pep-
tides, designated A, B, and C, currently have 175, 349, and 90 alleles de-
scribed, respectively. The class II molecules have separate designations
for individual components of each molecule. The highly polymorphic
components tend to be in the β1 chains that contact bound peptides
(Marsh et al. 2000). The β1 chains for the DR, DQ, and DP class II mole-
cules currently have 246, 44, and 86 alleles described, respectively. The
IMGT/HLA on-line database lists recent allelic counts, as described in
Robinson et al. (2000).
The MHC molecules shape the TCR repertoire. As T cells mature in
the thymus, they bind to MHC molecules presenting self-antigens. Those
TCRs that bind too strongly cause the associated T cells to die. Those
TCRs that bind too weakly fail to provide sufficiently strong reinforcing
signals, again causing the associated T cells to die. Fewer than 1% of T
cells pass these checks to survive (Marsh et al. 2000). Thus, the naive

SPECIFICITY AND CROSS-REACTIVITY 53
TCR repertoire is strongly influenced by the particular MHC alleles of
each individual. The individual naive repertoires lead to different TCR
clones being stimulated in different individuals when challenged by the
same epitope (Maryanski et al. 1996, 1999). Because helper T cells in-
fluence antibody response and other aspects of immune regulation, the
variable TCR repertoire may have additional consequences beyond CTL
variability.
Proteolysis of antigens and transport of peptides determine the pep-
tides available for MHC binding. Strong challenge by a particular par-
asite could lead to selection favoring or disfavoring specific patterns
of proteolysis. However, I am not aware of any evidence for protea-
some polymorphism. The peptide transporter, TAP, is polymorphic:
the two subunits TAP1 and TAP2 have six and four sequences listed
in the IMGT/HLA database (Robinson et al. 2000). So far, no functional
differences among alleles have been found (Marsh et al. 2000).
Somatic mutation and recombination between various germline loci
generate the DNA that encodes the TCR (Janeway et al. 1999). These
generative mechanisms allow each individual to produce a huge variety
of TCR binding specificities. The intensity of direct selection on germline
polymorphisms may be rather weak because the somatic mechanisms of
variation and selection shield the germline from the selective processes
imposed by diverse antigens. However, the germline alleles do set the
initial conditions on which somatic processes build, so it is certainly
possible that germline polymorphisms influence individual tendencies
to react to particular antigens.
The limited data available show some germline polymorphisms for
the TCR (e.g., Reyburn et al. 1993; Hauser 1995; Moffatt et al. 1997;
Moody et al. 1998; Sim et al. 1998; see also http://imgt.cines.fr). One
interesting study found an interaction between a human germline poly-
morphism in a subunit of the TCR (VA8.1) and an MHC class II poly-
morphism (HLA-DRB1) (Moffatt et al. 1997). The authors analyzed two
variants of the VA8.1 allele and the six most common HLA-DRB1 alle-
les. Individuals with enhanced allergic response to a dust mite antigen
tended to have one of the two VA8.1 variants combined with the HLA-
DRB1*1501 allele.
Moffatt et al. (1997) measured allergic response by the titer of IgE an-
tibodies, which are known to be directly involved in stimulating allergic
symptoms (Janeway et al. 1999). Most likely, the TCR and MHC class II
54 CHAPTER 4
polymorphisms influence IgE via helper T cells, because TCR binding to
antigens presented by MHC class II stimulate helper T cells, and such T
cell response is typically required for antibody stimulation. Thus, spe-
cific recognition by the TCR and MHC can affect specific recognition by
antibodies.
The B cell receptor (BCR) is generated by a process of somatic re-
combination and mutation similar to the process that generates TCRs.
Antibodies are secreted forms of the BCR. I did not find any comparable
reports of germline variation in the alleles that make up the components
of the BCR. Hauser (1995) suggested that somatic hypermutation (affin-
ity maturation) of the BCR protects the germline from direct selection.
The TCR has limited somatic mutation after the initial genetic recom-
binations, perhaps exposing germline TCRs to more intense selective
pressures than BCRs. However, the difference may simply reflect less
study of the BCR germline genes.
Finally, a complex network of quantitative or threshold signals regu-
lates many aspects of the immune response. Quantitative aspects of im-
mune regulation probably also vary among individuals. Those variable
regulatory controls may influence different hosts’ specific responses to
antigens, because response often depends on a cascade of quantitative
signals triggered by an antigen. Thus, it seems likely that variable pat-
terns of specific recognition between individuals will be influenced by
quantitative variability in regulatory control.
4.9 Problems for Future Research
1. Recognition by naive versus affinity-matured antibodies. Wede-
mayer et al.’s (1997) study suggests that naive IgM and affinity-matured
IgA/IgG antibodies differ in the nature of the antibody-epitope bond.
IgM antibodies may have rather flexible binding regions that significantly
change shape when attaching to an epitope. By contrast, the affinity-
matured antibodies seem to have relatively rigid, well-defined binding
regions that provide a highly specific lock-and-key fit to the epitope. I
suspect that an epitope must change more drastically to escape from
flexible IgM binding than from the more rigid IgA/IgG binding. Thus,
naive and affinity-matured antibodies may impose different selective
pressures on the molecular changes between antigenic variants.
SPECIFICITY AND CROSS-REACTIVITY 55
Affinity-matured antibodies in a memory response probably play the
dominant role in blocking repeat infection by most pathogens (Janeway
et al. 1999; Plotkin and Orenstein 1999). But some parasites may be
more strongly limited by naive antibodies. For example, IgM antibod-
ies seem to play the dominant role in fighting a sequence of different
antigenic variants of the spirochete Borrelia hermsii (Barbour and Bun-
doc 2001). This parasite switches its antigenic surface molecules dur-
ing a single infection. The parasite achieves this by occasionally copy-
ing into a single expression site different genes for antigenic variants
stored within the genome. In this case, the major selective pressure dif-
ferentiating antigenic variants most likely concerns cross-reaction with
previously expressed variants during the same infection cycle.
In a parasite that rapidly switches antigenic variants, a particular
epitope may need relatively more changes in amino acid composition
to escape cross-reaction with naive IgM antibodies. By contrast, other
pathogens may require relatively fewer amino acid changes to escape
affinity-matured IgA/IgG antibodies.
It would be valuable to have more data on the degree to which IgM
or affinity-matured antibodies dominate against different parasites. The
IgM response may dominate only against parasites that present to the
host a rapid sequence of antigenic variants. In those cases, escape from
IgM rather than affinity-matured antibodies may determine the molecu-
lar changes needed for antigenic variants to escape cross-reactivity.
2. Binding stringency affects the affinity-specificity relationship. Fig-
ure 4.1 shows how specificity and cross-reactivity change with inter-
actions between binding affinity and binding stringency. The degree
of cross-reactivity determines how much molecular change parasites
require to escape immune pressure directed against related antigens.
Thus, the combined effects of binding affinity and stringency influence
cross-reactivity, which in turn shapes molecular aspects of antigenic
variation.
Controlled experiments in vitro could apply monoclonal antibodies
with different affinities to cultured parasites under different binding
stringencies. The type of molecular change required to escape immune
pressure should vary in response to interactions between stringency and
affinity.
56 CHAPTER 4
3. Equilibrium versus kinetic aspects of affinity. Different stages of the
immune response probably depend on different aspects of binding affin-
ity to antigens. For example, clearance of antigens by antibodies may
depend on the equilibrium affinity of antibody-epitope bonds, whereas
the relative stimulation of different B cell lineages may depend on ki-
netic rates of association with antigens. Different kinetic consequences
probably follow from different molecular attributes of binding between
immune effectors and antigens. Complete understanding of antigenic
variation requires one to trace the chain: types of molecular variation
→ aspects of binding kinetics → control of the immune response.

5 GenerativeMechanisms
In this chapter, I summarize the different ways in which parasites gen-
erate antigenic variants. The amount of new variation and the kinds
of new variants influence antigenic polymorphism and the pace of evo-
lutionary change (Moxon et al. 1994; Deitsch et al. 1997; Fussenegger
1997).
The first section describes baseline mutation rates and special hyper-
mutation processes that raise rates above the baseline. Microbial muta-
tion rates per nucleotide decline with increasing genome size, causing
a nearly constant mutation rate per genome per generation of about
0.003. Genome-wide hypermutation can raise the mutation rate at all
sites within the genome. Such mutator phenotypes probably have al-
tered replication enzymes. Low frequencies of mutator phenotypes have
been observed in stable populations of Escherichia coli, whereas fluctu-
ating populations appear to maintain higher frequencies of mutators.
In some cases, hypermutation may be targeted to certain genes by DNA
repeats and other DNA sequence motifs that promote local replication
errors.
The second section presents three common mechanisms that para-
sites use to change gene expression between antigenically variable cop-
ies of a gene, potentially allowing escape from immune recognition.
Replication errors of short nucleotide repeats can alter regulatory se-
quences or disrupt translation of coding sequences. Gene conversion
can copy variant genes from different genomic locations into a single ex-
pression site. Invertible pieces of DNA occasionally change the direction
of nucleotide sequences, altering the expression of nearby genes. Dif-
ferent Plasmodium species have different families of antigenically vari-
able surface molecules. The mechanisms by which Plasmodium species
switch expression between antigenic variants are not fully understood.
The third section focuses on parasites that store antigenic variants
within each genome. Some parasite genomes have dozens or hundreds
of variants but express only one archival copy at a time. Intragenomic
recombination between archived copies may create new variants. Stud-
ies of the spirochete Borrelia hermsii and the protozoan Trypanosoma
brucei provide evidence of recombination between archival copies.
58 CHAPTER 5
The fourth section lists different mechanisms that can mix genetic
material between lineages of parasites to create new antigenic variants.
Segregation brings together in one individual different chromosomes
from distinct lineages. Intergenomic recombination mixes genetic se-
quences from different lineages. Horizontal transfer moves pieces of
DNA from one individual into another by processes such as bacterial
uptake of naked DNA from the environment.
The final section outlines promising topics of study for future re-
search.
5.1 Mutation and Hypermutation
There are many different ways to measure mutation rates and many
different processes that influence mutations (Drake et al. 1998). I fo-
cus in this section on errors in nucleotide replication that change the
antigenic properties of the encoded molecule.
BASELINE MUTATION RATES
RNA virus populations typically have high frequencies of mutants and
often evolve rapidly (Holland 1992; Knipe and Howley 2001). However,
few studies have provided direct estimates of mutation rates. The lim-
ited data suggest relatively high mutation rates on the order of 10−4–
10−5 per base per replication (Holland 1992; Coffin 1996; Preston and
Dougherty 1996; Drake et al. 1998; Drake and Holland 1999).
Drake et al. (1998) summarized mutation rates for various microbes
with DNA chromosomes (table 5.1). The table shows an amazingly con-
sistent value of approximately 0.003 mutations per genome per genera-
tion. This value holds over genomes that vary in total size by four orders
of magnitude; consequently the per base mutation rates also vary over
four orders of magnitude.
GENOME-WIDE HYPERMUTATION
None of the microbes in table 5.1 face intense, constant selective pres-
sure on antigens imposed by vertebrate immunity—it is unlikely that E.
coli depends on antigenic variation to avoid clearance from its hosts.
It would be interesting to know if pathogens under very intense selec-
tion by host immunity have higher baseline mutation rates than related
microbes under less intense immune pressure.
GENERATIVE MECHANISMS 59
Table 5.1 Mutation rates per replication in various microbes
Organism G µb µg
Bacteriophage M13 6.4× 10³ 7.2× 10⁻⁷ 0.0046Bacteriophage λ 4.9× 10⁴ 7.7× 10⁻⁸ 0.0038Bacteriophages T2 & T4 1.7× 10⁵ 2.4× 10⁻⁸ 0.0040Escherichia coli 4.6× 10⁶ 5.4× 10⁻¹⁰ 0.0025Saccharomyces cerevisiae 1.2× 10⁷ 2.2× 10⁻¹⁰ 0.0027Neurospora crassa 4.2× 10⁷ 7.2× 10⁻¹¹ 0.0030Mean 0.0034
Values are from Drake et al. (1998). All microbes listed here have DNA chromo-somes. G is the total number of bases in the genome, µb is the mutation rateper base per replication, and µg is the mutation rate per genome per replication.
High genome-wide mutation rates arise in bacteria by spontaneous
mutator mutations, in which the mutator alleles raise the error rate
during replication (Drake et al. 1998). The mutator alleles probably
are various DNA replication and repair enzymes. Ten or more genes
of E. coli can develop mutator mutations. Assuming that each gene
has about 1,000 bases, then the overall mutation rate of mutator loci
is 10× 1,000× 5× 10−10 ≈ 10−6–10−5, based on the per base mutation
rate in table 5.1. Some mutations will be nearly neutral; others will cause
extremely high mutation rates and will never increase in frequency.
Typical E. coli cultures accumulate mutator mutants at a frequency of
less than 10−5 (Mao et al. 1997), probably because most mutations are
deleterious and therefore selection does not favor increased mutation
rates. However, mutators can be strongly favored when the competitive
conditions and the selective environment provide opportunities for the
mutators to generate more beneficial mutations than the nonmutators
(Chao and Cox 1983; Mao et al. 1997). In this case, mutators increase
because they are linked with a higher frequency of beneficial mutations.
Although mutators are typically rare in freshly grown laboratory cul-
tures, hospital isolates of E. coli and Salmonella enterica sometimes have
mutator frequencies above 10−2 (Jyssum 1960; Gross and Siegel 1981;
LeClerc et al. 1996). Extensive serial passage in the laboratory can also
lead to high frequencies of mutators (Sniegowski et al. 1997). Thus, it
appears that rapid change of hosts or culture conditions can increase
the frequency of mutators 1,000-fold relative to stable environmental
conditions. As Drake et al. (1998) point out, theory suggests that muta-
tors can speed adaptation in asexual microbes (Leigh 1970; Moxon et al.
60 CHAPTER 5
1994; Taddei et al. 1997). It would be interesting to compare naturally
occurring frequencies of mutators in stable and rapidly changing selec-
tive environments.
DNA damage induces the SOS response of E. coli (Walker 1984). This
response causes higher mutation rates even in the undamaged parts of
the genome. Radman (1999) argues that this stress-induced mutagen-
esis is an adaptation to generate variability in the face of challenging
environments. But it is not clear whether the special replication en-
zymes induced by SOS serve primarily to replicate DNA under difficult
conditions, albeit with high mutation, or whether certain aspects of SOS
are particularly designed to raise mutation above the minimum level
that could be achieved efficiently during emergency. In any case, it is
interesting to consider whether some microbes facultatively induce in-
creased genome-wide mutation when challenged by host immunity.
LOCALIZED HYPERMUTATION
Targeting mutations to key loci would be more efficient than raising
the genome-wide mutation rate. Various mechanisms can increase the
mutation rate over short runs of nucleotides (Fussenegger 1997; Ripley
1999). For example, Streptococcus pyogenes coats its surface with a vari-
able M protein, of which eighty antigenically distinct variants are known
(Lancefield 1962; Fischetti 1991). The amino acid sequence of the M6
serotype revealed repeats in three regions of the protein (Hollingshead
et al. 1986, 1987). Region 1 has five repeats of 42 bp, each repeat con-
taining two nearly identical 21 bp repeats; region 2 has five 75 bp re-
peats; and region 3 has two repeats of about 81 bp. In regions 1 and
2, the two outermost repeats vary slightly in sequence from the three
identical repeats in the interior.
Sequence analysis of variant M proteins suggests that mutations oc-
cur by generating both gains and losses of the duplications. These mu-
tations probably arise by intragenic recombination between the DNA
repeats, but may be created by slippage during replication. Slippage
mutations over repeated DNA lead to gain or loss in the number of re-
peats and occur at frequencies much higher than typical replication er-
rors (Charlesworth et al. 1994). The repeats of the M protein are multi-
ples of 3 bases; thus changes in repeat number do not cause frameshift

GENERATIVE MECHANISMS 61
mutations. Some of the repeats vary slightly in base composition, so
recombinations can alter sequence composition as well as total length.
Fussenegger (1997) reviews several other cases of bacterial cell-wall
proteins that have repeated sequences, most of which occur in multiples
of 3 bp. Repeats are often associated with binding domains for other
proteins or polysaccharides (Wren 1991), so perhaps the ability to gen-
erate variable-length domains provides an advantage in attachment to
host tissues or in escape from host immunity.
Other mutational mechanisms besides repeats may increase local mu-
tation rates (Ripley 1999). For example, when double-stranded DNA
splits to be replicated, the complementary bases on a single strand may
bind to each other to form “hairpin” structures. Such hairpins may in-
crease errors in replication. Caporale (1999) suggests that certain ge-
nomic regions, such as antigenic sites, may have DNA base compositions
that promote higher mutation rates.
Apart from the well-known case of repeats and replication slippage,
no evidence at present associates antigenic sites with higher replication
errors. But this would certainly be an interesting problem to study fur-
ther. One could, for example, focus on associations between mutation
rate and nucleotide sequence. Comparison would be particularly inter-
esting between epitopes that evolve rapidly and conserved regions of
antigenic molecules that evolve slowly. Such comparison may help to
identify aspects of nucleotide composition that promote higher error
rates in replication.
5.2 Stochastic Switching between Archival Copies
Many pathogens change critical surface molecules by switching ex-
pression between alternative genes. Three types of switch mechanisms
commonly occur: replication errors that turn expression on or off, gene
conversion into fixed expression sites, and invertible promoters that
change the direction of transcription.
REGULATORY SWITCHES BY REPLICATION ERRORS OF SHORT REPEATS
Short, repeated nucleotide sequences often lead to high error rates
during replication. Repeats have recurring units typically with 1–5 bases
per unit. Short, repeated DNA sequences probably lead to replication
errors by slipped-strand mispairing (Meyer 1987; Levinson and Gutman
62 CHAPTER 5
1987; Charlesworth et al. 1994). Errors apparently arise when a DNA
polymerase either skips forward a repeat unit, causing a deletion of one
unit, or slips back one unit, producing a one-unit insertion.
Gene expression can be turned on or off by insertions or deletions.
Inserted or deleted repeats within the coding sequence cause frameshift
mutations that prevent translation and production of a full protein. For
example, the eleven opacity genes of Neisseria meningitidis influence
binding to host cells and tissue tropism. These genes each have between
eight and twenty-eight CTCTT repeats, which can disrupt or restore the
proper translational frame as the number of repeats changes (Stern et al.
1986; Stern and Meyer 1987). The limited repertoire of eleven genes and
the crude on-off switching suggest that variable expression has more
to do with altering cell tropism than with escape from host immunity
(Fussenegger 1997).
On-off switches can also be created by short repeats in transcriptional
control regions. Bordetella pertussis controls expression of two distinct
fimbriae by transcriptional switching (Willems et al. 1990). Fimbriae are
bacterial surface fibers that attach to host tissues. Particular cells pro-
duce both, only one, or neither of the fimbrial types. Sequences of about
15 C nucleotides in the transcriptional promoters of each of the two
genes influence expression. The actual length of the poly-C sequence
varies, probably by slipped-strand mispairing during replication. The
length affects transcription of the attached gene. Thus, by the stochas-
tic process of replication errors, the individual loci are turned on and off.
Again, this sort of switching may have more to do with tissue tropism
than with escape from immune recognition.
GENE CONVERSION
Some pathogens store many variant genes for a surface antigen, but
express only one of the copies at any time. For example, there may
be a single active expression site at which transcription occurs. Occa-
sionally, one of the variant loci copies itself to the expression site by
gene conversion—a type of intragenomic recombination that converts
the target without altering the donor sequence. The genome preserves
the archival library without change, but alters the expressed allele.
The spirochete Borrelia hermsii has approximately thirty alternative
loci that encode an abundant surface lipoprotein (Barbour 1993). There
GENERATIVE MECHANISMS 63
is a single active expression site when the spirochete is in mammalian
hosts (Barbour et al. 1991). The expression site is changed by gene con-
version to one of the variant archival copies at a rate of about 10−4–10−3
per cell division (Stoenner et al. 1982; Barbour and Stoenner 1985). A
small number of antigenic variants dominate the initial parasitemia of
this blood-borne pathogen. The host then clears these initial variants
with antibodies. Some of the bacteria from this first parasitemia will
have changed antigenic type. Those switches provide new variants that
cause a second parasitemia, which is eventually recognized by the host
and cleared. The cycle repeats several times, causing relapsing fever.
The protozoan Trypanosoma brucei has hundreds of alternative loci
that encode the dominant surface glycoprotein (Barry 1997; Pays and
Nolan 1998). Typically, each cell expresses only one of the alternative
loci. Switches in expression occur at a rate of up to 10−2 per cell divi-
sion (Turner 1997). The switch mechanism is similar to that in Borrelia
hermsii—gene conversion of archival copies into a transcriptionally ac-
tive expression site. T. brucei has approximately twenty alternative tran-
scription sites, of which only one is usually active. Thus, this parasite
can also change expression by switching between transcription sites. It
is not fully understood how different transcription sites are regulated.
INVERTIBLE SEQUENCES
E. coli stores two alternative fimbriae genes adjacent to each other
on its chromosome (Abraham et al. 1985). A promoter region between
the two genes controls transcription. The promoter triggers transcrip-
tion in only one direction, thus expressing only one of the two variants.
Occasionally, the promoter flips orientation, activating the alternative
gene. The ends of the promoter have inverted repeats, which play a
role in the recombination event that mediates the sequence inversion.
Salmonella uses a similar mechanism to control flagellum expression
(Silverman et al. 1979).
Moraxella species use a different method to vary pilin expression
(Marrs et al. 1988; Rozsa and Marrs 1991). The variable part of the
pilin gene has alternate cassettes stored in adjacent locations. Inverted
repeats flank the pair of alternate cassettes, causing the whole complex
occasionally to flip orientation. The gene starts with an initial constant

64 CHAPTER 5
region and continues into one of the cassettes within the invertible com-
plex. When the complex flips, the alternate variable cassette completes
the gene. Several bacteriophage use a similar inversion system to switch
genes encoding their tail fibers, which determine host range (Kamp et al.
1978; Iida et al. 1982; van de Putte et al. 1984).
Fussenegger (1997) reviews other invertible-sequence mechanisms.
These low-diversity switches provide only a limited advantage against
immunity because, even if the switch rates were low, an infection would
soon contain all variants at appreciable abundance. Thus, these switch
mechanisms may serve mainly to generate alternative attachment vari-
ants.
OTHER ARCHIVAL SWITCH MECHANISMS
Plasmodium species are a diverse and polyphyletic group of proto-
zoans that cause malarial symptoms in vertebrate hosts. Antigenic vari-
ation appears to be common and to be caused by diverse mechanisms.
I briefly summarize three examples.
Infection and reproduction in host erythrocytes determine the build-
up of parasite numbers within the host (Mims et al. 1998). P. falciparum
expresses the var gene within erythrocytes. The gene product, PfEMP1,
moves to the surface of the host cell, where it influences cellular adhe-
sion and recognition by host immunity (Deitsch and Wellems 1996). The
var genes are highly diverse antigenically (Su et al. 1995). Each parasite
exports only one var type to the erythrocyte surface, but a clone of par-
asites switches between var types (Smith et al. 1995). Switching leads
to a diverse population of PfEMP1 variants within a host and even wider
diversity among hosts.
The mechanism of var switching is not known. It appears that many
var loci are transcribed during the first few hours after erythrocyte in-
fection, but only a single var gene is active when PfEMP1 is translated
and moved to the erythrocyte surface (Q. Chen et al. 1998; Scherf et al.
1998). Switching between var loci does not depend on the mechanism
of gene conversion found in Borrelia hermsii and Trypanosoma brucei .
It may be that some mechanism shuts down expression of all but one
locus without modifying the DNA sequence. Scherf et al. (1998) sug-
gest that switches in gene expression do not depend on DNA sequence
changes in promoter regions or changes in transcription factors. They
GENERATIVE MECHANISMS 65
argue that regional changes in chromatin structure may control variable
expression.
Preiser et al. (1999) found antigenic variation at another stage in the
Plasmodium life cycle (see also Barnwell 1999). The parasitic forms that
invade erythrocytes are called merozoites. In a rodent malaria, P. yoelii,
the merozoite surface molecule p235 plays a role in attachment or in-
vasion of erythrocytes. There are at least eleven and perhaps as many
as fifty discrete genes that encode variants of p235 (Borre et al. 1995).
Within an erythrocyte, the parasite develops a multinucleate stage and
then divides into new merozoites that burst the host cell. Preiser et al.
(1999) found that each of the separate nuclei transcribe a different p235
gene. They suggest that upon division into separate merozoites, each
merozoite presents a different p235 protein on its surface. Thus, each
clone produces antigenically diverse progeny. The various p235 mole-
cules may facilitate invasion of different classes of erythrocytes.
Other Plasmodium species express surface proteins that are distantly
related to p235, but in those cases the surface molecules do not arise
from an antigenically diverse, multicopy gene family (Barnwell 1999).
Some of the Plasmodium species have diverged tens of millions of years
ago, so it is not surprising that they have different strategies for attach-
ment, immune evasion, and antigenic variation.
In another example, P. vivax has an extensive family of variant vir
genes, estimated to be present at 600–1,000 copies per haploid genome
(del Portillo et al. 2001). The parasite expresses only a small subset
of these genes in an infected erythrocyte. Del Portillo et al. (2001)
expressed the vir gene product from two variant loci and tested the
proteins for immunogenicity. Sera from twenty-five previously infected
hosts provided a panel of antibodies to test for prior exposure to the vir
gene products. One of the expressed proteins reacted with the serum
from only one host, the other protein reacted with sera from two hosts.
Thus, vir gene products are immunogenic, but each variant appears to
be expressed rarely—the hallmarks of antigenic variation from a large
archival library.
Sequences related to the vir family do not occur in P. falciparum or
P. knowlesi, suggesting that these different lineages have evolved dif-
ferent families of variable antigens. The diversity of gene families in
Plasmodium that play a role in antigenic variation provides an excellent
opportunity for comparative, evolutionary studies.

66 CHAPTER 5
5.3 New Variants by Intragenomic Recombination
Some parasites store many genetic variants for a particular surface
molecule. Usually, each parasite expresses only one archival variant.
New variants of archival copies may be created by recombination. For
example, Rich et al. (2001) found evidence for recombination between
the archived loci of the variable short protein (Vsp) of Borrelia hermsii.
They studied the DNA sequences of 11 vsp loci within a single clone.
These vsp loci are silent, archival copies that can, by gene conversion,
be copied into the single expression site. The genes differ by 30–40% in
amino acid sequence, providing sufficient diversity to reduce or elimi-
nate antigenic cross-reactivity within the host.
Rich et al. (2001) used statistical analyses of vsp sequences to in-
fer that past recombination events have occurred between archival loci.
Those analyses focus on attributes such as runs of similar nucleotides
between loci that occur more often than would be likely if alleles di-
verged only by accumulating mutations within each locus. Shared runs
can be introduced into diverged loci by recombination.
The archival antigenic repertoire of Trypanosoma brucei evolves rap-
idly (Pays and Nolan 1998). This species has a large archival library and
multiple expression sites, but only one expression site is active at any
time. New genes can be created within an active expression site when
several donor sequences convert the site in a mosaic pattern (Pays 1989;
Barbet and Kamper 1993). When an active expression site becomes inac-
tivated, the gene within that site probably becomes protected from fur-
ther gene conversion events (Pays et al. 1981; Pays 1985). Thus, newly
created genes by mosaic conversion become stored in the repertoire.
Perhaps new genes in silent expression sites can move into more per-
manent archival locations by recombination, but this has not yet been
observed. Recombination between silent, archived copies may also oc-
cur, which, although each event may be relatively rare, could strongly
affect the evolutionary rate of the archived repertoire.
These examples illustrate the scattered reports of recombination and
the evolution of archived repertoires. These preliminary studies show
the promise for understanding the interaction between mechanisms that
create diversity and the strong forces of natural selection imposed by
immune recognition. The combination of generative mechanisms and
selection shapes the archival antigenic repertoire.

GENERATIVE MECHANISMS 67
5.4 Mixing between Genomes
New antigenic variants can be produced by mixing genes between dis-
tinct lineages. This happens in three ways.
Segregation brings together chromosomes from different lineages.
Reassortment of influenza A’s neuraminidase and hemagglutinin sur-
face antigens provides the most famous example (Lamb and Krug 2001).
The genes for these antigens occur on two separate RNA segments of the
genome—the genome has a total of eight segments. When two or more
viruses infect a single cell, the parental segments all replicate separately
and then are packaged together into new viral particles. This process
can package the segments from different parents into a new virus.
New neuraminidase-hemagglutinin combinations present novel anti-
genic properties to the host. Rare segregation events have introduced
hemagglutinin from bird influenza into the genome of human influenza
(Webster et al. 1997). The novel hemagglutinins cross-reacted very lit-
tle with those circulating in humans, allowing the new combinations to
sweep through human populations and cause pandemics.
Intergenomic recombination occurs when chromosomes from differ-
ent lineages exchange pieces of their nucleotide sequence. In protozoan
parasites such as Plasmodium and Trypanosoma, recombination hap-
pens as part of a typical Mendelian cycle of outcrossing sex (Jenni et al.
1986; Conway et al. 1999). Recombination can occur in viruses when
two or more particles infect a single cell. DNA viruses may recombine
relatively frequently because they can use the host’s recombination en-
zymes (Strauss et al. 1996). RNA viruses may recombine less often be-
cause the host lacks specific enzymes to mediate reciprocal exchange of
RNA segments. However, many descriptions of RNA virus recombina-
tion have been reported (Robertson et al. 1995; Laukkanen et al. 2000;
and see chapter 10). In all cases, even rare recombination can provide
an important source for new antigenic variants.
Horizontal transfer of DNA between bacteria introduces new nucle-
otide sequences into a lineage (Ochman et al. 2000). Transformation
occurs when a cell takes up naked DNA from the environment. Some
species transform at a particularly high rate, suggesting that they have
specific adaptations for uptake and incorporation of foreign DNA (Fus-
senegger et al. 1997). For example, Neisseria species transform fre-
quently enough to have many apparently mosaic genes from interspecies
68 CHAPTER 5
transfers (Spratt et al. 1992; Zhou and Spratt 1992; Fussenegger et al.
1997), and N. gonorrhoeae has low linkage disequilibrium across its ge-
nome (Maynard Smith et al. 1993). Horizontal transfer also occurs when
bacteriophage viruses carry DNA from one host cell to another or when
two cells conjugate to transfer DNA from a donor to a recipient (Ochman
et al. 2000).
5.5 Problems for Future Research
1. Selection of mutation rates. Intense immune pressure favors the
generation of antigenic variants. However, variants, like any mutations,
may have associated costs. To what extent have molecular attributes
of antigenic genes been shaped by the costs and benefits of generat-
ing variants? Do microbes under intense immune pressure have higher
genome-wide mutation rates compared with similar organisms that do
not face immune attack? To what extent have nucleotide sequences of
antigens been shaped by the tendency of particular motifs to generate
replication errors—a form of local hypermutation?
2. Selection of mechanisms that control switching between archival
variants. I described various mechanisms by which gene expression
shifts between archived variants. The rate at which switches occur prob-
ably affects the parasite’s ability to extend infection. If switches happen
too quickly, then novel variants will not be expressed after the immune
response develops against the many variants expressed early in infec-
tion. If switches happen too slowly, then the parasite may be cleared
before the variants are expressed. Thus, natural selection can strongly
influence the molecular details of the switch process in order to adjust
the rate of change between variants. This can be tested by selecting in
vitro for faster or slower switch rates. Does an evolutionary response
occur in the switch rates? If so, how is the response accomplished at
the molecular level?
One could also test the evolution of the switch rate in vivo, comparing
situations that imposed different immune pressures on rates of change
and on particular orders in which variants are expressed. Such studies
allow one to relate the molecular mechanisms of switching to the adap-
tive significance of switching. Two general questions arise. To what ex-
tent do switch rates evolve to enhance parasite fitness? To what extent

GENERATIVE MECHANISMS 69
do mechanistic properties of switching constrain rates of change be-
tween variants?
3. Rates of diversification between archival copies. Some parasites
have large families of variants archived within the genome. I described
studies of Borrelia hermsii and Trypanosoma brucei in which intrage-
nomic recombination between archival copies generated new variants.
This calls attention to the rate at which new variants can be created and
the rate of diversification between members of archival gene families.
Rich et al. (2000) argue that all of the antigenic variants of Plasmo-
dium falciparum have arisen from a recent common ancestor. A more
detailed study by Volkman et al. (2001) estimates that the most recent
common ancestor lived less than ten thousand years ago. If this estimate
is correct, then the diverse var family of antigenic variants must have
evolved very rapidly. However, this conclusion remains contentious—
Hughes and Verra (2001) argue that the P. falciparum lineage is much
older.
It would be interesting to compare rates of diversification in these
families of variants between the different Plasmodium species, Trypano-
soma brucei, Borrelia hermsii, and other microbes with similar families
of variants. It would also be interesting to compare P. falciparum with
another malarial parasite of humans, P. vivax. As noted in the text, P.
vivax has a family of antigenic variants that does not occur in P. falci-
parum. How does the history of variation compare in these two species?


PART III
INDIVIDUALINTERACTIONS

6 Immunodominancewithin Hosts
Each parasite presents a large number of epitopes to the host’s immune
system. The immune response focuses on only a few of the many po-
tential epitopes, a process called immunodominance. Immunodominant
focus determines which epitopes are favored to vary antigenically to es-
cape immune pressure. In this chapter, I describe how immunodomi-
nance develops by competition among B and T cell lineages with differ-
ent specificities.
The first section reviews antibody immunodominance. The diverse,
naive B cells secrete IgM antibodies that bind to nearly any epitope. On
initial infection, B cells that bind epitopes with relatively high equilib-
rium affinity divide rapidly and dominate the early phase of the immune
response by outcompeting other B cells. However, antibodies that bind
too strongly clear the matching antigens quickly and prevent feedback
stimulation to their B cells. The later phases of B cell competition and
maturation of IgG favor antibodies with increased on-rates of associa-
tion to epitopes rather than increased equilibrium binding affinity.
The second section discusses cytotoxic T lymphocyte (CTL) immuno-
dominance. Aspects of specificity such as MHC binding and avoidance
of self-recognition determine which epitopes could potentially be rec-
ognized. Among this potential set, some epitopes dominate others in
stimulating a CTL response. Earlier stimulation of T cell lineages in
response to infection rather than more rapid T cell division seems to
determine the dominance of lineages. Dominant lineages may repress
subdominant lineages by pushing the abundance of pathogens below
the threshold needed to trigger weaker, subdominant responses.
The third section describes original antigenic sin, in which the speci-
ficity of the immune response depends on the sequence of exposure
to antigenic variants. If a host first encounters a variant A and then
a later variant A′, the second variant will sometimes restimulate the
initial response against A rather than a new, specific response against
A′. In this case, A′ recalls the memory against an earlier cross-reacting
epitope rather than generating a primary, specific response against it-
self. Sometimes the cross-reaction is rather weak, causing the host to
74 CHAPTER 6
respond weakly to the second antigen because of interference by its
memory against the first variant. Original antigenic sin has been ob-
served in both antibody and CTL responses.
The final section takes up promising issues for future research.
6.1 Antibody Immunodominance
I emphasize Rao’s (1999) studies of B cell competition, one of the few
empirical analyses of the dynamics of antibody immunodominance.
BROAD IGM AND NARROW IGG RESPONSE
Kumar et al. (1992) engineered a recombinant polypeptide with 100
amino acids that contained several epitopes from the envelope of hep-
atitis B virus. They called this polypeptide MEP-1. The initial antibody
response, detected one week after injection into a mouse, contained
heterogeneous IgM against several epitopes that collectively spanned
the entire 100-amino-acid sequence. By contrast, the IgG response four
weeks after injection was highly specific for a single epitope. These ob-
servations support the idea that the naive antibody repertoire can bind
almost any epitope, but that only a subset of the initially binding anti-
bodies stimulate their B cell clones to expand significantly and make the
transition to IgG production.
REVIEW OF PROCESSES BY WHICH ANTIBODY RESPONSE DEVELOPS
Major expansion of a B cell clone and transition to IgG production typ-
ically depend on stimulation from helper T cells, although some nonpro-
tein antigens can stimulate IgM response without T cell help (Janeway
et al. 1999). The interaction between B cells and T cells happens roughly
as follows. The B cell receptor (BCR) is an attached form of antibody,
which has specificity for particular epitopes. Each B cell expresses many
BCRs on its surface, each with the same specificity. When a BCR binds
antigen, it may pull the antigen into the cell. If the antigen is a pro-
tein, the B cell processes the antigen into smaller peptides, binds some
of those peptides to MHC class II molecules, and presents the peptide–
class II complexes on the cell surface.
If a helper (CD4+) T cell has a T cell receptor (TCR) that binds the
peptide–class II complex, then the T cell sends a stimulatory signal to
IMMUNODOMINANCE WITHIN HOSTS 75
the B cell. Thus, B cell stimulation requires binding to an epitope of
an antigen, processing the antigen, and finding a helper T cell that can
bind an epitope of the same antigen. The epitopes recognized by the BCR
and TCR may differ, but must be linked on the same antigen molecule
to provide matches to both the BCR and TCR (Shirai et al. 1999). T cell
stimulation causes B cells to divide more rapidly, to undergo somatic
hypermutation, and to switch from IgM to IgG production. Immuno-
dominance arises when some B cells receive relatively greater stimula-
tion from helper T cells. Signal strength depends on the dynamics of
antigen binding for BCRs and TCRs.
The vertebrate host has specialized organs to facilitate interaction be-
tween B and T cells. The initial interaction occurs when antigen-binding
B cells are trapped in a zone of lymphoid tissue that has a high density
of T cells. Some of the stimulated B cells differentiate into antibody fac-
tories, whereas others migrate along with matching T cells to primary
follicles of the lymphoid tissue. There, if the B cells receive sufficient
stimulation from T cells, they undergo rapid division to form germinal
centers. At these centers, the B cells hypermutate and proceed through
affinity maturation.
AFFINITY WINDOW FOR EPITOPE-PARATOPE BINDING
The naive B cell repertoire binds with varying affinity to different epi-
topes of an antigen. The relative stimulation of different B cell clones by
an antigen determines progression to the next steps in B cell response.
Stimulation depends on the affinity of the BCR paratopes (binding sites)
for their particular epitopes.
Rao (1999) found an affinity window for stimulation of B cells. Very
strong epitope-paratope binding prevents stimulation; weakly binding
B cells are outcompeted for stimulatory signals. I discuss in turn these
upper and lower thresholds.
Vijayakrishnan et al. (1994) discovered an upper affinity threshold by
the study of two epitopes of the MEP-1 peptide described above. One of
these epitopes stimulated the immunodominant IgG response; the other
was at the opposite end of the peptide. I refer to the immunodominant
epitope as D and the subdominant epitope as S. Vijayakrishnan et al.
(1994) followed antibody levels against these two epitopes in immunized
mice. Surprisingly, the early antibody response was stronger against S

76 CHAPTER 6
than D. However, secreted antibodies against S bound so efficiently to
S that they outcompeted the matching BCR and prevented stimulation
of the B cell lineage. By contrast, anti-D antibodies bound with lower
affinity and did not outcompete the matching BCR, allowing that B cell
lineage to receive strong stimulation from the antigen.
Agarwal et al. (1996) found a lower affinity threshold determined by
competition between BCRs for stimulation by helper T cells. They began
by constructing a peptide that had on one side a known B cell antigen of
hepatitis B virus and on the other side a known T cell epitope from the
malaria parasite Plasmodium falciparum. They injected this chimeric
peptide into mice and followed the antibody response. The early IgM
response had specificities that spanned the entire hepatitis B segment.
By contrast, the later IgG response focused on a single epitope in the
hepatitis B segment composed of the four amino acids DPAF.
Single amino acid changes in DPAF destroyed immunodominance by
this epitope, causing nearby epitopes to dominate the IgG response. The
anti-DPAF antibodies had affinities between 8- and 60-fold higher than
antibodies against neighboring epitopes. Agarwal et al. (1996) showed
that the high-affinity response against DPAF suppressed B cells initially
activated against neighboring epitopes. Immunodominance depended
on competition for antigen-specific helper T cells, which are limiting
during the initial stages of an immune response. The stronger-binding
BCRs take up antigen and present to T cells more efficiently than do
the weaker-binding competitors. Insufficient T cell stimulation leads to
suppression of B cell clones.
In later experiments, Agarwal and Rao (1997) manipulated the size of
the helper T cell pool. Reduced numbers of T cells allowed IgM response
but prevented the switch from the IgM stage to the IgG stage. This sup-
ports the hypothesis that competition for T cell help is the rate-limiting
step in the transition from the broad IgM response to the narrow IgG
response.
EQUILIBRIUM BINDING AFFINITY MAY DETERMINE EARLY RESPONSE
Antibody affinity for epitopes influences initial IgM stimulation and
subsequent competition for immunodominance during the switch to
IgG. What determines antibody affinity to individual epitopes during
IMMUNODOMINANCE WITHIN HOSTS 77
these early phases of B cell competition? Rao (1999) summarizes stud-
ies that rule out mouse MHC genotype and various physical properties
of the epitope such as accessibility within the overall peptide structure.
This led to the hypothesis that the Gibbs free-energy of binding between
epitope and paratope determines antibody affinity, and that the amino
acid sequence of the epitope influences the potential free-energy of the
bond.
Nakra et al. (2000) used various model peptides to show that the affin-
ity of an epitope-specific response depends on the amino acid composi-
tion of the epitope. They suggested that the relative ordering of affinities
for particular epitopes could be predicted by the amino acid sequence
of the epitope. In particular, the amino acid side chains of an epitope
sequence determine the potential free-energy of binding to an antibody
paratope.
Chemical determination of free-energy seems particularly important
in the early phases of antibody response, when the antibodies have not
yet been optimized for binding by affinity maturation. Unoptimized
antibodies do not have strong spatial complementarity of binding; thus
there is less steric and greater chemical constraint on binding at this
stage. After optimization, it may be that greater steric complementarity
of antibody-epitope binding places more emphasis on spatial fit and
reduces the predictability of binding energy based solely on chemical
composition of amino acid side chains.
KINETIC BINDING ON-RATES MAY DETERMINE AFFINITY MATURATION
So far, I have summarized the first stage of antibody selection: IgM-
producing B cells from the naive repertoire compete for T cell help, with
the winner(s) dividing more rapidly and starting on the path to IgG pro-
duction. Equilibrium binding affinity drives this first stage of antibody
competition.
I now turn to the next stage, called affinity maturation (Janeway et al.
1999). During this stage, B cells congregate in germinal centers of the
lymphoid tissue and mutate their antibody paratopes at a high rate.
A selection process favors those mutated paratopes that bind relatively
strongly to antigen, driving affinity maturation of antibodies for the par-
ticular epitopes.

78 CHAPTER 6
Rao’s (1999) group studied affinity maturation by continued analysis
of the DPAF epitope in the chimeric hepatitis B and Plasmodium anti-
gen mentioned above. Agarwal et al. (1998) found that the equilibrium
binding affinity of antibodies did not increase over time, supporting ob-
servations in two earlier studies on other systems (Newman et al. 1992;
Roost et al. 1995).
Rao’s group modified their model antigen by substituting cysteine
amino acid residues in the two sites flanking the DPAF epitope (Nayak
et al. 1998). This changes the conformation of the DPAF peptide and
influences the antibody-epitope binding reaction. Nayak et al. (1998)
raised antibodies through affinity maturation against DPAF in the na-
tive antigen and in the cysteine-modified antigen. They then compared
binding of each of the two antibody types against the native and modi-
fied antigen.
Antibodies raised against the native antigen bound with approximate-
ly equal equilibrium affinity to native and modified antigen. Antibodies
raised against the modified antigen also bound at equilibrium approxi-
mately equally against the two antigens. By contrast, the kinetic on-rates
of binding were 50-fold higher for native antibody to native antigen than
for native antibody to modified antigen. Kinetic on-rates were 14- to 25-
fold higher for modified antibody to modified antigen than for modified
antibody to native antigen.
Kinetic on-rates measure rates at which bonds form, whereas equi-
librium affinity measures the ratio of on-rates to off-rates. Selection
during affinity maturation apparently favors faster rates of interaction
with increases in both on-rates and off-rates: the on-rates rise, but the
equilibrium affinity does not change.
In this model system, it appears that B cells compete by rate of anti-
gen acquisition during affinity maturation. B cells with paratopes that
bind more quickly to antigen receive stronger stimulatory signals to di-
vide and to dominate the population in the germinal centers. Thus, the
optimized antibodies bind more quickly to antigen than unoptimized
precursors, but optimized antibodies do not necessarily increase their
equilibrium binding affinity.
In summary, Rao proposed an integrated, dynamic view of how the
specificity of an antibody response develops. The particular details may
turn out to vary in different cases. However, in all cases, progress will re-
quire study of the interactions between molecular structure, the kinetics

IMMUNODOMINANCE WITHIN HOSTS 79
of binding, regulatory control of cellular competition, and immunodom-
inance.
6.2 CTL Immunodominance
CTL immunodominance is not well understood, because it has been
difficult to measure the abundance of CTLs specific for particular epi-
topes. The technical limitations for quantitative assay of specific T cells
may soon be overcome with recently developed methods (Yewdell and
Bennink 1999; Doherty and Christensen 2000).
I mentioned in chapter 4 several factors of antigen processing that
affect CTL immunodominance. These factors include CTL repertoire
shaped by selection against MHC and self-peptide complexes, timing
and quantity of intracellular antigen production by pathogens, uptake
of extracellular antigen by antigen-presenting cells, proteolytic cleavage
of antigens, intracellular transport of peptides, binding to MHC, and
specificity of T cell receptors. In this section, I focus on the relative
abundance of T cell populations with different recognition specificities.
BREADTH AND SPECIFICITY OF CTL RESPONSE
The CTL response can be described by breadth, the number of differ-
ent CTL clones expanded, and by specificity, the number of pathogen
epitopes recognized by the expanded CTL clones (Gianfrani et al. 2000).
The current literature provides varying conclusions about CTL breadth
and specificity. This partly reflects the technical difficulties mentioned
above, but may also occur because the CTL response is variable.
The timing and methods of measurement may influence five aspects
of the observed CTL response (Gianfrani et al. 2000). First, some studies
measure primary CTL response, whereas other studies measure memory
CTLs stimulated by secondary challenge. W. Chen et al. (2000) found that
mouse primary response against influenza is more highly focused on a
few epitopes than is the secondary response. By contrast, Busch et al.
(1998) observed similar kinetics of primary and secondary responses
against four epitopes of Listeria.
Second, persistent viral infections may evolve within a host, causing
the host to develop a sequence of focused CTL responses.
Third, some methods measure relatively rare CTL-epitope combina-
tions better than other methods. Relatively insensitive measurement
80 CHAPTER 6
leads to observations of narrow response. Relatively sensitive methods
may pick up relatively weak CTL responses. The existence of a response
does not mean that the response was a significant fraction of the total
CTL expansion.
Fourth, it is often necessary to choose a priori a relatively small panel
of epitopes as probes for the presence of matching CTLs. As the meth-
ods improve to predict CTL epitopes, the number of epitopes observed
to stimulate CTL response will rise.
Fifth, some studies measure CTL response aggregated over several
hosts. Each host may have a relatively narrow response, but hosts may
differ in their choice of epitopes.
With these issues in mind, we can make some sense of the contrast-
ing reports on the diversity CTL response. On the one hand, studies of
influenza (Bednarek et al. 1991; Morrison et al. 1992) and Epstein-Barr vi-
rus (Callan et al. 1998) report a large fraction of CTLs focused on a single
epitope. These studies emphasize the dominance of certain CTL clones
at a particular time during infection within a single host (Murali-Krishna
et al. 1998; Sourdive et al. 1998; Callan et al. 1998). On the other hand,
observed human CTL responses were broad and multispecific against
hepatitis B and C viruses and against HIV (Chisari 1995; McMichael and
Phillips 1997; Rehermann et al. 1996). These pathogens tend to be ge-
netically heterogeneous within a single host and may evolve by escape
mutants in dominant epitopes. Thus, CTL focus may change over the
course of infection within a single host.
Gianfrani et al. (2000) found a broad and multispecific human CTL
memory response against influenza A. However, their measurements
were aggregated over several hosts. Each host tended to respond strong-
ly to a dominant epitope associated with one of its class I MHC alleles
and to have memory CTLs for a small number of other epitopes for that
dominant class I allele and for another class I allele. It seems that a few
CTL clones prevail numerically within each host, but other clones may
be stimulated and hosts may vary in which clones react to a particular
epitope.
TIME OF CTL RECRUITMENT
Three factors influence the relative abundance of expanded T cell
clones: frequency in the naive repertoire, rate of cell division, and time
IMMUNODOMINANCE WITHIN HOSTS 81
of initial expansion. Bousso et al. (1999) studied expansion of CTL clone
abundances in mice against the human MHC allele HLA-Cw3. The re-
sponse was dominated by a few clones. Those dominant clones were not
particularly frequent in the naive repertoire. The relative abundances
did not change between dominant and subdominant CTL clones that in-
creased in abundance from the early to late stages of the T cell response,
suggesting that expanding clones did not vary in their rate of cellular
division.
The dominant CTL clones began their numerical expansion earlier
than subordinate clones. CTL clones double every six to eight hours;
thus a one-day advance in clonal activation causes an 8- to 16-fold dif-
ference in cellular abundance. The timing of initial clonal expansion ap-
pears to control immunodominance in this case. Bousso et al. (1999) did
not determine whether the earlier proliferation of certain clones arose
from binding properties to epitopes that triggered faster activation or
from other causes.
INITIAL STIMULATION BY ENDOGENOUS VERSUS EXOGENOUS ANTIGEN
Naive CD8+ T cells must be activated to proliferate and to become
armed with killer function as CTLs. Naive CD8+ cells are also confined
to the blood and lymph systems and generally do not pass outside to
most tissues, whereas the armed CTLs can exit to infected tissues.
The confinement of naive CD8+ cells raises a paradox (Reimann and
Schirmbeck 1999). To be activated, the CD8+ cells must bind peptide-
MHC class I complexes on the surface of cells with foreign antigen. But
if the infection is not in the blood or lymph compartments, the naive
T cells cannot reach the site of infection. Somehow, the naive CD8+
cells must encounter peptide-MHC class I complexes within the blood or
lymph compartments even though the site of infection may be outside
those compartments.
One possible solution depends on the distinction between endoge-
nous and exogenous antigen (Schumacher 1999; Sigal et al. 1999). The
CD8+ T cell is traditionally thought to bind primarily to pathogen anti-
gens created endogenously within infected host cells. Those antigens
are digested within the cell and transported to the endoplasmic retic-
ulum, where they bind MHC class I molecules. The peptide-MHC com-
plex is then transported to the cell surface, where it becomes available
82 CHAPTER 6
to roving T cells. Endogenously generated antigen is confined to the
surface of the cell in which it was produced; thus endogenous antigen
cannot be transported from infected tissues that exclude naive CD8+
cells into the lymph nodes, where CD8+ cells are common.
When an infected cell dies, pathogen antigens become liberated and
exist exogenously. Sigal et al. (1999) showed that naive CD8+ stimu-
lation against a viral infection of peripheral tissue required transport
of exogenous antigen by macrophages or dendritic cells into the lymph
nodes. Dendritic cells are known to take up exogenous antigen in periph-
eral tissues and then to move to lymph nodes (Banchereau et al. 2000;
Watts and Amigorena 2000). In addition, dendritic cells can process ex-
ogenous antigen and present it bound to MHC class I alleles (Reimann
and Schirmbeck 1999). Thus, dendritic cells may serve as scouts in
the peripheral tissue, bringing exogenous antigen to lymph nodes when
stimulated by signs of infection or tissue damage.
How does this scouting network influence antigenic variation? For
pathogens that infect peripheral tissue, CTL stimulation may focus on
those antigens likely to be released exogenously and taken up by den-
dritic cells (or perhaps macrophages). Thus, abundant and stable patho-
gen proteins may be particularly likely to stimulate CTL response. For
example, the capsid proteins of viruses may be more abundant than
replicase enzymes and therefore more likely to be taken up as exoge-
nous antigen.
COMPETITION AND INTERFERENCE BETWEEN CTL CLONES
Immunodominant CTL clones suppress the abundance of subdomi-
nant clones, a phenomenon called immunodomination (see the excel-
lent review by Yewdell and Bennink 1999). Subdominant CTL clones
responded more strongly with alteration or deletion of either the epi-
tope stimulating the dominant CTL clone or the class I MHC molecule
that presents the dominant epitope, or with direct inhibition of the dom-
inant CTL clone (Zinkernagel et al. 1978; Doherty et al. 1978).
Yewdell and Bennink (1999) compare two explanations for immun-
odomination. First, the dominant epitope may interfere with the sub-
dominant epitope for binding and presentation by MHC class I mole-
cules. Such competition within antigen-presenting cells seems unlikely
because CTL recognition of subdominant epitopes is not affected by

IMMUNODOMINANCE WITHIN HOSTS 83
coexpression of dominant epitopes (Mylin et al. 1995; Weidt et al. 1998).
The abundance of epitopes (pathogen peptides) is usually so low that
competition for binding to MHC class I molecules seems very unlikely
(Yewdell and Bennink 1999).
Second, dominant CTL clones may directly or indirectly suppress sub-
dominant clones. This may occur because dominant CTLs clear infected
cells and associated subdominant epitopes too quickly for the weak CTL
stimulation by subdominant epitopes to generate a strong CTL response
(Nowak et al. 1995; Nowak and May 2000). Alternatively, the CTLs may
compete directly at antigen-presenting cells for stimulation. Finally, the
dominant CTLs may be able to suppress subdominant clones by compe-
tition for resources or by expressing suppressive cytokines.
On the whole, the evidence supports the second explanation, in which
dominant clones suppress subdominant clones. Weidt et al.’s (1998)
detailed study of lymphocytic choriomeningitis virus (LCMV) showed
that immunodomination in that system arose from CTLs against domi-
nant epitopes suppressing the viral population to a low level such that
the suppressed viral population in the host stimulates only a weak CTL
response against subdominant epitopes. This supports Nowak et al.’s
(1995) model, in which immunodomination arises by the population dy-
namic consequences of birth and death rates for specific CTL clones and
for viral populations that express matching epitopes.
In particular, Weidt et al. (1998) analyzed CTL response against two
viral strains. The strain WE stimulated a dominant response against
the epitope NP118−126, whereas the strain ESC lacked this dominant epi-
tope and stimulated response against various minor epitopes including
GP283−291. Class I MHC presents the minor epitopes in WE-infected cells,
but does not stimulate significant CTL response. Importantly, CTLs spe-
cific for the subdominant epitope GP283−291 lyse WE and ESC target cells
to the same extent, suggesting that the subdominant epitope is pre-
sented effectively equally on the surfaces of WE and ESC cells. Thus, the
strength of the CTL response is not caused by numerical differences in
epitope presentation on cell surfaces.
The NP118−126-specific CTLs do not directly suppress CTLs against mi-
nor epitopes, because coinfection by WE and ESC produces a significant
CTL response against both NP118−126 and GP283−291, suggesting that ESC
generates a CTL response against GP283−291 without interference by the
WE-induced CTLs against NP118−126.
84 CHAPTER 6
Although the dominant CTLs did not directly interfere with the sub-
dominant CTL population, further evidence suggests indirect competi-
tion. Expansion of the dominant CTL clone against NP118−126 and clear-
ance of WE infection occurred more rapidly than did expansion of the
subdominant CTL clone against GP283−291 and clearance of ESC infection.
Either WE or ESC infection activated CD8+ T cells against the minor epi-
tope, but in WE infection those minor-epitope T cells did not expand
into a significant CTL response with lytic activity. It appears that, in WE
infection, the fast development of CTLs against NP118−126 suppressed
the viral load quickly enough that the weaker-stimulated CD8+ T cells
against GP283−291 did not have time to develop into a primary CTL re-
sponse.
These kinetic processes lead to indirect competition. Kinetic control
suggests that immunodomination should be a quantitative phenomenon
ordering epitopes into a hierarchy. An immunodomination hierarchy
has been demonstrated by Wettstein (1986). In addition, factors that
alter the rate of CTL expansion against particular epitopes should be
able to change the dominance hierarchy. Such changes in the hierarchy
occur when the immune system has previously experienced an epitope.
For example, if epitope A dominates epitope B in a naive host, then
prior exposure only to B can reverse the dominance ranking and cause B
to dominate A (Bennink and Doherty 1981; Jamieson and Ahmed 1989;
Cole et al. 1997). This switch apparently occurs because secondary chal-
lenge causes a more rapid CTL response, allowing CTLs against B to re-
duce antigen load quickly enough to suppress a CTL response against A.
CTL REPERTOIRE
Why are CTL responses stronger against some epitopes than others?
It could simply be that the immunodominant epitopes are expressed
more commonly on cell surfaces than subdominant epitopes. However,
Yewdell and Bennink (1999) summarize various lines of evidence argu-
ing against a simple correlation between the abundance of presented
epitopes and immunodominance, for example, the study by Weidt et al.
(1998) described above. Thus, immunodomination of CTL clones ap-
pears to be influenced by biases in the CD8+ repertoire.
Three important questions arise concerning CD8+ biases in the naive
repertoire (Yewdell and Bennink 1999). First, does immunodomination
IMMUNODOMINANCE WITHIN HOSTS 85
arise because more CD8+ cells respond to an immunodominant epi-
tope or because CD8+ clones for immunodominant epitopes divide more
quickly upon initial stimulation? The available data cannot distinguish
between these alternatives.
Second, how does variation between individuals in naive CD8+ reper-
toires influence the hierarchical ordering of epitopes? Individual vari-
ation can occur in self-peptides, TCR genes, and MHC genes. Negative
selection shapes the TCR repertoire to avoid matching to self-peptides.
TCR genes form the building blocks for combinatorial generation of TCR
variability in each individual. MHC genes influence the presentation of
peptides.
Third, independently of self-peptides and TCR genes, do immuno-
dominant epitopes stimulate TCRs more strongly? Favorable structural
attributes of immunodominant epitopes could interact with relatively
constant features of the TCR.
A few studies have compared immunodominance in humans with that
in transgenic mice expressing the same human MHC alleles. Both hu-
mans and transgenic mice recognized the same immunodominant epi-
topes when injected with viruses (Engelhard et al. 1991; Man et al. 1995;
Shirai et al. 1995). Humans and mice that recognized the same peptide-
MHC class I complex used TCRs composed of different Vα and Vβ germ-
line components (Man et al. 1994). Thus, different self-peptides (mouse
versus human) or variable TCR genes do not necessarily influence im-
munodominance, although this is a rather weak conclusion. Instead, im-
munodominance may depend on interactions between structural prop-
erties of the epitopes and relatively constant features of TCRs (Yewdell
and Bennink 1999).
Negative selection against self-peptides can influence CD8+ response
to particular epitopes. This was shown in a study of human infection
by Epstein-Barr virus (Burrows et al. 1994, 1995). Individuals with the
MHC class I allele B8 typically have immunodominant responses against
EBNA3A325−333. The CTLs in this immunodominant response have a
high proportion of the same germline TCR genes; that is, the response
is composed of a very narrow set of CD8+ clones.
CTL response against EBNA3A325−333 cross-reacts to the MHC class I
allele HLA B*4402 when the host lacks this HLA allele. Individuals with
both B8 and B*4402 produce a relatively weak CTL response against
EBNA3A325−333. This weaker CTL response does not cross-react with

86 CHAPTER 6
B*4402 and has a TCR gene composition that differs from the TCRs in the
strong CTL response of the B8-positive and B*4402-negative individuals.
Self-reactivity apparently reduced the CTLs that cross-react with B*4402.
Reduction of those dominant CTLs allows other CD8+ clones to expand,
suggesting that the dominant CTLs in the B*4402-negative individuals
suppress those CD8+ clones that expand in B*4402-positive individuals.
ALTERED PEPTIDE LIGANDS
A CTL response depends on binding of the TCR to a peptide-MHC com-
plex. An altered parasite peptide sometimes interferes with or enhances
a CTL response against the original peptide, a phenomenon known as al-
tered peptide ligand (APL) (reviewed by Sette et al. 1994; Jameson and Be-
van 1995; Franco et al. 1995; Moskophidis and Zinkernagel 1995; Davis
et al. 1998; Price et al. 1998; Germain and Štefanová 1999; Madrenas
1999; Abrams and Schlom 2000).
Disruption of the lytic activity in an active CTL response provides one
example of APL antagonism. In this case, the CTL response against the
original epitope can be influenced by the presence of an altered epitope
(peptide) with a small number of amino acid substitutions. The altered
peptide prevents CTL lytic activity against cells expressing the original
epitope. Reduced lytic activity has been observed in HIV (Klenerman
et al. 1994) and hepatitis B virus (Bertoletti et al. 1994). Antagonism by
APLs lowers the clearance rate of viruses carrying the original peptide,
potentially allowing longer survival and greater success of the protected
genotypes within infected individuals.
Gilbert et al. (1998) studied the effects of APLs on the distribution of
strains in a population of Plasmodium falciparum infecting humans in
The Gambia. They examined four variant peptides of the circumsporo-
zoite protein. The peptides cp26 and cp29 have CTL epitopes that bind
the MHC class I molecule HLA-B35, the most frequent MHC class I mole-
cule in their study area. The other two peptides (cp27 and cp28) do not
bind HLA-B35.
The octamers cp26 and cp29 differ only in a single amino acid substi-
tution. Peptide cp26 antagonizes cp29-specific CTLs and cp29 antago-
nizes cp26-specific CTLs. Interference occurs even when the antagonist
occurs in relatively low concentration and is presented on different cells
from the partner epitope. In addition, in vitro studies of T cells from
IMMUNODOMINANCE WITHIN HOSTS 87
hosts unexposed to malaria show that cp26 and cp29 mutually interfere
with induction of primary CTL responses (Gilbert et al. 1998). In vivo
studies in mice also show the same mutual interference of primary CTL
induction (Plebanski et al. 1999).
Mutual interference suggests that hosts jointly infected with cp26
and cp29 will be less effective in clearing parasites than singly infected
hosts or hosts with other combinations of strains. Gilbert et al. (1998)
found hosts jointly infected with cp26 and cp29 more frequently than
expected from population frequencies, suggesting that mutual interfer-
ence of CTL response favors joint survival and transmission of these
strains.
It is clear that APLs sometimes reduce CTL response. In the case of
Plasmodium falciparum, it appears that variant peptides interfere with
immunity sufficiently to influence the distribution of antigenic variation
in the parasite population. It is not clear at present whether APLs have
a significant influence on the antigenic diversity of other parasites.
6.3 Sequence of Exposure toAntigens: Original Antigenic Sin
The host amplifies specific B and T cell lineages in response to chal-
lenge by foreign antigen. Often the host has several B and T cell specifici-
ties that match the various antigens of a parasite, but the host amplifies
only a subset of matching specificities. I discussed in earlier sections
various factors that influence immunodominance—the particular subset
of antigens that stimulate an immune reaction from among the broader
set of antigens that could potentially stimulate a response.
The sequence in which the host encounters antigenic variants influ-
ences the specificity of the immune response. The first observations
of sequential effects were made on influenza infections (Francis 1953;
Fazekas de St. Groth and Webster 1966a, 1966b). These authors called
sequential effects original antigenic sin because the first antigenic expo-
sure influenced response to later antigens.
Sequential effects in B and T cell responses can occur in various ways.
Figure 6.1a shows the most commonly described pattern. Consider two
variant epitopes, A and A′, at the same antigenic site. The specific im-
mune response a against the original epitope A cross-reacts with the
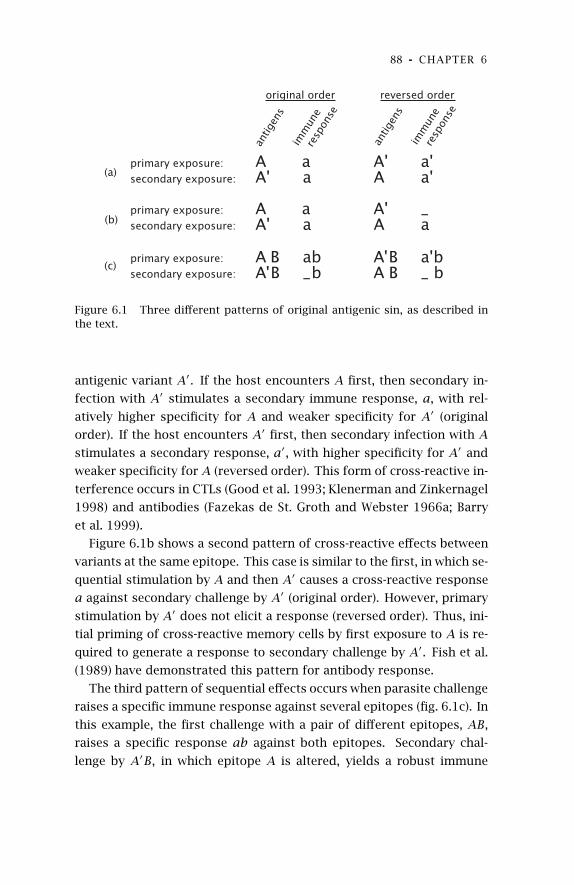
88 CHAPTER 6
A B ab A'B a'bA'B _b A B _ b
A a A' a'A' a A a'
A a A' _A' a A a
(c)
(a)
(b)
primary exposure:
secondary exposure:
primary exposure:
secondary exposure:
primary exposure:
secondary exposure:
antig
ens
imm
une
res
pons
e
antig
ens
imm
une
res
pons
e
original order reversed order
Figure 6.1 Three different patterns of original antigenic sin, as described inthe text.
antigenic variant A′. If the host encounters A first, then secondary in-
fection with A′ stimulates a secondary immune response, a, with rel-
atively higher specificity for A and weaker specificity for A′ (original
order). If the host encounters A′ first, then secondary infection with Astimulates a secondary response, a′, with higher specificity for A′ and
weaker specificity for A (reversed order). This form of cross-reactive in-
terference occurs in CTLs (Good et al. 1993; Klenerman and Zinkernagel
1998) and antibodies (Fazekas de St. Groth and Webster 1966a; Barry
et al. 1999).
Figure 6.1b shows a second pattern of cross-reactive effects between
variants at the same epitope. This case is similar to the first, in which se-
quential stimulation by A and then A′ causes a cross-reactive response
a against secondary challenge by A′ (original order). However, primary
stimulation by A′ does not elicit a response (reversed order). Thus, ini-
tial priming of cross-reactive memory cells by first exposure to A is re-
quired to generate a response to secondary challenge by A′. Fish et al.
(1989) have demonstrated this pattern for antibody response.
The third pattern of sequential effects occurs when parasite challenge
raises a specific immune response against several epitopes (fig. 6.1c). In
this example, the first challenge with a pair of different epitopes, AB,
raises a specific response ab against both epitopes. Secondary chal-
lenge by A′B, in which epitope A is altered, yields a robust immune

IMMUNODOMINANCE WITHIN HOSTS 89
response b against the original variant B but only a weak or absent re-
sponse against the modified epitope A′ (original order). Thus, a strong
response against a constant epitope represses the response against the
changed epitope. This pattern has been observed in sequential influenza
infections (Janeway et al. 1999, p. 411).
It is not known how memory B or T cells reduce stimulation of naive
clones during a secondary challenge. The rapid response from memory
cells may keep parasite density below the threshold required to stim-
ulate naive B or T cells. This would be a form of indirect repression
mediated by the population dynamics of the parasite and the specific
immune cells.
Alternatively, the memory cells may exert a more direct form of re-
pression (Janeway et al. 1999, p. 410). For example, antigen bound to
BCRs on naive B cells stimulates the B cells. But if the bound antigen
also has a free antibody attached to it, the antibody interacts with the
surface receptor FcγRIIB-1 on the naive B cell to repress activity of that
naive B cell. By contrast, antibody bound to antigen-BCR complexes does
not repress memory B cells.
6.4 Problems for Future Research
1. Molecular structure, binding kinetics, and competition between
cellular lineages. Binding kinetics determine winners and losers in the
competition between B cell lineages with different antibody specifici-
ties (Rao 1999). Equilibrium affinity dominates early in the competition,
whereas on-rates dominate later during affinity maturation.
How can one study the biochemical and structural attributes that de-
termine the binding kinetics of antibodies and epitopes? With regard
to equilibrium affinity, one can compare structurally the different anti-
bodies from the naive repertoire in relation to their success in binding
a particular epitope and stimulating its B cell lineage. With regard to
the shaping of on-rates, the hypermutation and selection during affin-
ity maturation produce a lineal sequence of substitutions that enhances
on-rates and perhaps also increases off-rates.
The contrast between the early selection of equilibrium affinity (on:off
ratio) and the later selection of on-rate may provide insight into the
structural features of binding that separately control on-rates and off-
90 CHAPTER 6
rates. This is a superb opportunity to relate structure to function via
the kinetic processes that regulate the immune response.
2. Mathematical models and experimental perturbations. Immuno-
dominance results from the kinetics of cellular lineages. Quantitative
models help to develop hypotheses that can be tested by experimental
perturbation. For example, Rao (1999) suggested that competition for
helper T cells determines the expansion of B cell lineages. He tested this
idea by manipulating the pool of helper T cells, and found that reducing
the helper T cell pool did lower stimulation to B cell lineages.
Rao’s quantitative model could be expanded into a mathematical anal-
ysis, with interactions between binding rates, pool sizes for different B
and T cell lineages, and the rules of competition that determine which
lineages succeed. Such a model presents clear hypotheses about the
quantitative interactions that regulate immunity. Those hypotheses call
attention to the sorts of experimental perturbations that should be in-
formative.
3. Nowak’s predator-prey model of competition. Nowak et al. (1995)
developed a mathematical model of immunodominance. Their model
focused on competition between immune cell lineages for stimulation
by epitopes. Immune cells receive relatively stronger stimulation as
their matching epitopes increase in numbers. The strongest immune-
epitope match leads to the largest, immunodominant population of im-
mune cells. That immunodominant lineage expands until its killing ef-
fect reduces the parasite population within the host down to a point of
balance.
At that balance point, the parasite population stimulates division of
the immunodominant population of immune cells just enough to match
the tendency of the immune cell population to die off. In turn, the immu-
nodominant immune cells reduce the parasites just enough to balance
their births and deaths and hold the parasite population at a constant
level. Other immune cell lineages receive weaker stimulation by the par-
asites because of their weaker binding characteristics to epitopes. Those
subdominant lineages decline because the dominant lineage pushes par-
asite abundance down to the point where the weaker stimulation re-
ceived by the subdominant lineages cannot overcome their tendency to
decline.
IMMUNODOMINANCE WITHIN HOSTS 91
The bottom line from this mathematical analysis matches the sim-
plest, standard theory of predator-prey population dynamics: the most
efficient predator reduces the prey down to a level where less efficient
predators cannot survive.
Can such idealized mathematical models capture the complex molec-
ular and kinetic details of the immune response? The answer depends
on one’s point of view. On the one hand, immunodominance is shaped
in part by competition between lineages of immune cells, and thus the
population dynamics of competition contribute in some way to the pat-
terns of immunodominance. On the other hand, the model abstracts
away many aspects of regulatory control, such as the role of helper T
cells, the distinction between equilibrium binding affinity and kinetic
on-rates of binding in different phases of the immune response, and
structural properties that govern affinity and cross-reactivity.
The mathematical abstraction pays off as long as one understands
the goal: to bring into sharp focus a hypothesis about how essential
processes shape immunodominance. For example, Nowak et al.’s (1995)
model predicts that essential properties of population dynamics and
stimulatory thresholds matter. Some of the studies described in the
text support this prediction. If one suspects that the distinction between
equilibrium affinity and kinetic on-rates matters in an essential way for
immunodominance, then an extended mathematical model would pro-
vide testable predictions about that aspect of the system.
I emphasize these issues here because the dynamics of immune cells
and parasite populations within each infected host provide one of the
few subjects that has been developed mathematically (Nowak and May
2000). The simple principles from those models do seem to be impor-
tant, if only because the rules of population dynamics must play a key
role in shaping how populations of immune cells and parasites interact.
One can, of course, make more specific mathematical models to pre-
dict the dynamics of particular parasites or the role of particular mo-
lecular mechanisms. Those specific models require empirical study of
their specialized predictions. And that is exactly what we want: tests of
clearly and logically formulated quantitative predictions.
4. Helper T cell epitopes in an antibody response. Helper T cells pro-
vide an important stimulus in the development of an antibody response.
As B cells bind antigen to their BCR, they often pull the antigen into the
92 CHAPTER 6
cell. The B cells process protein antigens into small peptides, bind those
peptides to MHC class II molecules, and present the peptide-MHC com-
plexes on their cell surfaces. Helper T cells with matching specificity in
their TCRs bind the peptide-MHC complexes and stimulate the B cells.
Thus, an antigen must have two epitopes to stimulate a robust B cell
response with affinity maturation. One epitope binds the BCR, and a
second must survive digestion and be presented on the B cell surface
bound to a class II molecule for the TCR of a helper T cell.
Several factors likely affect the degree to which helper T cell epitopes
modulate the immunodominance of B cell epitopes. These factors in-
clude the proximity of the two epitopes, the binding kinetics of the T
cell epitope to the TCR, the nature of the helper T cell signal that pro-
vides stimulation to the B cell, and the population dynamics of the helper
T cell lineages with different TCR specificities. For example, Shirai et al.
(1999) showed that the proximity of a helper T cell epitope to a B cell epi-
tope can influence development of the antibody response. In particular,
a helper T cell epitope near the hypervariable region of the hepatitis C
virus envelope gene aids in generation of antibodies to the hypervariable
region.
5. CTL versus antibody response. Antibody attack favors antigenic
variation in parasites’ surface molecules. By contrast, CTLs favor varia-
tion in any parasite molecule that can be presented by the host’s MHC
system. The balance of antibody versus CTL defense affects the popula-
tion dynamics of the parasites within the host, the time before clearance,
and the memory properties of host immunity against reinfection (Seder
and Hill 2000). The factors that tip an immune response toward anti-
body, CTL, or a mixture of the two are not fully understood (Constant
and Bottomly 1997; Power 2000). Studies of model systems sometimes
show a sharp dichotomy between CTL and antibody response controlled
by a simple variable such as antigen dosage (Menon and Bretscher 1998).
But the immune response to many viruses includes robust antibody and
CTL attack (Knipe and Howley 2001).
As more parasite genomes are sequenced, it may be useful to look
at which potential antigenic sites do in fact show significant variation.
Those highly variable sites can be studied to determine if they are CTL
or antibody epitopes, providing clues about which type of immunity
imposes the strongest selective pressure on the parasite.
7 Parasite Escapewithin Hosts
Specific immunity favors parasites that change their epitopes and escape
recognition. In this chapter, I summarize examples of parasite escape
and the consequences for antigenic diversity within hosts.
The first section presents HIV and hepatitis C virus (HCV) as two
pathogens that evolve within hosts to escape specific immunity. HIV
variants escape recognition by CTLs, whereas HCV variants escape rec-
ognition by specific antibodies. HIV also diversifies its surface molecules
in order to attack different cell types. Changing tissue tropisms over
the course of an infection provide an additional force to drive the evolu-
tion of parasite diversification within hosts. HIV and HCV are both RNA
viruses, which mutate frequently and evolve rapidly. The importance
of within-host immune escape by random mutations in DNA-encoded
pathogens remains to be studied.
The second section describes how parasites interfere with host immu-
nity. For example, viruses may disrupt MHC presentation of antigens,
send misleading signals to natural killer cells, block programmed cell
death (apoptosis) of infected cells, or express cytokines that alter im-
mune regulation. In some cases, parasite antigens may lack variation
because the parasite repels immune attack by interfering with host im-
munity rather than altering the specificity of its epitopes.
The third section focuses on parasites that escape host immunity by
switching gene expression between variants stored within each genome.
A single parasite expresses only one of the variants from the archival
genomic library. Each parasite lineage changes expression from one
stored gene to another at a low rate. As host immunity builds against
a common variant, one or more newly expressed variants can rise. The
host must then build another specific immune response against the new
variants. Parasites that switch variants in this way may gain by extending
the total time of infection. Additionally, switching may help to avoid the
immunological memory of a previously infected host.
The fourth section introduces processes that enhance or retard the
coexistence of antigenic variants within hosts. If antigenic variants com-
pete for a common resource, such as host cells or a limiting nutrient,

94 CHAPTER 7
then one competitively dominant variant tends to drive the other vari-
ants extinct. Resource specialization allows different variants to coexist,
for example, when each variant attacks a different cell type. Spatial vari-
ation in the density of resources can allow different variants to dominate
in different compartments of the host’s body.
The final section takes up promising issues for future research.
7.1 Natural Selection of Antigenic Variants
In several pathogens, a changing profile of antigenic variants charac-
terizes the course of infection within a single host. Natural selection
favors variants that escape immune recognition, although escape is of-
ten temporary. Selection may also favor diversification of the pathogens
for the ability to attack different types of host cells. I briefly summarize
a few examples.
SIV AND HIV
Soudeyns et al. (1999) identified the regions of the HIV-1 envelope
under strong selective pressure by analyzing the pattern of nucleotide
changes in the population. They compared the rate of nonsynonymous
(dN) nucleotide replacements that cause an amino acid change versus
the rate of synonymous (dS) nucleotide replacements that do not cause
an amino acid change. A high dN/dS ratio suggests positive natural
selection favoring amino acid change; a low dN/dS ratio suggests nega-
tive natural selection opposing change in amino acids (Page and Holmes
1998; see chapter 15 below).
Soudeyns et al. (1999) found that regions of the envelope gene under
strong positive selection corresponded to epitopes recognized by CTLs.
The nonsynonymous substitutions in these epitopes typically abolished
recognition by a matching CTL clone. The population of viruses accu-
mulated diversity in the dominant epitopes over the course of infection
within hosts. These results suggest that CTL attack based on specific
recognition drives the rapid rate of amino acid replacements in these
epitopes.
Kimata et al. (1999) studied properties of simian immunodeficiency
virus (SIV) isolated from early and late stages of infection within indi-
vidual hosts. The early viruses infected macrophages, replicated slowly,
and the viral particles were susceptible to antibody-mediated clearance.
PARASITE ESCAPE WITHIN HOSTS 95
The late viruses infected T cells, replicated more than 1,000 times faster
than early viruses, and were less sensitive to antibody-mediated clear-
ance.
Kimata et al. (1999) did not determine the viral amino acid changes
that altered cell tropism of SIV. Connor et al. (1997) found that changes
in the host cell coreceptors used by early and late HIV-1 correlated with
changes in cell tropism, but it is not yet clear which changes are essential
for the virus’s tropic specificity. Connor et al. (1997) did show that the
population of early viruses used a narrow range of coreceptors, whereas
the late viruses were highly polymorphic for a diverse range of host
coreceptors. Clearly, the virus is evolving to use various cell types.
The relative insensitivity of late SIV to antibody apparently depended
on increased glycosylation of the envelope proteins (Chackerian et al.
1997). The late viruses with increased glycosylation were not recog-
nized by antibodies that neutralized the early viruses. Viruses that es-
cape antibody recognition gain significant advantage during the course
of infection (Chackerian et al. 1997; Rudensey et al. 1998). Kimata et al.
(1999) showed that, when injected into a naive host, the late SIV did
not stimulate as much neutralizing antibody as did the early SIV. Addi-
tional glycosylation apparently reduces the ability of antibodies to form
against the viral surface. Presumably the glycosylation also hinders the
ability of the virus to initiate infection; otherwise both early and late
viruses would have enhanced glycosylation.
Both the early, macrophage-tropic SIV and the late, T cell–tropic SIV
used the host coreceptor CCR5 (Kimata et al. 1999). That observation
contrasts with a study of early and late HIV-1 isolated from individual
hosts, in which Connor et al. (1997) found that early, macrophage-tropic
viruses depended primarily on the CCR5 coreceptors, whereas the pop-
ulation of late viruses had expanded coreceptor use to include CCR5,
CCR3, CCR2b, and CXCR4.
Many recent studies focus on HIV diversification within hosts (e.g.,
Allen et al. 2000; Goulder et al. 2001; Saha et al. 2001).
HEPATITIS C VIRUS
Farci et al. (2000) obtained hepatitis C virus (HCV) samples at various
stages of infection within individual hosts. They sequenced the envelope
genes from these samples to determine the pattern of evolution within

96 CHAPTER 7
hosts. They then compared the evolutionary pattern with the clinical
outcome of infection, which follows one of three courses: clearance in
about 15% of cases; chronic infection and either slowly or rapidly pro-
gressive disease in about 85% of cases; and severe, fulminant hepatitis
in rare cases.
Farci et al. (2000) sampled three major periods of infection: the in-
cubation period soon after infection; during the buildup of viremia but
before significant expression of specific antibodies; and after the host’s
buildup of specific antibodies.
The sequence diversity within hosts identified two distinct regions
of the envelope genes. The hypervariable region evolved quickly and
appeared to be under positive selection from the host immune system,
whereas other regions of the envelope genes had relatively little genetic
variation and did not evolve rapidly under any circumstances. Thus, the
following comparisons focus only on the hypervariable region.
Those hosts that eventually cleared the virus had similar or higher
rates of viral diversification before antibodies appeared than did those
patients that developed chronic infection. By contrast, after antibod-
ies appeared, chronic infection was correlated with significantly higher
viral diversity and rates of evolution than occurred when the infection
was eventually cleared. It appears that hosts who cleared the infec-
tion could contain viral diversity and eventually eliminate all variants,
whereas those that progressed to chronic infection could not control
viral diversification. The rare and highly virulent fulminant pattern had
low viral diversity and rates of evolution. This lack of diversity suggests
either that the fulminant form may be associated with a single viral lin-
eage that has a strong virulence determinant or that some hosts failed
to mount an effective immune response.
GENERALITY OF WITHIN-HOST EVOLUTION OF ANTIGENS
HIV and HCV share several characters that make them particularly
likely to evolve within hosts. They are RNA viruses, which have rela-
tively high mutation rates, relatively simple genomes, simple life cycles,
potentially high replication rates, and potentially high population sizes
within hosts. HIV and HCV also typically develop persistent infections
with long residence times in each host. If the mutation rate per nucleo-
tide per replication is 10−5 and the population of viruses is on the order
PARASITE ESCAPE WITHIN HOSTS 97
of 1010 within a host, then there are 105 point mutations at every site in
every generation. For every pair of sites, there will usually be at least one
virus that carries mutations at both sites. Thus, there is a tremendous
influx of mutational variation.
Other RNA viruses such as influenza also have high mutation rates
and potentially large populations within hosts, but the hosts typically
clear infections within two weeks. Some within-host evolution very likely
occurs, but it does not play a significant role in the infection dynamics
within hosts.
DNA-based pathogens produce much less mutational variation per
replication. But large population sizes, long infection times, and hy-
permutation of epitopes could still lead to significant evolution within
hosts. At present, the persistent RNA infections have been studied most
intensively because of their obvious potential for rapid evolutionary
change. As more data accumulate, it will be interesting to compare
the extent and the rate of within-host evolutionary change in various
pathogens.
7.2 Pathogen Manipulation of Host Immune Dynamics
Pathogens use several strategies to interfere with host immunity. A
parasite’s exposed surface antigens or candidate CTL epitopes may lack
variation because the parasite can repel immune attack. I do not know
of any evidence to support this idea, but it should be considered when
studying candidate epitopes and their observed level of antigenic varia-
tion.
Several reviews summarize viral methods for reducing host immunity
(e.g., Spriggs 1996; Alcami and Koszinowski 2000). Some bacteria also
interfere with immune regulation (Rottem and Naot 1998). I list just
a few viral examples, taken from the outline given by Tortorella et al.
(2000).
Some viruses interfere with MHC presentation of antigens. Cases oc-
cur in which viruses reduce MHC function at the level of transcription,
protein synthesis, degradation, transport to the cell surface, and main-
tenance at the cell surface.
The host’s natural killer (NK) cells attack other host cells that fail
to present MHC class I molecules on their surface. Viruses that inter-
fere with normal class I expression use various methods to prevent NK
98 CHAPTER 7
attack, for example, viral expression of an MHC class I homolog that
interferes with NK activation.
Host cells often use programmed suicide (apoptosis) to control in-
fection. Various viruses interfere with different steps in the apoptosis
control pathway.
The host uses cytokines to regulate many immune functions. Some
viruses alter expression of host cytokines or express their own copies
of cytokines. Other viruses express receptors for cytokines or for the
constant (Fc) portion of antibodies. These viral receptors reduce con-
centrations of freely circulating host molecules or transmit signals that
alter the regulation of host defense.
7.3 Sequence of Variants inActive Switching from Archives
Some parasites store alternative genes for antigenic surface mole-
cules. Each individual parasite usually expresses only one of the alter-
natives (Deitsch et al. 1997; Fussenegger 1997). Parasite lineages change
expression from one stored gene to another at a low rate. In Trypano-
soma brucei, the switch rate is about 10−3 or 10−2 per cell division (Tur-
ner 1997).
Antigenic switches affect the dynamics of the parasite population
within the host. For example, the blood-borne bacterial spirochete Bor-
relia hermsii causes a sequence of relapsing fevers (Barbour 1987, 1993).
Each relapse and recovery follows from a spike in bacterial density. The
bacteria rise in abundance when new antigenic variants escape immune
recognition and fall in abundance when the host generates a specific
antibody response to clear the dominant variants.
Many different kinds of parasites change their surface antigens by al-
tering expression between variant genes in an archival library (Deitsch
et al. 1997; Fussenegger 1997). This active switching raises interesting
problems for the population dynamics and evolution of antigenic vari-
ation within individual hosts. I briefly describe some of these problems
in the following subsections.
STOCHASTIC SWITCHING VERSUS ORDERED PARASITEMIAS
In Trypanosoma brucei, lineages switch stochastically between vari-
ants. Turner and Barry (1989) measured the switch probability per cell
PARASITE ESCAPE WITHIN HOSTS 99
Table 7.1 Log10 of probability of switching between antigenic variants in Try-panosoma brucei
1.22 1.3 1.61 1.62 1.63 1.64
1.63 −2.7 −2.7 −2.31.64 −3.4 −3.4 −3.41.64 −3.0 −3.8 −3.11.64 −3.4 −2.6 −4.01.64 −2.7 −2.2 −5.7
Values are from Turner and Barry (1989). The numbers in the column headingsand row labels are names for particular antigenic variants. Table entries showlog10 of the switch probability per cell per generation.
per generation for changes between particular antigenic types. Each en-
try in table 7.1 shows log10 of the probability that a cell expressing a
particular variant, designated by a number in the left column, switches
to another variant designated by a number in the column headings.
The different rows in table 7.1 summarize data from five separate ex-
periments. Overall, it appears that each type can potentially switch to
several other types, with the probability of any transition typically on
the order of 10−4 to 10−2. Trypanosoma brucei stores and uses many
different antigenic variants, perhaps hundreds (Vickerman 1989; Barry
1997). Thus, the limited sample in table 7.1 does not provide a compre-
hensive analysis of switch probabilities between all types.
Switches between types within a cellular lineage occur stochastically.
But the sequence of variants that dominate sequential waves of para-
sitemia tends to follow a repeatable order (Gray 1965; Barry 1986). For
example, figure 7.1 shows the date at which different variants first ap-
peared in Trypanosoma vivax infections of rabbits. Some separation
occurs between variants that arise early versus late.
Temporal separation in the rise of different antigenic variants allows
trypanosomes to continue an infection for a longer period of time (Vick-
erman 1989). If all variants rose in abundance early in the infection, they
would all stimulate specific immune responses and be cleared, ending
the infection. If the rise in different variants can be spread over time,
then the infection can be prolonged.
The puzzle is how stochastic changes in the surface antigens of indi-
vidual parasites can lead to an ordered temporal pattern at the level of
the population of parasites within the host (Agur et al. 1989; Frank 1999;

100 CHAPTER 7
Antigenic variants
Firs
t ap
pea
rance
Figure 7.1 The sequence of appearance for nineteen antigenic variants of Try-panosoma vivax in rabbits. Each column shows a different antigenic variant.The rows are the day since inoculation at which a variant was first detectedduring an infection. The days of measurement are, from bottom to top, 12, 19,26, 33, 40, and 47/55, where data from days 47 and 55 are combined in thetop row. Barry (1986) collected data from six rabbits. The diameter of eachcircle shows, for each variant, the frequency of rabbits in which a variant firstappeared on a particular day following inoculation. I discarded variants forwhich there were observations from fewer than five of the six rabbits. I havearbitrarily ordered the variants from those on the left that appear early to thoseon the right that appear late. The vertical bars crudely group the variants intocategories defined by time of appearance.
Turner 1999). Four hypotheses have been developed, none of which has
empirical support at present. I briefly describe each idea.
First, the antigenic variants may differ in growth rate. Those that
divide more quickly could dominate the early phases of infection, and
those that divide more slowly could increase and be cleared later in the
infection (Seed 1978). Computer studies and mathematical models show
that variable growth rates alone can not easily explain wide separation in
the times of appearance of different variants (Kosinski 1980; Agur et al.
1989). Only with a very large spread in growth rates would the slowest
variant be able to avoid an immune response long enough to develop an
extended duration of total infection. Aslam and Turner (1992) measured
the growth rates of different variants and found little difference between
the variants.
Second, parasite cells may temporarily express both the old and new
antigens in the transition period after a molecular switch in antigenic
type (Agur et al. 1989). The double expressors could experience varying
immune pressure depending on the time for complete antigenic replace-
ment or aspects of cross-reactivity. This would favor some transitions
PARASITE ESCAPE WITHIN HOSTS 101
to occur more easily than others, leading to temporal separation in the
order of appearance for different antigenic variants. This model is rather
complex and has gained little empirical or popular support, as discussed
in several papers (Barry and Turner 1991, 1992; Agur 1992; Muñoz-
Jordán et al. 1996; Borst et al. 1997).
Third, the switch probabilities between antigenic variants may be
structured in a way to provide sequential dominance and extended in-
fection (Frank 1999). If the transition probabilities from each variant
to the other variants are chosen randomly, then an extended sequence
of expression cannot develop because the transition pathways are too
highly connected. The first antigenic types would generate several vari-
ants that develop a second parasitemia. Those second-order variants
would generate nearly all other variants in a random switch matrix.
The variants may arise in an extended sequence if the parasite struc-
tures the transition probabilities into separate sets of variants, with only
rare transitions between sets. The first set of variants switches to a lim-
ited second set of variants, the second set connects to a limited third set,
and so on. Longer infections enhance the probability of transmission to
other hosts. Thus, natural selection favors the parasites to structure
their switch probabilities in a hierarchical way in order to extend the
length of infection.
Turner (1999) proposed a fourth explanation for high switch rates
and ordered expression of variants. The parasite faces a trade-off be-
tween two requirements. On the one hand, competition between para-
site genotypes favors high rates of switching and stochastic expression
of multiple variants early in an infection. On the other hand, lower effec-
tive rates of switching later in an infection express variants sequentially
and extend the total length of infection.
Many Trypanosoma brucei infections in the field probably begin with
infection by multiple parasite genotypes transmitted by a single tsetse
fly vector (MacLeod et al. 1999). This creates competition between the
multiple genotypes. According to Turner (1999), competition inten-
sifies the selective pressure on parasites to express many variants—
variation allows escape from specific immunity by prior infections and
helps to avoid cross-reactivity between variants expressed by different
genotypes. These factors favor high rates of stochastic switching.
The effective rate of switching drops as the infection progresses be-
cause the host develops immunity to many variants. Effective switches
102 CHAPTER 7
occur when they produce novel variants, and the rate at which novel vari-
ants arise declines over the course of infection. Those novel variants,
when they do occur, can produce new waves of parasitemia, promoting
parasite transmission.
Turner’s idea brings out many interesting issues, particularly the role
of competition between genotypes within a host. But his verbal model
is not fully specified. For example, delayed expression of some variants
and extended infection depend on the connectivity of transition path-
ways between variants, an issue he does not discuss. The problem calls
for mathematical analysis coupled with empirical study.
ROLE OF PRIOR EXPOSURE
Hosts that have recovered from an infectious parasite that switches
antigenic type may retain immune memory for many antigenic variants.
Successful reinfection would require a parasite to express a variant for
which the host lacks specific memory. Antigenic variants expressed
from an archival library can help a parasite to overcome immune mem-
ory of previously infected hosts.
The role of antigenic variation in avoiding immune memory from prior
infections depends on several factors. How many variants stimulate
memory during a typical infection? What percentage of infected hosts
recover and survive? What is the rate of death among surviving hosts
(population memory decay) relative to the rate at which naive, newborn
hosts enter the population? What percentage of hosts suffer a primary
infection? What percentage become reinfected?
Again, these interacting quantitative factors can be combined into a
mathematical model. A model would suggest what conditions must be
met for archival antigenic variation to be an effective strategy to avoid
host immune memory.
7.4 Ecological Coexistence of Variants within a Host
Two or more antigenic variants may coexist within a host during a per-
sistent infection. Various processes tend to promote or destroy coexis-
tence.
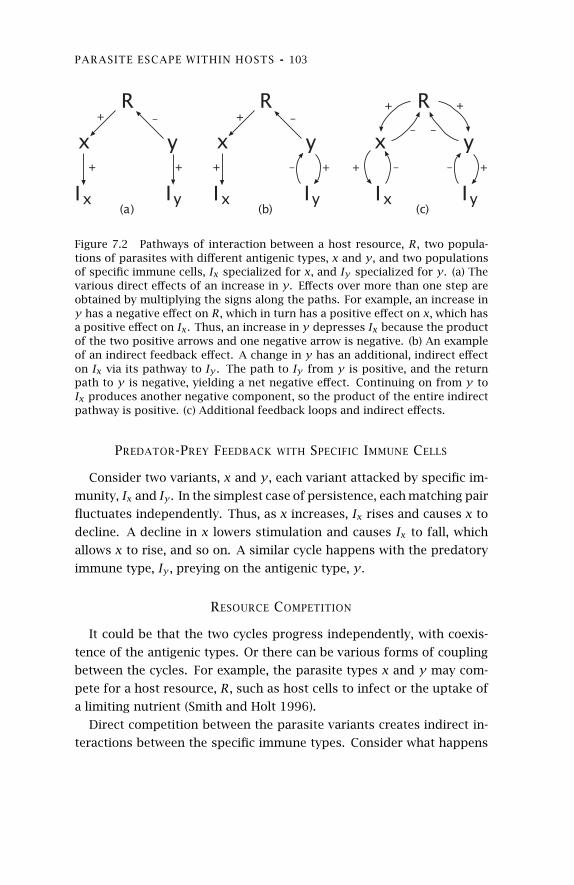
PARASITE ESCAPE WITHIN HOSTS 103
R
x y
Ix Iy(a)
R
x y
Ix Iy(b)
+
–+
+ +
+
+
–
–
R
x y
Ix Iy(c)
+–+ –
+
–
+
–
Figure 7.2 Pathways of interaction between a host resource, R, two popula-tions of parasites with different antigenic types, x and y , and two populationsof specific immune cells, Ix specialized for x, and Iy specialized for y . (a) Thevarious direct effects of an increase in y . Effects over more than one step areobtained by multiplying the signs along the paths. For example, an increase iny has a negative effect on R, which in turn has a positive effect on x, which hasa positive effect on Ix. Thus, an increase in y depresses Ix because the productof the two positive arrows and one negative arrow is negative. (b) An exampleof an indirect feedback effect. A change in y has an additional, indirect effecton Ix via its pathway to Iy . The path to Iy from y is positive, and the returnpath to y is negative, yielding a net negative effect. Continuing on from y toIx produces another negative component, so the product of the entire indirectpathway is positive. (c) Additional feedback loops and indirect effects.
PREDATOR-PREY FEEDBACK WITH SPECIFIC IMMUNE CELLS
Consider two variants, x and y , each variant attacked by specific im-
munity, Ix and Iy . In the simplest case of persistence, each matching pair
fluctuates independently. Thus, as x increases, Ix rises and causes x to
decline. A decline in x lowers stimulation and causes Ix to fall, which
allows x to rise, and so on. A similar cycle happens with the predatory
immune type, Iy , preying on the antigenic type, y .
RESOURCE COMPETITION
It could be that the two cycles progress independently, with coexis-
tence of the antigenic types. Or there can be various forms of coupling
between the cycles. For example, the parasite types x and y may com-
pete for a host resource, R, such as host cells to infect or the uptake of
a limiting nutrient (Smith and Holt 1996).
Direct competition between the parasite variants creates indirect in-
teractions between the specific immune types. Consider what happens
104 CHAPTER 7
if y increases. Figure 7.2a shows that a rise in y stimulates Iy and re-
duces the available host resources, R. A drop in R depresses x, which
in turn lowers stimulation to Ix. Overall, if we ignore all feedbacks, an
increase in y enhances Iy , and depresses x and Ix.Feedbacks occur, and their consequences must be followed. Contin-
uing with the example, figure 7.2b shows that a rise in Iy grazes y to
a lower value, allowing host resources, R, to recover, which enhances xand stimulates Ix. Figure 7.2c shows that several other feedbacks exist
even in this highly oversimplified network of interactions—to trace all
consequences is beyond normal intuition. Analysis requires mathemat-
ical models (Nowak and May 2000).
For this particular example, it turns out that resource competition by
itself typically reduces the potential for coexistence of antigenic variants
compared with the case in which no competition occurs. If Iy drives yto extinction in the absence of competition, then additional competition
for resources will usually not save y . Rather, the competition from xfurther decreases y ’s chances for survival.
Several studies suggest that resource competition between parasites
may sometimes influence the within-host dynamics of infection. In per-
sistent malaria infections, competition between Plasmodium for suscep-
tible erythrocytes apparently plays an important role (Gravenor et al.
1995; Hetzel and Anderson 1996; Gravenor and Lloyd 1998). Wodarz
et al. (1999) proposed that the spread of human T cell leukemia viruses
(HTLV-1) between host cells is limited by availability of susceptible, un-
infected T cells.
Turner et al. (1996) inferred density-dependent effects on the growth
rate of the blood-borne parasite Trypanosoma brucei. Although Tur-
ner et al. (1996) did not demonstrate parasite competition for host re-
sources, it seems likely that some resource limitation arises because of
the very high parasite densities that occur at peak parasitemia, on the
order of 106 to 107 parasites per ml of blood. These studies did not
directly discuss antigenic variation, but they suggest that resource com-
petition may be important.
RESOURCE SPECIALIZATION
Antigenic variants may specialize on different host resources. For
example, parasite surface molecules may influence tropism for host cell

PARASITE ESCAPE WITHIN HOSTS 105
type or efficiency in uptake of different host nutrients. To the extent that
antigenic variants do differ in their use of host resources, coexistence
becomes easier to maintain by reducing the direct competition between
the variants.
Variation in tissue tropism appears to be associated with antigenically
variable surface molecules in Neisseria gonorrhoeae (Gray-Owen et al.
1997; Virji et al. 1999). In Neisseria, variable cell tropism may be impor-
tant in sequentially colonizing different tissues as invasion and spread
develop, with little direct competition between the antigenic variants.
HIV provides a potential case of competition and resource specializa-
tion between variants. Connor et al. (1997) found changes in corecep-
tor use by early and late HIV-1 correlated with changes in cell tropism.
The population of early viruses used a narrow range of coreceptors,
whereas the late viruses were highly polymorphic for a diverse array of
host coreceptors. As the population of viruses builds and depresses the
abundance of commonly infected cell types, diversification to different
cell tropisms reduces competition.
SPATIAL SEGREGATION
Variable resource concentration can also favor antigenic diversity.
Consider a contrast between two antigenic variants. The first has a sur-
face antigen that provides superior entry into host cells, but this variant
is cleared at a higher rate. The second variant has a lower rate of entry
into host cells, but is cleared at a lower rate. The first type interferes
with the second when both are common.
This infection-clearance trade-off can promote coexistence by spatial
segregation. For example, host compartments with low resource lev-
els cannot sustain the first type—limited host cells reduce the produc-
tion rate below the high clearance rate. The second, weaker competitor
dominates. By contrast, in compartments with high resource levels, the
stronger type dominates by outcompeting the weaker type.
OTHER FACTORS
There are, of course, many other factors that influence the abundance
of antigenic variants and immune cells. The immunogenicity of the anti-
genic types may differ, varying the rate of parasite killing and the stimu-
latory signals to the immune cells. Each parasite carries many different
106 CHAPTER 7
antigenic determinants, raising once again issues of immunodominance,
which must be understood in terms of populations of parasite variants
and populations of immune cells with matching specificities.
Each factor can have complex dynamical consequences. Mathematical
studies show that even rather simple interactions often lead to fluctuat-
ing abundances because of the nonlinear processes inherent in popula-
tion dynamics. Thus, fluctuating abundances of antigenic variants and
matching immune specificities may often occur in persistent infections
(Nowak and May 2000).
7.5 Problems for Future Research
1. Mutational distance required for escape. How many amino acid sub-
stitutions are needed for new variants to escape immunity against the
original epitope? Does escape usually arise from a single substitution,
or are multiple substitutions often required? If laboratory mice can be
used as a model, it would be interesting to infect replicates of a common
host genotype by a cloned pathogen genotype. One could then study the
relative effect of genotype and stochastic factors on the number of sub-
stitutions in escape variants and the genetic pattern of diversification
in escape. I discuss relevant preliminary studies in later chapters on
experimental evolution.
2. Transmissibility of escape variants. Epitopes often occur in key
surface molecules used for attachment or in important enzymes such
as replication polymerases. Escape variants gain by avoiding specific
immunity but may impose costs by lowering other components of par-
asite fitness. I mentioned earlier that SIV isolated late in infections had
increased glycosylation of surface antigens that reduced susceptibility
to antibodies. The glycosylation also reduced the degree to which vi-
ruses stimulated an antibody response when injected into new hosts. It
would be interesting to know if glycosylation reduces transmissibility
or some other component of viral fitness.
Escape within a host does not necessarily reduce transmissibility or
other components of fitness. Goulder et al. (2001) studied human moth-
ers with the MHC allele B27 infected by HIV-1. B27 recognizes an im-
munodominant and highly conserved CTL epitope in the viral Gag pro-
tein. Escape mutants at this epitope persist and enhance progression to
PARASITE ESCAPE WITHIN HOSTS 107
disease. Mothers can transmit this escape variant to their offspring, who
then target a subdominant B27 epitope and fail to contain the infection.
These escape variants remain stable and do not revert to the original
type when passaged in cell culture. It would be interesting to study sim-
ilar issues with SIV, in which it would be possible to do experiments in
vivo and test whether there is a fitness cost associated with CTL escape.
3. Dynamics of infection in parasites that switch between archival
variants. Antigenic switching from archival libraries generates inter-
esting dynamics within the host. Typically, the first variants increase
rapidly, causing a high density of parasites within the host. Specific im-
munity then rises against those initial variants, causing a decline in the
parasite population within the host. The initial, dense parasitemia gen-
erates variants by occasional switching. The variants rise in abundance
during or after the decline of the first parasite burst.
These dynamics point to several questions. What is the basic tim-
ing for the initial growth of the parasite population, the rise in specific
immune cells, and the decline in the initial parasitemia? What are the
densities and the diversity of antigenic variants during the initial para-
sitemia? What are the timings and the shapes of the growth curves for
the populations of antigenic variants?
At what parasite density do the variants begin to stimulate a specific
immune response? That stimulatory threshold sets the pace at which
the host can raise a new wave of immunity to combat the second parasite
wave. How many variants rise in the second wave? What is the timing
and pattern of new variants generated by parasites in the second wave?
How do the coupled dynamics of specific immune cell populations and
matching parasite variants together determine the total length of infec-
tion and the fluctuating density of parasites available for transmission?
What determines the order in which parasite variants rise in successive
parasitemias?
4. Immune dynamics in different body compartments. Different par-
asite surface molecules may cause infection of different body compart-
ments. The surface molecules that affect tissue tropism may also be
strong antigenic determinants. I mentioned that diversifying tissue tro-
pisms during the course of an infection can diversify antigenic variation
within the host. In addition, the dynamics of host immunity and the

108 CHAPTER 7
ability of immune effectors to attack parasites likely vary among body
compartments. Thus, variants with certain tropisms may sequester
themselves in refuges from immune pressure. These protected sites
may provide a source of chronic infection or generate relapses after ap-
parent clearance of the initial infection.

PART IV
POPULATIONCONSEQUENCES


8 Genetic Variabilityof Hosts
In this chapter, I discuss the ways in which host immune responses
vary genetically. Host variability affects the relative success of different
parasite epitopes and the distribution of antigenic variants.
The first section reviews host variation in specific recognition. MHC
alleles are highly polymorphic—different hosts usually have different
MHC genotypes and therefore recognize different spectrums of parasite
epitopes. By contrast, limited genetic variability occurs in the germline
genes that encode the antibody and T cell binding regions. Instead, vari-
able antibody and T cell binding sites arise by somatic recombination.
Somatic mechanisms to generate variation may buffer the need for hosts
to vary genetically.
The second section summarizes genetic polymorphisms in immune
regulation. Hosts vary genetically in many of the controls of immune re-
sponse. This variation leads to differences in the thresholds that trigger
immunity and in the intensity of particular immune effectors deployed
against parasitic attack. Quantitative differences in immune regulation
can affect the intensity of selection on antigenic variants and the im-
munodominance of host responses against different variants. Immu-
nodominance, in turn, defines the selective pressures that shape the
distribution of antigenic variants.
A few major polymorphisms have been found in the promoters of
cytokines, molecules that regulate key aspects of the immune system.
Different promoter genotypes correlate with better or worse success in
combating certain pathogens. Regulatory polymorphisms may be main-
tained by trade-offs, in which a more intense immune response clears
parasites more effectively but also causes more collateral tissue damage
to the host.
Major regulatory polymorphisms have different alleles at high fre-
quencies, each allele with a significantly different effect on immune re-
sponse. High frequencies and large effects make such polymorphisms
relatively easy to find.
Rare variants of small effect undoubtedly occur throughout the im-
mune regulatory cascade, maintained by a balance between mutation

112 CHAPTER 8
and selection. Each individual probably carries several minor regula-
tory variants, causing significant quantitative genetic variability between
hosts in the regulation of the immune response.
The final section takes up promising issues for future research.
8.1 Polymorphisms in Specificity
MHC
Polymorphisms sometimes occur in host molecules that directly bind
to parasites. For example, the MHC class I and II alleles are the most
polymorphic of all human genes. The three main class I loci for present-
ing peptides, designated A, B, and C, currently have 175, 349, and 90
alleles described, respectively.
The class II molecules have separate designations for individual com-
ponents of each molecule. The highly polymorphic components tend
to be in the β1 chains that contact bound peptides (Marsh et al. 2000).
The β1 chains for the DR, DQ, and DP class II molecules currently have
246, 44, and 86 alleles described, respectively. The IMGT/HLA online
database lists recent allelic counts for both class I and class II loci, as
described in Robinson et al. (2000; see http://www.ebi.ac.uk/imgt/hla/).
The MHC molecules bind to parasite peptides and present those pep-
tides to T cells. Differences in MHC genotype cause significant variation
between hosts in their ability to bind particular antigenic variants (Yew-
dell and Bennink 1999). Many studies have shown associations between
MHC genotype and disease susceptibility (Hill 1998).
The MHC molecules also shape the TCR repertoire. As T cells mature
in the thymus, they bind to MHC molecules presenting self-antigens.
Those TCRs that bind too strongly cause the associated T cells to die.
Those TCRs that bind too weakly fail to provide sufficiently strong rein-
forcing signals, again causing the associated T cells to die. Less than 1%
of T cells pass these checks (Marsh et al. 2000). Thus, the particular MHC
alleles of each individual strongly influence the naive TCR repertoire.
Variant naive repertoires lead to different TCR clones being stim-
ulated in different individuals when challenged by the same epitope
(Maryanski et al. 1996, 1999). Because helper T cells influence anti-
body response and other aspects of immune regulation, the variable TCR
repertoire may have additional consequences beyond CTL variability.
GENETIC VARIABILITY OF HOSTS 113
Proteolysis of antigens and transport of peptides determine the pep-
tides available for MHC binding. Strong challenge by a particular para-
site could lead to selection favoring or disfavoring specific patterns of
proteolysis. However, I am not aware of any evidence for polymorphism
in proteolytic enzymes. The peptide transporter, TAP, is polymorphic:
the two subunits, TAP1 and TAP2, have six and four sequences listed
in the IMGT/HLA database (Robinson et al. 2000). So far, no functional
differences between alleles have been found (Marsh et al. 2000).
TCR GERMLINE
Different TCR germline loci somatically recombine and mutate to gen-
erate the DNA that codes for the variable, antigen-binding part of the
TCR (Janeway et al. 1999). These generative mechanisms allow each
individual to produce a huge variety of TCR binding specificities.
The intensity of direct selection on germline polymorphisms may be
rather weak because specific recognition of antigens depends primarily
on somatic mechanisms to create variability. However, the germline
alleles do set the initial conditions on which somatic processes build, so
it is certainly possible that germline polymorphisms influence individual
tendencies to react to particular antigens.
The limited data currently available indicate that some germline poly-
morphisms exist for the TCR (e.g., Reyburn et al. 1993; Hauser 1995;
Moffatt et al. 1997; Moody et al. 1998; Sim et al. 1998; see http://imgt.
cines.fr). One interesting study found an interaction between a human
germline polymorphism in a subunit of the TCR (VA8.1) and an MHC
class II polymorphism (HLA-DRB1) (Moffatt et al. 1997). The authors
analyzed two variants of the VA8.1 allele and the six most common
HLA-DRB1 alleles. Individuals with enhanced allergic response to a dust
mite antigen tended to have one of the two VA8.1 variants combined
with the HLA-DRB1*1501 allele.
Moffatt et al. (1997) measured allergic response by the titer of IgE an-
tibodies, which stimulate allergic symptoms (Janeway et al. 1999). Most
likely, the TCR and MHC class II polymorphisms influence IgE via helper
T cells—TCR binding to antigens presented by MHC class II stimulates
helper T cells, which in turn play a role in antibody stimulation. Thus,
specific recognition by the TCR and MHC can affect specific recognition
by antibodies (Shirai et al. 1999).
114 CHAPTER 8
Su et al. (1999) compared different TCR germline alleles across sev-
eral vertebrate species in a phylogenetic analysis. Differences between
species do not directly influence antigenic variation in parasites unless
the parasites infect different species. But phylogenetic comparisons
may illuminate the forces that shape TCR germline variability within
species.
BCR GERMLINE
The variable portion of the B cell receptor (BCR) develops by somatic
recombination and mutation similar to the processes that generate vari-
able TCRs. Antibodies are secreted forms of the BCR. I found only one
report of a major germline polymorphism in the alleles that make up
the variable components of the BCR. The same polymorphic alleles at
a single BCR germline locus occur in both rabbits and snowshoe hares,
suggesting that this polymorphism was inherited from a common an-
cestor and maintained for a long time in each species (Su and Nei 1999).
Hauser (1995) suggested that somatic hypermutation (affinity matura-
tion) of the BCR provides a buffer between the germline and the matured
BCR specific for particular antigens. The TCR has limited somatic muta-
tion after the initial genetic recombinations, perhaps exposing germline
TCRs to more intense selective pressures than BCRs. However, lack of
observed variability in germline BCR genes may simply reflect limited
study.
MATCH TO VARIANT CELLULAR RECEPTORS
Major deletions of cellular receptor genes can interfere with parasites
that depend on those receptors for binding or entry into cells. For exam-
ple, the human CCR5 gene encodes a coreceptor required for HIV-1 to
enter macrophages. A 32-bp deletion of this gene occurs at a frequency
of 0.1 in European populations. This deletion prevents the virus from
entering macrophages (Martinson et al. 1997; O’Brien and Dean 1997;
Smith et al. 1997).
Hill (1998) reviews cases in which variations in the hosts’ vitamin D
and other cellular receptors are associated with susceptibility to various
diseases. It is not clear whether minor variants of cellular receptors
occur sufficiently frequently to favor matching variation of parasites for
attachment to those receptors.
GENETIC VARIABILITY OF HOSTS 115
8.2 Polymorphisms in Immune Regulation
EXAMPLES OF QUANTITATIVE VARIABILITY
Stimulation of naive CD4+ helper T cells leads to proliferation of ei-
ther TH1 or TH2 helper T cells. TH1 response typically stimulates CTL
proliferation, whereas TH2 response typically stimulates antibody pro-
duction.
Several studies have found genetic variation among hosts in the reg-
ulation of TH1 versus TH2 response. In mice, the actions of multiple
genetic loci combine to determine regulation of TH1 versus TH2 against
Leishmania infections (Coffman and Beebe 1998; Power 2000). Mice that
develop a TH1 response control infection because Leishmania can be
cleared by CTLs. By contrast, those mice that develop a TH2 response
fail to clear infection because Leishmania cannot be controlled by a dom-
inant antibody response.
In pigs, polygenic control has been observed for several traits in-
cluding antibody response, with an important contribution of non-MHC
loci; proliferative and cytokine responses of mononuclear blood lym-
phocytes, such as T cells, B cells, and natural killer (NK) cells; T cell–
mediated inflammatory response to innocuous antigens (delayed-type
hypersensitivity); and the total number and relative proportions of the
various kinds of blood-borne immune cells (reviewed by Edfors-Lilja
et al. 1998). High heritabilities have been estimated for several of these
traits.
Studies of other organisms have also found polygenic control of quan-
titative immune responses outside the MHC region (Biozzi et al. 1982).
Linkage studies of mice have begun to map locations of genes that in-
fluence quantitative variability in components of immunity (Puel et al.
1995; Wu et al. 1996). Many studies of humans report nucleotide poly-
morphisms in promoters of cytokines and other immune regulatory loci
(Daser et al. 1996; Agarwal et al. 2000; Terry et al. 2000). Some human
polymorphisms are associated with differential response to particular
diseases (Hill 1998; Foster et al. 2000).
INTERLEUKIN 6 (IL6) PROMOTER POLYMORPHISM
IL6 plays a central role in the regulation of immunity (Janeway et al.
1999). It stimulates hepatic acute phase response to infection, induc-

116 CHAPTER 8
tion of fever, differentiation and activation of macrophages and T cells,
growth of B cells, and many other functions (Terry et al. 2000). Many
cell types release IL6 in response to infection or irritating stimuli.
The rate of gene expression regulates plasma levels of IL6 because
this cytokine is cleared rapidly from circulation. Various transcription
factors and steroid hormones interact with the promoter region of this
gene to produce synergistic combinations of positive and negative stim-
uli for transcription (Terry et al. 2000).
Terry et al. (2000) sequenced the promoter region of IL6 for 442 hap-
lotypes from 221 humans. They found polymorphisms at three nucleo-
tide sites and a variable-length AT run. These promoter polymorphisms
influenced expression level in a nonadditive way—a single nucleotide
change may have been associated with higher or lower levels of expres-
sion depending on other variable sites in the haplotype. In addition, the
IL6 polymorphisms influenced expression in different ways in response
to different stimulatory signals and when in different cell types.
The three single nucleotide polymorphisms are separated by 25 and
398 nucleotides. The GGG combination occurs in 54% of haplotypes,
AGC in 40%, and GCG in 5%.
It is not clear what processes maintain this polymorphism. I consider
a few possibilities in the remainder of this section and in the following
sections.
Each haplotype could be associated with a particular variant of the
coding region for IL6, thereby linking the pattern of gene expression
to different properties of the cytokine. However, Terry et al. (2000) se-
quenced the coding region from twenty individuals and found no poly-
morphisms. Thus, positive interactions and linkage between promoters
and coding regions seem unlikely in this case.
Alternatively, polymorphisms that affect phenotype are often main-
tained by a balance between the rate at which deleterious mutation adds
variability and the rate at which selection can remove deleterious mu-
tants. Mutation-selection balance probably explains a significant por-
tion of the total quantitative genetic variability observed in populations
(Barton and Turelli 1987).
Mutation-selection balance usually matches a high-frequency allele
maintained by selection against a distribution of low-frequency mutant
variants. Natural selection culls those lower-fitness variants, but mu-
tation maintains a constant flow of new variants. For the IL6 polymor-
GENETIC VARIABILITY OF HOSTS 117
phism, mutation-selection balance cannot explain the similar frequen-
cies of the two dominant haplotypes, because neither haplotype is a
rare mutational variant of the other. Mutation-selection balance proba-
bly does explain the two rare trinucleotide haplotypes at frequencies of
less than 1% observed by Terry et al. (2000).
Daser et al. (1996) and Mitchison (1997) suggested that heterozygosity
in cytokine promoters enhances flexibility of the immune response. En-
hanced flexibility could occur in heterozygotes by increasing the range
of inputs that control the response kinetics of the cytokine.
Heterozygote advantage could explain the observed frequencies of
the two common haplotypes if fitnesses are ordered as GGG/AGC >
GGG/GGG > AGC/AGC, in which the heterozygote is more fit than ei-
ther homozygote. However, by this scenario of heterozygote advantage,
many individuals would carry lower-fitness homozygote genotypes. Giv-
en the three haplotype frequencies listed above, the expected frequency
of homozygotes would be the sum of the squared haplotype frequencies,
or 45%.
The frequency of heterozygotes would be increased by a larger num-
ber of promoter haplotypes. But such diversity would mean that any
individual carried two randomly chosen haplotype patterns of regula-
tory control among the possible haplotypes. It is difficult to image how
complementarity between diverse regulatory haplotypes would occur.
MHC CLASS II PROMOTER POLYMORPHISM
Several studies describe promoter polymorphisms of the class II loci
(Louis et al. 1993; Reichstetter et al. 1994; Guardiola et al. 1996; Cowell
et al. 1998; Mitchison et al. 2000). These regulatory polymorphisms can
affect the relative expression of the class II alleles in different cell types.
For example, Louis et al. (1994) and Vincent et al. (1997) showed that
different class II alleles at the HLA-DRB locus are expressed at differ-
ent levels. Variable transcription rates were associated with nucleotide
polymorphisms in the promoters of these alleles.
The class II molecules present antigens to the helper T cells. Those
helper T cells tend to differentiate into type 1 or type 2 (TH1 versus TH2)
responses. The TH1 versus TH2 split influences the balance between
several immune effector functions, particularly CTLs favored by TH1
and antibodies favored by TH2.

118 CHAPTER 8
Cowell et al. (1998) and Mitchison et al. (2000) have argued that levels
of MHC class II expression, under the control of regulatory polymor-
phisms, influence the tendency for TH1 versus TH2 response. Higher
class II expression appears to trigger a cascade leading toward TH1
helper T cells, whereas lower class II expression favors development
of TH2 helper T cells. Thus, variable regulatory genotypes can influence
important aspects of the hosts’ immune responses.
Cowell et al. (1998) propose two processes by which heterozygosity
in MHC class II regulatory regions might be favored. First, they suggest
that in a heterozygote “one pattern of expression could favor differen-
tiation of TH1 cells while another could favor TH2’s, so that the two in
combination together would generate a balanced immune response.”
Heterozygote advantage imposes a severe cost, because a binary trait
such as high or low expression causes at least 50% of the population to
be homozygous and therefore at a disadvantage. Tissue-specific expres-
sion or intermediate expression does not require heterozygosity with the
associated cost of frequent, disadvantaged homozygotes.
Cowell et al. (1998) propose a second explanation in which promot-
ers are advantageously linked to particular MHC alleles. They argue
that “the TH1-favoring [pattern of expression] might become associated
with exons involved in resistance to infections best dealt with by TH1
cells, and the TH2-favoring pattern with resistance to infections needing
TH2’s.”
The available data do not provide a clear test of synergism between
particular promoters and class II alleles. The most interesting informa-
tion comes from sequences of the promoter regions linked to different
class II HLA-DRB1 alleles. Louis et al. (1993) found that divergence of
promoters followed the phylogenetic history for the linked structural
alleles.
Continuous divergence of promoters as a function of phylogenetic
distance suggests drifting changes constrained by the balance between
mutational input and selection to maintain functional integrity. There
may also be a tendency for compensatory nucleotide changes, in which
one slightly deleterious substitution is compensated by a second substi-
tution at a different site (Hartl and Taubes 1996; Burch and Chao 1999).
Phylogenetic divergence does not rule out Cowell et al.’s (1998) hy-
pothesis of functional synergism between promoter and allele. Common
phylogeny provides the background for all evolutionary divergence, but
GENETIC VARIABILITY OF HOSTS 119
other processes can occur. For example, functionally synergistic associ-
ations may exist between nucleotides in promoter and structural regions
that cannot be explained by common phylogeny.
BENEFITS AND COSTS OF CYTOKINE EXPRESSION
Increased expression of the immune response can have both benefits
and costs. On the positive side, a more intense immune response may
clear infections more rapidly. On the negative side, immune effectors
can often be harsh medicine, causing collateral damage to host tissues.
Promoter polymorphisms may be maintained by the balance between
effective clearance and tissue damage. For example, the human IL1 pro-
moter polymorphism affects expression of the pro-inflammatory cyto-
kine IL1β. Increased expression of this cytokine plays an important
role in stimulating the inflammatory immune response against the wide-
spread gastric pathogen Helicobacter pylori (Jung et al. 1997). Host ge-
notypes with stronger IL1β responses probably clear the infection more
effectively, but also suffer greater gastric tissue damage and a higher
risk of gastric cancer (El-Omar et al. 2000).
A different trade-off occurs between high and low expression of IL10
during HIV-1 infection (Shin et al. 2000). Humans homozygous for a
more active promoter variant of IL10 had a significantly delayed on-
set of AIDS relative to hosts either heterozygous or homozygous for a
less active promoter. IL10 inhibits macrophage proliferation (Kollmann
et al. 1996; Schols and De Clercq 1996), possibly reducing the number
of activated macrophages available for viral replication. In this case,
down-regulation of an immune effector, the macrophages, appears to
reduce viral spread. Against other pathogens that do not replicate in
macrophages, high IL10 expression and reduced macrophage prolifera-
tion may favor the pathogen.
MAJOR POLYMORPHISMS VERSUS RARE VARIANTS
The examples of variable regulatory control all have major polymor-
phisms in promoters, with two or more alternative haplotypes at sig-
nificant frequencies. Initial screening would naturally turn up major
polymorphisms rather than rare variants, which would be harder to de-
tect. But each regulatory element inevitably has some rare variants in
the population. Mutation provides a constant influx of such variants;

120 CHAPTER 8
natural selection culls those variants slowly in proportion to their neg-
ative effects on fitness.
The balance of mutation and selection almost certainly creates quan-
titative variability in every aspect of immune regulation. Each individual
likely has several rare mutants spread across different regulatory steps,
causing variable quantitative genetic profiles for the thresholds to trig-
ger responses and the intensities of responses.
The balance of mutation and selection sets the amount of quantita-
tive variability in each regulatory component. The influx of quantitative
variability depends on how mutations translate into quantitative effects
on regulation. The culling of variation depends on the intensity of nat-
ural selection acting on the particular regulatory step. Steps that affect
fitness relatively weakly will accumulate relatively more variation, un-
til a balance of mutation and selection occurs. Steps that affect fitness
strongly will accumulate relatively less variation. In each case, the vari-
ation in fitness will be roughly the same.
The major polymorphisms likely arise by processes in addition to
mutation-selection balance. In those cases, various trade-offs between
immune control of parasites and collateral damage probably balance
the fitnesses of different variants. The collateral damage may be inflam-
matory or other negative effects of a hyperimmune response, as in the
gastric tissue damage promoted by IL6. Or more rarely, the damage may
arise from reducing the proliferation of immune cells that normally con-
trol pathogens but also can be the target of parasitic attack. This latter
trade-off appears to occur in IL10 control of macrophages in the context
of HIV-1 infection.
Regulatory variability may sometimes alter immunodominance be-
cause cytokines modulate positive and negative stimulation of T and
B cell clones. Badovinac et al. (2000) provide a hint of how regulatory
cytokines influence immunodominance of a CTL response in mice. In
their study, normal levels of interferon-γ were associated with about a
5-fold ratio of immunodominant to subdominant T cell clones for two
Listeria monocytogenes epitopes. By contrast, reduced interferon-γ was
associated with roughly equivalent clonal expansion of CTLs specific for
these two epitopes.
Badovinac et al.’s (2000) study shows that variations in nonspecific
components of immune regulation may affect immunodominance. Im-
munodominance, in turn, affects the intensity of selection on particular
GENETIC VARIABILITY OF HOSTS 121
pathogen epitopes. Thus, variations in immune regulation may influ-
ence patterns of antigenic variation.
8.3 Problems for Future Research
1. Effects of antigenic variation on MHC diversity. Parasites may fa-
vor change in the frequencies of host MHC alleles. For example, the
human class I MHC molecule B35 binds to common epitopes of Plasmo-
dium falciparum’s circumsporozoite protein (Gilbert et al. 1998). The
B35 allele occurs in higher frequency in The Gambia, a region with en-
demic malaria, than in parts of the world with less severe mortality from
malaria.
It would be interesting to know if variant epitopes influence the fre-
quency of matching MHC alleles. For example, one epitope variant may
be common in one location and another variant common in another lo-
cation. Do those variants affect the local frequencies of MHC alleles in
the host population? This question focuses attention on the kind of
selection pressure parasites impose on MHC alleles.
Each MHC allele may have a qualitative relationship with each par-
ticular epitope, in that one amino acid substitution in the epitope can
have a large effect on binding. But over the lifetime of an individual,
each MHC type meets many potential epitopes from diverse parasites.
Thus, MHC alleles vary quantitatively in the net benefit they provide by
their different matches to the aggregate of potential epitopes. It may
be rather rare for a single parasite to impose strong, sustained pressure
on a particular MHC allele. Perhaps only major killers of young hosts
can cause such strong selection. Mathematical models could clarify the
nature of aggregate selection imposed on MHC alleles.
2. Effects of MHC diversity on antigenic variation. Does the distri-
bution of MHC alleles in the host population shape the distribution of
antigenic variants?
It would be interesting to compare parasites in two locations, each
location with hosts that have different frequencies of MHC alleles. In
principle, differing host MHC profiles could influence antigenic varia-
tion. But the pattern of selection may be complex. Each epitope could
potentially interact with several MHC alleles. The net effect depends on
the balance of fitness gains by an escape substitution against one MHC
allele and the potential costs of that substitution in terms of functional
122 CHAPTER 8
performance and the possibility of creating enhanced binding to other
MHC alleles.
It would also be interesting to compare parasites that attack only a
single host species with those that attack multiple vertebrate species.
The generalist parasites face variable selective pressures in the different
hosts.
3. Regulatory variability of immune response. I described a few major
polymorphisms in immune regulatory promoters. I also listed several
hypotheses to explain those polymorphisms: linkage with synergistic
coding regions, mutation-selection balance, and heterozygote advan-
tage. These explanations lack empirical support, and the case of het-
erozygote advantage may also have logical flaws.
I reviewed two cases in which the costs and benefits of a more potent
regulatory stimulus may favor polymorphism. In one example, host
genotypes with stronger IL1β responses probably clear infection by He-
licobacter pylori more effectively, but also suffer greater gastric tissue
damage and a higher risk of gastric cancer.
In another example, humans with a more active promoter of IL10 had
a significantly delayed onset of AIDS. IL10 inhibits macrophage prolifer-
ation, possibly reducing the number of activated macrophages available
for HIV-1 replication. Against other pathogens that do not replicate in
macrophages, reduced macrophage proliferation may favor the patho-
gen against the immune system.
Mathematical analysis could establish the necessary conditions to
maintain polymorphism for controls of the immune response by trade-
offs between high and low expression. Such models would clarify the
kinds of experiments needed to understand these polymorphisms.
4. Effects of regulatory variability on antigenic diversity. Two pos-
sibilities come to mind. First, different patterns of immune regulation
may affect immunodominance (Badovinac et al. 2000). Second, immune
regulation may affect the intensity and duration of memory. Immuno-
logical memory shapes antigenic diversity because a parasite often can-
not succeed in hosts previously infected by a similar antigenic profile.
5. Regulatory variability as model for quantitative variability. The
widespread genetic variability of quantitative traits forms a classical un-
solved puzzle of genetics. To solve this puzzle, one must understand
the links between nucleotide variants, the regulatory control of trait de-

GENETIC VARIABILITY OF HOSTS 123
velopment and expression, and fitness. The immune system is perhaps
the most intensively studied complex regulatory system in biology. This
chapter provided a glimpse of how it may be possible to link genetic vari-
ation to immune regulatory control and its fitness consequences. The
studies done so far focus on major polymorphisms. But it may soon
be possible to study rare variants and their association with regulatory
variability and susceptibility to different pathogens. This may lead to
progress in linking quantitative genetic variability and the evolution of
regulatory control systems.

9 ImmunologicalVariability of Hosts
A host often retains immunological memory of B and T cells stimulated
by prior infections. Upon later inoculation, a host rapidly builds defense
from its memory cells. Each host acquires a unique memory profile
based on its infection history.
In this chapter, I discuss the immune memory profiles of the host
population. The following chapter describes how the structuring of im-
munological memory in the host population shapes the structuring of
antigenic variation in parasite populations.
The first section reviews the immune processes that govern immuno-
logical memory. I emphasize the rate at which a host can generate a
secondary immune response and the rate at which immune memory
decays. These rate processes determine how immunological memory
imposes selective pressure on antigenic variants.
The second section discusses the different consequences of immuno-
logical memory for different kinds of parasites. For example, antibody
titers tend to decay more rapidly in mucosal than in systemic locations.
Thus, selective pressures on antigenic variation may differ for parasites
that invade or proliferate in these different compartments. Cytopathic
viruses, which kill their host cells, may be more susceptible to antibod-
ies, whereas noncytopathic viruses may be more susceptible to CTLs
that kill infected host cells. The different memory responses of anti-
bodies and CTLs may impose different selective pressures on antigenic
variation of cytopathic and noncytopathic viruses.
The third section describes the immunodominance of memory. The
memory profile may differ from the pattern of immunodominance dur-
ing primary infection. The immunodominance of memory affects the
ease with which new parasite variants can spread. If each host has nar-
row memory immunodominance with protection against one or a few
epitopes, then a small number of mutations can escape memory. By
contrast, if hosts have broad memory profiles, then the parasites have
to change simultaneously at many epitopes in order to avoid the hosts’
memory responses.
The fourth section focuses on the cross-reactivity between the anti-
gens of a primary and secondary infection. Sometimes a host first de-
IMMUNOLOGICAL VARIABILITY OF HOSTS 125
velops a memory response to a particular antigen, and then is exposed
secondarily to a variant of that antigen. If the secondary variant cross-
reacts with memory cells, then the host may produce a memory response
to the first antigen rather than a primary response to the second antigen.
This original antigenic sin can prevent the host from mounting a vigor-
ous immune response to secondary challenge. It can also prevent a host
from expanding its memory profile as it becomes infected by different
antigenic variants.
The fifth section summarizes the distribution of immune profiles
among hosts. This distribution determines the ability of particular anti-
genic variants to spread. Older hosts tend to have broader profiles be-
cause they have experienced more infections. Maternal antibodies pro-
vide short-term protection to infants, and certain antibody and T cell
responses may provide temporary protection to recently infected hosts.
Finally, the hosts may vary spatially in their prior exposure to different
epitopes, creating a spatial mosaic in the selective pressures that favor
different antigenic variants.
The final section takes up promising lines of study for future research.
9.1 Immunological Memory
Immunological memory causes different immune responses between
primary and secondary exposure to an antigen. Differences include the
speed, intensity, and breadth of reaction. I focus on the consequences
of immunological memory for antigenic variation of parasites. Thus, I
am mostly concerned with how memory affects replication and trans-
mission of the parasite.
MEMORY CELLS
The state of internal memory influences whether secondary response
rapidly clears or only partially reduces secondary infection (reviewed
by Zinkernagel et al. 1996). The X-Y-Z model (Byers and Sercarz 1968)
captures the essential features: X represents a specific, naive B or T lym-
phocyte clone; Y represents a partially differentiated, long-lived memory
state for the specific lymphocyte; and Z represents the short-lived, fully
armed effector cells that do the work of clearing infection.
Studies have supported different components of this model for some
experimental systems. But many conflicting results have been obtained,
126 CHAPTER 9
and controversy continues. A recent symposium (McMichael and Do-
herty 2000) and many reviews summarize empirical details and oppos-
ing views (Ahmed and Gray 1996; Zinkernagel et al. 1996; Dutton et al.
1998; Ada 1999; Farber 2000; Gray 2000; Seder and Hill 2000).
AN EXAMPLE
In an antibody response, Y represents the long-lived memory B cell
clones and Z represents the short-lived plasma B cells that secrete anti-
body. Ochsenbein et al. (2000) studied B cell memory against vesicular
stomatitis virus (VSV) infections in mice. They found that memory cells
did in fact live a relatively long time compared with antibody-secreting
plasma cells. The antibody-secreting cells had a half-life of 3–10 days.
Memory cells persisted in the absence of recurrent antigenic stimula-
tion. By contrast, the maintenance of plasma cells and circulating anti-
bodies required continued stimulation by antigens. Circulating antibod-
ies often protect against secondary infection by VSV, whereas memory
cells alone do not.
This example highlights several questions. Are effector cells generally
short-lived or long-lived? Does the maintenance of effectors require
recurrent antigenic stimulation? How long do memory cells live in the
absence of repeated stimulation? How long does it take for memory cells
to differentiate into effector cells? Is there always a sharp distinction
between memory and effector cells, or do some cell types have some
memory attributes (long-lived, easily stimulated) and effector attributes
(directly involved in killing)?
These issues play a crucial role in shaping the immunological struc-
ture of host populations and consequently in the evolution of antigenic
variation. The various conflicting details do not provide a clear picture at
present. But it is possible to discuss how particular memory processes
may affect the evolution of parasite diversity. The next subsection pro-
vides one example.
RECURRENT ANTIGENIC STIMULATION OF ANTIBODY PRODUCTION
How does a host maintain antibody titers after an infection has ap-
parently been cleared? Zinkernagel et al. (1996) and Ochsenbein et al.
(2000) favor the need for internal storage of antigen as a source of recur-
rent stimulation, with perhaps repeated infection as a booster in some
IMMUNOLOGICAL VARIABILITY OF HOSTS 127
cases. Others studies have implicated a subset of long-lived plasma
cells as a potential source of continuous antibody production without
the need for recurrent stimulation by antigen (Manz et al. 1998; Slifka
et al. 1998). For our purposes, we can take the following relatively safe
position.
The ratio of plasma to memory cells likely rises with recurrent anti-
genic stimulation. A higher concentration of plasma cells and antibodies
provides greater protection and more rapid clearance. The benefit for
maintaining plasma cells depends on how rapidly the infection develops
within the host. Slow infections may allow memory cells to differenti-
ate into an antibody response sufficiently rapidly to contain the infec-
tion. Fast infections may spread so quickly that memory cells cannot
differentiate antibody-secreting plasma cells fast enough to contain the
infection, but memory cells may aid in eventual clearance.
The immunological structure of host populations as it affects parasite
transmission depends on plasma:memory ratios, which in turn may be
affected by recurrent stimulation by internally stored antigen or extrin-
sic reinfection. Plasma:memory ratios more strongly influence parasites
that grow relatively quickly within hosts.
HELPER T CELL MEMORY
Memory B cells have higher densities of MHC class II molecules on
their surfaces than naive B cells (Janeway et al. 1999). Presumably this al-
lows antigens taken up by the B cell receptor to stimulate more strongly
helper T cells, which in turn signal the memory B cells to differentiate
into antibody-secreting plasma cells.
The CD4+ helper T cells themselves appear to differentiate into a
memory form after sufficient initial stimulation (Janeway et al. 1999).
Memory CD4+ helper T cells provide stronger stimulation to B cells than
do naive CD4+ cells (Scherle and Gerhard 1986; Croft and Swain 1992;
Swain 1994; Marshall et al. 1999).
The speed of an antibody response may be enhanced by CD4+ mem-
ory cells. This raises some interesting questions concerning the selective
pressures that influence antigenic variation in parasites. Suppose, for
example, that during initial exposure a host produces a dominant im-
mune response to a parasite’s B cell epitope, b, and to a CD4+ T cell
epitope, t . Thus, we can write the initial parasite genotype as b/t .
128 CHAPTER 9
In a host with memory against the b/t parasite, how well would anti-
genically variant parasites succeed with genotypes b′/t , b/t′ , or b′/t′,where the primes denote variants? For example, how much advantage
does the host gain by CD4+ memory against a parasite with an altered
B cell epitope, or from the parasite’s point of view, what is the fitness of
the parasite genotype b′/t relative to b′/t′ in a host previously exposed
to b/t? If the difference in fitness is sufficiently large, then the selective
intensity on the epitope t may be strong. This would be interesting to
know because most attention currently focuses on the obviously strong
selective pressure for changes in the epitope b.
Zinkernagel et al. (1996) summarize limited evidence suggesting that
helper T cell memory does not play an important role in shaping anti-
genic variants of parasites. Helper T cells cross-react between influenza
strains (Hurwitz et al. 1984; Mills et al. 1986; Scherle and Gerhard 1986)
and between vesicular stomatitis virus (VSV) strains (Gupta et al. 1986;
Burkhart et al. 1994). This cross-reactivity does not protect hosts against
secondary infection, but it can accelerate antibody response and reduce
the time until clearance (Scherle and Gerhard 1986; Marshall et al. 1999).
In influenza infections, the dominant epitopes of helper T cells focus
on hemagglutinin, a major surface molecule of influenza. The T cell
epitopes are very near the B cell epitopes that dominate protective im-
munity (Wilson and Cox 1990; Thomas et al. 1998). It may be that amino
acid changes in hemagglutinin between antigenically variant strains are
sometimes selected by memory helper T cells. However, for amino acid
replacements in hemagglutinin, it is difficult to separate the potential
role of memory helper T cells from the obviously strong effects of anti-
body memory.
The level of memory helper T cells can be measured by the time re-
quired for naive B cells to switch from initial IgM secretion to later IgG se-
cretion. When assessed by this functional response, helper T cell mem-
ory appears to be short-lived for influenza (Liang et al. 1994) and VSV
(Roost et al. 1990). In mice infected with VSV, memory T cell help that ac-
celerated the IgM to IgG switch lasted only fourteen to twenty-one days.
Other assays find that memory helper T cells remain for several months
after initial infection (Gupta et al. 1986); it appears that eventually the
number of memory cells drops below a threshold or the memory cells
lose a complementary signal. It will be interesting to learn whether lim-
IMMUNOLOGICAL VARIABILITY OF HOSTS 129
ited functional helper T cell memory applies generally to all vertebrates
or varies for different hosts or host-parasite combinations.
CD4+ cells have other functions in addition to stimulating B cells. For
example, CD4+ cells influence CTL response and the response of other
effectors such as macrophages. The limited evidence available does
not demonstrate a strong role for CD4+ memory with regard to these
effector-stimulating functions (Stevenson and Doherty 1998); however,
the potentially diverse memory effects for these cells must be consid-
ered (Whitmire et al. 2000).
CTL MEMORY
Important attributes of memory include the speed and intensity of
response to antigen and the time decay of these quantitative responses
(Seder and Hill 2000). CTL memory has been measured in various ways,
for different hosts and different kinds of parasites (Zinkernagel et al.
1996; Dutton et al. 1998; Stevenson and Doherty 1998). Preliminary data
suggest that patterns of immunodominance in the primary response do
not necessarily carry through to the memory pool (Belz et al. 2000; Rick-
inson et al. 2000; Seaman et al. 2000). In some cases, it seems that T
cell clones increased to high abundance in the primary response suf-
fer greater reductions as the cellular populations are regulated in the
memory phase (Rickinson et al. 2000).
A few general conclusions arise from this work: secondary CTL re-
sponses are typically faster and more intense than primary response,
and the strength of the secondary response can decay over time. More
important, the relations between CTL response and clearance depend
strongly on the kinds of parasites.
9.2 Kinds of Parasites
“Every infection is a race” (Mims et al. 1993). The parasites race
against immune effectors, which may eventually kill parasites faster
than they are born. Each kind of parasite has its particular site of infec-
tion, pattern of spread between tissues, and rate of increase. Immuno-
logical memory therefore influences the host-parasite race in a different
way for each kind of parasite.
130 CHAPTER 9
In this section, I highlight some of the interactions between immuno-
logical memory and parasite attributes. I discuss memory-parasite in-
teractions with regard to the type of immune cell involved, the kinetics
of parasite spread, and the kinetics of immune effector response.
There are four main classes of immune cells that can be enhanced by
primary infection to provide greater protection against later infections:
plasma B cells, memory B cells, effector T cells, and memory T cells
(Ahmed and Gray 1996).
The plasma cells secrete antibody. These effector B cells usually pro-
duce mature immunoglobulins such as IgG in systemic sites and IgA
on mucosal surfaces. Circulating IgG often remains at significant titers
throughout life. IgG can sometimes prevent infection by binding to in-
oculum before the parasites replicate in the host. IgG causes most cases
of long-lived protective immunity against pathogens such as measles,
yellow fever, polio, mumps, smallpox, and many other viruses and bac-
teria (Plotkin and Orenstein 1999; Knipe and Howley 2001).
IgA is often raised to high titers on mucosal surfaces in response to
infection. IgA antibodies provide effective protection against pathogens
that initially invade mucosal sites, such as influenza through the nasal
mucosa, rotaviruses and many bacterial pathogens via the intestinal mu-
cosa, and gonorrhea via the urethral epithelium (Mims 1987; Ada 1999).
However, IgA titers decline relatively rapidly after infection, lasting on
the order of months rather than years, as is often the case for IgG.
Memory B cells proliferate and differentiate into plasma cells upon
secondary infection. If the pathogen is not immediately cleared by ex-
isting antibodies and the pathogen’s initial replication is relatively slow,
then the memory B cells may have time to differentiate into plasma cells
and clear the pathogen before widespread infection develops. Differen-
tiation of memory B cells into plasma cells depends on stimulation by
CD4+ helper T cells (Ochsenbein et al. 2000).
Once widespread infection becomes established, memory B cells can
help to produce a more specific, rapid, and intense antibody response.
However, the relative roles of antibodies and T cells in clearing estab-
lished infection vary depending on the attributes of the pathogen (Mims
1987; Janeway et al. 1999). For example, Zinkernagel et al. (1996) empha-
sized the distinction between cytopathic (cell-killing) and noncytopathic
viruses. They also distinguished between viruses exposed to antibody

IMMUNOLOGICAL VARIABILITY OF HOSTS 131
in the blood or mucosa and those hidden from antibody in peripheral
tissue.
Antibodies play a key role in clearing cytopathic viruses on mucosa
or circulating in the blood. CTLs may be relatively ineffective against
cytopathic viruses when the rate at which viruses infect, replicate, and
kill a cell is greater than the rate at which CTLs kill viruses in infected
cells. The dynamics of this race could be analyzed by mathematical
models that compare the viruses’ birth and death rates in light of the
killing action mediated by antibodies and effector T cells.
For viruses that circulate in systemic infections, memory IgG anti-
bodies may often protect against infection. By contrast, for mucosal
infections such as those by rotaviruses and many bacterial pathogens,
memory IgA antibodies often decline below protection level, but mem-
ory B cells can play an important role in defense by differentiating IgA-
secreting plasma cells (Ahmed and Gray 1996).
Effector CTLs dominate clearance of noncytopathic intracellular path-
ogens and infected peripheral tissue that limits access to antibody (Zin-
kernagel et al. 1996). Effector T cells typically have a short half-life when
not stimulated by antigen. Thus clearance before significant infection
develops can occur by various scenarios. First, recent stimulation by
antigen can boost effector T cell density to protective levels. Stimulation
can occur by persistent antigen maintained in the host or by recurrent
infection. Second, slowly spreading infections may allow differentiation
of effector T cells from memory T cells in time to control initial spread
of the pathogen. Third, memory antibody may clear the pathogen before
the initial infection becomes established.
Lack of symptoms during secondary infection may result from rapid
clearance of the parasite or from control of the infection that still al-
lows some parasite replication and transmission. It is important to dis-
tinguish between clearance and controlled infection when studying the
population dynamics and evolution of the parasite.
In summary, parasite attributes determine the type of host memory
that impedes secondary infection. I mentioned the site of initial inva-
sion (e.g., mucosal versus systemic), the site of widespread infection
(e.g., epithelial, systemic, peripheral), and the lifetime of infected cells
for intracellular parasites (e.g., cytopathic versus noncytopathic). Other
parasite factors can tip the balance between clearance and widespread
132 CHAPTER 9
infection of a secondarily inoculated host. For example, the number of
parasites in the inoculum frequently influences whether an infection is
cleared quickly or spreads widely.
These various parasite attributes and the rate parameters that gov-
ern parasite birth and death within hosts must be measured against
the kinetics of immunological memory and the response to secondary
infection. The quantitative outcome influences the selective pressure
imposed on various parasite epitopes by host memory. Such selective
pressure, in turn, shapes the distribution of antigenic variation in para-
site populations.
9.3 Immunodominance of Memory
A host’s immunological memory profile depends on three factors.
First, which parasite variants have infected that host in the past? Sec-
ond, to which epitopes did the host respond?—the immunodominance
of primary response. Third, to which of the primary epitopes has the
host retained memory?—the immunodominance of the memory profile.
The immunological profile of each host and the variation of profiles
between hosts influence the selective pressures imposed on parasite
antigens. For the profile of each host, consider as a simple measure
of immunodominance the number of epitopes to which a host retains
protective antibody. If a host retains protection against n epitopes, then
a variant parasite strain must differ in at least n sites to avoid all mem-
ory. If the mutation rate per site is µ, then the probability is µn that
a progeny of the original strain is an escape variant with all of the nnecessary differences.
Several laboratory experiments of influenza have studied the origin of
escape variants when neutralizing antibody pressure is imposed against
viral epitopes (Yewdell et al. 1979, 1986; Lambkin et al. 1994). For anti-
bodies against only a single epitope, escape variants arise often because
only a single mutation is needed. The mutation rate of influenza is on
the order of µ = 10−5 per nucleotide per generation. Thus, a moderate-
size population of viruses likely has at least a few escape mutants. By
contrast, antibody selection against two or more epitopes rarely yields
escape mutants, because the probability of multiple mutations, µn, be-
comes small relative to the effective size of the population.

IMMUNOLOGICAL VARIABILITY OF HOSTS 133
These laboratory experiments show that a broader antibody response
against multiple epitopes impedes the origin of new variants. By con-
trast, a more focused immunodominant response allows the rapid evo-
lution of escape variants.
Similarly, persistent viral infections within hosts respond differently
to narrow versus broad CTL pressure (Wodarz and Nowak 2000). A
highly immunodominant CTL response allows rapid evolution of escape
mutants and continuing change within hosts. By contrast, a broad CTL
response against multiple epitopes impedes the origin of escape variants
and leads to relatively slow evolution of viruses within a host.
To determine the selective pressures imposed on parasite popula-
tions, the immunodominance of each host’s memory profile must be
placed in the context of variation in memory profiles between hosts.
Suppose, for example, that a parasite has two distinct antigenic sites. A
parasite with genotype A/B at the two sites sweeps through the popula-
tion, infecting all hosts. One-half of the host population maintains mem-
ory against both antigens, one-quarter has immunodominant memory
against A only, and one-quarter has immunodominant memory against
B only.
Now consider how this distribution of memory profiles influences the
success of antigenic variants. A mutation at a single site, for example
B, yields an altered parasite, A/B′. This mutant can attack the quar-
ter of the host population with memory only against B. As the para-
site spreads, a second mutation to A′/B′ allows attack of the remaining
hosts.
This example shows that strongly immunodominant host profiles lim-
ited to one or a few sites allow parasite mutants with few changes to
succeed. Once the variant parasite begins to spread between suscepti-
ble hosts, additional mutations allow attack against hosts with different
immunodominant profiles or against hosts that developed broader im-
munity against multiple antigenic sites.
Influenza evolution may proceed by this sort of sequential accumula-
tion of variation, with new epidemic strains differing from the previous
epidemic strain at several sites (Natali et al. 1981; Underwood 1984;
Wang et al. 1986; Wilson and Cox 1990; Lambkin and Dimmock 1996;
Cleveland et al. 1997; Nakajima et al. 2000). Surveys of human popula-
tions and laboratory studies of mice and rabbits support this hypoth-
esis by showing that individuals often have narrowly focused antibody
134 CHAPTER 9
responses and that individuals vary in the antigenic sites to which they
develop antibodies.
In the laboratory, studies show that individual mice infected with hu-
man influenza often produce antibody responses focused on a limited
number of antigenic sites—probably just one or two sites (Staudt and
Gerhard 1983; Underwood 1984; Thomas et al. 1998). Individual mice
differed in the antigenic sites to which they raised antibodies. Individ-
ual variation in antibody response probably occurs because stochastic
recombinational and mutational processes generate antibody specificity
(Staudt and Gerhard 1983).
Surveys of human populations find that individuals previously ex-
posed to influenza vary in antibody memory profiles (Natali et al. 1981;
Wang et al. 1986; Nakajima et al. 2000). Wang et al. (1986) studied im-
mune memory profiles of individuals when measured for three nonover-
lapping sites of the hemagglutinin surface glycoprotein. For samples
collected from the early years of the Hong Kong influenza subtype epi-
demics (1969 and 1971), 33% of individuals had antibodies to all three
sites, 50% had antibodies for two sites, and 17% had antibodies for only
one site. Approximately equal numbers of individuals lacked antibody
to any particular site, suggesting that each site was equally likely to stim-
ulate an antibody response. Most individuals sampled in 1978 had anti-
bodies for all three sites. It appears that after several years of repeated
exposure to various strains of the Hong Kong subtype, individuals had
acquired a wider repertoire of antibodies.
Human children tend to have particularly narrowly focused antibody
profiles against influenza (Natali et al. 1981, 1998; Nakajima et al. 2000).
This may occur either because of children’s relatively smaller number
of exposures or because of their narrower response per infection.
These observations on mice and humans support the hypothesis that
individuals have narrowly focused antibody memory and that individu-
als vary in the antigenic sites to which they respond. This combination of
individual focus and population variability creates a heterogeneous pat-
tern of selection on parasites. After a widespread epidemic by a single
parasite type, the parasite must acquire several new mutations before
it can again spread widely through the population. Stepwise changes
can occur by first changing at one site and attacking a subset of the
population with a dominant response against that site. The new mu-
tant strain can then accumulate a second change that provides access

IMMUNOLOGICAL VARIABILITY OF HOSTS 135
both to hosts with a dominant antibody response to the second mutant
site and to hosts with antibodies against both the first and second mu-
tant sites. Additional mutations allow attack against broader sets of
immunological profiles.
This description certainly oversimplifies the actual process. However,
the immunodominance of individual hosts for particular epitopes and
the population variability of immune profiles can create important se-
lective pressures on parasites.
9.4 Cross-Reactivity and Interference
A host’s secondary response to an antigen depends on immunological
memory to that antigen. Typically, memory leads to a faster and more
vigorous secondary response. Suppose, however, that a host first de-
velops a memory response to a particular antigen, and then is exposed
secondarily to a variant of that antigen. If the secondary variant cross-
reacts with memory cells, then the host may produce a memory response
to the first antigen rather than a primary response to the second antigen.
A memory response to the first antigen rather than a primary response
to the variant is called original antigenic sin. I reviewed aspects of this
phenomenon in chapter 6.
A memory response based on previously encountered, cross-reactive
antigens has three consequences for the immunological structure of
host populations. First, cross-reaction may aid protection or clearance
against secondary challenge. This occurs if the cross-reactive memory
effectors have sufficient affinity for the variant antigen (Kaverin et al.
2000; Roden et al. 2000; Sonrier et al. 2000; Stalhammar-Carlemalm
et al. 2000).
Second, cross-reaction may interfere with the secondary response.
This occurs when cross-reactive memory effectors do a poor job of clear-
ing secondary challenge but respond sufficiently to repress a new, pri-
mary response against the variant antigen (Good et al. 1993; Klenerman
and Zinkernagel 1998; Nara and Garrity 1998; Ferguson et al. 1999).
Third, the host may fail to develop an increasingly broad memory
profile over the course of repeated exposures to different variants. This
occurs when a new variant stimulates cross-reactive memory rather than
a specific primary response, preventing memory particular for the new
136 CHAPTER 9
variant (Fazekas de St. Groth and Webster 1966a, 1966b; Smith et al.
1999).
9.5 Distribution of Immune Profiles among Hosts
The distribution of immune profiles influences selective pressures on
antigenic diversity. Several factors shape the distribution of immunity.
I have already mentioned the immunodominance of individual immune
profiles and the tendency for the pattern of immunodominance to vary
among individuals. I also discussed how cross-reactivity can affect clear-
ance of secondary challenge and the development of memory over a
host’s lifetime. In this section, I add a few more factors that affect the
distribution of immune profiles.
AGE STRUCTURE OF HOSTS
An individual becomes exposed over time to an increasingly diverse
array of parasite genotypes. Thus, older individuals typically have a
broader memory profile than do younger individuals. Age-related pat-
terns have been measured by serological surveys, which describe the
presence or absence of circulating antibodies to a particular strain of
parasite or to a particular antigen. Many surveys have been published
for a wide variety of parasites and hosts (Anderson and May 1991, pp.
49–54).
Here are just a few example pathogens for which broader immunolog-
ical profiles have been reported in older hosts compared with younger
hosts: influenza (Dowdle 1999), Plasmodium (Gupta and Day 1994; Bar-
ragan et al. 1998), human T cell leukemia virus type 1 (HTLV-1) (Larsen
et al. 2000), and hepatitis A, B, and C viruses (Chapman et al. 2000).
The best data on age effects come from studies of the influenza A
virus. Most neutralizing antibodies against influenza bind to hemag-
glutinin, the virus’s dominant surface molecule (Wilson and Cox 1990).
Three major subtypes of hemagglutinin have circulated in human pop-
ulations since about 1890, labeled H1, H2, and H3. Antibodies to one
subtype cross-react relatively little with the other subtypes. Significant
variation occurs within each subtype. Although antibodies to a partic-
ular variant do not always protect against infection by other variants
of the same subtype, the antibodies to variants of a subtype do often
cross-react to some extent.
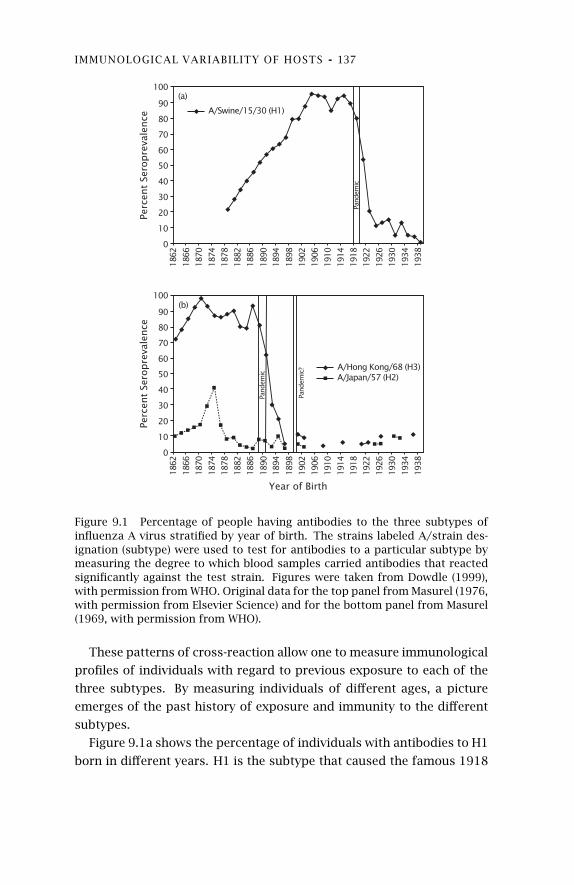
IMMUNOLOGICAL VARIABILITY OF HOSTS 137
100
90
80
70
60
50
40
30
20
10
0
1862
1866
1870
1874
1878
1882
1886
1890
1894
1898
1902
1906
1910
1914
1918
1922
1926
1930
1934
1938
Perc
ent
Sero
pre
vale
nce
100
90
80
70
60
50
40
30
20
10
0
1862
1866
1870
1874
1878
1882
1886
1890
1894
1898
1902
1906
1910
1914
1918
1922
1926
1930
1934
1938
Perc
ent
Sero
pre
vale
nce
Year of Birth
A/Swine/15/30 (H1)
Pand
emic
(a)
(b)
Pand
emic
Pand
emic
? A/Hong Kong/68 (H3)A/Japan/57 (H2)
Figure 9.1 Percentage of people having antibodies to the three subtypes ofinfluenza A virus stratified by year of birth. The strains labeled A/strain des-ignation (subtype) were used to test for antibodies to a particular subtype bymeasuring the degree to which blood samples carried antibodies that reactedsignificantly against the test strain. Figures were taken from Dowdle (1999),with permission from WHO. Original data for the top panel from Masurel (1976,with permission from Elsevier Science) and for the bottom panel from Masurel(1969, with permission from WHO).
These patterns of cross-reaction allow one to measure immunological
profiles of individuals with regard to previous exposure to each of the
three subtypes. By measuring individuals of different ages, a picture
emerges of the past history of exposure and immunity to the different
subtypes.
Figure 9.1a shows the percentage of individuals with antibodies to H1
born in different years. H1 is the subtype that caused the famous 1918

138 CHAPTER 9
5
4
3
2
1
05 15 25 35 45 55 65 75 85
October–December 1957 (H2)December–January 1969 (H3)
Age (years)
Rat
e per
10
00
Figure 9.2 Estimated mortality caused by two widely distributed influenzapandemics stratified by age of the host. The 1957 pandemic was caused byan H2 subtype and the 1968–69 pandemic was caused by an H3 subtype. Fig-ure taken from Dowdle (1999), with permission from WHO. Original data fromHousworth and Spoon (1971), with permission from Oxford University Press.
pandemic that killed tens of millions of people (Oxford 2000). Note that
antibodies against H1 occur in 80–90% of individuals who were less than
twenty years old during the pandemic years, suggesting widespread dis-
tribution of the disease. The drop in the seropositive level for individu-
als born before 1900 may be explained by the typically lower percentage
of adults than children infected by influenza epidemics (Nguyen-Van-
Tam 1998). There may also be some decay in immune memory among
older individuals. The large drop in seroprevalence after 1922 suggests
that H1 declined in frequency after the pandemic. Perhaps because
of widespread immunity to H1, variants of this subtype had difficulty
spreading between hosts.
Figure 9.1b shows a similar picture for the H3 subtype associated with
a pandemic in 1890. Cohorts born in the years before the pandemic had
very high seroprevalence, suggesting widespread infection. Seropreva-
lence declined sharply in those born just after the pandemic, implying
that H3 had nearly disappeared from circulation. Figure 9.1b also shows
data on H2 seroprevalence and a possible pandemic in 1900, but those
data are more difficult to interpret.
Figure 9.2 illustrates the estimated mortality rate associated with in-
fluenza infection in two severe (pandemic) years. The H2 pandemic of
IMMUNOLOGICAL VARIABILITY OF HOSTS 139
1957 caused relatively high mortality among older people compared
with the H3 pandemic of 1968–69. Older people often suffer higher mor-
tality from influenza than do younger people (Nguyen-Van-Tam 1998),
so the pattern in 1957 appears to be typical. The contained mortality
among older individuals in 1968–69 may have been caused partly by
immunological memory to the H3 pandemic of 1890 and consequent
protection against this subtype.
The age structure of immunity profiles has probably influenced the
waxing and waning of the various influenza A subtypes over the past 110
years. Influenza causes uniquely widespread and rapid epidemics; thus
the details of age-related immune profiles and antigenic variation likely
differ in other pathogens. Malaria is perhaps the only other disease for
which existing data suggest interesting hypotheses.
In areas with endemic Plasmodium falciparum infection, hosts often
pass through three stages of immunity (Gupta and Day 1994; Barra-
gan et al. 1998; Mohan and Stevenson 1998). Maternal antibodies pro-
vide significant protection for newborns up to six months of age. After
maternal antibodies fade, high infection rates with severe disease fre-
quently occur until the age of two to three years. Acquired immunity
develops gradually over the following years, with significant reduction
in the severity of symptoms. However, even healthy adults often have
subclinical infections. Maintenance of protection requires repeated ex-
posure. Individuals who depart and live in malaria-free areas for many
months become significantly more susceptible upon return (Neva 1977;
Cohen and Lambert 1982).
The slow buildup of immunity partly depends on the high antigenic
variation of Plasmodium falciparum (Marsh and Howard 1986; Forsyth
et al. 1989; Iqbal et al. 1993; Gupta and Day 1994). An individual appar-
ently requires exposure to several of the locally common variants before
acquiring a sufficiently broad immunological profile to protect against
disease (Barragan et al. 1998).
TRANSMISSION OF MATERNAL ANTIBODIES
The rate at which susceptible hosts enter the population plays an
important role in the dynamics of parasite strains. Newborns, memory
decay, and migration provide the main sources of new susceptible hosts.
140 CHAPTER 9
The susceptibility of newborns is complicated by maternal transmis-
sion of antibodies (Zinkernagel et al. 1996). Offspring of mice and hu-
mans obtain IgA antibodies in milk and IgG antibodies through the pla-
centa (Janeway et al. 1999, pp. 326–327). IgA protects the gut epithelium
and mucosal surfaces. The newborn inherits circulating IgG titers in the
blood that match the mother’s antibody levels. The infant receives the
particular antibody specificities generated by the mother’s history of ex-
posure to particular antigens. Thus, the infant has a temporary memory
profile that matches its mother’s.
Maternal antibodies have a half-life of 3–6 months (Nokes et al. 1986;
Anderson and May 1991, pp. 49-54). Infection of a baby early in life may
be cleared by maternal antibody, thereby failing to stimulate an immune
response and generate long-lasting memory (Albrecht et al. 1977).
Other vertebrates also transmit maternal antibodies to newborns (Zin-
kernagel et al. 1996). For example, bovines produce highly concentrated
antibodies in the first milk (colostrum), which must be absorbed via the
calf’s gut during the first twenty-four hours after birth (Porter 1972). In
this first day, the calf does not digest the immunoglobulins and is able
to take up most antibody classes by absorption through the gut epithe-
lium. Birds transmit maternal antibodies through the egg (Paul 1993).
SHORT-TERM PROTECTION FROM RECENT INFECTION
IgA antibodies on epithelia can prevent initial infection by pathogens
(Mims 1987, p. 251). For example, IgA may prevent attachment of Vibrio
cholerae to the intestinal epithelium, gonococcus to the urethral epithe-
lium, or chlamydia to the conjunctiva. IgA titers on epithelia often decay
quickly after infection. Thus, protection against infection by IgA typic-
ally lasts for a few months or less.
Most vaccines protect by elevating the level of circulating antibod-
ies and perhaps also memory B cells. The need for occasional vaccine
boosters to maintain protection against some pathogens suggests that
antibody titers or the pool of memory B cells decline in those cases.
When long-term protection requires no boost, it may be that a lower
threshold of antibodies or memory B cells protects against infection or
that some regulatory mechanism of immunity holds titers higher.
IMMUNOLOGICAL VARIABILITY OF HOSTS 141
In human influenza, T cells stimulated during infection provide some
protection against later infection (McMichael et al. 1983b). But that pro-
tection wanes over a three-to-five-year period (McMichael et al. 1983a).
A study of chickens also showed T cell–mediated control of secondary
infection (Seo and Webster 2001). In that case, the secondary infection
happened within 70 days of the primary challenge. The time decay of
protection was not studied.
Measurements of memory decay have been difficult partly because
laboratory mice provide a poor model for long-term processes of immu-
nity (Stevenson and Doherty 1998). Laboratory mice typically live up to
two years. It is difficult to separate decay of immunity from aging when
immune memory in a mouse declines over many months.
SPATIAL STRUCTURE OF HOSTS
I discussed above how immune memory profiles may be stratified by
age. Memory profiles may also be stratified by spatial location of hosts.
At present, few spatial data exist. Thus, I confine my comments to a few
conceptual issues.
To begin, consider the temporal pattern of measles epidemics prior
to widespread vaccination (Anderson and May 1991, chapter 6). Data
from England and Wales in 1948–1968 show a regular cycle of epidemic
peaks every two years. The cycle may be explained by the threshold den-
sity of susceptible individuals required for an infection to spread. Just
after an epidemic, most individuals retain memory that protects them
from reinfection. The parasite declines because each infected individual
transmits the infection to an average of less than one new susceptible
host.
The next epidemic must wait until the population recruits enough
newborns who are too young to have been infected in the last epidemic.
An epidemic then follows, leaving most of the population protected until
the next cycle of recruitment and spread of infection. Probably all par-
asite populations wax and wane to some extent as protective memory
spreads with infection and the pool of susceptibles rebuilds by recruit-
ment or by decay of immune memory.
These temporal fluctuations may also be coupled to spatial processes
(Rohani et al. 1999; Earn et al. 2000). Imagine the spatial landscape
of a population as a checkerboard of distinct patches. Epidemics may
142 CHAPTER 9
rise and fall synchronously in all patches, or epidemics may occur asyn-
chronously over space. Suppose, for example, that half of the patches,
labeled P1, have epidemics in odd years, whereas the other half of the
patches, labeled P2, have epidemics in even years. One can visualize this
dynamic landscape by imagining a peak in each patch rising during an
epidemic and falling back to the ground between epidemics. Over an
asynchronous landscape, some peaks are rising and others are falling at
any time.
Measles virus effectively has only one antigenic type—a host’s first
infection and recovery provides lifelong protection. The spatiotempo-
ral landscape of measles spread follows the waxing and waning of the
numbers of infected individuals, driven by immunological memory, re-
cruitment of newborns, and migration between patches.
Now imagine a parasite with distinct antigenic variants, for which
memory to one variant does not provide any cross-protection against
the other variants. The variants behave in effect as completely distinct
parasites. In a patch, the waxing and waning of one variant may be syn-
chronized with or uncoupled from the dynamics of the other variants.
If the variants change asynchronously within patches, then the spatio-
temporal landscape is covered by multiple surfaces of rising and falling
peaks, the surfaces moving independently of each other.
I have discussed infection landscapes in a rather abstract way. But
there is nothing out of the ordinary about hosts spread over space and
infected over time by different antigenic variants of a parasite. The diffi-
culty is to identify what general consequences arise from the interaction
between antigenic variation and spatial processes. The landscape I have
described so far has strains of antigenic variants that do not interact
or interfere with each other. Thus, each strain changes independently
of other strains, and no interaction occurs between space and antigenic
variation.
Now consider antigenic variants for which some pairs of variants
cause cross-reactive memory. It is not so easy to imagine the spatio-
temporal landscape because the spread of each variant has differing
quantitative effects on the dynamics of other variants. One simple anal-
ogy with age structure hints at the sort of processes that may occur.
In influenza, it may be that children have immunodominant memory
focused on only one or a few antigenic sites. In the simplified example
I discussed above, at first a virus strain with two sites, A/B, spreads.
IMMUNOLOGICAL VARIABILITY OF HOSTS 143
Patch types
Memory: A/B A'/B A'/B' A/B'
Parasite: A' /B' A/B' A/B A'/B
1 2 43
Figure 9.3 Spatial connectivity of parasite transmission between patches ofhosts with different immunological memory profiles.
Some children develop immunodominant memory against A; other chil-
dren develop immunodominant memory against B. Adults may have
memory for both A and B. Mutant viruses can spread through the en-
tire population in two steps. First, a mutant A′/B can attack children
with memory against A. Then a second mutant, A′/B′ can attack ev-
eryone. The key is that different classes of hosts provide a pathway
of connectivity by which single mutations of the virus can eventually
spread through the entire population.
Connectivity may also occur over space. Figure 9.3 shows four patch
types that have previously been infected by A/B, A′/B, A/B′, and A′/B′,respectively. This spatial distribution of immunological memory creates
a stepwise pathway of connectivity for a parasite. For example, if a
parasite A′/B′ first invades patch 1, then it can by a single mutation
change into A/B′ and attack patch 2. Single mutational steps take that
parasite to patch 3 and then on to patch 4.
This simplified description of spatial movement highlights two points.
First, patches 1 and 3 fluctuate betweenA/B andA′/B′, whereas patches
2 and 4 fluctuate between A′/B and A/B′. These patch identities occur
because immunological memory to both antigens imposes a barrier to
any variant except the type with changes at both sites. Gupta et al. (1996,
1998) have emphasized the emergence of strain structure caused by
this type of immunologically imposed selection. Second, my description
extends Gupta et al.’s model to spatially structured host populations.
With spatial structure, alternating regions of the host population can be
dominated by the different pairwise sets of parasite strains. I will return
to these issues in the next chapter, which focuses on the population
structure of antigenically variable parasites.
Mathematical models could be developed to explore the interactions
between antigenic variation and spatiotemporal dynamics. However, al-
most no data exist to compare with the models, and so there has been rel-

144 CHAPTER 9
atively little work along these lines. Some spatial data exist for influenza,
but the scale of sampling and the measurement of cross-reactivity prob-
ably need to be enhanced before much can be concluded. This will not
be easy to do in the short term. But eventually methods will improve
for typing strains, and more data will become available.
9.6 Problems for Future Research
The processes that govern immunological memory within hosts and
the distribution of immune profiles among hosts remain poorly under-
stood. Throughout this chapter, I have emphasized important topics
for further work. Rather than repeat all of those issues, I list here some
hypotheses about kinetics that deserve study both empirically and math-
ematically. Many patterns of antigenic variation turn on these rate pro-
cesses that drive evolutionary dynamics.
1. Demography. (a) A higher rate of recruitment into the host popula-
tion reduces the selective pressure on antigenic variation. Consider two
species, a long-lived species with an average life span of L years, and a
short-lived species with an average life span of S years. If L = 70, then
newborns replace approximately 1/70th of the population per year. By
contrast, if S = 7, then newborns replace approximately 1/7th of the
population each year. Immunological memory decays faster at the pop-
ulation level in short-lived than in long-lived species, perhaps reducing
the relative fitness advantage of antigenic variants in short-lived com-
pared with long-lived hosts.
If an antigenic variant has a fitness cost relative to the wild type, then
a greater offsetting fitness benefit occurs in the species with longer life
span and fewer naive hosts. Thus, a high-cost variant could gain an
advantage in long-lived but not in short-lived hosts. Antigenic variation
may therefore occur more often in long-lived hosts than in short-lived
hosts.
(b) Highly infectious parasites spread more widely in host populations
and induce a higher percentage of hosts to have immunological memory
against particular antigens. Highly infectious parasites therefore face
more severe selective pressure for antigenic change. Here “highly infec-
tious” means a higher basic reproductive number, R0, that is, a higher
number of secondary infections caused by an infected host in a naive
population. The density of immunological memory in the host popula-

IMMUNOLOGICAL VARIABILITY OF HOSTS 145
tion against parasites with different R0s should be studied mathemati-
cally to refine this idea.
(c) Rapidly transmitting parasites face less immunological pressure for
change within hosts. If most parasite transmission occurs before the on-
set of strong, specific immunity, then relatively little pressure for anti-
genic change occurs within each host. But rapidly transmitting parasites
may induce a greater density of immunological memory in the host pop-
ulation as noted in the previous item.
(d) Spatially homogeneous populations develop a higher and more uni-
form density of immunological memory than spatially heterogeneous
populations. All hosts have the same high exposure rate to parasites in
a well-mixed, spatially homogeneous population. By contrast, spatially
heterogeneous populations may maintain temporarily isolated refuges
in which hosts have low exposure. Those refuges could provide a source
of hosts with limited immune memory, reducing the intensity of selec-
tion favoring antigenic variation.
The dynamics are complex because isolated host populations may
have less prior exposure and immune memory but also may be less ac-
cessible to invasion by parasites and less able to transmit parasites back
into the bulk of the host population. The net effect depends on the spa-
tial connectivity of patches, rates of parasite transmission, and rates at
which immune memory builds up and decays.
(e) Heterogeneity in immune memory profiles between age classes or
spatial locations favors the stepwise spread of new antigenic variants.
In this chapter, I discussed how new variants often need to change in
several epitopes in order to spread through a host population with a
high density of prior exposure. Heterogeneity enhances the chance of
multiple antigenic changes by providing a sequence of susceptible host
classes separated by the need for only a single antigenic change.
2. Memory decay. (a) Faster time decay of immunological memory may
reduce the selective pressure on antigenic variation. Fast decay could
potentially reduce the density of immunological memory across the host
population. However, the faster the immunological memory decays, the
more rapidly the parasites may reinfect hosts. The net effect on memory
depends on the balance between these forces.
(b) The effect of immunological memory decay depends on the kind of
parasite. The site of initial invasion determines which immune effectors

146 CHAPTER 9
can potentially block first infection. Epithelial invasion interacts mostly
with IgA, a memory class that tends to decline relatively rapidly. By
contrast, systemic invasion interacts mostly with IgG, a memory class
with a relatively long half-life.
Clearance of extracellular parasites depends mostly on antibodies.
If infection spreads primarily to epithelial tissue, IgA plays a key role,
whereas IgG dominates against many systemic infections. Antibody
memory can increase the rate of clearance.
Once intracellular infection becomes established, the key immune ef-
fectors depend on kinetics. Antibodies dominate against intracellular
parasites that rapidly kill host cells. In these fast cytopathic parasites,
reproduction within cells occurs sufficiently quickly that CTLs cannot re-
duce the spread of the parasite. Antibody memory, if it does not prevent
infection, can increase the clearance rate of fast cytopathic parasites.
Slow cytopathic parasites or noncytopathic parasites that persistently
infect host cells must be cleared by killing infected cells. Most killing
of infected cells seems to be done by effector CTLs. Thus, the rate of
memory decay in CTLs may govern protection against noncytopathic
infections that are not blocked during initial invasion by antibodies.
3. Heterogeneity of immune profiles among hosts. The dynamics of
immune profiles can be complex because the spread of parasite variants
affects the immune structure of the hosts, and the immune structure
of the hosts determines the selective pressures on different classes of
antigenic variants. Some preliminary theoretical work along these lines
has appeared (Gupta et al. 1996; Andreasen et al. 1997; Gupta et al. 1998;
Lin et al. 1999). Similar processes of reciprocal coevolution arise when
hosts and parasites have multiple genetic determinants that influence
the outcome of an attack (Frank 1993, 1994).
4. Examples. Measles apparently can vary its dominant surface antigen,
hemagglutinin, and limited variation does occur (Griffin 2001). So it is an
interesting puzzle why antigenic variants do not to spread. Perhaps the
very high R0 of measles causes the common strain to spread so widely in
the host population that no differences occur between hosts in immune
memory profiles. Thus, there is no single-step mutational change that
allows a variant to spread to some hosts. The only “nearby” susceptible
class arises from the influx of naive newborns.

IMMUNOLOGICAL VARIABILITY OF HOSTS 147
Influenza A may not evolve as quickly and vary antigenically as much
in birds as it does in humans (Webster et al. 1992). This suggestion
is based on very limited evidence and must be confirmed by further
study. If the pattern holds, then many plausible explanations exist. For
example, the process of host invasion and spread during an infection
probably differs in birds and humans, which may influence the role of
immunity in clearance and in subsequent protection. Another possibil-
ity is that relatively short-lived species such as many birds have a larger
class of naive hosts than comparably long-lived humans, reducing the
relative pressure for antigenic variation in birds.

10 Genetic Structure ofParasite Populations
Variant alleles may be grouped together to form discrete parasite strains.
For example, some parasites may be of type A/B or A′/B′ at two distinct
epitopes, with intermediates A/B′ and A′/B rare or absent. In this chap-
ter, I consider the processes that group together variants.
The first section reviews different kinds of genetic structure. The ex-
ample above describes linkage disequilibrium between antigenic loci, a
pattern that may arise from host immune selection disfavoring the inter-
mediate forms. Alternatively, allelic variants across the entire genome
may be linked into discrete sets because different parasite lineages do
not mix. Spatial isolation or lack of sex and recombination can prevent
mixing.
The second section asks whether the observed associations between
alleles can be used to infer the processes that created the associations.
This would be valuable because it is easier to measure patterns of ge-
netic association than to measure processes such as immune selection
or the frequency of genetic mixing. However, many different processes
can lead to similar patterns of genetic association, making it difficult to
infer process from pattern. Detailed data and a careful accounting of al-
ternative hypotheses can allow one to narrow the possible explanations
for observed patterns.
The third section describes various processes of genetic mixing be-
tween lineages and the consequences for genome-wide linkage disequi-
librium. Some parasites have discrete, unmixed lineages, whereas other
parasites recombine frequently and have little linkage between differ-
ent loci. The degree of mixing determines the pace of antigenic recom-
bination. New antigenic combinations have the potential to overcome
existing patterns of host immunity.
The fourth section presents one example of antigenic linkage dis-
equilibrium, the case of Neisseria meningitidis. Variants at two antigenic
loci group together nonrandomly. Mixed genotypes occur at low fre-
quency, suggesting some recombination. The immune structure of the
host population could disfavor recombinant types, explaining the ob-
served linkage between antigenic loci. Alternatively, recent epidemics
STRUCTURE OF PARASITE POPULATIONS 149
or linkage with favored alleles at nonantigenic loci could also produce
the observed patterns of antigenic linkage.
The fifth section proposes that hosts form isolated islands for para-
sites (Hastings and Wedgwood-Oppenheim 1997). Island structure con-
fines selection within hosts to the limited genetic variation that enters
with initial infection or arises de novo by mutation. Island structure also
enhances stochastic fluctuations because each host receives only a very
small sample of parasite diversity. As the number of genotypes coloniz-
ing a host rises, selection becomes more powerful and stochastic per-
turbations decline in importance. Rouzine and Coffin (1999) apply the
balance between selection and stochastic perturbation to the observed
patterns of genetic variability in HIV.
The final section takes up promising lines of study for future research.
10.1 Kinds of Genetic Structure
Genetic structure describes the statistical pattern of associations be-
tween alleles (Wright 1969; Crow and Kimura 1970; Li 1976; Hartl and
Clark 1997; Hedrick 2000). It is useful to distinguish different kinds of
genetic associations.
LINKAGE DISEQUILIBRIUM BETWEEN ANTIGENIC LOCI
Statistical association between alleles at different loci is called link-
age disequilibrium. Linkage disequilibrium arises when alleles occur to-
gether in individuals (or haploid gametes) more or less frequently than
expected by chance.
Immune pressure by hosts could potentially create linkage disequilib-
rium between antigenic loci of the parasite (Gupta et al. 1996). Suppose
that the parasite genotype A/B infects many hosts during an epidemic,
leaving most hosts recovered and immune to any parasite genotype with
either A or B. Then genotypes A/B′ and A′/B will be selected against,
but A′/B′ can spread. Thus, host immunity favors strong linkage dise-
quilibrium in the parasites, dominated by the two strainsA/B andA′/B′.
GENOME-WIDE LINKAGE DISEQUILIBRIUM
Linkage disequilibrium over the entire genome arises when there is
some barrier to genetic mixing between lineages, such as spatial isola-
tion or lack of sex and recombination. When lineages do not mix, then
150 CHAPTER 10
the particular amino acid substitutions in each lineage become locked
together by their common pattern of inheritance. Genome-wide linkage
disequilibrium has been observed in some parasites but not in others
(Maynard Smith et al. 1993; Tibayrenc 1999).
Immune pressure can create associations between different antigenic
loci of the parasite. But if the parasite mixes its genome by recombina-
tion, nonantigenic loci will often remain in linkage equilibrium and will
not be separated into discrete strains. Consider, for example, a third,
nonantigenic locus with the allele C causing severe disease symptoms
and the equally frequent allele C′ causing mild symptoms.
Strong host immune pressure could potentially separate the antigenic
loci into discrete strains, A/B and A′/B′. But if recombination occurs,
the nonantigenic locus will be randomly associated with each strain, for
example, A/B/C and A/B/C′ will occur equally frequently. The alleles Cand C′ will also be distributed equally within the A′/B′ antigenic strain.
Immunity by itself does not organize the entire parasite genome into
discrete, nonoverlapping strains (Hastings and Wedgwood-Oppenheim
1997).
The distinction between antigenic and genome-wide linkage is impor-
tant for medical applications. If genome-wide linkage occurs, then each
strain defines a separate biological unit with its own immune interac-
tions, virulence characteristics, and response to drugs (Tibayrenc et al.
1990; Tibayrenc 1999). Strains can be typed, followed epidemiologically,
and treated based on information from a small number of identifying
markers of the genome.
ASSOCIATION BETWEEN COINFECTING PARASITES
Several parasite genotypes may infect a single host. A recent survey
of the literature found nonrandom associations between parasite geno-
types within hosts (Lord et al. 1999). For sexual parasites, nonrandom
associations within hosts often affect mating patterns. Mating typically
occurs between the parasites within a host or between parasites in a
vector that were recently derived from one or a few hosts. Nonrandom
mating alters heterozygosity at individual loci and the opportunities for
recombination between loci.
Host immunity may influence the distribution of strains within hosts.
Gilbert et al. (1998) found a positive association within hosts between

STRUCTURE OF PARASITE POPULATIONS 151
two antigenic variants of Plasmodium falciparum. Their data suggest
that the two variants mutually interfere with T cell attack against the
parasite, so both variants do better in the host when they are together.
In general, the immunological profile of each host constrains the range
of parasite variants that may coinfect that host.
EFFECTIVE POPULATION SIZE
The number of adult genotypes sampled to produce the progeny gen-
eration influences the effective size of the population (Wright 1969;
Crow and Kimura 1970; Li 1976; Hartl and Clark 1997; Hedrick 2000).
Population size affects many statistical properties of genetic structure.
For example, suppose a particular parasite genotype sweeps through
a host population, causing a widespread epidemic. This epidemic ge-
notype rises to a high frequency as other genotypes fail to spread or
decline in abundance.
Descendants of the population after an epidemic will likely come
from the epidemic genotype (Maynard Smith et al. 1993). The effec-
tive size of the population is small because of the limited number of
ancestral genotypes. The spread of an epidemic genotype carries along
in strong association the alleles of that genotype at different loci. Conse-
quently, strong genome-wide linkage disequilibrium may appear when
descendants of the epidemic genotypes are sampled among genotypes
descended from other lineages (Maynard Smith et al. 1993; Hastings and
Wedgwood-Oppenheim 1997).
Population size also influences the pattern of genomic evolution by
natural selection (Kimura 1983). When the effective population size is
small, chance events of sampling can favor one allele over another. This
stochastic sampling reduces the power of natural selection to shape evo-
lutionary patterns of antigenic variation.
10.2 Pattern and Process
Recently developed molecular tools, such as polymerase chain reac-
tion (PCR), provide the potential for widespread sampling of parasite
populations (Enright and Spratt 1999). Statistical descriptions of the
sampled data readily allow calculation of heterozygosity levels at single
loci, the linkage disequilibrium between loci within genomes, and the
spatial distribution of genotypes.
152 CHAPTER 10
Can we use the measurable patterns of population structure to infer
the underlying process that created the pattern? Yes, but only if we can
rule out alternative processes that could lead to the same pattern.
Suppose, for example, that we demonstrate genome-wide linkage dis-
equilibrium. The pattern by itself is interesting, because we have es-
tablished that the parasites fall into discrete strains. Each strain can
be identified by its combination of alleles, allowing the movement of
strains to be followed. Each strain can also be studied for its unique
antigenic and physiological properties, such as response to drugs.
The pattern of genome-wide linkage does not tell us what process cre-
ated that pattern. The pattern may be created by frequent epidemics,
each epidemic stemming from a limited number of genotypes. The par-
asite may be asexual, binding together alleles at different loci because
no process mixes alleles between genotypes. Or, sex and the physical
mixing of genotypes by recombination may occur in every generation,
but with all mating confined to the pool of genotypes within each host.
If only one parasite genotype typically infects a host, then all mating
occurs between members of the same lineage with no opportunity for
recombination to break down associations between loci.
One can carefully list all processes that could lead to the observed
pattern and then do statistical tests of the data to distinguish between
the potential causes. Maynard Smith et al. (1993) and Tibayrenc (1999)
present detailed statistical analyses to accomplish such tests.
Most statistical analyses have not focused on antigenic variation. In-
stead, those analyses have used data on genetic variability from loci
sampled across the genome. In some cases, the analyses use common
enzyme (housekeeping) loci (Enright and Spratt 1999). Housekeeping
loci are likely to evolve relatively slowly compared with other parts of
the genome. The relatively slow rates of change provide a good indi-
cator of common ancestry between genomes that have been separated
for long periods of time. Other analyses use rapidly evolving loci, which
provide more information about recent divergence from common ances-
tors (Tibayrenc 1999).
I review some population studies of genetic structure. I emphasize
only the background needed for understanding antigenic variation, leav-
ing out much of the analytical detail. I start with linkage of alleles across
the entire genome. I then turn to linkage at antigenic loci.
STRUCTURE OF PARASITE POPULATIONS 153
10.3 Genome-wide Linkage Disequilibrium
BARRIERS TO GENETIC MIXING
Genome-wide linkage arises when different lineages rarely mix their
genes (Tibayrenc 1999). Four different barriers prevent genetic mixing
(Maynard Smith et al. 1993; Hastings and Wedgwood-Oppenheim 1997).
First, asexual reproduction separates lineages irrespective of geograph-
ical or ecological locality. Differentiated strains will occur jointly in the
same area. In addition, particular multilocus combinations of genes may
disperse widely and be found in different regions without being broken
up by recombination with local varieties.
Second, physical separation by geography or habitat prevents genetic
mixing. Geographic subdivision is common in many populations. Eco-
logical subdivision may arise if some genotypes occur mainly in one host
species, whereas other genotypes are confined to a different host. Sex-
ual species divided by physical barriers will have mixed genomes within
local regions and differentiated genomes across barriers. Particular mul-
tilocus genotypes are unlikely to be found far from their native region
because they will be broken up by recombination with neighboring ge-
notypes.
Third, demography can separate lineages if each host or vector car-
ries only a single parasite genotype. Single-genotype infections prevent
physical contact between different parasite genotypes, isolating lineages
from each other even when they occur in the same region. Epidemics
may cause a single genotype to spread rapidly, limiting most infections
to the epidemic strain. This limited variability reduces opportunity for
genetic exchange and causes the region to be dominated by the linked
set of alleles within the epidemic strain (Maynard Smith et al. 1993).
In the absence of epidemics, single-genotype infections can maintain a
greater diversity of distinct genotypes within a region. Obligate intracel-
lular pathogens may be able to exchange genetic information only when
two distinct genotypes coinfect a cell.
Fourth, mixing may occur occasionally between separated lineages,
but mixed genotypes fail. Hybrid incompatibility separates eukaryotes
into distinct, reproductively isolated species. In segmented viruses, cer-
tain pairs of segments may be incompatible, causing the absence of
some genotypic combinations (Frank 2001). Recombining viruses and
154 CHAPTER 10
bacteria present more complex possibilities. Certain genomic regions
may be able to pass from one lineage to another, whereas other genomic
regions may be incompatible. Thus, some genomic regions may exhibit
linkage disequilibrium between lineages, whereas other regions may be
well mixed.
Sexual, diploid species will be primarily homozygous when different
lineages do not mix because most matings will be between the same
genotype. Asexual species may maintain significant heterozygosity even
in regions dominated by a single clone.
At the nucleotide level, epidemics tend to reduce genetic variability
because extant parasites have descended from a recent ancestral geno-
type that started the epidemic. By contrast, endemic diseases will often
maintain more nucleotide variability within genotypes because those ge-
notypes trace their ancestry back over a longer time to a common pro-
genitor.
Sexual, physical, and demographic barriers to genomic mixing shape
patterns of genetic variability. Conversely, those patterns provide infor-
mation about key aspects of parasite biology.
AN EXAMPLE
The protozoan Trypanosoma cruzi causes Chagas’ disease. Linkage
disequilibrium between loci has been observed in several sampling stud-
ies (e.g., Tibayrenc et al. 1986; Tibayrenc and Ayala 1988; Oliveira et al.
1998, 1999). Recently, Michel Tibayrenc’s laboratory expanded a long-
term analysis of genetic variability by using multilocus enzyme elec-
trophoresis (MLEE), random amplified polymorphic DNA (RAPD), and
polymerase chain reaction (PCR) (Barnabé et al. 2000; Brisse et al. 2000a,
2000b).
Tibayrenc’s laboratory has classified T. cruzi into six groups defined
as discrete typing units (DTUs) (Tibayrenc 1999). Each individual in
a DTU shares a significant proportion of alleles at several polymor-
phic loci with other members of the DTU and shares relatively few al-
leles with members of other DTUs. The discrete, nonoverlapping struc-
ture of DTUs is simply another way to describe genome-wide linkage
disequilibrium—the association of particular sets of alleles within ge-
nomes.

STRUCTURE OF PARASITE POPULATIONS 155
The different methods, MLEE, RAPD, and PCR, give similar results for
the classification of T. cruzi isolates into DTUs. Because each method
measures genetic variability in different parts of the genome, the con-
cordance between methods further supports the overall classification
into separate DTUs.
The DTUs provide a taxonomy to identify new samples. To the extent
that DTUs truly capture genome-wide linkage, each DTU will likely have
unique properties. Several studies have compared traits such as growth
rate, virulence in mice, and sensitivity to drugs (e.g., Revollo et al. 1998;
de Lana et al. 2000). The trait values for different isolates of a DTU often
vary widely, with the average values of the isolates differing between
DTUs. Thus, there appears to be considerable genetic diversity both
within and between DTUs.
What processes maintain genome-wide linkage? The previous section
classified barriers to genetic mixing as sexual, physical, demographic,
or genetic. Tibayrenc and his colleagues have argued that sexual re-
production occurs rarely in T. cruzi and that the lack of sex explains
the observed patterns of genetic linkage. They review many lines of
evidence, but perhaps the most telling observation concerns repeated
occurrences of particular multilocus genotypes.
Barnabé et al. (2000) showed that certain multilocus genotypes recur
in samples. Some of the repeated multilocus genotypes were found in
widely separated geographic locations. The probability of obtaining the
same set of alleles across multiple polymorphic loci would be very small
if the loci recombined occasionally.
Epidemics stemming from a single genotype could possibly cause the
spread and repeat occurrence of a genotype. But some of the repeated
genotypes were found in areas surrounded by other genotypes, far from
the geographic foci of their highest frequency. In addition, the high ge-
netic diversity within locations argues against local regions being swept
by epidemic strains.
Rare sex seems to be a reasonable explanation given the limited data.
Eventually, additional studies will collect more data and develop a clear-
er picture of genetic structure.
156 CHAPTER 10
IS A CLONAL POPULATION STRUCTURE COMMON?
Tibayrenc et al. (1990, 1991) concluded from the available data that
many parasites have genome-wide linkage disequilibrium, suggesting
that different lineages rarely mix genes. Tibayrenc et al. use the word
“clonal” to describe the observed pattern of genomic linkage, without
implying any particular cause such as asexuality or lack of mating be-
tween different sexual lineages.
Several recent analyses infer a clonal population structure, including
studies of the protozoan Trypanosoma cruzi (citations above), the pro-
tozoan Cryptosporidium parvum (Awad-El-Kariem 1999), and the yeast
Candida albicans (Xu et al. 1999). However, data from other species
present a complex picture, suggesting a wide diversity of genetic struc-
tures. I summarize some of the current ideas and observations in the
following subsections.
BACTERIA AND PROTOZOA
Bacteria reproduce by binary fission, an asexual process. However,
bacteria can mix genomes by taking up DNA from neighboring cells
(Ochman et al. 2000). Conjugation directly transfers DNA, transduction
carries bacterial DNA with infecting viruses, and transformation occurs
by uptake of free DNA that has been released into the environment. For-
eign DNA fragments can recombine with the host chromosome, inserting
a piece of genetic material from a different lineage into the genome.
Maynard Smith et al. (1993) classified bacterial genetic structure as
clonal, panmictic, or epidemic. Rare recombination leads to a clonal
structure with strong linkage disequilibrium, as observed in Salmonella
enterica (Spratt and Maiden 1999).
Frequent recombination leads to a panmictic (widely mixed) genet-
ic structure and relatively little association between alleles within ge-
nomes. Helicobacter pylori has a panmictic structure (Spratt and Maiden
1999). Recombination occurs so frequently that even variable nucleo-
tide sites within genes are often in linkage equilibrium (not statistically
associated) (Suerbaum et al. 1998; Salaun et al. 1998).
Neisseria gonorrhoeae also has a panmictic structure (Spratt and Maid-
en 1999). However, a strain that requires arginine, hypoxanthine, and
uracil (AHU) to grow has maintained a tightly linked genotype over a
thirty-nine-year period (Gutjahr et al. 1997). That strain can take up
STRUCTURE OF PARASITE POPULATIONS 157
and recombine with DNA in the laboratory. Perhaps the clonal AHU
strain remains within the broader panmictic population because it rarely
occurs in mixed infections with non-AHU genotypes.
Neisseria meningitidis has an epidemic population structure (Spratt
and Maiden 1999). Recombination occurs frequently, and broad sam-
ples of the population typically show highly mixed genomes with lit-
tle or no linkage disequilibrium. However, it appears that epidemics
sometimes arise from single genotypes and spread rapidly within a re-
stricted geographic area. When samples include a large fraction of the
epidemic strain, this strain shows a clonal pattern of inheritance and
strong linkage disequilibrium when compared against other isolates.
The epidemics appear to be sporadic and localized, and the epidemic
clone probably mixes its genome with other lineages over the span of
several months or a few years. As the epidemic clone mixes with other
genotypes, its unique pattern of genetic linkage decays.
Escherichia coli has a particularly interesting population structure
(Guttman 1997). The first broad studies found strong linkage disequi-
librium and an apparently clonal structure. However, early studies of
population structure tend to sample widely and sparsely, obtaining just
one or a few isolates from each habitat or geographic locality. Later
studies of E. coli provided finer resolution by sampling repeatedly from
the same or nearby localities or by using DNA sequences rather than
lower-resolution molecular markers. Those later studies found that re-
combination does occur.
How can E. coli ’s recombining genetic system maintain widespread
linkage disequilibrium? This remains a controversial question with sev-
eral possible answers. Recombination may be a weak force, introducing
changes into genomes at a rate no higher than the mutation rate. Ad-
vantageous genes may occasionally sweep through a local population,
carrying along linked genes as in epidemics. Frequent sweeps promote
linkage and may overwhelm the mixing effect of recombination. Alterna-
tively, different genotypes may be specific for different habitats, so that
most recombinational mixing occurs within habitats. This may lead to
weaker linkage within habitats but strong linkage when measured be-
tween nonmixing lineages that live in different habitats.
I suspect that the relatively complex structure of E. coli reflects the
more intensive study of this species at different spatial scales. Many
bacteria will likely show different genetic structures when analyzed at
158 CHAPTER 10
different scales. The particular spatial scale over which a species dif-
ferentiates into nonmixing lineages will vary depending on the relative
balance of recombination, genetic drift, selective sweeps, epidemics, and
migration.
Recent studies on the protozoan Trypanosoma brucei illustrate the
varying genetic structures revealed by careful sampling (MacLeod et al.
2000). The human-infective subspecies T. b. rhodesiense causes African
sleeping sickness, whereas the subspecies T. b. brucei cannot infect hu-
mans. Both subspecies occur in various domestic animals.
T. brucei can recombine sexually in the laboratory, but the extent of
genetic mixing in natural populations has been debated (Tibayrenc et al.
1990; Maynard Smith et al. 1993; Hide et al. 1994). MacLeod et al. (2000)
demonstrated that the two subspecies are genetically differentiated and
show linkage disequilibrium when compared against each other. Within
subspecies, T. b. brucei had an epidemic structure, in which recombina-
tion occurs but can be overwhelmed by clonal expansion of a few geno-
types during epidemics. By contrast, T. b. rhodesiense appeared clonal
within the Ugandan samples obtained. Further sampling may eventually
find that the Ugandan isolates are part of a wider population in which
some recombination occurs.
The protozoan Plasmodium falciparum has an obligate sexual phase
that occurs during transmission in the mosquito vector. In geographic
regions where infection is common, the vector frequently picks up mul-
tiple genotypes, which then mate and recombine before transmission
to a new host. By contrast, regions with sparsely infected hosts have
a lower probability of mixed genotypes in the vectors, leading to fre-
quent self-fertilization and limited opportunity for recombination be-
tween lineages (Babiker and Walliker 1997; Paul and Day 1998; Conway
et al. 1999).
Anderson et al. (2000) studied P. falciparum genetic structure with
twelve rapidly mutating microsatellite loci in 465 isolates from nine ge-
ographic regions. Within areas of low infection intensity, they found
strong linkage disequilibrium, low genetic diversity, and high variation
between geographic locations. They observed the opposite patterns
within areas of high infection intensity. This provides another exam-
ple in which the genetic structure varies across space.
STRUCTURE OF PARASITE POPULATIONS 159
REASSORTMENT IN SEGMENTED VIRUSES
The segmented RNA viruses provide an excellent model for studying
genomic linkage disequilibrium. Genomes are broken up into two or
more segments. Each segment replicates independently during cellular
infection. The segments act like distinct chromosomes but do not pair
and segregate as in eukaryotic cells. Instead, new viral particles form
by a sampling process that chooses approximately one segment of each
type. When multiple viruses infect a single cell, their replicating seg-
ments mix. The progeny form by reassorted combinations of genomic
segments.
Reassortment has the same effect as recombination. However, reas-
sorting segments are easier to study because the segments mark dis-
cretely and clearly the units of recombination.
Occasional reassortment plays a crucial role in creating new strains.
Reassortment of influenza A’s neuraminidase and hemagglutinin sur-
face antigens provides the most famous example (Lamb and Krug 2001).
The genes for these antigens occur on two separate RNA segments of
the genome—the genome has a total of eight segments.
It appears that rare reassortments have occasionally introduced hem-
agglutinin or neuraminidase from bird influenza into the genome of hu-
man influenza (Webster et al. 1997). The novel antigens cross-reacted
very little with those circulating in humans, allowing the new combina-
tion to sweep through human populations and cause pandemics.
Lack of reassortment maintains discrete strains with strong linkage
disequilibrium between segments. Rare mixing can be traced back phy-
logenetically to one or a few events. This is another way of saying that,
after reassortment, discrete lineages accumulate new mutations on dif-
ferent segments and keep those new mutations together within the lin-
eage, creating linkage disequilibrium.
Common reassortment reduces linkage disequilibrium between seg-
ments by bringing together genetic variants that arose in different indi-
viduals. Reassortment causes differences in the phylogenetic history of
different segments within a virus.
Reassortment may be common between viruses within a population,
but that population may not mix with viruses from another population.
Measured within each population, linkage disequilibrium will be low,
and there will be a weak correlation between phylogenetic patterns of

160 CHAPTER 10
different segments. But isolated populations do not share the same
associations between genetic variants and thus exhibit linkage disequi-
librium relative to each other. Equivalently, the segments within each
isolated population have a common phylogeny that differs relative to
the phylogenetic history of the segments in other populations.
No studies have sampled over different spatial and temporal scales
or studied the processes that cause barriers to reassortment. The best
studies I found examined the phylogenetic histories of the various seg-
ments of influenza. Influenza occurs in three major types: A, B, and C.
Several papers describe reassortment between segments of influenza
C (Buonagurio et al. 1985; Peng et al. 1994, 1996; Tada et al. 1997).
A phylogenetic tree of the NS (nonstructural protein) segment showed
that thirty-four isolates over 1947–1992 split into two distinct lineages.
Recent isolates had one NS lineage, whereas older isolates had the other
NS lineage. Thus, the newer NS lineage seems to have replaced the older
lineage. By contrast, phylogenies of the other six segments identify three
or four distinct lineages, in which each lineage contains older isolates
as well as recent isolates. Alamgir et al. (2000) suggest that the newer
NS type has reassorted with the other segments and replaced the older
NS type, perhaps because the newer NS type has a functional advantage
that enhances its spread.
The phylogenetic patterns for seven of the eight influenza B segments
show clear patterns of reassortment (Lindstrom et al. 1999; Hiromoto
et al. 2000). Figure 10.1 illustrates the phylogenetic patterns and pu-
tative reassortments for segments based on eighteen isolates obtained
over twenty years. Concordant phylogenetic patterns between segments
suggest cotransmission of those segments. Such concordance may arise
by selection of functionally compatible segments, for example, between
the PB1 and PB2 segments that encode components of the polymerase
complex (Hiromoto et al. 2000). However, the sample size is small, and
the observed concordances may simply be the chance outcome from a
small number of reassortment events.
Lindstrom et al. (1998) sequenced all eight segments from ten isolates
of influenza A. The isolates were collected over the years 1993–1997.
The hemagglutinin (HA) and neuraminidase (NA) segments encode the
surface glycoproteins known to determine the main components of anti-
genicity and interaction with human immunity. These two segments
accumulated amino acid changes sequentially over the 5-year period,
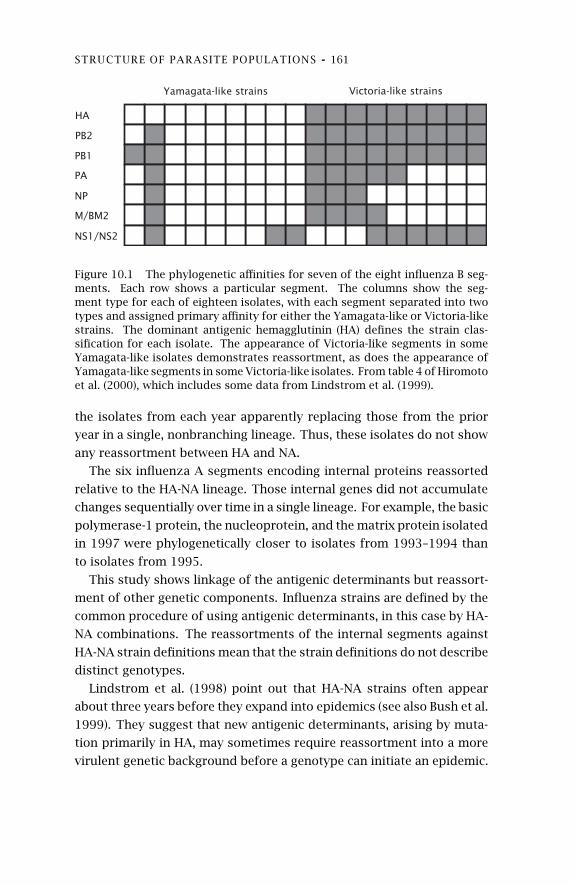
STRUCTURE OF PARASITE POPULATIONS 161
HA
NS1/NS2
M/BM2
NP
PA
PB1
PB2
Yamagata-like strains Victoria-like strains
Figure 10.1 The phylogenetic affinities for seven of the eight influenza B seg-ments. Each row shows a particular segment. The columns show the seg-ment type for each of eighteen isolates, with each segment separated into twotypes and assigned primary affinity for either the Yamagata-like or Victoria-likestrains. The dominant antigenic hemagglutinin (HA) defines the strain clas-sification for each isolate. The appearance of Victoria-like segments in someYamagata-like isolates demonstrates reassortment, as does the appearance ofYamagata-like segments in some Victoria-like isolates. From table 4 of Hiromotoet al. (2000), which includes some data from Lindstrom et al. (1999).
the isolates from each year apparently replacing those from the prior
year in a single, nonbranching lineage. Thus, these isolates do not show
any reassortment between HA and NA.
The six influenza A segments encoding internal proteins reassorted
relative to the HA-NA lineage. Those internal genes did not accumulate
changes sequentially over time in a single lineage. For example, the basic
polymerase-1 protein, the nucleoprotein, and the matrix protein isolated
in 1997 were phylogenetically closer to isolates from 1993–1994 than
to isolates from 1995.
This study shows linkage of the antigenic determinants but reassort-
ment of other genetic components. Influenza strains are defined by the
common procedure of using antigenic determinants, in this case by HA-
NA combinations. The reassortments of the internal segments against
HA-NA strain definitions mean that the strain definitions do not describe
distinct genotypes.
Lindstrom et al. (1998) point out that HA-NA strains often appear
about three years before they expand into epidemics (see also Bush et al.
1999). They suggest that new antigenic determinants, arising by muta-
tion primarily in HA, may sometimes require reassortment into a more
virulent genetic background before a genotype can initiate an epidemic.
162 CHAPTER 10
However, that leaves open the question of why mutations would often
arise in weak genetic backgrounds and require reassortment into strong
backgrounds.
RECOMBINATION IN VIRUSES
Reassortment is a special case of the more general process of recombi-
nation. DNA viruses and many RNA viruses have only a single segment,
so genetic exchange typically occurs between similar (homologous) seg-
ments. Several cases of recombination have been described (summa-
rized by Worobey and Holmes 1999), for example, between vaccine and
wild-type polio strains (Guillot et al. 2000).
Recombinants may strongly affect evolutionary patterns even when
the frequency of recombination per generation is very low. Occasional
recombinants can create the mosaic progenitors of successful lineages
(Worobey and Holmes 1999). In addition, recombination means that a
particular virus does not have a single phylogenetic history—instead,
each part of the genome may trace back to a different ancestral lineage.
This may preclude an unambiguous viral taxonomy based on phylogeny.
Recombination can occur only when host cells are coinfected by dif-
ferent viral genotypes. Preliminary reports suggest that some viruses
can recombine frequently when genetic variants coinfect a cell (Martin
and Weber 1997; Fujita et al. 1998; Bruyere et al. 2000; Hajós et al. 2000;
Jetzt et al. 2000; Zhang et al. 2000). Many viruses may be similar to the
Plasmodium example cited above, in which the frequency of multiple in-
fection by different genotypes determines the degree of genetic mixing
between lineages.
The frequency of recombination between genetic variants undoubt-
edly varies among viruses. Worobey (2000) has shown that isolates of
the DNA-based TT virus have mosaic genomes generated by recombi-
nation. Recombination is sufficiently frequent that a small subset of
the genome provides a poor indicator of the phylogenetic history for
the entire genome. Thus, strain typing may have little meaning because
highly diverged variants merge by recombination into a single gene pool.
A similar study of the RNA-based dengue virus found seven genotypes
created by recombination events between seventy-one isolates (Worobey
et al. 1999).
STRUCTURE OF PARASITE POPULATIONS 163
Distinct strains do not exist under frequent recombination. By con-
trast, rare recombination leaves most lineages identifiably intact as dis-
crete strains. With discrete strains, occasional recombinant mosaics can
be identified as the mixture of known strains.
HIV isolates across the world have been sequenced (http://hiv-web.
lanl.gov/). Most isolates appear to have a phylogenetic affinity for a
particular clade, but multiple recombination events and genomic mo-
saics also occur frequently (Bobkov et al. 1996; Cornelissen et al. 1996;
Robertson et al. 1999). The opposing aspects of discrete strains and
widespread recombination probably reflect heterogeneous histories in
different locations, the temporal and spatial scales of sampling, and the
rapidly changing nature of the viral populations as the infection contin-
ues to spread.
I briefly speculate about the history of HIV to illustrate the sort of
processes and patterns that may occur in viral evolution. The epicenter
of HIV diversity and the probable origin of the pandemic occur in central
Africa (Vidal et al. 2000). Based on sequences from the V3–V5 env region
of the genome, all known HIV-1 subtypes occurred in a sample of 247
isolates from the Democratic Republic of Congo. Analysis of the gag
genomic regions and longer sequences in the env region showed a high
frequency of recombination within this population.
Overall, the Democratic Republic of Congo population had all known
subtypes, a high degree of diversity within each subtype, and significant
mosaicism across different genomic regions. This suggests a relatively
old and large population that has accumulated diversity and probably
been the source for many lineages that have colonized different parts
of the world (Vidal et al. 2000).
Different lineages dominate different geographic regions of the world
(http://hiv-web.lanl.gov/). For example, subtype B has spread through-
out the Americas, Europe, Australia, and parts of eastern Asia. Subtype
A is relatively common in the eastern African countries around the Ivory
Coast, and subtype C dominates southern Africa. These broad patterns
probably represent the initial spread from central Africa into those re-
gions, each region founded by a narrow slice of the worldwide HIV di-
versity.
Each subtype divides more finely into variants. Such variants may
dominate smaller localities. For example, a distinctive B subtype is par-
ticularly common in the heterosexual population of Trinidad and To-
164 CHAPTER 10
bago (Cleghorn et al. 2000). Another variant B (Thai B) is common in
Thailand.
Each region may accumulate significant diversity within its dominant
subtype, with frequent recombination between subtype variants. How-
ever, as HIV spreads, a region initially pure for a subtype will eventu-
ally be colonized by other subtypes. Recombination between subtypes
then mixes the distinct phylogenetic histories of the subtypes. Such re-
combinations probably have become increasingly common, for example,
the admixtures of subtypes occurring along the routes of intravenous
drug user transmissions in China (Piyasirisilp et al. 2000). Drug users
in Greece and Cyprus also appear to be fertile sources of recombinants
between subtypes (Gao et al. 1998).
These studies suggest that recombination may be relatively common.
Such recombination between antigenic sites can strongly influence the
evolutionary dynamics of antigenic variation because new genotypes can
be generated by combinations of existing variants rather than waiting
for rare combinations of new mutations.
10.4 Antigenic Linkage Disequilibrium
The previous section described studies of distinct strains caused by
epidemics or barriers to genetic mixing between lineages. Those studies
defined strains mainly by measurement of genetic variability at nonanti-
genic loci (Enright and Spratt 1999). Methods of measurement include
electrophoresis and nucleotide sequencing.
In this section, I focus on genetic variability between lineages when
defined by differences at antigenic loci. Immune pressure by hosts can
potentially separate the parasite population into discrete, nonoverlap-
ping antigenic types (Gupta et al. 1996, 1999). Suppose that a haploid
parasite with alleles at two different loci, A/B, infects many hosts during
an epidemic, leaving most hosts recovered and immune to any parasite
genotype with either A or B. Then genotypes A/B′ and A′/B will be se-
lected against, but A′/B′ can spread. Thus, host immunity favors strong
linkage disequilibrium in the parasites, dominated by the two nonover-
lapping genotypes A/B and A′/B′.Few data exist on the degree of antigenic overlap between genotypes
(reviewed by Gupta et al. 1996, 1999). The best example comes from
Feavers et al. (1996), who analyzed variability in the outer membrane

STRUCTURE OF PARASITE POPULATIONS 165
Table 10.1 Linkage disequilibrium between antigens of Neisseria meningitidis
VR1 VR2 Expected Observedtype type percent percent
5 10 8.2 25.37 4 6.5 20.3
19 15 3.2 15.3other combinations 82.1 39.1
protein PorA of Neisseria meningitidis. This protein has two distinct
variable antigenic regions, VR1 and VR2. Strong associations occurred
between VR1 and VR2 variants in a sample of 222 isolates from England
and Wales obtained in 1989–1991. Table 10.1 shows that three combi-
nations account for 61% of the observed genotypes, much higher than
the 18% expected for these combinations if the two antigens occurred
independently. The “other combinations” include mixtures of the listed
types, for example, VR1 type 5 with VR2 type 4, plus other, rarer types
not listed.
The existence of uncommon combinations suggests that recombina-
tion can occur. Some process apparently opposes recombination to
maintain strong linkage disequilibrium between VR1 and VR2. Gupta
et al. (1996) favor host immune selection as the force that structures
bacterial genotypes into nonoverlapping sets. This is certainly a plau-
sible explanation. But, as with most population genetic patterns, other
processes can lead to the same observations. For example, the three
common types might just happen to be the strains circulating most
widely among the individuals sampled. Those strains might be com-
mon because of chance events that led to mild epidemics caused by
a few different types. Or those types may have advantageous alleles at
other loci, possibly antigenic but not necessarily so. Over time, recombi-
nation could break down the associations between advantageous alleles
and the VR combinations, but over a few years such associations can be
strong.
Gupta et al.’s (1996) work on antigenic strain structure calls attention
to several interesting questions. Are different antigenic combinations
structured into nonoverlapping sets? The pattern by itself is important
for the design of vaccines and the study of epidemiological distributions.
If discrete antigenic strains occur, are they associated with other com-
ponents of the genome that code for attributes such as virulence? Hast-

166 CHAPTER 10
ings and Wedgwood-Oppenheim (1997) provide a good introduction to
the processes that potentially link antigenic type to other characters.
What processes can potentially structure populations into discrete,
nonoverlapping antigenic combinations? Immune selection is one pos-
sibility, but any process that reduces gene flow relative to the scale of
sampling tends to create nonrandom associations between loci.
How can one differentiate between the various processes that lead to
similar patterns? A clear understanding of the processes that reduce
gene flow and their consequences (Hastings and Wedgwood-Oppenheim
1997) can help. Direct observations of immune selection disfavoring
“recombinant” antigenic types would be useful, but perhaps difficult to
obtain.
10.5 Population Structure: Hosts as Islands
Parasite populations often subdivide into Wright’s (1978) classical “is-
land model” structure from the theory of population genetics (Hastings
and Wedgwood-Oppenheim 1997). Each host forms an island colonized
by parasites from one or more sources. The population of parasites
within the host undergoes selection that depends on the amount of ge-
netic variation between parasites within the host. The host transmits mi-
grant parasites to colonize new hosts (islands). Each population within
a host expires when the host dies or clears the infection.
GENERAL ASPECTS OF TRANSMISSION AND SELECTION
The number of genotypes colonizing a host may often be small. For
example, only a few parasites may colonize a host, or all of the para-
sites may have come from a single donor that itself had little genetic
variation among its parasites. If initial genetic variability is low, then
selection within the host depends primarily on de novo mutations that
arise during the population expansion of the parasites. By contrast, high
initial genetic variability within hosts causes intense selection between
coinfecting genotypes.
The island structure of parasite populations resembles the genetic
structure of multicellular organisms when taking account of selection
within individuals. Each new organism begins as a single cell or, in some
clonal organisms, as a small number of progenitor cells. The individual
develops as a population of cells, with the potential for selection be-

STRUCTURE OF PARASITE POPULATIONS 167
tween cellular lineages that vary genetically. Genetic variation may arise
from the small number of progenitor cells or from de novo mutations.
The individual transmits some of its cells to form new bodies (islands).
Eventually, the individual dies.
There is some general theory on the population genetics of mutation
and selection within individuals (Slatkin 1984; Buss 1987; Orive 1995;
Michod 1997; Otto and Hastings 1998). Levin and Bull (1994) discussed
how selection within and between hosts can shape patterns of parasite
life history (reviewed by Frank 1996). But there has been little work on
the consequences of island population structure for antigenic variation.
Hastings and Wedgwood-Oppenheim (1997) illustrated how a quanti-
tative theory of island-model genetics can be used to understand the
buildup or decay of linkage disequilibrium.
I found one study that develops the theory of island population struc-
ture for parasites.
GENETIC VARIATION OF HIV WITHIN INDIVIDUAL HOSTS
Rouzine and Coffin (1999) sought to explain the high genetic diver-
sity of HIV within hosts. They developed the theory of island population
structure for parasites to compare the relative strengths of natural se-
lection and stochastic processes that can cause genetic variability.
Rouzine and Coffin (1999) focused on the pro gene, which encodes
a protease that processes other HIV gene products. Analysis of nucle-
otide sequences for this particular gene suggested that natural selec-
tion acts primarily in a purifying way to remove deleterious mutations.
Consequently, their model describes the accumulation of nucleotide di-
versity shaped by two opposing forces. On the one hand, stochastic
effects occur because only a small number of viruses invade each host—
the founders of that island. Stochastic drift during colonization allows
deleterious mutations to rise in frequency. On the other hand, purify-
ing selection within hosts removes deleterious mutations. How do the
opposing forces of mutation and selection in parasites play out in the
island structure of hosts?
If each new host is colonized by viruses from a single donor host,
then the founding population tends to have limited genetic diversity.
Low diversity causes natural selection to be weak because there is not
much opportunity for competition between genetic variants. Only new

168 CHAPTER 10
mutations that arise within the host provide an opportunity to replace
deleterious mutations by genetic variants that restore full fitness.
With colonization from a single donor host, the viruses in each host
share a lineage of descent that is isolated from the viruses in other hosts.
Isolated lineages and bottlenecks in viral numbers that occur during
transmission allow the accumulation of deleterious genetic variation by
drift.
Coinfection from different donor hosts mixes lineages, increases ge-
netic variation within hosts, and greatly enhances the power of natural
selection to remove deleterious variants. Rouzine and Coffin (1999) es-
timate that a coinfection frequency higher than 1% provides sufficiently
strong selection within hosts to reduce the level of genetic variation rel-
ative to the amount of variation that accumulates by drift in isolated
lineages.
If coinfection occurs more commonly than 1%, as Rouzine and Coffin
(1999) believe to be likely, then some other process must explain the
high levels of genetic variability observed. Rouzine and Coffin (1999)
discuss an interesting type of selection that purifies within hosts but
diversifies between hosts. According to their model, purifying selection
within hosts removes T cell epitopes to avoid host immunity. MHC type
varies between hosts, causing different T cell epitopes to be recognized
by different hosts. Thus, diversifying selection acts between hosts to
establish reduced recognition by MHC. Purifying selection within hosts
and diversifying selection between hosts may account for the apparently
paradoxical observations: nucleotide substitutions leave the signature
of purifying selection, yet the viral population maintains significant ge-
netic diversity.
Very few studies have considered how the island population structure
of parasites influences the distribution of genetic diversity. As more
sequences accumulate, there will be greater opportunity to match the
observed patterns to the combined stochastic and selective processes
that shape parasite diversity.
10.6 Problems for Future Research
1. Statistical inference. Patterns of genetic structure must be inter-
preted with regard to alternative models. For example, table 10.1 shows
linkage between two antigenic loci of Neisseria meningitidis. I mentioned

STRUCTURE OF PARASITE POPULATIONS 169
three hypotheses to explain those data: immune selection against re-
combinants, epidemics, and linkage with favored alleles at other loci.
Each hypothesis leads to a model dependent on several parameters.
For example, the rarity of recombinant genotypes under immune selec-
tion depends on the distribution of immune profiles in hosts, the inten-
sity of selection against the recombinant genotypes, and the frequency
of recombination.
To determine if an observed pattern favors one model over another,
one must understand the range of outcomes likely to follow from each
model. This requires mathematical development to calculate the pre-
dicted outcomes from the different models. Then one must design sam-
pling schemes to obtain data that can differentiate between the mod-
els. Theoretical analysis of sampling schemes can compare the infor-
mation in different sampling procedures with regard to the alternative
processes under study.
Technical advances will continue to improve the rate at which samples
can be processed and analyzed. Improved technical facilities will allow
designed sampling procedures and hypothesis testing.
2. Scale-dependent population structure. Sampling over different dis-
tances will often reveal a hierarchy of scale-dependent processes that
depend on the epidemiology and demography of the parasite. It may be
common to find spatial isolation at longer scales, mixing in dense aggre-
gations at local scales, and occasional swaths of genome-wide linkage
at varying scales caused by population bottlenecks or the rapid spread
of epidemic strains. The relative scaling of these processes will differ
greatly among parasites.
3. Different phylogenetic histories of genomic components. Very in-
tense selection on antigenic loci can occur in parasites. This focused
selection can cause different components of the genome to have dif-
ferent genetic structures and phylogenetic histories. I briefly mention
one example to provide hints about what may happen and to encourage
further work.
I described earlier in this chapter the example of influenza. In that
case, Lindstrom et al. (1998) found that the two antigenic segments,
hemagglutinin and neuraminidase, cotransmitted in an epidemic fash-
ion over five years of samples. By contrast, the other six segments ap-
peared to mix their lineages relative to the single line of cotransmitted

170 CHAPTER 10
antigenic segments. Thus, epidemically bound linkage groups may oc-
cur against a mixing genetic background. More data of this sort might
show different genomic components changing their population struc-
tures relative to each other over different temporal and spatial scales.
Such data could provide insight into the scale-dependent effects of de-
mographic, genetic, and selective processes.
4. Population bottlenecks and genomic diversity. Rich et al. (2000)
argue that all of the very diverse antigenic variants of Plasmodium fal-
ciparum have arisen since a recent population bottleneck that occurred
less than fifty thousand years ago. Variant alleles at antigenic loci ap-
pear to trace their phylogenetic history back to common ancestors more
recent than the putative bottleneck event. This pattern suggests intense
natural selection favoring novel diversity at antigenic sites against a
background of low genome-wide diversity caused by a recent bottleneck.
Alternatively, the antigenic variants could trace their history back
to ancestors that predated the bottleneck (Hughes 1992; Hughes and
Hughes 1995; Hughes and Verra 2001). This pattern arises when natural
selection strongly favors rare variant antigens, holding diverse antigens
in the population through the bottleneck that reduced variation in the
rest of the genome. Ancient polymorphisms of this sort suggest that
natural selection preserves existing variants rather than favors de novo
generation of new variants (Ayala 1995; O’hUigin et al. 2000).
A recent, more detailed study by Volkman et al. (2001) estimates that
the most recent common ancestor of P. falciparum lived less than ten
thousand years ago. If this estimate applies to the var genes as well as
the loci studied by Volkman et al. (2001), then the diverse var family
of antigenic variants must have evolved very rapidly. Further studies of
different genomic regions will contribute to understanding the speed of
diversification in the var archival library.
5. Island structure. Many classical genetic models develop the island
structure for populations (Wright 1978). However, those general studies
of migration, selection, and stochastic perturbation provide little guid-
ance for the genetic structure of parasites. Studies for parasites must
account for the density and variability of host immune memory, the
longevity of infections, the genetic diversity of inocula, and the patterns
of genetic mixing between parasites.
STRUCTURE OF PARASITE POPULATIONS 171
Much insight can be gained by island models focused specifically on
the special biology of parasites (Hastings and Wedgwood-Oppenheim
1997). Rouzine and Coffin’s (1999) study shows how a clear model of
population genetic process can lead to predictions about the expected
patterns in the data. This suggests how one could couple process-
oriented theory with the problem of statistical inference.


PART V
STUDYINGEVOLUTION

11 Classifications byAntigenicity andPhylogeny
In this chapter, I compare immunological and phylogenetic classifica-
tions of antigenic variation. Contrasts between these classifications pro-
vide insight into how natural selection shapes observed patterns of di-
versity. Following chapters take up other methods to infer processes of
selection.
The first section describes immunological measures of antigenicity.
These measures summarize the ability of specific antibodies to recog-
nize different antigenic variants. The reactivities for various antibodies
tested against different antigenic isolates form a matrix of antigenic or
immunological distances between parasite variants. These distances can
be used to classify antigenic variants into related clusters.
The second section notes that antigenic variants can also be classified
by phylogeny. This classification scheme measures relatedness between
variants by distance back in time to a common ancestor. Such distances
arise from the patterns of nucleotide or amino acid differences in ge-
nomic sequences.
The third section defines possible relations between antigenic and
phylogenetic classifications. Concordance commonly occurs because
antigenic distance often increases with time since a common ancestor,
reflecting the natural tendency for similarity by common descent. A
particular pattern of discord between antigenic and phylogenetic clas-
sifications suggests hypotheses about evolutionary process. Suppose,
for example, that phylogenetically divergent parasites are antigenically
close at certain epitopes. This suggests as a hypothesis that selective
pressure by antibodies has favored recurrent evolution of a particular
antigenic variant.
The fourth section presents flaviviruses as an example of concor-
dant antigenic and phylogenetic classifications. This example compares
strains that differ by relatively long phylogenetic distances with anti-
genicity measured by averaging reactivity over many different epitopes.
Aggregate antigenicity tends to diverge steadily over time as amino acid
176 CHAPTER 11
differences accumulate (Benjamin et al. 1984). Particular details of nat-
ural selection with regard to each amino acid substitution disappear in
the averaging over many independent events.
The fifth section shows a mixture of discordance and concordance
between antigenic and phylogenetic classifications for influenza A. The
classifications cover a history of transfers between different host spe-
cies. Antigenicity and phylogeny both separate isolates from pigs into
two groups, the classical swine types and avian-like swine types more
recently transferred from birds to pigs. Two bird isolates group phylo-
genetically with the avian-like swine types, as expected. However, anti-
genic measures separate the bird isolates as distinct from the relatively
similar classical swine and avian-like swine groups. Perhaps host adap-
tation influences antigenicity of some epitopes used in this study.
The sixth section suggests that immunological pressure by antibodies
drives the short-term phylogenetic divergence of influenza A. If so, then
antigenic classifications over the same scale of diversity may match the
phylogenetic pattern. Concordance probably depends on the percentage
of amino acid substitutions explained by antibody pressure.
The seventh section considers explanations for the discordant pat-
terns of phylogeny and antigenicity reported for HIV. Shared antigenicity
over long phylogenetic distances may arise by stabilizing or convergent
selection. Stabilizing selection prevents change in particular amino ac-
ids because of their essential contribution to viral fitness. Convergent
selection causes recurrent evolution of the same antigenic type by re-
peatedly favoring that type in different times and places. Alternatively,
divergent antigenicity over short phylogenetic distances can arise from
intense immune pressure. Stabilizing, convergent, and diversifying se-
lection can all occur over different temporal scales, combining to shape
the relations between antigenicity and phylogeny.
The final section lists problems for future research.
11.1 Immunological Measures of Antigenicity
Immunological methods measure the reactions of antigens with anti-
bodies or T cells. A particular test can be described by a matrix. One
dimension consists of standardized immunological components such
as different antibodies; the second dimension lists alternative parasite
isolates or molecules to be tested for their antigenic properties. Each

ANTIGENICITY AND PHYLOGENY 177
matrix entry contains the strength of the immunological response—a
measure of antigenicity.
Immunology differentiates antigens only to the extent that the test
antigens react differently with the panel of immunological agents. Thus,
the measures depend on the immunological panel used for discrimina-
tion. This reiterates a key point of chapter 4, that specificity and diver-
sity describe interactions between the host and parasite. The antigenic
diversity of a parasite has meaning only in the context of the specificity
of host recognition.
Different kinds of immunological panels have been used. Monoclonal
antibodies (MAbs) provide a high titer of identical antibodies. Each clone
responds to variation in a small region of a parasite molecule. Different
clones produce antibodies with different specificities. A panel of MAbs
provides a highly specific and repeatable set of determinants.
Polyclonal antibody serum contains the diverse antibody specificities
raised by a host against a particular challenge. The host may be chal-
lenged with a peptide, with a whole molecule, or with an entire parasite.
Polyclonal sera from different hosts form a panel that can be used to
test novel antigens. The response of each polyclonal serum aggregates
reactions against many antigenic epitopes. Thus, polyclonal measures
tend to be broader measures of total differences between antigens when
compared with monoclonal measures, but it is harder to know exactly
what differences the polyclonal technique measures.
T cell immunity has generally not been used to form an immune panel
for discrimination of antigenic diversity. T cell recognition depends on
the processing of peptides, their binding to MHC molecules, and the
affinity of T cell receptors for peptide-MHC complexes. Until recently, it
has been difficult to control these steps in a repeatable and measurable
way. A new method, tetramer binding (Altman et al. 1996; Doherty and
Christensen 2000), may allow some progress in this area. This method
first creates peptide-MHC complexes, then measures the percentage of
a host’s T cells that bind those peptide-MHC complexes. A test of par-
asite variability could take the following form: challenge a host with a
particular parasite type, then compare the host’s T cell response against
peptide-MHC complexes with peptides derived from different antigenic
variants.
Immunological tests can be conducted with intact parasites, whole
molecules, or molecular fragments such as peptides. Each choice has
178 CHAPTER 11
its benefits and limitations. Peptides provide small, controllable, and
easily studied variants. However, antibodies normally respond to ex-
posed, three-dimensional conformations rather than naked, sometimes
linearized peptides. Whole molecules maintain three-dimensional struc-
ture and provide a broader aggregate measure of variation over the en-
tire molecule. The shape of the molecule may, however, be altered when
combined into a whole parasite, and many parts of the surface of the
naked molecule may be inaccessible when in the intact parasite. Whole
parasites provide the most realistic aggregate measure of differentia-
tion. Assays may be technically difficult with the whole parasite, and re-
sults from such assays do not focus on specific variant epitopes (Nyambi
et al. 2000a).
A completed immunological test fills the matrix of reaction strengths
for each immunological agent and parasite isolate. The matrix can be
used to classify the parasite isolates into related groups according to the
degree of similarity in their immunological reactivity. The classification
provides a basis to type new isolates according to immunological prop-
erties. The matrix may also be used to identify the major determinants
of antigenic differences, which can be helpful in the design of vaccines
against antigenically variable parasites.
11.2 Phylogeny
The amount of change between two antigens relative to a common
ancestor provides another way to classify antigenic variants. One typic-
ally reconstructs the phylogenetic relationships of evolutionary descent
by analyzing the patterns of change in the nucleotide or amino acid
sequences that encode antigenic molecules (Page and Holmes 1998; Ro-
drigo and Learn 2000).
Allelic variants of a gene can usually be arranged into a phylogenetic
pattern of evolutionary descent—a gene tree. That phylogeny by itself
simply describes the lineal history of antigenic variants without regard
to the processes that shaped the pattern of descent. The phylogenetic
history provides a necessary context for interpreting evolutionary pro-
cess (Hughes 1999).

ANTIGENICITY AND PHYLOGENY 179
P1
P3
P2
P4
Figure 11.1 Hypothetical relationship of four parasite isolates based on im-munological reactions. The clustering shows that the pair P1 and P3 reacts in asimilar way to immunological agents, the pair P2 and P4 reacts in a similar way,and the two pairs differ in their patterns of reactivity.
11.3 Hypothetical Relationsbetween Immunology and Phylogeny
Suppose that we have constructed an immunological classification of
four parasite isolates, P1, P2, P3, and P4. The four parasites group into
two clusters, shown in figure 11.1.
Figure 11.2 shows a phylogenetic classification with the same group-
ings as the immunological pattern in figure 11.1. If a phylogenetic anal-
ysis provides the same classification, then immunological distance in-
creases with phylogenetic distance. The parasites may, for example, ac-
cumulate genetic differences randomly throughout their genomes. Par-
asites that diverged from a more distant common ancestor have more
genetic differences both inside and outside the tested antigenic regions,
with no concentration of differences in the antigenic sites. Alternatively,
natural selection on the antigenic sites may be driving apart the clusters.
Then both antigenic and nonantigenic sites provide the same phyloge-
netic pattern, clustering P1/P3 versus P2/P4, but the differences between
the clusters would likely be concentrated disproportionately in the anti-
genic sites.
A correspondence generally occurs between phylogenetic distance
and the differences measured on particular characters, reflecting the
natural tendency for similarity by common descent. Sometimes a par-
ticular force disrupts this natural concordance.
Figure 11.3 shows a discordant pattern between phylogenetic and im-
munological distance. In this case, broad similarity over the nucleotide
or amino acid sequence phylogenetically groups P1 with P2 and P3 with
P4. The immunological test, which focuses on only a narrow subset

180 CHAPTER 11
P1 P3 P2 P4
Figure 11.2 Hypothetical phylogenetic relationship of four parasite isolatesbased on nucleotide or amino acid sequences. The same clustering occurs asin fig. 11.1. The white lineages have the antigenic properties of the P1/P3 im-munological grouping, and the black lineages have the antigenic properties ofthe P2/P4 immunological grouping shown in fig. 11.1.
P1 P2 P3 P4
Figure 11.3 Alternative phylogenetic pattern that clusters P1 with P2 and P3with P4. The white lineages share the P1/P3 immunological grouping and theblack lineages share the P2/P4 immunological grouping shown in fig. 11.1. Thegray lineages show that the immunological type for the ancestors of each phy-logenetic group cannot be resolved.
of the total sequence, highlights antigenic divergence within closely re-
lated phylogenetic pairs. The pattern shows recurrent evolution of an
antigenic type.
Many processes can generate the discordant pattern of figure 11.3.
Suppose, for example, that only two variants can occur at a particular
epitope because of conformational constraints on the function of the
parasite molecule. If an epidemic begins with a parasite in state one,
then host immunity will eventually favor the spread of state two. Con-
versely, an initial epidemic beginning with state two leads eventually to
replacement by state one. Pairs of closely related lineages will often be
of opposite state.
ANTIGENICITY AND PHYLOGENY 181
Functional hypotheses can often be tested by comparison of the pre-
dicted and observed phylogenetic patterns. For example, the functional
constraint that an epitope can exist only in two alternative, antigeni-
cally distinct states predicts a discordant pattern between phylogenetic
and immunological classifications. Alternatively, an observed discor-
dance between phylogenetic and immunological classifications may lead
to a functional or process-oriented hypothesis. That hypothesis can be
tested by using other methods to infer function or process—for exam-
ple, whether an observed epitope is indeed constrained to two alterna-
tive states by structural and functional attributes.
11.4 Immunology Matches Phylogenyover Long Genetic Distances
The flaviviruses illustrate broad correspondence between immunolog-
ical and phylogenetic distances. This group includes well-known patho-
gens such as yellow fever, dengue fever, and West Nile virus. Kuno
et al. (1998) built a phylogeny from the nucleotide sequences of seventy-
two viral strains. These viruses span a diverse group, with nucleotide
sequence identities of 69% or higher within the fourteen phylogenetic
clades and lower percentages of identities between clades.
The flavivirus clades identified by molecular phylogeny correspond
closely to the antigenic classification by Calisher et al. (1989) based on re-
actions to polyclonal antisera, although the two methods do disagree on
the classification of a few strains. Two factors probably contribute to the
close match between antigenic classification and molecular phylogeny.
First, distinct clades have fairly large nucleotide sequence differences.
Thus, both phylogenetic and antigenic groupings measure broad-scale
divergence. Second, the antigenic analysis used polyclonal antisera, so
that each test agent averaged broadly over many antigenic sites.
11.5 Immunology-Phylogeny Mismatchwith Radiations into New Hosts
Influenza A isolates show a mixture of concordant and discordant
relations between antigenic distance and phylogeny. Figure 11.4 illus-
trates the phylogenetic pattern for eleven isolates and an immunological
matrix of reactivities to monoclonal antibodies (Brown et al. 1997). The
phylogenetic analysis separated three clusters: classical swine types on
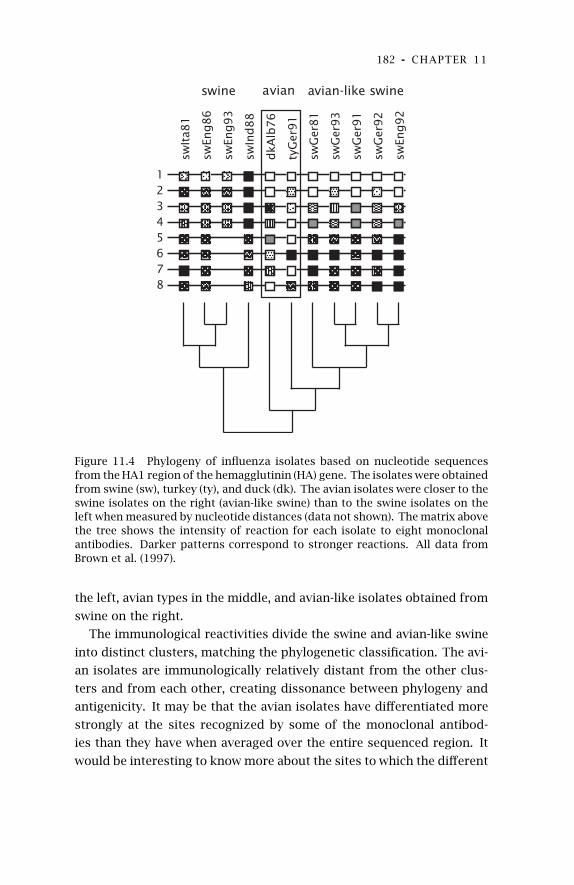
182 CHAPTER 11
swIt
a81
swEn
g8
6
swEn
g9
3
swIn
d8
8
dkA
lb7
6
tyG
er9
1
swG
er81
swG
er93
swG
er91
swG
er92
swEn
g9
2
12345678
avianswine avian-like swine
Figure 11.4 Phylogeny of influenza isolates based on nucleotide sequencesfrom the HA1 region of the hemagglutinin (HA) gene. The isolates were obtainedfrom swine (sw), turkey (ty), and duck (dk). The avian isolates were closer to theswine isolates on the right (avian-like swine) than to the swine isolates on theleft when measured by nucleotide distances (data not shown). The matrix abovethe tree shows the intensity of reaction for each isolate to eight monoclonalantibodies. Darker patterns correspond to stronger reactions. All data fromBrown et al. (1997).
the left, avian types in the middle, and avian-like isolates obtained from
swine on the right.
The immunological reactivities divide the swine and avian-like swine
into distinct clusters, matching the phylogenetic classification. The avi-
an isolates are immunologically relatively distant from the other clus-
ters and from each other, creating dissonance between phylogeny and
antigenicity. It may be that the avian isolates have differentiated more
strongly at the sites recognized by some of the monoclonal antibod-
ies than they have when averaged over the entire sequenced region. It
would be interesting to know more about the sites to which the different
ANTIGENICITY AND PHYLOGENY 183
monoclonal antibodies bind. Perhaps some of those sites are influenced
by selective pressures for attachment to host cells or for avoidance of
host defense that differ between birds and pigs.
11.6 Short-Term Phylogenetic DiversificationDriven by Immunological Selection
Influenza A variants with substitutions in the hemagglutinin molecule
rise to high frequency in epidemics, causing a selective sweep through
the influenza population. Isolates obtained in a particular year tend
to trace their ancestry back to a common progenitor lineage just a few
years into the past (Bush et al. 1999). Thus, the temporal sequence of the
population is dominated by lineal replacements rather than bifurcating
divergence.
Host antibodies mainly attack hemagglutinin. Immune selective pres-
sure on hemagglutinin appears to drive the lineal replacements—put
another way, immunological pressure drives change in the population-
wide pattern of phylogenetic descent. Thus, the phylogenetic pattern
of change may match the immunological pattern of change. Concor-
dance probably depends on the percentage of amino acid substitutions
explained by antibody pressure and the degree to which the antibody
panel used for classification measures aggregate divergence.
11.7 Discordant Patterns of Phylogeny andAntigenicity Created by Within-Host Immune Pressure
Nucleotide sequences of the HIV-1 envelope divide this virus into
eleven lineages within the M (major) group, into an O (outlier) group, and
into an N (new) group (Robertson et al. 1999; http://hiv-web.lanl.gov/).
The phylogenetic distance between isolates does not predict well the
strength of shared immunological response (Vogel et al. 1994; Nyambi
et al. 1996, 2000b; Weber et al. 1996; Zolla-Pazner et al. 1999).
Vaccines must stimulate an immune response against most viral ge-
notypes in order to provide sufficient protection. A candidate vaccine
might, for example, include isolates from each of the common phyloge-
netic lineages. This provides good coverage of diverse pathogens when
antigenicity corresponds to phylogeny. However, phylogeny does not
predict antigenicity for HIV. In order to choose HIV variants for a vac-

184 CHAPTER 11
cine, one needs to divide viral diversity into antigenic types that together
cover most of the antigenic range.
A few studies have developed antigenic classifications for HIV-1 (Vo-
gel et al. 1994; Nyambi et al. 1996; Zolla-Pazner et al. 1999). Nyambi
et al. (2000b) analyzed binding by twenty-eight monoclonal antibodies
to twenty-six intact viral particles. The viral genotypes were sampled
among eight different clades of the M group.
Nyambi et al. (2000b) grouped viral isolates according to their sim-
ilarity in binding to the antibodies. Such grouping defines antigenic
similarities of epitopes between the viral samples. The twenty-six viral
isolates formed three immunological clusters. The immunotypes did
not correspond to phylogenetic lineages (genotypes), geographic origin,
or tropism for different host-cell receptors (CXCR4 versus CCR5). Thus,
diverse genotypes share common epitopes, and similar genotypes can
be differentiated by antibody binding, causing a mismatch between phy-
logeny and antigenicity. Nyambi et al. (2000a) emphasized that many
antibodies that bind do not neutralize. Further studies must determine
if the observed antibody binding can influence viral fitness in vivo.
Joint studies of phylogeny and antigenicity in HIV call attention to
stabilizing, convergent, and diversifying natural selection.
First, shared antigenicity over long phylogenetic distances may be
caused by stabilizing selection. Under stabilizing selection, a mutation
that changes an epitope has opposing effects. The mutation allows es-
cape from immune recognition but also reduces some functional as-
pect of the epitope. External viral epitopes sometimes affect binding
or entry to host cells. Strong stabilizing selection of epitopes leads to
conservation of amino acid composition over all phylogenetic scales of
divergence.
In some cases, stabilizing selection may allow certain amino acid re-
placements that preserve geometric structure and charge. For example,
Nyambi et al. (2000a) argue that parts of the genetically variable V3 loop
of the HIV envelope have highly conserved structure and antigenicity.
Binding affinity to monoclonal antibodies may be a better measure of
antigenic conservation than amino acid sequence.
Second, shared antigenicity over long phylogenetic distances may be
caused by convergent selection. Suppose a small set of alternative struc-
tures for a parasite epitope retain similar function. This functional set
constrains the range of acceptable escape mutants. Immune pressure
ANTIGENICITY AND PHYLOGENY 185
favors change of epitopes within the acceptable set, eventually return-
ing to the original epitope. Phylogenetic pattern will reveal short-term
changes and occasional long-term similarity. T cell pressure based on
MHC binding may be particularly likely to create such patterns. A para-
site that can escape from a particular host’s MHC array will be favored.
The next host will likely have a different MHC pattern, perhaps favor-
ing a return to the epitopes lost in the previous host. Testing for this
pattern requires detailed data over different temporal scales.
Nyambi et al. (2000b) found that the tip of the V3 loop was conserved
antigenically between genotypes, whereas other parts of the V3 loop sep-
arated isolates into different antigenic groups. The genetic variants of
the V3 loop may fall into relatively few conformational, antigenic types.
The range of types may be constrained by stabilizing selection, caus-
ing short-term phylogenetic fluctuations between types but occasional
convergence to past types within phylogenetic lines of descent.
Third, distinct antigenicity between phylogenetically close isolates
implies very rapid diversifying selection. Escape mutants within hosts
follow this pattern. For example, Nyambi et al. (1997) studied the tem-
poral pattern of escape mutants and antibody profiles over the course
of a single infection of a chimpanzee by simian immunodeficiency virus
(SIV), a near relative of HIV. They analyzed eleven consecutive serum
(antibody) samples and eight SIV isolates taken at about four-month in-
tervals over a total of forty-one months. They tested the eighty-eight
pairwise reactions between serum antibodies and viral isolates. The
data showed viral escape mutants emerging at intervals of about fifteen
months, each escape followed approximately eight months later by new
antibody responses that matched the escape variants. Several studies of
HIV escape mutants have been published (see references in Beaumont
et al. 2001).
Combinations of diversifying, stabilizing, and convergent selection
may determine the relationship between HIV phylogeny and antigenic-
ity (Holmes et al. 1992). Diversifying selection within hosts favors es-
cape variants that avoid antibodies or T cells. Diversifying selection
between hosts favors mutants that avoid MHC recognition or immuno-
logical memory. Stabilizing selection constrains the range of variants.
Convergent selection causes recurrence of previous antigenic types in
response to diversifying selection and the stabilizing constraints that
limit the range of alternative forms. Together, these factors group HIV

186 CHAPTER 11
isolates into a limited number of immunological types. The immunolog-
ical classification does not match the phylogenetic classification.
Holmes et al. (1992) observed both diversifying and convergent selec-
tion within a single host infected by HIV. They sequenced the V3 loop
of the viral envelope from eighty-nine isolates collected over a seven-
year period. The isolates evolved over time through a series of replace-
ments, with different sequences dominating in frequency at different
times. Two divergent lineages formed about three years after infection.
Most subsequent isolates mapped to one of these two major lineages.
The same sequence of 6 amino acids at the tip of the V3 loop evolved
convergently in the two lineages.
In summary, phylogeny provides the historical context in which to
interpret immunological patterns. Hypotheses about natural selection
can be tested by mapping the sequence of immunological changes onto
the lineal history of descent.
11.8 Problems for Future Research
1. Adaptation to different hosts. Relations between antigenicity and
phylogeny suggest hypotheses about how natural selection shapes anti-
genic variation. Consider, for example, the data for influenza A in pigs
and birds (fig. 11.4). Antigenicity groups isolates according to current
host species, whereas phylogeny groups isolates according to the his-
tory of transfers between species.
Adaptation to different hosts may shape antigenicity. This could oc-
cur by adaptation of viral surfaces to host receptors associated with at-
tachment. Or the nature of immune pressure might differ significantly
between birds and pigs. Such hypotheses, suggested by statistical pat-
terns of association between phylogeny and antigenicity, must be tested
by molecular studies.
2. Optimal sampling for evolutionary inference. Most antigenic and
phylogenetic data were collected for reasons other than analyzing rela-
tions between antigenic and phylogenetic classifications. Little thought
has been given to the sampling schemes that maximize information
about evolutionary process. Ideal studies require analysis of the inter-
actions between evolutionary process, methods of measurement, and
statistical inference.

ANTIGENICITY AND PHYLOGENY 187
Different sampling schemes may be needed to study different kinds
of natural selection. For example, stabilizing selection impedes change.
To detect relatively slow antigenic change, one should probably sam-
ple over relatively long phylogenetic distances. The average divergence
of genomes over long distances sets a standard against which one can
detect reduced antigenic change at sites constrained by stabilizing se-
lection.
By contrast, diversifying selection accelerates change by favoring anti-
genic types that differ from the currently prevalent forms. To detect rel-
atively rapid change, one should probably sample over relatively short
phylogenetic distances. This sets a low level of background change
against which rapid, diversifying change can be detected.
3. Antigenic selection may shape phylogeny. The degree of match or
discord between antigenic and phylogenetic classifications may depend
on the demographic consequences of selection. If selection on a few
closely linked epitopes determines the success or failure of a parasite
lineage, then phylogeny may follow antigenicity. By contrast, selection
may strongly influence patterns of antigenic change without absolutely
determining success or failure of lineages. In this case, antigenicity does
not constrain phylogeny.
Mathematical models would clarify the various relations that may
arise between antigenic and phylogenetic classifications. Those rela-
tions depend on the time scales of differentiation, the epitopes used for
antigenic classification, and the antibodies used to discriminate between
variant epitopes.

12 Experimental Evolution:Foot-and-MouthDisease Virus
Experimental evolution manipulates the environment of a population
and observes the resulting pattern of evolutionary change. This allows
one to study the selective forces that shape antigenic diversity. For ex-
ample, one could manipulate immune selection by exposing parasites to
different regimes of monoclonal antibodies. The parasites’ evolutionary
response reveals the adaptive potential and the constraints that shape
patterns of antigenic variation.
In this chapter, I describe experimental evolution studies of foot-and-
mouth disease virus (FMDV). I also use this virus as a case study to show
how different methods combine to provide a deeper understanding of
antigenic variation. These approaches include structural analysis of the
virion, functional analysis of epitopes with regard to binding cellular re-
ceptors, sequence analysis of natural isolates, and experimental analysis
of evolving populations.
The first section introduces the antigenicity and structure of FMDV.
Structural studies provide the three-dimensional location of amino ac-
ids. This allows one to analyze how particular amino acid substitutions
affect shape, charge, and interaction with antibodies. Structural infor-
mation also aids functional analysis of substitutions with regard to bind-
ing cellular receptors or affecting other components of viral fitness.
The second section describes antibody escape mutants of FMDV. Most
of these escape mutants were generated by application of monoclonal
antibodies in controlled experimental studies. Several laboratory escape
mutants occur in an exposed loop on the surface of the virion, which is
also the site of a key antigenic region identified by sequencing natural
isolates. This antigenic loop mediates binding to cellular receptors, an
essential step for viral entry into host cells. The pattern of antibody
escape mutants identifies varying and unvarying amino acid sites. The
unvarying sites play an essential role in binding to host cells.
The third section continues discussion of binding to host cells and tro-
pism for different host receptors. Experimental evolution studies show
that in cell culture FMDV can evolve to use alternate cellular receptors.
EXPERIMENTAL EVOLUTION: FMDV 189
This switch in receptor tropism relieves the constraint on the previously
unvarying amino acid sites in the key antigenic region. Consequently,
escape mutants in that conserved region arise readily, demonstrating
that the conserved sites play an important role in recognition by anti-
bodies. This highlights the dual selective pressures by antibodies and
receptor binding that may shape key antigenic sites.
The fourth section describes an experimental approach to analyze
the fitness consequences of amino acid substitutions. Molecular stud-
ies can measure changes in binding affinity for antibodies and cellular
receptors associated with changes in amino acid shape and charge. But
substitutions ultimately spread or fail based on their consequences for
the dynamics of growth and transmission. These aspects of fitness can
be difficult to measure. I describe one study in which pigs were injected
with a wild-type virus and various antibody escape mutants. The rela-
tive success of parental and mutant viruses provides clues about how
particular amino acid substitutions may influence evolutionary dynam-
ics.
The final section lists problems for future research.
General discussions and examples of experimental evolution can be
found in Rose (1991), Bennett and Lenski (1999), Landweber (1999), Crill
et al. (2000), and Stearns et al. (2000).
12.1 Overview of Antigenicity and Structure
FMDV is an RNA virus that frequently causes disease in domesticated
cattle, swine, sheep, and goats (Sobrino et al. 2001). FMDV belongs to
the Picornaviridae family of viruses, which includes poliovirus, human
hepatitis A virus, and the human rhinoviruses (Racaniello 2001). FMDV
populations maintain antigenic diversity in several rapidly evolving epi-
topes (Mateu et al. 1988; Feigelstock et al. 1996).
Seven major serotypes occur across the world (Sobrino et al. 2001).
Phylogenetic distance between serotypes correlates reasonably well with
antigenic distance measured by cross-reactivity to polyclonal antisera—
in other words, phylogeny roughly matches serology at a broad scale of
sequence divergence (Mateu 1995). By contrast, small-scale phylogenetic
divergence does not correspond to patterns of antigenicity. One or a few
amino acid substitutions within a serotype can greatly alter antibody
recognition (Mateu et al. 1994).
190 CHAPTER 12
BC
HI
DE
FG
CH
E
F
BIDG
EF
GH
CD
HOOC
NH2
Figure 12.1 Schematic diagram of the foot-and-mouth disease virus surfaceproteins. Each of the three main surface proteins, VP1, VP2, and VP3, fills atrapezoidal space with eight β chains (arrows) labeled B-I and two α chains(cylinders). The loops connecting the β chains tend to be exposed on the proteinsurface, sometimes protruding from the protein core. The two-letter codesfor the loops name the connected β chains. The carboxyl (HOOC) and amino(NH2) termini may also occur at the surface. Antibodies apparently interactmainly with the loops and termini. The three proteins differ in the location andexposure of various loops, as indicated in fig. 12.2. Redrawn from Haydon andWoolhouse (1998) based on original work in Harrison (1989, with permissionfrom Nature, www.nature.com).
Figure 12.1 illustrates the structure of the surface proteins of FMDV.
Figure 12.2 shows how the three types of surface proteins combine to
form the FMDV capsid. The most widely immunodominant epitopes
occur on the GH loop of the VP1 surface protein (see fig. 12.3; Mateu et al.
1994; Mateu 1995; Sobrino et al. 2001). This loop has about 20 amino
acids that contribute to several overlapping epitopes. These antibody
binding sites appear to be determined mostly by the amino acids in the
GH peptide (a continuous epitope). Antibodies that bind to an isolated
GH peptide also neutralize intact viruses.
Many antibody escape variants occur in the GH loop, leading to ex-
tensive genetic variation in this region. However, a conserved amino
acid triplet, Arg-Gly-Asp (RGD), also binds to antibodies. This conserved
EXPERIMENTAL EVOLUTION: FMDV 191
1
23
1
1
1
2
2
2
3
3
3
COOH
COOH
COOH
GH
GH
GH
CD
CD
CD
EF
EF
EFBC
BC
BCHI
HI
HI
DE
Fab
BB
2
13
1 1 2
3
2
2
Figure 12.2 Structure of the foot-and-mouth disease virus. There are threesurface proteins, VP1, VP2, and VP3, labeled 1–3, respectively. Each proteinpresents an approximately trapezoidal shape on the surface. The three differ-ent proteins group into a structural unit as shown in the lower left. On thecapsid, the boldly lined pentagon contains five structural units arrayed in five-fold rotational symmetry about the pentagonal center. Each pentagonal vertexdefines the intersection of six structural units aligned in threefold rotationalsymmetry. The wiggly lines labeled on one unit of the capsid show the locationof structural loops that occur on the capsid surface (see fig. 12.3). Those loopsare candidates for antibody binding. The black circle at the lower right showsthe approximate relative size of an antibody-binding region (Fab), illustratingthe potential coverage of capsid protein loops that may be involved in immunerecognition. Redrawn from Mateu (1995, with permission from Elsevier Sci-ence) based on original work in Harrison (1989, with permission from Nature,www.nature.com).
1
2
3
COOH
COOH
COOH
GH
GH
GH
CD
CD
CD
EF
EF
EFBC
BC
BCHI
HI
HI
DE
BB
Figure 12.3 An enlarged view of the β loops and carboxyl termini shown infig. 12.2.
192 CHAPTER 12
triplet mediates binding to integrin host-cell receptors typically used in
FMDV attachment and entry (Berinstein et al. 1995; Neff et al. 1998; So-
brino et al. 2001).
The GH loop of VP1 contains continuous epitopes that together define
the hypervariable antigenic site A common to all serotypes. Discontin-
uous epitopes occur when amino acid residues from widely separated
sequence locations come together conformationally to form a binding
surface for antibodies. Two antigenic sites of serotypes A, O, and C have
discontinuous epitopes that have received widespread attention (Mateu
et al. 1994; Feigelstock et al. 1996).
The first discontinuous site occurs near the capsid’s threefold axes of
symmetry at the vertices of the pentagonal structural units (fig. 12.2).
This site includes the BC loop of VP2 and the BB knob of VP3 in serotypes
A, C, and O (fig. 12.3). In serotype C, the carboxyl terminus of VP1
also contributes to this site, and in serotype O, the EF loop of VP2 is
sometimes involved. This region (antigenic site D) forms the second
major immunodominant region of serotype C after antigenic site A in
the GH loop of VP1 (Feigelstock et al. 1996).
A second discontinuous epitope occurs in serotype O. The GH loop
and the carboxy-terminal (COOH) end of VP1 jointly form the bind-
ing region for some antibodies. However, in serotype C, the GH loop
and the carboxy-terminal end of VP1 form independent, continuous
epitopes. The high specificity of antibodies means that the sequence
and conformational differences between serotypes change the detailed
antigenic properties of particular regions. Studies focused on natu-
ral selection of particular amino acid residues must account for back-
ground differences of sequence and conformation among test strains.
12.2 Antibody Escape Mutants
Many antibody escape mutants have been sequenced (references in
Martínez et al. 1997). One can develop a map of natural escape variants
by comparing changes in sequence with differences in binding affinity
to a panel of MAbs.
Two problems of interpreting selective pressures arise from an escape
map based on natural variants. First, field isolates do not control the
multitude of evolutionary pressures on variation. Mutants may spread

EXPERIMENTAL EVOLUTION: FMDV 193
either in direct response to antibody pressure, in response to other se-
lective pressures, or by stochastic fluctuations independent of selective
forces. Lack of variability may result either from lack of antibody pres-
sure or from constraining selective pressures such as binding to host
receptors.
The second problem for interpreting selective pressures from natu-
ral isolates concerns lack of control over genetic background. Whether
a particular amino acid site affects antibody affinity may depend on
conformation-changing variants at other sites.
Site-directed mutagenesis controls amino acid replacements in a fixed
genetic background. One can alter sites that do not vary naturally to test
for effects on antibody binding. Site-directed mutagenesis has provided
useful information for FMDV (Mateu et al. 1998). But this method can
only define changes in antibody binding; it does not show how viral
populations actually respond to immune pressure.
Several studies have applied monoclonal or polyclonal antibodies to
FMDV in laboratory culture (Mateu 1995; Sobrino et al. 2001). This al-
lows direct control of selective pressure by comparing lines with and
without exposure to antibodies. In addition, cultures can be started
with genetically monomorphic viruses to control genetic background.
Martínez et al. (1997) began laboratory evolution studies from a sin-
gle viral clone of serotype C. These viruses were grown on baby hamster
kidney cells (BHK-21). All host cells were derived from a single precur-
sor cell. Two separate viral lines were established. C-S8c1 developed
through three successive plaque isolations. C-S8c1p100 began with C-
S8c1 and developed through one hundred serial passages on a mono-
layer of BHK-21 cells. The host cells were refreshed from independent
stock in each passage and therefore did not coevolve with the virus over
the passage history.
In natural isolates, extensive sequence variability in the GH loop of
VP1 correlates with escape from antibody neutralization. However, the
Arg-Gly-Asp (RGD) sequence near the center of this GH loop is invariant
in field isolates (Sobrino et al. 2001). Controlled studies of laboratory
evolution provide some insight into the evolution of this region.
The monoclonal antibody SD6 binds to an epitope spanning residues
136–147 in the GH loop of VP1. Martínez et al. (1997) applied selective
pressure by SD6 after establishment of the separate viral lines C-S8c1
and C-S8c1p100 by growing a cloned (genetically monomorphic) isolate

194 CHAPTER 12
Table 12.1 Escape mutants of FMDV (from Martínez et al. 1997)
Amino acid Mutants of Mutants ofsubstitution C-S8c1 C-S8c1p100
Ala-138 → Pro 1 0Ala-138 → Asp 3 1Ser-139 → Arg 20 0Ser-139 → Gly 2 0Ser-139 → Asn 8 2Ser-139 → Ile 17 8Gly-142 → Glu 0 4Asp-143 → Gly 0 1Leu-144 → Val 0 5Leu-144 → Ser 0 8Ala-145 → Val 0 2His-146 → Arg 31 0
in the presence of the antibody and sampling escape mutants. Nucleo-
tide sequences of escape mutants were obtained. Each mutant (except
one) escaped antibody neutralization by a single amino acid change.
Table 12.1 lists the changed amino acids in the escape mutants, ex-
cluding the one double mutant. The different locations of these muta-
tions in the original (C-S8c1) line compared with the serially passaged
(C-S8c1p100) line provide the most striking result of this study. The
original line conserved the Arg-Gly-Asp (RGD) motif at positions 141–
143. By contrast, the serially passaged line had numerous mutations
within the RGD motif. Figure 12.4 contrasts the location of mutants for
the two lines.
Variants in the RGD motif had not previously been observed in spite
of neutralizing antibodies’ affinity for this region. The RGD motif was
thought to be invariant because of its essential role in binding to the host
cell. Yet the serially passaged line accumulated variants in this region.
Those variants replicated with the same kinetics as the parental viruses
of C-S8c1p100, with no loss in fitness. Baranowski et al. (2000) showed
that lineages with an altered RGD motif use an alternative pathway of
attachment and entry to host cells.
Martínez et al. (1997) sequenced the capsid genes from the original
line, from the serially passaged line, and from an escape mutant of the
serially passaged line. The escape mutant from the serially passaged line
differed from the parental virus of this line only at a single site in the

EXPERIMENTAL EVOLUTION: FMDV 195
T T T Y T A S A R G D L A H L T T T H A R H L P
133 156
D IN
E VS
VG
PD
GNIR R
Figure 12.4 Amino acid sequence in the central region of the VP1 GH loop offoot-and-mouth disease virus. The start and stop numbers label amino acid po-sitions. The box shows the RGD motif at positions 141–143. The monoclonalantibody SD6 recognizes the continuous epitope defined by the underlined po-sitions. Black triangles show positions at which most replacement amino acidsgreatly reduce binding by SD6; in other words, a single replacement at any ofthese sites creates an escape mutant. The white triangles denote positions thatcan tolerate certain amino acid replacements without greatly affecting antibodybinding. Unmarked positions in the epitope can vary without much changein binding. The letters above the sequence summarize the escape mutants ofC-S8c1 (original line); letters below the sequence summarize escape mutantsof C-S8c1p100 (passaged line). Letters denote amino acids according to thestandard single-letter code. Table 12.1 shows the full distribution of escapemutants. Redrawn from Martínez et al. (1997, copyright National Academy ofSciences, U.S.A.).
Table 12.2 Capsid amino acids that differ between C-S8c1 and C-S8c1p100(from Martínez et al. 1997)
Secondary Amino acidstructure∗ Position substitution
VP1 βB strand 41 Lys → GluVP1 BC loop 46 Asp → GluVP1 C terminus 197 His → ArgVP3 N terminus 25 Ala → ValVP3 GH loop 173 Glu → LysVP3 C terminus 218 Gln → Lys
∗Secondary structure descriptions in Mateu et al. (1994). See figs. 12.2–12.4.
RGD region. Tolerance to replacements in the RGD region must follow
from the differences accumulated by C-S8c1p100 during serial passage.
Table 12.2 shows the 6 amino acids that differed between the original
and serially passaged lines. Apparently those substitutions changed cell
196 CHAPTER 12
tropism properties of the virus and allowed variation in the previously
invariant RGD motif.
12.3 Cell Binding and Tropism
Attachment and entry to host cells impose strong natural selection
on some regions of the viral surface. Experimental evolution provides
one approach to analyzing those selective forces, as described in the
previous section. In this section, I briefly summarize further studies
of amino acid variation in the FMDV capsid and the consequences for
attachment and entry to host cells.
Natural isolates of FMDV use cellular integrin receptors for some of
the steps in attachment and entry (Berinstein et al. 1995; Jackson, Shep-
pard, et al. 2000). Integrins are transmembrane glycoproteins composed
of two different subunits, α and β. Various integrins mediate adhesion
between cells, attachment of cells to the extracellular matrix, and signal
transduction of pathways that affect cell proliferation, morphology, mi-
gration, and apoptosis (Springer 1990; Hynes 1992; Montgomery et al.
1994).
The integrin receptors rely on an RGD amino acid sequence of ligands
in order to bind host proteins such as fibronectin, fibrinogen, and type I
collagen (Fox et al. 1989). All field isolates of FMDV have the conserved
RGD motif needed for interaction with the integrin receptors (Berinstein
et al. 1995; Jackson, Sheppard, et al. 2000).
FMDV can evolve changes in receptor usage, as shown by the exper-
imental evolution studies of Martínez et al. (1997) described above. In
their study, certain FMDV lineages mutated in the RGD motif and lost
the ability to use integrin receptors. The altered viruses had a high affin-
ity for heparan sulfate (HS) (Jackson et al. 1996; Sa-Carvalho et al. 1997),
a common carbohydrate component of surface proteoglycans found on
many types of host cells (Salmivirta et al. 1996; Fry et al. 1999; Sasisekha-
ran and Venkataraman 2000).
An affinity for HS has been reported for several viruses, including HIV-
1, human cytomegalovirus, dengue virus, Sindbis virus, vaccinia virus,
and adeno-associated virus type 2 (Schneider-Schaulies 2000). HS may
also play a role in bacterial adhesion (Rostand and Esko 1997; Hackstadt
1999). Some of these cases of increased affinity for HS may be caused by
EXPERIMENTAL EVOLUTION: FMDV 197
adaptation of the pathogens to cell culture, as occurred in FMDV, Sindbis
virus, and classical swine fever virus (Klimstra et al. 1998; Bernard et al.
2000; Hulst et al. 2000).
These various studies call attention to the complementary processes
of attachment and entry (Haywood 1994). In some cases, viruses may
first attach to host cells based on the kinetics of binding between viral
and host attachment sites. Once viruses bind to host attachment sites, a
second-phase kinetic process determines binding between viral and host
receptors that initiate viral entry into host cells. For example, FMDV in
cell culture may first bind to HS, a widespread component of the host cell
surface. The viruses, attracted near the cell surface, may then encounter
and bind to the relatively sparser host integrin receptors.
Viral kinetics may be modulated separately for preliminary attach-
ment and secondary binding to the port of entry. Structural and kinetic
studies of FMDV variants provide some clues about how modulation of
attachment and binding may occur.
FMDV type O adaptation to cell culture favors a histidine to arginine
substitution at position 56 of the surface protein VP3 (Fry et al. 1999).
This amino acid change increases the positive charge of the viral sur-
face at this site and strongly enhances binding to negatively charged
HS. Structural studies show that HS binds near the point of contact be-
tween the three surface proteins, VP1, VP2, and VP3 (figs. 12.2 and 12.3),
including contact with codon 56 of VP3 on the βB strand (fig. 12.1).
Serotype A12 does not acquire HS binding in cell culture, instead modi-
fying amino acids near the RGD sequence that presumably allow tighter
binding to integrin (Reider et al. 1994; Neff et al. 1998). Not surpris-
ingly, genetic background affects the binding consequences of amino
acid substitutions and the evolutionary changes that occur in different
strains.
HS provides a relatively low-affinity receptor at high density on the
surface of many cell types. FMDV variants with increased attraction to
HS may interact with host cells in two different ways. First, viruses may
enter host cells directly from attachment to HS without binding and
entering through a second host receptor (Neff et al. 1998; Baranowski
et al. 2000). Second, low-affinity and high-density HS may serve as an
attractant that brings viruses into proximity of high-affinity and low-
density integrins (Jackson et al. 1996; Fry et al. 1999; Baranowski et al.
2000).

198 CHAPTER 12
Various host adhesion molecules such as vitronectin and fibronectin
have affinity for both HS and integrin (Potts and Campbell 1994). HS
and integrin are sufficiently close on the host cell surface to interact
simultaneously with viral binding sites for HS and integrin (Fry et al.
1999). Studies of other pathogens have inferred a two-step process with
low-affinity receptors serving as the first site of adsorption (reviewed in
Jackson et al. 1996; Schneider-Schaulies 2000).
HS-binding variants of FMDV derived from cell culture cannot develop
virulent infections in vivo (Sa-Carvalho et al. 1997; Neff et al. 1998).
Similarly, equine encephalitis virus adapted for cell culture gained en-
hanced HS binding and subsequently produced relatively weak, rapidly
cleared infections in mice when compared with the wild type (Bernard
et al. 2000). HS-binding variants of Sindbis virus are also cleared rap-
idly from hosts (Byrnes and Griffin 2000). HS-binding variants of FMDV
with arginine at codon 56 of VP3 reverted to histidine or cysteine in ex-
perimental in vivo infections, demonstrating strong selection and rapid
evolution of reduced HS affinity (Sa-Carvalho et al. 1997).
Strong binding to HS impedes the spread of infection between host
cells. Viral particles may adhere too strongly to cells that cannot be
infected, or the rate of clearance may be raised by exposure on tissue
surfaces. Fry et al. (1999) speculated that HS-binding variation provides
different kinetics of infection and clearance in various tissues and also
quantitative modulation of virulence. Thus, pathogens may adapt within
the host to different tissues by altering HS affinity. In addition, reduced
virulence may sometimes be favored when associated with enhanced
persistence of infection, perhaps by sequestering viruses at low abun-
dance in certain tissues. Surface stickiness may therefore influence sev-
eral aspects of pathogen kinetics within the host and the consequences
of infection on host morbidity and mortality.
No evidence presently suggests that HS binding plays an important
role in natural isolates of FMDV. Rather, these analyses should be inter-
preted as a model for studying how particular amino acid substitutions
can profoundly alter kinetics and cellular tropisms. In each case, the
benefits for increased rates of entry to host cells balance against the
costs of reduced spread and faster clearance from certain host compart-
ments. Combined studies of experimental evolution in vitro and in vivo
provide a useful tool for studying how selective forces shape parasite
characters via particular amino acid substitutions.
EXPERIMENTAL EVOLUTION: FMDV 199
Comparisons of HS versus integrin binding form a contrast between
two very different types of host receptors interacting with two distinct
regions of the FMDV capsid. Recent studies have turned to more sub-
tle variations between FMDV isolates with regard to binding different
integrin receptors.
Jackson, Blakemore, et al. (2000) compared the affinity of different
viral genotypes for two integrin receptors, ανβ3 and α5β1. The stan-
dard RGD motif was required for both receptors. The following amino
acid at the RGD+1 position influenced relative affinity for the two inte-
grin types. For ανβ3, several different amino acids at RGD+1 allowed
binding, consistent with this receptor’s multifunctional role in binding
several ligands. By contrast, α5β1 has narrower specificity, favoring a
leucine at RGD+1.
Jackson, Blakemore, et al. (2000) compared two viruses that differed
only at RGD+1, the first with an arginine and the second with a leucine.
The first virus had relatively higher affinity for ανβ3 compared with
α5β1. By contrast, the second virus had relatively higher affinity for
α5β1 compared with ανβ3. For at least some antibodies that recog-
nize RGDL, loss of leucine at RGD+1 abolishes recognition (see fig. 12.4;
Martínez et al. 1997).
Thirty type O and eight type A field isolates had leucine at RGD+1.
By contrast, five SAT-2 isolates had arginine, two Asia-1 isolates had
methionine, and one Asia-1 isolate had leucine (Jackson, Blakemore, et
al. 2000). These and other data suggest that most serotypes have leucine
at RGD+1 and perhaps a higher affinity for α5β1. SAT-2 may either have
greater affinity for ανβ3 or its binding may be conditioned by amino
acid variants at other sites.
In another study, Jackson, Sheppard, et al. (2000) analyzed FMDV
binding to a different integrin, ανβ6. This integrin binds relatively few
host ligands and depends on an RGDLXXL motif with leucines at RGD+1
and RGD+4. Most FMDV isolates have leucines at those two positions.
ανβ3 does not have stringent requirements at those sites, suggesting
that ανβ6 may be an important natural receptor.
Overall, RGDLXXL binds to the widest array of integrins, at least over
those studied so far, although relative affinities for different integrins
may be modulated by substitutions at RGD+1 and perhaps other sites.
It would be interesting to sample isolates from various host tissues
that differ in the densities of the various integrin receptors and analyze
200 CHAPTER 12
whether any substitutions appear relative to isolates in other body com-
partments of the same host.
Viral success in different cell types or in different hosts may depend
on variations in nonstructural genes that do not mediate binding and
entry to host cells. For example, Núñez et al. (2001) serially passaged
FMDV in guinea pigs. FMDV does not normally cause lesions in guinea
pigs, but after serial passage, viral variants arose that caused disease.
Among the several amino acid substitutions that arose during passage,
a single change from glutamine to arginine at position 44 of gene 3A
provided virulence. The function of 3A in FMDV is not known. In po-
liovirus, a distantly related picornavirus, 3A plays a role in virus-specific
RNA synthesis.
These studies show the potential power of experimental evolution in
studying evolutionary forces, particularly when combined with analysis
of naturally occurring variation.
12.4 Fitness Consequences of Substitutions
Antibody escape mutants are typically isolated in one of two ways.
First, pathogens may be grown in vitro with antibodies. This creates
selective pressure for substitutions that escape antibody recognition.
Second, naturally occurring variants from field isolates may be tested
against a panel of antibodies. Certain sets of antibodies may bind most
isolates, allowing identification of those variants that differ at commonly
recognized epitopes.
Escape variants gain a fitness advantage by avoiding antibody recogni-
tion targeted to important epitopes. However, those pathogen epitopes
may also play a role in binding to host cells, in release from infected
cells, or in some other aspect of the pathogen’s life cycle. Functional
and structural studies of amino acid substitutions provide one method
of analysis. That approach has the advantage of directly assessing the
mechanisms by which amino acid variants affect multiple components
of parasite fitness, such as escape from antibody recognition and altered
host attachment characteristics.
Although functional and structural approaches can directly measure
binding differences caused by amino acid substitutions in different ge-
netic backgrounds, they cannot provide a good measure of all the fitness
consequences associated with changes in genotype.
EXPERIMENTAL EVOLUTION: FMDV 201
Carrillo et al. (1998) used an alternative approach to analyze the con-
sequences of amino acid substitutions. They studied the relative fit-
nesses in vivo of a parental FMDV genotype and three mutant genotypes
derived from the parental type. They measured relative fitness by com-
peting pairs of strains within live pigs.
The parental type, C-S8c1, came from a C serotype isolated from a
pig. The first monoclonal antibody–resistant mutant, MARM21, arose
in a pig infected with C-S8c1. MARM21 differs from C-S8c1 by a single
change from serine to arginine at VP1 139 (fig. 12.4), providing escape
from the monoclonal antibody SD6.
The second mutant, S-3T1, came from a blood sample of a pig one
day after experimental inoculation with C-S8c1. That isolate had a single
change from threonine to alanine at VP1 135 (fig. 12.4). Only one of fifty-
eight monoclonal antibodies differentiated between the parental type
and S-3T1, and the difference in affinity was small. This supports the
claim in figure 12.4 that position 135 is not strongly antigenic.
The third mutant, C-S15c1, derived from a field variant of type C1
isolated from a pig. This mutant type had eight amino acid differences
in VP1 compared with C-S8c1. C-S15c1 did not react with monoclonal
antibody SD6.
One of the three mutants was coinoculated with the parental type
into each experimental pig. Two replicate pigs were used for each of
the three pairs of mutant and parental types. Fever rose one day after
infection and peaked two or three days postinfection. All animals devel-
oped vesicular lesions two to four days postinfection. For each animal,
between two and seven samples were taken from lesions, and the rela-
tive proportions of the competing viruses were assayed by reactivity to
monoclonal antibodies.
The small sample sizes do not allow strong conclusions to be drawn.
Rather, the following two results hint at what might be learned from
more extensive studies of this sort. First, the parental type strongly
dominated MARM21 in all seven lesions sampled from the two experi-
mental animals, comprising between 80 and 94% of the viruses in each
lesion. The MARM21 mutation appears to confer lower fitness in vivo,
at least in the two animals tested. The lower fitness may arise because
the mutant was cleared more effectively by antibodies, bound less effi-
ciently to host cells, or had reduced performance in some other fitness
component.
202 CHAPTER 12
Second, S-3T1 abundance relative to the parental type varied strongly
between lesions. In the two lesions analyzed from one animal, the
parental type comprised 67±3.4 and 3.2±1.5% (mean ± standard devi-
ation). In the other animal, the three lesions analyzed had parental-type
percentages of 75 ± 4.1, 25 ± 2.8, and 5.9 ± 1.2. Differences in domi-
nance between lesions also occurred between C-S15c1 and the parental
type. Variations in dominance may arise from stochastic sampling of
viruses that form lesions, from differences in tissue tropism, or from
some other cause.
Further studies of this sort may provide a more refined understanding
of the multiple fitness consequences that follow from particular amino
acid changes, their interactions with the genetic background of the virus,
the role of different host genotypes, and the effect of prior exposure of
hosts to different antigenic variants.
12.5 Problems for Future Research
1. Escape versus performance. Both antibodies and cellular binding
impose strong natural selection on the GH loop of VP1. This leads to
a general question: How much does immune pressure impede natural
selection of functional performance?
Experimental evolution may provide some insight into this problem.
Consider two experimental lineages, one passaged in immunodeficient
hosts and the other passaged in immunocompetent hosts. If immune
pressure constrains functional performance by improved cellular bind-
ing, then the immunodeficient line should respond with amino acid sub-
stitutions that improve binding function.
In this context, improved binding function means increased viral fit-
ness rather than increased affinity of the virus for the host receptor.
Changes in fitness can be measured by competing the original genotype
against the genotype created by selection in immunodeficient hosts. It
would be interesting to study how amino acid substitutions affect the ki-
netics of cellular binding and reproduction and how those kinetics arise
from structural changes in shape and charge. One could also compete
these same genotypes in the immunocompetent line to study how amino
acid substitutions change response to antibodies.
2. Components of fitness. Serial passage experiments impose a com-
plex set of selective pressures on different components of pathogen fit-

EXPERIMENTAL EVOLUTION: FMDV 203
ness. For example, collecting pathogens from hosts early after infection
favors very rapid reproduction within the host, perhaps at the expense
of survival over the entire course of infection. By contrast, collecting
pathogens late after infection favors survival within the host rather than
rapid growth.
In a naive host without prior exposure to the pathogen, early sam-
pling may pick pathogens before strong antibody pressure develops.
This may favor amino acid substitutions that promote improved cellular
binding over avoidance of immune pressure. By contrast, late sampling
may favor more strongly avoidance of antibody pressure. Early and late
sampling in both immunocompetent and immunodeficient hosts would
allow comparison of amino acid substitutions under varying selective
pressures.
One could also examine evolutionary response in experiments to test
the idea that heparan sulfate binding modulates the pathogen’s sticki-
ness to different tissues and consequently the dynamics of growth and
clearance.
3. Adaptation to new hosts. The passage experiments in guinea pigs
showed that small changes in FMDV genotype allow virulent infections
to develop in novel hosts. Host adaptation forms the central problem
in the study of emerging diseases. Experimental evolution provides a
useful tool to identify the amino acid changes required to infect new
hosts, to cause virulent infections in those hosts, to transmit between
the new hosts, and to transmit back to the original host.
4. Genetic background. Pathogen genotypes that differ by many amino
acids can have significantly altered protein shape and charge. It can be
difficult to assess how those structural differences affect selection on
particular amino acid sites. Experimental evolution studies could ana-
lyze a replicated design in which initial pathogen genotypes vary. This
approach can identify how genetic background alters selective pressure
at particular sites.
Different genotypes may be chosen from natural isolates to study the
forces that shape particular variants in the field. Or special genotypes
may be constructed to test hypotheses about how structure affects the
fitness of amino acid substitutions at particular sites.
5. Experimental evolution of other pathogens. Most experimental evo-
lution studies of pathogens have been conducted on RNA viruses. These

204 CHAPTER 12
viruses often grow easily in culture, grow to large population sizes, mu-
tate frequently, and evolve quickly. RNA viruses also tend to have very
small genomes, making it easy to identify and sequence evolving genes.
Experimental evolution will become an important tool for studying
other kinds of pathogens. In section 5.5, I proposed an experiment to
study programmed antigenic switching in organisms such as Borrelia
hermsii.
The mechanistic issue concerned whether switch rates between dif-
ferent archival variants within a single genome could be modulated by
natural selection, and if so, by what changes in DNA sequence or regu-
latory control. This highlights experimental evolution’s role as a tool to
study biochemical mechanism.
The evolutionary problem concerned the extent to which switch rates
adapt to enhance bacterial fitness versus the extent to which mechanistic
properties of switching constrain rates of switching between variants.
This highlights experimental evolution’s role in studying the constraints
that govern evolutionary adaptation.
13 Experimental Evolution:Influenza
Experimental evolution of influenza has identified amino acid sites that
mediate escape from antibody attack. Experimental studies have also
located sites that influence binding to host receptors. In this chapter,
I put these experimental studies in the context of influenza structure.
I also discuss how amino acid substitutions affect the kinetics of an-
tibody binding and neutralization. These rate processes influence the
fitness consequences of amino acid variants and the course of evolu-
tionary change.
The first section provides an overview of influenza antigenicity and
structure. Detailed structural information exists for hemagglutinin, the
key viral surface glycoprotein. Structural analyses also describe hemag-
glutinin bound to its host receptor and hemagglutinin bound to antibod-
ies. These diverse structural studies set the foundation for evolutionary
analyses, allowing one to develop detailed hypotheses about the forces
acting on amino acid replacements.
The second section discusses antibody escape variants, many gen-
erated in experimental evolutionary studies with controlled antibody
pressure. Much of the exposed surface of hemagglutinin responds to
antibody pressure with escape mutants.
The third section describes experimental studies of cell binding and
receptor tropism. Ancestral lineages of influenza A in birds use an
α(2,3)-linked form of sialic acid as the host receptor. Derived lin-
eages in humans use an α(2,6) linkage. Experimental evolution studies
grew a human α(2,6)-tropic form in cell culture with horse serum that
binds and interferes with the α(2,6)-tropic linkage. A single amino acid
change of leucine to glutamine produced an α(2,3)-tropic viral recep-
tor. The favored amino acid, glutamine, matches that found in birds
at the same site. The reverse experiment began with the avian α(2,3)-tropic form and selected for human α(2,6)-tropic binding. The avian
glutamine changed to leucine, matching the amino acid found in human
isolates.
The fourth section analyzes the fitness consequences of amino acid
substitutions. Observed substitutions can raise or lower binding affinity

206 CHAPTER 13
for the host receptor. Natural selection of affinity may balance the ki-
netics of binding and the kinetics of release from the widely distributed
sialic acid receptor on host cells. A few studies report the effect of amino
acid substitutions on antibody binding affinity. Those studies also relate
antibody binding affinity to neutralization of viruses, a measure of the
reduction in viral fitness. I describe preliminary studies on the mecha-
nisms and the kinetics by which antibodies interfere with viruses. Those
details will be required to understand how amino acid substitutions alter
viral fitness.
The fifth section summarizes experimental evolution studies of other
pathogens.
The sixth section presents topics for future research.
13.1 Overview of Antigenicity and Structure
Influenza viruses occur as three phylogenetically distinct types (Lamb
and Krug 2001; Wright and Webster 2001). Influenza A and B have
eight RNA segments, and influenza C has seven segments. Influenza
C occurs primarily in humans, has relatively little antigenic variation,
and does not cause significant disease. Influenza B occurs naturally
only in humans. By contrast, influenza A infects humans, several other
mammalian species including pigs and horses, and many avian species.
Influenza A has much greater amino acid sequence variability than in-
fluenza B, although type B does vary among natural isolates.
The nearly annual human epidemics of influenza A or B cause signif-
icant morbidity and mortality (Nguyen-Van-Tam 1998). The yearly out-
breaks often spread widely through human populations. Epidemics lead
to immunological memory against common strains (Natali et al. 1981;
Wang et al. 1986; Dowdle 1999; Nakajima et al. 2000). Immunological
memory creates strong selective pressure on the viruses to change anti-
genic properties, escape immune memory responses within hosts, and
initiate new outbreaks (Wilson and Cox 1990; Cox and Bender 1995).
Widespread epidemics and the strong selective pressures of host im-
munity cause influenza A to evolve very rapidly in humans. Individual
strains often die out after a few years, replaced by antigenic variants
that temporarily escape immunological memory (Bush et al. 1999).
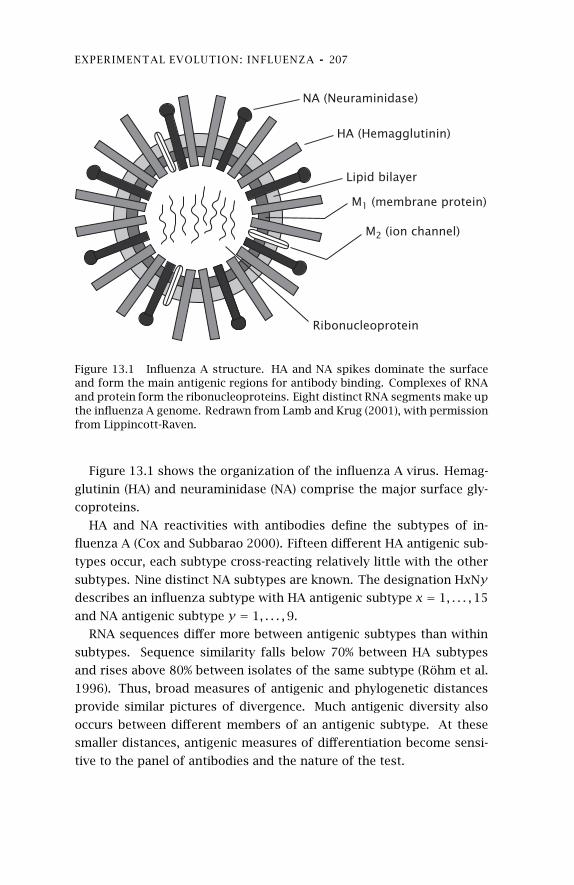
EXPERIMENTAL EVOLUTION: INFLUENZA 207
M2 (ion channel)
M1 (membrane protein)
Lipid bilayer
HA (Hemagglutinin)
NA (Neuraminidase)
Ribonucleoprotein
Figure 13.1 Influenza A structure. HA and NA spikes dominate the surfaceand form the main antigenic regions for antibody binding. Complexes of RNAand protein form the ribonucleoproteins. Eight distinct RNA segments make upthe influenza A genome. Redrawn from Lamb and Krug (2001), with permissionfrom Lippincott-Raven.
Figure 13.1 shows the organization of the influenza A virus. Hemag-
glutinin (HA) and neuraminidase (NA) comprise the major surface gly-
coproteins.
HA and NA reactivities with antibodies define the subtypes of in-
fluenza A (Cox and Subbarao 2000). Fifteen different HA antigenic sub-
types occur, each subtype cross-reacting relatively little with the other
subtypes. Nine distinct NA subtypes are known. The designation HxNydescribes an influenza subtype with HA antigenic subtype x = 1, . . . ,15
and NA antigenic subtype y = 1, . . . ,9.
RNA sequences differ more between antigenic subtypes than within
subtypes. Sequence similarity falls below 70% between HA subtypes
and rises above 80% between isolates of the same subtype (Röhm et al.
1996). Thus, broad measures of antigenic and phylogenetic distances
provide similar pictures of divergence. Much antigenic diversity also
occurs between different members of an antigenic subtype. At these
smaller distances, antigenic measures of differentiation become sensi-
tive to the panel of antibodies and the nature of the test.

208 CHAPTER 13
The HA and NA genes occur on different RNA segments. The other
six segments contain the remaining genes. A host infected with two dif-
ferent viral genotypes can produce hybrid viral progeny with reassorted
genotypes (Scholtissek 1998). For example, coinfection with HxNy and
HwNz could produce the hybrids HxNz and HwNy in addition to the
parental types.
The H3N2 subtype that caused the “Hong Kong” pandemic of 1968
arose by reassortment of the human H2N2 subtype with avian genes.
The reassorted genotype had the H3 subtype and the PB1 gene from the
bird lineage and the other six segments from the H2N2 human lineage
(Kawaoka et al. 1989; Cox and Subbarao 2000). Other reassortments
between the major human subtypes have been documented during the
past twenty-five years (Cox and Bender 1995). Reassortment between
subtypes may not occur frequently, but may be important in creating
novel genotypes that have the potential to spread widely through a host
population, causing pandemics.
All HA and NA subtypes occur in aquatic birds, suggesting that those
avian species were the original host of influenza (Webster and Bean 1998;
Cox and Subbarao 2000). Widespread human epidemics have been lim-
ited to H1N1, H2N2, and H3N2, although occasional transfers of other
subtypes occur from birds or mammals to humans. Pigs harbor H1 and
H3, whereas horses have H3 and H7. Other mammals and nonaquatic
birds occasionally become infected, but do not appear to maintain stable
lineages over time.
Influenza HA and NA molecules mediate viral attachment and entry
to host cells and release of progeny viral particles by budding through
the membrane of infected cells (Lamb and Krug 2001). Current under-
standing assigns adsorption and entry functions to HA (Steinhauer and
Wharton 1998) and release of progeny to NA (Colman 1998). However,
the HA and NA molecules may have multiple active sites and various
functions, and the different subtypes of each molecule differ signifi-
cantly (Lamb and Krug 2001). With those caveats, a brief summary of
structure and function follows.
HA binds to sialic acid on the surface of host cells. The HA mole-
cule then cleaves into two parts, the terminal HA1 and the basal HA2
fragments. Cleavage exposes on the surface of HA2 a highly conserved,
hydrophobic region that mediates fusion and entry via the host mem-
brane (Wilson and Cox 1990; Skehel and Wiley 2000).
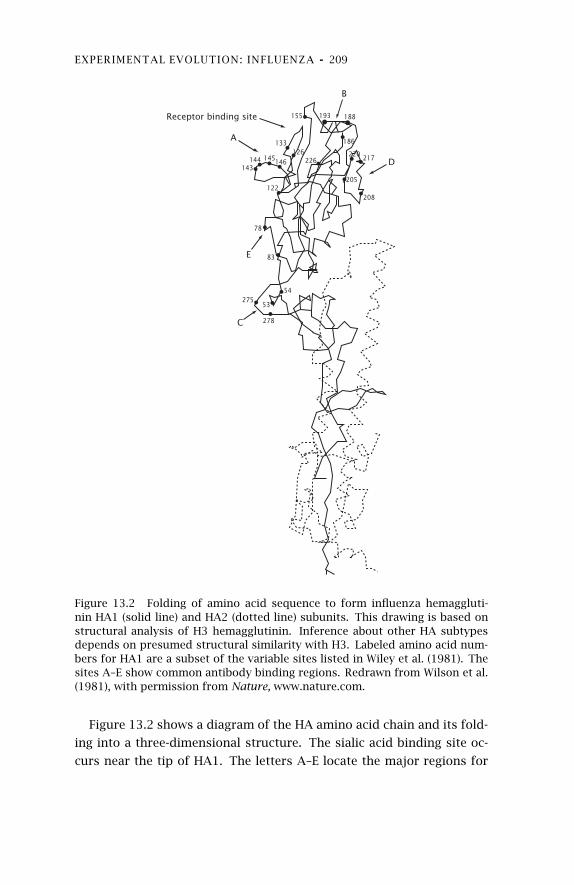
EXPERIMENTAL EVOLUTION: INFLUENZA 209
A
B
D
E
C
Receptor binding site
143144 145146
133126
122
226
155 193 188
186
217220
208
205
78
83
53
54
278
275
Figure 13.2 Folding of amino acid sequence to form influenza hemaggluti-nin HA1 (solid line) and HA2 (dotted line) subunits. This drawing is based onstructural analysis of H3 hemagglutinin. Inference about other HA subtypesdepends on presumed structural similarity with H3. Labeled amino acid num-bers for HA1 are a subset of the variable sites listed in Wiley et al. (1981). Thesites A–E show common antibody binding regions. Redrawn from Wilson et al.(1981), with permission from Nature, www.nature.com.
Figure 13.2 shows a diagram of the HA amino acid chain and its fold-
ing into a three-dimensional structure. The sialic acid binding site oc-
curs near the tip of HA1. The letters A–E locate the major regions for
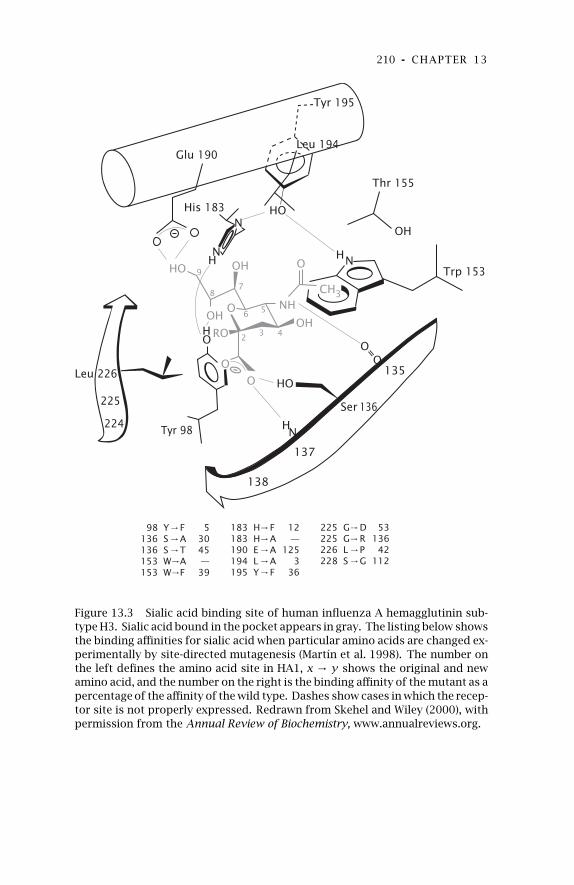
210 CHAPTER 13
138
137
Ser 136
135
Tyr 98224
225
Leu 226
His 183
Thr 155
Glu 190Leu 194
Tyr 195
HO
OH
Trp 153
HO
HN
HN
HO
HN
N
OO
=
HO OH
OHOH
NH
RO
O
O
O
O
6 5
432
78
9
CH3
98 Y → F 5136 S → A 30136 S → T 45153 W→ A —153 W→ F 39
225 G→ D 53225 G→ R 136226 L → P 42228 S → G 112
183 H → F 12183 H → A —190 E → A 125194 L → A 3195 Y → F 36
Figure 13.3 Sialic acid binding site of human influenza A hemagglutinin sub-type H3. Sialic acid bound in the pocket appears in gray. The listing below showsthe binding affinities for sialic acid when particular amino acids are changed ex-perimentally by site-directed mutagenesis (Martín et al. 1998). The number onthe left defines the amino acid site in HA1, x → y shows the original and newamino acid, and the number on the right is the binding affinity of the mutant as apercentage of the affinity of the wild type. Dashes show cases in which the recep-tor site is not properly expressed. Redrawn from Skehel and Wiley (2000), withpermission from the Annual Review of Biochemistry, www.annualreviews.org.
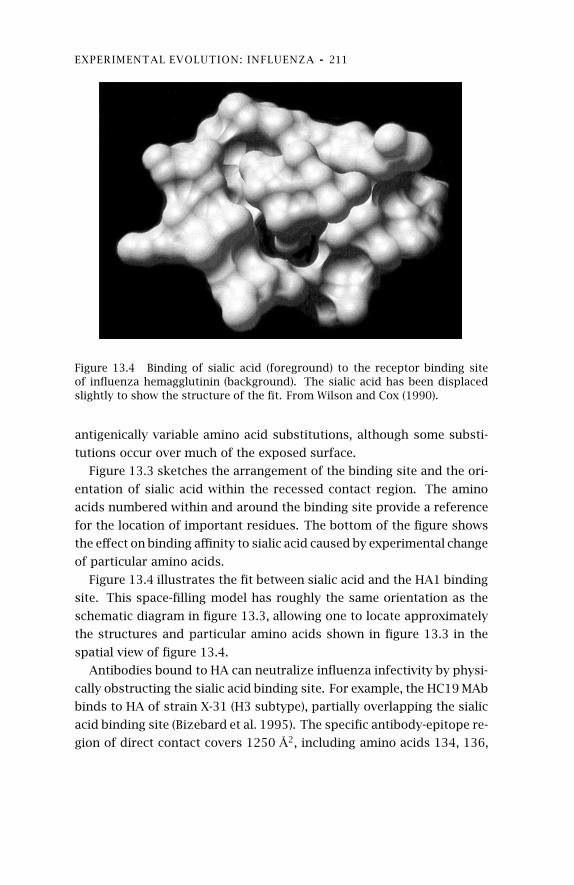
EXPERIMENTAL EVOLUTION: INFLUENZA 211
Figure 13.4 Binding of sialic acid (foreground) to the receptor binding siteof influenza hemagglutinin (background). The sialic acid has been displacedslightly to show the structure of the fit. From Wilson and Cox (1990).
antigenically variable amino acid substitutions, although some substi-
tutions occur over much of the exposed surface.
Figure 13.3 sketches the arrangement of the binding site and the ori-
entation of sialic acid within the recessed contact region. The amino
acids numbered within and around the binding site provide a reference
for the location of important residues. The bottom of the figure shows
the effect on binding affinity to sialic acid caused by experimental change
of particular amino acids.
Figure 13.4 illustrates the fit between sialic acid and the HA1 binding
site. This space-filling model has roughly the same orientation as the
schematic diagram in figure 13.3, allowing one to locate approximately
the structures and particular amino acids shown in figure 13.3 in the
spatial view of figure 13.4.
Antibodies bound to HA can neutralize influenza infectivity by physi-
cally obstructing the sialic acid binding site. For example, the HC19 MAb
binds to HA of strain X-31 (H3 subtype), partially overlapping the sialic
acid binding site (Bizebard et al. 1995). The specific antibody-epitope re-
gion of direct contact covers 1250 Å2, including amino acids 134, 136,

212 CHAPTER 13
153, 155, and 194. Figure 13.3 shows that these residues occur on three
of the four edges of the concave receptor binding depression. The de-
pression extends 315 Å2, of which the antibody binding region covers
167 Å2. Antibody escape mutants map to the ridge of amino acids that
ring the conserved amino acids in the binding pocket.
Bizebard et al. (1995) analyzed only the Fab fragments of antibod-
ies, which contain the antibody paratope that directly binds to epitopes.
Antibodies have a Y shape (fig. 2.1). Each upper arm forms an Fab frag-
ment, with the binding region on the tip of the fragment. An antibody
molecule can be cleaved to release two identical Fab fragments, each
containing a binding region.
Bizebard et al. (1995) established direct overlap of the Fab binding
region with the sialic acid binding site. However, other antibody escape
mutants map to regions of HA away from the sialic acid binding site.
Those sites are too far away to allow overlap of the direct antibody-
epitope binding region with the sialic acid binding site.
Fleury et al. (1999) studied binding and neutralization by the HC45
MAb, which binds to a site distant from the sialic acid binding site. The
Fab fragment of HC45 bound to its epitope with approximately the same
kinetics as HC19 bound to its epitope, but HC19 was an order of mag-
nitude more efficient at neutralization. Presumably this occurs because
the Fab of HC19 causes greater obstruction of binding to sialic acid than
does the more distantly bound Fab of HC45. By contrast, the full anti-
body molecules of HC19 and HC45 neutralized virus in proportion to
their binding affinity for their respective epitopes. Fleury et al. (1999)
suggest that the full antibody molecule is large enough to obstruct sialic
acid binding even though the epitope binding site is distant from the
sialic acid binding site.
Fleury et al. (1999) also noted a difference between HC19 and HC45
antibodies in their relative affinities for free HA molecules and HA mol-
ecules on the surface of viral particles. HC19 binds to the tips of HA
molecules away from the viral surface; thus HC19 faces relatively little
obstruction when binding to intact HA on viruses. By contrast, HC45
binds away from the tips of HA, toward the viral surface. This requires
HC45 to diffuse through the HA spikes, slowing the rate of HA-HC45
association and reducing the net affinity of the binding. Clearly, neu-
tralization depends on the structural environment of intact epitopes.
EXPERIMENTAL EVOLUTION: INFLUENZA 213
Other studies have noted differences between antibodies in their re-
lations between binding and neutralization (Dimmock 1993; Schofield
et al. 1997b, 1997a; Edwards and Dimmock 2000; Sanna et al. 2000).
The site of antibody attachment, the kinetics of antibody binding, and
the mechanism by which antibodies interfere with viral success all likely
play a role in determining the strength of natural selection on various re-
gions of the HA molecule. (See section 13.4 below, Fitness Consequences
of Substitutions.)
Various structural mechanisms allow HA escape mutants to reduce
binding by antibodies (Fleury et al. 1998). Bulky side chains may cause
steric hindrance that interferes with antibody-epitope contact. Glycosy-
lation adds surface carbohydrates that can prevent antibody access to
potential epitopes (Caton et al. 1982; Skehel et al. 1984; Cox and Bender
1995). Some substitutions may destroy key hydrogen bonds. Alterna-
tively, amino acid changes sometimes cause physical displacement of
various protein loops.
Fleury et al. (1998) compared binding of an antibody to an original HA
epitope and to a mutation of that epitope with changed conformation.
When the antibody bound to the mutant epitope, the antibody-epitope
complex reverted to the same structure as the antibody bound to the
original type. However, the energy required to distort the conformation
of the mutant epitope during binding reduced the binding affinity of
the antibody by 4,000-fold relative to the affinity of the antibody for
the original type. These various studies of antibody binding, structure,
and kinetics provide necessary background for analyses of evolutionary
change at the amino acid level.
I now turn to NA, which has not been studied as intensively as HA
(Colman 1998). The function of NA is not completely understood (Lamb
and Krug 2001). In general, neuraminidase enzymes cleave certain link-
ages within sialic acid. Sialic acid components of host cells form the
primary site of influenza attachment. Thus, NA appears to cleave the
host receptors to which influenza binds. This function seems to aid in
releasing progeny viral particles from infected host cells.
It may be that viruses lacking neuraminidase activity enter host cells
and replicate, but get stuck on the surface of the cell by attachment to
sialic acid (Palese and Compans 1976). Kilbourne et al. (1968) showed
that antibodies to NA do not prevent infection and replication, but do
214 CHAPTER 13
slow the rate at which viruses kill host cells—perhaps by reducing viral
spread from infected to uninfected cells.
13.2 Antibody Escape Mutants
Several different experimental methods and lines of evidence can be
used to infer the nature of antibody pressure on antigenic variation.
First, surface mapping determines which amino acids occur in sites
accessible to antibodies. Underwood (1982, 1984) raised a panel of 125
mouse IgG MAbs against HA. Underwood compared the reactivities of
the MAb panel against different natural and laboratory sequence vari-
ants of HA. Statistical methods identified which changed amino acids
caused a reduction in antibody binding. The changed amino acids were
located on the three-dimensional HA structure provided by Wilson et al.
(1981). Almost the entire distal exposed surface of HA reacted with anti-
body, suggesting that the exposed regions provide a nearly continuous
surface of potential epitopes. Antigenic sites B and D (fig. 13.2) con-
tained a greater proportion of epitopes than other regions and, at least
in particular laboratory mice, those sites appear to be more antigenic
than other sites.
There are some problems with inferring antibody pressure by map-
ping surface antigenicity. Different natural and laboratory isolates of
influenza may have multiple amino acid differences. This makes it dif-
ficult to assign changed antibody binding either to single amino acid
substitutions or to the role of the genetic background with variations
at other sites. In addition, changed antibody binding at different sites
may have different consequences for binding kinetics and viral fitness.
Some of the following methods mitigate these limitations.
A second approach applies MAb to either cultured or in vivo influenza
(Wiley et al. 1981; Caton et al. 1982; Thomas et al. 1998). This experi-
mental evolution favors escape variants that avoid neutralization. The
locations of the escape variants map the potentially variable sites that
can mutate to avoid recognition while preserving the ability to remain
infectious. This antigenic map can be used to determine whether nat-
urally varying amino acid sites likely changed under antibody pressure
or by some other process.
Often, the same amino acid substitution occurs in replicate lineages
faced with the same MAb, suggesting that the particular substitution
EXPERIMENTAL EVOLUTION: INFLUENZA 215
provides the best balance of escape from neutralization and preserva-
tion of viral fitness. Sites that do not change under MAb pressure may
either lack important contact with the antibody or may be constrained
by function. These alternatives can be tested by site-directed mutagen-
esis, which experimentally changes particular amino acids.
A third experimental technique simultaneously applies antibodies to
two or more sites (Yewdell et al. 1979, 1986; Lambkin et al. 1994). This
mimics host reactions in which two or more immunodominant sites gen-
erate neutralizing antibodies. The frequency of escape mutants to a sin-
gle antibody is about 10−5, so simultaneous escape against two distinct
antibodies occurs at a vanishingly low frequency of 10−10. It appears
that host antibodies directed simultaneously to two or more sites can
greatly reduce the chance of new escape mutants during the course of
a single infection.
A fourth experimental method focuses on escape mutants from low-
affinity, subneutralizing antibodies (Thomas et al. 1998). Laeeq et al.
(1997) obtained mice that lacked the ability to make the transition from
initial, low-affinity IgM antibodies to subsequent, high-affinity IgG. They
used those mice to raise low-affinity MAbs against influenza X-31 (sub-
type H3N2).
In previous studies, high-affinity MAbs applied to influenza typically
selected single amino acid changes in one of the major antigenic sites A–
E (fig. 13.2). By contrast, low-affinity MAbs selected escape mutants that
had two amino acid substitutions, one in the conserved receptor-binding
pocket and one in the highly antigenic regions next to the receptor-
binding site.
Clearance and protection probably derive from high-affinity IgA and
IgG antibodies rather than low-affinity IgM. So results from low-affinity
MAbs do not reflect the most common selective pressures on antigenic
variation. This study does, however, call attention to the processes by
which immunodominance develops within a host. The initial, naive an-
tibody repertoire may span widely over the HA surface, including the
receptor binding pocket. The stronger antigenic sites apparently out-
compete weaker sites in attracting high-affinity antibodies.
NA escape mutants have been studied less intensively than those for
HA (Webster et al. 1984, 1987).
216 CHAPTER 13
13.3 Cell Binding and Tropism
Influenza binds to sialic acid on host cells (Skehel and Wiley 2000).
Sialic acid occurs as the terminal residue attached to galactose on certain
carbohydrate side chains. Two common linkages between sialic acid and
galactose occur in natural molecules, the α(2,3) and α(2,6) forms.
Different amino acid residues in the HA receptor binding site affect
the relative affinity of HA for α(2,3) versus α(2,6) linkage (Matrosovich
et al. 1997, 1998). Isolates of influenza A from aquatic birds favor the
α(2,3) linkage. This matches the commonα(2,3) form on the intestinal
tissues of those hosts. All fifteen HA subtypes in aquatic birds share a
highly conserved receptor binding site (Webster et al. 1992). The binding
site apparently evolved before the evolution of the different subtypes
and has been retained during subsequent divergence.
The human influenza A subtypes H1, H2, and H3 derived from avian
ancestors (Webster et al. 1992). Each human subtype evolved from the
matching subtype in aquatic birds, for example, human H1 from avian
H1. In all three subtypes, the binding affinity of human lineages evolved
to favor the α(2,6) linkage (Paulson 1985; Rogers and D’Souza 1989;
Connor et al. 1994).
The evolutionary pathways differ for the human subtypes with regard
to the amino acid substitutions and changes in binding that eventually
led to preference for the α(2,6) form. Matrosovich et al. (1997) identi-
fied seven amino acid positions of the receptor binding site of aquatic
birds that have changed during adaptation to human hosts. Human sub-
types H2 and H3 have substitutions at positions 226 and 228 relative
to avian ancestors. By contrast, human subtype H1 retains the ances-
tral avian residues at 226 and 228, but has changes in positions 138,
186, 190, 194, and 225 (see fig. 13.3 for locations of amino acid posi-
tions). Thus, different human lineages have followed different pathways
of adaptation to receptor binding.
Experimental evolution studies of the H3 subtype support the phylo-
genetic data. Rogers et al. (1983) grew human H3N2 strains in chicken
eggs in the presence of nonimmune horse serum. Horse serum contains
α(2,6)-linked sialic acid, which binds to human strains of influenza and
interferes with the viral life cycle. The horse serum therefore selects
strongly for altered binding to α(2,3)-linked sialic acid (Matrosovich
et al. 1998). After selection, Rogers et al. (1983) found a single amino
EXPERIMENTAL EVOLUTION: INFLUENZA 217
acid substitution at position 226 of HA1. This substitution changed the
leucine of human H3 to a glutamine residue, the same residue found
in the ancestral avian H3 subtype. This substitution caused the modi-
fied virus to avoid α(2,6) binding and interference by horse serum and
allowed binding to α(2,3)-bearing receptors as in the ancestral avian
type.
Rogers et al. (1989) selected in the reverse direction. They began with
a duck H3 isolate that had glutamine at position 226 and favored bind-
ing to α(2,3) sialic acid linkages. Binding to erythrocytes selected vari-
ants that favor the α(2,6) linkage. Viruses bound to erythrocytes were
eluted and used to infect Madin-Darby canine kidney (MDCK) cells, a
standard culture vehicle for human influenza isolates. This selection
process caused replacement of glutamine at position 226 by leucine,
which in turn favored binding of α(2,6)- over α(2,3)-linked sialic acid.
The same sort of experimental evolution on H1 isolates would be very
interesting. If selection of avian H1 for a change from α(2,3) to α(2,6)binding causes the same substitutions as occurred in the human H1 lin-
eage, then the different genetic background of avian H1 compared with
H3 would be implicated in shaping the particular amino acid substitu-
tions. By contrast, if experimental evolution favors a change at posi-
tion 226 as in H3, then the evolution of human H1 receptor binding
may have followed a more complex pathway than simple selection for
α(2,6)-linked sialic acid.
Various steps have been proposed for adaptation of aquatic bird iso-
lates to humans. For example, Rudneva et al. (1996) and Matrosovich
et al. (1999) discuss the need to match HA and NA specificities. NA re-
moves sialic acid from HA receptors, apparently facilitating release of
viral progeny from the surface of host cells. If a viral lineage switches its
HA specificity from the avian α(2,3) to the human α(2,6) form, but NA
retains the avian specificity, then the lineage may have difficulty spread-
ing in humans. Complex pathways may be required for joint adaptation
of HA and NA (Matrosovich et al. 1999).
These studies raise the general problem of evolutionary pathways by
which pathogens change host receptors. If two or more pathogen func-
tions must change simultaneously, then changes in receptor affinity may
be rare. The need for joint change may cause significant constraint on
amino acid substitutions in receptor binding factors.

218 CHAPTER 13
Defined genetic background
Substitution
� in Ab neutralization
On/Off-rates
� in cell binding and entry
� in binding towrong substrates
Figure 13.5 Effects of amino acid substitutions on fitness. In an experimen-tal setting, one begins with a particular, defined genotype as the genetic back-ground for further analysis. One then obtains single amino acid substitutionsor small numbers of substitutions derived from the original background ge-notype. Substitutions may be obtained by imposing selective pressures suchas antibodies in an experimental evolution regime or by imposing site-directedor random mutagenesis. Substitutions affect various components of fitness asdescribed in the text.
13.4 Fitness Consequences of Substitutions
Surface amino acid substitutions affect fitness in three different ways
(fig. 13.5). Each of these processes relates fitness to different kinetic
aspects of surface binding.
First, changes in cell binding and entry affect the performance of in-
tracellular pathogens. The relationship between binding kinetics and
fitness may be rather complex. For example, figure 13.3 shows that nat-
urally occurring amino acids may promote lower binding affinity than
is associated with certain substitutions. In that figure, the substitutions
190 E→A, 225 G→R, and 228 S→G all have stronger binding affinity than
the common wild type.
HA has a relatively low affinity for its host-cell receptors (Skehel and
Wiley 2000). The fact that some substitutions raise affinity suggests that
binding has been adjusted by selection to an intermediate rate. It may be
possible to test this idea in various experimental systems by competing
viruses with different cell binding kinetics.
Robertson (1993, 1999) reviews experimental evolution work on the
adaptation of influenza to culture conditions in chicken eggs and Madin-
Darby canine kidney (MDCK) cells. Those in vitro systems allow study of
competition between different viral genotypes (Robertson et al. 1995).

EXPERIMENTAL EVOLUTION: INFLUENZA 219
Simple in vitro culture conditions may select for higher binding affin-
ity between pathogen and host cells (Robertson et al. 1995). It would
be interesting to compare the fitnesses in vivo between wild type and
mutants selected for higher binding affinity in vitro.
The second role of substitutions arises from binding that interferes
with viral fitness. Too high affinity of HA for the primary host-cell re-
ceptor may impair release of progeny viruses. High affinity may also ag-
gregate viruses in localized regions, interfering with infectious spread.
Again, it would be interesting to compete variants with different affini-
ties under various in vitro and in vivo conditions.
Receptor binding sites may also be strongly selected to avoid binding
molecules similar to the host-cell receptor. For example, the nonim-
mune component of horse serum attracts influenza particles that bind
the α(2,6) linkage of sialic acid (Matrosovich et al. 1998). Selection fa-
vors equine influenza strains that both bind α(2,3) linkages and avoid
α(2,6) linkages. By contrast, mucins of human lungs contain α(2,3)-linked sialic acid, favoring human lineages that avoid the α(2,3) linkage
(Couceiro et al. 1993). Thus, host fluids or host tissues different from
the primary infection target can cull viruses from circulation. The ki-
netics of such fitness losses must be balanced against kinetic gains in
receptor binding and avoidance of antibodies.
The third fitness effect of surface substitutions arises from changes
in antibody binding. A few studies have related different aspects of
antibody-virus binding kinetics to the neutralization (killing) of viruses
(Schofield et al. 1997a, 1997b; Drescher and Aron 1999; Edwards and
Dimmock 2000; Kostolanský et al. 2000; Sanna et al. 2000). This topic
stands as a preliminary model for analyzing the relations between bind-
ing kinetics and fitness (Dimmock 1993; McLain and Dimmock 1994;
Dimmock 1995).
No work has clearly established the roles of various amino acid sub-
stitutions in antibody neutralization kinetics. I highlight a few general
issues and some particular studies on influenza. I suspect that exper-
imental evolution will be an important tool in understanding the links
between fitness, amino acid substitutions, the kinetics of binding to host
cells, and the kinetics of antibody neutralization.
220 CHAPTER 13
ANTIBODY-EPITOPE BINDING
I begin with a few key measures. Consider the simple chemical re-
action [A] + [V] � [AV], where brackets denote concentration (mol/l)
for antibodies, A, viruses, V, and bound antibody-virus complexes, AV.
Binding occurs at the on-rate, or rate of association, ka (l/mol·s), and
the breakup of bound complexes occurs at the off-rate, or rate of disso-
ciation, kd (1/s). The equilibrium binding affinity is
Ka = kakd= [AV][A] [V]
with units l/mol. At equilibrium, the binding affinities can also be given
by the dissociation constant, Kd = 1/Ka.
Most studies of antibody-parasite binding report equilibrium affinity.
This may capture an important aspect of neutralization, but other pro-
cesses may also be important. For example, equilibrium binding affinity
provides no sense of the time course of association because it describes
the ratio between on-rate and off-rate. In vivo, the race occurs between
the rate of antibody binding and neutralization versus the rate of patho-
gen attachment and entry into host cells (Dimmock 1993; McLain and
Dimmock 1994). Experimental evolution studies could be devised to
measure under what conditions selection favors particular changes in
rate processes or only an overall change in equilibrium affinity.
NEUTRALIZATION MECHANISMS AND KINETICS
I now turn to a few particular studies. Schofield et al. (1997a) com-
pared equilibrium affinity, Ka, and neutralization strength for five MAbs
against influenza HA. They measured neutralization by the rate at which
a mixture of antibody and virus loses infectivity when presented with a
layer of cultured host cells. For the five MAbs, the rank order of binding
affinity approximately matched the rank order of neutralization rate.
Thus, binding affinity explains some of the variation in neutralization
rate. However, the ratio of affinity to neutralization rate varied by a
factor of 125. Affinity alone does not explain all of the variation.
Edwards and Dimmock (2000) studied several aspects by which IgG
MAbs H36 and H37 neutralize influenza. H36 binds to site B and H37
to site A on the HA molecule (see fig. 13.2). Antibodies in cell culture
may neutralize by blocking viral attachment, by preventing fusion of the
EXPERIMENTAL EVOLUTION: INFLUENZA 221
virus with the host cell membrane, by inhibiting internalization of the
virus, or by interfering with viral replication.
Edwards and Dimmock (2000) found that, when antibodies inhibited
infectivity by 50% of viruses, attachment was blocked for only 5 to 20% of
viruses. Thus, other neutralizing mechanisms must play an important
role. Further studies demonstrated that antibody inhibition of viral fu-
sion increased in proportion to neutralization. Interference with fusion
appears to be the primary neutralizing mechanism. However, antibody
concentration influenced the relative contributions of blocking attach-
ment versus blocking fusion: increased concentrations enhanced the
degree of interference with viral attachment for both H36 and H37 an-
tibodies. At high concentrations, interference with attachment became
the dominant mechanism. As in Schofield et al. (1997a), binding affinity
alone did not determine neutralization efficiency. H36 neutralized 10-
fold more efficiently than did H37, but H37 binding affinity was 1.4-fold
higher for H37 than for H36.
Schofield et al. (1997a) observed pseudo-first-order kinetics of in-
fluenza neutralization by antibody, defined as a log-linear decrease in
infectivity over time. Pseudo-first order kinetics typically occur for an-
tibody neutralization of viruses (Dimmock 1993), although exceptions
occur (McLain and Dimmock 1994). Many different underlying mech-
anisms of reaction can give rise to pseudo-first-order kinetics (Latham
and Burgess 1977).
The most commonly proposed mechanism for pseudo-first-order neu-
tralization follows the single-hit model, in which one assumes that a
single bound antibody can neutralize a virus (Dimmock 1993). In this
model, the probability at time t that a particular virion has not been hit
by at least a single antibody is e−λt , with an average time until the first
hit of 1/λ. The logarithm of the number of antibody-free virions decays
linearly in time with a slope proportional to −λ. This exponential decay
typifies models of random waiting times, random decay, and the Pois-
son distribution for the number of events in a particular time period.
In the antibody-virus model, one assumes an excess of antibody so that
antibody pressure does not decline over time as antibodies bind to viral
surfaces.
In an exponential decay model of binding, there is on average one anti-
body bound to each virion when λt = 1, following a Poisson distribution
with an average count of one. Thus, when the average number of bound

222 CHAPTER 13
antibodies per virus is λt = 1, the single-hit model for first-order neutral-
ization kinetics predicts a frequency of e−λt = e−1 antibody-free virions
and 1 − e−1 bound and neutralized virions. Conversely, 1 − e−1 = 63%
neutralization predicts an average of one bound antibody per virion.
The observed number of bound antibodies per virion at 63% neutral-
ization varies widely (Dimmock 1993): approximately 1 for polyclonal
antibodies neutralizing adenovirus hexon protein (Wohlfart 1988) and
poliovirus (Wetz et al. 1986), 4 to ≥ 15 for poliovirus with MAb IgG (Ice-
nogle et al. 1983; Mosser et al. 1989), and about 70 MAb IgG per influenza
virion (Taylor et al. 1987).
FIRST-ORDER KINETICS WITH MULTIHIT BINDING
To understand the apparent contradiction between the observed first-
order kinetics and multi-hit binding, one must understand the mecha-
nisms by which antibodies neutralize virus. Two possibilities have been
discussed (Icenogle et al. 1983; Dimmock 1993; McLain and Dimmock
1994).
First, a particular epitope may occur many times on the surface of
a virion. The different sites have the same antigenicity but may differ
in the effect of bound antibody on neutralization. Antibody bound to
critical sites neutralizes; antibody bound to noncritical sites does not
neutralize. Taylor et al. (1987) found an average of 70 HA-binding IgG
molecules per virion at 63% neutralization, suggesting a ratio of noncrit-
ical to critical sites of 70:1. A virion has about 1,000 HA spikes, implying
about 14 critical sites per virion. Thus only one hit in 70 neutralizes.
This model is possible, but at present there is no reason to suppose that
only a small fraction of apparently identical HA spikes differs in some
critical way.
Second, each bound antibody may partially neutralize a virion (Ice-
nogle et al. 1983). Although this process does not yield a perfectly log-
linear plot of neutralization versus time, the predicted kinetics are suffi-
ciently close to log-linear (pseudo-first-order) that departures would not
be easily noticed in experimental data. This model is attractive because
a single antibody bound to one of 1,000 HA spikes on an influenza virion
might fractionally reduce infectivity rather than completely neutralize
the virus.
EXPERIMENTAL EVOLUTION: INFLUENZA 223
4
3
2
1
0
–17 8 9 10
95% occupancy
ycnapucco%05
ycnapucco%5
log10 affinity
log
10 a
nti
body
at V
N5
0
Figure 13.6 The amount (units in ng) of MAb IIB4 required to impose 50% neu-tralization (VN50) of influenza grown in cell culture. Each observation (open cir-cle) shows the neutralization of a different influenza strain with variant aminoacids at the antibody binding site. The amino acid variants cause differentequilibrium binding affinities (Ka) with the antibody (units in l/mol). The per-cent occupancy describes the fraction of HA spikes occupied by antibody underequilibrium conditions at 50% neutralization. Redrawn from Kostolanský et al.(2000), with permission from the Society for General Microbiology.
Kostolanský et al. (2000) took a different approach to understanding
the interaction between the number of bound antibodies and the neutral-
ization of influenza. Earlier studies compared different MAbs directed
to different epitopes, so that it was difficult to separate the effects of
the different antibodies and epitopes on the relations between affinity,
neutralization kinetics, and mechanisms of neutralization. By contrast,
Kostolanský et al. (2000) compared binding of a single MAb, IIB4, to dif-
ferent influenza strains. Those strains have variant amino acids in a
single epitope located at HA antigenic site B (see fig. 13.2).
By focusing on a single MAb against variants of the same epitope, Kos-
tolanský et al. (2000) could analyze how variations in affinity influence
the number of bound antibodies and the degree of neutralization. They
measured equilibrium binding affinity (Ka) of MAb IIB4 for HA variants
and the ability of IIB4 to neutralize each variant. They reported neu-
tralization as VN50, the amount of antibody in vitro required to reduce
influenza replication rate by 50%.
Higher-affinity epitopes needed less antibody to reach VN50 (fig. 13.6).
In addition, higher-affinity epitopes had fewer antibodies per virion at
VN50. For example, the highest affinity of Ka ≈ 109 l/mol had about
224 CHAPTER 13
13% of HA spikes occupied by antibody, whereas the lowest affinity of
Ka ≈ 108 l/mol had about 98% of HA spikes occupied. These results
suggest that neutralization depends on quantitative effects of affinity
and the cumulative effects of multihit binding.
The particular mechanism that leads to quantitative effects on neu-
tralization remains unclear. It may be that lower-affinity antibodies pri-
marily interfere with attachment to host cells by covering most viral
attachment sites. By contrast, higher-affinity antibodies may interfere
primarily with fusion and entry to host cells, and such steric interference
at the cell surface requires a lower density of bound antibody.
Kostolanský et al. (2000) measured percent occupancy of free virions.
When virions attach to cell surfaces, the lower-affinity epitopes may lose
a larger fraction of bound antibody than higher-affinity epitopes. The
net effect is that, to achieve VN50, both high- and low-affinity epitopes
may have similar fractions of bound antibody during virion-cell binding.
Sanna et al. (2000) found that simultaneous binding by two antibod-
ies to different epitopes acted synergistically to enhance neutralization.
Synergism occurs when simultaneous binding by two antibodies causes
higher neutralization than expected by adding the effects of each anti-
body when bound alone. Thus, the fitness effect of an amino acid sub-
stitution may depend both on the reduced affinity for the conforming
antibody and on the context of other antibody-epitope combinations for
that pathogen genotype.
13.5 Experimental Evolution of Other Pathogens
FMDV and influenza distinguish themselves as model experimental
systems. Structural studies locate particular amino acid sites in their
three-dimensional context. Experimental evolution substitutes amino
acids in response to immune pressure, altered cellular receptors, in-
terference with the viral receptor binding site, or changed kinetics that
arise in cell culture. Binding affinity and kinetics of neutralization relate
amino acid substitutions to components of fitness.
Several other pathogens have been studied by experimental evolution.
The range of information for each pathogen tends to be limited when
compared with the multiple types of evidence for FMDV and influenza.
In this section, I briefly list a few additional studies of experimental
evolution.
EXPERIMENTAL EVOLUTION: INFLUENZA 225
Ciurea et al. (2000) manipulated in vivo the components of the mouse
immune response against cytopathic lymphocytic choriomeningitis vi-
rus. Experimental reduction of CD8+ T cell response greatly enhanced
the production of escape mutants from neutralizing antibody, suggest-
ing that antibodies play a greater part in controlling the virus in the
absence of CD8+ T cells. Experimental deletion of the B cell response
led to an absence of amino acid substitutions in the presumed antibody
epitopes, demonstrating that substitutions in surface proteins arise in
response to antibodies rather than cell tropism.
Hepatitis B virus (HBV) can cause severe liver damage in humans. Liver
transplants following damage by HBV infection require suppression of
HBV to prevent harm to the transplanted organ (Gow and Mutimer 2000).
One suppressive method treats patients with antibody directed at the
HBV surface antigens. This treatment creates an in vivo selection exper-
iment in the patient, favoring HBV escape mutants. Not surprisingly,
escape mutants do arise frequently with amino acid substitutions in the
immunodominant surface antigens (Gow and Mutimer 2000).
HBV encodes surface antigens and nucleotide polymerases in differ-
ent reading frames of the same nucleotide genomic sequence (Shields
et al. 1999). Antigenic change in response to antibody pressure can
change polymerase function, and substitutions in the polymerase in re-
sponse to nucleoside analog drugs can change antigenic properties of
surface proteins. The mapping of amino acid substitutions to fitness
may be rather complex in this case. Ghany et al. (1998) showed that an-
tibody escape mutants reverted to wild type after antibody pressure was
removed, suggesting that the escape mutants had reduced polymerase
function.
Liebert et al. (1994) studied measles encephalitis in a rat model. MAbs
injected in vivo reduced neurovirulence and selected escape mutants
that were isolated from brain tissue. MAb escape mutants selected in
vitro produced altered and variable patterns of neurovirulence when
injected into the host. The antibody epitopes appeared to be on the sur-
face hemagglutinin protein. Amino acid substitutions in measles hem-
agglutinin appear to alter both antigenicity and neurovirulence.
Measles virus also appears to change its binding affinity for different
cellular receptors during adaptation to cell culture (Nielsen et al. 2001).
The amino acid changes associated with receptor affinity occur in the
surface hemagglutinin protein. Further experimental evolution studies
226 CHAPTER 13
of this system will provide more information on how viruses modulate
receptor binding and cell tropism during adaptation to different kinds
of host cells.
The life cycle of arthropod-borne viruses (arboviruses) typically al-
ternates between vertebrate hosts and blood-feeding arthropod vectors.
The viruses replicate in both hosts. Arboviruses have RNA genomes and
therefore the potential for high genetic diversity. However, many stud-
ies have reported a high degree of antigenic conservation and slow rates
of molecular evolution (reviewed by Cooper and Scott 2001). Scott et al.
(1994) and Weaver et al. (1999) suggested that alternating hosts impose
a constraint on molecular change.
Cooper and Scott (2001) used experimental evolution to study how
alternating hosts potentially constrain adaptive change. They passaged
viral lineages in cell culture through either mosquito cells only, avian
cells only, or alternating between mosquito and avian cells. They then
measured various characteristics of infectivity and growth on insect,
avian, or mammalian host cells.
The different passage histories produced significant differences in in-
fectivity and growth between the lineages. The lineages that alternated
between the two host types expressed intermediate phenotypes rela-
tive to those lineages passaged only in one cell type. Alternation ap-
parently favored compromise between changing selective regimes. Fur-
ther experimental evolution studies in vivo may provide more insight
into how multiple selective pressures constrain the rate of evolutionary
change.
Moya et al. (2000) review experimental evolution studies of vesicular
stomatitis virus, an RNA virus. They particularly emphasize that high
mutation rates and large population sizes of RNA viruses affect evolu-
tionary potential by maintaining a large diversity of variant genotypes.
Those variants provide material for a rapid response to new or chang-
ing selective pressures. The consequences of varying population size
on the rate of adaptation have been analyzed under controlled experi-
mental conditions.
A few bacterial studies analyzed escape mutants in response to con-
trolled antibody pressure (e.g., Jensen et al. 1995; Solé et al. 1998). Other
scattered studies of experimental evolution have been done on nonviral
pathogens, but none approaches the scope of the viral experiments.

EXPERIMENTAL EVOLUTION: INFLUENZA 227
13.6 Problems for Future Research
1. Decoy antigenic variation. The first infection of a host initially stim-
ulates the naive IgM antibody repertoire, which has relatively low affinity
and broad specificity. The mature, high-affinity antibody response de-
velops by various processes, including competition between antibodies
based on binding affinity.
A pathogen gains if its most highly antigenic sites have low rates of
neutralization or high rates of antigenic change. Highly antigenic de-
coy sites can draw antibody pressure away from sites more sensitive to
neutralization or more strongly constrained against change because of
essential function.
Laeeq et al. (1997) showed that IgM antibody pressure selects variants
in the receptor binding site, whereas mature, high-affinity antibodies
select variants in the major antigenic sites outside of the binding pocket.
The immunodominant sites draw the maturing repertoire away from the
binding pocket.
To what extent have immunodominant sites evolved to draw antibody
pressure away from more sensitive sites? This is a difficult question,
because immunodominant sites may happen to be away from receptor
binding pockets or other functional sites for a variety of reasons.
No experimental systems developed so far provide a clear way to ad-
dress this problem. One needs experimental control of initial antibody
pressure and a feedback mechanism that enhances antibody pressure
on epitopes with stronger antibody binding. Feedback favors epitopes
with relatively lower rates of neutralization to evolve relatively stronger
antibody binding. Such decoy sites might additionally be favored if they
could tolerate a broad array of amino acid escape mutants.
This sort of experimental evolution would provide clues about the
forces that have shaped immunodominance. Mathematical models of
immunodominance such as those developed by Nowak and May (2000)
would aid in designing experiments and clarifying evolutionary process.
2. Genetic background. Experimental evolution studies of avian and
human H3 showed that a single amino acid change at position 226 of
HA1 determines avian α(2,3)-tropic or human α(2,6)-tropic binding
for sialic acid (Rogers et al. 1983, 1989). An open question concerns the

228 CHAPTER 13
role of the genetic background in conditioning the effects of a particular
substitution. These experiments could be repeated, starting with geno-
types that have different amino acid substitutions at varying distances
from site 226.
3. Kinetics of pleiotropy. Several escape mutants have been generated
by application of MAbs. It would be interesting to know the pleiotropic
consequences of antibody escape mutants for other components of fit-
ness, such as binding to host receptors, growth rate, and virulence.
These fitness components depend on various kinetic processes within
the host. A study that matched amino acid substitutions to kinetic pro-
cesses would illuminate the mechanistic basis of fitness and provide
insight into the microevolutionary patterns of change in proteins.
Most work on influenza has emphasized human isolates of influenza
A. Those isolates can be grown in vivo in mice and other hosts, but the
change in hosts compromises interpretations of kinetics and fitness. It
would be interesting to develop an experimental model of influenza A in
aquatic birds, the ancestral host for this virus. This would allow study
of natural variation in avian isolates coupled with in vivo experimental
analysis of fitness components.
4. Balancing selection of receptor binding. Influenza binding affinity
for host receptors appears to be balanced at an intermediate level. Some
substitutions raise affinity, and other substitutions lower affinity. Cell
culture studies of FMDV and other pathogens show that binding affinity
and receptor tropism evolve readily in experimental settings. It would
be interesting to learn more about the selective pressures that modulate
such affinities. The fitness effects no doubt depend on kinetic rates
of cellular binding and entry balanced against rates of aggregation on
inappropriate surfaces and in places hidden from or exposed to immune
effectors. Substitutions that modulate these rate processes may also
affect antibody binding. Study of these processes depends on a good
in vivo system in which selective pressures can be varied and fitness
components can be measured.
5. Kinetic consequences of neutralization mechanisms. Preliminary
studies of neutralization kinetics provide some clues about how anti-
body binding affects fitness. Different mechanistic models of neutraliza-
tion could be transformed into a family of mathematical models for neu-
tralization kinetics. Those models would clarify predicted response to
EXPERIMENTAL EVOLUTION: INFLUENZA 229
experimental manipulation under different assumptions, allowing bet-
ter tests of the mechanistic assumptions. In addition, models would sug-
gest how changes in different aspects of neutralization would affect viral
fitness. The more sensitive steps in neutralization would be under more
intense selective pressure for change, suggesting a testable prediction
for which amino acid sites would be most likely to respond during ex-
perimental evolution. These studies would link molecular mechanisms,
kinetic consequences, and evolutionary forces.
14 Experimental Evolution:CTL Escape
CTL pressure favors amino acid substitutions in pathogen epitopes that
escape recognition. Escape substitutions may avoid peptide processing
and transport, reduce binding to MHC molecules, or lower affinity for
the T cell receptor (Borrow and Shaw 1998). In this chapter, I discuss ex-
perimental evolution studies of CTL escape. I also discuss nonevolution-
ary studies that provide background or suggest promising experimental
systems.
The first section reviews mechanisms of escape during peptide cleav-
age and transport. Two studies of murine leukemia virus describe single
amino acid substitutions that changed patterns of peptide cleavage in
cellular proteasomes. One substitution added a cleavage site within an
epitope. Before the substitution, a significant amount of that epitope
was transported to the endoplasmic reticulum, bound to MHC mole-
cules, and presented to CTLs at the cell surface. The new cleavage site
greatly reduced the abundance of the epitope available for MHC binding.
A different substitution abrogated cleavage at the carboxyl terminus of
an epitope, preventing transport of the peptide from the proteasome to
the endoplasmic reticulum.
The second section describes escape from binding to MHC molecules
during experimental evolution. Studies of influenza and lymphocytic
choriomeningitis virus used a transgenic mouse with almost all of its
CTLs specific for a single epitope, creating intense selective pressure
for escape. Structural analyses of the peptide-MHC complex illuminate
the biochemical mechanisms by which escape variants reduce binding
to MHC. Experiments with simian immunodeficiency virus compared the
spread of amino acid substitutions in several epitopes when in differ-
ent host MHC genotypes. If the host had an MHC molecule that could
present a particular epitope, that epitope was much more likely to evolve
escape substitutions during infection.
The third section summarizes escape from binding to the T cell re-
ceptor (TCR). The experimental evolution studies of influenza and lym-
phocytic choriomeningitis with transgenic, monoclonal T cells yielded
some TCR escape substitutions. Structural studies of peptide-MHC com-

EXPERIMENTAL EVOLUTION: CTL ESCAPE 231
plexes and binding affinity studies of the complexes with TCRs clarified
the biochemical mechanisms by which escape occurs.
The fourth section considers how the function of pathogen proteins
may be altered by CTL escape substitutions. The Tax protein of human T
cell leukemia virus type 1 provides a major target for CTL attack. Intense
immune pressure selects for escape substitutions in naturally occurring
infections. Tax plays a key role in many viral and cellular processes
that affect viral fitness. Functional studies of Tax mutants suggest that
substitutions reduce Tax performance. In HIV, amino acid substitutions
in response to drugs sometimes increase binding to MHC molecules. It
may be that the wild-type sequence reflects a balance between protein
function and avoidance of MHC binding. Drugs or other experimental
perturbations may upset that balance, exposing the mechanisms that
mediate balancing selection.
The fifth section lists kinetic processes that determine the success
or failure of escape variants. Kinetic processes connect the biochem-
ical mechanisms of molecular interaction to the ultimate fitness conse-
quences that shape observed patterns of antigenic variation. No exper-
imental evolutionary studies have focused on these kinetic processes.
The final section highlights some topics for future research.
14.1 Cleavage and Transport of Peptides
Cellular proteasomes continuously chop up proteins into smaller pep-
tides. Proteasomal cleavage patterns of proteins determine which pep-
tides will be transported into the endoplasmic reticulum by transporter
(TAP) molecules and made available for binding and presentation by the
MHC system.
Single amino acid substitutions can affect proteasomal cleavage pat-
terns (references in Beekman et al. 2000). Ossendorp et al. (1996) com-
pared an eight-residue CTL epitope in two different murine leukemia
viruses. Those epitopes differ by a K→R substitution in the first posi-
tion. The R residue adds an additional, strong cleavage site within the
epitope, causing a large reduction in the abundance of the R-containing
epitope available for MHC presentation.
Cleavage does not occur instantaneously for all proteins. Instead,
varying sites affect rates of cleavage and consequently relative abun-
dances of different peptides. Ossendorp et al. (1996) present kinetic
232 CHAPTER 14
data for the accumulation of the K- and R-containing epitopes, and show
that a large difference in abundance arises early in digestion, on the or-
der of one hour.
Beekman et al. (2000) studied a different epitope in the same pair of
murine leukemia viruses. In this case, an amino acid substitution at
the residue flanking the C-terminus of the epitope affected both cleav-
age and transport. An aspartic acid residue at this position prevented
cleavage precisely at the C-terminal site of the epitope and prevented
transport by TAP. Thus, the epitope remained intact, but the peptide
was not carried to the site of MHC binding.
These studies demonstrate that cleavage and transport can affect CTL
response. But no data show how commonly amino acid substitutions ab-
rogate efficient cleavage and transport. Experimental evolution studies
could manipulate immunodominance and kinetic aspects of within-host
infections to measure the frequency of the escape mechanism under dif-
ferent conditions.
14.2 MHC Binding
Amino acid substitutions can reduce affinity of epitopes for binding
to MHC molecules. This may prevent MHC from transporting bound epi-
topes to the cell surface. Alternatively, peptide-MHC complexes may be
presented on the cell surface, but higher off-rates of the peptide reduce
the opportunity for interaction with T cell receptors (TCRs). Several ex-
perimental evolution studies report mutations that reduce peptide-MHC
binding.
LCMV
Mice infected with lymphocytic choriomeningitis virus (LCMV) form
the best-studied experimental system (Pircher et al. 1990; Weidt et al.
1995; Moskophidis and Zinkernagel 1995). LCMV is a noncytopathic
RNA virus that naturally infects mice. The infection can be controlled or
eliminated by a strong CTL response of the host. In H2-b mice, the MHC
molecule Db presents the viral glycoprotein epitope GP33–43 and the
MHC molecule Kb presents the overlapping GP34–43 epitope (Puglielli
et al. 2001).
Genetically modified (transgenic) mouse lines have been developed
that express a TCR specific for GP33–43 presented by MHC Db. Most (75–
EXPERIMENTAL EVOLUTION: CTL ESCAPE 233
90%) of the CTLs in these mice express the TCR for GP33–43 (Pircher et al.
1990). These CTLs clear low doses of LCMV. High doses produce an ini-
tial viremia and subsequent decline under CTL pressure, followed by the
appearance of CTL escape variants (Pircher et al. 1990). The rather ex-
treme immunodominance of this experimental system provides a good
model for studying molecular details of escape variants.
Puglielli et al. (2001) used this system to study amino acid substitu-
tions in response to CTL pressure against Db-restricted GP33–43. They
infected transgenic mice with high doses of LCMV virus. After the ini-
tial viremia and subsequent decline in titers in response to CTL pressure,
viral titers increased. They isolated viruses from this later period to de-
termine if escape variants had evolved and, if so, by what mechanism.
These late viruses had a V→A substitution at the third position (site 35)
of GP33–43 that nearly abolished binding to MHC Db.
Binding affinity of a peptide to MHC class I molecules typically de-
pends on a small number of anchor residues in the peptide (Janeway
et al. 1999). For example, an MHC molecule may have two anchor posi-
tions such that the fifth and ninth amino acids from the amino termi-
nus (lower-numbered end) of the peptide determine the main portion of
binding affinity. Structurally, such anchors may be pockets in the MHC
molecule into which side chains from amino acids can fit. An amino
acid with a side chain that fits well into the MHC pocket will bind with
high affinity. A substitution in the peptide at an anchor position to a
different amino acid with significantly altered shape or charge often di-
minishes or abolishes effective binding of the peptide-MHC complex.
Substitutions at nonanchor residues usually have much smaller effects
on binding affinity.
The third binding position of MHC Db is neither the primary nor aux-
iliary anchor residue according to previous studies (Rammensee et al.
1995). However, Tissot et al. (2000) solved the structure of Db bound
to the LCMV wild-type epitope at GP33-43 (fig. 14.1). They found that
the peptide residue at position three had its side chain buried in the
Db binding cleft and, apparently, certain substitutions such as V→A at
this location can disrupt binding in the manner of an anchor position
(Puglielli et al. 2001).
Moskophidis and Zinkernagel (1995) studied the same system with
H2-b mice and LCMV virus. Evolution within experimentally infected
mice produced substitutions in immunodominant CTL epitopes. The
234 CHAPTER 14
(a)
(b)
Figure 14.1 Binding of LCMV epitope GP33-41 to the H-2 mouse MHC moleculeDb. The nine amino acids of the epitope in positions 33–41 of the protein arelabeled as P1–P9. (a) The epitope fits into the MHC binding groove. The boundepitope exposes P4 and P6–P8; the groove shelters the other residues. (b) Side-view diagram shows the buried and exposed residues. Rammensee et al. (1995)list P5 and P9 as anchor residues; P2 and P3 also occur deep in the groove. FromTissot et al. (2000).
substitutions N→D and N→S at position 280 of epitope GP275–289 abol-
ished presentation by MHC molecule Db. This position forms an anchor
residue for binding to Db.
EXPERIMENTAL EVOLUTION: CTL ESCAPE 235
Moskophidis and Zinkernagel (1995) also studied the V→L substitu-
tion at position 35 of GP32–42 originally obtained in the experimental
evolution studies of Pircher et al. (1990). Both Db and Kb can present
this epitope. The V→L change, which occurred in a nonanchor residue
for both MHC molecules, did not significantly reduce binding to either
MHC molecule. The substitution did significantly reduce CTLs directed
against this epitope when presented by Db.
From these studies, two different substitutions at GP35 were analyzed
(position P3 in fig. 14.1). Puglielli et al. (2001) found that a V→A substi-
tution at GP35 abrogated binding to Db, whereas Moskophidis and Zin-
kernagel (1995) found that a V→L change did not affect binding to Db.
Although this site was previously considered as a nonanchor residue, the
L and A substitutions had significantly different effects on MHC bind-
ing. Interestingly, the V→L substitution, which did not affect binding
affinity to the MHC molecule, did reduce the affinity of the peptide-MHC
complex for a TCR (see section 14.3 below, TCR Binding).
SIV
Several authors suggest that HIV escape from CTLs plays an impor-
tant role in the dynamics and persistence of infection within individual
hosts (e.g., McMichael and Phillips 1997; Nowak and May 2000). Many
lines of evidence from human hosts support this argument. But human
infections cannot be controlled or manipulated experimentally. Several
experimental evolution studies of simian immunodeficiency virus (SIV)
infections in rhesus macaques have recently been published.
Allen et al. (2000) infected eighteen rhesus macaques with cloned SIV.
All ten hosts expressing the MHC class I molecule Mamu-A*01 made
CTLs to Tat28–35, the SL8 epitope in the Tat protein. Up to 10% of cir-
culating CTLs recognized this epitope during the acute phase of viremia
three to four weeks after infection. However, the frequency of Tat-
specific CTLs dropped sharply after the acute phase, suggesting escape
from recognition.
Sequencing at eight weeks after infection showed that five of ten
Mamu-A*01 positive animals had mutations in the SL8 epitope, with
little variation outside of this epitope. By contrast, only one of eight
Mamu-A*01 negative hosts had mutations in the SL8 epitope. Four of the
amino acid substitutions in SL8 effectively destroyed binding to Mamu-
236 CHAPTER 14
A*01. Three of these substitutions occurred at position 8, the primary
anchor site, and one substitution occurred at position 2, the secondary
anchor site. Two other substitutions reduced binding by less than two
orders of magnitude: a substitution at position 1 reduced binding by
67%, and a substitution at position 5 reduced binding by 85%.
Z. W. Chen et al. (2000) observed CTL escape in SIV infections of rhe-
sus macaques mediated by a single T→A substitution in an epitope of
the Gag protein. The Mamu-A*01 MHC molecule presents this Gag181–
189 epitope on the cell surface. The substitution did not affect bind-
ing affinity of Mamu-A*01 for Gag181–189. However, the peptide-MHC
complexes could stimulate CTL response only when in vitro target cells
where experimentally pulsed with high concentrations of the mutated
epitope. Z. W. Chen et al. (2000) conclude that the substitution increases
the off-rate of binding, causing a high dissociation rate of peptide-MHC
complexes on the cell surface. High experimental concentrations of the
epitope in vitro may overcome the high dissociation rates and provide
enough peptide-MHC complexes on the cell surface to stimulate CTLs.
Many studies of CTL escape either use nearly monoclonal T cells or
follow only one viral epitope. This leaves open the problem of whether
polyclonal CTL responses to multiple epitopes favor escape in the same
way as CTL responses to a single epitope. Evans et al. (1999) addressed
this issue by following the within-host evolution of five distinct CTL
epitopes of the Env and Nef proteins in five rhesus macaques experi-
mentally infected by SIV. All hosts had the same MHC class II genotype
and thus similar presentation of epitopes to helper T cells.
Hosts B and B′ had the same MHC class I genotype and progressed rap-
idly to disease without making a strong CTL response. The other three
hosts made strong initial CTL responses. Hosts A and D progressed
slowly to disease, whereas host C progressed at an intermediate rate.
The intermediate progressor, host C, differed from the fast progressors
by having MHC class I molecules Mamu-A*11 and Mamu-B*17. These
MHC molecules presented two epitopes, Env497–504 and Nef165–173.
One slow progressor, host A, differed from the fast progressors by hav-
ing MHC class I molecules Mamu-B*03 and Mamu-B*04, which present
three epitopes, Env575–583, Nef136–146, and Nef62–70. The other slow
progressor, host D, had all four class I molecules listed for hosts A and
C, and presented all five epitopes.
EXPERIMENTAL EVOLUTION: CTL ESCAPE 237
Evans et al. (1999) sequenced env and nef genes at various times
during the course of infection. For the five epitopes listed above, each
host had viral populations dominated by escape mutants only for those
epitopes that they could present by their class I MHC molecules. For
example, host C viruses were dominated by escape mutants in Env497–
504 and Nef165–173 but not in the other three epitopes. This demon-
strates selective pressure on multiple epitopes, defined by MHC class I
presentation. Some of the escape variants abolished MHC binding to the
epitopes, whereas others apparently reduced TCR recognition.
INFLUENZA
Price et al. (2000) infected mice with a human isolate of influenza.
These transgenic mice expressed a monoclonal TCR specific for the
influenza nucleoprotein epitope NP366–374, leading to a narrow and
strong CTL response directed against this epitope. This intense selec-
tive pressure favored escape variants in this nine-residue epitope at posi-
tions 5, 6, 7, and 9, each escape variant having only one altered position.
Young et al. (1994) described the structure of the MHC Db molecule
bound to this NP epitope. This structural information allowed Price
et al. (2000) to interpret the substitutions they observed in response to
CTL pressure. Positions 5 and 9 form anchor sites buried in the MHC
binding groove. Three different amino acid replacements at position 5
greatly reduced binding affinity for Db and consequently abrogated CTL
stimulation.
A substitution at position 9 reduced affinity for Db less than 10-fold.
In spite of the relatively small change in binding affinity for MHC, this
substitution also abolished CTL response. Price et al. (2000) cite data to
suggest that peptide processing and transport do not play a role, so the
mechanism of escape by this substitution remains unclear.
14.3 TCR Binding
I continue with the influenza study by Price et al. (2000), which ended
the previous section. I then return to the LCMV experimental system,
which provides the first combined information on structure, binding
affinity, and escape mutations with respect to peptide-MHC interactions
with the TCR.
238 CHAPTER 14
INFLUENZA
The structural study of Young et al. (1994) demonstrated that binding
between MHC Db and the NP366–374 epitope exposes positions 6 and 7.
These exposed positions could potentially interact with the TCR. Haanen
et al. (1999) showed a dominant role for position 7 by tetramer staining
of TCR bound to peptide-MHC complexes. These previous structural
and binding studies did not implicate position 6 as important for TCR
affinity.
Price et al. (2000) observed three substitutions at positions 6 and one
at position 7 that bound to Db with the same affinity as the wild type.
These escape variants avoided binding by the transgenic, monoclonal
CTL.
Price et al. (2000) compared the ability of the wild type and an M→I
substitution at position 6 to stimulate a CTL response in immunocompe-
tent mice with a polyclonal repertoire. The M→I substitution attracted
3–10-fold fewer CTLs than did the wild type. Thus, this substitution at
position 6 that escaped the transgenic monoclonal CTLs did not abolish
polyclonal CTL stimulation. These observations suggest that the total
TCR repertoire includes a set of overlapping specificities with varying
affinity, allowing recognition of the altered ligand.
LCMV
In the section above on MHC binding, I described the V→L substitution
of LCMV at GP35 (P3) that provided escape from transgenic CTLs in ex-
perimental infections of mice (Moskophidis and Zinkernagel 1995). This
substitution did not significantly reduce binding affinity of the GP33–41
epitope for the MHC molecule Db. Moskophidis and Zinkernagel (1995)
concluded that this substitution interfered with stimulation of CTLs by
the peptide-MHC complex.
Tissot et al. (2000) analyzed the structure and affinity of the peptide-
MHC complex bound to the same TCR used by Moskophidis and Zin-
kernagel (1995). The V→L substitution at P3 reduced binding affinity to
the TCR by a factor of 50, even though P3 is buried in the peptide-MHC
binding groove (fig. 14.1). Tissot et al. (2000) suggest that the relatively
bulky leucine reside caused shifting of the structure and a slight move-
ment in residues P2 and P4. The residue at P4 is exposed and had the
strongest effect on binding affinity to the TCR, so movement of P4 could
EXPERIMENTAL EVOLUTION: CTL ESCAPE 239
be responsible for the change in affinity. Escape variants with a Y→F sub-
stitution at P4 obtained during experimental evolution in vivo cause a
100-fold decline in affinity for the TCR.
14.4 Functional Consequences of Escape
Escape substitutions change amino acids in pathogen proteins. Those
changed proteins may have altered performance, affecting pathogen fit-
ness in ways other than CTL escape. Ideally, experimental studies of
escape would provide information about changed functional character-
istics of pathogen proteins and the associated fitness consequences. I
am not aware of any such analyses for CTL escape in experimentally
controlled systems. Two uncontrolled studies provide some clues.
First, Niewiesk et al. (1995) analyzed CTL escape variants of human
T cell leukemia virus (HTLV-1) in naturally infected human hosts. They
focused on the Tax protein, a major target of CTLs. Individuals with
MHC type HLA-A2 simultaneously recognize at least five epitopes of
Tax (Parker et al. 1994). Niewiesk et al. (1995) found that in HLA-A2
subjects, 24 of 179 isolates had substitutions in epitopes presented by
HLA-A2. By contrast, in subjects without HLA-A2, only one of 116 of
these epitopes had a substitution. CTLs appear to be imposing strong
selective pressure that favors escape. Nine different substitutions oc-
curred across the five Tax epitopes. Each substitution abolished CTL
attack of the associated epitope.
HTLV-1 is a retrovirus that integrates itself into the host genome. The
Tax protein is a trans-acting transcriptional regulator that modulates
expression of several viral and cellular genes (Yoshida 2001). Because
HTLV-1 typically occurs as an integrated provirus in host cells, viral
replication occurs by transmission within the lineages of host cells and
by transmission between cells. Tax appears to affect several aspects of
the cell cycle, potentially enhancing cell division and reducing cell death.
Niewiesk et al. (1995) tested the nine observed Tax substitutions for
potency as activators of one viral and two cellular promoters of tran-
scription. Potencies were compared with activation by a consensus se-
quence. Three substitutions had lowered ability to activate the viral
promoter, and all nine substitutions caused lowered or no activation of
two cellular promoters. The fitness consequences of these substitutions
could not be measured directly. In vitro studies introduced mutations

240 CHAPTER 14
into the Tax protein and demonstrated that most mutations abolished
Tax function (Smith and Greene 1990; Semmes and Jeang 1992). Thus,
Tax appears to be highly constrained, suggesting that substitutions ac-
cumulate only under very strong CTL pressure.
A second study analyzed the selective pressure imposed by a drug
(Samri et al. 2000). This study of human patients with HIV compared the
viral reverse transcriptase (RT) protein before and after application of
nucleoside inhibitors of RT. Substitutions in RT that escape drug pres-
sure also reduce viral fitness (Coffin 1995; Back et al. 1996; Harrigan
et al. 1998; Sharma and Crumpacker 1999). Samri et al. (2000) showed
that, on average, drug escape mutants increased CTL recognition, most
likely by enhanced binding to common MHC molecules.
Samri et al.’s (2000) preliminary study raises some interesting prob-
lems. Amino acid sequences of viral proteins may be shaped by two
opposing pressures: contribution to viral function and escape from im-
mune recognition. Thus, amino acid substitutions in response to a third
force, such as a drug, may be likely to reduce protein performance or
enhance recognition by the host immune system. In the case of RT,
both reduced performance and enhanced MHC recognition may have
occurred.
A particular viral sequence reflects the balance between functional
performance and avoidance of CTL recognition via MHC presentation.
Experimentally applied selective pressures such as drugs may provide
information about the functional and immune selective pressures that
shaped the wild-type sequence.
14.5 Kinetics of Escape
Experimental evolutionary studies have not focused on the kinetics
by which escape variants arise and spread within hosts or within popu-
lations. I briefly list six issues.
IMMUNODOMINANCE
The first experimentally controlled studies of escape from CTLs used
extreme immunodominance (Pircher et al. 1990). In that system, ge-
netically constructed mice produced the identical TCR on 75–90% of
circulating T cells. That extreme, monoclonal TCR distribution creates
EXPERIMENTAL EVOLUTION: CTL ESCAPE 241
powerful selection favoring escape mutants for epitopes recognized by
the dominant TCR.
More realistic polyclonal distributions of TCRs may not favor escape
so easily (Borrow and Shaw 1998; Haanen et al. 1999). A single viral
mutation can abrogate recognition of a particular epitope, but the virus
carrying the mutant will likely express other epitopes recognized by dif-
ferent CTLs. By this argument, partial escape means partial recognition
and death.
The degree of immunodominance plays an important role. For some
pathogens and hosts, a typical response may primarily target a single
epitope, with fewer CTLs focusing on subdominant epitopes. In this
case, the pressure on the lead epitope favors escape. Other infections
may have a broader and more even CTL response against several epi-
topes. Escape at one epitope does not alleviate recognition at several
other epitopes. However, escape at multiple epitopes may be observed
within individual hosts (Evans et al. 1999). The role of immunodomi-
nance in escape depends on the rate of killing by CTLs relative to the
rate of viral transmission between cells (McMichael and Phillips 1997;
Nowak and May 2000).
RATE OF KILLING VERSUS RATE OF TRANSMISSION
Consider a cytopathic virus—one that bursts its host cell when lib-
erating progeny virions. A CTL escape mutant gains if it enhances the
probability of cellular burst before CTL-mediated death. This probabil-
ity depends on the race between the CTLs to kill infected cells and the
viruses to liberate progeny. Escape at a dominant epitope provides ben-
efit if the aggregate rate of killing via subdominant epitopes allows a
higher probability of burst before death.
Noncytopathic viruses leak progeny virions from intact host cells.
Here the race occurs between, on the one hand, CTL-induced death and,
on the other hand, the time before the first viral progeny release and
then the subsequent rate of progeny production. CTL escape has no
benefit if pressure on other epitopes still kills before initial progeny
production. If some infected cells survive to produce new virions, the
benefit of escape at one epitope depends on the expected increase in
cellular longevity during the productive phase of virion release and the
probability that released viruses transmit to new host cells.
242 CHAPTER 14
The roles of these different rate processes could be combined into
a mathematical model by extending the approach of Nowak and May
(2000). Experimental control over TCR diversity, CTL intensity, and com-
parison of cytopathic and noncytopathic viruses could provide tests of
the mechanistic processes contained in the mathematical formulation.
MULTIPLICITY OF INFECTION
Higher multiplicity of infection may reduce the rate at which escape
mutants spread (McMichael and Phillips 1997). Suppose two viruses
infect a host cell. One virus expresses an escape mutant that avoids
recognition by the dominant CTLs, whereas the other virus expresses the
common epitope recognized by the dominant CTLs. This dually infected
cell presents the common epitope on its surface, making it susceptible
to recognition by CTLs. The escape mutant benefits only to the extent
that fewer recognized peptides occur on the cell surface—lower density
may reduce the rate of killing, and that reduction may in turn allow more
of the escape variant’s progeny to be transmitted.
DOSAGE AND POPULATION SIZE WITHIN HOSTS
In experimental studies, escape mutants arise more often as infecting
dose increases (Pircher et al. 1990). At low doses, the host clears infec-
tion before escape mutants spread. Higher dose most likely produces
larger population size during the initial viremia, increasing the time and
the number of pathogens available to make a particular mutant.
Experimental manipulations could test the contributions of dosage,
pathogen population size within the host, and time to clearance. Wait-
ing time for an escape mutant also depends on the mutation rate, which
could perhaps be varied by comparing genotypes that differed in muta-
tion rate.
RATE OF CLEARANCE AND TRANSMISSION BETWEEN HOSTS
Rapidly cleared infections provide little opportunity for the transmis-
sion of escape variants. Such variants spread within hosts only after
intense CTL pressure begins. If the infection clears rapidly, then the
potential escape variants do not increase sufficiently within the host to
contribute significantly to transmission to other hosts.
EXPERIMENTAL EVOLUTION: CTL ESCAPE 243
MHC POLYMORPHISM AND TRANSMISSION BETWEEN HOSTS
CTL escape may depend on reduced binding to an MHC molecule or
on changed affinity between TCRs and the peptide-MHC complex. Hosts
vary in the highly polymorphic MHC alleles. Escape from one host’s MHC
binding does not provide protection if most other hosts carry different
MHC alleles. Long-term spread of an MHC escape variant depends on
the frequency at which viruses encounter the particular MHC molecule
and the intensity of forces against the escape variant. Such countering
forces include creation of new sequences that bind well to different MHC
molecules and functional attributes that affect the performance of the
viral protein.
Further insight may be gained by multiple passage experiments. Vi-
ruses could be passed through a sequence of hosts with either the same
or varying MHC genotypes. The changing frequencies of amino acid
substitutions could be tracked under different regimes of fluctuating
selection.
14.6 Problems for Future Research
1. Immunodominance and timing of epitope expression. Infected
cells express different pathogen proteins at different times. Proteins
expressed relatively early may be more likely to attract a dominant CTL
response because they occur on the cell surface for longer periods of
time. The role of timing could be studied in the following experimental
evolution design.
Create a host with a biclonal TCR repertoire focused on two different
pathogen epitopes, one expressed early and the other expressed late.
Also create two different hosts with monoclonal TCRs, one focused on
the early epitope and the other focused on the late epitope. Finally,
create a host immunodeficient in CTL response. Infect the four differ-
ent host types with cloned genotypes of a pathogen. If early expressed
epitopes attract stronger CTL responses, then the biclonal host should
induce fewer escape substitutions in the late expressed epitope than the
monoclonal host focused on the late epitope. The relative escape rates
in the monoclonal hosts focused on early and late epitopes calibrate es-
cape rates in the absence of competition between epitopes.

244 CHAPTER 14
A similar design may be accomplished by using different host MHC
genotypes to turn on or off the pressure on epitopes expressed at dif-
ferent times.
2. Immunodominance and probability of escape. Pressure from a sin-
gle kind of MAb often gives rise to antibody escape mutants. By contrast,
simultaneous pressure from two or more MAbs can prevent spread of es-
cape substitutions because a pathogen needs to escape simultaneously
from multiple killing agents. A similar experiment can be developed for
CTLs by using different MHC host genotypes. In experimental evolution
studies, hosts that can effectively present a broader variety of epitopes
should restrict the spread of escape substitutions relative to hosts with
narrower presentation.
3. Performance versus avoiding MHC recognition. Substitutions that
avoid MHC recognition may reduce other components of fitness. This
hypothesis can be tested by evolving pathogens in different regimes of
MHC-mediated selection and then competing the evolved pathogens to
determine relative fitness. In this design, one starts with a cloned patho-
gen genotype. Some lineages can be passaged in a sequence of hosts with
the same MHC genotype, others in hosts with varying MHC genotypes,
and controls in hosts immunodeficient for CTL response. Competition
between various pairs of evolved pathogens can be used to estimate the
fitness costs of substitutions that avoid MHC recognition.
Some sites may have the potential to abrogate MHC recognition but
fail to acquire escape substitutions during experimental evolution. Non-
varying sites may identify key functional residues. This can be tested
by site-directed mutagenesis.
4. Spread of TCR escape substitutions between hosts. Klenerman and
Zinkernagel (1998) demonstrated original antigenic sin of TCR escape
mutants in LCMV. To simplify a bit, suppose epitope B is a TCR escape
variant derived from epitope A. If a host is first exposed to epitope
A, subsequent exposure to epitope B tends to reinforce the response
against epitope A. Similarly, hosts initially exposed to B, then challenged
with A, enhance their response to the first epitope, B. Thus, memory
tends to recall TCRs to previous, cross-reacting epitopes.
This memory effect may influence the spread of TCR escape substitu-
tions within a population. To study the evolutionary consequences, an
experimental evolution design could follow the fate of particular substi-

EXPERIMENTAL EVOLUTION: CTL ESCAPE 245
tutions through serial passage in hosts with various histories of prior
exposure. For example, what sort of evolutionary response would occur
in a series of hosts each previously exposed to epitope A? Each previ-
ously exposed to epitope B? What about a sequence of hosts with varying
exposure histories?
5. Altered peptide ligands. The affinity and kinetics of TCR binding to
peptide-MHC ligands influences regulatory control of CTL clones (Davis
et al. 1998; Germain and Štefanová 1999). Variant epitopes present al-
tered peptide ligands (APLs) to the TCR. It may be that APLs can inter-
fere with CTL attack by preventing expansion of CTLs with matching
TCR specificities. Experimental evolution may favor APLs that interfere
with CTL attack. APL variants could be measured for binding proper-
ties to TCRs (Tissot et al. 2000) and tendency to spread under various
experimental conditions.
6. Dependence of TCR escape on TCR germline genes. Germline genes
recombine to make diverse TCRs. The role of the germline genotype in
the TCR repertoire could be studied by selecting for TCR escape mutants
in hosts with different TCR germline genotypes.
7. Laboratory adaptation. Experimental evolution creates adaptations
to the particular in vitro or in vivo laboratory conditions. These con-
ditions only partially reflect selection in the wild. Laboratory studies
provide an opportunity to relate biochemical mechanism to kinetics,
and kinetics to fitness. Mathematical models aid the controlled, experi-
mental dissection of these relations (Nowak and May 2000). Controlled
analysis must be complemented by study of variation and adaptation in
natural isolates. The next chapter discusses aspects of natural variation.
15 Measuring Selectionwith Population Samples
Experimental evolution provides insight into kinetic and mechanistic as-
pects of parasite escape from host immunity. Such experimental studies
clarify selective forces that influence change at certain amino acid sites.
But experimental studies provide only a hint of what actually occurs in
natural populations, in which selective pressures and evolutionary dy-
namics differ significantly from those in controlled laboratory studies.
It is important to combine experimental insights with analyses of vari-
ation in natural populations. In this chapter, I discuss how population
samples of nucleotide sequences provide information about natural se-
lection of antigenic variation.
I focus on themes directly related to the goal of this book—the syn-
thesis between different kinds of biological analyses. In particular, I
show how analysis of population samples complements studies of mo-
lecular structure and experimental evolution. Several books and articles
review the methods to analyze population samples and the many differ-
ent types of applications (Kimura 1983; Nei 1987; Nee et al. 1995; Hillis
et al. 1996; Li 1997; Page and Holmes 1998; Crandall 1999; Hughes
1999; Nei and Kumar 2000; Otto 2000; Rodrigo and Learn 2000; Yang
and Bielawski 2000; Bush 2001; Overbaugh and Bangham 2001).
The first section describes how different kinds of natural selection
cause different patterns of nucleotide substitutions. Thus, the pattern of
nucleotide substitutions observed in a population sample of sequences
can sometimes be used to infer the kind of selection. The simplest pat-
tern concerns the number of nucleotide changes that cause an amino
acid substitution (nonsynonymous) relative to the number of nucleotide
changes that do not cause an amino acid substitution (synonymous). If
natural selection does not affect the relative success of amino acid vari-
ants, then nonsynonymous and synonymous nucleotide substitutions
occur at the same rate. An excess of nonsynonymous substitutions sug-
gests that natural selection favored those changes, providing evidence
for positive selection of amino acid replacements.
The second section presents two examples of positive selection on
parasite antigens. The surface antigen Tams1 of the protozoan Theileria

MEASURING SELECTION 247
annulata induces a strong antibody response in cattle, its primary host.
A sample of nucleotide sequences showed that strong positive selection
occurred in a few small regions of the Tams1 antigen, suggesting that
those regions have been under strong selection for escape from host
immunity. The group A streptococci cause sporadic epidemics of “strep
throat.” Streptococcal inhibitor of complement (Sic) is the most variable
protein of these bacteria. In a sample of 892 nucleotide sequences, 77 of
86 nucleotide changes caused amino acid substitutions, a large excess
of nonsynonymous substitutions. Very strong natural selection by host
antibodies apparently drives rapid change in Sic.
The third section continues with more examples of positive selec-
tion on parasite antigens. These examples improve on earlier studies
by estimating the rates of synonymous and nonsynonymous nucleotide
changes for each individual amino acid. This is important because an
epitope often requires only one or two amino acid changes to escape
from binding by a specific antibody or T cell. Identification of particular
amino acid sites under strong selection can confirm predictions for the
location of epitopes based on structural data and experimental anal-
ysis of escape mutants. Positively selected sites can also suggest the
location of new epitopes not found by other methods and provide clues
about which amino acid variants should be included in multicomponent
vaccines.
The fourth section turns to recent studies of influenza A that corre-
late amino acid changes at positively selected sites with the subsequent
success of the lineage. This correlation between substitutions and fit-
ness provides an opportunity to predict future evolution—new variants
arising at positively selected sites are predicted to be the progenitors of
future lineages. Yearly influenza A isolates from 1983 to 1997 provided
sequences on which to test this prediction method retrospectively. In
nine of eleven years, the changes at positively selected sites predicted
which lineage would give rise to the future influenza population.
The final section highlights some topics for future research.
15.1 Kinds of Natural Selection
Different kinds of natural selection leave different patterns of nu-
cleotide substitutions. These patterns can be observed in a sample of

248 CHAPTER 15
sequences isolated from a population, allowing one to infer the type of
selection.
SYNONYMOUS AND NONSYNONYMOUS NUCLEOTIDE SUBSTITUTIONS
The genetic code maps three sequential nucleotides (a codon) to a
single amino acid or to a stop signal. The four different nucleotides
combine to make 43 = 64 different codons. The 64 codons specify 20
different amino acids plus a stop signal, leading to an average of 64/21 ≈3 different codons for each amino acid or stop signal. This degenerate
aspect of the code means that some nucleotide substitutions do not
change the encoded amino acid or stop signal.
Nucleotide substitutions that do not cause an amino acid change are
called synonymous; those that do change the encoded amino acid are
called nonsynonymous. Synonymous substitutions do not affect the
amino acid sequence and therefore should not be affected by natural
selection of phenotype. By contrast, nonsynonymous substitutions can
be affected by selection because they do change the encoded protein.
If there is no selection on proteins, then the same forces of mutation
and random sampling influence all nucleotide changes, causing the rate
of nonsynonymous substitutions, dN , to equal the rate of synonymous
substitutions, dS (Nei 1987; Li 1997; Page and Holmes 1998).
POSITIVE AND NEGATIVE SELECTION
When natural selection favors change in amino acids, the nonsynony-
mous substitution rate dN rises. Thus, dN > dS measured in a sam-
ple of sequences implies that natural selection has favored evolutionary
change. This contribution of selection to the rate of amino acid change
above the background measured by dS is called positive selection. Par-
asite epitopes often show signs of positive selection as they change to
escape recognition by host immunity (Yang and Bielawski 2000).
By contrast, negative selection removes amino acid changes, preserv-
ing the amino acid sequence against the spread of mutations. Nega-
tive selection reduces the nonsynonymous substitution rate, causing
dN < dS .
The great majority of sequences show negative selection, suggesting
that most amino acid replacements are deleterious and are removed by
natural selection. In cases where positive selection does occur, the non-
MEASURING SELECTION 249
synonymous replacements often cluster on protein surfaces involved
in some sort of specific recognition. In these positively selected pro-
teins, amino acid sites structurally hidden from external recognition of-
ten show the typical signs of negative selection (see references in the
introduction to this chapter).
FREQUENCY-DEPENDENT SELECTION
A rare antigenic variant has an advantage because it avoids immune
memory in hosts induced by more common variants. This is an example
in which the success of an allele depends on its frequency, a kind of
frequency-dependent selection (Conway 1997).
Selection favoring rare types can cause two different patterns of evo-
lutionary change. First, transient polymorphisms may arise, in which
novel variants increase when rare and eventually dominate the popula-
tion, driving out the previous variants. This reduces genetic variation at
all nucleotide sites linked to the favored substitution.
Second, balanced polymorphisms may occur, in which rare variants
increase but then are held in check as they rise in frequency. This pro-
tects genetic variants from extinction because they rise when rare but
decline when common. Nucleotide sites linked to those sites under se-
lection also enjoy protection against extinction because they receive a
selective boost whenever they become rare. This increases genetic varia-
tion at all nucleotide sites linked to the site under selection. Thus, tran-
sient polymorphisms decrease genetic variation in sequences linked to
a favored site, and balanced polymorphisms increase genetic variation
in sequences linked to a favored site.
15.2 Positive Selection to Avoid Host Recognition
Many examples of positive selection come from genes involved in
host-parasite recognition (Endo et al. 1996; Hughes 1999; Yang and
Bielawski 2000). These sequence analyses provide information about
how selection has shaped the structure and function of proteins. For
example, one may combine analysis of positive selection with structural
data to determine which sites are exposed to antibody pressure. In the
absence of structural data, sequences can be used to predict which sites
are structurally exposed and can change and which sites are either not
250 CHAPTER 15
exposed or functionally constrained. I briefly summarize a few cases in
this section.
THEILERIA ANNULATA
The tick-borne protozoan Theileria annulata causes disease in cattle
(Gubbels et al. 2000). The surface antigen Tams1 induces a strong an-
tibody response and has been considered a candidate for developing a
vaccine. However, Tams1 varies antigenically; thus studies have focused
on the molecular nature of the variability to gain further insight. The
structure and function of Tams1 have not been determined.
Recently, Gubbels et al. (2000) analyzed a population sample of nu-
cleotide sequences to predict which domains of Tams1 change in re-
sponse to host immunity and which domains do not vary because of
structural or functional constraints. They found seven domains with
elevated rates of nonsynonymous substitutions compared with synony-
mous substitutions (fig. 15.1), suggesting that these regions may be ex-
posed to antibody pressure. Some domains had relatively little nonsyn-
onymous change, indicating that structural or functional constraints
preserve amino acid sequence. These inferences provide guidance in
vaccine design and point to testable hypotheses about antigenicity and
structure.
GROUP A STREPTOCOCCI
Group A streptococci (GAS) infect the upper respiratory tract of hu-
mans, causing “strep throat.” GAS epidemics develop quickly and typic-
ally last one to three years (Martin and Single 1993; Muotiala et al. 1997).
Streptococcal inhibitor of complement (Sic) is the most variable protein
of GAS (Hoe et al. 1999). This extracellular protein interferes with the
host’s complement system of immunity, a key defense against invading
bacteria.
Hoe et al. (1999) sequenced the sic gene in 892 GAS isolates. These
sequences had insertions, deletions, and nonsynonymous substitutions
that encode 158 variant Sic proteins. Of the single nucleotide changes,
77 of 86 caused amino acid substitutions (nonsynonymous), demon-
strating strong positive selection.
Figure 15.2 shows the phylogenetic relationship between sequences
from Ontario, Canada, in 1996. Most variants could be linked to each

MEASURING SELECTION 251
0 100 200 300 400 500 600 700 800
100
80
60
40
20
0
Nucleotide position at start of sliding window
Perc
ent
of
max
imum
sco
re
Figure 15.1 The seven peaks identify the major regions of positive selection inthe Tams1 protein. The eighteen sequences analyzed in this figure have about870 nucleotides. The analysis focused on a sliding window (Endo et al. 1996)of 60 nucleotides (20 amino acids). For each window shown on the x axis, thenumbers of nonsynonymous and synonymous nucleotide substitutions werecalculated by comparing the eighteen sequences. The y axis shows the strengthof positive selection measured as follows. For each window of 60 nucleotides,each pair of sequences was compared. Each paired comparison was scoredfor the statistical significance of positive selection based on the numbers ofnonsynonymous and synonymous changes between the pair, with a score ofzero for nonsignificant, a score of one for significant, and a score of two forhighly significant. The maximum score is twice the number of comparisons;the actual score is the sum of significance values for each comparison; and thepercentage of the maximum is the actual divided by the maximum multipliedby 100. From Gubbels et al. (2000), with permission of Elsevier Science.
other by a small number of changes, as shown in the figure. The starlike
shape of the phylogeny suggests that the isolates diverged rapidly from
a common ancestor during the course of the local epidemic. This rapid
divergence implies very strong selection for change, most likely caused
by escape from host antibodies (Hoe et al. 1999).
15.3 Phylogenetic Analysis of Nucleotide Substitutions
Initial studies of selection often used small numbers of sequences,
typically fewer than one hundred. Small sample sizes required aggre-
gating observations across all nucleotide sites to gain sufficient statis-
tical power. Conclusions focused on whether selection was positive,
negative, or neutral when averaged over all sites. With slightly larger
samples, one could do a sliding window analysis as in figure 15.1 to in-
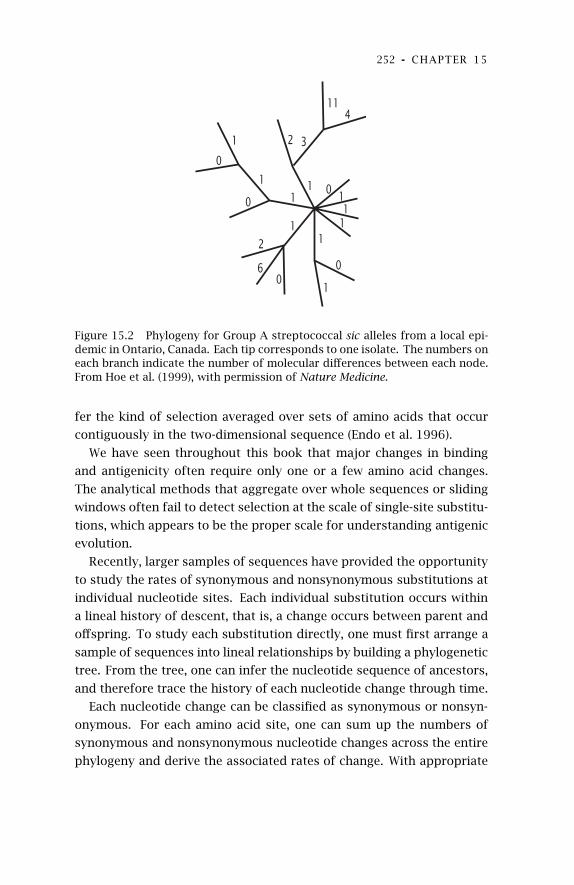
252 CHAPTER 15
114
321
11111
11
1
1
0
00
0
0
2
6
Figure 15.2 Phylogeny for Group A streptococcal sic alleles from a local epi-demic in Ontario, Canada. Each tip corresponds to one isolate. The numbers oneach branch indicate the number of molecular differences between each node.From Hoe et al. (1999), with permission of Nature Medicine.
fer the kind of selection averaged over sets of amino acids that occur
contiguously in the two-dimensional sequence (Endo et al. 1996).
We have seen throughout this book that major changes in binding
and antigenicity often require only one or a few amino acid changes.
The analytical methods that aggregate over whole sequences or sliding
windows often fail to detect selection at the scale of single-site substitu-
tions, which appears to be the proper scale for understanding antigenic
evolution.
Recently, larger samples of sequences have provided the opportunity
to study the rates of synonymous and nonsynonymous substitutions at
individual nucleotide sites. Each individual substitution occurs within
a lineal history of descent, that is, a change occurs between parent and
offspring. To study each substitution directly, one must first arrange a
sample of sequences into lineal relationships by building a phylogenetic
tree. From the tree, one can infer the nucleotide sequence of ancestors,
and therefore trace the history of each nucleotide change through time.
Each nucleotide change can be classified as synonymous or nonsyn-
onymous. For each amino acid site, one can sum up the numbers of
synonymous and nonsynonymous nucleotide changes across the entire
phylogeny and derive the associated rates of change. With appropriate

MEASURING SELECTION 253
statistics, one determines for each amino acid site whether nonsynony-
mous changes occur significantly more or less often than synonymous
changes (Hasegawa et al. 1993; Wakely 1993; Bush et al. 1999; Meyer
et al. 1999; Suzuki and Gojobori 1999; Yang and Bielawski 2000; Bush
2001).
The concepts of measuring positive and negative selection remain the
same. However, for the first time, the statistical power has been raised
to the point where analysis of population samples provides significant
insight into the evolution of antigens. The power derives from studying
the relative success of alternate amino acids at a single site. Important
selective forces include the amino acids at other sites as well as binding
properties to host immune molecules and other host receptors.
HIV
Yamaguchi-Kabata and Gojobori (2000) analyzed selection on indi-
vidual amino acid sites in gp120, the major exposed glycoprotein on
the HIV-1 envelope. gp120 contains the primary host-cell receptor that
binds to the host’s CD4 molecules on the surfaces of various immune
cells. gp120 also has the secondary host-cell receptor that binds either
the host’s CCR5 or CXCR4 molecules—the viral binding specificity for
these second receptors determines the kinds of host immune cells in-
fected by the virus. gp120 carries major antibody epitopes as well as
CTL epitopes.
Yamaguchi-Kabata and Gojobori (2000) studied amino acid variations
at 422 sites in 186 sequences of HIV-1 subtype B. Significant positive se-
lection occurred at 33 sites, and significant negative selection occurred
at 63 sites. As with most proteins, negative selection or no apparent
selection dominated over the whole sequence, with positive selection
limited to a minority of sites.
Previous work had split the linear amino acid sequence into five vari-
able and five constant domains based on the inferred tendency for ge-
netic variation in each region (Modrow et al. 1987). The variable domains
mostly occur in exposed loops, whereas the constant regions mostly oc-
cur in a core that may be partly protected.
Yamaguchi-Kabata and Gojobori (2000) found that, when analyzing
selection on individual amino acids, sites in the variable domains did
have a relatively greater tendency to be positively rather than negatively
254 CHAPTER 15
selected. By contrast, those sites in the constant domains had a rela-
tively greater tendency to be negatively rather than positively selected.
However, many positively selected sites occurred in the constant do-
mains.
Yamaguchi-Kabata and Gojobori (2000) focused on individual sites
with regard to location on the three-dimensional structure and in rela-
tion to potential selective pressures. For example, fifteen of the thirty-
three positively selected sites clustered on the face of the gp120 core
opposite the CD4 binding site. Seven of these sites occurred in posi-
tions 335–347, which form an α-helix that is alternately exposed on the
surface and hidden in the core. The positively selected sites occurred
at exposed positions, whereas three of the interior sites were highly
conserved although they lacked elevated ratios of synonymous to non-
synonymous substitutions.
The other positively selected sites in this region also occurred on the
exposed surface near the 335–347 α-helix. These other sites had dis-
persed sequence locations ranging from positions 291 to 446 that are
brought together in the three-dimensional structure. Yamaguchi-Kabata
and Gojobori (2000) propose that this cluster of fifteen positively se-
lected sites may form discontinuous epitopes. Previously, this partially
recessed region was not considered a key location for antibody binding.
FOOT-AND-MOUTH DISEASE VIRUS
Haydon et al. (2001) analyzed selection on individual amino acid sites
of foot-and-mouth disease virus. Most sites showed mild to strong nega-
tive selection, as usually occurs. At seventeen sites they found evidence
of significant positive selection. Twelve of these positively selected sites
occurred at positions that had previously been observed to develop es-
cape mutants in experimental evolution studies that imposed pressure
by monoclonal antibodies. The other five sites indicate candidates for
further experimental analysis.
Haydon et al.’s (2001) study of natural isolates gives further evidence
that a small number of amino acid sites determines a large fraction of
antigenic evolution to escape antibody recognition. The combination of
analyses on structure, experimental evolution, and natural variation pro-
vide an opportunity to study how complex evolutionary forces together
determine the evolutionary dynamics of particular amino acids.
MEASURING SELECTION 255
15.4 Predicting Evolution
The studies on positive selection in the previous section could not cor-
relate amino acid substitutions with the actual success of the viruses. In
each case, selection was inferred strictly from the patterns of nucleotide
substitutions in a sample of sequences.
Bush et al.’s (1999) study of influenza takes the next step by associ-
ating particular amino acid substitutions with the success or failure of
descendants that carry the substitutions. Influenza allows such studies
because sequences have been collected each year over the past several
decades, providing a history of which substitutions have led to success
over time.
The influenza data can be used to predict future evolution by two
steps. First, previous patterns of substitutions and the successes of as-
sociated lineages suggest which amino acid sites contain variants that
enhance fitness. Second, new variants arising at those key sites are pre-
dicted to be the progenitors of future lineages.
THE SHAPE OF PHYLOGENIES
Predicting evolution based on amino acid substitutions requires a cor-
relation between substitutions and the success of lineages. Many para-
sites do not have such broad-scale correlations. For example, figure 15.2
shows a star-shaped phylogeny for streptococcal divergence. This kind
of phylogeny retains multiple, diverging lineages along several branches.
Although selection may guide the relative success of different substitu-
tions within a lineage, the lineages along different branches apparently
do not compete. Thus, one cannot use particular substitutions to pre-
dict which lineages will eventually dominate the future population.
HIV-1 also has multiple diverging lineages that create star-shaped
phylogenies (fig. 15.3). This makes sense because HIV-1 currently forms
an expanding population with little competition between lineages. Many
different lineages continue to spread to naive hosts that have no prior
immune memory of infection. Thus, at the population level, immune
pressure does not favor one lineage over another by amino acid substi-
tutions that escape widely dispersed immune memory in hosts.
In the HIV-1 phylogeny, the different subtypes coalesce to a common
ancestor that probably occurred near the origin of the HIV-1 epidemic
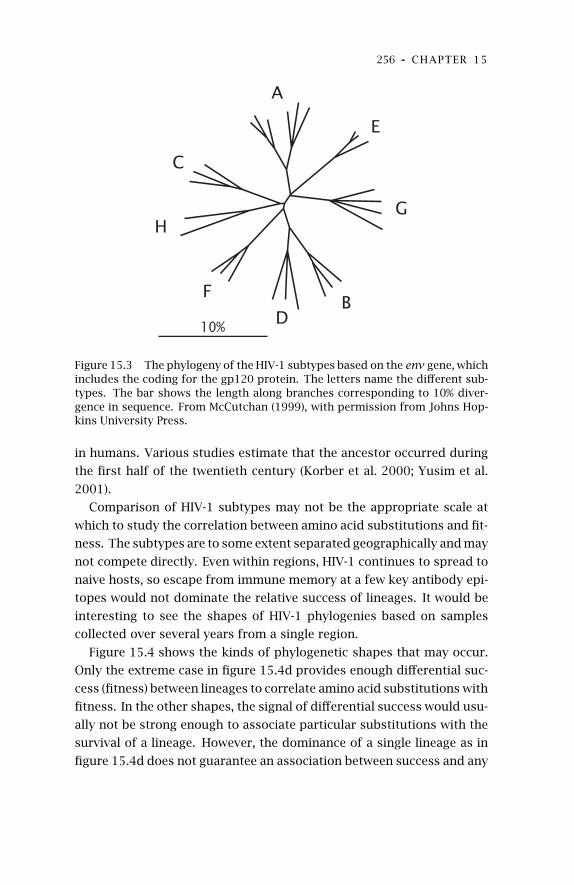
256 CHAPTER 15
C
A
E
G
BD
F
H
10%
Figure 15.3 The phylogeny of the HIV-1 subtypes based on the env gene, whichincludes the coding for the gp120 protein. The letters name the different sub-types. The bar shows the length along branches corresponding to 10% diver-gence in sequence. From McCutchan (1999), with permission from Johns Hop-kins University Press.
in humans. Various studies estimate that the ancestor occurred during
the first half of the twentieth century (Korber et al. 2000; Yusim et al.
2001).
Comparison of HIV-1 subtypes may not be the appropriate scale at
which to study the correlation between amino acid substitutions and fit-
ness. The subtypes are to some extent separated geographically and may
not compete directly. Even within regions, HIV-1 continues to spread to
naive hosts, so escape from immune memory at a few key antibody epi-
topes would not dominate the relative success of lineages. It would be
interesting to see the shapes of HIV-1 phylogenies based on samples
collected over several years from a single region.
Figure 15.4 shows the kinds of phylogenetic shapes that may occur.
Only the extreme case in figure 15.4d provides enough differential suc-
cess (fitness) between lineages to correlate amino acid substitutions with
fitness. In the other shapes, the signal of differential success would usu-
ally not be strong enough to associate particular substitutions with the
survival of a lineage. However, the dominance of a single lineage as in
figure 15.4d does not guarantee an association between success and any
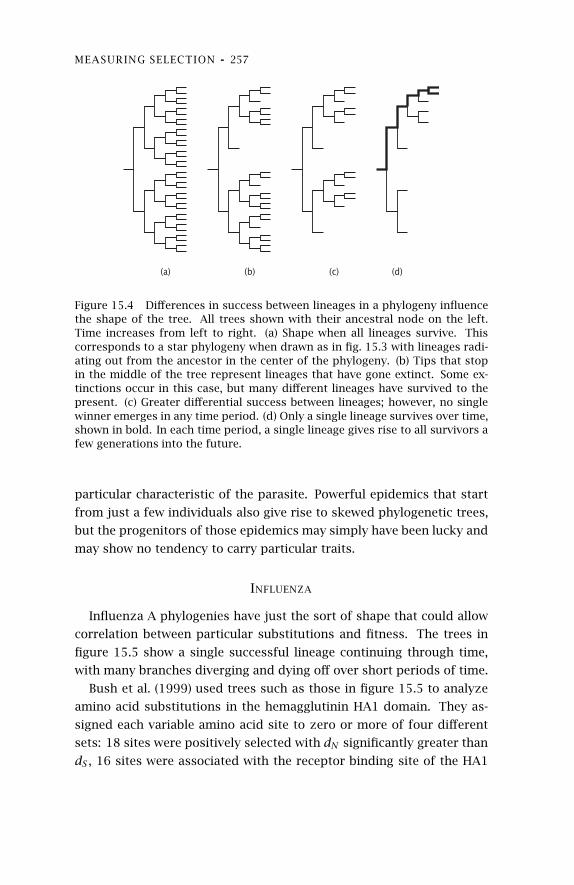
MEASURING SELECTION 257
(a) (b) (c) (d)
Figure 15.4 Differences in success between lineages in a phylogeny influencethe shape of the tree. All trees shown with their ancestral node on the left.Time increases from left to right. (a) Shape when all lineages survive. Thiscorresponds to a star phylogeny when drawn as in fig. 15.3 with lineages radi-ating out from the ancestor in the center of the phylogeny. (b) Tips that stopin the middle of the tree represent lineages that have gone extinct. Some ex-tinctions occur in this case, but many different lineages have survived to thepresent. (c) Greater differential success between lineages; however, no singlewinner emerges in any time period. (d) Only a single lineage survives over time,shown in bold. In each time period, a single lineage gives rise to all survivors afew generations into the future.
particular characteristic of the parasite. Powerful epidemics that start
from just a few individuals also give rise to skewed phylogenetic trees,
but the progenitors of those epidemics may simply have been lucky and
may show no tendency to carry particular traits.
INFLUENZA
Influenza A phylogenies have just the sort of shape that could allow
correlation between particular substitutions and fitness. The trees in
figure 15.5 show a single successful lineage continuing through time,
with many branches diverging and dying off over short periods of time.
Bush et al. (1999) used trees such as those in figure 15.5 to analyze
amino acid substitutions in the hemagglutinin HA1 domain. They as-
signed each variable amino acid site to zero or more of four different
sets: 18 sites were positively selected with dN significantly greater than
dS , 16 sites were associated with the receptor binding site of the HA1
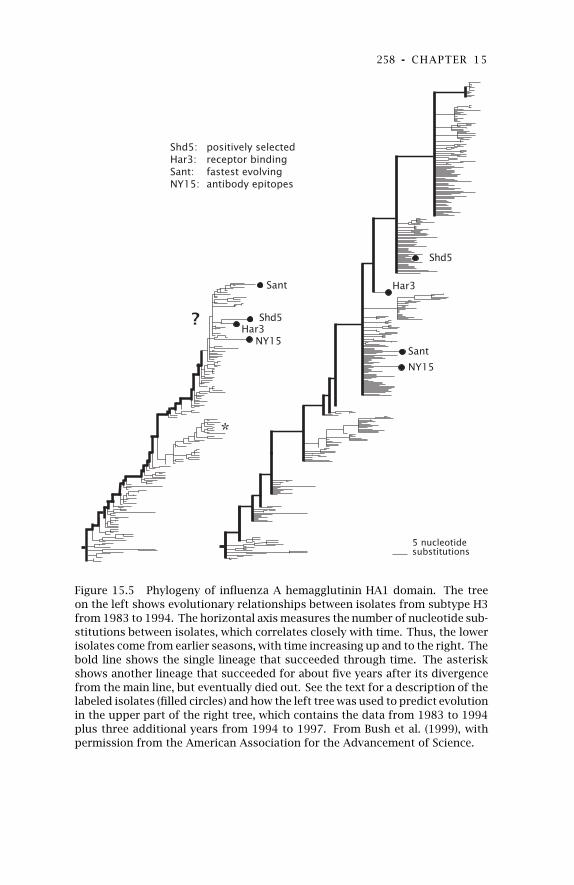
258 CHAPTER 15
? Shd5
NY15
Sant
Har3
5 nucleotidesubstitutions
Shd5: positively selectedHar3: receptor bindingSant: fastest evolvingNY15: antibody epitopes
*
NY15
Sant
Har3
Shd5
Figure 15.5 Phylogeny of influenza A hemagglutinin HA1 domain. The treeon the left shows evolutionary relationships between isolates from subtype H3from 1983 to 1994. The horizontal axis measures the number of nucleotide sub-stitutions between isolates, which correlates closely with time. Thus, the lowerisolates come from earlier seasons, with time increasing up and to the right. Thebold line shows the single lineage that succeeded through time. The asteriskshows another lineage that succeeded for about five years after its divergencefrom the main line, but eventually died out. See the text for a description of thelabeled isolates (filled circles) and how the left tree was used to predict evolutionin the upper part of the right tree, which contains the data from 1983 to 1994plus three additional years from 1994 to 1997. From Bush et al. (1999), withpermission from the American Association for the Advancement of Science.
MEASURING SELECTION 259
surface, 20 sites evolved relatively faster than the other sites, and 41
sites were in or near the well-known antibody epitope domains A and B.
Suppose amino acid changes in one of the four sets consistently cor-
related with the ultimate success of a lineage. Then, at any time, one
could predict which of the currently circulating isolates would be most
closely related to the progenitor of future lineages. In particular, those
lineages with the most amino acids that had recently changed at the key
sites would be most likely to succeed. In influenza, success probably
occurs by escaping the host’s immunological antibody memory caused
by recent epidemics.
Variant sites near key antibody epitopes would be good candidates
to produce antibody escape. However, Bush et al. (1999) found that the
variant amino acids at positively selected sites provided the best infor-
mation about future success. In other words, those sites with amino acid
replacements favored by selection in the past also provided the best in-
formation about which amino acid changes would lead to success in the
future.
Bush et al. (1999) did not truly predict future evolution. Instead, they
used data from 1983 to 1997 to form eleven retrospective tests. A ret-
rospective test analyzed data from 1983 to year x and predicted subse-
quent evolution in the years following x, where x varied between 1986
and 1997.
Figure 15.5 shows the structure of one retrospective comparison. The
left tree contains data from 1983 to 1994. The bold line along the left
marks the single dominant “trunk” lineage. At the question mark, just
before 1994, the data can no longer resolve the trunk lineage because
several variants cocirculated at that time and the trunk can be resolved
only after one knows which of those lineages succeeded.
The filled circles show four isolates from 1994 that represented the
four classifications for variable amino acids. Shd5 (A/Shangdong/5/94)
represented the lineage with the greatest number of recent amino acid
changes at sites that had been positively selected in the past, as inferred
from the 1983–1997 data. The Har3 (A/Harbin/3/94) lineage had variant
amino acids near the receptor binding site. The Sant (A/Santiago/7198/
94) lineage had variant amino acids at those sites that had evolved rap-
idly in the past. The NY15 (A/New York/15/94) lineage had variant sites
in or near antibody epitopes A and B.

260 CHAPTER 15
The right tree includes additional data from 1994 to 1997. Those data
show which of the 1994 lineages succeeded and which died out. Suc-
cessful prediction means choosing the isolate closest on the tree (most
alike genetically) with the lineage that continues along the trunk and
gives rise to the future population. It turned out that Shd5 was closest
to the successful trunk lineage among the candidates. In other words,
the most changes in previously positively selected sites predicted which
lineage succeeded in subsequent years.
Bush et al. (1999) reported a systematic analysis of retrospective tests
in eleven years. In nine of those eleven years, the lineage that contained
the most changes relative to its ancestor at the eighteen positively se-
lected sites identified the section of the tree from which the future trunk
emerged. The sites in the antibody epitopes only identified seven of
eleven trunk lineages, and the other amino acid sets did worse. Thus,
positive selection provided the best signal for which amino acid changes
correlated most closely with fitness.
FOOT-AND-MOUTH DISEASE VIRUS
Feigelstock et al. (1996) sequenced foot-and-mouth disease virus iso-
lates from a 1993–94 epidemic in Argentina. The epidemic strains con-
tained amino acid replacements at a small number of sites that had
previously been identified as crucial for escape from monoclonal anti-
bodies. Feigelstock et al. (1996) suggested a prediction method similar
to the one used by Bush et al. (1999): identify those few key amino acid
sites that correlate with fitness, then predict that lineages with changes
at those sites will be likely candidates to spread in the future.
Feigelstock et al. (1996) chose sites by previous reports of escape from
monoclonal antibodies in experimental evolution. Bush et al. (1999)
chose sites by analysis of positive selection from population samples.
It would be interesting to compare these two methods in a single study
of the same evolving parasite population.
15.5 Problems for Future Research
1. Episodic selection. Bush et al. (1999) found eighteen amino acid
sites under positive selection in subtype H3 of influenza A. Substitutions
at these positively selected sites correlated with the future success of

MEASURING SELECTION 261
lineages during the years of sampling, 1983–1997. In the future, will
these eighteen sites continue to be the primary target of selection?
On the one hand, the eighteen sites may indeed be the most important
for escape from protective antibodies. If so, future samples will continue
to find positive selection focused on these sites. On the other hand,
different sites may dominate in the future, with little future selective
change in the currently positively selected sites. A changing focus of
selection may arise from evolving structural features of the viral surface
that expose or hide different sites or from a changed distribution in the
immune memory profiles of hosts.
If episodic selection frequently occurs, then the time scale over which
one studies substitution patterns plays a critical role in inference. Sim-
ply measuring aggregate rates of synonymous and nonsynonymous sub-
stitutions may turn out to be a rather crude tool that misses a large
proportion of the changes brought about by natural selection. As more
data accumulate, it will become important to match statistical methods
with explicit hypotheses about the biological processes of selection and
the temporal scale over which selection varies.
2. Kinds of selection detectable from standard analyses of population
samples. Influenza has certain characters that make it a particularly
good model for simple analysis of positive selection. Epidemic strains
often have wide distribution; thus, there is relatively less spatial varia-
tion in the exposure of hosts to different strains than for many other
parasites. The wide and relatively uniform distribution of epidemics
creates relatively uniform selective pressure on the virus. In addition,
infections do not persist within hosts, so most selective pressure on the
surface hemagglutinin glycoprotein arises by escape from antibody rec-
ognition during transmission between hosts. The uniformity of selective
pressure means that aggregate samples can provide clear signals.
By contrast, other parasites may face multiple selective pressures that
vary over relatively small spatial and temporal scales. For example, Rou-
zine and Coffin (1999) analyzed 213 pro sequences of HIV-1 from eleven
infected individuals. This sampling scheme allowed them to analyze
the different patterns of selection within hosts and between hosts. This
may be particularly important in HIV, which causes long, persistent in-
fections within hosts. HIV probably faces relatively little pressure from
immune memory during transmission between hosts, but does expe-
262 CHAPTER 15
rience different MHC genotypes between hosts and different selective
pressures on T cell epitopes.
Rouzine and Coffin (1999) found evidence only for negative selection
within hosts. They propose various models of selection within and be-
tween hosts that could be tested by further sampling and analysis. The
point here is that a simple aggregation of sequences over the entire pop-
ulation may not be informative given the different kinds of selection that
act over various temporal and spatial scales.
3. Sampling methods to collect sequences. I mentioned in the Problems
for Future Research section of chapter 11 that most population samples
have been collected for reasons other than phylogenetic analysis. For
example, each year epidemic surveillance teams collect thousands of
influenza isolates from across the world. Sequencing labs choose only
a small fraction of the isolates for analysis. They typically use anti-
genic screening to pick isolates that differ significantly from the com-
mon, recently circulating strains. This biased sampling supports vaccine
design but may affect analyses of selection and other population-level
processes. Recent calls for wider and better-designed sampling should
lead to great opportunities for population studies (Layne et al. 2001).
Nonlinear processes of transmission and stochastic effects of small
effective population sizes in epidemics strongly influence the patterns of
evolutionary change. Random sampling may not be the best design for
studying the population consequences of nonlinear transmission and
stochastic fluctuations. New theoretical work on sampling and inference
would help to guide the advanced screening and analysis technologies
that will be put in place in the coming years.
4. Selection on archival variants. Several parasites such as Trypano-
soma brucei and Borrelia hermsii store archival libraries of antigenic
variants. They express only one variant at a time. Strong positive selec-
tion probably favored diversification of the archival variants during the
initial evolution of antigenic switching. However, once a genome con-
tains a large library of diverged variants, negative selection may act pri-
marily to retain the existing antigenic differences between the variants.
I found only one analysis of archival variants. Rich et al. (2001) stud-
ied one sequence from each of eleven different loci that contain antigenic
variants of the variable short protein (Vsp) of Borrelia hermsii. This sam-
ple showed significant recombination between the loci, suggesting that
MEASURING SELECTION 263
divergence between antigenic variants may arise by intragenomic mix-
ing of protein domains. Their sampling did not provide multiple alleles
at individual loci, so they did not report on the selective pressures re-
cently acting on each individual locus. An extended study that analyzed
variation within and between loci would be interesting.
5. Inferring selection from the spatial distribution of allele frequen-
cies. Rare antigenic variants often have an advantage because they
encounter specific immune memory less often than common antigens.
Conway (1997) suggested that this rare-type advantage promotes a bal-
anced distribution of allele frequencies among antigenic variants. By
this theory, such balancing selection reduces the fluctuations in allele
frequencies when compared with loci experiencing little or no selection.
The neutral loci would have allele frequencies drifting over time and
space, whereas the balanced antigenic loci would face a continual pres-
sure to raise any allele frequency that temporarily dropped to a low level.
Conway (1997) suggested that one could infer which loci experienced
strong immune selection by examining the spatial distribution of al-
lele frequencies. Balancing selection may cause immune-selected loci to
have a more even, less variable distribution of allele frequencies across
space than other loci.
Conway et al. (2000) tested this idea by examining the spatial dis-
tribution of allele frequencies for Msp1, a dominant surface protein of
Plasmodium falciparum. They divided the long (5 kb) msp1 gene into
domains and measured the allele frequencies for each domain over six
African and two Southeast Asian populations. Recombination occurs
frequently within the gene, causing low linkage disequilibrium between
domains. One domain, block 2, had very even distributions of its three
allelic types over the different populations within each continent. The
other domains all had significant variations in allele frequency over the
populations. Conway et al. (2000) also showed that hosts with IgG anti-
bodies against block 2 enjoyed some protection against malaria. From
these data, Conway et al. (2000) concluded that block 2 is an important
antigenic site.
Conway et al.’s (2000) spatial analysis of allele frequencies provides
an interesting approach to identifying key antigenic sites. However, the
theoretical prediction of relatively stable allele frequencies over space
requires further study.
264 CHAPTER 15
Frequency dependence with an advantage for rare types commonly oc-
curs in models of host-parasite interactions (Anderson and May 1991).
In the typical model, frequency dependence causes strong fluctuations
in allele frequencies rather than stable allele frequencies. The fluctu-
ations arise because of feedbacks between host and parasite types. A
rare parasite type, x, increases because most hosts do not recognize the
rare type. As x increases in frequency, this favors an increase in the
frequency of the hosts that recognize x, causing in turn a decline in the
frequency of x. The decline in x favors a loss of host recognition for x.
Low frequencies of x and of host recognition start the cycle again.
Conway (1997) suggested that frequency dependence stabilizes allele
frequencies rather than causes enhanced fluctuations. This may be true
for the particular dynamics that follow from Plasmodium demography
and the time course of host immune memory. However, this should be
studied with theoretical models that analyze fluctuations over space in
antigenic allele frequencies and host memory profiles.
16 Recap of SomeInteresting Problems
My Problems for Future Research span many different technical and con-
ceptual challenges for understanding antigenic variation. These fifty-six
problems arise from my synthesis of the molecular processes of recog-
nition, the dynamics of infections within hosts, the variability of popu-
lations, and the methods for studying evolution.
There is no point in covering once again so many diverse topics. In-
stead, I have chosen to recap four examples, to highlight the kinds of
problems that integrate different levels of analysis. I summarize each
example briefly, as a reminder of the potential for integrating structure,
function, biochemical kinetics, population dynamics, and evolution.
16.1 Population-Level Explanationfor Low Molecular Variability
Immune memory against the measles virus provides lifelong protec-
tion because the measles virus does not evolve widespread escape vari-
ants. Measles can vary its dominant surface antigen, hemagglutinin, and
limited variation does occur (Griffin 2001). So it is an interesting puzzle
why antigenic variants do not spread as in many other viruses.
Perhaps the very high infectiousness of measles causes the common
strain to spread so widely in the host population that little heterogeneity
occurs among hosts in immune memory profiles. If memory responds
against a few different epitopes, then no single-step mutational change
allows a measles variant to spread between previously infected hosts.
The only “nearby” susceptible class of hosts arises from the influx of
naive newborns, which depends on the birthrate of the host population.
Naive hosts do not impose selective pressure for antigenic change.
This explanation for the lack of antigenic variation suggests that the
epidemiological properties of the parasite and the demographic struc-
ture of the hosts affect the patterns of molecular variation in antigens.
These population processes do not control the possible types of varia-
tion or the molecular recognition between host and parasite, but instead
shape the actual distribution of variants.

266 CHAPTER 16
A population-level explanation for the measles virus’s lack of wide-
spread antigenic variation may be wrong. The lack of variation may
simply reflect conservation of some essential viral function in a domi-
nant antigen, such as binding to host receptors. My point here is that
the lack of molecular variation does not necessarily mean that the expla-
nation resides at the molecular level. Population processes can strongly
influence the distribution of molecular variants.
16.2 Molecular-Level Explanationfor Population Dynamics
The causal chain can move in the other direction, from the molecular
nature of host-parasite recognition to the dynamics of populations. For
example, five or so amino acids determine most of the binding energy
between an antibody and an antigen. Often a single amino acid substi-
tution in the antigen can abolish the defensive capability of a particular
antibody specificity for a matching epitope. This type of recognition is
qualitative, in which a single change determines whether or not recog-
nition occurs.
Binding reactions may change in a qualitative way between molecular
variants. But the dynamics of an infection within a host depend on all of
the parasite’s epitopes and all of the specific B and T cell lineages that
recognize different epitopes. The interactions within the host between
the population of parasites and the populations of different immune
cells determine immunodominance, the number of different epitopes
that stimulate a strong immune response.
Immunodominance sets the number of amino acid substitutions need-
ed to avoid host recognition. This aggregate recognition at the level of
individual hosts controls the spread of antigenic variants through a pop-
ulation of previously exposed hosts. Thus, molecular interactions affect
immunodominance, and immunodominance sets the pace of evolution-
ary change and the distribution of variants in parasite populations.
16.3 Binding Kinetics and theDynamics of Immunodominance
The control of immunodominance remains poorly understood. Rao’s
(1999) analyses suggest the kinds of studies that may generate new
insight. Rao showed that initial stimulation of B cells depended on
SOME INTERESTING PROBLEMS 267
an affinity window for binding between antibodies and epitopes. Low-
affinity binding did not stimulate division of B cell lineages, whereas
high-affinity antibodies bound the antigen so effectively that the B cell
receptors received little stimulation. Intermediate affinity provided the
strongest stimulation for initial expansion of B cell clones.
After initial stimulation and production of IgM, the next phase of B
cell competition occurs during affinity maturation and the shift to IgG
production. The B cell receptors with the highest on-rates of binding for
antigen tended to win the race to pass through affinity maturation. The
limiting step may be competition for stimulation by helper T cells. This
competition for T cell help apparently depends on the rate at which B
cells acquire antigens rather than on the equilibrium affinity of binding
to antigens.
Equilibrium affinity is the ratio of the rate at which bonds form (on-
rate) to the rate at which bonds break (off-rate). The contrast between
the early selection of equilibrium affinity (on:off ratio) and the later se-
lection of on-rate may provide insight into the structural features of
binding that separately control on-rates and off-rates. This is a superb
opportunity to relate structure to function via the kinetic processes that
regulate the immune response.
16.4 Diversity and Regulation of Archival Repertoires
Some parasites store archival libraries of antigenic variants in their
genomes. Switching expression between variants may allow the para-
site to escape recognition by immune responses directed at previously
expressed variants. Alternatively, a sequence of variants may exploit
the mechanisms of immune recognition and regulation to interfere with
the ability of the host to mount new responses to variants expressed
later in the sequence. Variants can potentially interfere with new host
responses by exploiting original antigenic sin—the tendency of the host
to enhance a cross-reactive response to a previously encountered anti-
gen instead of generating a new and more focused response to a novel
variant.
The interesting problem concerns the evolution of the archival reper-
toire. How do the different molecular mechanisms of escape and im-
mune interference shape the diversity and cross-reactivity of variants
stored within each parasite’s genome?
268 CHAPTER 16
The type of immune recognition may influence the pattern of diver-
sification between antigenic variants. For example, IgM antibodies with
relatively low affinity and high cross-reactivity control Borrelia hermsii ,
a spirochete with an archival library of variants (Barbour and Bundoc
2001). By contrast, many parasites face control by the more highly spe-
cific IgA and IgG antibodies. It would be interesting to know if B. hermsii
requires a relatively greater molecular distance between variants to es-
cape IgM cross-reactivity than parasites controlled by IgG antibodies. If
so, then B. hermsii’s variants may have diverged under a different pattern
of specificity and cross-reactivity from that influencing the divergence
of variants in other parasites.
Parasites with archival variants have particularly interesting dynamics
within hosts. If the variants are produced too quickly, the host develops
specific immunity against all types early in the infection, and the infec-
tion cannot persist for long. If the variants arise too slowly, the parasite
risks clearance before switching to a novel type. Thus, the pacing of
molecular switches in the parasite must be tuned to the dynamics of
the host’s immune response. This system of contained dynamics within
individual hosts may be particularly amenable to experimental study,
providing insight into the interactions between host immunity, antigenic
escape variants, the shaping of antigenic repertoires, and the evolution
of the molecular control systems that regulate antigenic switching.
16.5 Final Note
The technical advances in molecular biology have greatly accelerated
the pace of discovery in immunology and parasite biology. When review-
ing various topics, I found that many key articles had been published in
the past eighteen months.
This book’s synthesis may soon be outdated with regard to the latest
details for each particular subject. But, for the first time, it has been
possible to see the subject as a whole, to discuss in an informed way the
interactions between different processes and different ways of study.
The problems that I raised for future study will continue to provide key
challenges for many years to come.

References
Abraham, J. M., Freitag, C. S., Clements, J. R., and Eisenstein, B. I. 1985. An invert-
ible element of DNA controls phase variation of type 1 fimbriae of Escherichia
coli. Proceedings of the National Academy of Sciences 82:5724–5727.
Abrams, S. I., and Schlom, J. 2000. Rational antigen modification as a strat-
egy to upregulate or downregulate antigen recognition. Current Opinion in
Immunology 12:85–91.
Ada, G. 1999. The immunology of vaccination. In Plotkin, S. A., and Orenstein,
W. A., eds., Vaccines, 3d ed., pp. 28–39. W. B. Saunders, Philadelphia.
Agarwal, A., Nayak, B. P., and Rao, K. V. S. 1998. B cell responses to a peptide
epitope. VII. Antigen-dependent modulation of the germinal center reaction.
Journal of Immunology 161:5832–5841.
Agarwal, A., and Rao, K. V. S. 1997. B cell responses to a peptide epitope. III.
Differential T helper thresholds in recruitment of B cell fine specificities.
Journal of Immunology 159:1077–1085.
Agarwal, A., Sarkar, S., Nazbal, C., Balasundaram, G., and Rao, K. V. S. 1996. B cell
responses to a peptide epitope. I. The cellular basis for restricted recognition.
Journal of Immunology 157:2779–2788.
Agarwal, P., Oldenburg, M. C., Czarneski, J. E., Morse, R. M., Hameed, M. R., Cohen,
S., and Fernandes, H. 2000. Comparison study for identifying promoter al-
lelic polymorphism in interleukin 10 and tumor necrosis factor alpha genes.
Diagnostic Molecular Pathology 9:158–164.
Agur, Z. 1992. Mathematical models for African trypanosomiasis. Parasitology
Today 8:128–129.
Agur, Z., Abiri, D., and van der Ploeg, L. H. T. 1989. Ordered appearance of anti-
genic variants of African trypanosomes explained in a mathematical model
based on a stochastic switch process and immune-selection against putative
switch intermediates. Proceedings of the National Academy of Sciences USA
86:9626–9630.
Ahmed, R., and Gray, D. 1996. Immunological memory and protective immunity:
understanding their relation. Science 272:54–60.
Alamgir, A. S. M., Matsuzaki, Y., Hongo, S., Tsuchiya, E., Sugawara, K., Muraki,
Y., and Nakamura, K. 2000. Phylogenetic analysis of influenza C virus non-
structural (NS) protein genes and identification of the NS2 protein. Journal
of General Virology 81:1933–1940.
Albrecht, P., Ennis, F. A., Saltzmann, E. J., and Krugman, S. 1977. Persistence
of maternal antibody in infants beyond 12 months: mechanisms of measles
vaccine failure. Journal of Hygiene 86:291–304.
Alcami, A., and Koszinowski, U. H. 2000. Viral mechanisms of immune evasion.
Trends in Microbiology 8:410–418.
270 REFERENCES
Allen, T. M., O’Connor, D. H., Jing, P., Dzuris, J. L., Mothé, B. R., Vogel, T. U., Dun-
phy, E., Liebl, M. E., Emerson, C., Wilson, N., Kunstman, K. J., Wang, X., Allison,
D. B., Hughes, A. L., Desrosiers, R. C., Altman, J. D., Wolinsky, S. M., Sette, A.,
and Watkins, D. I. 2000. Tat-specific cytotoxic T lymphocytes select for SIV
escape variants during resolution of primary viraemia. Nature 407:386–390.
Almarri, A., and Batchelor, J. R. 1994. HLA and hepatitis B infection. Lancet
344:1194–1195.
Altman, J. D., Moss, P. A. H., Goulder, P. J. R., Barouch, D. H., McHeyzer-Williams,
M. G., Bell, J. I., McMichael, A. J., and Davis, M. M. 1996. Phenotypic analysis
of antigen-specific T lymphocytes. Science 274:94–96.
Anderson, R. M., and May, R. M. 1991. Infectious Diseases of Humans: Dynamics
and Control. Oxford University Press, Oxford.
Anderson, T. J. C., Haubold, B., Williams, J. T., Estrada-Franco, J. G., Richardson,
L., Mollinedo, R., Bockarie, M., Mikili, J., Mharakurwa, S., French, N., Whitworth,
J., Velez, I. D., Brockman, A. H., Nosten, F., Ferreira, M. U., and Day, K. P.
2000. Microsatellite markers reveal a spectrum of population structures in
the malaria parasite Plasmodium falciparum. Molecular Biology and Evolution
17:1467–1482.
Andreasen, V., Lin, J., and Levin, S. A. 1997. The dynamics of cocirculating
influenza strains conferring partial cross-immunity. Journal of Mathematical
Biology 35:825–842.
Aslam, N., and Turner, C. M. R. 1992. The relationship of variable antigen ex-
pression and population growth rates in Trypanosoma brucei. Parasitology
Research 78:661–664.
Avrameas, S. 1991. Natural autoantibodies: from horror autotoxicus to gnothi
seauton. Immunology Today 12:154–159.
Awad-El-Kariem, F. M. 1999. Does Cryptosporidium parvum have a clonal pop-
ulation structure? Parasitology Today 15:502–504.
Ayala, F. J. 1995. The myth of Eve: molecular biology and human origins. Science
270:1930–1936.
Babiker, H. A., and Walliker, D. 1997. Current views on the population struc-
ture of Plasmodium falciparum: implications for control. Parasitology Today
13:262–267.
Back, N. K., Nijhuis, M., Keulen, W., Boucher, C. A., Oude Essink, B. O., van Kuilen-
burg, A. B., van Gennip, A. H., and Berkout, B. 1996. Reduced replication of
3TC-resistant HIV-1 variants in primary cells due to a processivity defect of
the reverse transcriptase enzyme. EMBO Journal 15:4040–4049.
Badovinac, V. P., Tvinnereim, A. R., and Harty, J. T. 2000. Regulation of antigen-
specific CD8+ T cell homeostasis by perforin and interferon-γ. Science 290:
1354–1357.
Banchereau, J., Briere, F., Caux, C., Davoust, J., Lebecque, S., Liu, Y.-J., Pulendran,
B., and Palucka, K. 2000. Immunobiology of dendritic cells. Annual Review
of Immunology 18:767–811.
Baranowski, E., Ruiz-Jarabo, C. M., Sevilla, N., Andreu, D., Beck, E., and Domingo,
REFERENCES 271
E. 2000. Cell recognition by foot-and-mouth disease virus that lacks the RGD
integrin-binding motif: flexibility in aphthovirus receptor usage. Journal of
Virology 74:1641–1647.
Barbet, A. F., and Kamper, S. M. 1993. The importance of mosaic genes to try-
panosome survival. Parasitology Today 9:63–66.
Barbour, A. G. 1987. Immunobiology of relapsing fever. Contributions to Micro-
biology and Immunology 8:125–137.
Barbour, A. G. 1993. Linear DNA of Borrelia species and antigenic variation.
Trends in Microbiology 1:236–239.
Barbour, A. G., and Bundoc, V. 2001. In vitro and in vivo neutralization of the
relapsing fever agent Borrelia hermsii with serotype-specific immunoglobulin
M antibodies. Infection and Immunity 69:1009–1015.
Barbour, A. G., Burman, N., Carter, C. J., Kitten, T., and Bergstrom, S. 1991. Vari-
able antigen genes of the relapsing fever agent Borrelia hermsii are activated
by promoter addition. Molecular Microbiology 5:489–493.
Barbour, A. G., and Hayes, S. F. 1986. Biology of Borrelia species. Microbiological
Reviews 50:381–400.
Barbour, A. G., and Stoenner, H. G. 1985. Antigenic variation of Borrelia herm-
sii. In Herskowitz, I., and Simon, M. I., eds., Genome Rearrangement. UCLA
Symposium on Molecular and Cellular Biology, New Series, Vol. 20. Alan Liss,
Inc., New York.
Barnabé, C., Brisse, S., and Tibayrenc, M. 2000. Population structure and ge-
netic typing of Trypanosoma cruzi, the agent of Chagas disease: a multilocus
enzyme electrophoretic approach. Parasitology 120:513–526.
Barnwell, J. W. 1999. Malaria: a new escape and evasion tactic. Nature 398:562–
563.
Barragan, A., Kremsner, P. G., Weiss, W., Wahlgren, M., and Carlson, J. 1998.
Age-related buildup of humoral immunity against epitopes for rosette for-
mation and agglutination in African areas of malaria endemicity. Infection
and Immunity 66:4783–4787.
Barry, J. D. 1986. Antigenic variation during Trypanosoma vivax infections of
different host species. Parasitology 92:51–65.
Barry, J. D. 1997. The relative significance of mechanisms of antigenic variation
in African trypanosomes. Parasitology Today 13:212–218.
Barry, J. D., Peeling, R. W., and Brunham, R. C. 1999. Analysis of the original
antigenic sin antibody response to the major outer membrane protein of
Chlamydia trachomatis. Journal of Infectious Diseases 179:180–186.
Barry, J. D., and Turner, C. M. R. 1991. The dynamics of antigenic variation and
growth of African trypanosomes. Parasitology Today 7:207–211.
Barry, J. D., and Turner, C. M. R. 1992. Mathematical models for African trypano-
somiasis—reply. Parasitology Today 8:129.
Barton, N. H., and Turelli, M. 1987. Adaptive landscapes, genetic distance and
the evolution of quantitative characters. Genetical Research 49:157–173.
Beaumont, T., van Nuenen, A., Broersen, S., Blattner, W. A., Lukashov, V. V., and

272 REFERENCES
Schuitemaker, H. 2001. Reversal of human immunodeficiency virus type 1 IIIB
to a neutralization-resistant phenotype in an accidentally infected laboratory
worker with a progressive clinical course. Journal of Virology 75:2246–2252.
Bednarek, M. A., Sauma, S. Y., Gammon, M. C., Porter, G., Tamhankar, S., Wil-
liamson, A. R., and Zweerink, H. J. 1991. The minimum peptide epitope from
the influenza virus matrix protein: extra and intracellular loading of HLA-A2.
Journal of Immunology 147:4047–4053.
Beekman, N. J., van Veelen, P. A., van Hall, T., Neisig, A., Sijts, A., Camps, M.,
Kloetzel, P.-M., Neefjes, J. J., Melief, C. J., and Ossendorp, F. 2000. Abrogation
of CTL epitope processing by single amino acid substitution flanking the C-
terminal proteasome cleavage site. Journal of Immunology 164:1898–1905.
Belz, G. T., Xie, W., Altman, J. D., and Doherty, P. C. 2000. A previously unrecog-
nized H-2Db-restricted peptide prominent in the primary influenza A virus-
specific CD8+ T-cell response is much less apparent following secondary
challenge. Journal of Virology 74:3486–3493.
Benjamin, D. C., Berzofsky, J. A., East, I. J., Gurd, F. R. N., Hannum, C., Leach, S. J.,
Margoliash, E., Michael, J. G., Miller, A., Prager, E. M., Reichlin, M., Sercarz, E. E.,
Smith-Gill, S. J., Todd, P. E., and Wilson, A. C. 1984. The antigenic structure
of proteins: a reappraisal. Annual Review of Immunology 2:67–101.
Benjamin, D. C., and Perdue, S. S. 1996. Site-directed mutagenesis in epitope
mapping. Methods in Enzymology 9:508–515.
Bennett, A. F., and Lenski, R. E. 1999. Experimental evolution and its role in
evolutionary physiology. American Zoologist 39:346–362.
Bennink, J. R., and Doherty, P. C. 1981. The response to H-2-different virus-
infected cells is mediated by long-lived T lymphocytes and is diminished
by prior virus priming in a syngeneic environment. Cellular Immunology
61:220–224.
Berinstein, A., Roivainen, M., Hovi, T., Mason, P. W., and Baxt, B. 1995. Antibodies
to the vitronectin receptor (integrin αvβ3) inhibit binding and infection of
foot-and-mouth disease virus to cultured cells. Journal of Virology 69:2664–
2666.
Bernard, K. A., Klimstra, W. B., and Johnston, R. E. 2000. Mutations in the E2
glycoprotein of Venezuelan equine encephalitis virus confer heparan sulfate
interaction, low morbidity, and rapid clearance from blood of mice. Virology
276:93–103.
Bertoletti, A., Sette, A., Chisari, F. V., Penna, A., Levrero, M., De Carli, M., Fiac-
cadori, F., and Ferrari, C. 1994. Natural variants of cytotoxic epitopes are
T-cell receptor antagonists for antiviral cytotoxic T cells. Nature 369:407–
410.
Bhattacharjee, A. K., and Glaudemans, C. P. J. 1978. Dual binding specificities in
MOPC 384 and 870 murine myeloma immunoglobulins. Journal of Immunol-
ogy 120:411–413.
Biozzi, G., Cabrera, W. H., Mouton, D., and Ibanez, D. M. 1982. Restricted and

REFERENCES 273
general polygenic regulation of antibody responsiveness. In Benacerraf, B.,
ed., Immunogenetics and Immune Regulation, p. 31. Masson Italia Editori,
Milan.
Bizebard, T., Gigant, B., Rigolet, P., Rasmussen, B., Diat, O., Bösecke, P., Whar-
ton, S. A., Skehel, J. J., and Knossow, M. 1995. Structure of influenza virus
haemagglutinin complexed with a neutralizing antibody. Nature 376:92–94.
Bobkov, A., Cheingsong-Popov, R., Salminen, M., McCutchan, F., Louwagie, J.,
Ariyoshi, K., Whittle, H., and Weber, J. 1996. Complex mosaic structure of the
partial envelope sequence from a Gambian HIV type 1 isolate. AIDS Research
and Human Retroviruses 12:169–171.
Borre, M. B., Owen, C. A., Keen, J. K., Sinha, K. A., and Holder, A. A. 1995. Multiple
genes code for high-molecular-mass rhoptry proteins of Plasmodium yoelii.
Molecular and Biochemical Parasitology 70:149–155.
Borrow, P., and Shaw, G. M. 1998. Cytotoxic T-lymphocyte escape viral vari-
ants: how important are they in viral evasion of immune clearance in vivo?
Immunological Reviews 164:37–51.
Borst, P., Rudenko, G., Blundell, P. A., van Leeuwen, F., Cross, M. A., McCulloch,
R., Gerrits, H., and Chaves, I. M. F. 1997. Mechanisms of antigenic variation
in African trypanosomes. Behring Institute Mitteilungen 99:1–15.
Bousso, P., Levraud, J.-P., Kourilsky, P., and Abasado, J.-P. 1999. The compo-
sition of a primary T cell response is largely determined by the timing of
recruitment of individual T cell clones. Journal of Experimental Medicine
189:1591–1600.
Brannan, L. R., Turner, C. M. R., and Phillips, R. S. 1994. Malaria parasites undergo
antigenic variation at high rates in vivo. Proceedings of the Royal Society of
London Series B Biological Sciences 256:71–75.
Brisse, S., Barnabé, C., and Tibayrenc, M. 2000a. Identification of six Trypano-
soma cruzi phylogenetic lineages by random amplified polymorphic DNA
and multilocus enzyme electrophoresis. International Journal for Parasitol-
ogy 30:35–44.
Brisse, S., Dujardin, J.-C., and Tibayrenc, M. 2000b. Identification of six Try-
panosoma cruzi lineages by sequence-characterised amplified region mark-
ers. Molecular and Biochemical Parasitology 111:95–105.
Brown, I. H., Ludwig, S., Olsen, C. W., Hannoun, C., Scholtissek, C., Hinshaw,
V. S., Harris, P. A., McCauley, J. W., and Strong, I. 1997. Antigenic and genetic
analyses of H1N1 influenza A viruses from European pigs. Journal of General
Virology 78:553–562.
Bruyere, A., Wantroba, M., Flasinski, S., Dzianott, A., and Bujarski, J. J. 2000.
Frequent homologous recombination events between molecules of one RNA
component in a multipartite RNA virus. Journal of Virology 74:4214–4219.
Buonagurio, D. A., Nakada, S., Desselberger, U., Krystal, M., and Palese, P. 1985.
Noncumulative sequence changes in the hemagglutinin genes of influenza C
virus isolates. Virology 146:221–232.
274 REFERENCES
Burch, C. L., and Chao, L. 1999. Evolution by small steps and rugged landscapes
in the RNA virus variant φ6. Genetics 151:921–927.
Burkhart, C., Freer, G., Castro, R., Adorini, L., Wiesmuller, K. H., Zinkernagel,
R. M., and Hengartner, H. 1994. Characterization of T helper epitopes of the
glycoprotein of vesicular stomatitis virus. Journal of Virology 68:1573–1580.
Burrows, S. R., Khanna, R., Burrows, J. M., and Moss, D. J. 1994. An alloresponse
in humans is dominated by cytotoxic T lymphocytes (CTL) cross-reactive with
a single Epstein-Barr virus CTL epitope: implications for graft-versus-host
disease. Journal of Experimental Medicine 179:1155–1161.
Burrows, S. R., Silins, S. L., Moss, D. J., Khanna, R., Misko, I. S., and Argaet, V. P.
1995. T cell receptor repertoire for a viral epitope in humans is diversified by
tolerance to a background major histocompatibility complex antigen. Journal
of Experimental Medicine 182:1703–1715.
Busch, D. H., Pilip, I. M., Vijh, S., and Pamer, E. G. 1998. Coordinate regulation
of complex T cell populations responding to bacterial infection. Immunity
8:353–362.
Bush, R. M. 2001. Predicting adaptive evolution. Nature Reviews Genetics 2:387–
392.
Bush, R. M., Bender, C. A., Subbarao, K., Cox, N. J., and Fitch, W. M. 1999. Pre-
dicting the evolution of influenza A. Science 286:1921–1925.
Buss, L. W. 1987. The Evolution of Individuality. Princeton University Press,
Princeton, New Jersey.
Butz, E. A., and Bevan, M. J. 1998. Massive expansion of antigen-specific CD8+
T cells during an acute virus infection. Immunity 8:167–175.
Buus, S. 1999. Description and prediction of peptide-MHC binding: the ‘human
MHC project.’ Current Opinion in Immunology 11:209–213.
Byers, V. S., and Sercarz, E. E. 1968. The x-y-z scheme of immunocyte maturation.
Journal of Experimental Medicine 128:715–728.
Byrnes, A. P., and Griffin, D. E. 2000. Large-plaque mutants of Sindbis virus
show reduced binding to heparan sulfate, heightened viremia, and slower
clearance from the circulation. Journal of Virology 74:644–651.
Cadavid, D., Pachner, A. R., Estanislao, L., Patalapati, R., and Barbour, A. G. 2001.
Isogenic serotypes of Borrelia turnicatae show different localization in the
brain and skin of mice. Infection and Immunity 69:3389–3397.
Calisher, C. H., Karabatsos, N., Dalrymple, J. M., Shope, R. E., Porterfield, J. S.,
Westaway, E. G., and Brandt, W. E. 1989. Antigenic relationships between
flaviviruses as determined by cross-neutralization tests with polyclonal an-
tisera. Journal of General Virology 70:37–43.
Callan, M. F. C., Tan, L., Annels, N., Ogg, G. S., Wilson, J. D. K., O’Callaghan,
C. A., Steven, N., McMichael, A. J., and Rickinson, A. B. 1998. Direct visualiza-
tion of antigen-specific CD8+ T cells during the primary immune response to
Epstein-Barr virus in vivo. Journal of Experimental Medicine 187:1395–1402.
Caporale, L. H. 1999. Chance favors the prepared genome. Annals of the New
York Academy of Sciences 870:1–21.
REFERENCES 275
Carrillo, C., Borca, M., Moore, D. M., Morgan, D. O., and Sobrino, F. 1998. In
vivo analysis of the stability and fitness of variants recovered from foot-and-
mouth disease virus quasispecies. Journal of General Virology 79:1699–1706.
Caton, A. J., Brownlee, G. G., Yewdell, J. W., and Gerhard, W. 1982. The antigenic
structure of the influenza virus A/PR/8/34 hemagglutinin (H1 subtype). Cell
31:417–427.
Chackerian, B., Rudensey, L. M., and Overbaugh, J. 1997. Specific N-linked and
O-linked glycosylation modifications in the envelope V1 domain of simian
immunodeficiency virus variants that evolve in the host after recognition by
neutralizing antibodies. Journal of Virology 71:7719–7727.
Chao, L., and Cox, E. C. 1983. Competition between high and low mutating
strains of Escherichia coli. Evolution 37:125–134.
Chapman, B. A., Burt, M. J., Frampton, C. M., Collett, J. A., Yeo, K. H., Wilkinson,
I. D., Cook, H. B., Barclay, M. J., Ross, A. G., and George, P. M. 2000. The preva-
lence of viral hepatitis (HAV, HBC and HCV) in the Christchurch community.
New Zealand Medical Journal 113:394–396.
Charlesworth, B., Sniegowski, P., and Stephan, W. 1994. The evolutionary dy-
namics of repetitive DNA in eukaryotes. Nature 371:215–220.
Chen, Q., Fernandez, V., Sundström, A., Schlichtherle, M., Datta, S., Hagblom, P.,
and Wahlgren, M. 1998. Developmental selection of var gene expression in
Plasmodium falciparum. Nature 394:392–395.
Chen, W., Antón, L. C., Bennink, J. R., and Yewdell, J. W. 2000. Dissecting the mul-
tifactorial causes of immunodominance in class I–restricted T cell responses
to viruses. Immunity 12:83–93.
Chen, W., Khilko, S., Fecondo, J., Margulies, D. H., and McLuskey, J. 1994. De-
terminant selection of major histocompatibility complex class I–restricted
antigenic peptides is explained by class I–peptide affinity and is strongly in-
fluenced by nondominant anchor residues. Journal of Experimental Medicine
180:1471–1483.
Chen, Z. J., Wheeler, C. J., Shi, W., Wu, A. J., Yarboro, C. H., Gallagher, M., and
Notkins, A. L. 1998. Polyreactive antigen-binding B cells are the predominant
cell type in the newborn B cell repertoire. European Journal of Immunology
28:989–994.
Chen, Z. W., Craiu, A., Shen, L., Kuroda, M. J., Iroku, U. C., Watkins, D. I., Voss,
G., and Letvin, N. L. 2000. Simian immunodeficiency virus evades a dominant
epitope-specific cytotoxic T lymphocyte response through mutation resulting
in the accelerated dissociation of viral peptide and MHC class I. Journal of
Immunology 164:6474–6479.
Chisari, F. V. 1995. Hepatitis B virus immunopathogenesis. Annual Review of
Immunology 13:29–60.
Ciurea, A., Klenerman, P., Hunziker, L., Horvath, E., Senn, B. M., Ochsenbein,
A. F., Hengartner, H., and Zinkernagel, R. M. 2000. Viral persistence in vivo
through selection of neutralizing antibody-escape variants. Proceedings of
the National Academy of Sciences USA 97:2749–2754.

276 REFERENCES
Cleghorn, F. R., Jack, N., Carr, J. K., Edwards, J., Mahabir, B., Sill, A., McDanal, C. B.,
Connolly, S. M., Goodman, D., Bennetts, R. Q., O’Brien, T. R., Weinhold, K. J.,
Bartholomew, C., Blattner, W. A., and Greenberg, M. L. 2000. A distinctive
clade B HIV type 1 is heterosexually transmitted in Trinidad and Tobago.
Proceedings of the National Academy of Sciences USA 97:10532–10537.
Cleveland, S. M., Taylor, H. P., and Dimmock, N. J. 1997. Selection of neutralizing
antibody escape mutants with type A influenza virus HA-specific polyclonal
antisera: possible significance for antigenic drift. Epidemiology and Infection
118:149–154.
Coffin, J. M. 1995. HIV population dynamics in vivo: implications for genetic
variation, pathogenesis, and therapy. Science 267:483–489.
Coffin, J. M. 1996. Retroviridae: the viruses and their replication. In Fields, B. N.,
Knipe, D. M., and Howley, P. M., eds., Fields Virology, 3d ed., pp. 763–843.
Lippincott-Raven, Philadelphia.
Coffman, R. L., and Beebe, A. M. 1998. Genetic control of the T cell response
to Leishmania major infection. In Gupta, S., Sher, A., and Ahmed, R., eds.,
Mechanisms of Lymphocyte Activitation and Immune Regulation VII: Molecu-
lar Determinants of Microbial Immunity, pp. 61–66. Plenum Press, New York.
Cohen, S., and Lambert, P. H. 1982. Malaria. In Cohen, S., and Warren, D., eds.,
Immunology of Parasitic Infections, 2d ed., pp. 422–438. Blackwell, London.
Cole, G. A., Hogg, T. L., Coppola, M. A., and Woodland, D. L. 1997. Efficient prim-
ing of CD8+ memory T cells specific for a subdominant epitope following
Sendai virus infection. Journal of Immunology 158:4301–4309.
Colman, P. M. 1998. Structure and function of the neuraminidase. In Nicholson,
K. G., Webster, R. G., and Hay, A. J., eds., Textbook of Influenza, pp. 65–73.
Blackwell Science, Oxford.
Connor, R. I., Sheridan, K. E., Ceradini, D., Choe, S., and Landau, N. R. 1997.
Change in coreceptor use correlates with disease progression in HIV-1-infect-
ed individuals. Journal of Experimental Medicine 185:621–628.
Connor, R. J., Kawaoka, Y., Webster, R. G., and Paulson, J. C. 1994. Receptor
specificity in human, avian, and equine H2 and H3 influenza virus isolates.
Virology 205:17–23.
Constant, S. L., and Bottomly, K. 1997. Induction of Th1 and Th2 CD4+ T cell re-
sponses: the alternative approaches. Annual Review of Immunology 15:297–
322.
Conway, D. J. 1997. Natural selection on polymorphic malaria antigens and the
search for a vaccine. Parasitology Today 13:26–29.
Conway, D. J., Cavanagh, D. R., Tanabe, K., Roper, C., Mikes, Z. S., Sakihama, N.,
Bojang, K. A., Oduola, A. M. J., Kremsner, P. G., Arnot, D. E., Greenwood, B. M.,
and McBride, J. S. 2000. A principal target of human immunity to malaria
identified by molecular population genetic and immunological analyses. Na-
ture Medicine 6:689–692.
Conway, D. J., Roper, C., Oduola, A. M. J., Arnot, D. E., Kremsner, P. G., Grobusch,

REFERENCES 277
M. P., Curtis, C. F., and Greenwood, B. M. 1999. High recombination rate in
natural populations of Plasmodium falciparum. Proceedings of the National
Academy of Sciences USA 96:4506–4511.
Cooper, L. A., and Scott, T. W. 2001. Differential evolution of eastern equine en-
cephalitis virus populations in response to host cell type. Genetics 157:1403–
1412.
Cornelissen, M., Kampinga, G., Zorgdrager, F., and Goudsmit, J. 1996. Human
immunodeficiency virus type 1 subtypes defined by env show high frequency
of recombinant gag genes. Journal of Virology 70:8209–8212.
Couceiro, J. N., Paulson, J. C., and Baum, L. G. 1993. Influenza virus strains se-
lectively recognize sialyloligosaccharides on human respiratory epithelium:
the role of the host cell in selection of hemagglutinin receptor specificity.
Virus Research 29:155–165.
Cowell, L., Kepler, T. B., Janitz, M., Lauster, R., and Mitchison, N. A. 1998. The
distribution of variation in regulatory gene segments as present in MHC class
II promoters. Genome Research 8:124–134.
Cox, N. J., and Bender, C. A. 1995. The molecular epidemiology of influenza
viruses. Seminars in Virology 6:359–370.
Cox, N. J., and Subbarao, K. 2000. Global epidemiology of influenza: past and
present. Annual Review of Medicine 51:407–421.
Crandall, K. A., ed. 1999. The Evolution of HIV. Johns Hopkins University Press,
Baltimore, Maryland.
Crill, W. D., Wichman, H. A., and Bull, J. J. 2000. Evolutionary reversals during
viral adaptation to alternating hosts. Genetics 154:27–37.
Croft, M., and Swain, S. L. 1992. Analysis of CD4+ T cells that provide contact-
dependent bystander help to B cells. Journal of Immunology 149:3157–3165.
Crow, J. F., and Kimura, M. 1970. An Introduction to Population Genetics Theory.
Burgess, Minneapolis, Minnesota.
Daser, A., Mitchison, H., Mitchison, A., and Müller, B. 1996. Non-classical-MHC
genetics of immunological disease in man and mouse. The key role of pro-
inflammatory cytokine genes. Cytokine 8:593–597.
Davis, M. M., Boniface, J. J., Reich, Z., Lyons, D., Hampl, J., Arden, B., and Chien,
Y. 1998. Ligand recognition by αβ T cell receptors. Annual Review of Im-
munology 16:523–544.
de Lana, M., da Silveira, A., Bastrenta, B., Barnabé, C., Noël, S., and Tibayrenc, M.
2000. Trypanosoma cruzi: infectivity of clonal genotype infections in acute
and chronic phases in mice. Experimental Parasitology 96:61–66.
Deitsch, K. W., Moxon, E. R., and Wellems, T. E. 1997. Shared themes of anti-
genic variation and virulence in bacterial, protozoal, and fungal infections.
Microbiology and Molecular Biology Reviews 61:281–293.
Deitsch, K. W., and Wellems, T. E. 1996. Membrane modifications in erythrocytes
parasitized by Plasmodium falciparum. Molecular and Biochemical Parasitol-
ogy 76:1–10.
278 REFERENCES
del Portillo, H. A., Fernandez-Becerra, C., Bowman, S., Oliver, K., Preuss, M.,
Sanchez, C. P., Schneider, N. K., Villalobos, J. M., Rajandream, M.-A., Harris, D.,
Perera da Silva, L. H., Barrell, B., and Lanzer, M. 2001. A superfamily of vari-
ant genes encoded in the subtelomeric region of Plasmodium vivax. Nature
410:839–842.
Deng, Y., Yewdell, J. W., Eisenlohr, L. C., and Bennink, J. R. 1997. MHC affinity,
peptide liberation, T cell repertoire, and immunodominance all contribute to
the paucity of MHC class I–restricted peptides recognized by antiviral CTL.
Journal of Immunology 158:1507–1515.
Dick, L. R., Aldrich, C., Jameson, S. C., Moomaw, C. R., Pramanik, B. C., Doyle,
C. K., Demartino, G. N., Bevan, M. J., Forman, J. M., and Slaughter, C. A. 1994.
Proteolytic processing of ovalbumin and beta-galactosidase by the protea-
some to yield antigenic peptides. Journal of Immunology 152:3884–3894.
Dimmock, N. J. 1993. Neutralization of animal viruses. Current Topics in Micro-
biology and Immunology 183:1–149.
Dimmock, N. J. 1995. Update on the neutralization of animal viruses. Reviews
in Medical Virology 5:165–179.
Doherty, P. C., Biddison, W. E., Bennink, J. R., and Knowles, B. B. 1978. Cytotoxic
T-cell responses in mice infected with influenza and vaccinia viruses vary in
magnitude with H-2 genotype. Journal of Experimental Medicine 148:534–
543.
Doherty, P. C., and Christensen, J. P. 2000. Accessing complexity: the dynamics
of virus-specific T cell responses. Annual Review of Immunology 18:561–592.
Dougan, D. A., Malby, R. L., Gruen, L. C., Kortt, A. A., and Hudson, P. J. 1998.
Effects of substitutions in the binding surface of an antibody on antigen
affinity. Protein Engineering 11:65–74.
Dowdle, W. R. 1999. Influenza A virus recycling revisited. Bulletin of the World
Health Organization 77:820–828.
Drake, J. W., Charlesworth, B., Charlesworth, D., and Crow, J. F. 1998. Rates of
spontaneous mutation. Genetics 148:1667–1686.
Drake, J. W., and Holland, J. J. 1999. Mutation rates among RNA viruses. Pro-
ceedings of the National Academy of Sciences USA 96:13910–13913.
Drescher, J., and Aron, R. 1999. Influence of the amino acid differences between
the hemagglutinin HA1 domains of influenza virus H1N1 strains on their
reaction with antibody. Journal of Medical Virology 57:397–404.
Dutton, R. W., Bradley, L. M., and Swain, S. L. 1998. T cell memory. Annual
Review of Immunology 16:201–223.
Earn, D. J. D., Rohani, P., Bolker, B. M., and Grenfell, B. T. 2000. A simple model
for complex dynamical transitions in epidemics. Science 287:667–670.
Edfors-Lilja, I., Wattrang, E., Marklund, L., Moller, M., Andersson-Eklund, L., An-
dersson, L., and Fossum, C. 1998. Mapping quantitative trait loci for immune
capacity in the pig. Journal of Immunology 161:829–835.
Edwards, M. J., and Dimmock, N. J. 2000. Two influenza A virus-specific Fabs
REFERENCES 279
neutralize by inhibiting virus attachment to target cells, while neutralization
by their IgGs is complex and occurs simultaneously through fusion inhibition
and attachment inhibition. Virology 278:423–435.
El-Omar, E. M., Carrington, M., Chow, W.-H., McColl, K. E. L., Bream, J. H., Young,
H. A., Herrera, J., Lissowska, J., Yuan, C.-C., Rothman, N., Lanyon, G., Martin,
M., Fraumeni, Jr., J. F., and Rabkin, C. S. 2000. Interleukin-1 polymorphisms
associated with increased risk of gastric cancer. Nature 404:398–402.
Endo, T., Ikeo, K., and Gojobori, T. 1996. Large-scale search for genes on which
positive selection may operate. Molecular Biology and Evolution 13:685–690.
Engelhard, V. H., Lacy, E., and Ridge, J. P. 1991. Influenza A–specific, HLA-A2.1–
restricted cytotoxic T lymphocytes from HLA-A2.1 transgenic mice recognize
fragments of the M1 protein. Journal of Immunology 146:1226–1232.
Enright, M. C., and Spratt, B. G. 1999. Multilocus sequence typing. Trends in
Microbiology 7:482–487.
Evans, D. T., O’Connor, D. H., Jing, P., Dzuris, J. L., Sidney, J., da Silva, J., Allen,
T. M., Horton, H., Venham, J. E., Rudersdorf, R. A., Vogel, T., Pauza, C. D., Bon-
trop, R. E., DeMars, R., Sette, A., Hughes, A. L., and Watkins, D. I. 1999. Virus-
specific cytotoxic T-lymphocyte responses select for amino-acid variation in
simian immunodeficiency virus Env and Nef. Nature Medicine 5:1270–1276.
Farber, D. L. 2000. T cell memory: heterogeneity and mechanisms. Clinical
Immunology 95:173–181.
Farci, P., Shimoda, A., Coiana, A., Diaz, G., Peddis, G., Melpolder, J. C., Strazzera,
A., Chien, D. Y., Munoz, S. J., Balestrieri, A., Purcell, R. H., and Alter, H. J.
2000. The outcome of acute hepatitis C predicted by the evolution of viral
quasispecies. Science 288:339–344.
Fazekas de St. Groth, S., and Webster, R. G. 1966a. Disquisitions on original
antigenic sin. I. Evidence in man. Journal of Experimental Medicine 124:331–
345.
Fazekas de St. Groth, S., and Webster, R. G. 1966b. Disquisitions on original
antigenic sin. II. Proof in lower creatures. Journal of Experimental Medicine
124:347–361.
Feavers, I. M., Fox, A. J., Gray, S., Jones, D. M., and Maiden, M. C. J. 1996. Antigenic
diversity of meningococcal outer membrane protein PorA has implications
for epidemiological analysis and vaccine design. Clinical and Diagnostic Lab-
oratory Immunology 3:444–450.
Feigelstock, D. A., Mateu, M. G., Valero, M. L., Andreu, D., Domingo, E., and Palma,
E. L. 1996. Emerging foot-and-mouth disease virus variants with antigenically
critical amino acid substitutions predicted by model studies using reference
viruses. Vaccine 14:97–102.
Ferguson, N., Anderson, R., and Gupta, S. 1999. The effect of antibody-depend-
ent enhancement on the transmission dynamics and persistence of multiple-
strain pathogens. Proceedings of the National Academy of Sciences USA 96:
790–794.

280 REFERENCES
Fischetti, V. A. 1991. Streptococcal M protein. Scientific American 264(6):32–39.
Fish, S., Zenowich, E., Fleming, M., and Manser, T. 1989. Molecular analysis
of original antigenic sin. I. Clonal selection, somatic mutation, and isotype
switching during a memory B cell response. Journal of Experimental Medicine
170:1191–1209.
Fleury, D., Barrère, B., Bizebard, T., Daniels, R. S., Skehel, J. J., and Knossow, M.
1999. A complex of influenza hemagglutinin with a neutralizing antibody
that binds outside the virus receptor binding site. Nature Structural Biology
6:530–534.
Fleury, D., Wharton, S. A., Skehel, J. J., Knossow, M., and Bizebard, T. 1998. Anti-
gen distortion allows influenza virus to escape neutralization. Nature Struc-
tural Biology 5:119–123.
Forsyth, K. P., Philip, G., Smith, T., Kum, E., Southwell, B., and Brown, G. V. 1989.
Diversity of antigens expressed on the surface of the erythrocytes infected
with mature Plasmodium falciparum parasites in Papua New Guinea. Ameri-
can Journal of Tropical Medicine and Hygiene 41:259–265.
Foster, C. B., Lehrnbecher, T., Samuels, S., Stein, S., Mol, F., Metcalf, J. A., Wyvill,
K., Steinberg, S. M., Kovacs, J., Blauvelt, A., Yarchoan, R., and Chanock, S. J.
2000. An IL6 promoter polymorphism is associated with a lifetime risk of
development of Kaposi sarcoma in men infected with human immunodefi-
ciency virus. Blood 96:2562–2567.
Fox, G., Parry, N. R., Barnett, P. V., McGinn, B., Rowlands, D. J., and Brown, F.
1989. The cell attachment site on foot-and-mouth disease virus includes the
amino acid sequence RGD (arginine-glycine-aspartic acid). Journal of General
Virology 70:625–637.
Francis, T. 1953. The newe acquayantance. Annals of Internal Medicine 39:203–
212.
Franco, A., Ferrari, C., Sette, A., and Chisari, F. V. 1995. Viral mutations, TCR
antagonism and escape from the immune response. Current Opinion in Im-
munology 7:524–531.
Frank, S. A. 1993. Coevolutionary genetics of plants and pathogens. Evolutionary
Ecology 7:45–75.
Frank, S. A. 1994. Recognition and polymorphism in host-parasite genetics.
Philosophical Transactions of the Royal Society of London B 346:283–293.
Frank, S. A. 1996. Models of parasite virulence. Quarterly Review of Biology
71:37–78.
Frank, S. A. 1999. A model for the sequential dominance of antigenic variants in
African trypanosome infections. Proceedings of the Royal Society of London
B 266:1397–1401.
Frank, S. A. 2001. Multiplicity of infection and the evolution of hybrid incom-
patibility in segmented viruses. Heredity 87:522–529.
Fry, E. E., Lea, S. M., Jackson, T., Newman, J. W. I., Ellard, F. M., Blakemore, W. E.,
Abu-Ghazaleh, R., Samuel, A., King, A. M. Q., and Stuart, D. I. 1999. The struc-

REFERENCES 281
ture and function of foot-and-mouth disease virus-oligosaccharide receptor
complex. EMBO Journal 18:543–554.
Fujita, K., Maeda, K., Yokoyama, N., Miyazawa, T., Kai, C., and Mikami, T. 1998.
In vitro recombination of feline herpesvirus type 1. Archives of Virology
143:25–34.
Fussenegger, M. 1997. Different lifestyles of human pathogenic procaryotes and
their strategies for phase and antigenic variation. Symbiosis 22:85–153.
Fussenegger, M., Rudel, T., Barten, R., Ryll, R., and Meyer, T. F. 1997. Transfor-
mation competence and type-1 pilus biogenesis in Neisseria gonorrhoeae: a
review. Gene 192:125–134.
Gao, P., Robertson, D. L., Carruthers, C. D., Li, Y., Bailes, E., Kosrikis, L. G., Salmi-
nen, M. O., Bibollet-Ruche, F., Peeters, M., Ho, D. D., Shaw, G. M., Sharp, P. M.,
and Hahn, B. H. 1998. An isolate of human immunodeficiency virus type 1
originally classified as subtype I represents a complex mosaic comprising
three different group M subtypes (A, G, and I). Journal of Virology 72:10234–
10241.
Germain, R. N., and Štefanová, I. 1999. The dynamics of T cell receptor signaling:
complex orchestration and the key roles of tempo and cooperation. Annual
Review of Immunology 17:467–522.
Ghany, M. G., Ayola, B., Villamil, F. G., Gish, R. G., Rojter, S., Vierling, J. M., and
Lok, A. S. F. 1998. Hepatitis B virus S mutants in liver transplant recipients
who were reinfected despite hepatitis B immune globulin prophylaxis. Hep-
atology 27:213–222.
Gianfrani, C., Oseroff, C., Sidney, J., Chesnut, R. W., and Sette, A. 2000. Human
memory CTL response specific for influenza A virus is broad and multispe-
cific. Human Immunology 61:438–452.
Gilbert, S. C., Plebanski, M., Gupta, S., Morris, J., Cox, M., Aidoo, M., Kwiatkowski,
D., Greenwood, B. M., Whittle, H. C., and Hill, A. V. S. 1998. Association of
malaria parasite population structure, HLA, and immunological antagonism.
Science 279:1173–1177.
Golub, E. S., and Green, D. R. 1991. Immunology: A Synthesis, 2d ed. Sinauer
Associates, Sunderland, Massachusetts.
Good, M. F., Zevering, Y., Currier, J., and Bilsborough, J. 1993. Original anti-
genic sin, T cell memory, and malaria sporozoite immunity: an hypothesis
for immune evasion. Parasite Immunology 15:187–193.
Goulder, P. J. R., Brander, C., Tang, Y., Tremblay, C., Colbert, R. A., Addo, M. M.,
Rosenberg, E. S., Nguyen, T., Allen, R., Trocha, A., Altfeld, M., He, S., Bunce,
M., Funkhouser, R., Pelton, S. I., Burchett, S. K., McIntosh, K., Korber, B. T. M.,
and Walker, B. D. 2001. Evolution and transmission of stable CTL escape
mutations in HIV infection. Nature 412:334–338.
Gow, P. J., and Mutimer, D. 2000. Mechanisms of hepatitis B virus escape after
immunoglobulin therapy. Current Opinion in Infectious Disease 13:643–646.
Gras-Masse, H., Georges, B., Estaquier, J., Tranchand-Bunel, D., Tartar, A., Druil-
282 REFERENCES
he, P., and Auriault, C. 1999. Convergent peptide libraries, or mixotopes, to
elicit or to identify specific immune responses. Current Opinion in Immunol-
ogy 11:223–228.
Gravenor, M. B., and Lloyd, A. L. 1998. Reply to: models for the in-host dynamics
of malaria revisited: errors in some basic models lead to large over-estimates
of growth rates. Parasitology 117:409–410.
Gravenor, M. B., McLean, A. R., and Kwiatkowski, D. 1995. The regulation of
malaria parasitaemia: parameter estimates for a population model. Para-
sitology 110:115–122.
Gray, A. R. 1965. Antigenic variation in a strain of Trypanosoma brucei trans-
mitted by Glossina morsitans and G. palpalis. Journal of General Microbiology
41:195–214.
Gray, D. 2000. Thanks for the memory. Nature Immunology 1:11–12.
Gray-Owen, S. D., Lorenzen, D. R., Haude, A., Meyer, T. F., and Dehio, C. 1997.
Differential Opa specificities for CD66 receptors influence tissue interac-
tions and cellular response to Neisseria gonorrhoeae. Molecular Microbiology
26:971–980.
Griffin, D. E. 2001. Measles virus. In Knipe, D. M., and Howley, P. M., eds., Fields
Virology, 4th ed., pp. 1401–1441. Lippincott-Raven, Philadelphia.
Gross, M. D., and Siegel, E. C. 1981. Incidence of mutator strains in Escherichia
coli and coliforms in nature. Mutation Research 91:107–110.
Guardiola, J., Maffei, A., Lauster, R., Mitchison, N. A., Accolla, R. S., and Sartoris,
S. 1996. Functional significance of polymorphism among MHC class II gene
promoters. Tissue Antigens 48:615–625.
Gubbels, M.-J., Katzer, F., Hide, G., Jongejan, F., and Shiels, B. R. 2000. Gen-
eration of a mosaic pattern of diversity in the major merozoite-piroplasm
surface antigen of Theileria annulata. Molecular and Biochemical Parasitol-
ogy 110:23–32.
Guillot, S., Caro, V., Cuervo, N., Korotkova, E., Combiescu, M., Persu, A., Aubert-
Combiescu, A., Delpeyroux, F., and Crainic, R. 2000. Natural genetic ex-
changes between vaccine and wild poliovirus strains in humans. Journal
of Virology 74:8434–8443.
Gupta, S., and Day, K. P. 1994. A strain theory of malaria transmission. Para-
sitology Today 10:476–481.
Gupta, S., Ferguson, N., and Anderson, R. 1998. Chaos, persistence, and evo-
lution of strain structure in antigenically diverse infectious agents. Science
280:912–915.
Gupta, S., Maiden, M. C. J., and Anderson, R. M. 1999. Population structure of
pathogens: the role of immune selection. Parasitology Today 15:497–501.
Gupta, S., Maiden, M. C. J., Feavers, I. M., Nee, S., May, R. M., and Anderson, R. M.
1996. The maintenance of strain structure in populations of recombining
infectious agents. Nature Medicine 2:437–442.
Gupta, S. C., Hengartner, H., and Zinkernagel, R. M. 1986. Primary antibody
REFERENCES 283
responses to a well-defined and unique antigen are not enhanced by preim-
munization with carrier: analysis in a viral model. Proceedings of the National
Academy of Sciences USA 83:2604–2608.
Gutjahr, T. S., O’Rourke, M., Ison, C. A., and Spratt, B. G. 1997. Arginine-,
hypoxanthine-, uracil-requiring isolates of Neisseria gonorrhoeae are a clonal
lineage within a non-clonal population. Microbiology 143:633–640.
Guttman, D. S. 1997. Recombination and clonality in natural populations of
Escherichia coli. Trends in Ecology and Evolution 12:16–22.
Haanen, J. B. A. G., Wolkers, M. C., Kruisbeek, A. M., and Schumacher, T. N. M.
1999. Selective expansion of cross-reactive CD8+ memory T cells by viral
variants. Journal of Experimental Medicine 190:1319–1328.
Hackstadt, T. 1999. Cell biology. In Stephens, R. S., ed., Chlamydia: Intracellu-
lar Biology, Pathogenesis, and Immunity, pp. 101–138. American Society for
Microbiology, Washington, D.C.
Hajós, J. P., Pijnenburg, J., Usmany, M., Zuidema, D., Závadszky, P., and Vlak, J. M.
2000. High frequency recombination between homologous baculoviruses in
cell culture. Archives of Virology 145:159–164.
Harindranath, N., Ikematsu, H., Notkins, A. L., and Casali, P. 1993. Structure
of the VH and VL segments of polyreactive and monoreactive human nat-
ural antibodies to HIV-1 and Escherichia coli β-galactosidase. International
Immunology 5:1523–1533.
Harrigan, P. R., Bloor, S., and Larder, B. A. 1998. Relative replicative fitness of
zidovudine-resistant human immunodeficiency virus type 1 isolates in vitro.
Journal of Virology 72:3773–3778.
Harrison, S. C. 1989. Picornaviruses: finding the receptors. Nature 338:205–206.
Hartl, D. L., and Clark, A. G. 1997. Principles of Population Genetics, 3d ed.
Sinauer Associates, Sunderland, Massachusetts.
Hartl, D. L., and Taubes, C. H. 1996. Compensatory nearly neutral mutations:
selection without adaptation. Journal of Theoretical Biology 182:303–309.
Hasegawa, M., Di Rienzo, A., Kocher, T. D., and Wilson, A. C. 1993. Toward a
more accurate time scale for the human mitochondrial DNA tree. Journal of
Molecular Evolution 37:347–354.
Hastings, I. M., and Wedgwood-Oppenheim, B. 1997. Sex, strains and virulence.
Parasitology Today 13:375–383.
Hauser, S. L. 1995. T-cell receptor genes. Annals of the New York Academy of
Sciences 756:233–240.
Haydon, D. T., Bastos, A. D., Knowles, N. J., and Samuel, A. R. 2001. Evidence for
positive selection in foot-and-mouth disease virus capsid genes from field
isolates. Genetics 157:7–15.
Haydon, D. T., and Woolhouse, M. E. J. 1998. Immune avoidance strategies in
RNA viruses: fitness continuums arising from trade-offs between immuno-
genicity and antigenic variability. Journal of Theoretical Biology 193:601–
612.
284 REFERENCES
Haywood, A. M. 1994. Virus receptors: binding, adhesion strengthening, and
changes in viral structure. Journal of Virology 68:1–5.
Hedrick, P. W. 2000. Genetics of Populations, 2d ed. Jones and Bartlett, Boston.
Hetzel, C., and Anderson, R. M. 1996. The within-host cellular dynamics of
bloodstage malaria: theoretical and experimental studies. Parasitology 113:
25–38.
Hide, G., Welburn, S. C., Tait, A., and Maudlin, I. 1994. Epidemiological relation-
ships of Trypanosoma brucei stocks from south east Uganda: evidence for
different population structures in human infective and non-human infective
isolates. Parasitology 109:95–111.
Hill, A. V. S. 1998. The immunogenetics of human infectious diseases. Annual
Review of Immunology 16:593–617.
Hillis, D. M., Moritz, C., and Mable, B. K., eds. 1996. Molecular Systematics. Sin-
auer Associates, Sunderland, Massachusetts.
Hiromoto, Y., Saito, T., Lindstrom, S. E., Li, Y., Nerome, R., Sugita, S., Shinjoh, M.,
and Nerome, K. 2000. Phylogenetic analysis of the three polymerase genes
(PB1, PB2 and PA) of the influenza B virus. Journal of General Virology 81:929–
937.
Hoe, N. P., Nakashima, K., Lukomski, S., Grigsby, D., Liu, M., Kordari, P., Dou, S.-
J., Pan, X., Vuopio-Varkila, J., Salmelinna, S., McGeer, A., Low, D. E., Schwartz,
B., Schuchat, A., Naidich, S., de Lorenzo, D., Fu, Y.-X., and Musser, J. M. 1999.
Rapid selection of complement-inhibiting protein variants in group A stre-
pococcus epidemic waves. Nature Medicine 5:924–929.
Hohler, T., Gerken, G., Notghi, A., Lubjuhn, R., Taheri, H., Protzer, U., Lohr, H. F.,
Schneider, P. M., Meyer zum Buschenfelde, K. H., and Rittner, C. 1997. HLA-
DRB1*1301 and *1302 protect against chronic hepatitis B. Journal of Hepa-
tology 26:503–507.
Holland, J. J., ed. 1992. Genetic Diversity of RNA Viruses. Springer-Verlag, New
York.
Hollingshead, S. K., Fischetti, V. A., and Scott, J. R. 1986. Complete nucleotide se-
quence of type 6 M protein of the group A streptococcus: repetitive structure
and membrane anchor. Journal of Biological Chemistry 261:1677–1686.
Hollingshead, S. K., Fischetti, V. A., and Scott, J. R. 1987. Size variation in group
A streptococcal protein is generated by homologous recombination between
intragenic repeats. Molecular and General Genetics 207:196–203.
Holmes, E. C., Zhang, L. Q., Simmonds, P., Ludlam, C. A., and Leigh Brown, A. J.
1992. Convergent and divergent sequence evolution in the surface enve-
lope glycoprotein of human immunodeficiency virus type 1 within a single
infected patient. Proceedings of the National Academy of Sciences 89:4835–
4839.
Housworth, W. J., and Spoon, M. M. 1971. The age distribution of excess mortal-
ity during A2 Hong Kong influenza outbreaks. American Journal of Epidemi-
ology 94:348–350.
Hughes, A. L. 1992. Positive selection and interallelic recombination at the mero-
REFERENCES 285
zoite surface antigen-1 (MSA-1) locus of Plasmodium falciparum. Molecular
Biology and Evolution 9:381–393.
Hughes, A. L. 1999. Adaptive Evolution of Genes and Genomes. Oxford University
Press, Oxford.
Hughes, A. L., and Verra, F. 2001. Very large long-term effective population size
in the virulent human malaria parasite Plasmodium falciparum. Proceedings
of the Royal Society of London Series B Biological Sciences 268:1855–1860.
Hughes, M. K., and Hughes, A. L. 1995. Natural selection on Plasmodium surface
proteins. Molecular and Biochemical Parasitology 71:99–113.
Hulst, M. M., van Gennip, H. G. P., and Moormann, R. J. M. 2000. Passage of
classical swine fever virus in cultured swine kidney cells selects virus variants
that bind to heparan sulfate due to a single amino acid change in envelope
protein Erns. Virology 276:93–103.
Hurwitz, J. L., Heber-Katz, E., Hackett, C. J., and Gerhard, W. 1984. Characteriza-
tion of the murine TH response to influenza virus hemagglutinin: evidence
for three major specificities. Journal of Immunology 133:3371–3377.
Hynes, R. O. 1992. Integrins: versatility, modulation, and signaling in cell adhe-
sion. Cell 69:11–25.
Icenogle, J. C., Shiwen, H., Duke, G., Gilbert, S., Rueckert, R., and Anderegg, J.
1983. Neutralization of poliovirus by a monoclonal antibody: kinetics and
stoichiometry. Virology 127:412–425.
Iida, S., Meyer, J., Kennedy, K. E., and Arber, W. 1982. A site-specific, conserva-
tive recombination system carried by bacteriophage P1: mapping the recom-
binase gene cin and the crossover sites cix for the inversion of the C-segment.
EMBO Journal 1:1445–1453.
Iqbal, J., Perlmann, P., and Berzins, K. 1993. Serologic diversity of antigens
expressed on the surface of Plasmodium falciparum infected erythrocytes in
Punjab (Pakistan). Transactions of the Royal Society of Tropical Medicine and
Hygiene 87:583–588.
Jackson, T., Blakemore, W., Newman, J. W. I., Knowles, N. J., Mould, A. P., Hum-
phries, M. J., and King, A. M. Q. 2000. Foot-and-mouth disease virus is a
ligand for the high-affinity binding conformation of integrin α5β1: influence
of the leucine residue within the RGDL motif on selectivity of integrin bind-
ing. Journal of General Virology 81:1383–1391.
Jackson, T., Ellard, F. M., Abu-Ghazaleh, R., Brookes, S. M., Blakemore, W. E.,
Corteyn, A. H., Stuart, D. I., Newman, J. W. I., and King, A. M. Q. 1996. Efficient
infection of cells in culture by type O foot-and-mouth disease virus requires
binding to cell surface heparan sulfate. Journal of Virology 70:5282–5287.
Jackson, T., Sheppard, D., Denyer, M., Blakemore, W. E., and King, A. M. Q. 2000.
The epithelial integrin ανβ6 is a receptor for foot-and-mouth disease virus.
Journal of Virology 74:4949–4956.
Jameson, S. C., and Bevan, M. J. 1995. T cell receptor antagonists and partial
agonists. Immunity 2:1–11.
Jamieson, B. D., and Ahmed, R. 1989. T cell memory: long-term persistence of

286 REFERENCES
virus-specific cytotoxic T cells. Journal of Experimental Medicine 169:1993–
2005.
Janeway, Jr., C. A. 1993. How the immune system recognizes invaders. Scientific
American 269(3):73–79.
Janeway, Jr., C. A., Travers, P., Capra, J. D., and Walport, M. J. 1999. Immunobi-
ology: The Immune System in Health and Disease. Garland Publishers, New
York.
Jaulin, C., Casanova, J.-L., Romero, P., Luescher, I., Cordey, A.-S., Maryanski, J. L.,
and Kourilsky, P. 1992. Highly diverse T cell recognition of a single Plas-
modium berghei peptide presented by a series of mutant H-2 Kd molecules.
Immunity 4:47–55.
Jenni, L., Marti, S., Schweizer, J., Betschart, B., Le Page, R. W. F., Wells, J. M., Tait,
A., Paindavoine, P., Pays, E., and Steinert, M. 1986. Hybrid formation between
trypanosomes during cyclical transmission. Nature 322:173–175.
Jensen, L. T., Laderoged, S., Birkelund, S., and Christiansen, G. 1995. Selection of
Mycoplasma hominis PG21 deletion mutants by cultivation in the presence
of monoclonal antibody 552. Infection and Immunity 63:3336–3347.
Jetzt, A. E., Yu, H., Klarmann, G. J., Ron, Y., Preston, B. D., and Dougherty, J. P.
2000. High rate of recombination throughout the human immunodeficiency
virus type 1 genome. Journal of Virology 74:1234–1240.
Jung, H. C., Kim, J. M., Song, I. S., and Kim, C. Y. 1997. Heliobacter pylori induces
an array of pro-inflammatory cytokines in human gastric epithelial cells:
quantification of mRNA for interleukin-8, -1 α/β, granulocyte-macrophage
colony-stimulating factor, monocyte chemoattractant protein-1 and tumour
necrosis factor-alpha. Journal of Gastroenterology and Hepatology 12:473–
480.
Jyssum, K. 1960. Observations on two types of genetic instability in Escherichia
coli. Acta Pathologica et Microbiologica Scandinavica 48:113–120.
Kamp, D., Kahmann, R., Zipser, D., Broker, T. R., and Chow, L. T. 1978. Inver-
sion of the G DNA segment of phage Mu controls phage infectivity. Nature
271:577–580.
Kaverin, N. V., Smirnov, Y. A., Govorkova, E. A., Rudneva, I. A., Gitelman, A. K.,
Lipatov, A. S., Varich, N. L., Yamnikova, S. S., Makarova, N. V., Webster, R. G.,
and Lvov, D. K. 2000. Cross-protection and reassortment studies with avian
H2 influenza viruses. Archives of Virology 145:1059–1066.
Kawaoka, Y., Krauss, S., and Webster, R. G. 1989. Avian-to-human tranmission of
the PB1 gene of influenza A viruses in the 1957 and 1968 pandemics. Journal
of Virology 63:4603–4608.
Keitel, T., Kramer, A., Wessner, H., Scholz, C., Schneider-Mergener, J., and Höhne,
W. 1997. Crystallographic analysis of anti-p24 (HIV-1) monoclonal antibody
cross-reactivity and polyspecificity. Cell 91:811–820.
Kilbourne, E. D., Laver, W. G., Schulman, J. L., and Webster, R. G. 1968. Antiviral

REFERENCES 287
activity of antiserum specific for an influenza virus neuraminidase. Journal
of Virology 2:281–288.
Kimata, J. T., Kuller, L., Anderson, D. B., Dailey, P., and Overbaugh, J. 1999.
Emerging cytopathic and antigenic simian immunodeficiency virus variants
influence AIDS progression. Nature Medicine 5:535–541.
Kimura, M. 1983. The Neutral Theory of Molecular Evolution. Cambridge Uni-
versity Press, Cambridge.
Klenerman, P., Rowland-Jones, S., McAdam, S., Edwards, J., Daenke, S., Lalloo,
D., Koppe, B., Rosenberg, W., Boyd, D., and Edwards, A. 1994. Cytotoxic T-
cell activity antagonized by naturally occurring HIV-1 Gag variants. Nature
369:403–407.
Klenerman, P., and Zinkernagel, R. M. 1998. Original antigenic sin impairs cy-
totoxic T lymphocyte responses to viruses bearing variant epitopes. Nature
394:482–485.
Klimstra, W. B., Ryman, K. D., and Johnston, R. E. 1998. Adaptation of Sindbis vi-
rus to BHK cells selects for use of heparan sulfate as an attachment receptor.
Journal of Virology 72:7357–7366.
Knipe, D. M., and Howley, P. M., eds. 2001. Fields Virology, 4th ed. Lippincott-
Raven, Philadelphia.
Kollmann, T. R., Pettoello-Mantovani, M., Katopodis, N. F., Hachamvitch, M., Ru-
binstein, A., Kim, A., and Goldstein, H. 1996. Inhibition of acute in vivo hu-
man immunodeficiency virus infection by human interleukin 10 treatment
of SCID mice implanted with human fetal thymus and liver. Proceedings of
the National Academy of Sciences USA 93:3126–3131.
Korber, B., Muldoon, M., Theiler, J., Gao, F., Gupta, R., Lapedes, A., Hahn, B. H.,
Wolinsky, S., and Bhattacharya, T. 2000. Timing the ancestor of the HIV-1
pandemic strains. Science 288:1789–1796.
Kosinski, R. J. 1980. Antigenic variation in trypanosomes: a computer analysis
of variant order. Parasitology 80:343–357.
Kostolanský, F., Varecková, E., Betáková, T., Mucha, V., Russ, G., and Wharton,
S. A. 2000. The strong positive correlation between effective affinity and
infectivity neutralization of highly cross-reactive monoclonal antibody IIB4,
which recognizes antigenic site B on influenza A virus haemagglutinin. Jour-
nal of General Virology 81:1727–1735.
Kramer, A., Keitel, T., Winkler, K., Stöcklein, W., Höhne, W., and Schneider-Mer-
gener, J. 1997. Molecular basis for the binding promiscuity of an anti-p24
(HIV-1) monoclonal antibody. Cell 91:799–809.
Kropshofer, H., Hämmerling, G. J., and Vogt, A. B. 1999. The impact of the
non-classical MHC proteins HLA-DM and HLA-DO on loading of MHC class II
molecules. Immunological Reviews 172:267–278.
Kumar, V., Bansal, V. J., Rao, K. V. S., and Jameel, S. 1992. Hepatitis B virus
envelope epitopes: gene assembly and expression in Escherichia coli of an
288 REFERENCES
immunologically reactive novel multiple-epitope polypeptide 1 (MEP-1). Gene
110:137–144.
Kuno, G., Chang, G.-J., Tsuchiya, K. R., Karabatsos, N., and Cropp, C. B. 1998.
Phylogeny of the genus Flavivirus. Journal of Virology 72:73–83.
Laeeq, S., Smith, C. A., Wagner, S. D., and Thomas, D. B. 1997. Preferential se-
lection of receptor-binding variants of influenza virus hemagglutinin by the
neutralizing antibody repertoire of transgenic mice expressing a human im-
munoglobulin µ minigene. Journal of Virology 71:2600–2605.
Lamb, R. A., and Krug, R. M. 2001. Orthomyxoviridae: the viruses and their
replication. In Knipe, D. M., and Howley, P. M., eds., Fields Virology, 4th ed.,
pp. 1487–1531. Lippincott-Raven, Philadelphia.
Lambkin, R., and Dimmock, N. J. 1996. Longitudinal study of an epitope-biased
serum haemagglutinin-inhibition antibody response in rabbits immunized
with type A influenza virions. Vaccine 14:212–218.
Lambkin, R., McLain, L., Jones, S. E., Aldridge, S. L., and Dimmock, N. J. 1994.
Neutralization escape mutants of type A influenza virus are readily selected
by antisera from mice immunized with whole virus: a possible mechanism
for antigenic drift. Journal of General Virology 75:3493–3502.
Lancefield, R. C. 1962. Current knowledge of type-specific M antigens of group
A streptococci. Journal of Immunology 89:307–313.
Landweber, L. F. 1999. Experimental RNA evolution. Trends in Ecology and
Evolution 14:353–358.
Larsen, O., Andersson, S., da Silva, Z., Hedegaard, K., Sandstrom, A., Naucler, A.,
Dias, F., Melbye, M., and Aaby, P. 2000. Prevalences of HTLV-1 infection and
associated risk determinants in an urban population in Guinea–Bissau, West
Africa. Journal of Acquired Immune Deficiency Syndrome 25:157–163.
Latek, R. R., and Unanue, E. R. 1999. Mechanisms and consequences of peptide
selection by the I-Ak class II molecule. Immunological Reviews 172:209–228.
Latham, J. L., and Burgess, A. E. 1977. Elementary Reaction Kinetics, 3d ed.
Butterworths, London.
Laukkanen, T., Carr, J. K., Janssens, W., Liitsola, K., Gotte, D., McCutchan, F. E.,
de Coul, E. O., Cornelissen, M., Heyndrickx, L., and van der Groen, G. 2000.
Virtually full-length subtype F and F/D recombinant HIV-1 from Africa and
South America. Virology 269:95–104.
Lavoie, T. B., Mohan, S., Lipschultz, C. A., Grivel, J.-C., Li, Y., Mainhart, C. R.,
Kam-Morgan, L. N. W., Drohan, W. N., and Smith-Gill, S. J. 1999. Structural
differences among monoclonal antibodies with distinct fine specificities and
kinetic properties. Molecular Immunology 36:1189–1205.
Layne, S. P., Beugelsdijk, T. J., Patel, C. K., Taubenberger, J. K., Cox, N. J., Gust,
I. D., Hay, A. J., Tashiro, M., and Lavanchy, D. 2001. A global lab against
influenza. Science 293:1729.
LeClerc, J. E., Li, B., Payne, W. L., and Cebula, T. A. 1996. High mutation frequen-
cies among Escherichia coli and Salmonella pathogens. Science 274:1208–
1211.

REFERENCES 289
Leigh, E. G. 1970. Natural selection and mutability. American Naturalist 104:
301–305.
Lescar, J., Pellegrini, M., Souchon, H., Tello, D., Poljak, R. J., Peterson, N., Greene,
M., and Alzari, P. M. 1995. Crystal structure of a cross-reaction complex be-
tween Fab F9.13.7 and guinea fowl lysozyme. Journal of Biological Chemistry
270:18067–18076.
Levin, B. R., and Bull, J. J. 1994. Short-sighted evolution and the virulence of
pathogenic microorganisms. Trends in Microbiology 2:76–81.
Levinson, G., and Gutman, G. A. 1987. Slipped-strand mispairing: a major mech-
anism for DNA sequence evolution. Molecular Biology and Evolution 4:203–
221.
Li, C. C. 1976. First Course in Population Genetics. Boxwood Press, Pacific Grove,
California.
Li, W.-H. 1997. Molecular Evolution. Sinauer Associates, Sunderland, Massachu-
setts.
Liang, S., Mozdzanowska, K., Palladino, G., and Gerhard, W. 1994. Heterosub-
typic immunity to influenza type A virus in mice. Journal of Immunology
152:1653–1661.
Liebert, U. G., Flanagan, S. G., Loffler, S., Baczko, K., ter Meulen, V., and Rima, B. K.
1994. Antigenic determinants of measles virus hemagglutinin associated
with neurovirulence. Journal of Virology 68:1486–1493.
Lin, J., Andreasen, V., and Levin, S. A. 1999. Dynamics of influenza A drift: the
linear three-strain model. Mathematical Biosciences 162:33–51.
Lindstrom, S. E., Hiromoto, Y., Nerome, R., Omoe, K., Sugita, S., Yamazaki, Y.,
Takahashi, T., and Nerome, K. 1998. Phylogenetic analysis of the entire ge-
nome of influenza A (H3N2) viruses from Japan: evidence for genetic reas-
sortment of the six internal genes. Journal of Virology 72:8021–8031.
Lindstrom, S. E., Hiromoto, Y., Nishimura, H., Saito, T., Nerome, R., and Nerome,
K. 1999. Comparative analysis of evolutionary mechanisms of the hemagglu-
tinin and three internal protein genes of inflenza B virus: multiple cocirculat-
ing lineages and frequent reassortment of the NP, M, and NS genes. Journal
of Virology 73:4413–4426.
Llorente, M., Sánchez-Palomino, S., Mañes, S., Luca, P., Kremer, L., de Alborán,
I. M., Torán, J. L., Alcamí, J., del Real, G., and Martínez-A., C. 1999. Nat-
ural human antibodies retrieved by phage display libraries from healthy
donors: polyreactivity and recognition of human immunodeficiency virus
type 1 gp120 epitopes. Scandinavian Journal of Immunology 50:270–279.
Lord, C. C., Barnard, B., Day, K., Hargrove, J. W., McNamara, J. J., Paul, R. E. L.,
Trenholme, K., and Woolhouse, M. E. J. 1999. Aggregation and distribution
of strains in microparasites. Philosophical Transactions of the Royal Society
of London B 354:799–807.
Louis, P., Eliaou, J.-F., Kerlan-Candon, S., Pinet, V., Vincent, R., and Clot, J. 1993.
Polymorphism in the regulatory region of HLA-DRB genes correlating with
haplotype evolution. Immunogenetics 38:21–26.
290 REFERENCES
Louis, P., Vincent, R., Cavadore, P., Clot, J., and Eliaou, J.-F. 1994. Differential
transcriptional activities of HLA-DR genes in the various haplotypes. Journal
of Immunology 153:5059–5067.
MacLeod, A., Turner, C. M. R., and Tait, A. 1999. A high level of mixed T. bru-
cei infections in tsetse flies detected by three hypervariable minisatellites.
Molecular and Biochemical Parasitology 102:237–248.
MacLeod, A., Tweedie, A., Welburn, S. C., Maudlin, I., Turner, C. M. R., and Tait, A.
2000. Minisatellite marker analysis of Trypanosoma brucei: reconciliation of
clonal, panmictic, and epidemic population genetic structures. Proceedings
of the National Academy of Sciences USA 97:13442–13447.
Madrenas, J. 1999. Differential signalling by variant ligands of the T cell receptor
and the kinetic model of T cell activation. Life Sciences 64:717–731.
Malorny, B., Morelli, G., Kusecek, B., Kolberg, J., and Achtman, M. 1998. Sequence
diversity, predicted two-dimensional protein structure, and epitope mapping
of neisserial Opa proteins. Journal of Bacteriology 180:1323–1330.
Man, S., Newberg, M. H., Crotzer, V. L., Luckey, C. J., Williams, N. S., Chen, Y.,
Huczko, E. L., Ridge, J. P., and Engelhard, V. H. 1995. Definition of a human T
cell epitope from influenza A non-structural protein 1 using HLA-A2.1 trans-
genic mice. International Immunology 7:597–605.
Man, S., Ridge, J. P., and Engelhard, V. H. 1994. Diversity and dominance among
TCR recognizing HLA-A2.1(+) influenza matrix peptide in human MHC class
I transgenic mice. Journal of Immunology 153:4458–4467.
Manz, R. A., Löhning, M., Cassese, G., Theil, A., and Radbruch, A. 1998. Survival of
long-lived plasma cells is independent of antigen. International Immunology
10:1703–1711.
Mao, E. F., Lane, L., Lee, J., and Miller, J. H. 1997. Proliferation of mutators in a
cell population. Journal of Bacteriology 179:417–422.
Marrs, C. F., Reuhl, W. W., Schoolnik, G. K., and Falkow, S. 1988. Pilin gene
phase variation of Moraxella bovis is caused by an inversion of the pilin gene.
Journal of Bacteriology 170:3032–3039.
Marsh, K., and Howard, R. J. 1986. Antigens induced on erythrocytes by P. falci-
parum: expression of diverse and conserved determinants. Science 231:150–
153.
Marsh, S. G. E., Parham, P., and Barber, L. D. 2000. The HLA FactsBook. Academic
Press, San Diego.
Marshall, D., Sealy, R., Sangster, M., and Coleclough, C. 1999. TH cells primed
during influenza virus infection provide help for qualitatively distinct anti-
body responses to subsequent immunization. Journal of Immunology 163:
4673–4682.
Martin, D. R., and Single, L. A. 1993. Molecular epidemiology of group A strepto-
coccus-M type-1 infections. Journal of Infectious Diseases 167:1112–1117.
Martin, D. W., and Weber, P. C. 1997. DNA replication promotes high-frequency
homologous recombination during Autograha californica multiple nuclear
polyhedrosis virus infection. Virology 232:300–309.
REFERENCES 291
Martín, J., Wharton, S. A., Lin, Y. P., Takemoto, D. K., Skehel, J. J., Wiley, D. C.,
and Steinhauer, D. A. 1998. Studies of the binding properties of influenza
hemagglutinin receptor-site mutants. Virology 241:101–111.
Martínez, M. A., Verdaguer, N., Mateu, M. G., and Domingo, E. 1997. Evolution
subverting essentiality: dispensability of the cell attachment Arg-Gly-Asp mo-
tif in multiply passaged foot-and-mouth disease virus. Proceedings of the
National Academy of Sciences USA 94:6798–6802.
Martinson, J. J., Chapman, N. H., Rees, D. C., Liu, Y.-T., and Clegg, J. B. 1997.
Global distribution of the CCR5 gene 32-basepair deletion. Nature Genetics
16:100–103.
Maryanski, J. L., Attuil, V., Bucher, P., and Walker, P. R. 1999. A quantitative,
single-cell PCR analysis of an antigen-specific TCR repertoire selected during
an in vivo CD8 response: direct evidence for a wide range of clone sizes with
uniform tissue distribution. Molecular Immunology 36:745–753.
Maryanski, J. L., Casanova, J.-L., Falk, K., Gournier, H., Jaulin, C., Kourilsky, P.,
Lemonier, F. A., Luthy, R., Rammensee, H. G., Rotzschke, O., Servis, C., and
Lopez, J. A. 1997. The diversity of antigen-specific TCR repertoires reflects
the relative complexity of epitopes recognized. Human Immunology 54:117–
128.
Maryanski, J. L., Jongeneel, C. V., Bucher, P., Casanova, J.-L., and Walker, P. R.
1996. Single-cell PCR analysis of TCR repertoires selected by antigen in vivo:
a high magnitude CD8 response is comprised of very few clones. Immunity
4:47–55.
Mason, D. 1999. A very high level of crossreactivity is an essential feature of
the T-cell receptor. Immunology Today 19:395–404.
Masurel, N. 1969. Serological characteristics of a ‘new’ serotype of influenza
A virus: the Hong Kong strain. Bulletin of the World Health Organization
41:461–468.
Masurel, N. 1976. Swine influenza virus and the recycling of influenza A viruses
in man. Lancet 22:244–247.
Mateu, M. G. 1995. Antibody recognition of picornaviruses and escape from
neutralization: a structural view. Virus Research 38:1–24.
Mateu, M. G., Escarmís, C., and Domingo, E. 1998. Mutational analysis of dis-
continuous epitopes of foot-and-mouth disease virus using an unprocessed
capsid promoter precursor. Virus Research 53:27–37.
Mateu, M. G., Hernández, J., Martínez, M. A., Feigelstock, D., Lea, S., Peréz, J. J.,
Giralt, E., Stuart, D., Palma, E. L., and Domingo, E. 1994. Antigenic hetero-
geneity of a foot-and-mouth disease virus serotype in the field is mediated
by very limited sequence variation at several antigenic sites. Journal of Virol-
ogy 68:1407–1417.
Mateu, M. G., Silva, D. A., Rocha, E., De Brum, D. L., Alonso, A., Enjuanes, L.,
Domingo, E., and Barahona, H. 1988. Extensive antigenic heterogeneity of
foot-and-mouth disease virus of serotype C. Virology 167:113–124.
Matrosovich, M., Gao, P., and Kawaoka, Y. 1998. Molecular mechanisms of serum

292 REFERENCES
resistance of human influenza H3N2 virus and their involvement in virus
adaptation in a new host. Journal of Virology 72:6373–6380.
Matrosovich, M., Zhou, N., Kawaoka, Y., and Webster, R. 1999. The surface gly-
coproteins of H5 influenza viruses isolated from humans, chickens, and wild
aquatic birds have distinguishable properties. Journal of Virology 73:1146–
1155.
Matrosovich, M. N., Gambaryan, A. S., Teneberg, S., Piskarev, V. E., Yamnikova,
S. S., Lvov, D. K., Robertson, J. S., and Karlsson, K.-A. 1997. Avian influenza
A viruses differ from human viruses by recognition of sialyloligosaccharides
and gangliosides and by a higher conservation of the HA receptor-binding
site. Virology 233:224–234.
Maynard Smith, J., Smith, N. H., O’Rourke, M., and Spratt, B. G. 1993. How clonal
are bacteria? Proceedings of the National Academy of Sciences USA 90:4384–
4388.
McCutchan, F. E. 1999. Global diversity in HIV. In Crandall, K. A., ed., The Evolu-
tion of HIV, pp. 41–101. Johns Hopkins University Press, Baltimore, Maryland.
McLain, L., and Dimmock, N. J. 1994. Single- and multi-hit kinetics of immuno-
globulin G neutralization of human immunodeficiency virus type 1 by mon-
oclonal antibodies. Journal of General Virology 75:1457–1460.
McMichael, A. J., and Doherty, P. C. 2000. Introduction. Philosophical Transac-
tions of the Royal Society of London B 355:315–316.
McMichael, A. J., Gotch, F. M., Dongworth, D. W., Clark, A., and Potter, C. W.
1983a. Declining T-cell immunity to influenza, 1977–1982. Lancet 2:762–
764.
McMichael, A. J., Gotch, F. M., Noble, G. R., and Beare, P. S. 1983b. Cytotoxic
T-cell immunity to influenza. New England Journal of Medicine 309:13–17.
McMichael, A. J., and Phillips, R. E. 1997. Escape of human immunodeficiency
virus from immune control. Annual Review of Immunology 15:271–296.
Menon, J. N., and Bretscher, P. A. 1998. Parasite dose determines the Th1/Th2
nature of the response to Leishmania major independently of infection route
and strain of host or parasite. European Journal of Immunology 28:4020–
4028.
Meyer, S., Weiss, G., and von Haeseler, A. 1999. Pattern of nucleotide substitution
and rate heterogeneity in the hypervariable regions I and II of human mtDNA.
Genetics 152:1103–1110.
Meyer, T. F. 1987. Molecular basis of surface antigen variation in Neisseria.
Trends in Genetics 3:319–324.
Michod, R. E. 1997. Cooperation and conflict in the evolution of individuality. I.
Multilevel selection of the organism. American Naturalist 149:607–645.
Mills, K., Skehel, J., and Thomas, B. 1986. Extensive diversity in the recogni-
tion of influenza virus hemagglutinin by murine T helper clones. Journal of
Experimental Medicine 163:1477–1490.
Mims, C., Nash, A., and Stephen, J. 2001. Mims Pathogenesis of Infectious Disease,
5th ed. Academic Press, San Diego.
REFERENCES 293
Mims, C., Playfair, J., Roitt, I., Wakelin, D., and Williams, R. 1998. Medical Micro-
biology, 2d ed. Mosby, London.
Mims, C. A. 1987. The Pathogenesis of Infectious Disease, 3d ed. Academic Press,
London.
Mims, C. A., Playfair, J. H. L., Roitt, I. M., Wakelin, D., and Williams, R. 1993.
Medical Microbiology. Mosby, St. Louis, Missouri.
Mitchison, A. 1997. Partitioning of genetic variation between regulatory and
coding gene segments: the predominance of software variation in genes en-
coding introvert proteins. Immunogenetics 46:46–52.
Mitchison, N. A., Muller, B., and Segel, R. M. 2000. Natural variation in immune
responsiveness, with special reference to immunodeficiency and promoter
polymorphism in class II MHC genes. Human Immunology 61:177–181.
Modrow, S., Hahn, B. H., Shaw, G. M., Gallo, R. C., Wong-Staal, F., and Wolf, H.
1987. Computer-assisted analysis of envelope protein sequences of seven
human immunodeficiency isolates: predictions of antigenic epitopes in con-
served and variable regions. Journal of Virology 61:570–578.
Moffatt, M. F., Schou, C., Faux, J. A., and Cookson, W. O. C. M. 1997. Germline TCR-
A restriction of immunoglobulin E responses to allergen. Immunogenetics
46:226–230.
Mohan, K., and Stevenson, M. M. 1998. Acquired immunity to asexual blood
stages. In Sherman, I. W., ed., Malaria: Parasite Biology, Pathogenesis, and
Protection, pp. 467–493. American Society for Microbiology, Washington, D.C.
Montgomery, A. M. P., Reisfeld, R. A., and Cheresh, D. A. 1994. Integrinανβ3 res-
cues melanoma cells from apoptosis in three-dimensional dermal collagen.
Proceedings of the National Academy of Sciences USA 91:8856–8860.
Moody, A. M., Reyburn, H., Willcox, N., and Newsom-Davis, J. 1998. New polymor-
phism of the human T-cell receptor AV28S1 gene segment. Immunogenetics
48:62–64.
Morrison, J., Elvin, J., Latron, F., Gotch, F., Moots, R., Strominger, J. L., and McMi-
chael, A. 1992. Identification of the nonamer peptide from influenza A matrix
protein and the role of pockets of HLA-A2 in its recognition by cytotoxic T
lymphocytes. European Journal of Immunology 22:903–907.
Moskophidis, D., and Zinkernagel, R. M. 1995. Immunobiology of cytotoxic T-cell
escape mutants of lymphocytic choriomeningitis virus. Journal of Virology
69:2187–2193.
Mosser, A. G., Leippe, D., and Rueckert, R. R. 1989. Neutralization of picor-
naviruses: support for the pentamer bridging hypothesis. In Semler, B. L.,
and Ehrenfeld, E., eds., Molecular Aspects of Picornavirus Infection and Detec-
tion, pp. 155–167. American Society for Microbiology, Washington, D.C.
Moxon, E. R., Rainey, P. B., Nowak, M. A., and Lenski, R. E. 1994. Adaptive evolu-
tion of highly mutable loci in pathogenic bacteria. Current Biology 4:24–33.
Moya, A., Elena, S. F., Bracho, A., Miralles, R., and Barrio, E. 2000. The evolu-
tion of RNA viruses: a population genetics view. Proceedings of the National
Academy of Sciences USA 97:6967–6973.
294 REFERENCES
Muñoz-Jordán, J. L., Davies, K. P., and Cross, G. A. M. 1996. Stable expression of
mosaic coats of variant surface glycoproteins in Trypanosoma brucei. Science
272:1795–1797.
Muotiala, A., Seppala, H., Huovinen, P., and Vuopio-Varkila, J. 1997. Molecular
comparison of group A streptococci of T1M1 serotype from invasive and
noninvasive infections in Finland. Journal of Infectious Diseases 175:392–
399.
Murali-Krishna, K., Altman, J. D., Suresh, M., Sourdive, D. J. D., Zajac, A. J., Miller,
J. D., Slansky, J., and Ahmed, R. 1998. Counting antigen-specific CD8 T cells: a
reevaluation of bystander activation during viral infection. Immunity 8:177–
187.
Mylin, L. M., Bonneau, R. H., Lippolis, J. D., and Tevethia, S. S. 1995. Hierar-
chy among multiple H-2b-restricted cytotoxic T-lymphocyte epitopes within
simian virus 40 T antigen. Journal of Virology 69:6665–6677.
Nakagawa, T. Y., and Rudensky, A. Y. 1999. The role of lysosomal proteinases in
MHC class II–mediated antigen processing and presentation. Immunological
Reviews 172:121–129.
Nakajima, S., Nobusawa, E., and Nakajima, K. 2000. Variation in response among
individuals to antigenic sites on the HA protein of human influenza virus may
be responsible for the emergence of drift strains in the human population.
Virology 274:220–231.
Nakra, P., Manivel, V., Vishwakarma, R. A., and Rao, K. V. S. 2000. B cell re-
sponses to a peptide epitope. X. Epitope selection in a primary response is
thermodynamically regulated. Journal of Immunology 164:5615–5625.
Nara, P. L., and Garrity, R. 1998. Deceptive imprinting: a cosmopolitan strategy
for complicating vaccination. Vaccine 16:1780–1787.
Natali, A., Oxford, J. S., and Schild, G. C. 1981. Frequency of naturally occurring
antibody to influenza virus antigenic variants selected in vitro with mono-
clonal antibody. Journal of Hygiene 87:185–191.
Natali, A., Pilotti, E., Valcavi, P. P., Chezzi, C., and Oxford, J. S. 1998. Natural and
‘in vitro’ selected antigenic variants of influenza A virus (H2N2). Journal of
Infection 37:19–23.
Nayak, B. P., Tuteja, R., Manivel, V., Roy, R. P., Vishwakarma, R. A., and Rao, K.
V. S. 1998. B cell responses to a peptide epitope. V. Kinetic regulation of
repertoire discrimination and antibody optimization for epitope. Journal of
Immunology 161:3510–3519.
Nee, S., Holmes, E. C., Rambaut, A., and Harvey, P. H. 1995. Inferring population
history from molecular phylogenies. Philosophical Transactions of the Royal
Society of London B 349:25–31.
Neff, S., Sa-Carvalho, D., Rieder, E., Mason, P. W., Blystone, S. D., Brown, E. J., and
Baxt, B. 1998. Foot-and-mouth disease virus virulent for cattle utilizes the
integrin αvβ3 as its receptor. Journal of Virology 72:3587–3594.
Nei, M. 1987. Molecular Evolutionary Genetics. Columbia University Press, New
York.
REFERENCES 295
Nei, M., and Kumar, S. 2000. Molecular Evolution and Phylogenetics. Oxford
University Press, Oxford.
Neva, F. A. 1977. Looking back for a view of the future: observations of immu-
nity to induce malaria. American Journal of Tropical Medicine and Hygiene
26:211–215.
Newman, A. M., Mainhart, C. R., Mallet, C. P., Lavoie, T. B., and Smith-Gill, S. J.
1992. Patterns of antibody specificity during the BALB/c immune response
to hen egg white lysozyme. Journal of Immunology 149:3260–3272.
Nguyen-Van-Tam, J. S. 1998. Epidemiology of influenza. In Nicholson, K. G.,
Webster, R. G., and Hay, A. J., eds., Textbook of Influenza, pp. 181–206. Black-
well Science, Oxford.
Niedermann, G., Butz, S., Ihlenfeldt, H. G., Grimm, R., Lucchiari, M., Hoschutzky,
H., Jung, G., Maier, B., and Eichmann, K. 1995. Contribution of proteasome-
mediated proteolysis to the hierarchy of epitopes presented by major histo-
compatibility complex class I molecules. Immunity 2:289–299.
Niedermann, G., Geier, E., Lucchiari-Hartz, M., Hitziger, N., Ramsperger, A., and
Eichmann, K. 1999. The specificity of proteasomes: impact on MHC class I
processing and presentation of antigens. Journal of Immunology 158:1507–
1515.
Niedermann, G., King, G., Butz, S., Birsner, U., Grimm, R., Shabanowitz, J., Hunt,
D. F., and Eichmann, K. 1996. The proteolytic fragments generated by verte-
brate proteasomes: structural relationships to major histocompatibility com-
plex class I binding peptides. Proceedings of the National Academy of Sciences
USA 93:8572–8577.
Nielsen, L., Blixenkrone-Møller, M., Thylstrup, M., Hansen, N. J. V., and Bolt,
G. 2001. Adaptation of wild-type measles virus to CD46 receptor usage.
Archives of Virology 146:197–208.
Niewiesk, S., Daenke, S., Parker, C. E., Taylor, G., Weber, J., Nightingale, S., and
Bangham, C. R. M. 1995. Naturally occurring variants of human T-cell leuke-
mia virus type I Tax protein impair its recognition by cytotoxic T lymphocytes
and the transactivation function of Tax. Journal of Virology 69:2649–2653.
Nokes, D. J., Anderson, R. M., and Anderson, M. J. 1986. Rubella epidemiology
in South East England. Journal of Hygiene 86:291–304.
Nowak, M. A., and May, R. M. 2000. Virus Dynamics: Mathematical Principles of
Immunology and Virology. Oxford University Press, Oxford.
Nowak, M. A., May, R. M., Phillips, R. E., Rowland-Jones, S., Lalloo, D. G., McAdam,
S., Klenerman, P., Koppe, B., Sigmund, K., Bangham, C. R. M., et al. 1995.
Antigenic oscillations and shifting immunodominance in HIV-1 infections.
Nature 375:606–611.
Núñez, J. I., Baranowski, E., Molina, N., Ruiz-Jarabo, C. M., Sánchez, C., Domingo,
E., and Sobrino, F. 2001. A single amino acid substitution in nonstructural
protein 3A can mediate adaptation of foot-and-mouth disease virus to the
guinea pig. Journal of Virology 75:3977–3983.
Nyambi, P. N., Lewi, P., Peeters, M., Janssens, W., Heyndrickx, L., Fransen, K.,
296 REFERENCES
Andries, K., Vanden Haesevelde, M., Heeney, J., Piot, P., and van der Groen,
G. 1997. Study of the dynamics of neutralization escape mutants in a chim-
panzee naturally infected with the simian immunodeficiency virus SIVcpz-
ant. Journal of Virology 71:2320–2330.
Nyambi, P. N., Mbah, H. A., Burda, S., Williams, C., Gorny, M. K., Nádas, A., and
Zolla-Pazner, S. 2000a. Conserved and exposed epitopes on intact, native,
primary human immunodeficiency virus type 1 virions of group M. Journal
of Virology 74:7096–7107.
Nyambi, P. N., Nádas, A., Mbah, H. A., Burda, S., Williams, C., Gorny, M. K., and
Zolla-Pazner, S. 2000b. Immunoreactivity of intact virions of human immu-
nodeficiency virus type 1 (HIV-1) reveals the existence of fewer HIV-1 im-
munotypes than genotypes. Journal of Virology 74:10670–10680.
Nyambi, P. N., Nkengasong, J., Lewi, P., Andries, K., Janssens, W., Fransen, K.,
Heyndrickx, L., Piot, P., and van der Groen, G. 1996. Multivariate analysis
of human immunodeficiency virus type 1 neutralization data. Journal of
Virology 70:6235–6243.
O’Brien, S. J., and Dean, M. 1997. In search of AIDS-resistance genes. Scientific
American 277(3):44–51.
Ochman, H., Lawrence, J. G., and Groisman, E. A. 2000. Lateral gene transfer and
the nature of bacterial innovation. Nature 405:299–304.
Ochsenbein, A. F., Fehr, T., Lutz, C., Suter, M., Brombacher, F., Hengartner, H.,
and Zinkernagel, R. M. 1999. Control of early viral and bacterial distribution
and disease by natural antibodies. Science 286:2156–2159.
Ochsenbein, A. F., Pinschewer, D. D., Sierro, S., Horvath, E., Hengartner, H., and
Zinkernagel, R. M. 2000. Protective long-term antibody memory by antigen-
driven and T help-dependent differentiation of long-lived memory B cells to
short-lived plasma cells independent of secondary lymphoid organs. Pro-
ceedings of the National Academy of Sciences 97:13263–13268.
O’hUigin, C., Satta, Y., Hausmann, A., Dawkins, R. L., and Klein, J. 2000. The im-
plications of intergenic polymorphism for major histocompatibility complex
evolution. Genetics 156:867–877.
Oliveira, R. P., Broude, N. E., Macedo, A. M., Cantor, C. R., Smith, C. L., and Pena,
S. D. J. 1998. Probing the genetic population structure of Trypanosoma cruzi
with polymorphic microsatellites. Proceedings of the National Academy of
Sciences USA 95:3776–3780.
Oliveira, R. P., Melo, A. I. R., Macedo, A. M., Chiari, E., and Pena, S. D. J. 1999. The
population structure of Trypanosoma cruzi: expanded analysis of 54 strains
using eight polymorphic CA-repeat microsatellites. Memorias do Instituto
Oswaldo Cruz, 94 (Suppl. 1), 65–70.
Orive, M. E. 1995. Senescence in organisms with clonal reproduction and com-
plex life histories. American Naturalists 145:90–108.
Ossendorp, F., Eggers, M., Neisig, A., Ruppert, T., Groettrup, M., Sijts, A., Men-
gede, E., Kloetzel, P.-M., Neefjes, J., Koszinowski, U., and Melief, C. 1996. A sin-

REFERENCES 297
gle residue exchange within a viral CTL epitope alters proteasome-mediated
degradation resulting in lack of antigen presentation. Immunity 5:115–124.
Otto, S. P. 2000. Detecting the form of selection from DNA sequence data. Trends
in Genetics 16:526–529.
Otto, S. P., and Hastings, I. M. 1998. Mutation and selection within the individual.
Genetica 102/103:507–524.
Overbaugh, J., and Bangham, C. R. M. 2001. Selection forces and constraints on
retroviral sequence variation. Science 292:1106–1109.
Oxford, J. S. 2000. Influenza A pandemics of the 20th century with special
reference to 1918: virology, pathology and epidemiology. Reviews in Medical
Virology 10:119–133.
Page, R. D. M., and Holmes, E. C. 1998. Molecular Evolution: A Phylogenetic
Approach. Blackwell Scientific, Oxford.
Palese, P., and Compans, R. W. 1976. Inhibition of influenza virus replication
in tissue culture by 2-deoxy-2,3-dehydro-N-trifluoro-acetyl-neuraminic acid
(FANA): mechanism of action. Journal of General Virology 33:159–163.
Parker, E. P., Nightingale, S., Taylor, G. P., Weber, J., and Bangham, C. R. M. 1994.
Circulating anti-Tax cytotoxic T lymphocytes from human T-cell leukemia
virus type I–infected people, with and without tropical spastic paraparesis,
recognize multiple epitopes simultaneously. Journal of Virology 68:2860–
2868.
Paul, R. E. L., and Day, K. P. 1998. Mating patterns of Plasmodium falciparum.
Parasitology Today 14:197–202.
Paul, W. E. 1993. Fundamental Immunology. Raven Press, New York.
Paulson, J. C. 1985. Interactions of animal viruses with cell surface receptors.
In Conn, M., ed., The Receptors, pp. 131–219. Academic Press, New York.
Pays, E. 1985. Gene conversion in trypanosome antigenic variation. Progress in
Nucleic Acid Research and Molecular Biology 32:1–26.
Pays, E. 1989. Pseudogenes, chimeric genes and the timing of antigen variation
in African trypanosomes. Trends in Genetics 5:389–391.
Pays, E., Lheureux, M., and Steinert, M. 1981. The expression-linked copy of
the surface antigen gene in Trypanosoma is probably the one transcribed.
Nature 292:265–267.
Pays, E., and Nolan, D. 1998. Expression and function of surface proteins in
Trypanosoma brucei. Molecular and Biochemical Parasitology 91:3–36.
Peng, G., Hongo, S., Kimura, H., Muraki, Y., Sugawara, K., Kitame, F., Numazaki,
Y., Suzuki, H., and Nakamura, K. 1996. Frequent occurrence of genetic re-
assortment between influenza C virus strains in nature. Journal of General
Virology 77:1489–1492.
Peng, G., Hongo, S., Muraki, Y., Sugawara, K., Nishimura, H., Kitame, F., and Naka-
mura, K. 1994. Genetic reassortment of influenza C viruses in man. Journal
of General Virology 75:3619–3622.
Pinilla, C., Martin, R., Gran, B., Appel, J. R., Boggiano, C., Wilson, D. B., and
298 REFERENCES
Houghten, R. A. 1999. Exploring immunological specificity using synthetic
peptide combinatorial libraries. Current Opinion in Immunology 11:193–202.
Pircher, H., Moskophidis, D., Rohrer, U., Burki, K., Hengartner, H., and Zinkerna-
gel, R. M. 1990. Viral escape by selection of cytotoxic T cell–resistant virus
variants in vivo. Nature 346:629–633.
Piyasirisilp, S., McCutchan, F. E., Carr, J. K., Sanders-Buell, E., Liu, W., Chen, J.,
Wagner, R., Wolf, H., Shao, Y., Lai, S., Beyrer, C., and Yu, X.-F. 2000. A re-
cent outbreak of human immunodeficiency virus type 1 infection in south-
ern China was initiated by two highly homogeneous, geographically sepa-
rated strains, circulating recombinant form AE and a novel BC recombinant.
Journal of Virology 74:11286–11295.
Plebanski, M., Lee, E. A. M., Hannan, C. M., Flanagan, K. L., Gilbert, S. C., Gravenor,
M. B., and Hill, A. V. S. 1999. Altered peptide ligands narrow the repertoire
of cellular immune responses by interfering with T-cell priming. Nature
Medicine 5:565–571.
Plotkin, S. A., and Orenstein, W. A., eds. 1999. Vaccines, 3d ed. W. B. Saunders,
Philadelphia.
Porcelli, S. A., and Modlin, R. L. 1999. The CD1 system: antigen-presenting mol-
ecules for T cell recognition of lipids and glycolipids. Annual Review of Im-
munology 17:297–329.
Porter, P. 1972. Immunoglobulins in bovine mammary secretions: quantitative
changes in early lactation and absorption by the neonatal calf. Immunology
23:225–237.
Potts, J. R., and Campbell, I. D. 1994. Fibronectin structure and assembly. Cur-
rent Opinion in Cell Biology 6:648–655.
Power, C. A. 2000. Factors that influence T helper cell response to infection.
Current Opinion in Infectious Diseases 13:209–213.
Prager, E. M. 1993. The sequence-immunology correlation revisited: data for
cetacean myoglobins and mammalian lysozymes. Journal of Molecular Evo-
lution 37:408–416.
Preiser, P. R., Jarra, W., Capiod, T., and Snounou, G. 1999. A rhoptry-protein-
associated mechanism of clonal phenotypic variation in rodent malaria. Na-
ture 398:618–622.
Preston, B. D., and Dougherty, J. P. 1996. Mechanisms of retroviral mutation.
Trends in Microbiology 4:16–21.
Price, D. A., Meier, U.-C., Klenerman, P., Purbhoo, M. A., Phillips, R. E., and Sewell,
A. K. 1998. The influence of antigenic variation on cytotoxic T lymphocyte
responses in HIV-1 infection. Journal of Molecular Medicine 76:699–708.
Price, G. E., Ou, R., Jiang, H., Huang, L., and Moskophidis, D. 2000. Viral es-
cape by selection of cytotoxic T cell–resistant variants in influenza A virus
pneumonia. Journal of Experimental Medicine 191:1853–1867.
Prigozy, T. I., Naidenko, O., Qasba, P., Elewaut, D., Brossay, L., Khurana, A., Natori,
T., Koezuka, Y., Kulkarni, A., and Kronenberg, M. 2001. Glycolipid antigen
processing for presentation by CD1d molecules. Science 291:664–667.

REFERENCES 299
Puel, A., Groot, P. C., Lathrop, M. G., Demant, P., and Mouton, D. 1995. Mapping
of genes controlling quantitative antibody production in Biozzi mice. Journal
of Immunology 154:5799–5805.
Puglielli, M. T., Zajac, A. J., van der Most, R. G., Dzuris, J. L., Sette, A., Altman,
J. D., and Ahmed, R. 2001. In vivo selection of a lymphocytic choriomeningitis
virus variant that affects recognition of the GP330043 epitope by H-2Db but
not H–2Kb . Journal of Virology 75:5099–5107.
Racaniello, V. R. 2001. Picornaviridae: the viruses and their replication. In Knipe,
D. M., and Howley, P. M., eds., Fields Virology, 4th ed., pp. 685–722. Lippincott-
Raven, Philadelphia.
Radman, M. 1999. Enzymes of evolutionary change. Nature 401:866–868.
Rammensee, H. G., Friede, T., and Stefanovic, S. 1995. MHC ligand motifs: first
listing. Immunogenetics 41:178–228.
Rao, K. V. S. 1999. Selection in a T-dependent primary humoral response: new
insights from polypeptide models. APMIS 107:807–818.
Reeder, J. C., and Brown, G. V. 1996. Antigenic variation and immune evasion in
Plasmodium falciparum malaria. Immunology and Cell Biology 74:546–554.
Rehermann, B., Chang, K. M., McHutchison, J., Kokka, R., Houghton, M., Rice,
C. M., and Chisari, F. V. 1996. Differential cytotoxic T-lymphocyte responsive-
ness to the hepatitis B and C virus in chronically infected patients. Journal
of Virology 70:7092–7102.
Reichstetter, S., Krellner, P. H., Meenzen, C. M., Kalden, J. R., and Wassmuth, R.
1994. Comparative analysis of sequence variability in the upstream regula-
tory region of the HLA-DQB1 gene. Immunogenetics 39:207–212.
Reider, E., Baxt, B., and Mason, P. W. 1994. Animal derived antigenic variants of
foot-and-mouth disease virus type A12 have low affinity for cells in culture.
Journal of Virology 68:5296–5299.
Reimann, J., and Schirmbeck, R. 1999. Alternative pathways for processing ex-
ogenous and endogenous antigens that can generate peptides for MHC class
I–restricted presentation. Immunological Reviews 172:131–152.
Revollo, S., Oury, B., Laurent, J.-P., Barnabé, C., Quesney, V., Carriere, V., Noël, S.,
and Tibayrenc, M. 1998. Trypanosoma cruzi: impact of clonal evolution of the
parasite on its biological and medical properties. Experimental Parasitology
89:30–39.
Reyburn, H., Cornélis, F., Russell, V., Harding, R., Moss, P., and Bell, J. 1993.
Allelic polymorphism of human T-cell receptor V alpha gene segments. Im-
munogenetics 38:287–291.
Rich, S. M., Ferreira, M. U., and Ayala, F. J. 2000. The origin of antigenic diversity
in Plasmodium falciparum. Parasitology Today 16:390–396.
Rich, S. M., Sawyer, S. A., and Barbour, A. G. 2001. Antien polymorphism in
Borrelia hermsii, a clonal pathogenic bacterium. Proceedings of the National
Academy of Sciences USA 98:15038–15043.
Richards, F. F., Konigsberg, W. H., Rosenstein, R. W., and Varga, J. M. 1975. On the
specificity of antibodies: biochemical and biophysical evidence indicates the

300 REFERENCES
existence of polyfunctional antibody combining regions. Science 187:130–
137.
Rickinson, A. B., Callan, M. F. C., and Annels, N. E. 2000. T-cell memory: lessons
from Epstein-Barr virus infection in man. Philosophical Transactions of the
Royal Society of London B 355:391–400.
Ripley, L. S. 1999. Predictability of mutant sequences: relationships between
mutational mechanisms and mutant specificity. Annals of the New York
Academy of Sciences 870:159–172.
Robertson, D. L., Anderson, J. P., Bradac, J. A., Carr, J. K., Foley, B., Funkhouser,
R. K., Gao, F., Hahn, B. H., Kalish, M. L., Kuiken, C., Learn, G. H., Leitner, T.,
McCutchan, F., Osmanov, S., Peeters, M., Pieniazek, D., Salminen, M., Sharp,
P. M., Wolinsky, S., and Korber, B. 1999. HIV-1 nomenclature proposal: a refer-
ence guide to HIV-1 classification. In Kuiken, C. L., Foley, B., Hahn, B., Korber,
B., McCutchan, F., Marx, P. A., Mellors, J. W., Mullins, J. I., Sodroski, J., and
Wolinksy, S., eds., Human Retroviruses and AIDS 1999: A Compilation and
Analysis of Nucleic Acid and Amino Acid Sequences, pp. 492–505. Theoretical
Biology and Biophysics Group, Los Alamos National Laboratory, Los Alamos,
New Mexico.
Robertson, D. L., Hahn, B. H., and Sharp, P. M. 1995. Recombination in AIDS
viruses. Journal of Molecular Evolution 40:249–259.
Robertson, J. S. 1993. Clinical influenza virus and the embryonated hen’s egg.
Reviews in Medical Virology 3:97–106.
Robertson, J. S. 1999. An overview of host cell selection. In Brown, F., Robert-
son, J. S., Schild, G. C., and Wood, J. M., eds., Inactivated Influenza Vaccines
Prepared in Cell Culture. Developments in Biological Standards, vol. 98, pp.
7–11. Karger, Basel.
Robertson, J. S., Cook, P., Attwell, A.-M., and Williams, S. P. 1995. Replicative
advantage in tissue culture of egg-adapted influenza virus over tissue-culture
derived virus: implications for vaccine manufacture. Vaccine 13:1583–1588.
Robinson, J., Malik, A., Parham, P., Bodmer, J. G., and Marsh, S. G. E. 2000.
IMGT/HLA database—a sequence database for the human major histocom-
patibility complex. Tissue Antigens 55:280–287.
Rock, K. L., and Goldberg, A. L. 1999. Degradation of cell proteins and the
generation of MHC class I–presented peptides. Annual Review of Immunology
17:739–779.
Roden, R. B. S., Yutzy, W. H., Fallon, R., Inglis, S., Lowy, D. R., and Schiller, J. T.
2000. Minor capsid protein of human genital papillomaviruses contains sub-
dominant, cross-neutralizing epitopes. Virology 270:254–257.
Rodrigo, A. G., and Learn, Jr., G. H., eds. 2000. Computational and Evolutionary
Analysis of HIV Molecular Sequences. Kluwer Academic, Boston.
Rogers, G. N., Daniels, R. S., Skehel, J. J., Wiley, D. C., Wang, X., Higa, H. H.,
and Paulson, J. C. 1989. Host-mediated selection of influenza virus receptor
variants. Journal of Biological Chemistry 260:7362–7367.
REFERENCES 301
Rogers, G. N., and D’Souza, G. L. 1989. Receptor-binding properties of human
and animal H1 influenza virus isolates. Virology 173:317–322.
Rogers, G. N., Paulson, J. C., Daniels, R. S., Skehel, J. J., Wilson, I. A., and Wi-
ley, D. C. 1983. Single amino acid substitutions in influenza haemagglutinin
change receptor binding specificity. Nature 304:76–78.
Rohani, P., Earn, D. J. D., and Grenfell, B. T. 1999. Opposite patterns of synchrony
in sympatric disease metapopulations. Science 286:968–971.
Röhm, C., Zhou, N., Süss, J., MacKenzie, J., and Webster, R. G. 1996. Characteri-
zation of a novel influenza hemagglutinin, H15: criteria for determination of
influenza A subtypes. Virology 217:508–516.
Roost, H. P., Backmann, M. F., Haag, A., Karlinke, U., Pliska, V., Hengartner, H.,
and Zinkernagel, R. M. 1995. Early high-affinity neutralizing anti-virus IgG
responses without further overall improvement of affinity. Proceedings of
the National Academy of Sciences USA 92:1257–1261.
Roost, H. P., Charan, S., and Zinkernagel, R. M. 1990. Analysis of the kinetics of
antiviral memory T help in vivo: characterization of short lived cross-reactive
T help. European Journal of Immunology 20:2547–2554.
Rose, M. R. 1991. Evolutionary Biology of Aging. Oxford University Press, Oxford.
Rostand, K. S., and Esko, J. D. 1997. Microbial adherence to and invasion through
proteoglycans. Infection and Immunity 65:1–8.
Rottem, S., and Naot, Y. 1998. Subversion and exploitation of host cells by
mycoplasmas. Trends in Microbiology 6:436–440.
Rouzine, I. M., and Coffin, J. M. 1999. Search for the mechanism of genetic vari-
ation in the pro gene of human immunodeficiency virus. Journal of Virology
73:8167–8178.
Rozsa, W. F., and Marrs, C. F. 1991. Interesting sequence differences between the
pilin gene inversion regions of Moraxella lacunata ATCC 17956 and Moraxel-
la bovis Epp63. Journal of Bacteriology 173:4000–4006.
Rudensey, L. M., Kimata, J. T., Long, E. M., Chackerian, B., and Overbaugh, J.
1998. Changes in the extracellular envelope glycoprotein of variants that
evolve during the course of simian immunodeficiency virus SIVMne infection
affect neutralizing antibody recognition, syncytium formation, and macro-
phage tropism but not replication, cytopathicity, or CCR-5 coreceptor recog-
nition. Journal of Virology 72:209–217.
Rudneva, I. A., Sklyanskaya, E. I., Barulina, O. S., Yamnikova, S. S., Kovaleva, V. P.,
Tsvetkova, I. V., and Kaverin, N. V. 1996. Phenotypic expression of HA-NA
combinations in human-avian influenza A virus reassortants. Archives of
Virology 141:1091–1099.
Sa-Carvalho, D., Rieder, E., Baxt, B., Rodarte, R., Tanuri, A., and Mason, P. W. 1997.
Tissue culture adaptation of foot-and-mouth disease virus selects viruses
that bind to heparin and are attenuated in cattle. Journal of Virology 71:5115–
5123.
Saha, K., Zhang, J., Gupta, A., Dave, R., Yimen, M., and Zerhouni, B. 2001. Isolation

302 REFERENCES
of primary HIV-1 that target CD8+ T lymphocytes using CD8 as a receptor.
Nature Medicine 7:65–72.
Salaun, L., Audibert, C., Le Lay, G., Burucoa, C., Fauchere, J. L., and Picard, B. 1998.
Panmictic structure of Helicobacter pylori demonstrated by the comparative
study of six genetic markers. FEMS Microbiology Letters 161:231–239.
Salmivirta, M., Lidholt, K., and Linkahl, U. 1996. Heparan sulfate: a piece of
information. FASEB Journal 10:1270–1279.
Samri, A., Haas, G., Duntze, J., Bouley, J.-M., Calvez, V., Katlama, C., and Au-
tran, B. 2000. Immunogenicity of mutations induced by nucleoside reverse
transcriptase inhibitors for human immunodeficiency virus type 1–specific
cytotoxic T cells. Journal of Virology 74:9306–9312.
Sanna, P. P., Ramiro-Ibañez, F., and De Logu, A. 2000. Synergistic interactions
of antibodies in rate of virus neutralization. Virology 270:386–396.
Sasisekharan, R., and Venkataraman, G. 2000. Heparin and heparan sulfate:
biosynthesis, structure and function. Current Opinion in Chemical Biology
4:626–631.
Scherf, A., Hernandez-Rivas, R., Buffet, P., Bottius, E., Benatar, C., Pouvelle, B.,
Gysin, J., and Lanzer, M. 1998. Antigenic variation in malaria: in situ
switching, relaxed and mutually exclusive transcription of var genes dur-
ing intra-erythrocytic development in Plasmodium falciparum. EMBO Journal
17:5418–5426.
Scherle, P., and Gerhard, W. 1986. Functional analysis of influenza-specific
helper T cell clones in vivo: T cells specific for internal viral proteins provide
cognate help for B cell responses to hemagglutinin. Journal of Experimental
Medicine 164:1114–1128.
Schneider-Schaulies, J. 2000. Cellular receptors for viruses: links to tropism and
pathogenesis. Journal of General Virology 81:1413–1429.
Schofield, D. J., Stephenson, J. R., and Dimmock, N. J. 1997a. High and low
efficiency neutralization epitopes on the haemagglutinin of type A influenza
virus. Journal of General Virology 78:2441–2446.
Schofield, D. J., Stephenson, J. R., and Dimmock, N. J. 1997b. Variations in the
neutralizing and haemagglutination-inhibiting activities of five influenza A
virus-specific IgGs and their antibody fragments. Journal of General Virology
78:2431–2439.
Schols, D., and De Clercq, E. 1996. Human immunodeficiency virus type 1
gp120 induces anergy in human peripheral blood lymphocytes by inducing
interleukin-10 production. Journal of Virology 70:4953–4960.
Scholtissek, C. 1998. Genetic reassortment of human influenza viruses in na-
ture. In Nicholson, K. G., Webster, R. G., and Hay, A. J., eds., Textbook of
Influenza, pp. 120–125. Blackwell Science, Oxford.
Schroer, J. A., Bender, T., Feldmann, T., and Kim, K. J. 1983. Mapping epitopes
on the insulin molecule using monoclonal antibodies. European Journal of
Immunology 13:693–700.
Schubert, U., Antón, L. C., Gibbs, J., Norbury, C. C., Yewdell, J. W., and Bennink,

REFERENCES 303
J. R. 2000. Rapid degradation of a large fraction of newly synthesized pro-
teins by proteasomes. Nature 404:770–774.
Schumacher, T. N. M. 1999. Immunology: accessory to murder. Nature 398:26–
27.
Scott, T. W., Weaver, S. C., and Mallampalli, V. L. 1994. Evolution of mosquito-
borne viruses. In Morse, S. S., ed., Evolutionary Biology of Viruses, pp. 293–324.
Raven Press, New York.
Seaman, M. S., Wang, C. R., and Forman, J. 2000. MHC class Ib–restricted CTL
provide protection against primary and secondary Listeria monocytogenes
infection. Journal of Immunology 165:5192–5201.
Seder, R. A., and Hill, A. V. S. 2000. Vaccines against intracellular infections
requiring cellular immunity. Nature 406:793–798.
Seed, J. R. 1978. Competition among serologically different clones of Trypano-
soma brucei gambiense in vivo. Journal of Protozoology 25:526–529.
Semmes, O. J., and Jeang, K.-T. 1992. Mutational analysis of human T-cell leuke-
mia virus type I Tax: regions necessary for function determined with 47 mu-
tant proteins. Journal of Virology 66:7183–7192.
Seo, S. H., and Webster, R. G. 2001. Cross-reactive, cell-mediated immunity and
protection of chickens from lethal H5N1 influenza virus infection in Hong
Kong poultry markets. Journal of Virology 75:2516–2525.
Sette, A., Alexander, J., Ruppert, J., Snoke, K., Franco, A., Ishioka, G., and Grey,
H. M. 1994. Antigen analog/MHC complexes as specific T cell receptor an-
tagonists. Annual Review of Immunology 12:413–431.
Sharma, P. L., and Crumpacker, C. S. 1999. Decreased processivity of human
immunodeficiency virus type 1 reverse transcriptase (RT) containing didano-
sine-selected mutation Leu75Val: a comparative analysis of RT variants Leu-
74Val and lamivudine-selected Met184Val. Journal of Virology 73:8448–8456.
Shields, P. L., Owsianka, A., Carman, W. F., Boxall, E., Hubscher, S. G., Shaw,
J., O’Donnell, K., Elias, E., and Mutimer, D. J. 1999. Selection of hepatitis B
surface ‘escape’ mutants during passive immune prophylaxis following liver
transplantion: potential impact of genetic changes on polymerase protein
function. Gut 45:306–309.
Shin, H. D., Winkler, C., Stephens, J. C., Bream, J., Young, H., Goedert, J. J.,
O’Brien, T. R., Vlahov, D., Buchbinder, S., Giorgi, J., Rinaldo, C., Donfield, S.,
Willoughby, A., O’Brien, S. J., and Smith, M. W. 2000. Genetic restriction of
HIV-1 pathogenesis to AIDS by promoter alleles of IL10. Proceedings of the
National Academy of Sciences USA 97:14467–14472.
Shirai, M., Arichi, T., Chen, M., Nishioka, M., Ikeda, K., Takahashi, H., Enomoto,
N., Saito, T., Major, M. E., Nakazawa, T., Akatsuka, T., Feinstone, S. M., and
Berzofsky, J. A. 1999. T cell recognition of hypervariable region-1 from hep-
atitis C virus envelope protein with multiple class II MHC molecules in mice
and humans: preferential help for induction of antibodies to the hypervari-
able region. Journal of Immunology 162:568–576.
Shirai, M., Arichi, T., Nishioka, M., Nomura, T., Ikeda, K., Kawanishi, K., Engelhard,
304 REFERENCES
V. H., Feinstone, S. M., and Berzofsky, J. A. 1995. CTL responses of HLA-A2.1-
transgenic mice specific for hepatitis C viral peptides predict epitopes for
CTL of humans carrying HLA-A2.1. Journal of Immunology 154:2733–2742.
Sigal, L. J., Crotty, S., Andino, R., and Rock, K. L. 1999. Cytotoxic T-cell im-
munity to virus-infected non-haematopoietic cells requires presentation of
exogenous antigen. Nature 398:77–80.
Silverman, M., Zieg, J., Hilmen, M., and Simon, M. 1979. Phase variation in
Salmonella: genetic analysis of a recombinational switch. Proceedings of the
National Academy of Sciences USA 76:391–395.
Sim, B. C., Aftahi, N., Reilly, C., Bogen, B., Schwartz, R. H., Gascoigne, N. R., and
Lo, D. 1998. Thymic skewing of the CD4/CD8 ratio maps with the T-cell
receptor alpha-chain locus. Current Biology 8:701–704.
Skehel, J. J., Stevens, D. J., Daniels, R. S., Douglas, A. R., Knossow, M., Wilson,
I. A., and Wiley, D. C. 1984. A carbohydrate side chain on hemagglutinins of
Hong Kong influenza viruses inhibits recognition by a monoclonal antibody.
Proceedings of the National Academcy of Sciences USA 81:1779–1783.
Skehel, J. J., and Wiley, D. C. 2000. Receptor binding and membrane fusion
in virus entry: the influenza hemagglutinin. Annual Review of Biochemistry
69:531–569.
Slatkin, M. 1984. Somatic mutations as an evolutionary force. In Greewood, P. J.,
Harvey, P. H., and Slatkin, M., eds., Essays in Honor of John Maynard Smith,
pp. 19–30. Cambridge University Press, Cambridge.
Slifka, M. K., Antia, R., Whitmire, J. K., and Ahmed, R. 1998. Humoral immunity
due to long-lived plasma cells. Immunity 8:363–372.
Smith, D. J., Forrest, S., Ackley, D. H., and Perelson, A. S. 1999. Variable efficacy of
repeated annual influenza vaccination. Proceedings of the National Academy
of Sciences USA 96:14001–14006.
Smith, J. D., Chitnis, C. E., Craig, A. G., Roberts, D. J., Hudson-Taylor, D. E., Peter-
son, D. S., Pinches, R., Newbold, C. I., and Miller, L. H. 1995. Switches in expres-
sion of Plasmodium falciparum var genes correlate with changes in antigenic
and cytoadherent phenotypes of infected erythrocytes. Cell 82:101–110.
Smith, M. R., and Greene, W. C. 1990. Identification of HTLV-I tax trans-activator
mutants exhibiting novel transcriptional phenotypes. Genes and Develop-
ment 4:1875–1885.
Smith, M. W., Dean, M., Carrington, M., Winkler, C., Huttley, G. A., Lomb, D. A.,
Goedert, J. J., O’Brien, T. R., Jacobson, L. P., Kaslow, R., et al. 1997. Contrasting
genetic influence of CCR2 and CCR5 variants on HIV-1 infection and disease
progression. Science 277:959–965.
Smith, V. H., and Holt, R. D. 1996. Resource competition and within-host disease
dynamics. Trends in Ecology and Evolution 11:386–389.
Sniegowski, P. D., Gerrish, P. J., and Lenski, R. E. 1997. Evolution of high mutation
rates in experimental populations of E. coli. Nature 387:703–705.
Sobrino, F., Sáiz, M., Jiménez-Clavero, M. A., Núñez, J. I., Rosas, M. F., Baranowski,

REFERENCES 305
E., and Ley, V. 2001. Foot-and-mouth disease virus: a long known virus, but
a current threat. Veterinary Research 32:1–30.
Solé, M., Bantar, C., Indest, K., Gu, Y., Ramamoorthy, R., Coughlin, R., and Philipp,
M. T. 1998. Borrelia burgdorferi escape mutants that survive in the presence
of antiserum to the OspA vaccine are killed when complement is also present.
Infection and Immunity 66:2540–2546.
Sompayrac, L. M. 1999. How the Immune System Works. Blackwell Science,
Malden, Massachusetts.
Sonrier, C., Branger, C., Michel, V., Ruvoen-Clouet, N., Ganiere, J. P., and Andre-
Fontaine, G. 2000. Evidence of cross-protection within Leptospira interrogans
in an experimental model. Vaccine 15:86–94.
Soudeyns, H., Paolucci, S., Chappey, C., Daucher, M. B., Graziosi, C., Vaccarezza,
M., Cohen, O. J., Fauci, A. S., and Pantaleo, G. 1999. Selective pressure exerted
by immunodominant HIV-1-specific cytotoxic T lymophocyte responses dur-
ing primary infection drives genetic variation restricted to the cognate epi-
tope. European Journal of Immunology 29:3629–3635.
Sourdive, D. J. D., Murali-Krishna, K., and Altman, J. D. 1998. Conserved T cell
receptor repertoire in primary and memory CD8 T cell responses to an acute
viral infection. Journal of Experimental Medicine 188:71–82.
Spratt, B. G., Bowler, L. D., Zhang, Q.-Y., Zhou, J., and Maynard Smith, J. 1992.
Role of interspecies transfer of chromosomal genes in the evolution of peni-
cillin resistance in pathogenic and commensal Neisseria species. Journal of
Molecular Evolution 34:115–125.
Spratt, B. G., and Maiden, M. C. J. 1999. Bacterial population genetics, evolution
and epidemiology. Philosophical Transactions of the Royal Society of London
B 354:701–710.
Spriggs, M. K. 1996. One step ahead of the game: viral immunomodulatory
molecules. Annual Review of Immunology 14:101–130.
Springer, T. A. 1990. Adhesion receptors of the immune system. Nature 346:
425–434.
Stalhammar-Carlemalm, M., Areschoug, T., Larsson, C., and Lindahl, G. 2000.
Cross-protection between group A and group B streptococci due to cross-
reacting surface proteins. Journal of Infectious Disease 182:142–149.
Staudt, L. M., and Gerhard, W. 1983. Generation of antibody diversity in the
immune response of BALB/c mice to influenza virus hemagglutinin. I. Signif-
icant variation in repertoire expression between individual mice. Journal of
Experimental Medicine 157:687–704.
Stearns, S. C., Ackermann, M., Doebeli, M., and Kaiser, M. 2000. Experimental
evolution of aging, growth, and reproduction in fruitflies. Proceedings of the
National Academy of Sciences USA 97:3309–3313.
Steinhauer, D. A., and Wharton, S. A. 1998. Structure and function of the haemag-
glutinin. In Nicholson, K. G., Webster, R. G., and Hay, A. J., eds., Textbook of
Influenza, pp. 54–64. Blackwell Science, Oxford.
306 REFERENCES
Stern, A., Brown, M., Nickel, P., and Meyer, T. F. 1986. Opacity genes in Neisseria
gonorrhoeae: control of phase and antigenic variation. Cell 47:61–71.
Stern, A., and Meyer, T. F. 1987. Common mechanism controlling phase and
antigenic variation in pathogenic neisseriae. Molecular Microbiology 1:5–12.
Stevenson, P. G., and Doherty, P. C. 1998. Cell-mediated imune response to in-
fluenza virus. In Nicholson, K. G., Webster, R. G., and Hay, A. J., eds., Textbook
of Influenza, pp. 278–287. Blackwell Science, Oxford.
Stoenner, H. G., Dodd, T., and Larsen, C. 1982. Antigenic variation of Borrelia
hermsii. Journal of Experimental Medicine 156:1297–1311.
Strauss, E. G., Straus, J. H., and Levine, A. J. 1996. Virus evolution. In Fields,
B. N., Knipe, D. M., and Howley, P. M., eds., Fundamental Virology, 3d ed., pp.
141–159. Lippincott-Raven, Philadelphia.
Su, C., Jakobsen, I., Gu, X., and Nei, M. 1999. Diversity and evolution of T-
cell recpetor variable region genes in mammals and birds. Immunogenetics
50:301–308.
Su, C., and Nei, M. 1999. Fifty-million-year-old polymorphism at an immunoglob-
ulin variable region gene locus in the rabbit evolutionary lineage. Proceedings
of the National Academy of Sciences USA 96:9710–9715.
Su, X., Heatwole, V. M., Wertheimer, S. P., Guinet, F., Herrfeldt, J. V., Peterson,
D. S., and Ravetch, J. V. W. 1995. A large and diverse gene family (var ) encodes
200–350 kD proteins implicated in the antigenic variation and cytoadherence
of Plasmodium falciparum–infected erythrocytes. Cell 82:89–100.
Suerbaum, S., Maynard Smith, J., Bapumia, K., Morelli, G., Smith, N. H., Kunst-
mann, E., Dyrek, I., and Achtman, M. 1998. Free recombination within He-
licobacter pylori. Proceedings of the National Academy of Sciences USA 95:
12619–12624.
Suzuki, Y., and Gojobori, T. 1999. A method for detecting positive selection at
single amino acid sites. Molecular Biology and Evolution 16:1315–1328.
Swain, S. L. 1994. Generation and in vivo persistence of polarized Th1 and Th2
memory cells. Immunity 1:543–552.
Tada, Y., Hongo, S., Muraki, Y., Sugawara, K., Kitame, F., and Nakamura, K. 1997.
Evolutionary analysis of influenza C virus M genes. Virus Genes 15:53–59.
Taddei, F., Radman, M., Maynard Smith, J., Toupance, B., Gouyon, P. H., and
Godelle, B. 1997. Role of mutator alleles in adaptive evolution. Nature
387:700–702.
Taylor, H. P., Armstrong, S. J., and Dimmock, N. J. 1987. Quantitative rela-
tionships between an influenza virus and neutralizing antibody. Virology
159:288–298.
Terry, C. F., Loukaci, V., and Green, F. R. 2000. Cooperative influence of ge-
netic polymorphisms on interleukin 6 transcriptional regulation. Journal of
Biological Chemistry 275:18138–18144.
Thomas, D. B., Patera, A. C., Graham, C. M., and Smith, C. A. 1998. Antibody-
mediated immunity. In Nicholson, K. G., Webster, R. G., and Hay, A. J., eds.,
Textbook of Influenza, pp. 267–277. Blackwell Science, Oxford.

REFERENCES 307
Thursz, M., Kwiatkowski, D., Allsopp, C. E. M., Greenwood, B. M., Thomas, H. C.,
and Hill, A. V. S. 1995. Association of an HLA class II allele with clearance of
hepatitis B virus infection in The Gambia. New England Journal of Medicine
332:1065–1069.
Tibayrenc, M. 1999. Toward an integrated genetic epidemiology of parasitic
protozoa and other pathogens. Annual Review of Genetics 33:171–191.
Tibayrenc, M., and Ayala, F. J. 1988. Isozyme variability in Trypanosoma cruzi,
the agent of Chagas’ disease: genetical, taxonomical, and epidemiological sig-
nificance. Evolution 42:277–292.
Tibayrenc, M., Kjellberg, F., Arnaud, J., Oury, B., Brenière, S., Dardé, M.-L., and
Ayala, F. J. 1991. Are eukaryotic microorganisms clonal or sexual? A popula-
tion genetics vantage. Proceedings of the National Academy of Sciences USA
88:5129–5133.
Tibayrenc, M., Kjellberg, F., and Ayala, F. J. 1990. A clonal theory of parasitic pro-
tozoa: the population genetic structure of Entamoeba, Giardia, Leishmania
and Trypanosomes, and its medical and taxonomic consequences. Proceed-
ings of the National Academy of Sciences USA 87:2414–2418.
Tibayrenc, M., Ward, P., Moya, A., and Ayala, F. J. 1986. Natural populations of
Trypanosoma cruzi, the agent of Chagas’ disease, have a complex multiclonal
structure. Proceedings of the National Academy of Sciences USA 83:115–119.
Tissot, A. C., Ciatto, C., Mitti, P. R. E., Grütter, M. G., and Plückthun, A. 2000.
Viral escape at the molecular level explained by quantitative T-cell recep-
tor/peptide/MHC interactions and the crystal structure of a peptide/MHC
complex. Journal of Molecular Biology 302:873–885.
Tortorella, D., Gewurz, B. E., Furman, M. H., Schust, D. J., and Ploegh, H. L.
2000. Viral subversion of the immune system. Annual Review of Immunology
18:861–926.
Turner, C. M. R. 1997. The rate of antigenic variation in fly-transmitted and
syringe-passaged infections of Trypanosoma brucei. FEMS Microbiology Let-
ters 153:227–231.
Turner, C. M. R. 1999. Antigenic variation in Trypanosoma brucei infections: an
holistic view. Journal of Cell Science 112:3187–3192.
Turner, C. M. R., Aslam, N., and Angus, S. D. 1996. Inhibition of growth of
Trypanosoma brucei parasites in chronic infections. Parasitology Research
82:61–66.
Turner, C. M. R., and Barry, J. D. 1989. High frequency of antigenic variation in
Trypanosoma brucei rhodesiense infections. Parasitology 99:67–75.
Underwood, P. A. 1982. Mapping of antigenic changes in the haemagglutinin
of Hong Kong influenza (H3N2) strains using a large panel of monoclonal
antibodies. Journal of General Virology 62:153–169.
Underwood, P. A. 1984. An antigenic map of the haemagglutinin of the influenza
Hong Kong subtype (H3N2), constructed using mouse monoclonal antibod-
ies. Molecular Immunology 21:663–671.
van de Putte, P., Plasterk, R., and Kuijpers, A. 1984. A Mu gin complementing

308 REFERENCES
function and an invertible DNA region in Escherichia coli K-12 are situated
on the genetic element e14. Journal of Bacteriology 158:517–522.
van Hattum, J., Schreuder, G. M., and Schalm, S. W. 1987. HLA antigens in pa-
tients with various courses after hepatitis B virus infection. Hepatology 7:11–
14.
van Regenmortel, M. H. V. 1998. From absolute to exquisite specificity: reflec-
tions on the fuzzy nature of species, specificity and antigenic sites. Journal
of Immunological Methods 216:37–48.
van Regenmortel, M. H. V., Altschuh, D., Chatellier, J., Christensen, L., Rauffer-
Bruyère, N., Richalet, S., Witz, J., and Zeder-Lutz, G. 1998. Measurement of
antigen-antibody interactions with biosensors. Journal of Molecular Recog-
nition 11:163–167.
Vickerman, K. 1989. Trypanosome sociology and antigenic variation. Parasitol-
ogy 99:S37–S47.
Vidal, N., Peeters, M., Mulanga-Kabeya, C., Nzilambi, N., Robertson, D., Ilunga, W.,
Sema, H., Tshimanga, K., Bongo, B., and Delaporte, E. 2000. Unprecedented
degree of human immunodeficiency virus type 1 (HIV-1) group M genetic
diversity in the Democratic Republic of Congo suggests that the HIV-1 pan-
demic originated in central Africa. Journal of Virology 74:10498–10507.
Vijayakrishnan, L., Kumar, V., Agrewala, A., Mishra, G. C., and Rao, K. V. S. 1994.
Antigen-specific early primary humoral responses modulate immunodomi-
nance of B cell epitopes. Journal of Immunology 153:1613–1625.
Villadangos, J. A., Bryant, R. A. R., Deussing, J., Driessen, C., Lennon-Dumenil,
A.-M., Riese, R. J., Roth, W., Saftig, P., Shi, G.-P., Chapman, H. A., Peters, C., and
Ploegh, H. L. 1999. Proteases involved in MHC class II antigen presentation.
Immunological Reviews 172:109–120.
Vincent, R., Louis-Plence, P., Gaillard, F., Clot, J., and Eliaou, J.-F. 1997. Qual-
itative and quantitative analysis of HLA-DRB gene expression. Journal of
Rheumatology 24:225–226.
Virji, M., Evans, D., Hadfield, A., Grunert, F., Telxeira, A. M., and Watt, S. M. 1999.
Critical determinants of host receptor targeting by Neisseria meningitidis and
Neisseria gonorrhoeae: identification of Opa adhesiotopes on the N-domain
of CD66 molecules. Molecular Microbiology 34:538–551.
Vogel, T., Kurth, R., and Norley, S. 1994. The majority of neutralizing Abs in
HIV-1 infected patients recognize linear V3 loop sequences. Journal of Im-
munology 153:1895–1904.
Volkman, S. K., Barry, A. E., Lyons, E. J., Nielsen, K. M., Thomas, S. M., Choi, M.,
Thakore, S. S., Day, K. P., Wirth, D. F., and Hartl, D. L. 2001. Recent origin of
Plasmodium falciparum from a single progenitor. Science 293:482–484.
Wakely, J. 1993. Substitution rate variation among sites in hypervariable region
I of human mitochondrial DNA. Journal of Molecular Evolution 37:613–623.
Walker, G. C. 1984. Mutagenesis and inducible responses to deoxyribonucleic
acid damage in Escherichia coli. Microbiological Reviews 48:60–93.
REFERENCES 309
Wang, M.-L., Skehel, J. J., and Wiley, D. C. 1986. Comparative analyses of the
specificities of anti-influenza hemagglutinin antibodies in human sera. Jour-
nal of Virology 57:124–128.
Watts, C., and Amigorena, S. 2000. Antigen traffic pathways in dendritic cells.
Traffic 1:312–317.
Weaver, S. C., Brault, A. C., Kang, W., and Holland, J. J. 1999. Genetic and fit-
ness changes accompanying adaptation of an arbovirus to vertebrate and
invertebrate cells. Journal of Virology 73:4316–4326.
Weber, J., Fenyo, E.-M., Beddows, S., Kaleebu, P., and Bjorndal, A. 1996. Neutral-
ization serotypes of HIV-1 field isolates are not predicted by genetic subtype.
Journal of Virology 70:7827–7832.
Webster, R. G., Air, G. M., Metzger, D. W., Colman, P. M., Varghese, J. N., Baker,
A. T., and Laver, W. G. 1987. Antigenic structure and variation in an influenza
virus N9 neuraminidase. Journal of Virology 61:2910–2916.
Webster, R. G., and Bean, W. J. 1998. Evolution and ecology of influenza viruses:
interspecies transmission. In Nicholson, K. G., Webster, R. G., and Hay, A. J.,
eds., Textbook of Influenza, pp. 109–119. Blackwell Science, Oxford.
Webster, R. G., Bean, W. J., Gorman, O. T., Chambers, T. M., and Kawaoka, Y.
1992. Evolution and ecology of influenza A viruses. Microbiological Review
56:152–179.
Webster, R. G., Brown, L. E., and Laver, W. G. 1984. Antigenic and biological
characterization of influenza virus neuraminidase (N2) with monoclonal an-
tibodies. Virology 135:30–42.
Webster, R. G., Shortridge, K. F., and Kawaoka, Y. 1997. Influenza: interspecies
transmission and emergence of new pandemics. FEMS Immunology and Med-
ical Microbiology 18:275–279.
Wedemayer, G. J., Patten, P. A., Wang, L. H., Schultz, P. G., and Stevens, R. C.
1997. Structural insights into the evolution of an antibody combining site.
Science 276:1665–1669.
Weidt, G., Deppert, W., Utermöhlen, O., Heukeshoven, J., and Lehmann-Grube, F.
1995. Emergence of virus escape mutants after immunization with epitope
vaccine. Journal of Virology 69:7147–7151.
Weidt, G., Utermöhlen, O., Heukeshoven, J., Lehmann-Grube, F., and Deppert,
W. 1998. Relationship among immunodominance of single CD8+ T cell epi-
topes, virus load, and kinetics of primary antiviral CTL response. Journal of
Immunology 160:2923–2931.
Wettstein, P. J. 1986. Immunodominance in the T-cell response to multiple
non-H-2 histocompatibility antigens. II. Observation of a hierarchy among
dominant antigens. Immunogenetics 24:24–31.
Wetz, K., Willingmann, P., Zeichhardt, H., and Habermehl, K.-O. 1986. Neutral-
ization of poliovirus by polyclonal antibodies requires binding of a single
molecule per virion. Archives of Virology 91:207–220.
Whitmire, J. K., Murali-Krishna, K., Altman, J., and Ahmed, R. 2000. Antiviral
310 REFERENCES
CD4 and CD8 T-cell memory: differences in the size of the response and
activation requirements. Philosophical Transactions of the Royal Society of
London B 355:373–379.
Wiley, D. C., Wilson, I. A., and Skehel, J. J. 1981. Structural identification of
the antibody-binding sites of Hong Kong influenza haemagglutinin and their
involvement in antigenic variation. Nature 289:373–378.
Willems, R., Paul, A., van der Heide, H. G. J., ter Avest, A. R., and Mooi, F. R.
1990. Fimbrial phase variation in Bordetella pertussis: a novel mechanism
for transcriptional regulation. EMBO Journal 9:2803–2809.
Wilson, I. A., and Cox, N. J. 1990. Structural basis of immune recognition of
influenza virus hemagglutinin. Annual Review of Immunology 8:737–771.
Wilson, I. A., Skehel, J. J., and Wiley, D. C. 1981. Structure of the haemagglutinin
membrane glycoprotein of influenza virus at 3 Å resolution. Nature 289:366–
373.
Wodarz, D., and Nowak, M. A. 2000. CD8 memory, immunodominance, and
antigenic escape. European Journal of Immunology 30:2704–2712.
Wodarz, D., Nowak, M. A., and Bangham, C. R. M. 1999. The dynamics of HTLV-I
and the CTL response. Immunology Today 20:220–227.
Wohlfart, C. 1988. Neutralization of adenoviruses: kinetics, stoichiometry and
mechanisms. Journal of Virology 62:2321–2328.
Worobey, M. 2000. Extensive homologous recombination among widely diver-
gent TT viruses. Journal of Virology 74:7666–7670.
Worobey, M., and Holmes, E. C. 1999. Evolutionary aspects of recombination in
RNA viruses. Journal of General Virology 80:2535–2543.
Worobey, M., Rambaut, A., and Holmes, E. C. 1999. Widespread intra-serotype
recombination in natural populations of dengue virus. Proceedings of the
National Academy of Sciences USA 96:7352–7357.
Wren, B. W. 1991. A family of clostridial and streptococcal ligand-binding pro-
teins with conserved C-terminal repeat sequences. Molecular Microbiology
5:797–803.
Wright, P. F., and Webster, R. G. 2001. Orthomyxoviruses. In Knipe, D. M., and
Howley, P. M., eds., Fields Virology, 4th ed., pp. 1533–1579. Lippincott-Raven,
Philadelphia.
Wright, S. 1969. Evolution and the Genetics of Populations. Vol. 2, The Theory of
Gene Frequencies. University of Chicago Press, Chicago.
Wright, S. 1978. Evolution and the Genetics of Populations. Vol. 4, Variabil-
ity within and between Natural Populations. University of Chicago Press,
Chicago.
Wu, J., Longmate, J. A., Adamus, G., Hargrave, P. A., and Wakeland, E. K. 1996.
Interval mapping of quantitative trait loci controlling humoral immunity to
exogenous antigens. Journal of Immunology 157:2498–2505.
Xu, J., Mitchell, T. G., and Vilgalys, R. 1999. PCR-restriction fragment length poly-
REFERENCES 311
morphism (RFLP) analyses reveal both extensive clonality and local genetic
differences in Candida albicans. Molecular Ecology 8:59–73.
Yamaguchi-Kabata, Y., and Gojobori, T. 2000. Reevaluation of amino acid vari-
ability of the human immunodeficiency virus type 1 gp120 envelope glyco-
protein and prediction of new discontinuous epitopes. Journal of Virology
74:4335–4350.
Yang, Z. H., and Bielawski, J. P. 2000. Statistical methods for detecting molecular
adaptation. Trends in Ecology and Evolution 15:496–503.
Yewdell, J. W., and Bennink, J. R. 1999. Immunodominance in major histocom-
patibility complex class I–restricted T lymphocyte responses. Annual Review
of Immunology 17:51–88.
Yewdell, J. W., Caton, A. J., and Gerhard, W. 1986. Selection of influenza A
adsorptive mutants by growth in the presence of a mixture of monoclonal
anti-haemagglutinin antibodies. Journal of Virology 57:623–628.
Yewdell, J. W., Webster, R. G., and Gerhard, W. U. 1979. Antigenic variation in
three distinct determinants of an influenza type A haemagglutinin molecule.
Nature 279:246–248.
York, I. A., Goldberg, A. L., Mo, X. Y., and Rock, K. L. 1999. Proteolysis and class
I major histocompatibility complex antigen presentation. Immunological Re-
views 172:49–66.
Yoshida, M. 2001. Multiple viral strategies of HTLV-1 for dysregulation of cell
growth control. Annual Review of Immunology 19:475–496.
Young, A. C., Zhang, W., Sacchettini, J. C., and Nathenson, S. G. 1994. The three-
dimensional structure of H-2Db at 2.4 Å resolution: implications for antigen-
determinant selection. Cell 76:39–50.
Yusim, K., Peeters, M., Pybus, O. G., Bhattacharya, T., Delaporte, E., Mulanga, C.,
Muldoon, M., Theiler, J., and Korber, B. 2001. Using human immunodeficiency
virus type 1 sequences to infer historical features of the acquired immune de-
ficiency syndrome epidemic and human immunodeficiency virus evolution.
Philosophical Transactions of the Royal Society of London B 356:855–866.
Zhang, J., Tang, L.-Y., Li, T., Ma, Y., and Sapp, C. M. 2000. Most retroviral re-
combinations occur during minus-strand DNA synthesis. Journal of Virology
74:2313–2322.
Zhou, J., and Spratt, B. G. 1992. Sequence diversity within the argF, fbp and
recA genes of natural isolates of Neisseria meningitidis—interspecies recom-
bination within the argF gene. Molecular Microbiology 6:2135–2146.
Zinkernagel, R. M., Althage, A., Cooper, S., Kreeb, G., Klein, P. A., Sefton, B.,
Flaherty, L., Stimpfling, J., Shreffler, D., and Klein, J. 1978. Ir-genes in H-2
regulate generation of anti-viral cytotoxic T cells. Mapping to K or D and
dominance or unresponsiveness. Journal of Experimental Medicine 148:592–
606.
Zinkernagel, R. M., Bachmann, M. F., Kündig, T. M., Oehen, S., Pirchet, H., and Hen-

312 REFERENCES
gartner, H. 1996. On immunological memory. Annual Review of Immunology
14:333–367.
Zolla-Pazner, S., Gorny, M. K., Nyambi, P. N., VanCott, T. C., and Nádas, A. 1999.
Immunotyping of HIV-1: an approach to immunologic classification of HIV.
Journal of Virology 73:4042–4051.

Author Index
Aaby, P., 136, 288Abasado, J.-P., 81, 273Abiri, D., 99–100, 269Abraham, J. M., 63, 269Abrams, S. I., 86, 269Abu-Ghazaleh, R., 196–98, 280, 285Accolla, R. S., 117, 282Achtman, M., 27, 156, 290, 306Ackermann, M., 189, 305Ackley, D. H., 136, 304Ada, G., 126, 130, 269Adamus, G., 115, 310Addo, M. M., 95, 106, 281Adorini, L., 128, 274Aftahi, N., 53, 113, 304Agarwal, A., 76, 78, 269Agarwal, P., 115, 269Agrewala, A., 75, 308Agur, Z., 99–101, 269Ahmed, R., 80, 84, 126–27, 129–31,
232–33, 235, 269, 285, 294, 299,304, 309
Aidoo, M., 29, 86–87, 121, 150, 281Air, G. M., 215, 309Akatsuka, T., 75, 92, 113, 303Alamgir, A. S. M., 160, 269Albrecht, P., 140, 269Alcami, A., 97, 269Alcamí, J., 40, 289Aldrich, C., 46, 278Aldridge, S. L., 132, 215, 288Alexander, J., 86, 303Allen, R., 95, 106, 281Allen, T. M., 95, 235–36, 241, 270,
279Allison, D. B., 95, 235, 270Allsopp, C. E. M., 26, 307Almarri, A., 26, 270Alonso, A., 189, 291Alter, H. J., 95–96, 279Altfeld, M., 95, 106, 281Althage, A., 82, 311Altman, J., 129, 309
Altman, J. D., 80, 95, 129, 177,232–33, 235, 270, 272, 294, 299,305
Alzari, P. M., 37, 289Amigorena, S., 82, 309Anderegg, J., 222, 285Anderson, D. B., 94–95, 287Anderson, J. P., 163, 183, 300Anderson, M. J., 140, 295Anderson, R., 29, 135, 143, 146, 279,
282Anderson, R. M., 104, 136, 140–41,
143, 146, 149, 164–65, 264, 270,282, 284, 295
Anderson, T. J. C., 158, 270Andersson, L., 115, 278Andersson, S., 136, 288Andersson-Eklund, L., 115, 278Andino, R., 47, 81–82, 304Andreasen, V., 25, 146, 270, 289Andre-Fontaine, G., 135, 305Andreu, D., 189, 192, 194, 197, 260,
270, 279Andries, K., 183–85, 295–96Angus, S. D., 104, 307Annels, N., 80, 274Annels, N. E., 129, 300Antia, R., 127, 304Antón, L. C., 47, 79, 275, 302Appel, J. R., 37, 297Arber, W., 64, 285Arden, B., 44, 86, 245, 277Areschoug, T., 135, 305Argaet, V. P., 85, 274Arichi, T., 75, 85, 92, 113, 303Ariyoshi, K., 163, 273Armstrong, S. J., 222, 306Arnaud, J., 156, 307Arnot, D. E., 67, 158, 263, 276Aron, R., 219, 278Aslam, N., 100, 104, 270, 307Attuil, V., 53, 112, 291Attwell, A.-M., 218–19, 300

314 AUTHOR INDEX
Aubert-Combiescu, A., 162, 282Audibert, C., 156, 302Auriault, C., 37–38, 281Autran, B., 240, 302Avrameas, S., 39, 270Awad-El-Kariem, F. M., 156Ayala, F. J., 69, 150, 154, 156, 158,
170, 270, 299, 307Ayola, B., 225, 281
Babiker, H. A., 158, 270Bachmann, M. F., 125–26, 128–31,
140, 311Back, N. K., 240, 270Backmann, M. F., 78, 301Baczko, K., 225, 289Badovinac, V. P., 120, 122, 270Bailes, E., 164, 281Baker, A. T., 215, 309Balasundaram, G., 76, 269Balestrieri, A., 95–96, 279Banchereau, J., 82, 270Bangham, C. R. M., 83, 90–91, 104,
239, 246, 295, 297, 310Bansal, V. J., 74, 287Bantar, C., 226, 305Bapumia, K., 156, 306Barahona, H., 189, 291Baranowski, E., 189–90, 192–94, 197,
200, 270, 295, 304Barber, L. D., 48, 52–53, 112–13, 290Barbet, A. F., 66, 271Barbour, A. G., 26–27, 55, 62–63, 66,
98, 262, 268, 271, 274, 299Barclay, M. J., 136, 275Barnabé, C., 154–55, 271, 273, 277,
299Barnard, B., 150, 289Barnett, P. V., 196, 280Barnwell, J. W., 65, 271Barouch, D. H., 177, 270Barragan, A., 136, 139, 271Barrell, B., 65, 278Barrère, B., 212, 280Barrio, E., 226, 293Barry, A. E., 69, 170, 308Barry, J. D., 63, 88, 98–101, 271, 307
Barten, R., 67–68, 281Bartholomew, C., 164, 276Barton, N. H., 116, 271Barulina, O. S., 217, 301Bastos, A. D., 254, 283Bastrenta, B., 155, 277Batchelor, J. R., 26, 270Baum, L. G., 219, 277Baxt, B., 192, 196–98, 272, 294, 299,
301Bean, W. J., 147, 208, 216, 309Beare, P. S., 141, 292Beaumont, T., 185, 271Beck, E., 194, 197, 270Beddows, S., 183, 309Bednarek, M. A., 80, 272Beebe, A. M., 115, 276Beekman, N. J., 231–32, 272Bell, J., 53, 113, 299Bell, J. I., 177, 270Belz, G. T., 129, 272Benatar, C., 64, 302Bender, C. A., 161, 183, 206, 208,
213, 253, 255, 257–60, 274, 277Bender, T., 35, 302Benjamin, D. C., 35–36, 41, 43, 176,
272Bennett, A. F., 189, 272Bennetts, R. Q., 164, 276Bennink, J. R., 44, 46–47, 49, 51–52,
79, 82–85, 112, 272, 275, 278,302, 311
Bergstrom, S., 63, 271Berinstein, A., 192, 196, 272Berkout, B., 240, 270Bernard, K. A., 197–98, 272Bertoletti, A., 29, 86, 272Berzins, K., 139, 285Berzofsky, J. A., 35, 43, 75, 85, 92,
113, 176, 272, 303Betáková, T., 219, 222–24, 287Betschart, B., 67, 286Beugelsdijk, T. J., 262, 288Bevan, M. J., 46, 50, 86, 274, 278,
285Beyrer, C., 164, 298Bhattacharjee, A. K., 37, 272
AUTHOR INDEX 315
Bhattacharya, T., 256, 287, 311Bibollet-Ruche, F., 164, 281Biddison, W. E., 82, 278Bielawski, J. P., 246, 248–49, 253,
311Bilsborough, J., 88, 135, 281Biozzi, G., 115, 272Birkelund, S., 226, 286Birsner, U., 46, 295Bizebard, T., 211–13, 273, 280Bjorndal, A., 183, 309Blakemore, W., 196, 199, 285Blakemore, W. E., 196–99, 280, 285Blattner, W. A., 164, 185, 271, 276Blauvelt, A., 115, 280Blixenkrone-Møller, M., 225, 295Bloor, S., 240, 283Blundell, P. A., 101, 273Blystone, S. D., 192, 197–98, 294Bobkov, A., 163, 273Bockarie, M., 158, 270Bodmer, J. G., 52–53, 112–13, 300Bogen, B., 53, 113, 304Boggiano, C., 37, 297Bojang, K. A., 263, 276Bolker, B. M., 141, 278Bolt, G., 225, 295Bongo, B., 163, 308Boniface, J. J., 44, 86, 245, 277Bonneau, R. H., 83, 294Bontrop, R. E., 236, 241, 279Borca, M., 200, 275Borre, M. B., 65, 273Borrow, P., 230, 241, 273Borst, P., 101, 273Bösecke, P., 211–12, 273Bottius, E., 64, 302Bottomly, K., 92, 276Boucher, C. A., 240, 270Bouley, J.-M., 240, 302Bousso, P., 81, 273Bowler, L. D., 68, 305Bowman, S., 65, 278Boxall, E., 225, 303Boyd, D., 29, 86, 287Bracho, A., 226, 293Bradac, J. A., 163, 183, 300
Bradley, L. M., 126, 129, 278Brander, C., 95, 106, 281Brandt, W. E., 181, 274Branger, C., 135, 305Brannan, L. R., 27, 273Brault, A. C., 226, 309Bream, J., 119, 303Bream, J. H., 119, 279Brenière, S., 156, 307Bretscher, P. A., 92, 292Briere, F., 82, 270Brisse, S., 154–55, 271, 273Brockman, A. H., 158, 270Broersen, S., 185, 271Broker, T. R., 64, 286Brombacher, F., 40, 296Brookes, S. M., 196–98, 285Brossay, L., 48, 298Broude, N. E., 154, 296Brown, E. J., 192, 197–98, 294Brown, F., 196, 280Brown, G. V., 27, 139, 280, 299Brown, I. H., 181–82, 273Brown, L. E., 215, 309Brown, M., 27, 62, 306Brownlee, G. G., 213–14, 275Brunham, R. C., 88, 271Bruyere, A., 162, 273Bryant, R. A. R., 46, 308Buchbinder, S., 119, 303Bucher, P., 51, 53, 112, 291Buffet, P., 64, 302Bujarski, J. J., 162, 273Bull, J. J., 167, 189, 277, 289Bunce, M., 95, 106, 281Bundoc, V., 55, 268, 271Buonagurio, D. A., 160, 273Burch, C. L., 118, 274Burchett, S. K., 95, 106, 281Burda, S., 178, 183–85, 296Burgess, A. E., 221, 288Burkhart, C., 128, 274Burki, K., 232–33, 235, 240, 242, 298Burman, N., 63, 271Burrows, J. M., 85, 274Burrows, S. R., 85, 274Burt, M. J., 136, 275

316 AUTHOR INDEX
Burucoa, C., 156, 302Busch, D. H., 79, 274Bush, R. M., 161, 183, 206, 246, 253,
255, 257–60, 274Buss, L. W., 167, 274Butz, E. A., 50, 274Butz, S., 46, 295Buus, S., 48, 274Byers, V. S., 125, 274Byrnes, A. P., 198, 274
Cabrera, W. H., 115, 272Cadavid, D., 27, 274Calisher, C. H., 181, 274Callan, M. F. C., 80, 129, 274, 300Calvez, V., 240, 302Campbell, I. D., 198, 298Camps, M., 231–32, 272Cantor, C. R., 154, 296Capiod, T., 65, 298Caporale, L. H., 61, 274Capra, J. D., 13, 20, 53, 55, 74, 77,
89, 113, 115, 127, 130, 140, 233,286
Carlson, J., 136, 139, 271Carman, W. F., 225, 303Caro, V., 162, 282Carr, J. K., 67, 163–64, 183, 276,
288, 298, 300Carriere, V., 155, 299Carrillo, C., 200, 275Carrington, M., 26, 114, 119, 279,
304Carruthers, C. D., 164, 281Carter, C. J., 63, 271Casali, P., 39, 283Casanova, J.-L., 49, 51, 53, 112, 286,
291Cassese, G., 127, 290Castro, R., 128, 274Caton, A. J., 132, 213–15, 275, 311Caux, C., 82, 270Cavadore, P., 117, 290Cavanagh, D. R., 263, 276Cebula, T. A., 59, 288Ceradini, D., 95, 105, 276Chackerian, B., 95, 275, 301
Chambers, T. M., 147, 216, 309Chang, G.-J., 181, 288Chang, K. M., 80, 299Chanock, S. J., 115, 280Chao, L., 59, 118, 274–75Chapman, B. A., 136, 275Chapman, H. A., 46, 308Chapman, N. H., 26, 114, 291Chappey, C., 94, 305Charan, S., 128, 301Charlesworth, B., 58–61, 275, 278Charlesworth, D., 58–59, 278Chaves, I. M. F., 101, 273Cheingsong-Popov, R., 163, 273Chen, J., 164, 298Chen, M., 75, 92, 113, 303Chen, Q., 27, 64, 275Chen, W., 46, 79, 275Chen, Y., 85, 290Chen, Z. J., 39, 275Chen, Z. W., 236, 275Cheresh, D. A., 196, 293Chesnut, R. W., 79–80, 281Chezzi, C., 134, 294Chiari, E., 154, 296Chien, D. Y., 95–96, 279Chien, Y., 44, 86, 245, 277Chisari, F. V., 29, 80, 86, 272, 275,
280, 299Chitnis, C. E., 64, 304Choe, S., 95, 105, 276Choi, M., 69, 170, 308Chow, L. T., 64, 286Chow, W.-H., 119, 279Christensen, J. P., 79, 177, 278Christiansen, G., 226, 286Ciatto, C., 233–34, 238, 245, 307Ciurea, A., 224, 275Clark, A., 141, 292Clark, A. G., 149, 151, 283Clegg, J. B., 26, 114, 291Cleghorn, F. R., 164, 276Clements, J. R., 63, 269Cleveland, S. M., 133, 276Clot, J., 117–18, 289–90, 308Coffin, J. M., 58, 149, 167–68, 171,
240, 261–62, 276, 301
AUTHOR INDEX 317
Coffman, R. L., 115, 276Cohen, O. J., 94, 305Cohen, S., 115, 139, 269, 276Coiana, A., 95–96, 279Colbert, R. A., 95, 106, 281Cole, G. A., 84, 276Coleclough, C., 127–28, 290Collett, J. A., 136, 275Colman, P. M., 208, 213, 215, 276,
309Combiescu, M., 162, 282Compans, R. W., 213, 297Connolly, S. M., 164, 276Connor, R. I., 95, 105, 276Connor, R. J., 216, 276Constant, S. L., 92, 276Conway, D. J., 67, 158, 249, 263–64,
276Cook, H. B., 136, 275Cook, P., 218–19, 300Cookson, W. O. C. M., 53, 113, 293Cooper, L. A., 226, 277Cooper, S., 82, 311Coppola, M. A., 84, 276Cordey, A.-S., 51, 286Cornélis, F., 53, 113, 299Cornelissen, M., 67, 163, 277, 288Corteyn, A. H., 196–98, 285Couceiro, J. N., 219, 277Coughlin, R., 226, 305Cowell, L., 117–18, 277Cox, E. C., 59, 275Cox, M., 29, 86–87, 121, 150, 281Cox, N. J., 128, 133, 136, 161, 183,
206–8, 211, 213, 253, 255, 257–60,262, 274, 277, 288, 310
Craig, A. G., 64, 304Crainic, R., 162, 282Craiu, A., 236, 275Crandall, K. A., 246, 277Crill, W. D., 189, 277Croft, M., 127, 277Cropp, C. B., 181, 288Cross, G. A. M., 101, 294Cross, M. A., 101, 273Crotty, S., 47, 81–82, 304Crotzer, V. L., 85, 290
Crow, J. F., 58–59, 149, 151, 277–78Crumpacker, C. S., 240, 303Cuervo, N., 162, 282Currier, J., 88, 135, 281Curtis, C. F., 67, 158, 276Czarneski, J. E., 115, 269
Daenke, S., 29, 86, 239, 287, 295Dailey, P., 94–95, 287Dalrymple, J. M., 181, 274Daniels, R. S., 212–13, 216–17, 227,
280, 300–1, 304Dardé, M.-L., 156, 307Daser, A., 115, 117, 277da Silva, J., 236, 241, 279da Silva, Z., 136, 288da Silveira, A., 155, 277Datta, S., 27, 64, 275Daucher, M. B., 94, 305Dave, R., 28, 95, 301Davies, K. P., 101, 294Davis, M. M., 44, 86, 177, 245, 270,
277Davoust, J., 82, 270Dawkins, R. L., 170, 296Day, K., 150, 289Day, K. P., 69, 136, 139, 158, 170,
270, 282, 297, 308de Alborán, I. M., 40, 289Dean, M., 26, 28, 114, 296, 304De Brum, D. L., 189, 291De Carli, M., 29, 86, 272De Clercq, E., 119, 302de Coul, E. O., 67, 288Dehio, C., 27–28, 105, 282Deitsch, K. W., 24, 57, 64, 98, 277de Lana, M., 155, 277Delaporte, E., 163, 256, 308, 311De Logu, A., 213, 219, 224, 302de Lorenzo, D., 250–52, 284Delpeyroux, F., 162, 282del Portillo, H. A., 65, 278del Real, G., 40, 289Demant, P., 115, 299DeMars, R., 236, 241, 279Demartino, G. N., 46, 278Deng, Y., 44, 278

318 AUTHOR INDEX
Denyer, M., 199, 285Deppert, W., 83–84, 232, 309Desrosiers, R. C., 95, 235, 270Desselberger, U., 160, 273Deussing, J., 46, 308Dias, F., 136, 288Diat, O., 211–12, 273Diaz, G., 95–96, 279Dick, L. R., 46, 278Dimmock, N. J., 132–33, 213, 215,
219–22, 276, 278, 288, 292, 302,306
Di Rienzo, A., 253, 283Dodd, T., 63, 306Doebeli, M., 189, 305Doherty, P. C., 79, 82, 84, 126, 129,
141, 177, 272, 278, 292, 306Domingo, E., 189–90, 192–97, 199–
200, 260, 270, 279, 291, 295Donfield, S., 119, 303Dongworth, D. W., 141, 292Dou, S.-J., 250–52, 284Dougan, D. A., 36, 278Dougherty, J. P., 58, 162, 286, 298Douglas, A. R., 213, 304Dowdle, W. R., 136–38, 206, 278Doyle, C. K., 46, 278Drake, J. W., 58–59, 278Drescher, J., 219, 278Driessen, C., 46, 308Drohan, W. N., 37, 41–42, 288Druilhe, P., 37–38, 281D’Souza, G. L., 216, 301Dujardin, J.-C., 154, 273Duke, G., 222, 285Dunphy, E., 95, 235, 270Duntze, J., 240, 302Dutton, R. W., 126, 129, 278Dyrek, I., 156, 306Dzianott, A., 162, 273Dzuris, J. L., 95, 232–33, 235–36,
241, 270, 279, 299
Earn, D. J. D., 141, 278, 301East, I. J., 35, 43, 176, 272Edfors-Lilja, I., 115, 278Edwards, A., 29, 86, 287
Edwards, J., 29, 86, 164, 276, 287Edwards, M. J., 213, 219–21, 278Eggers, M., 231, 296Eichmann, K., 45–46, 295Eisenlohr, L. C., 44, 278Eisenstein, B. I., 63, 269Elena, S. F., 226, 293Elewaut, D., 48, 298Eliaou, J.-F., 117–18, 289–90, 308Elias, E., 225, 303Ellard, F. M., 196–98, 280, 285El-Omar, E. M., 119, 279Elvin, J., 80, 293Emerson, C., 95, 235, 270Endo, T., 249, 251–52, 279Engelhard, V. H., 85, 279, 290, 303Enjuanes, L., 189, 291Ennis, F. A., 140, 269Enomoto, N., 75, 92, 113, 303Enright, M. C., 151–52, 164, 279Escarmís, C., 193, 291Esko, J. D., 196, 301Estanislao, L., 27, 274Estaquier, J., 37–38, 281Estrada-Franco, J. G., 158, 270Evans, D., 27, 105, 308Evans, D. T., 236, 241, 279
Falk, K., 49, 291Falkow, S., 63, 290Fallon, R., 135, 300Farber, D. L., 126, 279Farci, P., 95–96, 279Fauchere, J. L., 156, 302Fauci, A. S., 94, 305Faux, J. A., 53, 113, 293Fazekas de St. Groth, S., 28, 87–88,
136, 279Feavers, I. M., 143, 146, 149, 164–65,
279, 282Fecondo, J., 46, 275Fehr, T., 40, 296Feigelstock, D., 189–90, 192, 195,
291Feigelstock, D. A., 189, 192, 260,
279Feinstone, S. M., 75, 85, 92, 113, 303

AUTHOR INDEX 319
Feldmann, T., 35, 302Fenyo, E.-M., 183, 309Ferguson, N., 29, 135, 143, 146, 279,
282Fernandes, H., 115, 269Fernandez, V., 27, 64, 275Fernandez-Becerra, C., 65, 278Ferrari, C., 29, 86, 272, 280Ferreira, M. U., 69, 158, 170, 270,
299Fiaccadori, F., 29, 86, 272Fischetti, V. A., 60, 280, 284Fish, S., 88, 280Fitch, W. M., 161, 183, 206, 253,
255, 257–60, 274Flaherty, L., 82, 311Flanagan, K. L., 87, 298Flanagan, S. G., 225, 289Flasinski, S., 162, 273Fleming, M., 88, 280Fleury, D., 212–13, 280Foley, B., 163, 183, 300Forman, J., 129, 303Forman, J. M., 46, 278Forrest, S., 136, 304Forsyth, K. P., 139, 280Fossum, C., 115, 278Foster, C. B., 115, 280Fox, A. J., 164, 279Fox, G., 196, 280Frampton, C. M., 136, 275Francis, T., 87, 280Franco, A., 86, 280, 303Frank, S. A., 99, 101, 146, 153, 167,
280Fransen, K., 183–85, 295–96Fraumeni, Jr., J. F., 119, 279Freer, G., 128, 274Freitag, C. S., 63, 269French, N., 158, 270Friede, T., 45, 233–34, 299Fry, E. E., 196–98, 280Fu, Y.-X., 250–52, 284Fujita, K., 162, 281Funkhouser, R., 95, 106, 281Funkhouser, R. K., 163, 183, 300Furman, M. H., 97, 307
Fussenegger, M., 24, 57, 60–62, 64,67–68, 98, 281
Gaillard, F., 117, 308Gallagher, M., 39, 275Gallo, R. C., 253, 293Gambaryan, A. S., 216, 292Gammon, M. C., 80, 272Ganiere, J. P., 135, 305Gao, F., 163, 183, 256, 287, 300Gao, P., 164, 216, 219, 281, 291Garrity, R., 135, 294Gascoigne, N. R., 53, 113, 304Geier, E., 45–46, 295George, P. M., 136, 275Georges, B., 37–38, 281Gerhard, W., 127–28, 132, 134,
213–15, 275, 285, 289, 302, 305,311
Gerhard, W. U., 132, 215, 311Gerken, G., 26, 284Germain, R. N., 44, 86, 245, 281Gerrish, P. J., 59, 304Gerrits, H., 101, 273Gewurz, B. E., 97, 307Ghany, M. G., 225, 281Gianfrani, C., 79–80, 281Gibbs, J., 47, 302Gigant, B., 211–12, 273Gilbert, S., 222, 285Gilbert, S. C., 29, 86–87, 121, 150,
281, 298Giorgi, J., 119, 303Giralt, E., 189–90, 192, 195, 291Gish, R. G., 225, 281Gitelman, A. K., 135, 286Glaudemans, C. P. J., 37, 272Godelle, B., 59, 306Goedert, J. J., 26, 114, 119, 303–4Gojobori, T., 249, 251–54, 279, 306,
311Goldberg, A. L., 45–46, 300, 311Goldstein, H., 119, 287Golub, E. S., 18, 281Good, M. F., 88, 135, 281Goodman, D., 164, 276Gorman, O. T., 147, 216, 309
320 AUTHOR INDEX
Gorny, M. K., 178, 183–85, 296, 312Gotch, F., 80, 293Gotch, F. M., 141, 292Gotte, D., 67, 288Goudsmit, J., 163, 277Goulder, P. J. R., 95, 106, 177, 270,
281Gournier, H., 49, 291Gouyon, P. H., 59, 306Govorkova, E. A., 135, 286Gow, P. J., 225, 281Graham, C. M., 128, 134, 214–15,
306Gran, B., 37, 297Gras-Masse, H., 37–38, 281Gravenor, M. B., 87, 104, 282, 298Gray, A. R., 99, 282Gray, D., 126, 130–31, 269, 282Gray, S., 164, 279Gray-Owen, S. D., 27–28, 105, 282Graziosi, C., 94, 305Green, D. R., 18, 281Green, F. R., 115–17, 306Greenberg, M. L., 164, 276Greene, M., 37, 289Greene, W. C., 240, 304Greenwood, B. M., 26, 29, 67, 86–87,
121, 150, 158, 263, 276, 281, 307Grenfell, B. T., 141, 278, 301Grey, H. M., 86, 303Griffin, D. E., 23, 146, 198, 265, 274,
282Grigsby, D., 250–52, 284Grimm, R., 46, 295Grivel, J.-C., 37, 41–42, 288Grobusch, M. P., 67, 158, 276Groettrup, M., 231, 296Groisman, E. A., 67–68, 156, 296Groot, P. C., 115, 299Gross, M. D., 59, 282Gruen, L. C., 36, 278Grunert, F., 27, 105, 308Grütter, M. G., 233–34, 238, 245, 307Gu, X., 113, 306Gu, Y., 226, 305Guardiola, J., 117, 282
Gubbels, M.-J., 250–51, 282Guillot, S., 162, 282Guinet, F., 64, 306Gupta, A., 28, 95, 301Gupta, R., 256, 287Gupta, S., 29, 86–87, 121, 135–36,
139, 143, 146, 149–50, 164–65,279, 281–82
Gupta, S. C., 128, 282Gurd, F. R. N., 35, 43, 176, 272Gust, I. D., 262, 288Gutjahr, T. S., 156, 283Gutman, G. A., 61, 289Guttman, D. S., 157, 283Gysin, J., 64, 302
Haag, A., 78, 301Haanen, J. B. A. G., 238, 241, 283Haas, G., 240, 302Habermehl, K.-O., 222, 309Hachamvitch, M., 119, 287Hackett, C. J., 128, 285Hackstadt, T., 196, 283Hadfield, A., 27, 105, 308Hagblom, P., 27, 64, 275Hahn, B. H., 67, 163–64, 183, 253,
256, 281, 287, 293, 300Hajós, J. P., 162, 283Hameed, M. R., 115, 269Hämmerling, G. J., 47, 287Hampl, J., 44, 86, 245, 277Hannan, C. M., 87, 298Hannoun, C., 181–82, 273Hannum, C., 35, 43, 176, 272Hansen, N. J. V., 225, 295Harding, R., 53, 113, 299Hargrave, P. A., 115, 310Hargrove, J. W., 150, 289Harindranath, N., 39, 283Harrigan, P. R., 240, 283Harris, D., 65, 278Harris, P. A., 181–82, 273Harrison, S. C., 190–91, 283Hartl, D. L., 69, 118, 149, 151, 170,
283, 308Harty, J. T., 120, 122, 270
AUTHOR INDEX 321
Harvey, P. H., 246, 294Hasegawa, M., 253, 283Hastings, I. M., 149–51, 153, 165–67,
171, 283, 297Haubold, B., 158, 270Haude, A., 27–28, 105, 282Hauser, S. L., 53–54, 113–14, 283Hausmann, A., 170, 296Hay, A. J., 262, 288Haydon, D. T., 190, 254, 283Hayes, S. F., 26, 271Haywood, A. M., 197, 284He, S., 95, 106, 281Heatwole, V. M., 64, 306Heber-Katz, E., 128, 285Hedegaard, K., 136, 288Hedrick, P. W., 149, 151, 284Heeney, J., 185, 295Hengartner, H., 40, 78, 125–26,
128–31, 140, 224, 232–33, 235,240, 242, 274–75, 282, 296, 298,301, 311
Hernández, J., 189–90, 192, 195, 291Hernandez-Rivas, R., 64, 302Herrera, J., 119, 279Herrfeldt, J. V., 64, 306Hetzel, C., 104, 284Heukeshoven, J., 83–84, 232, 309Heyndrickx, L., 67, 183–85, 288,
295–96Hide, G., 158, 250–51, 282, 284Higa, H. H., 217, 227, 300Hill, A. V. S., 26, 29, 86–87, 92, 112,
114–15, 121, 126, 129, 150, 281,284, 298, 303, 307
Hillis, D. M., 246, 284Hilmen, M., 63, 304Hinshaw, V. S., 181–82, 273Hiromoto, Y., 160–61, 169, 284, 289Hitziger, N., 45–46, 295Ho, D. D., 164, 281Hoe, N. P., 250–52, 284Hogg, T. L., 84, 276Hohler, T., 26, 284Höhne, W., 37, 286–87Holder, A. A., 65, 273
Holland, J. J., 58, 226, 278, 309Hollingshead, S. K., 60, 284Holmes, E. C., 94, 162, 178, 185–86,
246, 248, 284, 294, 297, 310Holt, R. D., 103, 304Hongo, S., 160, 269, 297, 306Horton, H., 236, 241, 279Horvath, E., 126, 130, 224, 275, 296Hoschutzky, H., 46, 295Houghten, R. A., 37, 297Houghton, M., 80, 299Housworth, W. J., 138, 284Hovi, T., 192, 196, 272Howard, R. J., 139, 290Howley, P. M., 58, 92, 130, 287Huang, L., 237–38, 298Hubscher, S. G., 225, 303Huczko, E. L., 85, 290Hudson, P. J., 36, 278Hudson-Taylor, D. E., 64, 304Hughes, A. L., 69, 95, 170, 178,
235–36, 241, 246, 249, 270, 279,284–85
Hughes, M. K., 170, 285Hulst, M. M., 197, 285Humphries, M. J., 196, 199, 285Hunt, D. F., 46, 295Hunziker, L., 224, 275Huovinen, P., 250, 294Hurwitz, J. L., 128, 285Huttley, G. A., 26, 114, 304Hynes, R. O., 196, 285
Ibanez, D. M., 115, 272Icenogle, J. C., 222, 285Ihlenfeldt, H. G., 46, 295Iida, S., 64, 285Ikeda, K., 75, 85, 92, 113, 303Ikematsu, H., 39, 283Ikeo, K., 249, 251–52, 279Ilunga, W., 163, 308Indest, K., 226, 305Inglis, S., 135, 300Iqbal, J., 139, 285Iroku, U. C., 236, 275
322 AUTHOR INDEX
Ishioka, G., 86, 303Ison, C. A., 156, 283
Jack, N., 164, 276Jackson, T., 196–99, 280, 285Jacobson, L. P., 26, 114, 304Jakobsen, I., 113, 306Jameel, S., 74, 287Jameson, S. C., 46, 86, 278, 285Jamieson, B. D., 84, 285Janeway, Jr., C. A., 13, 16–17, 20, 53,
55, 74, 77, 89, 113, 115, 127, 130,140, 233, 286
Janitz, M., 117–18, 277Janssens, W., 67, 183–85, 288,
295–96Jarra, W., 65, 298Jaulin, C., 49, 51, 286, 291Jeang, K.-T., 240, 303Jenni, L., 67, 286Jensen, L. T., 226, 286Jetzt, A. E., 162, 286Jiang, H., 237–38, 298Jiménez-Clavero, M. A., 189–90,
192–93, 304Jing, P., 95, 235–36, 241, 270, 279Johnston, R. E., 197–98, 272, 287Jones, D. M., 164, 279Jones, S. E., 132, 215, 288Jongejan, F., 250–51, 282Jongeneel, C. V., 51, 53, 112, 291Jung, G., 46, 295Jung, H. C., 119, 286Jyssum, K., 59, 286
Kahmann, R., 64, 286Kai, C., 162, 281Kaiser, M., 189, 305Kalden, J. R., 117, 299Kaleebu, P., 183, 309Kalish, M. L., 163, 183, 300Kam-Morgan, L. N. W., 37, 41–42,
288Kamp, D., 64, 286Kamper, S. M., 66, 271Kampinga, G., 163, 277Kang, W., 226, 309
Karabatsos, N., 181, 274, 288Karlinke, U., 78, 301Karlsson, K.-A., 216, 292Kaslow, R., 26, 114, 304Katlama, C., 240, 302Katopodis, N. F., 119, 287Katzer, F., 250–51, 282Kaverin, N. V., 135, 217, 286, 301Kawanishi, K., 85, 303Kawaoka, Y., 67, 147, 159, 208,
216–17, 219, 276, 286, 291–92,309
Keen, J. K., 65, 273Keitel, T., 37, 286–87Kennedy, K. E., 64, 285Kepler, T. B., 117–18, 277Kerlan-Candon, S., 117–18, 289Keulen, W., 240, 270Khanna, R., 85, 274Khilko, S., 46, 275Khurana, A., 48, 298Kilbourne, E. D., 213, 286Kim, A., 119, 287Kim, C. Y., 119, 286Kim, J. M., 119, 286Kim, K. J., 35, 302Kimata, J. T., 94–95, 287, 301Kimura, H., 160, 297Kimura, M., 149, 151, 246, 277, 287King, A. M. Q., 196–99, 280, 285King, G., 46, 295Kitame, F., 160, 297, 306Kitten, T., 63, 271Kjellberg, F., 150, 156, 158, 307Klarmann, G. J., 162, 286Klein, J., 82, 170, 296, 311Klein, P. A., 82, 311Klenerman, P., 29, 83, 86, 88, 90–91,
135, 224, 244, 275, 287, 295, 298Klimstra, W. B., 197–98, 272, 287Kloetzel, P.-M., 231–32, 272, 296Knipe, D. M., 58, 92, 130, 287Knossow, M., 211–13, 273, 280, 304Knowles, B. B., 82, 278Knowles, N. J., 196, 199, 254, 283,
285Kocher, T. D., 253, 283
AUTHOR INDEX 323
Koezuka, Y., 48, 298Kokka, R., 80, 299Kolberg, J., 27, 290Kollmann, T. R., 119, 287Konigsberg, W. H., 37, 299Koppe, B., 29, 83, 86, 90–91, 287,
295Korber, B., 163, 183, 256, 287, 300,
311Korber, B. T. M., 95, 106, 281Kordari, P., 250–52, 284Korotkova, E., 162, 282Kortt, A. A., 36, 278Kosinski, R. J., 100, 287Kosrikis, L. G., 164, 281Kostolanský, F., 219, 222–24, 287Koszinowski, U., 231, 296Koszinowski, U. H., 97, 269Kourilsky, P., 49, 51, 81, 273, 286,
291Kovacs, J., 115, 280Kovaleva, V. P., 217, 301Kramer, A., 37, 286–87Krauss, S., 208, 286Kreeb, G., 82, 311Krellner, P. H., 117, 299Kremer, L., 40, 289Kremsner, P. G., 67, 136, 139, 158,
263, 271, 276Kronenberg, M., 48, 298Kropshofer, H., 47, 287Krug, R. M., 67, 159, 206–8, 213, 288Krugman, S., 140, 269Kruisbeek, A. M., 238, 241, 283Krystal, M., 160, 273Kuijpers, A., 64, 307Kuiken, C., 163, 183, 300Kulkarni, A., 48, 298Kuller, L., 94–95, 287Kum, E., 139, 280Kumar, S., 246, 295Kumar, V., 74–75, 287, 308Kündig, T. M., 125–26, 128–31, 140,
311Kuno, G., 181, 288Kunstman, K. J., 95, 235, 270Kunstmann, E., 156, 306
Kuroda, M. J., 236, 275Kurth, R., 183–84, 308Kusecek, B., 27, 290Kwiatkowski, D., 26, 29, 86–87, 104,
121, 150, 281–82, 307
Lacy, E., 85, 279Laderoged, S., 226, 286Laeeq, S., 215, 227, 288Lai, S., 164, 298Lalloo, D., 29, 86, 287Lalloo, D. G., 83, 90–91, 295Lamb, R. A., 67, 159, 206–8, 213,
288Lambert, P. H., 139, 276Lambkin, R., 132–33, 215, 288Lancefield, R. C., 60, 288Landau, N. R., 95, 105, 276Landweber, L. F., 189, 288Lane, L., 59, 290Lanyon, G., 119, 279Lanzer, M., 64–65, 278, 302Lapedes, A., 256, 287Larder, B. A., 240, 283Larsen, C., 63, 306Larsen, O., 136, 288Larsson, C., 135, 305Latek, R. R., 48, 288Latham, J. L., 221, 288Lathrop, M. G., 115, 299Latron, F., 80, 293Laukkanen, T., 67, 288Laurent, J.-P., 155, 299Lauster, R., 117–18, 277, 282Lavanchy, D., 262, 288Laver, W. G., 213, 215, 286, 309Lavoie, T. B., 37, 41–42, 78, 288, 295Lawrence, J. G., 67–68, 156, 296Layne, S. P., 262, 288Lea, S., 189–90, 192, 195, 291Lea, S. M., 196–98, 280Leach, S. J., 35, 43, 176, 272Learn, G. H., 163, 183, 300Learn, Jr., G. H., 178, 246, 300Lebecque, S., 82, 270LeClerc, J. E., 59, 288Lee, E. A. M., 87, 298
324 AUTHOR INDEX
Lee, J., 59, 290Lehmann-Grube, F., 83–84, 232, 309Lehrnbecher, T., 115, 280Leigh, E. G., 59, 289Leigh Brown, A. J., 185–86, 284Leippe, D., 222, 293Leitner, T., 163, 183, 300Le Lay, G., 156, 302Lemonier, F. A., 49, 291Lennon-Dumenil, A.-M., 46, 308Lenski, R. E., 24, 57, 59, 189, 272,
293, 304Le Page, R. W. F., 67, 286Lescar, J., 37, 289Letvin, N. L., 236, 275Levin, B. R., 167, 289Levin, S. A., 25, 146, 270, 289Levine, A. J., 67, 306Levinson, G., 61, 289Levraud, J.-P., 81, 273Levrero, M., 29, 86, 272Lewi, P., 183–85, 295–96Ley, V., 189–90, 192–93, 304Lheureux, M., 66, 297Li, B., 59, 288Li, C. C., 149, 151, 289Li, T., 162, 311Li, W.-H., 246, 248, 289Li, Y., 37, 41–42, 160–61, 164, 281,
284, 288Liang, S., 128, 289Lidholt, K., 196, 302Liebert, U. G., 225, 289Liebl, M. E., 95, 235, 270Liitsola, K., 67, 288Lin, J., 25, 146, 270, 289Lin, Y. P., 210, 291Lindahl, G., 135, 305Lindstrom, S. E., 160–61, 169, 284,
289Linkahl, U., 196, 302Lipatov, A. S., 135, 286Lippolis, J. D., 83, 294Lipschultz, C. A., 37, 41–42, 288Lissowska, J., 119, 279Liu, M., 250–52, 284Liu, W., 164, 298
Liu, Y.-J., 82, 270Liu, Y.-T., 26, 114, 291Llorente, M., 40, 289Lloyd, A. L., 104, 282Lo, D., 53, 113, 304Loffler, S., 225, 289Löhning, M., 127, 290Lohr, H. F., 26, 284Lok, A. S. F., 225, 281Lomb, D. A., 26, 114, 304Long, E. M., 95, 301Longmate, J. A., 115, 310Lopez, J. A., 49, 291Lord, C. C., 150, 289Lorenzen, D. R., 27–28, 105, 282Louis, P., 117–18, 289–90Louis-Plence, P., 117, 308Loukaci, V., 115–17, 306Louwagie, J., 163, 273Low, D. E., 250–52, 284Lowy, D. R., 135, 300Lubjuhn, R., 26, 284Luca, P., 40, 289Lucchiari, M., 46, 295Lucchiari-Hartz, M., 45–46, 295Luckey, C. J., 85, 290Ludlam, C. A., 185–86, 284Ludwig, S., 181–82, 273Luescher, I., 51, 286Lukashov, V. V., 185, 271Lukomski, S., 250–52, 284Luthy, R., 49, 291Lutz, C., 40, 296Lvov, D. K., 135, 216, 286, 292Lyons, D., 44, 86, 245, 277Lyons, E. J., 69, 170, 308
Ma, Y., 162, 311Mable, B. K., 246, 284Macedo, A. M., 154, 296MacKenzie, J., 207, 301MacLeod, A., 158, 290Madrenas, J., 86, 290Maeda, K., 162, 281Maffei, A., 117, 282Mahabir, B., 164, 276

AUTHOR INDEX 325
Maiden, M. C. J., 143, 146, 149,156–57, 164–65, 279, 282, 305
Maier, B., 46, 295Mainhart, C. R., 37, 41–42, 78, 288,
295Major, M. E., 75, 92, 113, 303Makarova, N. V., 135, 286Malby, R. L., 36, 278Malik, A., 52–53, 112–13, 300Mallampalli, V. L., 226, 303Mallet, C. P., 78, 295Malorny, B., 27, 290Man, S., 85, 290Mañes, S., 40, 289Manivel, V., 77–78, 294Manser, T., 88, 280Manz, R. A., 127, 290Mao, E. F., 59, 290Margoliash, E., 35, 43, 176, 272Margulies, D. H., 46, 275Marklund, L., 115, 278Marrs, C. F., 63, 290, 301Marsh, K., 139, 290Marsh, S. G. E., 48, 52–53, 112–13,
290, 300Marshall, D., 127–28, 290Marti, S., 67, 286Martin, D. R., 250, 290Martin, D. W., 162, 290Martín, J., 210, 291Martin, M., 119, 279Martin, R., 37, 297Martínez, M. A., 189–90, 192–96,
199, 291Martínez-A., C., 40, 289Martinson, J. J., 26, 114, 291Maryanski, J. L., 49, 51, 53, 112, 286,
291Mason, D., 34, 49–50, 291Mason, P. W., 192, 196–98, 272, 294,
299, 301Masurel, N., 137, 291Mateu, M. G., 189–96, 199, 260, 279,
291Matrosovich, M., 216–17, 219, 291–
92Matrosovich, M. N., 216, 292
Matsuzaki, Y., 160, 269Maudlin, I., 158, 284, 290May, R. M., 83, 90–91, 104, 106, 136,
140–41, 143, 146, 149, 164–65,227, 235, 241–42, 245, 264, 270,282, 295
Maynard Smith, J., 59, 68, 150–53,156, 158, 292, 305–6
Mbah, H. A., 178, 183–85, 296McAdam, S., 29, 83, 86, 90–91, 287,
295McBride, J. S., 263, 276McCauley, J. W., 181–82, 273McColl, K. E. L., 119, 279McCulloch, R., 101, 273McCutchan, F., 163, 183, 273, 300McCutchan, F. E., 67, 164, 256, 288,
292, 298McDanal, C. B., 164, 276McGeer, A., 250–52, 284McGinn, B., 196, 280McHeyzer-Williams, M. G., 177, 270McHutchison, J., 80, 299McIntosh, K., 95, 106, 281McLain, L., 132, 215, 219–22, 288,
292McLean, A. R., 104, 282McLuskey, J., 46, 275McMichael, A., 80, 293McMichael, A. J., 24, 80, 126, 141,
177, 235, 241–42, 270, 274, 292McNamara, J. J., 150, 289Meenzen, C. M., 117, 299Meier, U.-C., 86, 298Melbye, M., 136, 288Melief, C., 231, 296Melief, C. J., 231–32, 272Melo, A. I. R., 154, 296Melpolder, J. C., 95–96, 279Mengede, E., 231, 296Menon, J. N., 92, 292Metcalf, J. A., 115, 280Metzger, D. W., 215, 309Meyer, J., 64, 285Meyer, S., 253, 292Meyer, T. F., 27–28, 61–62, 67–68,
105, 281–82, 292, 306
326 AUTHOR INDEX
Meyer zum Buschenfelde, K. H., 26,284
Mharakurwa, S., 158, 270Michael, J. G., 35, 43, 176, 272Michel, V., 135, 305Michod, R. E., 167, 292Mikami, T., 162, 281Mikes, Z. S., 263, 276Mikili, J., 158, 270Miller, A., 35, 43, 176, 272Miller, J. D., 80, 294Miller, J. H., 59, 290Miller, L. H., 64, 304Mills, K., 128, 292Mims, C, 13, 64, 293Mims, C., 13, 292Mims, C. A., 15, 129–30, 140, 293Miralles, R., 226, 293Mishra, G. C., 75, 308Misko, I. S., 85, 274Mitchell, T. G., 156, 310Mitchison, A., 115, 117, 277, 293Mitchison, H., 115, 117, 277Mitchison, N. A., 117–18, 277, 282,
293Mitti, P. R. E., 233–34, 238, 245, 307Miyazawa, T., 162, 281Mo, X. Y., 45–46, 311Modlin, R. L., 48, 298Modrow, S., 253, 293Moffatt, M. F., 53, 113, 293Mohan, K., 139, 293Mohan, S., 37, 41–42, 288Mol, F., 115, 280Molina, N., 200, 295Moller, M., 115, 278Mollinedo, R., 158, 270Montgomery, A. M. P., 196, 293Moody, A. M., 53, 113, 293Mooi, F. R., 62, 310Moomaw, C. R., 46, 278Moore, D. M., 200, 275Moormann, R. J. M., 197, 285Moots, R., 80, 293Morelli, G., 27, 156, 290, 306Morgan, D. O., 200, 275
Moritz, C., 246, 284Morris, J., 29, 86–87, 121, 150, 281Morrison, J., 80, 293Morse, R. M., 115, 269Moskophidis, D., 86, 232–35, 237–38,
240, 242, 293, 298Moss, D. J., 85, 274Moss, P., 53, 113, 299Moss, P. A. H., 177, 270Mosser, A. G., 222, 293Mothé, B. R., 95, 235, 270Mould, A. P., 196, 199, 285Mouton, D., 115, 272, 299Moxon, E. R., 24, 57, 59, 98, 277,
293Moya, A., 154, 226, 293, 307Mozdzanowska, K., 128, 289Mucha, V., 219, 222–24, 287Mulanga, C., 256, 311Mulanga-Kabeya, C., 163, 308Muldoon, M., 256, 287, 311Müller, B., 115, 117, 277Muller, B., 117–18, 293Munoz, S. J., 95–96, 279Muñoz-Jordán, J. L., 101, 294Muotiala, A., 250, 294Muraki, Y., 160, 269, 297, 306Murali-Krishna, K., 80, 129, 294,
305, 309Musser, J. M., 250–52, 284Mutimer, D., 225, 281Mutimer, D. J., 225, 303Mylin, L. M., 83, 294
Nádas, A., 178, 183–85, 296, 312Naidenko, O., 48, 298Naidich, S., 250–52, 284Nakada, S., 160, 273Nakagawa, T. Y., 46, 294Nakajima, K., 133–34, 206, 294Nakajima, S., 133–34, 206, 294Nakamura, K., 160, 269, 297, 306Nakashima, K., 250–52, 284Nakazawa, T., 75, 92, 113, 303Nakra, P., 77, 294Naot, Y., 97, 301

AUTHOR INDEX 327
Nara, P. L., 135, 294Nash, A., 13, 292Natali, A., 133–34, 206, 294Nathenson, S. G., 237–38, 311Natori, T., 48, 298Naucler, A., 136, 288Nayak, B. P., 78, 269, 294Nazbal, C., 76, 269Nee, S., 143, 146, 149, 164–65, 246,
282, 294Neefjes, J., 231, 296Neefjes, J. J., 231–32, 272Neff, S., 192, 197–98, 294Nei, M., 113–14, 246, 248, 294–95,
306Neisig, A., 231–32, 272, 296Nerome, K., 160–61, 169, 284, 289Nerome, R., 160–61, 169, 284, 289Neva, F. A., 139, 295Newberg, M. H., 85, 290Newbold, C. I., 64, 304Newman, A. M., 78, 295Newman, J. W. I., 196–99, 280, 285Newsom-Davis, J., 53, 113, 293Nguyen, T., 95, 106, 281Nguyen-Van-Tam, J. S., 138–39, 206Nickel, P., 27, 62, 306Niedermann, G., 45–46, 295Nielsen, K. M., 69, 170, 308Nielsen, L., 225, 295Niewiesk, S., 239, 295Nightingale, S., 239, 295, 297Nijhuis, M., 240, 270Nishimura, H., 160–61, 289, 297Nishioka, M., 75, 85, 92, 113, 303Nkengasong, J., 183–84, 296Noble, G. R., 141, 292Nobusawa, E., 133–34, 206, 294Noël, S., 155, 277, 299Nokes, D. J., 140, 295Nolan, D., 63, 66, 297Nomura, T., 85, 303Norbury, C. C., 47, 302Norley, S., 183–84, 308Nosten, F., 158, 270Notghi, A., 26, 284
Notkins, A. L., 39, 275, 283Nowak, M. A., 24, 57, 59, 83, 90–91,
104, 106, 133, 227, 235, 241–42,245, 293, 295, 310
Numazaki, Y., 160, 297Núñez, J. I., 189–90, 192–93, 200,
295, 304Nyambi, P. N., 178, 183–85, 295–96,
312Nzilambi, N., 163, 308
O’Brien, S. J., 26, 28, 114, 119, 296,303
O’Brien, T. R., 26, 114, 119, 164,276, 303–4
O’Callaghan, C. A., 80, 274Ochman, H., 67–68, 156, 296Ochsenbein, A. F., 40, 126, 130, 224,
275, 296O’Connor, D. H., 95, 235–36, 241,
270, 279O’Donnell, K., 225, 303Oduola, A. M. J., 67, 158, 263, 276Oehen, S., 125–26, 128–31, 140, 311Ogg, G. S., 80, 274O’hUigin, C., 170, 296Oldenburg, M. C., 115, 269Oliveira, R. P., 154, 296Oliver, K., 65, 278Olsen, C. W., 181–82, 273Omoe, K., 160–61, 169, 289Orenstein, W. A., 55, 130, 298Orive, M. E., 167, 296O’Rourke, M., 68, 150–53, 156, 158,
283, 292Oseroff, C., 79–80, 281Osmanov, S., 163, 183, 300Ossendorp, F., 231–32, 272, 296Otto, S. P., 167, 246, 297Ou, R., 237–38, 298Oude Essink, B. O., 240, 270Oury, B., 155–56, 299, 307Overbaugh, J., 94–95, 246, 275, 287,
297, 301Owen, C. A., 65, 273Owsianka, A., 225, 303
328 AUTHOR INDEX
Oxford, J. S., 133–34, 138, 206, 294,297
Pachner, A. R., 27, 274Page, R. D. M., 94, 178, 246, 248,
297Paindavoine, P., 67, 286Palese, P., 160, 213, 273, 297Palladino, G., 128, 289Palma, E. L., 189–90, 192, 195, 260,
279, 291Palucka, K., 82, 270Pamer, E. G., 79, 274Pan, X., 250–52, 284Pantaleo, G., 94, 305Paolucci, S., 94, 305Parham, P., 48, 52–53, 112–13, 290,
300Parker, C. E., 239, 295Parker, E. P., 239, 297Parry, N. R., 196, 280Patalapati, R., 27, 274Patel, C. K., 262, 288Patera, A. C., 128, 134, 214–15, 306Patten, P. A., 37, 39, 54, 309Paul, A., 62, 310Paul, R. E. L., 150, 158, 289, 297Paul, W. E., 140, 297Paulson, J. C., 216–17, 219, 227,
276–77, 297, 300–1Pauza, C. D., 236, 241, 279Payne, W. L., 59, 288Pays, E., 63, 66–67, 286, 297Peddis, G., 95–96, 279Peeling, R. W., 88, 271Peeters, M., 163–64, 183, 185, 256,
281, 295, 300, 308, 311Pellegrini, M., 37, 289Pelton, S. I., 95, 106, 281Pena, S. D. J., 154, 296Peng, G., 160, 297Penna, A., 29, 86, 272Perdue, S. S., 35–36, 41, 272Perelson, A. S., 136, 304Perera da Silva, L. H., 65, 278Peréz, J. J., 189–90, 192, 195, 291Perlmann, P., 139, 285
Persu, A., 162, 282Peters, C., 46, 308Peterson, D. S., 64, 304, 306Peterson, N., 37, 289Pettoello-Mantovani, M., 119, 287Philip, G., 139, 280Philipp, M. T., 226, 305Phillips, R. E., 24, 80, 83, 86, 90–91,
235, 241–42, 292, 295, 298Phillips, R. S., 27, 273Picard, B., 156, 302Pieniazek, D., 163, 183, 300Pijnenburg, J., 162, 283Pilip, I. M., 79, 274Pilotti, E., 134, 294Pinches, R., 64, 304Pinet, V., 117–18, 289Pinilla, C., 37, 297Pinschewer, D. D., 126, 130, 296Piot, P., 183–85, 295–96Pircher, H., 232–33, 235, 240, 242,
298Pirchet, H., 125–26, 128–31, 140,
311Piskarev, V. E., 216, 292Piyasirisilp, S., 164, 298Plasterk, R., 64, 307Playfair, J., 13, 64, 293Playfair, J. H. L., 15, 129, 293Plebanski, M., 29, 86–87, 121, 150,
281, 298Pliska, V., 78, 301Ploegh, H. L., 46, 97, 307–8Plotkin, S. A., 55, 130, 298Plückthun, A., 233–34, 238, 245, 307Poljak, R. J., 37, 289Porcelli, S. A., 48, 298Porter, G., 80, 272Porter, P., 140, 298Porterfield, J. S., 181, 274Potter, C. W., 141, 292Potts, J. R., 198, 298Pouvelle, B., 64, 302Power, C. A., 92, 115, 298Prager, E. M., 35, 43, 176, 272, 298Pramanik, B. C., 46, 278Preiser, P. R., 65, 298
AUTHOR INDEX 329
Preston, B. D., 58, 162, 286, 298Preuss, M., 65, 278Price, D. A., 86, 298Price, G. E., 237–38, 298Prigozy, T. I., 48, 298Protzer, U., 26, 284Puel, A., 115, 299Puglielli, M. T., 232–33, 235, 299Pulendran, B., 82, 270Purbhoo, M. A., 86, 298Purcell, R. H., 95–96, 279Pybus, O. G., 256, 311
Qasba, P., 48, 298Quesney, V., 155, 299
Rabkin, C. S., 119, 279Racaniello, V. R., 189, 299Radbruch, A., 127, 290Radman, M., 59–60, 299, 306Rainey, P. B., 24, 57, 59, 293Rajandream, M.-A., 65, 278Ramamoorthy, R., 226, 305Rambaut, A., 162, 246, 294, 310Ramiro-Ibañez, F., 213, 219, 224,
302Rammensee, H. G., 45, 49, 233–34,
291, 299Ramsperger, A., 45–46, 295Rao, K. V. S., 41, 74–78, 89–90, 266,
269, 287, 294, 299, 308Rasmussen, B., 211–12, 273Ravetch, J. V. Wellems, 64, 306Reeder, J. C., 27, 299Rees, D. C., 26, 114, 291Rehermann, B., 80, 299Reich, Z., 44, 86, 245, 277Reichlin, M., 35, 43, 176, 272Reichstetter, S., 117, 299Reider, E., 197, 299Reilly, C., 53, 113, 304Reimann, J., 81–82, 299Reisfeld, R. A., 196, 293Reuhl, W. W., 63, 290Revollo, S., 155, 299Reyburn, H., 53, 113, 293, 299Rice, C. M., 80, 299
Rich, S. M., 66, 69, 170, 262, 299Richards, F. F., 37, 299Richardson, L., 158, 270Rickinson, A. B., 80, 129, 274, 300Ridge, J. P., 85, 279, 290Rieder, E., 192, 196–98, 294, 301Riese, R. J., 46, 308Rigolet, P., 211–12, 273Rima, B. K., 225, 289Rinaldo, C., 119, 303Ripley, L. S., 60–61, 300Rittner, C., 26, 284Roberts, D. J., 64, 304Robertson, D., 163, 308Robertson, D. L., 67, 163–64, 183,
281, 300Robertson, J. S., 216, 218–19, 292,
300Robinson, J., 52–53, 112–13, 300Rocha, E., 189, 291Rock, K. L., 45–47, 81–82, 300, 304,
311Rodarte, R., 196, 198, 301Roden, R. B. S., 135, 300Rodrigo, A. G., 178, 246, 300Rogers, G. N., 216–17, 227, 300–1Rohani, P., 141, 278, 301Röhm, C., 207, 301Rohrer, U., 232–33, 235, 240, 242,
298Roitt, I., 13, 64, 293Roitt, I. M., 15, 129, 293Roivainen, M., 192, 196, 272Rojter, S., 225, 281Romero, P., 51, 286Ron, Y., 162, 286Roost, H. P., 78, 128, 301Roper, C., 67, 158, 263, 276Rosas, M. F., 189–90, 192–93, 304Rose, M. R., 189, 301Rosenberg, E. S., 95, 106, 281Rosenberg, W., 29, 86, 287Rosenstein, R. W., 37, 299Ross, A. G., 136, 275Rostand, K. S., 196, 301Roth, W., 46, 308Rothman, N., 119, 279

330 AUTHOR INDEX
Rottem, S., 97, 301Rotzschke, O., 49, 291Rouzine, I. M., 149, 167–68, 171,
261–62, 301Rowland-Jones, S., 29, 83, 86, 90–91,
287, 295Rowlands, D. J., 196, 280Roy, R. P., 78, 294Rozsa, W. F., 63, 301Rubinstein, A., 119, 287Rudel, T., 67–68, 281Rudenko, G., 101, 273Rudensey, L. M., 95, 275, 301Rudensky, A. Y., 46, 294Rudersdorf, R. A., 236, 241, 279Rudneva, I. A., 135, 217, 286, 301Rueckert, R., 222, 285Rueckert, R. R., 222, 293Ruiz-Jarabo, C. M., 194, 197, 200,
270, 295Ruppert, J., 86, 303Ruppert, T., 231, 296Russ, G., 219, 222–24, 287Russell, V., 53, 113, 299Ruvoen-Clouet, N., 135, 305Ryll, R., 67–68, 281Ryman, K. D., 197, 287
Sa-Carvalho, D., 192, 196–98, 294,301
Sacchettini, J. C., 237–38, 311Saftig, P., 46, 308Saha, K., 28, 95, 301Saito, T., 75, 92, 113, 160–61, 284,
289, 303Sáiz, M., 189–90, 192–93, 304Sakihama, N., 263, 276Salaun, L., 156, 302Salmelinna, S., 250–52, 284Salminen, M., 163, 183, 273, 300Salminen, M. O., 164, 281Salmivirta, M., 196, 302Saltzmann, E. J., 140, 269Samri, A., 240, 302Samuel, A., 196–98, 280Samuel, A. R., 254, 283Samuels, S., 115, 280
Sánchez, C., 200, 295Sanchez, C. P., 65, 278Sánchez-Palomino, S., 40, 289Sanders-Buell, E., 164, 298Sandstrom, A., 136, 288Sangster, M., 127–28, 290Sanna, P. P., 213, 219, 224, 302Sapp, C. M., 162, 311Sarkar, S., 76, 269Sartoris, S., 117, 282Sasisekharan, R., 196, 302Satta, Y., 170, 296Sauma, S. Y., 80, 272Sawyer, S. A., 66, 262, 299Schalm, S. W., 26, 308Scherf, A., 64, 302Scherle, P., 127–28, 302Schild, G. C., 133–34, 206, 294Schiller, J. T., 135, 300Schirmbeck, R., 81–82, 299Schlichtherle, M., 27, 64, 275Schlom, J., 86, 269Schneider, N. K., 65, 278Schneider, P. M., 26, 284Schneider-Mergener, J., 37, 286–87Schneider-Schaulies, J., 196, 198Schofield, D. J., 213, 219–21, 302Schols, D., 119, 302Scholtissek, C., 181–82, 208, 273,
302Scholz, C., 37, 286Schoolnik, G. K., 63, 290Schou, C., 53, 113, 293Schreuder, G. M., 26, 308Schroer, J. A., 35, 302Schubert, U., 47, 302Schuchat, A., 250–52, 284Schuitemaker, H., 185, 271Schulman, J. L., 213, 286Schultz, P. G., 37, 39, 54, 309Schumacher, T. N. M., 47, 81, 238,
241, 283, 303Schust, D. J., 97, 307Schwartz, B., 250–52, 284Schwartz, R. H., 53, 113, 304Schweizer, J., 67, 286Scott, J. R., 60, 284
AUTHOR INDEX 331
Scott, T. W., 226, 277, 303Sealy, R., 127–28, 290Seaman, M. S., 129, 303Seder, R. A., 92, 126, 129, 303Seed, J. R., 100, 303Sefton, B., 82, 311Segel, R. M., 117–18, 293Sema, H., 163, 308Semmes, O. J., 240, 303Senn, B. M., 224, 275Seo, S. H., 141, 303Seppala, H., 250, 294Sercarz, E. E., 35, 43, 125, 176, 272,
274Servis, C., 49, 291Sette, A., 29, 79–80, 86, 95, 232–33,
235–36, 241, 270, 272, 279–81,299, 303
Sevilla, N., 194, 197, 270Sewell, A. K., 86, 298Shabanowitz, J., 46, 295Shao, Y., 164, 298Sharma, P. L., 240, 303Sharp, P. M., 67, 163–64, 183, 281,
300Shaw, G. M., 164, 230, 241, 253, 273,
281, 293Shaw, J., 225, 303Shen, L., 236, 275Sheppard, D., 199, 285Sheridan, K. E., 95, 105, 276Shi, G.-P., 46, 308Shi, W., 39, 275Shields, P. L., 225, 303Shiels, B. R., 250–51, 282Shimoda, A., 95–96, 279Shin, H. D., 119, 303Shinjoh, M., 160–61, 284Shirai, M., 75, 85, 92, 113, 303Shiwen, H., 222, 285Shope, R. E., 181, 274Shortridge, K. F., 67, 159, 309Shreffler, D., 82, 311Sidney, J., 79–80, 236, 241, 279, 281Siegel, E. C., 59, 282Sierro, S., 126, 130, 296Sigal, L. J., 47, 81–82, 304
Sigmund, K., 83, 90–91, 295Sijts, A., 231–32, 272, 296Silins, S. L., 85, 274Sill, A., 164, 276Silva, D. A., 189, 291Silverman, M., 63, 304Sim, B. C., 53, 113, 304Simmonds, P., 185–86, 284Simon, M., 63, 304Single, L .A., 250, 290Sinha, K. A., 65, 273Skehel, J., 128, 292Skehel, J. J., 133–34, 206, 208–14,
216–18, 227, 273, 280, 291, 300–1,304, 309–10
Sklyanskaya, E. I., 217, 301Slansky, J., 80, 294Slatkin, M., 167, 304Slaughter, C. A., 46, 278Slifka, M. K., 127, 304Smirnov, Y. A., 135, 286Smith, C. A., 128, 134, 214–15, 227,
288, 306Smith, C. L., 154, 296Smith, D. J., 136, 304Smith, J. D., 64, 304Smith, M. R., 240, 304Smith, M. W., 26, 114, 119, 303–4Smith, N. H., 68, 150–53, 156, 158,
292, 306Smith, T., 139, 280Smith, V. H., 103, 304Smith-Gill, S. J., 35, 37, 41–43, 78,
176, 272, 288, 295Sniegowski, P., 60–61, 275Sniegowski, P. D., 59, 304Snoke, K., 86, 303Snounou, G., 65, 298Sobrino, F., 189–90, 192–93, 200,
275, 295, 304Solé, M., 226, 305Sompayrac, L. M., 13, 305Song, I. S., 119, 286Sonrier, C, 135, 305Souchon, H., 37, 289Soudeyns, H., 94, 305Sourdive, D. J. D., 80, 294, 305
332 AUTHOR INDEX
Southwell, B., 139, 280Spoon, M. M., 138, 284Spratt, B. G., 68, 150–53, 156–58,
164, 279, 283, 292, 305, 311Spriggs, M. K., 97, 305Springer, T. A., 196, 305Stalhammar-Carlemalm, M., 135, 305Staudt, L. M., 134, 305Stearns, S. C., 189, 305Štefanová, I., 44, 86, 245, 281Stefanovic, S., 45, 233–34, 299Stein, S., 115, 280Steinberg, S. M., 115, 280Steinert, M., 66–67, 286, 297Steinhauer, D. A., 208, 210, 291, 305Stephan, W., 60–61, 275Stephen, J., 13, 292Stephens, J. C., 119, 303Stephenson, J. R., 213, 219–21, 302Stern, A., 27, 62, 306Steven, N., 80, 274Stevens, D. J., 213, 304Stevens, R. C., 37, 39, 54, 309Stevenson, M. M., 139, 293Stevenson, P. G., 129, 141, 306Stimpfling, J., 82, 311Stöcklein, W., 37, 287Stoenner, H. G., 63, 271, 306Straus, J. H., 67, 306Strauss, E. G., 67, 306Strazzera, A., 95–96, 279Strominger, J. L., 80, 293Strong, I., 181–82, 273Stuart, D., 189–90, 192, 195, 291Stuart, D. I., 196–98, 280, 285Su, C., 113–14, 306Su, X., 64, 306Subbarao, K., 161, 183, 206–8, 253,
255, 257–60, 274, 277Suerbaum, S., 156, 306Sugawara, K., 160, 269, 297, 306Sugita, S., 160–61, 169, 284, 289Sundström, A., 27, 64, 275Suresh, M., 80, 294Süss, J., 207, 301Suter, M., 40, 296Suzuki, H., 160, 297
Suzuki, Y., 253, 306Swain, S. L., 126–27, 129, 277–78,
306
Tada, Y., 160, 306Taddei, F., 59, 306Taheri, H., 26, 284Tait, A., 67, 158, 284, 286, 290Takahashi, H., 75, 92, 113, 303Takahashi, T., 160–61, 169, 289Takemoto, D. K., 210, 291Tamhankar, S., 80, 272Tan, L., 80, 274Tanabe, K., 263, 276Tang, L.-Y., 162, 311Tang, Y., 95, 106, 281Tanuri, A., 196, 198, 301Tartar, A., 37–38, 281Tashiro, M., 262, 288Taubenberger, J. K., 262, 288Taubes, C. H., 118, 283Taylor, G., 239, 295Taylor, G. P., 239, 297Taylor, H. P., 133, 222, 276, 306Tello, D., 37, 289Telxeira, A. M., 27, 105, 308Teneberg, S., 216, 292ter Avest, A. R., 62, 310ter Meulen, V., 225, 289Terry, C. F., 115–17, 306Tevethia, S. S., 83, 294Thakore, S. S., 69, 170, 308Theil, A., 127, 290Theiler, J., 256, 287, 311Thomas, B., 128, 292Thomas, D. B., 128, 134, 214–15,
227, 288, 306Thomas, H. C., 26, 307Thomas, S. M., 69, 170, 308Thursz, M., 26, 307Thylstrup, M., 225, 295Tibayrenc, M., 150, 152–56, 158,
271, 273, 277, 299, 307Tissot, A. C., 233–34, 238, 245, 307Todd, P. E., 35, 43, 176, 272Torán, J. L., 40, 289Tortorella, D., 97, 307

AUTHOR INDEX 333
Toupance, B., 59, 306Tranchand-Bunel, D., 37–38, 281Travers, P., 13, 20, 53, 55, 74, 77,
89, 113, 115, 127, 130, 140, 233,286
Tremblay, C., 95, 106, 281Trenholme, K., 150, 289Trocha, A., 95, 106, 281Tshimanga, K., 163, 308Tsuchiya, E., 160, 269Tsuchiya, K. R., 181, 288Tsvetkova, I. V., 217, 301Turelli, M., 116, 271Turner, C. M. R., 24, 27, 63, 98–101,
104, 158, 270–71, 273, 290, 307Tuteja, R., 78, 294Tvinnereim, A. R., 120, 122, 270Tweedie, A., 158, 290
Unanue, E. R., 48, 288Underwood, P. A., 133–34, 214, 307Usmany, M., 162, 283Utermöhlen, O., 83–84, 232, 309
Vaccarezza, M., 94, 305Valcavi, P. P., 134, 294Valero, M. L., 189, 192, 260, 279VanCott, T. C., 183–84, 312Vanden Haesevelde, M., 185, 295van de Putte, P., 64, 307van der Groen, G., 67, 183–85, 288,
295–96van der Heide, H. G. J., 62, 310van der Most, R. G., 232–33, 235,
299van der Ploeg, L. H. T., 99–100, 269van Gennip, A. H., 240, 270van Gennip, H. G. P., 197, 285van Hall, T., 231–32, 272van Hattum, J., 26, 308van Kuilenburg, A. B., 240, 270van Leeuwen, F., 101, 273van Nuenen, A., 185, 271van Veelen, P. A., 231–32, 272Varecková, E., 219, 222–24, 287Varga, J. M., 37, 299Varghese, J. N., 215, 309
Varich, N. L., 135, 286Velez, I. D., 158, 270Venham, J. E., 236, 241, 279Venkataraman, G., 196, 302Verdaguer, N., 192–96, 199, 291Verra, F., 69, 170, 285Vickerman, K., 99, 308Vidal, N., 163, 308Vierling, J. M., 225, 281Vijayakrishnan, L., 75, 308Vijh, S., 79, 274Vilgalys, R., 156, 310Villadangos, J. A., 46, 308Villalobos, J. M., 65, 278Villamil, F. G., 225, 281Vincent, R., 117–18, 289–90, 308Virji, M., 27, 105, 308Vishwakarma, R. A., 77–78, 294Vlahov, D., 119, 303Vlak, J. M., 162, 283Vogel, T., 183–84, 236, 241, 279,
308Vogel, T. U., 95, 235, 270Vogt, A. B., 47, 287Volkman, S. K., 69, 170, 308von Haeseler, A., 253, 292Voss, G., 236, 275Vuopio-Varkila, J., 250–52, 284, 294
Wagner, R., 164, 298Wagner, S. D., 215, 227, 288Wahlgren, M., 27, 64, 136, 139, 271,
275Wakeland, E. K., 115, 310Wakelin, D., 13, 15, 64, 129, 293Wakely, J., 253, 308Walker, B. D., 95, 106, 281Walker, G. C., 60, 308Walker, P. R., 51, 53, 112, 291Walliker, D., 158, 270Walport, M. J., 13, 20, 53, 55, 74, 77,
89, 113, 115, 127, 130, 140, 233,286
Wang, C. R., 129, 303Wang, L. H., 37, 39, 54, 309Wang, M.-L., 133–34, 206, 309
334 AUTHOR INDEX
Wang, X., 95, 217, 227, 235, 270,300
Wantroba, M., 162, 273Ward, P., 154, 307Wassmuth, R., 117, 299Watkins, D. I., 95, 235–36, 241, 270,
275, 279Watt, S. M., 27, 105, 308Wattrang, E., 115, 278Watts, C., 82, 309Weaver, S. C., 226, 303, 309Weber, J., 163, 183, 239, 273, 295,
297, 309Weber, P. C., 162, 290Webster, R., 217, 292Webster, R. G., 28, 67, 87–88, 132,
135–36, 141, 147, 159, 206–8, 213,215–16, 276, 279, 286, 301, 303,309–11
Wedemayer, G. J., 37, 39, 54, 309Wedgwood-Oppenheim, B., 149–51,
153, 165–67, 171, 283Weidt, G., 83–84, 232, 309Weinhold, K. J., 164, 276Weiss, G., 253, 292Weiss, W., 136, 139, 271Welburn, S. C., 158, 284, 290Wellems, T. E., 24, 57, 64, 98, 277Wells, J. M., 67, 286Wertheimer, S. P., 64, 306Wessner, H., 37, 286Westaway, E. G., 181, 274Wettstein, P. J., 84, 309Wetz, K., 222, 309Wharton, S. A., 208, 210–13, 219,
222–24, 273, 280, 287, 291, 305Wheeler, C. J., 39, 275Whitmire, J. K., 127, 129, 304, 309Whittle, H., 163, 273Whittle, H. C., 29, 86–87, 121, 150,
281Whitworth, J., 158, 270Wichman, H. A., 189, 277Wiesmuller, K. H., 128, 274Wiley, D. C., 133–34, 206, 208–10,
213–14, 216–18, 227, 291, 300–1,304, 309–10
Wilkinson, I. D., 136, 275Willcox, N., 53, 113, 293Willems, R., 62, 310Williams, C., 178, 183–85, 296Williams, J. T., 158, 270Williams, N. S., 85, 290Williams, R., 13, 15, 64, 129, 293Williams, S. P., 218–19, 300Williamson, A. R., 80, 272Willingmann, P., 222, 309Willoughby, A., 119, 303Wilson, A. C., 35, 43, 176, 253, 272,
283Wilson, D. B., 37, 297Wilson, I. A., 128, 133, 136, 206,
208–9, 211, 213–14, 216, 227, 301,304, 310
Wilson, J. D. K., 80, 274Wilson, N., 95, 235, 270Winkler, C., 26, 114, 119, 303–4Winkler, K., 37, 287Wirth, D. F., 69, 170, 308Wodarz, D., 104, 133, 310Wohlfart, C., 222, 310Wolf, H., 164, 253, 293, 298Wolinsky, S., 163, 183, 256, 287, 300Wolinsky, S. M., 95, 235, 270Wolkers, M. C., 238, 241, 283Wong-Staal, F., 253, 293Woodland, D. L., 84, 276Woolhouse, M. E. J., 150, 190, 283,
289Worobey, M., 162, 310Wren, B. W., 61, 310Wright, P. F., 206, 310Wright, S., 149, 151, 166, 170, 310Wu, A. J., 39, 275Wu, J., 115, 310Wyvill, K., 115, 280
Xie, W., 129, 272Xu, J., 156, 310
Yamaguchi-Kabata, Y., 253–54, 311Yamazaki, Y., 160–61, 169, 289Yamnikova, S. S., 135, 216–17, 286,
292, 301

AUTHOR INDEX 335
Yang, Z. H., 246, 248–49, 253, 311Yarboro, C. H., 39, 275Yarchoan, R., 115, 280Yeo, K. H., 136, 275Yewdell, J. W., 44, 46–47, 49, 51–52,
79, 82–85, 112, 132, 213–15, 275,278, 302, 311
Yimen, M., 28, 95, 301Yokoyama, N., 162, 281York, I. A., 45–46, 311Yoshida, M., 239, 311Young, A. C., 237–38, 311Young, H., 119, 303Young, H. A., 119, 279Yu, H., 162, 286Yu, X.-F., 164, 298Yuan, C.-C., 119, 279Yusim, K., 256, 311Yutzy, W. H., 135, 300
Zajac, A. J., 80, 232–33, 235, 294,299
Závadszky, P., 162, 283Zeichhardt, H., 222, 309Zenowich, E., 88, 280Zerhouni, B., 28, 95, 301Zevering, Y., 88, 135, 281Zhang, J., 28, 95, 162, 301, 311Zhang, L. Q., 185–86, 284Zhang, Q.-Y., 68, 305Zhang, W., 237–38, 311Zhou, J., 68, 305, 311Zhou, N., 207, 217, 292, 301Zieg, J., 63, 304Zinkernagel, R. M., 29, 40, 78, 82,
86, 88, 125–26, 128–31, 135, 140,224, 232–35, 238, 240, 242, 244,274–75, 282, 287, 293, 296, 298,301, 311
Zipser, D., 64, 286Zolla-Pazner, S., 178, 183–85, 296,
312Zorgdrager, F., 163, 277Zuidema, D., 162, 283Zweerink, H. J., 80, 272

Subject Index
adeno-associated virus type 2, 196adenovirus, 222affinity, see binding kineticsaffinity maturation, 18, 38–39, 77–79
B cell competition, 39, 41, 75, 90equilibrium affinity for antigen,
39–41, 75–77, 89germinal centers, 75, 77, 78helper T cells, 75, 76, 92immunodominance, 75–79, 267on-rate of antigen binding, 41,
77–79, 89paratope, amino acid substitutions
in, 39, 89paratope, rigidity of, 39, 77somatic hypermutation, 18, 38, 54specificity for epitopes, 39
African sleeping sickness, see Try-panosoma brucei
age structure, see demographyAIDS, see HIValtered peptide ligand (APL)
in archival libraries, 30interference with CTL response,
29, 86–87in Plasmodium falciparum, 29, 86study by experimental evolution,
245amino acid
accessible to antibody, 36, 178,214
antibody binding, 36, 39, 189,211, 223
contribution to binding energy,36–37, 77, 211, 213, 216, 236
in epitopes, 15, 20, 35, 94, 214,223, 225
MHC binding, 47, 121, 232–37shape and charge, 33, 184, 197,
202, 233side chains, 77, 213, 233structural location, 186, 190–92,
195, 197, 199, 211–14, 237, 249
TCR binding, 50, 237–39amino acid substitutions
background genotype, 192, 193,195, 197, 203, 217, 227
and binding kinetics, 198, 223–24,228–29
fitness consequences, 106, 198,200–3, 216–19, 225, 228–29,239, 248, 256, 260
number between variants, 42, 55,76, 86, 106, 189, 194, 241, 266
preserving shape and charge, 184and proteasomal cleavage, 46, 231rapidly evolving sites, 186, 195,
215, 253, 257–60slowly evolving (conserved) sites,
192, 195, 250, 253See also positive selection
antibodies, 16–19as secreted BCR, 16constant region, Fc, 17, 89, 98versus CTLs, 92, 115, 117epitopes, size and structure, 35,
211IgA, IgE, IgG, IgM, see individual
entriesmucosal IgA, 130–32naive repertoire, 38, 40, 54, 74,
215, 227natural, 39–40paratopes, size and structure,
36–39, 77speed of response, 125, 127structure bound to epitope, 39,
54, 191, 211–13structure of, 17variable region, Fab, 17, 191, 212See also affinity maturation, B
cells, B cell receptor (BCR),immunological memory, neutral-ization kinetics
antigen, 15See also epitope

338 SUBJECT INDEX
antigen-presenting cell (APC), 20, 46,47, 79, 82
See also B cells, dendritic cells,macrophages
antigenicity, 176–78, 189, 206APC, see antigen-presenting cellarbovirus, 226archival library of variants, 61–65,
98–102, 107benefits of, 24, 27, 30Borrelia hermsii, 55, 57, 62, 66,
69, 98, 204, 262, 268diversification of, 69, 170, 262expression site, 62–63, 66gene conversion, 62–63, 66interference of immune response,
30invertible promoter, 63natural selection of switching
process, 68order of expression, 98–102, 107Plasmodium falciparum, 27, 64,
69, 170Plasmodium vivax, 65, 69recombination, 66, 262stochastic switching, 61–65, 98–
102switch matrix, 99, 101switch rate, 64, 68, 98, 99, 101,
204Trypanosoma brucei, 24, 63, 66,
69, 98–102, 262Trypanosoma vivax, 99, 100
attachment of pathogens, 196–200,216–17
affinity, 210, 228binding site on pathogen, 192,
196, 208, 210, 216, 254, 259epitope, attachment site as, 192,
200host receptors, 26, 114, 196, 208,
216hosts, role in changing, 183, 186,
216, 217kinetics, 197, 221, 228structural analysis, 197, 211trade-off between attachment and
release, 198, 213, 228two-step model, 197, 198variable tropism, 26–28, 62, 64,
65, 95, 105, 107, 194, 196, 199,226
See also fimbriae, neutralizationkinetics, pili
B cell receptor (BCR), 16antibody, relation to, 16germline polymorphism, 114somatic recombination, 16uptake of antigen, 74, 92See also affinity maturation, anti-
bodies, B cellsB cells, 16–19
antigen presentation by MHC classII, 74, 92
competition between clonal lin-eages, 18, 39, 41, 74, 89,267
interaction with helper T cells, 75,76, 91, 127, 128
memory, 89, 126, 127, 130, 140plasma, 126, 127, 130quantitative variation, 115
bacteriaattachment, 62, 64genetic mixing, mechanisms of, 67population structure, 156, 165surface polysaccharides, 15, 61See also fimbriae, pili
bacteriophage, 59, 64, 68basic reproductive number, R0, 144,
146BCR, see B cell receptorbinding kinetics
affinity and cross-reactivity, 40–42affinity and specificity, 40–42association constant, 220dissociation constant, 220equilibrium affinity, 220off-rate, 220on-rate, 220See also affinity maturation, neu-
tralization kineticsbirth rate of hosts, see demography

SUBJECT INDEX 339
Borrelia hermsiiarchival library, 62, 66, 69, 98,
262control by IgM, 55, 268switch mechanism, 62
Borrelia turicataesequestered in brain, 23, 27
Candida albicans, 156CD4+ T cells, see helper T cellsCD8+ T cells, see cytotoxic T
lymphocytescell culture, adaptation to
binding to heparan sulfate (HS),196–97
measles virus, 225stickiness to host tissues, 219trade-off causing low fitness in
vivo, 198cell-mediated immunity, see T cellsChagas’ disease, see Trypanosoma
cruziclassical swine fever virus, 197classification, 175–87
discrete typing unit (DTU), 154distance, 181, 207genetic data, 154, 178immunological data, 176–78immunological versus phyloge-
netic, 179–86, 189phylogenetic, 178–81sampling methods, 186
complement, 15, 250cross-reactivity, 33
IgM, 39, 55, 268immunological classification, 176–
78measurement, 35monoclonal versus polyclonal
antibodies, 43, 177and specificity, 33, 42, 43and stringency, 42, 43, 55TCR, 44–52
Cryptosporidium parvum, 156CTL, see cytotoxic T lymphocytescytokines
benefits and costs, 119
immune regulation, 83, 98, 115–17, 120
promoter polymorphisms, 115,119
cytomegalovirus, 196cytopathic versus noncytopathic
virusesand antigenic variation, 241–42control by antibody or CTL, 131,
146cytotoxic T lymphocytes, 19
activation, 81versus antibodies, 92, 115, 117,
225control of infection, 94, 131, 133,
146, 230–45dynamics of clonal expansion, 51,
79, 81, 83escape mutants, 94, 230–45helper T cell, stimulation by, 115,
117immunodominance, 79–87, 120,
133, 240–41memory cells, 129, 146monoclonal, 233, 236–38, 241repertoire shaped by negative
selection, 85repertoire, differences among
hosts, 52, 85, 112See also altered peptide ligand
(APL), original antigenic sin, Tcell receptor
demographyage-dependent memory profiles,
25, 136–40, 144–47birth rate and decay of memory,
141, 144–47, 265and mating patterns, 153
dendritic cells, 82dengue virus, 162, 181, 196dosage, 92, 233, 242DTU (discrete typing unit), see
classification
epidemiologyantigenic variation, effects on, 25,
340 SUBJECT INDEX
132–35, 137–39, 161, 206, 259,265
immune memory profiles, 25,132–35, 137–39, 141, 206, 255,259, 261, 265
phylogeny, effects on, 180, 183,251, 255, 257, 259, 261
population structure, 151–54, 157,158, 165, 169, 170
epitope, 15of antibody, 35–38conformational (discontinuous),
35, 178, 192, 254conserved, 23, 106, 185, 190,
194–96, 226, 265continuous, 190, 192, 195mapping, 192, 212, 214paratope, relation to, 36–38prediction for T cells, 46–48of T cell, 44–52trade-off between function and
escape, 200–2, 218–19, 239–40See also antigen
Epstein-Barr virus, 80, 85equilibrium affinity, 220equine encephalitis virus, 198escape mutants
antibody, 185, 192–96, 214–15,224–26
CTL, 230–45in experimental evolution, 192–96,
214–15, 224–26, 230–45fitness cost, 184, 200–2, 228, 244high- versus low-affinity MAbs,
215kinetics of escape, 240–43MHC, 232–37at multiple epitopes, 132–35, 215,
236, 241, 244, 266number of mutations to escape
recognition, 42, 55, 76, 86, 106,132–35, 189, 194, 215, 231, 236,241, 244, 268
peptide cleavage, 231–32reversion to wild type, 225TCR, 237–39
Escherichia colimutation rate, 59mutator strains, 59population structure, 157
exogenous antigens and T cells, 47,81–82
experimental evolution, 188–245CTL, mouse with transgenic, 232,
237, 238in vivo, 198, 201–2, 225, 235, 239population size, role of, 226, 242serial passage, 193, 194, 200, 202
fimbriae, 62, 63fitness
biochemical basis for changesin, 94–97, 198, 200–3, 218–24,231–40, 245
components of, 121, 144, 167,168, 198, 200, 202, 226, 228,239, 241, 244, 261
in vivo experimental analysis, 198,201, 228
kinetics as determinant of, 98–102, 107, 129–32, 145, 197, 198,213, 218–24, 241–42, 245
measures of, 24, 29, 201, 202,255–57
transmission, 24, 28, 29, 87, 101,106, 127, 136–47, 168, 243, 244,261
flavivirus classification, 181foot-and-mouth disease virus (FMDV),
188–204antigenic sites, 189–92cell culture, adaptation to, 196,
197competition between variants in
vivo, 201–2conserved epitopes, 190, 194–96,
199escape mutants, 192–96experimental evolution, 188–204GH loop, 190–93, 195, 202heparan sulfate (HS) host receptor,
196–99, 203

SUBJECT INDEX 341
host change, 200, 203integrin binding by RGD motif,
192, 196–200positive selection, 254predicting evolution, 260serotypes, 189–92structure, 189–92
generative mechanisms, 57–69expression site, variable, 63, 64,
66expression, on-off switch, 62gene conversion, 62–63, 66invertible promoters, 63–64mutation, 58–61nucleotide repeats, 60–61promoter hypermutation, 61–62recombination, intergenomic, 67,
263sex and genetic mixing, 67–68,
153–64glycosylation of antibody epitopes,
95, 106, 213gonorrhea, see Neisseria gonorrhoeae
Helicobacter pylorigastric cancer, 119polymorphisms in cytokine ex-
pression, consequences of, 119population structure, 156
helper T cells, 20, 46affinity maturation of antibodies,
74–79antibody stimulation, 54, 74–79,
90, 91, 113, 127, 130antibody versus CTL, 92, 115, 117epitopes, proximity to antibody
epitopes, 75, 92, 128immunodominance of antibodies,
74–79, 90, 91, 128memory cells, 127–29MHC class II binding, 20, 46, 48,
74, 236presentation of antigens to, 20,
46, 74, 76, 91, 236repertoire, differences among
hosts, 53, 112, 128TH1 versus TH2, 115, 117
heparan sulfate (HS), 196cell culture adaptation, role in,
197–98as generic component of sticki-
ness, 197–98, 203pathogen binding site, 196
hepatitis A virus (HAV), 189immune memory profile, 136
hepatitis B virus (HBV)altered peptide ligand antagonism,
29, 86antibody therapy as experimental
evolution, 225CTL immunodominance, 80epitope in chimeric peptide, 74,
76, 78escape mutants, 225host MHC genotype, persistence
and, 26immune memory profile, 136
hepatitis C virus (HCV)CTL immunodominance, 80envelope, hypervariable region, 92,
96escape mutants, 96immune memory profile, 136persistent infection, 96
HIValtered peptide ligand antagonism,
29, 86antibody epitopes, 40, 95CD4+ T cells, infection of, 28classification, immunological ver-
sus phylogenetic, 183–86convergent evolution, 184, 186CTL escape, 94–95, 106, 168, 235,
240cytokines, expression level, 119,
120env gene, 163, 256gag gene, 163geographic distribution, 163, 184gp120 envelope glycoprotein, 28,
40, 253

342 SUBJECT INDEX
host-cell receptors, 26, 28, 95,105, 114, 253
immunodominance of CTL epi-topes, 80
macrophages, infection of, 28,114, 119
persistent infection, 28, 94, 96,105
phylogeny, 183population structure, 163, 167–68positive selection, 94, 253–54pro gene, 167purifying selection within hosts,
167–68recombination, 163resistant hosts, 26, 114star phylogeny and epidemiology,
255, 256subtypes, 163, 183transmission versus persistence,
95, 106V3 loop, 184, 186See also simian immunodeficiency
virushost species
alternating, 226changing, 181, 186, 200, 203,
216–17host-cell receptors
attachment versus release, 198,203, 213, 217, 219, 228
binding site as epitope, 192, 212,215, 227, 266
density versus affinity, 197heparan sulfate (HS), 196–99integrins, 192, 196–200polymorphism, 26, 114two steps, attachment and entry,
197, 198See also attachment of pathogens
HTLV-1, see human T cell leukemiavirus
human rhinovirus, 189human T cell leukemia virus (HTLV-1)
competition for uninfected cells,104
CTL escape versus function, 239–40
immune memory profile, 136Tax protein, 239–40
humoral immunity, see antibodies
Ig, see immunoglobulinsIgA, 18
half-life, 130, 146maternal, 140on mucosa, 130–32, 140, 146protection against secondary
infection, 130–32, 140, 146IgE, 113IgG, 18, 39, 74–75
circulatory, 130, 131half-life, 130, 146maternal, 140protection against secondary
infection, 130, 131structural rigidity in binding, 39,
54IgM, 18, 38, 74–75
binding affinity, low, 39–40, 227cross-reactivity, high, 39–40role in defense, 39–40structural flexibility in binding,
39, 54immune interference by pathogens,
97apoptosis blocks, 239complement blocks, 250decoy antigens, 227
immune regulation, 92fitness consequences, 119mutation-selection balance, 116,
118, 120, 122quantitative genetic variability,
115, 122regulatory polymorphism, 115–23See also cytokines
immunodominance, 73–92of antibodies and B cells, 74–79,
89–92antigenic variation, importance
for, 132–35, 241, 244

SUBJECT INDEX 343
changes following escape muta-tion, 76
of CTLs, 129, 233, 240–41, 243–44cytokines, affected by, 120decoy antigens, 227dynamics of immune cell popula-
tions, 83, 90initial versus memory response,
129mathematical model, 83, 90–91,
227, 242of memory profiles, 80, 129,
132–35MHC binding, 232–37, 244MHC genotype, 235–37peptide cleavage, 231–32peptide transport by TAP, 231–32Rao’s model of B cell competition,
41, 75–79, 89, 90, 266TCR binding, 237–39timing of clonal expansion, 80–81See also memory profiles, immune
immunodomination, 82–85immunoglobulins
as antibodies, 16as B cell receptor, 16IgA, IgE, IgG, IgM, see individual
entriesstructure of, 17See also antibodies, B cell receptor
immunological distance, 176–78molecular distance, compared
with, 268monoclonal versus polyclonal
measures, 42–44, 177See also classification, cross-
reactivityinfluenza A virus
1918 pandemic, 138age structure of memory profiles,
136–39attachment to host, 181–83, 186,
208–12, 216–19, 221, 224in birds, 67, 147, 159, 181–83,
208, 216–17, 228in cell culture, 218, 219
in chicken eggs, 218classification, immunological ver-
sus phylogenetic, 181–83cross-reactivity of helper T cells,
128epidemiology, 138, 206escape mutants, 132, 214–15experimental evolution, 205–29hemagglutinin (HA), 207–9Hong Kong subtype, H3N2, 134,
208in horses, 208, 216, 219host switching, 159, 183, 208,
216–17immune memory profiles, 133–39,
142joint adaptation of HA and NA,
217neuraminidase (NA), 207, 208pandemics, 137–39, 208phylogeny, 181–83, 257–60positive selection, 257–60predicting evolution, 257–60reassortment of segments, 159,
161, 208release from host cells, 208, 213,
217, 219, 228sialic acid receptor, 208–13, 216–
17, 219, 227structure, 206–14subtypes, 136–39, 207, 208, 216in swine, 181–83, 208See also memory profiles, immune
influenza B virus, 206reassortment of segments, 160
influenza C virus, 206reassortment of segments, 160
inoculumgenetic diversity, 170, 201
integrin receptors, 196–200interferon-γ, 46, 120interleukins (IL)
IL1, 119, 122IL6, 115–17, 120IL10, 119, 122See also cytokines
344 SUBJECT INDEX
LCMV, see lymphocytic choriomenin-gitis virus (LCMV)
LeishmaniaTH1 versus TH2, 115
linkage disequilibriumantigenic, 149, 164–66, 168genome-wide, 68, 149, 151, 153–
64processes creating, 151–54, 167processes destroying, 67–68, 159–
64, 263spatial scale, 157–58, 169
Listeria monocytogenes, 40, 120lymph nodes, 82lymphocytic choriomeningitis virus
(LCMV)antibody response, 225CTL escape mutants, 83, 232–35,
238–39dosage and persistence, 233experimental evolution, 225, 232–
35, 238–39immunodominance, 83, 233original antigenic sin, 29, 244peptide-MHC binding, structure of,
232–35peptide-TCR binding, structure of,
238–39
macrophages, 15site of infection, 114, 119, 120,
122stimulation by cytokines, 116,
119, 120, 122, 129transport of antigen, 82
major histocompatibility complex,19, 47–48
aggregate binding against allparasites, 80, 121
anchor positions for bindingpeptides, 48, 233–37
class I, 19, 20, 44–49, 52, 80–83,85, 86, 97, 112, 121, 233, 235,236
class II, 20, 46, 48, 52, 53, 74, 92,112, 117–19, 127, 236
CTL stimulation, 19, 44, 51, 52,
81–83, 85, 86, 237–39, 243, 245See also MHC polymorphism
malaria, see Plasmodiummaternal antibodies, see immuno-
logical memorymathematical models, ideas for,
90–91, 102, 104, 121, 122, 131,143, 145, 169, 187, 227, 228,242
measles virusantigenic variation, 146, 225encephalitis, 225processes that limit variation,
146–47, 265–66memory, immunological, 19, 20,
125–29IgA versus IgG, 130, 146immunodominance of, 51, 79, 80,
129, 132–36, 142long-term maintenance, 122recurrent stimulation, 126speed of response, 89, 127–32storage of antigen, 126X-Y-Z model, 125See also original antigenic sin
memory profiles, immune, 136–44age structure, 25, 134, 136–39,
144, 147, 265barrier to antigenic change, 132,
146connectivity between host classes,
133, 142–43, 145, 265decay of memory, 102, 127–30,
138–41, 144–46epidemiology and population
coverage, 25, 102, 137, 144,146, 255, 261, 265
heterogeneity among hosts, 133,134, 146, 170, 249
immunodominance, role of, 102,132
and linkage disequilibrium ofparasites, 143
maternal antibodies, 139–40multistep mutation model for
epidemics, 132, 134, 142, 145,146

SUBJECT INDEX 345
newborns, influx of naive hosts,25, 136, 139, 141, 144, 147, 265
spatial structure, 141–45meningitis, see Neisseria meningitidisMHC polymorphism, 20, 47, 52, 54,
112as selective force on CTL epitopes,
168, 243MHC, see major histocompatibility
complexmixotope, 38monoclonal antibodies (MAbs)
neutralization kinetics, 220, 223panel to test cross-reactivity, 38,
177, 181, 184, 201, 214polyclonal antibodies, compared
with, 43, 177as selective pressure favoring
escape, 193, 195, 201, 214, 225,228, 244, 254, 260
monoclonal CTL pressure, 233,236–38, 243
Moraxella, 63mucosal immunity, IgA, 130–32,
140, 146multiplicity of infection
and CTL escape, 242genetic mixing in hosts, 153, 162,
168mumps virus, 130murine leukemia virus, 230–32mutation, 58–61
compensatory, 118deleterious, 59, 116, 118, 167, 248genome-wide rate, 58–60mutator strains, 59–60targeted hypermutation, 60–61, 68
mutation-selection balance, 116,118, 120, 122, 167, 248
natural killer cells (NK)interference by MHC homolog, 97quantitative variation, 115
natural selection, analysis ofat amino acid sites, 248–49,
251–63competition experiments, 201–2
nucleotide substitutions, patternsof, 248–49
phylogenetic, 179–87, 251–60sliding window, 250, 251spatial comparison of allele fre-
quencies, 263See also amino acid substitutions,
escape mutants, experimentalevolution
natural selection, kinds ofbalancing, 228, 263convergent, 184–86diversifying, 168, 185–87, 262episodic, 260–61fluctuating, 243frequency dependent, 249, 264heterozygote advantage, 117–18,
122negative, 94, 248–49, 251, 253–54,
262positive, 94, 96, 248–62stabilizing, 184–87
negative selection, see naturalselection, kinds of
Neisseria gonorrhoeaeantigenic variation, 27, 105cell tropism, 27, 105IgA antibodies, 130Opa proteins, 27population structure, 68, 156spread through host, 28
Neisseria meningitidisantigenic variation, 165cell tropism, 62linkage disequilibrium, 165, 168Opa proteins, 62population structure, 157, 165PorA protein, 165
Neurospora crassa, 59neutralization kinetics of antibodies,
220–24, 228antibodies per virion, 222, 223antibody affinity, 212, 213, 220,
223attachment, interference with,
211, 212, 220, 224bind but not neutralize, 184

346 SUBJECT INDEX
entry, interference with, 220, 224multi-hit kinetics, 222–24pseudo-first-order kinetics, 221–24single-hit kinetics, 221synergistic, 224See also antibodies
nucleotide substitutionsdN/dS ratio, 248–49nonsynonymous (dN), 248in phylogenies, 251–60synonymous (dS), 248
off-rate, 220on-rate, 220original antigenic sin
antibodies, 88antigens, order of exposure to, 28,
87–89, 135in archival libraries, 30CTLs, 244
paratope, see antibodiespeptides
binding to MHC class I, 19, 45–48,83, 85, 86, 232–37
binding to MHC class II, 20, 46,48, 74, 92
C- versus N-terminal cuts, 45, 232intracellular transport by TAP, 44,
46, 53, 113, 231–32kinetics of intracellular produc-
tion, 47nonrandom cleavage, 45proteasomal processing, 45–47,
53, 231T cell interaction, 19, 46, 49–52,
74, 81, 83, 85, 86, 92, 127,237–39
See also major histocompatibilitycomplex
persistent infection, 23–24, 26, 28,68, 94–97, 106, 133, 146, 198,233, 235, 261
phylogenetic distance, see classifica-tion
phylogeny, 178driven by antigenic selection, 183,
257–60recombination and reassortment,
159–62tree shape, 255–57
pili, 63Plasmodium berghei, 51Plasmodium falciparum
age-dependent immunity, 139antigenic variation, 27, 64, 69, 87,
121, 139, 263–64APL antagonism, 29, 86archival library, 64attachment, 27circumsporozoite protein, CTL
epitopes in, 29, 86, 121divergence from recent ancestor,
69, 170inbreeding, 158Msp1 surface antigen, 263PfEMP1, product of var , 27, 64population structure, 69, 87, 158,
170, 263–64var family of variants, 64, 69, 170
Plasmodium knowlesi, 65Plasmodium vivax
vir family of variants, 65, 69Plasmodium yoelii, 65poliovirus, 189, 200
antibody neutralization, 222protective immunity by IgG, 130recombination, 162
population structure, 148–71bottleneck, 168–70clonal, 156–58effective population size, 151epidemic, 133, 134, 151–58, 161,
165, 169geographic scale, 144, 153, 155,
157, 158, 160, 163, 166, 169,170, 184, 256
hosts as islands, 166–68, 170inbreeding, 158linkage disequilibrium, antigenic,
149, 168linkage disequilibrium, genome-
wide, 68, 149, 151panmictic, 156

SUBJECT INDEX 347
population size, 24, 97, 151, 204,226, 242
selective sweep, 67, 133, 151, 157,159, 183
spatial, 141–45, 151, 157, 158,160, 163, 169, 261, 263
positive selection, see natural selec-tion
predicting evolution, 255–61foot-and-mouth disease, 260influenza A, 257–60
programmed antigenic switching,see archival library of variants
proteasome, see peptides
reassortment of viral segments, 67,169, 208
hybrid incompatibility, 153inferred from phylogeny, 159–62
recombination, intergenomic, 67,149, 150, 153–66
inferred from phylogeny, 164in viruses, 162–64See also HIV, linkage disequilib-
rium, phylogenyrelapsing fever, see Borrelia hermsiiRNA viruses, 203
high mutation rate, 58, 96, 226segmented genome, 206, 208segments, reassortment of, 67,
159–62rotavirus, 130, 131
Saccharomyces cerevisiae, 59Salmonella enterica, 59, 156segmented genome, see RNA virusesseroprevalence, see memory profiles,
immunesimian immunodeficiency virus (SIV)
antibody escape and reducedtransmission, 95, 106
cell tropism, 94CTL escape mutants, 185, 235–37experimental studies, 235–37MHC genotype and rate of disease
progression, 236Tat protein, 235
Sindbis virus, 196, 198site-directed mutagenesis
binding consequences of substitu-tions, 35, 193, 210
function of conserved sites, 215,218, 244
SIV, see simian immunodeficiencyvirus
smallpox virus, 130spatial heterogeneity
caused by MHC variability, 168,243
memory profiles, 133, 134, 141–46, 170, 249
population structure, 151, 157,158, 163, 169, 170
within hosts, 105, 107specificity
aggregate binding against allparasites, 38, 80, 121
and cross-reactivity, 33–56stringency of binding conditions,
42, 55spirochetes, see Borrelia, 348strains, distinct antigenic, 87, 132,
142, 143, 149, 164–66Streptococcus, 250–51
hypermutation, 60positive selection, 250star phylogeny in epidemics, 255streptococcal inhibitor of comple-
ment (Sic), 250structural analysis
antibody epitopes, conformational,35, 192, 254
buried versus exposed sites, 233,234, 237, 238
FMDV, 189–92HIV, 254influenza A, 206–14, 237, 238LCMV, 233, 238MHC binding groove, 233See also site-directed mutagenesis
superinfection, see multiplicity ofinfection
T cell receptor, 19
348 SUBJECT INDEX
germline polymorphism, 53, 85,113–14, 245
peptide-MHC complex, binding to,19, 46, 49–52, 74, 81, 83, 85,86, 92, 127, 237–39
repertoire, 49–52, 85, 112, 238,245
self-peptides, avoiding, 51, 52, 79,85
somatic recombination, 53specificity and cross-reactivity,
49–51tetramer analysis, 177, 238See also cytotoxic T lymphocytes,
escape mutants, helper T cellsT cells
exogenous antigen, 47, 81–82quantitative variation, 115See also cytotoxic T lymphocytes,
helper T cells, T cell receptorTAP, see peptidesTCR, see T cell receptorTheileria annulata, 250transmission between hosts
escape variants, effect of, 95, 106immune memory variability, 127,
133, 134, 136–44, 146, 170, 249MHC variability, 168, 243
tropism, cell or tissueas cause of antigenic variation,
26–28, 62, 64, 65, 104–5, 107as constraint on antigenic varia-
tion, 194, 196–200Trypanosoma brucei
archival library, 63, 66, 262evolutionary rate, 66, 69, 262population structure, 158switch mechanism, 63, 66switch rate, 63, 99within-host dynamics, 24, 98–102
Trypanosoma cruzipopulation structure, 154–55strain classification, 154
Trypanosoma vivaxantigenic variants, order of ex-
pression, 99archival library, 99
TT virus, 162
vaccinesantigenic variation, 4, 165, 178,
183, 250booster, need for, 127, 140MHC polymorphism, 47recombination with wild type, 162
vaccinia virus, 196vesicular stomatitis virus (VSV)
cross-reaction by helper T cells,128
decay of memory helper T cells,128
experimental evolution, 226half-life of plasma B cells, 126survival of memory B cells, 126
Vibrio cholerae, 140viruses
cytopathic versus noncytopathic,130–32, 146, 241–42
persistent infection, 28, 94–97,104–6, 133, 146, 198, 233, 235,261
West Nile virus, 181within host dynamics
body compartments, separationby, 81, 105, 107, 200
cell tropism, evolving changes in,28, 94–95, 105, 184
coexistence of antigenic variants,102–6
escape mutants and persistence,93–108, 230–45
populations of immune cells,73–92
waves of parasitemia, 24, 99, 102,107
See also archival library of vari-ants, escape mutants
yellow fever virus, 130, 181