Digital image processing techniques for detecting, quantifying and classifying plant diseases
12
a SpringerOpen Journal Barbedo SpringerPlus 2013, 2:660 http://www.springerplus.com/content/2/1/660 REVIEW Open Access Digital image processing techniques for detecting, quantifying and classifying plant diseases Jayme Garcia Arnal Barbedo Abstract This paper presents a survey on methods that use digital image processing techniques to detect, quantify and classify plant diseases from digital images in the visible spectrum. Although disease symptoms can manifest in any part of the plant, only methods that explore visible symptoms in leaves and stems were considered. This was done for two main reasons: to limit the length of the paper and because methods dealing with roots, seeds and fruits have some peculiarities that would warrant a specific survey. The selected proposals are divided into three classes according to their objective: detection, severity quantification, and classification. Each of those classes, in turn, are subdivided according to the main technical solution used in the algorithm. This paper is expected to be useful to researchers working both on vegetable pathology and pattern recognition, providing a comprehensive and accessible overview of this important field of research. Introduction Agriculture has become much more than simply a means to feed ever growing populations. Plants have become an important source of energy, and are a fundamental piece in the puzzle to solve the problem of global warm- ing. There are several diseases that affect plants with the potential to cause devastating economical, social and eco- logical losses. In this context, diagnosing diseases in an accurate and timely way is of the utmost importance. There are several ways to detect plant pathologies. Some diseases do not have any visible symptoms associated, or those appear only when it is too late to act. In those cases, normally some kind of sophisticated analysis, usu- ally by means of powerful microscopes, is necessary. In other cases, the signs can only be detected in parts of the electromagnetic spectrum that are not visible to humans. A common approach in this case is the use of remote sensing techniques that explore multi and hyperspectral image captures. The methods that adopt this approach often employ digital image processing tools to achieve their goals. However, due to their many peculiarities and to the extent of the literature on the subject, they will not be treated in this paper. A large amount of information Correspondence: [email protected] Embrapa Agricultural Informatics, Campinas, SP, Brazil on the subject can be found in the papers by Bock et al. (2010), Mahlein et al. (2012) and Sankaran et al. (2010). Most diseases, however, generate some kind of manifes- tation in the visible spectrum. In the vast majority of the cases, the diagnosis, or at least a first guess about the dis- ease, is performed visually by humans. Trained raters may be efficient in recognizing and quantifying diseases, how- ever they have associated some disadvantages that may harm the efforts in many cases. Bock et al. (2010) list some of those disadvantages: • Raters may tire and lose concentration, thus decreasing their accuracy. • There can be substantial inter- and intra-rater variability (subjectivity). • There is a need to develop standard area diagrams to aide assessment. • Training may need to be repeated to maintain quality. Raters are expensive. • Visual rating can be destructive if samples are collected in the field for assessment later in the laboratory. • Raters are prone to various illusions (for example, lesion number/size and area infected). © 2013 Barbedo; licensee Springer. This is an Open Access article distributed under the terms of the Creative Commons Attribution License (http://creativecommons.org/licenses/by/2.0), which permits unrestricted use, distribution, and reproduction in any medium, provided the original work is properly cited.
Transcript of Digital image processing techniques for detecting, quantifying and classifying plant diseases
a SpringerOpen Journal
Barbedo SpringerPlus 2013, 2:660http://www.springerplus.com/content/2/1/660
REVIEW Open Access
Digital image processing techniques fordetecting, quantifying and classifying plantdiseasesJayme Garcia Arnal Barbedo
Abstract
This paper presents a survey on methods that use digital image processing techniques to detect, quantify and classifyplant diseases from digital images in the visible spectrum. Although disease symptoms can manifest in any part of theplant, only methods that explore visible symptoms in leaves and stems were considered. This was done for two mainreasons: to limit the length of the paper and because methods dealing with roots, seeds and fruits have somepeculiarities that would warrant a specific survey. The selected proposals are divided into three classes according totheir objective: detection, severity quantification, and classification. Each of those classes, in turn, are subdividedaccording to the main technical solution used in the algorithm. This paper is expected to be useful to researchersworking both on vegetable pathology and pattern recognition, providing a comprehensive and accessible overviewof this important field of research.
IntroductionAgriculture has become much more than simply a meansto feed ever growing populations. Plants have becomean important source of energy, and are a fundamentalpiece in the puzzle to solve the problem of global warm-ing. There are several diseases that affect plants with thepotential to cause devastating economical, social and eco-logical losses. In this context, diagnosing diseases in anaccurate and timely way is of the utmost importance.
There are several ways to detect plant pathologies. Somediseases do not have any visible symptoms associated,or those appear only when it is too late to act. In thosecases, normally some kind of sophisticated analysis, usu-ally by means of powerful microscopes, is necessary. Inother cases, the signs can only be detected in parts of theelectromagnetic spectrum that are not visible to humans.A common approach in this case is the use of remotesensing techniques that explore multi and hyperspectralimage captures. The methods that adopt this approachoften employ digital image processing tools to achievetheir goals. However, due to their many peculiarities andto the extent of the literature on the subject, they will notbe treated in this paper. A large amount of information
Correspondence: [email protected] Agricultural Informatics, Campinas, SP, Brazil
on the subject can be found in the papers by Bock et al.(2010), Mahlein et al. (2012) and Sankaran et al. (2010).
Most diseases, however, generate some kind of manifes-tation in the visible spectrum. In the vast majority of thecases, the diagnosis, or at least a first guess about the dis-ease, is performed visually by humans. Trained raters maybe efficient in recognizing and quantifying diseases, how-ever they have associated some disadvantages that mayharm the efforts in many cases. Bock et al. (2010) list someof those disadvantages:
• Raters may tire and lose concentration, thusdecreasing their accuracy.
• There can be substantial inter- and intra-ratervariability (subjectivity).
• There is a need to develop standard area diagrams toaide assessment.
• Training may need to be repeated to maintainquality. Raters are expensive.
• Visual rating can be destructive if samples arecollected in the field for assessment later in thelaboratory.
• Raters are prone to various illusions (for example,lesion number/size and area infected).
© 2013 Barbedo; licensee Springer. This is an Open Access article distributed under the terms of the Creative CommonsAttribution License (http://creativecommons.org/licenses/by/2.0), which permits unrestricted use, distribution, and reproductionin any medium, provided the original work is properly cited.

Barbedo SpringerPlus 2013, 2:660 Page 2 of 12http://www.springerplus.com/content/2/1/660
Besides those disadvantages, it is important to considerthat some crops may extend for extremely large areas,making monitoring a challenging task.
Depending on the application, many of those problemsmay be solved, or at least reduced, by the use of digi-tal images combined with some kind of image processingand, in some cases, pattern recognition and automaticclassification tools. Many systems have been proposed inthe last three decades, and this paper tries to organizeand present those in a meaningful and useful way, as willbe seen in the next section. Some critical remarks aboutthe directions taken by the researches on this subject arepresented in the concluding section.
Literature reviewVegetable pathologies may manifest in different partsof the plant. There are methods exploring visual cuespresent in almost all of those parts, like roots (Smithand Dickson 1991), kernels (Ahmad et al. 1999), fruits(Aleixos et al. 2002; Corkidi et al. 2005; López-García et al.2010), stems and leaves. As commented before, this workconcentrates in the latter two, particularly leaves.
This section is divided into three subsections accord-ing to the main purpose of the proposed methods. Thesubsections, in turn, are divided according to the maintechnical solution employed in the algorithm. A sum-marizing table containing information about the culturesconsidered and technical solutions adopted by each workis presented in the concluding section.
Some characteristics are shared by most methods pre-sented in this section: the images are captured usingconsumer-level cameras in a controlled laboratory envi-ronment, and the format used for the images is RGBquantized with 8 bits. Therefore, unless stated otherwise,those are the conditions under which the described meth-ods operate. Also, virtually all methods cited in this paperapply some kind of preprocessing to clean up the images,thus this information will be omitted from now on, unlesssome peculiarity warrants more detailing.
DetectionBecause the information gathered by applying image pro-cessing techniques often allows not only detecting thedisease, but also estimating its severity, there are not manymethods focused only in the detection problem. There aretwo main situations in which simple detection applies:
• Partial classification: when a disease has to beidentified amidst several possible pathologies, it maybe convenient to perform a partial classification, inwhich candidate regions are classified as being theresult of the disease of interest or not, instead ofapplying a complete classification into any of thepossible diseases. This is the case of the method by
Abdullah et al. (2007), which is described inSection ‘Neural networks’.
• Real-time monitoring: in this case, the systemcontinuously monitor the crops, and issues an alarmas soon as the disease of interest is detected in any ofthe plants. The papers by Sena Jr et al. (2003) andStory et al. (2010) fit into this context. Both proposalsare also described in the following.
Neural networksThe method proposed by Abdullah et al. (2007) triesto discriminate a given disease (corynespora) from otherpathologies that affect rubber tree leaves. The algorithmdoes not employ any kind of segmentation. Instead, Prin-cipal Component Analysis is applied directly to the RGBvalues of the pixels of a low resolution (15 × 15 pixels)image of the leaves. The first two principal componentsare then fed to a Multilayer Perceptron (MLP) NeuralNetwork with one hidden layer, whose output reveals ifthe sample is infected by the disease of interest or not.
ThresholdingThe method proposed by Sena Jr et al. (2003) aimsto discriminate between maize plants affected by fallarmyworm from healthy ones using digital images. Theydivided their algorithm into two main stages: image pro-cessing and image analysis. In the image processing stage,the image is transformed to a grey scale, thresholded andfiltered to remove spurious artifacts. In the image anal-ysis stage, the whole image is divided into 12 blocks.Blocks whose leaf area is less than 5% of the total areaare discarded. For each remaining block, the number ofconnected objects, representing the diseased regions, iscounted. The plant is considered diseased if this number isabove a threshold, which, after empirical evaluation, wasset to ten.
Dual-segmented regression analysisStory et al. (2010) proposed a method for monitoring andearly detection of calcium deficiency in lettuce. The firststep of the algorithm is the plant segmentation by thresh-olding, so the canopy region is isolated. The outlines of theregion of interest are applied back to the original image,in such a way only the area of interest is considered. Fromthat, a number of color features (RGB and HSL) and tex-ture features (from the gray-level co-occurrence matrix)are extracted. After that, the separation point identify-ing the onset of stress due to the calcium deficiency iscalculated by identifying the mean difference betweenthe treatment and control containers at each measuredtime for all features. Dual-segmented regression analy-sis is performed to identify where in time a change pointwas present between the nutrient-deficit group of plantsand the healthy group of plants. The authors concluded
Barbedo SpringerPlus 2013, 2:660 Page 3 of 12http://www.springerplus.com/content/2/1/660
arguing that their system can be used to monitor plantsin greenhouses during the night, but more research isneeded for its use during the day, when lighting conditionsvary more intensely.
QuantificationThe methods presented in this section aim to quantify theseverity of a given disease. Such a severity may be inferredeither by the area of the leaves that are affected by thedisease, or by how deeply rooted is the affection, whichcan be estimated by means of color and texture features.Most quantification algorithms include a segmentationstep to isolate the symptoms, from which features can beextracted and properly processed in order to provide anestimate for the severity of the disease.
It is worth noting that the problem of determining theseverity of a disease by analyzing and measuring its symp-toms is difficult even if performed manually by one ormore specialists, which have to pair the diagnosis guide-lines with the symptoms as accurately as possible. Asa result, the manual measurements will always containsome degree of subjectivity, which in turn means that ref-erences used to validate the automatic methods are notexactly “ground truth”. It is important to take this intoconsideration when assessing the performance of thosemethods.
The methods presented in the following are groupedaccording to the main strategies they employ to estimatethe severity of the diseases.
ThresholdingOne of the first methods to use digital image processingwas proposed by Lindow and Webb (1983). The imageswere captured using an analog video camera, under a redlight illumination to highlight the necrotic areas. Thoseimages were later digitized and stored in a computer. Thetests were performed using leaves from tomatoes, brackenfern, sycamore and California buckeye. The identificationof the necrotic regions is done by a simple thresholding.The algorithm then apply a correction factor to compen-sate for pixel variations in the healthy parts of the leaves,so at least some of the pixels from healthy regions thatwere misclassified as part of the diseased areas can bereassigned to the correct set.
Price et al. (1993) compared visual and digital image-processing methods in quantifying the severity of coffeeleaf rust. They tested two different imaging systems. In thefirst one, the images were captured by a black and whitecharge coupled device (CCD) camera, and in the secondone, the images were captured with a color CCD cam-era. In both cases, the segmentation was performed by asimple thresholding. According to the authors, the imageprocessing-based systems had better performance thanvisual evaluations, especially for cases with more severe
symptoms. They also observed that the color imaging hadgreater potential in discriminating between rusted andnon-rusted foliage.
The method proposed by Tucker and Chakraborty(1997) aims to quantify and identify diseases in sunflowerand oat leaves. The first step of the algorithm is a seg-mentation whose threshold varies according to the diseasebeing considered (blight or rust). The resulting pixels areconnected into clusters representing the diseased regions.Depending on the characteristics of the lesions, they areclassified into the appropriate category (type a or b in caseof blight and by size in case of rust). The authors reportedgood results, but observed some errors due to inappropri-ate illumination during the capture of the images.
Martin and Rybicki (1998) proposed a method to quan-tify the symptoms caused by the maize streak virus. Thethresholding scheme adopted by the authors was based onthe strategy described by Lindow and Webb (1983) andbriefly explained in the previous paragraph. The authorscompared the results obtained by visual assessment, byusing a commercial software package and by employinga custom system implemented by themselves. They con-cluded that the commercial and custom software packageshad approximately the same performance, and that bothcomputer-based methods achieved better accuracy andprecision than the visual approach.
The method proposed by Skaloudova et al. (2006) mea-sures the damage caused in leaves by spider mites. Thealgorithm is based on a two-stage thresholding. The firststage discriminates the leaf from the background, and thesecond stage separates damaged regions from healthy sur-face. The final estimate is given by the ratio between thenumber of pixels in damage regions divided by the totalnumber of pixels of the leaf. The authors compared theresults with two other methods based on the leaf dam-age index and chlorophyll fluorescence. They concludedthat their method and the leaf damage index providedsuperior results when compared with the chlorophyllfluorescence.
In their work, Weizheng et al. (2008) presented a strat-egy to quantify lesions in soybean leaves. The algorithm isbasically composed by a two-step thresholding. The firstthreshold aims to separate leaf from background. Afterthat, the image containing only the leaf is converted to theHSI color space, and the Sobel operator is applied to iden-tify the lesion edges. A second threshold is applied to theresulting Sobel gradient image. Finally, small objects in thebinary image are discarded and holes enclosed by whitepixels are filled. The resulting objects reveal the diseasedregions.
Camargo and Smith (2009a) proposed a method toidentify regions of leaves containing lesions caused bydiseases. The tests were performed using leaves from avariety of plants, like bananas, maize, alfalfa, cotton and

Barbedo SpringerPlus 2013, 2:660 Page 4 of 12http://www.springerplus.com/content/2/1/660
soybean. Their algorithm is based on two main opera-tions. First, a color transformation to the HSV and I1I2I3spaces is performed, from which only H and two modi-fied versions of I3 are used in the subsequent steps. Afterthat, a thresholding based on the histogram of intensitiestechnique (Prewitt 1970) is applied in order to separatehealthy and diseased regions. According to the authors,their approach was able to properly discriminate betweendiseased and healthy areas for a wide variety of conditionsand species of plants.
The method proposed by Macedo-Cruz et al. (2011)aimed to quantify the damage caused by frost in oat crops.The images used by the authors were captured directlyin the crop fields. The first step of the algorithm is theconversion from RGB to the L*a*b* representation. Theauthors employed three different thresholding strategies:Otsu’s method, Isodata algorithm, and fuzzy thresholding.Each strategy generates a threshold value for each colorchannel, which are combined by a simple average so asingle threshold value is assigned to each channel. If nec-essary, the resulting partitions may be thresholded again,and so on, until some stopping criteria are met. The finalresulting partitions give rise to a number of classes that,after properly labeled, reveal the extent of the damagesuffered by the crops.
Lloret et al. (2011) proposed a system to monitor thehealth of vineyards. The images were captured by meansof webcams scattered throughout the field. The mainobjective was to detected and quantify diseased leaves.Their system has five stages: 1) leaf size estimation, whichis necessary due to the variation of the distance betweenthe cameras and the plants; 2) thresholding, which sep-arates diseased leaves and ground from healthy leavesusing both the RGB and HSV color representations ofthe image; 3) a set of morphological operations, aim-ing to reduce noise without eliminating useful features;4) a detection step, which aims to discriminate betweenground and actual diseased leaves; 5) calculation of theratio of diseased leaves. Depending on the value of thisratio, the system emits a warning that the plant requiressome attention.
Patil and Bodhe (2011) proposed a method for assessingthe severity of fungi-related disease in sugar cane leaves.The method performs two segmentations. The first oneaims to separate the leaves from the rest of the scene,and is performed by means of a simple thresholding. Inthe second segmentation, the image is converted from theRGB to the HSI color space, and a binarization is appliedin order to separate the diseased regions. The thresholdfor the binarization is calculated by the so-called trian-gle thresholding method, which is based on the gray-scalehistogram of the image. The binary image is finally usedto determine the ratio of the infection with respect to theentire leaf.
Color analysisBoese et al. (2008) proposed a method to estimate theseverity of eelgrass leaf injury, which can be caused bydesiccation, wasting disease, and micro herbivory feeding.The first step of the algorithm is the unsupervised seg-mentation of the leaves into a number of classes (six toten). In the following, an expert labels the classes into oneof five possibilities (the three types of injuries, plus healthytissue and background). After that, the quantification isjust a matter of measuring the areas occupied by each ofthe injuries. According to the authors, their approach stillhave a number of problems that limit its utility, but it is animprovement over other approaches to quantify complexleaf injuries from multiple stressors.
The method proposed by Pagola et al. (2009) deals withthe problem of quantifying nitrogen deficiency in bar-ley leaves. They use some color channel manipulations inthe RGB space and apply Principal Component Analysis(PCA) to obtain a measure for the “greenness” of the pix-els. In order to aggregate the results of all pixels into asingle estimate, the authors tested four strategies, whosemain goal was to emphasize relevant regions and reducethe influence of the regions that are not photosintheticallyactive, like veins and leaf spots. The authors concludedthat their method had high correlation with the largelyadopted approach based on non-destructive hand-heldchlorophyll meters.
Contreras-Medina et al. (2012) proposed a system toquantify five different types of symptoms in plant leaves.Their system is actually composed of five independentmodules: 1) chlorosis algorithm, which combines the redand green components of the image in order to determinethe yellowness of the leaf, which indicates the severity ofthe chlorosis; 2) necrosis algorithm, which uses the bluecomponent to discriminate leaves from background, andthe green component to identify and quantify the necroticregions; 3) leaf deformation algorithm, which uses theblue component to segment the leaf and calculates thesphericity of the leaf as a measure for its deformation;4) white spots algorithm, which applies a thresholding tothe blue component of the image to estimate the areaoccupied by those spots; 5) mosaic algorithm, which usesthe blue channel, a number of morphological operationsand the Canny edge detector to identify and quantify thevenations present in the leaf.
Fuzzy logicIn their paper, Sannakki et al. (2011) presented a methodto quantify disease symptoms based on Fuzzy logic. Thetests were performed using pomegranate leaves. The algo-rithm begins converting the images to the L*a*b* colorspace. The pixels are grouped into a number of classesthrough K-means clustering. According to the authors,one of the groups will correspond to the diseased areas,
Barbedo SpringerPlus 2013, 2:660 Page 5 of 12http://www.springerplus.com/content/2/1/660
however the paper does not provide any informationon how the correct group is identified. In the follow-ing, the program calculates the percentage of the leafthat is infected. Finally, a Fuzzy Inference System isemployed for the final estimation of the disease rating.The details on how such a system is applied are alsoabsent.
Sekulska-Nalewajko and Goclawski (2011) method aimsto detect and quantify disease symptoms in pumpkin andcucumber leaves. The images used in the tests were cap-tured using a flatbed scanner. The leaves were detachedfrom the plants, treated and stained prior to the imag-ing. The authors used functions present in the Matlabtoolboxes to implement their ideas. The first step ofthe algorithm is the isolation of the leaf by threshold-ing. In the following, the image is transformed fromRGB to HSV color space. The brightness component(V) is discarded. Then, a Fuzzy c-means algorithm isapplied in order to group the pixels into two mainclusters, representing healthy and diseased regions. Theauthors argued that their approach is a better solu-tion than using third-party packages which, according tothem, require too many operations to achieve the desiredresults.
Zhou et al. (2011) proposed a method to evaluate thedegree of hopper infestation in rice crops. The presenceof rice plant-hoppers manifests more intensely in thestem, so that was the part of the plant focused by theauthors. In the algorithm, after the regions of interest areextracted, fractal-dimension value features are extractedusing the box-counting dimension method. These featuresare used to derive a regression model. Finally, a fuzzy C-means algorithm is used to classify the regions into oneof four classes: no infestation, mild infestation, moderateinfestation and severe infestation.
Knowledge-based systemThe aim of the work by Boissard et al. (2008) was a lit-tle different from the others presented in this paper, astheir method tries to quantify the number of whitefliesin rose leaves as part of an early pest detection sys-tem. The method employs two knowledge-based systems(KBS) to estimate the number of insects. The first sys-tem, the so-called classification KBS, takes the numericalresults from some image processing operations, and inter-prets them into higher level concepts which, in turn, areexplored to assist the algorithm to choose and retain onlythe regions containing insects. The second system, the so-called supervision KBS, selects the image processing toolsto be applied, as well as the parameters to be used, in orderto collect and feed the most meaningful information to thefirst system. According to the authors, their proposal hadsome problems, but it was a good addition to the effortstowards the automation of greenhouse operations.
Region growingPang et al. (2011) proposed a method to segment lesionscaused by six types of diseases that affect maize crops. Thealgorithm begins by identifying all pixels for which thelevel of the red channel (R) is higher than the level of thegreen channel (G). According to the authors, those pix-els are part of a diseased region in 98% of the cases. Theconnected regions are then identified and labeled. Thesecond part of the algorithm tries to identify the pixels forwhich R < G that are actually part of the lesions. To dothat, the algorithm takes the connected regions as seedsand applies a region growing technique to more accuratelydefine the diseased regions. The termination condition forthe growing procedure is given by the threshold valuesobtained by applying Otsu’s method to each connectedregion.
Third party image processing packagesOlmstead et al. (2001) compared two different methods(one visual and one computational) for quantifying pow-dery mildew infection in sweet cherry leaves. The imageswere captured using a flatbed scanner. The image analy-sis, which is basically the application of thresholding, wasperformed using the SigmaScan Pro (v. 4.0) software pack-age. In order to generate a standard for comparison of thetwo methods, the fungi colonies were manually paintedwhite and submitted to the image analysis, providing thereference values. According to the authors, the visualassessment provided far superior estimates in comparisonwith the computational one.
The method proposed by Berner and Paxson (2003)aimed at quantifying the symptoms in infected yellowstarthistle. The images were captured using a flatbed scan-ner, and the images were analyzed by the SigmaScanPro (v.5.0) software package. The operations applied tothe image are simple: brightness and contrast adjust-ments, transformation to gray scale, and applicationof color overlays. Those overlays emphasize both dis-eased regions (pustules) and dark areas along venations,so a shape-based selection is carried out in order tokeep only the diseased regions. Finally, the pustules arecounted.
Moya et al. (2005) compared the results obtained byvisual and image processing-based assessment of squashleaves infected with powdery mildew. They used a com-mercial software package, the ArcView GIS 3.2, to seg-ment the leaf images into either five or ten classes. Theassigned classes were then manually compared to the orig-inal images, and the regions corresponding to diseasewere properly labeled and measured. Finally, the severityof the disease was given by the number of selected pix-els divided by the total number of pixels in the leaf. Theauthors compared these results to those obtained entirelymanually. They also compared the results according to

Barbedo SpringerPlus 2013, 2:660 Page 6 of 12http://www.springerplus.com/content/2/1/660
the type of device used for capturing the images (digitalcamera or scanner).
In their proposals, Bock et al. (2008, 2009) aimed atquantifying the severity of the Foliar Citrus Canker inGrapefruit leaves. To perform the image analysis, theauthors employed a package called Assess V1.0: ImageAnalysis Software for plant disease quantification (Lamari2002). In their approach, the images are first convertedto the HSI format, and then thresholded to separate thediseased parts from the rest of the scene. The valueof the threshold was initially tuned manually by visu-ally comparing the resulting segmentation with the actualimage. After the ideal segmentation is achieved, esti-mating the severity is just a matter of calculating thehealthy and diseased areas and finding their ratio. Theauthors later tried to automate the thresholding process,achieving some mixed results due to tone and lightingvariations that prevent fixed thresholds to be valid in allcases.
Goodwin and Hsiang (2010) and Wijekoon et al. (2008)used a freely available software called Scion Image toquantify fungal infection in leaves of lilies-of-the-valley,apple trees, phlox and golden rod. The images were cap-tured both in laboratory and in situ, using flatbed scannersfor detached leaves and consumer level digital cameras forattached leaves. The use of the Scion software was almostentirely based upon the method proposed by Murakami(2005), in which the color of a targeted area is manuallyadjusted in order to maximize the discrimination betweenhealthy and diseased surfaces. The symptoms of severalfungal diseases were tested, like powdery mildew, rust,anthracnose and scab.
The Assess software (v. 2.0) was used by Coninck et al.(2012) to determine the severity of Cercospora leaf spot(CLS) disease in sugar beet breeding. Their approach wasrelated to that used by Bock et al. (2009), with the imagesbeing converted to the HSI representation and with aproperly threshold being determined by means of practi-cal experiments. The main purpose of the authors was notto develop a novel method for disease symptom quantifi-cation, but to compare the accuracy of three very differentways of estimating the disease severity: visual assessment,real-time Polymerase Chain Reaction (PCR) and imageprocessing. The authors concluded stating that the use ofboth image analysis and real-time PCR had the potentialto increase accuracy and sensitivity of assessments of CLSin sugar beet, while reducing bias in the evaluations.
The software package ImageJ was used by Peressottiet al. (2011) to quantify grapevine downy mildew sporu-lation. The authors wrote a macro for ImageJ, whichproperly adjusts color balance and contrast prior to pre-senting the image to the user. After that, the user cantest several different values of threshold to segment theimage, until a satisfactory result is achieved. The authors
reported good correlation between the results obtained bytheir method and by visual assessment.
ClassificationThe classification methods can be seen as extensions ofthe detection methods, but instead of trying to detectonly one specific disease amidst different conditions andsymptoms, these ones try to identify and label whicheverpathology that is affecting the plant. As in the caseof quantification, classification methods almost alwaysinclude a segmentation step, which is normally followedby the extraction of a number of features that will feedsome kind of classifier. The methods presented in the fol-lowing are grouped according to the kind of classificationstrategy employed.
Neural networksA very early attempt to monitor plant health was carriedout by Hetzroni et al. (1994). Their system tried to identifyiron, zinc and nitrogen deficiencies by monitoring lettuceleaves. The capture of the images was done by an ana-log video camera, and only afterwards the images wouldbe digitized. The first step of the proposed algorithm isthe segmentation of the images into leaf and background.In the following a number of size and color features areextracted from both the RGB and HSI representationsof the image. Those parameters are finally fed to neu-ral networks and statistical classifiers, which are used todetermine the plant condition.
Pydipati et al. (2005) compared two differentapproaches to detect and classify three types of citrusdiseases. The authors collected 39 texture features, andcreated four different subsets of those features to beused in two different classification approaches. The firstapproach was based on a Mahalanobis minimum distanceclassifier, using the nearest neighbor principle. The sec-ond approach used radial basis functions (RBF) neuralnetwork classifiers trained with the backpropagationalgorithm. According to the authors, both classificationapproaches performed equally well when using the best ofthe four subsets, which contained ten hue and saturationtexture features.
Huang (2007) proposed a method to detect andclassify three different types of diseases that affectPhalaenopsis orchid seedlings. The segmentation proce-dure adopted by the author is significantly more sophisti-cated than those found in other papers, and is composedby four steps: removal of the plant vessel using a Bayesclassifier, equalization of the image using an exponen-tial transform, a rough estimation for the location ofthe diseased region, and equalization of the sub-imagecentered at that rough location. A number of color andtexture features are then extracted from the gray levelco-occurrence matrix (Haralick et al. 1973). Finally, those
Barbedo SpringerPlus 2013, 2:660 Page 7 of 12http://www.springerplus.com/content/2/1/660
features are submitted to an MLP artificial neural net-work with one hidden layer, which performs the finalclassification.
Sanyal et al. (2007) tackled the problem of detectingand classifying six types of mineral deficiencies in ricecrops. First, the algorithm extracts a number of textureand color features. Each kind of feature (texture and color)is submitted to its own specific MLP neural network. Bothnetworks have one hidden layer, but the number of neu-rons in the hidden layer is different (40 for texture and 70for color). The results returned by both networks are thencombined, yielding the final classification. A very similarapproach is used by the same authors in another paper(Sanyal and Patel 2008), but in this case the objective is toidentify two kinds of diseases (blast and brown spots) thataffect rice crops.
The method proposed by Al Bashish et al. (2010) triesto identify five different plant diseases. The authors didnot specify the species of plants used in the tests, andthe images were captured in situ. After a preprocessingstage to clean up the image, a K-means clustering algo-rithm is applied in order to divide the image into fourclusters. According to the authors, at least one of theclusters must correspond to one of the diseases. Afterthat, for each cluster a number of color and texturefeatures are extracted by means of the so-called ColorCo-Occurrence Method, which operates with images inthe HSI format. Those features are fed to a MLP NeuralNetwork with ten hidden layers, which performs the finalclassification.
Kai et al. (2011) proposed a method to identify threetypes of diseases in maize leaves. First, the images areconverted to the YCbCr color representation. Apparently,some rules are applied during the thresholding in orderto properly segment the diseased regions. However, dueto a lack of clarity, it is not possible to infer exactly howthis is done. The authors then extract a number of texturefeatures from the gray level co-occurrence matrix. Finally,the features are submitted to an MLP neural network withone hidden layer.
Wang et al. (2012) proposed a method to discriminatebetween pairs of diseases in wheat and grapevines. Theimages are segmented by a K-means algorithm, and then50 color, shape and texture features are extracted. For thepurpose of classification, the authors tested four differentkinds of neural networks: Multilayer Perceptron, RadialBasis Function, Generalized Regression, and Probabilistic.The authors reported good results for all kinds of neuralnetworks.
Suport vector machinesMeunkaewjinda et al. (2008) proposed a method to iden-tify and classify diseases that affect grapevines. Themethod uses several color representations (HSI, L*a*b*,
UVL and YCbCr) throughout its execution. The separa-tion between leaves and background is performed by anMLP neural network, which is coupled with a color librarybuilt a priori by means of an unsupervised self organiz-ing map (SOM). The colors present on the leaves arethen clustered by means of an unsupervised and untrainedself-organizing map. A genetic algorithm determines thenumber of clusters to be adopted in each case. Diseasedand healthy regions are then separated by a SupportVector Machine (SVM). After some additional manipula-tions, the segmented image is submitted to a multiclassSVM, which performs the classification into either scab,rust, or no disease.
Youwen et al. (2008) proposed a method to identify twodiseases that can manifest in cucumber leaves. The seg-mentation into healthy and diseased regions is achievedusing a statistic pattern recognition approach. In thefollowing, some color, shape and texture features areextracted. Those features feed an SVM, which performsthe final classification. The authors stated that the resultsprovided by the SVM are far better than those achievedusing neural networks.
The system proposed by Yao et al. (2009) aimed to iden-tify and classify three types of diseases that affect ricecrops. The algorithm first applies a particular color trans-formation to the original RGB image, resulting in twochannels (y1 and y2). Then, the image is segmented byOtsu’s method, after which the diseased regions are iso-lated. Color, shape and texture features are extracted, thelatter one from the HSV color space. Finally, the fea-tures are submitted to a Support Vector Machine, whichperforms the final classification.
The method proposed by Camargo and Smith (2009b)tries to identify three different kinds of diseases thataffect cotton plants. The authors used images not onlyof leaves, but also of fruits and stems. The segmenta-tion of the image is performed using a technique devel-oped by the authors (Camargo and Smith 2009a), whichwas described earlier in this paper (Section ‘Thresh-olding’). After that, a number of features is extractedfrom the diseased regions. Those features are thenused to feed an SVM. The one-against-one method(Hsu and Lin 2002) was used to allow the SVMto deal with multiple classes. The authors concludedthat the texture features have the best discriminationpotential.
Jian and Wei (2010) proposed a method to recog-nize three kinds of cucumber leaf diseases. As in mostapproaches, the separation between healthy and diseasedregions is made by a simple thresholding procedure. In thefollowing, a variety of color, shape and texture features areextracted. Those features are submitted to an SVM withRadial Basis Function (RBF) as kernel, which performs thefinal classification.
Barbedo SpringerPlus 2013, 2:660 Page 8 of 12http://www.springerplus.com/content/2/1/660
Fuzzy classifierThe method proposed by Hairuddin et al. (2011) tries toidentify four different nutritional deficiencies in oil palmplants. The image is segmented according to color simi-larities, but the authors did not provide any detail on howthis is done. After the segmentation, a number of colorand texture features are extracted and submitted to a fuzzyclassifier which, instead of outputting the deficienciesthemselves, reveals the amounts of fertilizers that shouldbe used to correct those deficiencies. Unfortunately, thetechnical details provided in this paper are superficial,making it difficult to reach a clear understanding aboutthe approach adopted by the authors.
Xu et al. (2011) proposed a method to detect nitrogenand potassium deficiencies in tomato plants. The algo-rithm begins extracting a number of features from thecolor image. The color features are all based on the b*component of the L*a*b* color space. The texture featuresare extracted using three different methods: differenceoperators, Fourier transform and Wavelet packet decom-position. The selection and combination of the featureswas carried out by means of a genetic algorithm. Finally,the optimized combination of features is used as theinput of a fuzzy K-nearest neighbor classifier, which isresponsible for the final identification.
Feature-based rulesIn their two papers, Kurniawati et al. (2009a,2009b) pro-posed a method to identify and label three differentkinds of diseases that affect paddy crops. As in manyother methods, the segmentation of healthy and dis-eased regions is performed by means of thresholding. Theauthors tested two kinds of thresholding, Otsu’s and localentropy, with the best results being achieved by the latterone. Afterwards, a number of shape and color features areextracted. Those features are the basis for a set of rulesthat determine the disease that best fits the characteristicsof the selected region.
Zhang (2010) proposed a method for identifying andclassifying lesions in citrus leaves. The method is mostlybased on two sets of features. The first set was selectedhaving as main goal to separate lesions from the rest of thescene, which is achieved by setting thresholds to each fea-ture and applying a weighted voting scheme. The secondset aims to provide as much information as possible aboutthe lesions, so a discrimination between diseases becomespossible. The final classification is, again, achieved bymeans of feature thresholds and a weighted voting system.A more detailed version of (Zhang 2010) can be found in(Zhang and Meng 2011).
Color analysisThe method proposed by Wiwart et al. (2009) aims todetect and discriminate among four types of mineral
deficiencies (nitrogen, phosphorus, potassium and mag-nesium). The tests were performed using faba bean, peaand yellow lupine leaves. Prior to the color analysis, theimages are converted to the HSI and L*a*b* color spaces.The presence or absence of the deficiencies is then deter-mined by the color differences between healthy leaves andthe leaves under test. Those differences are quantified byEuclidean distances calculated in both color spaces.
Pugoy and Mariano (2011) proposed a system to iden-tify two different types of diseases that attack rice leaves.The algorithm first converts the image from RGB to HSIcolor space. The K-means technique is applied to clusterthe pixels into a number of groups. Those groups are thencompared to a library that relates colors to the respectivediseases. This comparison results in values that indicatethe likelihood of each region being affected by each of thediseases.
Self organizing mapsThe method proposed by Phadikar and Sil (2008) detectsand differentiates two diseases that affect rice crops, blastand brown spots. First, the image is converted to the HSIcolor space. Then, a entropy-based thresholding is usedto segment the image. An edge detector is applied to thesegmented image, and the intensity of the green compo-nents is used to detect the spots. Each region containingeach detected spot is then resized by interpolation, so allregions have a size of 80 × 100 pixels. The pixel values(gray scale) are finally fed to a self organizing map (SOM),which performs the final classification.
Discriminant analysisPydipati et al. (2006) method aims to detect and clas-sify three different types of citrus diseases. The methodrelies heavily on the color co-occurrence method (CCM),which, in turn, was developed through the use of spa-tial gray-level dependence matrices (SGDM’s) (Shearerand Holmes 1990). The resulting CCM matrices, whichare generated from the HSI color representation of theimages, are used to extract 39 texture features. The num-ber of features was then reduced by means of a redun-dancy reduction procedure. The authors observed that theelimination of intensity features improved the results, ashue and saturation features are more robust to ambientlight variations than the former ones. The final classifica-tion was performed using discriminant analysis.
Membership functionAnthonys and Wickramarachchi (2009) proposed amethod to discriminate among three different diseasesthat attack paddy plants. The image is segmented by athresholding procedure – the grayscale version of theimage used in such a procedure is obtained after assign-ing different weights to each component of its RGB

Barbedo SpringerPlus 2013, 2:660 Page 9 of 12http://www.springerplus.com/content/2/1/660
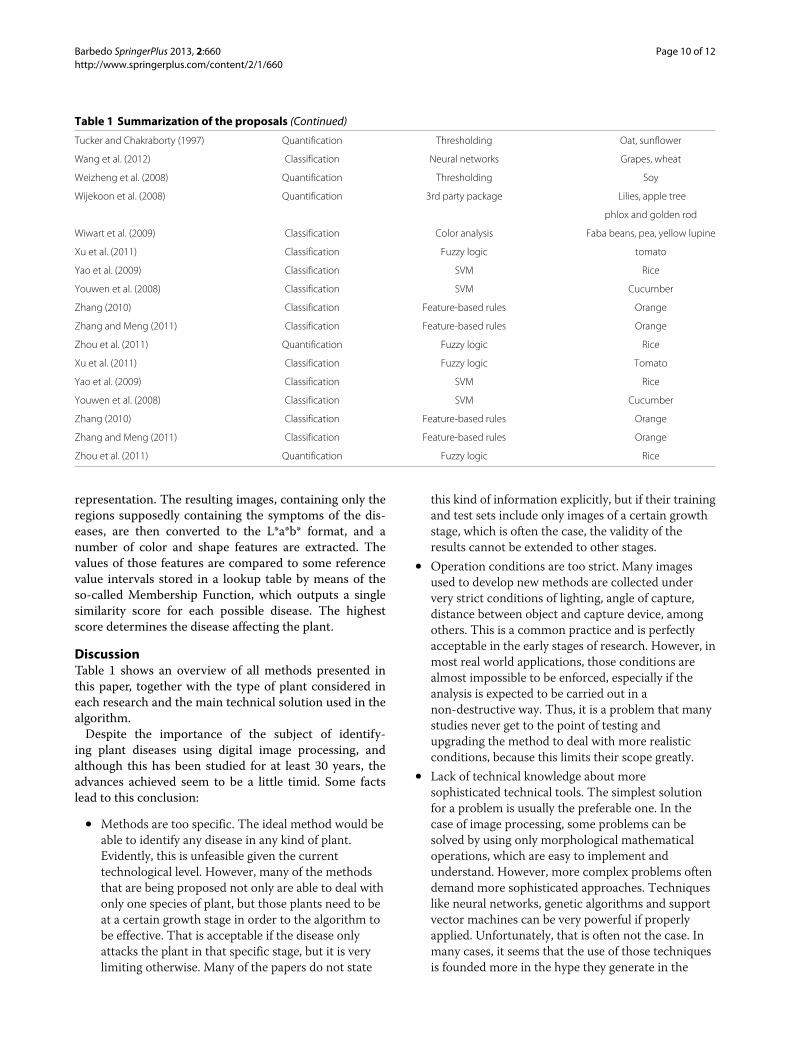
Table 1 Summarization of the proposals
Proposal Type Main tool Culture
Abdullah et al. (2007) Detection Neural networks Rubber tree
Al Bashish et al. (2010) Classification Neural networks N/A
Anthonys and Wickramarachchi (2009) Classification Membership function Rice
Berner and Paxson (2003) Quantification 3rd party package Yellow starthistle
Bock et al. (2008) Quantification 3rd party package Grapefruit
Bock et al. (2009) Quantification 3rd party package Grapefruit
Boese et al. (2008) Quantification Color analysis Eelgrass
Boissard et al. (2008) Quantification Knowledge-based Roses
Camargo and Smith (2009a) Quantification Thresholding Banana, maize, soy, alfalfa, cotton
Camargo and Smith (2009b) Classification SVM Cotton
Coninck et al. (2012) Quantification 3rd party package Sugar beet
Contreras-Medina et al. (2012) Quantification Color analysis Pumpkin, pepper, bean
Goodwin and Hsiang (2010) Quantification 3rd party package Lilies, apple tree
phlox and golden rod
Hairuddin et al. (2011) Classification Fuzzy logic Oil palm
Hetzroni et al. (1994) Classification Neural networks Lettuce
Huang (2007) Classification Neural networks Orchid
Jian and Wei (2010) Classification SVM Cucumber
Kai et al. (2011) Classification Neural networks Maize
Kurniawati et al. (2009a) Classification Feature-based rules Rice
Kurniawati et al. (2009b) Classification Feature-based rules Rice
Lindow and Webb (1983) Quantification Thresholding Sycamore, fern, tomato, buckeye
Lloret et al. (2011) Quantification Thresholding Grapes
Macedo-Cruz et al. (2011) Quantification Thresholding Oat
Martin and Rybicki (1998) Quantification Thresholding Maize
Meunkaewjinda et al. (2008) Classification SVM Grapes
Moya et al. (2005) Quantification 3rd party package Squash
Olmstead et al. (2001) Quantification 3rd party package Cherry
Pagola et al. (2009) Quantification Color analysis Barley
Pang et al. (2011) Quantification Region growing Maize
Patil and Bodhe (2011) Quantification Thresholding Sugar cane
Peressotti et al. (2011) Quantification 3rd party package Grapes
Phadikar and Sil (2008) Classification Self organizing maps Rice
Price et al. (1993) Quantification Thresholding Coffee
Pugoy and Mariano (2011) Classification Color analysis Rice
Pydipati et al. (2005) Classification Neural networks Orange
Pydipati et al. (2006) Classification Self organizing maps Orange
Sannakki et al. (2011) Quantification Fuzzy logic Pomegranate
Sanyal et al. (2007) Classification Neural networks Rice
Sanyal and Patel (2008) Classification Neural networks Rice
Sekulska-Nalewajko and Goclawski (2011) Quantification Fuzzy logic Pumpkin, cucumber
Sena Jr et al. (2003) Detection Thresholding Maize
Skaloudova et al. (2006) Quantification Thresholding Bean
Story et al. (2010) Detection Dual-segmented regression analysis Lettuce
Barbedo SpringerPlus 2013, 2:660 Page 10 of 12http://www.springerplus.com/content/2/1/660
Table 1 Summarization of the proposals (Continued)
Tucker and Chakraborty (1997) Quantification Thresholding Oat, sunflower
Wang et al. (2012) Classification Neural networks Grapes, wheat
Weizheng et al. (2008) Quantification Thresholding Soy
Wijekoon et al. (2008) Quantification 3rd party package Lilies, apple tree
phlox and golden rod
Wiwart et al. (2009) Classification Color analysis Faba beans, pea, yellow lupine
Xu et al. (2011) Classification Fuzzy logic tomato
Yao et al. (2009) Classification SVM Rice
Youwen et al. (2008) Classification SVM Cucumber
Zhang (2010) Classification Feature-based rules Orange
Zhang and Meng (2011) Classification Feature-based rules Orange
Zhou et al. (2011) Quantification Fuzzy logic Rice
Xu et al. (2011) Classification Fuzzy logic Tomato
Yao et al. (2009) Classification SVM Rice
Youwen et al. (2008) Classification SVM Cucumber
Zhang (2010) Classification Feature-based rules Orange
Zhang and Meng (2011) Classification Feature-based rules Orange
Zhou et al. (2011) Quantification Fuzzy logic Rice
representation. The resulting images, containing only theregions supposedly containing the symptoms of the dis-eases, are then converted to the L*a*b* format, and anumber of color and shape features are extracted. Thevalues of those features are compared to some referencevalue intervals stored in a lookup table by means of theso-called Membership Function, which outputs a singlesimilarity score for each possible disease. The highestscore determines the disease affecting the plant.
DiscussionTable 1 shows an overview of all methods presented inthis paper, together with the type of plant considered ineach research and the main technical solution used in thealgorithm.
Despite the importance of the subject of identify-ing plant diseases using digital image processing, andalthough this has been studied for at least 30 years, theadvances achieved seem to be a little timid. Some factslead to this conclusion:
• Methods are too specific. The ideal method would beable to identify any disease in any kind of plant.Evidently, this is unfeasible given the currenttechnological level. However, many of the methodsthat are being proposed not only are able to deal withonly one species of plant, but those plants need to beat a certain growth stage in order to the algorithm tobe effective. That is acceptable if the disease onlyattacks the plant in that specific stage, but it is verylimiting otherwise. Many of the papers do not state
this kind of information explicitly, but if their trainingand test sets include only images of a certain growthstage, which is often the case, the validity of theresults cannot be extended to other stages.
• Operation conditions are too strict. Many imagesused to develop new methods are collected undervery strict conditions of lighting, angle of capture,distance between object and capture device, amongothers. This is a common practice and is perfectlyacceptable in the early stages of research. However, inmost real world applications, those conditions arealmost impossible to be enforced, especially if theanalysis is expected to be carried out in anon-destructive way. Thus, it is a problem that manystudies never get to the point of testing andupgrading the method to deal with more realisticconditions, because this limits their scope greatly.
• Lack of technical knowledge about moresophisticated technical tools. The simplest solutionfor a problem is usually the preferable one. In thecase of image processing, some problems can besolved by using only morphological mathematicaloperations, which are easy to implement andunderstand. However, more complex problems oftendemand more sophisticated approaches. Techniqueslike neural networks, genetic algorithms and supportvector machines can be very powerful if properlyapplied. Unfortunately, that is often not the case. Inmany cases, it seems that the use of those techniquesis founded more in the hype they generate in the

Barbedo SpringerPlus 2013, 2:660 Page 11 of 12http://www.springerplus.com/content/2/1/660
scientific community than in their technicalappropriateness with respect to the problem at hand.As a result, problems like overfitting, overtraining,undersized sample sets, sample sets with lowrepresentativeness, bias, among others, seem to be awidespread plague. Those problems, although easilyidentifiable by a knowledgeable individual on thetopic, seem to go widely overlooked by the authors,probably due to the lack of knowledge about the toolsthey are employing. The result is a whole group oftechnically flawed solutions.
Evidently, there are some high quality manuscripts inwhich the authors rigorously take into account most fac-tors that could harm the validity of their results, butunfortunately those still seem to be the exception, notthe rule. As a result, the technology evolves slower thanit could. The underlying conclusion is that the authorsshould spend a little more time learning about the toolsthey intend to use. A better understand about the con-cepts behind those tools can potentially lead to more solidresults and to less time wasted, improving the overallquality of the literature of the area.
ConclusionThe wide-ranging variety of applications on the subjectof counting objects in digital images makes it difficultfor someone to prospect all possible useful ideas presentin the literature, which can cause potential solutions forproblematic issues to be missed. In this context, thispaper tried to present a comprehensive survey on thesubject, aiming at being a starting point for those con-ducting research on the issue. Due to the large number ofreferences, the descriptions are short, providing a quickoverview of the ideas underlying each of the solutions. Itis important to highlight that the work on the subject isnot limited to what was shown here. Many papers on thesubject could not be included in order to keep the paperlength under control – the papers were selected as toconsider the largest number of different problems as pos-sible. Thus, if the reader wishes to attain a more completeunderstanding on a given application or problem, he/shecan refer to the bibliographies of the respective articles.
Competing interestsThe author declares that he has no competing interests.
Received: 14 June 2013 Accepted: 26 September 2013Published: 7 December 2013
References
Abdullah NE, Rahim AA, Hashim H, Kamal MM (2007) Classification of rubbertree leaf diseases using multilayer perceptron neural network. In: 2007 5thstudent conference on research and development. IEEE, Selangor, pp 1–6
Ahmad IS, Reid JF, Paulsen MR, Sinclair JB (1999) Color classifier for symptomaticsoybean seeds using image processing. Plant Dis 83(4):320–327
Al Bashish D, Braik M, Bani-Ahmad S (2010) A framework for detection andclassification of plant leaf and stem diseases. In: 2010 internationalconference on signal and image processing. IEEE, Chennai, pp 113–118
Aleixos N, Blasco J, Navarron F, Molto E (2002) Multispectral inspection of citrusin real-time using machine vision and digital signal processors. ComputElectron Agric 33(2):121–137
Anthonys G, Wickramarachchi N (2009) An image recognition system for cropdisease identification of paddy fields in Sri Lanka. In: 2009 InternationalConference on Industrial and Information Systems (ICIIS). IEEE, Sri Lanka,pp 403–407
Berner DK, Paxson LK (2003) Use of digital images to differentiate reactions ofcollections of yellow starthistle (Centaurea solstitialis) to infection byPuccinia jaceae. Biol Control 28(2):171–179
Bock CH, Parker PE, Cook AZ, Gottwald TR (2008) Visual rating and the use ofimage analysis for assessing different symptoms of citrus canker ongrapefruit leaves. Plant Dis 92(4):530–541
Bock CH, Cook AZ, Parker PE, Gottwald TR (2009) Automated image analysis ofthe severity of foliar citrus canker symptoms. Plant Dis 93(6):660–665
Bock CH, Poole GH, Parker PE, Gottwald TR (2010) Plant disease severityestimated visually, by digital photography and image analysis, and byhyperspectral imaging. Critical Rev Plant Sci 29(2):59–107
Boese BL, Clinton PJ, Dennis D, Golden RC, Kim B (2008) Digital image analysisof Zostera marina leaf injury. Aquat Bot 88:87–90
Boissard P, Martin V, Moisan S (2008) A cognitive vision approach to early pestdetection in greenhouse crops. Comput Electron Agric 62(2):81–93
Camargo A, Smith JS (2009a) An image-processing based algorithm toautomatically identify plant disease visual symptoms. Biosyst Eng102:9–21
Camargo, A, Smith JS (2009b) Image pattern classification for the identificationof disease causing agents in plants. Comput Electron Agric 66(2):121–125
Coninck BMA, Amand O, Delauré SL, Lucas S, Hias N, Weyens G, Mathys J,De Bruyne E, Cammue BPA (2012) The use of digital image analysis andreal-time PCR fine-tunes bioassays for quantification of Cercospora leafspot disease in sugar beet breeding. Plant Pathol 61:76–84
Contreras-Medina LM, Osornio-Rios RA, Torres-Pacheco I, Romero-Troncoso RJ,Guevara-González RG, Millan-Almaraz JR (2012) Smart sensor for real-timequantification of common symptoms present in unhealthy plants. Sensors(Basel, Switzerland) 12:784–805
Corkidi G, Balderas-Ruíz KA, Taboada B, Serrano-Carreón L, Galindo E (2005)Assessing mango anthracnose using a new three-dimensionalimage-analysis technique to quantify lesions on fruit. Plant Pathol55(2):250–257
Goodwin PH, Hsiang T (2010) Quantification of fungal infection of leaves withdigital images and Scion Image software. Methods Mol Biol 638:125–135
Hairuddin MA, Tahir NM, Baki SRS (2011) Overview of image processingapproach for nutrient deficiencies detection in Elaeis Guineensis. In: 2011IEEE international conference on system engineering and technology. IEEE,Shah Alam, pp 116–120
Haralick RM, Shanmugam K, Dinstein I (1973) Textural features for imageclassification. IEEE Trans Syst Man Cybern SMC-3 3:610–621
Hetzroni A, Miles GE, Engel BA, Hammer PA, Latin RX (1994) Machine visionmonitoring of plant health. Adv Space Res 14(11):203–212
Hsu CW, Lin CJ (2002) A comparison of methods for multi-class support vectormachines. IEEE Trans Neural Netw 13:415–425
Huang KY (2007) Application of artificial neural network for detectingPhalaenopsis seedling diseases using color and texture features. ComputElectron Agric 57:3–11
Jian Z, Wei Z (2010) Support vector machine for recognition of cucumber leafdiseases. In: 2010 2nd international conference on advanced computercontrol. IEEE, Shenyang, pp 264–266
Kai S, Zhikun L, Hang S, Chunhong G (2011) A research of maize disease imagerecognition of corn based on BP networks. In: 2011 third internationalconference on measuring technology and mechatronics automation. IEEE,Shangshai, pp 246–249
Kurniawati NN, Abdullah SNHS, Abdullah S, Abdullah S (2009a) Investigationon image processing techniques for diagnosing paddy diseases. In: 2009international conference of soft computing and pattern recognition. IEEE,Malacca, pp 272–277
Kurniawati NN, Abdullah SNHS, Abdullah S, Abdullah S (2009b) Textureanalysis for diagnosing paddy disease. In: 2009 International conference onelectrical engineering and informatics. IEEE, Selangor, pp 23–27

Barbedo SpringerPlus 2013, 2:660 Page 12 of 12http://www.springerplus.com/content/2/1/660
Lamari L (2002) Assess: image analysis software for plant diseasequantification. APS Press, St. Paul
Lindow SE, Webb RR (1983) Quantification of foliar plant disease symptoms bymicrocomputer-digitized video image analysis. Phytopathology73(4):520–524
Lloret J, Bosch I, Sendra S, Serrano A (2011) A wireless sensor network forvineyard monitoring that uses image processing. Sensors 11(6):6165–6196
López-García F, Andreu-García G, Blasco J, Aleixos N, Valiente JM (2010)Automatic detection of skin defects in citrus fruits using a multivariateimage analysis approach. Comput Electron Agric 71(2):189–197
Macedo-Cruz A, Pajares G, Santos M, Villegas-Romero I (2011) Digital imagesensor-based assessment of the status of oat (Avena sativa L.) crops afterfrost damage. Sensors 11(6):6015–6036
Mahlein AK, Oerke EC, Steiner U, Dehne HW (2012) Recent advances in sensingplant diseases for precision crop protection. Eur J Plant Pathol 133:197–209
Martin DP, Rybicki EP (1998) Microcomputer-based quantification of maizestreak virus symptoms in zea mays. Phytopathology 88(5):422–427
Meunkaewjinda A, Kumsawat P, Attakitmongcol K, Srikaew A (2008) Grape leafdisease detection from color imagery using hybrid intelligent system. In:2008 5th international conference on electrical engineering/electronics,computer, telecommunications and information technology. IEEE, Krabi,pp 513–516
Moya EA, Barrales LR, Apablaza GE (2005) Assessment of the disease severity ofsquash powdery mildew through visual analysis, digital image analysis andvalidation of these methodologies. Crop Protect 24(9):785–789
Murakami PF (2005) An instructional guide for leaf color analysis using digitalimaging software. General technical report NE, Newtown Square: U.S.Dept. of Agriculture, Forest Service, Northeastern Research Station
Olmstead JW, Lang GA, Grove GG (2001) Assessment of severity of powderymildew infection of sweet cherry leaves by digital image analysis.Hortscience 36:107–111
Pagola M, Ortiz R, Irigoyen I, Bustince H, Barrenechea E, Aparicio-Tejo P, LamsfusC, Lasa B (2009) New method to assess barley nitrogen nutrition statusbased on image colour analysis. Comput Electron Agric 65(2):213–218
Pang J, Bai Zy, Lai Jc, Li Sk (2011) Automatic segmentation of crop leaf spotdisease images by integrating local threshold and seeded region growing.In: 2011 international conference on image analysis and signal processing.IEEE, Hubei, pp 590–594
Patil SB, Bodhe SK (2011) Leaf disease severity measyrement using imageprocessing. Int J Eng Technol 3(5):297–301
Peressotti E, Duchêne E, Merdinoglu D, Mestre P (2011) A semi-automaticnon-destructive method to quantify grapevine downy mildew sporulation.J Microbiol Methods 84(2):265–271
Phadikar S, Sil J (2008) Rice disease identification using pattern recognitiontechniques. IEEE, Khulna, pp 420–423
Prewitt J (1970) Object enhancement and extraction. In: Picture processingand psychopictorics. Academic Press, Orlando
Price TV, Gross R, Wey JH, Osborne CF (1993) A comparison of visual and digitalimage-processing methods in quantifying the severity of coffee leaf rust(Hemileia vastatrix). Aust J Exp Agric 33:97–101
Pugoy RADL, Mariano VY (2011) Automated rice leaf disease detection usingcolor image analysis. In: 3rd international conference on digital imageprocessing, volume 8009. SPIE, Chengdu, pp F1–F7
Pydipati R, Burks TF, Lee WS (2005) Statistical and neural network classifiers forcitrus disease detection using machine vision. Trans ASAE 48(5):2007–2014
Pydipati, R, Burks TF, Lee WS (2006) Identification of citrus disease using colortexture features and discriminant analysis. Comput Electron Agric52(1–2):49–59
Sankaran S, Mishra A, Ehsani R, Davis C (2010) A review of advancedtechniques for detecting plant diseases. Comput Electron Agric 72:1–13
Sannakki SS, Rajpurohit VS, Nargund VB, Kumar A (2011) Leaf disease gradingby machine vision and fuzzy logic. Int J 2(5):1709–1716
Sanyal P, Patel SC (2008) Pattern recognition method to detect two diseases inrice plants. Imaging Sci J 56(6):7
Sanyal P, Bhattacharya U, Parui SK, Bandyopadhyay SK, Patel S (2007) Colortexture analysis of rice leaves diagnosing deficiency in the balance ofmineral levels towards improvement of crop productivity. In: 10thInternational Conference on Information Technology (ICIT 2007). IEEE,Orissa, pp 85–90
Sekulska-Nalewajko J, Goclawski J (2011) A semi-automatic method for thediscrimination of diseased regions in detached leaf images using fuzzy
c-means clustering. In: VII international conference on perspectivetechnologies and methods in MEMS design. IEEE, Polyana-Svalyava,pp 172–175
Sena DG Jr, Pinto FAC, Queiroz DM, Viana PA (2003) Fall armyworm damagedmaize plant identification using digital images. Biosyst Eng 85(4):449–454
Shearer SA, Holmes RG (1990) Plant identification using color co-occurrencematrices. Trans ASAE 33(6):2037–2044
Skaloudova B, Krvan V, Zemek R (2006) Computer-assisted estimation of leafdamage caused by spider mites. Comput Electron Agric 53(2):81–91
Smith SE, Dickson S (1991) Quantification of active vesicular-arbuscularmycorrhizal infection using image analysis and other techniques. Aust JPlant Physiol 18(6):637–648
Story D, Kacira M, Kubota C, Akoglu A, An L (2010) Lettuce calcium deficiencydetection with machine vision computed plant features in controlledenvironments. Comput Electron Agric 74(2):238–243
Tucker CC, Chakraborty S (1997) Quantitative assessment of lesioncharacteristics and disease severity using digital image processing.J Phytopathol 145(7):273–278
Wang H, Li G, Ma Z, Li X (2012) Application of neural networks to imagerecognition of plant diseases. In: Proceedings of the 2012 InternationalConference on Systems and Informatics (ICSAI). IEEE, Yantai, pp 2159–2164
Weizheng S, Yachun W, Zhanliang C, Hongda W (2008) Grading method of leafspot disease based on image processing. In: 2008 international conferenceon computer science and software engineering. IEEE, Wuhan, pp 491–494
Wijekoon CP, Goodwin PH, Hsiang T (2008) Quantifying fungal infection ofplant leaves by digital image analysis using scion image software.J Microbiol Methods 74(2–3):94–101
Wiwart M, Fordonski G, Zuk-Golaszewska K, Suchowilska E (2009) Earlydiagnostics of macronutrient deficiencies in three legume species by colorimage analysis. Comput Electron Agric 65:125–132
Xu G, Zhang F, Shah SG, Ye Y, Mao H (2011) Use of leaf color images to identifynitrogen and potassium deficient tomatoes. Pattern Recognit Lett32(11):1584–1590
Yao Q, Guan Z, Zhou Y, Tang J, Hu Y, Yang B (2009) Application of supportvector machine for detecting rice diseases using shape and color texturefeatures. In: 2009 international conference on engineering computation.IEEE, Hong Kong, pp 79–83
Youwen T, Tianlai L, Yan N (2008) The recognition of cucumber disease basedon image processing and support vector machine. In: 2008 congress onimage and signal processing. IEEE, Sanya, pp 262–267
Zhang M (2010) Citrus canker detection based on leaf images analysis. In: The2nd international conference on information science and engineering.IEEE, Hangzhou, pp 3584–3587
Zhang M, Meng Q (2011) Automatic citrus canker detection from leaf imagescaptured in field. Pattern Recognit Lett 32(15):2036–2046
Zhou Z, Zang Y, Li Y, Zhang Y, Wang P, Luo X (2011) Rice plant-hopperinfestation detection and classification algorithms based on fractaldimension values and fuzzy C-means. Math Comput Model 58:701–709
doi:10.1186/2193-1801-2-660Cite this article as: Barbedo: Digital image processing techniques for detecting,quantifying and classifying plant diseases. SpringerPlus 2013 2:660.
Submit your manuscript to a journal and benefi t from:
7 Convenient online submission
7 Rigorous peer review
7 Immediate publication on acceptance
7 Open access: articles freely available online
7 High visibility within the fi eld
7 Retaining the copyright to your article
Submit your next manuscript at 7 springeropen.com