Detecting and Quantifying p53 Isoforms at mRNA Level in Cell Lines and Tissues
240
-
Upload
independent -
Category
Documents
-
view
0 -
download
0
Transcript of Detecting and Quantifying p53 Isoforms at mRNA Level in Cell Lines and Tissues


M E T H O D S I N M O L E C U L A R B I O L O G Y ™
Series EditorJohn M. Walker
School of Life SciencesUniversity of Hertfordshire
Hat fi eld, Hertfordshire, AL10 9AB, UK
For further volumes:http://www.springer.com/series/7651


p53 Protocols
Second Edition
Edited by
Sumitra Deb
Department of Biochemistry, Massey Cancer Center Department of Microbiology and Immunology
Virginia Commonwealth University, Richmond, VA, USA
Swati Palit Deb
Department of Biochemistry, Massey Cancer Center Department of Microbiology and Immunology
Virginia Commonwealth University, Richmond, VA, USA
EditorsSumitra Deb Department of Biochemistry Massey Cancer CenterDepartment of Microbiology and ImmunologyVirginia Commonwealth UniversityRichmond, VA, USA
Swati Palit DebDepartment of Biochemistry Massey Cancer CenterDepartment of Microbiology and ImmunologyVirginia Commonwealth UniversityRichmond, VA, USA
ISSN 1064-3745 ISSN 1940-6029 (electronic)ISBN 978-1-62703-235-3 ISBN 978-1-62703-236-0 (eBook)DOI 10.1007/978-1-62703-236-0Springer New York Heidelberg Dordrecht London
Library of Congress Control Number: 2012951134
© Springer Science+Business Media New York 2013This work is subject to copyright. All rights are reserved by the Publisher, whether the whole or part of the material is concerned, speci fi cally the rights of translation, reprinting, reuse of illustrations, recitation, broadcasting, reproduction on micro fi lms or in any other physical way, and transmission or information storage and retrieval, electronic adaptation, computer software, or by similar or dissimilar methodology now known or hereafter developed. Exempted from this legal reservation are brief excerpts in connection with reviews or scholarly analysis or material supplied speci fi cally for the purpose of being entered and executed on a computer system, for exclusive use by the purchaser of the work. Duplication of this publication or parts thereof is permitted only under the provisions of the Copyright Law of the Publisher’s location, in its current version, and permission for use must always be obtained from Springer. Permissions for use may be obtained through RightsLink at the Copyright Clearance Center. Violations are liable to prosecution under the respective Copyright Law.The use of general descriptive names, registered names, trademarks, service marks, etc. in this publication does not imply, even in the absence of a speci fi c statement, that such names are exempt from the relevant protective laws and regulations and therefore free for general use.While the advice and information in this book are believed to be true and accurate at the date of publication, neither the authors nor the editors nor the publisher can accept any legal responsibility for any errors or omissions that may be made. The publisher makes no warranty, express or implied, with respect to the material contained herein.
Printed on acid-free paper
Humana Press is a brand of SpringerSpringer is part of Springer Science+Business Media (www.springer.com)
v
Preface
We are proud to present the second edition of p53 protocols to keep up with the progress in p53 research since the publication of its fi rst edition. The present edition includes 19 chapters delineating state-of-the art methods to address the challenging questions of the p53 fi eld such as identi fi cation of the target genes and binding partners of gain of func-tion p53 mutants, methods to determine stress response, autophagy or senescence induced by p53, cell cycle analysis, analysis of different phases of DNA replication modi fi ed by p53, and generation of pluripotent stem cells.
As in the earlier version, the primary focus of p53 protocols was to include methods that are important for research on p53 or other tumor suppressors. We have also attempted to discuss the problems and to provide tips for troubleshooting. We owe thanks to Professor John Walker for giving us the opportunity and encouragement to design and edit the sec-ond edition. We also thank the staff of Humana Press for their help in compiling the book. We sincerely thank all the contributing authors for sharing their invaluable experience to the research community by writing the high-quality chapters. We would also like to thank Dr. Rebecca Frum and our students Catherine Vaughan, Isabella Pearsall, Shilpa Singh, and Olivia Bouton who enthusiastically acted as foot soldiers assisting us with grammatical editing, communicating with the authors, and organizing the manuscript.
Richmond, VA, USA Sumitra DebRichmond, VA, USA Swati Palit Deb

vii
Contents
Preface. . . . . . . . . . . . . . . . . . . . . . . . . . . . . . . . . . . . . . . . . . . . . . . . . . . . . . . . . . vContributors. . . . . . . . . . . . . . . . . . . . . . . . . . . . . . . . . . . . . . . . . . . . . . . . . . . . . . ix
1 Detecting and Quantifying p53 Isoforms at mRNA Level in Cell Lines and Tissues . . . . . . . . . . . . . . . . . . . . . . . . . . . . . . . . . . . . . . . . . 1Marie P. Khoury, Virginie Marcel, Kenneth Fernandes, Alexandra Diot, David P. Lane, and Jean-Christophe Bourdon
2 Detecting p53 Isoforms at Protein Level . . . . . . . . . . . . . . . . . . . . . . . . . . . . . 15Virginie Marcel, Marie P. Khoury, Kenneth Fernandes, Alexandra Diot, David P. Lane, and Jean-Christophe Bourdon
3 Autophagy, Senescence, and Apoptosis . . . . . . . . . . . . . . . . . . . . . . . . . . . . . . 31Rachel W. Goehe, Molly L. Bristol, Eden N. Wilson, and David A. Gewirtz
4 p53 and Cell Cycle Effects After DNA Damage. . . . . . . . . . . . . . . . . . . . . . . . 49Emir Senturk and James J. Manfredi
5 p53 Ubiquitination and Proteasomal Degradation. . . . . . . . . . . . . . . . . . . . . . 63Ian M. Love, Dingding Shi, and Steven R. Grossman
6 Identification of p53 in Mitochondria . . . . . . . . . . . . . . . . . . . . . . . . . . . . . . . 75Angelina V. Vaseva and Ute M. Moll
7 Identification of Novel Mutant p53 Interacting Proteins by Proteomic Analysis . . . . . . . . . . . . . . . . . . . . . . . . . . . . . . . . . . . . . . . . . . . 85Sumitra Deb and Paul R. Graves
8 Identification of Small Molecules Affecting p53-MDM2/MDMX Interaction by Fluorescence Polarization . . . . . . . . . . . . . . . . . . . . . . . . . . . . . 95Qi Zhang and Hua Lu
9 Determine the Effect of p53 on Chemosensitivity . . . . . . . . . . . . . . . . . . . . . . 113Emir Senturk and James J. Manfredi
10 Measurement of Chemosensitivity and Growth Rate in p53 Expressing Cells . . . . . . . . . . . . . . . . . . . . . . . . . . . . . . . . . . . . . . . . . . 127Mahesh Ramamoorthy, Catherine Vaughan, Sumitra Deb, and Swati Palit Deb
11 Mutant p53 in Cell Adhesion and Motility . . . . . . . . . . . . . . . . . . . . . . . . . . . 135W. Andrew Yeudall, Katharine H. Wrighton, and Sumitra Deb
12 Use of the DNA Fiber Spreading Technique to Detect the Effects of Mutant p53 on DNA Replication . . . . . . . . . . . . . . . . . . . . . . . . . . . . . . . . 147Rebecca A. Frum, Sumitra Deb, and Swati Palit Deb
13 Generation of p53-Deficient Induced Pluripotent Stem Cells from Mouse Embryo Fibroblasts . . . . . . . . . . . . . . . . . . . . . . . . . . . . . . . . . . . 157Evguenia M. Alexandrova and Ute M. Moll

viii Contents
14 p53 Actions on MicroRNA Expression and Maturation Pathway . . . . . . . . . . . 165Hiroshi I. Suzuki and Kohei Miyazono
15 Isolation and Characterization of Murine Multipotent Lung Stem Cells . . . . . 183Venkat S. Gadepalli, Catherine Vaughan, and Raj R. Rao
16 Generation of p53 Knock-down Cell Lines . . . . . . . . . . . . . . . . . . . . . . . . . . . 193Catherine Vaughan, Swati Palit Deb, and Sumitra Deb
17 ChIP for Identification of p53 Responsive DNA Promoters. . . . . . . . . . . . . . . 201Jun-Ming Liao and Hua Lu
18 ChIP-on-chip to Identify Mutant p53 Targets. . . . . . . . . . . . . . . . . . . . . . . . . 211Frauke Goeman, Giulia Fontemaggi, and Giovanni Blandino
19 ChIP Sequencing to Identify p53 Targets . . . . . . . . . . . . . . . . . . . . . . . . . . . . 227Catherine Vaughan, Brad Windle, and Sumitra Deb
Erratum. . . . . . . . . . . . . . . . . . . . . . . . . . . . . . . . . . . . . . . . . . . . . . . . . . . . . . . . . E1Index . . . . . . . . . . . . . . . . . . . . . . . . . . . . . . . . . . . . . . . . . . . . . . . . . . . . . . . . . . . 237
ix
Contributors
EVGUENIA M. ALEXANDROVA • Department of Pathology , Stony Brook University , Stony Brook , NY , USA
GIOVANNI BLANDINO • Laboratory of Translational Oncogenomics , Regina Elena Cancer Institute , Rome , Italy
JEAN-CHRISTOPHE BOURDON • Department of Surgery and Molecular Oncology , Ninewells Hospital, University of Dundee , Dundee , UK
MOLLY L. BRISTOL • Department of Pharmacology and Toxicology , Virginia Commonwealth University , Richmond , VA , USA; Department of Pathology , Virginia Commonwealth University , Richmond , VA , USA
SUMITRA DEB • Department of Biochemistry, Massey Cancer Center, Department of Microbiology and Immunology, Virginia Commonwealth University, Richmond, VA, USA
SWATI PALIT DEB • Department of Biochemistry, Massey Cancer Center, Department of Microbiology and Immunology, Virginia Commonwealth University, Richmond, VA, USA
ALEXANDRA DIOT • CR-UK Cell Transformation Research Group , Centre for Oncology and Molecular Medicine, Ninewells Hospital, University of Dundee , Dundee , UK
KENNETH FERNANDES • CR-UK Cell Transformation Research Group , Centre for Oncology and Molecular Medicine, Ninewells Hospital, University of Dundee , Dundee , UK
GIULIA FONTEMAGGI • Laboratory of Translational Oncogenomics , Regina Elena Cancer Institute , Rome , Italy; Rome Oncogenomic Center (ROC) , Regina Elena Cancer Institute , Rome , Italy
REBECCA A. FRUM • Department of Internal Medicine, Massey Cancer Center, Goodwin Research Laboratory , Virginia Commonwealth University , Richmond , VA , USA
VENKAT S. GADEPALLI • Integrative Life Sciences, Department of Life Sciences , Virginia Commonwealth University , Richmond , VA , USA
DAVID A. GEWIRTZ • Massey Cancer Center, Virginia Commonwealth University , Richmond , VA , USA
RACHEL W. GOEHE • Department of Pharmacology and Toxicology , Virginia Commonwealth University , Richmond , VA , USA; Department of Radiation Oncology , Virginia Commonwealth University , Richmond , VA , USA
FRAUKE GOEMAN • Laboratory of Translational Oncogenomics , Regina Elena Cancer Institute , Rome , Italy; Rome Oncogenomic Center (ROC) , Regina Elena Cancer Institute , Rome , Italy
ZEHAVIT GOLDBERG • Lautenberg Center, IMRIC, The Hebrew University-Hadassah Medical School , Jerusalem , Israel
PAUL R. GRAVES • Department of Radiation Oncology , New York Methodist Hospital , Brooklyn , NY , USA
STEVEN R. GROSSMAN • Hematology Oncology, Department of Internal Medicine , Virginia Commonwealth University , Richmond , VA , USA
MARIE P. KHOURY • CR-UK Cell Transformation Research Group , Centre for Oncology and Molecular Medicine, Ninewells Hospital, University of Dundee , Dundee , UK
x Contributors
DAVID P. LANE • CR-UK Cell Transformation Research Group , Centre for Oncology and Molecular Medicine, Ninewells Hospital, University of Dundee , Dundee , UK
YAARA LEVAV-COHEN • Lautenberg Center, IMRIC, The Hebrew University-Hadassah Medical School , Jerusalem , Israel
JUN-MING LIAO • Department of Biochemistry & Molecular Biology and Simon Cancer Center , Indiana University School of Medicine , Indianapolis , IN , USA
IAN M. LOVE • Department of Internal Medicine , Virginia Commonwealth University , Richmond , VA , USA
HUA LU • Department of Biochemistry & Molecular Biology and Tulane Cancer Center , Tulane University School of Medicine , New Orleans , LA , USA
JAMES J. MANFREDI • Oncological Sciences and Developmental and Regenerative Biology , Ichan Medical Institute , New York , NY , USA
VIRGINIE MARCEL • CR-UK Cell Transformation Research Group , Centre for Oncology and Molecular Medicine, Ninewells Hospital, University of Dundee , Dundee , UK
KOHEI MIYAZONO • Department of Molecular Pathology , Graduate School of Medicine, University of Tokyo , Tokyo , Japan
UTE M. MOLL • Department of Pathology , Stony Brook University , Stony Brook , NY , USA MAHESH RAMAMOORTHY • Laboratory of Molecular Gerontology , National Institute on
Aging, Biomedical Research Center , Baltimore MD , USA RAJ R. RAO • Department of Chemical and Life Science Engineering , School of Engineer-
ing, Virginia Commonwealth University , Richmond , VA , USA EMIR SENTURK • Mount Sinai School of Medicine , New York , NY , USA DINGDING SHI • Institute for Cancer Genetics , Columbia University ,
New York City , NY , USA HIROSHI I. SUZUKI • Department of Molecular Pathology , Graduate School of Medicine,
University of Tokyo , Tokyo , Japan ANGELINA V. VASEVA • Department of Pathology , Stony Brook University , Stony Brook ,
NY , USA CATHERINE VAUGHAN • Department of Integrative Life Sciences , Virginia Commonwealth
University , Richmond , VA , USA EDEN N. WILSON • Department of Pharmacology and Toxicology , Virginia Commonwealth
University , Richmond , VA , USA BRAD WINDLE • Department of Medicinal Chemistry , Virginia Commonwealth University ,
Richmond , VA , USA KATHARINE H. WRIGHTON • Nature Reviews, Macmillan Press , London , UK W. ANDREW YEUDALL • Philips Institute of Oral & Craniofacial Molecular Biology ,
School of Dentistry , Virginia Commonwealth University, Richmond , VA , USA QI ZHANG • Department of Biochemistry & Molecular Biology and Tulane Cancer Center ,
Tulane University School of Medicine , New Orleans , LA , USA VALENTINA ZUCKERMAN • Lautenberg Center, IMRIC, The Hebrew University-Hadassah
Medical School , Jerusalem , Israel
1
Sumitra Deb and Swati Palit Deb (eds.), p53 Protocols, Methods in Molecular Biology, vol. 962,DOI 10.1007/978-1-62703-236-0_1, © Springer Science+Business Media New York 2013
Chapter 1
Detecting and Quantifying p53 Isoforms at mRNA Level in Cell Lines and Tissues
Marie P. Khoury* , Virginie Marcel* , Kenneth Fernandes , Alexandra Diot , David P. Lane , and Jean-Christophe Bourdon
Abstract
The TP53 gene expresses at least nine different mRNA variants (p53 isoform mRNAs), including the one encoding the canonical p53 tumor suppressor protein. We have developed scienti fi c tools to speci fi cally detect and quantify p53 isoform expression at mRNA level by nested RT-PCR (reverse transcription-polymerase chain reaction) and quantitative real-time RT-PCR (RT-qPCR using the TaqMan ® chemistry). Here, we describe these two methods, while highlighting essential points with regard to the analysis of p53 isoform mRNA expression.
Key words: p53 isoforms , Cancer , Detection , Quanti fi cation , mRNA , Splicing , Nested PCR , Quantitative real-time RT-PCR (TaqMan ® chemistry) , p53 tumor suppressor protein
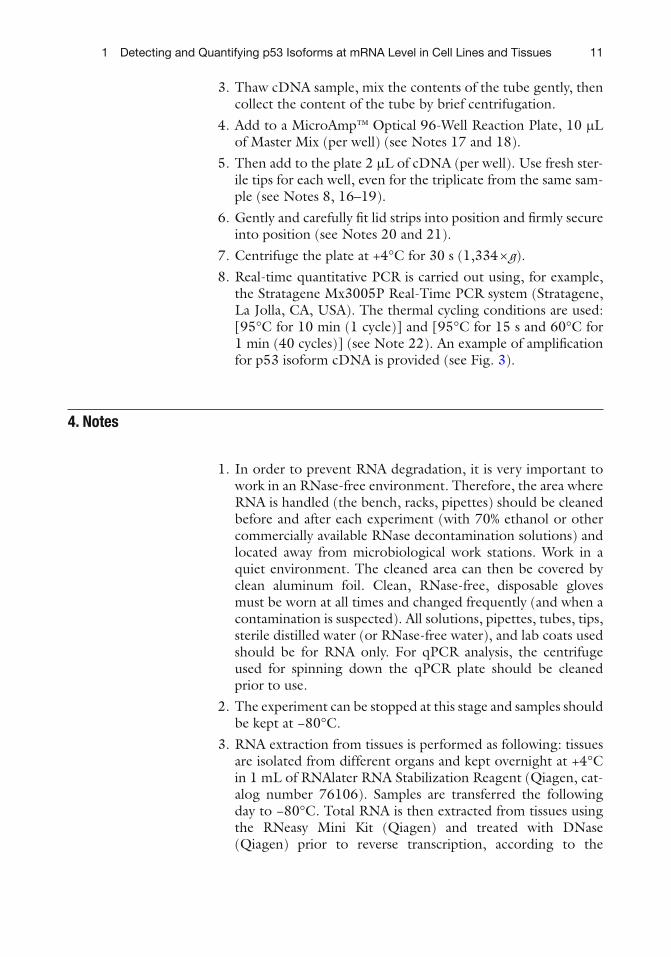
The TP53 gene expresses at least nine different mRNA variants (p53 isoform mRNAs), due to alternative splicing and internal promoter usage (see Fig. 1 ) ( 1 ) . The dual promoter structure of the TP53 gene results in the production of two subclasses of mRNA variants which differ in their 5 ¢ UTR (TAp53 and D 133p53 subclasses) ( 2 ) . A third subclass of mRNA variant ( D 40p53 sub-class) retains the entire intron 2 by alternative splicing ( 3 ) . These three different subclasses can be combined to three distinct sub-classes of mRNA variants differing by their 3 ¢ UTR due to alterna-tive splicing of intron 9 ( a , b , and g subclasses) ( 2 ) . Indeed, complete “splicing out” of intron 9 generates the a subclass, while
1. Introduction
* Both authors have contributed equally to this work.
2 M.P. Khoury et al.
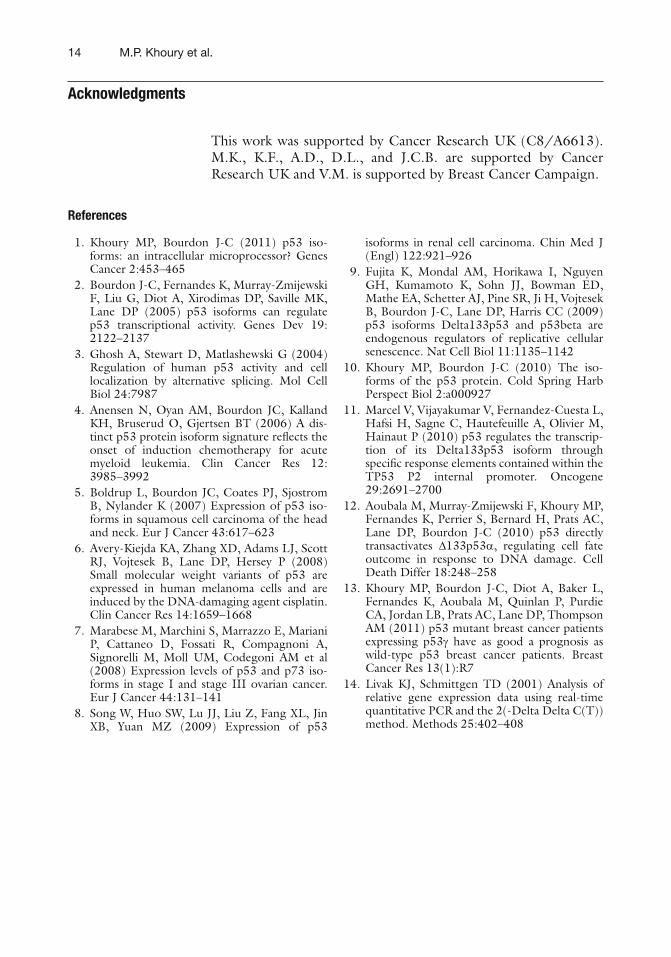
retention of different parts of intron 9 produces the b and g subclasses (see Fig. 1 ). The canonical p53 protein (encoded by the p53 mRNA variant retaining all exons 1–11 correctly spliced) belongs to the TAp53 subclass. Thus, p53 mRNA variants have distinct nucleotide sequences allowing the design of primers and probes speci fi c for p53 isoforms. Nested PCRs allow the detection of each p53 mRNA variant (see Fig. 2 ), while RT-qPCR enables the quanti fi cation of subclasses of p53 mRNA variants (i.e., TAp53, D 40p53, D 133p53, a , b , and g subclasses), since it is not technically possible to perform quantitative PCR on DNA frag-ments larger than 200 bp (see Fig. 3 ).
Using these methods, we and others have shown that p53 isoforms are differentially expressed in human tissues at mRNA level ( 2, 4– 10 ) . For instance, while the TAp53 mRNA subclass is the most abundant one in most human cell lines and tissues, the D 133p53 subclass is present at about 1–30% of the TAp53
Δ133p53 (α, β, γ)P2
P1
Sequencep53 mRNA variantPromoter
TP53
P1 P2
exon 9βexon 9γstop codon
βγ
(3)(2)(1)
TAp53 (α, β, γ)
Δ40p53 (α, β, γ)
TAp53α: E1-E2-(E3/8)-E9-E10-E11.TAp53β: E1-E2-(E3/8)-E9-E9β-E10-E11.TAp53γ: E1-E2-(E3/8)-E9-E9γ-E10-E11.Δ40p53α: E1-E2-I2-(E3/8)-E9-E10-E11.Δ40p53β: E1-E2-I2-(E3/8)-E9-E9β-E10-E11.Δ40p53γ: E1-E2-I2-(E3/8)-E9-E9γ-E10-E11.
Δ133p53α: I4-(E5/8)-E9-E10-E11.Δ133p53β: I4-(E5/8)-E9-E9β-E10-E11.Δ133p53γ: I4-(E5/8)-E9-E9γ-E10-E11.
a
b
Fig. 1. ( a ) The genomic sequence of the human TP53 gene spans 19,200 bp and contains 11 exons. The dual promoter structure of the TP53 gene (promoters ( P1 ) and ( P2 )) allows the production of several p53 mRNA variants due to alternative splicing and internal promoter usage ( 2 ) . ( b ) Alternative splicing of intron 9 generates the b and g subclasses (designated by exon 9 b and exon 9 g ). As highlighted in the text, the three different subclasses of p53 isoform mRNAs differing by their 5 ¢ UTR (TAp53, D 40p53, and D 133p53) can be combined to three different subclasses of mRNA variants differing by their 3 ¢ UTR due to alternative splicing of intron 9 ( a , b , and g subclasses). Of note, while nine different mRNA variants can be obtained in total, 12 different p53 isoform proteins can be generated from the TP53 gene (due to alternative initiation of translation (see Chapter 2, Fig. 1)). Exons (E) are numbered, non-coding exons are represented by black boxes , coding exons by white boxes and introns (I) are marked with a bold straight line . The stop codons in the b , g , and a subclasses of p53 mRNA variants are indicated with an arrow with the numbers (1), (2), and (3), respectively. E3/8: exon 3 to exon 8; E5/8: exon 5 to exon 8.

31 Detecting and Quantifying p53 Isoforms at mRNA Level in Cell Lines and Tissues
mRNA subclass. Despite their low expression level, p53 isoforms have been shown to be potent regulators of p53 transcriptional activity and tumor suppressor functions ( 2, 9, 11– 13 ) . In human cancers, several studies have shown that p53 isoform mRNA variants are abnormally expressed. Indeed, comparison of expression of p53 mRNA variants in normal and tumor tissues revealed that the b and g subclasses tend to be lost in human tumors, while others ( D 133p53 subclass) tend to be overex-pressed ( 1, 10 ) . Furthermore, we have recently reported that the p53 g isoform is associated with cancer prognosis in a cohort of primary breast tumors ( 10, 13 ) . Given the important role of p53 isoforms in the modulation of p53 tumor suppressor activ-ity and their differential expression in human cancer, future studies will require a systemic characterization of their expres-sion in cell lines and tumor tissues in order to decipher their response to cellular stress.
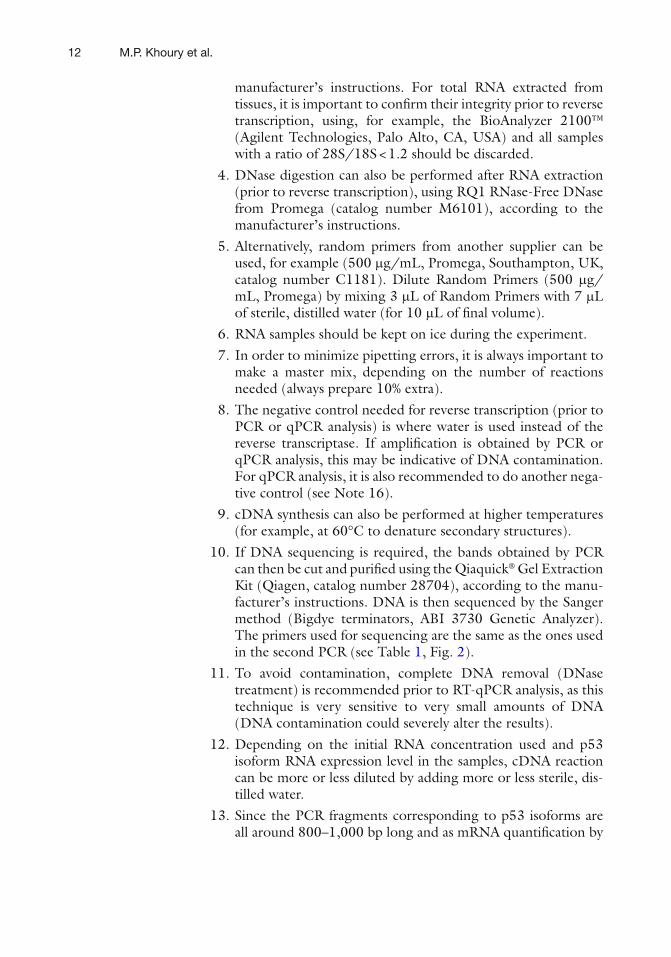
Fig. 2. Example of ampli fi cation of p53 isoform mRNAs by nested PCR in human cell lines (MCF-7: human breast adenocarcinoma cell line, wild-type p53; SK-N-AS: Human neu-roblastoma cell line, mutant p53: R342X; H1299: human non-small cell lung carcinoma cell line, p53-null). Speci fi c primers were used for amplifying p53, p53 b , p53 g , D 133p53, D 133p53 b , or D 133p53 g by nested RT-PCR (see Table 1 ). 20 m L of the PCR products were migrated on 1% agarose gel. M: Marker (100 bp DNA ladder, Promega), C: negative control (see Note 8). The Sanger Method was used for DNA sequencing of the bands obtained (see Note 10).
4 M.P. Khoury et al.
Up until now, while some of the available antibodies allow the detection/identi fi cation of all p53 isoforms but with a different accuracy (see Chapter 3 ), the identi fi cation and quanti fi cation of p53 isoforms can only be achieved by nested PCRs and RT-qPCR, respectively, and it is therefore crucial to standardize the techniques used to characterize p53 mRNA variants.
subclasses
subclasses
Flu
ores
cenc
e (d
R)
-10000
2 4 6 8 10 12 14 16 18 20 22 24 26 28 30 32 34 36 38 40
2 4 6 8 10 12 14 16 18 20 22 24 26 28 30 32 34 36 38 40
100020003000400050006000700080009000
10000110001200013000140001500016000170001800019000
Cycles (Ct values)
α subclasses
β subclasses
γ subclasses0
2000
4000
6000
8000
10000
12000
14000
16000
18000
20000
Cycles (Ct values)
Flu
ores
cenc
e (d
R)
TA/Δ40p53
Δ133p53
a
b
Fig. 3. Example of ampli fi cation plots for p53 isoform cDNA standards by the Stratagene Mx3005P™ Real-Time PCR system. In this fi gure are shown examples of Ct values (or number of PCR cycles required for speci fi c ampli fi cation) for ampli fi cation of ( a ) TAp53, D 40p53, and D 133p53 isoforms and ( b ) a , b , and g isoforms. Of note, the reverse transcription for this experiment was performed with 1 m g of RNA and then diluted to 200 m L of fi nal volume with water (see Subheadings 2 and 3 ).
51 Detecting and Quantifying p53 Isoforms at mRNA Level in Cell Lines and Tissues
1. Clean, RNase-free area (see Note 1). 2. RNeasy ® Mini Kit (Qiagen, West Sussex, UK, catalog number
74104). 3. RNase-free DNase Set (Qiagen, catalog number 79254).
1. Clean, RNase-free area. 2. Random primers (stock solution at 3 m g/ m L, Invitrogen, cata-
log number 48190-011). Dilute in sterile, distilled water to obtain a fi nal concentration of 0.5 m g/ m L (see Note 5).
3. Set of dATP, dCTP, dGTP, dTTP (stock solution at 100 mM each, Promega, catalog number U1240). Prepare 10 mM dNTP Mix by diluting 10 m L of each dATP, dCTP, dGTP, dTTP to 100 m L of fi nal volume with sterile, distilled water.
4. RNaseOUT™ Recombinant Ribonuclease Inhibitor (Invitrogen, Paisley, UK, catalog number 10777-019).
5. Cloned AMV Reverse Transcriptase (15 U/ m L, Invitrogen, catalog number 12328-019) which includes the Cloned AMV Reverse Transcriptase, 5× cDNA Synthesis Buffer, and 0.1 M DTT.
6. Sterile, distilled water.
1. PCR SuperMix (Invitrogen, catalog number 10572-063). 2. Primers (Forward and Reverse) speci fi c for p53 isoforms were
designed in our laboratory and purchased from MWG-Biotech (UK). Primers are used at 10 m M and stored at −20°C. The list of primers used for ampli fi cation of human p53 isoforms by nested PCR is provided (see Table 1 ).
3. 5× TBE (Tris-borate-EDTA): Prepare a concentrated (5×) stock solution of TBE by dissolving 30 g Tris-base, 15.4 g Boric Acid, 1.86 g EDTA-Na 2 -2H 2 O in water for a fi nal volume of 1 L. The solution can then be stored at room temperature. Use a diluted (0.5×) TBE solution for agarose gel preparation.
4. Ultrapure™ Agarose (Invitrogen, catalog number 16500-500). 5. UltraPure™ 10 mg/mL Ethidium Bromide (Invitrogen, cata-
log number 15585-011). 6. 100 bp DNA ladder (Promega, catalog number G2101). 7. Prepare 1% agarose gels by boiling agarose in 0.5× TBE buffer.
Add 1 m L of ethidium bromide (10 m g/ m L, Invitrogen) per 100 mL of buffer.
2. Materials
2.1. RNA Extraction
2.2. Nested Reverse Transcription-Polymerase Chain Reaction
2.2.1. Reverse Transcription
2.2.2. Polymerase Chain Reaction

6 M.P. Khoury et al.
8. 10× DNA loading buffer: Prepare a concentrated (10×) stock solution of DNA loading buffer by dissolving 125 mg of bromophenol blue in 16.5 mL of Tris Buffer (150 mM, pH 7.6). Add 30 mL of glycerol and 3.5 mL of water. The solution can then be stored at room temperature. Use the solution of DNA loading buffer at 1×.
9. Sterile, distilled water.
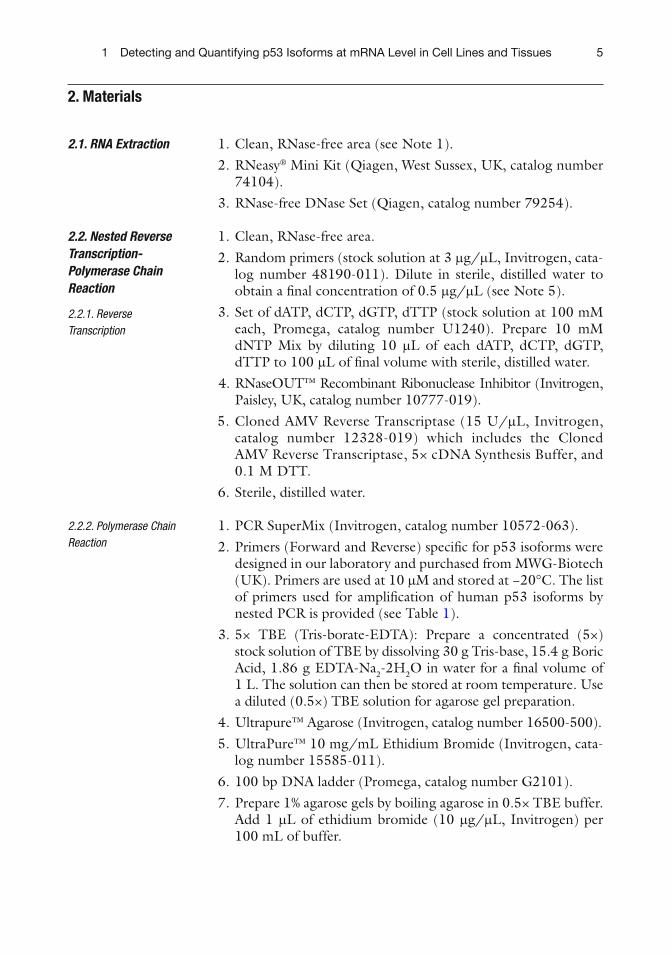
Table 1 Primers for ampli fi cation of human p53 isoform and actin mRNAs by RT-PCR (nested PCR)
mRNA (PCR fragment size) PCR
Primer name and targeted region 5 ¢ –3 ¢ sequence
p53 (1,130 bp)
I
II
e2.1 (F) (exon 2) RT1 (R) (exon 11) e2 (F) (exon 2) RT2 (R) (exon 11)
GTCACTGCCATGGAGGAGCCGCA GACGCACACCTATTGCAAGCAAGGGTTC ATGGAGGAGCCGCAGTCAGAT ATGTCAGTCTGAGTCAGGCCCTTCTGTC
p53 b (1,120 bp)
I
II
e2.1 (F) (exon 2) RT1 (R) (exon 11) e2 (F) (exon 2) p53b (R) (exon 9 b )
GTCACTGCCATGGAGGAGCCGCA GACGCACACCTATTGCAAGCAAGGGTTC ATGGAGGAGCCGCAGTCAGAT TTTGAAAGCTGGTCTGGTCCTGA
p53 g (1,120 bp)
I
II
e2.1 (F) (exon 2) RT1 (R) (exon 11) e2 (F) (exon 2) p53g (R) (exon 9 g )
GTCACTGCCATGGAGGAGCCGCA GACGCACACCTATTGCAAGCAAGGGTTC ATGGAGGAGCCGCAGTCAGAT TCGTAAGTCAAGTAGCATCTGAAGG
D 133p53 (770 bp)
I
II
i4F1 (F) (intron 4) RT1 (R) (exon 11) i4F2 (F) (intron 4) RT2 (R) (exon 11)
TAGACGCCAACTCTCTCTAG GACGCACACCTATTGCAAGCAAGGGTTC CTAGTGGGTTGCAGGAGGTGCTTACAC ATGTCAGTCTGAGTCAGGCCCTTCTGTC
D 133p53 b (760 bp)
I
II
i4F1 (F) (intron 4) RT1 (R) (exon 11) i4F2 (F) (intron 4) p53b (R) (exon 9 b )
TAGACGCCAACTCTCTCTAG GACGCACACCTATTGCAAGCAAGGGTTC CTAGTGGGTTGCAGGAGGTGCTTACAC TTTGAAAGCTGGTCTGGTCCTGA
D 133p53 g (760 bp)
I
II
i4F1 (F) (intron 4) RT1 (R) (exon 11) i4F2 (F) (intron 4) p53g (R) (exon 9 g )
TAGACGCCAACTCTCTCTAG GACGCACACCTATTGCAAGCAAGGGTTC CTAGTGGGTTGCAGGAGGTGCTTACAC TCGTAAGTCAAGTAGCATCTGAAGG
Actin (one PCR)
Actin (F)
Actin (R)
ATCTGGCACCACACCTTCTACAATGAGCTGCG CGTCATACTCCTGCTTGCTGATCCACATCTGC
The speci fi c region (exon or intron) that each of the primers target is indicated. (F): Forward, (R): Reverse. PCR frag-ment sizes (bp) corresponding to p53 isoforms are also indicated. cDNA quality is con fi rmed by PCR ampli fi cation of actin. Of note, the primers corresponding to D 40p53 isoforms ( D 40p53 a , D 40p53 b , and D 40p53 g ) are not listed in this table, as we have not studied the D 40p53 isoforms in our laboratory
71 Detecting and Quantifying p53 Isoforms at mRNA Level in Cell Lines and Tissues
1. Clean, RNase-free area. 2. Random primers (stock solution at 3 m g/ m L, Invitrogen,
catalog number 48190-011). Prepare as in Subheading 2.1 (see Note 5).
3. Set of dATP, dCTP, dGTP, dTTP (Promega, catalog number U1240). Prepare as in Subheading 2.1 .
4. RNaseOUT™ Recombinant Ribonuclease Inhibitor (Invitrogen, catalog number 10777-019).
5. Superscript™ II reverse transcriptase (200 U/ m L, Invitrogen, catalog number 18064-014) which includes the Superscript™ II reverse transcriptase, 5× First-Strand Buffer, and 0.1 M DTT.
6. Prepare a fresh 1:3 dilution of the reverse transcriptase by dilut-ing the Superscript™ II reverse transcriptase (200 U/ m L) in 1× First-Strand Buffer (for example, 10 m L of Superscript™ II reverse transcriptase is added to 20 m L of 1× First-Strand Buffer, for a fi nal volume of 30 m L), as recommended by the manufac-turer. 1× First-Strand Buffer is diluted in sterile, distilled water from the 5× stock solution (5× First-Strand Buffer).
7. Sterile, distilled water.
1. Clean, RNase-free area. 2. A set of pipettes dedicated to RT-qPCR experiments only. 3. TaqMan ® Universal PCR Master Mix, No AmpErase ® UNG
(2×, Applied Biosystems, catalog number 4324020). 4. Primers and probes speci fi c for each subclass of p53 isoform
mRNAs were designed in our laboratory and purchased from MWG-Biotech (UK). Primers and probes are used at 10 m M and stored at −20°C. The list of primers and probes used for ampli fi cation of human p53 isoforms by RT-qPCR is provided (see Table 2 , Notes 13 and 14).
5. MicroAmp™ Optical 96-Well Reaction Plate (Applied Biosystems, catalog number N8010560).
6. A rack to support the 96-well reaction plate. 7. MicroAmp™ Optical 8-Cap Strip (Applied Biosystems, catalog
number 4323032).
1. For cell harvesting, remove medium from wells/dishes then wash cells twice with ice-cold 1× PBS.
2. Cells are lysed by directly adding onto wells/dishes Buffer RLT supplemented with b -Mercaptoethanol ( b -Mercaptoethanol is
2.3. Quantitative Real-Time RT-PCR (Real-Time PCR Using the TaqMan ® Chemistry)
2.3.1. Reverse Transcription (RT)
2.3.2. RT-qPCR (Quantitative Real-Time RT-PCR Using the TaqMan ® Chemistry)
3. Methods
3.1. RNA Extraction
8 M.P. Khoury et al.
added to Buffer RLT under a chemical hood), according to the manufacturer’s instructions.
3. Cells are scrapped off with a cell scraper and collected into a tube.
4. Lysate is passed at least fi ve times through a 23-G needle fi tted to an RNase-free syringe (see Note 2).
5. Extract RNA from cells with the RNeasy Mini Kit (Qiagen) according to the manufacturer’s instructions (see Note 3).
6. In addition, on-column DNase digestion is carried out using RNase-free DNase Set (Qiagen) during RNA extraction (between Buffer RW1 wash and fi rst Buffer RPE wash), accord-ing to the manufacturer’s instructions (see Note 4).
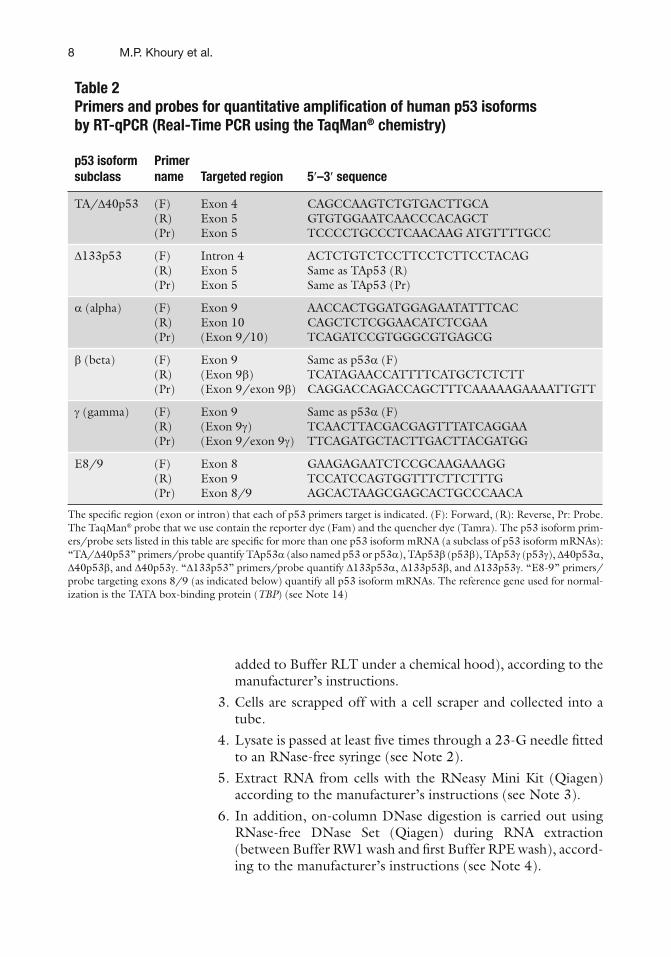
Table 2 Primers and probes for quantitative ampli fi cation of human p53 isoforms by RT-qPCR (Real-Time PCR using the TaqMan ® chemistry)
p53 isoform subclass
Primer name Targeted region 5 ¢ –3 ¢ sequence
TA/ D 40p53 (F) (R) (Pr)
Exon 4 Exon 5 Exon 5
CAGCCAAGTCTGTGACTTGCA GTGTGGAATCAACCCACAGCT TCCCCTGCCCTCAACAAG ATGTTTTGCC
D 133p53 (F) (R) (Pr)
Intron 4 Exon 5 Exon 5
ACTCTGTCTCCTTCCTCTTCCTACAG Same as TAp53 (R) Same as TAp53 (Pr)
a (alpha) (F) (R) (Pr)
Exon 9 Exon 10 (Exon 9/10)
AACCACTGGATGGAGAATATTTCAC CAGCTCTCGGAACATCTCGAA TCAGATCCGTGGGCGTGAGCG
b (beta) (F) (R) (Pr)
Exon 9 (Exon 9 b ) (Exon 9/exon 9 b )
Same as p53 a (F) TCATAGAACCATTTTCATGCTCTCTT CAGGACCAGACCAGCTTTCAAAAAGAAAATTGTT
g (gamma) (F) (R) (Pr)
Exon 9 (Exon 9 g ) (Exon 9/exon 9 g )
Same as p53 a (F) TCAACTTACGACGAGTTTATCAGGAA TTCAGATGCTACTTGACTTACGATGG
E8/9 (F) (R) (Pr)
Exon 8 Exon 9 Exon 8/9
GAAGAGAATCTCCGCAAGAAAGG TCCATCCAGTGGTTTCTTCTTTG AGCACTAAGCGAGCACTGCCCAACA
The speci fi c region (exon or intron) that each of p53 primers target is indicated. (F): Forward, (R): Reverse, Pr: Probe. The TaqMan ® probe that we use contain the reporter dye (Fam) and the quencher dye (Tamra). The p53 isoform prim-ers/probe sets listed in this table are speci fi c for more than one p53 isoform mRNA (a subclass of p53 isoform mRNAs): “TA/ D 40p53” primers/probe quantify TAp53 a (also named p53 or p53 a ), TAp53 b (p53 b ), TAp53 g (p53 g ), D 40p53 a , D 40p53 b , and D 40p53 g . “ D 133p53” primers/probe quantify D 133p53 a , D 133p53 b , and D 133p53 g . “E8-9” primers/probe targeting exons 8/9 (as indicated below) quantify all p53 isoform mRNAs. The reference gene used for normal-ization is the TATA box-binding protein ( TBP ) (see Note 14)
91 Detecting and Quantifying p53 Isoforms at mRNA Level in Cell Lines and Tissues
7. Elute RNA in 50 m L of fi nal volume. 8. Concentration of RNA can be determined, for example, by mea-
suring the absorbance at 260 nm using a spectrophotometer. 9. RNA samples should be stored at −80°C.
(Per reaction)
1. Mix 0.5 m L of random primers (0.5 m g/ m L) with 2 m L of dNTP Mix (10 mM) and 300 ng of total RNA (see Notes 6 and 7).
2. Add sterile, distilled water to 15 m L. 3. Heat the mixture at 65°C for 5 min (using, for example, a
heating block), then chill on ice for 5 min. 4. Collect the content of the tube by brief centrifugation. 5. Add 4 m L of cDNA Synthesis Buffer (5×), 1 m L of DTT
(0.1 M), 1 m L of RNaseOUT™ (40 U/ m L), and 1 m L of Cloned AMV Reverse Transcriptase (15 U/ m L). Mix the con-tents of the tube gently (see Note 8).
6. Incubate at 45°C for 1 h using, for example, a heating block (see Note 9).
7. Reverse transcription product is then stored at −20°C.
(50 m L of fi nal volume for each PCR) Nested PCR assays are performed as two consecutive PCRs
with two separate primer pairs for p53 isoforms (see Table 1 ).
1. For the fi rst PCR, mix 45 m L of PCR SuperMix (Invitrogen) with 2 m L of cDNA (undiluted), 2 m L of p53 isoform speci fi c primers (1 m L of Forward primer (10 m M) and 1 m L of Reverse primer (10 m M)) (see Table 1 ), and dilute to 50 m L of fi nal volume with sterile, distilled water.
2. Perform PCR ampli fi cation using, for example, the Applied Biosystems 2720 Thermal Cycler (Applied Biosystems, Foster City, CA, USA). Thermal cycling conditions for PCR ampli fi cation ( fi rst and second PCRs) for p53 isoforms are as follows: [94°C for 3 min (1 cycle)], [94°C for 30 s, 60°C for 45 s, 72°C for 1 min 30 s (30 cycles)], and fi nally [72°C for 8 min (1 cycle)].
3. For the second PCR, mix 45 m L of PCR SuperMix (Invitrogen) with 1 m L of product of fi rst PCR and 2 m L of p53 isoform speci fi c primers (1 m L of Forward primer (10 m M) and 1 m L of Reverse primer (10 m M)) (see Table 1 ), and dilute to 50 m L of fi nal volume with sterile, distilled water.
4. Perform PCR ampli fi cation as in step 2. 5. PCR products are then analyzed by agarose gel electrophoresis
(1% gel, see Subheading 2 ). For 20 m L of fi nal volume, add
3.2. Nested RT-PCR (Reverse Transcription-Polymerase Chain Reaction)
3.2.1. Reverse Transcription (RT)
3.2.2. PCR (Polymerase Chain Reaction)

10 M.P. Khoury et al.
2 m L of 10× DNA loading buffer to 18 m L of DNA (DNA from samples or from 3 m L of 100 bp DNA ladder (Promega) diluted in 15 m L of water), then load onto gels.
6. The bands obtained are visualized using, for example, the Syngene UV transilluminator (see Note 10, Fig. 2 ).
Prior to reverse transcription, extract total RNA as in Subheading 1 (see Notes 1–4, 11).
(Per reaction, for 20 m L of fi nal volume) (see Note 1).
1. Prepare Mix 1 by adding 0.5 m L of random primers (0.5 m g/ m L), 1 m L of dNTP Mix (10 mM), and 1 m g of total RNA (see Notes 6 and 7).
2. Add sterile, distilled water to Mix 1–12 m L. 3. Heat the mixture at 70°C for 10 min (using, for example, a
heating block) then chill on ice for 5 min. 4. Collect the content of the tube by brief centrifugation. 5. Prepare Mix 2 by adding 4 m L of 5× First-Strand Buffer, 1 m L
of DTT (0.1 M), and 1 m L of RNaseOUT™ (40 U/ m L). Add contents of Mix 2 to Mix 1. Mix the contents of the tube gently.
6. Incubate at 25°C for 5 min. 7. Add 2 m L of the diluted solution of Superscript™ II reverse
transcriptase in 1× First-Strand Buffer (see Subheading 2 ) to each tube (see Note 8).
8. Reverse transcription is then performed under the following thermal conditions: 25°C for 10 min, 42°C for 50 min, and 70°C for 15 min, using, for example, the Applied Biosystems 2720 Thermal Cycler (Applied Biosystems).
9. Dilute cDNA reaction to a fi nal volume of 200 m L by adding 180 m L of sterile, distilled water (to obtain about 5 ng of total RNA per m L) (see Note 12).
(Per reaction) (see Note 1).
1. Prepare a Master Mix by adding 5 m L of TaqMan ® (2×) Universal PCR Mastermix ( fi nal concentration of 1×), 1 m L of Forward primer (10 m M), 1 m L of Reverse primer (10 m M), 0.5 m L of probe (10 m M), and 2.5 m L of sterile, distilled water (for 10 m L of fi nal volume per well) (see Notes 7, 8, 14–17).
2. Mix the contents of the tube gently then collect the content of the tube by brief centrifugation.
3.3. Quantitative Real-Time RT-PCR (Real-Time PCR Using the TaqMan ® Chemistry)
3.3.1. Reverse Transcription (RT)
3.3.2. RT-qPCR (Quantitative Real-Time RT-PCR Using the TaqMan ® Chemistry)
111 Detecting and Quantifying p53 Isoforms at mRNA Level in Cell Lines and Tissues
3. Thaw cDNA sample, mix the contents of the tube gently, then collect the content of the tube by brief centrifugation.
4. Add to a MicroAmp™ Optical 96-Well Reaction Plate, 10 m L of Master Mix (per well) (see Notes 17 and 18).
5. Then add to the plate 2 m L of cDNA (per well). Use fresh ster-ile tips for each well, even for the triplicate from the same sam-ple (see Notes 8, 16–19).
6. Gently and carefully fi t lid strips into position and fi rmly secure into position (see Notes 20 and 21).
7. Centrifuge the plate at +4°C for 30 s (1,334 ́ g ). 8. Real-time quantitative PCR is carried out using, for example,
the Stratagene Mx3005P Real-Time PCR system (Stratagene, La Jolla, CA, USA). The thermal cycling conditions are used: [95°C for 10 min (1 cycle)] and [95°C for 15 s and 60°C for 1 min (40 cycles)] (see Note 22). An example of ampli fi cation for p53 isoform cDNA is provided (see Fig. 3 ).
1. In order to prevent RNA degradation, it is very important to work in an RNase-free environment. Therefore, the area where RNA is handled (the bench, racks, pipettes) should be cleaned before and after each experiment (with 70% ethanol or other commercially available RNase decontamination solutions) and located away from microbiological work stations. Work in a quiet environment. The cleaned area can then be covered by clean aluminum foil. Clean, RNase-free, disposable gloves must be worn at all times and changed frequently (and when a contamination is suspected). All solutions, pipettes, tubes, tips, sterile distilled water (or RNase-free water), and lab coats used should be for RNA only. For qPCR analysis, the centrifuge used for spinning down the qPCR plate should be cleaned prior to use.
2. The experiment can be stopped at this stage and samples should be kept at −80°C.
3. RNA extraction from tissues is performed as following: tissues are isolated from different organs and kept overnight at +4°C in 1 mL of RNAlater RNA Stabilization Reagent (Qiagen, cat-alog number 76106). Samples are transferred the following day to −80°C. Total RNA is then extracted from tissues using the RNeasy Mini Kit (Qiagen) and treated with DNase (Qiagen) prior to reverse transcription, according to the
4. Notes
12 M.P. Khoury et al.
manufacturer’s instructions. For total RNA extracted from tissues, it is important to con fi rm their integrity prior to reverse transcription, using, for example, the BioAnalyzer 2100™ (Agilent Technologies, Palo Alto, CA, USA) and all samples with a ratio of 28S/18S < 1.2 should be discarded.
4. DNase digestion can also be performed after RNA extraction (prior to reverse transcription), using RQ1 RNase-Free DNase from Promega (catalog number M6101), according to the manufacturer’s instructions.
5. Alternatively, random primers from another supplier can be used, for example (500 m g/mL, Promega, Southampton, UK, catalog number C1181). Dilute Random Primers (500 m g/mL, Promega) by mixing 3 m L of Random Primers with 7 m L of sterile, distilled water (for 10 m L of fi nal volume).
6. RNA samples should be kept on ice during the experiment. 7. In order to minimize pipetting errors, it is always important to
make a master mix, depending on the number of reactions needed (always prepare 10% extra).
8. The negative control needed for reverse transcription (prior to PCR or qPCR analysis) is where water is used instead of the reverse transcriptase. If ampli fi cation is obtained by PCR or qPCR analysis, this may be indicative of DNA contamination. For qPCR analysis, it is also recommended to do another nega-tive control (see Note 16).
9. cDNA synthesis can also be performed at higher temperatures (for example, at 60°C to denature secondary structures).
10. If DNA sequencing is required, the bands obtained by PCR can then be cut and puri fi ed using the Qiaquick ® Gel Extraction Kit (Qiagen, catalog number 28704), according to the manu-facturer’s instructions. DNA is then sequenced by the Sanger method (Bigdye terminators, ABI 3730 Genetic Analyzer). The primers used for sequencing are the same as the ones used in the second PCR (see Table 1 , Fig. 2 ).
11. To avoid contamination, complete DNA removal (DNase treatment) is recommended prior to RT-qPCR analysis, as this technique is very sensitive to very small amounts of DNA (DNA contamination could severely alter the results).
12. Depending on the initial RNA concentration used and p53 isoform RNA expression level in the samples, cDNA reaction can be more or less diluted by adding more or less sterile, dis-tilled water.
13. Since the PCR fragments corresponding to p53 isoforms are all around 800–1,000 bp long and as mRNA quanti fi cation by

131 Detecting and Quantifying p53 Isoforms at mRNA Level in Cell Lines and Tissues
RT-qPCR is not reliable for fragments larger than 200 bp, it is not technically possible to speci fi cally quantify each of the human p53 isoform mRNAs. Therefore, for p53 isoform mRNAs, we have designed in our laboratory primers/probe sets that speci fi cally amplify a subclass of p53 isoform mRNAs. For more information about the primers/probe sets that we use, as well as the isoforms they amplify, see Table 2 .
14. In our laboratory, the reference gene often used for normaliza-tion of qPCR experiments is the TATA box-binding protein ( TBP ). The (5 ¢ -3 ¢ ) sequence of primers/probe used is the fol-lowing: Forward primer: (CACGAACCACGGCACTGATT); Reverse primer: (TTTTCTTGCTGCCAGTCTGGAC); Probe: (Fam-5 ¢ -TGTGCACAGGAGCCAAGAGTGAAGA-3 ¢ -Tamra).
15. Prior to using the primers/probe for the fi rst time, it is impor-tant to test their ef fi ciency. Therefore, a 1:3 serial dilution of cDNA is performed (encompassing a range of at least fi ve dif-ferent concentrations including undiluted samples) and run in triplicate with the new primers/probe set. Primer ef fi ciency (E) is then determined (standard curve) ( 14 ) .
16. The second type of negative control needed for qPCR is the non-template control (NTC), where for each set of primers/probe, water is added to the qPCR plate instead of cDNA. This control should not show any ampli fi cation and if it does, it may indicate that the water used is contaminated. The qPCRs corresponding to the negative control are also run in triplicate.
17. Samples should be run in triplicate, including the negative controls (see Notes 8 and 16).
18. As RT-qPCR is a highly sensitive technique, pipetting should be as accurate as possible.
19. Apply the cDNA mid-way down the plate well to prevent los-ing cDNA when cap strips are applied later on.
20. A cap sealer may be used to apply the cap strips. Use new clean gloves when applying cap strips.
21. An adhesive fi lm can be used instead of the cap strips to cover the qPCR plate.
22. Important notes regarding qPCR result analysis: After prim-ers/probe ef fi ciency (E) is determined, this value is then taken into consideration to obtain the relative expression of each of the genes analyzed. Relative expression is determined by the comparative ( 1 + E) − D D Ct method. Therefore, the relative quanti fi cation is obtained by normalizing the Ct (Cycle thresh-old) values to the reference gene ( D Ct) and to the calibrator ( D D Ct) ( 14 ) .
14 M.P. Khoury et al.
Acknowledgments
This work was supported by Cancer Research UK (C8/A6613). M.K., K.F., A.D., D.L., and J.C.B. are supported by Cancer Research UK and V.M. is supported by Breast Cancer Campaign.
References
1. Khoury MP, Bourdon J-C (2011) p53 iso-forms: an intracellular microprocessor? Genes Cancer 2:453–465
2. Bourdon J-C, Fernandes K, Murray-Zmijewski F, Liu G, Diot A, Xirodimas DP, Saville MK, Lane DP (2005) p53 isoforms can regulate p53 transcriptional activity. Genes Dev 19:2122–2137
3. Ghosh A, Stewart D, Matlashewski G (2004) Regulation of human p53 activity and cell localization by alternative splicing. Mol Cell Biol 24:7987
4. Anensen N, Oyan AM, Bourdon JC, Kalland KH, Bruserud O, Gjertsen BT (2006) A dis-tinct p53 protein isoform signature re fl ects the onset of induction chemotherapy for acute myeloid leukemia. Clin Cancer Res 12:3985–3992
5. Boldrup L, Bourdon JC, Coates PJ, Sjostrom B, Nylander K (2007) Expression of p53 iso-forms in squamous cell carcinoma of the head and neck. Eur J Cancer 43:617–623
6. Avery-Kiejda KA, Zhang XD, Adams LJ, Scott RJ, Vojtesek B, Lane DP, Hersey P (2008) Small molecular weight variants of p53 are expressed in human melanoma cells and are induced by the DNA-damaging agent cisplatin. Clin Cancer Res 14:1659–1668
7. Marabese M, Marchini S, Marrazzo E, Mariani P, Cattaneo D, Fossati R, Compagnoni A, Signorelli M, Moll UM, Codegoni AM et al (2008) Expression levels of p53 and p73 iso-forms in stage I and stage III ovarian cancer. Eur J Cancer 44:131–141
8. Song W, Huo SW, Lu JJ, Liu Z, Fang XL, Jin XB, Yuan MZ (2009) Expression of p53
isoforms in renal cell carcinoma. Chin Med J (Engl) 122:921–926
9. Fujita K, Mondal AM, Horikawa I, Nguyen GH, Kumamoto K, Sohn JJ, Bowman ED, Mathe EA, Schetter AJ, Pine SR, Ji H, Vojtesek B, Bourdon J-C, Lane DP, Harris CC (2009) p53 isoforms Delta133p53 and p53beta are endogenous regulators of replicative cellular senescence. Nat Cell Biol 11:1135–1142
10. Khoury MP, Bourdon J-C (2010) The iso-forms of the p53 protein. Cold Spring Harb Perspect Biol 2:a000927
11. Marcel V, Vijayakumar V, Fernandez-Cuesta L, Hafsi H, Sagne C, Hautefeuille A, Olivier M, Hainaut P (2010) p53 regulates the transcrip-tion of its Delta133p53 isoform through speci fi c response elements contained within the TP53 P2 internal promoter. Oncogene 29:2691–2700
12. Aoubala M, Murray-Zmijewski F, Khoury MP, Fernandes K, Perrier S, Bernard H, Prats AC, Lane DP, Bourdon J-C (2010) p53 directly transactivates D 133p53 a , regulating cell fate outcome in response to DNA damage. Cell Death Differ 18:248–258
13. Khoury MP, Bourdon J-C, Diot A, Baker L, Fernandes K, Aoubala M, Quinlan P, Purdie CA, Jordan LB, Prats AC, Lane DP, Thompson AM (2011) p53 mutant breast cancer patients expressing p53 g have as good a prognosis as wild-type p53 breast cancer patients. Breast Cancer Res 13(1):R7
14. Livak KJ, Schmittgen TD (2001) Analysis of relative gene expression data using real-time quantitative PCR and the 2(-Delta Delta C(T)) method. Methods 25:402–408
15
Sumitra Deb and Swati Palit Deb (eds.), p53 Protocols, Methods in Molecular Biology, vol. 962,DOI 10.1007/978-1-62703-236-0_2, © Springer Science+Business Media New York 2013
Chapter 2
Detecting p53 Isoforms at Protein Level
Virginie Marcel* , Marie P. Khoury* , Kenneth Fernandes , Alexandra Diot , David P. Lane , and Jean-Christophe Bourdon
Abstract
The human p53 protein isoforms are expressed in several cell lines and modulate p53 tumor suppressor activity, mainly through modulation of gene expression ( 1 – 4 ) . Thus, identifying the pattern of p53 isoforms expression in cell lines is a key step for future studies of the p53 network ( 5 ) . At the moment, the detection of p53 protein isoforms is based on the use of a panel of antibodies allowing their identi fi cation by comparing their molecular weights and their detection pattern by different antibodies ( 6 ) . Here, classical protocols supplemented with technical know-how are described to detect p53 protein isoforms at protein level by Western blotting and immunoprecipitation. Furthermore, a simple method to study the impact of p53 pro-tein isoforms on p53 transcriptional activity through luciferase reporter gene assays is provided.
Key words: p53 protein isoforms , Antibodies , Western blotting , Immunoprecipitation , Luciferase reporter gene assays , Protein detection , p53 tumor suppressor protein , Animal model
The human tumor suppressor TP53 gene expresses several p53 tran-scripts due to the use of alternative promoters, splicing sites, and/or internal initiation sites of translation ( 1, 7– 9 ) . The different p53 tran-scripts encode at least 12 protein isoforms produced by the combina-tion of four distinct N-terminal domains (TA, D 40, D 133, and D 160) and three distinct C-terminal domains ( a , b , and g ) (see Fig. 1 ) ( 5 ) . In the N-terminus, the TA forms (initiation site of translation: ATG-1) exhibit a transactivation domain (TAD) and a DNA-binding domain
1. Introduction
* Both authors have contributed equally to this work.
16 V. Marcel et al.
(DBD), while the D 40 forms (ATG-40) lack part of the TAD and the D 133/ D 160 forms (ATG-133 and ATG-160, respectively) lack the entire TAD and part of the DBD. In the C-terminus, the a forms contain an oligomerization domain (OD), which is replaced by 10 or 15 new residues in b and g forms, respectively. Among the p53 iso-forms, the canonical p53 protein corresponds to the largest protein expressed by TP53 with a TAD, a DBD, and a C-terminal domain (OD) and thus termed p53 a or TAp53 a (see Fig. 1 ). Several studies have reported the interplay between p53 protein isoforms, resulting in the modulation of p53 tumor suppressor activity mainly through regulation of gene expression ( 2– 4, 7 ) .
Fig. 1. The human p53 protein isoforms. At least 12 p53 protein isoforms are expressed by the TP53 gene. Four N-truncated forms (TA, D 40, D 133, and D 160) can be combined to three distinct C-terminal forms ( a , b , and g ). As compared to the canoni-cal p53 protein (or TAp53 a ), the D 40 forms lack the transactivation domain I (TADI), while the D 133 and D 160 forms lack the entire TAD and part of the DNA-binding domain (DBD). In the C-terminus, the a forms contain an oligomerization domain (OD), whereas b and g forms include novel residues instead of the OD. By Western blotting, the detection of p53 protein isoforms is based on their individual molecular weight ( right panel ) and their distinct recognition pattern by a panel of monoclonal and polyclonal anti-p53 antibodies ( upper panel ). TAD: transactivation domain, blue ; PXXP: proline-rich domain, violet ; DBD: DNA-binding domain, orange ; NLS: nuclear localization signal, dark green ; OD: oligomerization domain, light green ; gray boxes : conserved domains; ATG: codon used to initiate each N-truncated p53 protein isoform; kDa: kilo Dalton, theoretical protein molecular weight; colored boxes : monoclonal and polyclonal anti-p53 antibodies; numbers within brackets : epitopes.
172 Detecting p53 Isoforms at Protein Level
Tabl
e 1
Pane
l of c
omm
erci
ally
and
non
-com
mer
cial
ly a
vaila
ble
prim
ary
antib
odie
s to
det
ect p
53 p
rote
in is
ofor
ms
(see
Not
e 9)
Spec
ies
Prim
ary
antib
ody
Sour
ce
Wes
tern
bl
ottin
g ( m
g/m
l) Im
mun
o-pr
ecip
itatio
n ( m
g)
Imm
unos
tain
ing
( m g/
ml)
Ex. s
uppl
ier/
cata
log
num
ber
Ref.
Hum
an
DO
-1
DO
-12
CM
1 SA
PU
KJC
8 M
AP4
-9
Mou
se
Mou
se
Rab
bit
Shee
p R
abbi
t R
abbi
t
1 5 1 1 1 3
5
5 5 5 10
nd
1 5 1 1 1 nd
Sant
a C
ruz
Bio
tech
nolo
gy/
sc-1
26
Con
vanc
e/SI
G-3
520
( 1, 8
)
( 1 )
( 1 )
( 3 )
Dro
soph
ila
anti-
Dm
p53
Poly
Ct
Rab
bit
Rab
bit
( 11 )
( 1
2 )
Zeb
ra fi s
h 5.
1 9.
1 M
ouse
M
ouse
( 1
3 )
( 13 )
nd n
ot d
eter
min
ed, e
x. e
xam
ple,
ref
. ref
eren
ce
18 V. Marcel et al.
The human p53 protein isoforms have been detected at endog-enous level in several human cell lines ( 1, 7, 8 ) . Using the current available antibodies (see Table 1 ), the detection of p53 isoforms is mainly based on the comparison of signal pattern given by a panel of antibodies, since p53 protein isoforms share a common amino-acid sequence and thus similar epitopes (see Fig. 1 ). For example, the detection of p53 protein isoforms by Western blotting is based on (1) a different reactivity to a panel of several antibodies recognizing dis-tinct epitopes and (2) a different electrophoresis motility (see Fig. 2a ). Interestingly, new antibodies have been developed to speci fi cally rec-ognize some subclasses of p53 protein isoforms. Such antibodies allow immunoprecipitation and immuno fl uo rescence experiments (i.e., MAP4-9 recognizes the D 133 forms, including D 133p53 a , D 133p53 b , and D 133p53 g ; KJC8 is speci fi c for the b forms, includ-ing TAp53 b , D 40p53 b , D 133p53 b , and D 160p53 b ) (see Figs. 1 and 2 ). In addition, it should be kept in mind that one could com-pare the expression levels of each p53 isoform only when the anti-body recognizes an identical epitope per isoform. The polyclonal antibodies (SAPU or CM1), which recognize epitopes in both N- and C-terminal p53 domains, do not detect the p53 isoforms with the same af fi nity since some isoforms lack the N- and/or the C-terminus.
The best described biochemical activity of p53 protein iso-forms is their ability to modulate p53 transcriptional activity, as described using luciferase reporter gene assays ( 1, 7, 9, 10 ) . However, luciferase reporter gene assays performed to assess the impact of one protein on the transcriptional activity of a second one, requires the user to establish appropriate experimental condi-tions. Of note, the activity of p53 isoform on transcription can be detected and quanti fi ed even at low expression level of p53 protein isoforms, below the detection threshold by Western blotting. This suggests that the p53 isoforms are potent regulators of p53 tran-scriptional activity in human cells (see Fig. 3 ) ( 1, 10 ) .
Detecting p53 isoforms at protein level remains to be improved, mainly by increasing the panel of antibodies speci fi c to p53 iso-forms. The development of these tools has been initiated with the generation of antibodies recognizing some subclasses of p53 iso-forms (i.e., KJC8 or MAP4.9) and has been extended to p53 iso-forms expressed in animal models, in particular, in Drosophila melanogaster and Danio rerio models (see Table 1 , Fig. 4 ) ( 5 ) .
1. NP40 extraction buffer: 50 mM Tris–HCL pH 7.5; 10% glycerol;
0.1% “NP-40 Alternative” (Calbiochem); 100 mM NaCl; 0.2 mM EDTA. Store at 4°C. The buffer is supplemented extemporane-ously with 1× Complete™ Protease Inhibitor Cocktail (Roche).
2. Materials
2.1. Western Blotting

192 Detecting p53 Isoforms at Protein Level
Fig. 2. Detection of human p53 protein isoforms. ( a ) Detection of ectopic p53 protein isoforms by Western blotting. p53-null H1299 cells were transfected with vectors expressing different p53 protein isoforms. Expression of ectopic p53 isoforms was veri fi ed by Western blotting using three different antibodies ( see Subheading 2 ). The interpretation of a Western blot for p53 isoform expression is based on (1) distinct migration pro fi le and (2) distinct recognition pattern given by several antibodies. For example, the band corresponding to p53 b protein isoform (1) is located at around 47 kDa and (2) is detected by both CM1 (all isoforms) and KJC8 ( b forms) but not by MAP4-9 ( D 133 forms). MTp53 D 60: truncated mutant p53 lacking the last 60 residues; Empty: empty-expression vector; kDa: kilo Dalton; §: D 40 forms; *: D 160 forms. ( b ) Detection of endogenous p53 protein isoforms by immunoprecipitation. Wild-type p53 MCF7 cells were used to immu-noprecipitate endogenous p53 b protein isoform using the rabbit polyclonal KJC8 antibody speci fi c for the b forms, then revealed by Western blotting using the sheep polyclonal SAPU antibody recognizing all p53 protein isoforms ( see Subheading 3 ). Immunoprecipitation of b forms allows a simple interpretation as compared to Western blotting. p53-null H1299 cells were used as negative control. Input: positive control (unprecipitated protein extract); IgG Rabbit: negative control (immunoprecipitation using nonspeci fi c antibody); KJC8-1/2: 2 different batches of puri fi ed KJC8 antibodies with distinct af fi nity for p53 b protein isoform.

20 V. Marcel et al.
2. 1× LDS buffer: dilution from the 4× stock solution NuPAGE ® LDS Sample Buffer (Invitrogen). Store at room temperature (see Note 1).
3. DTT 1 M: 1.54 g in a fi nal volume of 10 ml milli-Q water. Store at −20°C.
4. Electrophoresis components: XCell SureLock ® Mini-Cell Electrophoresis System
(Invitrogen). Pre-casted NuPAGE ® Novex ® 10% Bis-Tris Mini Gels
(Invitrogen). 1× Running buffer prepared from 20× NuPAGE ® MOPS SDS
Running Buffer (Invitrogen). NuPAGE ® Antioxidant (Invitrogen).
Fig. 3. Luciferase reporter gene assays to study the impact of p53 protein isoforms on p53 transcriptional activity. ( a ) Determination of the amount of p53 expression vector to transfect to obtain 50% of maximum promoter activity. The p53-null H1299 cells were co-transfected ( see Subheading 4 ) with (1) a constant amount of Fire fl y luciferase reporter plasmid driven by the promoter of interest, (2) a constant amount of the control Renilla luciferase reporter plasmid, driven by the SV40 promoter, and (3) an increasing amount of p53 expression vector balanced with the corresponding amount of Empty-expression vector. The Fire fl y luciferase activity driven by the p21 promoter is increased by a low amount of ectopic p53 protein barelly detectable by western blotting ( b ) and reaches a plateau starting from 2.5 ng of transfected p53 expression vector. To be able to detect either an increase or a decrease of p53 transcriptional activity on the p21 promoter, we transfected the amount of p53 expression vector that leads to 50% of maximum the p21 promoter activity (here, 1 ng of pcDNA3-p53 expression vector). Empty: Empty-expression vector; Ku80: loading control.
212 Detecting p53 Isoforms at Protein Level
5. Transfer components: Mini Trans-Blot ® Cell (Biorad). 1× Transfer buffer prepared from 10× Wet blot solution (144 g
glycine—30 g Tris-Base—in a fi nal volume of 1 L milli-Q water) supplemented with 20% methanol.
BA83 Protran ® Nitrocellulose Membrane (Whatman). 6. Immunoblotting components:
Wash solution-1: 1× PBS prepared using 10 Dulbecco “A” tablets in a fi nal volume of 1 L milli-Q water (Oxoid).
Wash solution-2: 1× PBS—0.1% Tween 20. Blocking solution: 5% nonfat milk—1× PBS—0.1% Tween 20. Primary antibodies are diluted in 5% milk—1× PBS—0.1%
Tween 20, stored at −20°C and used up to three times (Table 1 , Fig. 1 ).
Secondary Horse Radish Peroxidase (HRP)-conjugated antibodies (IgG) are purchased from Jackson Immuno
Fig. 4. p53 protein isoforms in animal models. The TP53 gene expresses several protein isoforms conserved in different animal models. Up until now, three p53 protein isoforms have been identi fi ed in Drosophila melanogaster and in Danio rerio (zebra fi sh) that correspond mainly to N-truncated p53 protein isoforms. Speci fi c antibodies have been developed to rec-ognize Drosophila and zebra fi sh p53 isoforms. TAD: transactivation domain, blue ; DBD: DNA-binding domain, orange ; OD: oligomerization domain, green ; gray box : residues not present in the other protein isoforms; D: Drosophila p53 protein; Z: zebra fi sh ( Danio rerio ) p53 protein; kDa: kilo Dalton, observed protein molecular weight; colored boxes : anti-p53 antibod-ies; Poly: polyclonal antibody; numbers within brackets : epitopes.
22 V. Marcel et al.
Research Laboratories, Inc., used at 1:10,000 dilution (in 5% milk—1× PBS—0.1% Tween 20). Dilutions are stored at −20°C and used only 1 time to improve detection.
7. Detection reagents: Amersham ECL™ Western Blotting Detection Reagents (GE
Healthcare). SuperSignal ® West Dura Extended Duration Substrate (Thermo
Scienti fi c). Amersham Hyper fi lm ECL (GE Healthcare).
1. Materials described in Subheading 2.1 . 2. RQ1 RNase-free DNase (Promega); RNase A (Qiagen). 3. Preparation of protein G coupled to beads : Dynabeads ® Protein
G (Invitrogen) according to the manufacturer’s protocol (“Washing/Preparation Dynabeads”).
1. Transfection reagents: FuGENE ® 6 Transfection Reagent (Roche). OptiMEM (Gibco™, Invitrogen).
2. Luciferase assays: White 96-well microplates (Greiner Bio-One). Dual Luciferase ® Reporter Assay System (Promega) (see Note 19).
1. Wash cells twice with cold 1× PBS, add about 100 m l of NP40 extraction buffer directly into dishes, keep on ice, and scrape off the cells with a cell scraper (see Notes 1 and 2).
2. Collect cell lysate into a tube, keep on ice (see Note 3). 3. Pass cell lysate at least fi ve times through a syringe with a 23 G
needle to fragment cell membranes (see Note 3). 4. Spin cell lysate for 10 min, 13,800 ́ g , at 4°C. 5. Conserve the supernatant in a fresh tube (see Note 3). 6. Determine protein concentration (see Note 4). 7. Prepare 10–30 m g of protein sample supplemented with 0.1 M
DTT and 1× LDS buffer (Invitrogen) (see Note 5). 8. Heat protein samples at 95°C for 5 min. 9. Load between 10 and 30 m g of protein sample per well on pre-
casted NuPAGE 10% Bis-Tris polyacrylamide gels (Invitrogen) and separate proteins using 1× MOPS Running Buffer
2.2. Immuno-precipitation
2.3. Luciferase Reporter Gene Assays
3. Methods
3.1. Western Blotting

232 Detecting p53 Isoforms at Protein Level
supplemented with 0.2% Antioxidant as described by the manufacturer (Invitrogen) at 80 V for 2–3 h (see Note 6).
10. Transfer proteins overnight (25 mA, 11 V, about 14 h) onto the nitrocellulose membrane using 1× Transfer buffer supple-mented with 20% methanol (see Note 7).
11. Block membrane with 5% nonfat milk—1× PBS—0.1% Tween 20 for 20 min by gentle shaking (see Note 8).
12. Place the membrane on the bench protected with a piece of saran fi lm and add directly the primary antibody onto the membrane (1 ml per 50 cm 2 ) (see Note 9).
13. Cover to avoid evaporation and incubate for 1 h (see Note 10). 14. Wash with 5% nonfat milk—1× PBS—0.1% Tween 20 for
10 min by gentle shaking. 15. Repeat steps 12 and 13 for the secondary antibody (see
Table 1 ). 16. Wash the membrane twice with 1× PBS—0.1% Tween 20 for
7 min, followed by an additional 7 min wash with 1× PBS. 17. Incubate membrane with Amersham ECL Western blotting
detection system (GE Healthcare) or with SuperSignal ® West Dura Extended Duration Substrate (Thermo Scienti fi c), according to the manufacturer’s recommendations, by directly adding the reagent onto the membrane placed on the bench (see Note 11).
18. Exposure time of Hyper fi lm to membrane varies according to the p53 protein isoform of interest (see Note 12).
19. Development (for example, using the Konica Medical Film Processor).
20. Analysis of p53 protein isoform expression (see Note 13) (see Fig. 2a ).
1. Seed cells at least 24 h prior to immunoprecipitation to obtain up to 80% con fl uent cells the day of harvest (e.g., 2 × 10 7 of MCF-7 cells in a 125 ml fl ask).
2. Wash cells twice with cold 1× PBS. 3. Add 3 ml of NP40 extraction buffer extemporaneously supple-
mented with 1× Complete Mini protease inhibitor and 1 mM DTT directly onto cells, keep on ice.
4. Scrape off cells from fl ask and leave fl ask to rock gently for 15 min at 4°C.
5. Transfer cell lysate to 5 ml tubes, keep in ice (see Note 3). 6. Syringe the cell lysate at least ten times through a 23 G needle
(see Note 3). 7. Transfer into several 1.5 ml tubes, keep in ice, and spin at
11,800 ́ g for 10 min at 4°C.
3.2. Immuno-precipitation
24 V. Marcel et al.
8. Aliquot 500 m l of supernatant per tube and treat with 10 U of DNase RQ (Promega) and 35 U of RNase A (Qiagen) for 20 min at room temperature on a rotating wheel (see Note 3).
9. Pre-clear the lysate by adding 50 m l of prepared protein G cou-pled to beads for 15 min at 4°C on a rotating wheel.
10. Using the magnet, transfer the lysate into a new tube (see Note 3). 11. Determine protein concentration (see Note 4). 12. Use 5 mg of total protein lysate concentrated in 1 ml per
immunoprecipitation (see Notes 14 and 15). 13. Add the required amount (suggested up to 10 m g) of primary
antibody to the total protein lysate and incubate for 2 h at 4°C on a rotating wheel (see Note 16) (see Table 1 ).
14. Add 100 m l of prepared protein G coupled to beads for 2 h at 4°C on a rotating wheel.
15. Using the magnet, discard the supernatant. 16. Wash beads four times with 500 m l of NP40 extraction buffer
extemporaneously supplemented with 1× Complete Mini pro-tease inhibitor using the magnet (see Note 17).
17. Wash beads twice with 500 m l 1× PBS using the magnet. 18. Suspend the beads in 20 m l of 1× LDS Buffer (Invitrogen) and
heat for 10 min at 70°C. 19. Using the magnet, transfer the supernatant in a fresh tube (see
Note 5). 20. Perform Western blot as described in Subheading 2.2 starting
from step 9 using the totality of protein samples. 21. Analysis of immunoprecipitation (see Note 18) (see Fig. 2b ).
1. Seed 3 × 10 4 cells per well in 24-well plates 24 h prior to trans-fection in a fi nal volume of 500 m l.
2. Prepare a mix of plasmids containing the amount of plasmids determined during the pre-experimental process of titration (see Fig. 3 ). For example, using the p21- luciferase reporter gene in p53-null H1299 cells, mix 2 ng/well of Renilla luciferase reporter plasmid, 200 ng/well of Fire fl y luciferase reporter plasmid, and 1 ng/well of expression vector (see Note 20).
3. Transfect plasmid mix using FuGENE ® 6 Transfection Reagent (Roche) with OptiMEM ® (Invitrogen) according to the man-ufacturer’s protocol (ratio FuGENE:DNA = 3:1) using a fi nal volume of 100 m L. Prior to transfection, replace media with 400 m L of fresh complete media.
4. Incubate cells under normal conditions for 24 h. 5. Wash cells twice with cold 1× PBS and measure luciferase activ-
ity as described by the manufacturer using 10 m L of the whole
3.3. Luciferase Reporter Gene Assays
252 Detecting p53 Isoforms at Protein Level
cell lysate and 30 m L of both luciferase substrates (5 s time delay and 10 s measurement, for example, using the Luminometer (EG&G BERTHOLD, Microplate Luminometer LB 96 V)).
6. Perform analysis (see Note 21).
1. Cells can be directly lysed in 1× LDS buffer (Invitrogen) instead of using the NP40 extraction buffer (no need for items 4 and 5 of Subheading 2.2 ). However, detection of p53 pro-tein isoforms can be less ef fi cient using this alternative extrac-tion method because of post-translational modi fi cations on some epitopes.
2. Use one volume of NP40 extraction buffer corresponding to cell con fl uence (i.e., add 80 m l of buffer onto 80% con fl uent cells).
3. Experiment can be stopped at this stage and samples can be stored at −80°C.
4. Different protocols can be used. We recommend the Qubit ® 2.0 Fluorometer (Invitrogen) using the Qubit Protein Assay (Invitrogen), which provides a sensible and accurate detection.
5. Experiment can be stopped at this stage and samples can be stored at −20°C.
6. Detection of p53 protein isoforms requires suf fi cient migra-tion to dissociate proteins with closed molecular weights (see Fig. 1 ). We recommend to stop the running process when the migration front has just dissolved in the lower buffer chamber (keep the 15 kDa band of the protein molecular weight marker in the gel).
7. Alternatively, transfer can be performed for 1 h 30 min at 200 mA at 4°C.
8. The blocking process may vary from 20 min to 1 h without any alteration of the detection.
9. Addition of antibodies directly onto the membrane, rather than using the classical “bath” process, limits antibody consumption and improves the immunoreaction. Usually, use 1 m g of anti-body per ml diluted in 5% milk—1× PBS—0.1% Tween 20.
10. Alternatively, membranes can be incubated within a bath of 5 ml primary antibody overnight at 4°C under gentle shaking.
11. In most cell lines, Amersham ECL Western blotting detection system (GE Healthcare) is suf fi cient to detect N-terminal TA
4. Notes
26 V. Marcel et al.
and D 40 forms (see Fig. 2a , CM1 antibody), while SuperSignal ® West Dura Extended Duration Substrate (Thermo Scienti fi c) is required to detect D 133 and D 160 forms (see Fig. 2a , MAP4-9 antibody).
12. Time of exposure using Amersham Hyper fi lm varies according to cell lines and to the p53 protein isoform of interest and has to be determined by the user. Exposure time may vary from 1 min to 1 h.
13. Regarding the analysis of p53 protein isoforms, the interpreta-tion of Western blotting is based on (a) the molecular weight and (b) the detection pattern of distinct antibodies (see Fig. 2a , e.g., p53 b at about 47 kDa and detected with CM1 (speci fi c for all isoforms) and KJC8 (speci fi c for b forms) but not with MAP4-9 (speci fi c for D 133 forms)). However, comparison of expression levels between p53 isoforms requires the use of an antibody, which recognizes an identical epitope, at a given time exposure using the same detection reagent (Fig. 2a , e.g., com-parison of p53 b and D 133p53 b expression levels using KJC8 ( b forms) but not CM1 (all isoforms)). To assess the speci fi city of the antibody, it is necessary to fi rst compare the detection of protein issued from cells transfected with vector expressing ectopic p53 and with an Empty-expression vector. Of note, internal initiations of translation have been described for TAp53 forms and D 133 forms leading to D 40 and D 160 forms, respectively ( 7, 8 ) . Thus, ectopic expression of TA and D 133 forms results in the detection of a doublet (see Fig. 2a ). The clear identi fi cation of a p53 protein isoform by Western blot-ting requires at least one of the following controls: (a) use of a panel of distinct antibodies; (b) loading of proteins extracted from cells transfected with p53 isoform expression vector; and (c) use of siRNA speci fi cally targeting p53 isoforms.
14. To immunoprecipitate p53 isoforms, 1–5 mg of total protein lysate is required and is prepared in a fi nal volume of 500–1,000 m l.
15. For each sample, use the same amount of protein extract to perform an immunoprecipitation using your antibody of inter-est and an immunoprecipitation using a control antibody (i.e., IgG mouse if the primary antibody of interest is a mouse anti-body, IgG rabbit if using a primary rabbit antibody, etc). About 50 m g of protein extract is stored at −80°C and used as the input control (see Fig. 2b ).
16. The amount of primary antibody varies according to the expression level of the p53 isoform of interest, the number of epitopes per isoform for one considered antibody, and the speci fi city of the antibody (see Table 1 , Fig. 1 ).
17. Do not add DTT at this step.
272 Detecting p53 Isoforms at Protein Level
18. If the right controls are performed, interpretation of immunoprecipitation is easier than the one of Western blotting since analysis is based only on the distinct molecular weight of p53 protein isoforms. Immunoprecipitation using two differ-ent anti-p53 antibodies is an ideal experiment to identify p53 isoforms. However, immunoprecipitation cannot be used to compare protein expression levels under different experimental conditions.
19. As compared to other reporter gene assays (i.e., Chloram-phenicol Acetyl Transferase assays), the luciferase reporter gene assay is highly recommended to study promoter activity since the luciferase enzymes have a short half-life, as well as a rapid enzymatic activity, and current luminometer kits allow the detection of small amounts of luciferase enzyme (from 10 −20 molecule).
20. The amount of plasmids (Basic luciferase, Fire fl y luciferase, Renilla luciferase, and expression vector) should be carefully predetermined prior to experimentation, because of the speci fi city of each cell line, each promoter, and each transcrip-tion factor. First, the amount of the promoterless Basic luciferase reporter plasmid, used to normalized the experi-ments (see Note 21), should not yield ten times more luciferase activity than the background light given by non-transfected cells. Second, the optimal amount of Fire fl y luciferase reporter plasmid driven by the promoter of interest should yield two to three times more luciferase activity than the promoterless Basic luciferase reporter plasmid. Third, the amount of Renilla luciferase reporter plasmid, which is driven by the constitutive promoter SV40, corresponds to 1/100 of the amount of Fire fl y luciferase reporter plasmid. We do not recommend the use of the thymidine kinase promoter as in internal control since it contains some p53 responsive elements. Finally, the amount of p53 expression vector should be carefully deter-mined. To study the regulation of p53 transcriptional activity on a promoter of interest, the experiment should be performed at 50% of the maximum promoter activity allowing thus the detection of both decreased and increased p53 transcriptional activity. Usually, a promoter activity in response to increasing amount of p53 has two phases (see Fig. 3 ): a “linear” phase, where the promoter activity is proportional to the amount of p53; and a “plateau” phase, corresponding to the maximal activity of a given promoter in response to p53. A titration experiment allows the determination of the amount of p53 expression vector to transfect to obtain 50% of maximum pro-moter activity. Importantly, it is crucial to balance the amount of p53 expression vector with the corresponding Empty-expression vector in order to transfect a constant amount of
28 V. Marcel et al.
DNA expression vector (e.g., pcDNA3-p53 + pcDNA3-Empty = 30 ng) (see Fig. 3 ).
21. Results of luciferase assays are usually presented as an average of at least three independent experiments performed in tripli-cate. In a fi rst step, each independent experiment should be carefully normalized. This “intra-”normalization using the Renilla luciferase activity avoids misinterpretation due to varia-tion in pipetting, transfection ef fi ciency, or cell death (Fire fl y/ Renilla ). In addition, each condition is expressed as a ratio compared to the promoterless Basic luciferase reporter plasmid ([Fire fl y/ Renilla ] condition1 /[Fire fl y/ Renilla ] Basic ). As for the “intra-”normalization, this “inter-”normalization avoids misinterpretation due to variation in cell passage, transfection ef fi ciency, etc. In a second step, average can be calculated from the normalized values. Important controls to consider are (1) “Basic” condition (co-transfection of promoterless Basic luciferase reporter plasmid and Empty-expression vector) to allow the “inter-”normalization; (2) “Empty” condition (co-transfection of the Fire fl y luciferase reporter plasmid and Empty-expression vector) to allow determination of the intrin-sic promoter activity and to be used as a negative control when an ectopic protein is co-expressed; (3) “Plateau” condition (co-transfection of the Fire fl y luciferase reporter plasmid with the amount of expression vector reaching the plateau of fold-activation, see Note 20) to be used as a positive control when an ectopic protein is co-expressed. Of note, when transfecting increasing amount of expression vector, the total amount of DNA corresponding to the expression vector should be kept constant by balancing with Empty-expression vector (e.g., pcDNA3-p53 + pcDNA3-Empty = 30 ng) (see Fig. 3 ).
Acknowledgments
This work was supported by Cancer Research UK (C8/A6613). V.M. is supported by Breast Cancer Campaign, M.P.K., K.F., A.D., and J.C.B. are supported by Cancer Research UK.
References
1. Bourdon J-C, Fernandes K, Murray-Zmijewski F, Liu G, Diot A, Xirodimas DP, Saville MK, Lane DP (2005) p53 isoforms can regulate p53 transcriptional activity. Genes Dev 19:2122–2137
2. Aoubala M, Murray-Zmijewski F, Khoury MP, Fernandes K, Perrier S, Bernard H, Prats AC,
Lane DP, Bourdon J-C (2011) p53 directly transactivates D 133p53 a , regulating cell fate outcome in response to DNA damage. Cell Death Differ 18:248–258
3. Fujita K, Mondal AM, Horikawa I, Nguyen GH, Kumamoto K, Sohn JJ, Bowman ED, Mathe EA, Schetter AJ, Pine SR, Ji H, Vojtesek
292 Detecting p53 Isoforms at Protein Level
B, Bourdon J-C, Lane DP, Harris CC (2009) p53 isoforms Delta133p53 and p53beta are endogenous regulators of replicative cellular senescence. Nat Cell Biol 11:1135–1142
4. Marcel V, Vijayakumar V, Fernandez-Cuesta L, Hafsi H, Sagne C, Hautefeuille A, Olivier M, Hainaut P (2010) p53 regulates the transcrip-tion of its Delta133p53 isoform through speci fi c response elements contained within the TP53 P2 internal promoter. Oncogene 29:2691–2700
5. Marcel V, Dichtel-Danjoy ML, Sagne C, Hafsi H, Ma D, Ortiz-Cuaran S, Olivier M, Hall J, Mollereau B, Hainaut P, Bourdon J-C (2011) Biological functions of p53 isoforms through evolution: lessons from animal and cellular models. Cell Death Differ 18(12):1815–24
6. Khoury MP, Bourdon J-C (2010) The iso-forms of the p53 protein. Cold Spring Harb Perspect Biol 2:a000927
7. Courtois S, Verhaegh G, North S, Luciani MG, Lassus P, Hibner U, Oren M, Hainaut P (2002) DeltaN-p53, a natural isoform of p53 lacking the fi rst transactivation domain, counteracts growth suppression by wild-type p53. Oncogene 21:6722–6728
8. Marcel V, Perrier S, Aoubala M, Ageorges S, Groves MJ, Diot A, Fernandes K, Tauro S,
Bourdon J-C (2010) D 160p53 is a novel N-terminal p53 isoform encoded by D 133p53 transcript. FEBS Lett 584:4463–4468
9. Yin Y, Stephen CW, Luciani MG, Fåhraeus R (2002) p53 stability and activity is regulated by Mdm2-mediated induction of alternative p53 translation products. Nat Cell Biol 4:462–467
10. Murray-Zmijewski F, Lane DP, Bourdon J-C (2006) p53/p63/p73 isoforms: an orchestra of isoforms to harmonise cell differentiation and response to stress. Cell Death Differ 13:962–972
11. Ollman M, Young JM, Di Como CJ, Karim F, Belvin M, Robertson S, Whittaker K, Demsky M, Fisher WW, Buchman A, Duyk G, Friedman L, Prives C, Kopczynski C (2000) Drosophila p53 is a structural and functional homolog of the tumor suppressor p53. Cell 101:91–101
12. Brodsky MH, Nordstrom W, Tsang G, Kwan E, Rubin GM, Abrams JM (2000) Drosophila p53 binds a damage response element at the reaper locus. Cell 101:103–113
13. Lee K-C, Goh WLP, Xu M, Kua N, Lunny D, Wong JS, Coomber D, Vojtesek B, Lane EB, Lane DP (2008) Detection of the p53 response in zebra fi sh embryos using new monoclonal antibodies. Oncogene 27:629–640
31
Sumitra Deb and Swati Palit Deb (eds.), p53 Protocols, Methods in Molecular Biology, vol. 962,DOI 10.1007/978-1-62703-236-0_3, © Springer Science+Business Media New York 2013
Chapter 3
Autophagy, Senescence, and Apoptosis
Rachel W. Goehe , Molly L. Bristol , Eden N. Wilson , and David A. Gewirtz
Abstract
This chapter presents methods for interrogating the involvement of p53 in signaling to apoptosis, autophagy, and senescence. The well-known association of p53 with the stress response to chemotherapy and radiation is the basis for presenting these approaches. The development of quantitative and ef fi cient in vitro assays has enabled researchers to overcome the limitations of previous methodologies. This chapter provides up-to-date procedures relating to the molecular networks in which the p53 protein has been shown to play a central role that allows damaged cells either to adapt to stress (autophagy and/or senes-cence) or to progress towards programmed cell death (apoptosis).
Key words: Apoptosis , Senescence , Autophagy , Flow cytometry , Western immunoblotting , Fluorescent microscopy , Acridine orange , b -Galactosidase , Annexin V , Propidium iodide
The p53 tumor suppressor pathway serves to protect genomic sta-bility and suppress tumor formation. Cellular stress can induce autophagy in a p53-dependent manner; however, p53 can play dual roles in the control of autophagy. Whereas nuclear p53 can induce autophagy through transcriptional effects, cytoplasmic p53 may act as a repressor of autophagy ( 1 ) .
Autophagy re fl ects a cellular response to stress in which cyto-plasmic constituents, including organelles, are sequestered into double-membraned autophagosomes, which subsequently fuse with lysosomes, allowing for degradation of the sequestered com-ponents to generate energy and metabolic precursors; accordingly, there is evidence that autophagy can serve either as a cytoprotec-tive or cytotoxic mechanism, depending on the cells and the nature of the stress-promoting challenge ( 2– 6 ) .
1. Introduction
1.1. p53 and Autophagy

32 R.W. Goehe et al.
Standard methods utilized for detection of autophagy include conventional electron microscopy for assessing the appearance of double-membraned autophagosomes that encapsulate various cytoplasmic components as well as acridine orange staining of acidic vacuoles. In addition, the molecular basis of autophagosome formation and degradation provides useful marker proteins for monitoring autophagic activity ( 7 ) .
The p53 protein, also known as the guardian of the genome, is a transcription factor which plays a role in DNA damage, cellular senescence, cell cycle progression, and, when damage is irrepara-ble, executing cell death ( 8– 10 ) . With regard to cellular senes-cence, p53-dependent senescence is triggered by a wide spectrum of stimuli. In normal cells, replicative senescence is associated with telomere shortening, which limits their proliferative potential. In addition, non-telomeric signals, such as DNA damage (stress-induced senescence—SIS), oncogenic signaling (oncogene-induced senescence—OIS), oxidative stress, HDAC inhibitors, and deple-tion of heat shock proteins have all been found to induce p53-dependent senescence ( 11– 13 ) . Since p53-induced senescence is a route taken by cells to escape malignancy, understanding how p53 exerts these activities is of utmost importance.
In this chapter, we describe methods for studying p53-mediated senescence. Until recently, the most well-known methods to ana-lyze senescence have been beta-galactosidase staining and western immunoblotting for “key players” in the senescent state. Here, we describe the common methods along with a more updated fl ow cytometric assay for the measurement of p53-mediated senescent activity. With the use of a fl uorescently labeled p53 construct (GFP, RFP), the exongenously labeled versus non-transfected p53 pro-tein can be detected by fl ow cytometry. The extent of p53-induced senescence is determined by the detection of senescence-associated beta-galactosidase (SA- b gal) activity using fl ow cytometry.
Apoptosis is a caspase-dependent programmed cell death pathway ( 14 ) . It is a normal physiological process that occurs during cellu-lar development and serves to maintain cellular homeostasis and protect against abnormal cell division ( 15 ) . It can also be activated following extreme cellular stress conditions. Morphological fea-tures include cell shrinkage, membrane blebbing, and nuclear frag-mentation ( 16 ) .
Apoptosis is regulated by many genes, one of which is p53. P53-dependent apoptosis can occur in response to cellular stres-sors such as DNA damage or hypoxia ( 17 ) . Upon activation, p53 activates genes which are involved in both extrinsic and intrinsic apoptotic pathways ( 18 ) . Both pathways result in the cleavage of caspases and subsequent cell death.
1.2. p53 and Senescence
1.3. p53 and Apoptosis

333 Autophagy, Senescence, and Apoptosis
There are numerous assays to measure apoptosis. These include visualizing nuclear morphology by 4 ¢ ,6-diamidino-2-phenylindole (DAPI) staining, DNA fragmentation by terminal deoxynucleoti-dyl transferase-mediated dUTP nick end labeling (TUNEL), cell cycle analysis for the percentage of cells in the sub-G1 population, western blot analysis for cleavage of caspase-3 or PARP, and fl uorescence-activated cell sorting (FACS) analysis for the apopto-sis marker phosphotidylserine using annexin V, which is frequently coupled with propidium iodide. In-depth protocols for apoptosis detection are described below.
1. Permanox Petri dishes. 2. Phosphate-buffered saline (PBS ). 3. 0.1 M sodium cacodylate buffer, pH 7.4. 4. 2% Paraformaldehyde/2% glutaraldehyde in 0.1 M sodium
cacodylate buffer. 5. 1% Osmium tetroxide in 0.1 M cacodylate buffer. 6. Graded ethanol series: 50%, 70%, 80%, 95%, 100%. 7. Propylene oxide (3×). 8. PolyBed 812 resin (Polysciences, Inc.). 9. 50/50 Mix of propylene oxide and PolyBed 812 resin. 10. Leica EM UC6i Ultramicrotome (Lecia Microsystems). 11. Hexagonal Grids, Copper. 12. 5% Uranyl acetate and Reynold’s lead citrate. 13. JEOL JEN-1230 transmission electron microscopy (TEM)
(JEOL USA, Inc.). 14. Gatan Ultrascan 4000 digital camera (Gatan Inc., Pleasanton,
CA).
1. Cells and suitable medium, serum, and other relevant supple-ments (depending on the cell system of choice).
2. Trypsin solution (0.02% ethylenediamine tetraacetic acid [EDTA], 0.25% trypsin) for the dissociation of cells from the culture substrate.
3. 0.1 m g/mL acridine orange (Invitrogen, cat. no. A-3568). 4. Fluorescence microscope (e.g., Olympus) or similar microscope.
2. Materials
2.1. p53 and Autophagy
2.1.1. Detection of Autophagic Cells by Transmission Electron Microscopy
2.1.2. Detection of Autophagic Cells by Acridine Orange Staining

34 R.W. Goehe et al.
1. Cells and suitable medium, serum, and other relevant supplements (depending on the cell system of choice).
2. Trypsin solution (0.02% EDTA, 0.25% trypsin) for the disso-ciation of cells from the culture substrate.
3. Phosphate buffer solution. 4. Tissue culture grade dishes. 5. Acridine orange staining solution (Invitrogen, cat. no. A3568). 6. 5 mL Polystyrene round-bottom tubes with cell-strainer cap
for the use of the fl ow cytometer (BD Falcon, cat. no. 352235). Note : For cell types that do not “clump,” purchase tubes with-out the cell strainer (BD Falcon, cat. no. 352058).
7. Flow cytometer (e.g., FACSCalibur (Becton Dickinson) or FC500 MPL (Beckman Coulter)) or a similar fl ow cytometer. Appropriate software for analysis (e.g., Cellquest (Becton Dickinson)).
1. Lysing reagent, e.g., RIPA Buffer; M-PER mammalian protein extraction reagent (Thermo Scienti fi c #78501).
2. Protease Inhibitor Cocktail (Roche, 11836145001). 3. Phosphatase Inhibitor Cocktail (Sigma, cat. no. 040M4005). 4. Bovine serum albumin (BSA): Albumin Standard (2 mg/mL,
PIERCE, cat. no. 23210). 5. Lowry reagents: Solution A: 2% sodium carbonate (FW: 106,
Sigma, cat. no. S-6139) in 0.1 M NaOH; Solution B: 1% cupric sulfate (FW: 249.7, CuSO 4 ·5H 2 ); Solution C: 2% potassium sodium tartrate (Na-K Tartrate, FW: 282.2); Solution D: (Solution A + B + C:A:B:C = 100:1:1); Solution E: Folin phenol (folin and ciocalteu’s phenol reagent, Sigma, cat. no. F-9252) diluted 1:1 with dH 2 O.
6. Standard loading buffer (5×): (60 mM Tris-base (pH 6.8), 25% glycerol, 2% SDS, 14.4 mM 2-mercaptoethanol, 0.1% bromophenol blue).
7. Benchmark pre-stained molecular weight standard (Invitrogen). 8. Long Shelf Life Precast Gels for use with Tris/Glycine Buffers
(Mini-PROTEAN TGX, 4–15%, 10-well comb, 30 m L, BIO-RAD).
9. BIO-RAD Western Apparatus. 10. Western Blot Running Buffer: 25 mM Tris-base, 190 mM gly-
cine, 0.1% SDS. 11. Nitrocellulose membranes. 12. Western blot transfer buffer: 0.025 M Tris, 0.192 M glycine,
and 20% methanol.
2.1.3. Quanti fi cation of Acridine Orange Stained Cell via FACS Analysis
2.1.4. Autophagic Initiation and Flux by Western Immunoblotting Analysis
353 Autophagy, Senescence, and Apoptosis
13. Tris buffered saline (TBS; 10×): 1.5 M NaCl, 0.1 M Tris–HCl, pH 7.4.
14. TBS containing 0.05% Tween-20 (TPBST). 15. Blocking solution: 5% milk in TPBST. Store at 4°C. 16. Plastic container. 17. Immunoblotting components: Carry out all procedures at
room temperature unless otherwise. 18. Primary antibodies used: anti-p62 (SQSTM1) (Santa Cruz,
cat. no. sc-28359) anti-LC3 (Novus Biologicals, cat. no. NB100-2220).
1. Cells and suitable medium, serum, and other relevant supple-ments (depending on the cell system of choice).
2. Tissue culture grade dishes (92 mm). 3. Trypsin solution (0.02% EDTA, 0.25% trypsin) for the disso-
ciation of cells from the culture substrate. 4. Fixing buffer components:
(a) Formaldehyde. (b) Glutaraldehyde.
5. Phosphate-buffered saline (PBS). 6. Staining buffer components:
(a) Citric acid/Sodium phosphate buffer, pH 6.0. (b) Potassium ferrocyanide. (c) Potassium ferricyanide. (d) Sodium Chloride. (e) Magnesium Chloride. (f) X-gal. (g) Dimethylformamide.
1. Cells and suitable medium, serum, and other relevant supple-ments (depending on the cell system of choice).
2. Tissue culture grade dishes (92 mm). 3. Trypsin solution (0.02% EDTA, 0.25% trypsin) for the disso-
ciation of cells from the culture substrate. 4. Transfection reagent such as Effectene (Qiagen, cat. no. 301425)
or Lipofectamine (Life Technologies, cat. no. 18292-011). 5. 15 mL high-clarity polypropylene conical centrifuge tubes for
centrifugation. 6. 5 mL polystyrene round-bottom tubes with cell-strainer cap
for the use of the fl ow cytometer (BD Falcon, cat. no. 352235). Note : For cell types that do not “clump,” purchase tubes with-out the cell strainer (BD Falcon, cat. no. 352058).
2.2. p53 and Senescence
2.2.1. Measurement of Senescence-Associated Beta-Galactosidase Activity by Beta-Galactosidase Staining
2.2.2. Measurement of Senescence-Associated Beta-Galactosidase Activity by FACS Analysis

36 R.W. Goehe et al.
7. Phosphate-buffered saline (PBS). 8. Ba fi lomycin A1 (Sigma, cat. no. B1793) Caution ! Irritant. It is
recommended that one wears suitable protective clothing (e.g., gloves, lab coat, goggles) when handling the solution. Use a fume hood.
9. C 12 FDG (Molecular Probes, Invitrogen, cat. no. D-2893). This is a b -galactosidase substrate which has been covalently modi fi ed to include a 12-carbon lipophilic moiety. Once the substrate is in the cells, it is cleaved by b -galactosidase produc-ing a fl uorescent product that is well-retained by the cells.
10. Flow cytometer (e.g., FACSCalibur (Becton Dickinson) or FC500 MPL (Beckman Coulter)) or a similar fl ow cytometer. Appropriate software for analysis (e.g., Cellquest (Becton Dickinson)).
1. Cells and suitable medium, serum, and other relevant supple-ments (depending on the cell system of choice).
2. Tissue culture grade dishes (92 mm). 3. Trypsin solution (0.02% EDTA, 0.25% trypsin) for the disso-
ciation of cells from the culture substrate. 4. Chamber slides. 5. Phosphate-buffered saline (PBS). 6. Ba fi lomycin A1 (Sigma, cat. no. B1793) Caution ! Irritant. It is
recommended you wear suitable protective clothing (e.g., gloves, lab coat, goggles) when handling the solution. Use a fume hood.
7. C 12 FDG (Molecular Probes, Invitrogen, cat. no. D-2893). This is a b -galactosidase substrate which has been covalently modi fi ed to include a 12-carbon lipophilic moiety. Once the substrate is in the cells, it is cleaved by b -galactosidase produc-ing a fl uorescent product that is well-retained by the cells.
8. Triton X-100 (Invitrogen, cat. no. HFH-10) Caution ! Harmful. It is recommended you wear suitable protective clothing (e.g., gloves, lab coat, goggles) when handling the solution.
9. BSA (Fisher Scienti fi c, cat. no. BP1600100). 10. ProLong Gold anti-fade mounting medium (Invitrogen, cat.
no. P36934). 11. Coverslips (Corning, cat. no. 2740-225).
1. In situ Cell Death Detection kit (Roche, cat. no. 11373242910, 033335660001).
2. Phosphate buffered saline. 3. DAPI. 4. 1 mg/mL BSA in PBS. 5. Cold ethanol. 6. Cold acetic acid.
2.2.3. Measurement of SA- b -Gal Activity by Fluorescent Microscopy
2.3. p53 and Apoptosis
2.3.1. Terminal Deoxynucleotidyl TUNEL/DAPI Assay for Apoptosis

373 Autophagy, Senescence, and Apoptosis
7. Vectashield. 8. 4% Formaldehyde in PBS. 9. Glass slides. 10. Coverslips. 11. Immunopen (Calbiochem, cat. no. 402176). 12. Humidi fi ed chamber. 13. Aluminum foil.
1. 70% Cold ethanol. 2. Phosphate buffered saline. 3. 1 mg/mL Propidium Iodide. Caution ! Light sensitive. Vial
should be protected from light and stored at 4°C (Sigma, cat. no. 81845).
4. DNase-free RNase A. 5. 0.1% Triton X-100 in PBS (v/v). 6. Flow tubes (BD Falcon, cat. no. 352235).
1. Annexin V-FITC (BD Pharmingen, cat. no. 556420). 2. Propidium Iodide at a 10 m g/mL stock solution (BD
Pharmingen, cat. no. 556463). 3. Phosphate buffered saline. 4. Flow tubes.
1. Plate approximately 1 × 10 5 cells on Permanox Petri dishes. 2. Perform desired treatments to promote autophagy. 3. At selected times, wash cells with 1× PBS and then fi x cells
with 2% paraformaldehyde/2% glutaraldehyde in 0.1 M sodium cacodylate buffer. Caution! Irritant. It is recommended you wear suitable protective clothing (e.g., gloves, lab coat, goggles) when handling the solution. Use a fume hood.
4. After 1 h at room temperature, remove fi xative and replace with 0.1 M sodium cacodylate buffer, pH 7.4.
5. Fix plates in 1% osmium tetroxide in 0.1 M cacodylate buffer for 1 h, after which they are rinsed in 0.1 M cacodylate buffer for 5–10 min.
6. Plates are then dehydrated in graded ethanol series: 50%, 70%, 80%, and 95% for 5–10 min each.
7. Plates are dehydrated in 100% ethanol 3×, 10–15 min each, followed by propylene oxide 3×, 10–15 min each.
2.3.2. Cell Cycle Analysis by Propidium Iodide Staining
2.3.3. FACS Analysis for Annexin V and Propidium Iodide Positive Cells to Monitor Apoptosis and Necrosis
3. Methods
3.1. p53 and Autophagy
3.1.1. Detection of Autophagic Cells by TEM
38 R.W. Goehe et al.
8. In fi ltrate cells with 50/50 mix of propylene oxide and PolyBed 812 resin mix; leave overnight.
9. Cells are in fi ltrated with pure PolyBed 812 resin (Polysciences, Inc.) mix; leave overnight.
10. Place cells in embedding molds containing PolyBed 812 and allow to polymerize overnight in a 60°C oven.
11. Sectioning is performed using a Leica EM UC6i Ultramicro-tome (Leica Microsystems) or similar system. For electron microscopy, 70–90 nm thick sections are collected on copper mesh grids and stained with 5% uranyl acetate and Reynold’s lead citrate. Images are captured using a JEOL JEM-1230 TEM (JEOL USA, Inc.) with Gatan Ultrascan 4000 digital camera (Gatan Inc, Pleasanton, CA).
As a marker of autophagy, the volume of the cellular acidic com-partment can be visualized by acridine orange staining ( 19 ) as demonstrated in Fig. 1 .
1. Cells are harvested from culture and 1 × 10 5 cells are plated per well in six-well tissue culture dishes and treated with agents of interest.
2. At various time points following treatment, cells are incubated with medium containing 0.1 m g/mL acridine orange for 15 min at 37°C; the acridine orange is removed, cells are washed once with PBS, fresh medium is added, and fl uorescent micrographs are taken using an Olympus inverted fl uorescence microscope. The number of cells with increased acidic vesicular
3.1.2. Detection of Autophagic Cells by Acridine Orange Staining
Fig. 1. Tamoxifen induces acidic vesicular organelles in MCF7 cells. MCF7 cells were exposed to Tamoxifen (2.5 m M) for 4 days and stained with acridine orange. Examples of acridine orange staining associated with autophagy can be found in Goehe et al (2012) The autophagy-senescence connection in chemotherapy; must tumor cells (self) eat before they sleep? J Pharm Exp Ther.
393 Autophagy, Senescence, and Apoptosis
organelles is determined by counting all vesicles per cell in at least three representative fi elds per treatment condition. Caution! Light Sensitive. Be sure to perform staining in the dark and protect plates from light.
In addition to visualizing cells with acridine orange by a fl uorescence microscope, the measurement of the acidic component can also be quantitatively measured by FACS analysis ( 19, 20 ) . This protocol identi fi es the intensity of the red (FL-1) fl uorescence in compari-son to the intensity of the green (FL-3) fl uorescence. Cells under-going autophagy will fl uoresce with an intense red or orange color; alternatively, cells not undergoing autophagy will demonstrate low red and green intensity levels. Green fl uorescence indicates unacidi fi ed compartments.
1. Cells are plated at a semi-con fl uent density (~50%), 24 h before transfection and incubated at 37°C, 5% CO 2 .
2. Treatments of choice plus a positive (e.g., serum starvation) and negative (e.g., Ba fi lomycin) control.
3. Once treatments are completed, remove the solution and wash the cell monolayers twice with PBS at RT.
4. Harvest the cells by trypsinization. 5. Pellet the cells by centrifuging at 1,000 rpm in a tabletop cen-
trifuge for 5 min at 4°C. 6. Discard the supernatant and resuspend cells in either medium or
PBS at a concentration of ~1 × 10 6 cells/mL. It should be noted that a minimum of 0.4 mL cell suspension is required for analysis.
7. Add acridine orange to the cell suspensions at a fi nal dilution of 1:10,000.
8. Immediately run the cell suspension in a BD Canto or similar fl ow cytometer. Acquire and analyze the data using FCS Express or similar software.
9. Data processing to analysis acridine orange staining: on a two-parameter display of FSC versus SSC set up an analysis region that excludes dead cells and subcellular debris. Depict the events within this region in a histogram where the y -axis indi-cates green fl uorescence intensity (FL-1) and the x -axis indi-cates red fl uorescence intensity (FL-3). On this histogram, estimate the intensity of the red fl uorescence (compared with positive, negative, and control vehicle cells) using the mean fl uorescence intensity (MFI) of the population.
LC3 is a novel marker for autophagy. Newly synthesized LC3 is immediately processed by mammalian Atg4 and is present in the cytosol as LC3-I. When autophagy is induced, LC3-I is converted into LC3-II, which migrates faster on SDS-PAGE ( 7 ) . Alternatively,
3.1.3. Quanti fi cation of Acridine Orange Stained Cell via FACS Analysis
3.1.4. Autophagic Initiation and Flux by Western Immunoblotting Analysis
40 R.W. Goehe et al.
it is now recognized that although autophagosome formation is a necessary component of the autophagic process, autophagosome formation can occur without completion of autophagy and degra-dation of the autophagosomal content; consequently, it becomes necessary to also assess autophagic fl ux ( 21 ) . To evaluate autophagic fl ux, levels of the p62 protein are monitored by Western blotting. As a positive control, a decline in p62 levels is typically evident when the cells are serum starved.
1. Protein Isolation (a) Cells are typically plated at a density of 50,000–
100,000 cells per 10 cm tissue culture dish. (b) After the indicated treatments and at appropriate time
points, media is aspirated, 1.5 mL cold 1× PBS added per fl ask, cells are scraped from the surface of the fl ask, and transferred to microfuge tube.
(c) Spin 1 min at 13,000 rpm to pellet cells. (d) Aspirate PBS and lyse using 100–500 m L lysing reagent
(e.g., RIPA Buffer containing protease and phosphatase inhibitors).
(e) Vortex to dislodge pellet and boil at 95–100°C for 5 min. (f ) Place cells on ice. Sonicate on ice for 18 s to shear DNA
then centrifuge for 10 min at 10,000 rpm at 4°C. Transfer supernatant to new microfuge tube and store at −80°C until day of western.
2. Lowry Assay for Protein Concentration (a) Protein concentrations are determined by the Lowry
method ( 22 ) . Dilutions of isolated proteins are compared to a standard curve using various doses of BSA. Absorbance at 750 m m is then determined using an Ultraspec 300 UV/Visible Spectrophotometer.
3. Electrophoresis (a) Concentrations determined by the Lowry assay allow for
equal aliquots of protein (35–50 m g) added to 5× sample buffer (60 mM Tris-base (pH 6.8), 25% glycerol, 2% SDS, 14.4 mM 2-mercaptoethanol, 0.1% bromophenol blue) and diluted to equal volumes (30 m l) water.
(b) The samples are then loaded onto a polyacrylamide gel and separated using SDS-PAGE running buffer for 0.5–2 h with 60 milliamps constant current.
(c) Proteins are then transferred onto a nitrocellulose mem-brane electrophoretically for 1 h at 100 V in transfer buf-fer at 4°C.
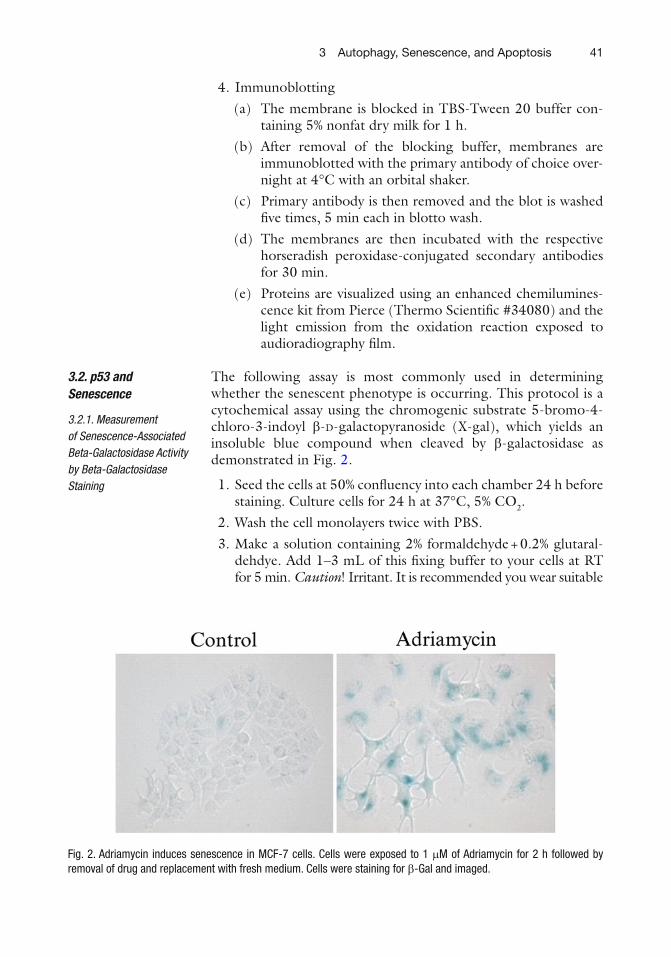
413 Autophagy, Senescence, and Apoptosis
4. Immunoblotting (a) The membrane is blocked in TBS-Tween 20 buffer con-
taining 5% nonfat dry milk for 1 h. (b) After removal of the blocking buffer, membranes are
immunoblotted with the primary antibody of choice over-night at 4°C with an orbital shaker.
(c) Primary antibody is then removed and the blot is washed fi ve times, 5 min each in blotto wash.
(d) The membranes are then incubated with the respective horseradish peroxidase-conjugated secondary antibodies for 30 min.
(e) Proteins are visualized using an enhanced chemilumines-cence kit from Pierce (Thermo Scienti fi c #34080) and the light emission from the oxidation reaction exposed to audioradiography fi lm.
The following assay is most commonly used in determining whether the senescent phenotype is occurring. This protocol is a cytochemical assay using the chromogenic substrate 5-bromo-4-chloro-3-indoyl b - D -galactopyranoside (X-gal), which yields an insoluble blue compound when cleaved by b -galactosidase as demonstrated in Fig. 2 .
1. Seed the cells at 50% con fl uency into each chamber 24 h before staining. Culture cells for 24 h at 37°C, 5% CO 2 .
2. Wash the cell monolayers twice with PBS. 3. Make a solution containing 2% formaldehyde + 0.2% glutaral-
dehdye. Add 1–3 mL of this fi xing buffer to your cells at RT for 5 min. Caution ! Irritant. It is recommended you wear suitable
3.2. p53 and Senescence
3.2.1. Measurement of Senescence-Associated Beta-Galactosidase Activity by Beta-Galactosidase Staining
Fig. 2. Adriamycin induces senescence in MCF-7 cells. Cells were exposed to 1 m M of Adriamycin for 2 h followed by removal of drug and replacement with fresh medium. Cells were staining for b -Gal and imaged.
42 R.W. Goehe et al.
protective clothing (e.g. gloves, lab coat, goggles) when han-dling the solution. Use a fume hood.
4. Wash the cell monolayers twice with PBS. 5. Add 1–3 mL of staining buffer to the cells 37°C for 2–24 h. If
the cells are undergoing senescence a blue color will be detect-able. The time frame for development of senescence is differ-ent for each cell system. Staining buffer: (a) 20 mg/mL X-gal in dimethylformamide (b) 0.2 M citric acid/sodium phosphate buffer at pH 6.0 (c) 100 mM potassium ferrocyanide (d) 100 mM potassium ferricyanide (e) 5 M sodium chloride (f) 1 M magnesium chloride (g) H 2 O
6. After incubation, wash staining solution off cell monolayers and replace with PBS. Store at 4°C.
7. Visualize cells underneath an electron microscope.
Replicative senescence is a phenomenon which occurs naturally in multicellular organisms when diploid cells are no longer able to divide due to the shortening of telomeres. DNA damage and onco-genic signaling can induce SIS or OIS, respectively. The senescent phenotype is characterized by morphological and biochemical fea-tures that include an enlarged cell size, fl attened morphology, the inability to synthesize DNA, and expression of senescence-associated b -galactosidase (SA- b -gal) ( 23, 24 ) . SA- b -gal activity has been reported to re fl ect an increase in lysosomal enzyme ( 25 ) . Since acidic SA- b -gal activity is detected at pH 4.0, we take advantage of the inhibitors Chloroquine and Ba fi lomycin A1 to induce lyso-somal alkalization. Chloroquine is a weak base that concentrates in lysosomes, raising the pH to approximately 6 ( 26– 28 ) . Ba fi lomycin A1 is a speci fi c inhibitor of vacuolar-type H+-ATPase and inhibits lysosomal acidi fi cation ( 29 ) . Cells are incubated with C 12 FDG, a substrate of b -gal that fl uoresces upon hydrolysis.
p53-transfected cells can be detected by anti-p53 antibodies or by a tag, such as green fl uorescent protein (GFP). In the following section, we describe the senescence-associated beta-galactosidase activity (SA- b gal) by fl ow cytometry following transient transfec-tion with a GFP-p53 plasmid. The use of naturally fl uorescent pro-teins, such as GFP, avoids the potential problem of background staining and saves time and reduces the costs of reagents.
1. Plate cells at a semi-con fl uent density (~50%), 24 h before transfection and incubate at 37°C, 5% CO 2 .
2. Transfect cells with p53 expression plasmid (between 0.5 m g and 1 m g/sample). Transfection reagents such as Lipofectamine
3.2.2. Measurement of Senescence-Associated Beta-Galactosidase Activity by FACS Analysis
433 Autophagy, Senescence, and Apoptosis
or Effectene, which tend to not cause much cell death and yet achieve high ef fi ciency, are suitable. The use of electroporation is not suitable because of the high levels of cell death resulting from the transfection process.
3. Optional : At 24–72 h post-transfection, induce lysosomal alka-linization by pretreating subcon fl uent cells with 100 nM Ba fi lomycin A1 for 1 h in fresh cell culture medium at 37°C, 5% CO 2 . Caution ! Irritant. It is recommended you wear suit-able protective clothing (e.g., gloves, lab coat, goggles) when handling the solution. Use a fume hood.
4. After 1 h, add C 12 FDG to the cell culture medium to a fi nal concentration of 30 m M and continue to incubate for 1–2 h at 37°C, 5% CO 2 .
5. Remove the solution and wash the cell monolayers twice with PBS at RT.
6. Harvest the cells by trypsinization. 7. Pellet the cells by centrifuging at 1,000 rpm in a tabletop cen-
trifuge for 5 min at 4°C. 8. Discard the supernatant and resuspend cells in ice-cold PBS at
a concentration of ~1 × 10 6 cells/mL. It should be noted that a minimum of 0.4 mL cell suspension is required for analysis.
9. Immediately run the cell suspension in a BD Canto or similar fl ow cytometer. Acquire and analyze the data using FCS Express or similar software.
10. Data processing to estimate relative b gal activity: on a two-parameter display of FSC versus SSC set up an analysis region that excludes dead cells and subcellular debris. Depict the events within this region in a green fl uorescence histogram where the y -axis indicates cell number and the x -axis indicates C12- fl uorescein fl uorescence intensity in log scale. On this his-togram, estimate the relative b -galactosidase activity (com-pared with positive or negative control cells) using the MFI of the population.
In addition to using C 12 FDG for b -gal via FACS, it is also a suitable fl uorescent substrate for fl uorescence microscopy.
1. Depending on the chamber slides used, seed the cells at 50% con fl uency into each changer 24 h before staining. Culture cells for 24 h at 37°C, 5% CO 2 .
2. To induce lysosomal alkalinization, remove the culture medium and pretreat cells with 100 nM ba fi lomycin A1 for 1 h in fresh cell culture medium at 37°C, 5% CO 2 .
3. After 1 h incubation with ba fi lomycin A1, add C 12 FDG to the cell culture medium to give a fi nal concentration of 30 m M and continue to incubate for 1–2 h at 37°C, 5% CO 2 .
3.2.3. Measurement of SA- b -Gal Activity by Fluorescent Microscopy
44 R.W. Goehe et al.
4. After 1–2 h, remove the solution and wash the cell monolayers twice with PBS at RT.
5. Permeabilize the cells in 1% (v/v) Triton X-100 for 5 min at RT. Caution ! Harmful. It is recommended you wear suitable protective clothing (e.g., gloves, lab coat, goggles) when han-dling the solution.
6. Remove the Triton X-100 solution and wash the cells twice with 2–4% (w/v) BSA at RT.
7. Mount the cells onto the slides by dispensing a drop (~25 m L) of ProLong Gold anti-fade reagent containing DAPI mount-ing media onto the slides. Add coverslips and allow the mount-ing medium to disperse over the entire slide.
8. Observe with a confocal microscope, such as Leica.
The TUNEL assay uses a terminal transferase (TdT) to label free 3 ¢ OH ends in genomic DNA with fl uorescein-dUTP. Upon labeling, cells with free 3 ¢ OH ends will fl uorescence green and can be visualized using a fl uorescence microscope as demon-strated in Fig. 3a .
1. Treated cells are harvested (both adherent and in suspension). Approximately 20,000 cells should be collected for each treatment.
2. Transfer harvested cells to glass slides by cytospin. 3. Cells are then washed in PSB for 5 min. 4. Fix cells with 4% formaldehyde in PBS for 10 min at RT. 5. Wash slides two times for 5 min each with PBS. 6. Fix cells with a 1:2 dilution of cold acetic acid in ethanol for
5 min at RT. 7. Wash slides two times for 5 min with PBS. 8. Using an immunopen, draw a tight circle around the cells to
contain solutions. 9. Block with BSA for 30 min at RT (50–100 m L BSA per slide).
Blocking should be performed in a humidi fi ed chamber cov-ered with aluminum foil.
10. Wash slides two times for 5 min with PBS. 11. Stain slides with Roche enzyme mixture (see below) for 1 h at
37°C. Caution ! Light Sensitive. Be sure to perform staining in the dark and protect slides from light. (a) Note : For ten slides, prepare a staining solution containing
40 m L of 5× reaction buffer, 2 m L of terminal transferase, 20 m L of 25 nM CoCL 2 , 124 m L of H 2 O, and 4 m L of Fluorescein-12-dUTP which should be added last. Per slide, 20 m L of the staining solution should be added.
3.3. p53 and Apoptosis
3.3.1. Terminal Deoxynucleotidyl TUNEL/DAPI Assay for Apoptosis
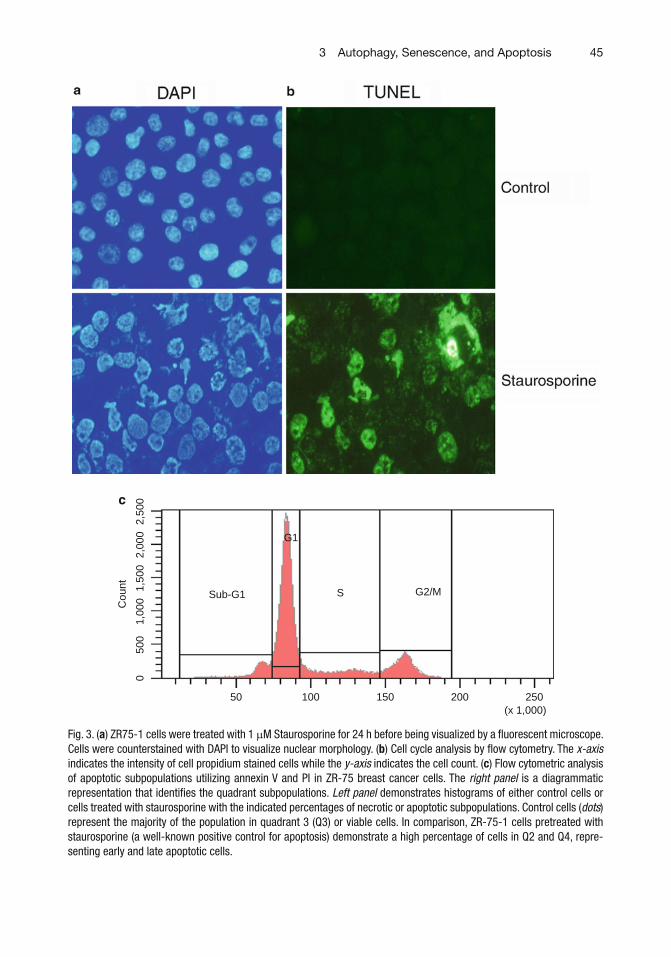
453 Autophagy, Senescence, and Apoptosis
Fig. 3. ( a ) ZR75-1 cells were treated with 1 m M Staurosporine for 24 h before being visualized by a fl uorescent microscope. Cells were counterstained with DAPI to visualize nuclear morphology. ( b ) Cell cycle analysis by fl ow cytometry. The x-axis indicates the intensity of cell propidium stained cells while the y-axis indicates the cell count. ( c ) Flow cytometric analysis of apoptotic subpopulations utilizing annexin V and PI in ZR-75 breast cancer cells. The right panel is a diagrammatic representation that identi fi es the quadrant subpopulations. Left panel demonstrates histograms of either control cells or cells treated with staurosporine with the indicated percentages of necrotic or apoptotic subpopulations. Control cells ( dots ) represent the majority of the population in quadrant 3 (Q3) or viable cells. In comparison, ZR-75-1 cells pretreated with staurosporine (a well-known positive control for apoptosis) demonstrate a high percentage of cells in Q2 and Q4, repre-senting early and late apoptotic cells.
50 100 150 200 250(x 1,000)
050
01,
000
1,50
02,
000
2,50
0
Cou
nt
Sub-G1
c
G1
G2/MS

46 R.W. Goehe et al.
12. Wash slides two times for 5 min with PBS in the dark. 13. Prepare a 1:1,000 solution of DAPI in vectashield and add
10–20 m L per slide and mount with coverslips. 14. Immediately visualize slides using a fl uorescent microscope.
Cells undergoing apoptosis will demonstrate DNA fragmentation in late apoptosis and those cells may be detected as having sub-G1 DNA content. A representation of cell cycle analysis is demon-strated in Fig. 3b .
1. Harvest treated cells (a total of 10 6 –10 7 cells for each condition). 2. Pellet cells by centrifugation and resuspend in 0.2 mL of PBS. 3. To fi x the cells, add 1.8 mL of cold ethanol dropwise while
vortexing to obtain a single cell suspension. 4. Incubate cell suspension on ice for 30 min or store at 4°C until
ready for staining. 5. Prepare staining solution. For 10 mL of staining solution, add
2 mg of DNAse-free RNase A and 0.2 mL of propidium iodide stock (1 mg/mL) to 0.1% (v/v) Triton X-100.
6. To proceed with staining, cells should be centrifuged to remove ethanol and resuspended in PBS.
7. Repeat centrifugation step and resuspend pellet in 1 mL of propidium iodide/RNase/Triton X-100 staining solution. Cells should be left in the staining solution 30 min to 24 h before analysis by fl ow cytometer.
8. Analyze samples. Propidium iodide is excited by 488 nm light and fl uoresces with a broad spectrum from about 550 nm to 700 nm. A minimum of 20,000 events should be recorded.
3.3.2. Cell Cycle Analysis by Propidium Iodide Staining
102 103 104 105
102
103
104
105 2.5%
0.5%
0.4% 3.9%
25.7%
16.7%
Q1 Q2
Q3 Q4
102 103 104 10510
210
310
410
5
Q1 Q2
Q3 Q4
Q1Necrosis
Q2 LateApoptosis
Q3 ViableCells
Q4 EarlyApoptosis
Fig. 3. (continued)

473 Autophagy, Senescence, and Apoptosis
Annexin V/PI staining can be used to monitor cells undergoing early and late apoptosis. Annexin V binds to cells that have expressed phosphatidylserine on the cell surface, a feature found in apoptosis ( 30 ) . Upon binding, Annexin V fl uoresces and can be measured by FACS analysis (Fig. 3c ).
1. Treated cells are harvested (a total of 10 6 –10 7 cells for each condition).
2. Pellet cells by centrifugation and resuspend in 0.2 mL of PBS. Repeat one more time to wash pellet of any trypsin or media.
3. Resuspend cell pellets with 100 m L of 1× binding buffer. 4. Add 5 m L of Annexin V-FITC to each sample. 5. Add 5 m L of the 10 m g/mL propidium iodide stock solution to
each sample. 6. Vortex samples and incubate at room temperature in the dark
for 15 min. 7. Immediately before analysis add 400 m L of 1× binding buffer
to yield a total volume of 500 m L. The number of cells with increased Annexin V-FITC/PI staining can be determined by fl ow cytometry. To set compensation and voltages there should be a sample with no stain, Annexin V-FITC alone, and PI alone. A minimum of 10,000 events should be recorded.
References
3.3.3. FACS Analysis for Annexin V and Propidium Iodide Positive Cells to Monitor Apoptosis and Necrosis
1. Tasdemir E et al (2008) A dual role of p53 in the control of autophagy. Autophagy 4(6):810–814
2. Boya P et al (2005) Inhibition of macroau-tophagy triggers apoptosis. Mol Cell Biol 25(3):1025–1040
3. Klionsky DJ et al (2008) Guidelines for the use and interpretation of assays for monitoring autophagy in higher eukaryotes. Autophagy 4(2):151–175
4. Lambert LA et al (2008) Autophagy: a novel mechanism of synergistic cytotoxicity between doxorubicin and roscovitine in a sarcoma model. Cancer Res 68(19):7966–7974
5. Livesey KM et al (2009) Autophagy inhibition in combination cancer treatment. Curr Opin Investig Drugs 10(12):1269–1279
6. Wilson EN, Bristol ML et al (2011) A switch between cytoprotective and cytotoxic autophagy in radiosensitization of breast tumor cells by chloroquine and vitamin D. Horm Cancer 2(5):272–285
7. Mizushima N (2004) Methods for monitoring autophagy. Int J Biochem Cell Biol 36(12):2491–2502
8. Schmitt CA et al (2002) Dissecting p53 tumor suppressor functions in vivo. Cancer Cell 1(3):289–298
9. Shiloh Y (2003) ATM and related protein kinases: safeguarding genome integrity. Nat Rev Cancer 3(3):155–168
10. Taylor RC, Cullen SP, Martin SJ (2008) Apoptosis: controlled demolition at the cellular level. Nat Rev Mol Cell Biol 9(3):231–241
11. Campisi J, d’Adda di Fagagna F (2007) Cellular senescence: when bad things happen to good cells. Nat Rev Mol Cell Biol 8(9):729–740
12. Chen Z et al (2005) Crucial role of p53-depen-dent cellular senescence in suppression of Pten-de fi cient tumorigenesis. Nature 436(7051):725–730
13. Sharpless NE, DePinho RA (2005) Cancer: crime and punishment. Nature 436(7051):636–637
14. Widmann C, Gibson S, Johnson GL (1998) Caspase-dependent cleavage of signaling pro-teins during apoptosis. A turn-off mechanism for anti-apoptotic signals. J Biol Chem 273(12):7141–7147
48 R.W. Goehe et al.
15. Schwartzman RA, Cidlowski JA (1993) Apoptosis: the biochemistry and molecular biology of programmed cell death. Endocr Rev 14(2):133–151
16. Boe R et al (1991) The protein phosphatase inhibitor okadaic acid induces morphological changes typical of apoptosis in mammalian cells. Exp Cell Res 195(1):237–246
17. Shen Y, White E (2001) p53-dependent apop-tosis pathways. Adv Cancer Res 82:55–84
18. Haupt S et al (2003) Apoptosis – the p53 net-work. J Cell Sci 116(Pt 20):4077–4085
19. Paglin S et al (2001) A novel response of cancer cells to radiation involves autophagy and forma-tion of acidic vesicles. Cancer Res 61(2):439–444
20. Traganos F, Darzynkiewicz Z (1994) Lysosomal proton pump activity: supravital cell staining with acridine orange differentiates leukocyte subpopulations. Methods Cell Biol 41:185–194
21. Pankiv S et al (2007) p62/SQSTM1 binds directly to Atg8/LC3 to facilitate degradation of ubiquitinated protein aggregates by autophagy. J Biol Chem 282(33):24131–24145
22. Lowry OH et al (1951) Protein measurement with the Folin phenol reagent. J Biol Chem 193(1):265–275
23. Ben-Porath I, Weinberg RA (2004) When cells get stressed: an integrative view of cellular senescence. J Clin Invest 113(1):8–13
24. Campisi J (2005) Senescent cells, tumor sup-pression, and organismal aging: good citizens, bad neighbors. Cell 120(4):513–522
25. Kurz DJ et al (2000) Senescence-associated (beta)-galactosidase re fl ects an increase in lyso-somal mass during replicative ageing of human endothelial cells. J Cell Sci 113(Pt 20):3613–3622
26. Amaravadi RK, Thompson CB (2007) The roles of therapy-induced autophagy and necro-sis in cancer treatment. Clin Cancer Res 13(24):7271–7279
27. Boya P et al (2003) Mitochondrial membrane permeabilization is a critical step of lysosome-initiated apoptosis induced by hydroxychloro-quine. Oncogene 22(25):3927–3936
28. Tasdemir E et al (2008) Methods for assessing autophagy and autophagic cell death. Methods Mol Biol 445:29–76
29. Yoshimori T et al (1991) Ba fi lomycin A1, a speci fi c inhibitor of vacuolar-type H(+)-ATPase, inhibits acidi fi cation and protein deg-radation in lysosomes of cultured cells. J Biol Chem 266(26):17707–17712
30. Vermes I et al (1995) A novel assay for apopto-sis. Flow cytometric detection of phosphatidyl-serine expression on early apoptotic cells using fl uorescein labelled Annexin V. J Immunol Methods 184(1):39–51

49
Sumitra Deb and Swati Palit Deb (eds.), p53 Protocols, Methods in Molecular Biology, vol. 962,DOI 10.1007/978-1-62703-236-0_4, © Springer Science+Business Media New York 2013
Chapter 4
p53 and Cell Cycle Effects After DNA Damage
Emir Senturk and James J. Manfredi
Abstract
Flow cytometry, a valuable technique that employs the principles of light scattering, light excitation, and emission of fl uorochrome molecules, can be used to assess the cell cycle position of individual cells based on DNA content. After the permeabilization of cells, the DNA can be stained with a fl uorescent dye. Cells which have a 2N amount of DNA can be distinguished from cells with a 4N amount of DNA, making fl ow cytometry a very useful tool for the analysis of cell cycle checkpoints following DNA damage. A critical feature of the cellular response to DNA damage is the ability to pause and repair the damage so that con-sequential mutations are not passed along to daughter generations of cells. If cells arrest prior to DNA replication, they will contain a 2N amount of DNA, whereas arrest after replication but before mitosis will result in a 4N amount of DNA. Using this technique, the role that p53 plays in cell cycle checkpoints following DNA damage can be evaluated based on changes in the pro fi le of the G1, S, and G2/M phases of the cell cycle.
Key words: Flow cytometry , Fluorescence , Dual parameter , Propidium iodide , BrdU , Phosho-histone H3 , p53 , DNA damage , DNA damage checkpoints , G1 arrest , G2/M arrest , Apoptosis
Genomic stability is a critical requirement for cell survival and the prevention of tumorigenesis. In order to ensure that mutations that result from DNA damage are not passed on to daughter gen-erations, the cell must pause and repair the damage. The cellular response pathway is a network that involves sensors of damage that ultimately transmit signals to mediator proteins that regulate the transcription of effector proteins that play an important role in arresting the cell cycle. In the cell cycle, transitions (G1/S, intra S, G2/M) that lead from DNA replication to mitosis are monitored for successful completion. In the event of DNA damage, genotoxic stress, or ribonucleotide depletion, cell cycle checkpoints prevent
1. Introduction

50 E. Senturk and J.J. Manfredi
progression to the next phase of the cell cycle until the damage is repaired, the stress is removed, or nutrients are replenished. Other pathways may be activated that result in programmed cell death if the damage is irreparable ( 1 ) . When there are defects in the cell cycle checkpoints, gene mutations, chromosome damage, and aneuploidy can result and ultimately, cell transformation can be a consequence of such defects ( 2 ) .
p53, a transcription factor ( 3, 4 ) and tumor suppressor protein ( 5 ) , can regulate the expression of proteins that play critical roles in growth arrest and apoptosis (programmed cell death) ( 6 ) . p53 plays a critical role both in the G1/S checkpoint, in which cells arrest prior to DNA replication and have a 2N content of DNA, and in the G2/M checkpoint, in which arrest occurs before mitosis and cells have a 4N content of DNA. The activation of p53 follow-ing DNA damage results in the expression of many proteins which are important in cell cycle arrest, repair, and apoptosis ( 7 ) .
The cyclin-dependent kinase inhibitor, p21, accomplishes cell cycle arrest by inhibiting cyclin–cdk complexes that phosphorylate cell cycle proteins that mediate the passage from G1 to S ( 8– 10 ) . As a result of inhibition, the retinoblastoma protein (pRB) remains hypophosphorylated, E2F remains bound to pRB, and arrest occurs at the G1/S boundary. Proliferating cell nuclear antigen (PCNA), a protein that plays a role in both DNA replication and repair, is a component of the cyclin–cdk complex. p21 binds to and inhibits PCNA from mediating elongation during replication thereby preventing replication in cells that have already entered S phase ( 11 ) .
Although the G1/S checkpoint is recognized as being entirely p53 dependent, the G2/M checkpoint can be accomplished as a result of multiple pathways. In the presence of DNA damage, p53-dependent and -independent pathways converge to inhibit the activities of cyclin B and Cdc2, proteins that play a role in promot-ing mitosis ( 12, 13 ) . Activation of the ATM/CHK2/cdc25 or ATR/CHK1/cdc25 pathways ( 14 ) results in the inactivation of phosphatases in the cdc25C family by downregulation and cyto-plasmic sequestration. Additionally, p53, itself, is phosphorylated by the kinases in these pathways and in turn becomes stabilized and active. p53 contributes to the maintenance of the G2/M checkpoint by transcriptional repression of both cdc25C and cyclin B ( 15 ) , upregulation of p21 that can inhibit cyclin B–cdk1 com-plexes ( 16 ) , 14-3-3 sigma proteins that target cdc25C proteins to the cytoplasm ( 17 ) , and GADD45, a protein that can inhibit cyclin B–Cdc2 complexes ( 18 ) .
Cells in which p53 is deleted or mutated lose the G1 check-point and no longer arrest at the G1/S transition. Although they maintain a G2 arrest, this arrest can decay over time thus allowing cells to enter mitosis with unrepaired DNA damage and mutations
514 p53 and Cell Cycle Effects After DNA Damage
that increase the risk of progression to malignancy. People who have Li–Fraumeni syndrome, a cancer prone condition in which one allele of the p53 gene is mutated, are susceptible to sarcomas, leukemias, brain and adrenal tumors. In these tumors the remain-ing allele of p53 is often deleted (loss of heterozygosity) highlight-ing the importance of the role of p53 in genomic stability ( 19 ) .
Flow cytometry is a valuable technique used for the analysis of cell cycle checkpoints after DNA damage. Using the principles of light scattering, light excitation, and light emission, fl uorescent compounds can be incorporated into the DNA of cells and emit a signal that is detectable and proportional to the number of fl uorochrome molecules. A unique feature of fl ow cytometry is that fl uorescence is measured on a per cell basis and not as a bulk volume as in spectrophotometry. In the following method, pro-pidium iodide, a fl uorescent compound, is used to intercalate into DNA of cells that have been treated with the DNA damaging agent, doxorubicin. This property can be used to evaluate the DNA content of cells because cells will have a 2N content of DNA prior to cell replication, followed by a 4N amount of DNA after replication.
Brie fl y, a sample containing stained cells in suspension is taken up by the fl ow cytometer and hydrodynamically focused through a small nozzle so that single cells pass before a laser, one cell at a time. An argon laser is commonly used in fl ow cytometry because the 488 nm light that it emits can excite more than one fl uorochrome. Therefore multiple fl uorochromes can be incorpo-rated simultaneously, provided that their emission wavelengths are far enough apart for detection. In the fi rst protocol, a single parameter assay is performed in which only propidium iodide is incorporated and detected (see Fig. 1 ). Propidium iodide and a fl uorescein isothiocyanate (FITC) conjugated antibody with emis-sions of 575 nm and 520 nm, respectively, are used to create a dual parameter assay in the second and third protocol. In the sec-ond protocol, bromodeoxyuridine (BrdU), a synthetic analog of thymidine, is incorporated into replicating DNA and the antibody that detects BrdU is conjugated to the fl uorescent compound (see Fig. 2 ). In the third protocol, an antibody to phosphorylated his-tone H3, a marker for mitotic cells, is used which is bound by a secondary antibody that is conjugated to the FITC molecule (see Fig. 3 ). The light that is emitted is sent to different detectors via band fi lters and converted to electrical pulses that ultimately are ampli fi ed and processed so that the data can be plotted on a graph as digital events. Histograms, which are dot plots of each event, can be constructed to illustrate both parameters. In the second protocol, actively replicating cells can be distinguished because of the BrdU uptake. Cells in G1 (2N content of DNA) and G2/M (4N content of DNA) can be easily discerned because all the cells
52 E. Senturk and J.J. Manfredi
No treatmenta
b
HCT WT
HCT p53-/-
RKO
RKO-E6
G1 51.99%
G3/M25.81%
0 200 400 600Fl2-A
sub G1 SG2/M
G1
sub G1S G2/M
G1
sub G1 S G2/M G2/MG1 sub G1 SG1
G2/Msub G1 S
G1
G2/MG2/M sub G1sub G1 SS
G1G1
G2/Msub G1 S
G1
G2/Msub G1 S
G1
G2/Msub G1 SG1
sub G1S G2/M
G1
Fl2-A
Irs 9-28-07.006 Irs 9-28-07.007 Irs 9-28-07.008
Irs 9-28-07.016 Irs 9-28-07.017 Irs 9-28-07.018
Fl2-A
Fl2-A
Fl2-A
Fl2-A
Fl2-AFl2-AFl2-A
Fl2-A Fl2-A Fl2-A
DL102302.005
DL102302.003 DL102302.004DL102302.001
050
100
150
Cou
nts
200
250
050
100
150
Cou
nts
200
250
050
100
150
Cou
nts
200
250
050
100
150
Cou
nts
200
250
050
100
150
Cou
nts
200
250
050
100
150
Cou
nts
200
250
040
8012
0
Cou
nts
160
200
040
8012
0C
ount
s16
020
0
040
8012
0C
ount
s16
020
00
4080
120
Cou
nts
160
200
040
8012
0C
ount
s16
020
0
040
8012
0C
ount
s16
020
0
DL102302.007 DL102302.008
800 1000
0 200 400 600 800 1000
0 200 400 600 800 1000
0 200 400 600 800 1000
0 200 400 600 800 1000
0 200 400 600 800 1000
0 200 400 600 800 1000 0 200 400 600 800 1000 0 200 400 600 800 1000
0 200 400 600 800 1000 0 200 400 600 800 1000 0 200 400 600 800 1000
S 22.45%
G1 43.91%
G2/M66.89%S 0.85%
G1 5.83%
G2/M89.25%S 4.75%
G1 2.55%
G2/M95.30%S 1.99%
G1 30.55%
G2/M 53.6%S 2.41%
G1 48.53%
G2/M 30.62%S 9.15%
G1 52.17%
G2/M 20.10%S 20.85%
G1 46.84%
G2/M 28.94%S 12.46%
G1 29.30%
G2/M 48.07%S 8.52%
G1 4.40%
G2/M 71.03%S 4.63%
G1 20.16%
G2/M74.88%S 4.63%
G1 13.66%
G2/M66.89%S 0.85%
0.05 µg/mL doxorubicin 0.1 µg/mL doxorubicin
No treatment 0.01 µg/mL doxorubicin 0.05 µg/mL doxorubicin
Fig. 1. Wild-type p53 cells maintain a G1 and G2/M arrest after treatment with doxorubicin, whereas p53−/− cells primarily arrest in G2/M. ( a ) HCT 116 WT and p53−/− colorectal carcinoma cells were treated with 0.05 and 0.1 m g/ml doxorubicin for 24 h before harvesting for fl ow analysis. ( b ) RKO (wild-type p53) and RKO E6 (p53 is targeted for degradation by HPV E6) colorectal carcinoma cells were treated with 0.01 and 0.05 m g/ml doxorubicin for 24 h before harvesting for fl ow analysis. The analysis cell pro fi les are shown for untreated and treated cells. The percentage of cells in G1, S, and G2/M are indicated in the upper right hand corner of each histogram.

534 p53 and Cell Cycle Effects After DNA Damage
No treatment 0.1 µg/mL doxorubicin 0.2 µg/mL doxorubicin
G1 62.15%
S 23.61%
WT MEFs
p53-/- MEFs
S 25.28% S 14.08% S 17.09%
S 2.37% S 1.75%
G2/M 12.30%
MEFs.002
MEFs.006
MEFs.003 MEFs.004
MEFs.007 MEFs.008
MEFs.006
MEFs.003 MEFs.004
S 23.61%
G1 45.53%
G2/M 26.49%S 25.28%
G1 11.07%
G2/M 71.84%S 14.08%
G1 20.02%
G2/M 58.95%S 17.09%
G1 43.25%
G2/M 53.85%S 2.37%
G1 48.43%
G2/M 48.56%S 1.75%
G2/M
G-2/M G-2/M G-2/MG-1 G-1 G-1
-S-
G-2/M G-2/M G-2/MG-1 G-1 G-1
-S- -S- -S-
-S- -S-
G2/MG2/MG2/M
sub-G1sub-G1sub-G1
G1G1
G1
SSS
G2/M G2/M
G1 G1 G1
S S Ssub-G1 sub-G1 sub-G1
600
480
360
Cou
nts
240
120
060
048
036
0
Cou
nts
240
120
0
600
480
360
Cou
nts
240
120
0
600
480
360
Cou
nts
240
120
0
100
101
102
BrD
UB
rDU
103
104
100
101
102
BrD
U
103
104
100
101
102
BrD
U10
310
4
100
101
102
103
104
BrD
U
100
101
102
103
104
BrD
U10
010
110
210
310
4
0 200 400 600PI
PI
800 1000
0 200 400 600 800 1000
0 200 400 600 800 1000
0 200 400 600 800 1000
0 200 400 600PI
800 1000 0 200 400 600PI
800 1000
0 200 400 600PI
800 1000 0 200 400 600
PI
800 1000
0 200 400 600 800 1000 0 200 400 600 800 1000
MEFs.007 MEFs.008
0 200 400 600 800 1000 0 200 400 600 800 1000
600
480
360
Cou
nts
240
120
0
600
480
360
Cou
nts
240
120
0
Fig. 2. Treatment with doxorubicin in WT p53 mouse embryonic fi broblasts (MEFs) results in a signi fi cant reduction of S phase cells. Wild-type and p53−/− MEFs were treated with 0.1 and 0.2 m g/ml doxorubicin for 24 h prior to being pulsed with 10 m M BrdU for 4 h. Following antibody treatment and propidium iodide staining the cells were analyzed by dual parameter fl ow cytometry. Both single and dual parameter histograms are shown for each condition. The percentage of cells in G1, S, and G2/M are indicated in the upper right hand corner of each histogram.
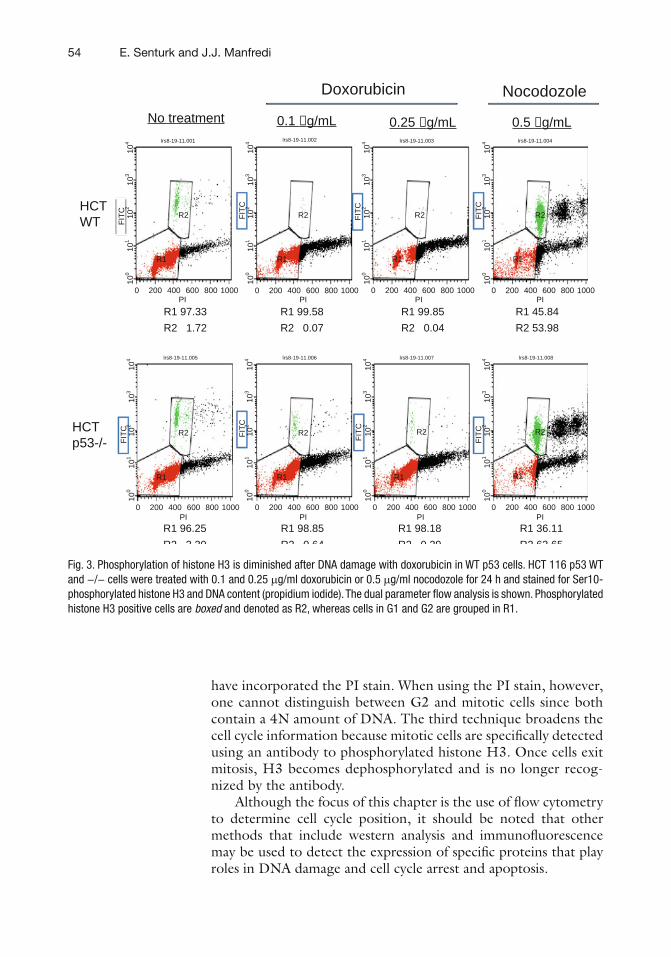
54 E. Senturk and J.J. Manfredi
have incorporated the PI stain. When using the PI stain, however, one cannot distinguish between G2 and mitotic cells since both contain a 4N amount of DNA. The third technique broadens the cell cycle information because mitotic cells are speci fi cally detected using an antibody to phosphorylated histone H3. Once cells exit mitosis, H3 becomes dephosphorylated and is no longer recog-nized by the antibody.
Although the focus of this chapter is the use of fl ow cytometry to determine cell cycle position, it should be noted that other methods that include western analysis and immuno fl uorescence may be used to detect the expression of speci fi c proteins that play roles in DNA damage and cell cycle arrest and apoptosis.
No treatment 0.1 µg/mL 0.25 µg/mL 0.5 µg/mL
0 200 400 600
R2
lrs8-19-11.001
lrs8-19-11.005 lrs8-19-11.006 lrs8-19-11.007 lrs8-19-11.008
lrs8-19-11.002 lrs8-19-11.003 lrs8-19-11.004
HCTWT
Doxorubicin Nocodozole
HCTp53-/-
R2 R2 R2 R2
R2 R2 R2
FIT
CF
ITC
FIT
C
FIT
C
FIT
C
FIT
C
FIT
C
FIT
C
R1
R1 R1 R1 R1
R1 R1 R1
R1 97.33
R2 1.72
R1 96.25
R2 2 30
R1 98.18
R2 0 29
R1 36.11
R2 63 65
R1 98.85
R2 0 64
R1 99.58
R2 0.07
R1 99.85
R2 0.04
R1 45.84
R2 53.98
PI800 1000
0 200 400 600PI
800 1000 0 200 400 600PI
800 1000 0 200 400 600PI
800 1000 0 200 400 600PI
800 1000
0 200 400 600PI
800 1000 0 200 400 600PI
800 1000 0 200 400 600PI
800 1000
100
101
102
103
104
100
101
102
103
104
100
101
102
103
104
100
101
102
103
104
100
101
102
103
104
100
101
102
103
104
100
101
102
103
104
100
101
102
103
104
Fig. 3. Phosphorylation of histone H3 is diminished after DNA damage with doxorubicin in WT p53 cells. HCT 116 p53 WT and −/− cells were treated with 0.1 and 0.25 m g/ml doxorubicin or 0.5 m g/ml nocodozole for 24 h and stained for Ser10-phosphorylated histone H3 and DNA content (propidium iodide). The dual parameter fl ow analysis is shown. Phosphorylated histone H3 positive cells are boxed and denoted as R2, whereas cells in G1 and G2 are grouped in R1.
554 p53 and Cell Cycle Effects After DNA Damage
1. Dulbecco’s modi fi ed Eagle’s medium (DMEM with High Glucose) supplemented with 10% fetal bovine serum (FBS, Atlanta Biologicals) that has been heat inactivated at 56°C for 30 min.
2. 1× Dulbecco’s phosphate buffered saline without calcium and magnesium (DPBS).
3. 0.05% Trypsin–ethylenediamine tetraacetic acid (EDTA). 4. Doxorubicin (Sigma-Aldrich, St. Louis, MO) is dissolved in
dimethyl sulfoxide (DMSO) (Sigma-Aldrich, St. Louis, MO) to yield a concentration of 1 mg/ml. A sterile solution is pre-pared by passage through a 0.2 m m fi lter and aliquots are stored at −20°C. A subsequent dilution of the stock in sterile H 2 O, 0.1 mg/ml, may be prepared and also stored at −20°C. This can be added directly to tissue culture cells at the appropriate concentration.
5. Nocodozole (Sigma-Aldrich, St. Louis, MO) is dissolved in distilled water to yield a 500 m g/ml stock that is passed through a 0.2 m m fi lter and stored at −20°C.
1. Dulbecco’s phosphate buffered saline without calcium and magnesium (1× DPBS).
2. Dulbecco’s modi fi ed Eagle’s medium (DMEM with High Glucose) is supplemented with 10% FBS (Atlanta Biologicals) that has been heat inactivated at 56°C for 30 min.
3. 0.05% Trypsin–EDTA. 4. 70% Ethanol (ETOH) is prepared from reagent grade, 190
proof (95%) ethanol and diluted with distilled water. 5. Propidium iodide (PI) (Sigma-Aldrich, St. Louis MO). A 100×
stock (2 mg/ml in PBS) is prepared and stored at 4°C in a foil-covered tube for protection from the light.
6. Bovine pancreatic ribonuclease A (RNase A) (Sigma, St. Louis, MO) is stored at −20°C and for each use an appropriate amount is added fresh to PI/PBS solution.
7. Polystyrene round-bottom 12 × 75 mm (5 ml) Falcon tubes (BD Falcon, Franklin Lakes, NJ).
1. BrdU (Sigma-Aldrich, Fairlawn, NJ) is prepared at a concen-tration of 10 mM in distilled H 2 O and stored at −20°C.
2. 1× DPBS. 3. 1% Bovine serum albumin (BSA)/DPBS. 4. 70% ETOH is prepared from reagent grade, 190 proof (95%)
ethanol and diluted with distilled H 2 O.
2. Materials
2.1. Cell Culture, Lysis, DNA Damaging Agent, and Mitotic Tubule Inhibitor
2.2. Propidium Iodide Staining for FACS Analysis
2.3. (+)-5-Bromo-2-Deoxyuridine (BrdU) Incorporation
56 E. Senturk and J.J. Manfredi
5. FITC-conjugated Anti-BrdU antibody (Becton Dickenson). 6. PI (Sigma Chemical Co.). 7. 2 N HCl with 0.5% Triton-X-100 (v/v). 8. 0.1 M Sodium tetraborate (Na 2 B 4 O 7 . 10 H 2 O), pH 8.5. 9. 0.5% Tween-20/1% BSA/DPBS. 10. 12 × 75 Polystyrene Falcon tubes (BD Falcon, Franklin
Lakes, NJ).
1. 0.5% Formaldehyde in 1× DPBS. 2. 90% Methanol is prepared with distilled H 2 O. 3. Anti-phosphorylated ser 10 histone 3 antibody (Cell Signaling)
is diluted in DPBS. 4. RNase A (Sigma, St. Louis, MO) is stored at −20°C and for
each use an appropriate amount is added fresh to antibody/PBS solution.
5. FITC-conjugated secondary antibody (Jackson Laboratories) is appropriately diluted in DPBS.
6. BSA.
In preparation for treatment with speci fi c DNA damaging agents, cell lines containing wild type, mutant, or no p53 are trypsinized and plated at an appropriate number into 60 mm or 100 mm tissue culture dishes to yield dishes that will be subcon fl uent the follow-ing day. It is best to start by seeding a suf fi cient number of dishes in order to do a dose–response curve for your drug.
Doxorubicin (0.1 mg/ml) is thawed and added directly to cell cul-tures at a broad range of concentrations (0.01–0.5 m g/ml) to establish a dose that is suitable. The cell cultures are maintained for an additional 24 h at 37°C before harvesting (see Note 1).
Follow the above given protocol.
1. The treated and untreated cells are harvested by trypsinization, making sure to retain the medium from each dish. This pre-vents the loss of dying cells that lifted off of the dish as a result
2.4. Phosphorylated Histone H3 Assay
3. Methods
3.1. Treatment with DNA Damaging Agent
3.1.1. Day 0
3.1.2. Day 1
3.2. Staining with Propidium Iodide and Preparation for FACS Analysis
3.2.1. Day 0 and Day 1
3.2.2. Day 2
574 p53 and Cell Cycle Effects After DNA Damage
of the drug treatment. This medium can be used to neutralize the trypsin.
2. The cell suspensions are pelleted by centrifugation at 1,000 rpm for 5 min at 4°C.
3. The cell pellets are washed by resuspension in 1× DPBS and spun again at 1,000 rpm for 5 min at 4°C.
4. The supernatant is carefully removed and the pellet is gently dislodged. 1 ml of 70% ETOH is added dropwise to the cells while vortexing in order to disrupt the clumping of the cells (see Notes 2 and 3).
5. Once the cells are fi xed they can be stored at −20°C for a mini-mum of 12 h or up to 2 weeks prior to PI staining.
1. The fi xed cells are centrifuged at 1,000 rpm for 5 min at 4°C. 2. The cells are rehydrated with DPBS and spun again at
1,000 rpm for 5 min at 4°C. 3. The pellet is resuspended in 20 m g/ml PI in PBS containing
1 mg/ml of RNase A and the cells are transferred to polystrene 12 × 75 mm Falcon tubes. Generally, 1–2 ml of the PI stain is adequate for 10 6 cells. The PI is prepared from a 100× stock (2 mg/ml) but the RNase is added fresh each time. The tubes are placed in the dark at room temperature for 2 h prior to FACS analysis. They may also be stored overnight at 4°C in the dark.
4. A BD BioSciences fl ow cytometer (FACSCalibur) is used to analyze samples for cell cycle position. Acquisition and analysis plots of 10,000 cells are generated using CellQuest software. The FL2 laser is employed for detection of the propidium iodide staining of the DNA.
An appropriate number of cells are seeded for optimal growth in 100 mm tissue culture dishes.
The cells are treated with doxorubicin. The stock (0.1 mg/ml) is thawed and added directly to cell cultures. A dose–response curve for each cell line should be performed in order to attain a dose that produces a p53-dependent response. This can be done as a single parameter experiment using PI before setting up a BrdU incorpo-ration assay.
1. BrdU is added directly to the culture medium to attain a fi nal concentration of 10 m M. Washing the cells prior to addition of BrdU is not recommended because it might slow the growth of
3.2.3. Day 3
3.3. Dual Parameter, BrdU Incorporation Assay, and Propidium Iodide Staining
3.3.1. Day 0
3.3.2. Day 1
3.3.3. Day 2
58 E. Senturk and J.J. Manfredi
the cells and the incorporation of the analog. Plan on including a dish of cells that will not be pulsed with BrdU (see Note 4).
2. Incubate cells at 37°C for 45–60 min, but note that this time will vary depending on the doubling time of the cells.
3. The BrdU pulsed cells are trypsinized, making sure to save the medium so as not to lose cells that are no longer adhered to the tissue culture dish and spun for 5 min at 1,000 rpm.
4. The number of cells per sample is adjusted to approximately 10 6 by resuspension of the cell pellet in 1× PBS and spun again for 5 min at 1,000 rpm.
5. The pellet is retained and resuspended in 1 ml 70% ETOH. It is important to prevent clumping of cells by gently vortexing the pellet while adding ETOH.
6. The cells can be stored overnight at −20°C before proceeding. This step can be shortened but usually a minimum of 12 h in fi xative is standard before the denaturation step.
7. The cells are centrifuged at 1,000 rpm for 5 min. 1 ml of 2 N HCL/0.5%Triton X-1000 (v/v) is slowly added to the pellet, a few drops at a time while maintaining a vortex. This will dis-rupt clumps of cells that may result from addition of the HCL/Triton X mixture. This treatment will denature the DNA and create single-stranded molecules.
8. Incubate at room temperature for 30 min. 9. The cell suspension is spun at 1,000 rpm for 5 min. The pelleted
cells are resuspended in 1 ml of 0.1 M Na 2 B 4 O 7 · 10H 2 O pH 8.5, a sodium tetraborate solution that neutralizes the acid.
10. You can pause at this point and store the BrdU-labeled cells at −20°C. If you choose to do this, the cells are centrifuged at 1,000 rpm for 5 min and the pellet is resuspended in 70% ETOH. Otherwise you can proceed directly from steps 9 to 11.
11. The cells are spun down at 1,000 rpm for 5 min and the pellet is resuspended in 500 m l 0.5% Tween-20/1% BSA/PBS con-taining an appropriate concentration of anti-BrdU-FITC sec-ondary antibody (Becton Dickinson).
12. The cells are maintained at room temperature (RT) and pro-tected from the light for 30 min.
13. The cells are centrifuged at 1,000 rpm for 5 min, followed by resuspension of the pellet in 1 ml of PBS containing 10 m g/ml propidium iodide. The labeled cells are transferred into 12 × 75 mm polystyrene Falcon tubes and stored at RT in the dark for 2 h.
14. The samples are analyzed for cell cycle position using a BD BioSciences fl ow cytometer (FACSCalibur). Although the
594 p53 and Cell Cycle Effects After DNA Damage
excitation, 488 nm, is the same for both stains, the FL1 and FL3 detection lasers can discriminate between the emission of the green fl uorescent FITC stain and the red propidium iodide staining of the DNA. CellQuest software is used to generate the acquisition and analysis plots of 10,000 cells.
An appropriate number of cells are seeded for optimal growth in 100 mm tissue culture dishes.
The cells are treated with doxorubicin. The stock (0.1 mg/ml) is thawed and added directly to cell cultures. A dose–response curve for each cell line should be performed previously in order to attain a dose that produces a p53-dependent response. To aid in analysis, a dish of cells should also be treated with nocodozole at a fi nal concentration of 500 ng/ml (see Note 5). This agent is an inhibi-tor of microtubules and will result in a population of cells that are arrested in M phase. The cell cultures are maintained for an addi-tional 24 h at 37°C.
1. The cells are trypsinized, making sure to save the medium that may contain cells that are no longer adhered to the tissue cul-ture dish, and centrifuged for 5 min at 1,000 rpm.
2. The pellets are resuspended in PBS and spun down for 5 min at 1,000 rpm.
3. The pelleted cells are fi xed in 1 ml of 0.5% formaldehyde for 10 min at 37°C.
4. The fi xed cells are spun out at 1,000 rpm for 5 min and washed in 1 ml PBS to dilute out the fi xative.
5. The cells are spun again at 1,000 rpm for 5 min and permeabi-lized using 1 ml of 90% methanol.
6. The cells are incubated on ice for 30 min or can be stored at −20°C for up to 10 days.
7. The cells are centrifuged and resuspended in PBS. 8. Once again the cells are centrifuged at 1,000 rpm for 5 min
followed by resuspension in the primary antibody, anti-phos-phorylated Ser 10 histone 3. The antibody is diluted according to the manufacturer’s suggestion in PBS that contains 100 m g/ml RNase A.
9. The cells are incubated for 1 h with occasional shaking at RT. 10. The cells are pelleted and subsequently washed twice with 1%
BSA/PBS.
3.4. Phosphorylated Histone H3 Assay
3.4.1. Day 0
3.4.2. Day 1
3.4.3. Day 2
60 E. Senturk and J.J. Manfredi
11. After centrifugation the cells are taken up in the secondary, anti-FITC-conjugated antibody that is diluted accordingly in PBS.
12. The cells are incubated for 1 h at RT in the dark. 13. The samples are centrifuged for 5 min at 1,000 rpm and resus-
pended 1% BSA/PBS. 14. Once again the cells are centrifuged and resuspended in PBS
containing 20 m g/ml propidium iodide and transferred into polystyrene 12 × 75 mm Falcon tubes.
15. The stained cells are incubated in the dark at RT for 30 min. 16. A FACS brand fl ow cytometer can be used for the analysis of
the labeled samples. FL1 and FL3 detectors are selected to distinguish between the emission of PI and FITC. CellQuest software is used to generate the acquisition and analysis histo-grams of labeled cells.
1. The cellular response to a particular DNA damaging drug will vary for individual cell lines. Therefore it is important to empirically derive a concentration that will produce a biologic effect that is p53 dependent. It is important to establish a concentration curve of each drug for each cell line. Moreover it is a good idea to use parallel dishes to harvest for protein. An SDS-PAGE gel can be run, blotted, and probed for p53 and its target genes. One can then determine at which dose p53 is being induced and at what levels the response remains p53 dependent.
2. Cells are impermeable to PI. Therefore for this assay, the cells must be fi xed so that the PI stain can penetrate the cells and intercalate into the DNA. Although ETOH is used, paraform-aldehyde can also be used and might be preferable, when you want to prevent transfected proteins, like green fl uorescent protein (GFP) from leaking out of the cell.
3. Some cell lines tend to be very sticky and are prone to clump-ing. Use of 12 × 75 mm Falcon polystyrene tubes with strainer caps will fi lter out clumps of cells from the fi nal cell suspension.
4. A sample should be included to which BrdU has not been added. This control will be helpful when gating cells in the analysis portion of this assay.
5. Nocodozole-treated cells will serve as a positive control for the mitotic population that contains phosphorylated histone H3. This control will aid in proper gating in the analysis.
4. Notes

614 p53 and Cell Cycle Effects After DNA Damage
Acknowledgments
The author is appreciative to Melissa Mattia-Sansorbrino and Emir Senturk for their contributions to the fi gures presented in this chapter. The authors are supported by grants from the National Cancer Institute (P01 CA080058, R01 CA125741, and R01 CA086001).
References
1. Hartwell LH, Weinert TA (1989) Checkpoints: controls that ensure the order of cell cycle events. Science 246:629–634
2. Paulovich AG, Toczyski DP, Hartwell LH (1997) When checkpoints fail. Cell 88:315–321
3. Kern SE, Kinzler KW, Bruskin A, Jarosz D, Friedman P, Prives C, Vogelstein B (1991) Identi fi cation of p53 as a sequence-speci fi c DNA-binding protein. Science 252:1708–1711
4. Pietenpol JA, Tokino T, Thiagalingam S, el-Deiry WS, Kinzler KW, Vogelstein B (1994) Sequence-speci fi c transcriptional activation is essential for growth suppression by p53. Proc Natl Acad Sci USA 91:1998–2002
5. Finlay CA, Hinds PW, Levine AJ (1989) The p53 proto-oncogene can act as a suppressor of transformation. Cell 57:1083–1093
6. Burns TF, El-Deiry WS (1999) The p53 pathway and apoptosis. J Cell Physiol 181:231–239
7. Bargonetti J, Manfredi JJ (2002) Multiple roles of the tumor suppressor p53. Curr Opin Oncol 14:86–91
8. el-Deiry WS, Tokino T, Velculescu VE, Levy DB, Parsons R, Trent JM, Lin D, Mercer WE, Kinzler KW, Vogelstein B (1993) WAF1, a potential mediator of p53 tumor suppression. Cell 75:817–825
9. Harper JW, Adami GR, Wei N, Keyomarsi K, Elledge SJ (1993) The p21 Cdk-interacting protein Cip1 is a potent inhibitor of G1 cyclin-dependent kinases. Cell 75:805–816
10. Waldman T, Kinzler KW, Vogelstein B (1995) p21 is necessary for the p53-mediated G1 arrest in human cancer cells. Cancer Res 55:5187–5190
11. Waga S, Hannon GJ, Beach D, Stillman B (1994) The p21 inhibitor of cyclin-dependent kinases controls DNA replication by interac-tion with PCNA. Nature 369:574–578
12. Agarwal ML, Agarwal A, Taylor WR, Stark GR (1995) p53 controls both the G2/M and the G1 cell cycle checkpoints and mediates revers-ible growth arrest in human fi broblasts. Proc Natl Acad Sci USA 92:8493–8497
13. Flatt PM, Tang LJ, Scatena CD, Szak ST, Pietenpol JA (2000) p53 regulation of G(2) checkpoint is retinoblastoma protein depen-dent. Mol Cell Biol 20:4210–4223
14. Matsuoka S, Huang M, Elledge SJ (1998) Linkage of ATM to cell cycle regulation by the Chk2 protein kinase. Science 282:1893–1897
15. Taylor WR, DePrimo SE, Agarwal A, Agarwal ML, Schonthal AH, Katula KS, Stark GR (1999) Mechanisms of G2 arrest in response to overexpression of p53. Mol Biol Cell 10:3607–3622
16. Bunz F, Dutriaux A, Lengauer C, Waldman T, Zhou S, Brown JP, Sedivy JM, Kinzler KW, Vogelstein B (1998) Requirement for p53 and p21 to sustain G2 arrest after DNA damage. Science 282:1497–1501
17. Chan TA, Hermeking H, Lengauer C, Kinzler KW, Vogelstein B (1999) 14-3-3Sigma is required to prevent mitotic catastrophe after DNA damage. Nature 401:616–620
18. Kastan MB, Zhan Q, el-Deiry WS, Carrier F, Jacks T, Walsh WV, Plunkett BS, Vogelstein B, Fornace AJ Jr (1992) A mammalian cell cycle checkpoint pathway utilizing p53 and GADD45 is defective in ataxia-telangiectasia. Cell 71:587–597
19. Malkin D (1993) p53 and the Li-Fraumeni syndrome. Cancer Genet Cytogenet 66:83–92

63
Sumitra Deb and Swati Palit Deb (eds.), p53 Protocols, Methods in Molecular Biology, vol. 962,DOI 10.1007/978-1-62703-236-0_5, © Springer Science+Business Media New York 2013
Chapter 5
p53 Ubiquitination and Proteasomal Degradation
Ian M. Love , Dingding Shi , and Steven R. Grossman
Abstract
p53 levels and activity are controlled in large part through regulated ubiquitination and subsequent destruction by the 26S proteasome. Monoubiquitination of p53 is mediated primarily by the RING- fi nger E3 ubiquitin ligase MDM2 and impacts p53 activity through modulation of p53 localization and tran-scription activities. Recently, several E4 ubiquitin ligases (E4s) have been identi fi ed which serve to extend these monoubiquitin chains. The ubiquitin ligase activity of these factors toward p53, and their contribu-tion to p53 degradation, can be studied using a variety of in vitro and in vivo methods and reagents which will be described in this chapter. These methods include in vivo ubiquitination of p53 using HA-ubiquitin or his-ubiquitin; the in vitro E3 ubiquitin ligase assay, in which ubiquitin reaction components (URC) are incubated with a puri fi ed E3 or E4 ligase; a one-step E4 assay, in which URC are incubated with a sub-strate, E3, and E4; and a two-step E4 assay in which p53 is monoubiquitinated in an E3 reaction, and subsequently puri fi ed and incubated with an E4. Finally, we will describe an in vitro degradation assay in which ubiquitinated p53 is incubated with puri fi ed 26S proteasomes. Together, these assays can be used to provide insight into the biochemical nature of p53 ubiquitination and degradation.
Key words: p53 , MDM2 , Ubiquitination , 26S proteasome , Ubiquitin ligase
Homeostatic control of p53 levels is primarily accomplished through its regulated ubiquitination and subsequent degradation by the 26S proteasome. Potent cell-cycle inhibitory and apoptotic activities necessitate that p53 levels be kept under tight control in normal cells. Upon genotoxic or other stresses, however, p53 lev-els need to be rapidly upregulated to generate a quick response, and the inhibition of its constitutive ubiquitin/proteasome degra-dation after stress allows for a suitably rapid response. Ubiquitination of p53 occurs through the ATP-dependent trans-fer of a 76-residue ubiquitin moiety to a target lysine via an E3
1. Introduction
64 I.M. Love et al.
ubiquitin ligase ( 1 ) , which then serves as a substrate for extension of ubiquitin chains by an E4 ubiquitin ligase ( 1– 3 ) . A suf fi cient number of ubiquitin molecules composing a chain (often four or more) ( 4 ) , when linked by K48 to G76 of a preceding ubiquitin, serve as a proteasome recognition signal which directs degrada-tion of the covalently attached substrate. In addition to the K48 linkage, a number of other physiologically relevant linkages exist (K6, K11, K29, and K63) ( 5 ) .
The most well-characterized p53 ubiquitin ligase is the proto-oncogene MDM2, which directs the monoubiquitination of a cluster of C-terminal lysines of p53 and is critical for the proper regulation of p53 stability ( 6– 8 ) . In vitro , however, MDM2 in limiting physiologically relevant quantities is insuf fi cient to facili-tate p53 polyubiquitination and degradation ( 2, 9 ) . This addi-tional function is provided by the activity of an E4 ubiquitin ligase, of which the transcriptional coactivators p300 and CBP have been identi fi ed to harbor this activity toward p53. In recent years, additional p53 ubiquitin ligases have been identi fi ed ( 10– 13 ) . It is likely that a number of additional p53 E3 and E4 ligases will be uncovered in the future, and the methods described below will greatly aid in the investigation of their activities.
We will fi rst describe two commonly used methods to sensi-tively detect ubiquitin chains on substrates in cells by utilizing exogenously expressed histidine (his) or HA-tagged ubiquitin. By using various ubiquitin lysine mutants in place of wild-type tagged ubiquitin, these methods also allow the study of ubiquitin chain linkages that might be preferentially assembled by a speci fi c E3 or E4. The HA-ubiquitin method exhibits greater sensitivity for poly-ubiquitin chain conjugates than the his-tagged ubiquitin and Ni-NTA pull down method. However, the his-Ub method pro-vides more consistent results when detecting monoubiquitinated substrates and short-chain conjugates.
Next, we will describe in vitro methods of studying p53 ubiquit-ination using puri fi ed components. These methods facilitate the study of ubiquitin chain formation, stability, and speci fi city in the presence of speci fi c, puri fi ed components, allowing the contribution of speci fi c factors or reaction conditions to these processes to be de fi ned. These methods have been useful in the identi fi cation of novel E4 activities, where native proteins do not serve as substrates unless monoubiquit-inated ( 2, 14 ) , as well as in the identi fi cation of structural and func-tional elements required for substrate ubiquitination.
A p53 proteasome degradation assay will be described last, which involves the incubation of ubiquitinated p53 with puri fi ed 26S protea-somes. This assay can inform upon the contribution of factors or con-ditions which regulate the degradation of p53 by the proteasome after ubiquitination, and allow the probing of structural and functional ele-ments of the substrate, ubiquitin chains, proteasome adapters, and even the proteasome itself, necessary to direct p53 degradation.
655 p53 Ubiquitination and Proteasomal Degradation
1. Transfection competent cell line(s) (suggestions: U2OS [wild-type p53] for study of native p53; H1299 [p53-null] for study of exogenous p53).
2. Lipophilic transfection reagent. 3. HA-ubiquitin expression vector (and p53 expression vector
where indicated). 4. Proteasome inhibitor MG132 (Sigma-Aldrich). 5. RIPA buffer (50 mM Tris–HCl, pH 7.4, 250 mM NaCl,
10 mM MgCl 2 , 1% Triton X-100, 0.5% deoxycholate (DOC)). 6. N -Ethyl maleimide (NEM, Sigma). 7. Protease inhibitor cocktail (Complete-mini EDTA-free, Roche). 8. Protein A (FL-393) or Protein G (DO-1) agarose beads
(Upstate). 9. Antibodies: a -HA F-7 for detection of ubiquitin conjugates by
western blot (Santa Cruz); p53 antibody (DO-1 or FL-393) for immunoprecipitation of p53, and blotting of IPs as a con-trol and to detect short chain and native p53 in the IPs.
1. Transfection competent cell line(s). 2. Lipophilic transfection reagent. 3. His-ubiquitin expression vector. 4. Proteasome inhibitor MG132 (Sigma-Aldrich). 5. Guanidinium lysis buffer (6 M guanidinium-HCl, 100 mM
Na 2 HPO 4 /NaH 2 PO 4 pH 8.0, 10 mM Tris–HCl pH 8.0, 5 mM imidazole , 10 m M b -mercaptoethanol).
6. Urea buffer (8 M urea, 100 mM Na 2 HPO 4 /NaH 2 PO 4 pH 8.0, 10 mM Tris–HCl pH 8.0, 10 m M b -mercaptoethanol).
7. Wash buffer A (8 M urea, 100 mM Na 2 HPO 4 /NaH 2 PO 4 pH 6.3, 10 mM Tris–HCl pH 8.0, 10 m M b -mercaptoethanol).
8. Triton X-100 (to supplement washes). 9. Imidazole elution buffer (200 mM imidazole, 5% SDS, 150 mM
Tris–HCl pH 6.7, 30% glycerol, 720 mM b -mercaptoethanol). 10. N -Ethyl maleimide (NEM, Sigma). 11. Protease inhibitor cocktail (Complete-mini EDTA-free, Roche). 12. Ni 2+ -NTA-agarose beads (follow manufacturer instructions to
be sure beads are properly loaded with Ni 2+ ; Sigma-Aldrich). 13. Antibodies: a -His antibody for immunoprecipitation of ubiq-
uitin conjugates; p53 antibody (DO-1 or FL-393) for detec-tion of ubiquitinated p53.
2. Materials
2.1. In Vivo Ubiquitination of p53 with HA-Tagged Ubiquitin
2.2. In Vivo Ubiquitination of p53 with His-Tagged Ubiquitin
66 I.M. Love et al.
1. NP-40 lysis buffer (150 mM NaCl, 25 mM Tris–HCl, pH 8.0, 1% NP-40, 5 mM EDTA).
2. RIPA lysis buffer (50 mM Tris–HCl, pH 7.4, 250 mM NaCl, 10 mM MgCl 2 , 1% Triton X-100, 0.5% DOC, 1 µM ZnCl 2 ).
3. Ubiquitin reaction buffer (URB): 25 mM Hepes pH 7.4, 10 mM NaCl, 3 mM MgCl 2 , 0.05% Triton X-100, 0.5 mM DTT.
4. Mg 2+ -ATP (Boston Biochem). 5. FLAG peptide (Sigma-Aldrich). 6. URC: E1 enzyme, E2 enzyme (UbcH5a), ubiquitin (Ub),
Me-Ub (all from Boston Biochem). 7. Proteasome inhibitors: MG132 (Sigma-Aldrich), lactacystin,
clasto-lactacystin- b -lactone. 8. Sf9 insect cells (see Notes 1 and 2). 9. HA-p53, FLAG-MDM2, and FLAG-tagged E4 recombinant
baculoviruses (p53 and MDM2 baculoviruses available on request from Grossman laboratory after execution of MTA agreements—[email protected]) or plasmids encoding truncated or full length FLAG-tagged E4 polypeptides for transfection into human cells.
10. 37°C Water bath or heat block.
1. URB: 25 mM Hepes pH 7.4, 10 mM NaCl, 3 mM MgCl 2 , 0.05% Triton X-100, 0.5 mM DTT.
2. Mg 2+ -ATP (Boston Biochem). 3. URC: E1 enzyme, E2 enzyme (UbcH5a), ubiquitin (Ub),
Me-Ub (all from Boston Biochem). 4. Proteasome inhibitors: MG132 (Sigma-Aldrich), lactacystin,
clasto-lactacystin- b -lactone. 5. Sf 9 insect cells (see Notes 1 and 2). 6. HA-p53, FLAG-MDM2, and FLAG-tagged E4 baculovirus. 7. 37°C Water bath or heat block. 8. (Optional) Nutlin-3a or racemic Nutlin-3 (Sigma-Aldrich).
1. Puri fi ed human 26S proteasomes (BIOMOL or Boston Biochem). 2. URB. 3. In vitro-ubiquitinated p53 reactions from Subheading 3.2 or
Subheading 3.3 . 4. Proteasome inhibitors: MG132 (Sigma-Aldrich), lactacystin,
clasto-lactacystin- b -lactone. 5. Mg 2+ -ATP (Boston Biochem). 6. A 30°C water bath or heat block.
2.3. One-Step E4 Assay
2.4. Two-Step E4 Assay
2.5. In Vitro Proteasomal Degradation Assay
675 p53 Ubiquitination and Proteasomal Degradation
In this assay, HA-ubiquitin is transfected into cells and the substrate is immunoprecipitated after lysis. After separation by SDS-PAGE, ubiquitin conjugates can be visualized by western blot using HA or p53-speci fi c antibodies.
1. Plate cells on 10 cm 2 dishes at a suitable density for next-day transfection (cells should be approximately 60% con fl uent at the time of transfection).
2. Using an appropriate transfection reagent (we recommend Lipofectamine 2000 at a ratio of 2 m L:1 m g DNA into antibi-otic-free media; Fugene will work if Lipofectamine is too cyto-toxic), transfect cells with 2 m g HA-ubiquitin construct, (optionally) 0.1–0.5 m g of p53 expression vector as appropriate, and additional factors (E3 ubiquitin ligases or modi fi ers of sub-strate ubiquitination, for example) as the experiment requires.
3. 32–40 h after transfection, treat cells with 10–20 m M MG132 proteasome inhibitor for 8 h (range of 6–12 h depending on sensitivity to MG132 causing cytotoxicity) to promote the accumulation of polyubiquitinated p53 species.
4. Following MG132 treatment (40–48 h post-transfection), harvest cells in 500 m l RIPA buffer freshly supplemented with NEM (see Note 3; 5 mM) and complete EDTA-free tablets (Roche) and incubate for 30 min on ice.
5. Perform immunoprecipitations on ~0.5 mg (for transfected p53) to ~1 mg (endogenous p53) cleared lysate (14,000 rpm or 19,000 RCF for 10 min) in lysis buffer by adding 1 m g p53 antibody (FL-393, Santa Cruz) to lysates and incubating overnight, rotating at 4°C.
6. Add 20 m L RIPA-washed Protein A or G agarose beads (slurry 20 m l, dry beads in 10 m l) to immunoprecipitation reactions, rotating at 4°C for 2 h.
7. Wash immunoprecipitation reactions fi ve times in cold RIPA lysis buffer supplemented with fresh 5 m M NEM, removing the supernatant after the fi nal wash.
8. Elute bound protein off Protein A or G beads by boiling for 3–5 min using an SDS or LDS sample buffer.
9. Separate eluted protein by SDS-PAGE and transfer as normal (if detection of high molecular weight species is problematic then add 0.01–0.05% SDS to the transfer buffer).
10. Immunoblot using an anti-HA antibody to detect immuno-precipitated high molecular weight ubiquitin conjugates and image. The blot can be reprobed with p53 antibody (DO-1 mouse monoclonal or FL-393 rabbit polyclonal) to detect
3. Methods
3.1. In Vivo Ubiquitination of p53 with HA-Tagged Ubiquitin
68 I.M. Love et al.
short chain or monoubiquitinated p53 species. Detection of high molecular weight polyubiquitin conjugates may require higher exposure times than detection of other proteins.
In this assay, his-ubiquitin is transfected into cells, and his-ubiq-uitin conjugated proteins are pulled down with Ni-NTA beads after lysis. After elution from Ni-NTA beads with imidazole, his-ubiquitin conjugates are separated by SDS-PAGE, and p53-his-ubiquitin conjugates can be visualized by western blot using p53 antibody.
1. Plate cells on 10 cm dishes at a suitable density for next-day transfection (cells should be approximately 60% con fl uent at the time of transfection).
2. Using an appropriate transfection reagent (we recommend Lipofectamine 2000 at a ratio of 2 m L:1 m g DNA and transfec-tion into antibiotic-free media; Fugene if Lipofectamine is too cytotoxic), transfect cells with 2 m g his-ubiquitin construct, p53 expression vector as appropriate (0.1–0.5 m g), and (option-ally) additional factors (E3 ubiquitin ligases or modi fi ers of substrate ubiquitination, for example) as the experiment requires.
3. 32–40 h after transfection, treat cells with 10–20 m M MG132 proteasome inhibitor for 8 h to promote the accumulation of polyubiquitinated p53 species.
4. Following MG132 treatment (40–48 h post-transfection), wash cells twice with cold PBS and harvest cells in 6 ml (per 100 cm dish) guanidinium lysis buffer supplemented with freshly pre-pared NEM (5 mM; see Note 3) and complete EDTA-free tablets (Roche). Allow lysis to occur 30 min on ice.
5. Perform Ni-NTA pulldowns on 1 mg of cleared lysate (spin 14,000 rpm or 19,000 RCF for 10 min) by adding 75 m L Ni 2+ -NTA-agarose bead slurry to lysates and incubating for 2 h, rotating at room temperature.
6. Wash pulldowns successively using 1 ml of the following buf-fers one time each: guanidinium lysis buffer, urea buffer, wash buffer A supplemented with 0.2% Triton X-100, buffer A alone, and buffer A supplemented with 0.1% Triton X-100. At the last wash, carefully remove as much of the supernatant as possible from the beads.
7. Elute bound protein from Ni 2+ -NTA-agarose beads by adding 2–3× bed volume of imidazole elution buffer, incubating 30 min on ice.
8. Dilute eluate with an appropriate SDS-PAGE sample buffer to a fi nal concentration of 1× SDS-PAGE sample buffer; boil samples for 5 min.
3.2. In Vivo Ubiquitination of p53 with His-Tagged Ubiquitin
695 p53 Ubiquitination and Proteasomal Degradation
9. Separate eluted protein by SDS-PAGE and transfer using stan-dard separation and transfer conditions.
10. Immunoblot using an anti-p53 antibody to detect immuno-precipitated ubiquitin conjugates and image. The blot can be reprobed with anti-his antibody to detect total his-ubiquitin conjugates.
The one-step E4 ubiquitin ligase assay allows for the analysis of E4 activity toward a substrate while in the presence of an E3 ligase and all ubiquitination reaction components. p53/MDM2 complexes and E4 truncated or full-length polypeptides af fi nity puri fi ed from Sf9 insect cell lysates and incubated with URC to generate ubiquit-inated p53 species in vitro (see Note 4) .
1. Split Sf 9 cells at 50% con fl uence into 8 ml SF900 II SFM media (Life Technologies).
2. After cells are attached, add 200 m l of passage 2 (P2) baculovi-rus. If p53/Mdm2 complexes are being puri fi ed, the 2 separate viruses are coinfected to facilitate complex formation of p53 and MDM2, with different baculovirus ratios recommended depending on the application: 1:1 p53:Mdm2 is recommended for assays where p53 needs to be ef fi ciently polyubiquitylated, while 10:1 p53:Mdm2 ratio is recommended to produce mono-/oligoubiquitylated p53. For assistance with cloning or producing baculovirus for serial infections, see http://tools.invitrogen.com/content/sfs/manuals/bactobac_man.pdf .
3. After 40–48 h, collect cells and transfer into falcon tubes. Centrifuge 5 min at 500 RCF. Wash cells with ice-cold PBS. Centrifuge again at 500 RCF.
4. Resuspend cells in lysis buffer supplemented with 1 mM PMSF, 1 mM DTT, and phosphatase inhibitors. Use 1 ml of lysis buf-fer for cells from two 10 cm plates. Lyse 30 min at 4°C with end-over-end rotation. Note : For puri fi cation of p53/Mdm2 complexes, use NP-40 lysis buffer. For puri fi cation of CBP or p300 polypeptides, use RIPA lysis buffer.
5. Centrifuge 15 min, 4°C, 14,000 rpm (19,000 RCF). 6. Transfer supernatant to a new tube. 7. Add pre-washed FLAG M2-agarose beads (Sigma)—for
puri fi cation of FLAG-tagged proteins. 8. Incubate at 4°C 2 h—overnight (an overnight incubation will
improve the yield) with end-over-end rotation. 9. Wash beads three times with lysis buffer, then two times with
URB. 10. Aspirate liquid with a fl at tip. Add 2–3 bed volumes of URB
supplemented with FLAG-peptide at 200 ng/ m l. 11. Incubate 2–3 h at 4°C with end-over end rotation.
3.3. One-Step E4 Assay
3.3.1. Production of Protein from Sf9 Cells
70 I.M. Love et al.
12. Collect eluate by transferring to fresh tubes and measure pro-tein concentration. Use this puri fi ed protein fresh, or freeze in small aliquots (add 15% glycerol prior to fl ash freezing in dry ice-ethanol) and store at −80°C.
1. Combine URC (100 ng rabbit E1, 50 ng human E2 UbcH5a, 10 m g ubiquitin (Boston Biochem)) in 20 m L URB supple-mented with 3 mM fresh Mg 2+ -ATP.
2. Add 10–100 ng insect cell puri fi ed p53/MDM2 complex to the ubiquitination reaction.
3. Incubate for 30 min at 37°C. 4. Add 1–100 ng insect cell puri fi ed E4 ubiquitin ligase (E4 activ-
ity should be experimentally determined in this assay). 5. Incubate the reaction further for 60 min at 37°C. 6. Add a suitable SDS or LDS sample buffer to each reaction and
brie fl y boil for 5 min. 7. Separate the p53-ubiquitin conjugates by SDS-PAGE and
immunoblot reaction products using an appropriate p53 or ubiquitin antibody.
The two-step E4 ubiquitin ligase assay allows the analysis of E4 ligase activity toward a substrate in the absence of an E3 ubiquitin ligase. While requiring an additional puri fi cation step, this method provides the added advantage of allowing the distinct contribution of an E4 to substrate ubiquitination to be assessed in the absence of other ubiq-uitin ligase activity in the reaction. Therefore it is critical to differenti-ate the speci fi c ubiquitin signal on substrate from auto-ubiquitination of E3 and E4 ubiquitin ligases. As in the one-step assay, p53, MDM2, and E4 peptides or full-length proteins are af fi nity puri fi ed from Sf9 insect cell lysates. p53 and MDM2 are incubated with URC to gener-ate monoubiquitinated p53, which is then re-puri fi ed and incubated with puri fi ed E4 protein in an additional ubiquitination reaction.
1. Split Sf9 cells at 50% con fl uence into 8 ml SF900 II SFM media (Life Technologies).
2. After cells are attached, add 200 m l of P2 baculovirus. Use a 10:1 p53:Mdm2 ratio to allow production of monoubiquitinated p53 which will serve as an ef fi cient substrate for E4 activity.
3. Refer to Subheading 3.3.1 above, steps 3–12, to complete protein isolation.
1. Combine URC (100 ng rabbit E1, 50 ng human E2 UbcH5a, 10 m g ubiquitin (Boston Biochem) in 20 m L URB supple-mented with 3 mM fresh Mg-ATP.
2. Add 10–100 ng insect-cell puri fi ed p53 and MDM2 to the ubiquitination reaction.
3.3.2. Ubiquitin Ligase Assay
3.4. Two-Step E4 Assay
3.4.1. Production of Protein from Sf9 Cells
3.4.2. Two-Step E4 Assay
715 p53 Ubiquitination and Proteasomal Degradation
3. Incubate for 30 min at 37°C. 4. To immunoprecipitate monoubiquitinated p53, add 0.2 m g
p53 FL-393 antibody conjugated agarose beads for 2 h, rock-ing at 4°C.
5. Wash beads three times with 200 m L lysis buffer (optional: with 20 m M Nutlin-3 or 10 m M Nutlin-3a included; see Note 5), then two times with 200 m L URB to remove residual ubiquitin and MDM2.
6. Add a fresh set of ubiquitination reaction components (100 ng E1, 50 ng UbcH5a, 10 m g FLAG-tagged ubiquitin (Boston Biochem), and 10–100 ng CBP or other E4 puri fi ed in the last step) to the bead-immobilized p53.
7. Incubate at 37°C for 60 min. 8. Wash beads three times with RIPA buffer to remove any CBP
auto-ubiquitination products or untethered polyubiquitin conjugates.
9. Add a suitable SDS or LDS sample buffer to each reaction and brie fl y boil for 5 min.
10. Separate the p53-ubiquitin conjugates by SDS-PAGE and immunoblot reaction products using an appropriate p53 or ubiquitin antibody.
1. After performing in vitro p53 (poly)ubiquitination reactions as described above (see Note 6), preincubate 1 m g puri fi ed 26S proteasomes (see Note 7) with 10 m M each of MG132, lactacystin, and clasto-lactacystin- b -lactone proteasome inhib-itors vs. vehicle for 30 min at 4°C in 15 m l URB (use of pro-teasome inhibitors in control reactions allows con fi rmation that effects seen are due to proteasome degradation and not other effects; see Note 8).
2. Add the ubiquitinated substrate (10–50 ng) in a minimal vol-ume to the pre-incubated proteasome cocktail see Note 9, add fresh 3 mM Mg 2+ -ATP (maximum total volume 20–25 m l), and incubate for 5 h at 37°C see Note 10).
3. Stop the reaction by adding EDTA to a fi nal concentration of 5 mM if not loading on gel immediately, and/or add SDS or LDS sample buffer and boil 5 min.
4. Analyze the degradation reactions by SDS-PAGE and immu-noblot with appropriate p53 antibody (DO-1 preferred due to sensitivity required to detect low abundance high molecular weight species). Quantitate the extent of degradation by den-sitometry or other method comparing the ratio of p53 species above 110 kDa to the abundance of the native band +/− monoubiquitinated bands below 110 kDa.
3.5. In Vitro Proteasome-Dependent Degradation Assay
72 I.M. Love et al.
1. The baculovirus expression system is highly recommended to produce recombinant E3/E4 ubiquitin ligases (MDM2, p300 and CBP). This system boasts a number of advantages in pro-tein production. Most importantly, the system is eukaryotic, producing high-yield recombinant proteins with high solu-bility, as well as proper post-translational modi fi cations including phosphorylation, acetylation, and glycosylation. These modi fi cations may be prerequisites for ubiquitin ligase enzymatic activity in the assay. Additionally, expression of pro-tein complexes can be achieved by simultaneously infecting cells with two or more baculoviruses.
2. Mammalian expression systems can be used, if necessary, to produce recombinant protein, but yields will generally be much lower as compared to the baculovirus/Sf9 system, and must be scaled up accordingly.
3. NEM can be made fresh immediately before use or can be aliquoted from 500 mM stock solution in 100% EtOH stored at −80°C.
4. As an alternative to insect cell production of E4 polypeptides, FLAG-tagged E4 polypeptides (truncated or full-length) can be puri fi ed from transfected human cells though with a lower yield than would be expected using the Sf9 insect cell system. Transfection conditions are as described in 3.1, while puri fi cation of the FLAG-tagged polypeptides is performed as described in 3.3.1 steps 3–12.
5. Nutlin-3, a potent nanomolar inhibitor of the p53-MDM2 interaction, can be used to assist in the removal of MDM2 from ubiquitinated p53 that is to be used as a substrate in the two-step E4 assay. Nutlin-3a is the active enantiomer, so the concentra-tion of racemic nutlin should be doubled relative to nutlin-3a.
6. To achieve optimal degradation in the in vitro proteasome degradation assay, ubiquitinated protein substrates from a prior ubiquitination reaction and a saturating concentration of pro-teasomes should be used in the assay. Also, in the ubiquitina-tion assay, the protein substrate should be ubiquitinated to the maximum extent in the reaction.
7. The degradation activity of proteasome is a key factor in the in vitro proteasome degradation assay. Therefore, it is critical to preserve the enzymatic activity of the proteasome. When ready for use, the proteasome should be thawed by standing on ice and should be used immediately after thawing, as the proteasome complex is labile. Multiple freeze–thaws dramati-cally decrease enzymatic activity and should be avoided.
4. Notes
735 p53 Ubiquitination and Proteasomal Degradation
8. When assessing the impact of small molecules or other regula-tory proteins on in vitro proteasomal degradation, incubate these molecules in URB for 30 min at 4°C (with or without MDM2 or p53 depending on the nature of these modi fi ers) with proteasomes.
9. Ubiquitin aldehyde (2–5 µM) can also be added to the in vitro proteasome degradation assay (added at the same time as pro-teasome inhibitor or vehicle as described in Subheading 3.5.1 ) to enhance degradation by preserving polyubiquitin conju-gates. This modi fi ed ubiquitin is a DUB inhibitor like NEM but not toxic to proteasomes; therefore it is useful in preserv-ing ubiquitin chains after synthesis during subsequent enzy-matic reactions.
10. Fresh Mg 2+ -ATP (added 1–3 mM) can be added halfway through the degradation reaction (after 2–2.5 h) to ensure maximum activity of proteasomes through the entire reaction.
References
1. Pickart CM (2001) Mechanisms underlying ubiquitination. Annu Rev Biochem 70:503–533
2. Grossman SR, Deato ME, Brignone C, Chan HM, Kung AL, Tagami H, Nakatani Y, Livingston DM (2003) Polyubiquitination of p53 by a ubiquitin ligase activity of p300. Science 300(5617):342–344
3. Shi D, Pop MS, Kulikov R, Love IM, Kung AL, Grossman SR (2009) CBP and p300 are cyto-plasmic E4 polyubiquitin ligases for p53. Proc Natl Acad Sci USA 106(38):16275–16280
4. Thrower JS, Hoffman L, Rechsteiner M, Pickart CM (2000) Recognition of the polyubiquitin proteolytic signal. EMBO J 19(1):94–102
5. Behrends C, Harper JW (2011) Constructing and decoding unconventional ubiquitin chains. Nat Struct Mol Biol 5:520–528
6. de Oca M, Luna R, Wagner DS, Lozano G (1995) Rescue of early embryonic lethality in mdm2-de fi cient mice by deletion of p53. Nature 378(6553):203–206
7. Jones SN, Roe AE, Donehower LA, Bradley A (1995) Rescue of embryonic lethality in Mdm2-de fi cient mice by absence of p53. Nature 378(6553):206–208
8. Yu ZK, Geyer RK, Maki CG (2000) MDM2-dependent ubiquitination of nuclear and cyto-plasmic p53. Oncogene 19(51):5892–5897
9. Lai Z, Ferry KV, Diamond MA, Wee KE, Kim YB, Ma J, Yang T, Ben fi eld PA, Copeland RA,
Auger KR (2001) Human mdm2 mediates multiple mono-ubiquitination of p53 by a mechanism requiring enzyme isomerization. J Biol Chem 276(33):31357–31367
10. Dornan D, Wertz I, Shimizu H, Arnott D, Frantz GD, Dowd P, O’Rourke K, Koeppen H, Dixit VM (2004) The ubiquitin ligase COP1 is a critical negative regulator of p53. Nature 429(6987):86–92
11. Le Cam L, Linares LK, Paul C, Julien E, Lacroix M, Hatchi E, Triboulet R, Bossis G, Shmueli A, Rodriguez MS, Coux O, Sardet C (2006) E4F1 is an atypical ubiquitin ligase that modulates p53 effector funct ions independently of degradation. Cell 127(4):775–788
12. Leng RP, Lin Y, Ma W, Wu H, Lemmers B, Chung S, Parant JM, Lozano G, Hakem R, Benchimol S (2003) Pirh2, a p53-induced ubiquitin-protein ligase, promotes p53 degra-dation. Cell 112(6):779–791
13. Love IM, Grossman SR (2012) It Takes 15 to Tango- Making Sense of the Many Ubiquitin Ligases of p53. Genes Can, in press
14. Linares LK, Kiernan R, Triboulet R, Chable-Bessia C, Latreille D, Cuvier O, Lacroix M, Le Cam L, Coux O, Benkirane M (2007) Intrinsic ubiquitination activity of PCAF controls the stability of the oncoprotein Hdm2. Nat Cell Biol 9(3):331–338
75
Sumitra Deb and Swati Palit Deb (eds.), p53 Protocols, Methods in Molecular Biology, vol. 962,DOI 10.1007/978-1-62703-236-0_6, © Springer Science+Business Media New York 2013
Chapter 6
Identi fi cation of p53 in Mitochondria
Angelina V. Vaseva and Ute M. Moll
Abstract
p53 is a master regulator of cell death pathways and has transcription-dependent and transcription-independent modes of action. Mitochondria are major signal transducers in apoptosis and are critical for p53-dependent cell death. Our lab and others have discovered that a fraction of stress-induced wild-type p53 protein rapidly translocates to mitochondria upon various stress stimuli and exerts p53-dependent apoptosis. Suborganellar localization by various methods shows that p53 localizes to the surface of mito-chondria. Direct targeting of p53 to mitochondria is suf fi cient to induce apoptosis in p53-null cells, without requiring further DNA damage. Recently, p53 has been also shown to localize to other mito-chondrial compartments such as the mitochondrial matrix where it plays a role in maintaining mitochon-drial genome integrity. Here, we describe subcellular fractionation as a classic technique for detecting mitochondrial p53 in cell extracts. It consists of cell homogenization by hypo-osmotic swelling, removal of nuclear components by low-speed centrifugation, and mitochondrial isolation by a discontinuous sucrose density gradient. Additionally, we describe a method for submitochondrial fractionation, per-formed by phosphate buffer mediated swelling/shrinking. p53 and other mitochondrial proteins can then be detected by standard immunoblotting procedures. The quality of mitochondrial isolates/sub-fractions can be veri fi ed for purity and intactness.
Key words: p53 , Mitochondria puri fi cation , Submitochondrial fractionation
p53 kills tumor cells by transcriptionally activating gene products that have various roles in the cell death pathway. However, it has long been observed that p53 has a transcription-independent way of killing cells, although no mechanism was known ( 1– 3 ) . Mitochondria are major signal transducers in apoptosis and are critical for p53-dependent cell death. Mitochondria can trigger cell death by releasing cytochrome c and other potent apoptosis activa-tors stored in their intermembraneous space that, once released,
1. Introduction

76 A.V. Vaseva and U.M. Moll
activate effector caspases and break down nuclear chromatin ( 4, 5 ) . Our group and others had discovered that a fraction of stress-induced wild-type p53 protein rapidly translocates to mitochon-dria during p53-dependent apoptosis induced by, e.g., g -irradiation (IR), topoisomerase inhibitors, and hypoxia. This phenomenon is widespread and occurs in human and mouse cultured cells ( 6– 9 ) (see Note 1). The translocation of p53 to mitochondria is rapid (within 1 h after p53 activation) and precedes changes in mito-chondrial membrane potential, cytochrome c release, and procas-pase-3 activation. In contrast, p53 does not translocate during p53-independent apoptosis or p53-mediated cell cycle arrest. Importantly, bypassing the nucleus by targeting p53 to mitochon-dria is suf fi cient to induce apoptosis in p53-null tumor cells and xenografts, without further DNA damage ( 10– 12 ) . Thus, p53 protein is suf fi cient to launch apoptosis directly from the mito-chondria. Although, initially it was considered that the predomi-nant amount of p53 is located at the surface of mitochondria, recently it has been shown that p53 protein can be detected in mitochondrial matrix as well ( 13– 15 ) . This matrix associated sub-fraction of mitochondrial p53 might have a role in normal mito-chondrial homeostasis and/or non-apoptotic outcomes after stress; however, the exact role or mitochondrial matrix associated p53 still remains to be determined.
Subcellular fractionation for mitochondrial enrichment is a major analytical tool for studying mitochondrial translocation of p53. While this method can also be adapted to isolate mitochon-dria from rat or mouse liver ( 16 ) , bovine heart, skeletal muscle ( 17 ) , or yeast ( 18 ) , we focus here on cultured tumor cells, because they are easy to grow and respond well to various treatments with drugs, IR, UV, hypoxia, or transfection. The protocol for isolation of mitochondria is a discontinuous sucrose gradient and follows largely the method described by Bogenhagen and Clayton ( 19 ) . We also describe a fast and easy method for separation of submito-chondrial compartments—outer membrane (OM), intermembrane space (IMS), inner membrane (IM), and matrix (MA). The method involves consecutive swelling and shrinking of isolated mitochon-dria by phosphate buffers and several steps of differential centrifu-gation as described by Hovius et al. ( 20 ) and others ( 21, 22 ) with minor modi fi cations.
1. Con fl uent suspension or adherent cultured cells, treated or untreated with drugs, IR, hypoxia, and/or transfection.
2. TD washing buffer: 135 mM NaCl, 5 mM KCl, 25 mM Tris–HCl, pH 7.6, ice-cold. To make a 10× solution: 39.15 g NaCl,
2. Materials
2.1. Mitochondria Isolation
776 Identifi cation of p53 in Mitochondria
1.85 g KCl, 15.15 g Tris–HCl, 3.485 g Tris-base, 0.5 g Na 2 HPO 4 . Add water up to 500 mL. Store at 4°C.
3. CaRSB buffer: 10 mM NaCl, 1.5 mM CaCl 2 , 10 mM Tris–HCl, pH 7.5, ice-cold. Mix together 1 mL 5 M NaCl, 750 m L 1 M CaCl 2 , 5 mL 1 M Tris–HCl, pH 7.5. Add water up to 500 mL.
4. MS buffer: 210 mM mannitol, 70 mM sucrose, 5 mM ethylenediamine tetraacetic acid (EDTA), 5 mM Tris, pH 7.6, ice -cold. To make a 2.5× solution: 38.26 g mannitol, 23.96 g sucrose, 5 mL 1 M Tris–HCl, pH 7.6, 20 mL 0.25 M EDTA, pH 7.4. Add water up to 400 mL. Store at 4°C.
5. Sucrose buffer: 1 M or 1.5 M sucrose, 2 mM dithiothreitol (DTT), 5 mM EDTA, 10 mM Tris, pH 7.6. Mix together 34.24 or 51.34 g sucrose, 200 m L 1 M DTT, 2 mL 0.25 M EDTA, 1 mL 1 M Tris–HCl, pH 7.6. Add water up to 100 mL. Store at 4°C.
6. Protease inhibitors (Roche Molecular Biochemicals, Indianapolis, IN, USA). Should be made fresh and added to each solution. Store as recommended by company.
7. Glass Dounce homogenizer (Kimble/Kontes, Vineland, NJ, USA), fi t A.
8. Low-speed centrifuge with swinging bucket rotor. 9. Table-top refrigerated microcentrifuge (e.g., Eppendorf ®
microcentrifuge). 10. Ultracentrifuge with swinging bucket rotor (e.g., Rotor type
SW41; Beckman Coulter, Fullerton, CA, USA: cat. no. L8-80M).
11. 10% Sodium dodecyl sulfate (SDS) acrylamide gel. 12. Tris-buffered saline with Tween ® 20 (TBST) buffer. For 8 L of
stock solution: 80 mL 1 M Tris–HCl, pH 8.0, 20.4 g NaCl, 4 mL 20% Tween 20. Add distilled water (dH 2 O) up to 8 L. Store at room temperature.
1. Swelling buffer: 10 mM KH 2 PO 4 , pH 7.4. Dissolve 680 mg KH 2 PO 4 in water up to 500 mL, adjust pH to 7.4.
2. Shrinking buffer: 10 mM KH 2 PO 4 , pH 7.4, 32% sucrose, 30% glycerol, 10 mM MgCl 2 . Mix together 16 g sucrose, 15 mL glycerol, 476 mg MgCl 2 , add 10 mM KH 2 PO 4 , pH 7.4 up to 500 mL.
3. Protease inhibitors (Roche Molecular Biochemicals, Indianapolis, IN, USA). Protease inhibitors (Roche Molecular Biochemicals, Indianapolis, IN, USA).
4. Ultracentrifuge with swinging bucket rotor (e.g., Rotor type SW41; Beckman Coulter, Fullerton, CA, USA: cat. no. L8-80M).
2.2. Submitochondrial Fractionation
78 A.V. Vaseva and U.M. Moll
5. Table-top refrigerated microcentrifuge (e.g., Eppendorf ® microcentrifuge).
6. Refrigerated centrifugal concentrator (or centrifugal fi lters, e.g., Amicon Ultra centrifugal fi lters for protein puri fi cation and concentration).
1. Pellet suspension cells by spinning for 5 min at 1,000–3,000 × g at 4°C in low-speed centrifuge with swinging rotor (see Note 2).
2. Aspirate media completely. 3. Resuspend cells from 100 mL culture into 50 mL 1× TD buf-
fer, ice-cold (see Note 3). 4. Pellet cells by spinning for 5 min at 1,000–3,000 × g at 4°C.
1. Discard supernatant completely and resuspend cells into CaRSB buffer containing protease inhibitors. Use approxi-mately 10× volume of packed cells.
2. Leave on ice for 10 min to let cells swell; monitor swelling under microscope.
3. Transfer cells to ice-cold glass Dounce homogenizer and homogenize on ice with frequent monitoring under micro-scope (see Note 4).
4. Quickly add 2 mL of 2.5× MS buffer containing protease inhibi-tor per 3 mL homogenate. Transfer an aliquot to another tube for Western blotting to check for nuclear contamination. Another aliquot is used for protein determination (see Note 5).
5. Transfer the rest of the homogenate to centrifuge tubes and spin down nuclei for 5 min at 1,000–3,000 × g at 4°C. Decant supernatant into new clean tube and repeat again (see Note 6).
1. Make a discontinuous sucrose gradient in a ultracentrifuge tube (Polyallomer tubes; Beckman Coulter; cat. no. 331372) by carefully layering 3 mL of 1 M sucrose buffer on top of 3 mL of 1.5 M sucrose buffer (each containing protease inhibi-tors) (see Note 7).
2. After spinning, take supernatant of homogenate (from Subheading “Homogenize Cells,” step 5) and apply carefully on top of the sucrose gradient.
3. Ultracentrifuge the gradient in a SW41 swinging bucket rotor for 35 min at 26,000 rpm (85,000 × g ) at 4°C.
3. Methods
3.1. Isolation of Mitochondria
3.1.1. Suspension Culture Cells
Prepare Cells
Homogenize Cells
Isolate Mitochondria
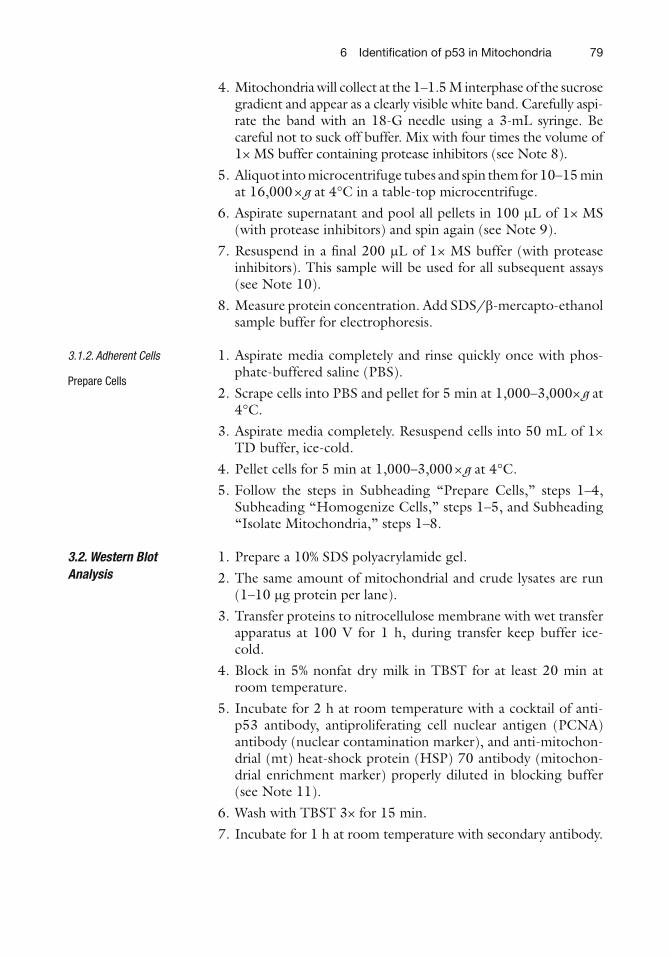
796 Identifi cation of p53 in Mitochondria
4. Mitochondria will collect at the 1–1.5 M interphase of the sucrose gradient and appear as a clearly visible white band. Carefully aspi-rate the band with an 18-G needle using a 3-mL syringe. Be careful not to suck off buffer. Mix with four times the volume of 1× MS buffer containing protease inhibitors (see Note 8).
5. Aliquot into microcentrifuge tubes and spin them for 10–15 min at 16,000 × g at 4°C in a table-top microcentrifuge.
6. Aspirate supernatant and pool all pellets in 100 m L of 1× MS (with protease inhibitors) and spin again (see Note 9).
7. Resuspend in a fi nal 200 m L of 1× MS buffer (with protease inhibitors). This sample will be used for all subsequent assays (see Note 10).
8. Measure protein concentration. Add SDS/ b -mercapto-ethanol sample buffer for electrophoresis.
1. Aspirate media completely and rinse quickly once with phos-phate-buffered saline (PBS).
2. Scrape cells into PBS and pellet for 5 min at 1,000–3,000× g at 4°C.
3. Aspirate media completely. Resuspend cells into 50 mL of 1× TD buffer, ice-cold.
4. Pellet cells for 5 min at 1,000–3,000 × g at 4°C. 5. Follow the steps in Subheading “Prepare Cells,” steps 1–4,
Subheading “Homogenize Cells,” steps 1–5, and Subheading “Isolate Mitochondria,” steps 1–8.
1. Prepare a 10% SDS polyacrylamide gel. 2. The same amount of mitochondrial and crude lysates are run
(1–10 m g protein per lane). 3. Transfer proteins to nitrocellulose membrane with wet transfer
apparatus at 100 V for 1 h, during transfer keep buffer ice-cold.
4. Block in 5% nonfat dry milk in TBST for at least 20 min at room temperature.
5. Incubate for 2 h at room temperature with a cocktail of anti-p53 antibody, antiproliferating cell nuclear antigen (PCNA) antibody (nuclear contamination marker), and anti-mitochon-drial (mt) heat-shock protein (HSP) 70 antibody (mitochon-drial enrichment marker) properly diluted in blocking buffer (see Note 11).
6. Wash with TBST 3× for 15 min. 7. Incubate for 1 h at room temperature with secondary antibody.
3.1.2. Adherent Cells
Prepare Cells
3.2. Western Blot Analysis
80 A.V. Vaseva and U.M. Moll
8. Wash with TBST 3× for 15 min. 9. Develop with enhanced chemiluminescence reagent (Luminol
Reagent; Pierce Chemical, Rockford, IL, USA).
1. Obtain mitochondria suspension in 1×MS buffer, prepared fol-lowing the procedure above. Take a small aliquot, lyse the mitochondria, and determine protein concentration using, for example, Bradford assay.
1. Pellet mitochondria by spinning the mitochondrial suspension from step 1 of Subheading 3.3.1 for 10 min at 16,000 × g using table-top centrifuge at 4°C. Aspirate completely all traces of MS buffer.
2. Resuspend the mitochondrial pellet in swelling buffer at a concentration 200 m g mitochondrial protein/mL. The volume of swelling buffer to use should be calculated using the concentration of mitochondrial protein obtained in step 1 of Subheading 3.3.1 .
3. Incubate the mitochondria in swelling buffer for 20 min at 4°C. Mix gently every 5 min.
4. Add the same volume of shrinking buffer (see Note 12). 5. Spin down at 10,000 × g for 10 min (see Note 13). 6. Transfer the supernatant containing outer membrane and
intermembrane space fractions into fresh tube. Label the tube “OM&IMS.”
7. Wash the mitoplasts pellet from step 5 by adding 1:1 mixture of swelling and shrinking buffer and spin down 10,000 × g for 10 min. Repeat at least one more time (see Note 14).
8. After washing, resuspend the mitoplasts in swelling buffer and incubate for 20 min at 4°C. Mix gently every 5 min. Use the same volume of buffer as used in step 2. Label the tube “IM&MA” (see Note 15).
9. Spin down tubes “OM&IMS” and “IM&MA” at 14,000 × g for 60 min, 4°C, using ultracentrifuge.
10. Transfer supernatants into fresh tubes and label the tubes “IMS” and “MA.” The pellets represent OM and IM.
11. Concentrate the IMS and MA fractions using refrigerated cen-trifugal concentrator or centrifugal fi lters. If using centrifugal fi lters, follow the manufacturer instructions.
12. Resuspend the OM and IM pellets in 1× SDS/ b -mercapto-ethanol sample buffer, add up to 1× sample buffer to the con-centrated IMS and MA, and boil 5 min 100°C (see Note 16).
13. Perform Western blotting as described in Subheading 3.2 (see Note 17 and Table 1 ).
3.3. Submitochondrial Fractionation
3.3.1. Determine Mitochondrial Protein Concentration
3.3.2. Separate Outer Membrane, Intermembrane Space, Inner Membrane, and Matrix

816 Identifi cation of p53 in Mitochondria
1. A death stimulus is required to induce endogenous wild-type p53 to translocate to mitochondria. Mitochondria from unstimulated cells have small levels of mitochondrial p53, which are sometimes hard to detect by western blotting. g -IR, DNA damaging agents (e.g., 5 m M camptothecin for 6 h), or hypoxia (125 m M desferoxamine for 5 h or GasPak pouches; Becton Dickinson, Franklin Lakes, NJ, USA) induce mito-chondrial p53 ( 6, 7 ) . Cancer cell lines with mutant p53 exhibit mitochondrial p53 constitutively without prior DNA damage ( 8 ) . When mitochondrially targeted p53 fusion pro-tein is transfected (the LFp53wt plasmid used in refs. 10– 12 ) , mitochondrial p53 is clearly detectable by immuno fl uorescence analysis.
2. First resuspend pellet in about 5 mL of CaRSB buffer by pipetting up and down, then add the rest of the buffer. For some cell types, it is dif fi cult to ascertain whether they undergo swelling within 10 min. In that case, it is acceptable to keep
4. Notes
Table 1 Antibodies
Name Origin Dilution Company
Anti-p53 DO-1 Mouse IgG 2a 1:1,000 Santa Cruz Biotechnology (Santa Cruz, CA, USA)
Anti-PCNA PCNA (PC10) Mouse IgG 2a 1:1,000 Santa Cruz Biotechnology (Santa Cruz, CA, USA)
Anti-mt hsp70 Mitochondrial heat-shock protein 70
Mouse IgG 3 1:1,000 Af fi nity Bioreagents (Golden, CO, USA)
Anti-mt hsp60 Mitochondrial heat-shock protein 60
Mouse IgG 2a 1:1,000 Af fi nity Bioreagents (Golden, CO, USA)
Anti-cytochrome c Cytochrome c Mouse IgG 2b k 1:1,000 BD Biosciences (San Jose, CA, USA)
Anti-VDAC Voltage-Dependent Anion Channel
Mouse IgG 2b 1:1,000 Calbiochem
Anti-cyclophilin D Cyclophilin D Mouse IgG 1 1:1,000 Calbiochem
Anti-CoxIV OxPhos Complex IV subunit I
Mouse IgG 2a k 1:1,000 Invitrogen (Camarillo, CA, USA)

82 A.V. Vaseva and U.M. Moll
cells in TD buffer or in growth medium and only remove small aliquots to try out the proper swelling time. Compare with cell shape prior to swelling and observe enlargement under the microscope. ML-1 cells (human chronic myelogenous leuke-mia line) are the standard cell line for verifying swelling.
3. How many strokes are needed? It really depends on the type of cells. Homogenize to the point where ideally 70–90% of the cells are broken, but the nuclei are still intact (they appear as smooth round small spheres under the phase optic micro-scope). The nuclei of some cell lines are very fragile. Some cell lines need 100 strokes, others need only 10. To deter-mine the proper number of strokes, visually monitor after every 5 strokes.
4. Usually 100 m L of crude cell extract is enough. 5. To avoid nuclear contamination, the second centrifugation is
critical. A third spin is even recommended if the second spin still produces a signi fi cant nuclear pellet. Although 5 min is enough for centrifugation, it can be extended until 15 min. Do not disturb the pellet when removing the supernatant. Decanting is better than pipetting. Although pure mitochon-dria will be isolated with the following sucrose gradient, wash-ing the nuclear pellet to obtain a higher yield of mitochondria is not recommended, because some cell lines have very fragile nuclei that may release nuclear proteins.
6. In preparation for the experiments, the rotor and rotor buckets should be placed at 4°C and −20°C, respectively.
7. Do not disturb the mitochondrial shelf. Another white ring on top of the sucrose gradient contains smaller organelles (e.g., lysosomes, peroxisomes).
8. Pipette very gently up and down as to not break the mitochondria.
9. After this step, the mitochondria can also be resuspended in cell lysis buffer for subsequent co-immunoprecipitation experiments.
10. An example of the antibody combination is given in Table 1 . To verify the absence of nuclear contamination, we found that PCNA is highly sensitive.
11. For all the antibodies described in Table 1 , we use sheep anti-mouse immunoglobulin (IgG) (peroxidase-linked, species-speci fi c whole antibody) (Amersham Pharmacia Biotech, Piscataway, NJ, USA). Use 1:2,000 dilution in blocking buffer.
12. During the incubation with swelling buffer, the outer mito-chondrial membrane bursts, while inner membrane stays intact. Shrinking buffer is added to prevent bursting of the inner mitochondrial membrane during the subsequent spinning.
836 Identifi cation of p53 in Mitochondria
13. During this spin the intact mitoplasts are pelleted down, while the supernatant contains OM and IMS.
14. Washing the mitoplast pellet will eliminate contamination from OM and IMS. Second wash is necessary for obtaining clean fractions.
15. During this step the inner membrane (IM) bursts and the fol-lowing centrifugation separates IM from MA. Alternatively, one can sonicate to disrupt the IM: sonication twice at 40 W for 15 s with a 1 min interval is suf fi cient.
16. If determining protein concentration is necessary, one can resuspend the OM and IM pellets in RIPA buffer—25 mM Tris, pH 8.2, 50 mM NaCl, 0.5% NP40, 0.5% deoxycholate, 0.1% SDS, and protease inhibitors.
17. To verify the purity of the fractions, protein markers for each fraction are needed. For OM we use VDAC, for IMS—cytochrome C, for IM—coxIV and for MA—cyclophilin D. See Table 1 for antibody information.
References
1. Levine AJ (1997) p53, the cellular gatekeeper for growth and division. Cell 88:323–331
2. Harris CC (1996) Structure and function of the p53 tumor suppressor gene: clues for ratio-nal cancer therapeutic strategies. J Natl Cancer Inst 88:1442–1455
3. Gottlieb TM, Oren M (1998) p53 and apopto-sis. Semin Cancer Biol 8:359–368
4. Brenner C, Kroemer G (2000) Apoptosis. Mitochondria – the death signal integrators. Science 289:1150–1151
5. Moll UM, Zaika A (2001) Nuclear and mito-chondrial apoptotic pathways of p53. FEBS Lett 493:65–69
6. Marchenko ND, Zaika A, Moll UM (2000) Death signal-induced localization of p53 protein to mitochondria. A potential role in apoptotic signaling. J Biol Chem 275:16202–16212
7. Sansome C, Zaika A, Marchenko ND, Moll UM (2001) Hypoxia death stimulus induces translocation of p53 protein to mitochondria. Detection by immuno fl uorescence on whole cells. FEBS Lett 488:110–115
8. Mihara M, Erster S, Zaika A, Petrenko O, Chittenden T, Pancoska P, Moll UM (2003) p53 has a direct apoptogenic role at the mito-chondria. Mol Cell 11:577–590
9. Chipuk JE, Kuwana T, Bouchier-Hayes L, Droin NM, Newmeyer DD, Schuler M, Green DR (2004) Direct activation of Bax by p53
mediates mitochondrial membrane permeabili-zation and apoptosis. Science 303:1010–1014
10. Talos F, Petrenko O, Mena P, Moll UM (2005) Mitochondrially targeted p53 has tumor suppressor activities in vivo. Cancer Res 65:9971–9981
11. Palacios G, Moll UM (2006) Mitochondrially targeted wild-type p53 suppresses growth of mutant p53 lymphomas in vivo. Oncogene 25:6133–6139
12. Palacios G, Crawford HC, Vaseva A, Moll UM (2008) Mitochondrially targeted wild-type p53 induces apoptosis in a solid human tumor xenograft model. Cell Cycle 7(16):2584–2590
13. Achanta G, Sasaki R, Feng L, Carew JS, Lu W, Pelicano H, Keating MJ, Huang P (2005) Novel role of p53 in maintaining mitochon-drial genetic stability through interaction with DNA Pol gamma. EMBO J 24:3482–3492
14. de Souza-Pinto NC, Harris CC, Bohr VA (2004) p53 functions in the incorporation step in DNA base excision repair in mouse liver mitochondria. Oncogene 23:6559–6568
15. Yoshida Y, Izumi H, Torigoe T, Ishiguchi H, Itoh H, Kang D, Kohno K (2003) P53 physi-cally interacts with mitochondrial transcription factor A and differentially regulates binding to damaged DNA. Cancer Res 63:3729–3734
16. Vamecq J, Van Hoof F (1984) Implication of a peroxisomal enzyme in the catabolism of glu-taryl-CoA. Biochem J 221:203–211

84 A.V. Vaseva and U.M. Moll
17. Bhattacharya SK, Thakar JH, Johnson PL, Shanklin DR (1991) Isolation of skeletal mus-cle mitochondria from hamsters using an ionic medium containing ethylenediaminetetraa-cetic acid and nagarse. Anal Biochem 192:344–349
18. Beauvoit B, Rigoulet M, Guerin B (1989) Thermodynamic and kinetic control of ATP synthesis in yeast mitochondria: role of delta pH. FEBS Lett 244:255–258
19. Bogenhagen D, Clayton DA (1974) The num-ber of mitochondrial deoxyribonucleic acid genomes in mouse L and human HeLa cells. Quantitative isolation of mitochondrial deoxy-ribonucleic acid. J Biol Chem 249:7991–7995
20. Hovius R, Lambrechts H, Nicolay K, de Kruijff B (1990) Improved methods to isolate and subfractionate rat liver mitochondria. Lipid composition of the inner and outer membrane. Biochim Biophys Acta 1021:217–226
21. Bijur GN, Jope RS (2003) Rapid accumulation of Akt in mitochondria following phosphati-dylinositol 3-kinase activation. J Neurochem 87:1427–1435
22. Milon L, Meyer P, Chiadmi M, Munier A, Johansson M, Karlsson A, Lascu I, Capeau J, Janin J, Lacombe ML (2000) The human nm23-H4 gene product is a mitochondrial nucleoside diphosphate kinase. J Biol Chem 275:14264–14272

85
Sumitra Deb and Swati Palit Deb (eds.), p53 Protocols, Methods in Molecular Biology, vol. 962,DOI 10.1007/978-1-62703-236-0_7, © Springer Science+Business Media New York 2013
Chapter 7
Identi fi cation of Novel Mutant p53 Interacting Proteins by Proteomic Analysis
Sumitra Deb and Paul R. Graves
Abstract
Protein–protein interaction studies can provide valuable insight into protein function. One of the most practical and high-yielding approaches is immunoprecipitation of a bait protein followed by mass spec-trometry to identify co-precipitating proteins. Here we describe an effective and simpli fi ed version of this method that can be performed in most laboratories using standard laboratory equipment (apart from the mass spectrometer). We further demonstrate the utility of this method to identify proteins that speci fi cally interact with mutant forms of the tumor suppressor protein, p53.
Key words: Proteomics , Mutant p53 , Mass spectrometry , Co-precipitation
Protein–protein interactions are essential to the function of all pro-teins and help de fi ne their biological roles. Therefore, identi fi cation of protein binding partners can yield important information about protein functions in normal or diseased cellular processes. To identify protein interactions, a wide variety of approaches have been devised that can be broadly grouped into two different categories. One, in vitro interaction studies, and two, those performed in intact cells. In vitro protein interaction studies include the use of proteins immo-bilized on various surfaces (protein chips) ( 1 ) and have the advantage that both low and high abundant proteins can be presented for bind-ing studies in equimolar amounts. This allows the large bias against low abundant proteins to be overcome. However, in vitro studies may also result in binding artifacts as cellular constituents and cellular organization is absent. In contrast, protein interaction techniques conducted in vivo to identify protein interactions, such as bimolecular
1. Introduction
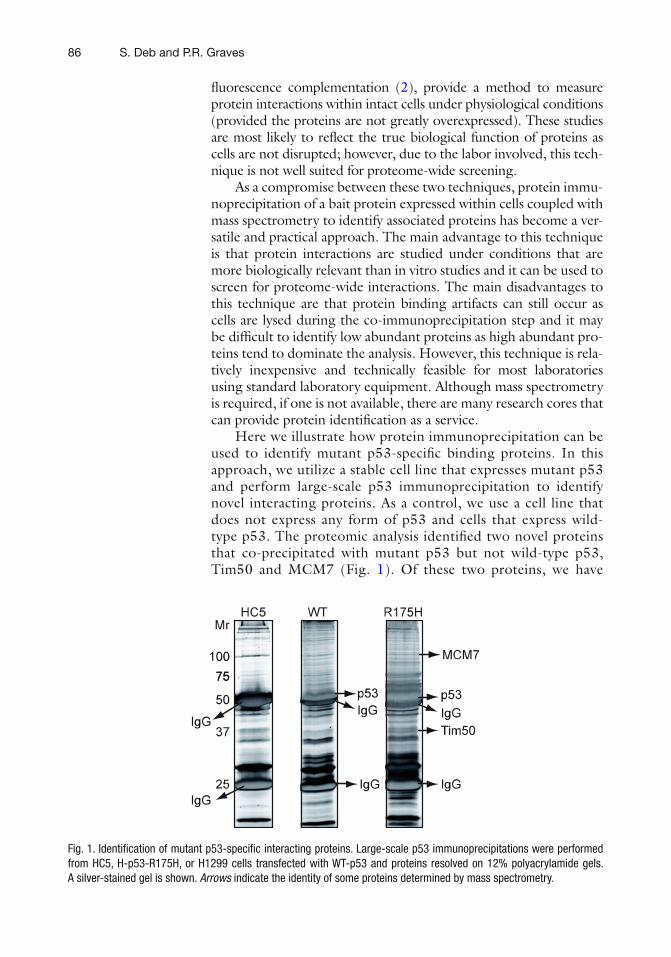
86 S. Deb and P.R. Graves
fl uorescence complementation ( 2 ) , provide a method to measure protein interactions within intact cells under physiological conditions (provided the proteins are not greatly overexpressed). These studies are most likely to re fl ect the true biological function of proteins as cells are not disrupted; however, due to the labor involved, this tech-nique is not well suited for proteome-wide screening.
As a compromise between these two techniques, protein immu-noprecipitation of a bait protein expressed within cells coupled with mass spectrometry to identify associated proteins has become a ver-satile and practical approach. The main advantage to this technique is that protein interactions are studied under conditions that are more biologically relevant than in vitro studies and it can be used to screen for proteome-wide interactions. The main disadvantages to this technique are that protein binding artifacts can still occur as cells are lysed during the co-immunoprecipitation step and it may be dif fi cult to identify low abundant proteins as high abundant pro-teins tend to dominate the analysis. However, this technique is rela-tively inexpensive and technically feasible for most laboratories using standard laboratory equipment. Although mass spectrometry is required, if one is not available, there are many research cores that can provide protein identi fi cation as a service.
Here we illustrate how protein immunoprecipitation can be used to identify mutant p53-speci fi c binding proteins. In this approach, we utilize a stable cell line that expresses mutant p53 and perform large-scale p53 immunoprecipitation to identify novel interacting proteins. As a control, we use a cell line that does not express any form of p53 and cells that express wild-type p53. The proteomic analysis identi fi ed two novel proteins that co-precipitated with mutant p53 but not wild-type p53, Tim50 and MCM7 (Fig. 1 ). Of these two proteins, we have
Fig. 1. Identi fi cation of mutant p53-speci fi c interacting proteins. Large-scale p53 immunoprecipitations were performed from HC5, H-p53-R175H, or H1299 cells transfected with WT-p53 and proteins resolved on 12% polyacrylamide gels. A silver-stained gel is shown. Arrows indicate the identity of some proteins determined by mass spectrometry.

877 Identifi cation of Novel Mutant p53 Interacting Proteins by Proteomic Analysis
con fi rmed that MCM7 does indeed show speci fi c binding to mutant p53 but not WT p53 upon co-expression in H1299 cells (Fig. 2 ). The other protein identi fi ed, Tim50, was shown to be upregulated by mutant p53 at the transcriptional level ( 3 ) . Thus, these results illustrate the practical feasibility of this method to identify novel protein–protein interactions or targets of mutant p53.
All media components for the growth of cells must be sterile and preparation of media conducted in a sterile environment. Tissue culture maintenance is conducted in a sterile tissue culture hood and cells grown at 37°C in a CO 2 incubator.
1. Cell media: DMEM (Dulbecco’s modi fi ed Eagle’s medium) supplemented with fetal bovine serum (FBS) and Gentamicin. A gentamicin stock solution of 10 mg/ml was generated, sterile- fi ltered, and stored in aliquots at −20°C.
2. Cell passaging and harvesting: Trypsin–EDTA and PBS (phos-phate-buffered saline).
3. Cell transfection: Lipofectamine-2000 and highly puri fi ed DNA stock (see Note 1).
2. Materials
2.1. Cell Growth, Maintenance, and Transfection
Fig. 2. Con fi rmation of the speci fi c interaction between mutant p53 and MCM7. H1299 cells were transfected with Myc-MCM7 alone or together with FLAG-WT-p53 or FLAG-R175H-p53 and FLAG immunoprecipitations performed. Although all proteins were expressed to rela-tively equal levels (see total lysates), only FLAG-R175-p53 immunoprecipitants contained signi fi cant amounts of MCM7 protein (see FLAG immunoprecipitations).
88 S. Deb and P.R. Graves
1. Mammalian cell lysis buffer: 50 mM Tris–HCl, pH 7.5, 150 mM NaCl, 0.5% NP-40, 2 mM EDTA, and 1 m M EDTA-free protease inhibitor cocktail (Roche, Indianapolis, IN).
2. Antibody to bait protein (p53): The p53 DO-1 antibody, con-jugated to agarose, was used for p53 immunoprecipitation (#sc-126AC, Santa Cruz, Biotech).
3. SDS sample buffer: 8.75 ml 1 M Tris–HCl, pH 6.8, 7.5 ml glycerol, 2.5 g SDS.
4. 2.33 g DTT, 0.1 ml Bromophenol blue solution (100 mg Bromophenol blue in 5 ml water).
5. Q.s. to 25 ml. Aliquot into 1.5 ml tubes and store at −20°C. 6. Epitope-tagged protein immunoprecipitation: Anti-myc and
Anti-FLAG agarose (Sigma) (see Note 2).
1. Running gel: 30:0.8% polyacrylamide/bis-acrylamide solu-tion, 1.5 M Tris–HCl, pH 8.8, 10% SDS, 10% ammonium per-sulfate, TEMED. Stacking gel: 0.5 M Tris–HCl, pH 6.8. Molecular weight markers (Bio-Rad).
2. SDS-PAGE running buffer: 1× stock (1 L): 3 g Tris, 14 g gly-cine, and 1 g SDS.
3. Silver staining of protein gels: sodium thiosulfate, silver nitrate, 37% formaldehyde, methanol, glacial acetic acid, potassium carbonate.
1. Excision of protein bands: clean glass plate, razor blades, and siliconized tubes.
2. Silver stain removal: sodium thiosulfate, potassium ferricya-nide, ammonium bicarbonate, acetonitrile, formic acid.
3. In-gel digestion of proteins with trypsin: ammonium bicar-bonate, trypsin resuspension buffer (Promega, #V5111), and sequencing grade modi fi ed porcine Trypsin (Promega, #V5111).
1. Peptide puri fi cation: Poros 20 R2 reverse phase packing (Applied Biosystems, Foster City, CA), NanoES spray capillar-ies (Proxeon, Odense, Denmark), methanol, formic acid (see Note 3).
1. Protein transfer: Western transfer buffer, 1× (1 L): 14.4 g gly-cine, 3 g Tris, 0.2 g SDS. Dissolve components and q.s. to 1 L with water but add 200 ml of methanol (20% methanol fi nal). Nitrocellulose, Western blocking reagent in TBS-T (Bio-Rad), TBS-T (1×): 25 mM Tris–HCl, pH 7.5, 150 mM NaCl, 0.1% Tween-20.
2.2. Immuno-precipitation of the Bait Protein, Mutant p53
2.3. SDS-Polyacrylamide Electrophoresis and Silver Staining
2.4. Excision of Protein Bands, Silver Stain Removal, and Trypsin Digestion
2.5. Mass Spectrometry
2.6. Con fi rmation by Western Blotting
897 Identifi cation of Novel Mutant p53 Interacting Proteins by Proteomic Analysis
2. Myc-agarose and FLAG-agarose were obtained from Sigma. Primary antibodies for detection of proteins included: Anti-FLAG and anti-Myc antibodies obtained from Sigma and Santa Cruz Biotech, respectively. Anti-actin antibodies (#1615) and anti-p53 antibodies (#9282) were obtained from Santa Cruz Biotech and Cell Signaling, respectively. Secondary antibodies included IRDye800-conjugated af fi nity-puri fi ed rabbit anti-IgG (Rockland Immunochemicals, Gilbertsville, PA), Alexa Fluor 680-conjugated goat anti-mouse IgG antibody (Molecular Probes, Invitrogen, Carlsbad, PA), and Alexa Fluor 680-conjugated rabbit anti-goat IgG antibody (Invitrogen, Carlsbad, CA) (see Note 4).
The cell lines used in this study were derived from H1299 cells which is a p53 null, non-small cell lung carcinoma cell line. Clones of H1299 cells were isolated that stably maintained the control vec-tor (designated HC5 cells) or a vector expressing the p53 gain of function mutant, R175H (designated here as H-p53-R175H) as previously described ( 4– 6 ) . To express Wild-type (WT) p53, H1299 cells were transfected with DNA encoding WT p53 using Lipofectamine-2000 according to the manufacturer’s instructions.
1. Cell lines were grown in DMEM supplemented with 10% (v/v) FBS and 400 m g/ml Gentamicin to maintain selection for sta-ble clones. Approximately, hundred 10-cm dishes of HC5 or H-p53-R175H cells, respectively, were grown to ~80% con fl uence and harvested by trypsinization to collect adherent cells. The trypsin was inactivated by addition of fresh media to the plates and cells were subsequently collected by centrifuga-tion (5 min at 1,000 rpm). The supernatant was discarded and the resultant cell pellet was washed 2× with 1× PBS and the cell pellet (approximately 5 g) was stored at −80°C.
1. The cell pellet was lysed in mammalian cell lysis buffer (50 mM Tris–HCl, pH 7.5, 150 mM NaCl, 0.5% NP-40, 2 mM EDTA, and 1 m M EDTA-free protease inhibitor cocktail (Roche, Indianapolis, IN)). Cell lysates were clari fi ed by centrifugation at 13,000 × g for 20 min and the resultant supernatant mixed with 250 m g of p53 DO-1 antibody conjugated agarose (#sc-126AC, Santa Cruz, Biotech) and left on a rotator overnight at 4°C.
2. The next day, the antibody-agarose conjugate was collected by gentle centrifugation (1,000 rpm for 2 min), and then washed
3. Methods
3.1. Cell Growth and Harvesting
3.2. Immuno-precipitation of the Bait Protein, Mutant p53

90 S. Deb and P.R. Graves
four times with cold lysis buffer (1 ml each wash), once with cold PBS, the supernatant removed, and the beads incubated for 5 min at 100°C in 2× SDS sample buffer.
1. Fresh running and stacking gels were poured the day of the experiment. For two 12% mini-gels, 10 ml of running gel solution was prepared: (2.5 ml of 1.5 M Tris–HCl, pH 8.8, 0.1 ml of 10% SDS, 4 ml of 30:0.8 acrylamide:bis-acrylamide solution, and q.s. to 10 ml with water). Gel polymerization is initiated by the addition of 100 m L of 10% ammonium per-sulfate and 10 m L TEMED. A solution of 0.1% SDS in water was overlaid on the running gel to allow for gel polymeriza-tion. Then, 5 ml of stacking gel was prepared: (1.25 ml of 0.5 M Tris–HCl, pH 6.8, 50 m L of 10% SDS, 1 ml of 30:0.8 acrylamide:bis-acrylamide solution, and q.s. to 5 ml with water). Stacking gel polymerization is initiated by the addi-tion of 50 m L of 10% ammonium persulfate and 5 m L TEMED and a 10-well gel comb was immediately inserted into the stacking gel.
2. Approximately 50 m L of sample in SDS sample buffer was loaded per lane along with protein molecular weight standards separated by several empty wells. Samples were resolved using the Bio-Rad Mini-Protean II electrophoresis system and elec-trophoresis carried out for approximately 45 min at 200 V, constant voltage.
3. After the electrophoresis was completed, the gels were disas-sembled and placed in a plastic tray in fi xing solution consist-ing of 10% acetic acid/10% methanol/water on a table-top shaker at slow speed so as not to damage the gels. The gels were fi xed for a minimum time of 30 min or left overnight on the shaker.
4. After fi xing, the fi xing solution was removed and gels were washed 4× in water. Each wash lasted at least 5 min and after each wash, the water was replaced with distilled, puri fi ed water.
5. Gels were then incubated in a solution of sodium thiosulfate (0.18 g/500 ml of water) for 90 s. The sodium thiosulfate solution must be made fresh each time and some of the solu-tion (~20 ml) is saved for the developing step.
6. At the end of the 90 s, the sodium thiosulfate solution is dis-carded and the gels are washed again with water 3× in rapid succession (gels are covered with water and then wash water instantly discarded).
7. After the washes, the gels are stained in solution of silver nitrate (0.9 g silver nitrate in 500 ml water) for at least 10 min, with no maximum time limit. The gels should turn slightly yellow. At the end of the staining period, the silver nitrate is recovered
3.3. SDS-Polyacrylamide Electrophoresis and Silver Staining

917 Identifi cation of Novel Mutant p53 Interacting Proteins by Proteomic Analysis
for re-use and the gels are washed with water 3× in rapid succession (gels are covered with water and then water instantly discarded).
8. The gels are developed by addition of developing solution: 10 g potassium carbonate, 20 ml sodium thiosulfate solution (from the fi rst step), and 250 m L 37% formaldehyde in a total volume of 500 ml, q.s. with de-ionized, puri fi ed water. The developer amount can be scaled according to how many gels need to be stained and 50 ml is enough for one mini-gel. When the darkness of the silver stain is determined to be sat-isfactory, the developer is stopped by addition of fi xing solu-tion (10% MeOH/10% acetic acid/water). Gels are then scanned using a desktop scanner for permanent recording of the stained image (Fig. 1 ).
Throughout the gel band cutting and digestion procedure, care should be taken to work in a clean environment free of dust to avoid excess keratin introduction to the samples. Therefore, all surfaces should be washed prior to use and gloves worn through-out the procedure.
1. Using a light box to visualize silver-stained protein bands of interest, place the gel on a clean glass plate to allow cutting of gel bands. Gel bands should be excised with a clean razor blade, chopped into four to fi ve pieces, and transferred to clean siliconized, eppendorf tubes. Excess unstained gel pieces should be avoided. If combining samples, no more than ~2–3 gel bands per sample should be collected to avoid excess gel matrix.
2. The method for de-stain and trypsin cleavage of proteins is adapted from earlier work ( 7 ) . For each sample, add ~200 m L of a 1:1 mixture of 100 mM sodium thiosulfate and 30 mM Potassium Ferricyanide (or enough liquid to completely cover the gel bands) to the eppendorf tube. The stock solutions of 100 mM thiosulfate and 30 mM Potassium Ferricyanide can be stored for several weeks at 4°C. Incubate gel bands for at least ~10 min in the solution at room temperature with occa-sional agitation. After 10 min, the silver stain should disappear and the gel pieces will become yellow in color.
3. Remove the excess liquid with a pipetman, being careful not to remove the gel pieces, and wash the gel pieces 3× with ~500 m L of puri fi ed water at ~10 min per wash. At the end of the wash steps, the yellow color should be gone and the gel pieces should be colorless.
4. Add ~500 m L of 50% acetonitrile/50% 100 mM NH 4 HCO 3 and incubate for 10 min at room temperature. Repeat the wash with this solution 2×.
3.4. Excision of Protein Bands, Silver De-staining, and Trypsin Digestion
92 S. Deb and P.R. Graves
5. Add 500 m L of 100% acetonitrile for 15 min. Gel pieces will become dehydrated and turn white. Completely remove ace-tonitrile with a pipetman.
6. For trypsinization, use sequencing grade modi fi ed porcine Trypsin from Promega (catalog #V5111). Promega Trypsin is packaged at 20 m g per glass vial. Add 40 m L of ice-cold trypsin resuspension buffer (included) to give a concentration of 0.5 m g/ m L. Then, dilute trypsin to 0.02 m g/ m L with ice-cold 50 mM NH 4 HCO 3 and add 30 m L of this solution to each sample and store tube on ice for ~1 h. The trypsin will become absorbed into the gel pieces but the digestion will not begin. The fi nal amount of trypsin is 600 ng or 0.6 m g per sample.
7. After 1 h on ice, pipette away excess liquid from gel pieces and start trypsin digestion by addition of 30 m L of 50 mM NH 4 HCO 3 to each tube and incubate overnight at 37°C.
8. The next day, spin down tubes brie fl y in a microfuge (1,500 rpm) to collect condensation and transfer the superna-tant (containing the tryptic peptides) to new siliconized eppen-dorf tubes. Add 30 m L of 20 mM NH 4 HCO 3 to the gel pieces, incubate 15 min at room temperature, and combine the super-natant from this step with the previous supernatant.
9. Add 30 m L of 50% acetonitrile/5% formic acid/water to the gel pieces, let stand 15 min, and combine supernatant with the previous. Repeat and then discard the gel pieces.
10. Reduce the volume of samples in a speed-vacuum (~20 m L) but do not dry down samples completely. Samples can be stored at −20°C until mass spectrometry is performed.
1. Tryptic peptides are puri fi ed with Poros 20 R2 reverse phase packing (Applied Biosystems, Foster City, CA) and subjected to direct infusion nanospray using NanoES spray capillaries (Proxeon, Odense, Denmark) on an Applied Biosystems QSTAR pulsar XL mass spectrometer.
2. MS spectra is collected both in data-dependent acquisition mode and in manual mode using an ion spray voltage of 800 V, a curtain gas of 20, a declustering potential of 75 V and a focusing potential of 280 V.
3. For data-dependent acquisition, MS data were collected for a mass range of 400–2,000 m / z with a charge state of 2–5 which exceed one count. MS/MS (tandem MS) data were acquired for ions from a mass range of 60–2,000 m / z with a dwell time of 15 s per ion.
4. Identi fi cation of peptides is achieved by manual interpretation of MS/MS spectra with the aid of Analyst QS 1.1 (MDS Sciex, Concord, ON, Canada) and by searching the nonredundant protein database with the aid of Mascot (Matrix Science, Boston, MA) (see Note 5).
3.5. Mass Spectrometry
937 Identifi cation of Novel Mutant p53 Interacting Proteins by Proteomic Analysis
1. To con fi rm the speci fi city of the interaction between mutant p53 and MCM-7, MCM-7 was engineered to contain a Myc epitope at the amino-terminus and p53 a FLAG epitope. Puri fi ed DNA preparations of the respective plasmids was per-formed and the DNA co-transfected using Lipofectamine-2000 in H1299 cells according to the manufacturer’s instructions.
2. Following transfection for 48 h, H1299 cells were harvested and FLAG immunoprecipitations performed overnight at 4°C.
3. Protein immunoprecipitants were resolved by SDS-PAGE (8 or 12% gels) and transferred to nitrocellulose membranes. Following blocking of the membranes with casein blocking reagent (Bio-Rad) the membranes were incubated with anti-p53 or anti-Myc antibodies overnight at 4°C at a 1:1,000 dilu-tion in TBS-T with casein blocking reagent.
4. Following washing of the nitrocellulose membranes to remove unbound primary antibody (4 washes, 10 min each wash with 1× TBS-T), primary antibodies were detected with secondary mouse or rabbit antibodies at a 1:7,000 dilution in TBS-T with blocking reagent. Following a similar washing step to remove unbound secondary antibodies, proteins were visualized using the Odyssey system (Li-COR) and where indicated, relative amounts of immunoreactive protein in each band were deter-mined by densitometric analysis and normalized to the level of actin (Fig. 2 ).
1. Although we prefer Lipofectamine-2000 (Invitrogen) for transfections, there are a large number of lipid-based transfec-tion reagents that will suf fi ce. DNA for transfections should be of high purity as produced using commercial plasmid DNA preparation kits (for example, Qiagen maxi-preps).
2. A wide variety of epitope tags are available for validation of protein interactions, although we prefer Myc and FLAG for this purpose. For proteomics applications, FLAG-agarose is very useful as the FLAG epitope can be easily added to a bait protein of interest, generally does not interfere with protein function, and the protein complexes can be eluted with FLAG-peptide.
3. Peptide puri fi cation for mass spectrometry with Poros 20 R2 reverse phase packing and NanoES spray capillaries may not be necessary depending upon the mass spectrometry core service used. The investigator should determine the type of mass spec-trometry that will be performed before investing in these materials.
3.6. Con fi rmation by Western Blotting
4. Notes
94 S. Deb and P.R. Graves
4. The secondary antibodies listed here were used in conjunction with the Li-COR imaging system that allows fl uorescent detection of a signal. As an alternative, standard ECL reagents can be used with HRP-conjugated secondary antibodies.
5. Although this is the mass spectrometric method we utilized to identify the proteins in hand, the type of mass spectrometer available and core services offered will ultimately determine the methodology used for mass spectrometry.
Acknowledgments
This work was supported by NIH grant (CA70712 and CA121144) to S.D. P.G. is supported by a Grant from the American Heart Association (0835471N).
References
1. Spisak S, Guttman A (2009) Biomedical appli-cations of protein microarrays. Curr Med Chem 16:2806–2815
2. Kerppola TK (2008) Bimolecular fl uorescence complementation (BiFC) analysis as a probe of protein interactions in living cells. Annu Rev Biophys 37:465–487
3. Sankala H, Vaughan C, Wang J, Deb S, Graves PR (2011) Upregulation of the mitochondrial transport protein, Tim50, by mutant p53 con-tributes to cell growth and chemoresistance. Arch Biochem Biophys 512:52–60
4. Deb D, Scian M, Roth KE, Li W, Keiger J, Chakraborti AS, Deb SP, Deb S (2002) Hetero-oligomerization does not compromise ‘gain of function’ of tumor-derived p53 mutants. Oncogene 21:176–189
5. Scian MJ, Stagliano KE, Deb D, Ellis MA, Carchman EH, Das A, Valerie K, Deb SP, Deb S (2004) Tumor-derived p53 mutants induce oncogenesis by transactivating growth-pro-moting genes. Oncogene 23:4430–4443
6. Lanyi A, Deb D, Seymour RC, Ludes-Meyers JH, Subler MA, Deb S (1998) ‘Gain of func-tion’ phenotype of tumor-derived mutant p53 requires the oligomerization/nonsequence-speci fi c nucleic acid-binding domain. Oncogene 16:3169–3176
7. Shevchenko A, Wilm M, Vorm O, Mann M (1996) Mass spectrometric sequencing of pro-teins silver-stained polyacrylamide gels. Anal Chem 68:850–858

95
Sumitra Deb and Swati Palit Deb (eds.), p53 Protocols, Methods in Molecular Biology, vol. 962,DOI 10.1007/978-1-62703-236-0_8, © Springer Science+Business Media New York 2013
Chapter 8
Identi fi cation of Small Molecules Affecting p53-MDM2/MDMX Interaction by Fluorescence Polarization
Qi Zhang and Hua Lu
Abstract
Fluorescence polarization (FP) has become a powerful technique to quantitatively analyze the binding of a small soluble fl uorescence-labeled probe to a larger soluble protein and its displacement by other mole-cules. Here, we describe a detailed protocol to identify small molecules capable of targeting p53-MDM2/MDMX interactions using a fl uorescence polarization assay with Rhodamine-labeled p53 peptides.
Key words: Fluorescence polarization , p53 , MDM2 , MDMX , Small molecules
MDM2 (HDM2 in human) and MDMX (also known as MDM4) are two chief monitor proteins of the tumor suppressor p53. In a feedback fashion, they directly bind to p53, inhibit its transcrip-tional activity, and mediate its ubiquitination and degradation. The interactions between p53 and MDM2 or MDMX are medi-ated mainly by three key residues (Phe19, Trp23, and Leu26) of p53 and the hydrophobic pocket in the N-terminal domain of MDM2 or of MDMX ( 1– 3 ) . Despite the similarity in the p53 recognition surface of MDM2 and MDMX, a number of MDM2 inhibitors have been reported to show signi fi cantly less af fi nity to MDMX ( 1, 4, 5 ) . Given that both MDM2 and MDMX are over-expressed in many cancers and function as the major suppressors of p53 in cells, working independently or synergistically, the identi fi cation and development of p53-MDM2/MDMX dual inhibitors are appealing and highly desirable, but still remain challenging ( 2, 6, 7 ) .
1. Introduction
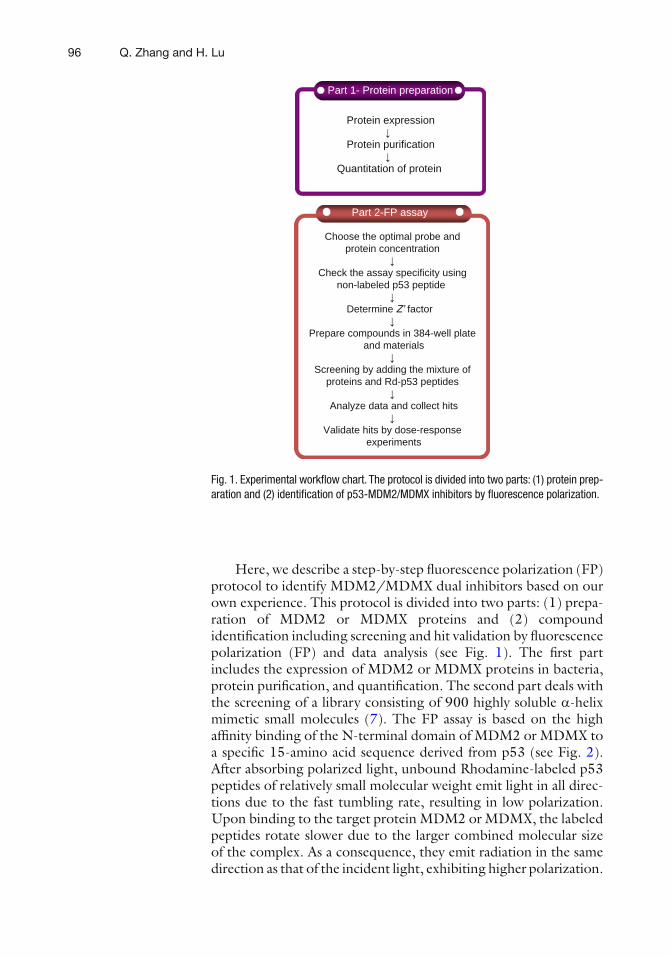
96 Q. Zhang and H. Lu
Here, we describe a step-by-step fl uorescence polarization (FP) protocol to identify MDM2/MDMX dual inhibitors based on our own experience. This protocol is divided into two parts: (1) prepa-ration of MDM2 or MDMX proteins and (2) compound identi fi cation including screening and hit validation by fl uorescence polarization (FP) and data analysis (see Fig. 1 ). The fi rst part includes the expression of MDM2 or MDMX proteins in bacteria, protein puri fi cation, and quanti fi cation. The second part deals with the screening of a library consisting of 900 highly soluble a -helix mimetic small molecules ( 7 ) . The FP assay is based on the high af fi nity binding of the N-terminal domain of MDM2 or MDMX to a speci fi c 15-amino acid sequence derived from p53 (see Fig. 2 ). After absorbing polarized light, unbound Rhodamine-labeled p53 peptides of relatively small molecular weight emit light in all direc-tions due to the fast tumbling rate, resulting in low polarization. Upon binding to the target protein MDM2 or MDMX, the labeled peptides rotate slower due to the larger combined molecular size of the complex. As a consequence, they emit radiation in the same direction as that of the incident light, exhibiting higher polarization.
Part 2-FP assay
Protein expression
Protein purification
Quantitation of protein
Choose the optimal probe and protein concentration
Check the assay specificity using
non-labeled p53 peptide
Determine Z’ factor
Prepare compounds in 384-well plate and materials
↓Screening by adding the mixture of
proteins and Rd-p53 peptides
Analyze data and collect hits
Validate hits by dose-response experiments
Part 1- Protein preparation
Fig. 1. Experimental work fl ow chart. The protocol is divided into two parts: (1) protein prep-aration and (2) identi fi cation of p53-MDM2/MDMX inhibitors by fl uorescence polarization.
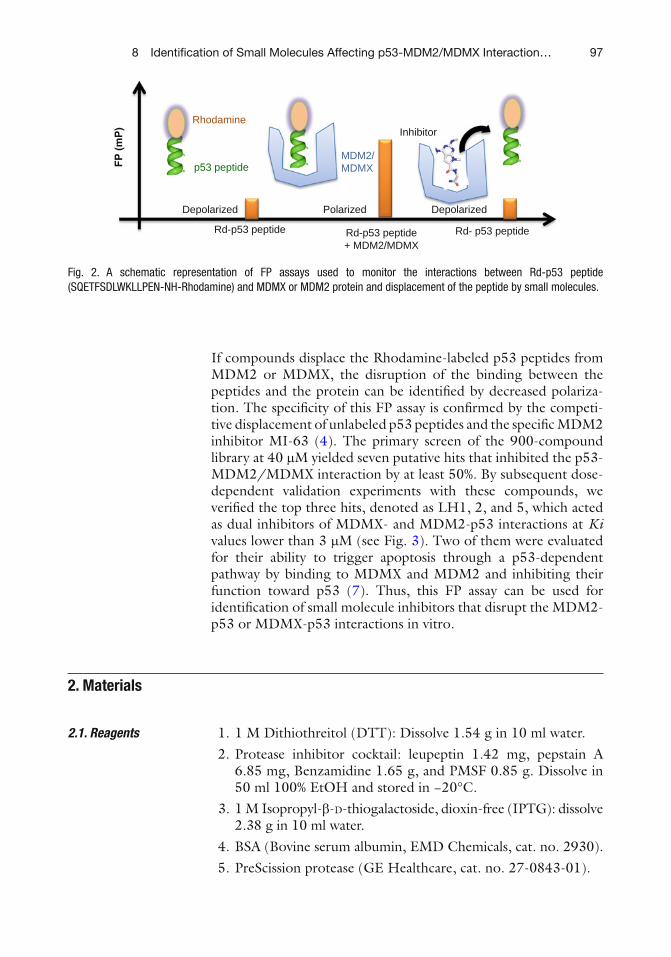
978 Identifi cation of Small Molecules Affecting p53-MDM2/MDMX Interaction…
If compounds displace the Rhodamine-labeled p53 peptides from MDM2 or MDMX, the disruption of the binding between the peptides and the protein can be identi fi ed by decreased polariza-tion. The speci fi city of this FP assay is con fi rmed by the competi-tive displacement of unlabeled p53 peptides and the speci fi c MDM2 inhibitor MI-63 ( 4 ) . The primary screen of the 900-compound library at 40 m M yielded seven putative hits that inhibited the p53-MDM2/MDMX interaction by at least 50%. By subsequent dose-dependent validation experiments with these compounds, we veri fi ed the top three hits, denoted as LH1, 2, and 5, which acted as dual inhibitors of MDMX- and MDM2-p53 interactions at Ki values lower than 3 m M (see Fig. 3 ). Two of them were evaluated for their ability to trigger apoptosis through a p53-dependent pathway by binding to MDMX and MDM2 and inhibiting their function toward p53 ( 7 ) . Thus, this FP assay can be used for identi fi cation of small molecule inhibitors that disrupt the MDM2-p53 or MDMX-p53 interactions in vitro.
1. 1 M Dithiothreitol (DTT): Dissolve 1.54 g in 10 ml water. 2. Protease inhibitor cocktail: leupeptin 1.42 mg, pepstain A
6.85 mg, Benzamidine 1.65 g, and PMSF 0.85 g. Dissolve in 50 ml 100% EtOH and stored in −20°C.
3. 1 M Isopropyl- b - D -thiogalactoside, dioxin-free (IPTG): dissolve 2.38 g in 10 ml water.
4. BSA (Bovine serum albumin, EMD Chemicals, cat. no. 2930). 5. PreScission protease (GE Healthcare, cat. no. 27-0843-01).
2. Materials
2.1. Reagents
FP
(m
P)
Rhodamine
p53 peptide MDM2/MDMX
Inhibitor
Rd-p53 peptide Rd-p53 peptide + MDM2/MDMX
Rd- p53 peptide
Depolarized Polarized Depolarized
Fig. 2. A schematic representation of FP assays used to monitor the interactions between Rd-p53 peptide (SQETFSDLWKLLPEN-NH-Rhodamine) and MDMX or MDM2 protein and displacement of the peptide by small molecules.
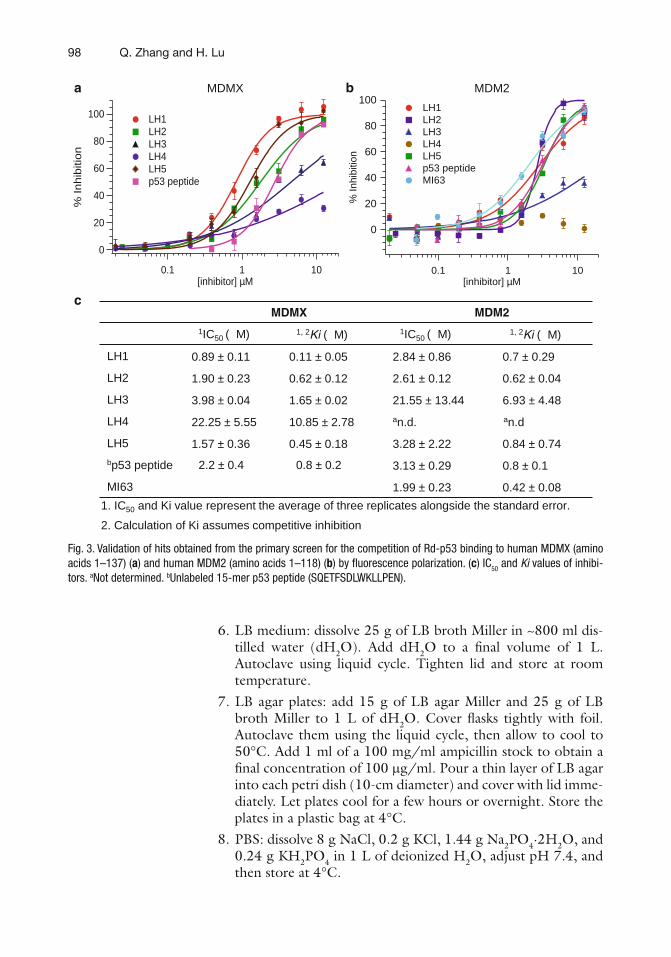
98 Q. Zhang and H. Lu
6. LB medium: dissolve 25 g of LB broth Miller in ~800 ml dis-tilled water (dH 2 O). Add dH 2 O to a fi nal volume of 1 L. Autoclave using liquid cycle. Tighten lid and store at room temperature.
7. LB agar plates: add 15 g of LB agar Miller and 25 g of LB broth Miller to 1 L of dH 2 O. Cover fl asks tightly with foil. Autoclave them using the liquid cycle, then allow to cool to 50°C. Add 1 ml of a 100 mg/ml ampicillin stock to obtain a fi nal concentration of 100 m g/ml. Pour a thin layer of LB agar into each petri dish (10-cm diameter) and cover with lid imme-diately. Let plates cool for a few hours or overnight. Store the plates in a plastic bag at 4°C.
8. PBS: dissolve 8 g NaCl, 0.2 g KCl, 1.44 g Na 2 PO 4 ·2H 2 O, and 0.24 g KH 2 PO 4 in 1 L of deionized H 2 O, adjust pH 7.4, and then store at 4°C.
1. IC50 and Ki value represent the average of three replicates alongside the standard error.
2. Calculation of Ki assumes competitive inhibition
100
80
60
40
20
0
% In
hib
itio
n
0.1 1 10[inhibitor] µM
LH1 LH2 LH3 LH4 LH5 p53 peptide
MDMX
a
c
b
MDM2
LH1 0.89 ± 0.11 0.11 ± 0.05 2.84 ± 0.86 0.7 ± 0.29
LH2 1.90 ± 0.23 0.62 ± 0.12 2.61 ± 0.12 0.62 ± 0.04
LH3 3.98 ± 0.04 1.65 ± 0.02 21.55 ± 13.44 6.93 ± 4.48
LH4 22.25 ± 5.55 10.85 ± 2.78 an.d an.d.
LH5 1.57 ± 0.36 0.45 ± 0.18 3.28 ± 2.22 0.84 ± 0.74
bp53 peptide 2.2 ± 0.4 0.8 ± 0.2 3.13 ± 0.29 0.8 ± 0.1
MI63 1.99 ± 0.23 0.42 ± 0.08
100
80
60
40
20
0
% In
hibi
tion
0.1 1 10[inhibitor] µM
LH1 LH2 LH3 LH4 LH5 p53 peptide MI63
MDMX MDM2
1IC50 (µM) 1IC50 (µM)1, 2Ki (µM) 1, 2Ki (µM)
Fig. 3. Validation of hits obtained from the primary screen for the competition of Rd-p53 binding to human MDMX (amino acids 1–137) ( a ) and human MDM2 (amino acids 1–118) ( b ) by fl uorescence polarization. ( c ) IC 50 and Ki values of inhibi-tors. a Not determined. b Unlabeled 15-mer p53 peptide (SQETFSDLWKLLPEN).
998 Identifi cation of Small Molecules Affecting p53-MDM2/MDMX Interaction…
9. Glutathione agarose beads (Thermo Scienti fi c Pierce, cat. no. 15160).
10. Millipore-Amicon ultra-15 device. 11. Poly-Prep Chromatography Columns (Bio-Rad Laboratories,
cat. no. 731-1550). 12. 5× FP Assay Buffer: 5× PBS, 0.025% Tween-20, pH 7.5, 0.5%
BSA. 13. 384-well black plates (cat. no. 262260, Nalge Nunc
International). 14. pGEX- 6P-1 plasmid coding p53-binding domain of human
MDMX (a.a. 1–137) or human MDM2 (a.a. 1–118) was developed in the Lu laboratory (Indiana University School of Medicine, IN).
15. p53 peptides (SQETFSDLWKLLPEN-NH 2 ) and N-terminally labeled Rhodamine p53 peptides (SQETFSDLWKLLPEN-NH-Rhodamine) were synthesized by Antagene Inc.
1. Sonicator (e.g., Fisher Scienti fi c Model 100). 2. Mini-PROTEAN Tetra Cell (Bio-Rad, cat. no. 165-8000). 3. Incubator shaker (e.g., Excella E25, New Brunswick
Scienti fi c). 4. End-over-end rotation apparatus (e.g., Rotospin test tube
rotator, Tarsons). 5. Nanodrop 2000c spectrophotometer (or other standard pro-
tein assay kit). 6. Benchtop centrifuge for 96-well plates (e.g., ALC PK120 plate
centrifuge, DJB Labcare). 7. Plate reader capable of FP measurements (e.g., SpectraMax
M5 e (Molecular Devices)).
1. Transform pGEX-6P1 plasmid coding p53-binding domain of human MDMX (a.a. 1–137) or human MDM2 (a.a. 1–118) into competent E. coli BL21 (DE3) cells by a standard heat-shock method ( 8 ) .
2. Prepare LB agar plates containing 100 m g/ml ampicillin. 3. Plate the cells on the agar plates using a sterile loop and incu-
bate overnight at 37°C. 4. Prepare liquid LB medium with 100 m g/ml ampicillin.
2.2. Equipment
3. Methods
3.1. Protein Preparations
3.1.1. Expression and Puri fi cation of MDMX (a.a. 1–137) and MDM2 (a.a. 1–118) Proteins
100 Q. Zhang and H. Lu
5. Using a sterile pipette tip, touch a single colony of bacteria from your agar plate. Inoculate the liquid LB by swirling the tip in it.
6. Incubate the culture in an orbital shaker at 250 rpm overnight (~12 h) at 37°C.
7. Prepare 1 L LB medium with 100 m g/ml ampicillin. 8. Inoculate the 1 L LB medium with 5 ml of the overnight
culture. 9. Grow the cultures in an orbital shaker, at 200 rpm and at 37°C
until the OD 600 reaches about 0.6–0.8 (after ~4 h) (see Note 1). 10. Add 1 ml of 0.5 M IPTG ( fi nal concentration, 0.5 mM) to
induce the cells. 11. Incubate induced cultures at 28°C with orbital shaking at
200 rpm (see Note 1). 12. At 4–5 h after induction, centrifuge the cells at 6,000 × g for
5 min at 4°C (see Note 2). 13. Discard the supernatants, wash the pellets with 10 ml cold PBS
by gently pipetting the cells, and then spin down at 6,000 × g for 5 min.
14. Re-suspend the pellets in 50 ml PBS lysis buffer (freshly add 50 m l protease inhibitor cocktail solution and 200 m l of 1 M DTT ( fi nal concentration, ~4 mM) to 50 ml of ice-cold PBS, pH 7.5, 10% glycerol) (see Note 3). Vortex until the pellets are fully re-suspended.
15. Incubate the suspension with lysozyme (50 m L of a solution of 100 mg/ml; fi nal concentration, 100 m g/ml) on ice for 30 min.
16. Sonicate lysates on ice for six-ten 20s bursts at 300W with a 20s cooling period between each burst and centrifuge at 10,000 × g for 30 min at 4°C.
17. Collect the supernatants. Take 10–100 m l of the supernatants to quantify protein expression by electrophoresis and brilliant coomassie blue staining.
18. Transfer 4 ml 50% slurry of glutathione agarose beads to a 50-ml tube. Sediment the slurry by centrifugation at 400 × g for 5 min. Aspirate the supernatants carefully and discard them.
19. Wash glutathione agarose beads by adding 20 ml of cold PBS and separate the beads by centrifugation at 400 × g for 5 min. Aspirate the supernatants carefully and discard. Repeat three times.
20. Add 50 ml of the cleared lysates to the beads and mix by gentle inversion.
21. Incubate the mixture for 2–3 h at 4°C with gentle end-over-end rotation.
1018 Identifi cation of Small Molecules Affecting p53-MDM2/MDMX Interaction…
22. Pour the mixture into an empty Poly-Prep Chromatography column. Tap the column and allow the beads to settle.
23. Open the column outlet and collect the fl ow-through until the column completely drains. Take an aliquot (~20 m l) of the fl ow-through for analysis of nonbound proteins by electropho-resis and coomassie staining.
24. Close the column outlet and add 10 ml of cold PBS lysis buffer to the column. Incubate for 10 min with gentle end-over-end rotation (see Note 4). Open the column outlet and allow the column to drain. Repeat at least fi ve times (see Note 5). Take some beads (~20 m l) for analysis by electrophoresis and coo-massie staining (see Fig. 4 ).
25. Prepare the PreScission protease mix by adding 200 m l (400 U) of the PreScission protease to 5 ml of cold PBS lysis buffer.
26. Load the PreScission protease mixture onto the column and incubate with gentle end-over-end rotation for ~12 h at 4°C (see Note 6).
27. Open the column outlet and collect eluates, which contain non-GST-tagged of puri fi ed MDM2 or MDMX proteins. The PreScission enzyme contains a GST tag, so it remains bound to the column.
28. Add 4 ml PBS lysis buffer to the column and rotate for 10 min at 4°C. Collect the eluates, which also contain puri fi ed MDM2 or MDMX proteins. Repeat fi ve times. Save aliquots (~10 m l) of each elute for analysis by the Bradford assay, with subsequent electrophoresis analysis with coomassie staining (see Fig. 4 ).
MDM21-118
MDMX1-137
CS
MW
80 -
40 -
25 -15 -
GST-MDMX1-137
GST
-MD
MX
1-13
7
GS
T-M
DM
21-
118
MD
MX
1-13
7
MD
M2
1-11
8
GST-MDM21-118
Fig. 4. Coomassie-stained gel showing the puri fi ed recombinant MDM2 1–118 and MDMX 1–
137 with or without GST tag produced in E. coli BL21-(DE3).

102 Q. Zhang and H. Lu
29. Collect the elution and transfer it to a pre-cooled 50 ml ultra fi ltration tube (Millipore-Amicon ultra), centrifuge at 2,000 × g until the protein concentration goes to 2 mg/ml (see Note 7). Save a small aliquot (~10 m l) for protein quanti fi cation by the Bradford assay, electrophoresis, and coomassie staining using BSA as a standard.
30. Aliquot puri fi ed proteins into small volumes (~100 m l) and freeze them in liquid nitrogen or store them in a −80°C freezer. The puri fi ed proteins are stable at −80°C for several months.
1. Determine the total protein concentration using Nanodrop 2000c spectrophotometer (or other standard protein assays), according to the manufacturer’s instructions.
2. Load 1–10 m g per lane (at least 2 lanes per protein) of puri fi ed proteins, and 1, 2, 4, 10, 20 m g per lane of BSA and molecular weight markers onto a 15% SDS-PAGE gel. Run the gels with the Mini-PROTEAN Tetra Cell, following the manufacturer’s instructions. Perform EZ-Run Protein Gel Staining according to the manufacturer’s instructions.
3. Quantify the intensity of all bands in each lane for each protein corresponding to BSA (~67 kDa), MDM2 (~13 kDa), or MDMX (~15 kDa). Use ImageJ (freely available from: http://rsbweb.nih.gov/ij/download.html ) or custom software pro-vided by the manufacturer of the gel quanti fi cation software.
4. Establish the linear relationship between the amounts of BSA loaded and quanti fi cation of the detected band intensity.
5. Using the established BSA amount-band intensity, calculate the percentage of total MDM2 or MDMX proteins in each preparation.
1. Dilute 10 m l 1 mM DMSO stock of Rhodamine-labeled p53 peptides (Rd-p53 peptide) 1:100 by adding 990 m l FP assay buffer ( fi nal concentration: 10 m M) (see Notes 8 and 9).
2. Prepare 12 dilutions at twofold dilution of the Rd-p53 pep-tides in a 384-well plate: dispense 60 m l FP assay buffer to wells A2–A12. Pipette 60 m l of 10 m M Rd-p53 to A1 and A2. After mixing A2, transfer 60 m l from A2 to A3, and continue this twofold dilution all the way to well A12. Discard the excess 60 m l from A12. In this way, there are 12 dilutions 1:2 serial dilution of the peptides at the highest concentration of 10 m M (A1).
3. Centrifuge the plate for 2 min at 200 × g (see Note 10). 4. Place the plate into a SpectraMax M5 e plate reader (Molecular
Devices). Open the Softmax Pro software and select the FP option. Set the excitation at 531 nm and emission at 595 nm. Read fl uorescence polarization at room temperature (RT,
3.1.2. Quanti fi cation of the Concentration of MDM2 and MDMX Proteins
3.2. Fluorescence Polarization Assay
3.2.1. Choosing the Working Probe and Protein Concentration
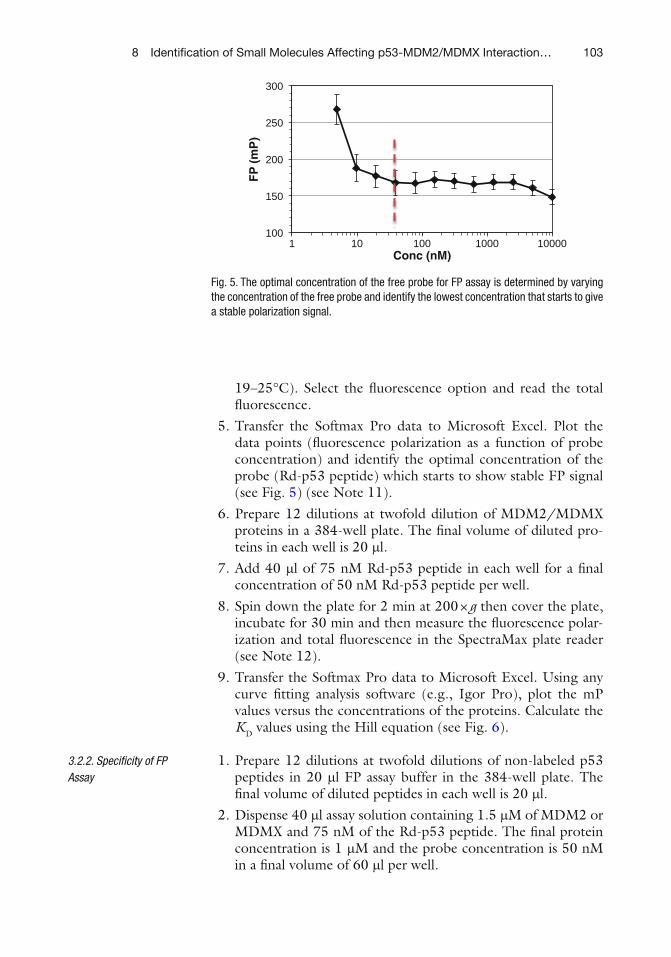
1038 Identifi cation of Small Molecules Affecting p53-MDM2/MDMX Interaction…
19–25°C). Select the fl uorescence option and read the total fl uorescence.
5. Transfer the Softmax Pro data to Microsoft Excel. Plot the data points ( fl uorescence polarization as a function of probe concentration) and identify the optimal concentration of the probe (Rd-p53 peptide) which starts to show stable FP signal (see Fig. 5 ) (see Note 11).
6. Prepare 12 dilutions at twofold dilution of MDM2/MDMX proteins in a 384-well plate. The fi nal volume of diluted pro-teins in each well is 20 m l.
7. Add 40 m l of 75 nM Rd-p53 peptide in each well for a fi nal concentration of 50 nM Rd-p53 peptide per well.
8. Spin down the plate for 2 min at 200 × g then cover the plate, incubate for 30 min and then measure the fl uorescence polar-ization and total fl uorescence in the SpectraMax plate reader (see Note 12).
9. Transfer the Softmax Pro data to Microsoft Excel. Using any curve fi tting analysis software (e.g., Igor Pro), plot the mP values versus the concentrations of the proteins. Calculate the K D values using the Hill equation (see Fig. 6 ).
1. Prepare 12 dilutions at twofold dilutions of non-labeled p53 peptides in 20 m l FP assay buffer in the 384-well plate. The fi nal volume of diluted peptides in each well is 20 m l.
2. Dispense 40 m l assay solution containing 1.5 m M of MDM2 or MDMX and 75 nM of the Rd-p53 peptide. The fi nal protein concentration is 1 m M and the probe concentration is 50 nM in a fi nal volume of 60 m l per well.
3.2.2. Speci fi city of FP Assay
100
150
200
250
300
1 10 100 1000 10000F
P (
mP
)Conc (nM)
Fig. 5. The optimal concentration of the free probe for FP assay is determined by varying the concentration of the free probe and identify the lowest concentration that starts to give a stable polarization signal.
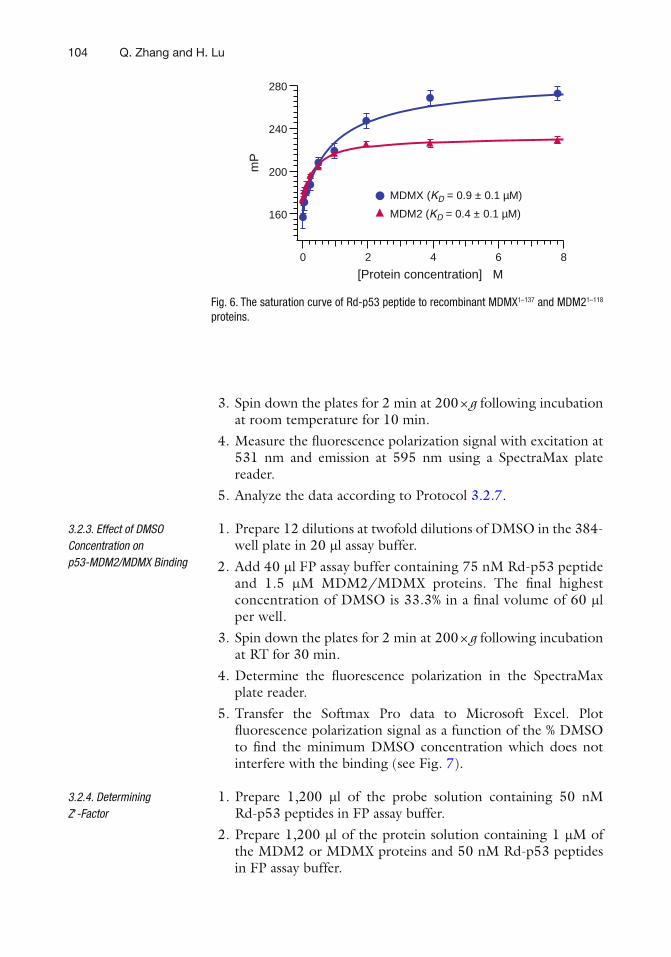
104 Q. Zhang and H. Lu
3. Spin down the plates for 2 min at 200 × g following incubation at room temperature for 10 min.
4. Measure the fl uorescence polarization signal with excitation at 531 nm and emission at 595 nm using a SpectraMax plate reader.
5. Analyze the data according to Protocol 3.2.7 .
1. Prepare 12 dilutions at twofold dilutions of DMSO in the 384-well plate in 20 m l assay buffer.
2. Add 40 m l FP assay buffer containing 75 nM Rd-p53 peptide and 1.5 m M MDM2/MDMX proteins. The fi nal highest concentration of DMSO is 33.3% in a fi nal volume of 60 m l per well.
3. Spin down the plates for 2 min at 200 × g following incubation at RT for 30 min.
4. Determine the fl uorescence polarization in the SpectraMax plate reader.
5. Transfer the Softmax Pro data to Microsoft Excel. Plot fl uorescence polarization signal as a function of the % DMSO to fi nd the minimum DMSO concentration which does not interfere with the binding (see Fig. 7 ).
1. Prepare 1,200 m l of the probe solution containing 50 nM Rd-p53 peptides in FP assay buffer.
2. Prepare 1,200 m l of the protein solution containing 1 m M of the MDM2 or MDMX proteins and 50 nM Rd-p53 peptides in FP assay buffer.
3.2.3. Effect of DMSO Concentration on p53-MDM2/MDMX Binding
3.2.4. Determining Z ¢ -Factor
280
240
200
160
mP
86420
[Protein concentration] µM
MDMX (KD = 0.9 ± 0.1 µM)
MDM2 (KD = 0.4 ± 0.1 µM)
Fig. 6. The saturation curve of Rd-p53 peptide to recombinant MDMX 1–137 and MDM2 1–118 proteins.
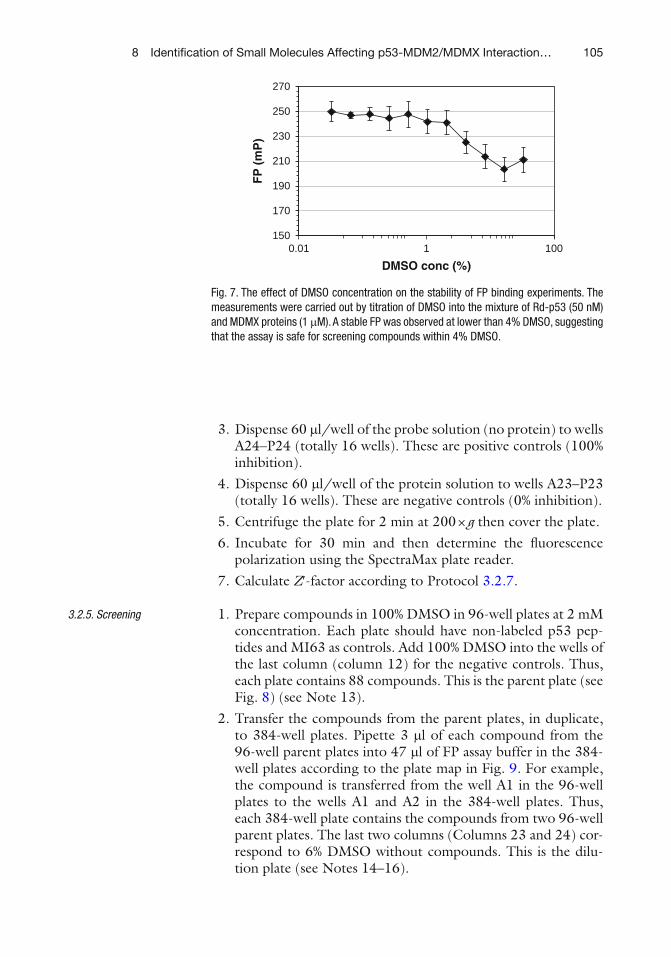
1058 Identifi cation of Small Molecules Affecting p53-MDM2/MDMX Interaction…
3. Dispense 60 m l/well of the probe solution (no protein) to wells A24–P24 (totally 16 wells). These are positive controls (100% inhibition).
4. Dispense 60 m l/well of the protein solution to wells A23–P23 (totally 16 wells). These are negative controls (0% inhibition).
5. Centrifuge the plate for 2 min at 200 × g then cover the plate. 6. Incubate for 30 min and then determine the fl uorescence
polarization using the SpectraMax plate reader. 7. Calculate Z ¢ -factor according to Protocol 3.2.7 .
1. Prepare compounds in 100% DMSO in 96-well plates at 2 mM concentration. Each plate should have non-labeled p53 pep-tides and MI63 as controls. Add 100% DMSO into the wells of the last column (column 12) for the negative controls. Thus, each plate contains 88 compounds. This is the parent plate (see Fig. 8 ) (see Note 13).
2. Transfer the compounds from the parent plates, in duplicate, to 384-well plates. Pipette 3 m l of each compound from the 96-well parent plates into 47 m l of FP assay buffer in the 384-well plates according to the plate map in Fig. 9 . For example, the compound is transferred from the well A1 in the 96-well plates to the wells A1 and A2 in the 384-well plates. Thus, each 384-well plate contains the compounds from two 96-well parent plates. The last two columns (Columns 23 and 24) cor-respond to 6% DMSO without compounds. This is the dilu-tion plate (see Notes 14–16).
3.2.5. Screening
150
170
190
210
230
250
270
0.01 1 100F
P (
mP
)DMSO conc (%)
Fig. 7. The effect of DMSO concentration on the stability of FP binding experiments. The measurements were carried out by titration of DMSO into the mixture of Rd-p53 (50 nM) and MDMX proteins (1 m M). A stable FP was observed at lower than 4% DMSO, suggesting that the assay is safe for screening compounds within 4% DMSO.
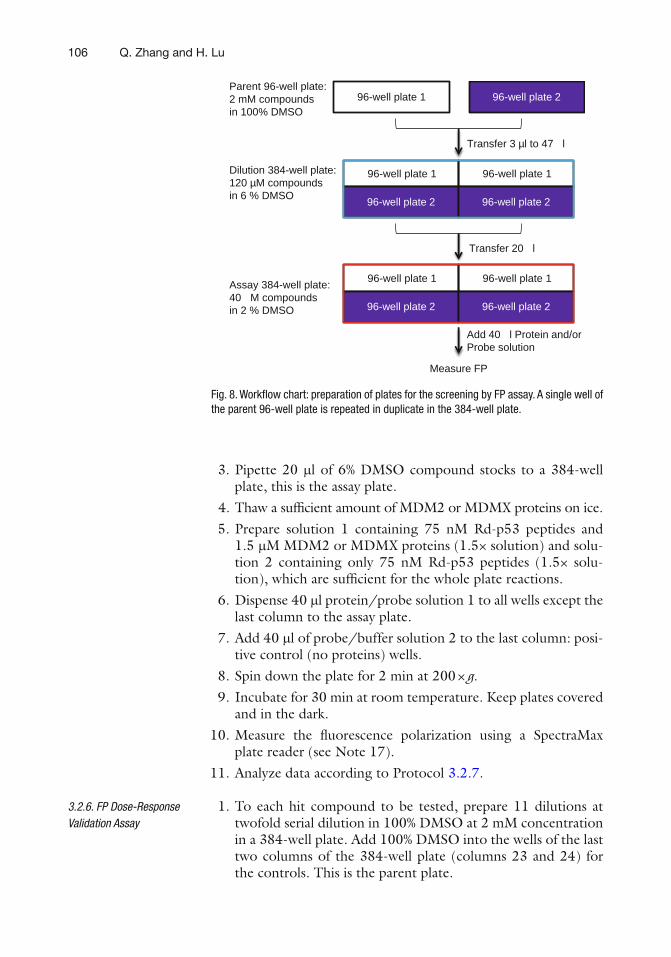
106 Q. Zhang and H. Lu
3. Pipette 20 m l of 6% DMSO compound stocks to a 384-well plate, this is the assay plate.
4. Thaw a suf fi cient amount of MDM2 or MDMX proteins on ice. 5. Prepare solution 1 containing 75 nM Rd-p53 peptides and
1.5 m M MDM2 or MDMX proteins (1.5× solution) and solu-tion 2 containing only 75 nM Rd-p53 peptides (1.5× solu-tion), which are suf fi cient for the whole plate reactions.
6. Dispense 40 m l protein/probe solution 1 to all wells except the last column to the assay plate.
7. Add 40 m l of probe/buffer solution 2 to the last column: posi-tive control (no proteins) wells.
8. Spin down the plate for 2 min at 200 × g . 9. Incubate for 30 min at room temperature. Keep plates covered
and in the dark. 10. Measure the fl uorescence polarization using a SpectraMax
plate reader (see Note 17). 11. Analyze data according to Protocol 3.2.7 .
1. To each hit compound to be tested, prepare 11 dilutions at twofold serial dilution in 100% DMSO at 2 mM concentration in a 384-well plate. Add 100% DMSO into the wells of the last two columns of the 384-well plate (columns 23 and 24) for the controls. This is the parent plate.
3.2.6. FP Dose-Response Validation Assay
96-well plate 1 96-well plate 2Parent 96-well plate: 2 mM compounds in 100% DMSO
96-well plate 1 96-well plate 1Dilution 384-well plate: 120 µM compounds in 6 % DMSO
96-well plate 1 96-well plate 1Assay 384-well plate: 40 µM compounds in 2 % DMSO
Add 40 µl Protein and/or Probe solution
Measure FP
Transfer 3 µl to 47 µl
Transfer 20 µl
96-well plate 296-well plate 2
96-well plate 2 96-well plate 2
Fig. 8. Work fl ow chart: preparation of plates for the screening by FP assay. A single well of the parent 96-well plate is repeated in duplicate in the 384-well plate.
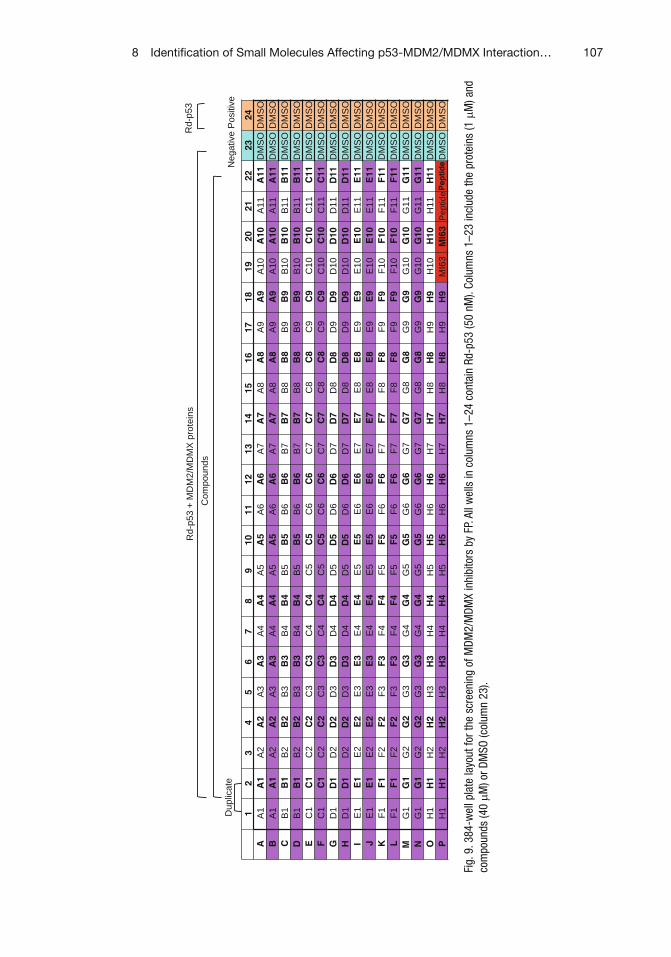
1078 Identifi cation of Small Molecules Affecting p53-MDM2/MDMX Interaction…
1
2 3
4 5
6 7
8 9
10
11
12
13
14
15
16
17
18
19
20
21
22
23
24
A
A1
A1
A2
A2
A3
A3
A4
A4
A5
A5
A6
A6
A7
A7
A8
A8
A9
A9
A10
A
10
A11
A
11
DM
SO
DM
SO
B A
1 A
1 A
2 A
2 A
3 A
3 A
4 A
4 A
5 A
5 A
6 A
6 A
7 A
7 A
8 A
8 A
9 A
9 A
10
A10
A
11
A11
D
MS
O D
MS
O C
B1
B1
B2
B2
B3
B3
B4
B4
B5
B5
B6
B6
B7
B7
B8
B8
B9
B9
B10
B
10
B11
B
11
DM
SO
DM
SO
D
B1
B1
B2
B2
B3
B3
B4
B4
B5
B5
B6
B6
B7
B7
B8
B8
B9
B9
B10
B
10
B11
B
11
DM
SO
DM
SO
E C
1 C
1 C
2 C
2 C
3 C
3 C
4 C
4 C
5 C
5 C
6 C
6 C
7 C
7 C
8 C
8 C
9 C
9 C
10
C10
C
11
C11
D
MS
O D
MS
O F
C1
C1
C2
C2
C3
C3
C4
C4
C5
C5
C6
C6
C7
C7
C8
C8
C9
C9
C10
C
10
C11
C
11
DM
SO
DM
SO
G
D1
D1
D2
D2
D3
D3
D4
D4
D5
D5
D6
D6
D7
D7
D8
D8
D9
D9
D10
D
10
D11
D
11
DM
SO
DM
SO
H
D1
D1
D2
D2
D3
D3
D4
D4
D5
D5
D6
D6
D7
D7
D8
D8
D9
D9
D10
D
10
D11
D
11
DM
SO
DM
SO
I E
1 E
1 E
2 E
2 E
3 E
3 E
4 E
4 E
5 E
5 E
6 E
6 E
7 E
7 E
8 E
8 E
9 E
9 E
10
E10
E
11
E11
D
MS
O D
MS
O J
E1
E1
E2
E2
E3
E3
E4
E4
E5
E5
E6
E6
E7
E7
E8
E8
E9
E9
E10
E
10
E11
E
11
DM
SO
DM
SO
K F
1 F
1 F
2 F
2 F
3 F
3 F
4 F
4 F
5 F
5 F
6 F
6 F
7 F
7 F
8 F
8 F
9 F
9 F
10
F10
F
11
F11
D
MS
O D
MS
O L
F1
F1
F2
F2
F3
F3
F4
F4
F5
F5
F6
F6
F7
F7
F8
F8
F9
F9
F10
F
10
F11
F
11
DM
SO
DM
SO
M
G1
G1
G2
G2
G3
G3
G4
G4
G5
G5
G6
G6
G7
G7
G8
G8
G9
G9
G10
G
10
G11
G
11
DM
SO
DM
SO
N
G1
G1
G2
G2
G3
G3
G4
G4
G5
G5
G6
G6
G7
G7
G8
G8
G9
G9
G10
G
10
G11
G
11
DM
SO
DM
SO
O
H1
H1
H2
H2
H3
H3
H4
H4
H5
H5
H6
H6
H7
H7
H8
H8
H9
H9
H10
H
10
H11
H
11
DM
SO
DM
SO
P H
1 H
1 H
2 H
2 H
3 H
3 H
4 H
4 H
5 H
5 H
6 H
6 H
7 H
7 H
8 H
8 H
9 H
9 M
I63
MI6
3 P
eptid
e P
epti
de D
MS
O D
MS
O
Dup
licat
e N
egat
ive
Pos
itive
Rd-
p53
+ M
DM
2/M
DM
X p
rote
ins
Rd-
p53
Com
poun
ds
Fig.
9. 3
84-w
ell p
late
layo
ut fo
r the
scr
eeni
ng o
f MDM
2/M
DMX
inhi
bito
rs b
y FP
. All
wel
ls in
col
umns
1–2
4 co
ntai
n Rd
-p53
(50
nM).
Colu
mns
1–2
3 in
clud
e th
e pr
otei
ns (1
m M
) and
co
mpo
unds
(40
m M) o
r DM
SO (c
olum
n 23
).

108 Q. Zhang and H. Lu
2. Add 3 m l of each compound from the parent plates to 47 m l of FP assay buffer in a 384-well plate. This is the dilution plate and these intermediate stocks are at 6% DMSO.
3. Pipette 20 m l diluted compounds from the dilution plate to a new 384-well microplate, this is the assay plate. The fi nal DMSO concentration is 2%.
4. Thaw a suf fi cient amount of MDM2 or MDMX proteins on ice. 5. Prepare solution 1 containing 75 nM Rd-p53 peptide and
1.5 m M MDM2 or MDMX proteins (1.5× solution) and solu-tion 2 containing only 75 nM Rd-p53 peptides (1.5× solu-tion), which are suf fi cient for the whole plate reactions.
6. Dispense 40 m l protein/probe solutions to all wells of the assay plates except the last column.
7. Add 40 m l of probe/buffer to the last column: positive control (no proteins) wells.
8. Spin down the plate for 2 min at 200 × g . 9. Cover the plate with a new plate seal. Incubate for 30 min at
room temperature. Keep plates covered and in the dark. 10. Measure the fl uorescence polarization using a SpectraMax
plate reader. 11. Analyze the data according to Protocol 3.2.7 .
1. Transfer the Softmax Pro data to Microsoft Excel. 2. Calculate the average and the standard deviations of the nega-
tive control samples (column 23). 3. Calculate the average and the standard deviations of the posi-
tive control samples (column 24). 4. Calculate the Z ¢ factor for each plate:
+ −
+ −
× +′ = −μ − μ
3 (SD SD )factor 1 ,Z
where m + and m − represent the means of the positive and nega-tive control signals, respectively, and SD + and SD − are standard deviations of the mean values for the positive and negative con-trols, respectively (see Note 18).
5. Calculate the percent inhibition of each sample as follows:
Negative Sample
Inhibition% 100%Negative Positive
−= ×−
Inhibitory activity is calculated as the mean FP value of nega-tive controls minus the sample FP value divided by the mean FP value of negative controls minus the mean FP value of posi-tive controls, multiplied by 100.
3.2.7. Data Analysis
1098 Identifi cation of Small Molecules Affecting p53-MDM2/MDMX Interaction…
6. For each compound, percentage inhibitions were plotted against the compound concentration (see Fig. 3 ). Compounds greater than a certain cutoff are considered hits. For example, compounds with greater than 50% inhibition of MDM2/MDMX-p53 binding at 40 m M are de fi ned as active hits of the primary screening. The primary screening active hits proceed to the dose-response con fi rmation stage.
7. For the dose-response con fi rmation, using suitable nonlinear regression analysis software such as Igor Pro, plot the calcu-lated percent inhibition values versus the log of the concentra-tions of the test compound. Calculate the IC 50 values using Hill equation.
8. Ki values were calculated by a web-based computer program developed for FP-based binding assays ( http://sw16.im.med.umich.edu/software/calc_ki/ ) ( 9 ) .
1. Expression of GST-MDM2 or GST-MDMX at higher cell den-sities ( A 600 > 0.5) and reduced temperature (28°C) results in greater yields of intact forms of the soluble proteins.
2. All procedures hereafter should be performed at 4°C to mini-mize protein degradation.
3. Add glycerol and DTT (1–10 mM) into the lysis buffer. Glycerol and DTT prevent degradation of proteins and increase the binding of proteins to glutathione agarose beads.
4. Each washing of the glutathione agarose beads after protein binding at slow speed or longer incubation time (10–30 min) is important to ensure the purity of GST fusion proteins.
5. After the fi nal wash, drain the column completely to avoid dilution of the eluates.
6. The conditions for cleavage need to be optimized (e.g., amount of protein, time, and temperature).
7. Concentrate proteins to a concentration below 2 mg/ml because they may precipitate at higher concentrations.
8. Keep in mind that fl uorophores are light-sensitive and pH-sensitive. Prepare the stock of Rhodamine-labeled p53 pep-tides in 100% DMSO, aliquot, and keep them from light.
9. High concentration of peptide stock (>10 mM) may lead to poor solubility when dissolved in the buffer.
10. Make sure to centrifuge the plate to remove bubbles and keep the reaction solution on the bottom.
4. Notes
110 Q. Zhang and H. Lu
11. Choose the lowest concentration (to keep it below its K D ) that gives minimal variations of FP signal. We use 50 nM Rd-p53 peptides for the FP assay (protocols 3.2.5 and 3.2.6 ).
12. Determine the total fl uorescence to assess whether the fl uorescence of Rd-p53 changes when it binds to the protein. If binding affects the fl uorescent properties of the fl uorophore, the latter should be conjugated through another position, or the use of another fl uorescent ligand and/or protein fragment should be explored.
13. For each compound to be screened, to make sure that the compounds do not interfere with the polarization assay, deter-mine their fl uorescence in the working fl uorescence wavelength range and eliminate those that show fl uorescence.
14. For all solutions in the reaction plates, mix the reaction solu-tion well using the pipette, a pipetting system (e.g., Precission from BioTek Instruments, Inc.), an orbital shaker at 500–700 rpm, or shaking in the plate reader to ensure homogeneity.
15. Change the pipette tips or thoroughly rinse the tips if you are using a pipetting robot with permanent tips.
16. This preparation of plates for the FP assay involves systems that employ pipette tips. For systems that use the pintool device, the protocol described here needs to be adjusted accordingly.
17. It takes about 10–15 min to measure the fl uorescent polariza-tion of the entire plate depending on the plate readers. Consider intervals and arrange the time if you have more than one plate to measure.
18. The Z ¢ factor, indicating the quality of a FP assay, is expected to be higher than 0.7, based on negative (containing Rd-p53 peptides with MDMX or MDM2 proteins) and positive (con-taining Rd-p53 peptides only) controls (16 data points per positive and negative controls). If the Z ¢ -factor is below 0.5, the plate has to be rescreened in order to increase the assay quality. The concentration of the probe and protein need to be optimized to improve the Z ¢ -factor.
References
1. Czarna A, Popowicz GM, Pecak A, Wolf S, Dubin G, Holak TA (2009) High af fi nity inter-action of the p53 peptide-analogue with human Mdm2 and Mdmx. Cell Cycle 8:1176–1184
2. Pazgier M, Liu M, Zou G, Yuan W, Li C, Li J, Monbo J, Zella D, Tarasov SG, Lu W (2009) Structural basis for high-af fi nity peptide inhibi-tion of p53 interactions with MDM2 and MDMX. Proc Natl Acad Sci USA 106:4665–4670
3. Phan J, Li Z, Kasprzak A, Li B, Sebti S, Guida W, Schonbrunn E, Chen J (2010) Structure-based design of high af fi nity peptides inhibiting the interaction of p53 with MDM2 and MDMX. J Biol Chem 285:2174–2183
4. Ding K, Lu Y, Nikolovska-Coleska Z, Qiu S, Ding Y, Gao W, Stuckey J, Krajewski K, Roller PP, Tomita Y, Parrish DA, Deschamps JR, Wang S (2005) Structure-based design of
1118 Identifi cation of Small Molecules Affecting p53-MDM2/MDMX Interaction…
potent non-peptide MDM2 inhibitors. J Am Chem Soc 127:10130–10131
5. Shangary S, Qin D, McEachern D, Liu M, Miller RS, Qiu S, Nikolovska-Coleska Z, Ding K, Wang G, Chen J, Bernard D, Zhang J, Lu Y, Gu Q, Shah RB, Pienta KJ, Ling X, Kang S, Guo M, Sun Y, Yang D, Wang S (2008) Temporal activation of p53 by a speci fi c MDM2 inhibitor is selectively toxic to tumors and leads to complete tumor growth inhibition. Proc Natl Acad Sci USA 105:3933–3938
6. Reed D, Shen Y, Shelat AA, Arnold LA, Ferreira AM, Zhu F, Mills N, Smithson DC, Regni CA, Bashford D, Cicero SA, Schulman BA, Jochemsen AG, Guy RK, Dyer MA (2010) Identi fi cation and characterization of the fi rst
small molecule inhibitor of MDMX. J Biol Chem 285:10786–10796
7. Lee JH, Zhang Q, Jo S, Chai SC, Oh M, Im W, Lu H, Lim HS (2011) Novel pyrrolopyrimi-dine-based alpha-helix mimetics: cell-perme-able inhibitors of protein-protein interactions. J Am Chem Soc 133:676–679
8. Inoue H, Nojima H, Okayama H (1990) High ef fi ciency transformation of Escherichia coli with plasmids. Gene 96:23–28
9. Ding K, Lu Y, Nikolovska-Coleska Z, Wang G, Qiu S, Shangary S, Gao W, Qin D, Stuckey J, Krajewski K, Roller PP, Wang S (2006) Structure-based design of spiro-oxindoles as potent, speci fi c small-molecule inhibitors of the MDM2-p53 interaction. J Med Chem 49:3432–3435
113
Sumitra Deb and Swati Palit Deb (eds.), p53 Protocols, Methods in Molecular Biology, vol. 962,DOI 10.1007/978-1-62703-236-0_9, © Springer Science+Business Media New York 2013
Chapter 9
Determine the Effect of p53 on Chemosensitivity
Emir Senturk and James J. Manfredi
Abstract
The p53 tumor suppressor protein plays a central role in mediating the cellular response to a variety of stresses. Activation of p53 signaling will trigger cell cycle arrest or apoptosis in normal cells, depending on such factors as cell type and genetic context. The ability of a cell to circumvent either of these p53-directed outcomes leads to inappropriate proliferation, thereby contributing to the development of cancer. As such, tumors frequently escape the apoptotic pathway in response to cell stress. DNA-damaging agents, however, achieve signi fi cant tumor cytotoxicity in spite of this hallmark characteristic. Tumors treated with DNA-damaging drugs often undergo alternate forms of cell death, such as senescence or mitotic catastrophe, in addition to apoptosis that may ultimately lead to regression. Although not a predictor of chemotherapy response in patients per se, p53 status in tumor-derived cells is frequently a determinant of the death path-way promoted by these agents. The cytotoxic effects of DNA-damaging agents can be readily appreciated using such tools as cell cycle analysis, phopsho-H3 Ser10 immunoblotting, and annexin V detection.
Key words: p53 , Tumor cells , DNA damage , Chemotherapy , Chemosensitivity , Drug response , Cell cycle , Apoptosis , Senescence , Mitotic catastrophe
The p53 tumor suppressor protein is responsible for impeding the proliferation of cells in response to a variety of stresses, including genotoxic stress ( 1 ) . In normal, healthy cells, p53 achieves this outcome by triggering either cell cycle arrest at the G1/S and G2/M checkpoints or apoptosis ( 2 ) . Cells are thus able to prevent the propagation of potentially oncogenic mutations or other genetic aberrations. A testament to the critical role of p53 in protecting against such genomic instability is the observation that p53 is the most commonly mutated gene in human malignancies ( 2 ) . Furthermore, p53-null mice develop tumors at an accelerated
1. Introduction

114 E. Senturk and J.J. Manfredi
rate, often succumbing to disease by 6 months ( 3 ) . Loss of p53 function constitutes a mechanism of checkpoint bypass and escape from apoptosis, the latter of which is a well-established hallmark of cancer ( 4 ) .
Initial studies of cellular response to antineoplastic agents put forth that p53-directed apoptosis was the common underlying mechanism of chemotherapy and radiation response in tumors ( 5, 6 ) . Indeed, certain tumors, particularly hematologic malignan-cies, undergo a robust, p53-dependent apoptotic response to extrinsic DNA damage ( 7 ) . These fi ndings further suggested that loss of p53 by mutation or deletion would render a given tumor resistant to treatment with genotoxic agents. Subsequent work in p53-null cells and animal models, however, revealed that DNA-damaging treatments are able to achieve signi fi cant cytotoxicity in a p53-independent manner ( 8– 10 ) (Fig. 1 ). Moreover, epithelial tumor lines and solid tumor models have been observed to respond to DNA damage despite not undergoing frank apoptosis ( 11 ) . As the overwhelming majority of human malignancies are epithelial in origin, these alternate forms of DNA damage-induced tumor cell death are of particular interest in assessing tumor response to conventional cancer treatments, including topoisomerase inhibi-tors, cross-linking agents, and ionizing radiation.
Tumors in which the wild-type p53 gene remains expressed respond to DNA damage in a cell type- and genetic context-depen-dent manner, as discussed elsewhere ( 2 ) . Under such circum-stances, p53 and its downstream effectors may remain intact and responsive to DNA damage but have become insensitive to other oncogenic stresses (e.g., signaling stress) as a result of mutations in genes encoding upstream p53 activators (e.g., p14 ARF ). Treatment of many epithelial neoplasms with DNA-damaging agents in cell culture, for example, will often provoke p53-dependent arrest at the G1/S and G2/M checkpoints that will prevent further progression through the cell cycle until the damage is repaired ( 12, 13 ) . Removal of the offending compound will lead to even-tual resolution of these checkpoints and resumption of the cell cycle ( 12 ) . If DNA damage persists, perhaps by means of an effec-tive dosing strategy, cells arrested in the cell cycle may ultimately senesce, as discussed below. Alternatively, tumors that arise from tissues known to be exquisitely sensitive to DNA damage, such as bone marrow or thymus, forego cell cycle arrest in favor of robust p53-dependent apoptosis ( 14, 15 ) . In these tumors, loss of p53 has been associated with resistance to DNA-damaging therapies ( 5 ) (Fig. 1 ). The mechanistic basis of these divergent p53-depen-dent outcomes in response to DNA damage is a subject of contin-ued investigation.
More recently, sustained p53 activation in the setting of DNA damage has also been shown to trigger accelerated cell senescence ( 16 ) . Senescence refers to a permanent growth-arrested state in

0sub
G1
G1
RK
O.0
01
RK
OR
KO
E6
G1
<G
10%21
%
19%
46%
G2/
MG
2/M
060120Counts
No treatmentDoxorubicin
24 hrsDoxorubicin
48 hrs
180210300 060120Counts
180210300
200
400 F
L2-A
RK
O.0
02600
800
1000
020
040
0 FL2
-A600
800
1000
S
S
G1
<G
113
%
46%
7%24%
G2/
MS
sub
G1
G1
G2/
MS
060120Counts
180210300
RK
O.0
03
020
040
0 FL2
-A600
800
1000
G1
<G
117
%
36%6%17%
G2/
MS
sub
G1
G1
G2/
MS
Doxorubicin72 hrs
Doxorubicin72 hrs
060120Counts
180210300
RK
O.0
04
020
040
0 FL2
A600
800
1000
G1
<G
123
%
18%3%8%
G2/
MS
sub
G1G
1
G2/
MS
060120Counts
180240300
RK
O.0
08
020
040
0 FL2
A600
800
1000
G1
<G
15%70
%3%4%
G2/
MS
sub
G1G
1
G2/
M
S
060120Counts
180240300
RK
O.0
07
020
040
0 FL2
-A600
800
1000
G1
<G
13%70
%3%7%
G2/
MS
sub
G1G
1
G2/
M
S
060120Counts
180240300
RK
O.0
06
020
040
0 FL2
-A600
800
1000
G1
<G
12%77
%2%10%
G2/
MS
sub
G1
G1
G2/
M
S
060120Counts
180210300
RK
O.0
05
020
040
0 FL2
-A600
800
1000
G1
<G
11%29
%
20%
44%
G2/
MS
sub
G1G
1
G2/
M
S
100
101
102
103
104
No
trea
tmen
t24
hrs
48 h
rs72
hrs
Tre
atm
ent T
imep
oint
0255075100
% Annexin V Positive Cells
% A
popt
osis
(R
KO
)
Ann
V (
-)A
nn V
(+
)
Ann
V (
-)A
nn V
(+
)
AN
N_V
_AS
SA
Y.0
01
AN
N_V
_AS
SA
Y.0
04
01020304050 100
101
102
103
104
01020304050
No treatment
ab
Fig. 1. DNA damage-induced apoptosis in human colorectal carcinoma cell line RKO and derivative line RKO E6, in which stable expression of the HPV E6 protein has been shown to promote the degradation of p53 ( 26 ) . RKO cells respond to sus-tained DNA damage by undergoing p53-dependent apoptosis, revealed by an increase in the hypodiploid population of cells after treatment by PI staining and fl ow cytometry ( a , fi rst column ). The same assay reveals RKO E6 cells, on the other hand, to be resistant to DNA damage-induced apoptosis ( a , second column ). Apoptosis in RKO cells can be quanti fi ed by way of annexin V immunolabeling and detection by fl ow cytometry, as shown in ( b ).
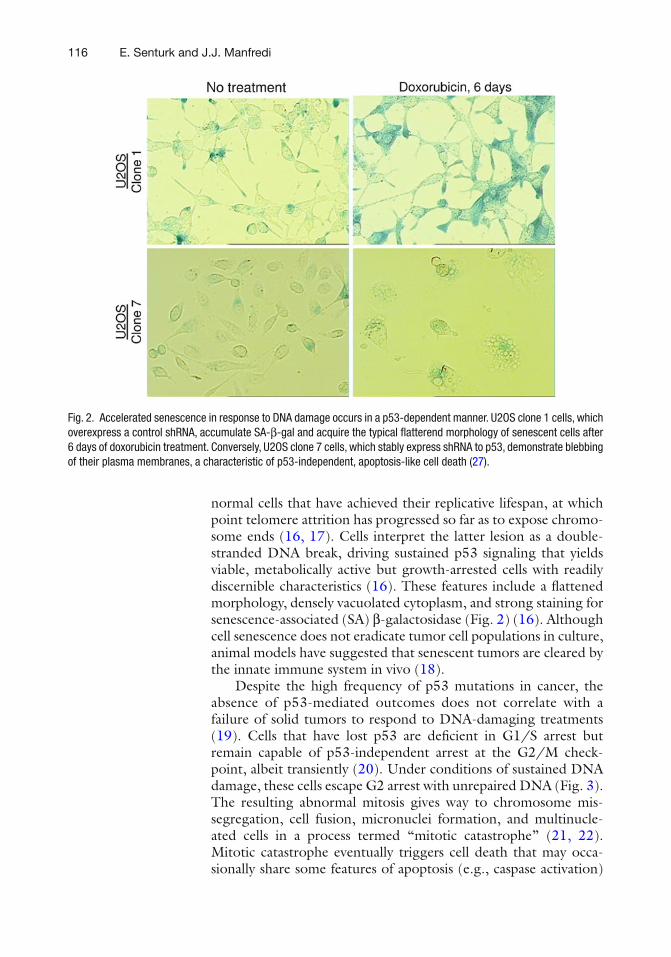
116 E. Senturk and J.J. Manfredi
normal cells that have achieved their replicative lifespan, at which point telomere attrition has progressed so far as to expose chromo-some ends ( 16, 17 ) . Cells interpret the latter lesion as a double-stranded DNA break, driving sustained p53 signaling that yields viable, metabolically active but growth-arrested cells with readily discernible characteristics ( 16 ) . These features include a fl attened morphology, densely vacuolated cytoplasm, and strong staining for senescence-associated (SA) β -galactosidase (Fig. 2 ) ( 16 ) . Although cell senescence does not eradicate tumor cell populations in culture, animal models have suggested that senescent tumors are cleared by the innate immune system in vivo ( 18 ) .
Despite the high frequency of p53 mutations in cancer, the absence of p53-mediated outcomes does not correlate with a failure of solid tumors to respond to DNA-damaging treatments ( 19 ) . Cells that have lost p53 are de fi cient in G1/S arrest but remain capable of p53-independent arrest at the G2/M check-point, albeit transiently ( 20 ) . Under conditions of sustained DNA damage, these cells escape G2 arrest with unrepaired DNA (Fig. 3 ). The resulting abnormal mitosis gives way to chromosome mis-segregation, cell fusion, micronuclei formation, and multinucle-ated cells in a process termed “mitotic catastrophe” ( 21, 22 ) . Mitotic catastrophe eventually triggers cell death that may occa-sionally share some features of apoptosis (e.g., caspase activation)
Fig. 2. Accelerated senescence in response to DNA damage occurs in a p53-dependent manner. U2OS clone 1 cells, which overexpress a control shRNA, accumulate SA- β -gal and acquire the typical fl atterend morphology of senescent cells after 6 days of doxorubicin treatment. Conversely, U2OS clone 7 cells, which stably express shRNA to p53, demonstrate blebbing of their plasma membranes, a characteristic of p53-independent, apoptosis-like cell death ( 27 ).
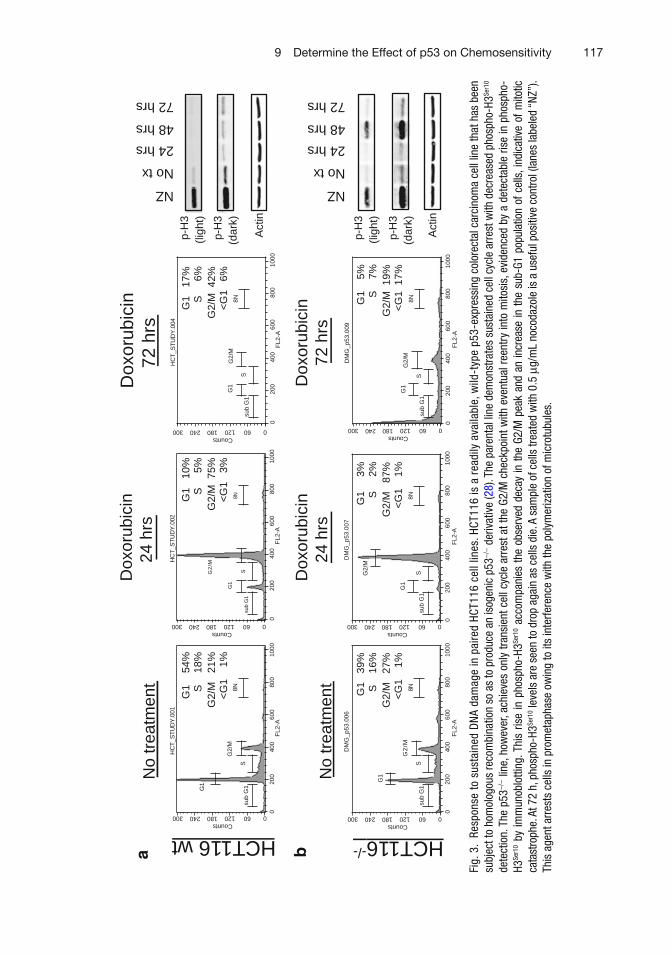
1179 Determine the Effect of p53 on Chemosensitivity
Fig.
3.
Resp
onse
to s
usta
ined
DN
A da
mag
e in
pai
red
HCT1
16 c
ell l
ines
. HCT
116
is a
rea
dily
ava
ilabl
e, w
ild-t
ype
p53-
expr
essi
ng c
olor
ecta
l car
cino
ma
cell
line
that
has
bee
n su
bjec
t to
hom
olog
ous
reco
mbi
natio
n so
as
to p
rodu
ce a
n is
ogen
ic p
53 −
/− d
eriv
ativ
e ( 2
8 ) . T
he p
aren
tal l
ine
dem
onst
rate
s su
stai
ned
cell
cycl
e ar
rest
with
dec
reas
ed p
hosp
ho-H
3 Ser1
0 de
tect
ion.
The
p53
−/−
line
, how
ever
, ach
ieve
s on
ly tr
ansi
ent c
ell c
ycle
arr
est a
t the
G2/
M c
heck
poin
t with
eve
ntua
l ree
ntry
into
mito
sis,
evi
denc
ed b
y a
dete
ctab
le ri
se in
pho
spho
-H3
Ser1
0 by
imm
unob
lotti
ng. T
his
rise
in p
hosp
ho-H
3 Ser1
0 ac
com
pani
es th
e ob
serv
ed d
ecay
in th
e G2
/M p
eak
and
an in
crea
se in
the
sub-
G1 p
opul
atio
n of
cel
ls, i
ndic
ativ
e of
mito
tic
cata
stro
phe.
At 7
2 h,
pho
spho
-H3 Se
r10 l
evel
s ar
e se
en to
dro
p ag
ain
as c
ells
die
. A s
ampl
e of
cel
ls tr
eate
d w
ith 0
.5 μ
g/m
L no
coda
zole
is a
use
ful p
ositi
ve c
ontro
l (la
nes
labe
led
“NZ”
). Th
is a
gent
arr
ests
cel
ls in
pro
met
apha
se o
win
g to
its
inte
rfere
nce
with
the
poly
mer
izat
ion
of m
icro
tubu
les.
HCT116 wt
020
040
060
080
010
00F
L2-A
DM
G_p
53.0
07
sub
G1
G1
SG2/
M
8N
020
040
060
080
010
00F
L2-A
DM
G_p
53.0
06
sub
G1
G1
S
G2
/M8N
HCT116-/-
No
trea
tmen
t
p-H
3 (li
ght)
Act
in
NZ
No tx
24 hrs
48 hrs
72 hrs
No
trea
tmen
t
a b
020
040
060
080
010
00F
L2-A
DM
G_p
53.0
09
sub
G1
G1
S
G2/
M8N
G1
39%
S
1
6%
G2/
M
27%
<
G1
1%
G1
3
%
S
2%
G2/
M
87%
<
G1
1%
G1
5%
S
7
%
G2/
M 1
9%
<G
1 1
7%
NZ
No tx
24 hrs
48 hrs
72 hrs
0060Counts
120180240300
060Counts
120180240300
060Counts
120180240300 060Counts
120180240300
060Counts
120180240300
060Counts
120180240300
200
400
600
800
1000
FL2
-A
HC
T_S
TU
DY
.001
sub
G1G1
S
G2/
M8N
020
040
060
080
010
00F
L2-A
HC
T_S
TU
DY
.002
sub
G1
G1
SG2
/M
8N
020
040
060
080
010
00F
L2-A
HC
T_S
TU
DY
.004
sub
G1
G1
S
G2/
M8N
G1
54
%
S
18%
G
2/M
21
%
<G
1
1%
G1
10%
S
5
%
G2/
M 7
5%
<G
1 3
%
G
1 1
7%
S
6%
G
2/M
42%
<
G1
6%
p-H
3 (d
ark)
p-H
3 (li
ght)
Act
in
p-H
3 (d
ark)
Dox
orub
icin
24 h
rs
Dox
orub
icin
72
hrs
Dox
orub
icin
24 h
rs
Dox
orub
icin
72 h
rs
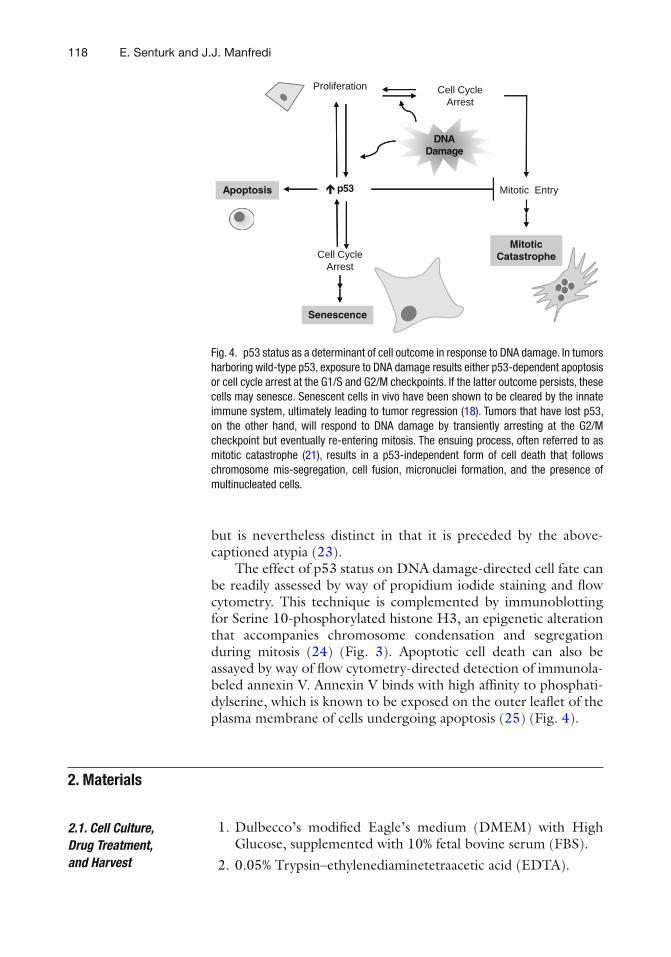
118 E. Senturk and J.J. Manfredi
but is nevertheless distinct in that it is preceded by the above-captioned atypia ( 23 ) .
The effect of p53 status on DNA damage-directed cell fate can be readily assessed by way of propidium iodide staining and fl ow cytometry. This technique is complemented by immunoblotting for Serine 10-phosphorylated histone H3, an epigenetic alteration that accompanies chromosome condensation and segregation during mitosis ( 24 ) (Fig. 3 ). Apoptotic cell death can also be assayed by way of fl ow cytometry-directed detection of immunola-beled annexin V. Annexin V binds with high af fi nity to phosphati-dylserine, which is known to be exposed on the outer lea fl et of the plasma membrane of cells undergoing apoptosis ( 25 ) (Fig. 4 ).
1. Dulbecco’s modi fi ed Eagle’s medium (DMEM) with High Glucose, supplemented with 10% fetal bovine serum (FBS).
2. 0.05% Trypsin–ethylenediaminetetraacetic acid (EDTA).
2. Materials
2.1. Cell Culture, Drug Treatment, and Harvest
Cell CycleArrest
Senescence
Apoptosis
DNADamage
p53
Cell CycleArrest
Mitotic Entry
MitoticCatastrophe
Proliferation
Fig. 4. p53 status as a determinant of cell outcome in response to DNA damage. In tumors harboring wild-type p53, exposure to DNA damage results either p53-dependent apoptosis or cell cycle arrest at the G1/S and G2/M checkpoints. If the latter outcome persists, these cells may senesce. Senescent cells in vivo have been shown to be cleared by the innate immune system, ultimately leading to tumor regression ( 18 ) . Tumors that have lost p53, on the other hand, will respond to DNA damage by transiently arresting at the G2/M checkpoint but eventually re-entering mitosis. The ensuing process, often referred to as mitotic catastrophe ( 21 ) , results in a p53-independent form of cell death that follows chromosome mis-segregation, cell fusion, micronuclei formation, and the presence of multinucleated cells.
1199 Determine the Effect of p53 on Chemosensitivity
3. Doxorbucin HCl (Sigma-Aldrich, St. Louis, MO), dissolved in dimethyl sulfoxide (DMSO) (Sigma-Aldrich, St. Louis, MO). 1 mg/mL stocks should prepared and aliquoted after fi ltration through a 0.2- μ m fi lter under a laminar fl ow hood and main-tained at −20°C thereafter. Working dilutions can also be maintained at −20°C after 1:10 dilution in sterile water.
1. DMEM with High Glucose, supplemented with 10% FBS. 2. 0.05% Trypsin–EDTA. 3. 70% Ethanol (EtOH). 4. 100× Stock propidium iodide (Sigma-Aldrich, St. Louis, MO)
prepared by dissolving available powder in PBS. Stock is stored in the dark at 4°C.
5. Ribonuclease A (RNAse A) powder, prepared from bovine pancreas (Sigma-Aldrich, St. Louis, MO). Powder is stored as-is at −20°C.
6. Conical-bottom 15 mL Falcon tubes, 17 × 120 mm style (BD Falcon, Franklin Lanes, NJ).
7. Round-bottom 12 × 75 mm Falcon tubes, polystyrene (BD Falcon, Franklin Lanes, NJ).
1. Tetramethylethylenediamine (TEMED) (Bio-Rad Laboratories, Rockaway, NJ).
2. 10% Ammonium persulfate (Sigma-Aldrich, St. Louis, MO) dissolved in distilled water. Store at 4°C for up to 1 month.
3. 30% Acrylamide/Bis solution, 37.5:1 (2–8°C) (Sigma-Aldrich, St. Louis, MO).
4. 10% Sodium-dodecyl sulfate (SDS) (Invitrogen, Carlsbad, CA) in distilled water.
5. 12% Resolving gel mix: Add 3 mL 10% SDS to 75 mL 1.5 M tris (hydroxymethyl)aminomethane (TRIS) (Sigma-Aldrich, St. Louis, MO), diluted in distilled water, and pH adjusted to 8.8 with HCl. Bring fi nal volume to 200 mL with distilled water. Store at 4°C.
6. 5% Stacking gel mix: Add 3 mL 10% SDS to 75 mL 0.5 M TRIS (Sigma-Aldrich, St. Louis, MO), diluted in distilled water, and pH adjusted to 6.8 with HCl. Bring fi nal volume to 250 mL with distilled water. Store at 4°C.
7. 1× SDS-PAGE running (Tris/Glycine/SDS) buffer (Bio-Rad Laboratories, Rockaway, NJ).
8. 0.1% Polyethylene glycol sorbitan monolaurate (TWEEN ® 20) dissolved in 1× PBS (Sigma-Aldrich, St. Louis, MO).
2.2. Propidium Iodide Staining for FACS Analysis
2.3. SDS-PAGE, Electrophoretic Transfer, and Immunoblotting for Serine 10-Phoshorylated Histone H3

120 E. Senturk and J.J. Manfredi
9. 3MM blotting paper (Whatman, Piscataway, NJ). 10. Nitrocellulose membranes (Bio-Rad Laboratories, Rockaway,
NJ). 11. Gel transfer buffer. Prepare 1 L using 100 mL 10× Tris/
Glycine buffer (Bio-Rad Laboratories, Rockaway, NJ), 200 mL 195-proof EtOH, and 700 mL distilled water.
12. Blocking solution: 2.5% nonfat dry milk (LabScienti fi c, Livingston, NJ) dissolved in 1× PBS/0.1% TWEEN ® 20.
13. Rabbit polyclonal Anti-Phospho-Histone H3 Ser10 antibody (Millipore, Billerica, MA), diluted 1:10,000 in blocking solution.
14. Stock lysis buffer reagents: Lysis buffer
(a) 10% Triton-X-100 (FisherScienti fi c, Fair Lawn, NJ). (b) 1 M HEPES pH 7.5 (FisherScienti fi c, Fair Lawn, NJ). (c) 5 M NaCl (FisherScienti fi c, Fair Lawn, NJ). (d) 1 M MgCl 2 (FisherScienti fi c, Fair Lawn, NJ).
Stock Triton-X-100-base may be prepared with fi nal con-centrations of 1% Triton-X-100, 50 mM HEPES pH 7.5, 50 mM NaCl, 1 mM MgCl 2 in an appropriate volume of distilled water. The following inhibitors are added to this buffer base immediately prior to use.:
Phosphatase inhibitors (a) 0.1 M Sodium orthovanadate (Sigma-Aldrich, St. Louis,
MO). Store stock at −20°C. Use 10 m L per mL of lysis buffer.
(b) 0.5 M Sodium fl uoride (Sigma-Aldrich, St. Louis, MO). Store stock at −20°C. Use 2 m L per mL of lysis buffer.
(c) 1.5 M 4-Nitrophenyl phosphate disodium salt hexahydrate (Sigma-Aldrich, St. Louis, MO). Store stock at −20°C. Use 1 μ L per mL of lysis buffer.
Protease inhibitors (a) 50 mM Phenylmethylsulfonyl fl uoride (Sigma-Aldrich, St.
Louis, MO). Store stock at −20°C. Use 20 μ L per mL of lysis buffer.
(b) Aprotinin, from bovine pancreas (Sigma-Aldrich, St. Louis, MO). Store at 4°C. Use 30 μ L per mL of lysis buffer.
(c) 2 mg/mL leupeptin (Sigma-Aldrich, St. Louis, MO). Store stock at −20°C. Use 1 μ L per mL of lysis buffer.
15. 3× Protein sample buffer, prepared with 3 mL glycerol, 1.5 mL β -mercaptoethanol, 0.9 g SDS, 3.75 mL 0.5 M TRIS PO 4 pH
1219 Determine the Effect of p53 on Chemosensitivity
6.8 (all available through FisherScienti fi c, Fair Lawn, NJ), adjusted to 10 mL with water. 1.0 mL Aliquots should be stored at −20°C.
16. 1.7 mL Microcentrifuge tubes (VWR Scienti fi c, Buffalo Grove, IL).
17. Anti-actin rabbit polyclonal antibody (Sigma-Aldrich, St. Louis, MO), diluted 1:1,000 in 1×PBS/0.1% TWEEN ® 20.
18. Broad range protein standards (Fermentas, Glen Burnie, MD). 19. HRP-conjugated goat anti-rabbit secondary antibody
(Millipore, Billerica, MA), diluted 1:1,000 in blocking solution.
20. Enhanced chemiluminescence (ECL) substrates for HRP detection (Thermo Scienti fi c, Rockford, IL).
21. Autoradiography fi lm and cassettes (MidSci, St. Louis, MO).
1. FITC-conjugated anti-Annexin V antibody (BD Pharmingen, San Diego, CA).
2. Annexin V binding buffer (AVBB) stock reagents: (a) 1 M HEPES pH 7.5 (FisherScienti fi c, Fair Lawn, NJ). (b) 5 M NaCl (FisherScienti fi c, Fair Lawn, NJ). (c) 1 M MgCl 2 (FisherScienti fi c, Fair Lawn, NJ). (d) 1 M CaCl 2 (FisherScienti fi c, Fair Lawn, NJ). Prepare AVBB with fi nal concentrations of reagents as follows:
10 mM HEPES pH 7.5, 150 mM NaCl, 5 mM KCl, 1 mM MgCl 2 , and 1.8 mM CaCl 2 . AVBB should be stored at 4°C for up to 1 month.
1. Laminar fl ow hood for sterile cell culture work. 2. CO 2 incubator, 37°C. 3. Refrigerator, 4°C. 4. Freezers, −20°C and −80°C. 5. Microcentrifuge. 6. Low speed centrifuge with swinging bucket rotor capable of
accommodating 15 mL tubes (see Subheading 2.2 , above). 7. FACS brand fl ow cytometer (BD BioSciences, San Jose, CA). 8. Appropriate apparatuses for SDS-acrylamide gel casting, SDS-
PAGE, gel transfer, and subsequent immunoblotting (available through Bio-Rad Laboratories, Rockaway, NJ).
9. Dark room with fi lm developer capable of processing autoradiographs.
2.4. Annexin V Detection by Flow Cytometry
2.5. Equipment
122 E. Senturk and J.J. Manfredi
p53 and Cell Cycle Effects after DNA Damage Chapter 4, “Determine the effect of p53 on cell cycle,” for the relevant protocol.
It is recommended that SDS-PAGE gels be cast ahead of time. Gels may be stored at 4°C for up to 5 days:
12.0% Resolving gel : Combine 5.9 mL 12% gel mix, 4.0 mL 30% Acrylamide/Bis solution, 37.5:1, 100 μ L 10% APS, and 10 μ L TEMED. Mix thoroughly and add 7.5 mL to an 8 cm × 10 cm × 1.5 mm gel cassette. Overlay with 70% EtOH. Incubate 15 min at room temperature. Dispose of ethanol overlay and rinse gently fi ve to six times with distilled water.
5.0% Stacking gel : Combine 8.3 mL 5.0% gel mix, 1.7 mL, 4.0 mL 30% Acrylamide/Bis solution, 37.5:1, 100 μ L 10% APS, and 10 μ L TEMED. Mixed thoroughly and add a volume suf fi cient to fi ll cast-ing apparatus. Insert a 10- or 15-well comb (depending on the num-ber of samples), taking care not to introduce air bubbles. Incubate 15 min at room temperature.
1. Cells are harvested by trypsinization at relevant points in time following treatment (e.g., every 24 h). Cells should be spun down at 2,000 g × 5 min at 4°C, rinsed once with 1× PBS, and spun again. Pellets may be frozen for lysis at a later time, pro-vided that all supernatants are aspirated and pellets are kept on dry ice for 5–10 min prior to storage at −80°C.
2. Cell pellets are lysed in an appropriate amount of Triton-X-100-based lysis buffer, prepared with the addition of protease and phosphatase inhibitors as detailed in Subheading 2 . Cells should be lysed on ice for 10–15 min.
3. Whole cell lysates (WCLs) are spun at 16,000 g × 5 min at 4°C. The supernatant is transferred to a new 1.7 mL microcentri-fuge tube. The pellet is discarded.
4. The protein content of each WCL is determined by Bradford assay.
5. Samples are prepared using a suf fi cient volume of WCL for 50 μ g of protein in a 1.7 mL microcentrifuge tube. Volume across samples should be equalized using Triton-X-100 lysis buffer, as prepared above. Add an appropriate volume of 3× protein sample buffer to each sample.
6. Samples are vortexed, spun down, and incubated at 95°C for 3 min to denature proteins. To avoid having tubes pop open during this incubation, a syringe needle may be used to produce a hole in the lid of each tube.
3. Methods
3.1. Staining with Propidium Iodide for Cell Cycle Analysis
3.2. Detection of Serine 10-Phosphorylated Histone H3 by Immunoblotting
1239 Determine the Effect of p53 on Chemosensitivity
7. Samples are again vortexed and spun down after incubation. 8. Samples are loaded into the wells of a pre-cast 12.0% resolv-
ing/5.0% stacking gel. 10 μ L Protein standards in an appro-priate amount of 3× protein sample buffer should be loaded into one lane at either end of the gel.
9. Samples are run at 130 V for approximately 1.5 h, until sample buffer has run out of the gel and into the running buffer.
10. After electrophoresis, the gel is transferred to a nitrocellulose membrane at 110 V for 60 min. Gel transfer should be carried out at 4°C.
11. The nitrocellulose membrane is cut horizontally at the ~35 kDa marker. The top half of the membrane can be used for actin immunodetection (~43 kDa). The bottom half is to be used for phosho-H3 Ser10 immunodetection (~17 kDa).
12. The nitrocellulose membrane sections are blocked in blocking solution for 1 h. The upper half is incubated in an appropriate volume and dilution of anti-actin antibody, the lower half in anti-phosho-H3 Ser10 , overnight with gentle agitation.
13. The membrane sections are washed three times, 10 min each, in blocking solution.
14. The membrane sections are incubated in an appropriate volume and dilution of HRP-conjugated anti-rabbit secondary for 1 h at room temperature with gentle agitation.
15. The membrane sections are washed four times, 10 min each, in blocking solution. Two fi nal washes in 1× PBS/0.1% TWEEN ® 20, 10 min each, are performed to wash out any residual milk prior to developing.
16. The membranes are coated in ECL reagent for 1 min. The ECL is blotted off on a paper towel. The membranes are wrapped in transparent fi lm and fi xed to the inside of an auto-radiography cassette with clear tape.
17. In a dark room, membranes are exposed against autoradiog-raphy fi lm for a range of different exposure lengths (e.g., 5, 10, 30, and 60 s). Films are developed and labeled appropriately.
1. Unlike PI staining for fl ow cytometry analysis of DNA con-tent, cells harvested for Annexin V staining are not fi xed in EtOH and cannot be stored at −20°C for later analysis. All samples must be harvested and analyzed at the same time. For assessment of up to 72 h of treatment, for example, cells should be split evenly 4 days prior to analysis and treated on days 3, 2, and 1 prior to harvest. An untreated plate of cells may be harvested on the day of analysis as a control sample.
2. Cells are harvested by trypsinization. Cell culture medium should be retained in a 15 mL conical-bottom Falcon tube, as
3.3. Assessment of Apoptosis by Annexin V Staining and Detection by Flow Cytometry
124 E. Senturk and J.J. Manfredi
this is likely to contain dead cells that will be relevant for the analysis. This medium can be used to neutralize the trypsiniza-tion reaction and collect adherent cells into the same tube. Add 2–3 mL of 1× PBS and collect into relevant tube of cells to ensure maximum recovery.
3. Cell suspensions are spun at 800 g × 5 min at room temperature. 4. Cell supernatant is aspirated. All visible traces of trypsin should
be removed, as residual enzyme may cleave exposed annexin V. 5. The FITC-conjugated annexin V antibody is diluted 1:250 in
AVBB. 6. Cells are resuspended in 500 μ L to 1.0 mL of FITC-annexin V
dilution and transferred to round-bottom 12 × 75 mm Falcon tubes.
7. Cells are kept in the dark at 4°C for 30 min. Cells are resus-pended every 5–10 min to ensure adequate antibody binding.
8. Samples are analyzed for annexin V expression on a BD BioSciences FACScalibur fl ow cytometer. The FL1 laser is used to detect the FITC-annexin V antibody. CellQuest software is used to generate both acquisition and analysis plots of 2,000 cells. The percent of cells that are annexin V positive is used as a surrogate measure for cells that have undergone apoptosis.
Acknowledgments
The authors wish to thank Jerry Chipuk and Kostas Floros for guidance with Annexin V staining and detection protocols. The authors are supported by grants from the National Cancer Institute.
References
1. Stewart ZA, Pietenpol JA (2001) p53 Signaling and cell cycle checkpoints. Chem Res Toxicol 14:243–263
2. Vousden KH, Lu X (2002) Live or let die: the cell’s response to p53. Nat Rev Cancer 2:594–604
3. Sansom OJ, Clarke AR (2000) P53 null mice: damaging the hypothesis? Mutat Res 452:149–162
4. Hanahan D, Weinberg RA (2000) The hall-marks of cancer. Cell 100:57–70
5. Lowe SW, Ruley HE, Jacks T, Housman DE (1993) p53-dependent apoptosis modulates the cytotoxicity of anticancer agents. Cell 74:957–967
6. Lowe SW, Schmitt EM, Smith SW, Osborne BA, Jacks T (1993) p53 is required for radiation-induced apoptosis in mouse thymocytes. Nature 362:847–849
7. Gudkov AV, Komarova EA (2003) The role of p53 in determining sensitivity to radiotherapy. Nat Rev Cancer 3:117–129
8. Merritt AJ, Allen TD, Potten CS, Hickman JA (1997) Apoptosis in small intestinal epithelial from p53-null mice: evidence for a delayed, p53-independent G2/M-associated cell death after gamma-irradiation. Oncogene 14:2759–2766
9. Han JW, Dionne CA, Kedersha NL, Goldmacher VS (1997) p53 status affects the rate of the onset but not the overall extent of
1259 Determine the Effect of p53 on Chemosensitivity
doxorubicin-induced cell death in rat-1 fi broblasts constitutively expressing c-Myc. Cancer Res 57:176–182
10. Tannock IF, Lee C (2001) Evidence against apoptosis as a major mechanism for reproduc-tive cell death following treatment of cell lines with anti-cancer drugs. Br J Cancer 84:100–105
11. Kemp CJ, Sun S, Gurley KE (2001) p53 induc-tion and apoptosis in response to radio- and chemotherapy in vivo is tumor-type-dependent. Cancer Res 61:327–332
12. Agarwal ML, Agarwal A, Taylor WR, Stark GR (1995) p53 controls both the G2/M and the G1 cell cycle checkpoints and mediates revers-ible growth arrest in human fi broblasts. Proc Natl Acad Sci USA 92:8493–8497
13. Flatt PM, Tang LJ, Scatena CD, Szak ST, Pietenpol JA (2000) p53 regulation of G(2) checkpoint is retinoblastoma protein depen-dent. Mol Cell Biol 20:4210–4223
14. Meulmeester E, Jochemsen AG (2008) p53: a guide to apoptosis. Curr Cancer Drug Targets 8:87–97
15. Schmitt CA, Rosenthal CT, Lowe SW (2000) Genetic analysis of chemoresistance in primary murine lymphomas. Nat Med 6:1029–1035
16. Gewirtz DA, Holt SE, Elmore LW (2008) Accelerated senescence: an emerging role in tumor cell response to chemotherapy and radi-ation. Biochem Pharmacol 76:947–957
17. Dimri GP (2005) What has senescence got to do with cancer? Cancer Cell 7:505–512
18. Xue W, Zender L, Miething C, Dickins RA, Hernando E, Krizhanovsky V, Cordon-Cardo C, Lowe SW (2007) Senescence and tumour clearance is triggered by p53 restoration in murine liver carcinomas. Nature 445:656–660
19. Brown JM, Wilson G (2003) Apoptosis genes and resistance to cancer therapy: what does the experimental and clinical data tell us? Cancer Biol Ther 2:477–490
20. Bunz F, Dutriaux A, Lengauer C, Waldman T, Zhou S, Brown JP, Sedivy JM, Kinzler KW, Vogelstein B (1998) Requirement for p53 and p21 to sustain G2 arrest after DNA damage. Science 282:1497–1501
21. Castedo M, Perfettini JL, Roumier T, Andreau K, Medema R, Kroemer G (2004) Cell death by mitotic catastrophe: a molecular de fi nition. Oncogene 23:2825–2837
22. Mansilla S, Bataller M, Portugal J (2006) Mitotic catastrophe as a consequence of chemotherapy. Anticancer Agents Med Chem 6:589–602
23. Mansilla S, Priebe W, Portugal J (2006) Mitotic catastrophe results in cell death by caspase-dependent and caspase-independent mecha-nisms. Cell Cycle 5:53–60
24. Nowak SJ, Corces VG (2004) Phosphorylation of histone H3: a balancing act between chro-mosome condensation and transcriptional acti-vation. Trends Genet 20:214–220
25. Koopman G, Reutelingsperger CP, Kuijten GA, Keehnen RM, Pals ST, van Oers MH (1994) Annexin V for fl ow cytometric detec-tion of phosphatidylserine expression on B cells undergoing apoptosis. Blood 84:1415–1420
26. DeWeese TL, Walsh JC, Dillehay LE, Kessis TD, Hedrick L, Cho KR, Nelson WG (1997) Human papillomavirus E6 and E7 oncopro-teins alter cell cycle progression but not radio-sensitivity of carcinoma cells treated with low-dose-rate radiation. Int J Radiat Oncol Biol Phys 37:145–154
27. Portugal J, Bataller M, Mansilla S (2009) Cell death pathways in response to antitumor therapy. Tumori 95:409–421
28. Bunz F, Hwang PM, Torrance C, Waldman T, Zhang Y, Dillehay L, Williams J, Lengauer C, Kinzler KW, Vogelstein B (1999) Disruption of p53 in human cancer cells alters the responses to therapeutic agents. J Clin Invest 104:263–269

127
Sumitra Deb and Swati Palit Deb (eds.), p53 Protocols, Methods in Molecular Biology, vol. 962,DOI 10.1007/978-1-62703-236-0_10, © Springer Science+Business Media New York 2013
Chapter 10
Measurement of Chemosensitivity and Growth Rate in p53 Expressing Cells
Mahesh Ramamoorthy * , Catherine Vaughan * , Sumitra Deb , and Swati Palit Deb
Abstract
Chemoresistance and increased growth rate are two gain-of-function functions that mutant p53 is thought to possess. Here, we describe two methods for measuring the sensitiveness of cells to chemotherapeutic drugs and the rate of cell growth. Both of which can be used with a wide range of cell types. The clono-genic assay can be used with many different chemotoxic drugs and the growth assay described here presents an alternative to the MTT assay and allows for a long-term measurement of cell growth. These protocols are both easy, fl exible, require relatively little effort, and are inexpensive to carry out.
Key words: Chemotoxic , Gain of function , Clonogenic assay , Growth assay
Clonogenic assays are considered the ‘gold standards’ for the mea-surement of cellular sensitivity. As described by Puck and Marcus, the clonogenic assay relies on the ability of individual mammalian cells to replicate and form colonies ( 1 ) . At least 50 cells are required to de fi ne a colony. The fi rst clonogenic experiments were carried out to measure the ability of HeLa cells to survive radiation ( 2 ) .
Subsequently, the assay has been used to measure the sensi-tivity of a large variety of cells including stem cells to a wide range
1. Introduction
* These authors contributed equally to this work.
128 M. Ramamoorthy et al.
of agents, with the ‘surviving’ fraction of cells retaining the ability to form colonies. Further, the assay has been widely used to test the ability of particular gene(s) to confer resistance or sensitivity to treatment with agents. The expression of wild type p53 is generally correlated with sensitivity to radiation and treatment with various chemotherapeutic agents, where p53 is activated when cells are subject to stress and triggers cell death or senescence. The clono-genic assay has been used over the years to determine the contri-bution of p53 towards resistance or sensitivity to various chemotherapeutic agents, radiation and other stresses ( 3 –7 ) .
Cell proliferation assays have been performed to study the roles of various microRNAs ( 8 ) , the effect of treatment with growth factors ( 9 ) , and with inhibitors ( 10 ) . Most of the cell proliferation assays used now are based off of the MTT assay ( 11 ) or colony formation assays ( 11, 12 ) . Counting cells can also be accomplished through the use of trypan blue staining, but that method is slow and time consuming when a large number of popu-lation of cells need to be counted.
The MTT assay is a colorimetric assay where the reduction of salts is used to produce a color that is measured using a spectro-photometer. Others have used the CyQUANT assay ( 13 ) which measures the amount of DNA present in cells to calculate prolifera-tion. The growth assay as described here is especially useful in studying the gain of function phenotype of mutant p53 and has been used extensively in cells that have had p53 knocked down. This assay may be used after any treatment to cells such as transient transfection, siRNA mediated knock-down, or drug or steroid treatment.
Cells are counted and plated at a speci fi c density and then harvested either every other day or every day depending on how fast the cell line grows. A coulter counter is used to count cells and the total number calculated. This method is easy to perform and quick to complete.
1. Petri plates- 10cm or 6cm; Alternatively 6 well plates can be used.
2. Pipettes. 3. Sterile tubes for serial dilution. 4. Coulter counter or Haemocytometer. 5. Microscope. 6. Colony counting pen. 7. Light Box.
2. Materials
2.1. Clonogenic assay
12910 Measurement of Chemosensitivity and Growth Rate in p53 Expressing Cells
8. Appropriate cell culture medium. Most cells require serum to be added.
9. Phosphate Buffered Saline (PBS) or Hanks Balanced Salt Solution (HBSS).
10. Trypsin with EDTA. 11. Isotonic solution for counting cells. 12. Chemotherapeutic drug(s) to be tested. At least 3 different
concentrations to be tested. 13. Vehicle for diluting drugs and also for control plates. 14. Methanol for fi xation of colonies. 15. Methylene Blue or Crystal Violet Dye for staining colonies.
1. Adherent cultured cells. 2. Cell culture incubator. 3. 60 mm Culture dishes. 4. Cell counter or hemacytometer. 5. HBSS or PBS. 6. 10× Trypsin in EDTA. 7. 15 mL Tube.
1. HBSS or PBS. 2. 10× Trypsin in EDTA. 3. 1.5 mL Tubes.
1. 1× PBS. 2. Coulter Counter or haemacytometer. 3. Trypan blue if using a haemacytometer.
1. Excel or other suitable software.
1. Before starting the experiment, ensure all the paraphernalia that will be used is kept inside a sterile tissue culture hood including the tubes in which the dilutions will be carried out. Also label the plates (along with the lid) that will be used for the assay appropriately. This ensures that the plates are not switched when multiple assays are carried out together. Make sure the label is resistant to methanol, used for fi xation.
2. Remove the media from the cells that will be used to plate for the assay (see Note 1). Wash the plate two times with either
2.2. Plating Cells
2.3. Harvesting Cells
2.4. Counting Cells
2.5. Plotting Data
3. Methods
3.1. Clonogenic Assay
3.1.1. Plating cells

130 M. Ramamoorthy et al.
PBS or HBSS and aspirate the wash solution. Trypsinize the cells and collect the cells in 10 mls media in a tube.
3. Count the cells using either a haemocytometer or using a coulter counter.
4. Dilute the cell suspension serially to obtain desired seeding concentrations (see Note 2). It is advisable to use at least 1 ml of cell suspension for dilution and also for the fi nal seeding. This ensures minimum error.
5. Allow the cells to plate before the treatment. Generally, 24 hours is a good time period for this purpose.
1. Perform the treatment (see Note 3). Some treatments call for at least two washes with PBS and a change of media immedi-ately after treatment to remove the drug from the plates after exposure. Others vary depending on the agent used.
2. The plates are then kept back in the incubator. 3. Change media on the plates every 4-5 days, as this allows fresh
supply of nutrients. If required, leave back some of the old media (for conditioning). Constantly monitor the cells for the formation of colonies-every two days.
1. Once the colonies form, remove the media and was the plates with PBS.
2. Remove the PBS and fi x the colonies with ice cold methanol. Let the methanol sit on the plates for at least 20 minutes.
3. Rinse the plates with distilled water. Add either Methylene Blue or Crystal violet stain and leave the plates overnight.
4. Remove the stain and wash the plates with water and leave them to dry. The colonies should be visible and are now ready to count.
1. Use either an automatic counting colony counter or manually count the colonies using an alcohol resistant pen to mark indi-vidual colonies. Determine the plating ef fi ciency of control cells, that is, the fraction of colonies from cells exposed to the vehicle of no treatment.
Plating ef fi ciency is calculated as below:P.E.= number of colonies formed/ number of cells seeded. Plot a graph of percent survival (y axis) against drug concen-tration (x axis) to get the survival curve.
1. Take the cells to be used for the growth assay out of the incubator and remove media. Wash once with 10 mL HBSS or PBS and remove.
3.1.2. Treating cells
3.1.3. Staining
3.1.4. Counting colonies
3.1.5. Analysis of Results
3.2. Growth Assay
3.2.1. Plating Cells
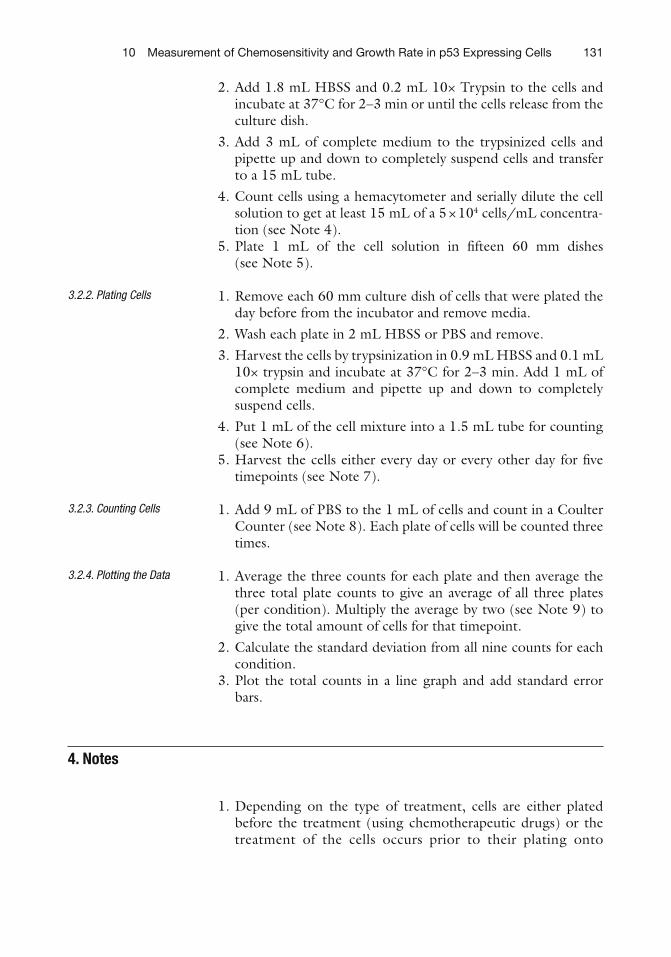
13110 Measurement of Chemosensitivity and Growth Rate in p53 Expressing Cells
2. Add 1.8 mL HBSS and 0.2 mL 10× Trypsin to the cells and incubate at 37°C for 2–3 min or until the cells release from the culture dish.
3. Add 3 mL of complete medium to the trypsinized cells and pipette up and down to completely suspend cells and transfer to a 15 mL tube.
4. Count cells using a hemacytometer and serially dilute the cell solution to get at least 15 mL of a 5 × 10 4 cells/mL concentra-tion (see Note 4).
5. Plate 1 mL of the cell solution in fi fteen 60 mm dishes (see Note 5).
1. Remove each 60 mm culture dish of cells that were plated the day before from the incubator and remove media.
2. Wash each plate in 2 mL HBSS or PBS and remove. 3. Harvest the cells by trypsinization in 0.9 mL HBSS and 0.1 mL
10× trypsin and incubate at 37°C for 2–3 min. Add 1 mL of complete medium and pipette up and down to completely suspend cells.
4. Put 1 mL of the cell mixture into a 1.5 mL tube for counting (see Note 6).
5. Harvest the cells either every day or every other day for fi ve timepoints (see Note 7).
1. Add 9 mL of PBS to the 1 mL of cells and count in a Coulter Counter (see Note 8). Each plate of cells will be counted three times.
1. Average the three counts for each plate and then average the three total plate counts to give an average of all three plates (per condition). Multiply the average by two (see Note 9) to give the total amount of cells for that timepoint.
2. Calculate the standard deviation from all nine counts for each condition.
3. Plot the total counts in a line graph and add standard error bars.
1. Depending on the type of treatment, cells are either plated before the treatment (using chemotherapeutic drugs) or the treatment of the cells occurs prior to their plating onto
3.2.2. Plating Cells
3.2.3. Counting Cells
3.2.4. Plotting the Data
4. Notes
132 M. Ramamoorthy et al.
subsequent dishes (gamma irradiation). It is advisable to save the medium in which the cells have been growing prior to them split into treatment plates and adding this medium to the plates. This ‘conditions’ the media with growth factors gener-ated when the cells were grown at a higher density.
2. It is important to remember to make enough cell suspension to allow plating for at least a minimum of three different con-centrations of the treatment with allowance for triplicates for each concentration. Plating for the non treated control plates should come from either the stock used for plating for the vari-ous treatment or should be a dilution of the stock with the dilution factor accounted for in the fi nal analysis. The accuracy is important as this accounts for the plating ef fi ciency of the cells.
3. As previously mentioned, it is important to have at least three concentrations of the treatment. This allows plotting for a sur-vival curve. If the assay is done with untested agents or untried strategies, it is recommended to test the agent in a series of concentrations increasing logarithmically and the nailing on a range of three concentrations to be tested before the actual experiment. It is imperative to identify the vehicle to be used for dissolving chemical agents and use the vehicle to treat the control plates (vehicle control).
4. 7.5 × 10 5 Total cells are needed. 5. At least three plates are needed for each cell type, condition the
cells have been treated, and for each time point that will be used (Ex. three plates of H1299 siRNA treated for at least fi ve timepoints; giving a total of 15 plates).
6. Make sure that all cells have been collected from the culture dish. If the trypsinization has been inef fi cient the cell counts will be inaccurate.
7. Depending on how fast the cell line grows, the times at which to harvest the cells will vary. For example, H1299 cells grow quickly and are harvested every day while slower growing cells are harvested every other day.
8. Cell counting can also be accomplished with a haemacytometer, but using a Coulter Counter can save time and be more ef fi cient.
9. The average number is multiplied by two since the cells were harvested in a total amount of 2 mL and only half was used for counting.
13310 Measurement of Chemosensitivity and Growth Rate in p53 Expressing Cells
Acknowledgments
This work was supported by grants from NIH to Sumitra Deb (CA70712 and CA121144) and Swati Palit Deb (CA74172), and Pilot Project Awards from Massey Cancer to Sumitra Deb and Swati Palit Deb. We thank Shilpa Singh for help in editing this chapter.
References
1. Puck, T.T., Marcus, P.I. and Cieciura, S.J. (1956) Clonal growth of mammalian cells in vitro; growth characteristics of colonies from single HeLa cells with and without a feeder layer. J. Exp. Med ., 103, 273–283
2. Puck, T.T. and Marcus, P.I. (1956) Action of x-rays on mammalian cells. J. Exp . Med., 103, 653–666
3. Bhana, S. and Lloyd, D.R. (2008) The role of p53 in DNA damage-mediated cytotoxicity overrides its ability to regulate nucleotide exci-sion repair in human fi broblasts. Mutagenesis , 23, 43–50
4. Lin, X., Ramamurthi, K., Mishima, M., Kondo, A. and Howell, S.B. (2000) p53 interacts with the DNA mismatch repair system to modulate the cytotoxicity and mutagenicity of hydrogen peroxide. Mol. Pharmacol ., 58, 1222–1229
5. Lu, X., Errington, J., Curtin, N.J., Lunec, J. and Newell,D.R. (2001) The impact of p53 status on cellular sensitivity to antifolate drugs. Clin. Cancer Res ., 7, 2114–2123
6. McDonald, A.C. and Brown, R. (1998) Induction of p53-dependent and p53-inde-pendent cellular responses by topoisomerase 1 inhibitors. Br. J. Cancer , 78, 745–751
7. Sah, N.K., Munshi, A., Nishikawa,T., Mukhopadhyay,T., Roth,J.A. and Meyn,R.E. (2003) Adenovirus-mediated wild-type p53 radiosensitizes human tumor cells by suppress-ing DNA repair capacity. Molecular Cancer Therapeutics , 2, 1223–1231
8. Jiang, S. et al. Molecular dissection of the miR-17–92 cluster’s critical dual roles in promoting Th1 responses and preventing inducible Treg differentiation. Blood. 2011 Oct
9. Stewart EA, Samaranayake GJ, Browning AC, Hopkinson A, Amoaku WM. Comparison of choroidal and retinal endothelial cells: Characteristics and response to VEGF isoforms and anti-VEGF treatments. Experimental Eye Research. 2011 Sep 28
10. Demars MP, Bartholomew A, Strakova Z, Lazarov O. Soluble amyloid precursor pro-tein: a novel proliferation factor of adult progenitor cells of ectodermal and mesodermal origin. Stem Cell Res Ther. 2011 Aug 30;2(4):36
11. Yang J, Sun M, Zhang A, Lv C, De W, Wang Z. Adenovirus-mediated siRNA targeting Bcl-xL inhibits proliferation, reduces invasion and enhances radiosensitivity of human colorectal cancer cells. World Journal of Surgical Oncology . 2011 Oct 4;9(1):117
12. Anzai, K. Effectiveness of combined treatment using X-rays and a phosphoinositide 3-kinase inhibitor, ZSTK474, on proliferation of HeLa cells in vitro and in vivo. Cancer Sci. 2011 Jun; 102(6):1176–80
13. Johnson MD, O’Connell M, Facik M, Maurer P, Jahromi B, Pilcher W. Cerebrospinal fl uid stimulates leptomeningeal and meningioma cell proliferation and activation of STAT3. Journal of Neuro-oncology . 2011 Oct
135
Sumitra Deb and Swati Palit Deb (eds.), p53 Protocols, Methods in Molecular Biology, vol. 962,DOI 10.1007/978-1-62703-236-0_11, © Springer Science+Business Media New York 2013
Chapter 11
Mutant p53 in Cell Adhesion and Motility
W. Andrew Yeudall , Katharine H. Wrighton , and Sumitra Deb
Abstract
Pro-oncogenic properties of mutant p53 were investigated with the aid of migration assays, adhesion assays, and soft agar growth assays using cells stably expressing gain-of-function p53 mutants. To deter-mine cell migration, “wound-healing” (scratch) assays and haptotactic (chamber) assays were used. H1299 cells expressing mutant p53 were found to migrate more rapidly than cells transfected with empty vector alone. Results from both types of migration assay were broadly similar. Migratory ability differed for different p53 mutants, suggesting allele-speci fi c effects. Cells expressing p53 mutants also showed enhanced adhesion to extracellular matrix compare to controls. Furthermore, stable transfection of mutant p53-H179L into NIH3T3 fi broblasts was suf fi cient to allow anchorage-independent growth in soft agar.
Key words: Adhesion , Motility , Migration , Gain-of-function , Chemotaxis , Extracellular matrix , Anchorage independence
Although wild-type p53 is well recognized as a gatekeeper of normal cellular homeostasis ( 1 ) , the functions attributable to mutant p53 have been less well studied. While much earlier research focused on dominant-negative inactivation of wild-type p53, it is becoming increasingly clear that “gain-of-function” (GOF) mutations may endow p53 with additional properties, making it oncogenic in its own right ( 2– 13 ) . It is important to identify these aberrant pro-teins, not only as a means to understand mechanisms of tumor progression but, also, because such mutants will likely be good targets for therapeutic intervention if their oncogenic properties can be neutralized ( 14 ) .
During tumor progression, cancer cells gain many properties that may give them growth and/or survival advantages and include
1. Introduction

136 W.A. Yeudall et al.
altered interactions with the extracellular matrix (ECM), increased motility, and, in some cases, anchorage-independent growth. These properties are straightforward to measure using a range of assays. Thus, the contribution of GOF p53 proteins to the aforemen-tioned aspects of tumor progression can be readily determined using appropriate cell lines. Adhesion assays, in which multi-well tissue culture plates are coated with the ECM protein of choice (routinely we use fi bronectin, vitronectin, laminin, and collagen IV), can be used to investigate altered cell–ECM interactions. Enhanced cell motility can be determined by wound-closure or “scratch” assays, which measures the time taken for cells to migrate across a denuded area of a previously con fl uent cell monolayer. Alternatively, cells may be plated in the upper chamber of porous supports, and the number of cells migrating to the opposite side of the porous membrane in a given time is then determined after staining and counting. Further, inoculation of cells into suspension culture (“soft agar”) measures growth in the absence of solid support and can be a good determinant of the aggressive nature of a cell line.
We used H1299 lung cancer cells stably transfected with GOF p53 mutants: R175H, H179L, R273H, D281G; and NIH3T3 fi broblasts (which have endogenous wild-type p53) stably trans-fected with p53-H179L, as well as appropriate vector-transfected controls ( 10, 11, 13 ) . We found that H1299 cells expressing p53 mutants at similar levels showed increased adhesion to fi bronectin (FN)-coated plates and enhanced migration in scratch and haptot-actic migration assays. Furthermore, fi broblasts expressing p53-H179L formed colonies in soft agar, consistent with the aggressive phenotype of these cells as reported previously by our laboratory.
1. 24-Well tissue culture plates (Cellstar 662160; Greiner Bio-One, Monroe, NC, USA [or equivalent]).
2. Fibronectin (F1141; Sigma Aldrich, St. Louis, MO, USA) [or vitronectin (V8379), laminin (L2020), collagen IV (C0543)—all from Sigma Aldrich].
3. Bovine serum albumin (BSA; A9418; Sigma Aldrich, St. Louis, MO, USA).
4. Calcium- and magnesium-free (CMF) phosphate-buffered saline (Dulbecco’s PBS, DPBS, pH 7.4; 55-031-PB; Mediatech Inc., Manassas, VA, USA). Reconstitute in tissue culture grade water and sterilize by fi ltration.
2. Materials
2.1. Adhesion Assays
13711 Mutant p53 in Cell Adhesion and Motility
5. Growth medium (e.g., Dulbecco’s modi fi cation of Eagle’s medium, DMEM). We recommend purchasing DMEM in powdered form (DMEM/High Glucose; HyClone SH30003.03; Thermo Scienti fi c HyClone, Logan, UT, USA [or equivalent]), reconstituting in tissue culture grade water together with NaHCO 3 (Cellgro 61-065-RO; Mediatech Inc., Manassas, VA, USA) and sterilizing by fi ltration. This allows preparation of 2× concentrated medium, as required for soft agar assays (see Subheading 2.4 ). Be sure to supplement with sodium pyruvate (and antibiotics, if desired).
6. Crystal violet (C3886; Sigma Aldrich, St. Louis, MO, USA), prepared as a 0.1% solution in DPBS.
7. Ethanol (absolute, 200 proof; 459844, Sigma Aldrich, St. Louis, MO, USA).
1. 12-Well tissue culture plates (Costar 3513; Corning Inc., Corning, NY, USA [or equivalent]).
2. DMEM (see Subheading 2.1 ) supplemented with 10% (v/v) fetal bovine serum (HyClone, Thermo Scienti fi c HyClone, Logan, UT, USA [or equivalent]).
3. Light microscope with camera and imaging software (e.g., Axiocam and Axiovision, Carl Zeiss Inc., Thornwood, NY, USA).
1. Transwell tissue culture inserts (6.5 mm) with polycarbonate membranes of pore-size 8 μ m (Costar 3422, Corning Inc., Corning, NY, USA).
2. Cellstripper (Cellgro 25-056-CI; Mediatech Inc., Manassas, VA, USA).
3. DPBS and DMEM (see Subheading 2.1 ). 4. Glutaraldehyde (G5882; Sigma Aldrich, St. Louis, MO, USA)
prepared as a 0.025% (v/v) solution in DPBS. 5. Hematoxylin solution (H-3401; Vector Laboratories,
Burlingame, CA, USA [or equivalent]). 6. Scalpel blades (#11).
1. 35 mm Diameter tissue culture dishes (Cellstar 627170) or 6-well plates (Cellstar 657185; Greiner Bio-One, Monroe, NC, USA [or equivalent]).
2. Low melting point (LMP) agarose (V3841; Promega Corp., Madison, WI, USA [or equivalent]).
3. Tissue culture grade water. 4. DMEM (see Subheading 2.1 ), reconstituted to 2× working
concentration and fi lter-sterilized.
2.2. Wound-Closure Migration Assays
2.3. Haptotactic Migration Assays
2.4. Soft Agar Assays
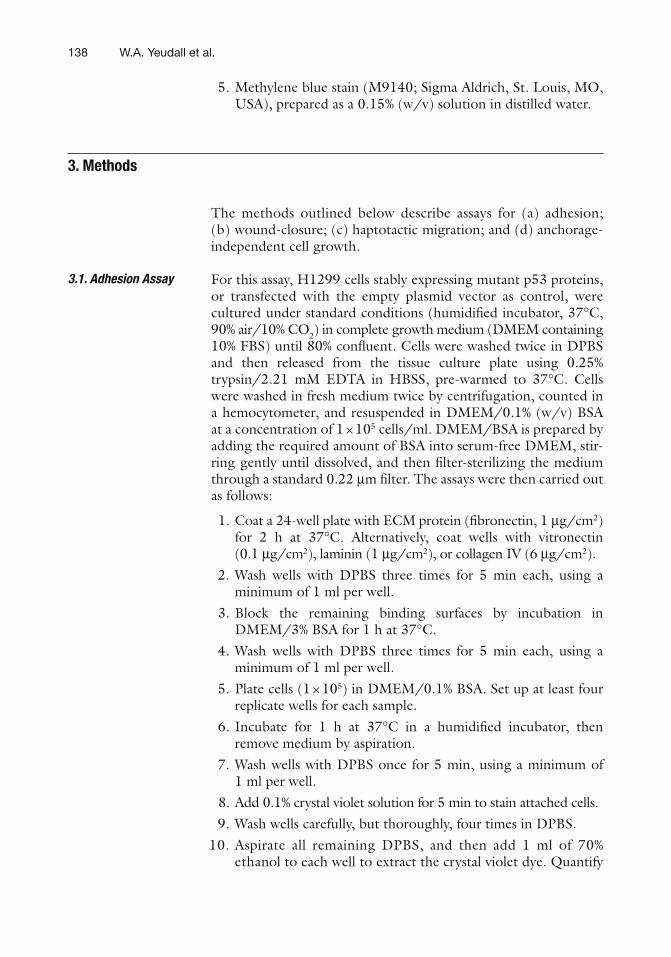
138 W.A. Yeudall et al.
5. Methylene blue stain (M9140; Sigma Aldrich, St. Louis, MO, USA), prepared as a 0.15% (w/v) solution in distilled water.
The methods outlined below describe assays for (a) adhesion; (b) wound-closure; (c) haptotactic migration; and (d) anchorage-independent cell growth.
For this assay, H1299 cells stably expressing mutant p53 proteins, or transfected with the empty plasmid vector as control, were cultured under standard conditions (humidi fi ed incubator, 37°C, 90% air/10% CO 2 ) in complete growth medium (DMEM containing 10% FBS) until 80% con fl uent. Cells were washed twice in DPBS and then released from the tissue culture plate using 0.25% trypsin/2.21 mM EDTA in HBSS, pre-warmed to 37°C. Cells were washed in fresh medium twice by centrifugation, counted in a hemocytometer, and resuspended in DMEM/0.1% (w/v) BSA at a concentration of 1 × 10 5 cells/ml. DMEM/BSA is prepared by adding the required amount of BSA into serum-free DMEM, stir-ring gently until dissolved, and then fi lter-sterilizing the medium through a standard 0.22 μ m fi lter. The assays were then carried out as follows:
1. Coat a 24-well plate with ECM protein ( fi bronectin, 1 μ g/cm 2 ) for 2 h at 37°C. Alternatively, coat wells with vitronectin (0.1 μ g/cm 2 ), laminin (1 μ g/cm 2 ), or collagen IV (6 μ g/cm 2 ).
2. Wash wells with DPBS three times for 5 min each, using a minimum of 1 ml per well.
3. Block the remaining binding surfaces by incubation in DMEM/3% BSA for 1 h at 37°C.
4. Wash wells with DPBS three times for 5 min each, using a minimum of 1 ml per well.
5. Plate cells (1 × 10 5 ) in DMEM/0.1% BSA. Set up at least four replicate wells for each sample.
6. Incubate for 1 h at 37°C in a humidi fi ed incubator, then remove medium by aspiration.
7. Wash wells with DPBS once for 5 min, using a minimum of 1 ml per well.
8. Add 0.1% crystal violet solution for 5 min to stain attached cells. 9. Wash wells carefully, but thoroughly, four times in DPBS. 10. Aspirate all remaining DPBS, and then add 1 ml of 70%
ethanol to each well to extract the crystal violet dye. Quantify
3. Methods
3.1. Adhesion Assay
13911 Mutant p53 in Cell Adhesion and Motility
by reading the absorbance at 620 nm in a standard visible light spectrophotometer. Be sure to include blank wells without cells as control. Absorbance is then plotted after subtracting the value for the blank. The results of a typical assay are shown in Fig. 1 , with mutant p53-expressing H1299 cells showing enhanced adhesion to fi bronectin-coated plates compared to control-transfected cells.
In this assay, we measured the speed with which cells expressing mutant p53 proteins are able to migrate across a denuded area (“wound” or “scratch”) of a tissue culture plate. Cells were grown in complete medium until 80% con fl uent, then released from the culture plate using 0.1% trypsin–2.21 mM EDTA (Mediatech, Herndon, VA), counted in a hemocytometer, and resuspended in complete medium at a concentration of 1 × 10 5 cells/ml.
1. Mark the undersurface of each well of 12-well culture plates with three parallel straight lines using an indelible pen. This will allow for orientation of plates for measurement.
2. Plate 2 × 10 5 cells in triplicate wells of these culture plates and incubate at 37°C until cells are completely con fl uent.
3. Using a sterilized disposable pipette tip (“yellow tip”), make a scratch across the surface of the plate to remove the complete layer of cells within the scratch area. This should be at 90° to the orientation lines drawn in step 1. Following cell removal, wash each well twice with DPBS and then replace with complete growth medium.
3.2. Wound-Closure Migration Assay
0.2
0.3
0.4
0.5
0.6
0.7
0.8
0.9
OD
620
H1299
0
0.1
vect
or
p53-
R17
5H
p53-
R27
3H
p53-
D28
1G
Fig. 1. H1299 lung cancer cells, stably transfected with empty vector or plasmids encoding the indicated p53 mutants, were tested for adhesion to fi bronectin substrate, as described in the text. After crystal violet staining, dye was extracted and quanti fi ed by spectrophotometry. Values are means of quadruplicate wells and representative of three independent experiments. Bar = s.d.
140 W.A. Yeudall et al.
4. Immediately, measure the width of the scratch either side of where it intersects with the three orientation lines. This is carried out under a low power objective using a light micro-scope with camera and suitable analysis software. We use an Axiocam MRm and Axiovision software. You should have 18 measurements for each cell line being analyzed—triplicate wells and six points per well.
5. Return cells to the 37°C incubator for 10 h, after which time the scratch width is measured at exactly the same positions as at the starting time. Subtract fi nal distance from starting distance and then divide by time to give migration rate ( μ m/h). As shown in Fig. 2 , expression of mutant p53 proteins enhances cell motility compared to vector-transfected control H1299 cells. Furthermore, different mutant p53 alleles increase motility by varying amounts, suggesting allele-speci fi c effects.
Migratory ability can also be measured readily with the aid of Transwell tissue culture inserts, which contain a porous membrane that separates an upper chamber from the remainder of the culture well. For migration assays, we fi nd that the inserts with 8 μ m diameter pores are suitable for most of the cancer cells with which we work.
1. Coat the underside of 8 μ m pore size Transwell inserts with fi bronectin at a density of 1 μ g/cm 2 and incubate for 2 h at 37°C in a humidi fi ed incubator.
2. Rinse the fi bronectin-coated inserts once in DPBS, and then place the inserts in the wells of the 24-well plate containing 0.5 ml of DMEM/0.5% BSA per well. Return plates/inserts to the incubator. Note: DMEM used here does not contain serum.
3. Culture H1299 cells expressing mutant p53 or vector-transfected control cells to 80% con fl uence. The cultures are then washed twice in DPBS, and cells detached from the tissue culture plate using Cellstripper ( Note : avoid enzymatic dissociation).
4. Wash the cells twice in DMEM/0.5% BSA by centrifugation, count the cells in a hemocytometer, and then resuspend in DMEM/0.5% BSA at a density of 1 × 10 6 cells/ml. Add 5 × 10 4 cells to the upper chamber of the Transwell insert (use triplicates at a minimum), return to the incubator and allow the cells to migrate for 6 h.
5. Fix the cells using 0.025% glutaraldehyde in DPBS for 5 min at ambient temperature.
6. Stain in Gill’s hematoxylin for 20 min at ambient temp, and then destain thoroughly in tap water, until no more stain is seen in the rinse.
3.3. Haptotactic Migration Assay
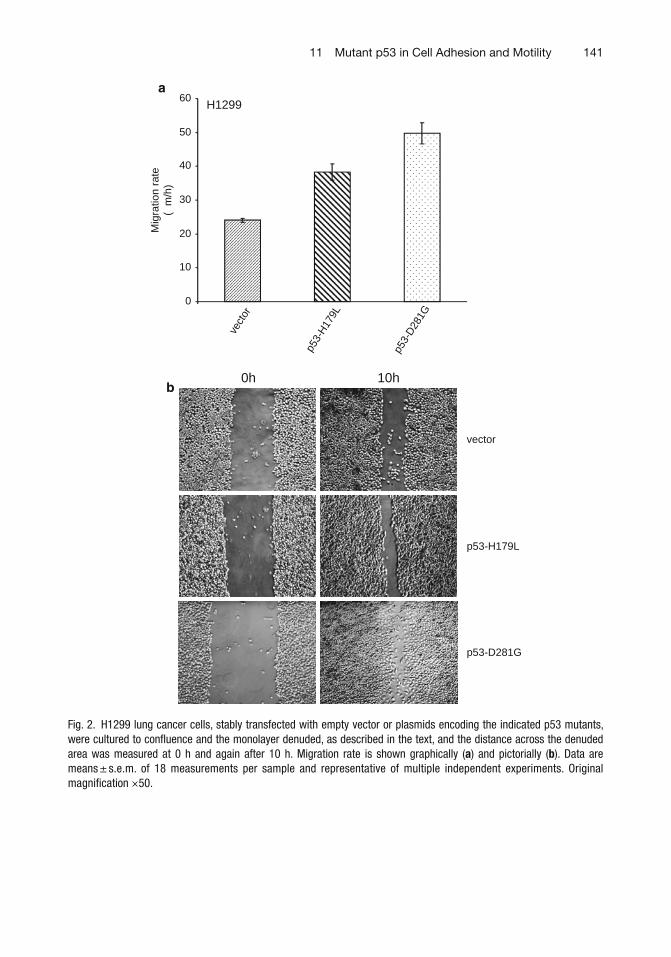
14111 Mutant p53 in Cell Adhesion and Motility
0
10
20
30
40
50
60H1299
a
b
vect
or
p53-
H17
9L
p53-
D28
1G
Mig
ratio
n ra
te(µ
m/h
)
vector
10h0h
p53-D281G
p53-H179L
Fig. 2. H1299 lung cancer cells, stably transfected with empty vector or plasmids encoding the indicated p53 mutants, were cultured to con fl uence and the monolayer denuded, as described in the text, and the distance across the denuded area was measured at 0 h and again after 10 h. Migration rate is shown graphically ( a ) and pictorially ( b ). Data are means ± s.e.m. of 18 measurements per sample and representative of multiple independent experiments. Original magni fi cation ×50.
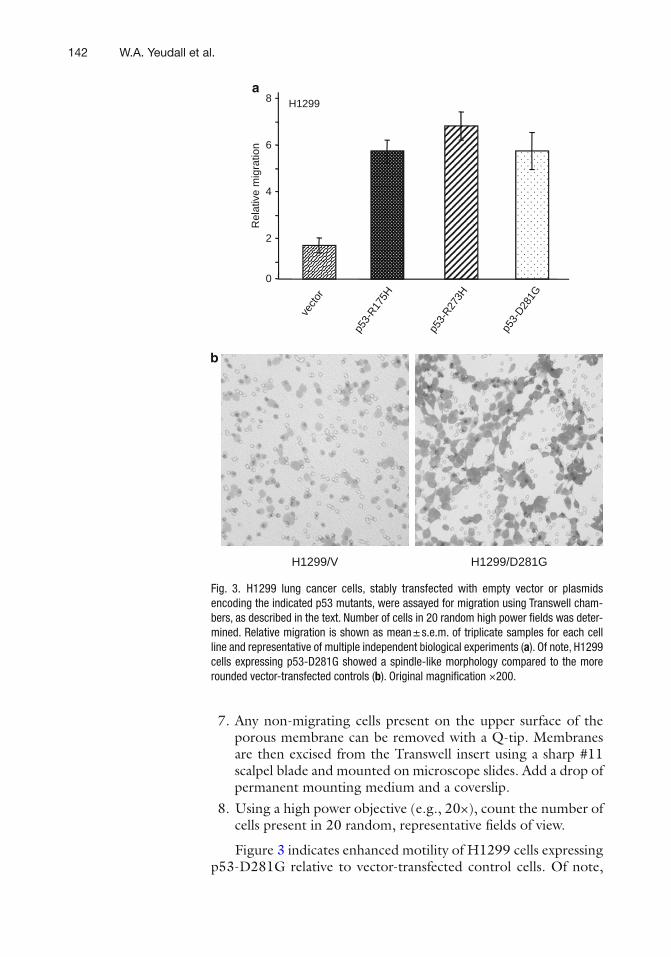
142 W.A. Yeudall et al.
7. Any non-migrating cells present on the upper surface of the porous membrane can be removed with a Q-tip. Membranes are then excised from the Transwell insert using a sharp #11 scalpel blade and mounted on microscope slides. Add a drop of permanent mounting medium and a coverslip.
8. Using a high power objective (e.g., 20×), count the number of cells present in 20 random, representative fi elds of view.
Figure 3 indicates enhanced motility of H1299 cells expressing p53-D281G relative to vector-transfected control cells. Of note,
0
vect
or
p53-
R175H
p53-
R273H
p53-
D281G
2
4
6
8
Rel
ativ
e m
igra
tion
H1299a
b
H1299/V H1299/D281G
Fig. 3. H1299 lung cancer cells, stably transfected with empty vector or plasmids encoding the indicated p53 mutants, were assayed for migration using Transwell cham-bers, as described in the text. Number of cells in 20 random high power fi elds was deter-mined. Relative migration is shown as mean ± s.e.m. of triplicate samples for each cell line and representative of multiple independent biological experiments ( a ). Of note, H1299 cells expressing p53-D281G showed a spindle-like morphology compared to the more rounded vector-transfected controls ( b ). Original magni fi cation ×200.

14311 Mutant p53 in Cell Adhesion and Motility
the mutant p53-expressing cells show altered morphology on fi bronectin, with a more stellate appearance compared to control cells.
The ability to grow in suspension culture (anchorage-independent growth) is a characteristic of more aggressive tumor cells. Thus, it is an additional parameter that we can use to determine the contri-bution of GOF mutant p53 proteins to tumor progression.
1. Prepare a 1% solution of LMP agarose in tissue culture grade water, autoclave it, and then store in a water bath at 42°C to prevent solidi fi cation.
2. Mix equal volumes of 1% agarose and 2× complete growth medium to form a solid underlayer. Add 1.5 ml of agarose/DMEM solution to each 35 mm tissue culture dish (or to each well of a 6-well plate) and allow to solidify for 1 h at ambient temperature. This gives a fi nal underlayer concentration of 0.5% agarose in 1× complete growth medium.
3. While the agarose underlayer is solidifying, trypsinize and count the tumor cells. Wash the cells by centrifugation and then resuspend them at a density of 7.2 × 10 4 cells per 1.2 ml of complete growth medium.
4. Add 1.2 ml of 2× complete growth medium and 1.2 ml of 1% agarose to the cell suspension, and mix quickly by pipetting.
5. Add 1 ml of the cell suspension per 35 mm dish or well of a 6-well plate. This gives 2 × 10 4 cells/well in a suspension of 0.33% agarose and 1× complete growth medium. Set up three plates/wells per cell line, and allow the cell suspension to gel at ambient temperature for 30 min.
6. Incubate cultures at 37°C under standard conditions for 2 weeks. Add 100 μ l of complete growth medium (containing serum) to each plate/well every 2 days. Inclusion of a positive control consisting of a cell line known to form colonies in suspension allows monitoring of growth.
7. After 2 weeks, photograph and measure the colonies under a light microscope, and then fi x and stain colonies for 2 h at ambient temperature in a solution of 0.15% (v/v) methylene blue prepared in 10% EtOH. Destain by gentle washing under running tap water for 4 h. Photograph under a low power (e.g., 5×) objective lens, and quantify by counting the number of colonies in 20 random fi elds of vision.
As can be seen in Fig. 4 , NIH3T3 fi broblasts stably transfected with p53-H179L form large colonies in soft agar (even larger than those formed by the positive control WT2 chondrogenic tumor cell line), whereas vector-transfected NIH3T3 cells and HN4 (negative control) do not grow under these conditions.
3.4. Growth in Soft Agar
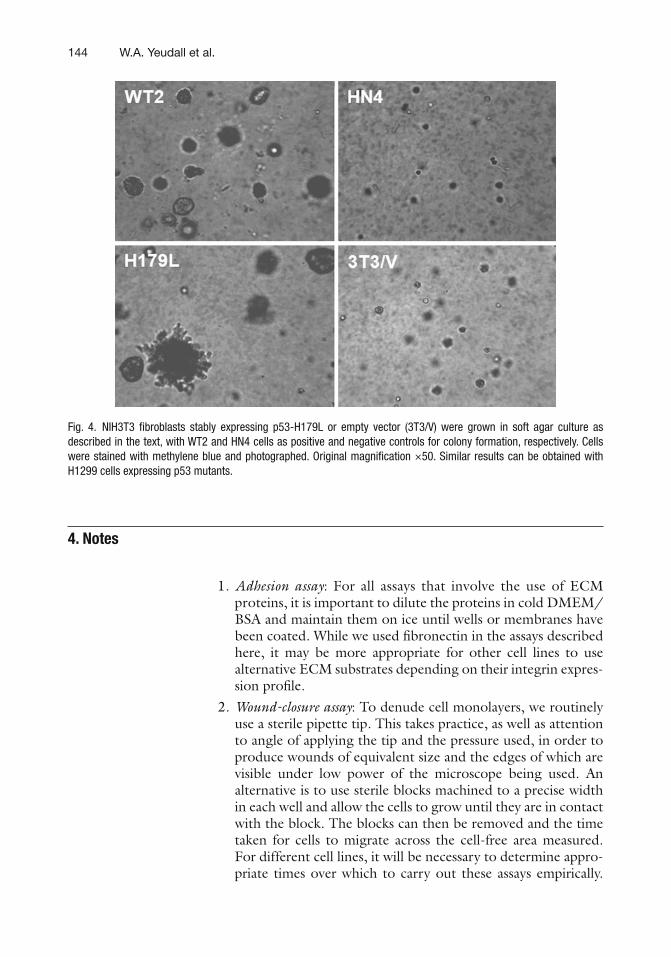
144 W.A. Yeudall et al.
1. Adhesion assay : For all assays that involve the use of ECM proteins, it is important to dilute the proteins in cold DMEM/BSA and maintain them on ice until wells or membranes have been coated. While we used fi bronectin in the assays described here, it may be more appropriate for other cell lines to use alternative ECM substrates depending on their integrin expres-sion pro fi le.
2. Wound-closure assay : To denude cell monolayers, we routinely use a sterile pipette tip. This takes practice, as well as attention to angle of applying the tip and the pressure used, in order to produce wounds of equivalent size and the edges of which are visible under low power of the microscope being used. An alternative is to use sterile blocks machined to a precise width in each well and allow the cells to grow until they are in contact with the block. The blocks can then be removed and the time taken for cells to migrate across the cell-free area measured. For different cell lines, it will be necessary to determine appro-priate times over which to carry out these assays empirically.
4. Notes
Fig. 4. NIH3T3 fi broblasts stably expressing p53-H179L or empty vector (3T3/V) were grown in soft agar culture as described in the text, with WT2 and HN4 cells as positive and negative controls for colony formation, respectively. Cells were stained with methylene blue and photographed. Original magni fi cation ×50. Similar results can be obtained with H1299 cells expressing p53 mutants.
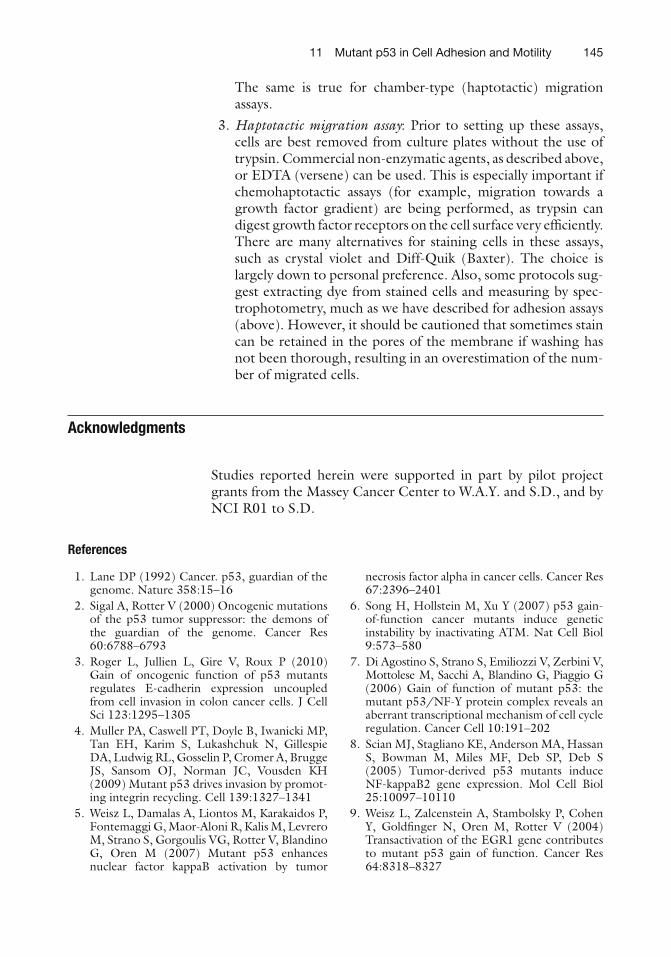
14511 Mutant p53 in Cell Adhesion and Motility
The same is true for chamber-type (haptotactic) migration assays.
3. Haptotactic migration assay : Prior to setting up these assays, cells are best removed from culture plates without the use of trypsin. Commercial non-enzymatic agents, as described above, or EDTA (versene) can be used. This is especially important if chemohaptotactic assays (for example, migration towards a growth factor gradient) are being performed, as trypsin can digest growth factor receptors on the cell surface very ef fi ciently. There are many alternatives for staining cells in these assays, such as crystal violet and Diff-Quik (Baxter). The choice is largely down to personal preference. Also, some protocols sug-gest extracting dye from stained cells and measuring by spec-trophotometry, much as we have described for adhesion assays (above). However, it should be cautioned that sometimes stain can be retained in the pores of the membrane if washing has not been thorough, resulting in an overestimation of the num-ber of migrated cells.
Acknowledgments
Studies reported herein were supported in part by pilot project grants from the Massey Cancer Center to W.A.Y. and S.D., and by NCI R01 to S.D.
References
1. Lane DP (1992) Cancer. p53, guardian of the genome. Nature 358:15–16
2. Sigal A, Rotter V (2000) Oncogenic mutations of the p53 tumor suppressor: the demons of the guardian of the genome. Cancer Res 60:6788–6793
3. Roger L, Jullien L, Gire V, Roux P (2010) Gain of oncogenic function of p53 mutants regulates E-cadherin expression uncoupled from cell invasion in colon cancer cells. J Cell Sci 123:1295–1305
4. Muller PA, Caswell PT, Doyle B, Iwanicki MP, Tan EH, Karim S, Lukashchuk N, Gillespie DA, Ludwig RL, Gosselin P, Cromer A, Brugge JS, Sansom OJ, Norman JC, Vousden KH (2009) Mutant p53 drives invasion by promot-ing integrin recycling. Cell 139:1327–1341
5. Weisz L, Damalas A, Liontos M, Karakaidos P, Fontemaggi G, Maor-Aloni R, Kalis M, Levrero M, Strano S, Gorgoulis VG, Rotter V, Blandino G, Oren M (2007) Mutant p53 enhances nuclear factor kappaB activation by tumor
necrosis factor alpha in cancer cells. Cancer Res 67:2396–2401
6. Song H, Hollstein M, Xu Y (2007) p53 gain-of-function cancer mutants induce genetic instability by inactivating ATM. Nat Cell Biol 9:573–580
7. Di Agostino S, Strano S, Emiliozzi V, Zerbini V, Mottolese M, Sacchi A, Blandino G, Piaggio G (2006) Gain of function of mutant p53: the mutant p53/NF-Y protein complex reveals an aberrant transcriptional mechanism of cell cycle regulation. Cancer Cell 10:191–202
8. Scian MJ, Stagliano KE, Anderson MA, Hassan S, Bowman M, Miles MF, Deb SP, Deb S (2005) Tumor-derived p53 mutants induce NF-kappaB2 gene expression. Mol Cell Biol 25:10097–10110
9. Weisz L, Zalcenstein A, Stambolsky P, Cohen Y, Gold fi nger N, Oren M, Rotter V (2004) Transactivation of the EGR1 gene contributes to mutant p53 gain of function. Cancer Res 64:8318–8327

146 W.A. Yeudall et al.
10. Scian MJ, Stagliano KE, Ellis MA, Hassan S, Bowman M, Miles MF, Deb SP, Deb S (2004) Modulation of gene expression by tumor-derived p53 mutants. Cancer Res 64:7447–7454
11. Scian MJ, Stagliano KE, Deb D, Ellis MA, Carchman EH, Das A, Valerie K, Deb SP, Deb S (2004) Tumor-derived p53 mutants induce oncogenesis by transactivating growth-promoting genes. Oncogene 23:4430–4443
12. Olive KP, Tuveson DA, Ruhe ZC, Yin B, Willis NA, Bronson RT, Crowley D, Jacks T (2004) Mutant p53 gain of function in two mouse
models of Li-Fraumeni syndrome. Cell 119:847–860
13. Cardinali M, Kratochvil FJ, Ensley JF, Robbins KC, Yeudall WA (1997) Functional character-ization in vivo of mutant p53 molecules derived from squamous cell carcinomas of the head and neck. Mol Carcinog 18:78–88
14. Goldstein I, Marcel V, Olivier M, Oren M, Rotter V, Hainaut P (2011) Understanding wild-type and mutant p53 activities in human cancer: new landmarks on the way to targeted therapies. Cancer Gene Ther 18:2–11
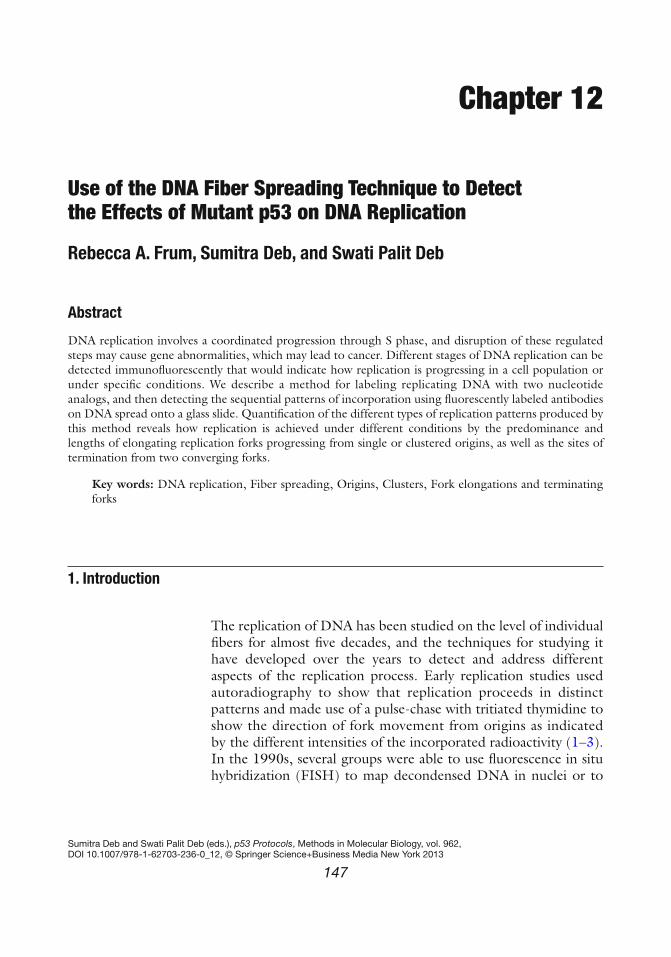
147
Chapter 12
Use of the DNA Fiber Spreading Technique to Detect the Effects of Mutant p53 on DNA Replication
Rebecca A. Frum , Sumitra Deb , and Swati Palit Deb
Abstract
DNA replication involves a coordinated progression through S phase, and disruption of these regulated steps may cause gene abnormalities, which may lead to cancer. Different stages of DNA replication can be detected immuno fl uorescently that would indicate how replication is progressing in a cell population or under speci fi c conditions. We describe a method for labeling replicating DNA with two nucleotide analogs, and then detecting the sequential patterns of incorporation using fl uorescently labeled antibodies on DNA spread onto a glass slide. Quanti fi cation of the different types of replication patterns produced by this method reveals how replication is achieved under different conditions by the predominance and lengths of elongating replication forks progressing from single or clustered origins, as well as the sites of termination from two converging forks.
Key words: DNA replication , Fiber spreading , Origins , Clusters , Fork elongations and terminating forks
The replication of DNA has been studied on the level of individual fi bers for almost fi ve decades, and the techniques for studying it have developed over the years to detect and address different aspects of the replication process. Early replication studies used autoradiography to show that replication proceeds in distinct patterns and made use of a pulse-chase with tritiated thymidine to show the direction of fork movement from origins as indicated by the different intensities of the incorporated radioactivity ( 1– 3 ) . In the 1990s, several groups were able to use fl uorescence in situ hybridization (FISH) to map decondensed DNA in nuclei or to
1. Introduction
Sumitra Deb and Swati Palit Deb (eds.), p53 Protocols, Methods in Molecular Biology, vol. 962,DOI 10.1007/978-1-62703-236-0_12, © Springer Science+Business Media New York 2013
148 R.A. Frum et al.
detect single fi bers of DNA extended onto slides ( 4– 7 ) . Other groups have subsequently combined the incorporation of single ( 8 ) or double ( 9 ) nucleotide analogs such as iododeoxyuridine (IdU) and chlorodeoxyuridine (CldU) and their detection by fl uorescently labeled antibodies to show different patterns of repli-cation by color instead of radioactivity intensity. The double label-ing method has been used for analyzing replication dynamics in subsequent studies ( 10– 12 ) .
The use of more than one marker such as different intensities of incorporation of radioactivity, or the use of more than one nucleotide analog sequentially incorporated into replicating DNA, enables the detection of different types of replication events occur-ring in the cell based on the directionality of fork movement. In the method we describe here, asynchronous cells are fi rst pulsed with IdU for 10 min, which is then washed out and is followed by a pulse with CldU for 20 min. The IdU and CldU are incorporated into replicating DNA sequentially in the direction of fork move-ment. The cells are then collected, and a de fi ned small number of cells is streaked across the top of a silane-coated slide and is then lysed. The slides are then tilted to a 45° angle, and as the droplet of lysis buffer is pulled down the slide by gravity, one end of the DNA sticks to the slide and the fi ber is straightened by the force of the movement of the buffer down the slide. The slides are then air-dried and fi xed, and the incorporated IdU and CldU are detected with fl uorescent-coupled antibodies that identify IdU in red and CldU in green to reveal the direction of fork movement.
There are four readily distinguishable patterns of red and green that can be produced by this labeling strategy that indicate sites where replication is initiating at single or clustered origins bidirec-tionally, elongating or extending at forks, or where replication is merging between two adjacent replicons (terminations). As shown in Fig. 1a , a single red track at the center of two green tracks indi-cates a single bidirectional origin, with the origin of replication initiating during the fi rst pulse with IdU (detected in red) and extending in both directions from the point of initiation as deter-mined by the subsequent bidirectional incorporation with CldU (detected in green). Clusters of replicons are de fi ned by the merg-ing of two or more red and two or more green tracks that indicate two or more adjacent replicons that complete replication within the de fi ned total pulse time (in this case, 30 min). If a red track within a cluster is surrounded by a green track on both sides, this center red track likely contains an origin. Elongating forks are represented by red and green tracks, while a red track fl anked by a green track indicates fork movement from a different replicon towards the other origin in the cluster. Merging of two forks from two adjacent replicons indicates the site of termination by the pattern of a green track at the center of two red tracks, where replication forks are extending in the direction from red to green, since

14912 Use of the DNA Fiber Spreading Technique to Detect the Effects of Mutant p53…
IdU (red) was incorporated fi rst followed by CldU (green). Single tracks of red or green can also be detected in this type of analysis as well, with a red track likely indicating a site where replication ter-minated or stalled before the nucleotide from the second pulse could be incorporated, while a single green track is likely indicative of a site where replication initiated after the fi rst pulse with IdU had already been washed out. Asynchronous or synchronized cells at different hours of S phase could be used to study replication ( 11 ) . Also, different pulse times with nucleotide analogs can be employed to reveal how replication extends from newly fi red ori-gins ( 12 ) . In addition to these studies, analyses of replication on individual DNA fi bers have been used to show the rate of fork elongation ( 11, 13 ) , origin interference ( 14 ) , the use of latent ori-gins caused by a slower rate of replication ( 15 ) , and differences in replication between normal and cancer cells ( 11, 12, 16 ) .
Here, we describe a method for fl uorescently detecting the different patterns of replication using DNA from H1299 cells either expressing mutant p53 or stably transfected with vector. The method involves the incorporation of IdU and CldU into replicating DNA, the creation of DNA fi ber spreads by extending DNA linearly onto glass slides, and the immuno fl uorescent detec-tion of the incorporated nucleotide analogs by confocal micros-copy. We also describe strategies for quantifying and analyzing the replication patterns after images are obtained and discuss the different types of information that can be obtained from this type of analysis.
0
5
10
15
20
Per
cen
t of
Ori
gin
cl
ust
ers
HC5 H273H
IdU CldUa
bOrigin (O)
Elongation (E)
Termination (T)
Origin clusters (OC)
Fig. 1. The different types of replication patterns produced by the fl uorescent detection of the sequential incorporation of IdU followed by CldU into replicating DNA are shown in ( a ). Since cells are labeled fi rst with IdU (detected in red ) followed by CldU (detected in green ), the direction of fork movement can be determined in merged red-green tracks to reveal bidirectional replication from origins, elongating forks, as well as merged tracks of two or more adjacent replicons ( clusters ) and sites where two converging unidirectional forks from adjacent replicons merge ( terminations ). The bar graph in ( b ) shows higher percentage of origin clusters in H1299 cells expressing a tumor-derived mutant of p53 (273H).
150 R.A. Frum et al.
1. Iododeoxyuridine (IdU, 100 mM). 2. Chlorodeoxyuridine (CldU, 100 mM).
1. Hanks balanced salt solution (HBSS), phosphate-buffered saline (PBS), or Dulbecco’s phosphate-buffered saline (DPBS).
2. DNA lysis buffer: 0.5% SDS, 200 mM Tris–HCl pH 7.4, 50 mM EDTA.
3. Methanol/Acetic acid (3:1). 4. 2.5 N HCl. 5. PBS/0.1% Tween 20. 6. 2% BSA. Make fresh. Dilute in PBS. 7. Rat anti-Bromodeoxyuridine. 8. Mouse anti-Bromodeoxyuridine. 9. Stringency buffer: 10 mM Tris–HCl pH 7.4, 400 mM NaCl,
0.2% Nonidet P40 (NP40). 10. Alexa fl uor 488-conjugated chicken anti-rat (Molecular Probes)
(1:250). 11. Alexa fl uor 594-conjugated rabbit anti-mouse (Molecular
Probes) (1:333). 12. 2% Normal goat serum (NGS). Make fresh. Dilute in PBS. 13. Alexa fl uor 488-conjugated goat anti-chicken (Molecular
Probes) (1:250). 14. Alexa fl uor 594-conjugated goat anti-rabbit (Molecular Probes)
(1:333). 15. Antifade without DAPI (Invitrogen).
1. Silane-coated slides (Sigma). 2. Coplin jars. 3. Plastic strips cut into the size of the glass slide surface. 4. Nail polish. 5. Confocal microscope. 6. Image J: This software can be downloaded from the NIH Web
site.
1. Aphidicolin. 2. Caffeine (50 mM).
2. Materials
2.1. Nucleotide Analogs (Sigma)
2.2. Reagents
2.3. DNA Fiber Spreading
2.4. Optional Reagents for Synchronization or S Phase Checkpoint Analysis
15112 Use of the DNA Fiber Spreading Technique to Detect the Effects of Mutant p53…
1. Add 2 μ l of 100 mM IdU to 4 ml of media in the plate. Incubate for 10 min.
2. Wash off IdU two times with HBSS. Work quickly since cells are still actively replicating to ensure continuity of labeled tracks.
3. Add 4 μ l of 100 mM CldU to 4 ml of media in the plate. Incubate for 20 min.
4. Wash two times with HBSS and trypsinized cells. Collect into a tube.
5. Spin cells at 500 × g for 6 min. 6. Wash with 4 ml of DPBS. 7. Repeat steps 5 and 6 once. 8. Count the number of cells present in the sample. Add DPBS to
the sample so that the cells are suspended at 200–300 cells per μ l.
1. Label slides in pencil. Make enough slide duplicates so that enough fi bers will be obtained for analysis, which is usually three to ten depending on the experiment.
2. Vortex cells. Immediately streak 2 μ l of the cell suspension across the glass near the top of the slide.
3. Allow most of the liquid to evaporate but do not let the streak dry.
4. Add 9 μ l of DNA lysis buffer across the initial streak of cells. Allow cells to lyse for 10 min.
5. Tilt the slide to an approximately 45° angle to allow the buffer to run down the slide. Add 2 μ l of extra buffer to the droplet if it starts to dry out.
6. Leave slides at the same tilted angle and allow to air-dry for 2 h.
7. Fix in 3:1 methanol/acetic acid. Dip in slide fi xing chamber for 2 min. Place slides on an absorbent surface and allow them to dry overnight in a fume hood.
8. The next day, place the cells in a freezer at −20°C for at least 24 h.
1. Remove slides from freezer and allow them to return to room temperature.
2. Fill Coplin jar(s) with 50 ml of 2.5 N HCl to cover the slides. Place slides into the jar and mix up and down a few times. Incubate for 30 min.
3. Methods
3.1. Labeling of Replicating DNA
3.2. Creating Spreads of DNA Fibers
3.3. Immunostaining
152 R.A. Frum et al.
3. Using additional Coplin jars, wash once in PBS/0.1% Tween 20, followed by two washes in PBS for 3 min each.
4. Fill unused pipette tip boxes with hot water almost to the top to create a humid chamber. Remove the slides from the last wash and dry the back of the slide with a paper towel. Place onto dry surface of the tip box fi lled with hot water. Add 2 ml of 2% BSA onto the glass surface of the slide to block nonspeci fi c binding of the antibodies. Spread 2% BSA solution evenly over the surface of the slide by creating surface tension between the solution on the slide and the wide opening of a 1 ml pipette tip. Incubate 2 h.
5. Discard the blocking solution on the slides into a beaker. Dry the back of the slide and add 100 μ l of the primary antibody solution (1:250 rat anti-bromodeoxyuridine (detects CldU) plus 1:250 mouse anti-bromodeoxyuridine (detects IdU) in 0.2% BSA in PBS). Tilt the slide to make sure the antibody solution covers the entire glass surface and cover with a piece of plastic. Place onto dried surface of humid chamber and incubate for 1 h.
6. Wash slides for 10 min in stringency buffer in Coplin jar. 7. Wash slides two times in PBS in Coplin jar. 8. Dry the back surface of the slides and add 100 μ l of the
secondary antibody solution to the slide (1:250 Alexa fl uor 488-conjugated chicken anti-rat plus 1:333 Alexa fl uor 594-conjugated chicken anti-rat in 0.2% BSA in PBS). Tilt the slide to make sure the antibody solution covers the entire glass sur-face and cover with a piece of plastic. Place onto dried surface of humid chamber and incubate for 30 min in the dark.
9. Wash slides once in PBS/0.1% Tween 20, and then twice in PBS for 3 min each in a Coplin jar.
10. Dry the back surface of the slide and replace slide onto dried surface of the humid chamber. Add 1–2 ml of 2% NGS and spread the solution evenly over the slide as in step 3. Incubate for 15 min.
11. Discard the NGS blocking solution into a beaker and dry the back surface of the slide. Add 100 μ l of the third antibody solution to the slide (1:250 Alexa fl uor 388-conjugated goat anti-chicken plus 1:333 Alexa fl uor 594-conjugated goat anti-rabbit in 0.2% NGS in PBS). Tilt the slide to make sure the antibody solution covers the entire glass surface and cover with a piece of plastic. Place onto dried surface of humid chamber and incubate for 30 min in the dark.
12. Wash slides once in PBS/0.1% BSA, then twice in PBS for 3 min each in Coplin jar.
13. Mount coverslips onto slides using antifade mounting solution. Seal coverslips onto slide with nail polish if necessary.
15312 Use of the DNA Fiber Spreading Technique to Detect the Effects of Mutant p53…
14. Collect images using a confocal microscope. Analyze images using Image J software program.
1. Normal cells can be synchronized by con fl uence arrest. Change the media as required by the cell line.
2. Replate cells at 374,000 cells on a 60 mm plate the day before labeling. Optionally, aphidicolin can be added to the plate for 24 h at a fi nal concentration of 2 μ g/ml for synchroniza-tion of cells.
3. To knockdown the intra-S phase checkpoint, treat cells with 2 mM caffeine for 30 min prior to labeling. During labeling with IdU and CldU, keep the same concentration of caffeine in the media to ensure that the checkpoint remains inactivated.
1. IdU and CldU are light sensitive, so it is recommended that labeling is performed without the light on in the hood.
2. Plating 374,000 cells per 60 mm plate is recommended to ensure proper availability of nucleotide analogs during pulse labeling.
3. Aphidicolin can be used to increase the number of cells syn-chronously entering S phase after 24 h; however, this may result in checkpoint activation. Con fl uence arrest alone gener-ally creates a suf fi cient population of cells entering S phase synchronously. It generally takes about 13–14 h for con fl uence-arrested cells to reach early S phase following replating and approximately 8–10 h for cells to progress through S phase.
4. To save time during labeling, mixtures of IdU/media or CldU/media can be made in advance on the day of labeling and added directly to plates to save time with multiple additions.
5. While creating DNA fi ber spreads, keeping the cell sample at room temperature just before streaking the cells onto the slide creates an even spread of cells and prevents the cell sample from forming droplets when streaked across the slide.
6. After streaking the cell sample on the slide, the streak appears rounded on the surface. Add the lysis buffer when the surface of the cell sample is fl at to the surface of the slide but before it is dry.
7. After tilting the slide to create the fi ber spreads, use a p20 pipette tip to create a small “point” on the edge of the droplet.
3.4. Optional Treatments
4. Notes

154 R.A. Frum et al.
This encourages the drop to proceed down the slide at a good rate (usually 5–10 min).
8. To save time, the antibody mixtures can be made up during the initial blocking step in BSA and stored in dark at 4°C.
9. Bubbles generated when placing the plastic strips over the slides during antibody addition steps can be removed by sliding the plastic a little off the slide and then returning it.
10. When mounting coverslips with antifade, bubbles can also be generated. To prevent bubbles, place the glass coverslip on the bench and place three drops of antifade (about 100 μ l total per slide) onto the coverslip. Dry the back surface of the slide and place it face down onto the antifade drops. Usually, keeping a hold of the slide while allowing it to just barely touch the surface of the drops at the same time creates an even spreading of the anti-fade with minimal bubbles. When bubbles are present, they can be removed by tapping one side of the bubble with tweezers.
11. When focusing the confocal microscope to fi nd the fi bers, they are on the same plane as the surface of the slide. Focusing on the surface of the slide fi rst (tiny dots of fl uorescence or any label on the slide) will enable the detection of the DNA fi bers.
12. Images can be analyzed using the Image J software program. To ensure that all fi bers in an image are scored, create an RGB image and after measuring the track length or counting the number of fi bers, erase the scored fi ber in the RGB image using the eraser tool. Since there are always fi bers present in the images that are unscorable (overlapping fi bers, overly stretched fi bers, undistinguishable labeled tracks), this helps ensure that all scorable fi bers are counted in the image.
13. Slides can usually be analyzed for up to a month after staining. 14. This type of analysis can give both quantitative (length of
fi bers) and qualitative (percent of type of replication patterns) present in the samples. If checking for both parameters, it is recommended that the length of the fi bers be measured and the number of these scored fi ber lengths be used to generate the percent of each replication pattern out of the total number of scored patterns. This ensures that the same fi bers are used for both analyses.
Acknowledgments
This study was initiated by pilot project funds from the VCU Massey Cancer Center (P30CA016059) and was supported by funds from NCI (CA121144) to Sumitra Deb. We thank Catherine Vaughan and Shilpa Singh for technical assistance and editing the manuscript.
15512 Use of the DNA Fiber Spreading Technique to Detect the Effects of Mutant p53…
References
1. Cairns J (1966) Autoradiography of HeLa cell DNA. J Mol Biol 15:372–373
2. Huberman J, Riggs AD (1966) Autoradiography of chromosomal DNA fi bers from Chinese hamster cells. Proc Natl Acad Sci USA 55:599–606
3. Huberman J, Riggs AD (1968) On the mecha-nism of DNA replication in mammalian chro-mosomes. J Mol Biol 32:327–341
4. Heng HHQ, Squire J, Tsui L-C (1992) High-resolution mapping of mammalian genes by in situ hybridization to free chromatin. Proc Natl Acad Sci USA 89:9509–9513
5. Wiegant J et al (1992) High-resolution in situ hybridization using DNA halo preparations. Hum Mol Genet 1:587–591
6. Lawrence JB, Carter KC, Gerdes MJ (1992) Extending the capabilities of interphase chro-matin mapping. Nat Genet 2:171–172
7. Parra I, Windle B (1993) High resolution visual mapping of stretched DNA by fl uorescent hybridization. Nat Genet 5:17–21
8. Jackson DA, Pombo A (1998) Replicon clusters are stable units of chromosome structure: evi-dence that nuclear organization contributes to the ef fi cient activation and propagation of S phase in human cells. J Cell Biol 140:1285–1295
9. Windle B, Parra I, Silvas E (1999) Analysis of structure and function by high resolution visual mapping of extended DNA. In: Andreeff M, Pinkel D (eds) Introduction to fl uorescence in
situ hybridization: principles and clinical appli-cations. Wiley-Liss, New York, pp 119–132
10. Merrick CJ, Jackson D, Dif fl ey JF (2004) Visualization of altered replication dynamics after DNA damage in human cells. J Biol Chem 279:20067–20075
11. Frum RA, Khondker ZS, Kaufman DG (2009) Temporal differences in DNA replication during the S phase using single fi ber analysis of normal human fi broblasts and glioblastoma T98G cells. Cell Cycle 8:3133–3148
12. Frum RA, Chastain PD II, Qu P et al (2008) DNA replication in early S phase pauses near newly activated origins. Cell Cycle 7:1440–1448
13. Daboussi R, Courbet S, Benhamou S et al (2008) A homologous recombination defect affects replication-fork progression in mamma-lian cells. J Cell Sci 121:162–166
14. Lebofsky R, Heilig R, Sonnleitner M et al (2006) DNA replication origin interference increases the spacing between initiation events in human cells. Mol Cell Biol 17:5337–5345
15. Courbet S, Gay S, Arnoult N et al (2008) Replication fork movement sets chromatin loop size and origin choice in mammalian cells. Nature 4555:557–560
16. Martin R, Oppenheim A (1977) Initiation points for DNA replication in nontransformed and simian virus 40-transformed Chinese hamster lung cells. Cell 11:859–869
157
Chapter 13
Generation of p53-De fi cient Induced Pluripotent Stem Cells from Mouse Embryo Fibroblasts
Evguenia M. Alexandrova and Ute M. Moll
Abstract
Here we describe a method for generating induced pluripotent stem (iPS) cells from mouse embryonic fi broblasts (MEFs). Recombinant retroviruses carrying human transcription factors for Klf4, Oct3/4, Sox2, with or without c-Myc, are used to transduce early passage MEFs several times. Based on morpho-logic criteria, the resulting iPS colonies are picked manually at fi rst, and then propagated and expanded by standard methods. iPS cells can then be differentiated into virtually any cell type or lineage, thus allowing for discoveries of new functions of p53 and mutant p53.
Key words: iPS , MEF , Retrovirus , Reprogramming
Induced pluripotent stem (iPS) cells are now widely used as a more accessible surrogate for embryonic stem (ES) cells. Similarly to ES cells, iPS cells can be differentiated in vitro and in vivo into virtu-ally any cell type ( 1 ) . Reprogramming somatic cells to pluripotency was fi rst successfully achieved by Yamanaka and colleagues in 2006, by means of retroviral transduction of mouse fi broblasts with four human transcription factors involved in pluripotency maintenance: Klf4, c-Myc, Oct3/4, and Sox2 ( 2 ) . Here we describe a method for reprogramming mouse embryonic fi broblasts (MEFs) into iPS cells with either four or three of Yamanaka’s factors ( 3 ) . The repro-gramming factors are cloned into the retroviral genome and pack-aged into retroviruses in Phoenix E cells ( 4 ) . The retroviral
1. Introduction
Sumitra Deb and Swati Palit Deb (eds.), p53 Protocols, Methods in Molecular Biology, vol. 962,DOI 10.1007/978-1-62703-236-0_13, © Springer Science+Business Media New York 2013

158 E.M. Alexandrova and U.M. Moll
supernatant is then used to transduce MEFs. In the course of a few weeks, ES-like colonies appear and are manually picked for further propagation by standard methods. If starting with p53−/− MEFs or MEFs that carry mutant p53, possibly in combination with another gene deletion/mutation, one can use the resulting iPS cells to analyze the role of p53 in: (1) differentiation into a certain cell type, (2) a cell signaling pathway involved, (3) in the speci fi cation to certain lineages, or (4) in the process of repro-gramming itself.
1. Accutase solution (Sigma). 2. Antibiotic–antimycotic, 100× (Gibco). 3. DPBS: Dulbecco’s phosphate-buffered saline, 1×. 4. ES medium: DMEM/F12+GlutaMAX-I (Gibco), 10% KSR
(knockout serum replacement, Gibco), 2 mM l -Glutamine (Gibco), 1× MEM nonessential amino acids (Gibco), 55 μ m 2-mercaptoethanol (Gibco), 1× penicillin–streptomycin, 1,000 U/ml ESGRO mLIF (Millipore).
5. ES medium/FBS: same as above, except that 10% FBS (Hyclone) is used instead of KSR.
6. Freezing medium: 50% FBS (Hyclone), 40% ES medium/FBS, 10% DMSO Hybri-MAX (Sigma).
7. Gelatin, 0.1% in ultrapure water (Millipore). 8. Lipofectamine reagent (Invitrogen). 9. MEFs: mouse embryonic fi broblasts obtained by standard
methods from day E12-14 embryos ( 5 ) . 10. MEF medium: 1× high glucose DMEM (Gibco), 10% heat-
inactivated fetal bovine serum, 1× penicillin–streptomycin. 11. Mouse feeders: mytomycin-treated or gamma-irradiated MEFs
(GlobalStem). 12. Phoenix E cells ( 4 ) . 13. pRebna-hKlf4, pRebna-hOct3/4, pRebna-hSox2 (optional:
pRebna-h-c-Myc and pRebna-GFP) plasmids ( 6 ) from midi- or maxi-prep (see Note 1). Alternatively, the same human genes in pMXs vector (Addgene).
14. Puromycin, 1 mg/ml (500×). 15. Trypsin–EDTA, 0.05% (Gibco).
2. Materials

15913 Generation of p53-Defi cient Induced Pluripotent Stem Cells…
1. Apply 4 ml gelatin to a 10 cm tissue culture dish, wait 20 min, remove gelatin, let dry 1–2 min, seed Phoenix E cells in MEF medium (see Note 2).
2. In a 10 cm dish, obtain actively growing Phoenix E cells at 60–80% con fl uency (see Note 3).
3. Transfect Phoenix E cells for 12 h or overnight with a mixture of four (5 μ g each) or three (6.7 μ g each) DNAs encoding Yamanaka’s factors in pRebna or pMXs vector, using Lipofectamine reagent according to the manufacturer’s directions (see Note 4). At the end of transfection, add 10 ml MEF medium.
4. 24 h after transfection, puromycin selection can be started if reprogramming factors were in puromycin-selectable pRebna vector. Select cells for 2–3 days (see Note 5).
5. After selection is completed, add MEF medium for at least 12 h. Collect the virus-containing supernatants every 12–24 h, fi lter through a 0.45 μ m fi lter to get rid of Phoenix E cells, and use immediately for steps in Subheading 3.2 or freeze in −80°C, since viral particles are unstable at RT or +4°C (see Note 6).
1. Treat the desired number of 6 cm plates with 2 ml gelatin as in step 1 of Subheading 3.1 . Add 2 ml fresh or just thawed retro-viral supernatant per plate and put the plates into 37°C incubator.
2. Trypsinize and spin down actively growing, early passage (passage 0–3, fresh or frozen) MEFs in two tubes, approxi-mately 0.1–0.5 million cells per tube for one reprogramming experiment (see Note 7). Remove the supernatant.
3. Add 1 ml fi ltered retroviral supernatant to one tube of cells, resuspend, and count cells. Add approximately 250,000 MEFs to the warm plate prepared in step 1 in Subheading 3.2 . If there are not enough cells in one tube, add the viral super-natant to the other tube, resuspend the cell pellet, and add the required number of cells to the same plate (see Notes 8 and 9).
4. Collect, fi lter, and add fresh retroviral supernatants to MEFs every 12–24 h for a total of three to fi ve times. If at the time of last transduction MEFs appear overgrown, split them 1:2 or 1:3 directly in the retroviral supernatant, as in steps 1–3 of Subheading 3.2 . For the rest of the experiment, the MEFs will not be split.
5. 24 h after the last transduction, change the medium to ES medium. Add fresh ES medium every other day and observe
3. Methods
3.1. Production of Retroviral Supernatants
3.2. Retroviral Transduction of MEFs
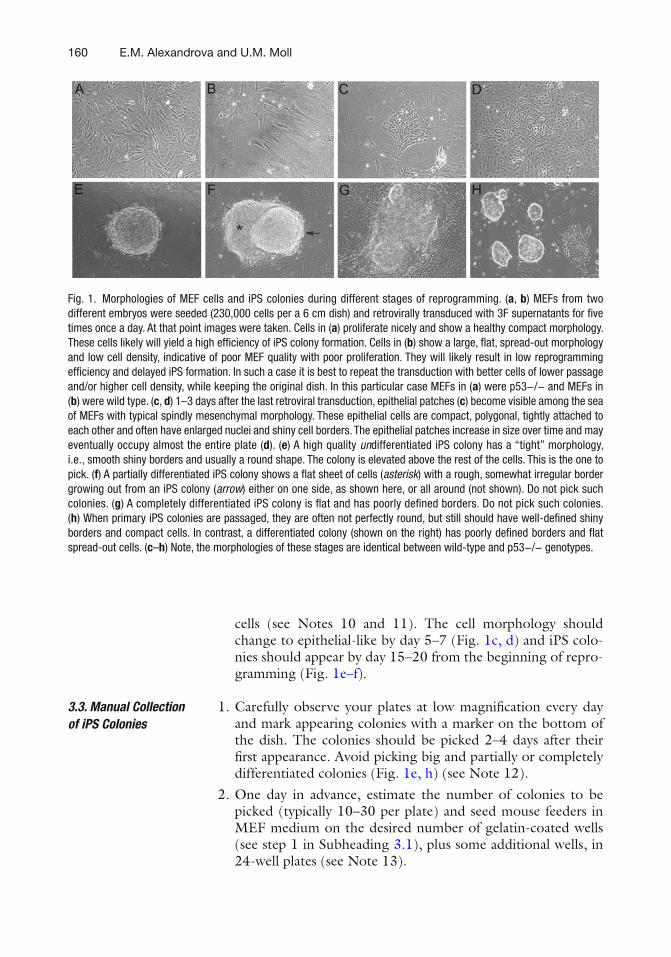
160 E.M. Alexandrova and U.M. Moll
cells (see Notes 10 and 11). The cell morphology should change to epithelial-like by day 5–7 (Fig. 1c, d ) and iPS colo-nies should appear by day 15–20 from the beginning of repro-gramming (Fig. 1e–f ).
1. Carefully observe your plates at low magni fi cation every day and mark appearing colonies with a marker on the bottom of the dish. The colonies should be picked 2–4 days after their fi rst appearance. Avoid picking big and partially or completely differentiated colonies (Fig. 1e, h ) (see Note 12).
2. One day in advance, estimate the number of colonies to be picked (typically 10–30 per plate) and seed mouse feeders in MEF medium on the desired number of gelatin-coated wells (see step 1 in Subheading 3.1 ), plus some additional wells, in 24-well plates (see Note 13).
3.3. Manual Collection of iPS Colonies
Fig. 1. Morphologies of MEF cells and iPS colonies during different stages of reprogramming. ( a , b ) MEFs from two different embryos were seeded (230,000 cells per a 6 cm dish) and retrovirally transduced with 3F supernatants for fi ve times once a day. At that point images were taken. Cells in ( a ) proliferate nicely and show a healthy compact morphology. These cells likely will yield a high ef fi ciency of iPS colony formation. Cells in ( b ) show a large, fl at, spread-out morphology and low cell density, indicative of poor MEF quality with poor proliferation. They will likely result in low reprogramming ef fi ciency and delayed iPS formation. In such a case it is best to repeat the transduction with better cells of lower passage and/or higher cell density, while keeping the original dish. In this particular case MEFs in ( a ) were p53−/− and MEFs in ( b ) were wild type. ( c , d ) 1–3 days after the last retroviral transduction, epithelial patches ( c ) become visible among the sea of MEFs with typical spindly mesenchymal morphology. These epithelial cells are compact, polygonal, tightly attached to each other and often have enlarged nuclei and shiny cell borders. The epithelial patches increase in size over time and may eventually occupy almost the entire plate ( d ). ( e ) A high quality un differentiated iPS colony has a “tight” morphology, i.e., smooth shiny borders and usually a round shape. The colony is elevated above the rest of the cells. This is the one to pick. ( f ) A partially differentiated iPS colony shows a fl at sheet of cells ( asterisk ) with a rough, somewhat irregular border growing out from an iPS colony ( arrow ) either on one side, as shown here, or all around (not shown). Do not pick such colonies. ( g ) A completely differentiated iPS colony is fl at and has poorly de fi ned borders. Do not pick such colonies. ( h ) When primary iPS colonies are passaged, they are often not perfectly round, but still should have well-de fi ned shiny borders and compact cells. In contrast, a differentiated colony (shown on the right) has poorly de fi ned borders and fl at spread-out cells. ( c – h ) Note, the morphologies of these stages are identical between wild-type and p53−/− genotypes.
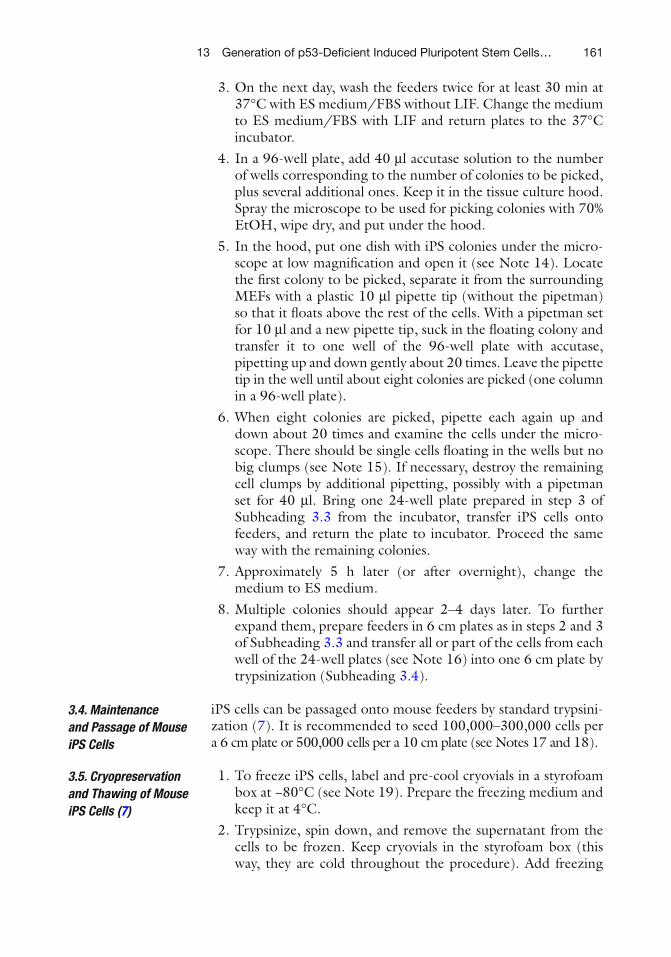
16113 Generation of p53-Defi cient Induced Pluripotent Stem Cells…
3. On the next day, wash the feeders twice for at least 30 min at 37°C with ES medium/FBS without LIF. Change the medium to ES medium/FBS with LIF and return plates to the 37°C incubator.
4. In a 96-well plate, add 40 μ l accutase solution to the number of wells corresponding to the number of colonies to be picked, plus several additional ones. Keep it in the tissue culture hood. Spray the microscope to be used for picking colonies with 70% EtOH, wipe dry, and put under the hood.
5. In the hood, put one dish with iPS colonies under the micro-scope at low magni fi cation and open it (see Note 14). Locate the fi rst colony to be picked, separate it from the surrounding MEFs with a plastic 10 μ l pipette tip (without the pipetman) so that it fl oats above the rest of the cells. With a pipetman set for 10 μ l and a new pipette tip, suck in the fl oating colony and transfer it to one well of the 96-well plate with accutase, pipetting up and down gently about 20 times. Leave the pipette tip in the well until about eight colonies are picked (one column in a 96-well plate).
6. When eight colonies are picked, pipette each again up and down about 20 times and examine the cells under the micro-scope. There should be single cells fl oating in the wells but no big clumps (see Note 15). If necessary, destroy the remaining cell clumps by additional pipetting, possibly with a pipetman set for 40 μ l. Bring one 24-well plate prepared in step 3 of Subheading 3.3 from the incubator, transfer iPS cells onto feeders, and return the plate to incubator. Proceed the same way with the remaining colonies.
7. Approximately 5 h later (or after overnight), change the medium to ES medium.
8. Multiple colonies should appear 2–4 days later. To further expand them, prepare feeders in 6 cm plates as in steps 2 and 3 of Subheading 3.3 and transfer all or part of the cells from each well of the 24-well plates (see Note 16) into one 6 cm plate by trypsinization (Subheading 3.4 ).
iPS cells can be passaged onto mouse feeders by standard trypsini-zation ( 7 ) . It is recommended to seed 100,000–300,000 cells per a 6 cm plate or 500,000 cells per a 10 cm plate (see Notes 17 and 18).
1. To freeze iPS cells, label and pre-cool cryovials in a styrofoam box at −80°C (see Note 19). Prepare the freezing medium and keep it at 4°C.
2. Trypsinize, spin down, and remove the supernatant from the cells to be frozen. Keep cryovials in the styrofoam box (this way, they are cold throughout the procedure). Add freezing
3.4. Maintenance and Passage of Mouse iPS Cells
3.5. Cryopreservation and Thawing of Mouse iPS Cells ( 7 )
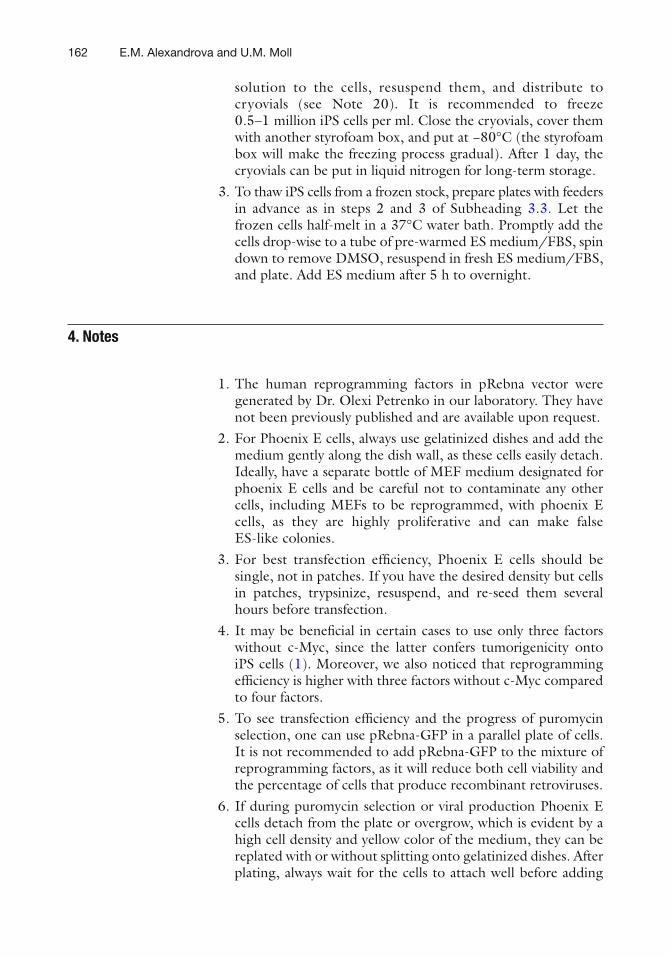
162 E.M. Alexandrova and U.M. Moll
solution to the cells, resuspend them, and distribute to cryovials (see Note 20). It is recommended to freeze 0.5–1 million iPS cells per ml. Close the cryovials, cover them with another styrofoam box, and put at −80°C (the styrofoam box will make the freezing process gradual). After 1 day, the cryovials can be put in liquid nitrogen for long-term storage.
3. To thaw iPS cells from a frozen stock, prepare plates with feeders in advance as in steps 2 and 3 of Subheading 3.3 . Let the frozen cells half-melt in a 37°C water bath. Promptly add the cells drop-wise to a tube of pre-warmed ES medium/FBS, spin down to remove DMSO, resuspend in fresh ES medium/FBS, and plate. Add ES medium after 5 h to overnight.
1. The human reprogramming factors in pRebna vector were generated by Dr. Olexi Petrenko in our laboratory. They have not been previously published and are available upon request.
2. For Phoenix E cells, always use gelatinized dishes and add the medium gently along the dish wall, as these cells easily detach. Ideally, have a separate bottle of MEF medium designated for phoenix E cells and be careful not to contaminate any other cells, including MEFs to be reprogrammed, with phoenix E cells, as they are highly proliferative and can make false ES-like colonies.
3. For best transfection ef fi ciency, Phoenix E cells should be single, not in patches. If you have the desired density but cells in patches, trypsinize, resuspend, and re-seed them several hours before transfection.
4. It may be bene fi cial in certain cases to use only three factors without c-Myc, since the latter confers tumorigenicity onto iPS cells ( 1 ) . Moreover, we also noticed that reprogramming ef fi ciency is higher with three factors without c-Myc compared to four factors.
5. To see transfection ef fi ciency and the progress of puromycin selection, one can use pRebna-GFP in a parallel plate of cells. It is not recommended to add pRebna-GFP to the mixture of reprogramming factors, as it will reduce both cell viability and the percentage of cells that produce recombinant retroviruses.
6. If during puromycin selection or viral production Phoenix E cells detach from the plate or overgrow, which is evident by a high cell density and yellow color of the medium, they can be replated with or without splitting onto gelatinized dishes. After plating, always wait for the cells to attach well before adding
4. Notes
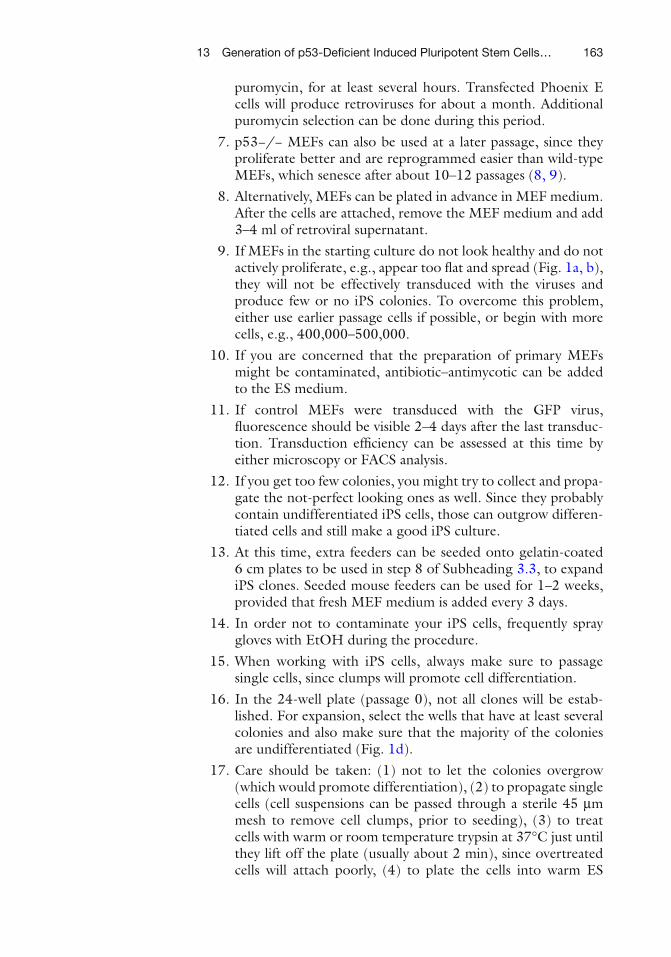
16313 Generation of p53-Defi cient Induced Pluripotent Stem Cells…
puromycin, for at least several hours. Transfected Phoenix E cells will produce retroviruses for about a month. Additional puromycin selection can be done during this period.
7. p53−/− MEFs can also be used at a later passage, since they proliferate better and are reprogrammed easier than wild-type MEFs, which senesce after about 10–12 passages ( 8, 9 ) .
8. Alternatively, MEFs can be plated in advance in MEF medium. After the cells are attached, remove the MEF medium and add 3–4 ml of retroviral supernatant.
9. If MEFs in the starting culture do not look healthy and do not actively proliferate, e.g., appear too fl at and spread (Fig. 1a, b ), they will not be effectively transduced with the viruses and produce few or no iPS colonies. To overcome this problem, either use earlier passage cells if possible, or begin with more cells, e.g., 400,000–500,000.
10. If you are concerned that the preparation of primary MEFs might be contaminated, antibiotic–antimycotic can be added to the ES medium.
11. If control MEFs were transduced with the GFP virus, fl uorescence should be visible 2–4 days after the last transduc-tion. Transduction ef fi ciency can be assessed at this time by either microscopy or FACS analysis.
12. If you get too few colonies, you might try to collect and propa-gate the not-perfect looking ones as well. Since they probably contain undifferentiated iPS cells, those can outgrow differen-tiated cells and still make a good iPS culture.
13. At this time, extra feeders can be seeded onto gelatin-coated 6 cm plates to be used in step 8 of Subheading 3.3 , to expand iPS clones. Seeded mouse feeders can be used for 1–2 weeks, provided that fresh MEF medium is added every 3 days.
14. In order not to contaminate your iPS cells, frequently spray gloves with EtOH during the procedure.
15. When working with iPS cells, always make sure to passage single cells, since clumps will promote cell differentiation.
16. In the 24-well plate (passage 0), not all clones will be estab-lished. For expansion, select the wells that have at least several colonies and also make sure that the majority of the colonies are undifferentiated (Fig. 1d ).
17. Care should be taken: (1) not to let the colonies overgrow (which would promote differentiation), (2) to propagate single cells (cell suspensions can be passed through a sterile 45 μ m mesh to remove cell clumps, prior to seeding), (3) to treat cells with warm or room temperature trypsin at 37°C just until they lift off the plate (usually about 2 min), since overtreated cells will attach poorly, (4) to plate the cells into warm ES
164 E.M. Alexandrova and U.M. Moll
medium/FBS (FBS will promote their attachment better than KSR), and (5) to change the medium to KSR-containing ES medium no later than after one night.
18. If, during early passages, too many iPS colonies appear differ-entiated, it is possible to repeat the manual selection of undif-ferentiated colonies as in Subheading 3.3 .
19. We typically use the styrofoam racks that come with the 15 ml conical tubes to put cryovials into and cover them with.
20. When freezing iPS cells, work promptly to reduce the amount of time the cells are in contact with DMSO, which is toxic for them.
Acknowledgments
We thank Dr. Olexi Petrenko for sharing his expertise and gener-ating pRebna constructs of reprogramming factors, Dr. Alice Nemajerova for technical advice and useful discussions, and Dr. Flaminia Talos for critical reading of this chapter.
References
1. Okita K et al (2007) Generation of germline-competent induced pluripotent stem cells. Nature 448:313–317
2. Takahashi K, Yamanaka S (2006) Induction of pluripotent stem cells from mouse embryonic and adult fi broblast cultures by de fi ned factors. Cell 126:663–676
3. Li H et al (2009) The Ink4/Arf locus is a barrier for iPS cell reprogramming. Nature 460:1136–1141
4. http://www.stanford.edu/group/nolan/retro-viral_systems/phx.html
5. h t t p s : // w w w. w i c e l l . o r g / i n d e x . p h p ?option=com_docman&task=doc_download&gid=687
6. Petrenko O et al (1999) The molecular charac-terization of the fetal stem cell marker AA4. Immunity 10:691–700
7. http://www.stemcell.com/~/media/Tech-nical%20Resources/2/29141MAN_1_1_1.ashx
8. Whibley C et al (2010) Wild-type and Hupki (human p53 knock-in) murine embryonic fi broblasts: p53/ARF pathway disruption in spontaneous escape from senescence. J Biol Chem 285:11326–11335
9. Hong H et al (2009) Suppression of induced pluripotent stem cell generation by the p53-p21 pathway. Nature 460:1132–1135
165
Chapter 14
p53 Actions on MicroRNA Expression and Maturation Pathway
Hiroshi I. Suzuki and Kohei Miyazono
Abstract
The tumor suppressor p53 orchestrates multiple cellular pathways as a central node of anti-oncogenic programs in response to DNA damage, oncogene activation, and several stresses. In addition to the principal role as a transcription factor that transactivates many target genes involved in apoptosis and cell cycle control, p53 has been shown to exert various transactivation-independent effects both in the nucleus and in the cytoplasm. Diversity of p53 activities is further emphasized by the recent studies revealing the close interaction between the p53 and microRNA (miRNA) world. We recently demonstrated that p53 promotes the processing of several primary miRNA transcripts through association with Drosha, a central RNase III in miRNA biogenesis, under DNA damage-inducing conditions. In contrast to wild-type p53, cancer-derived p53 mutants attenuate miRNA maturation. These fi ndings reveal a novel aspect of p53 activities and suggest complex crosstalks between miRNA biogenesis and intracellular signaling pathways. In this chapter, we describe the methods for evaluation of the effects of p53 on miRNA expression, an interaction between pri-miRNA and Drosha complex, and pri-miRNA processing activity of the Drosha complex.
Key words: microRNA , p53 , p68 , Drosha , Dicer , Processing
p53 tumor suppressor is at the center of a complex web composed of numerous signaling pathways triggered by a wide range of cellular stresses including DNA damage, oncogene activation, and hypoxia ( 1 ) . Loss of p53 function occurs in most human tumors by either mutation of the p53 gene itself, or by inactivation of the p53
1. Introduction
Potential con fl icts of interest: none.
Sumitra Deb and Swati Palit Deb (eds.), p53 Protocols, Methods in Molecular Biology, vol. 962,DOI 10.1007/978-1-62703-236-0_14, © Springer Science+Business Media New York 2013
166 H.I. Suzuki and K. Miyazono
signal transduction pathway ( 2 ) . p53 is well characterized as a sequence-speci fi c transcription factor that transactivates many target genes such as p21, 14-3-3 σ , GADD45, and PUMA upon activation by several stresses. The target genes of p53 are involved in various cellular pathways such as apoptosis, cell cycle arrest, and metabolism. In addition to the role as a transcriptional activator, p53 has been shown to exert several transcriptional-independent and/or cytoplasmic activities ( 3 ) . In the nucleus, p53 regulates DNA replication and homologous recombination apart from the transactivation-dependent effects. It has also been demonstrated that p53 promotes apoptosis through induction of mitochondrial outer membrane potential at the mitochondria and regulates autophagy at the cytoplasm. Furthermore, recent studies revealed a close relationship between the p53 pathway and microRNA (miRNA) network ( 4 ) .
miRNAs are emerging regulators of post-transcriptional gene regulation through RNA-induced gene silencing ( 5 ) . miRNAs are short 20–23-nucleotide single-stranded RNA molecules derived from miRNA genes and introns of various mRNAs. Mature miR-NAs form RNA-induced silencing complex (RISC) with Argonaute (Ago) proteins and guide RISC to target mRNAs through nucle-otide complementarity between miRNAs and target mRNAs, lead-ing to degradation, destabilization, or translational inhibition of target mRNAs. One miRNA species targets multiple target mRNAs and modulates diverse cellular functions, taking advantage of the fl exible target recognition based on partial complementarity. Intense researches have disclosed that miRNA expression alters in several cellular contexts and that various miRNAs are involved in diverse physiological and pathological processes ( 6 ) .
miRNAs originate from primary miRNA transcripts containing one or more stem-loop structures, which are mainly transcribed by RNA polymerase II from miRNA genes. These primary miRNAs are subjected to two-step RNase III-mediated cleavage to generate mature miRNAs. Drosha, an RNase III enzyme, cleaves out the stem-loop portion (precursor miRNA, pre-miRNA) from pri-miRNAs in the nucleus ( 7– 9 ) . The Drosha complex accompanies several cofactors such as DGCR8 (DiGeorge critical region 8), cer-tain heterogeneous nuclear ribonucleoproteins (hnRNPs), p68 (DDX5), and p72 (DDX17) DEAD-box helicases ( 7 ) . p68 and p72 are required for adequate processing of a subset of, but not all, miRNAs ( 10 ) . The resultant pre-miRNAs are exported to the cyto-plasm and further processed to double-stranded miRNA duplexes by Dicer, another central RNase III in miRNA biogenesis ( 11, 12 ) . One strand of miRNA duplex is fi nally loaded onto the RISC and executes RNA silencing. Recent advances disclosed that miRNA biogenesis is dynamically regulated at multiple steps of miRNA maturation ( 13 ) .
16714 p53 Actions on MicroRNA Expression and Maturation Pathway
p53 modulates the expression of various miRNAs through several mechanisms. As a transcriptional activator, p53 activates the transcription of the miR-34 family (miR-34a, miR-34b, and miR-34c) and elevates these miRNAs ( 14– 17 ) . miR-34s regulate targets involved in the cell cycle and apoptosis, such as cyclin- dependent kinase 4 (cdk4), cyclin E2, and Bcl-2. miR-192, miR-194, and miR-215 are additional miRNAs that are transcriptionally activated by p53 ( 18, 19 ) . p53 has been also shown to suppress miRNA expression including miR-17-92 cluster through transcrip-tional repression. Under hypoxia, the expression of miR-17-92 cluster is repressed through a competitive block of the recruitment of TATA-binding protein (TBP) to the miR-17-92 promoter by p53 binding to the promoter ( 20 ) .
We have recently demonstrated that p53 modulates the miRNA system in a more intimate manner ( 21 ) . In addition to miR-34 induction by p53, DNA damage induction resulted in upregula-tion of several miRNAs, including miR-143 and miR-16, in a p53-dependent fashion ( 21, 22 ) . This upregulation of mature miRNA expression was accompanied with the upregulation of pre-miRNAs, but not pri-miRNAs, suggesting the enhancement of pri-miRNA processing activity. In consistent with the previous report of an interaction between p53 and p68/p72 ( 23 ) , it was con fi rmed that p53 was associated with the Drosha complex through the interaction with p68/p72. RNA immunoprecipita-tion (RIP) analysis showed that p53 enhanced the association of Drosha and p68 with the target pri-miRNAs. In vitro pri-miRNA processing analysis further revealed that the pri-miRNA processing activity of Drosha for pri-miR-143/-16 increased in a p53-depen-dent manner under DNA damage-inducing conditions. In contrast to the enhancement of miRNA processing by wild-type p53, tran-scriptionally inactive tumor-derived p53 mutants have been shown to hinder the miRNA processing of certain miRNAs including miR-143 and miR-16. These fi ndings indicate that p53 modulates miRNA biogenesis through the interaction with the Drosha complex and suggest that transcription-independent regulation of miRNA biogenesis is embedded in an anti-oncogenic program governed by p53.
In addition, another line of evidence showed the close con-nection between the p53 network and miRNA system ( 4 ) . Several miRNAs such as miR-29 family, miR-125b, miR-122, and miR-372/373 have been shown to regulate the p53 activity and the p53 downstream pathway ( 4, 24– 27 ) . It was also reported that a loss of mature miRNAs results in increased DNA damage and p53 activity ( 28 ) , revealing a reciprocal connection between the p53 and miRNA pathways. Most recent study has identi fi ed Dicer and miR-130b as transcriptional targets of p63, a p53 family member, but not p53, underscoring the crosstalk between p53 family members

168 H.I. Suzuki and K. Miyazono
and miRNAome ( 29 ) . Further investigations would provide insights about miRNA involvement in the p53 network.
In this chapter, we detail the general methods for evaluation of the effects of p53 on miRNA expression and biogenesis; (1) miRNA expression analysis (qRT-PCR analysis and northern blot analysis); (2) RIP assay examining the interaction between pri-miRNA and target proteins; and (3) in vitro pri-miRNA processing analysis assessing the activity of Drosha complex.
1. Cells of interest. 2. Trizol (Invitrogen). 3. Chloroform, molecular biology grade. 4. Isopropyl alcohol, molecular biology grade. 5. Nuclease-free water. 6. Ethanol: 100%, 75%. 7. Glycogen (5 mg/ml, Applied Biosystems, Cat No. AM9510):
optional use. 8. mirVana miRNA isolation kit (Applied Biosystems, Cat. no.
AM1560 ). *Other equivalent kits for preparation of <200 nt small RNA
(e.g., miRNeasy Mini kit (Qiagen)) can be used.
1. RNA samples from Subheading 3.1.1 . 2. Applied Biosystems 7300/7500/7500 Fast Real-Time PCR
System.
1. Taqman microRNA Reverse Transcription kit (Applied Biosystems).
2. Taqman microRNA assays (for the target miRNA) (Applied Biosystems).
3. Taqman 2× Universal PCR Master Mix, No AmpErase UNG (Applied Biosystems).
*Other alternative kits for miRNA detection (e.g., miScript PCR System (Qiagen)) can be used.
1. Quantitect Reverse Transcription kit (Qiagen). 2. FastStart Universal SYBR Green Master (Roche). *Items 1–2: other equivalent kits can be used. 3. RT primers for ampli fi cation of pri-miRNA and pre-miRNA.
2. Materials
2.1. Isolation of RNA and miRNA Expression Analysis
2.1.1. RNA Preparation
2.1.2. miRNA RT-PCR Analysis
Analysis of Mature miRNA
Analysis of Pri-miRNA and Pre-miRNA
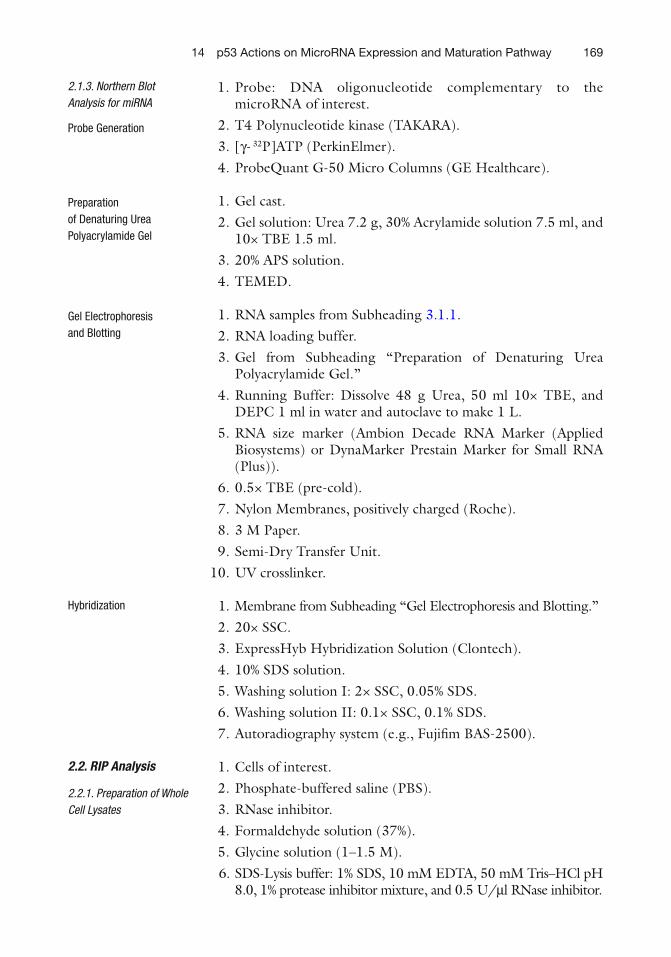
16914 p53 Actions on MicroRNA Expression and Maturation Pathway
1. Probe: DNA oligonucleotide complementary to the microRNA of interest.
2. T4 Polynucleotide kinase (TAKARA). 3. [γ- 32 P]ATP (PerkinElmer). 4. ProbeQuant G-50 Micro Columns (GE Healthcare).
1. Gel cast. 2. Gel solution: Urea 7.2 g, 30% Acrylamide solution 7.5 ml, and
10× TBE 1.5 ml. 3. 20% APS solution. 4. TEMED.
1. RNA samples from Subheading 3.1.1 . 2. RNA loading buffer. 3. Gel from Subheading “Preparation of Denaturing Urea
Polyacrylamide Gel.” 4. Running Buffer: Dissolve 48 g Urea, 50 ml 10× TBE, and
DEPC 1 ml in water and autoclave to make 1 L. 5. RNA size marker (Ambion Decade RNA Marker (Applied
Biosystems) or DynaMarker Prestain Marker for Small RNA (Plus)).
6. 0.5× TBE (pre-cold). 7. Nylon Membranes, positively charged (Roche). 8. 3 M Paper. 9. Semi-Dry Transfer Unit. 10. UV crosslinker.
1. Membrane from Subheading “Gel Electrophoresis and Blotting.” 2. 20× SSC. 3. ExpressHyb Hybridization Solution (Clontech). 4. 10% SDS solution. 5. Washing solution I: 2× SSC, 0.05% SDS. 6. Washing solution II: 0.1× SSC, 0.1% SDS. 7. Autoradiography system (e.g., Fuji fi m BAS-2500).
1. Cells of interest. 2. Phosphate-buffered saline (PBS). 3. RNase inhibitor. 4. Formaldehyde solution (37%). 5. Glycine solution (1–1.5 M). 6. SDS-Lysis buffer: 1% SDS, 10 mM EDTA, 50 mM Tris–HCl pH
8.0, 1% protease inhibitor mixture, and 0.5 U/ μ l RNase inhibitor.
2.1.3. Northern Blot Analysis for miRNA
Probe Generation
Preparation of Denaturing Urea Polyacrylamide Gel
Gel Electrophoresis and Blotting
Hybridization
2.2. RIP Analysis
2.2.1. Preparation of Whole Cell Lysates

170 H.I. Suzuki and K. Miyazono
7. Bioruptor sonicator or equivalent. 8. ChIP dilution buffer: 1% Triton X-100, 50 mM Tris–HCl pH
8.0, 165 mM NaCl, 0.11% sodium deoxycholate, 1% protease inhibitor mixture, and 0.5 U/ μ l RNase inhibitor.
1. Cell lysate samples from Subheading 3.2.1 . 2. Protein G (A) agarose beads (Sigma). 3. Antibody to the protein of interest (e.g., p53 DO-1 (sc-126)
or FL-393 (sc-6243) (Santa Cruz); p68 05-850 (Upstate); Drosha 07-717 (Upstate)).
4. 1× RIPA buffer/150 mM NaCl: 0.1% SDS, 1% Triton X-100, 1 mM EDTA, 50 mM Tris–HCl pH 8.0, 150 mM NaCl, 0.1% sodium deoxycholate, 1% protease inhibitor mixture and 0.5 U/ μ l RNase inhibitor.
5. 1× RIPA buffer/500 mM NaCl: 0.1% SDS, 1% Triton X-100, 1 mM EDTA, 50 mM Tris–HCl pH 8.0, 500 mM NaCl, 0.1% sodium deoxycholate, 1% protease inhibitor mixture and 0.5 U/ μ l RNase inhibitor.
6. LiCl wash buffer: 250 mM LiCl, 1% Nonidet P40, 1 mM EDTA, 10 mM Tris–HCl pH 8.0, 0.5% sodium deoxycholate, 1% protease inhibitor mixture and 0.5 U/ μ l RNase inhibitor.
7. TE pH 8.0.
1. Immunoprecipitated complex on beads from Subheading 3.2.2 . 2. ChIP elution buffer: 0.5% SDS, 5 mM EDTA, 10 mM Tris–
HCl pH 8.0, 300 mM NaCl, and 0.5 U/ μ l RNase inhibitor. 3. Proteinase K (10 mg/ml). 4. Trizol, glycogen, and reagents for RNA isolation (see
Subheading 2.1.1 ).
1. DNase I. 2. Quantitect Reverse Transcription kit (Qiagen). 3. FastStart Universal SYBR Green Master (Roche). *Items 2 and 3: Other equivalent kits can be used. 4. Applied Biosystems 7300/7500/7500 Fast Real-Time PCR
System.
1. Linearized DNA template containing T7 promoter and a target pri-miRNA fragment, or equivalent.
2. DIG RNA Labeling Kit (SP6/T7) (Roche). 3. ATP, CTP, GTP, and UTP (Roche). 4. [ α - 32 P]UTP (PerkinElmer).
2.2.2. Immunoprecipitation and Wash
2.2.3. Elution, Reversal of Crosslinks, and RNA Puri fi cation
2.2.4. RT-PCR Analysis
2.3. In Vitro Pri-miRNA Processing Analysis
2.3.1. Preparation of Pri-miRNA Template and (Radiolabeled) Pri-miRNA

17114 p53 Actions on MicroRNA Expression and Maturation Pathway
5. RNase inhibitor. 6. RNase-free water. 7. ProbeQuant G-50 Micro Columns (GE Healthcare).
1. Cells of interest, which produce FLAG-Drosha, and FLAG-Drosha expression vector.
2. PBS. 3. Lysis buffer: 1% Nonidet P40, 20 mM Tris–HCl pH 7.4,
150 mM NaCl, 5 mM EDTA, and 1% protease inhibitor mixture.
4. Anti-FLAG M2 Af fi nity Gel (Sigma).
1. Radiolabeled pri-miRNA substrates. 2. Immunoprecipitated FLAG-Drosha complex on beads. 3. Processing buffer: 20 mM Tris–HCl pH 7.9, 0.1 M KCl, 10%
Glycerol, 5 mM dithiothreitol, and 0.2 mM PMSF in water. 4. Energy solution buffer: 32 mM MgCl 2 , 10 mM ATP, and
200 mM creatine phosphate in water. 5. RNase inhibitor. 6. Nuclease-free water. 7. Trizol, glycogen, and reagents for RNA isolation (see
Subheading 2.1.1 ). 8. TBE-urea 15% acrylamide precast gels. 9. Running Buffer: Dissolve 48 g Urea, 50 ml 10× TBE, and
DEPC 1 ml in water and autoclave to make 1 L. 10. Small RNA marker (e.g., Ambion Decade RNA Marker
(Applied Biosystems) or DynaMarker Prestain Marker for Small RNA (Plus)).
11. Autoradiography system (e.g., Fuji fi lm BAS-2500).
The following methods for miRNA expression analysis are composed of (1) preparation of RNA samples, (2) qRT-PCR analysis, and (3) northern blot analysis. Stem-loop reverse tran-scription (RT)-based TaqMan ® MicroRNA assays are most widely used for the evaluation of mature miRNA expression by RT-PCR analysis ( 30 ) .
1. Prepare the cells of interest. Before RNA preparation, cells would be transfected with siRNAs of interest (e.g., p53, p68,
2.3.2. Preparation of Drosha Complex
2.3.3. In Vitro Processing Reaction and Analysis
3. Methods
3.1. Isolation of RNA and miRNA Expression Analysis
3.1.1. RNA Preparation
172 H.I. Suzuki and K. Miyazono
and so on), infected with adenovirus carrying wild-type p53 or p53 mutants and/or treated with various DNA damage-inducing agents.
2. Remove the media and lyse cells by directly adding 1 ml of Trizol to a 35–100-mm dish and pipetting the cell lysate several times (see Notes 1 and 2).
3. Incubate the homogenized samples for 5 min at room temperature.
4. Add 0.2 ml of chloroform per 1 ml of Trizol reagent. Shake tubes vigorously for 15 s.
5. Incubate for 2–3 min at room temperature. 6. Centrifuge at 12,000 × g at 4°C for 15 min. 7. Transfer the upper aqueous phase containing RNA to a new
tube and add 0.5 ml of isopropyl alcohol per 1 ml of Trizol reagent initially used. During isopropanol precipitation, glycogen can be added as a career.
8. Incubate for 10 min at room temperature. 9. Centrifuge at 12,000 × g at 4°C for 10 min. 10. Remove the supernatant. Add 1 ml of 75% ethanol and vortex. 11. Centrifuge at 7,500 × g at 4°C for 5 min. 12. Remove the supernatant and dry the RNA pellet. 13. Dissolve RNA in nuclease-free water by pipetting several times
and incubating at 55–60°C for 10 min. 14. (Optional) For small RNA (<200-nt) puri fi cation, total RNA
puri fi ed by Trizol reagent can be subjected to further fraction-ation using mirVana miRNA isolation kit (Applied Biosystems) or miRNeasy Mini kit (Qiagen), according to the manufac-turer’s instructions. Cells can be directly subjected to the RNA preparation protocol using these kits (see Note 3).
1. The RNA puri fi ed from the previous step is used as a template to synthesize cDNA using Taqman microRNA Reverse Transcription kit (Applied Biosystems) and miRNA-speci fi c RT primers (Applied Biosystems), according to the manufac-turer’s instructions.
2. Quantitative real-time RT-PCR analysis is performed using Taqman 2× Universal PCR Master Mix, No AmpErase UNG (Applied Biosystems), miR-speci fi c RT-PCR primers (Applied Biosystems), and the 7500 Fast Real-Time PCR System (Applied Biosystems), according to the manufacturer’s instructions. Data analysis is done by the comparative C T method. Results are normalized to U6 snRNA or RNU44 snoRNA for human samples.
3.1.2. miRNA RT-PCR Analysis
Analysis of Mature miRNA
17314 p53 Actions on MicroRNA Expression and Maturation Pathway
1. The RNA puri fi ed from the previous step is used as a template to synthesize cDNA using Quantitect Reverse Transcription kit (Qiagen) and random hexamers, according to the manufac-turer’s instructions. For analysis of pre-miRNA expression, small RNA fraction is subjected to cDNA synthesis.
2. Quantitative real-time RT-PCR analysis is performed using FastStart Universal SYBR Green Master (Roche) and the 7500 Fast Real-Time PCR System (Applied Biosystems). Results are normalized to GAPDH for pri-miRNA detection and U6 snRNA for pre-miRNA detection.
1. Combine the following in a total volume of 50 μ l: (a) 10–50 pmol of DNA oligonucleotide probe. (b) 5 ml of 10× T4 PNK buffer. (c) 1 ml of T4 PNK. (d) 5 μ l of [ γ - 32 P]ATP (20 μ Ci/ μ l, 800 mCi/mmol). (e) Nuclease-free water.
2. Incubate at 37°C for 1 h. 3. Incubate at 90°C for 2 min to inactivate T4 PNK and transfer
the tube on ice. 4. Gel- fi lter with a ProbeQuant G-50 Micro Column according
to the manufacturer’s instructions, to remove unincorporated radioisotope.
1. Assemble a gel cast after washing. 2. Mix Gel solution (Urea 7.2 g, 30% Acrylamide solution 7.5 ml,
and 10× TBE 1.5 ml) and shake in the dark for 1 h at room temperature.
3. Mix Gel solution, 60 ml of 20% APS, and 16 ml of TEMED. Pour gel solution into a gel cast immediately.
1. Set the gel cast to the gel box and add Running buffer to the reservoirs.
2. Rinse out wells with a syringe and 23 G needle. 3. Pre-run the gel at 120 V for 30 min. 4. During pre-running, prepare RNA samples.
(a) Mix equivalent volumes of sample and DNA loading buffer.
(b) Incubate at 65°C for 10 min, transfer to ice. 5. After pre-running, rinse out wells with a syringe and 23 G
needle and load samples. 6. Run gel at 240 V for approximately 1–2 h or until BPB reaches
about 2 cm above the bottom of the gel.
Analysis of Pri-miRNA and Pre-miRNA
3.1.3. Northern Blot Analysis for miRNA
Probe Generation
Preparation of Denaturing Urea Polyacrylamide Gel
Gel Electrophoresis and Blotting
174 H.I. Suzuki and K. Miyazono
7. Disassemble the gel cast and transfer the gel into pre-cold 0.5× TBE buffer.
8. Add a few drops of EtBr to the 0.5× TBE and stain the gel for 10 min using a shaker.
9. Wash the gel in 0.5× TBE for 10 min. Check the gel under UV for RNA quality.
10. Soak Nylon Membranes and six pieces of 3M papers in 0.5× TBE.
11. Assemble the Semi-Dry Transfer Unit: three pieces of 3M paper, gel, membrane, and three pieces of 3M paper.
12. Roll out bubbles and transfer at 250 mA for 1 h at room temperature.
13. After dissembling, UV crosslink at 1,200 mJ by UV crosslinker. 14. Bake the membrane between 3M papers at 80°C for 30 min.
1. Soak the membrane with 2× SSC. 2. Put the membrane into the hybridization bottle. 3. Add 5 ml of ExpressHyb Hybridization Solution (Clontech)
(pre-warmed to 37°C) into the bottle. 4. Incubate at 37°C for 30 min for pre-hybridization in hybrid-
ization oven. 5. Replace the solution with 5 ml of fresh hybridization
solution. 6. Add appropriate volume of the radiolabeled probe and incu-
bate at 37°C for 12–24 h in hybridization oven. 7. Wash the membrane in the bottle with 10 ml of Washing
solution I. 8. Transfer the membrane to a glass tray fi lled with 200 ml of
Washing solution I. 9. Rinse for 30 min at room temperature. 10. Repeat washing with Washing solution I. 11. Rinse with Washing solution II for 15 min, twice. 12. Remove the residual liquid, wrap the membrane in plastic
wrap, and analyze by Autoradiography system (e.g., Fuji fi m BAS-2500).
The potential interaction of various RNA species including miRNA precursors and miRNAs and target proteins can be evaluated by a modi fi ed version of the chromatin immunoprecipitation (ChIP) assay widely used for DNA–protein interactions. This procedure is named RNA immunoprecipitation (RIP) assay or RNA-ChIP and has been used for investigation of various RNA–protein interac-tions ( 10, 31– 33 ) . The interactions between pri-miRNAs and p53,
Hybridization
3.2. RIP Analysis
17514 p53 Actions on MicroRNA Expression and Maturation Pathway
p68, or Drosha are investigated according to these methods, with some minor modi fi cations ( 21 ) . In RIP assay, the interactions between RNAs and proteins are reversibly fi xed through chemical crosslinking with formaldehyde. RNA interacting with target protein(s) is immunoprecipitated with antibodies against the candidate protein and detected by RT-PCR analysis. RIP assay is performed throughout the procedures using the buffers containing RNase inhibitor.
1. Prepare the cells in one to three 100-mm dishes, which are transfected with siRNAs of interest (e.g., p53, p68, and so on) and/or treated with various DNA damage-inducing agents (see Notes 4–6).
2. Wash cells twice with PBS. 3. Add formaldehyde to a fi nal concentration of 1% in PBS and
perform crosslinking by shaking for 10 min at room temperature.
4. Add glycine to a fi nal concentration of 125 mM to quench crosslinking and shake for 5 min at room temperature.
5. Wash twice with cold PBS. 6. Add 1 ml of ice-cold PBS containing 1% protease inhibitor
mixture, collect the cells by scrapping, and transfer to a tube. 7. Centrifuge at 800 ́ g at 4°C for 5 min. 8. Add 150–200 ml of SDS-Lysis buffer to the pellets, mix well,
and incubate on ice for 10–20 min. 9. Sonicate lysates on crushed ice using Bioruptor (power high,
on 30 s/off 1 min for 5–6 cycles) (see Note 7) 10. Centrifuge at maximum speed (20,400 ́ g ) at 4°C for 10 min. 11. Transfer the supernatant to a new tube and dilute the sonicate
tenfold into ChIP dilution buffer to a fi nal volume of 1 ml per immunoprecipitation assay. A 1–10% aliquot is preserved as an input sample and preserved at −80°C until the reverse cross-linking step.
1. Add 40 ml of protein G agarose beads and preclean the soni-cate from steps 1 to 11 of Subheading 3.2.1 by rotating at 4°C for 1–2 h.
2. Centrifuge at 9,000 ́ g at 4°C for 10 s. 3. Transfer the supernatant to a new tube, add antibodies of
interest (0.5–5 mg/ml) or normal control IgG, and rotate at 4°C overnight.
4. Add 50 ml of protein G agarose beads and rotate at 4°C for 2 h.
3.2.1. Preparation of Whole Cell Lysates
3.2.2. Immunoprecipitation and Wash

176 H.I. Suzuki and K. Miyazono
5. Centrifuge at 1,500 ́ g at 4°C for 1–2 min to collect immune complexes. The supernatant would be preserved as an unbound fraction.
6. Wash the beads fi ve times using the following buffer. After each wash, beads are collected by gentle centrifugation (1,500 ́ g , 1–2 min). (a) 1× RIPA buffer/150 mM NaCl (b) 1× RIPA buffer/500 mM NaCl (c) LiCl wash buffer (d) TE pH 8.0 (e) TE pH 8.0
1. Add 200 ml of ChIP elution buffer to the beads from the previous step, vortex brie fl y following gentle centrifugation. From this step, input sample and/or unbound fraction would be subjected to the same procedures.
2. Reverse crosslinks by incubating at 65°C for 1–2 h. 3. Add 1 ml of 10 mg/ml Proteinase K and incubate at 42°C for
45 min. 4. Purify RNA using Trizol and glycogen, according to the man-
ufacturer’s instructions.
1. DNA from the samples is removed with DNase I treatment (buffer composition: 70 μ l nuclease-free water with 1 μ l of 40 U/ μ l RNase inhibitor, 5 μ l of 1 M Tris–HCl pH 7.5, 20 μ l of 50 mM MgCl 2 , and 4 μ l of 10 U/ μ l DNase I) for 30 min at 37°C, followed by Trizol puri fi cation (dissolved in 30 ml of nuclease-free water) or removal of the DNase I using DNase-inactivating reagent (Ambion Inc.).
2. The RNA puri fi ed from the previous step is used as a template to synthesize cDNA using Quantitect Reverse Transcription kit (Qiagen) and random hexamers, according to the manufac-turer’s instructions. 29 ml of RNA samples was usually used for a 60 ml cDNA synthesis reaction.
3. Quantitative real-time RT-PCR analysis is performed using FastStart Universal SYBR Green Master (Roche) and the 7500 Fast Real-Time PCR System (Applied Biosystems).
In mammalian miRNA biogenesis, long pri-miRNA transcripts are sequentially processed to mature miRNA in the nucleus and cyto-plasm. Two members of the RNase III, Drosha and Dicer in the nucleus and cytoplasm, respectively, are responsible for this two-step processing of miRNA precursors ( 13 ) . Drosha-mediated pro-cessing of pri-miRNAs to pre-miRNAs can be reconstituted in in vitro system using immunoprecipitated Drosha complex and
3.2.3. Elution, Reversal of Crosslinks, and RNA Puri fi cation
3.2.4. RT-PCR Analysis
3.3. In Vitro Pri-miRNA Processing Analysis
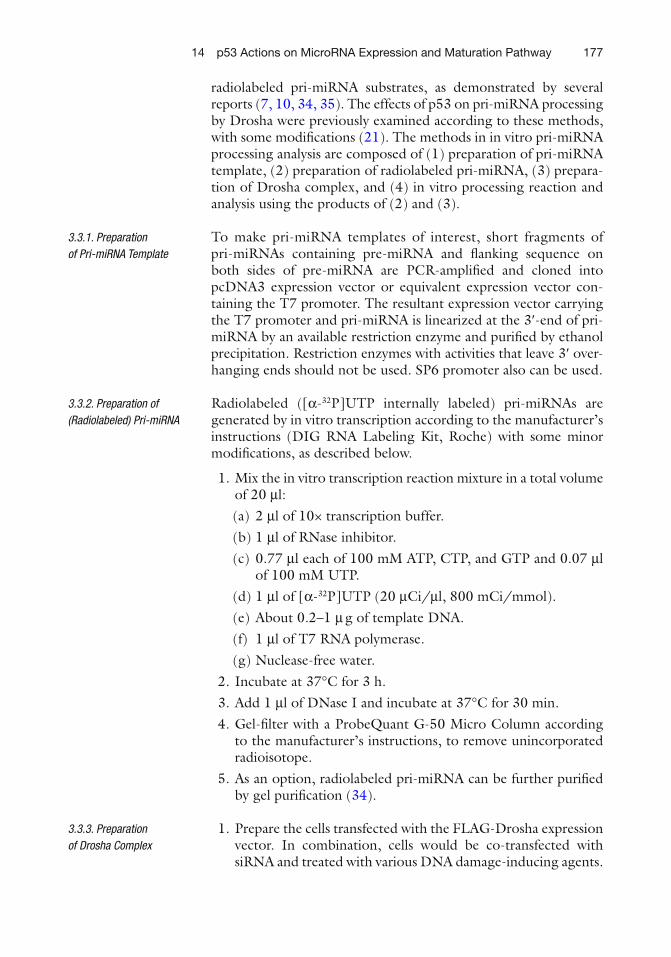
17714 p53 Actions on MicroRNA Expression and Maturation Pathway
radiolabeled pri-miRNA substrates, as demonstrated by several reports ( 7, 10, 34, 35 ) . The effects of p53 on pri-miRNA processing by Drosha were previously examined according to these methods, with some modi fi cations ( 21 ) . The methods in in vitro pri-miRNA processing analysis are composed of (1) preparation of pri-miRNA template, (2) preparation of radiolabeled pri-miRNA, (3) prepara-tion of Drosha complex, and (4) in vitro processing reaction and analysis using the products of (2) and (3).
To make pri-miRNA templates of interest, short fragments of pri-miRNAs containing pre-miRNA and fl anking sequence on both sides of pre-miRNA are PCR-ampli fi ed and cloned into pcDNA3 expression vector or equivalent expression vector con-taining the T7 promoter. The resultant expression vector carrying the T7 promoter and pri-miRNA is linearized at the 3 ¢ -end of pri-miRNA by an available restriction enzyme and puri fi ed by ethanol precipitation. Restriction enzymes with activities that leave 3 ¢ over-hanging ends should not be used. SP6 promoter also can be used.
Radiolabeled ([ α - 32 P]UTP internally labeled) pri-miRNAs are generated by in vitro transcription according to the manufacturer’s instructions (DIG RNA Labeling Kit, Roche) with some minor modi fi cations, as described below.
1. Mix the in vitro transcription reaction mixture in a total volume of 20 μ l: (a) 2 μ l of 10× transcription buffer. (b) 1 μ l of RNase inhibitor. (c) 0.77 μ l each of 100 mM ATP, CTP, and GTP and 0.07 μ l
of 100 mM UTP. (d) 1 μ l of [ α - 32 P]UTP (20 μ Ci/ μ l, 800 mCi/mmol). (e) About 0.2–1 μ g of template DNA. (f) 1 μ l of T7 RNA polymerase. (g) Nuclease-free water.
2. Incubate at 37°C for 3 h. 3. Add 1 μ l of DNase I and incubate at 37°C for 30 min. 4. Gel- fi lter with a ProbeQuant G-50 Micro Column according
to the manufacturer’s instructions, to remove unincorporated radioisotope.
5. As an option, radiolabeled pri-miRNA can be further puri fi ed by gel puri fi cation ( 34 ) .
1. Prepare the cells transfected with the FLAG-Drosha expression vector. In combination, cells would be co-transfected with siRNA and treated with various DNA damage-inducing agents.
3.3.1. Preparation of Pri-miRNA Template
3.3.2. Preparation of (Radiolabeled) Pri-miRNA
3.3.3. Preparation of Drosha Complex
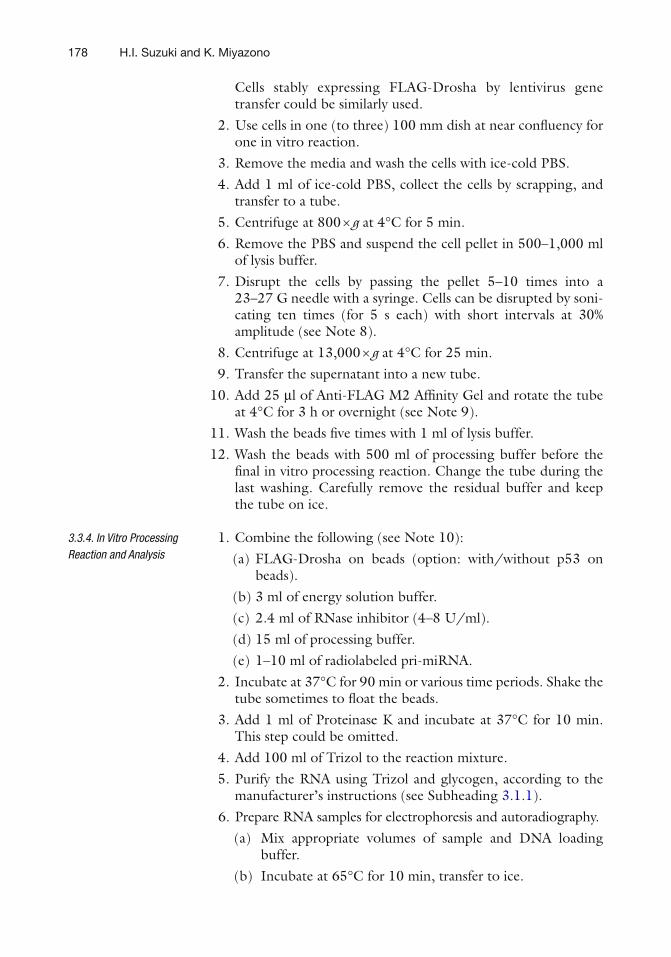
178 H.I. Suzuki and K. Miyazono
Cells stably expressing FLAG-Drosha by lentivirus gene transfer could be similarly used.
2. Use cells in one (to three) 100 mm dish at near con fl uency for one in vitro reaction.
3. Remove the media and wash the cells with ice-cold PBS. 4. Add 1 ml of ice-cold PBS, collect the cells by scrapping, and
transfer to a tube. 5. Centrifuge at 800 ́ g at 4°C for 5 min. 6. Remove the PBS and suspend the cell pellet in 500–1,000 ml
of lysis buffer. 7. Disrupt the cells by passing the pellet 5–10 times into a
23–27 G needle with a syringe. Cells can be disrupted by soni-cating ten times (for 5 s each) with short intervals at 30% amplitude (see Note 8).
8. Centrifuge at 13,000 ́ g at 4°C for 25 min. 9. Transfer the supernatant into a new tube. 10. Add 25 μ l of Anti-FLAG M2 Af fi nity Gel and rotate the tube
at 4°C for 3 h or overnight (see Note 9). 11. Wash the beads fi ve times with 1 ml of lysis buffer. 12. Wash the beads with 500 ml of processing buffer before the
fi nal in vitro processing reaction. Change the tube during the last washing. Carefully remove the residual buffer and keep the tube on ice.
1. Combine the following (see Note 10): (a) FLAG-Drosha on beads (option: with/without p53 on
beads). (b) 3 ml of energy solution buffer. (c) 2.4 ml of RNase inhibitor (4–8 U/ml). (d) 15 ml of processing buffer. (e) 1–10 ml of radiolabeled pri-miRNA.
2. Incubate at 37°C for 90 min or various time periods. Shake the tube sometimes to fl oat the beads.
3. Add 1 ml of Proteinase K and incubate at 37°C for 10 min. This step could be omitted.
4. Add 100 ml of Trizol to the reaction mixture. 5. Purify the RNA using Trizol and glycogen, according to the
manufacturer’s instructions (see Subheading 3.1.1 ). 6. Prepare RNA samples for electrophoresis and autoradiography.
(a) Mix appropriate volumes of sample and DNA loading buffer.
(b) Incubate at 65°C for 10 min, transfer to ice.
3.3.4. In Vitro Processing Reaction and Analysis
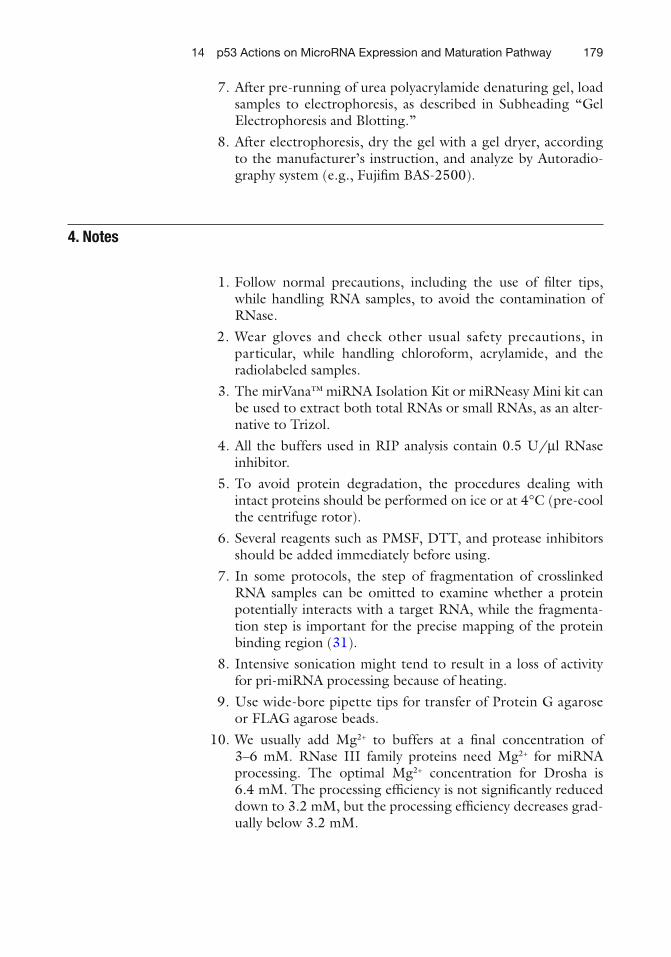
17914 p53 Actions on MicroRNA Expression and Maturation Pathway
7. After pre-running of urea polyacrylamide denaturing gel, load samples to electrophoresis, as described in Subheading “Gel Electrophoresis and Blotting.”
8. After electrophoresis, dry the gel with a gel dryer, according to the manufacturer’s instruction, and analyze by Autoradio-graphy system (e.g., Fuji fi m BAS-2500).
1. Follow normal precautions, including the use of fi lter tips, while handling RNA samples, to avoid the contamination of RNase.
2. Wear gloves and check other usual safety precautions, in particular, while handling chloroform, acrylamide, and the radiolabeled samples.
3. The mirVana™ miRNA Isolation Kit or miRNeasy Mini kit can be used to extract both total RNAs or small RNAs, as an alter-native to Trizol.
4. All the buffers used in RIP analysis contain 0.5 U/ μ l RNase inhibitor.
5. To avoid protein degradation, the procedures dealing with intact proteins should be performed on ice or at 4°C (pre-cool the centrifuge rotor).
6. Several reagents such as PMSF, DTT, and protease inhibitors should be added immediately before using.
7. In some protocols, the step of fragmentation of crosslinked RNA samples can be omitted to examine whether a protein potentially interacts with a target RNA, while the fragmenta-tion step is important for the precise mapping of the protein binding region ( 31 ) .
8. Intensive sonication might tend to result in a loss of activity for pri-miRNA processing because of heating.
9. Use wide-bore pipette tips for transfer of Protein G agarose or FLAG agarose beads.
10. We usually add Mg 2+ to buffers at a fi nal concentration of 3–6 mM. RNase III family proteins need Mg 2+ for miRNA processing. The optimal Mg 2+ concentration for Drosha is 6.4 mM. The processing ef fi ciency is not signi fi cantly reduced down to 3.2 mM, but the processing ef fi ciency decreases grad-ually below 3.2 mM.
4. Notes
180 H.I. Suzuki and K. Miyazono
Acknowledgments
We thank K. Yamagata and S. Kato for technical advice on in vitro processing analysis. This work was supported by KAKENHI (Grant-in-Aid for Scienti fi c Research) and the Global Center of Excellence Program for “Integrative Life Science Based on the Study of Biosignaling Mechanisms” from the Ministry of Education, Culture, Sports, Science, and Technology of Japan. H.I.S. is supported by a research fellowship of the Japan Society for the Promotion of Science for Young Scientists.
References
1. Brown CJ, Lain S, Verma CS, Fersht AR, Lane DP (2009) Awakening guardian angels: drugging the p53 pathway. Nat Rev Cancer 9:862–873
2. Soussi T, Beroud C (2001) Assessing TP53 status in human tumours to evaluate clinical outcome. Nat Rev Cancer 1:233–240
3. Green DR, Kroemer G (2009) Cytoplasmic functions of the tumour suppressor p53. Nature 458:1127–1130
4. Suzuki HI, Miyazono K (2010) Dynamics of microRNA biogenesis: crosstalk between p53 network and microRNA processing pathway. J Mol Med 88:1085–1094
5. Krol J, Loedige I, Filipowicz W (2010) The widespread regulation of microRNA biogen-esis, function and decay. Nat Rev Genet 11:597–610
6. Mendell JT (2005) MicroRNAs: critical regu-lators of development, cellular physiology and malignancy. Cell Cycle 4:1179–1184
7. Gregory RI, Yan KP, Amuthan G, Chendrimada T, Doratotaj B, Cooch N et al (2004) The Microprocessor complex mediates the genesis of microRNAs. Nature 432:235–240
8. Lee Y, Ahn C, Han J, Choi H, Kim J, Yim J et al (2003) The nuclear RNase III Drosha initiates microRNA processing. Nature 425:415–419
9. Han J, Lee Y, Yeom KH, Nam JW, Heo I, Rhee JK et al (2006) Molecular basis for the recognition of primary microRNAs by the Drosha-DGCR8 complex. Cell 125:887–901
10. Fukuda T, Yamagata K, Fujiyama S, Matsumoto T, Koshida I, Yoshimura K et al (2007) DEAD-box RNA helicase subunits of the Drosha complex are required for processing of rRNA and a subset of microRNAs. Nat Cell Biol 9:604–611
11. Yi R, Qin Y, Macara IG, Cullen BR (2003) Exportin-5 mediates the nuclear export of pre-microRNAs and short hairpin RNAs. Genes Dev 17:3011–3016
12. Gregory RI, Chendrimada TP, Cooch N, Shiekhattar R (2005) Human RISC couples microRNA biogenesis and posttranscriptional gene silencing. Cell 123:631–640
13. Suzuki HI, Miyazono K (2011) Emerging complexity of microRNA generation cascades. J Biochem 149(1):15–25
14. He L, He X, Lim LP, de Stanchina E, Xuan Z, Liang Y et al (2007) A microRNA component of the p53 tumour suppressor network. Nature 447:1130–1134
15. Chang TC, Wentzel EA, Kent OA, Ramachandran K, Mullendore M, Lee KH et al (2007) Transactivation of miR-34a by p53 broadly in fl uences gene expression and pro-motes apoptosis. Mol Cell 26:745–752
16. Raver-Shapira N, Marciano E, Meiri E, Spector Y, Rosenfeld N, Moskovits N et al (2007) Transcriptional activation of miR-34a contrib-utes to p53-mediated apoptosis. Mol Cell 26:731–743
17. Tarasov V, Jung P, Verdoodt B, Lodygin D, Epanchintsev A, Menssen A et al (2007) Differential regulation of microRNAs by p53 revealed by massively parallel sequencing: miR-34a is a p53 target that induces apoptosis and G1-arrest. Cell Cycle 6:1586–1593
18. Braun CJ, Zhang X, Savelyeva I, Wolff S, Moll UM, Schepeler T et al (2008) p53-Responsive micrornas 192 and 215 are capable of inducing cell cycle arrest. Cancer Res 68:10094–10104
19. Georges SA, Biery MC, Kim SY, Schelter JM, Guo J, Chang AN et al (2008) Coordinated regulation of cell cycle transcripts by p53-Inducible microRNAs, miR-192 and miR-215. Cancer Res 68:10105–10112
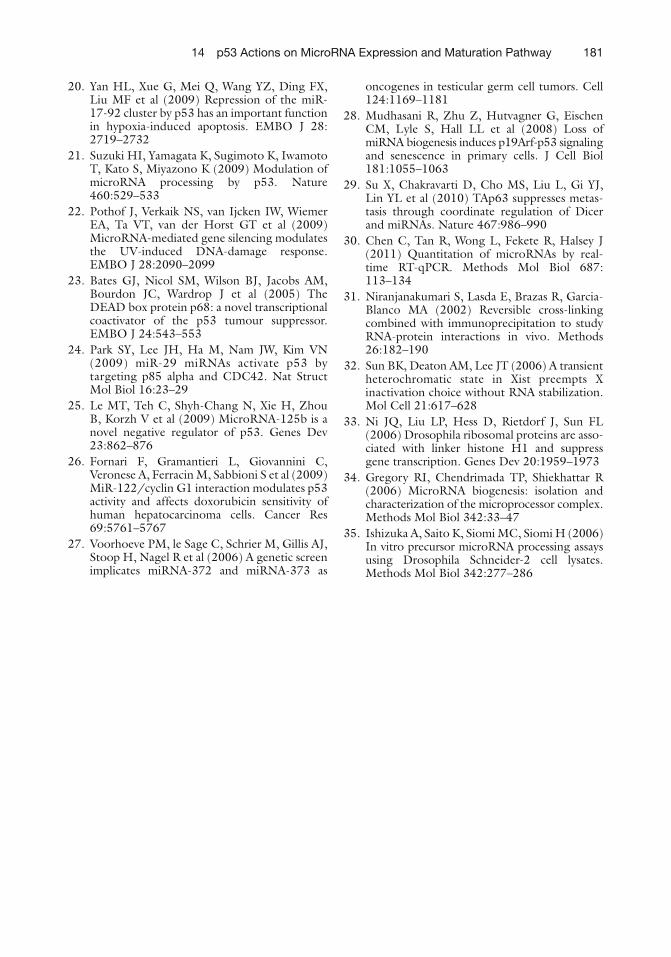
18114 p53 Actions on MicroRNA Expression and Maturation Pathway
20. Yan HL, Xue G, Mei Q, Wang YZ, Ding FX, Liu MF et al (2009) Repression of the miR-17-92 cluster by p53 has an important function in hypoxia-induced apoptosis. EMBO J 28:2719–2732
21. Suzuki HI, Yamagata K, Sugimoto K, Iwamoto T, Kato S, Miyazono K (2009) Modulation of microRNA processing by p53. Nature 460:529–533
22. Pothof J, Verkaik NS, van Ijcken IW, Wiemer EA, Ta VT, van der Horst GT et al (2009) MicroRNA-mediated gene silencing modulates the UV-induced DNA-damage response. EMBO J 28:2090–2099
23. Bates GJ, Nicol SM, Wilson BJ, Jacobs AM, Bourdon JC, Wardrop J et al (2005) The DEAD box protein p68: a novel transcriptional coactivator of the p53 tumour suppressor. EMBO J 24:543–553
24. Park SY, Lee JH, Ha M, Nam JW, Kim VN (2009) miR-29 miRNAs activate p53 by targeting p85 alpha and CDC42. Nat Struct Mol Biol 16:23–29
25. Le MT, Teh C, Shyh-Chang N, Xie H, Zhou B, Korzh V et al (2009) MicroRNA-125b is a novel negative regulator of p53. Genes Dev 23:862–876
26. Fornari F, Gramantieri L, Giovannini C, Veronese A, Ferracin M, Sabbioni S et al (2009) MiR-122/cyclin G1 interaction modulates p53 activity and affects doxorubicin sensitivity of human hepatocarcinoma cells. Cancer Res 69:5761–5767
27. Voorhoeve PM, le Sage C, Schrier M, Gillis AJ, Stoop H, Nagel R et al (2006) A genetic screen implicates miRNA-372 and miRNA-373 as
oncogenes in testicular germ cell tumors. Cell 124:1169–1181
28. Mudhasani R, Zhu Z, Hutvagner G, Eischen CM, Lyle S, Hall LL et al (2008) Loss of miRNA biogenesis induces p19Arf-p53 signaling and senescence in primary cells. J Cell Biol 181:1055–1063
29. Su X, Chakravarti D, Cho MS, Liu L, Gi YJ, Lin YL et al (2010) TAp63 suppresses metas-tasis through coordinate regulation of Dicer and miRNAs. Nature 467:986–990
30. Chen C, Tan R, Wong L, Fekete R, Halsey J (2011) Quantitation of microRNAs by real-time RT-qPCR. Methods Mol Biol 687:113–134
31. Niranjanakumari S, Lasda E, Brazas R, Garcia-Blanco MA (2002) Reversible cross-linking combined with immunoprecipitation to study RNA-protein interactions in vivo. Methods 26:182–190
32. Sun BK, Deaton AM, Lee JT (2006) A transient heterochromatic state in Xist preempts X inactivation choice without RNA stabilization. Mol Cell 21:617–628
33. Ni JQ, Liu LP, Hess D, Rietdorf J, Sun FL (2006) Drosophila ribosomal proteins are asso-ciated with linker histone H1 and suppress gene transcription. Genes Dev 20:1959–1973
34. Gregory RI, Chendrimada TP, Shiekhattar R (2006) MicroRNA biogenesis: isolation and characterization of the microprocessor complex. Methods Mol Biol 342:33–47
35. Ishizuka A, Saito K, Siomi MC, Siomi H (2006) In vitro precursor microRNA processing assays using Drosophila Schneider-2 cell lysates. Methods Mol Biol 342:277–286
183
Sumitra Deb and Swati Palit Deb (eds.), p53 Protocols, Methods in Molecular Biology, vol. 962,DOI 10.1007/978-1-62703-236-0_15, © Springer Science+Business Media New York 2013
Chapter 15
Isolation and Characterization of Murine Multipotent Lung Stem Cells
Venkat S. Gadepalli , Catherine Vaughan , and Raj R. Rao
Abstract
Cancer stem cells possess the ability to self-renew and differentiate into speci fi c cells found in tumor types, a characteristic feature of normal multipotent stem cells. These cells harbor within the bulk of tumors and if the tumor suppressor p53 is mutated in these cells, can be more likely to cause relapse and metastasis by giving rise to new tumors. This new paradigm of oncogenesis has been observed in various cancers, including lung cancer. Determining the interaction of critical cellular pathways in the ontogeny of lung tumors is expected to lead to identi fi cation of molecular targets for effective therapeutic strategies. To achieve this, it is important to characterize and dissect the differences between the cancer cells with aber-rant stem cell like properties and normal multipotent stem cells that contribute to regeneration. This could be accomplished by using cell surface markers unique for certain cell types by employing techniques such as fl ow cytometry and magnetic bead isolation. This chapter summarizes the isolation process of the resident stem cell Sca1 (+ve), CD-45 (−ve), and CD-31 (−ve) populations for its potential use in assessing correlations between speci fi c p53 gain of function phenotypes in different murine lung cancer models.
Key words: Lung stem cells , Flow cytometry , MACS
Stem cells possess distinct characteristic features such as self-renewal and differentiation potential. However, depending on the source of resident stem cells, these characteristics differ; e.g., embry-onic stem cells are pluripotent (ability to differentiate into any cell type in a body), while somatic stem cells are multipotent (ability to differentiate into cells of speci fi c lineage). Isolation, character-ization, and propagation of these multipotent stem cell lines have been a challenge for researchers. In the context of lung regeneration,
1. Introduction

184 V.S. Gadepalli et al.
the main purpose of the multipotent lung stem cells is to generate new cells and maintain structure and function of the tissue through-out the life of a multicellular organism. Scientists have character-ized multipotent stem cells from different tissues and have inferred that different organs use different strategies to renew themselves with results suggesting adoption of a diverse and fl exible renewal process by respective tissue and organs ( 1 ) . The adult lung is a vital and complex organ in multicellular organisms and exhibits a slower regeneration process than rapidly regenerating hematopoietic and epithelial tissues. There is growing evidence of resident multipo-tent stem cell populations in different anatomical regions of murine lung tissue that posses different differentiating capacities ( 2, 3 ) .
Recent studies on phenotypical and functional properties of human lung samples have shown the evidence of resident stem cell population that participate in tissue homeostasis and regeneration in animal models ( 4 ) . The existence of cancer stem cells in different tumor types has set a challenge in identifying and characterizing lung cancer stem cells, which could serve as relevant targets in understanding and treating human lung cancer. The tumor sup-pressor p53 is mutated in a high number of lung cancers. Certain gain of function phenotypes result from a mutated p53 protein such as increased oncogenecity and tumorigenecity.
Results obtained from the studies of animal models of lung injury and carcinogenesis have led to the idea that several potential stem cell compartments are located along the respiratory tract and in the lung parenchyma ( 5 ) . Identi fi cation of these potential stem cells is primarily based on expression of speci fi c surface markers ( 2, 3 ) . Based on different studies, it is hypothesized that Sca1 (+ve), CD-45 (−ve), and CD-31 (−ve) cell population harbors one or more endogenous stem cell populations ( 3 ) . In order to characterize the difference between cancer stem cells and normal stem cells it is important to develop reproducible methods to identify, isolate, and propagate these stem cells. This chapter details cell sorting techniques such as magnetic-activated cell sorting (MACS) and fl uorescence-activated cell sorting (FACS), which take advantage of speci fi c cell surface marker expression in the isolation, sorting, and characteriza-tion of resident stem cell populations in the lung. This will enable researchers to study the role mutant p53 may play in cancer stem cells and gain of function effects in those cells throughout the lungs.
1. Sterile Laminar Air fl ow hood. 2. MACS (Milteny Biotec, Auburn, CA, USA). 3. Fluorescence-activated cell sorter (BD FACSAria™ II High-
Speed Cell Sorter, BD Biosciences).
2. Materials
2.1. Equipment
18515 Isolation and Characterization of Murine Multipotent Lung Stem Cells
4. Desktop centrifuge. 5. Flow cytometer (BD Accuri ® C6 Flow Cytometer, Accuri, Ann
Arbor, MI, USA).
1. Stock solution : Add 5 ml T-amyl alcohol to 5 g tribromoethanol (tbe) (Aldrich St. Louis, MO, USA) in a dark environment.
2. Working solution : Mix 0.1 ml stock solution with approximately 7.9 ml normal saline, (or PBS), in a glass vessel wrapped in foil or a dark bottle. Dosage is about 0.2 ml/10 g of body weight.
1. Sterile stainless steel narrow blade scalpel, sharp/blunt operating scissors, straight iris scissors, thumb forceps, fi ne-point forceps, straight teasing needle, surgical thread, syringe, 18, 21, 30 gauge needle, 0.40 μ m mesh fi lter, 1 ml SubQ Syringe.
1. Dispase solution, 0.6–2.4 U/ml working concentration, pre-pared in sterile Phosphate buffer saline (PBS) (Ca 2+ and Mg 2+ free). Alternatively more ef fi cient dissociation of tissue is obtained by mixing the Dispase at 0.3–0.6 U/ml and collagenase (60–100 U/ml) (Invitrogen, Carlsbad, CA, USA) (see Note 1).
2. 0.001% Dnase solution (Invitrogen, Carlsbad, CA, USA), to hydrolyze DNA from damaged cells.
2.2. Anesthesia Preparation
2.3. Dissection Kit
2.4. Digestion Media
Fig. 1. Schematic detailing the steps involved in isolation of multipotent lung stem cells. Step 1 : Lung isolation, digestion, sieving tissue debris, Red Blood cell (RBC) lysis, and pelleting by centrifugation. Step 2 : Separation of Sca1 (+ve), CD-31 (−ve), CD-45 (−ve) cells by magnetic-activated cell sorter (MACS). Note : Sca1-APC ( red ), CD-31–PE and CD-45–PE ( yellow ).
186 V.S. Gadepalli et al.
1. Phosphate buffer saline (PBS ++ with Ca 2+ and Mg 2+ ions) with 10% fetal bovine serum (FBS).
1. Anti-mouse CD-31–PE conjugate (R&D systems, Minneapolis, MN, USA).
2. Anti-mouse CD-45–PE conjugate (R&D systems, Minneapolis, MN, USA).
3. Anti-PE and Anti-APC Micro-beads (Milteny Biotec, Auburn, CA, USA).
1. DMEM high glucose supplemented with sodium pyruvate and glutamine (Invitrogen, Carlsbad, CA, USA).
2. 1% Penicillin and streptomycin. 3. 1% Nonessential amino acids. 4. 10% FBS (Fig. 1 ).
The experimental mice used in this study are maintained in our animal facility in pathogen-free conditions according to the guide-lines of IACUC and Virginia Commonwealth University animal care facility.
1. Select three 6–8 weeks old mice for dissection. 2. Place the mice on a cage lid and grasp the loose skin behind the
ears with your thumb and fore fi nger. As soon as the mouse’s head is restrained pick up the tail and secure it within your ring fi nger and little fi nger. Make sure movement of mice is restrained completely.
3. Anesthetize mice by Intra-peritoneal injection method. The injection site should be in the lower left quadrant of the abdo-men. Disinfect the site by 70% alcohol and carefully penetrate the tip of the needle into mice abdomen wall at a 45° angle.
4. It will take about 5 min for the mouse to become fully anesthe-tized (evidenced by lack of response to toe or tail pinch). An additional 0.05–0.1 ml can be given if any sense of pain is observed. Once completely anesthetized, sacri fi ce the mice by cervical dislocation.
5. Using sterile pointed scissors make a small incision near the posterior end of abdomen. Excise towards the anterior end cutting the rib cage to expose internal organs. Care should be taken to near the throat region to avoid any damage to trachea. Dissect away the platysma and anterior tracheal muscles in order to visualize and access tracheal rings.
2.5. Sorting Medium
2.6. Antibodies, Micro-beads, and Fluorescent Stains
2.7. Multipotent Lung Stem Cell Medium
3. Methods
3.1. Lung Isolation
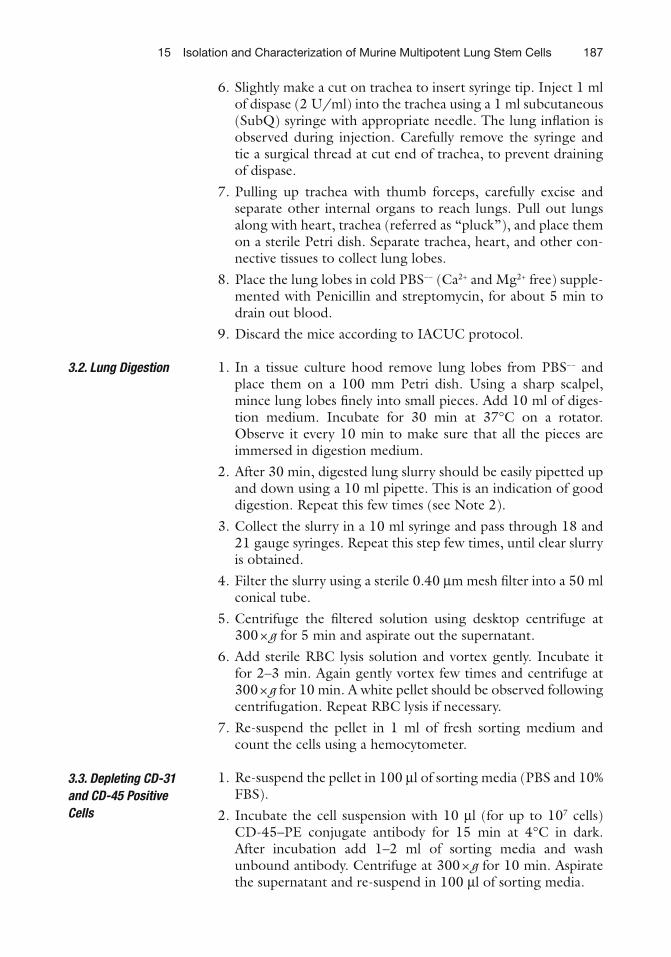
18715 Isolation and Characterization of Murine Multipotent Lung Stem Cells
6. Slightly make a cut on trachea to insert syringe tip. Inject 1 ml of dispase (2 U/ml) into the trachea using a 1 ml subcutaneous (SubQ) syringe with appropriate needle. The lung in fl ation is observed during injection. Carefully remove the syringe and tie a surgical thread at cut end of trachea, to prevent draining of dispase.
7. Pulling up trachea with thumb forceps, carefully excise and separate other internal organs to reach lungs. Pull out lungs along with heart, trachea (referred as “pluck”), and place them on a sterile Petri dish. Separate trachea, heart, and other con-nective tissues to collect lung lobes.
8. Place the lung lobes in cold PBS −− (Ca 2+ and Mg 2+ free) supple-mented with Penicillin and streptomycin, for about 5 min to drain out blood.
9. Discard the mice according to IACUC protocol.
1. In a tissue culture hood remove lung lobes from PBS −− and place them on a 100 mm Petri dish. Using a sharp scalpel, mince lung lobes fi nely into small pieces. Add 10 ml of diges-tion medium. Incubate for 30 min at 37°C on a rotator. Observe it every 10 min to make sure that all the pieces are immersed in digestion medium.
2. After 30 min, digested lung slurry should be easily pipetted up and down using a 10 ml pipette. This is an indication of good digestion. Repeat this few times (see Note 2).
3. Collect the slurry in a 10 ml syringe and pass through 18 and 21 gauge syringes. Repeat this step few times, until clear slurry is obtained.
4. Filter the slurry using a sterile 0.40 μ m mesh fi lter into a 50 ml conical tube.
5. Centrifuge the fi ltered solution using desktop centrifuge at 300 × g for 5 min and aspirate out the supernatant.
6. Add sterile RBC lysis solution and vortex gently. Incubate it for 2–3 min. Again gently vortex few times and centrifuge at 300 × g for 10 min. A white pellet should be observed following centrifugation. Repeat RBC lysis if necessary.
7. Re-suspend the pellet in 1 ml of fresh sorting medium and count the cells using a hemocytometer.
1. Re-suspend the pellet in 100 μ l of sorting media (PBS and 10% FBS).
2. Incubate the cell suspension with 10 μ l (for up to 10 7 cells) CD-45–PE conjugate antibody for 15 min at 4°C in dark. After incubation add 1–2 ml of sorting media and wash unbound antibody. Centrifuge at 300 × g for 10 min. Aspirate the supernatant and re-suspend in 100 μ l of sorting media.
3.2. Lung Digestion
3.3. Depleting CD-31 and CD-45 Positive Cells
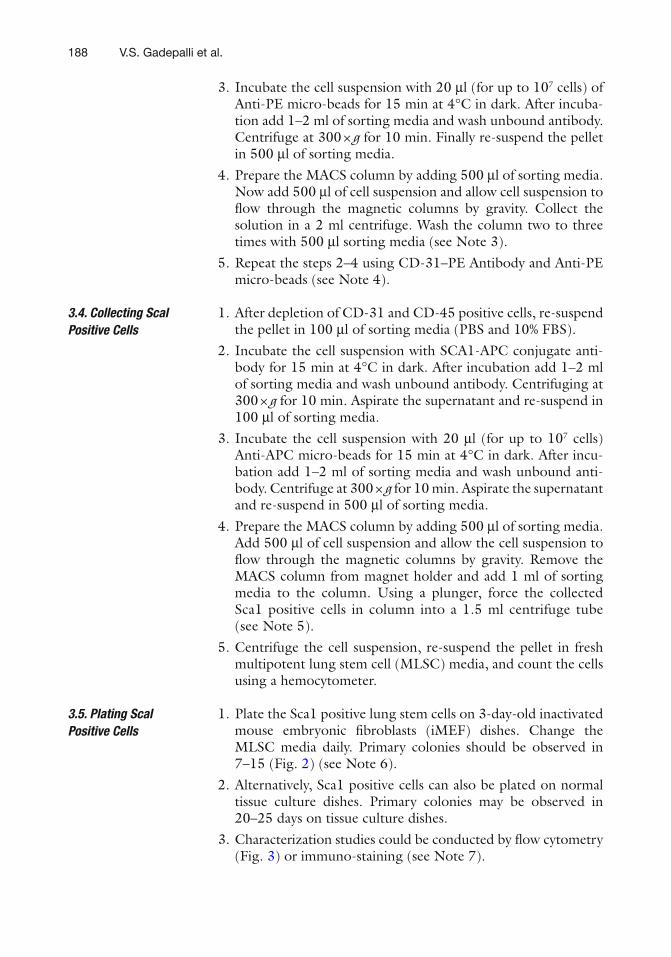
188 V.S. Gadepalli et al.
3. Incubate the cell suspension with 20 μ l (for up to 10 7 cells) of Anti-PE micro-beads for 15 min at 4°C in dark. After incuba-tion add 1–2 ml of sorting media and wash unbound antibody. Centrifuge at 300 × g for 10 min. Finally re-suspend the pellet in 500 μ l of sorting media.
4. Prepare the MACS column by adding 500 μ l of sorting media. Now add 500 μ l of cell suspension and allow cell suspension to fl ow through the magnetic columns by gravity. Collect the solution in a 2 ml centrifuge. Wash the column two to three times with 500 μ l sorting media (see Note 3).
5. Repeat the steps 2–4 using CD-31–PE Antibody and Anti-PE micro-beads (see Note 4).
1. After depletion of CD-31 and CD-45 positive cells, re-suspend the pellet in 100 μ l of sorting media (PBS and 10% FBS).
2. Incubate the cell suspension with SCA1-APC conjugate anti-body for 15 min at 4°C in dark. After incubation add 1–2 ml of sorting media and wash unbound antibody. Centrifuging at 300 × g for 10 min. Aspirate the supernatant and re-suspend in 100 μ l of sorting media.
3. Incubate the cell suspension with 20 μ l (for up to 10 7 cells) Anti-APC micro-beads for 15 min at 4°C in dark. After incu-bation add 1–2 ml of sorting media and wash unbound anti-body. Centrifuge at 300 × g for 10 min. Aspirate the supernatant and re-suspend in 500 μ l of sorting media.
4. Prepare the MACS column by adding 500 μ l of sorting media. Add 500 μ l of cell suspension and allow the cell suspension to fl ow through the magnetic columns by gravity. Remove the MACS column from magnet holder and add 1 ml of sorting media to the column. Using a plunger, force the collected Sca1 positive cells in column into a 1.5 ml centrifuge tube (see Note 5).
5. Centrifuge the cell suspension, re-suspend the pellet in fresh multipotent lung stem cell (MLSC) media, and count the cells using a hemocytometer.
1. Plate the Sca1 positive lung stem cells on 3-day-old inactivated mouse embryonic fi broblasts (iMEF) dishes. Change the MLSC media daily. Primary colonies should be observed in 7–15 (Fig. 2 ) (see Note 6).
2. Alternatively, Sca1 positive cells can also be plated on normal tissue culture dishes. Primary colonies may be observed in 20–25 days on tissue culture dishes.
3. Characterization studies could be conducted by fl ow cytometry (Fig. 3 ) or immuno-staining (see Note 7).
3.4. Collecting Scal Positive Cells
3.5. Plating Scal Positive Cells
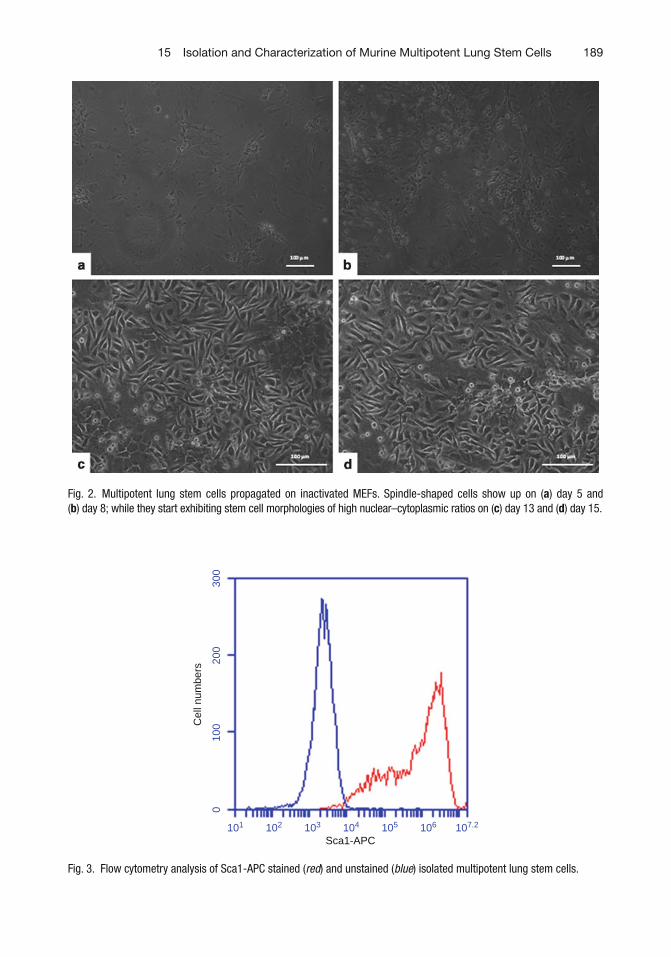
18915 Isolation and Characterization of Murine Multipotent Lung Stem Cells
Fig. 2. Multipotent lung stem cells propagated on inactivated MEFs. Spindle-shaped cells show up on ( a ) day 5 and ( b ) day 8; while they start exhibiting stem cell morphologies of high nuclear–cytoplasmic ratios on ( c ) day 13 and ( d ) day 15.
010
020
0
Cel
l num
bers
300
101 102 103
Sca1-APC104 105 106 107.2
Fig. 3. Flow cytometry analysis of Sca1-APC stained ( red ) and unstained ( blue ) isolated multipotent lung stem cells.
190 V.S. Gadepalli et al.
1. It is important to dissolve lyophilized dispase enzyme in PBS (Ca 2+ /Mg 2+ free), because these ions reduce the activity of the enzyme. Concentrations higher than 2.4 U/ml are not recommended.
2. In general, 30 min incubation at 37°C is required for soft tissue digestion. If incomplete digestion is obtained, increase the reaction time accordingly with addition of fresh digestion medium.
3. It is important to allow the fl ow of cell suspension through the column by gravity. Do not fl ush the column with force. Please review the use of antibody concentration according to the manufacturer’s protocol.
4. Mouse lung suspension cells have higher number of CD-45 positive cells. Hence it is important to deplete these cells fi rst. Based on the cell numbers obtained from three lungs, deple-tion of CD-45 and CD-31 could be performed in a single step. If there are more than 10 7 cells obtained from three mice lungs, it is important to perform depletion steps independently, to avoid the clogging of the column. Please review manufactur-er’s column sizes and cell number recommendations (Milteny Biotec, Auburn, CA, USA).
5. The ef fi ciency of MACS separation is about 70–80%. To further achieve a more homogenous population of Sca1 posi-tive, and CD-45 and CD-31 negative cells, it is important to perform FACS sorting (BD FACSAria™ II High-Speed Cell Sorter). To reduce the stress on cells, propagate MACS sorted cells at in vitro conditions for two passages and then further sort them on FACS Aria.
6. In co-culture with iMEFs, we observe compact spindle-shaped cells (Fig. 2 ). Once the primary colonies are established these cells can be propagated directly on tissue culture plates without the need of iMEF. Enzymatic passage using 0.25% Trypsin is recommended.
7. Additional characterization studies are important to establish these isolated cells as multipotent lung stem cells. Immuno-staining, fl ow cytometry, limiting dilution assays to assess colony forming ability, and differentiation into speci fi c lineage helps us to categorize them as stem cells. Flow cytometry analysis on these isolated lung stem cells is shown in Fig. 3 .
4. Notes
19115 Isolation and Characterization of Murine Multipotent Lung Stem Cells
Acknowledgments
This work was supported by a grant received from VCU Massey Cancer Center Pilot Project Program. BD FACSAria™ II High-Speed Cell Sorter Services and products in support of the research project were provided by the VCU Massey Cancer Center Flow Cytometry Shared Resource, supported, in part, with funding from NIH-NCI Cancer Center Support Grant P30 CA016059.
References
1. Rawlins EL, Hogan BL (2006) Epithelial stem cells of the lung: privileged few or opportunities for many? Development 133:2455–2465
2. Summer R, Fitzsimmons K, Dwyer D, Murphy J, Fine A (2007) Isolation of an adult mouse lung mesenchymal progenitor cell population. Respir Cell Mol Biol 37:152–159
3. Hegab AE, Kubo H, Fujino N, Suzuki T, He M, Kato H, Yamaya M (2010) Isolation and charac-
terization of murine multipotent lung stem cells. Stem Cells Dev 19:523–536
4. Moodley Y (2011) Evidence for human lung stem cells. N Engl J Med 365:464, 465–6
5. Kim CF, Jackson EL, Woolfenden AE, Lawrence S, Babar I, Vogel S, Crowley D, Bronson RT, Jacks T (2005) Identi fi cation of bronchioalveolar stem cells in normal lung and lung cancer. Cell 121:823–835
193
Chapter 16
Generation of p53 Knock-down Cell Lines
Catherine Vaughan , Swati Palit Deb , and Sumitra Deb
Abstract
In order to study the functions of a cell’s endogenous mutant p53, the p53 protein levels must be knocked-down. Transient transfection of small interfering RNAs is one way to accomplish this. Another is the stable expression of short hairpin RNAs. This chapter presents a method by which a short hairpin RNA (shRNA) targeting p53 is inserted into the genome of a cell via lentivirus infection. These p53 knock-down cell lines are stable and may be grown long term for use in a wide range of applications.
Key words: p53 knock-down , shRNA , Lentivirus , Gain of function
There are thousands of different p53 gene mutations. According to the International Agency for Research on Cancer (IARC) TP53 database there are 27,580 somatic and 597 germline mutations alone ( 1 ) . One way of studying the functions of a particular muta-tion is to overexpress that particular cDNA clone into a p53-null cell line, such as H1299. However, if the functions of a cell line’s endogenous mutant p53 were to be studied, the protein levels need to be reduced. Transient transfections are a quick and easy method by which this can be done and can be accomplished using several different reagents. The problem with transient knock-down is that if long-term functions, such as cell growth or tumorigenicity, are to be studied, there is no way of preventing the protein levels from coming back.
Stable expression of a shRNA against a particular protein, and the generation of a cell line expressing this, can be used in any type of functional assay without the worry of short-term problems.
1. Introduction
Sumitra Deb and Swati Palit Deb (eds.), p53 Protocols, Methods in Molecular Biology, vol. 962,DOI 10.1007/978-1-62703-236-0_16, © Springer Science+Business Media New York 2013
194 C. Vaughan et al.
shRNA-mediated knock-down of proteins has been used successfully by many different groups ( 2– 4 ) . Generating cell lines with p53 knocked-down is accomplished using a short hairpin RNA targeting p53 cloned inside a lentiviral vector that is always expressed. Cells are transfected with the shRNA using a lentivirus system to fully integrate it into the cell genome. After integration, transfected cells are selected for with the addition of an antibiotic. A puromycin resistance gene is located within the shRNA vector allowing only the cells that have been transfected to survive. Cells that continue to grow are cloned and p53 protein levels are checked by Western blot analysis. Many successfully knocked-down cell clones may be created following this protocol.
1. TRCN0000003756 (supplied as a bacterial culture, Open Biosystems).
2. STE: 0.1 M NaCl, 10 mM Tris–Cl pH 8.0, 1 mM EDTA pH 8.0.
3. Solution I: 50 mM Glucose, 25 mM Tris–Cl pH 8.0, 10 mM EDTA pH 8.0.
4. Lysozyme. 5. Solution II: 0.1% NaOH, 1% SDS. 6. Solution III: 3 M Potassium Acetate, 11.5% Glacial Acetic Acid. 7. 1× TE. 8. Cesium chloride. 9. 10 mg/mL Ethidium bromide. 10. Dialysis tubing. 11. Dialysis tubing clips.
1. Puri fi ed shp53 lentiviral DNA. 2. Packaging plasmid. 3. Packaging envelope. 4. pmax GFP. 5. Fugene 6 Transfection Reagent (Roche). 6. HEK293T cells in culture. 7. DMEM. 8. Disposable pipettes. 9. 1.5 mL tubes.
2. Materials
2.1. Preparation of shRNA Against p53
2.2. Generation of shp53 Lentivirus
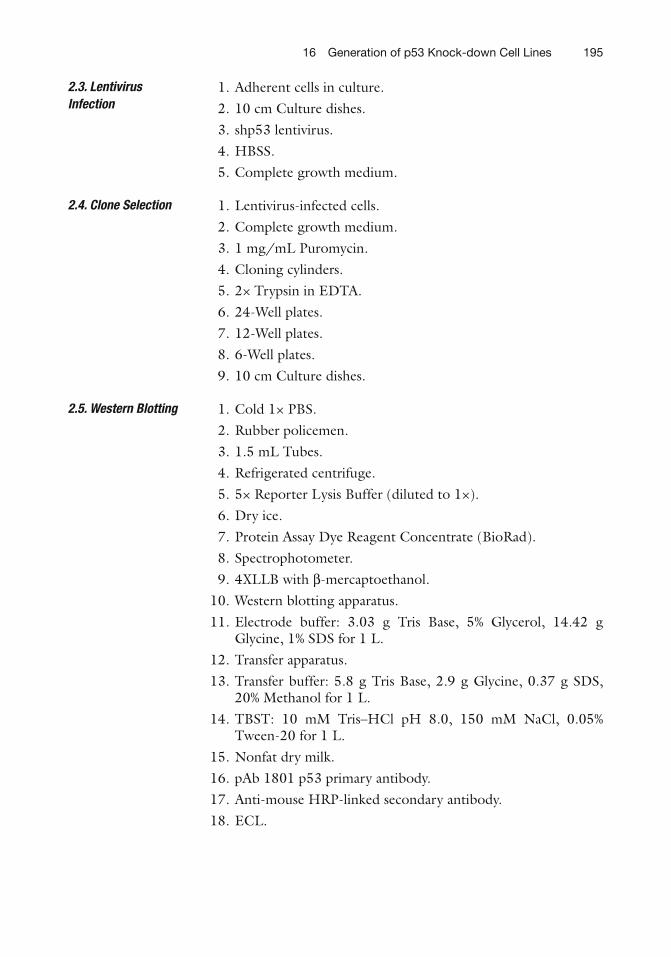
19516 Generation of p53 Knock-down Cell Lines
1. Adherent cells in culture. 2. 10 cm Culture dishes. 3. shp53 lentivirus. 4. HBSS. 5. Complete growth medium.
1. Lentivirus-infected cells. 2. Complete growth medium. 3. 1 mg/mL Puromycin. 4. Cloning cylinders. 5. 2× Trypsin in EDTA. 6. 24-Well plates. 7. 12-Well plates. 8. 6-Well plates. 9. 10 cm Culture dishes.
1. Cold 1× PBS. 2. Rubber policemen. 3. 1.5 mL Tubes. 4. Refrigerated centrifuge. 5. 5× Reporter Lysis Buffer (diluted to 1×). 6. Dry ice. 7. Protein Assay Dye Reagent Concentrate (BioRad). 8. Spectrophotometer. 9. 4XLLB with β -mercaptoethanol. 10. Western blotting apparatus. 11. Electrode buffer: 3.03 g Tris Base, 5% Glycerol, 14.42 g
Glycine, 1% SDS for 1 L. 12. Transfer apparatus. 13. Transfer buffer: 5.8 g Tris Base, 2.9 g Glycine, 0.37 g SDS,
20% Methanol for 1 L. 14. TBST: 10 mM Tris–HCl pH 8.0, 150 mM NaCl, 0.05%
Tween-20 for 1 L. 15. Nonfat dry milk. 16. pAb 1801 p53 primary antibody. 17. Anti-mouse HRP-linked secondary antibody. 18. ECL.
2.3. Lentivirus Infection
2.4. Clone Selection
2.5. Western Blotting

196 C. Vaughan et al.
1. Large-scale preparation of the shRNA against p53 is accom-plished using the protocol found in the Molecular Cloning laboratory manual (see Notes 1 and 5).
1. Split a con fl uent plate of HEK293T cells so that the new plates will be 60–70% con fl uent on the day of transfection.
2. The day of transfection, change media on the plates to be transfected in the morning.
3. Combine 2.5 μ g packaging plasmid, 2.5 μ g packaging enve-lope, and 5 μ g shRNA against p53 or positive control DNA (see Note 2) in a 1.5 mL tube and make the volume up to 100 μ L with DMEM.
4. Put 100 μ L DMEM in a separate 1.5 mL tube and add 25 μ L of the Fugene 6 solution directly to the DMEM slowly. Flick tube to mix, do not vortex , and spin down.
5. Add the DNA–DMEM mix to the Fugene 6–DMEM mix slowly. Flick tube to mix, do not vortex , and spin down.
6. Incubate the solution (now 225 μ L) in the cell culture hood for 15 min and add dropwise to the plate of 293T cells. Swirl plate gently and keep in incubator for 2 days.
1. Before harvesting the virus, view the positive control plate (pmax GFP) under fl uorescent light to make sure the transfec-tion worked.
2. Using a disposable pipette, collect the entire amount of media from the plate and put it into a 50 mL tube, this is the virus. Mix gently.
3. Aliquot the virus in 1 mL aliquots and fl ash freeze in liquid nitrogen for 5 min. Store at −70°C until needed (see Note 3).
1. The day before virus infection, split the cells to be infected into a 10 cm dish so they will be 20% con fl uent on the day of transfection.
2. Remove the culture medium from the cells and wash with 10 mL HBSS or PBS, and then remove.
3. Add 1 mL lentivirus to the plate and rock to coat all the cells. Put the dish in the incubator.
4. Rock the plate every 15 min for 2 h to ensure even distribution of the virus and to make sure the cells don’t dry out.
5. After 2 h, add 10 mL complete medium back to the cells.
3. Methods
3.1. Preparation of shRNA Against p53
3.2. Generation of shp53 Lentivirus
3.2.1. Transfection
3.2.2. Harvesting the Lentivirus
3.3. Lentivirus Infection
19716 Generation of p53 Knock-down Cell Lines
1. Two days after infection add puromycin to the cells to begin selection and change the media plus puromycin for every 3–4 days until colonies are visible (see Note 4).
2. When nicely separated colonies are visible, remove the culture medium and wash the plate with 10 mL HBSS or PBS, and remove.
3. Put one cloning cylinder around each colony and add 100 μ L 2× trypsin inside. Incubate at room temperature for 2–3 min.
4. Pipette up and down using a micropipettor and put each colony into one well of a 24-well plate containing 0.5 mL complete medium plus puromycin.
5. When the clones become con fl uent in their wells, move them to the next well size higher (e.g., 24-well to a 12-well).
6. When the clones become con fl uent in a 6-well dish, split them so that 80% of the cells are transferred to a 10 cm dish and 20% remain in the 6-well dish (see Note 5).
7. Upon Western blotting veri fi cation, split the cells to a 10 cm dish and utilize for various experiments.
1. Take the 10 cm dish for each clone for Western when it is about 80–90% con fl uent.
2. Aspirate the media and wash the cells with 10 mL ice-cold PBS. Aspirate.
3. Add 1 mL ice-cold PBS to the cells and scrape off the culture dish with a rubber policeman. Pipette the cell/PBS mix into a 1.5 mL tube.
4. Pellet the cells by centrifugation at 4,000 rpm (1,700 rcf) for 10 min at 4°C and remove the supernatant.
5. Resuspend the cell pellet in 1× Reporter Lysis Buffer and perform a freeze–thaw cycle by putting the tube in a dry ice/ethanol bath for 5 min. Thaw the extracts and pellet the cell debris by centrifugation at 10,000 rpm (1,700 rcf) for 10 min at 4°C.
6. Transfer the supernatant into a new 1.5 mL tube and perform a protein assay (see Subheading 3.5.2 ).
7. Add one-third the volume of the protein extract of 4XLLB with β -mercaptoethanol and mix.
8. Boil the extracts for 5 min and load in a polyacrylamide gel.
1. Combine 960 μ L sterile water, 240 μ L Protein Assay Reagent, and 3 μ L extract or water for blank into a 1.5 mL tube. Mix and take an optical density reading using a spectrophotometer at 595 nm.
3.4. Clone Selection
3.5. Western Blotting Veri fi cation of p53 Knock-down
3.5.1. Harvesting and Preparing Extract
3.5.2. Protein Assay
198 C. Vaughan et al.
2. Normalize the amount of extract to use for each sample in the polyacrylamide gel.
1. Pour a 10% polyacrylamide gel with spacers of 1.5 mm. 2. Load a maximum volume of 20 μ L per extract and a protein
ladder for band identi fi cation (see Note 6). 3. Run the gel at 30 mA until the dye band almost runs out of
the gel. 4. Transfer at 350 mA for 2 h using a 0.45 μ m membrane.
1. Block nonspeci fi c antibody binding by washing the blot in a 3% milk-TBST solution for 45 min at room temperature.
2. Wash the blot twice with 10 mL TBST for 10 min. 3. Incubate in pAb 1801 for 1 h. 4. Repeat step 2. 5. Incubate the blot in anti-mouse HRP-linked secondary diluted
1:1,000 in TBST for 30 min at room temperature. 6. Repeat step 2. 7. Develop the blot for p53 and keep all clones that show an
absent p53 band (see Note 7).
1. Preparation of the lentivirus DNA may be done outside of a biosafety cabinet, the DNA will be dialyzed to clean it. All steps from this point onward should be carried out inside a sterile biosafety cabinet with the exception of Western blotting.
2. Use pmax GFP as a positive control for transfection. Two days later view the cells under fl uorescent light; the cells should express GFP and provide support to the success of the transfection.
3. Take care to only use disposable pipettes and treat everything the virus touches with bleach for at least 24 h. The lentivirus is replication de fi cient but can still infect tissue it comes into contact with.
4. It is useful to add puromycin at different concentrations starting at 1 μ g to the original cell line to determine which concentration would be the best for clonal selection. After selection, cells need to continue to be grown in media containing puromycin to ensure the knock-down effect is not lost.
5. The 10 cm dish will be used for Western analysis while the remain-ing cells grow in the 6-well dish until p53 knock-down veri fi cation.
3.5.3. Running and Transferring the Gel
3.5.4. Developing the Blot
4. Notes
19916 Generation of p53 Knock-down Cell Lines
6. Use either the original cell line or cells infected with shGFP as a positive p53 band control.
7. Make sure to develop the blot for a loading control such as Actin, GAPDH, or Erk2.
Acknowledgments
This work was supported by grants from NIH to Sumitra Deb (CA70712 and CA121144) and Swati Palit Deb (CA74172), and Pilot Project Awards from Massey Cancer to Sumitra Deb and Swati Palit Deb. We thank Shilpa Singh for help in editing this chapter.
References
1. International Agency for Research on Cancer TP53 database. http://www-p53.iarc.fr
2. Avery-Kiejda KA et al (2011) P53 in human melanoma fails to regulate target genes associated with apoptosis and the cell cycle and may con-tribute to proliferation. BMC Cancer 11:203
3. Hung MS et al (2011) Cul4A is an oncogene in malignant pleural mesothelioma. J Cell Mol Med 15(2):350–358
4. Wu ZZ, Sun NK, Chao CC (2011) Knockdown of CITED2 using short-hairpin RNA sensitizes cancer cells to cisplatin through stabilization of p53 and enhancement of p53-dependent apop-tosis. J Cell Physiol 226(9):2415–2428
5. Sambrook J, Russell D (2001) Molecular cloning: a laboratory manual. Cold Spring Harbor Laboratory, Cold Spring Harbor, NY
201
Sumitra Deb and Swati Palit Deb (eds.), p53 Protocols, Methods in Molecular Biology, vol. 962,DOI 10.1007/978-1-62703-236-0_17, © Springer Science+Business Media New York 2013
Chapter 17
ChIP for Identi fi cation of p53 Responsive DNA Promoters
Jun-Ming Liao and Hua Lu
Abstract
Chromatin immunoprecipitation assay (ChIP) has been frequently used to determine whether a transcrip-tional regulator can bind to a speci fi c DNA element in the chromatin content of cells. Here, we describe a detailed protocol for this assay with hands-on tips based on our own experience in working on the tran-scriptional regulator and tumor suppressor p53.
Key words: Chromatin immunoprecipitation , p53 responsive DNA element , Transcription
Although p53 can induce apoptosis in a transcription-independent fashion ( 1 ) , it has been well established that p53 functions as a tumor suppressor primarily through its transcriptional regulation of a num-ber of target genes, which encode proteins and miRNAs important for executing the p53 response to a variety of stress signals ( 2– 5 ) . This transcriptional activity is exerted via the direct binding of p53 to the canonical p53 responsive DNA elements of its target promoters. Thus, monitoring the binding of p53 to its target gene promoters becomes one critical measurement of p53 transcriptional functions for speci fi c target genes in cells. Chromatin immunoprecipitation (ChIP) was ini-tially developed to de fi ne the Polycomb-repressed chromatin domains in cells ( 6 ) and later on often applied for the detection of the binding of a number of transcriptional factors to their responsive DNA ele-ments in the chromatin content in cells ( 7 ) . This method has also been successfully used not only to detect the binding of p53 to its known responsive DNA elements in vivo ( 8 ) , but also to identify new p53 target promoters, including some of our own studies in the labo-ratory ( 9– 11 ) . Hence, ChIP has become one of the frequently used
1. Introduction
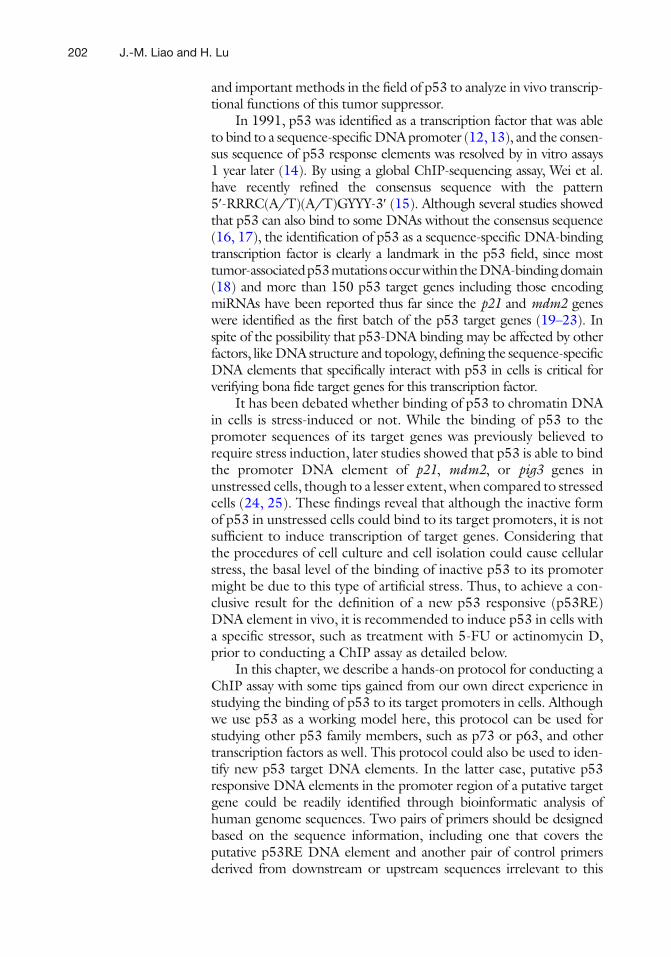
202 J.-M. Liao and H. Lu
and important methods in the fi eld of p53 to analyze in vivo transcrip-tional functions of this tumor suppressor.
In 1991, p53 was identi fi ed as a transcription factor that was able to bind to a sequence-speci fi c DNA promoter ( 12, 13 ) , and the consen-sus sequence of p53 response elements was resolved by in vitro assays 1 year later ( 14 ) . By using a global ChIP-sequencing assay, Wei et al. have recently re fi ned the consensus sequence with the pattern 5 ¢ -RRRC(A/T)(A/T)GYYY-3 ¢ ( 15 ) . Although several studies showed that p53 can also bind to some DNAs without the consensus sequence ( 16, 17 ) , the identi fi cation of p53 as a sequence-speci fi c DNA-binding transcription factor is clearly a landmark in the p53 fi eld, since most tumor-associated p53 mutations occur within the DNA-binding domain ( 18 ) and more than 150 p53 target genes including those encoding miRNAs have been reported thus far since the p21 and mdm2 genes were identi fi ed as the fi rst batch of the p53 target genes ( 19– 23 ) . In spite of the possibility that p53-DNA binding may be affected by other factors, like DNA structure and topology, de fi ning the sequence-speci fi c DNA elements that speci fi cally interact with p53 in cells is critical for verifying bona fi de target genes for this transcription factor.
It has been debated whether binding of p53 to chromatin DNA in cells is stress-induced or not. While the binding of p53 to the promoter sequences of its target genes was previously believed to require stress induction, later studies showed that p53 is able to bind the promoter DNA element of p21 , mdm2 , or pig3 genes in unstressed cells, though to a lesser extent, when compared to stressed cells ( 24, 25 ) . These fi ndings reveal that although the inactive form of p53 in unstressed cells could bind to its target promoters, it is not suf fi cient to induce transcription of target genes. Considering that the procedures of cell culture and cell isolation could cause cellular stress, the basal level of the binding of inactive p53 to its promoter might be due to this type of arti fi cial stress. Thus, to achieve a con-clusive result for the de fi nition of a new p53 responsive (p53RE) DNA element in vivo, it is recommended to induce p53 in cells with a speci fi c stressor, such as treatment with 5-FU or actinomycin D, prior to conducting a ChIP assay as detailed below.
In this chapter, we describe a hands-on protocol for conducting a ChIP assay with some tips gained from our own direct experience in studying the binding of p53 to its target promoters in cells. Although we use p53 as a working model here, this protocol can be used for studying other p53 family members, such as p73 or p63, and other transcription factors as well. This protocol could also be used to iden-tify new p53 target DNA elements. In the latter case, putative p53 responsive DNA elements in the promoter region of a putative target gene could be readily identi fi ed through bioinformatic analysis of human genome sequences. Two pairs of primers should be designed based on the sequence information, including one that covers the putative p53RE DNA element and another pair of control primers derived from downstream or upstream sequences irrelevant to this
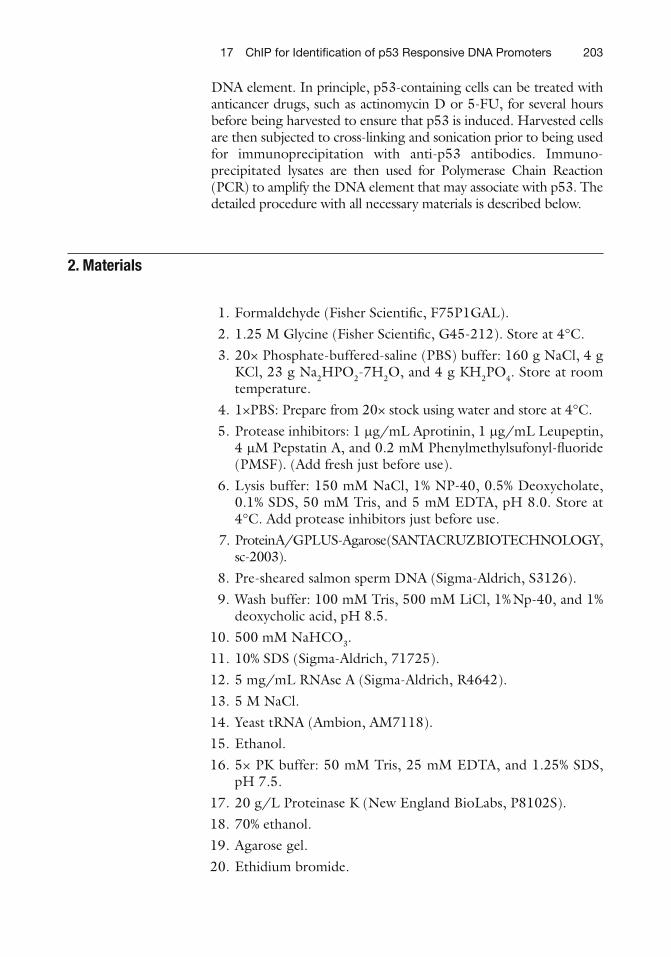
20317 ChIP for Identification of p53 Responsive DNA Promoters
DNA element. In principle, p53-containing cells can be treated with anticancer drugs, such as actinomycin D or 5-FU, for several hours before being harvested to ensure that p53 is induced. Harvested cells are then subjected to cross-linking and sonication prior to being used for immunoprecipitation with anti-p53 antibodies. Immuno-precipitated lysates are then used for Polymerase Chain Reaction (PCR) to amplify the DNA element that may associate with p53. The detailed procedure with all necessary materials is described below.
1. Formaldehyde (Fisher Scienti fi c, F75P1GAL). 2. 1.25 M Glycine (Fisher Scienti fi c, G45-212). Store at 4°C. 3. 20× Phosphate-buffered-saline (PBS) buffer: 160 g NaCl, 4 g
KCl, 23 g Na 2 HPO 2 -7H 2 O, and 4 g KH 2 PO 4 . Store at room temperature.
4. 1×PBS: Prepare from 20× stock using water and store at 4°C. 5. Protease inhibitors: 1 m g/mL Aprotinin, 1 m g/mL Leupeptin,
4 m M Pepstatin A, and 0.2 mM Phenylmethylsufonyl- fl uoride (PMSF). (Add fresh just before use).
6. Lysis buffer: 150 mM NaCl, 1% NP-40, 0.5% Deoxycholate, 0.1% SDS, 50 mM Tris, and 5 mM EDTA, pH 8.0. Store at 4°C. Add protease inhibitors just before use.
7. Protein A/G PLUS-Agarose (SANTA CRUZ BIOTECHNOLOGY, sc-2003).
8. Pre-sheared salmon sperm DNA (Sigma-Aldrich, S3126). 9. Wash buffer: 100 mM Tris, 500 mM LiCl, 1% Np-40, and 1%
deoxycholic acid, pH 8.5. 10. 500 mM NaHCO 3 . 11. 10% SDS (Sigma-Aldrich, 71725). 12. 5 mg/mL RNAse A (Sigma-Aldrich, R4642). 13. 5 M NaCl. 14. Yeast tRNA (Ambion, AM7118). 15. Ethanol. 16. 5× PK buffer: 50 mM Tris, 25 mM EDTA, and 1.25% SDS,
pH 7.5. 17. 20 g/L Proteinase K (New England BioLabs, P8102S). 18. 70% ethanol. 19. Agarose gel. 20. Ethidium bromide.
2. Materials
204 J.-M. Liao and H. Lu
The following protocol is based on the previously described method ( 26 ) with some modi fi cations according to our own experience (Fig. 1 ).
1. Culture suf fi cient cells (at least 10 7 cells per IP) with desired
treatments (see Note 1). 2. Add 37% formaldehyde (30 m L/mL media) directly into the plate
with media. Gently shake the plates at RT for 10 min ( see Note 2 ).
3. Methods
3.1. Chromatin Preparation
Fig. 1. Schematic diagram showing ChIP .
20517 ChIP for Identification of p53 Responsive DNA Promoters
3. Add glycine to a fi nal concentration of 0.125 M to stop the cross-linking reaction. Incubate at room temperature (RT) for 5 min.
4. Wash cells twice with PBS and scrape 10 7 cells in 1.5 mL PBS with PMSF. Transfer the cells to 1.5 mL tube.
5. Pellet cells for 5 min at 1,000 × g at 4°C and aspirate off the supernatant. The cells can be used for ChIP directly or frozen in liquid N 2 and stored at −80°C for months. From this step, keep your sample and reagents at 4°C or in an ice bucket.
6. Add protease inhibitors into the RIPA buffer (prepare 5 mL per IP).
7. Resuspend cell (do not vortex) pellets with 1 mL RIPA with protease inhibitors ( see Note 3 ).
8. Incubate the mixture in ice for 30 min by reversing the tube occasionally to avoid precipitation.
9. Shear DNA to yield fragments of 300–1,000 bp by sonication (Fig. 2 ), 10 s, 8 times. We use Fisher Scienti fi c Model 100 Sonic Dismembrator and set up the output power to 14 W ( see Note 4 ).
10. After sonication, spin the lysates for 10 min at 16,000 × g and collect the supernatant into a new 1.5 mL tube. The chromatin can be stored at −80°C at this step.
For the fi rst ChIP experiment, we strongly recommend that you set up both positive and negative controls for both antibodies and primer sets.
1. Take out 50 m L for the input ( see Note 5 ). 2. Prepare DNA–protein A/G slurry (1:1 mixture of 10 g/L pre-
sheared salmon sperm DNA and protein A/G). 3. The prepared chromatin was precleared with 50 m L DNA–
protein A/G slurry on rotating platform for 30 min at 4°C. 4. Spin at 1,500 × g 4°C for 2 min, collect the supernatants to a
new 1.5 mL tube ( see Note 6 ). 5. Take 250 m L of mixtures to a new tube for each antibody, add
appropriate antibody (1–5 m g) to each sample, and immuno-precipitation was performed on a rotating platform at 4°C overnight ( see Note 7 ).
End of day 1
6. Add 50 m L Protein A/G sepharose beads and incubate for two more hours at 4°C on the rotating platform.
7. Wash the immunocomplexes twice with 1 mL RIPA buffer, four times with IP wash buffer, and twice with RIPA buffer. Between washes, samples are rotated for 5 min and spun at 1,000 × g 1 min ( see Note 8 ).
3.2. Immunoprecipi-tation
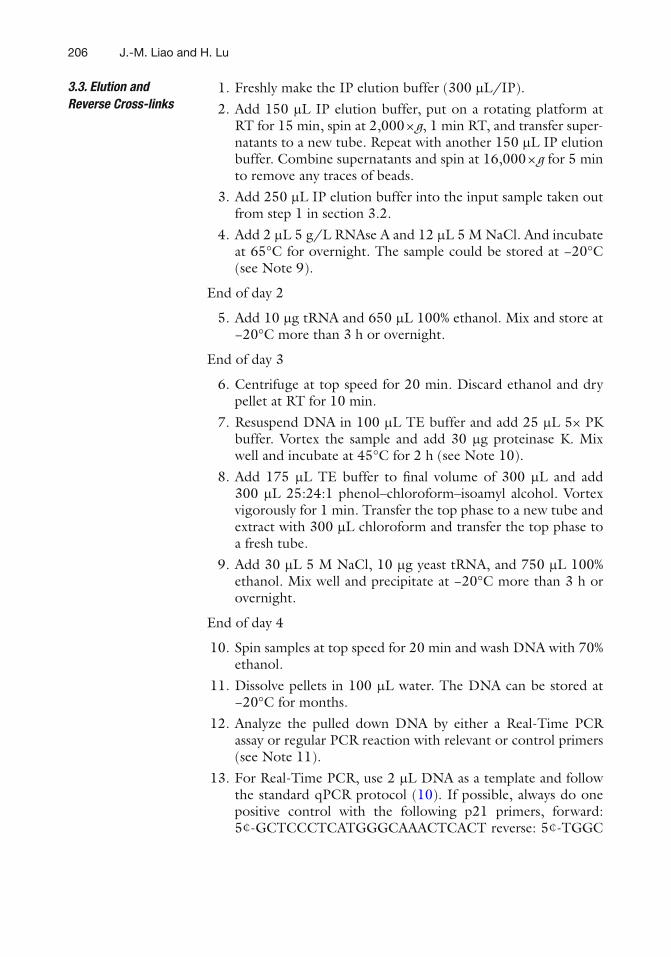
206 J.-M. Liao and H. Lu
1. Freshly make the IP elution buffer (300 m L/IP). 2. Add 150 m L IP elution buffer, put on a rotating platform at
RT for 15 min, spin at 2,000 × g , 1 min RT, and transfer super-natants to a new tube. Repeat with another 150 m L IP elution buffer. Combine supernatants and spin at 16,000 × g for 5 min to remove any traces of beads.
3. Add 250 m L IP elution buffer into the input sample taken out from step 1 in section 3.2.
4. Add 2 m L 5 g/L RNAse A and 12 m L 5 M NaCl. And incubate at 65°C for overnight. The sample could be stored at −20°C ( see Note 9 ).
End of day 2
5. Add 10 m g tRNA and 650 m L 100% ethanol. Mix and store at −20°C more than 3 h or overnight.
End of day 3
6. Centrifuge at top speed for 20 min. Discard ethanol and dry pellet at RT for 10 min.
7. Resuspend DNA in 100 m L TE buffer and add 25 m L 5× PK buffer. Vortex the sample and add 30 m g proteinase K. Mix well and incubate at 45°C for 2 h ( see Note 10 ).
8. Add 175 m L TE buffer to fi nal volume of 300 m L and add 300 m L 25:24:1 phenol–chloroform–isoamyl alcohol. Vortex vigorously for 1 min. Transfer the top phase to a new tube and extract with 300 m L chloroform and transfer the top phase to a fresh tube.
9. Add 30 m L 5 M NaCl, 10 m g yeast tRNA, and 750 m L 100% ethanol. Mix well and precipitate at −20°C more than 3 h or overnight.
End of day 4
10. Spin samples at top speed for 20 min and wash DNA with 70% ethanol.
11. Dissolve pellets in 100 m L water. The DNA can be stored at −20°C for months.
12. Analyze the pulled down DNA by either a Real-Time PCR assay or regular PCR reaction with relevant or control primers ( see Note 11 ).
13. For Real-Time PCR, use 2 m L DNA as a template and follow the standard qPCR protocol ( 10 ) . If possible, always do one positive control with the following p21 primers, forward: 5 ¢ -GCTCCCTCATGGGCAAACTCACT reverse: 5 ¢ -TGGC
3.3. Elution and Reverse Cross-links
20717 ChIP for Identification of p53 Responsive DNA Promoters
TGGTCTACCTGGCTCCTCT, with annealing temperature: 60°C and data collecting temperature: 75°C.
14. Or, run regular PCR products on a 2% agarose gel with ethid-ium bromide staining (Fig. 1 ) ( see Note 12 ).
1. Start with three con fl uent 10-cm dishes. A suf fi cient number of cells are vital to the success of the ChIP assay. Fewer cells may result in weak signal and high background. The required number of cells may vary depending on cell type. Therefore, we suggest measuring the DNA concentration for each cell line and start with 25 m g DNA per IP.
2. The time and formaldehyde concentration may be optimized. However, do not cross-link the proteins to DNA longer than 30 min, for it would affect the antibody binding and the ef fi ciency of sonication or cause cell aggregation.
3. Optional steps to purify the nuclei may reduce the nonspeci fi c binding of primary antibodies. Before adding RIPA buffer, add 1 mL Swelling buffer (5 mM PIPES, 80 mM KCl, and 1% NP-40, pH 8.0) with protease inhibitors to 5 × 10 7 cells, incu-bate on ice for 30 min, reverse the tube during the incubation to avoid the precipitation. Centrifuge at 2,300 × g at 4°C for 5 min, dump the supernatants, and go to step 7 in this section.
4. Make sure to keep cell lysates cold. Optimizing the conditions for the sonication is crucial, for sonication ef fi ciency varies depending on cell type. Test the pulse duration, intensity, and time course to establish optimal conditions. Make sure to carry on the reverse cross-linking after sonication and apply the DNA fragments to 2% agarose gel as shown in Fig. 2 . Do not shear or sonicate DNA for too long, for long time sonication may result in disruption of nucleosome-DNA binding. The frag-ments shorter than 250 bp could be an indication for too long sonication. Choose the lowest power output that gives ideal fragmentation to avoid overheat.
5. For the fi rst ChIP assay, it is recommended to measure the DNA concentration after reverse cross-linking. Brie fl y, take the input DNA at step 1 in section 3.2, go to step 3 in section 3.3 directly, and measure the concentration after step 11 in section 3.3. The DNA concentration should be about half of the concentration measured after step 11 in section 3.3.
6. The preclear step is important for reducing the background. Leave 100 m L supernatant in the original tube to avoid any
4. Notes
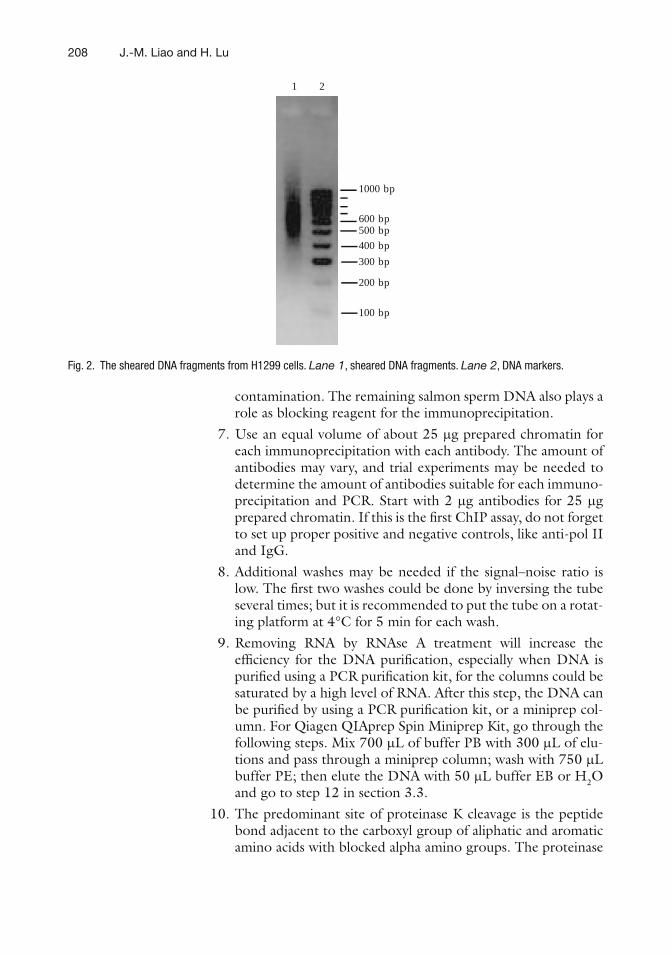
208 J.-M. Liao and H. Lu
contamination. The remaining salmon sperm DNA also plays a role as blocking reagent for the immunoprecipitation.
7. Use an equal volume of about 25 m g prepared chromatin for each immunoprecipitation with each antibody. The amount of antibodies may vary, and trial experiments may be needed to determine the amount of antibodies suitable for each immuno-precipitation and PCR. Start with 2 m g antibodies for 25 m g prepared chromatin. If this is the fi rst ChIP assay, do not forget to set up proper positive and negative controls, like anti-pol II and IgG.
8. Additional washes may be needed if the signal–noise ratio is low. The fi rst two washes could be done by inversing the tube several times; but it is recommended to put the tube on a rotat-ing platform at 4°C for 5 min for each wash.
9. Removing RNA by RNAse A treatment will increase the ef fi ciency for the DNA puri fi cation, especially when DNA is puri fi ed using a PCR puri fi cation kit, for the columns could be saturated by a high level of RNA. After this step, the DNA can be puri fi ed by using a PCR puri fi cation kit, or a miniprep col-umn. For Qiagen QIAprep Spin Miniprep Kit, go through the following steps. Mix 700 m L of buffer PB with 300 m L of elu-tions and pass through a miniprep column; wash with 750 m L buffer PE; then elute the DNA with 50 m L buffer EB or H 2 O and go to step 12 in section 3.3.
10. The predominant site of proteinase K cleavage is the peptide bond adjacent to the carboxyl group of aliphatic and aromatic amino acids with blocked alpha amino groups. The proteinase
1000 bp
1 2
600 bp500 bp
400 bp
300 bp
200 bp
100 bp
Fig. 2. The sheared DNA fragments from H1299 cells. Lane 1 , sheared DNA fragments. Lane 2 , DNA markers.
20917 ChIP for Identification of p53 Responsive DNA Promoters
K treatment disrupts the binding of protein to DNA and increases the ef fi ciency of DNA puri fi cation.
11. The primers could be designed based on the p53RE DNA ele-ment within a target gene. The p53RE DNA element could be bioinformatically predicted by p53MH program ( 27 ) . A good negative control could be the primers encompassing the 3 UTR-coding region of a target gene.
12. It is necessary to optimize the PCR cycle number, for too many cycles will amplify the nonspeci fi c DNA as immunoprecipitated with IgG; however, fewer cycles could not show the DNA pulled down by the p53 antibody used. A titration of immuno-precipitated DNA is recommended to fi gure out the proper cycle number for a speci fi c PCR reaction.
Acknowledgment
H.L. was supported by NIH-NCI grants CA127724, CA095441, and CA129828.
References
1. Moll UM, Wolff S, Speidel D, Deppert W (2005) Transcription-independent pro-apop-totic functions of p53. Curr Opin Cell Biol 17(6):631–636
2. Vogelstein B, Lane D, Levine AJ (2000) Sur fi ng the p53 network. Nature 408(6810):307–310
3. Marchenko ND, Moll UM (2007) The role of ubiquitination in the direct mitochondrial death program of p53. Cell Cycle 6(14):1718–1723
4. Vousden KH, Lane DP (2007) p53 in health and disease. Nat Rev Mol Cell Biol 8(4):275–283
5. He L, He X, Lim LP, de Stanchina E, Xuan Z, Liang Y, Xue W, Zender L, Magnus J, Ridzon D, Jackson AL, Linsley PS, Chen C, Lowe SW, Cleary MA, Hannon GJ (2007) A microRNA component of the p53 tumour suppressor net-work. Nature 447(7148):1130–1134
6. Orlando V, Paro R (1993) Mapping polycomb-repressed domains in the bithorax complex using in vivo formaldehyde cross-linked chro-matin. Cell 75(6):1187–1198
7. Orlando V (2000) Mapping chromosomal pro-teins in vivo by formaldehyde-crosslinked-chromatin immunoprecipitation. Trends Biochem Sci 25(3):99–104
8. Brady CA, Jiang D, Mello SS, Johnson TM, Jarvis LA, Kozak MM, Broz DK, Basak S, Park EJ, McLaughlin ME, Karnezis AN, Attardi LD (2011) Distinct p53 transcriptional programs dictate acute DNA-damage responses and tumor suppression. Cell 145(4):571–583
9. Zeng SX, Dai MS, Keller DM, Lu H (2002) SSRP1 functions as a co-activator of the tran-scriptional activator p63. EMBO J 21(20):5487–5497
10. Zhang Y, Liao JM, Zeng SX, Lu H (2011) p53 downregulates Down syndrome-associated DYRK1A through miR-1246. EMBO Rep 12(8):811–817
11. Jin Y, Zeng SX, Dai MS, Yang XJ, Lu H (2002) MDM2 inhibits PCAF (p300/CREB-binding protein-associated factor)-mediated p53 acety-lation. J Biol Chem 277(34):30838–30843
12. Bargonetti J, Friedman PN, Kern SE, Vogelstein B, Prives C (1991) Wild-type but not mutant p53 immunopuri fi ed proteins bind to sequences adjacent to the SV40 origin of replication. Cell 65(6):1083–1091
13. Kern SE, Kinzler KW, Bruskin A, Jarosz D, Friedman P, Prives C, Vogelstein B (1991) Identi fi cation of p53 as a sequence-speci fi c DNA-binding protein. Science 252(5013):1708–1711
210 J.-M. Liao and H. Lu
14. el-Deiry WS, Kern SE, Pietenpol JA, Kinzler KW, Vogelstein B (1992) De fi nition of a con-sensus binding site for p53. Nat Genet 1(1):45–49
15. Wei CL, Wu Q, Vega VB, Chiu KP, Ng P, Zhang T, Shahab A, Yong HC, Fu Y, Weng Z, Liu J, Zhao XD, Chew JL, Lee YL, Kuznetsov VA, Sung WK, Miller LD, Lim B, Liu ET, Yu Q, Ng HH, Ruan Y (2006) A global map of p53 transcription-factor binding sites in the human genome. Cell 124(1):207–219
16. Cawley S, Bekiranov S, Ng HH, Kapranov P, Sekinger EA, Kampa D, Piccolboni A, Sementchenko V, Cheng J, Williams AJ, Wheeler R, Wong B, Drenkow J, Yamanaka M, Patel S, Brubaker S, Tammana H, Helt G, Struhl K, Gingeras TR (2004) Unbiased map-ping of transcription factor binding sites along human chromosomes 21 and 22 points to widespread regulation of noncoding RNAs. Cell 116(4):499–509
17. Liu Y, Lagowski JP, Vanderbeek GE, Kulesz-Martin MF (2004) Facilitated search for speci fi c genomic targets by p53 C-terminal basic DNA binding domain. Cancer Biol Ther 3(11):1102–1108
18. Hainaut P, Hollstein M (2000) p53 and human cancer: the fi rst ten thousand mutations. Adv Cancer Res 77:81–137
19. el-Deiry WS, Tokino T, Velculescu VE, Levy DB, Parsons R, Trent JM, Lin D, Mercer WE, Kinzler KW, Vogelstein B (1993) WAF1, a potential mediator of p53 tumor suppression. Cell 75(4):817–825
20. Harper JW, Adami GR, Wei N, Keyomarsi K, Elledge SJ (1993) The p21 Cdk-interacting protein Cip1 is a potent inhibitor of G1 cyclin-dependent kinases. Cell 75(4):805–816
21. Barak Y, Juven T, Haffner R, Oren M (1993) mdm2 expression is induced by wild type p53 activity. EMBO J 12(2):461–468
22. Zauberman A, Barak Y, Ragimov N, Levy N, Oren M (1993) Sequence-speci fi c DNA bind-ing by p53: identi fi cation of target sites and lack of binding to p53 – MDM2 complexes. EMBO J 12(7):2799–2808
23. Wu X, Bayle JH, Olson D, Levine AJ (1993) The p53-mdm-2 autoregulatory feedback loop. Genes Dev 7(7A):1126–1132
24. Szak ST, Mays D, Pietenpol JA (2001) Kinetics of p53 binding to promoter sites in vivo. Mol Cell Biol 21(10):3375–3386
25. Kaeser MD, Iggo RD (2002) Chromatin immunoprecipitation analysis fails to support the latency model for regulation of p53 DNA binding activity in vivo. Proc Natl Acad Sci USA 99(1):95–100
26. Nelson JD, Denisenko O, Bomsztyk K (2006) Protocol for the fast chromatin immunopre-cipitation (ChIP) method. Nat Protoc 1(1):179–185
27. Hoh J, Jin S, Parrado T, Edington J, Levine AJ, Ott J (2002) The p53MH algorithm and its application in detecting p53-responsive genes. Proc Natl Acad Sci USA 99(13):8467–8472
211
Sumitra Deb and Swati Palit Deb (eds.), p53 Protocols, Methods in Molecular Biology, vol. 962,DOI 10.1007/978-1-62703-236-0_18, © Springer Science+Business Media New York 2013
Chapter 18
ChIP-on-chip to Identify Mutant p53 Targets
Frauke Goeman , Giulia Fontemaggi , and Giovanni Blandino
Abstract
Chromatin immunoprecipitation (ChIP) followed by microarray hybridization (on-chip) is a technique well suited for a comprehensive analysis of transcription factor binding sites, histone modi fi cation patterns, and nucleosome occupancy. It can be restricted to a subset of genes or regions but also expanded up to a genome-wide range yielding insight into the functional elements of gene regulatory networks. Mutant p53 proteins have lost their capacity to bind to its cognate binding sites, but it is well established that it has retained the ability to bind indirectly to DNA via other transcription factors and therefore change the expression of several target genes. The identi fi cation of those transcription factors and binding regions sheds light on how mutant p53 is able to exert oncogenic functions.
Key words: Mutant p53 , ChIP , ChIP-on-chip , Microarray , Binding sites , ChIP-chip , Chromatin , Target genes , Transcription factor , Transcriptional signature
“ChIP-on-chip” (also called ChIP-chip) is a technique that allows anyone to perform a large-scale identi fi cation of genomic regions occupied by DNA-binding proteins under physiologically relevant, in vivo conditions ( 1, 2 ) . This method combines the already well-established procedure of chromatin immunoprecipitation with DNA-microarrays (Fig. 1 ). The probes on the microarray can be designed in several ways, by using libraries of CpG islands, cloned PCR fragments of promoter regions or oligonucleotides which nowadays constitute the most frequently used probe set ( 3, 4 ) . The oligonucleotides can be spotted in house or bought by several companies that offer fi xed catalogue arrays but also the possibility to arrange custom-designed arrays, providing in addition, all the necessary software for the probe design. The fi rst crucial step in
1. Introduction

212 F. Goeman et al.
performing a successful ChIP-on-chip is to carry out an ef fi cient chromatin immunoprecipitation and therefore enrich the target regions of the transcription factor of interest. Consequently, a highly speci fi c antibody that is able to deliver a speci fi c enrichment of at least eight to tenfold over the background is essential. The initial immunoprecipitated DNA amount is very low and therefore has to be ampli fi ed to ensure enough material for the subsequent fl uorescent labeling and hybridization onto the microarray. The starting material before the ampli fi cation should be in a certain range, around 10 ng, to minimize the risk of an introduction of a bias during the ampli fi cation process. In this protocol the ampli fi cation is achieved via ligation-mediated PCR. The chroma-tin is blunted and then ligated to a unidirectional double-stranded oligonucleotide linker that permits the subsequent PCR ampli fi cation. The quality of the immunoprecipitated chromatin should be tested before and after the ampli fi cation process via PCR with known target regions to ensure a suf fi cient enrichment before
TF
TF
TF
TF
TF
mutp53
TF
mutp53
mutp53
TFmutp53
Cy3 labelinginput DNA
Cy5 labelingIP DNA
hybridize to microarray
Fig. 1. Schematic overview of the ChIP-on-chip procedure.
21318 ChIP-on-chip to Identify Mutant p53 Targets
and after the amplicon generation that should not change during the ampli fi cation. The actual enrichment is measured by compar-ing it to the input and a PCR using primers against regions that should not be enriched. The resulting DNA population is labeled by Cy5 and hybridized to the microarray. To determine the enrich-ment of the immunoprecipitated material, it has to be co-hybrid-ized with a reference DNA, which is the starting chromatin fraction (input) that should undergo the same treatments like the IP mate-rial and is labeled with Cy3. To exclude enrichments that are not due to the antibody used for the ChIP, we suggest to also include chromatin that was immunoprecipitated with either no antibody or with an IgG control and co-hybridize it with the input amplicon on a parallel array.
1. 250 mM PIPES [piperazine-N,N ¢ -bis(ethanesulfonic acid)]: Add 18.9 g of solid PIPES to 200 mL of ultrapure water. Adjust the pH with 1 M NaOH to pH 8 and make up to 250 mL with ultrapure water.
2. 1 M KCl: Solve 7.45 g of KCl in 70 mL of ultrapure water. After the salt has dissolved, make up to 100 mL with ultrapure water and fi lter it with a 0.2 m m cellulose acetate fi lter.
3. 10% SDS: Add 10 g SDS to 90 mL of ultrapure water. 4. 0.5 M EDTA pH8: Add 93.06 g disodium ethylenediaminetet-
raacetate (EDTA) to 450 mL ultrapure water. Adjust pH with 10 M NaOH which will render the EDTA solute. Finally, the EDTA solution has to be fi lled up with ultrapure water to 500 mL and autoclaved.
5. 1 M Tris–HCl pH 8: Weigh 60.57 g Tris [Tris (Hydroxymethyl) Aminomethane] into 450 mL of ultrapure water. Adjust the pH with HCl, make up to 500 mL with ultrapure water and fi lter through a 0.2 m M cellulose acetate fi lter.
6. 5 M NaCl: Weigh 5.75 g into fi nally 50 mL of ultrapure water. Filter the solution with a 0.2 m m cellulose acetate fi lter.
7. 1 M NaHCO 3 : Weigh 840 mg of NaHCO 3 and dissolve it into fi nally 10 mL of ultrapure water.
8. Lysis Buffer: 5 mM PIPES, 85 mM KCl, and 0.5% NP-40 sub-stitute. Add 1 mL of the 250 mM PIPES and 4.25 mL of the 1 M KCl stock solution together with 0.25 mL of NP-40 substi-tute, fi ll it up with ultrapure water up to 50 mL. Store at 4°C.
9. Sonication buffer: 1% SDS, 10 mM EDTA, and 50 mM Tris–HCl pH 8. Mix 5 mL of 10% SDS solution with 1 mL of 0.5 M
2. Materials

214 F. Goeman et al.
EDTA pH 8, 2.5 mL 1 M Tris–HCl pH 8, and 41.5 mL of ultrapure water. Store at room temperature to avoid a precipi-tation of the SDS under low temperatures.
10. Dilution buffer: 0.01% SDS, 1.2 mM EDTA pH 8, 16.7 mM Tris–HCL pH 8, 1.1% Triton-X100, and 167 mM NaCl. Add 0.05 mL of 10% SDS, 120 m L of 0.5 M EDTA pH 8, 0.835 mL of 1 M Tris–HCl pH 8, 5.5 mL of Triton-X100, and 1.67 mL of 5 M NaCl solution to 41.83 mL ultrapure water.
11. Elution buffer: 100 mM NaHCO 3 and 1% SDS. Add 1 mL of 10% SDS solution and 1 mL of 1 M NaHCO 3 to 8 mL of ultra-pure water. The buffer has to be prepared fresh and used within 2 weeks!
12. Wash buffer A: 0.1% SDS, 2 mM EDTA pH 8, 20 mM Tris-HCl pH 8, 1% Triton X-100, and 150 mM NaCl. Add 2.5 mL of 10% SDS, 1 mL of 0.5 M EDTA pH 8, 5 mL of 1 M Tris–HCl pH 8, 2.5 mL of Triton X-100, and 7.5 mL of 5 M NaCl stock solu-tion to 231.5 mL of ultrapure water ( fi nal volume 250 mL).
13. Wash Buffer B: 0.1% SDS, 2 mM EDTA pH 8, 20 mM Tris–HCl pH 8, 1% Triton-X-100, and 500 mM NaCl. Add 2.5 mL of 10% SDS solution, 1 mL of 0.5 M EDTA pH 8, 5 mL of 1 M Tris–HCl pH 8 solution, 2.5 mL of Triton-X-100, and 25 mL of the 5 M NaCl stock to 214 mL of ultrapure water ( fi nal volume 250 mL).
14. Wash Buffer TE: 10 mM Tris–HCl pH 8, 1 mM EDTA pH 8. Dilute 0.5 mL of 1 M Tris–HCl pH 8, and 0.1 mL of 0.5 M EDTA pH 8 into fi nally 50 mL of ultrapure water.
15. BSA (100 m g/ m L) solution: Weigh 1 g of BSA fraction V into fi nally 10 mL of ultrapure water. Then, fi lter the solution with a 0.2 m m cellulose acetate fi lter.
16. 0.125 M Glycine solution: Weigh 1.88 g glycine into 200 mL of PBS buffer. For cells in suspension: Prepare a 10× concen-trated glycine solution by weighing 4.7 g glycine into fi nally 50 mL 1× PBS.
17. 100 mM PMSF: Weigh 174.2 mg and dissolve it into 10 mL of isopropanol.
18. p53 speci fi c antibody: sheep polyclonal Ab-7 (Calbiochem/Merck).
19. PBS/BSA wash buffer: 1× PBS plus 5 mg/mL BSA. Weigh 250 mg of BSA fraction V into 50 mL of 1× PBS. Filter with 0.2 m m cellulose acetate fi lters.
20. Magnetic beads: Use Dynabeads ® Protein G for Immunoprecipitation (Invitrogen).
21. 1 M Tris–HCl pH 6.5: Weigh 60.57 g Tris [Tris (Hydroxymethyl) Aminomethane] into 450 mL of ultrapure water. Adjust the pH with HCl to pH 6.5. Make up to 500 mL with ultrapure water and fi lter through a 0.2 m M cellulose acetate fi lter.
21518 ChIP-on-chip to Identify Mutant p53 Targets
22. 3 M NaAc pH 5.2: Weigh 61.52 g of sodium acetate into 220 mL of ultrapure water and adjust the pH with glacial acid to pH 5.2. Fill it up to 250 mL with ultrapure water and fi lter through a 0.2 m m cellulose acetate fi lter.
23. 70% ethanol: Combine 70 mL of ethanol with 30 mL of ultra-pure water.
24. Primers used for qPCR: ID4-C-F: GGCGCACGGCTCTATAAATAC ID4-C-R: CAAAAGCACCGGAAGAAAAGTA HIST1H2BA_F: ACTCTCCTTACGGGTCCTCTTG HIST1H2BA_R: AGTGCTGTGTAACCCTGGAAAA.
25. PicoGreen ® or Qubit dsDNA HS Assay (Invitrogen). 26. 0.1 M NaHCO 3 : Weigh 840 mg of NaHCO 3 and dissolve it in
100 mL of ultrapure water. 27. 0.1 M Na 2 CO 3 : Weigh 1.06 g of anhydrous Na 2 CO 3 and dis-
solve it in fi nally 100 mL of ultrapure water. The solution must always be prepared fresh .
28. 0.1 M NaHCO 3 solution pH 9: Always prepare it fresh . Adjust the pH by mixing the 0.1 M NaHCO 3 solution with the 0.1 M Na 2 CO 3 solution until it reaches pH 9.
29. Cyanine dyes: Amersham CyDye Post-Labeling Reactive Dye Packs (GE Healthcare).
30. High concentrated Klenow: BioPrime ® DNA Labeling System (Invitrogen).
31. Hybridization buffer: 2×SDS based hybridization buffer (Genisphere).
32. Human Cot-1 DNA (Invitrogen) 33. 1× SSC with 1% SDS: Dilute 10 mL of a 20× SSC stock solu-
tion and 20 mL of 10% SDS with 170 mL of ultrapure water. 34. 0.2× SSC: Mix 1 mL of 20× SSC with 99 mL of ultrapure
water. 35. NanoDrop ® spectrophotometer. 36. Microarray scanner.
The ChIP-on-chip assay begins with a chromatin immunoprecipita-tion similar to the one described in Chapter 17 . Two important changes have to be considered: In order to obtain the immunopre-cipitated chromatin amount of around 10 ng, we usually start with a higher quantity of cells/chromatin for the IP and with a higher
3. Methods
3.1. Chromatin Immunoprecipitation
216 F. Goeman et al.
amount of m g antibodies compared to the classical ChIP. The second important step is to use protein G Dynabeads ® instead of agarose beads. These kinds of beads tend to have a lower unspeci fi c binding and do not need to be blocked with salmon sperm DNA, which should be avoided using for instance commercially available oligo-nucleotide microarrays. For one immunoprecipitation use 1 × 10 7 cells (ca. 80 m g chromatin) employing 7 m L of the p53 speci fi c Ab-7 anti-body. Perform in parallel an immunoprecipitation with no antibody or IgG as negative control.
1. To freeze the transcription factors that are bound in certain regions on the DNA, add 1% of formaldehyde ( fi nal concentra-tion) to the live cells. The formaldehyde generates protein–pro-tein and protein–DNA cross-links in this way fi xing the proteins in proximity to the DNA. The formaldehyde should be incu-bated EXACTLY 10 min at room temperature (22–24°C) under a hood (see Note 1).
2. To terminate the cross-linking, the adherent cells should be washed quickly with cold 1× PBS and then incubated at room temperature for 5 min with 1× PBS supplemented with 0.125 M glycine. The glycine quenches the formaldehyde and therefore stops the cross-linking (if you use cells in suspension you can add glycine directly to a fi nal concentration of 0.125 mM after the cross-linking. In this case, prepare a 10× concentrated solu-tion and add 1/10 of the overall volume to the cells).
3. After the 5 min incubation period, rinse the cells again with cold 1× PBS and collect them into a 50 mL Falcon by scraping. Centrifuge the cells for 5 min at 1,000 rpm, 4°C, remove the supernatant, and wash the cell pellet with cold 10 mL 1× PBS supplemented with 0.5 mM PMSF. Centrifuge again at 1,000 rpm and remove the supernatant. The resultant cross-linked cell pellet is ready for storing at −80°C or immediate cell lysis.
The cells are lysed by adding 5 cell pellet volumes of a hypotonic buffer, the cell lysis buffer, and incubation for 30 min on ice (see Note 2). Transfer the solution into a 1.5 mL microfuge tube and isolate the nuclei of the cells by rigorously pipetting up and down the solution at the end of the incubation time and subsequent cen-trifugation at 3,000 rpm in a table centrifuge. The nuclei of 2 × 10 7 cells (for one p53 IP and one IgG IP) are resuspended in 250 m L of sonication buffer, supplemented with protease inhibitors.
Sonicate the lysate to shear the DNA to a size range of 100–600 bp (after reverse cross-linking). The sonication power and time will depend on your type of sonicator and cell type, which has to be deter-mined empirically (see Note 3). Control 1 m L of the cross-linked chromatin over the time-course of sonication on a 0.8% agarose gel
3.1.1. Cross-linking and Cell Harvesting
3.1.2. Cell Lysis and Nuclei Isolation
3.1.3. Sonication
21718 ChIP-on-chip to Identify Mutant p53 Targets
that should run like shown in Fig. 2a . Centrifuge the lysate for 20 s at 14,000 rpm in a table centrifuge to pellet the cell debris and trans-fer the supernatant into a new 1.5 mL microfuge tube (see Note 4). The lysate can be frozen at −80°C.
1. To quantify the chromatin and to control its actual size after reverse cross-linking, remove 8 m L of the nuclei lysate. Fill up the volume by adding 192 m L dilution buffer and 0.5 m L RNase A (20 m g/ m L) plus 8 m L of the 5 M NaCl solution (200 m M fi nal NaCl concentration) and reverse the cross-link-ing by incubating the samples for 5 h or overnight at 65°C in a thermo mixer with shaking (see Note 5).
2. Afterwards, add 4.2 m L of 5 M EDTA pH 8, 8.4 m L of 1 M Tris–HCl pH 6.5, and 1 m L of proteinase K (20 m g/ m L) and incubate the samples for 2 h at 42°C (see Note 6). The fi nal concentration of EDTA and Tris–HCl pH 6.5 are therefore, 10 mM and 40 mM, respectively.
3. The DNA is recovered by phenol–chloroform puri fi cation and ethanol precipitation. Therefore, 200 m L of phenol–chloro-form–isoamyl alcohol is added and vigorously mixed for 30 s.
4. A centrifugation step at 11,000 rpm in a table centrifuge at room temperature separates the DNA that remains in the aque-ous phase from the proteins that are in the organic phase and interphase (see Note 7 ).
3.1.4. DNA Concentration Determination
Ma bchro
mat
in
water
cont
rol a
mpli
con
IP a
mpli
con
input
am
plico
n
1,6502,000
M
1,650
1000
2,000
(bp)
(bp)
500
1000
650500650
100
200300400
Fig. 2. ( a ) Size distribution of the sonicated chromatin before reverse cross-linking; M marker. The length of the DNA marker fragments is indicated. ( b ) Size distribution of the immunoprecipitated DNA after Ligation mediated PCR (LM-PCR).
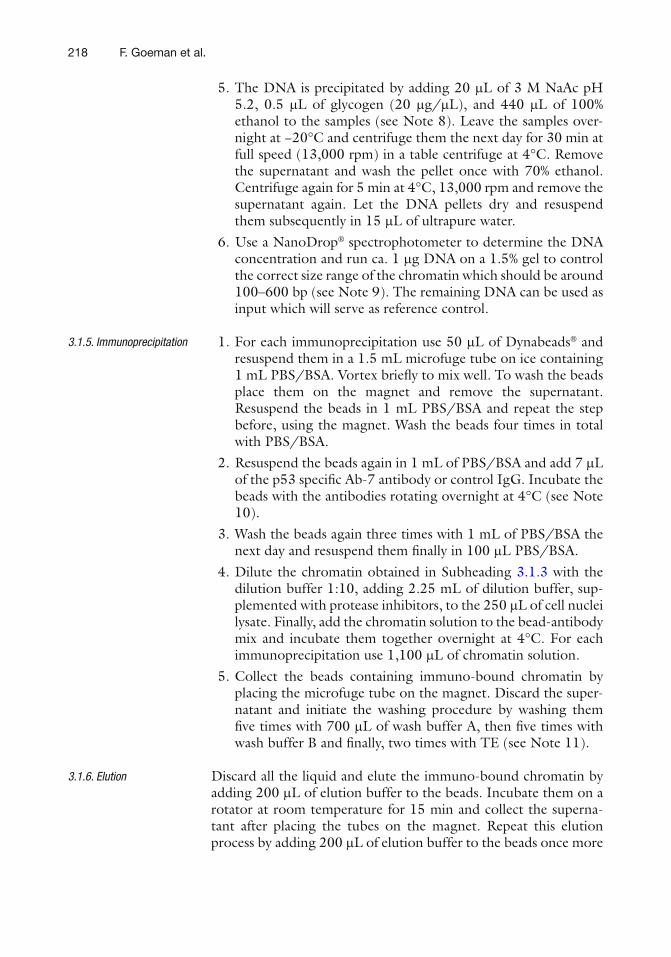
218 F. Goeman et al.
5. The DNA is precipitated by adding 20 m L of 3 M NaAc pH 5.2, 0.5 m L of glycogen (20 m g/ m L), and 440 m L of 100% ethanol to the samples (see Note 8). Leave the samples over-night at −20°C and centrifuge them the next day for 30 min at full speed (13,000 rpm) in a table centrifuge at 4°C. Remove the supernatant and wash the pellet once with 70% ethanol. Centrifuge again for 5 min at 4°C, 13,000 rpm and remove the supernatant again. Let the DNA pellets dry and resuspend them subsequently in 15 m L of ultrapure water.
6. Use a NanoDrop ® spectrophotometer to determine the DNA concentration and run ca. 1 m g DNA on a 1.5% gel to control the correct size range of the chromatin which should be around 100–600 bp (see Note 9). The remaining DNA can be used as input which will serve as reference control.
1. For each immunoprecipitation use 50 m L of Dynabeads ® and resuspend them in a 1.5 mL microfuge tube on ice containing 1 mL PBS/BSA. Vortex brie fl y to mix well. To wash the beads place them on the magnet and remove the supernatant. Resuspend the beads in 1 mL PBS/BSA and repeat the step before, using the magnet. Wash the beads four times in total with PBS/BSA.
2. Resuspend the beads again in 1 mL of PBS/BSA and add 7 m L of the p53 speci fi c Ab-7 antibody or control IgG. Incubate the beads with the antibodies rotating overnight at 4°C (see Note 10).
3. Wash the beads again three times with 1 mL of PBS/BSA the next day and resuspend them fi nally in 100 m L PBS/BSA.
4. Dilute the chromatin obtained in Subheading 3.1.3 with the dilution buffer 1:10, adding 2.25 mL of dilution buffer, sup-plemented with protease inhibitors, to the 250 m L of cell nuclei lysate. Finally, add the chromatin solution to the bead-antibody mix and incubate them together overnight at 4°C. For each immunoprecipitation use 1,100 m L of chromatin solution.
5. Collect the beads containing immuno-bound chromatin by placing the microfuge tube on the magnet. Discard the super-natant and initiate the washing procedure by washing them fi ve times with 700 m L of wash buffer A, then fi ve times with wash buffer B and fi nally, two times with TE (see Note 11).
Discard all the liquid and elute the immuno-bound chromatin by adding 200 m L of elution buffer to the beads. Incubate them on a rotator at room temperature for 15 min and collect the superna-tant after placing the tubes on the magnet. Repeat this elution process by adding 200 m L of elution buffer to the beads once more
3.1.5. Immunoprecipitation
3.1.6. Elution

21918 ChIP-on-chip to Identify Mutant p53 Targets
and incubate them for 15 min rotating at room temperature. Collect the supernatant by placing the samples on a magnet and combine it with the fi rst eluate.
1. To reverse the cross-links, add 16 m L 5 M NaCl ( fi nal concen-tration 200 mM) and 0.5 m L RNase A (20 m g/ m L) and incu-bate them with continuous shaking for at least 5 h or overnight at 65°C.
2. Afterwards, add 8.33 m L 0.5 M EDTA pH 8, 16.66 m L 1 M Tris–HCL pH 6.5, and 1 m L proteinase K (20 m g/ m L) to the samples and incubate them for 2 h at 42°C.
3. Next, add 440 m L phenol–chloroform–isoamyl alcohol to the samples, mix rigorously for 30 s and divide the two phases by centrifugation at room temperature for 10 min at 11,000 rpm.
4. Collect the upper aqueous phase that contains the DNA and place it into a new microfuge tube (see Note 7). Add 44 m L 3 M NaAc pH 6.5, 0.5 m L glycogen (20 m g/ m L), and 880 m L ethanol to precipitate the DNA. Leave the samples overnight at −20°C and centrifuge them the following day for 30 min at 13,000 rpm, 4°C (see Note 12). Remove the supernatant, add 700 m L of 70% ethanol and centrifuge the samples again for 5 min. Remove the supernatant and allow the samples to dry (see Note 13). Resuspend the samples in 50 m L of ultrapure water.
It is crucial to control the quality and the quantity of the immuno-precipitated DNA. The quantity is determined by employing PicoGreen ® or the Qubit dsDNA HS Assay. We immunoprecipi-tated approximately 2–3 ng per single ChIP. Instead, the quality is controlled by PCR or qPCR using primers for targets that should be enriched but also primers for regions that should not be enriched to estimate the fold enrichment over the background. Use 2 m L of each ChIPed DNA and 10 and 25 ng of input. If you carry out a qPCR, prepare a standard curve by serial dilutions of your input. Your ChIP should display an eight to tenfold enrichment and con-tain 10 ng of immunoprecipitated chromatin to go on with the on-chip part. If necessary, pool several ChIPs. For mutant p53 we used the ID4 promoter as a positive and the HIST1H2BA promoter as a negative control in SKBr3 and MDA-MB-231 cells ( 5 ) (Fig. 3 ).
To obtain suf fi cient material for microarray hybridization the immunoprecipitated DNA has to be ampli fi ed, which is usually done by ligating a unidirectional linker to the DNA followed by PCR ampli fi cation. Sonication generates overhanging ends. Therefore, to allow an ef fi cient ligation of the linker the chromatin has to be blunted fi rst.
3.1.7. Reverse Cross-links and DNA Puri fi cation
3.1.8. Quality Control of ChIP Material
3.2. Ampli fi cation of the Immunopreci-pitated Chromatin
220 F. Goeman et al.
The end-repair of the DNA is accomplished by T4 DNA polymerase, mixing 1 m L of the enzyme (5 U/ m L) with 0.5 m L BSA (10 mg/mL), 1.6 m L dNTPs (20 mM total), 10 ng of input or pooled ChIP samples (mutant p53 IP or IgG IP), and 22 m L T4 DNA poly-merase buffer (5×), fi lled up until 110 m L with ultrapure water. Let the samples incubate in a thermo mixer for 1 h at 37°C (see Note 14). Purify the DNA with QIAquick PCR puri fi cation columns following the manufacturer’s instructions and elute in 30 m L elution buffer (EB).
The oligonucleotides JW102 (5 ¢ gcggtgacccgggagatctgaattc 3 ¢ ) and JW103 (5 ¢ gaattcagatc 3 ¢ ) ( 2 ) have to be annealed by combin-ing 6.7 m L of each oligonucleotide (100 m M) with 86.6 m L ultra-pure water and boiling them for 5 min in a water bath. It is important to let them cool down very slowly within the water bath until they reach room temperature. The linkers can be stored in fi nitely at −20°C. Thawing should be done slowly on ice.
To ensure ef fi cient ligation, use a high concentrated T4 DNA ligase (400 U/ m L). Combine 10.3 m L of ultrapure water with 5 m L ligase buffer (10×), 6.7 m L linker, 27 m L blunted chromatin and 1 m L of the T4 DNA ligase. Let the samples incubate overnight at 16°C. Purify them again with QIAquick PCR puri fi cation columns fol-lowing the manufacturer’s instructions and elute them in 30 m L of elution buffer (EB).
3.2.1. Blunting of the Immunoprecipitated DNA
3.2.2. Annealing of the Primers to Form the Unidirectional Linker
3.2.3. Ligation of the Linkers
IgG
2
4
6
8
10
12
14
p53 Ab-7
ID4/
H1
norm
aliz
ed o
n in
put
SKBr3
Fig. 3. Quality control for the mutant p53 chromatin immunoprecipitation. The ChIP was performed on cross-linked extracts from proliferating SKBr3 cells using either the p53 speci fi c antibody Ab-7 or IgG as control. The ef fi ciency of the ChIP was analyzed by qPCR. The fold enrichment was calculated by comparing the quantity between the positive con-trol promoter ID4 to the negative control promoter of HIST1H2BA (H1), normalized to the input.
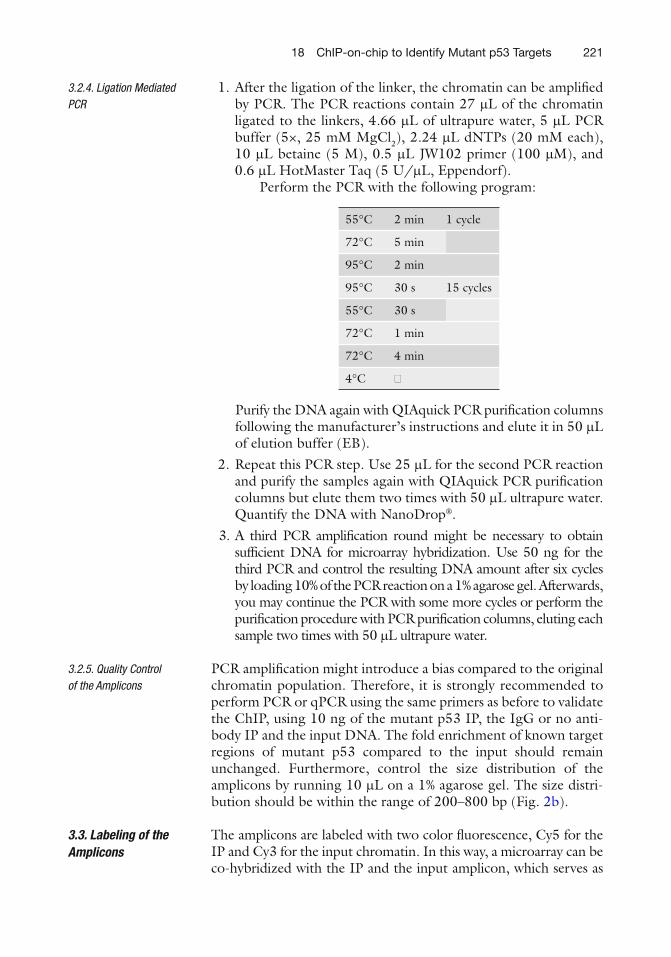
22118 ChIP-on-chip to Identify Mutant p53 Targets
1. After the ligation of the linker, the chromatin can be ampli fi ed by PCR. The PCR reactions contain 27 m L of the chromatin ligated to the linkers, 4.66 m L of ultrapure water, 5 m L PCR buffer (5×, 25 mM MgCl 2 ), 2.24 m L dNTPs (20 mM each), 10 m L betaine (5 M), 0.5 m L JW102 primer (100 m M), and 0.6 m L HotMaster Taq (5 U/ m L, Eppendorf).
Perform the PCR with the following program:
55°C 2 min 1 cycle
72°C 5 min
95°C 2 min
95°C 30 s 15 cycles
55°C 30 s
72°C 1 min
72°C 4 min
4°C �
Purify the DNA again with QIAquick PCR puri fi cation columns following the manufacturer’s instructions and elute it in 50 m L of elution buffer (EB).
2. Repeat this PCR step. Use 25 m L for the second PCR reaction and purify the samples again with QIAquick PCR puri fi cation columns but elute them two times with 50 m L ultrapure water. Quantify the DNA with NanoDrop ® .
3. A third PCR ampli fi cation round might be necessary to obtain suf fi cient DNA for microarray hybridization. Use 50 ng for the third PCR and control the resulting DNA amount after six cycles by loading 10% of the PCR reaction on a 1% agarose gel. Afterwards, you may continue the PCR with some more cycles or perform the puri fi cation procedure with PCR puri fi cation columns, eluting each sample two times with 50 m L ultrapure water.
PCR ampli fi cation might introduce a bias compared to the original chromatin population. Therefore, it is strongly recommended to perform PCR or qPCR using the same primers as before to validate the ChIP, using 10 ng of the mutant p53 IP, the IgG or no anti-body IP and the input DNA. The fold enrichment of known target regions of mutant p53 compared to the input should remain unchanged. Furthermore, control the size distribution of the amplicons by running 10 m L on a 1% agarose gel. The size distri-bution should be within the range of 200–800 bp (Fig. 2b ).
The amplicons are labeled with two color fl uorescence, Cy5 for the IP and Cy3 for the input chromatin. In this way, a microarray can be co-hybridized with the IP and the input amplicon, which serves as
3.2.4. Ligation Mediated PCR
3.2.5. Quality Control of the Amplicons
3.3. Labeling of the Amplicons
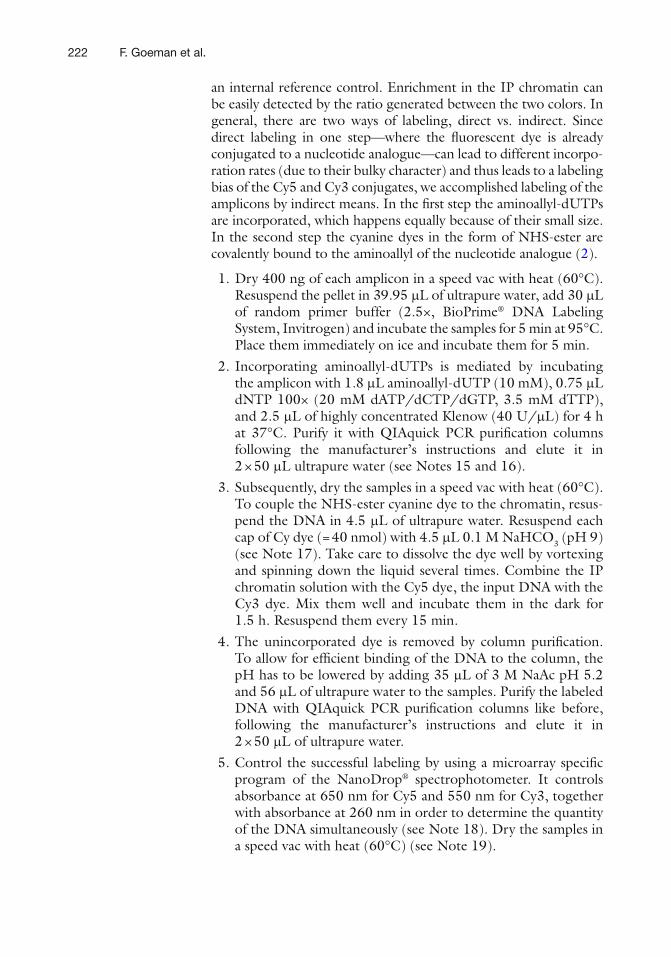
222 F. Goeman et al.
an internal reference control. Enrichment in the IP chromatin can be easily detected by the ratio generated between the two colors. In general, there are two ways of labeling, direct vs. indirect. Since direct labeling in one step—where the fl uorescent dye is already conjugated to a nucleotide analogue—can lead to different incorpo-ration rates (due to their bulky character) and thus leads to a labeling bias of the Cy5 and Cy3 conjugates, we accomplished labeling of the amplicons by indirect means. In the fi rst step the aminoallyl-dUTPs are incorporated, which happens equally because of their small size. In the second step the cyanine dyes in the form of NHS-ester are covalently bound to the aminoallyl of the nucleotide analogue ( 2 ) .
1. Dry 400 ng of each amplicon in a speed vac with heat (60°C). Resuspend the pellet in 39.95 m L of ultrapure water, add 30 m L of random primer buffer (2.5×, BioPrime ® DNA Labeling System, Invitrogen) and incubate the samples for 5 min at 95°C. Place them immediately on ice and incubate them for 5 min.
2. Incorporating aminoallyl-dUTPs is mediated by incubating the amplicon with 1.8 m L aminoallyl-dUTP (10 mM), 0.75 m L dNTP 100× (20 mM dATP/dCTP/dGTP, 3.5 mM dTTP), and 2.5 m L of highly concentrated Klenow (40 U/ m L) for 4 h at 37°C. Purify it with QIAquick PCR puri fi cation columns following the manufacturer’s instructions and elute it in 2 × 50 m L ultrapure water (see Notes 15 and 16).
3. Subsequently, dry the samples in a speed vac with heat (60°C). To couple the NHS-ester cyanine dye to the chromatin, resus-pend the DNA in 4.5 m L of ultrapure water. Resuspend each cap of Cy dye (= 40 nmol) with 4.5 m L 0.1 M NaHCO 3 (pH 9) (see Note 17). Take care to dissolve the dye well by vortexing and spinning down the liquid several times. Combine the IP chromatin solution with the Cy5 dye, the input DNA with the Cy3 dye. Mix them well and incubate them in the dark for 1.5 h. Resuspend them every 15 min.
4. The unincorporated dye is removed by column puri fi cation. To allow for ef fi cient binding of the DNA to the column, the pH has to be lowered by adding 35 m L of 3 M NaAc pH 5.2 and 56 m L of ultrapure water to the samples. Purify the labeled DNA with QIAquick PCR puri fi cation columns like before, following the manufacturer’s instructions and elute it in 2 × 50 m L of ultrapure water.
5. Control the successful labeling by using a microarray speci fi c program of the NanoDrop ® spectrophotometer. It controls absorbance at 650 nm for Cy5 and 550 nm for Cy3, together with absorbance at 260 nm in order to determine the quantity of the DNA simultaneously (see Note 18). Dry the samples in a speed vac with heat (60°C) (see Note 19).

22318 ChIP-on-chip to Identify Mutant p53 Targets
The total amount of DNA that should be hybridized onto the array depends on the kind and size of the array. Nowadays, there are dif-ferent formats commercially available, which allow hybridizing various samples also on one slide depending on the number of probes requested, etc. For one entire slide, we recommend to use between 1 and 5 m g of labeled DNA each, IP and input that will be co-hybridized on one slide. You might want to use one additional array to hybridize the IgG or no antibody control together with the input amplicon. In this way, unspeci fi c enrichments that were not due to the p53 antibody can be excluded.
1. Dissolve the desired amount of DNA (which should be equal for IP and input) in 105 m L of ultrapure water. Next, combine the Cy5 and Cy3 labeled DNA, each one dissolved in 105 m L ultrapure water, add 50 m L Cot-1 DNA (1 mg/mL) and fi nally, add 260 m L of the hybridization buffer (Genisphere, 2×SDS based, C600V600 S25) (see Note 20). The mixture is denatured at 95°C for 5 min and then immediately trans-ferred to a thermo mixer at 37°C and incubated for 30 min (see Note 21).
2. Spin at 13,000 rpm at room temperature for 1 min. If you use the Agilent SureHyb system dispense 490 m L of the hybridiza-tion mix onto the gasket slides, which should already be loaded into the Agilent SureHyb chamber base, and carefully place the microarray slide on top. Close the chamber and incubate the slides rotating in an oven at 60°C for 24 h.
The washing procedure includes several buffers, differing in SSC and SDS composition. Use glass dishes, slide racks, and magnetic stir plates. Let the buffers swirl during the incubation of the slides by using a little magnetic stir bar.
1. Remove the gasket slides carefully in 1× SSC 0.1% SDS, pre-heated to 50°C. Place the microarray slide into a glass rack that already resides in a new glass dish, fi lled up with 1× SSC 0.1% SDS, preheated to 50°C (see Note 22) and incubate it for 5 min with a magnetic stir bar by swirling (medium speed).
2. Next, transfer the slides with the glass rack into a new glass dish containing 1× SSC, 0.1% SDS and let them incubate with magnetic stirring at room temperature for 5 min.
3. The last wash is performed by using 0.2× SSC for 5 min at room temperature. The last buffer will remove any residual SDS that could otherwise create a huge background. The microarrays are dried by spinning them in a 50 mL Falcon tube for 5 min at 600 rpm and immediately scanned in a microarray scanner.
3.4. Hybridization of the Array
3.5. Washing of the DNA Microarray
224 F. Goeman et al.
1. In this step it is very important to follow exactly the 10 min incubation to avoid cross-linking that is too strong or too low. Exceeding the 10 min could result in excessive cross-linking, which reduces antigen accessibility and sonication ef fi ciency. Too low cross-linking instead does not allow ef fi cient freez-ing/cross-linking of the transcription factors on the DNA.
2. Henceforth, keep the samples on ice and always add protease inhibitors (for instance protease inhibitor cocktail from Roche).
3. It is essential to keep the samples during the sonication on ice and strictly prevent the samples from warming. Avoid foaming of the samples.
4. In this step it is important that the samples are not kept cold for a very short moment in order to avoid the SDS from pre-cipitating. Centrifuge shortly at room temperature. The pellet should be very small, otherwise it is an indication that SDS precipitated.
5. The RNA will be ef fi ciently removed by the RNase treatment. This step is also strongly advised for a classical ChIP, if you use a column (PCR puri fi cation kit) for the subsequent DNA puri fi cation because the RNA can dramatically reduce the DNA yield as the column becomes saturated.
6. Proteinase K has broad substrate speci fi city and therefore, digests and removes proteins from DNA. Furthermore, it eliminates nucleases from the puri fi ed DNA which prevents degradation.
7. It is critical not to carry over any phenol which would precipi-tate later on together with the DNA and hinder subsequent enzymatic reactions. One could either use a PCR puri fi cation kit instead of the phenol–chloroform–ethanol precipitation step or a Phase Lock ® gel tube (Eppendorf) that separates reliably the aqueous phase from the organic phase without any carryover.
8. Glycogen is an inert carrier, which signi fi cantly increases the recovery of nucleic acids by alcohol precipitation. It is espe-cially useful for precipitating low amounts of DNA like in the samples of the fi nal chromatin IP.
9. The DNA determination is especially important to control the total DNA amount used for each immunoprecipitation, if you wish to compare DNA-binding events under different treat-ments that may have in fl uenced the cell growth and therefore, the cell number cross-linked.
10. Dynabeads ® have the big advantage to bind less DNA in an unspeci fi c manner compared to agarose beads. Furthermore,
4. Notes

22518 ChIP-on-chip to Identify Mutant p53 Targets
salmon sperm DNA for blocking is not necessary which can create a background in several kinds of oligonucleotide based arrays. Please note that the antibody af fi nity of these beads is lower and requires an overnight incubation with the antibody for ef fi cient binding.
11. When you remove the unbound chromatin make sure to use fi lter tips and to eliminate the waste to prevent any contamina-tion of the samples later on. Take care not to contaminate your gloves with chromatin.
12. The DNA pellet should be visible but not too big or fuzzy. If the pellet is huge or fuzzy it is an indication that your sample contains phenol precipitates which will disturb subsequent enzymatic reactions. If you use PhaseLock ® gel tubes you can be sure that you will never carry over any phenol traces.
13. The ethanol must be completely removed to avoid any distur-bance of subsequent enzymatic reactions.
14. You might perform all the following steps with one additional sample using only water instead of DNA as a control.
15. Avoid using elution buffer because the amine groups of the Tris can react with the monofunctional NHS-ester of the cya-nine dyes.
16. Control the quantity of the puri fi ed DNA with the NanoDrop ® . The amount should have been increased signi fi cantly (at least three to eightfold).
17. The cyanine dyes are light sensitive. Perform all steps under minimal light exposure.
18. The minimum amount of incorporated dye should be 100 picomol.
19. At this point, you could store the samples at −20°C in the dark overnight. The cyanine dyes are sensitive to light but also to air humidity, therefore, it is important to store them dry if necessary.
20. The amount of hybridization buffer depends on the hybridiza-tion chamber used. We recommend employing the gasket slides, SureHyb hybridization chambers and oven from Agilent that ensure a good and even hybridization. The most impor-tant thing to remember is that the slides should never become dry during the hybridization process which would otherwise result in a huge background due to precipitated SDS.
21. This step allows the Cot-1 DNA to hybridize with the repeti-tive DNA sequences to reduce the background in the subse-quent microarray hybridization.
22. Do not allow the slide to dry during the washing steps! Scan the slides immediately at the end of the washing procedure. Cy5, especially, degrades rapidly if exposed to ozone.
226 F. Goeman et al.
Acknowledgments
We greatly appreciate the support given by AIRC-ROC. We also thank Tania Merlino for proofreading the manuscript.
References
1. Boyd KE, Wells J, Gutman J et al (1998) c-Myc target gene speci fi city is determined by a post-DNAbinding mechanism. Proc Natl Acad Sci USA 95:13887–13892
2. Oberley MJ, Tsao J, Yau P et al (2004) High-throughput screening of chromatin immuno-precipitates using CpG-island microarrays. Methods Enzymol 376:315–334
3. Dell’Orso S, Fontemaggi G, Stambolsky P et al (2011) ChIP-on-chip analysis of in vivo mutant p53 binding to selected gene promoters. OMICS 15:305–312
4. Stambolsky P, Tabach Y, Fontemaggi G et al (2010) Modulation of the vitamin D3 response by cancer-associated mutant p53. Cancer Cell 17:273–285
5. Fontemaggi G, Dell’Orso S, Trisciuoglio D et al (2009) The execution of the transcrip-tional axis mutant p53, E2F1 and ID4 pro-motes tumor neo-angiogenesis. Nat Struct Mol Biol 16:1086–1093
227
Sumitra Deb and Swati Palit Deb (eds.), p53 Protocols, Methods in Molecular Biology, vol. 962,DOI 10.1007/978-1-62703-236-0_19, © Springer Science+Business Media New York 2013
Chapter 19
ChIP Sequencing to Identify p53 Targets
Catherine Vaughan , Brad Windle , and Sumitra Deb
Abstract
Mutant p53 may activate target genes through the interaction of transcription factors or through histone modi fi cations. Chromatin immunoprecipitation (ChIP) is a method commonly used to study these types of protein interactions. In order to generate a list of target genes that may be activated through this mecha-nism, ChIP sequencing may be used. ChIP sequencing involves the mass parallel sequencing of ChIP DNA fragments. We describe a method by which to prepare chromatin immunoprecipitation sequencing libraries and how to analyze sequencing data. In this procedure, prepared libraries have been sent to a core facility. The results have been veri fi ed using quantitative PCR.
Key words: p53 , Chromatin immunoprecipitation , ChIP sequencing , Histone modi fi cation
Mutant p53 targeted gene transcription may be accomplished in a variety of ways. The promoter region of genes contains regulatory elements which bring an RNA polymerase to the promoter and starts the process of transcription. Histone modi fi cations may occur which unwind the chromatin and make it accessible for transcription. In order to study how genes become activated in the presence of mutant p53, chromatin immunoprecipitation, or ChIP, can be used.
Cross-linked ChIP, the method used here, was fi rst developed in the 1980s by Varshavsky’s group and is continuing to be updated ( 1, 2 ) . ChIP is a useful tool in understanding the relationship between proteins and genomic DNA, and can be used with a wide variety of antibodies. ChIP DNA can now be sequenced to deter-mine the exact location within the genome of where a particular protein binds ( 3 ) . Used on cells expressing mutant p53, and using
1. Introduction

228 C. Vaughan et al.
antibodies against different transcription factors or histones, a pro fi le of potential target genes may be derived ( 4 ) .
In the basic ChIP procedure, chromatin-associated proteins are cross-linked to the DNA using formaldehyde. The genomic DNA is then sheared, the proteins are released from the DNA and digested, and the DNA puri fi ed. ChIP sequencing then utilizes that DNA for large scale parallel sequencing to the genome. The DNA libraries are prepared by blunt-ending the DNA fragments generated by ChIP and attaching an “A” base to the 3 ¢ ends. Adapter sequences are then ligated to the DNA and ampli fi ed using polymerase chain reaction (PCR) ( 5 ) . The analysis is performed by aligning sequenc-ing reads to the genome. Once the sequencing of these libraries is analyzed, quantitative PCR is performed to validate the data.
1. H1299 cells. 2. Trypan blue. 3. Hemocytometer. 4. 10 cm cell culture dishes. 5. 37% Formaldehyde. 6. 1 M Glycine. 7. 1× PBS. 8. Lysis Buffer: 150 mM NaCl, 25 mM Tris–HCl pH 7.5, 5 mM
EDTA pH 8.0, 1% Triton X-100, 0.1% SDS, and 0.5% NaDoc.
9. Protease Inhibitor Cocktail mix. 10. 1 mL syringes. 11. 27 G1/2 needles. 12. 5 mL snap-cap tubes. 13. Misonix Sonicator. 14. Refrigerated centrifuge. 15. RIPA Buffer: 150 mM NaCl, 50 mM Tris–HCl, pH 8.0, 0.1%
SDS, 0.5% NaDoc, and 1% NP-40. 16. High Salt Buffer: 500 mM NaCl, 50 mM Tris–HCl pH 8.0,
0.1% SDS, and 1% NP-40. 17. LiCl Buffer: 250 mM LiCl, 50 mM Tris–HCl pH 8.0, 0.5%
NaDoc, and 1% NP-40. 18. 1× TE Buffer. 19. 5 M NaCl. 20. Absolute EtOH.
2. Materials
2.1. Chromatin Immunoprecipitation
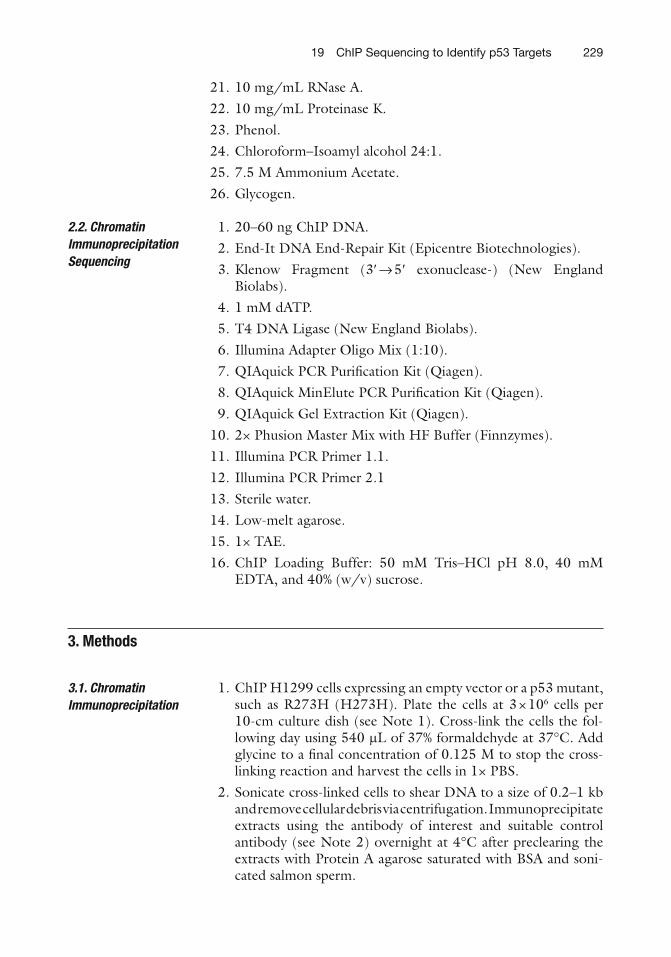
22919 ChIP Sequencing to Identify p53 Targets
21. 10 mg/mL RNase A. 22. 10 mg/mL Proteinase K. 23. Phenol. 24. Chloroform–Isoamyl alcohol 24:1. 25. 7.5 M Ammonium Acetate. 26. Glycogen.
1. 20–60 ng ChIP DNA. 2. End-It DNA End-Repair Kit (Epicentre Biotechnologies). 3. Klenow Fragment (3 ¢ → 5 ¢ exonuclease-) (New England
Biolabs). 4. 1 mM dATP. 5. T4 DNA Ligase (New England Biolabs). 6. Illumina Adapter Oligo Mix (1:10). 7. QIAquick PCR Puri fi cation Kit (Qiagen). 8. QIAquick MinElute PCR Puri fi cation Kit (Qiagen). 9. QIAquick Gel Extraction Kit (Qiagen). 10. 2× Phusion Master Mix with HF Buffer (Finnzymes). 11. Illumina PCR Primer 1.1. 12. Illumina PCR Primer 2.1 13. Sterile water. 14. Low-melt agarose. 15. 1× TAE. 16. ChIP Loading Buffer: 50 mM Tris–HCl pH 8.0, 40 mM
EDTA, and 40% (w/v) sucrose.
1. ChIP H1299 cells expressing an empty vector or a p53 mutant, such as R273H (H273H). Plate the cells at 3 × 10 6 cells per 10-cm culture dish (see Note 1). Cross-link the cells the fol-lowing day using 540 m L of 37% formaldehyde at 37°C. Add glycine to a fi nal concentration of 0.125 M to stop the cross-linking reaction and harvest the cells in 1× PBS.
2. Sonicate cross-linked cells to shear DNA to a size of 0.2–1 kb and remove cellular debris via centrifugation. Immunoprecipitate extracts using the antibody of interest and suitable control antibody (see Note 2) overnight at 4°C after preclearing the extracts with Protein A agarose saturated with BSA and soni-cated salmon sperm.
2.2. Chromatin Immunoprecipitation Sequencing
3. Methods
3.1. Chromatin Immunoprecipitation
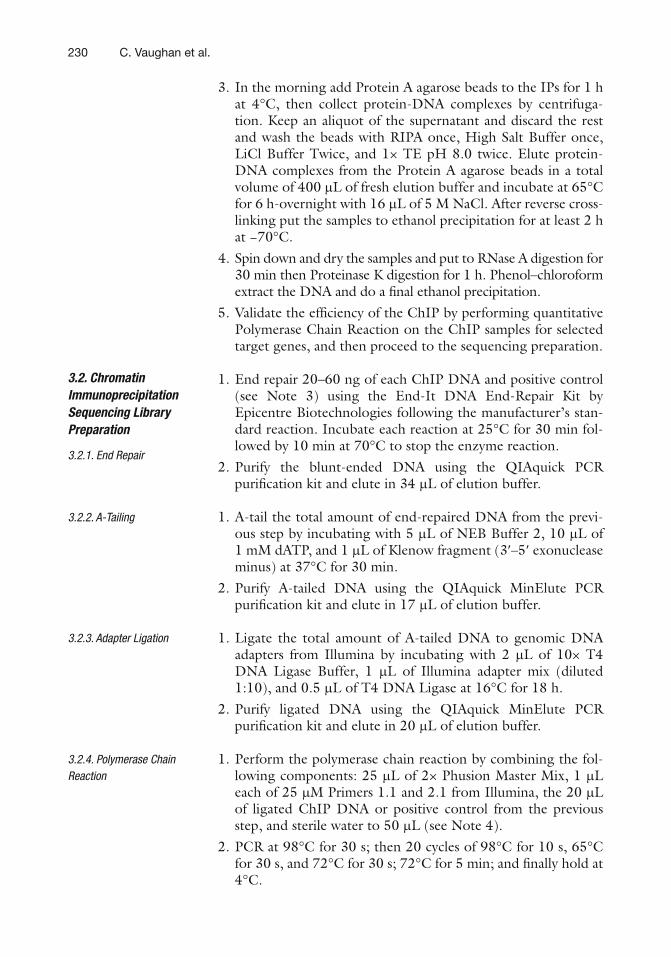
230 C. Vaughan et al.
3. In the morning add Protein A agarose beads to the IPs for 1 h at 4°C, then collect protein-DNA complexes by centrifuga-tion. Keep an aliquot of the supernatant and discard the rest and wash the beads with RIPA once, High Salt Buffer once, LiCl Buffer Twice, and 1× TE pH 8.0 twice. Elute protein-DNA complexes from the Protein A agarose beads in a total volume of 400 m L of fresh elution buffer and incubate at 65°C for 6 h-overnight with 16 m L of 5 M NaCl. After reverse cross-linking put the samples to ethanol precipitation for at least 2 h at −70°C.
4. Spin down and dry the samples and put to RNase A digestion for 30 min then Proteinase K digestion for 1 h. Phenol–chloroform extract the DNA and do a fi nal ethanol precipitation.
5. Validate the ef fi ciency of the ChIP by performing quantitative Polymerase Chain Reaction on the ChIP samples for selected target genes, and then proceed to the sequencing preparation.
1. End repair 20–60 ng of each ChIP DNA and positive control (see Note 3) using the End-It DNA End-Repair Kit by Epicentre Biotechnologies following the manufacturer’s stan-dard reaction. Incubate each reaction at 25°C for 30 min fol-lowed by 10 min at 70°C to stop the enzyme reaction.
2. Purify the blunt-ended DNA using the QIAquick PCR puri fi cation kit and elute in 34 m L of elution buffer.
1. A-tail the total amount of end-repaired DNA from the previ-ous step by incubating with 5 m L of NEB Buffer 2, 10 m L of 1 mM dATP, and 1 m L of Klenow fragment (3 ¢ –5 ¢ exonuclease minus) at 37°C for 30 min.
2. Purify A-tailed DNA using the QIAquick MinElute PCR puri fi cation kit and elute in 17 m L of elution buffer.
1. Ligate the total amount of A-tailed DNA to genomic DNA adapters from Illumina by incubating with 2 m L of 10× T4 DNA Ligase Buffer, 1 m L of Illumina adapter mix (diluted 1:10), and 0.5 m L of T4 DNA Ligase at 16°C for 18 h.
2. Purify ligated DNA using the QIAquick MinElute PCR puri fi cation kit and elute in 20 m L of elution buffer.
1. Perform the polymerase chain reaction by combining the fol-lowing components: 25 m L of 2× Phusion Master Mix, 1 m L each of 25 m M Primers 1.1 and 2.1 from Illumina, the 20 m L of ligated ChIP DNA or positive control from the previous step, and sterile water to 50 m L (see Note 4).
2. PCR at 98°C for 30 s; then 20 cycles of 98°C for 10 s, 65°C for 30 s, and 72°C for 30 s; 72°C for 5 min; and fi nally hold at 4°C.
3.2. Chromatin Immunoprecipitation Sequencing Library Preparation
3.2.1. End Repair
3.2.2. A-Tailing
3.2.3. Adapter Ligation
3.2.4. Polymerase Chain Reaction
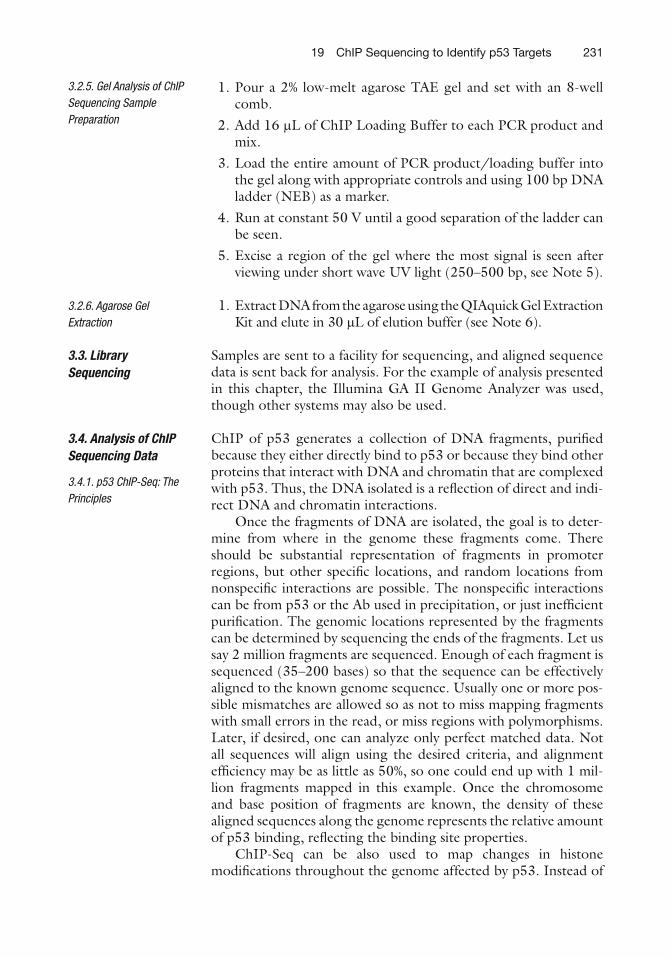
23119 ChIP Sequencing to Identify p53 Targets
1. Pour a 2% low-melt agarose TAE gel and set with an 8-well comb.
2. Add 16 m L of ChIP Loading Buffer to each PCR product and mix.
3. Load the entire amount of PCR product/loading buffer into the gel along with appropriate controls and using 100 bp DNA ladder (NEB) as a marker.
4. Run at constant 50 V until a good separation of the ladder can be seen.
5. Excise a region of the gel where the most signal is seen after viewing under short wave UV light (250–500 bp, see Note 5).
1. Extract DNA from the agarose using the QIAquick Gel Extraction Kit and elute in 30 m L of elution buffer (see Note 6).
Samples are sent to a facility for sequencing, and aligned sequence data is sent back for analysis. For the example of analysis presented in this chapter, the Illumina GA II Genome Analyzer was used, though other systems may also be used.
ChIP of p53 generates a collection of DNA fragments, puri fi ed because they either directly bind to p53 or because they bind other proteins that interact with DNA and chromatin that are complexed with p53. Thus, the DNA isolated is a re fl ection of direct and indi-rect DNA and chromatin interactions.
Once the fragments of DNA are isolated, the goal is to deter-mine from where in the genome these fragments come. There should be substantial representation of fragments in promoter regions, but other speci fi c locations, and random locations from nonspeci fi c interactions are possible. The nonspeci fi c interactions can be from p53 or the Ab used in precipitation, or just inef fi cient puri fi cation. The genomic locations represented by the fragments can be determined by sequencing the ends of the fragments. Let us say 2 million fragments are sequenced. Enough of each fragment is sequenced (35–200 bases) so that the sequence can be effectively aligned to the known genome sequence. Usually one or more pos-sible mismatches are allowed so as not to miss mapping fragments with small errors in the read, or miss regions with polymorphisms. Later, if desired, one can analyze only perfect matched data. Not all sequences will align using the desired criteria, and alignment ef fi ciency may be as little as 50%, so one could end up with 1 mil-lion fragments mapped in this example. Once the chromosome and base position of fragments are known, the density of these aligned sequences along the genome represents the relative amount of p53 binding, re fl ecting the binding site properties.
ChIP-Seq can be also used to map changes in histone modi fi cations throughout the genome affected by p53. Instead of
3.2.5. Gel Analysis of ChIP Sequencing Sample Preparation
3.2.6. Agarose Gel Extraction
3.3. Library Sequencing
3.4. Analysis of ChIP Sequencing Data
3.4.1. p53 ChIP-Seq: The Principles

232 C. Vaughan et al.
using an Ab to p53 in the ChIP, an Ab to a modi fi ed histone is used, such as to acetylated histone H3. An increase in acetylated histones in promoter regions corresponds to increased transcrip-tion for the associated genes. ChIP studies of histone modi fi cation changes mediated by p53 are consistent with associations of p53 with histone acetyl transferases on promoters.
There is a signi fi cant distinction between mapping p53 binding sites and mapping histone modi fi cation changes. For the modi fi ed histone mapping, there are sites of histone modi fi cation in the con-trol that change levels of modi fi cation when p53 is altered, though most sites do not change. The mapping of p53 binding sites merely locates sites of binding with signals signi fi cantly above the noise of the assay.
Interpretation of the data for binding site properties of p53 is a matter for discussion that goes beyond this chapter. While locat-ing the peaks is reasonable, quantifying the peaks for comparison between samples without a viable normalization strategy is prob-lematic. The challenges in analyzing ChIP-Seq data include identi-fying peaks, normalization of the data, quantifying peaks within replicates, comparing those peak signals between samples, and sta-tistical analysis. An approach that avoids many of these issues and challenges is to quantify binding signal within de fi ned regions of the genome, such as de fi ned gene promoter regions. We use this approach in the analysis described in this chapter.
The basic information needed for analysis is (1) the sequence, (2) the location (chromosome and base position) of the aligned sequence, (3) the strand of alignment, (4) how the sequence matched the location (perfect match or allowable mismatches), and (5) a numerical indicator of how well the sequence matched the location. This data should be provided in a text format, such as BED, though any text format and arrangement of fi elds of data is usable. The data may include both aligned and unaligned sequences.
The unaligned sequences will be fi ltered out leaving the aligned sequences, the tags or hits. The number of hits to expect can range from 1 × 10 6 to 100 × 10 6 . The more hits to be analyzed, the greater the sensitivity and reliability, but also the greater the time for analy-sis. The desired minimum number of hits can depend on the results expected. A protein with high speci fi city for binding and few bind-ing sites will not require a large number of hits, as few as 1 × 10 6 , while proteins that bind throughout the genome, e.g., modi fi ed histones, will generate a large number of sites and require a larger number of hits to quantify those sites. Any study with a high hit background throughout the genome would need a larger number of hits.
3.4.2. Data Interpretation
3.4.3. Bioinformatics of ChIP-Seq Data
23319 ChIP Sequencing to Identify p53 Targets
The analysis starts with aligned sequences. The fi rst step in analyz-ing the data is to place it where it can be accessed. While Microsoft Excel does a good job handling data for manipulation and calcula-tions, it can’t hold the number of records for the sequences gener-ated by most ChIP-Seq experiments. We use the database software Filemaker Pro because it has no problem holding the amount of data generated by ChIP-Seq and because it runs on both Windows and Macintosh operating systems.
The next step in analysis is to summarize the data. The sum-mary may still be quite large and extensive but it is more manage-able. The different types of summaries include binning the data so that the hits are summed over fi xed intervals such as 100 bases. Another summary includes locations of peaks found. The summary used in this chapter determines the number of hits within a de fi ned promoter region for each of the known genes.
We use the genes and positions as determined by NCBI RefSeq, with 21,518 genes ( 6 ) , and transcript start sites as mapped to HG18. This data was collected from the UCSC Genome Browser ( ( 7 ) ; http://hgdownload.cse.ucsc.edu/goldenPath/hg18/data-base/refGene.txt.gz ).
The transcription start site for each gene is determined and a de fi ned region of each gene’s promoter is determined; 1,000 bases upstream and 1,500 bases downstream of this site is one possible condition. Too narrow a region could result in not collecting data for the entire peak. Also, some peaks can exceed the size of a 2,500 base window or span further into gene coding regions, so initial visual inspection of various promoter regions can help in deciding the size of the promoter window.
Figure 1 shows the distribution of H3 acetylation sequence hits near the promoters for three example genes; the arrows show the transcription start sites and direction of transcription on a 1 Kb increment scale.
The number of hits for each gene promoter region is deter-mined from unbinned data. The hits per promoter are normalized for the average number of hits for the sample run. The average from replicates is calculated and a student t -test is used to deter-mine statistical signi fi cance between the controls and the p53-manipulated cells. Because of the greater than 21,000 tests performed, the Benjamini–Hochberg correction for multiple test-ing ( 8 ) is used to help identify genes with signi fi cant changes based on a desired false discovery rate.
This analysis provides a list of genes whose promoters are affected in H3 acetylation levels. This gene list can be further ana-lyzed just as a list of genes with altered gene expression can be analyzed, such as analysis of over-represented genes from GO bio-logical processes or determining the correlation with known tran-scription factor binding sites.
3.4.4. Analysis of Histone H3 Acetylation Changes Mediated by Mutant p53
234 C. Vaughan et al.
A visual inspection of peaks can be performed by exporting all or a subset of data from the database for generating density plots using the graphing software of choice.
When aligning the sequences to the genome, a version of the genome must be selected. The latest human genome version is HG19, but it is not annotated to as great an extent as the previous version, HG18. Therefore, as of this date, to relate the ChIP-Seq data to the greatest amount of data within the Genome Browser database, alignment to HG18 may be preferred.
The results for mapping hits to gene promoters will depend on how a promoter is de fi ned in size and position. If the hits are low, then using a wide window may be necessary to establish enough hits per promoter for analysis. However, the wider the window, the greater the background. The position of this window around the promoter region or the transcription start site can make a signi fi cant difference. Peaks of histone modi fi cations are not necessarily within promoters; they can be downstream past the transcription start site and well into the coding region of genes. The peaks can also be narrow or broad, spanning many kilobases ( 9 ) .
One can see from the UCSC Genome Browser data that the transcription start site for all genes (Tx) is lower in position than the end site regardless of which strand codes the genes. The start site is not always the actual start site. For genes coded on the plus
3.4.5. Caveats and Considerations
2BNCC CDC5L
172106200172100200 57182400 57209400 44460800 44470800
SNORD78
Fig. 1. Peaks of H3 acetylation near promoters.
23519 ChIP Sequencing to Identify p53 Targets
strand, the start site (lower value) is the transcription start site and for genes coded on the minus strand, the end site (higher value) is the transcription start site.
Perform quantitative PCR on the leftover DNA to validate the sequencing analysis. Ensure all primer sets are speci fi c for the gene of interest and that the PCR will amplify a region of DNA about 500 bp before the promoter start site.
1. The optimal number of cells plated for cross-linking should be determined empirically to achieve the best results later on.
2. Make sure the antibody used for immunoprecipitation is good for ChIP before proceeding with the ChIP Sequencing procedure.
3. Take the aliquot of the immunoprecipitation supernatant and carry it through the rest of the ChIP procedure and run it in a 2% agarose TBE gel. Cut out a region of the gel around 200 bp and extract out the DNA. This DNA can be used as a positive control for ChIP Sequencing preparation. One of the bands in the PhiX HaeIII DNA Ladder (New England Biolabs) such as the 234 bp band may be used as well but does not need to be end repaired.
4. To ensure the PCR works, PCR half of the positive control sample as normal and take the other half of the positive control sample and PCR without the enzyme. This will show the dif-ference between the ligated material and unused primers. Always perform a negative for PCR, where water is used instead of DNA.
5. Do not view the gel under long wave UV light, this will dam-age the DNA and seriously compromise both sequencing and analysis.
6. Make sure to perform quantitative PCR on the samples after the ChIP Sequencing preparation to ensure sample integrity.
References
3.5. Quantitative PCR Veri fi cation of ChIP Sequencing Analysis
4. Notes
1. Collas P (2010) The current state of chroma-tin immunoprecipitation. Mol Biotechnol 45(1):87–100
2. Solomon MJ, Larsen PL, Varshavsky A (1988) Mapping protein-DNA interactions in vivo with formaldehyde: evidence that histone H4
is retained on a highly transcribed gene. Cell 53(6):937–947
3. Robertson G et al (2007) Genome-wide pro fi les of STAT1 DNA association using chro-matin immunoprecipitation and massively par-allel sequencing. Nat Methods 4(8):651–657

236 C. Vaughan et al.
4. Northrup DL, Zhao K (2011) Application of ChIP-Seq and related techniques to the study of immune function. Immunity 34(6):830–842
5. Kaufmann K, Muino JM, Osteras M, Farinelli L, Krajewski P, Angenent GC (2010) Chromatin immunoprecipitation (ChIP) of plant transcrip-tion factors followed by sequencing (ChIP-SEQ) or hybridization to whole genome arrays (ChIP-CHIP). Nat Protoc 5(3):457–472
6. Pruitt KD et al (2009) NCBI Reference Sequences: current status, policy and new ini-
tiatives. Nucleic Acids Res 37(Database issue):D32–D36
7. Fujita PA et al (2011) The UCSC Genome Browser database: update. Nucleic Acids Res 39(Database issue):D876–D882
8. Hochberg Y, Benjamini Y (1990) More pow-erful procedures for multiple signi fi cance test-ing. Stat Med 9(7):811–818
9. Kratz A et al (2010) Core promoter structure and genomic context re fl ect histone 3 lysine 9 acetyla-tion patterns. BMC Genomics 11:257–268

237
INDEX
A
Adhesion assay .........................................1 36–139, 144, 145 Animal model .......................................1 8, 21, 114, 116, 184 Antibodies ....................................... 4 , 16, 35, 51, 65, 79, 88,
120, 148, 170, 186, 195, 203, 212, 227 Apoptosis ....................................... 3 1–47, 50, 54, 75, 76, 97,
113–116, 118, 123–124, 166, 167, 201 Autophagy ........................................................... 3 1–47, 166
B
Binding sites ............................................................ 2 31–233 BrdU ...........................................................5 1, 53, 55–58, 60
C
Cancer ..................................3 , 45, 51, 81, 95, 114, 116, 135, 136, 139–142, 149, 184, 193, 203
Cell cycle ....................................... 3 2, 33, 37, 45, 46, 49–61, 63, 76, 113, 114, 117, 118, 122, 166, 167
Chemosensitivity ..................................... 1 13–124, 127–133 Chemotherapy ....................................3 8, 114, 128, 129, 131 Chemotoxic .....................................................................1 27 ChIP. See Chromatin immunoprecipitation (ChIP) ChIP-chip .......................................................................2 11 ChIP-on-chip .......................................................... 2 11–226 ChIP sequencing ............................................. 2 02, 227–235 CHK .................................................................................5 0 Chromatin ................................. 7 6, 174, 201, 202, 204–205,
208, 211–213, 215–222, 224, 225, 227–231 Chromatin immunoprecipitation (ChIP) ........170, 174–176,
201–209, 211–235 Clonogenic assay ..................................................... 1 27–130 Clusters .......................................................6 4, 148, 149, 167 Co-precipitaiton ................................................................8 6
D
Degradation ................................... 1 1, 31, 32, 40, 52, 63–73, 95, 109, 115, 166, 179, 224
Detection ................................2 , 4, 16, 18, 19, 22, 23, 25–27, 32, 33, 36–39, 51, 57, 59, 65, 67, 68, 89, 94, 115, 117, 118, 121–124, 148, 149, 154, 168, 173, 201
Dicer .................................................................1 66, 167, 176
DNA damage ......................................3 2, 42, 49–61, 76, 81, 114–118, 165, 167, 172, 175, 177
DNA damage checkpoints .......................................... 4 9, 50 DNA replication ...................................4 9, 50, 147–154, 166 Drosha ...................................... 1 66–168, 170, 171, 175–179 Drug response .................................................................1 13 Dual parameter ...........................................5 1, 53, 54, 57–59
F
Fiber spreading ........................................................ 1 47–154 Flow cytometry ....................................3 2, 34–36, 39, 42, 43,
45–47, 51, 53, 57, 58, 60, 115, 118, 121, 123–124, 185, 188–190
Fluorescence ............................ 1 8, 32, 33, 36, 38, 39, 42–47, 51, 54, 59, 60, 81, 86, 94–110, 147–149, 154, 163, 184, 186, 196, 198, 212, 221, 222
Fluorescence polarization ..........................................9 5–110 Fork elongations ..............................................................1 49
G
Gain of function (GOF) ....................................89, 128, 135, 136, 143, 184
G1 arrest ...................................................................... 5 0, 52 G2/M arrest ......................................................................5 2 GOF. See Gain of function (GOF) Growth assay ................................................... 1 28, 130–131
H
Haptotactic migration assay ................................... 1 36–138, 140–143, 145
Hdm2 ................................................................................95 Histone modi fi cation ................................2 27, 231, 232, 234
I
Immunoblotting ..................................2 1, 32, 34–35, 39–41, 67, 69–71, 117–123
Immunoprecipitation ...................................... 1 7–19, 22–24, 26, 27, 65, 67, 69, 71, 82, 86–90, 93, 167, 170, 171, 174–176, 201, 203, 205, 208, 209, 211–220, 224, 227–231, 235
iPS ........................................................................... 1 57–164
Sumitra Deb and Swati Palit Deb (eds.), p53 Protocols, Methods in Molecular Biology, vol. 962,DOI 10.1007/978-1-62703-236-0, © Springer Science+Business Media New York 2013
238 P53 PROTOCOLS
Index
L
Lentivirus .................................................1 78, 194–196, 198 Luciferase reporter gene assays .............1 8, 20, 22, 24–25, 27 Lung stem cells ........................................................ 1 83–190
M
Magnetic-activated cell sorting (MACS) ............... 184, 185, 188, 190
Mass spectrometry ........................................... 8 6, 88, 92–94 MDM2 ....................................... 64, 66, 69–73, 95–110, 202 MDMX .....................................................................9 5–110 MEF. See Mouse embryonic fi broblast (MEF) Microarray ................ 2 11–213, 215, 216, 219, 221–223, 225 MicroRNA (miRNA) ...................................... 128, 165–179 Mitochondria isolation ................................................7 6–77 Mitotic catastrophe ................................................. 1 16–118 Mouse embryonic fi broblast (MEF) ..................53, 157–163,
188–190 mRNA ................................................................... 1 –13, 166 Mutant p53 ......................... 3, 19, 81, 85–94, 128, 135–145,
147–154, 158, 184, 193, 211–225, 227, 233–234
N
Nested PCR ................................................................ 2 –6, 9
O
Origins ...............................................8 1, 114, 147–149, 166
P
p68 .................................................... 166, 167, 170, 171, 175 Phoshohistone H3 ...................... 51, 54, 56, 59–60, 117–123 Phosphorylation ..............5 0, 51, 54, 56, 59, 60, 72, 118, 122 p53 isoforms ...................................................... 1 –13, 15–28 p53 knock-down ...................................................... 1 93–199 p53 protein isoforms .................................. 1 6–21, 23, 25–27 p53 responsive DNA element .................................. 2 01, 202 Processing ............. 3 9, 43, 121, 166–168, 170–171, 176–179 Propidium iodide .......................................3 3, 37, 46, 47, 51,
53–60, 118, 119, 122
Protein detection ........................................1 6, 18, 19, 22, 25 Proteomics ...................................................................8 5–94 p53 tumor suppressor protein ..........................................1 13
Q
Quanti fi cation ....................................1 –13, 34, 96, 102, 232 Quantitative Real-Time RT-PCR
(TaqMan® chemistry) ........... 7, 10–11, 172, 173, 176
R
Reprogramming .............................................. 1 57–160, 162 Retrovirus ........................................................ 1 57, 162, 163
S
Senescence ....................................3 1–47, 114, 116, 118, 128 Short hairpin RNA (shRNA) .....................16, 193, 194, 196 Small molecules ................................................... 7 3, 95–110 Splicing ...................................................................... 1 , 2, 15 26S proteasome ................................................6 3, 64, 66, 71 Submitochondrial fractionation ....................... 7 7–78, 80–81
T
Target genes ....................... 6 0, 166, 201, 202, 209, 228, 230 Terminating forks ............................................................1 48 Transcription ..............................4 , 5, 7, 9–12, 18, 20, 27, 32,
49, 50, 87, 157, 166–168, 170–173, 177, 201, 202, 212, 216, 224, 227, 228, 232–235
Transcriptional signature. ................................................2 11 Transcription factor ...............................2 7, 32, 50, 157, 166,
201, 202, 212, 216, 224, 228, 233 Tumor cells ..................................... 3 8, 75, 76, 114, 116, 143
U
Ubiquitination ....................................................... 6 3–73, 95 Ubiquitin ligase ............................................... 6 4, 67–70, 72
W
Western blotting ..................................1 6–27, 33, 34, 40, 65, 67, 68, 78–81, 88–89, 93, 194, 195, 197, 198
E1
Erratum tO
Chapter 4 P53 and Cell Cycle Effects After DNA Damage
Emir Senturk and James J. Manfredi
Sumitra Deb and Swati Palit Deb (eds.), p53 Protocols, Methods in Molecular Biology, vol. 962,DOI 10.1007/978-1-62703-236-0_4, © Springer Science+Business Media New York 2013
DOI 10.1007/978-1-62703-236-0_20
The publisher regrets that the coauthors of Chapter 4 were incorrect. The coauthors of Chapter 4 should be Lois Resnick-Silverman and James J. Manfredi and not Emir Senturk and James J. Manfredi.
The online version of the original chapter can be found at http://dx.doi.org/10.1007/978-1-62703-236-0_4