Model for estimating enteric methane emissions from United States dairy and feedlot cattle
34
E. Kebreab, K. A. Johnson, S. L. Archibeque, D. Pape and T. Wirth Model for estimating enteric methane emissions from US dairy and feedlot cattle published online June 6, 2008 J ANIM SCI http://jas.fass.org/content/early/2008/06/06/jas.2008-0960.citation the World Wide Web at: The online version of this article, along with updated information and services, is located on www.asas.org by guest on May 18, 2011 jas.fass.org Downloaded from
Transcript of Model for estimating enteric methane emissions from United States dairy and feedlot cattle

E. Kebreab, K. A. Johnson, S. L. Archibeque, D. Pape and T. WirthModel for estimating enteric methane emissions from US dairy and feedlot cattle
published online June 6, 2008J ANIM SCI
http://jas.fass.org/content/early/2008/06/06/jas.2008-0960.citationthe World Wide Web at:
The online version of this article, along with updated information and services, is located on
www.asas.org
by guest on May 18, 2011jas.fass.orgDownloaded from
�
Modeling methane emissions in cattle�
�
Model for estimating enteric methane emissions from US dairy �
and feedlot cattle1�
�
E. Kebreab,* 2 K. A. Johnson,† S. L. Archibeque,‡ D. Pape,§ and T. Wirth¥�
*National Centre for Livestock and Environment, Department of Animal Science, University �
of Manitoba, Winnipeg, Manitoba R3T 2N2, Canada; † Washington State University,
Department of Animal Science, Pullman, WA 99164 USA; ‡ Colorado State University,
Department of Animal Science, Ft Collins, CO 80523 USA; § ICF International, Washington ���
DC, USA; ¥ Environmental Protection Agency, Washington DC, USA���
���
���
���
���
���
���
��
___________________________________________________________________________��
1This research was undertaken thanks to funding from U.S. Environmental Protection Agency.���
2Corresponding author: [email protected]���
Page 1 of 32 Journal of Animal Science
by guest on May 18, 2011jas.fass.orgDownloaded from

�
ABSTRACT: Methane production from enteric fermentation in cattle is one of the major ���
sources of anthropogenic greenhouse gas emission in the United States and worldwide. ���
National estimates of methane emissions rely on mathematical models such as the one ���
recommended by the Intergovernmental Panel for Climate Change (IPCC). Models used for ���
prediction of methane emissions from cattle range from empirical to mechanistic with varying ���
input requirements. Two empirical (IPCC, 2006; Moe and Tyrrell, 1979) and 2 mechanistic ���
models (Dijkstra et al., 1992 (COWPOLL); Baldwin, 1995 (MOLLY)) were evaluated for ��
their prediction ability using individual cattle measurements. Model selection was based on ��
mean square prediction error (MSPE), concordance correlation coefficient and residuals vs. ���
predicted values analyses. In dairy cattle, COWPOLL had the lowest root MSPE and greatest���
accuracy and precision of predicting methane emissions (correlation coefficient estimate =���
0.75). The model simulated differences in diet more accurately than the other models and the ���
residuals vs. predicted value analysis showed no mean bias (P = 0.71). In feedlot cattle,���
MOLLY had the lowest root MSPE with almost all errors from random sources (correlation ���
coefficient estimate = 0.69). The IPCC model also had good agreement with observed values���
and no significant mean (P = 0.74) or linear bias (P = 0.11) was detected when residuals were ���
plotted against predicted values. A fixed methane conversion factor (Ym) might be an easier ��
alternative to diet dependent variable Ym. Based on results, the 2 mechanistic models were ��
used to simulate methane emissions from representative US diets and compared with the IPCC���
model. The average Ym in dairy cows was 5.63% of GE (range 3.78 to 7.43%) compared to ���
6.5% ± 1% recommended by IPCC. In feedlot cattle the average Ym was 3.88% (range 3.36 ���
to 4.56%) compared to 3% ± 1% recommended by IPCC. Based on our simulations, using���
IPCC values can result in an overestimate of about 12.5% and underestimate of emissions by ���
Page 2 of 32Journal of Animal Science
by guest on May 18, 2011jas.fass.orgDownloaded from

�
about 9.8% for dairy and feedlot cattle, respectively. In addition to providing improved ���
estimates of emissions based on diets, mechanistic models can be used to assess mitigation���
options such as changing source of carbohydrate or addition of fat to reduce methane, which is ���
not possible with empirical models. We recommend national inventories use diet specific Ym ��
values predicted by mechanistic models to estimate methane emissions from cattle.��
���
Key words: cattle, greenhouse gas, methane, modeling ���
Page 3 of 32 Journal of Animal Science
by guest on May 18, 2011jas.fass.orgDownloaded from
�
INTRODUCTION��
���
Enteric methane (CH4) production arises principally from microbial fermentation of ���
hydrolyzed dietary carbohydrates. Methane represents loss of energy to the animal, and varies���
between 2 to 12% of GE intake (Johnson and Johnson, 1995). Methane is one of the ���
greenhouse gases (GHG) emitted from livestock and up to 21 times more potent than CO2 in ���
its ability to trap heat in the atmosphere. Globally, 287 Mt of CH4 are released from��
anthropogenic sources annually, 50% of which is from agriculture and the largest biogenic ��
source of CH4 is enteric fermentation from ruminants (U.S. EPA, 2006). Agriculture in the US ���
contributes about 8% of the total US GHG emissions and is the second largest CH4 source in ���
the US (U.S. EPA, 2007). ���
Measurement of CH4 production in animals requires complex and often expensive ���
equipment; therefore, prediction equations are widely used to estimate CH4 emissions. Some ���
models have been developed specifically to predict CH4 emissions from animals (Ellis et al.,���
2007) and others have either been modified or adapted to estimate CH4 emission from rumen ���
fermentation (Dijkstra et al., 1992; Baldwin, 1995). At present, mathematical models are used ���
to estimate CH4 emissions from enteric fermentation at a national and global level. The ��
Intergovernmental Panel on Climate Change (IPCC) publishes guidelines (IPCC, 2006) that ��
are used for official estimates of CH4 emissions. However, accuracy of these models has been ���
challenged (Kebreab et al., 2006a). The US Environmental Protection Agency has adopted ���
mechanistic models to estimate CH4 yield (Ym, % GE) for dairy cattle that are used as inputs ���
to the IPCC Tier 2 approach for estimating emission factors (U.S. EPA, 2007).���
The objectives of this study were to evaluate selected models against observed data for ���
an independent appraisal of the performance of the models in predicting enteric CH4 emission ���
Page 4 of 32Journal of Animal Science
by guest on May 18, 2011jas.fass.orgDownloaded from
�
and, to use selected models to develop diet specific CH4 emission factors for calculating ���
national inventory. ���
��
MATERIALS AND METHODS��
��
Data Sources��
Dairy Cattle. Methane emission data from dairy cattle from Johnson et al. (2002) and ��
Westberg et al. (2001) were used to evaluate the accuracy of predictions of CH4 emission by ��
models listed below. These data were individual daily animal CH4 emissions from animals fed ��
several types of diets. Methane measurements were based on sulfur hexafluoride tracer gas ��
technique (SF6). The data used for evaluation of the models is summarized in Table 1.��
Diets fed to dairy cattle from several states were obtained and CH4 emissions from ��
animals fed those diets were estimated by selected models. Several consulting nutritionists and �
extension personnel in California, Colorado, Kansas, New Mexico, Texas, Washington, and �
Wisconsin were contacted and asked to provide representative diets for the different classes of ��
cows on a dairy operation. These classes included high milk yield, low milk yield, non ��
lactating cows, and growing heifers. These individuals were asked to provide nutrient analysis ��
information about the diet as well. The representative samples contained major dietary factors ��
that affect CH4 production such as type and level of concentrates and various levels of fat ��
supplementation. However, only the data for high yielding and non lactating cows were ��
complete and therefore used in this study.��
Feedlot Cattle Methane emissions from feedlot cattle from Archibeque et al. (2006) and ��
Archibeque et al. (2007) were used to evaluate the models. These data were individual daily �
Page 5 of 32 Journal of Animal Science
by guest on May 18, 2011jas.fass.orgDownloaded from

�
CH4 emissions from feedlot steers fed several types of diets. Measurements of CH4 in these �
studies were made using the open-circuit chamber method as described by Nienaber and ����
Maddy (1985). The data used for evaluation of the models is summarized in Table 1.����
The 2007 Texas Tech University survey (Vasconcelos and Galyean, 2007) was used to ����
generate representative diets that would encompass various extremes as well as “average” diet ����
compositions. Selected models were then used to estimate CH4 emissions from cattle fed the ����
diets in the survey.����
����
The Models����
There have been several attempts to formulate mathematical models to predict CH4 emissions ���
from cattle (Wilkerson et al., 1995). The models can be classified into 2 principal groups: ���
empirical (statistical) models that relate nutrient intake to CH4 output directly and dynamic ����
mechanistic models that attempt to simulate CH4 emissions based on a mathematical ����
description of ruminal fermentation biochemistry. We chose to evaluate 4 models based on ����
their ease of application, previous usage for making inventories and potential to improve on ����
previous model predictions. The models chosen were IPCC (2006) Tier II model, Moe and����
Tyrrell (1979), 2007 version of MOLLY (Baldwin, 1995), and COWPOLL (Dijkstra et al.,����
1992; Kebreab et al., 2004). ����
IPCC (2006). The IPCC in its 2006 national greenhouse gas inventories manual (IPCC, ����
2006) outlines methods for estimating CH4 emissions from enteric fermentation at 3 levels of ���
detail and complexity. In Tier 1, average milk production of 8,400 kg/(animal·yr) is assumed ���
and the estimated emission factor for North American dairy cows is 121 kg CH4/(animal·yr). ����
For feedlot cattle the emission factor is 53 kg CH4/(animal·yr). However, IPCC (2006) ����
Page 6 of 32Journal of Animal Science
by guest on May 18, 2011jas.fass.orgDownloaded from
�
recommends the Tier 2 (or Tier 3 which requires further refinement) method for estimating ����
CH4 emissions from enteric fermentation for those countries with large cattle populations. ����
Average daily feed intake (in terms of GE content, MJ/d) and CH4 conversion rates (Ym) are ����
used to estimate CH4 emissions in Tier 2 method. For dairy cattle, a 6.5% ± 1% of GEI ����
conversion rate is suggested with the lower bounds recommended for diets with greater ����
digestibility and energy values. Similarly for feedlot cattle a 3% ± 1% conversation rate is ����
suggested with the same caveat as in the dairy procedure. Feed intake is estimated from BW, ADG, ���
feeding situation (indoor or outdoor housing, pasture or grazing), milk production per day, ���
average amount of work performed per day, percentage of cows that give birth in a year and ����
feed digestibility. Using GE estimation equations will introduce a source of error into CH4����
estimates and will not allow a robust assessment of the default Ym values. Therefore, ����
measured GE intake values were used as an input to IPCC (2006) as well as the other models.����
Moe and Tyrrell (1979). The model of Moe and Tyrrell (1979) is an empirical model ����
developed using data from US cattle and the model relates intake of carbohydrate fractions to ����
CH4 production as follows:����
Methane (MJ/d) = 3.41 + 0.51 NFC + 1.74 HC + 2.65 C, (1)����
where NFC is non-fiber carbohydrate (kg/d), HC is hemicellulose (kg/d), and C is cellulose���
(kg/d). In cases where NFC values were not available, it was calculated as NFC = 100 – (CP + ���
EE + ash + NDF). Book values were used where HC and C values were not given.����
MOLLY. MOLLY (Baldwin, 1995 and its current version MOLLY, 2007) is a dynamic ����
mechanistic model of nutrient utilization in cattle originally developed at the University of ����
California, Davis. Methane production is predicted as described by Baldwin (1995). Briefly, ����
ruminal CH4 production was predicted based on hydrogen balance. Excess hydrogen produced ����
Page 7 of 32 Journal of Animal Science
by guest on May 18, 2011jas.fass.orgDownloaded from

during fermentation of carbohydrates and protein to lipogenic VFA (acetate and butyrate) is ����
partitioned between use for microbial growth, biohydrogenation of unsaturated fatty acids, and ����
production of glucogenic VFA (propionate and valerate). The assumption is made that the ����
remaining hydrogen is used solely and completely for methanogenesis. The VFA ���
stoichiometry in MOLLY is based on equations developed by Murphy et al. (1982).���
COWPOLL. The rumen model of Dijkstra et al. (1992) is the basis for the mechanistic ����
model used in the present evaluation. The model is based on a series of dynamic, ����
deterministic, and non-linear differential equations. Methane production in the rumen and ����
hindgut was introduced by Mills et al. (2001) following the principles of Baldwin (1995). ����
Later, Kebreab et al. (2004) incorporated the rumen model to a whole animal model that ����
included nitrogen and phosphorus utilization. Bannink et al. (2006) developed a new ����
stoichiometry for fermentation within the rumen based entirely on experimental observations ����
with lactating dairy cows, therefore, COWPOLL was modified to accommodate these ����
stoichiometric coefficients. One of the fundamental differences in estimating CH4 emissions ���
between MOLLY and COWPOLL is the representation of microbes in the rumen and the ���
coefficients of fermentation for transformation of substrate to VFA. The MOLLY model uses ����
one group of microbes whereas COWPOLL separates the microbial community into three: ����
amylolytic, celluolytic bacteria, and protozoa.����
����
Statistical Analysis����
A database containing diets that had measured CH4 values reported in the literature (Table 1) ����
were used to evaluate the models. For a perfect model, CH4 predicted will be equal to CH4����
Page 8 of 32Journal of Animal Science
by guest on May 18, 2011jas.fass.orgDownloaded from
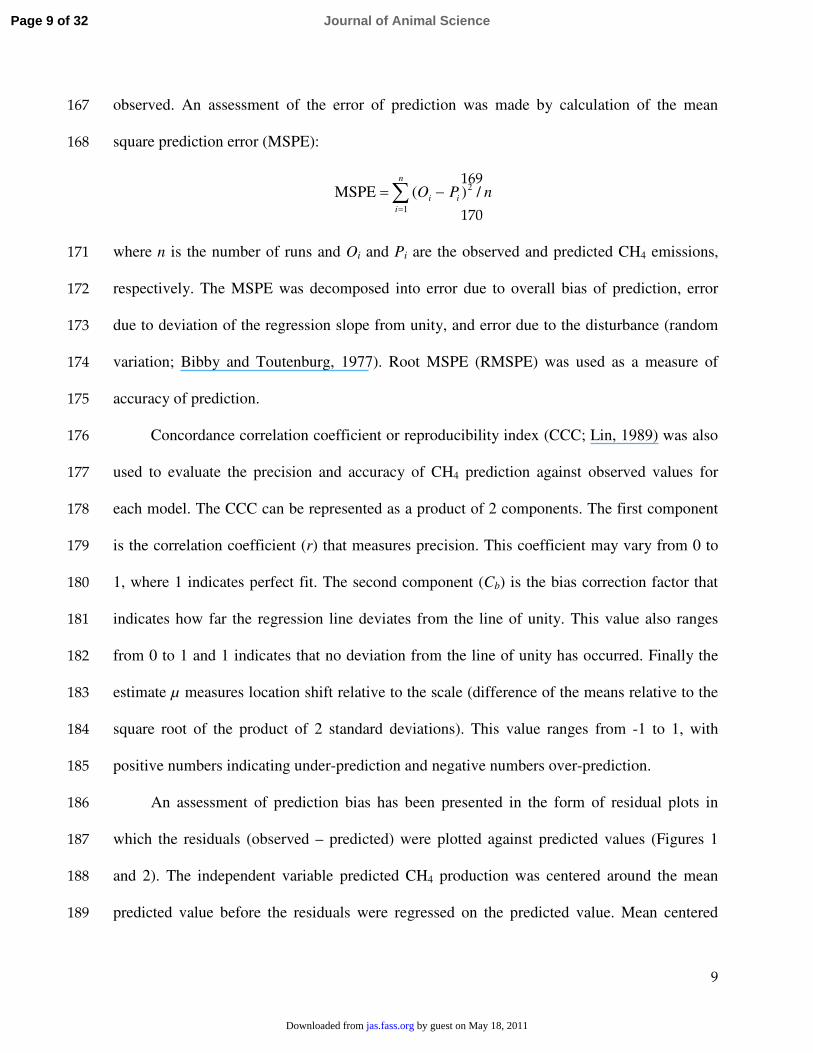
observed. An assessment of the error of prediction was made by calculation of the mean ����
square prediction error (MSPE):���
���
����
where n is the number of runs and Oi and Pi are the observed and predicted CH4 emissions, ����
respectively. The MSPE was decomposed into error due to overall bias of prediction, error ����
due to deviation of the regression slope from unity, and error due to the disturbance (random ����
variation; Bibby and Toutenburg, 1977). Root MSPE (RMSPE) was used as a measure of ����
accuracy of prediction.����
Concordance correlation coefficient or reproducibility index (CCC; Lin, 1989) was also ����
used to evaluate the precision and accuracy of CH4 prediction against observed values for ����
each model. The CCC can be represented as a product of 2 components. The first component ���
is the correlation coefficient (r) that measures precision. This coefficient may vary from 0 to ���
1, where 1 indicates perfect fit. The second component (Cb) is the bias correction factor that ���
indicates how far the regression line deviates from the line of unity. This value also ranges ���
from 0 to 1 and 1 indicates that no deviation from the line of unity has occurred. Finally the���
estimate µ measures location shift relative to the scale (difference of the means relative to the ���
square root of the product of 2 standard deviations). This value ranges from -1 to 1, with ���
positive numbers indicating under-prediction and negative numbers over-prediction.���
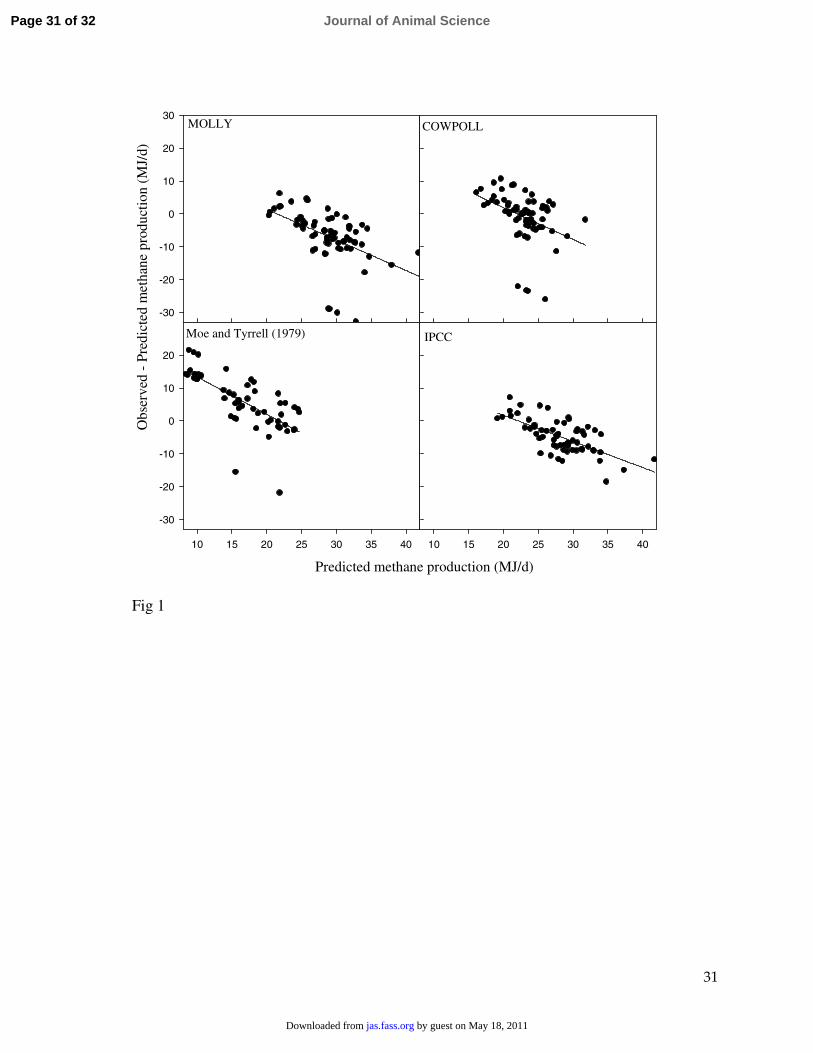
An assessment of prediction bias has been presented in the form of residual plots in ���
which the residuals (observed – predicted) were plotted against predicted values (Figures 1 ���
and 2). The independent variable predicted CH4 production was centered around the mean ��
predicted value before the residuals were regressed on the predicted value. Mean centered ��
nPOn
iii /)(MSPE 2
1∑=
−=
Page 9 of 32 Journal of Animal Science
by guest on May 18, 2011jas.fass.orgDownloaded from
����
bias, and bias at the minimum and maximum values were determined as described by St-���
Pierre (2003).���
���
RESULTS AND DISCUSSION���
Model Evaluation���
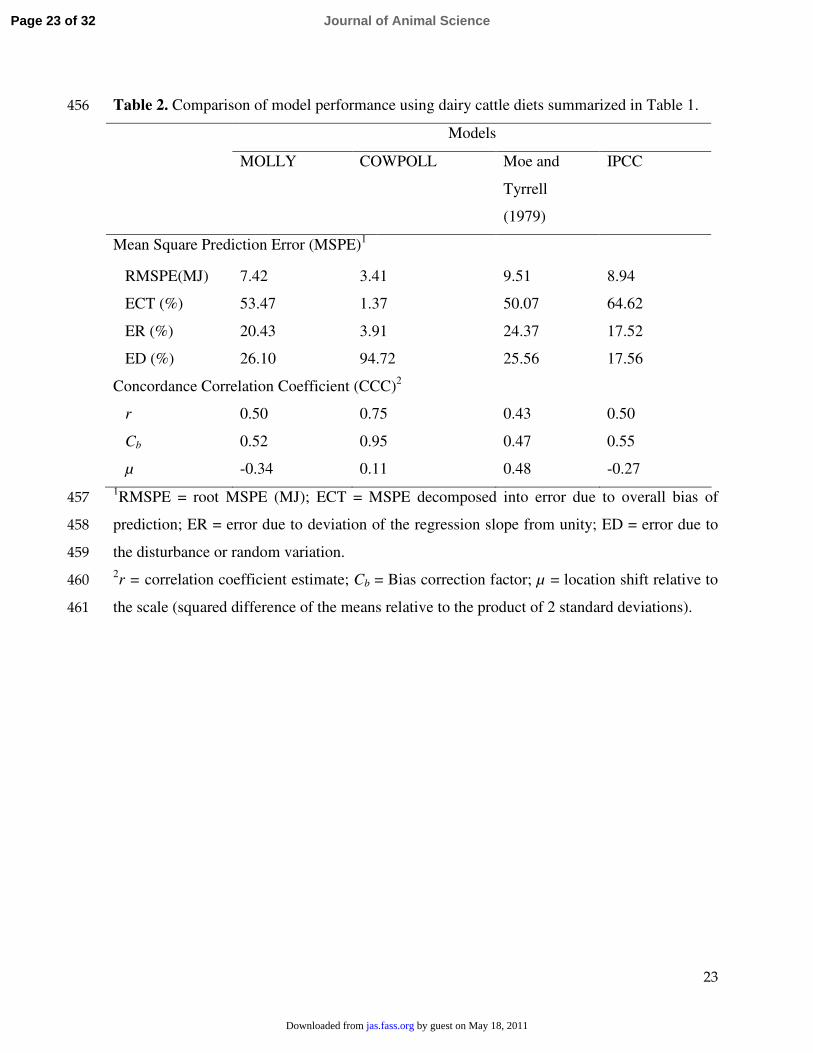
Dairy. Table 2 gives summary statistics for each model’s performance in predicting CH4���
emissions. For the dairy cow data, COWPOLL had the lowest RMSPE (3.41 MJ) and the Moe ���
and Tyrrell (1979) had the greatest (9.51 MJ). MOLLY and IPCC models showed ���
intermediate RMSPE values (7.42 and 8.94, respectively). Decomposition of the MSPE ��
indicated that COWPOLL based predictions had nearly 95% of its errors coming from random ��
sources. For the other three models the overall bias of prediction component contributed most ����
to the MSPE (48 to 53%). The CCC analysis revealed that COWPOLL was more precise (r = ����
0.75) and more accurate (Cb = 0.95) than the other 3 models (r between 0.43 and 0.52, and Cb����
between 0.47 and 0.58). There was a small overall mean under prediction of CH4 emission by ����
COWPOLL (µ = 0.11). The MOLLY and IPCC models tended to over predict (µ = -0.34 and -����
0.27, respectively) and Moe and Tyrrell (1979) to under predict (µ = 0.48) overall CH4����
emissions. Predictions from IPCC were slightly better than MOLLY mainly because the mean ����
predictions from IPCC are closer to the observed data (mean bias 17.5% for IPCC compared ����
to 20.4% for MOLLY; Table 2). Results of residuals plotted against predicted value (Figure 1) ���
showed a significant mean and linear biases (P < 0.001) for all models except COWPOLL ���
where there was only significant linear bias (P = 0.02). The magnitude of the linear bias for ����
COWPOLL was less than 5.7 MJ/d at the minimum (16.2 MJ/d) and 9.5 MJ/d at the ����
Page 10 of 32Journal of Animal Science
by guest on May 18, 2011jas.fass.orgDownloaded from
����
maximum (31.8 MJ/d) predicted CH4 emission values. One of the main differences between ����
the 2 dynamic mechanistic models was the VFA stoichiometry used to predict VFA profile ����
from nutrients. The MOLLY model uses Murphy (1982) equations which describe the ����
stoichiometry of the production of acetic, propionic, butyric, and valeric acids with ����
fermentation of soluble carbohydrate, starch, hemicelluloses, cellulose and protein. The ����
updated version of MOLLY uses these coefficient estimates, but with 1.0 mol propionic acid ����
and 0.5 mol butyric acid substituted for 1.0 mol valeric acid and VFA coefficients were also ���
dependent on rumen pH (Argyle and Baldwin, 1988). The COWPOLL model on the other ���
hand uses the equations developed by Bannink et al. (2006) that were based on dairy cow ����
experiments and have different stoichiometric coefficients. Benchaar et al. (1998) also showed ����
that COWPOLL (before the modifications were made) agreed with observed data better than ����
MOLLY or other empirical models.����
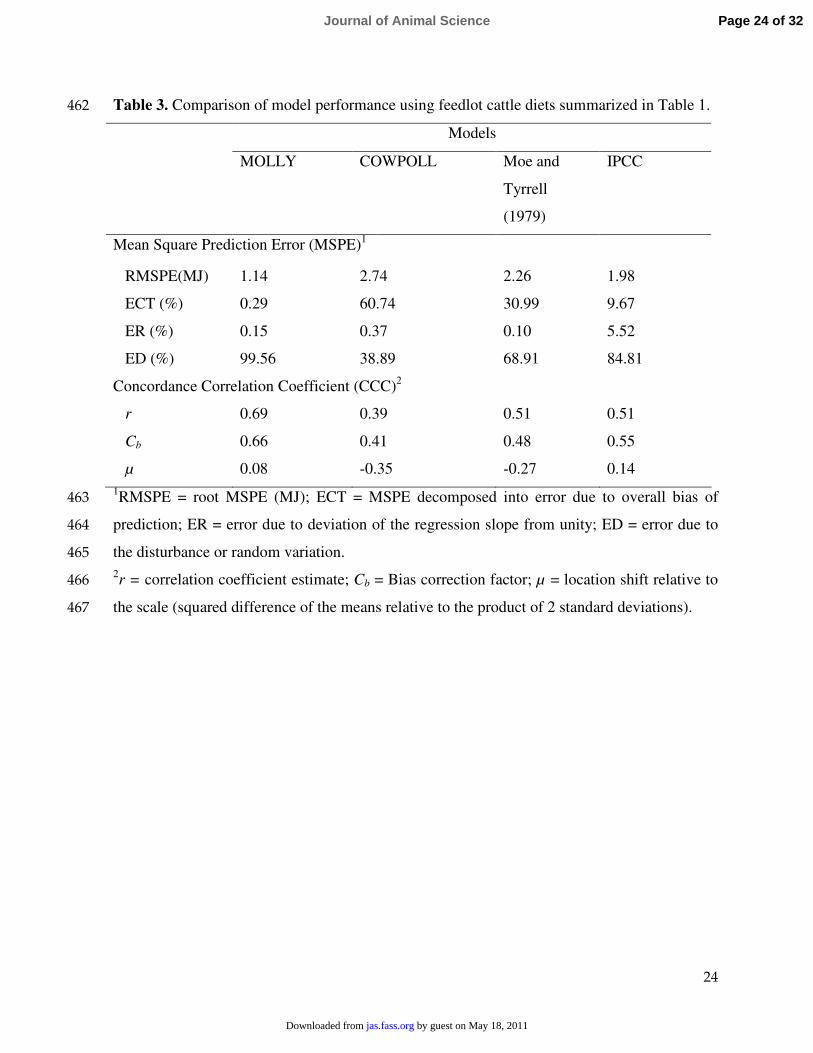
Feedlot. Statistical analysis showed that for feedlot cattle, MOLLY had the lowest ����
RMSPE and COWPOLL had the greatest (Table 3), although the differences were not as large ����
as those observed for dairy cattle. The IPCC and Moe and Tyrrell (1979) models had ����
intermediate RMSPE values. The breakdown of errors indicated that most of the errors from ����
MOLLY and IPCC were random (99.6 and 84.8%, respectively). In contrast, the overall bias ���
of prediction component contributed most to the MSPE in COWPOLL (60.7%) and was a ���
significant component in Moe and Tyrrell (1979) model (31.0%). The results are supported by ����
the CCC analysis which showed that MOLLY was more precise (r = 0.69) and accurate (Cb = ����
0.66) compared to the other models (r between 0.39 and 0.52, and Cb between 0.41 and 0.56). ����
Results of residuals vs. predicted values showed absence of mean bias for MOLLY (P = 0.94) ����
and IPCC (P = 0.74) and no linear bias for COWPOLL (P = 0.74), Moe and Tyrrell (1979) (P ����
Page 11 of 32 Journal of Animal Science
by guest on May 18, 2011jas.fass.orgDownloaded from
����
= 0.32) and IPCC models (P = 0.11). There was a significant mean bias for COWPOLL and ����
Moe and Tyrrell (1979) models (P < 0.001). The magnitude of linear bias was 1.6 MJ/d at the ����
minimum (2.01 MJ/d) and 1.4 MJ/d at the maximum (6.47 MJ/d) predicted CH4 emission ����
values. Although COWPOLL was developed and parameterized for lactating dairy cows, CH4���
emissions from the rumen were expected to be predicted better than the use of other models. ���
Feedlot diets used for evaluation were mostly concentrates and the VFA stoichiometry used in ����
COWPOLL might not have represented VFA production well. Table 3 shows a systematic ����
over prediction by COWPOLL model (µ = -0.35) and that could be due to under estimation of ����
propionate production in high concentrate diets. The IPCC model with fixed Ym can be used ����
as a simple alternative to mechanistic models to estimate CH4 emissions for feedlot diets ����
because its predictions showed neither mean nor linear bias (Figure 2).����
Estimates of Enteric Methane Emissions from Dairy Cattle ����
Based on the comparison of models, COWPOLL was used to predict CH4 emissions from ����
representative diets across the United States. Most countries use the IPCC model for their CH4���
emissions inventory, therefore, calculations using the IPCC method was also made to compare ���
with the results of COWPOLL predictions.����
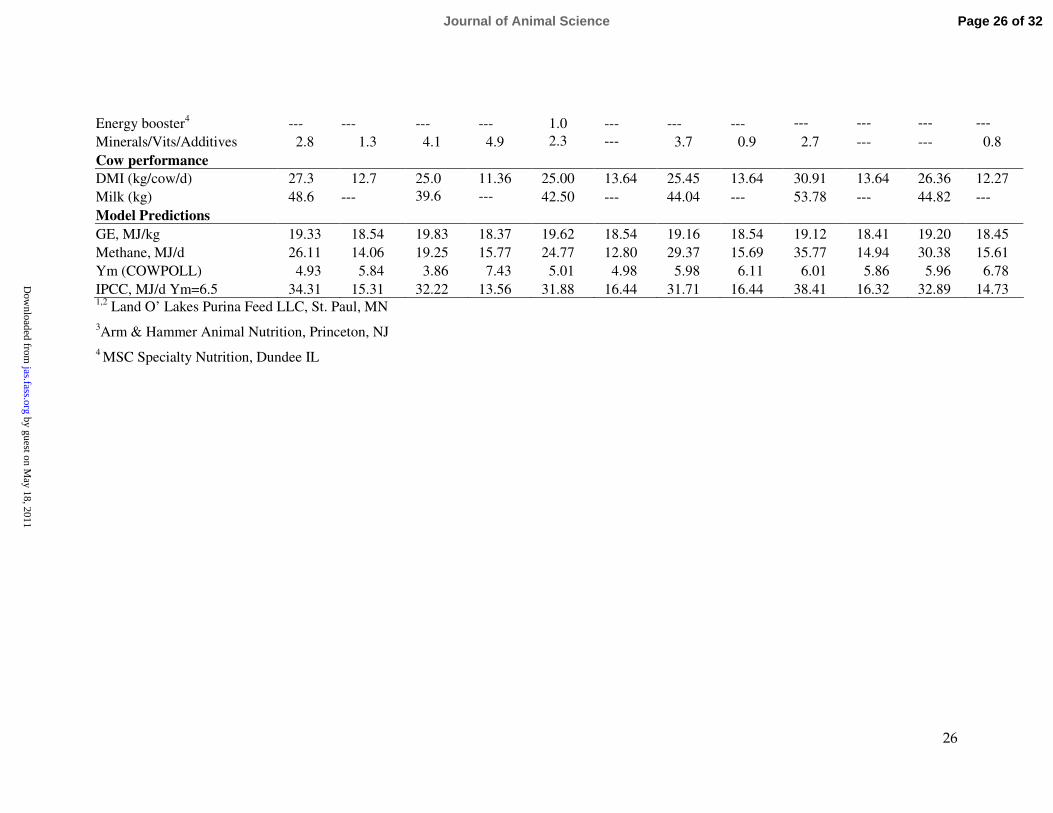
Various diets from Wisconsin (Shaver and Kaiser, 2004), Texas, New Mexico, Kansas, ����
and Washington states were evaluated (Tables 4 and 5). Different diets for mature and dry ����
cows were used to estimate CH4 emissions. Methane emissions from mature cows were ����
consistently greater when estimated using the IPCC compared to COWPOLL. In contrast, ����
CH4 emissions from dry cows were consistently lower with the IPCC method compared to ����
COWPOLL. The main reason for these differences is that the IPCC is heavily dependent on ����
Page 12 of 32Journal of Animal Science
by guest on May 18, 2011jas.fass.orgDownloaded from

����
the amount of DMI and does not respond to the types of nutrients supplied to the cows. For ����
example, in dry cows fed 53% haylage and 31% corn silage as part of the forage portion of ���
diet (diet 1 in Table 4) IPCC predicted 15.3 MJ/d CH4 (272 g/d) emission whereas���
COWPOLL predicted 14.1 MJ (248 g/d; DMI=12.7 kg/d). When the haylage was reduced by ����
half and substituted by oatlage (diet 3 in Table 4), IPCC predicted 16.4 MJ/d (292 g/d) ����
whereas COWPOLL predicted 12.8 MJ/d (227 g/d; DMI=13.6 kg/d). On a Ym basis, ����
COWPOLL suggested CH4 emission of 5.84% for the first diet and 4.98% of GE for the ����
second diet compared to 6.5% for both diets in IPCC. For Wisconsin diets, COWPOLL����
suggests an average Ym value of 5.2% for lactating cows and 6.2% for dry cows. Considering ����
the number of cows and the amount of feed consumed, these changes will make a significant ����
difference in the CH4 inventory of each state. Based on available information of diets, ����
COWPOLL estimates Ym values for Texas diets to be 3.78% for lactating cows and 7.2% for ���
dry cows. The differences are due to higher proportion of forage (up to 88%) in dry cow diets ���
compared to 60% in lactating cow diets. For diets from New Mexico, Ym values of 5.36 and ����
4.97% were predicted for lactating and dry cows, respectively and for diets from Kansas ����
5.57% for lactating cows and 6.58% for dry cows. Only lactating cow diet information was ����
available for Washington diets, which was estimated to be 5.43%. It is important to note that ����
the Ym values are diet specific and would likely change for different diets in a given region or ����
state.����
Estimates of Enteric Methane Emissions from Feedlot Cattle����
The results of model comparison based on MSPE and CCC showed that MOLLY����
predicted CH4 emissions from feedlot cattle better than the other three models, therefore, ���
MOLLY was used to estimate CH4 emissions from feedlot cattle fed various types of diets that ���
Page 13 of 32 Journal of Animal Science
by guest on May 18, 2011jas.fass.orgDownloaded from
����
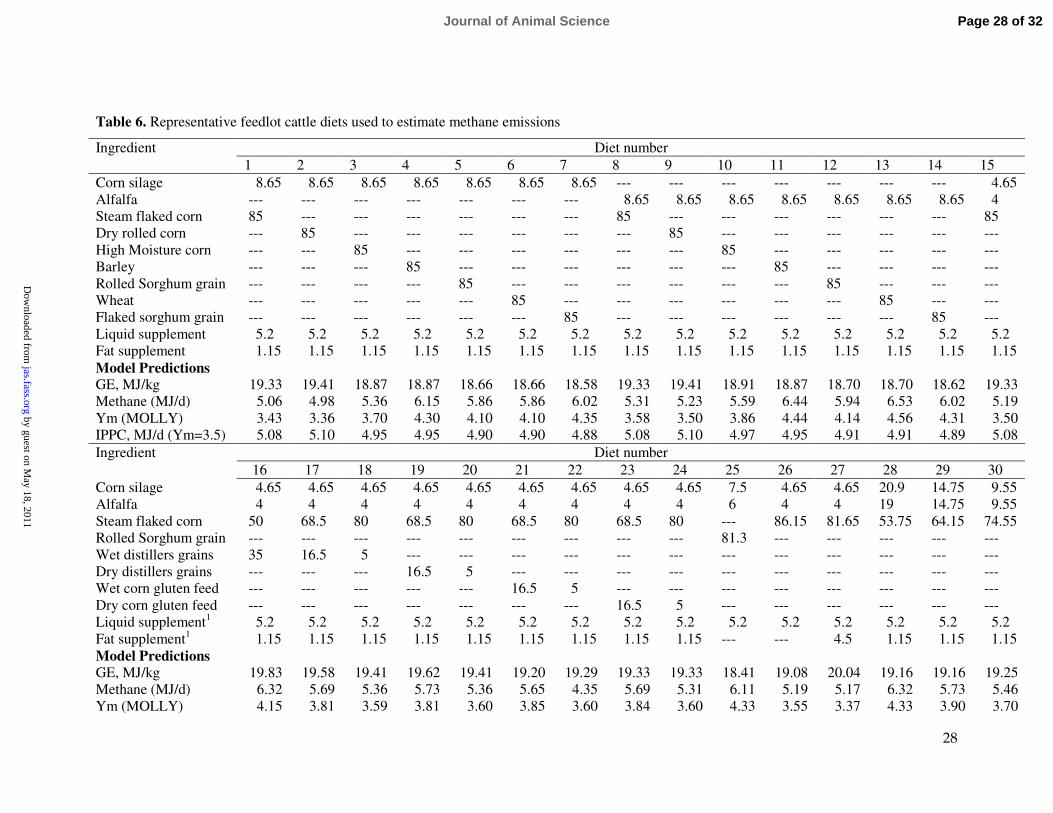
are representative of different regions of the United States. The IPCC model also showed ���
comparable results to MOLLY and has been included in the comparison of predictions. The ���
main difference among the diets used for prediction of CH4 emission was the proportion and ���
type of grain and silage included (Table 6). The average Ym values from all diets predicted by ���
MOLLY (3.88%) was within the range recommended by IPCC (3 ±1% for feedlot cattle). ���
However, MOLLY was responsive to dietary changes and its effect on CH4 emissions and the ���
Ym values predicted ranged from 3.36 to 4.56% of GE. MOLLY predicted that diets based on ���
corn had lower Ym values (average 3.5%) compared to those based on barley, sorghum and ���
wheat (4.2%; Table 6). ��
Mills et al. (2001) showed that utilizing corn starch increased total tract starch digestion��
in the small intestine compared to wheat starch which contributed to corn’s decreased CH4���
production. The authors recommended the use of corn starch compared to wheat or barley ���
because for similar energy availability, corn provides lower CH4 production and therefore is ���
more environmentally desirable. Castillo et al. (2001) suggested that wheat or barley based ���
diets support greater microbial protein synthesis than corn based diets by providing more ���
rumen-fermentable energy. Greater Ym values were estimated for diets based on wheat ���
(4.56% with alfalfa, and 4.10% with corn silage; Table 6). The higher Ym value in diet with ���
alfalfa may be associated with quick availability of nutrients in the rumen which might not be���
efficiently utilized by the microbes compared to corn silage based diet. Roughage diets are ��
also greater in cellulose which stimulate extensive digestion by cellulolytic microbes that ��
result in greater acetate production, therefore, greater CH4 emission (Owens and Goetsch, ����
1988).����
Page 14 of 32Journal of Animal Science
by guest on May 18, 2011jas.fass.orgDownloaded from
����
The model was also sensitive to differences in fat supplementation. The advantages of ����
adding fat to the diet is well documented and has recently been summarized by Kebreab et al. ����
(2006b). Odongo et al. (2007) reported that adding myristic acid in the diet reduced CH4����
emissions by 36% and addition of sunflower oil to diet decreased CH4 emissions by 21% in ����
steers (McGinn et al., 2004). One of the representative diets (diet 27; Table 6) had 4.5% fat for ����
that diet, the model estimated one of the lowest Ym values for CH4 emission (3.37%). The ����
MOLLY model takes into account bio hydrogenation as an alternative method of using excess ���
hydrogen in the rumen which reduces CH4 production.���
Methane emission values used in this study were measured using indirect calorimetry ����
(feedlot data) and SF6 tracer technique (dairy data). Comparison of models for their accuracy ����
of prediction of CH4 emissions depends not only on the models themselves but also on the ����
quality of the measured values. The technique used to measure CH4 emissions from cattle has ����
a significant impact on absolute values measured. For example, Grainger et al. (2007) ����
compared CH4 emissions measured using indirect calorimetry chambers and SF6 tracer ����
technique and found that the latter underestimates emissions by about 8% mainly because ����
emissions through rectum are not accounted for in the measurements. However, the authors ����
concluded that the SF6 technique can be used with reasonable accuracy for inventory ���
purposes. Kebreab et al. (2006b) reviewed studies that compared measurement techniques and ���
found similar systematic differences. Pasture based dairy and grazing beef animals are not ����
included in the study mainly due to paucity of reliable CH4 emission measurements and ����
variables that affect emissions such as DMI and detailed diet composition.����
Application of the average Ym values for dairy cows and feedlot cattle from the ����
mechanistic models results in a considerable difference in total emissions compared to IPCC����
Page 15 of 32 Journal of Animal Science
by guest on May 18, 2011jas.fass.orgDownloaded from

����
tier II calculations when using default Ym values. Assuming a dairy cow consuming 25 kg����
DM/d of a diet with energy concentration of 18 MJ/kg, daily CH4 emissions would be 29.3����
and 25.3 MJ according to IPCC and COWPOLL, respectively. The National Agricultural ����
Statistics Service reported that there were 9.2 million lactating cows in 2007 (NASS, 2007),���
which means that based on IPCC Ym value, in a 305 d lactation, the annual CH4 emissions ���
would be overestimated by an average of 12.5% by IPCC compared to COWPOLL (assuming ����
an average Ym). Similarly, there is a considerable difference in annual CH4 emission ����
estimates from feedlot cattle. From the 12 million feedlot cattle (in feedlots of > 1,000 ����
animals) in the United States (NASS, 2007), using IPCC values would underestimate ����
emissions by about 9.8% compared to the average Ym value from MOLLY would indicate.����
Clearly, the mechanistic models are diet specific so average values are used here to emphasize ����
the magnitude of differences in CH4 emissions when using apparently similar Ym values to ����
estimate national inventory.����
Another advantage of using mechanistic models compared to empirical models is that ���
mitigation options implemented at a farm or national level can be assessed for their ���
effectiveness. The only reductions in emissions that can be assessed using empirical models ����
are decline in cattle numbers and feed intake (amount and energy concentration). The ����
mechanistic models are ideal to investigate mitigation options that have been summarized in ����
the literature (Boadi et al., 2004; Kebreab et al., 2006b). ����
The study has demonstrated that national CH4 emissions inventories are more accurately ����
estimated by mechanistic models that are diet specific, and, hence, should be considered as the ����
preferred approach in preparing inventories. Given the complexities of the models, generating ����
national inventories estimates may not be feasible, however, mechanistic models can be used ����
Page 16 of 32Journal of Animal Science
by guest on May 18, 2011jas.fass.orgDownloaded from

����
to generate Ym values, that can be used in national inventory models. Additionally, future ���
studies to improve the reliability of these models will eventually help in assessing CH4���
reductions on a farm, state or national basis. When incentives are introduced (either financial ����
or through legislation), to mitigate CH4 emissions at a farm level mechanistic models would ����
be excellent tools to make reliable estimates of enteric CH4 emissions. However, the models ����
need to be extended with methane losses during storage of fermented feedstuffs such as silage.����
����
LITERATURE CITED����
����
Archibeque, S. L., H. C. Freetly, N. A. Cole, and C. L. Ferrell. 2007. The influence of ����
oscillating dietary protein concentrations on finishing cattle. II. Nutrient retention and ���
ammonia emissions. J. Anim. Sci. 85:1496-1503.���
Archibeque, S. L., D. N. Miller, H. C. Freetly, and C. L. Ferrell. 2006. Feeding high-moisture ����
corn instead of dry-rolled corn reduces odorous compound production in manure of ����
finishing beef cattle without decreasing performance. J. Anim. Sci. 84:1767-1777.����
Argyle J. L., and Baldwin R. L. 1988. Modeling of the rumen water kinetics and effects on ����
rumen pH changes. J. Dairy Sci. 71:1178-1188.����
Baldwin R. L. 1995. Modeling Ruminant Digestion and Metabolism. Chapman & Hall, ����
London, UK.����
Bannink A., J. Kogut, J. Dijkstra, J. France, E. Kebreab, A. M. Van Vuuren, and S. ����
Tamminga. 2006. Estimation of the stoichiometry of volatile fatty acid production in the ���
rumen of lactating cows. J. Theor. Biol. 238:36-51.���
Page 17 of 32 Journal of Animal Science
by guest on May 18, 2011jas.fass.orgDownloaded from
���
Benchaar C., J. Rivest, C. Pomar, and J. Chiquette. 1998. Prediction of methane production ����
from dairy cows using existing mechanistic models and regression equations. J. Anim. ����
Sci. 76:617-627.����
Bibby J., and H. Toutenburg. 1977. Prediction and Improved Estimation in Linear Models. ����
John Wiley & Sons, London.����
Boadi, D. A., C. Benchaar, J. Chiquette, and D. Massé. 2004. Mitigation strategies to reduce ����
enteric methane emissions from dairy cows: update review. Can. J. Anim. Sci. 84:319–����
336.����
Castillo, A. R., E. Kebreab, D. E. Beever, J. H. Barbi, J. D. Sutton, H. C. Kirby, and J. France. ���
2001. The effect of energy supplementation on nitrogen utilization in lactating dairy cows ���
fed grass silage diets. J. Anim. Sci. 79:240-246.���
Dijkstra J., H. D. St. C. Neal, D. E. Beever and J. France 1992. Simulation of nutrient ���
digestion, absorption and outflow in the rumen: model description. J. Nutr. 122:2239-���
2256.���
Ellis J. L., E. Kebreab, N. E. Odongo, B. W. McBride, E. K. Okine, and J. France. 2007. ���
Prediction of methane production from dairy and beef cattle. J. Dairy Sci. 90:3456-3467.���
Grainger, C., T. Clarke, S. M. McGinn, M. J. Auldist, K. A. Beauchemin, M. C. Hannah, G. ���
C. Waghorn, H. Clark, and R. J. Eckard. 2007. Methane emissions from dairy cows ���
measured using the sulfur hexafluoride (SF6) tracer and chamber techniques. J. Dairy Sci. ��
90:2755-2766.��
Intergovernmental Panel on Climate Change (IPCC). 2006. 2006 IPCC Guidelines for ���
National Greenhouse Gas Inventories. IGES, Hayama, Kanagawa, Japan.���
http://www.ipcc-nggip.iges.or.jp. Accessed Jan. 20, 2008.���
Page 18 of 32Journal of Animal Science
by guest on May 18, 2011jas.fass.orgDownloaded from
���
Johnson, K. A., and D. E. Johnson. 1995. Methane emissions from cattle. J. Anim. Sci. ���
73:2483–2492.���
Johnson, K. A., R. L. Kincaid, H. H. Westberg, C. T. Gaskins, B. K. Lamb, and J. D. ���
Cronrath. 2002. The effect of oilseeds in diets of lactating cows on milk production and ���
methane emissions. J. Dairy Sci. 85:1509-1515.���
Kebreab E., J. A. N. Mills, L. A. Crompton, A. Bannink, J. Dijkstra, W. J. J. Gerrits, and J. ��
France. 2004. An integrated mathematical model to evaluate nutrient partition in dairy ��
cattle between animal and environment. Anim. Feed Sci. Technol. 112:131-154.����
Kebreab, E., J. France, B. W. McBride, N. E. Odongo, A. Bannink, J. A. N Mills, and J. ����
Dijkstra. 2006a. Evaluation of models to predict methane emissions from enteric ����
fermentation in North American dairy cattle. Pages 299-313 in Nutrient Utilization in ����
Farm Animals: Modelling Approach. E. Kebreab, J. Dijkstra, W. J. J. Gerrits, A. Bannink, ����
and J. France, eds. CAB International, Wallingford, UK. ����
Kebreab, E., K. Clarke, C. Wagner-Riddle, and J. France. 2006b. Methane and nitrous oxide ����
emissions from Canadian animal agriculture – a review. Can. J. Anim. Sci. 86:135-158.����
Lin, L. I. K. 1989. A concordance correlation coefficient to evaluate reproducibility. ���
Biometrics 45:255-268.���
McGinn, S. M., Beauchemin, K. A., Coates, T. and Colombatto, D. 2004. Methane emissions ����
from beef cattle: Effects of monensin, sunflower oil, enzymes, yeast, and fumaric acid. J. ����
Anim. Sci. 82:3346–3356.����
Mills, J. A .N., J. Dijkstra, A. Bannink, S. B. Cammell, E. Kebreab, and J. France. 2001. A ����
mechanistic model of whole-tract digestion and methanogenesis in the lactating dairy ����
cow: model development, evaluation, and application. J. Anim. Sci. 79:1584-1597.����
Page 19 of 32 Journal of Animal Science
by guest on May 18, 2011jas.fass.orgDownloaded from
����
Moe, P. W., and H. F. Tyrrell. (1979) Methane production in dairy cows. J. Dairy Sci. ����
62:1583–1586.����
MOLLY. 2007. Version 3.0 available from http://animalscience.ucdavis.edu/research/molly. ���
Accessed Dec. 12, 2007.���
Murphy, M. R., R. L. Baldwin, and L. J. Koong. 1982. Estimation of stoichiometric ����
parameters for rumen fermentation of roughage and concentrate diets. J. Anim. Sci. ����
55:279-296.����
National Agricultural Statistics Service (NASS). 2007. United States and Canadian Cattle. ����
http://www.gov.mb.ca/agriculture/statistics/pdf/uscancattlestatjuly2007.pdf. Accessed ����
Dec. 19, 2007.����
Nienaber, J. A., and A. L. Maddy. 1985. Temperature controlled multiple chamber indirect ����
calorimeter - Design and operation. Trans. ASAE 28:555–560.����
Odongo, N. E., M. M. Or-Rashid, E. Kebreab, J. France, and B. W. McBride. 2007. Effect of ���
supplementing myristic acid in dairy cow rations on ruminal methanogenesis and fatty ���
acid profile in milk. J. Dairy Sci. 90:1851-1858.����
Owens, F. N., and A. L. Goetsch. 1988. Ruminal fermentation. Pages 145-171 in The ����
Ruminant Animal – Digestive Physiology and Nutrition. D. C. Church, ed. Printice Hall, ����
Englewood Cliffs, NJ.����
Shaver, R., and R. Kaiser. 2004. Feeding programs in high producing dairy herds. Proc. Tri-����
State Dairy Nutrition Conference, Fort Wayne, IN. pp.143-168.����
St-Pierre, N. R. 2003. Reassessment of biases in predicted nitrogen flows to the duodenum by ����
NRC 2001. J. Dairy Sci. 86:344-350.����
Page 20 of 32Journal of Animal Science
by guest on May 18, 2011jas.fass.orgDownloaded from
����
U.S. Environmental Protection Agency (U.S. EPA). 2006. Global Anthropogenic Emissions ���
of Non-CO2 Greenhouse Gases 1990-2020 (EPA Report 430-R-06-003), June 2006, 274 ���
pp. Also available on http://www.epa.gov/methane/pdfs/GreenhouseGasReport.pdf.����
U.S. Environmental Protection Agency (U.S. EPA). 2007. Inventory of U.S. Greenhouse Gas ����
Emissions and Sinks: 1990-2005 (EPA Report 430-R-07-002), April 2007, 393 pp. Also ����
available on http://www.epa.gov/climatechange/emissions/downloads06/07CR.pdf.����
Vasconcelos, J. T., and M. L. Galyean. 2007. Nutritional recommendations of feedlot ����
consulting nutritionists: The 2007 Texas Tech University survey. J. Anim. Sci. 85:2772-����
2781.����
Westberg, H., B. Lamb, K. A. Johnson, and M. Huyler. 2001. Inventory of methane emissions ����
from U.S. cattle. J. Geophys. Res. 106:12,633-12,642.���
Wilkerson, V. A., D. P. Casper, and D. R. Mertens. 1995. The prediction of methane ���
production of Holstein cows by several equations. J. Dairy Sci. 78:2402–2414.����
Page 21 of 32 Journal of Animal Science
by guest on May 18, 2011jas.fass.orgDownloaded from
����
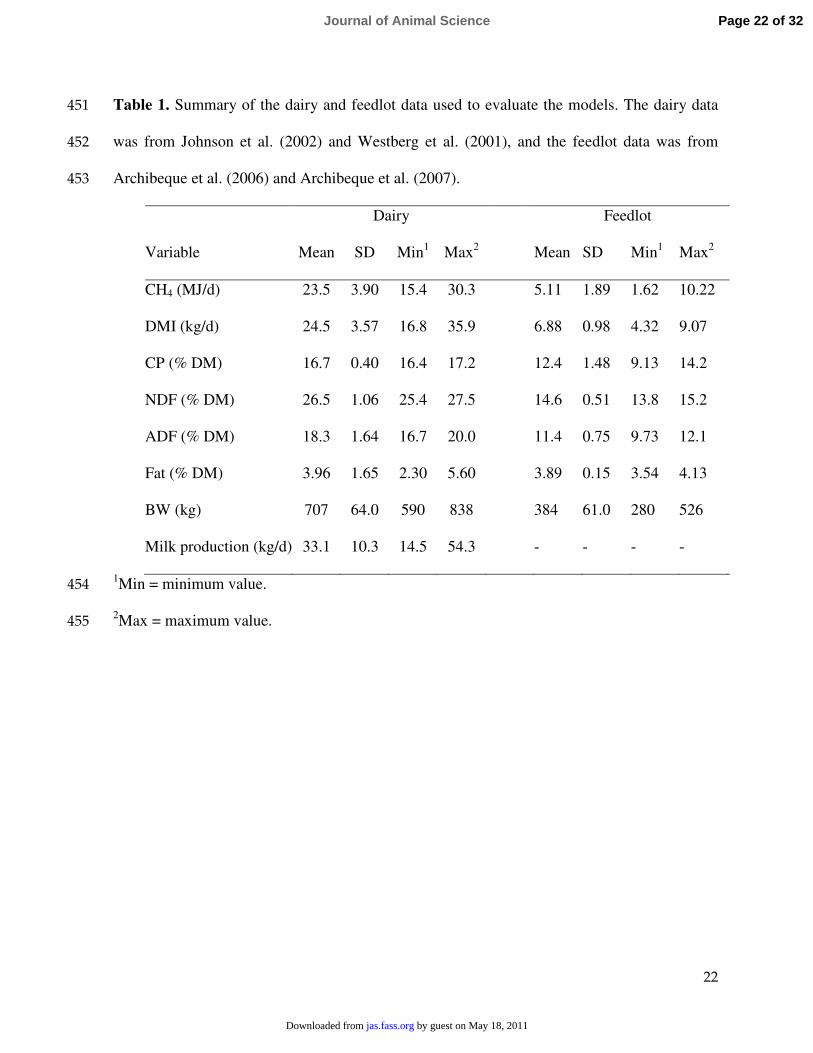
Table 1. Summary of the dairy and feedlot data used to evaluate the models. The dairy data ����
was from Johnson et al. (2002) and Westberg et al. (2001), and the feedlot data was from ����
Archibeque et al. (2006) and Archibeque et al. (2007).����
Dairy Feedlot
Variable Mean SD Min1 Max2 Mean SD Min1 Max2
CH4 (MJ/d) 23.5 3.90 15.4 30.3 5.11 1.89 1.62 10.22
DMI (kg/d) 24.5 3.57 16.8 35.9 6.88 0.98 4.32 9.07
CP (% DM) 16.7 0.40 16.4 17.2 12.4 1.48 9.13 14.2
NDF (% DM) 26.5 1.06 25.4 27.5 14.6 0.51 13.8 15.2
ADF (% DM) 18.3 1.64 16.7 20.0 11.4 0.75 9.73 12.1
Fat (% DM) 3.96 1.65 2.30 5.60 3.89 0.15 3.54 4.13
BW (kg) 707 64.0 590 838 384 61.0 280 526
Milk production (kg/d) 33.1 10.3 14.5 54.3 - - - -
1Min = minimum value.����
2Max = maximum value.����
Page 22 of 32Journal of Animal Science
by guest on May 18, 2011jas.fass.orgDownloaded from
����
Table 2. Comparison of model performance using dairy cattle diets summarized in Table 1. ����
Models
MOLLY COWPOLL Moe and
Tyrrell
(1979)
IPCC
Mean Square Prediction Error (MSPE)1
RMSPE(MJ) 7.42 3.41 9.51 8.94
ECT (%) 53.47 1.37 50.07 64.62
ER (%) 20.43 3.91 24.37 17.52
ED (%) 26.10 94.72 25.56 17.56
Concordance Correlation Coefficient (CCC)2
r 0.50 0.75 0.43 0.50
Cb 0.52 0.95 0.47 0.55
µ -0.34 0.11 0.48 -0.271RMSPE = root MSPE (MJ); ECT = MSPE decomposed into error due to overall bias of ����
prediction; ER = error due to deviation of the regression slope from unity; ED = error due to���
the disturbance or random variation.���2r = correlation coefficient estimate; Cb = Bias correction factor; µ = location shift relative to ����
the scale (squared difference of the means relative to the product of 2 standard deviations).����
Page 23 of 32 Journal of Animal Science
by guest on May 18, 2011jas.fass.orgDownloaded from
����
Table 3. Comparison of model performance using feedlot cattle diets summarized in Table 1. ����
Models
MOLLY COWPOLL Moe and
Tyrrell
(1979)
IPCC
Mean Square Prediction Error (MSPE)1
RMSPE(MJ) 1.14 2.74 2.26 1.98
ECT (%) 0.29 60.74 30.99 9.67
ER (%) 0.15 0.37 0.10 5.52
ED (%) 99.56 38.89 68.91 84.81
Concordance Correlation Coefficient (CCC)2
r 0.69 0.39 0.51 0.51
Cb 0.66 0.41 0.48 0.55
µ 0.08 -0.35 -0.27 0.141RMSPE = root MSPE (MJ); ECT = MSPE decomposed into error due to overall bias of ����
prediction; ER = error due to deviation of the regression slope from unity; ED = error due to ����
the disturbance or random variation.����2r = correlation coefficient estimate; Cb = Bias correction factor; µ = location shift relative to ����
the scale (squared difference of the means relative to the product of 2 standard deviations).����
Page 24 of 32Journal of Animal Science
by guest on May 18, 2011jas.fass.orgDownloaded from

��
Table 4. Representative diets from Wisconsin used to estimate methane emissions
Diet 1 Diet 2 Diet 3 Diet 4 Diet 5 Diet 6Mature Dry Mature Dry Mature Dry Mature Dry Mature Dry Mature Dry
Ingredients, % DM Cows Cows Cows Cows Cows Cows Cows Cows Cows Cows Cows CowsWheat Straw 1.5 5 --- --- --- --- --- --- 0.6 --- --- 9.7Baled Hay 7.2 9.3 --- --- --- --- --- --- 2.6 11 4.4 ---Haylage 9.9 53.3 20.4 26.7 24.0 29.0 16 57.0 19.5 28 26.6 ---Corn Silage 23.4 31.1 24.5 5.6 22.0 31.0 34 36 23.3 54 21.9 36.2Corn Stalkage --- --- --- 32.4 --- --- --- --- --- --- --- ---Oatlage --- --- --- --- --- 38.0 --- 6.1 --- --- --- 36.9Dry shelled corn --- --- 24.4 --- 26.1 --- 7.7 --- --- --- --- 8.7High Moisture Shelled Corn 29.6 --- --- --- --- --- 9.8 --- 21.6 2.4 20.5 ---Soy hulls --- --- --- 30.2 --- --- 7.2 --- 3.9 --- --- ---Corn Starch 0.8 --- --- --- --- --- --- --- --- --- --- ---Corn gluten feed 2.3 --- 3.4 --- --- --- --- --- 5.5 --- --- ---Corn gluten meal, 60% --- --- --- --- 0.7 --- 0.5 --- --- --- --- ---Whole Cottonseed 9.2 --- 7.3 --- 9.5 --- 2.6 --- 6.7 --- --- ---Beet pulp --- --- --- --- --- --- --- --- 6.2 --- --- ---Liquid feed supplement 1.7 --- --- --- 2.9 --- 4.9 --- --- --- --- ---Soybean meal, 48% 6.5 --- --- --- 7.0 --- 7.2 --- 6.0 --- --- 4.8Distillers Dried Grains 3.1 --- --- --- 0.7 --- --- --- --- --- --- ---Roasted soybeans 1.7 --- 11.4 --- 2.3 --- 5.2 --- --- --- 6.0 ---Linseed meal 6.5 --- 2.9 --- --- --- --- --- --- --- --- ---Feather meal 3.1 --- 0.4 --- --- --- --- --- --- --- --- ---Blood meal 1.2 --- 1.2 --- 1.1 --- 0.7 --- --- --- --- ---Fish meal --- --- --- --- --- --- --- 0.7 --- --- ---Dry cow mix --- --- --- --- --- --- --- --- --- 4.6 --- ---Purina milking custom-ext1 --- --- --- --- --- --- --- --- --- --- 20.6 ---Purina dry cow custom2 --- --- --- --- --- --- --- --- --- --- --- 2.9Urea 0.2 --- --- 0.2 --- --- --- --- 0.1 --- --- ---Tallow 0.2 --- --- --- 0.4 --- --- --- 0.6 --- --- ---Megalac3 0.4 --- --- --- --- --- 0.5 --- --- --- --- ---
Page 25 of 32 Journal of Animal Science
by guest on May 18, 2011
jas.fass.orgD
ownloaded from
��
Energy booster4 --- --- --- --- 1.0 --- --- --- --- --- --- ---Minerals/Vits/Additives 2.8 1.3 4.1 4.9 2.3 --- 3.7 0.9 2.7 --- --- 0.8Cow performanceDMI (kg/cow/d) 27.3 12.7 25.0 11.36 25.00 13.64 25.45 13.64 30.91 13.64 26.36 12.27Milk (kg) 48.6 --- 39.6 --- 42.50 --- 44.04 --- 53.78 --- 44.82 ---Model PredictionsGE, MJ/kg 19.33 18.54 19.83 18.37 19.62 18.54 19.16 18.54 19.12 18.41 19.20 18.45Methane, MJ/d 26.11 14.06 19.25 15.77 24.77 12.80 29.37 15.69 35.77 14.94 30.38 15.61Ym (COWPOLL) 4.93 5.84 3.86 7.43 5.01 4.98 5.98 6.11 6.01 5.86 5.96 6.78IPCC, MJ/d Ym=6.5 34.31 15.31 32.22 13.56 31.88 16.44 31.71 16.44 38.41 16.32 32.89 14.731,2 Land O’ Lakes Purina Feed LLC, St. Paul, MN3Arm & Hammer Animal Nutrition, Princeton, NJ4 MSC Specialty Nutrition, Dundee IL
Page 26 of 32Journal of Animal Science
by guest on May 18, 2011
jas.fass.orgD
ownloaded from

����
Table 5. Representative diets from Texas, New Mexico, Kansas and Washington states used to
estimate methane emissions
1 Soybean meal, West Central, Ralston, IA2 Wet corn gluten feed, Cargill, Minneapolis, MN
Texas New Mexico Kansas WashingtonMature Dry Mature Dry Mature Dry Mature
Ingredients, % DM Cows Cows Cows Cows Cows Cows CowsWheat straw --- --- --- --- --- 17.1 ---Alfalfa hay 7.66 --- 13.37 21.2 13.7 10.1 23.9Oat hay --- --- --- 11.6 --- --- ---Ground hay --- 37.5 --- --- --- --- ---Corn silage --- --- 45.1 18.7 49.1 10.5 15.6Wheat silage 32.0 50.0 --- --- --- --- ---Sorghum silage 20.4 --- --- --- --- 54.9 ---Triticale silage --- --- 6.38 38.9 --- --- 6.04Canola --- --- --- --- 6.44 --- 4.65Soy hulls --- --- 1.3 6.98 --- --- 4.85Soy plus1 --- --- 1.3 --- --- --- ---Corn grain flaked 17.6 --- 6.99 --- 14.1 --- 6.87Corn grain ground --- --- 6.84 --- --- --- 16.3Corn gluten feed 2.94 7.5 --- --- --- --- ---Whole Cottonseed 2.55 --- 7.69 --- 6.44 --- 4.84Beet pulp --- --- 3.24 --- --- --- 4.21High fat pellet 7.02 --- --- --- --- --- ---Soybean meal, 48% 5.11 --- 5.24 1.18 --- --- 3.12Distillers Dried Grains 3.19 3.75 --- --- 1.95 7.03 6.08Molasses --- --- --- 0.6 --- --- ---Blood meal --- --- --- --- --- --- 0.78Sweet bran2 --- --- --- --- 5.92 --- ---Minerals/Vitamins/Additives 1.59 1.25 2.54 0.92 2.41 0.54 2.8Model PredictionsGE, MJ/kg 20.71 18.62 19.37 19.08 19.25 18.79 19.50Methane, MJ/d 19.66 17.03 26.11 11.88 26.94 15.61 26.65Ym (COWPOLL) 3.78 7.20 5.36 4.91 5.57 6.53 5.43IPCC, MJ/d Ym=6.5 33.64 15.15 31.46 15.52 31.30 15.27 31.67
Page 27 of 32 Journal of Animal Science
by guest on May 18, 2011jas.fass.orgDownloaded from
�
Table 6. Representative feedlot cattle diets used to estimate methane emissions
Ingredient Diet number1 2 3 4 5 6 7 8 9 10 11 12 13 14 15
Corn silage 8.65 8.65 8.65 8.65 8.65 8.65 8.65 --- --- --- --- --- --- --- 4.65Alfalfa --- --- --- --- --- --- --- 8.65 8.65 8.65 8.65 8.65 8.65 8.65 4Steam flaked corn 85 --- --- --- --- --- --- 85 --- --- --- --- --- --- 85Dry rolled corn --- 85 --- --- --- --- --- --- 85 --- --- --- --- --- ---High Moisture corn --- --- 85 --- --- --- --- --- --- 85 --- --- --- --- ---Barley --- --- --- 85 --- --- --- --- --- --- 85 --- --- --- ---Rolled Sorghum grain --- --- --- --- 85 --- --- --- --- --- --- 85 --- --- ---Wheat --- --- --- --- --- 85 --- --- --- --- --- --- 85 --- ---Flaked sorghum grain --- --- --- --- --- --- 85 --- --- --- --- --- --- 85 ---Liquid supplement 5.2 5.2 5.2 5.2 5.2 5.2 5.2 5.2 5.2 5.2 5.2 5.2 5.2 5.2 5.2Fat supplement 1.15 1.15 1.15 1.15 1.15 1.15 1.15 1.15 1.15 1.15 1.15 1.15 1.15 1.15 1.15Model PredictionsGE, MJ/kg 19.33 19.41 18.87 18.87 18.66 18.66 18.58 19.33 19.41 18.91 18.87 18.70 18.70 18.62 19.33Methane (MJ/d) 5.06 4.98 5.36 6.15 5.86 5.86 6.02 5.31 5.23 5.59 6.44 5.94 6.53 6.02 5.19Ym (MOLLY) 3.43 3.36 3.70 4.30 4.10 4.10 4.35 3.58 3.50 3.86 4.44 4.14 4.56 4.31 3.50IPPC, MJ/d (Ym=3.5) 5.08 5.10 4.95 4.95 4.90 4.90 4.88 5.08 5.10 4.97 4.95 4.91 4.91 4.89 5.08Ingredient Diet number
16 17 18 19 20 21 22 23 24 25 26 27 28 29 30Corn silage 4.65 4.65 4.65 4.65 4.65 4.65 4.65 4.65 4.65 7.5 4.65 4.65 20.9 14.75 9.55Alfalfa 4 4 4 4 4 4 4 4 4 6 4 4 19 14.75 9.55Steam flaked corn 50 68.5 80 68.5 80 68.5 80 68.5 80 --- 86.15 81.65 53.75 64.15 74.55Rolled Sorghum grain --- --- --- --- --- --- --- --- --- 81.3 --- --- --- --- ---Wet distillers grains 35 16.5 5 --- --- --- --- --- --- --- --- --- --- --- ---Dry distillers grains --- --- --- 16.5 5 --- --- --- --- --- --- --- --- --- ---Wet corn gluten feed --- --- --- --- --- 16.5 5 --- --- --- --- --- --- --- ---Dry corn gluten feed --- --- --- --- --- --- --- 16.5 5 --- --- --- --- --- ---Liquid supplement1 5.2 5.2 5.2 5.2 5.2 5.2 5.2 5.2 5.2 5.2 5.2 5.2 5.2 5.2 5.2Fat supplement1 1.15 1.15 1.15 1.15 1.15 1.15 1.15 1.15 1.15 --- --- 4.5 1.15 1.15 1.15Model PredictionsGE, MJ/kg 19.83 19.58 19.41 19.62 19.41 19.20 19.29 19.33 19.33 18.41 19.08 20.04 19.16 19.16 19.25Methane (MJ/d) 6.32 5.69 5.36 5.73 5.36 5.65 4.35 5.69 5.31 6.11 5.19 5.17 6.32 5.73 5.46Ym (MOLLY) 4.15 3.81 3.59 3.81 3.60 3.85 3.60 3.84 3.60 4.33 3.55 3.37 4.33 3.90 3.70
Page 28 of 32Journal of Animal Science
by guest on May 18, 2011
jas.fass.orgD
ownloaded from
�
IPPC, MJ/d (Ym=3.5) 5.20 5.14 5.10 5.15 5.10 5.04 5.06 5.08 5.08 4.83 5.01 5.26 5.03 5.03 5.05
1 The liquid and fat supplements indicated in these diets represent general supplements as indicated by the survey of Vasconcelos and
Galyean (2007).
Page 29 of 32 Journal of Animal Science
by guest on May 18, 2011
jas.fass.orgD
ownloaded from
����
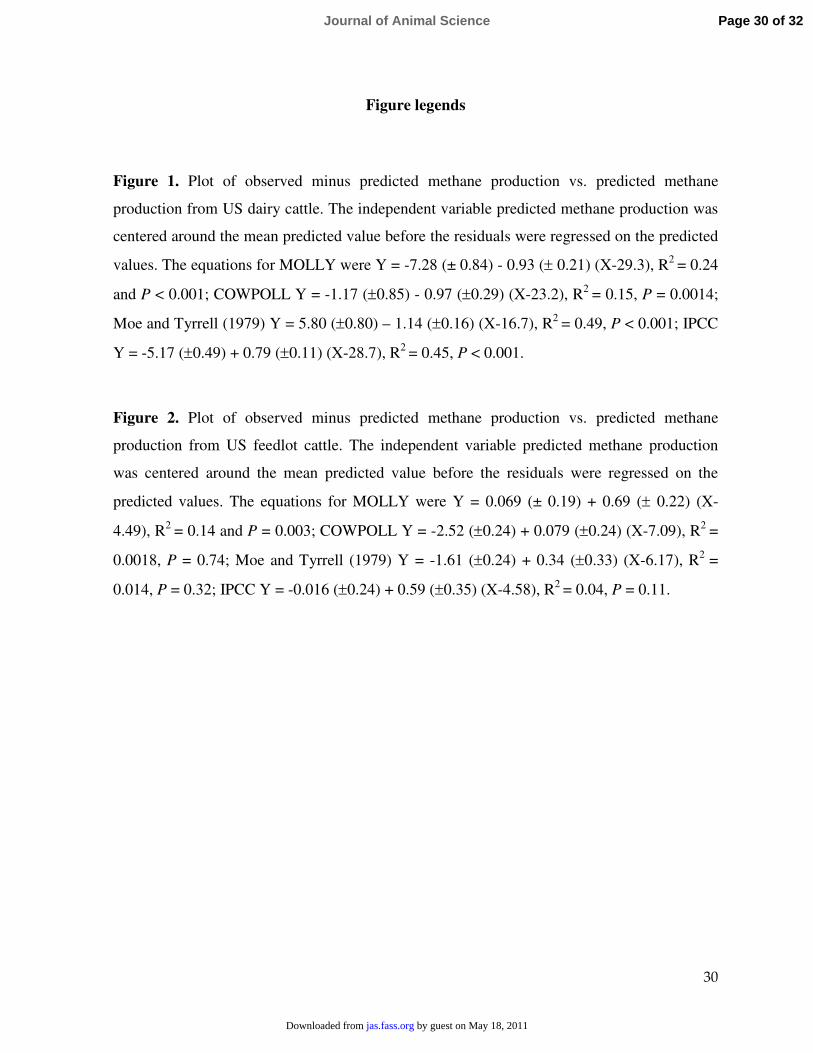
Figure legends
Figure 1. Plot of observed minus predicted methane production vs. predicted methane
production from US dairy cattle. The independent variable predicted methane production was
centered around the mean predicted value before the residuals were regressed on the predicted
values. The equations for MOLLY were Y = -7.28 (± 0.84) - 0.93 (± 0.21) (X-29.3), R2 = 0.24
and P < 0.001; COWPOLL Y = -1.17 (±0.85) - 0.97 (±0.29) (X-23.2), R2 = 0.15, P = 0.0014;
Moe and Tyrrell (1979) Y = 5.80 (±0.80) – 1.14 (±0.16) (X-16.7), R2 = 0.49, P < 0.001; IPCC
Y = -5.17 (±0.49) + 0.79 (±0.11) (X-28.7), R2 = 0.45, P < 0.001.
Figure 2. Plot of observed minus predicted methane production vs. predicted methane
production from US feedlot cattle. The independent variable predicted methane production
was centered around the mean predicted value before the residuals were regressed on the
predicted values. The equations for MOLLY were Y = 0.069 (± 0.19) + 0.69 (± 0.22) (X-
4.49), R2 = 0.14 and P = 0.003; COWPOLL Y = -2.52 (±0.24) + 0.079 (±0.24) (X-7.09), R2 =
0.0018, P = 0.74; Moe and Tyrrell (1979) Y = -1.61 (±0.24) + 0.34 (±0.33) (X-6.17), R2 =
0.014, P = 0.32; IPCC Y = -0.016 (±0.24) + 0.59 (±0.35) (X-4.58), R2 = 0.04, P = 0.11.
Page 30 of 32Journal of Animal Science
by guest on May 18, 2011jas.fass.orgDownloaded from
����
MOLLY
-30
-20
-10
0
10
20
30COWPOLL
Moe and Tyrrell (1979)
Predicted methane production (MJ/d)
10 15 20 25 30 35 40
Obs
erve
d -
Pred
icte
d m
etha
ne p
rodu
ctio
n (M
J/d)
-30
-20
-10
0
10
20
IPCC
10 15 20 25 30 35 40
Fig 1
Page 31 of 32 Journal of Animal Science
by guest on May 18, 2011jas.fass.orgDownloaded from

����
MOLLY
-4
-2
0
2
4 COWPOLL
Moe and Tyrrell (1979)
Predicted methane production (MJ/d)
2 4 6 8
Obs
erve
d -
Pred
icte
d m
etha
ne p
rodu
ctio
n (M
J/d)
-4
-2
0
2
4IPCC
2 4 6 8
Fig 2
Page 32 of 32Journal of Animal Science
by guest on May 18, 2011jas.fass.orgDownloaded from

Citations
ticleshttp://jas.fass.org/content/early/2008/06/06/jas.2008-0960.citation#otherarThis article has been cited by 2 HighWire-hosted articles:
by guest on May 18, 2011jas.fass.orgDownloaded from