A method for measuring methane oxidation rates using low-levels of 14C-labeled methane and...
16
245 Marine methane oxidation consumes 80% (85-304 Tg CH 4 y –1 ; Hinrichs and Boetius 2002; Reeburgh 2007) or more of the methane (CH 4 ) released from sediments and is a globally important sink for the potent greenhouse gas. Measurements of marine methane oxidation rates, however, are sparse and the environmental controls on oxidation are not well under- stood. Further, scaling the available rate measurements to the world ocean introduces large uncertainties to estimates of total marine methane consumption (the range is large: 85-304 Tg CH 4 yr –1 ). Methane oxidation occurs by two distinct processes in oxic and anoxic environments. Aerobic methane oxidation (Eq. 1) is mediated by methanotrophs (bacteria capable of using CH 4 as their sole source of carbon and energy), whereas anaerobic oxidation of methane (AOM; Eq. 2) is mediated by archea in consortia with sulfate reducing bacteria (Reeburgh 2007). Recent studies show that AOM in low sulfate environments may be coupled with nitrate, iron, or manganese instead of sulfate (e.g., Beal et al. 2009; Caldwell et al. 2008; Crowe et al. 2010; Raghoebarsing et al. 2006). For either process, after methane is fixed, its carbon can be respired for energy or incorporated into the microbe’s cell biomass. CH 4 + 2O 2 → CO 2 + 2H 2 O + [cell biomass] (1) CH 4 + SO 4 2– → HCO 3 – + HS – + H 2 O + [cell biomass] (2) Rates of the above reactions in water columns and sedi- ments have been measured by radiotracer ( 14 C-CH 4 or 3 H-CH 4 ) methods (e.g., Alperin and Reeburgh 1985; Carini et al. 2005; Griffiths et al. 1982; Hoehler et al. 1994; Joye et al. 2004; Joye et al. 1999; Reeburgh et al. 1991; Reeburgh 1980; Treude et al. 2003; Valentine et al. 2010; Valentine et al. 2001), stable iso- tope tracer ( 13 C-CH 4 ) methods (e.g., Moran et al. 2008; Moran et al. 2007), tracking changes in methane concentration over time in discrete samples (e.g., Carini et al. 2003; Girguis et al. A method for measuring methane oxidation rates using low- levels of 14 C-labeled methane and accelerator mass spectrometry Mary A. Pack 1 *, Monica B. Heintz 2 , William S. Reeburgh 1 , Susan E. Trumbore 1 , David L. Valentine 2 , Xiaomei Xu 1 , and Ellen R. M. Druffel 1 1 University of California Irvine, Irvine, California 92697 2 University of California Santa Barbara, Santa Barbara, California 93106 Abstract We report a new method for methane oxidation rate measurements that uses 10 3 -10 5 times less 14 C-CH 4 than existing measurements by taking advantage of the high sensitivity of accelerator mass spectrometry. Methane oxidation in the marine environment is a microbial process of global importance because it prevents methane released from underlying reservoirs from reaching the ocean and atmosphere. Rate measurements provide a cru- cial tool for assessing the efficacy of this process across a range of environments, but the current methods use high amounts of radioactive elements ( 3 H- or 14 C-CH 4 ), tend to increase methane concentrations in a sample markedly over in situ levels, and are limited by strict health and safety regulations. The low-level method pre- sented here uses levels of 14 C-CH 4 that are below transportation regulations, produce samples that do not require treatment as radioactive waste, and allow for tracer level rate measurements in low methane environments. Moreover, the low-level method lays the analytical foundation for a below-regulation rate measurement that could be used broadly and in-situ. Parallel rate measurements with the low-level 14 C-CH 4 and existing 3 H-CH 4 methods are generally consistent with a correlation coefficient of 0.77. However, the low-level method in most cases yields slower rates than the 3 H method possibly due to temperature, priming, and detection limit effects. *Corresponding author: E-mail: [email protected] Acknowledgments We thank the officers and crew of the R/V Atlantis for their support at sea, John Southon, Sheila Griffin, Kevin Druffel-Rodriguez, and Matthew Khosh for their assistance in the laboratory, and two anonymous review- ers for their constructive comments. Funding for this work was provided by the National Science Foundation (NSF Grants OCE-0622759 and OCE-0447395) and the US Department of Energy Methane Hydrate Program (DE-NT005667). DOI 10.4319/lom.2011.9.245 Limnol. Oceanogr.: Methods 9, 2011, 245–260 © 2011, by the American Society of Limnology and Oceanography, Inc. LIMNOLOGY and OCEANOGRAPHY: METHODS
-
Upload
independent -
Category
Documents
-
view
2 -
download
0
Transcript of A method for measuring methane oxidation rates using low-levels of 14C-labeled methane and...

245
Marine methane oxidation consumes 80% (85-304 Tg CH4
y–1; Hinrichs and Boetius 2002; Reeburgh 2007) or more of themethane (CH4) released from sediments and is a globallyimportant sink for the potent greenhouse gas. Measurementsof marine methane oxidation rates, however, are sparse andthe environmental controls on oxidation are not well under-stood. Further, scaling the available rate measurements to theworld ocean introduces large uncertainties to estimates oftotal marine methane consumption (the range is large: 85-304Tg CH4 yr
–1).Methane oxidation occurs by two distinct processes in oxic
and anoxic environments. Aerobic methane oxidation (Eq. 1)is mediated by methanotrophs (bacteria capable of using CH4
as their sole source of carbon and energy), whereas anaerobicoxidation of methane (AOM; Eq. 2) is mediated by archea inconsortia with sulfate reducing bacteria (Reeburgh 2007).Recent studies show that AOM in low sulfate environmentsmay be coupled with nitrate, iron, or manganese instead ofsulfate (e.g., Beal et al. 2009; Caldwell et al. 2008; Crowe et al.2010; Raghoebarsing et al. 2006). For either process, aftermethane is fixed, its carbon can be respired for energy orincorporated into the microbe’s cell biomass.
CH4 + 2O2 → CO2 + 2H2O + [cell biomass] (1)
CH4 + SO42–→ HCO3
– + HS– + H2O + [cell biomass] (2)
Rates of the above reactions in water columns and sedi-ments have been measured by radiotracer (14C-CH4 or
3H-CH4)methods (e.g., Alperin and Reeburgh 1985; Carini et al. 2005;Griffiths et al. 1982; Hoehler et al. 1994; Joye et al. 2004; Joyeet al. 1999; Reeburgh et al. 1991; Reeburgh 1980; Treude et al.2003; Valentine et al. 2010; Valentine et al. 2001), stable iso-tope tracer (13C-CH4) methods (e.g., Moran et al. 2008; Moranet al. 2007), tracking changes in methane concentration overtime in discrete samples (e.g., Carini et al. 2003; Girguis et al.
A method for measuring methane oxidation rates using low-levels of 14C-labeled methane and accelerator mass spectrometryMary A. Pack1*, Monica B. Heintz2, William S. Reeburgh1, Susan E. Trumbore1, David L. Valentine2, Xiaomei Xu1,and Ellen R. M. Druffel11University of California Irvine, Irvine, California 926972University of California Santa Barbara, Santa Barbara, California 93106
AbstractWe report a new method for methane oxidation rate measurements that uses 103-105 times less 14C-CH4 than
existing measurements by taking advantage of the high sensitivity of accelerator mass spectrometry. Methaneoxidation in the marine environment is a microbial process of global importance because it prevents methanereleased from underlying reservoirs from reaching the ocean and atmosphere. Rate measurements provide a cru-cial tool for assessing the efficacy of this process across a range of environments, but the current methods usehigh amounts of radioactive elements (3H- or 14C-CH4), tend to increase methane concentrations in a samplemarkedly over in situ levels, and are limited by strict health and safety regulations. The low-level method pre-sented here uses levels of 14C-CH4 that are below transportation regulations, produce samples that do not requiretreatment as radioactive waste, and allow for tracer level rate measurements in low methane environments.Moreover, the low-level method lays the analytical foundation for a below-regulation rate measurement thatcould be used broadly and in-situ. Parallel rate measurements with the low-level 14C-CH4 and existing
3H-CH4
methods are generally consistent with a correlation coefficient of 0.77. However, the low-level method in mostcases yields slower rates than the 3H method possibly due to temperature, priming, and detection limit effects.
*Corresponding author: E-mail: [email protected]
AcknowledgmentsWe thank the officers and crew of the R/V Atlantis for their support at
sea, John Southon, Sheila Griffin, Kevin Druffel-Rodriguez, and MatthewKhosh for their assistance in the laboratory, and two anonymous review-ers for their constructive comments. Funding for this work was providedby the National Science Foundation (NSF Grants OCE-0622759 andOCE-0447395) and the US Department of Energy Methane HydrateProgram (DE-NT005667).
DOI 10.4319/lom.2011.9.245
Limnol. Oceanogr.: Methods 9, 2011, 245–260© 2011, by the American Society of Limnology and Oceanography, Inc.
LIMNOLOGYand
OCEANOGRAPHY: METHODS
2005; Girguis et al. 2003; Nauhaus et al. 2002; Sansone andMartens 1978), comparing water mass age with methane satu-ration and modeling methane turnover (water column only;e.g., Heeschen et al. 2004; Rehder et al. 1999; Scranton andBrewer 1978), and one-dimensional numerical models withsediment CH4 and sulfate profiles (sediment AOM only; e.g.,Jørgensen et al. 2001). Radiotracer methods measure theincorporation of 3H-CH4 or 14C-CH4 tracers in the oxidationproducts during a timed incubation by decay-counting. Thesemethods are the most sensitive and direct of the availablemethods and are thus the most commonly used (Heintz2011). Stable isotope tracer (13C-CH4) methods are not viablein the marine environment due to the large amount of 13C inthe dissolved inorganic carbon (DIC: carbon dioxide, carbonicacid, and carbonate and bicarbonate ions) pool. The amountof carbon dioxide (CO2) typically produced by methane oxi-dation during short incubations (1 d) is too small comparedwith natural 13C-DIC to create a signal that is detectable bymass spectrometry.
Rate measurements of marine methane oxidation are sparsebecause the commonly used radiotracer methods (RT meth-ods) are logistically complex. Difficulties with internationalshipping of radioisotopes, concerns for possible contamina-tion of sensitive natural abundance measurements (14C and3H), strict health and safety regulations for handling radioiso-topes in lab and nonlab settings (Table 1), and high costs asso-ciated with radioactive material training, regulation, andwaste disposal all limit the usefulness of the RT rate mea-surements. In addition, regulations and permitting forradioactive applications are especially difficult in Arctic envi-
ronments (an area of special interest in methane cycling) andrapid response situations (e.g., the Gulf of Mexico oil spill)and have become stricter overall in recent years (Rudd et al.1974 versus King et al. 2002).
Here we introduce a 14C-CH4 RT method that uses 103-105
less 14C than existing RT methods by replacing decay-countingwith accelerator mass spectrometry (AMS). AMS detects indi-vidual atoms rather than decay events and can make103-109
more sensitive 14C measurements (Turteltaub and Vogel 2000).The low-level radiotracer method (LLRT method) adds 0.0146kBq 14C-CH4 per sample compared with the 370 kBq 3H-CH4
added by an existing RT method (Table 2), yet still raises thebackground 14C-CH4 by a factor of 107. Incubating a water sam-ple (120 mL, 100 nM CH4, 0.6 nM CH4 d–1 oxidation rate) withthe low-level 14C-CH4 for 1 d will raise the 14C-concentration inthe oxidation products by a factor of 120-140. This increase in14C is below the minimum detection limit for standard decay-counting techniques, but is easily detected by AMS. The LLRTmethod uses levels of 14C-CH4 that are considered exempt fortransportation regulations and lays the analytical foundationfor a rate measurement that is below regulated levels (Table 1).In addition, the method produces labeled samples that do notrequire treatment as radioactive waste (Table 1) and allows fortracer level measurements in low CH4 environments because ituses 30-103 times less CH4 per sample than existing RT meth-ods (Table 2). Thus, the LLRT method introduced here andbelow-regulation RT methods to follow will be useful for rou-tine methane oxidation rate measurements in low-methaneenvironments and when application of the existing RT meth-ods for oxidation rate measurements is not practical.
Pack et al. Methane oxidation rates by AMS
246
Table 1. United States Code of Federal Regulations (CFR) concerning the use of 14C-labeled radioactive material for academic researchas of 2010. These regulations apply in U.S. ocean waters. For research carried out at land-based field sites within the U.S., one will needto look-up and follow regulations put forth by the state in which the field site is located.
Activity Regulating law Exempt quantities for 14CConcentration Total
Use/possession CFR Title 10. Chapter 1.* (licensing) 0.037 Bq/mL (gas) 3.7 ¥ 106 Bq296 Bq/mL (liquid)
Transportation CFR Title 49. Subtitle B. Chapter 1. Volume 2. Subchapter C. 104 Bq/g 107 BqWaste disposal CFR Title 10. Chapter 1. Volume 1. Part 20. Subpart K. §2005. 1850 Bq/g —
Below-regulation = below all regulations listed here.*Exempt here = below both the total activity and concentration activity.
Table 2. Summary of the radioactive tracers used for water column methane oxidation rate measurements and their characteristics.
Tracer Products Quantification Tracer activity Added to sample Methane increaseBq/g Bq/mL kBq nM*
14C-CH414C-CO2,
14C-Cell decay counting 1.1-3.9 ¥ 1010 1.3-4.4 ¥ 106 93-880 1800-27003H-CH4 [3H-H2O,
3H-Cell] decay counting 3.7-6.4 ¥ 109 3.5-7.4 ¥ 106 350-370 12.5-25Low-level 14C-CH4
14C-CO2,14C-Cell AMS 1.6 ¥ 105 292 0.0146 0.41
Data from Valentine et al. (2001), Ward (1992), Ward et al. (1989), and David Valentine’s Lab at UC Santa Barbara.*Methane increase following injection of tracer into a 160-mL water sample for the existing 14C- and 3H-CH4 tracers and 120 mL for the low-level
14C-CH4 tracer.
Materials and procedures
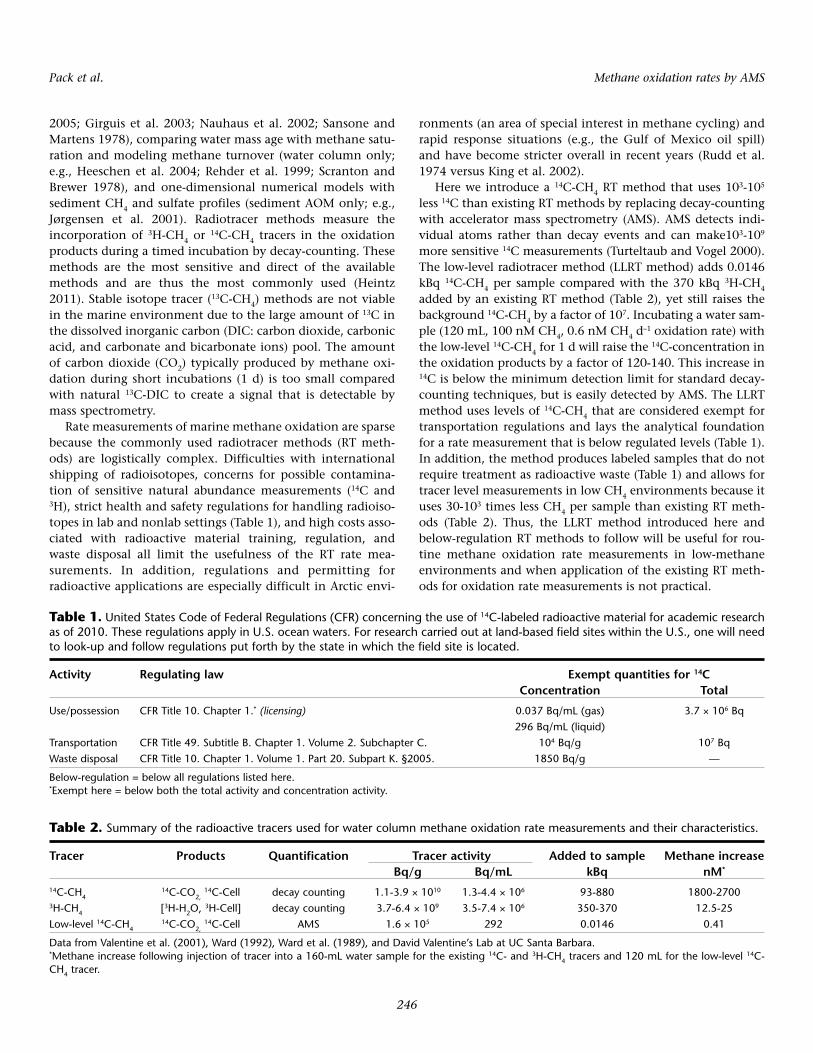
As outlined in Fig. 1, the 14C-CH4 LLRT method has 6 steps:[1] collecting fresh water samples, [2] treating the sampleswith low-levels of 14C-CH4 and incubating, [3] killing andremoving the unreacted CH4, [4] measuring the increase in the14C-DIC by AMS, [5] measuring the increase in the 14C-cell bio-mass by AMS, and [6] calculating oxidation rates. Steps 1-3 arecarried out shipboard, while steps 4-6 are completed in a land-based laboratory. A detailed description of each step and infor-mation on preparation and activity measurements of the low-level 14C-CH4 tracer are provided below.
To measure the increase in the 14C-DIC and 14C-cell biomassthat occurs during incubation with 14C-CH4 tracer, two sampletypes are needed: one labeled and one natural/background.Labeled samples are inoculated with 14C-CH4 (ca. 1 µmol L–1
CH4 in 14C-free CO2) and treated as outlined below, whereasnatural samples are subject to the same process but onlytreated with 14C-free CO2. When developing the LLRT method,we focused on the oxic/suboxic water column where methaneoxidation is expected to follow the aerobic pathway outlinedin Eq. 1. The products of aerobic oxidation are water, CO2, and
cell biomass. After CO2 is formed, it mixes with the ambientDIC pool, thus our measurements deal with DIC, not dis-solved CO2.Preparation of the 14C-CH4 tracer
The low-level 14C-CH4 tracer used here originated from par-ent 14C-CH4 that was prepared according to methods outlinedin Daniels and Zeikus (1983). The parent 14C-CH4 was 16mmol L–1 CH4 in hydrogen and contained 3.4 ¥ 106 Bq 14CmL–1. Our 14C-CH4 tracer was prepared by diluting a ~1 mLaliquot of the parent 14C-CH4 in 16 L of 14C-free CO2 in a pre-evacuated 6 L stainless steel gas canister. We chose CO2 as thecarrier gas for our 14C-CH4 tracer because of its high solubilityin sea water, but other reasonably soluble carrier gasses such asnitrogen may also be used. The low-level 14C-CH4 tracer had afinal activity concentration of 292 Bq mL–1 (1.6 ¥ 105 Bq g–1),with a total of 4.8 ¥ 106 Bq and 1.7 atmg pressure in the gascanister. For details on tracer activity measurements, refer tothe “Activity of the 14C- CH4 tracer” section.
Note that we prepared our 14C-CH4 tracer with a higheractivity concentration (more 14C delivered per sample) thannecessary so that the efficacy of the LLRT method could betested with ease. The higher activity added a step to the 14C-
Pack et al. Methane oxidation rates by AMS
247
Fig. 1. Summary of the 14C-CH4 LLRT rate measurement procedures.
DIC analysis with the labeled samples; their 14C-content wasabove the maximum AMS detection limit (ca. 8 times modernunder the standard operating conditions at the UC Irvine KeckCarbon Cycle AMS facility) and they required dilution beforeanalysis. This extra step can removed from the analysis proce-dure if the 14C-CH4 tracer is prepared with an activity levelappropriate for the environment in which it will be applied.Such considerations are discussed in the “Comments and rec-ommendations” section.Step 1: Sample collection
Water samples were collected in 10 L Niskin bottlesattached to a conductivity-temperature-depth (CTD)/Rosette.Four 120 mL glass serum bottles (Wheaton Scientific #223747;pre-weighed and washed three times with 5% hydrochloricacid and deionized water and dried at 110°C) were filleddirectly from each Niskin bottle using Tygon tubing secured toa 6-inch length of Pyrex tubing. Bottles were rinsed threetimes with sample before they were filled from the bottom tooverflowing. The sample bottles were then sealed without airbubbles with gray butyl stoppers and aluminum crimp caps(Wheaton Scientific #W224100-193 and 22417-01). The foursamples collected were divided into duplicate sets of labeledand natural samples.Step 2: 14C-labeling and incubation
This section outlines the labeling and incubation proce-dures used for labeled samples. Natural samples were treatedidentically, but injected with 14C-free CO2 instead of 14C-CH4
tracer using a designated syringe. The 14C-CH4 tracer was intro-duced to samples in sets of 10-20 using a gastight Hamiltonsyringe (100 µL with removable needle and reproducibilityadapter, Hamilton Company #81030 and 14725). The Hamil-ton syringe was purged 3 times with 14C-CH4 before startingtracer additions and 50 µL tracer aliquots (with 14.6 Bq 14C,6.3 ¥ 10–12 mol 14C) were prepared for each sample by fillingthe Hamilton syringe to 80 µL and venting to 50 µL using thestop bottom on the reproducibility adapter. The 14C-CH4 traceraliquots were introduced to samples using a two syringe tech-nique: the sample stopper was pierced with the needle of avent syringe to receive displaced water, the Hamilton syringeneedle was inserted in the stopper, the tracer aliquot wasintroduced, and the Hamilton syringe needle was removedfollowed by the vent syringe needle. Last, samples wereshaken vigorously for 1 min to equilibrate the 14C-CH4 withthe liquid phase and incubated upside down in the dark for 24h at near in situ temperatures.Step 3: Killing and removal of unreacted CH4
The following post incubation procedures for labeled andnatural samples were carried out inside a glove bag (Glass-Col#108DX-37-27H) that was purged and partially inflated withultra-high purity nitrogen (UHP N2). The N2 filled glove bagprevented sample exposure to atmospheric CO2 that can alterthe 14C-DIC, and natural and labeled samples were processedin separate glove bags to prevent cross contamination. First,0.4 mL sodium hydroxide (NaOH, saturated and bicarbonate
free) were added to samples using the two syringe techniquedescribed above and samples were vigorously shaken for 30 s.This treatment ended the incubation period by killing samples(stopping microbial activity) and converting the gaseous CO2
oxidation product to aqueous carbonate. Next, sample stop-pers were removed, 60 mL from each sample were poured intoa waste container, and samples were sparged for 30 min withUHP N2 to remove the unreacted CH4. A basic kill agent(NaOH) has been used in previously published 14C-CH4 RTstudies and is necessary as opposed to a metabolic kill agent(e.g., mercuric chloride) to sequester the CO2 in solution sothat it is not removed with the unreacted CH4. Finally, sam-ples were resealed with blue butyl rubber stoppers (BellcoGlass #2048-11800) and aluminum crimp caps, removed fromthe glove bag, and stored upside down for transport back toshore.Step 4: 14C-DIC analysis
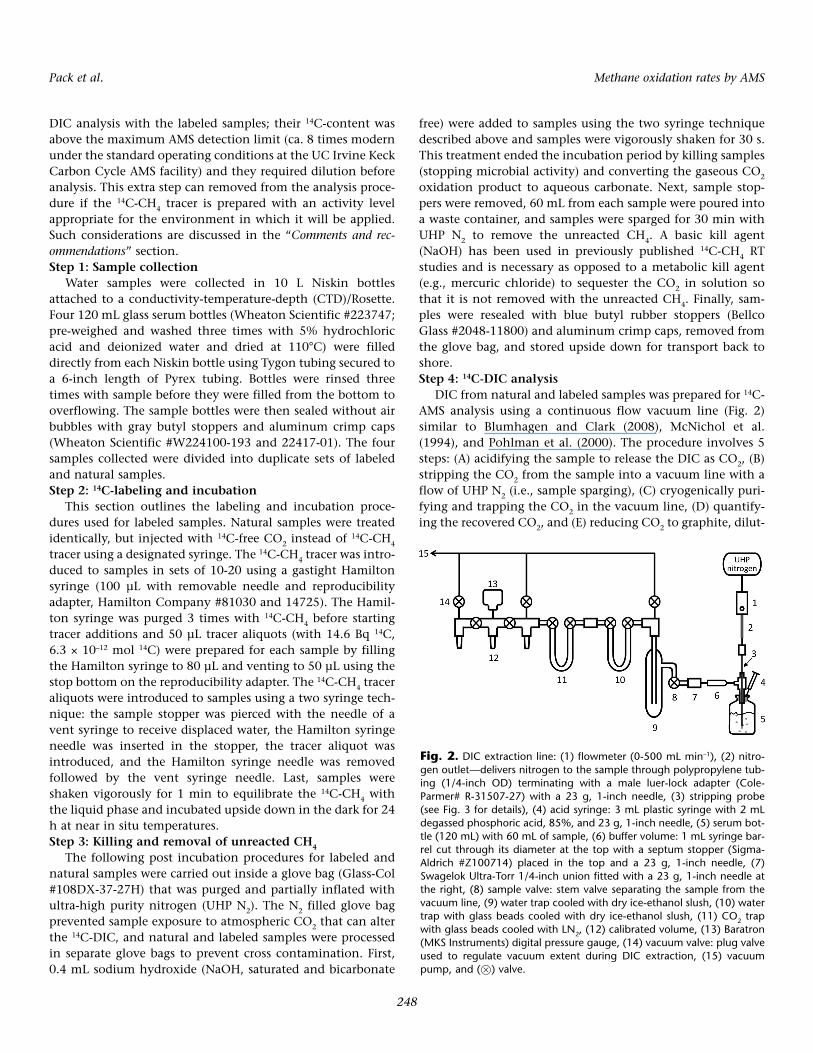
DIC from natural and labeled samples was prepared for 14C-AMS analysis using a continuous flow vacuum line (Fig. 2)similar to Blumhagen and Clark (2008), McNichol et al.(1994), and Pohlman et al. (2000). The procedure involves 5steps: (A) acidifying the sample to release the DIC as CO2, (B)stripping the CO2 from the sample into a vacuum line with aflow of UHP N2 (i.e., sample sparging), (C) cryogenically puri-fying and trapping the CO2 in the vacuum line, (D) quantify-ing the recovered CO2, and (E) reducing CO2 to graphite, dilut-
Pack et al. Methane oxidation rates by AMS
248
Fig. 2. DIC extraction line: (1) flowmeter (0-500 mL min–1), (2) nitro-gen outlet—delivers nitrogen to the sample through polypropylene tub-ing (1/4-inch OD) terminating with a male luer-lock adapter (Cole-Parmer# R-31507-27) with a 23 g, 1-inch needle, (3) stripping probe(see Fig. 3 for details), (4) acid syringe: 3 mL plastic syringe with 2 mLdegassed phosphoric acid, 85%, and 23 g, 1-inch needle, (5) serum bot-tle (120 mL) with 60 mL of sample, (6) buffer volume: 1 mL syringe bar-rel cut through its diameter at the top with a septum stopper (Sigma-Aldrich #Z100714) placed in the top and a 23 g, 1-inch needle, (7)Swagelok Ultra-Torr 1/4-inch union fitted with a 23 g, 1-inch needle atthe right, (8) sample valve: stem valve separating the sample from thevacuum line, (9) water trap cooled with dry ice-ethanol slush, (10) watertrap with glass beads cooled with dry ice-ethanol slush, (11) CO2 trapwith glass beads cooled with LN2, (12) calibrated volume, (13) Baratron(MKS Instruments) digital pressure gauge, (14) vacuum valve: plug valveused to regulate vacuum extent during DIC extraction, (15) vacuumpump, and (�) valve.
ing labeled samples, and measuring sample 14C by AMS. TheN2 flow into the sample combined with the maintenance of avacuum downstream of the sample creates a continuous flowof gas that allows CO2 to be stripped from the sample and car-ried into the vacuum line. A description of each step anddetails for preparation and operation of the vacuum line aregiven below.
Sample preparation for DIC extractionEfficient sparging of samples was accomplished using strip-
ping probes (Fig. 3) designed for the 120 mL sample bottles.The probes were inserted in the sample bottles just prior toextraction in a CO2-free atmosphere by placing a sample andstripping probe (pre-purged with N2) in a loosely sealed cham-ber and flushing the chamber with UHP N2 for 5 min. Insidethe chamber with the N2 gas still flowing, the sample stopperwas removed and the stripping probe inserted. Last, theweight of the sample/stripping probe combination wasrecorded and the needle of a degassed phosphoric acid filledsyringe (Fig. 2, #4) was inserted partway in the stripping probestopper.
Vacuum line preparation for DIC extractions (numbers inparenthesis below refer to numbers in Fig. 2)
At the start of each extraction, the vacuum line was evacu-ated, dry ice ethanol slushes were added to the water traps (9and 10), and a homemade union (a 1 mL plastic syringe bar-rel cut through its diameter to form a 1/2-inch long tube andseptum, Sigma-Aldrich #Z100714, inserted into both ends ofthe tube) was placed between the nitrogen outlet (2) andbuffer volume (6) to substitute for a sample (3-5). The entireline (1-14, with the union substituting for 3-5) was flushedwith UHP N2 and evacuated twice before it was filled to ca. 780torr. Next, the vacuum line (8-14) was isolated and evacuated,and the nitrogen outlet (2) was flushed by removing its needlefrom the union and turning the flowmeter (1) to maximumflow. Last, once the vacuum line (8-14) was completely evacu-ated, a Dewar of liquid nitrogen (LN2) was placed on the CO2
trap (11), and the sample with stripping probe (3-5) wasattached to the vacuum line; the union was removed from thebuffer volume (6) and the buffer volume needle was insertedin the stripping probe (3) outlet, and then the flowmeter (1)was turned off and the nitrogen outlet needle (2) placed in thestripping probe (3) inlet.
Sample acidification, sparging, and purification (Steps A-C)The sample headspace was sequentially expanded to the
water trap (10) and then to the vacuum valve (14) waiting ca.30 s after each expansion for water vapor to freeze down.Next, the line pressure (created by the sample headspace andread at 13) was pumped down to ca. 100 mtorr by partiallyopening the vacuum valve (14). While the line pressuredecreased, the acid syringe (4) needle was pushed through thestripping probe (3) stopper, the degassed phosphoric acidinjected, and the needle removed.
As the line pressure approached 100 mtorr, N2 was intro-duced to the line (the flowmeter was turned on) and sample
sparging began. During sample sparging, the pressure in thevacuum line needs to be low enough to sufficiently freezedown CO2, but still high enough to allow reasonable flowrates for sample sparging and prevent sample water frombeing pulled into the vacuum line. Thus, the N2 flow and vac-uum were balanced (using valves 1 and 14) to create a steadyline pressure of 80-100 mtorr with a ca. 5 mL min–1 flowrate.Sample sparging was allowed to continue for 20 min to ensure
Pack et al. Methane oxidation rates by AMS
249
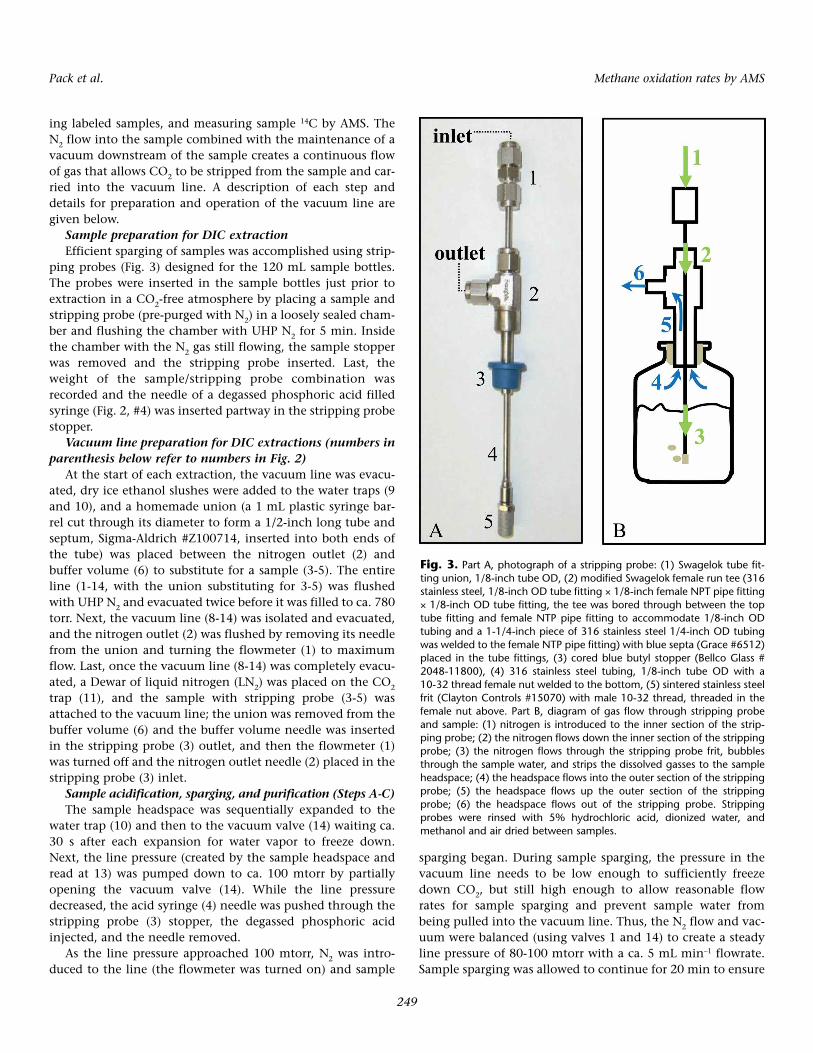
Fig. 3. Part A, photograph of a stripping probe: (1) Swagelok tube fit-ting union, 1/8-inch tube OD, (2) modified Swagelok female run tee (316stainless steel, 1/8-inch OD tube fitting ¥ 1/8-inch female NPT pipe fitting¥ 1/8-inch OD tube fitting, the tee was bored through between the toptube fitting and female NTP pipe fitting to accommodate 1/8-inch ODtubing and a 1-1/4-inch piece of 316 stainless steel 1/4-inch OD tubingwas welded to the female NTP pipe fitting) with blue septa (Grace #6512)placed in the tube fittings, (3) cored blue butyl stopper (Bellco Glass #2048-11800), (4) 316 stainless steel tubing, 1/8-inch tube OD with a10-32 thread female nut welded to the bottom, (5) sintered stainless steelfrit (Clayton Controls #15070) with male 10-32 thread, threaded in thefemale nut above. Part B, diagram of gas flow through stripping probeand sample: (1) nitrogen is introduced to the inner section of the strip-ping probe; (2) the nitrogen flows down the inner section of the strippingprobe; (3) the nitrogen flows through the stripping probe frit, bubblesthrough the sample water, and strips the dissolved gasses to the sampleheadspace; (4) the headspace flows into the outer section of the strippingprobe; (5) the headspace flows up the outer section of the strippingprobe; (6) the headspace flows out of the stripping probe. Strippingprobes were rinsed with 5% hydrochloric acid, dionized water, andmethanol and air dried between samples.
that all CO2 was stripped from the sample and trapped in thevacuum line. The sparging period was concluded by turningoff the N2 flow at the flowmeter, allowing the line pressure topump down to 50 mtorr, closing the sample valve (8), andthen evacuating the residual N2 from the vacuum line (8-14).
Quantification of the extracted CO2 (Step D)The CO2 trap (11) was isolated and a dry ice-ethanol bath
was placed on the trap to retain residual water. Three minutesafter placing the dry ice bath, the sample CO2 was transferredto a calibrated volume (12) with a pressure gauge (13) andquantified. The amount of CO2 recovered and the measuredmass of the sample were used to calculate the DIC concentra-tion (SCO2) of the seawater sample.
Reduction to graphite and AMS measurement (Step E)The CO2 extracted from natural samples was graphitized
using a sealed tube zinc reduction method (Xu et al. 2007) andanalyzed for 14C-content at the Keck Carbon Cycle AMS(KCCAMS) facility at UC Irvine (Southon and Santos 2004,2007). The CO2 extracted from labeled samples was flamesealed in 6 mm Pyrex tubes and set aside for dilution.
Labeled CO2 dilutionThe amount of dilution required to bring the 14C-content of
each labeled sample within the AMS detection limit was esti-mated using oxidation rates provided by parallel 3H-CH4 RTrate measurements (see “Assessment: Proof of concept”). Then,dilutions were performed by mixing the sample CO2 with anappropriate amount of 14C-free CO2. A careful record of themixing ratios was kept by mixing in a calibrated volume witha pressure gauge (Fig. 2, #12-13). The 14C-diluted CO2 wasreduced to graphite and its 14C-content measured as describedabove. Finally, the 14C content of the pre-diluted labeled CO2
was back calculated using the recorded mixing ratios and AMSdata in an isotope mass balance equation.Step 5: 14C-cell biomass analysis
The ideal 14C-cell biomass analysis would involve filteringout cells from samples in the field before samples are killedwith NaOH, and such a method is described below in the“Comments and recommendations” section. However, for thedata presented here, samples were not filtered shipboard, werekilled with NaOH (final pH~10), and stored > 2 mo beforeanalysis. In genetic studies, the use of NaOH to help breakdown cell walls is common (Birnboim and Doly 1979). Thus,the long sample storage period with NaOH likely lysed themethanotroph cells and undermined the utility of filtrationback in a land-based laboratory. As a result, we quantified the14C incorporated in the cell biomass by measuring the 14C-con-tent of the total organic carbon (TOC) in our labeled samples.
TOC is generally comprised of two pools: particulateorganic carbon (POC, which contains the cell biomass) anddissolved organic carbon (DOC). The cells in our basified sam-ples likely lysed and entered the DOC pool. The 14C-content ofthe cellular remains was far greater than the 14C-content of thebackground TOC, so we can assume that all (>99%) of the 14C-TOC measured originated from the 14C-labeled cells and back-
ground 14C-DOC did not significantly contribute. Note thatmethanotroph cells can excrete fixed 14C as DOC (methanol orother organic compounds; Bussmann et al. 2006; Costa et al.2001; Hanson and Hanson 1996). While a small portion ofthis excreted 14C-DOC may have been removed with othervolatile compounds during stripping of the unreacted CH4
and sample drying for 14C-TOC analysis (see next paragraph),the bulk of it likely remained and influenced our 14C-TOCmeasurements. Therefore, the 14C-TOC measurement usedhere cannot distinguish between 14C excreted and 14C takeninto the cell biomass, whereas direct filtering of cells can makethis distinction. For studying carbon allocation and dynamics,this distinction is necessary, but for methane oxidation ratemeasurements, only the total amount of 14C-CH4 taken up isimportant.
We measured the 14C-TOC by combusting dried sub-sam-ples of our labeled samples in sealed quartz tubes (similar toFry et al. 1996). Following DIC extraction, samples were vor-tex mixed, their stoppers removed, and 20-200 mg samplealiquots transferred to small quartz tubes (6 mm diameter, 1/2-inch length, prebaked at 900°C for 2 h) using disposable plas-tic pipettes. The sample aliquots were quantified by weighingthe quartz tubes on a microbalance before and immediatelyfollowing the sample transfer (if the sample is not weighedimmediately after transfer, its weight will change due to evap-oration). After weighing, the samples were dried in the oven at50°C for 3 d in an aluminum heating block.
The dried sample tubes were removed from the oven andset inside quartz combustion tubes (9 mm diameter, 6-10-inchlength, prebaked at 900°C) containing acetanilide (0.2-1 mg,weighed in pressed tin cups on a microbalance), cupric oxide(60 mg), and silver wire (ca. 3 mm, prebaked at 900°C). Thedried sub-samples had high 14C concentrations, but very littleorganic carbon (<0.0003 mg). Thus, the acetanilide acted as adead (14C-free) carbon carrier, whereas the cupric oxide sup-plied oxygen for combustion and the silver wire removed sul-fur and chlorine compounds that can interfere with graphiti-zation. The tube assemblies were evacuated, flame sealed,combusted at 900°C for 2 h, and the sample TOC andacetanilide were burned to CO2. Following combustion, theCO2 was extracted from the tube assemblies, quantified, con-verted to graphite, and analyzed for 14C following the meth-ods of Xu et al. (2007).Step 6: Rate calculations
The increase in the 14C-content of the DIC (14CDIC increase) andthe cell biomass (14CCell increase) during sample incubation with14C-CH4 tracer was calculated as shown in Eqs. 3 and 5, respec-tively, using data obtained from the analyses described in “Step4: 14C-DIC analysis” and “Step 5: 14C-Cell biomass analysis.”
14CDIC increase = [ 14CLS – 14CNS] ¥ DIC ¥ Vs (3)
14CTOC Total sub-sample = 14CMeasured ¥ CRecovered (4)
Pack et al. Methane oxidation rates by AMS
250
14CCell increase = [14CTOC Total sub-sample ¥ MSample ]/MSub-sample (5)
In Eq. 3, 14CLS is the 14C/12C ratio of the labeled sample DIC,14CNS is the 14C/12C ratio of the natural sample DIC, DIC is theDIC sample concentration in moles carbon per liter sample,and Vs is the sample volume. In Eqs. 4 and 5, 14CMeasured is the14C/12C ratio of the TOC in the dried/combusted sub-sample,CRecovered is the moles of CO2 recovered from the combustion ofthe dried sub-sample with acetanilide, MSub-sample is the mass ofthe sub-sample, and MSample is the mass of the original seawa-ter sample. The 14CMeasured in Eq. 4 is the 14C/12C ratio of thesub-sample TOC because the 14C contribution from theacetanilide dead carbon carrier was subtracted during blankcorrections to the raw 14C-AMS data.
F14C = [14CDIC increase + 14CCell increase]/14C-CH4 tracer (6)
k = F14C/t (7)
t = 1/k (8)
R = k ¥ [CH4] (9)
Methane oxidation rates (R) and turnover times (t) werecalculated as shown in Eqs. 6-9 using the results from Eqs. 3and 5 along with the 14C-CH4 tracer activity, incubation dura-tion (t), and ambient methane concentrations ([CH4]). Ambi-ent CH4 concentrations were measured in parallel with oxida-tion rate samples and the data are presented in Mau et al.(unpub. data) and Heintz (2011). In Eqs. 6-9, 14C-CH4 tracer isthe moles of 14C tracer injected, F14C is the fraction of theinjected 14C-CH4 that was incorporated into the oxidationproducts, and k is the fractional turnover rate.Activity of the 14C-CH4 tracer
In this section, we cover the techniques used to quantifythe activity concentration of our low-level 14C-CH4 tracer. Theactivity falls at the minimum detection limit for standarddecay-counting techniques, but above the AMS maximumdetection limit. Therefore, we diluted aliquots of tracer (20-40µL) in 16 L of 14C-free CH4 in pre-evacuated 6 L stainless steelgas canisters, measured the 14C-content of the diluted tracer byAMS, and back calculated the activity concentration. The can-ister volumes were approximately 6 L, so the amount of 14C-free CH4 added to each canister was quantified by weighingthe canister prior to and following the addition of the 14C-freeCH4. The mass of the 14C-free CH4 was converted to a volumeusing the molar mass of CH4 and the ideal gas law, and a vol-ume-to-volume mixing ratio was calculated for the dilution.
An aliquot of the diluted 14C-CH4 tracer was then preparedfor AMS analysis using a continuous flow vacuum line (Fig. 4;numbers in parentheses below refer to numbers in this figure)adapted from Kessler and Reeburgh (2005) and Valentine et al.(2001). The procedure involves combusting the 14C-CH4 toCO2 and water in a furnace, cryogenically purifying and trap-
ping the CO2 product, quantifying the recovered CO2, reduc-ing the CO2 to graphite, and measuring the 14C-content byAMS. Before each analysis, dry ice-ethanol baths were placedon the water traps (7 and 8) and the entire vacuum line (1-12)was flushed with ultra-zero air and evacuated 3 times. Then, acontinuous flow of gas through the line (1-12) was created byintroducing a ca. 5 mL min–1 flow of ultra-zero air at theflowmeter (1) and opening the vacuum valve (12). The airflowand vacuum quickly balanced to create a line pressure (read at11) of ca. 3 mtorr and a Dewar of LN2 was placed on the CO2
trap (9).Next, the diluted 14C-CH4 tracer was introduced to the vac-
uum line by filling a gas tight Hamilton syringe (previouslyflushed with dilute 14C-CH4) with 3 mL diluted tracer, ventingthe syringe to 2 mL, and then slowly injecting the dilutedtracer into the line through the injection port (2). The dilutedtracer flowed with the ultra-zero air through the 975°C furnace(4) and was combusted to CO2 and water. The CO2/water/airmixture then flowed through two dry ice-ethanol cooled traps(7 and 8), and the water was removed. The purified CO2/airmixture flowed through a LN2 cooled trap (9) and the CO2
froze down while the air was pumped away. This process wasallowed to continue for 10 min to ensure that all of theinjected 14C-CH4 was combusted and trapped. After 10 min, theair flow was turned off, the traps (7-9) were isolated from thefurnace (4) by closing the sample valve (6), and the residualultra-zero air was evacuated from the traps. The purified CO2
was quantified, reduced to graphite, and its 14C-content mea-sured as described in the “14C-DIC Analysis” section. Finally, the
Pack et al. Methane oxidation rates by AMS
251
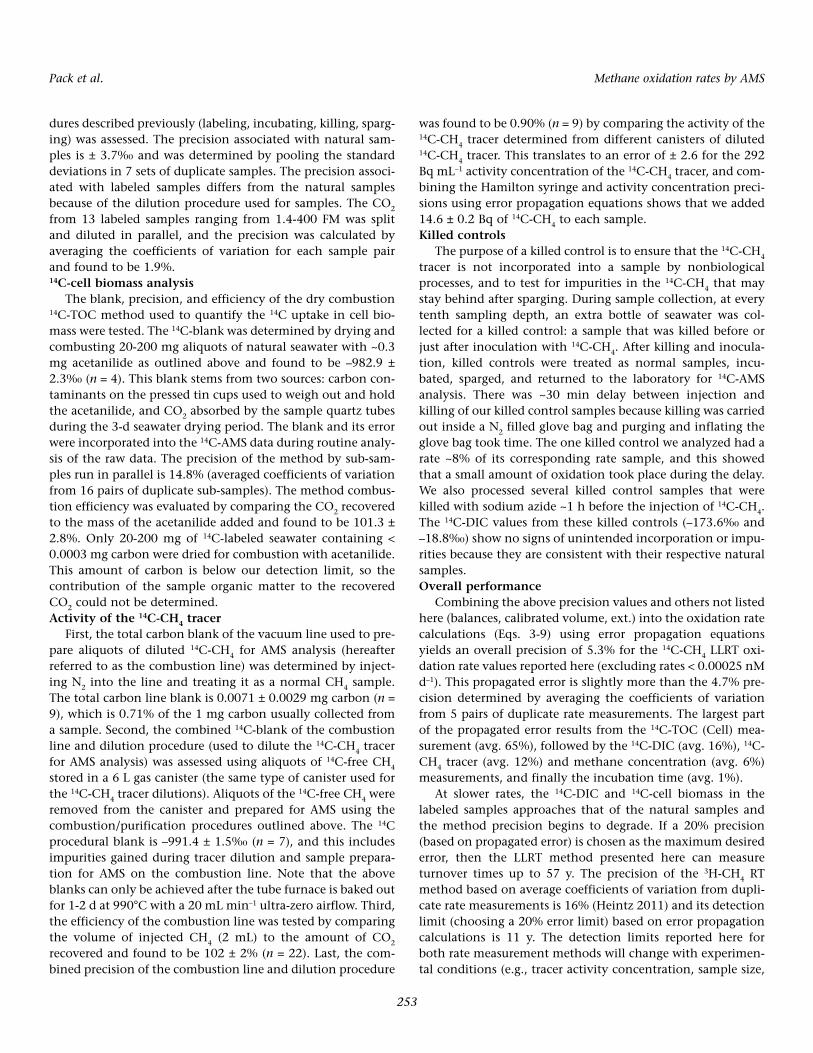
Fig. 4. Methane combustion line: (1) flowmeter (0-500 mL min–1), (2)Swagelok tube fitting union tee (1/8-inch tube OD) with blue septum forinjection, (3) polypropylene tubing, 1/8-inch tube OD, (4) Lindberg/BlueFurnace (Thermo Scientific #TF55050A) at 975°C with a 316 stainlesssteel combustion tube (1/2-inch tube OD) filled with cupric oxide to pro-vide oxygen for combustion, (5) Swagelok Ultra-Torr 1/4-inch union withtube fitting adapter (1/4-inch tube stub ¥ 1/8-inch OD tubing fitting) andpolypropylene tubing, (6) sample valve: stem vale separating the furnacefrom the vacuum line, (7) water trap cooled with dry ice-ethanol slush,(8) water trap with glass beads cooled with dry ice-ethanol slush, (9) CO2
trap with glass beads cooled with LN2, (10) calibrated volume, (11) Bara-tron (MKS Inst.) digital pressure gauge, (12) vacuum valve: plug valvethat separates the vacuum line from the vacuum pump, (13) vacuumpump, and (�) valve.

activity of the 14C-CH4 tracer was back calculated using the vol-ume-to-volume mixing ratio from dilution and the 14C-AMSdata in an isotope mass balance equation.
AssessmentA series of experiments were conducted to test the efficien-
cies, blanks, and precision associated with the 14C-CH4 LLRTmethod. The experiments and results are described below andsummarized in Table 3. AMS results are reported in D14C (‰)or fraction modern (FM) as defined in Stuiver and Polach(1977). As a proof of concept, we compare parallel methaneoxidation rate measurements made using the 14C-CH4 LLRTmethod described here and a previously published 3H-CH4 RTmethod (Valentine et al. 2001).14C-labeling of samples
The precision of the 14C-CH4 activity is addressed in “Activ-ity of the 14C-CH4 tracer.” Here, the accuracy and precision ofthe tracer volume (50 µL) were assessed by dispensing 50 µLaliquots of MilliQ water into 1 mL vials with septum using thesame Hamilton syringe that was used for treating sampleswith the 14C-CH4 tracer. The 1 mL vials were weighed beforeand following the addition of MilliQ water and the volume ofinjected water was calculated using the water mass and den-sity. The Hamilton syringe, with reproducibility adapter set at50 µL, dispensed 49.21 ± 0.23 µL with a precision of 0.48%.14C-DIC analysis
First, the total carbon blank of the continuous flow vacuumline used to extract DIC (hereafter referred to as the extractionline) was tested by extracting DIC from 60 mL acidified,degassed, MilliQ water following the extraction proceduresoutline above. The total carbon line blank is 0.004 ± 0.001 mgcarbon per 60 mL water (n = 2), which is 0.2% of the average
1.70 mg carbon that we collect per 60 mL of seawater.Second, the 14C-blank and efficiency of the extraction line
were tested using 14C-free spar calcite ground to a fine powder.Aliquots of spar calcite (14.7-16.7 mg) were weighed out andstored in vials with rubber stoppers (Kendall Healthcare #8881301215), and later transferred to stripped seawater in a CO2-free atmosphere. The transfer occurred as follows: a calcite vial(with stopper removed) and stripped seawater sample (withstripping probe still in place) were set inside a loosely enclosedchamber, and the chamber was flushed with UHP N2 for 5min. Then, with N2 still flowing, the stripping probe wasremoved from the sample bottle, the calcite was poured intothe bottle, and the stripping probe was quickly returned. Oncethe calcite was transferred to the seawater, it was treated as anormal sample and subjected to the DIC extraction proce-dures outlined above. The extraction line efficiency was calcu-lated by comparing the amount of CO2 extracted to theamount of calcite weighed out and found to be 99.1 ± 2.2% (n= 8). The average D14C of the extracted CO2 (the 14C-line blank)was –995.2 ± 1.2‰ (n = 8).
Third, the accuracy and precision of the DIC extraction linewere tested using duplicates of seawater samples that were pre-viously analyzed in Ellen Druffel’s Lab at UC Irvine for 14C-DIC and DIC concentration (SCO2, results reported in Hingeret al. 2010 and listed here in Table 4). We analyzed the dupli-cate samples using the procedures outlined above, and ourresults (Table 4) show a pooled standard deviation of 1.8‰(2.9‰ taking the larger difference in the DIC I 2/14/07 pairinto account) and are not statistically different from the pre-vious measurements.
Last, the precision of the 14C-DIC measurement of labeledand natural samples that were subject to the shipboard proce-
Pack et al. Methane oxidation rates by AMS
252
Table 3. Summary of the efficiencies, blanks, and precisions associated with the 14C-DIC, 14C-TOC (cell), and 14C-CH4 analyses.
Analysis Total carbon blank (mg carbon) 14C blank (‰) Efficiency (%) Precision*
14C-DIC 0.004 ± 0.001 –995.2 ± 1.2 99.1 ± 2.2 3.7‰ natural DIC1.9 % labeled DIC
14C-TOC (cell) — –982.9 ± 2.3 101.3 ± 2.8 14.8%14C-CH4 0.0071 ± 0.0029 –991.4 ± 1.5 102 ± 2 0.90%*All precisions were calculated from duplicates analyses as described in the “Assessment” section.
Table 4. DIC concentration (SCO2) and D14C-DIC data for duplicate seawater samples from Ellen Druffel’s Lab at UC Irvine. The Duf-
fel Lab results are listed under “expected,” whereas the results from our analyses of the duplicate samples are listed under “mean.”
Sample name n DIC expected* DIC mean D14C expected* D14C mean(mol/L ¥ 10–3) (mol/L ¥ 10–3) ± 1s (‰) (‰) ± 1s
DIC II 9/14/06 3 2.08 2.04 0.07 32.2 30.6 1.7DIC II 10/17/06 1 2.04 2.07 — 33.7 31.2 —DIC I 2/14/07 2 2.07 2.15 0.01 48.4 42.7 1.8DIC II 12/6/07 4 2.01 2.03 0.03 25.0 25.4 1.9*The expected values are published in Hinger et al. (2010). The precision of the expected DIC values is ± 0.041 ¥ 10–3 mol/L, while the precision for theD14C is ± 2‰.
dures described previously (labeling, incubating, killing, sparg-ing) was assessed. The precision associated with natural sam-ples is ± 3.7‰ and was determined by pooling the standarddeviations in 7 sets of duplicate samples. The precision associ-ated with labeled samples differs from the natural samplesbecause of the dilution procedure used for samples. The CO2
from 13 labeled samples ranging from 1.4-400 FM was splitand diluted in parallel, and the precision was calculated byaveraging the coefficients of variation for each sample pairand found to be 1.9%.14C-cell biomass analysis
The blank, precision, and efficiency of the dry combustion14C-TOC method used to quantify the 14C uptake in cell bio-mass were tested. The 14C-blank was determined by drying andcombusting 20-200 mg aliquots of natural seawater with ~0.3mg acetanilide as outlined above and found to be –982.9 ±2.3‰ (n = 4). This blank stems from two sources: carbon con-taminants on the pressed tin cups used to weigh out and holdthe acetanilide, and CO2 absorbed by the sample quartz tubesduring the 3-d seawater drying period. The blank and its errorwere incorporated into the 14C-AMS data during routine analy-sis of the raw data. The precision of the method by sub-sam-ples run in parallel is 14.8% (averaged coefficients of variationfrom 16 pairs of duplicate sub-samples). The method combus-tion efficiency was evaluated by comparing the CO2 recoveredto the mass of the acetanilide added and found to be 101.3 ±2.8%. Only 20-200 mg of 14C-labeled seawater containing <0.0003 mg carbon were dried for combustion with acetanilide.This amount of carbon is below our detection limit, so thecontribution of the sample organic matter to the recoveredCO2 could not be determined.Activity of the 14C-CH4 tracer
First, the total carbon blank of the vacuum line used to pre-pare aliquots of diluted 14C-CH4 for AMS analysis (hereafterreferred to as the combustion line) was determined by inject-ing N2 into the line and treating it as a normal CH4 sample.The total carbon line blank is 0.0071 ± 0.0029 mg carbon (n =9), which is 0.71% of the 1 mg carbon usually collected froma sample. Second, the combined 14C-blank of the combustionline and dilution procedure (used to dilute the 14C-CH4 tracerfor AMS analysis) was assessed using aliquots of 14C-free CH4
stored in a 6 L gas canister (the same type of canister used forthe 14C-CH4 tracer dilutions). Aliquots of the 14C-free CH4 wereremoved from the canister and prepared for AMS using thecombustion/purification procedures outlined above. The 14Cprocedural blank is –991.4 ± 1.5‰ (n = 7), and this includesimpurities gained during tracer dilution and sample prepara-tion for AMS on the combustion line. Note that the aboveblanks can only be achieved after the tube furnace is baked outfor 1-2 d at 990°C with a 20 mL min–1 ultra-zero airflow. Third,the efficiency of the combustion line was tested by comparingthe volume of injected CH4 (2 mL) to the amount of CO2
recovered and found to be 102 ± 2% (n = 22). Last, the com-bined precision of the combustion line and dilution procedure
was found to be 0.90% (n = 9) by comparing the activity of the14C-CH4 tracer determined from different canisters of diluted14C-CH4 tracer. This translates to an error of ± 2.6 for the 292Bq mL–1 activity concentration of the 14C-CH4 tracer, and com-bining the Hamilton syringe and activity concentration preci-sions using error propagation equations shows that we added14.6 ± 0.2 Bq of 14C-CH4 to each sample.Killed controls
The purpose of a killed control is to ensure that the 14C-CH4
tracer is not incorporated into a sample by nonbiologicalprocesses, and to test for impurities in the 14C-CH4 that maystay behind after sparging. During sample collection, at everytenth sampling depth, an extra bottle of seawater was col-lected for a killed control: a sample that was killed before orjust after inoculation with 14C-CH4. After killing and inocula-tion, killed controls were treated as normal samples, incu-bated, sparged, and returned to the laboratory for 14C-AMSanalysis. There was ~30 min delay between injection andkilling of our killed control samples because killing was carriedout inside a N2 filled glove bag and purging and inflating theglove bag took time. The one killed control we analyzed had arate ~8% of its corresponding rate sample, and this showedthat a small amount of oxidation took place during the delay.We also processed several killed control samples that werekilled with sodium azide ~1 h before the injection of 14C-CH4.The 14C-DIC values from these killed controls (–173.6‰ and–18.8‰) show no signs of unintended incorporation or impu-rities because they are consistent with their respective naturalsamples.Overall performance
Combining the above precision values and others not listedhere (balances, calibrated volume, ext.) into the oxidation ratecalculations (Eqs. 3-9) using error propagation equationsyields an overall precision of 5.3% for the 14C-CH4 LLRT oxi-dation rate values reported here (excluding rates < 0.00025 nMd–1). This propagated error is slightly more than the 4.7% pre-cision determined by averaging the coefficients of variationfrom 5 pairs of duplicate rate measurements. The largest partof the propagated error results from the 14C-TOC (Cell) mea-surement (avg. 65%), followed by the 14C-DIC (avg. 16%), 14C-CH4 tracer (avg. 12%) and methane concentration (avg. 6%)measurements, and finally the incubation time (avg. 1%).
At slower rates, the 14C-DIC and 14C-cell biomass in thelabeled samples approaches that of the natural samples andthe method precision begins to degrade. If a 20% precision(based on propagated error) is chosen as the maximum desirederror, then the LLRT method presented here can measureturnover times up to 57 y. The precision of the 3H-CH4 RTmethod based on average coefficients of variation from dupli-cate rate measurements is 16% (Heintz 2011) and its detectionlimit (choosing a 20% error limit) based on error propagationcalculations is 11 y. The detection limits reported here forboth rate measurement methods will change with experimen-tal conditions (e.g., tracer activity concentration, sample size,
Pack et al. Methane oxidation rates by AMS
253
counting volume, etc.), and are especially dependent on themaximum desired error and amount of tracer added to eachsample.Proof of concept: Parallel rate measurements
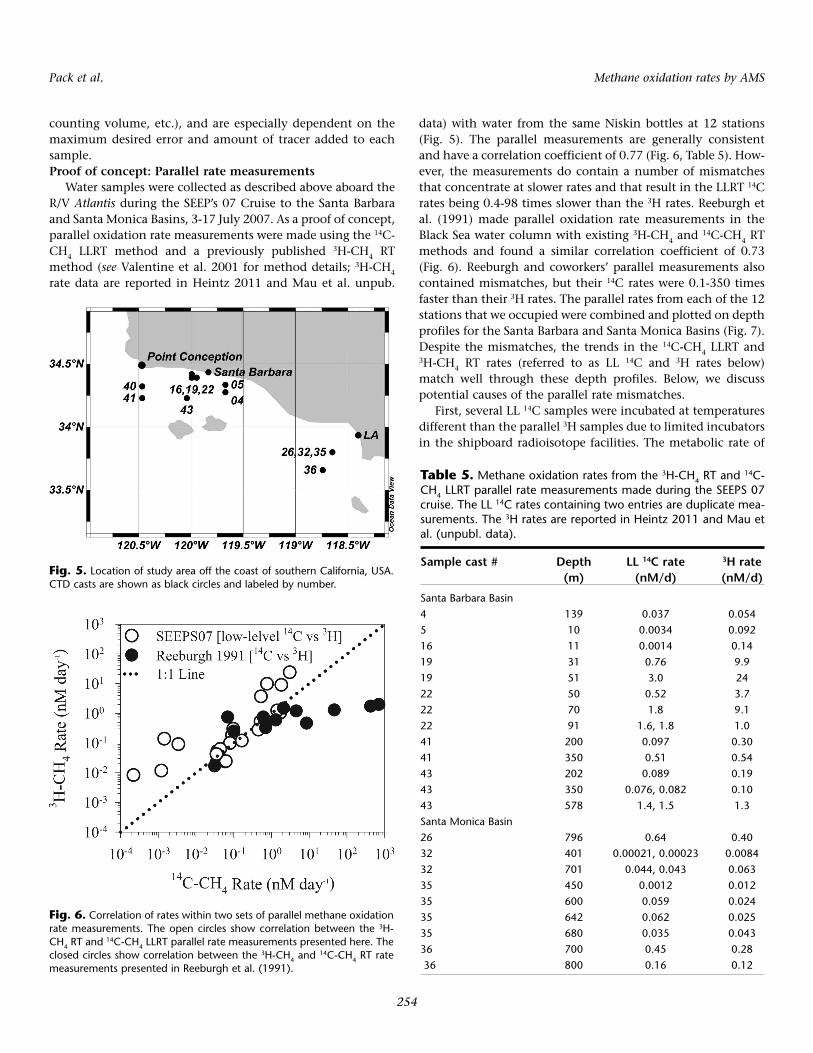
Water samples were collected as described above aboard theR/V Atlantis during the SEEP’s 07 Cruise to the Santa Barbaraand Santa Monica Basins, 3-17 July 2007. As a proof of concept,parallel oxidation rate measurements were made using the 14C-CH4 LLRT method and a previously published 3H-CH4 RTmethod (see Valentine et al. 2001 for method details; 3H-CH4
rate data are reported in Heintz 2011 and Mau et al. unpub.
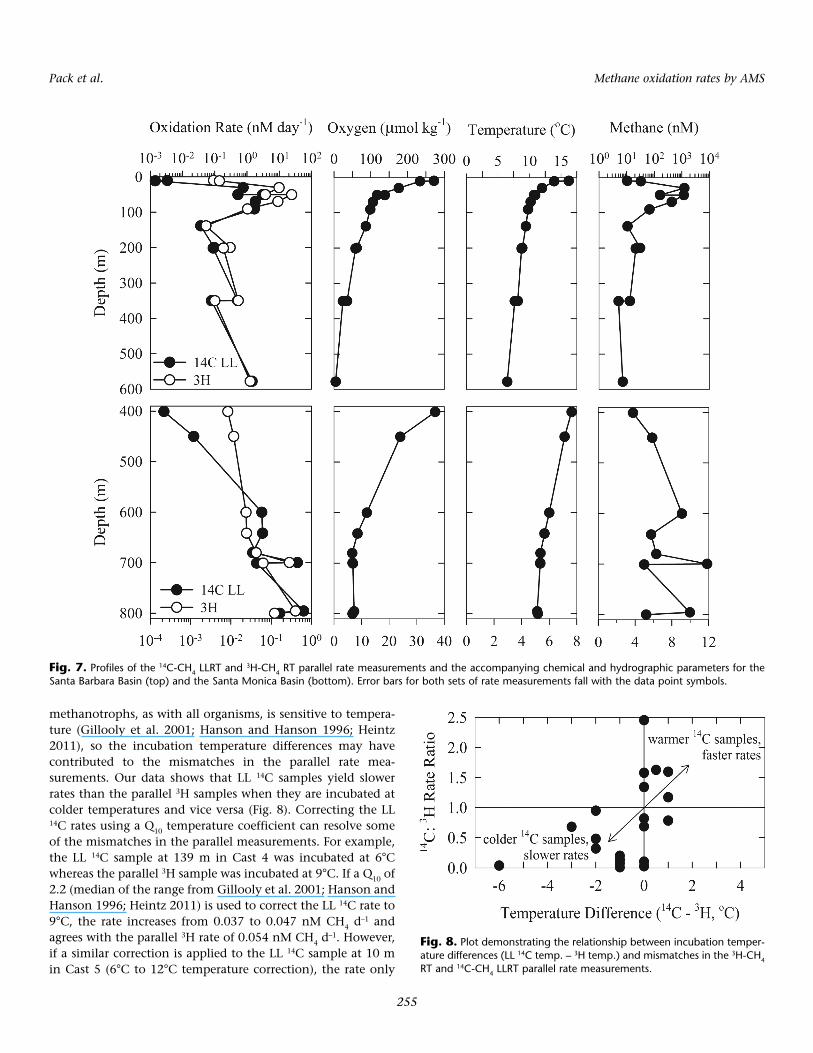
data) with water from the same Niskin bottles at 12 stations(Fig. 5). The parallel measurements are generally consistentand have a correlation coefficient of 0.77 (Fig. 6, Table 5). How-ever, the measurements do contain a number of mismatchesthat concentrate at slower rates and that result in the LLRT 14Crates being 0.4-98 times slower than the 3H rates. Reeburgh etal. (1991) made parallel oxidation rate measurements in theBlack Sea water column with existing 3H-CH4 and 14C-CH4 RTmethods and found a similar correlation coefficient of 0.73(Fig. 6). Reeburgh and coworkers’ parallel measurements alsocontained mismatches, but their 14C rates were 0.1-350 timesfaster than their 3H rates. The parallel rates from each of the 12stations that we occupied were combined and plotted on depthprofiles for the Santa Barbara and Santa Monica Basins (Fig. 7).Despite the mismatches, the trends in the 14C-CH4 LLRT and3H-CH4 RT rates (referred to as LL 14C and 3H rates below)match well through these depth profiles. Below, we discusspotential causes of the parallel rate mismatches.
First, several LL 14C samples were incubated at temperaturesdifferent than the parallel 3H samples due to limited incubatorsin the shipboard radioisotope facilities. The metabolic rate of
Pack et al. Methane oxidation rates by AMS
254
Fig. 5. Location of study area off the coast of southern California, USA.CTD casts are shown as black circles and labeled by number.
Fig. 6. Correlation of rates within two sets of parallel methane oxidationrate measurements. The open circles show correlation between the 3H-CH4 RT and
14C-CH4 LLRT parallel rate measurements presented here. Theclosed circles show correlation between the 3H-CH4 and
14C-CH4 RT ratemeasurements presented in Reeburgh et al. (1991).
Table 5. Methane oxidation rates from the 3H-CH4 RT and 14C-CH4 LLRT parallel rate measurements made during the SEEPS 07cruise. The LL 14C rates containing two entries are duplicate mea-surements. The 3H rates are reported in Heintz 2011 and Mau etal. (unpubl. data).
Sample cast # Depth LL 14C rate 3H rate(m) (nM/d) (nM/d)
Santa Barbara Basin4 139 0.037 0.0545 10 0.0034 0.09216 11 0.0014 0.1419 31 0.76 9.919 51 3.0 2422 50 0.52 3.722 70 1.8 9.122 91 1.6, 1.8 1.041 200 0.097 0.3041 350 0.51 0.5443 202 0.089 0.1943 350 0.076, 0.082 0.1043 578 1.4, 1.5 1.3Santa Monica Basin26 796 0.64 0.4032 401 0.00021, 0.00023 0.008432 701 0.044, 0.043 0.06335 450 0.0012 0.01235 600 0.059 0.02435 642 0.062 0.02535 680 0.035 0.04336 700 0.45 0.2836 800 0.16 0.12
methanotrophs, as with all organisms, is sensitive to tempera-ture (Gillooly et al. 2001; Hanson and Hanson 1996; Heintz2011), so the incubation temperature differences may havecontributed to the mismatches in the parallel rate mea-surements. Our data shows that LL 14C samples yield slowerrates than the parallel 3H samples when they are incubated atcolder temperatures and vice versa (Fig. 8). Correcting the LL14C rates using a Q10 temperature coefficient can resolve someof the mismatches in the parallel measurements. For example,the LL 14C sample at 139 m in Cast 4 was incubated at 6°Cwhereas the parallel 3H sample was incubated at 9°C. If a Q10 of2.2 (median of the range from Gillooly et al. 2001; Hanson andHanson 1996; Heintz 2011) is used to correct the LL 14C rate to9°C, the rate increases from 0.037 to 0.047 nM CH4 d–1 andagrees with the parallel 3H rate of 0.054 nM CH4 d–1. However,if a similar correction is applied to the LL 14C sample at 10 min Cast 5 (6°C to 12°C temperature correction), the rate only
Pack et al. Methane oxidation rates by AMS
255
Fig. 7. Profiles of the 14C-CH4 LLRT and 3H-CH4 RT parallel rate measurements and the accompanying chemical and hydrographic parameters for theSanta Barbara Basin (top) and the Santa Monica Basin (bottom). Error bars for both sets of rate measurements fall with the data point symbols.
Fig. 8. Plot demonstrating the relationship between incubation temper-ature differences (LL 14C temp. – 3H temp.) and mismatches in the 3H-CH4RT and 14C-CH4 LLRT parallel rate measurements.
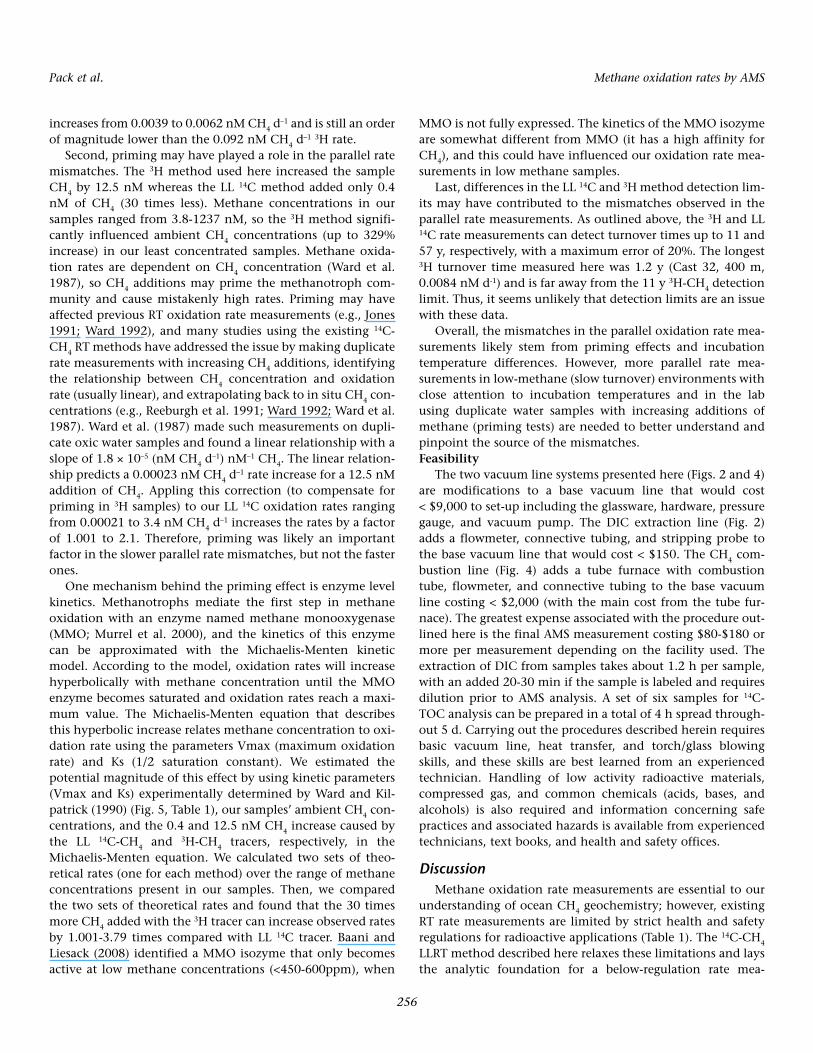
increases from 0.0039 to 0.0062 nM CH4 d–1 and is still an orderof magnitude lower than the 0.092 nM CH4 d–1 3H rate.
Second, priming may have played a role in the parallel ratemismatches. The 3H method used here increased the sampleCH4 by 12.5 nM whereas the LL 14C method added only 0.4nM of CH4 (30 times less). Methane concentrations in oursamples ranged from 3.8-1237 nM, so the 3H method signifi-cantly influenced ambient CH4 concentrations (up to 329%increase) in our least concentrated samples. Methane oxida-tion rates are dependent on CH4 concentration (Ward et al.1987), so CH4 additions may prime the methanotroph com-munity and cause mistakenly high rates. Priming may haveaffected previous RT oxidation rate measurements (e.g., Jones1991; Ward 1992), and many studies using the existing 14C-CH4 RT methods have addressed the issue by making duplicaterate measurements with increasing CH4 additions, identifyingthe relationship between CH4 concentration and oxidationrate (usually linear), and extrapolating back to in situ CH4 con-centrations (e.g., Reeburgh et al. 1991; Ward 1992; Ward et al.1987). Ward et al. (1987) made such measurements on dupli-cate oxic water samples and found a linear relationship with aslope of 1.8 ¥ 10–5 (nM CH4 d–1) nM–1 CH4. The linear relation-ship predicts a 0.00023 nM CH4 d–1 rate increase for a 12.5 nMaddition of CH4. Appling this correction (to compensate forpriming in 3H samples) to our LL 14C oxidation rates rangingfrom 0.00021 to 3.4 nM CH4 d–1 increases the rates by a factorof 1.001 to 2.1. Therefore, priming was likely an importantfactor in the slower parallel rate mismatches, but not the fasterones.
One mechanism behind the priming effect is enzyme levelkinetics. Methanotrophs mediate the first step in methaneoxidation with an enzyme named methane monooxygenase(MMO; Murrel et al. 2000), and the kinetics of this enzymecan be approximated with the Michaelis-Menten kineticmodel. According to the model, oxidation rates will increasehyperbolically with methane concentration until the MMOenzyme becomes saturated and oxidation rates reach a maxi-mum value. The Michaelis-Menten equation that describesthis hyperbolic increase relates methane concentration to oxi-dation rate using the parameters Vmax (maximum oxidationrate) and Ks (1/2 saturation constant). We estimated thepotential magnitude of this effect by using kinetic parameters(Vmax and Ks) experimentally determined by Ward and Kil-patrick (1990) (Fig. 5, Table 1), our samples’ ambient CH4 con-centrations, and the 0.4 and 12.5 nM CH4 increase caused bythe LL 14C-CH4 and 3H-CH4 tracers, respectively, in theMichaelis-Menten equation. We calculated two sets of theo-retical rates (one for each method) over the range of methaneconcentrations present in our samples. Then, we comparedthe two sets of theoretical rates and found that the 30 timesmore CH4 added with the 3H tracer can increase observed ratesby 1.001-3.79 times compared with LL 14C tracer. Baani andLiesack (2008) identified a MMO isozyme that only becomesactive at low methane concentrations (<450-600ppm), when
MMO is not fully expressed. The kinetics of the MMO isozymeare somewhat different from MMO (it has a high affinity forCH4), and this could have influenced our oxidation rate mea-surements in low methane samples.
Last, differences in the LL 14C and 3H method detection lim-its may have contributed to the mismatches observed in theparallel rate measurements. As outlined above, the 3H and LL14C rate measurements can detect turnover times up to 11 and57 y, respectively, with a maximum error of 20%. The longest3H turnover time measured here was 1.2 y (Cast 32, 400 m,0.0084 nM d-1) and is far away from the 11 y 3H-CH4 detectionlimit. Thus, it seems unlikely that detection limits are an issuewith these data.
Overall, the mismatches in the parallel oxidation rate mea-surements likely stem from priming effects and incubationtemperature differences. However, more parallel rate mea-surements in low-methane (slow turnover) environments withclose attention to incubation temperatures and in the labusing duplicate water samples with increasing additions ofmethane (priming tests) are needed to better understand andpinpoint the source of the mismatches.Feasibility
The two vacuum line systems presented here (Figs. 2 and 4)are modifications to a base vacuum line that would cost < $9,000 to set-up including the glassware, hardware, pressuregauge, and vacuum pump. The DIC extraction line (Fig. 2)adds a flowmeter, connective tubing, and stripping probe tothe base vacuum line that would cost < $150. The CH4 com-bustion line (Fig. 4) adds a tube furnace with combustiontube, flowmeter, and connective tubing to the base vacuumline costing < $2,000 (with the main cost from the tube fur-nace). The greatest expense associated with the procedure out-lined here is the final AMS measurement costing $80-$180 ormore per measurement depending on the facility used. Theextraction of DIC from samples takes about 1.2 h per sample,with an added 20-30 min if the sample is labeled and requiresdilution prior to AMS analysis. A set of six samples for 14C-TOC analysis can be prepared in a total of 4 h spread through-out 5 d. Carrying out the procedures described herein requiresbasic vacuum line, heat transfer, and torch/glass blowingskills, and these skills are best learned from an experiencedtechnician. Handling of low activity radioactive materials,compressed gas, and common chemicals (acids, bases, andalcohols) is also required and information concerning safepractices and associated hazards is available from experiencedtechnicians, text books, and health and safety offices.
DiscussionMethane oxidation rate measurements are essential to our
understanding of ocean CH4 geochemistry; however, existingRT rate measurements are limited by strict health and safetyregulations for radioactive applications (Table 1). The 14C-CH4
LLRT method described here relaxes these limitations and laysthe analytic foundation for a below-regulation rate mea-
Pack et al. Methane oxidation rates by AMS
256
surement (see “Comments and recommendations”). The methoduses levels of 14C-CH4 (292 Bq mL–1 with a total of 4.8 ¥ 106 Bqin a 6L canister) that are 103-105 times lower than the existing3H-CH4 (3.5-7.4 ¥ 106 Bq mL–1) and 14C-CH4 (1.3-4.4 ¥ 106 BqmL–1) RT methods (Table 2) and below regulation for trans-portation (<107 Bq total, Table 1). Also, samples inoculatedwith the low-level 14C-CH4 tracer do not require handling asradioactive waste because they contain 0.12 Bq 14C mL–1,which is three orders of magnitude below the strictest regula-tion for liquids (296 Bq 14C mL–1, Table 1). The LLRT methodand below-regulation methods to follow should increase sam-pling opportunities for methane oxidation rate mea-surements, and thus lead to a better understanding and quan-tification of the marine methane oxidation sink.
The LLRT method has another important advantage; themethod increases the ambient CH4 in a sample by 0.4 nM,which is 30-103 less than the existing RT methods (Table 2).This leads to less disruption in the microbial community andmore realistic/tracer level rate measurements in low CH4 areaswhere the previous published RT methods would overwhelmthe CH4 pool (e.g., 2 nM CH4 open ocean water). The previ-ously published 3H-CH4 and 14C-CH4 RT methods increaseambient CH4 in a sample by 12-25 nM CH4 and ~103 nM CH4,respectively (Table 2). Because of the smaller CH4 additions,the 3H-CH4 RT method can be used for tracer level rate mea-surements in medium-low CH4 waters, but it cannot track car-bon allocation between respiration (CO2) and cell biomass.Thus, the LLRT method will be a useful new tool that canmake tracer level measurement in low CH4 environments andtrack carbon allocation.
Comments and recommendationsLow-level or below-regulation 14C-CH4 tracers relax the
restrictions that accompany the existing-high activity RT ratemeasurements, but the 14C-CH4 tracer and labeled samples stillrequire careful handling to avoid contamination issues withnatural 14C studies and AMS laboratories. Precautions thatshould be taken when working with tracers and labeled mate-rial are discussed here. First, work with labeled material shouldbe isolated in designated isotope facilities both in the field andwhen preparing samples for AMS analysis. Second, the vac-uum line used for DIC extractions should be cleaned betweennatural and labeled samples by exposing it to room air orwater (expand a small amount of distilled water into the line)overnight. Third, samples should only be sent to AMS labs aspressed graphite and care should be taken that the graphitesamples are packaged in clean materials (packing free of 14Cthat has not been in a designated isotope facility). Graphitiza-tion can be carried out inside the designated isotope areaimmediately following DIC extraction using the sealed tubetechnique referenced here (Xu et al. 2007). Forth, frequentblanks and standards should be run to monitor memoryeffects. For the data presented here, 14C-labeled samples, natu-ral samples, blanks, and standards were prepared on the same
vacuum line and processed in the same AMS wheels. We sawno memory effects between samples even with 14C-concentra-tions as high as 400 FM. If memory is seen in the vacuum line,the line can be cleaned as described above. A well-planned 14C-CH4 tracer-based experiment should result in samples with14C-concentrations that are < 2 FM. AMS facilities will likelynot be concerned with measuring these levels of enrichmentbecause they are similar to atmospheric concentrations fol-lowing nuclear bomb testing (~1.99 FM; Levin et al. 1985).AMS preparation labs, however, will not likely accept 14C-labeled samples for processing (CO2 extraction and graphitiza-tion) unless they have designated isotope facilities. Thus, asmentioned above, samples will need to be sent as pressedgraphite. When working with the LLRT method for the firsttime, we recommend that a few test samples be sent for AMSanalysis before a whole batch to ensure the desired 14C-levelswere met. As a precaution, splits of CO2 can be saved for eachsample in 6-mm Pyrex flame seal tubes, so that if the samplesdo exceed the maximum AMS detection limit, the saved CO2
can be diluted with 14C-free CO2 and analyzed for 14C asdescribed above.
We made three improvements to the 14C-CH4 LLRT ratemeasurement in the course of development and testing.First, we reduced the length of the post-incubation proce-dures by eliminating the need for a N2-filled glove bag. Postincubation, a 60-mL N2 headspace is introduced to the sam-ples with the two syringe technique described above, 0.4 mLsodium hydroxide is added to the samples by syringe, andthe sealed samples are sparged with UHP N2 for 40 min usingtwo needles (one 16 g, 4-inch needle inserted into the bot-tom of the sample bottle to deliver the N2 and a 23 g, 1-inchneedle inserted in the sample headspace as a vent for thestripped gasses and N2 flow). After sparging, sample stoppersare replaced with blue butyl stoppers inside a looselyenclosed N2 filled chamber. Second, we developed a methodfor filtering the cell biomass from samples in the field beforethe NaOH treatment for direct 14C-AMS analysis. At sea, themethod involves vacuum filtering 60 mL sample through aquartz fiber filter to collect cell biomass. The quartz filters arepartially dried by vacuum, rolled up with tweezers, insertedinto 6 mm, 2-inch prebaked quartz tubes, and completelydried on a hotplate at 60°C. Back in the laboratory, the cellbiomass on the quartz filters is combusted to CO2 in sealedquartz tubes and the 14C-content is measured as described in“14C-Cell Biomass Analysis.” Third, we replaced the plug value(called the vacuum valve above, Fig. 2 #14) in the DICextraction line with a needle valve. This allows more sensi-tive control over the extent of vacuum used during theextraction process.
The LLRT 14C-CH4 oxidation rate measurement outlinedhere lays the analytic foundation for a below-regulation mea-surement. Analytic techniques for measuring oxidation ratesusing low-levels of 14C-CH4 in conjunction with AMS wereidentified and tested during the method’s development. Now
Pack et al. Methane oxidation rates by AMS
257
that the analytic techniques are validated, the method can beextended to levels of 14C-CH4 that are below-regulation, butcareful attention needs to be paid to the intended site of appli-cation. In environments where the turnover times are fast (<400 d), the 14C-CH4 can be diluted below-regulation (0.037 BqmL–1, the strictest regulation for gases in Table 1) and 0.0074Bq 14C can be added per sample with 200 µL aliquots. Incu-bating a water sample (120 mL, 100 nM CH4,) with thisamount of 14C-CH4 for 1.5 d will increase the 14C-content ofthe DIC by ~25 ‰ and the POC by ~1700 ‰ assuming 30%of the 14C-CH4 consumed is fixed to the cell biomass and thesample has a turnover time of 400 d. In environments wherethe turnover time is slow (>400 d), the increase in the 14C-DICwill be < 25‰ and will approach the error in the 14C-DIC mea-surement (±3.7 ‰, see above). Increasing the volume ofinjected 14C-CH4 tracer to > 200 µL to introduce more 14C isnot a good option because a large gas pocket in a sample mayprevent the added 14C-CH4 from fully dissolving. To go below-regulation in these > 400 d environments, the 14C-CH4 willneed to be delivered as a sterile aqueous solution instead of agas. The use/possession exempt quantities for liquids are 103
times less strict than for gases (Table 1). Thus, a solution con-taining adequate 14C-CH4 for a rate measurement that isbelow-regulation could easily be made (the tracer preparationmethods outlined in de Angelis et al. 1993 or Joye et al. 1999could be adapted for this).
The 14C-CH4 LLRT rate measurement described here alsolays the analytic foundation for many applications of belowregulation 14C work that take advantage of the high sensitivityof AMS. First, the method can be extended to measuremethane oxidation rates in anoxic waters or sediments. Forboth environments, the activity of the 14C-CH4 tracer wouldneed to be adjusted so that adequate 14C was added to create adetectable signal in the oxidation products. In anoxic waters,the same procedures could be used as described here, but forsediments the method would need to be adapted for workwith cores (e.g., Joye et al. 2004). Second, because low-level14C-CH4 tracer adds small amounts of CH4 yet still raises back-ground 14C concentrations in a sample significantly (naturalabundance: 10–10 % 14C versus 1% 13C), the LLRT method maybe used to study carbon dynamics in environments where theexisting-high level 14C-CH4 radiotracers or 13C-CH4 stable iso-tope tracers would be impractical. For instance, a water sam-ple could be labeled with low-level 14C-CH4 and the 14C couldbe tracked through the methanotrophs, their predators, andviruses that infect the methanotrophs. Third, the LLRTmethod leads the way for work with other 14C-labeled organiccompounds at levels below-regulation. For example, themethod could be adapted to measure the consumption ratesof higher hydrocarbons such as ethane, propane, and butanein sediments and the water column. These hydrocarbonsaccompany CH4 in many seep environments, and little isknown about their consumption rates (Kinnaman et al. 2007;Mau et al. 2010; Valentine et al. 2010).
In conclusion, the 14C-CH4 LLRT method for methane oxi-dation rate measurements is generally consistent with the pre-viously published 3H-CH4 RT method, but mismatchesbetween methods at slower rates require further investigation.The AMS-based LLRT method compared with the decay-counting based 3H-CH4 and 14C-CH4 RT methods requiresmore time and funding per sample, and thus is unlikely toreplace them. However, the LLRT method should prove as auseful new tool for measuring methane oxidation rates andstudying carbon dynamics in low methane environments andwhen application of the existing RT methods is not practical(e.g., foreign venues, remote field sites, rapid response situa-tions, etc.)
ReferencesAlperin, M. J., and W. S. Reeburgh. 1985. Inhibition experi-
ments on anaerobic methane oxidation. Appl. Environ.Microbiol. 50(4):940-945.
Baani, M., and W. Liesack. 2008. Two isozymes of particulatemethane monooxygenase with different methane oxida-tion kinetics are found in Methylocystis sp. strain SC2. Proc.Natl. Acad. Sci. U.S.A. 105(29):10203-10208 [doi:10.1073/pnas.0702643105].
Beal, E. J., C. H. House, and V. J. Orphan. 2009. Manganese-and iron-dependent marine methane oxidation. Science325:184-187 [doi:10.1126/science.1169984].
Birnboim, H.C., and J. Doly. 1979. A rapid alkaline extractionprocedure for screening recombinant plasmid DNA. NucleicAcids Res. 7(6):1513-1524. [doi:10.1093/nar/7.6.1513].
Blumhagen, E. D., and J. F. Clark. 2008. Carbon sources andsignals through time in an alpine groundwater basin, Sage-hen, California. Appl. Geochem. 23:2284-2291 [doi:10.1016/j.apgeochem.2008.03.010].
Bussmann, I., M. Rahalkar, and M. Schink. 2006. Cultivationof methanotrophic bacteria in opposing gradients ofmethane and oxygen. FEMS Microbiol. Ecol. 56:331-344[doi:10.1111/j.1574-6941.2006.00076.x].
Caldwell, S. L., J. R. Laidler, E. A. Brewer, J. O. Eberly, S. C.Sandborgh, and F. S. Colwell. 2008. Anaerobic oxidation ofmethane: mechanisms, bioenergetics, and the ecology ofassociated microorganisms. Environ. Sci. Technol.42(18):6791-6799 [doi:10.1021/es800120b].
Carini, S., N. Bano, G. LeCleir, and S. B. Joye. 2005. Aerobicmethane oxidation and methanotroph community compo-sition during seasonal stratification in Mono Lake, Califor-nia (USA). Environ. Microbiol. 7(8):1127-1138 [doi:10.1111/j.1462-2920.2005.00786.x].
Carini, S. A., B. N. Orcutt, and S. B. Joye. 2003. Interactionsbetween methane oxidation and nitrification in coastalsediments. Geomicrobiol. J. 20(4):355-374 [doi:10.1080/01490450303900].
Costa, C., M. Vecherskaya, C. Dijkema, and A. J. M. Stams.2001. The effect of oxygen on methanol oxidation by anobligate methanotrophic bacterium studied by in vivo 13C
Pack et al. Methane oxidation rates by AMS
258
nuclear magnetic resonance spectroscopy. J. Indus. Micro-biol. Biotech. 26:9-14 [doi:10.1038/sj.jim.7000075].
Crowe, S. A., and others. 2010. The methane cycle in ferrugi-nous, tropical Lake Matano. Geobiology [doi:10.1111/j.1472-4669.2010.00257.x].
Daniels, L., and J. G. Zeikus. 1983. Convenient biologicalpreparation of pure high specific activity 14C-labelledmethane. J. Labeled Comp. Radiopharm. 20:17-24[doi:10.1002/jlcr.2580200104].
de Angelis, M. A., M. D. Lilley, E. J. Olson, and J. A. Baross.1993. Methane oxidation in deep-sea hydrothermal plumesof the Endeavour Segment of the Juan de Fuca Ridge. Deep-Sea Res. I. 40(6):1169-1186 [doi:10.1016/0967-0637(93)90132-M].
Fry, B., E. T. Peltzer, C. S. Hopkinson Jr., A. Nolin, and L. Red-mond. 1996. Analysis of marine DOC using a dry combus-tion method. Mar. Chem. 54:191-201 [doi:10.1016/0304-4203(96)00031-X].
Gillooly, J. F., J. H. Brown, G. B. West, V. M. Savage, and E. L.Charnov. 2001. Effects of size and temperature on meta-bolic rate. Science 293:2248-2251 [doi:10.1126/science.1061967].
Girguis, P. R., V. J. Orphan, S. J. Hallam, and E. F. DeLong.2003. Growth and methane oxidation rates of anaerobicmethanotrophic archaea in a continuous-flow bioreactor.Appl. Environ. Microbiol. 69(9):5472-5482 [doi:10.1128/AEM.69.9.5472-5482.2003].
———, A. E. Cozen, and E. F. DeLong. 2005. Growth and pop-ulation dynamics of anaerobic methane-oxidizing archaeaand sulfate-reducing bacteria in a continuous-flow bioreac-tor. Appl. Environ. Microbiol. 71(7):3725-3733 [doi:10.1128/AEM.71.7.3725-3733.2005].
Griffiths, R. P., B. A. Caldwell, J. D. Cline, W. A. Broich, and R.J. Morita. 1982. Field observations of methane concentra-tions and oxidation rates in the Southeastern Bering Sea.Appl. Environ. Microbiol. 44:435-446.
Hanson, R. S., and T. E. Hanson. 1996. Methanotrophic bacte-ria. Microbiol. Rev. 60(2):439-471.
Heeschen, K. U., R. S. Keir, G. Rehder, O. Klatt, and E. Suess.2004. Methane dynamics in the Weddell Sea determinedvia stable isotope ratios and CFC-11. Global Biogeochem.Cycles. 18:GB2012 [doi:10.1029/2003GB002151].
Heintz, M. B. 2011. Rates of aerobic methane oxidation in thewaters of the Santa Monica Basin and Alaskan Arctic Lakesmeasured with a tritium-based radiotracer technique, Ph.D.thesis. Univ. of California, Santa Barbara.
Hinger, E. N., G. M. Santos, E. R. M. Druffel, and S. Griffin.2010. Carbon isotope measurements of surface seawaterfrom a time-series off Southern California. Radiocarbon52(1):69-89.
Hinrichs, K.- U., and A. Boetius. 2002. The anaerobic oxida-tion of methane: New insights in microbial ecology andbiogeochemistry, p. 457-77. In G. Wefer, D. Billett, D.Hebbeln, B. B. Jørgensen, M. Schlüter, and T. C. E. van-
Weering, [eds.], Ocean margin systems. Springer-Verlag.Hoehler, T. M., M. J. Alperin, D. B. Albert, and C. S. Martens.
1994. Field and laboratory studies of methane oxidation inan anoxic marine sediment: Evidence for methanogen-sul-fate reducer consortium. Global Biogeochem. Cycl.8(4):451-463 [doi:10.1029/94GB01800].
Jones, R. D. 1991. Carbon monoxide and methane distribu-tion and consumption in the photic zone of the SargassoSea. Deep-Sea Res. 38(6):625-635 [doi:10.1016/0198-0149(91) 90002-W].
Jørgensen, B. B., A. Weber, and J. Jopfi. 2001. Sulfate reductionand anaerobic methane oxidation in Black Sea sediments.Deep-Sea Res. I 48:2097-2120 [doi:10.1016/S0967-0637(01)00007-3].
Joye, S. B., T. L. Connell, L. G. Miller, and R. S. Oremland.1999. Oxidation of ammonia and methane in an alkaline,saline lake. Limnol. Oceanogr. 44(1):178-188 [doi:10.4319/lo.1999.44.1.0178].
———, A. Boetius, B. N. Orcutt, J. P. Montoy, H. N. Schulz, M.J. Erickson, and S. K. Lugo. 2004. The anaerobic oxidationof methane and sulfate reduction in sediments from Gulf ofMexico cold seeps. Chem. Geol. 205:219-238 [doi:10.1016/j.chemgeo.2003.12.019].
Kessler, J. D., and W. S. Reeburgh. 2005. Preparation of naturalmethane samples for stable isotope and radiocarbon analy-sis. Limnol. Oceanogr. Methods 3:408-418 [doi:10.4319/lom.2005.3.408].
King, J. Y., W. S. Reeburgh, K. K. Thieler, G. W. Kling, W. M.Lova, L. C. Johnson, and K. J. Nadelhoffer. 2002. Pulse-labeling studies of carbon cycling in Arctic tundra ecosys-tems: The contribution of photosynthates to methaneemission. Global Biogeochem. Cycl. 16:1062-1069[doi:10.1029/2001GB001456].
Kinnaman, F. S., D. L. Valentine, and S. C. Tyler. 2007. Carbonand hydrogen isotope fractionation associated with the aer-obic microbial oxidation of methane, ethane, propane andbutane. Geochim. Cosmochim. Acta 71:271-283 [doi:10.1016/j.gca.2006.09.007].
Levin, I., and others. 1985. 25 years of tropospheric 14C obser-vations in central Europe. Radiocarbon 27(1):1-19.
Mau, S., M. B. Heintz, F. S. Kinnaman, and D. L. Valentine.2010. Compositional variability and air-sea flux of ethaneand propane in the plume of a large, marine seep field nearCoal Oil Point, CA. Geo-Mar. Lett. 30:367-378[doi:10.1007/s00367-010-0185-z].
McNichol, A. P, G. A. Jones, D. L. Hutton, and A. R. Gagnon.1994. The rapid preparation of seawater CO2 for radiocar-bon analysis at the National Ocean Sciences AMS Facility.Radiocarbon 36(2):237-246.
Moran, J. J., Beal, E. J., Vrentas, J. M., Orphan, V. J., Freeman,K. H., and C. H. House1. 2008. Methyl sulfides as interme-diates in the anaerobic oxidation of methane. Environ.Microbiol. 10(1): 162-173. [doi:10.1111/j.1462-2920. 2007.01441.x].
Pack et al. Methane oxidation rates by AMS
259
———, House, C. H., Thomas, B., and K. H. Freeman. 2007.Products of trace methane oxidation during nonmethyl-trophic growth by Methanosarcina. J. Geophys. Res. 112:G02011. [doi:10.1029/2006JG000268].
Murrel, J. C., B. Golbert, and I. R. McDonald. 2000. Molecularbiology and regulation of methane monooxygenase. Arch.Microbiol. 50:955-969.
Nauhaus, K., A. Boetius, M. Krüger, and F. Widdel. 2002. Invitro demonstration of anaerobic oxidation of methanecoupled to sulphate reduction in sediment from a marinegas hydrate area. Environ. Microbiol. 4(5):296-305[doi:10.1046/j.1462-2920.2002.00299.x].
Pohlman, J. W., D. L. Knies, K. S. Grabowski, T. M. DeTurck, D.J. Treacy, and R. B. Coffin. 2000. Sample distillation/graphi-tization system for carbon pool analysis by accelerator massspectrometry (AMS). Nucl. Instrum. Methods Phys. Res.,Sect. B. 172:428-433.
Raghoebarsing, A. A., and others. 2006. A microbial consor-tium couples anaerobic methane oxidation to denitrifica-tion. Nature 440:918-921 [doi:10.1038/nature04617].
Reeburgh, W. S. 1980. Anaerobic methane oxidation: Ratedepth distributions in Skan Bay sediments. Earth Planet.Sci. Lett. 47:345-352 [doi:10.1016/0012-821X(80)90021-7].
———. 2007. Oceanic methane biogeochemistry. Chem. Rev.107:486-513 [doi:10.1021/cr050362v].
———, B. B. Ward, S. C. Whalen, K. A. Sandbeck, K. A. Kil-patrick, and L. J. Kerhof. 1991. Black-sea methane geo-chemistry. Deep-Sea Res. A 38:S1189-S1210.
Rehder, G., R. S. Keir, E. Suess, and M. Rhein. 1999. Methanein the northern Atlantic controlled by microbial oxidationand atmospheric history. Geophys. Res. Lett. 26(5):587-590.
Rudd, J. W. M., R. D. Hamilton, and N. E. Campbell. 1974.Measurement of microbial oxidation of methane in lakewater. Limnol. Oceanogr. 19:519-524.
Sansone, F. J., and C. S. Martens. 1978. Methane oxidation inCape Lookout Bight, North Carolina. Limnol. Oceanogr.23(2):349-355 [doi:10.4319/lo.1978.23.2.0349].
Schlitzer, R. 2010. Ocean data view, <hppt://odv.awi.de>.Scranton, M. I., and P. G. Brewer. 1978. Consumption of dis-
solved methane in the deep ocean. Limnol. Oceanogr.23(6):1207-1213 [doi:10.4319/lo.1978.23.6.1207].
Southon, J. R., and G. M. Santos. 2004. Ion source develop-ment at KCCAMS, University of California, Irvine. Radio-carbon 46(1):33-39.
———, and ———. 2007. Life with MC-SNICS. Part II: further
ion source development at the Keck carbon cycle AMS facil-ity. Nucl. Instrum. Methods Phys. Res., Sect. B. 259:88-93.
Stuiver, M., and H. A. Polach. 1977. Discussion: Reporting 14Cdata. Radiocarbon 19:355-363.
Treude, T., A. Boetius, K. Knittell, K. Wallmann, and B. B. Jør-gensen. 2003. Anaerobic oxidation of methane above gashydrates at Hydrate Ridge, NE Pacific Ocean. Mar. Ecol.Prog. Ser. 264:1-14 [doi:10.3354/meps264001].
Turteltaub, K. W., and S. V. Vogel. 2000. Bioanalytical applica-tions of accelerator mass spectrometry for pharmaceuticalresearch. Curr. Pharm. Des. 6:991-1007 [doi:10.2174/1381612003400047].
Valentine, D. L., D. C. Blanton, W. S. Reeburgh, and M. Kast-ner. 2001. Water column methane oxidation adjacent to anarea of active hydrate dissociation, Eel River Basin.Geochim. Cosmochim. Acta 65(16):2633-2640 [doi:10.1016/S0016-7037(01)00625-1].
———, and others. 2010. Propane respiration jump-startsmicrobial response to a deep oil spill. Science330(6001):208-211 [doi:10.1126/science.1196830].
Ward, B. B. 1992. The subsurface methane maximum in theSouthern California Bight. Continent. Shelf Res.12(5/6):735-752 [doi:10.1016/0278-4343(92)90028-I].
———, Kilpatrick, K.A., Wopat, A.E., Minnich, E.C., and M. E.Lidstrom. 1989. Methane oxidation in Saanich Inlet duringsummer stratification. Continent. Shelf Res. 9(1):65-75.[doi:10.1016/0278-4343(89)90083-6].
———, ———, P. C. Novelli, and M. I. Scranton. 1987.Methane oxidation and methane fluxes in the ocean sur-face-layer and deep anoxic waters. Nature 327(6119):226-229 [doi:10.1038/327226a0].
———, and K. A. Kilpatrick. 1990. Relationship between sub-strate concentration and oxidation of ammonium andmethane in a stratified water column. Continent. Shelf Res.10(12):1193-1208 [doi:10.1016/0278-4343(90)90016-F].
Xu, X. M., S. E. Trumbore, S. H. Zheng, J. R. Southon, K. E.McDuffee, M. Luttgen, and J. C. Liu. 2007. Modifying asealed tube zinc reduction method for preparation of AMSgraphite targets: Reducing background and attaining highprecision. Nucl. Instrum. Methods Phys. Res., Sect. B259(1):320-329.
Submitted 2 December 2010Revised 5 May 2011
Accepted 10 May 2011
Pack et al. Methane oxidation rates by AMS
260