Algorithmic Trading Accelerator Guide
62
Algorithmic Trading Accelerator Guide 5.3 January 2015
-
Upload
khangminh22 -
Category
Documents
-
view
4 -
download
0
Transcript of Algorithmic Trading Accelerator Guide

Algorithmic Trading Accelerator Guide
5.3
January 2015

This document applies to Apama 5.3 and to all subsequent releases.
Specifications contained herein are subject to change and these changes will be reported in subsequent release notes or new editions.
Copyright © 2013-2015 Software AG, Darmstadt, Germany and/or Software AG USA Inc., Reston, VA, USA, and/or its subsidiaries and/or its affiliates and/ortheir licensors.
The name Software AG and all Software AG product names are either trademarks or registered trademarks of Software AG and/or Software AG USA Inc.and/or its subsidiaries and/or its affiliates and/or their licensors. Other company and product names mentioned herein may be trademarks of their respectiveowners.
Detailed information on trademarks and patents owned by Software AG and/or its subsidiaries is located at http://softwareag.com/licenses.
This software may include portions of third-party products. For third-party copyright notices, license terms, additional rights or restrictions, please refer to"License Texts, Copyright Notices and Disclaimers of Third Party Products". For certain specific third-party license restrictions, please refer to section E of theLegal Notices available under "License Terms and Conditions for Use of Software AG Products / Copyright and Trademark Notices of Software AG Products".These documents are part of the product documentation, located at http://softwareag.com/licenses and/or in the root installation directory of the licensedproduct(s).
Document ID: PAF-Algorithmic_Trading_Accelerator_Guide-5.3-20150122@245813

Table of Contents
Algorithmic Trading Accelerator Guide 5.3 3
Table of Contents
Chapter 1: Overview of the Algorithmic Trading Accelerator.............................................5
Chapter 2: Running the ATA samples...................................................................................7Starting and stopping the ATA demo................................................................................................................. 8
Starting and stopping on Windows............................................................................................................. 9Starting and stopping on UNIX or Linux...................................................................................................10
Subscribing to Symbol Sets............................................................................................................................. 11Using the Order Management System.............................................................................................................12
Blotter Window Fields............................................................................................................................... 15Background Effects................................................................................................................................... 16Order Details............................................................................................................................................. 17
Using Algorithmic Trading Strategies............................................................................................................... 17Algos Home Page..................................................................................................................................... 17Crossover...................................................................................................................................................18Iceberg....................................................................................................................................................... 20Momentum Trading....................................................................................................................................21Order Slicing..............................................................................................................................................23Percentage of Volume (POV)....................................................................................................................24
Using the POV Strategy.....................................................................................................................25Statistical Arbitrage....................................................................................................................................28Time Weighted Average Price (TWAP).....................................................................................................29
Using the TWAP Strategy..................................................................................................................30Volume Weighted Average Price (VWAP)................................................................................................ 32
Using the VWAP Strategy..................................................................................................................33Using Risk Firewalls......................................................................................................................................... 35
Overview of Active Risk Firewalls.............................................................................................................36Viewing Firewall Rule Details....................................................................................................................37Firewall Ruleset: Order Price Limits......................................................................................................... 38Firewall Ruleset: Order Quantity Limits.................................................................................................... 39Firewall Ruleset: Position Limits............................................................................................................... 40Firewall Ruleset: Order Throttle Limits..................................................................................................... 42Firewall Ruleset: Client Credit Limits........................................................................................................ 43
Using Market Test Scenarios........................................................................................................................... 43Testing with the Order Manager Scenarios.............................................................................................. 44Testing with the Market Data Scenarios................................................................................................... 46
Chapter 3: Developing and deploying custom ATA applications.....................................49Architecture overview....................................................................................................................................... 49
Components of the Algorithmic Trading solution...................................................................................... 49Directory structure..................................................................................................................................... 50
Importing the ATA Project into Apama Studio................................................................................................. 52Quick steps to a new algorithm....................................................................................................................... 53Deploying the ATA to a Web Application Server............................................................................................. 53Adding Adapters............................................................................................................................................... 54

Table of Contents
Algorithmic Trading Accelerator Guide 5.3 4
Adding Symbol Sets......................................................................................................................................... 56Getting Symbol attributes..........................................................................................................................56Adding temporary Symbol Sets................................................................................................................ 57Adding Symbol Sets on the server........................................................................................................... 58
Chapter 4: Troubleshooting................................................................................................. 61

Algorithmic Trading Accelerator Guide 5.3 5
Chapter 1: Overview of the Algorithmic Trading Accelerator
The Algorithmic Trading Accelerator (ATA) installs with the Capital Markets Foundation (CMF).Unlike solutions that offer commoditized, pre-defined strategies, the ATA enables you to quicklydevelop, refine, and deploy unique algorithmic trading strategies built upon your own intellectualproperty. The ATA relies on Apama's patented Event Stream Processing (ESP) platform to applystrategies against high volume market activity, enabling users to achieve trading objectives.
Apama includes an extensible framework for integrating with market data feeds, middlewaretechnologies, order management systems and databases. And it offers a rich dashboard environmentfor graphical monitoring of algorithmic trading execution. The following illustrates the runtimearchitecture of a solution based on the ATA.
In a production environment, adapters feed events to an Apama correlator, which filters eventsand applies trading strategies. An administrator can set up risk firewalls to prevent unauthorizedtrading. Traders can view the orderbook and trade using the supplied Apama dashboard ora customized trading user interface. For an example of a custom trading interface, see the FXAggregation solution, which is also based on the CMF.
ATA includes tools to monitor market flow and depth and to execute orders through one or more ofthe following:
Basic Direct Market Access (DMA) with explicit buy and sell orders.
Execution distribution strategies such as Volume-weighted and Time-weighted Average Price(VWAP and TWAP), order slicing, iceberg, and Percentage of Volume (PoV).
Market-responsive analytic strategies such as momentum trading, and crossover.

Algorithmic Trading Accelerator Guide 5.3 6
Complex algorithms such as statistical arbitrage that are sophisticated in terms of the logicalconstructs that define them as well as the technological requirements to run them effectively.
All order activities can be monitored by several overlapping trading firewalls that are defined forsets of users, venues, and instruments. Each firewall monitors prices, quantities, positions, and clientbalances to alert traders at one threshold, and reject orders at the outer limit. The firewalls protect theclient's interests when order submission and trade execution are virtually immediate.
Using ATA as a starting point for a custom solution allows you to:
Develop unique automated trading strategies in a graphical modeling environment.
Package existing algorithmic modules for reuse in new strategies.
Build upon a foundation library of trading algorithms.
Evaluate and refine strategies by testing against historical data.
Execute thousands of trading scenarios concurrently.
Use packaged connectivity for access to financial feeds.
Optimize trade opportunities for both sell-side and buy-side firms.
Out-of-the-box, ATA provides a trade simulator and start-up scripts, which make it easy toexplore ATA and learn about its capabilities. The following illustration shows the demonstrationarchitecture.
This document shows you how to set up the Algorithmic Trading Accelerator, run it indemonstration mode, explore its client screens, set up distributed clients, and use Apama Studio tocreate custom trading algorithms.

Algorithmic Trading Accelerator Guide 5.3 7
Chapter 2: Running the ATA samples
n Starting and stopping the ATA demo .................................................................................................................. 8
n Subscribing to Symbol Sets .............................................................................................................................. 11
n Using the Order Management System .............................................................................................................. 12
n Using Algorithmic Trading Strategies ................................................................................................................ 17
n Using Risk Firewalls .......................................................................................................................................... 35
n Using Market Test Scenarios ............................................................................................................................ 43
The ATA includes algorithmic trading strategies that are injected into an Apama correlator, and anApama dashboard that supports trading, displays information about the strategies, and allows youto configure firewall rules. Included scripts allow you to start the runtime pieces and demonstrateATA capabilities.
You can run ATA on a single machine, or you can run the correlator on one machine and runmultiple dashboards that connect to it remotely. You might do this for example, if you wantedto install the correlator on a machine running Linux. The dashboards must be run on Windowsmachines.
Note: Before you can run ATA, you must install and configure Apama and the CMF as described inCapital Markets Foundation Guide.The CMF installation makes it easy to run the pre-defined ATA immediately on the local machine.The ATA is copied into the %APAMA_WORK% directory during installation and run from there.Then, in "Developing and deploying custom ATA applications" on page 49, you see how toimport the projects into Apama Studio, so you can define, test, and deploy your custom ATA.
The following table lists the scripts (located in ATA's installation directory %APAMA_WORK%/ATA_{version}) for starting and stopping the demo or the correlator and dashboard separately:
Table 1. ATA Scripts
Description Batch and sh file Ant script
One command that:
Builds the project
Starts the correlator
Starts the trade simulator
Starts the Administrativedashboard
startDemo ant start-demo
ant start
Starts the correlator. startServer ant start-server

Starting and stopping the ATA demo
Algorithmic Trading Accelerator Guide 5.3 8
Description Batch and sh file Ant script
Starts the Administrativedashboard.
startClient (.bat only, noequivalent on Linux)
ant start-client
Shuts down the correlatorand trade simulator.
stopDemo ant stop
Stops only the correlator. stopServer ant stop-server
Creates a deploymentWAR which can be usedto deploy the ATA using aWeb Application Service.See "Deploying the ATA toa Web Application Server"on page 53 for usageinformation.
deploy (.bat only, noequivalent on Linux)
ant deploy
Prints a list of ant targets. N/A ant usage
Prints a list of ant targets. N/A ant help
Deletes log files and cleansup deployed strategies.
N/A ant clean
Deletes log files. N/A ant clean-logs
Archives log files in a zipfile in the ATA directory anddeletes all log files fromthe log folder. The zip filesuffix includes the dateand time. For example,log_20120420_103921.zip.The correlators must bestopped before you run thiscommand.
N/A ant archive-logs
The following sections describe how to start and stop the ATA demo and walk through the availablefeatures and panels in the Algorithmic Trading dashboard. Later chapters describe how to set upusers and customize ATA.
Starting and stopping the ATA demoDemo scripts start a correlator, inject the ATA framework and strategies, start a market datasimulator, and start an administrative dashboard--all on the same machine. A local ATA demorequires no authentication, and the user is referenced as your local login name, referenced here as asample user myusername.

Starting and stopping the ATA demo
Algorithmic Trading Accelerator Guide 5.3 9
When your server session is done, stop the Algorithmic Trading accelerator server and perform agraceful shutdown. Closing the command prompt window where you started the server does notstop the process. You must explicitly run the stop command to stop the server.
Running the ATA samples
Starting and stopping on WindowsOn Windows, you can start and stop the ATA demo from the Start > All Programs menu, chooseSoftware AG > Apama Capital Markets 5.3 > ATA > StartATA / StopATA, or from a CMF command prompt,as follows:
1. To start and stop the ATA demo from the a CMF command prompt:
a. From the Start > All Programs menu, from the Start > All Programs menu, choose Software AG >Apama Capital Markets Foundation 5.3 > CMF Command Prompt.
A CMF Command Prompt opens to the %APAMA_WORK% directory.
b. Change directories to the top level ATA directory. For example:
cd ATA_{version}
c. Launch the demo start script by entering:
startDemo.bat or ant startDemo
The Algorithmic Trading dashboard Home page opens. The Home page provides access to theother pages as well as the status of the correlator and service.

Starting and stopping the ATA demo
Algorithmic Trading Accelerator Guide 5.3 10
d. When you have completed your demo session, launch the demo stop script by entering:
stopDemo.bat or ant stopDemo
Starting and stopping the ATA demo
Starting and stopping on UNIX or LinuxOn UNIX or Linux, start and stop the ATA demo, as follows:
1. Open an Apama Command Prompt
2. Change directory to the root of the CMF installation.
3. Source bin/CMF_env
4. Enter ./startdemo.sh or ant startDemo
The Algorithmic Trading dashboard Home page opens. The Home page provides access to theother pages as well as the status of the correlator and service.

Subscribing to Symbol Sets
Algorithmic Trading Accelerator Guide 5.3 11
5. When you have completed your demo session, launch the demo stop script by entering ./stopdemo.sh or ant
stopDemo
Starting and stopping the ATA demo
Subscribing to Symbol SetsActivities in Algorithmic Trading are based on market data. Whether running the demo and usingsimulated data or using real data from an adapter to an external feed, you first need to subscribe tothe symbol sets of interest. Each symbol set corresponds to a data feed and initializes the symbolvalues for that feed.
To subscribe to a symbol set:
1. From the dashboard Home page click Setup to open the Symbol Set Subscription page.
2. Select a symbol set.
3. Click Subscribe.
The demo simulates data from all these feeds, so you can subscribe to one or more. Each subscribedsymbol set is highlighted and checked, as shown for DJIA and FX:

Using the Order Management System
Algorithmic Trading Accelerator Guide 5.3 12
To unsubscribe from a symbol set, select it, and then click Unsubscribe.
Running the ATA samples
Using the Order Management SystemFrom the left navigation bar, click OMS to display the Order Management page. This page providesthe following functionality:
Selection of multiple instrument groups
Visual summary of Bid/Ask/Last prices and volumes
Visual summary of positions in each instrument
Detailed view of full market depth (5 Best Bid/Asks)
Order “blotter” view of all orders working and worked in the market
Selection of an order provides detailed information, and enables modification or cancellation oflive orders
Note: The current position of all instruments will be persisted. When the application restarts, thepositions are restored.

Using the Order Management System
Algorithmic Trading Accelerator Guide 5.3 13
The Order Management System screen opens with the selected instruments of the subscribed symbolsets listed in the trader section, as shown:
At the top of the OMS screen, you can click a button to launch new panes of the Trader section(prices, market depth, and DMA) or the Blotter section (executed orders):
Trader section
The trader section provides the information about trades for the subscribed symbol set.

Using the Order Management System
Algorithmic Trading Accelerator Guide 5.3 14
The left side of Trader section provides a view of the market activity and holdings within the currentinstrument list. When you click on a line, it is selected for order activities, as shown:
The right side of the Trader section enables monitoring of an instrument and access to trading of theselected instrument, as illustrated:

Using the Order Management System
Algorithmic Trading Accelerator Guide 5.3 15
The market depth and flow information take the pulse of the market for the selected instrument. Youcan then specify the quantity, type, and price of the intended trade. Clicking the Buy or Sell buttonsubmits the order, and then records the transaction in the blotter section. In addition to standardDMA capabilities, this screen supports launching trading strategies directly from this panel. Forsingle instrument strategies, the dialog will reflect the selected instrument and its symbol set in thealgo creation dialog.
You can open multiple Trader windows to monitor selected instruments.
Blotter section
The Blotter section provides the status of orders about trades for the subscribed symbol sets. It alsowill reflect orders that have been blocked by the firewall. You can clear the blotter listings; however,underlying open orders will continue to process. You can open multiple blotter windows but theywill all reflect the same data and when one is cleared, they all are cleared.
Running the ATA samples
Blotter Window FieldsThe Blotter window fields are:
Field Name Description
Symbol The name of the symbol

Using the Order Management System
Algorithmic Trading Accelerator Guide 5.3 16
Field Name Description
Side The side of the symbol where BUY has a greenbackground, and SELL has a red background.
Quantity The total quantity requested by this order
Price The price issued with this order
Type The type of order: MARKET, LIMIT, FOREX MARKET, FOREX LIMIT, orPREVIOUSLY QUOTED
MKT When checked, order is acknowledged to be in the market
CAN When checked, order has been cancelled
Remaining The quantity not yet traded on this order
Avg Price The average price gained on this order
Status Message The latest status message – click on order to see full list
Algorithm OMS is from this dashboard, alternatively it will show thename of the algorithm that issued the order
Issued The time and date that the order was issued
Using the Order Management System
Background EffectsBackgrounds and text colors indicate an order's status:
Grey background — Order issued; not yet acknowledged from the market
Yellow background — Order acknowledged and working in the market
White background — Order acknowledged and no longer in market (completed, cancelled, rejected,etc.)
Using the Order Management System

Using Algorithmic Trading Strategies
Algorithmic Trading Accelerator Guide 5.3 17
Order DetailsClicking on an order line displays details about the selected order, as shown:
In this panel you can:
Modify the quantity, price, and type of the order (if the underlying exchange supports thesechanges).
Cancel the order
View history of all activity recorded on that order.
When an order is complete, as shown, its history and details are displayed.
A completed order can no longer be edited or cancelled.
Using the Order Management System
Using Algorithmic Trading StrategiesThe Algorithmic Trading Accelerator provides several pre-defined strategies that were created in theApama Scenario Manager.
Note: You will learn later how to modify them to derive your own algorithms, and to redefine thedashboards in the Apama Dashboard Studio to suit your needs.
Running the ATA samples
Algos Home Page
Using Algorithmic Trading Strategies
Algorithmic Trading Accelerator Guide 5.3 18
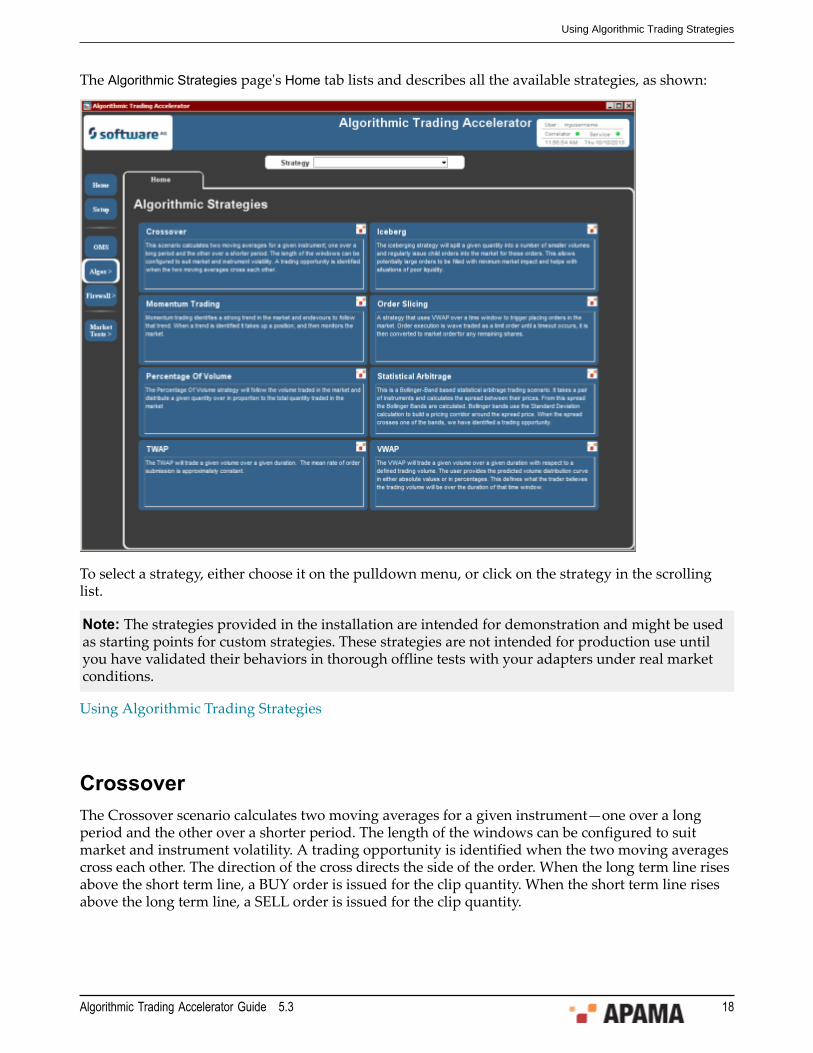
The Algorithmic Strategies page's Home tab lists and describes all the available strategies, as shown:
To select a strategy, either choose it on the pulldown menu, or click on the strategy in the scrollinglist.
Note: The strategies provided in the installation are intended for demonstration and might be usedas starting points for custom strategies. These strategies are not intended for production use untilyou have validated their behaviors in thorough offline tests with your adapters under real marketconditions.
Using Algorithmic Trading Strategies
CrossoverThe Crossover scenario calculates two moving averages for a given instrument—one over a longperiod and the other over a shorter period. The length of the windows can be configured to suitmarket and instrument volatility. A trading opportunity is identified when the two moving averagescross each other. The direction of the cross directs the side of the order. When the long term line risesabove the short term line, a BUY order is issued for the clip quantity. When the short term line risesabove the long term line, a SELL order is issued for the clip quantity.

Using Algorithmic Trading Strategies
Algorithmic Trading Accelerator Guide 5.3 19
Select an instance in the Scenario Instances to view its data in the graphic section.
To run strategies, click Create New. In the Crossover: Create dialog box, choose from the symbolsets towhich you are subscribed, and then an instrument in the selected set, as shown:
When you change the value of a parameter, press Enter (while focus is on that field) to persist thechange.
Click Create to save the parameters, and then click on its line on the page to run the strategy. Createas many strategies as you want. This type of strategy has no defined end, so you need to explicitlystop each strategy instance.
This strategy exposes an important concept. The strategies that you create in a dashboard are activein the server on behalf of the current user. When you close all your running dashboards, the strategywill continue until the server is stopped. When you reconnect later from any browser, the active

Using Algorithmic Trading Strategies
Algorithmic Trading Accelerator Guide 5.3 20
strategies can be viewed. After a server restart, the strategies and pending orders are not active. Theuser's position in each instrument was persisted and is displayed in the dashboard.
Using Algorithmic Trading Strategies
IcebergThe iceberg strategy (also known as wave-trading, clipping, and quantity hiding) splits a givenquantity into a number of smaller volumes, and then regularly issues partial orders into the marketfor the full order. This allows potentially large orders to be filled with minimum market impactand helps with situations of poor liquidity. The dashboard shows the progress of each scenario insummary and in detail when selected.
Select an instance in the Scenario Instances to view its data in the graphic section.
To run strategies, click Create New. In the Iceberg Trading: Create dialog box, choose from thesymbolsets to which you are subscribed, and then an instrument in the selected set, as shown:

Using Algorithmic Trading Strategies
Algorithmic Trading Accelerator Guide 5.3 21
When you change the value of a parameter, press Enter (while focus is on that field) to persist thechange.
Click Create to save the parameters, and then click on its line on the page to run the strategy. Createas many strategies as you want.
Using Algorithmic Trading Strategies
Momentum TradingMomentum trading identifies a strong trend in the market and attempts to follow that trend. When atrend is identified it takes up a position, and then monitors the market. If the trend continues, it takesup another position, and continues to do so. Once the trend is identified as completed, the positionbuilt up is then neutralized. This scenario is intended for use on large trends in the market ratherthan constant intra-day trading such as statistical arbitrage.

Using Algorithmic Trading Strategies
Algorithmic Trading Accelerator Guide 5.3 22
Select an instance in the Scenario Instances to view its data in the graphic section.
To run strategies, click Create New. In the Momentum Trading: Create dialog box, choose from thesymbolsets to which you are subscribed, and then an instrument in the selected set, as shown:
When you change the value of a parameter, press Enter (while focus is on that field) to persist thechange.
Click Create to save the parameters, and then click on its line on the page to run the strategy. Createas many strategies as you want.
Using Algorithmic Trading Strategies

Using Algorithmic Trading Strategies
Algorithmic Trading Accelerator Guide 5.3 23
Order SlicingOrder slicing is a strategy that uses VWAP over a time window to trigger placing orders in themarket. Order execution is wave traded as a limit order until a timeout occurs. It is then converted tomarket order for any remaining shares.
Note: To view data in the upper graph, you must first select an instance in the table.
You can choose to see Average Price instead of Remaining:
Using Algorithmic Trading Strategies
Algorithmic Trading Accelerator Guide 5.3 24
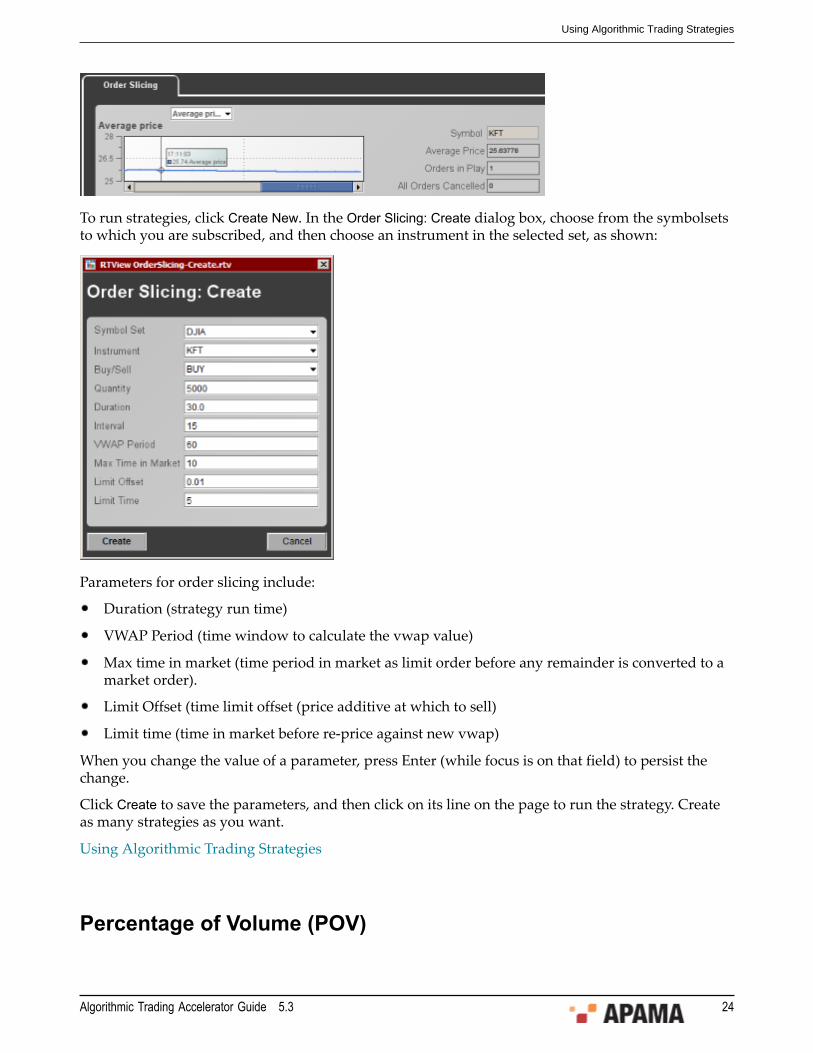
To run strategies, click Create New. In the Order Slicing: Create dialog box, choose from the symbolsetsto which you are subscribed, and then choose an instrument in the selected set, as shown:
Parameters for order slicing include:
Duration (strategy run time)
VWAP Period (time window to calculate the vwap value)
Max time in market (time period in market as limit order before any remainder is converted to amarket order).
Limit Offset (time limit offset (price additive at which to sell)
Limit time (time in market before re-price against new vwap)
When you change the value of a parameter, press Enter (while focus is on that field) to persist thechange.
Click Create to save the parameters, and then click on its line on the page to run the strategy. Createas many strategies as you want.
Using Algorithmic Trading Strategies
Percentage of Volume (POV)

Using Algorithmic Trading Strategies
Algorithmic Trading Accelerator Guide 5.3 25
The Percentage of Volume execution strategy follows the volume traded in the market anddistributes a specified quantity over time, in proportion to the total quantity traded in the market.This is much like iceberg trading an order but will follow market volume rather than trading clips ofa fixed size. The purpose of this algo is to minimize market impact while ensuring that the desiredquantity is traded. The following screenshot depicts the POV strategy in use. The main bar chartshows the volume traded in each clip so far.
Select an instance in the Scenario Instances to view its data in the graphic section.
The total order quantity is partitioned over time intervals, with child order sizes determined by thevolume seen traded in market over the preceding interval. It is possible to cap the child order size ifyou want; otherwise, the algorithm will attempt to place orders of the specified percentage of marketvolume. Each child order will be worked in market, becoming more aggressively priced if it remainsunfilled, and the aggression of this working is determined by the algorithm’s progress relative to themarket volume.
Using Algorithmic Trading Strategies
Using the POV StrategyThe strategy relies on the average daily volume (ADV) being defined for each instrument used. Toload ADVs into memory, click Load ADVs. The POV Data Loader dialog box opens, as shown:

Using Algorithmic Trading Strategies
Algorithmic Trading Accelerator Guide 5.3 26
You can load ADVs from a file. It is not essential to load ADVs, but if this step is skipped the usermust specify the ADV for each strategy instance.(A sample file is provided to demonstrate therequired format, but note that the sample values are not suitable for trading.)
To create a new strategy, click Create New Strategy Instance. The POV Order Creator dialog box opens,as shown:
Specify the following parameters:
Parameter Value
Symbolset The parent symbolset of the chosen symbol
Instrument The symbol to trade
Total Quantity The total quantity of the POV order to be placed
Percentage to Trade The percentage of the total quantity chosen to actuallysend to the market.

Using Algorithmic Trading Strategies
Algorithmic Trading Accelerator Guide 5.3 27
Parameter Value
Child Order Interval The duration of each clip
Randomness Random variation in seconds added to the child orderinterval.
Target % of ADV The level of participation in the market; the strategy willnot exceed this percentage of market volume.
Round Lot Size The size of a round lot in the market; the strategy willquantise child orders at this granularity.
Max Child Order Size (Optional) the maximum quantity to trade in a clip.
Max aggression The aggression level at which to cap the used pricingmodels.
Side BUY or SELL
Order Type Limit orders will not trade worse than the specifiedprice, and will not work child orders up to marketorders. As with any limit order, complete execution is notguaranteed.
Limit Price Only applied to limit orders. Used to cap/floor child orderprices, and to restrict which trades in market are countedfor determining eligible volume.
Max eligible % of ADV Trades over this percentage of the ADV will be excludedfrom the market quantity when determining thesize of child orders. This is intended to remove fromconsideration trades that are large enough to distort themarket, and the resultant effect that the strategy wouldplace large child orders in the wake of such trades.
ADV If set to 0, the system will use a pre-loaded ADV. If this isset to 0 and no ADV is loaded, the strategy will not tradeand must be manually deleted after creation.
Start Time Start hour/minute of the strategy, which should fall withinthe start and end time of the chosen volume curve
End Time End hour/minute of the strategy, which should be after thestart hour/minute and fall within the start and end time ofthe chosen volume curve.
When you change the value of a parameter, press Enter (while focus is on that field) to persist thechange.

Using Algorithmic Trading Strategies
Algorithmic Trading Accelerator Guide 5.3 28
Click Create to save the parameters, and then click on its line on the page to run the strategy. Createas many strategies as you want.
Percentage of Volume (POV)
Statistical ArbitrageThis is a Bollinger-Band based statistical arbitrage trading scenario. It takes a pair of instrumentsand calculates the spread between their prices. From this spread, the Bollinger bands are calculated.Bollinger bands use the Standard Deviation calculation to build a pricing corridor around the spreadprice. When the spread crosses one of the bands, the strategy has identified a trading opportunity.Depending on which boundary is crossed: upper or lower, the orders are to BUY/SELL or SELL/BUY.You always buy one instrument and sell the other, and ideally have the same number of BUYs andSELLs, so you end up with no inventory.
Select an instance in the Scenario Instances to view its data in the graphic section.
To run strategies, click Create New. In the Statistical Arbitrage: Create dialog box, choose from thesymbolsets to which you are subscribed, and then two instruments in the selected set, as shown:

Using Algorithmic Trading Strategies
Algorithmic Trading Accelerator Guide 5.3 29
When you change the value of a parameter, press Enter (while focus is on that field) to persist thechange.
Click Create to save the parameters, and then click on its line on the page to run the strategy. Createas many strategies as you want.
Using Algorithmic Trading Strategies
Time Weighted Average Price (TWAP)This strategy will trade a given volume over a given duration. The mean rate of trading is constantover time.
The total quantity to trade is partitioned into a number of clips; each clip is executed in turnthroughout the trading period. The strategy will randomize clip sizes, and will work each orderaggressively in market. The aggressiveness level is determined by discrete thresholds according tohow far ahead or behind the target progress the TWAP is currently performing. The strategy willswitch price models to become more or less aggressive in the market the farther ahead or morebehind it is. It will place a market order as a last resort if trailing significantly.
The screenshot below depicts a TWAP strategy in use. The main chart shows the volume traded ineach clip.

Using Algorithmic Trading Strategies
Algorithmic Trading Accelerator Guide 5.3 30
Select an instance in the Scenario Instances to view its data in the graphic section.
Using Algorithmic Trading Strategies
Using the TWAP StrategyThe strategy relies on the average daily volume (ADV) being defined for each instrument used. Toload ADVs into memory, click Load ADVs. The TWAP Data Loader dialog box opens, as shown:

Using Algorithmic Trading Strategies
Algorithmic Trading Accelerator Guide 5.3 31
You can load ADVs from a file. It is not essential to load ADVs, but if this step is skipped the usermust specify the ADV for each strategy instance.(A sample file is provided to demonstrate therequired format, but note that the sample values are not suitable for trading.)
To create a new strategy, click Create New Strategy Instance. The TWAP Order Creator dialog box opens,as shown:
You can choose to limit total trades to a specified percentage of the average daily volume. To doso, the ADV must first be loaded from a CSV file via the Load ADVs dialog. Once this is done, or ifvolume limiting is not to be used, click the Create New Strategy Instance button to launch a strategycreation dialog, and then enter values for the TWAP parameters:
Parameter Value
Symbol Set The parent symbolset of the chosen symbol
Instrument The symbol to trade
Total Quantity The total quantity of the TWAP order to be placed
Slice Interval Size The interval size for slices in units of minutes
Subslicing Frequency The interval size for subslices in units of seconds (not atrue frequency; nomenclature derives from a specificationdocument).
Side BUY or SELL
Volume Curve Name The name of the volume curve to be used for determiningthe slice quantities Child Order Interval
Round Lot Size The quantity by which orders and the total quantityshould be rounded

Using Algorithmic Trading Strategies
Algorithmic Trading Accelerator Guide 5.3 32
Parameter Value
Max Aggression The aggression level at which to cap the used pricingmodels
Percent to Trade The percentage of the total quantity chosen to actuallysend to the market.
Max % of ADV The percentage of the average daily volume (ADV) atwhich to cap the total quantity. (Optional, defaults to100%)
Randomness Random variation in seconds added to the subslicingfrequency
Start Time Start hour/minute of the strategy, which should fall withinthe start and end time of the chosen volume curve
End Time End hour/minute of the strategy, which should be after thestart hour/minute and fall within the start and end time ofthe chosen volume curve..
When you change the value of a parameter, press Enter (while focus is on that field) to persist thechange.
Click Create to save the parameters, and then click on its line on the page to run the strategy. Createas many strategies as you want.
Time Weighted Average Price (TWAP)
Volume Weighted Average Price (VWAP)Also referred to as Volume Curve based trading, this strategy will trade a given volume over a givenduration with respect to a defined trading volume.
The following screenshot below depicts a VWAP strategy . The top chart (pale blue) depicts thevolume as predicted by the trader. Below this are the actual trading volumes expected to be issued ineach clip; the chart below that depicts the current progress and the volumes executed at each clip.
Note that the volume curve will be displayed over its full length, typically a trading day, while theplanned/executed volumes will be displayed only over the strategy lifetime.

Using Algorithmic Trading Strategies
Algorithmic Trading Accelerator Guide 5.3 33
Select an instance in the Scenario Instances to view its data in the graphic section.
The user provides the predicted volume distribution curve in either absolute values or inpercentages. This defines what the trader believes the trading volume will be over the duration ofthat time window.
The total quantity to trade is then partitioned into a number of clips; each clip is executed in turnthroughout the trading period. In addition to calculating the correct volume to execute at eachclip, the scenario will work each order aggressively. The aggressiveness level is determined bydiscrete percentage thresholds according to how far ahead or behind the anticipated market volumethe VWAP is currently performing. The strategy will switch price models to become more or lessaggressive in the market the farther ahead or more behind it is. It will place a market order as a lastresort if trailing significantly.
Using Algorithmic Trading Strategies
Using the VWAP StrategyThe strategy relies on the average daily volume (ADV) being defined for each instrument used. Touse this strategy, click Load Volume Curves/ADVs. The VWAP Data Loader dialog box opens, as shown:

Using Algorithmic Trading Strategies
Algorithmic Trading Accelerator Guide 5.3 34
You can load ADVs from a file. It is not essential to load ADVs, but if this step is skipped the usermust specify the ADV for each strategy instance.(A sample file is provided to demonstrate therequired format, but note that the sample values are not suitable for trading.)
After volume curves (and ADVs, if specified) are loaded, click click Create New Strategy Instance toopen a strategy creation dialog.
To create a new strategy, . The VWAP Order Creator dialog box opens, as shown:
In the dialog box, specify values for the following VWAP parameters:
Parameter Value
Symbol Set The parent symbolset of the chosen symbol
Instrument The symbol to trade
Total Quantity The total quantity of the TWAP order to be placed

Using Risk Firewalls
Algorithmic Trading Accelerator Guide 5.3 35
Parameter Value
Slice Interval Size The interval size for slices in units of minutes
Subslicing Frequency The interval size for subslices in units of seconds (not atrue frequency; nomenclature derives from a specificationdocument).
Side BUY or SELL
Volume Curve Name The name of the volume curve to be used for determiningthe slice quantities Child Order Interval
Round Lot Size The quantity by which orders and the total quantityshould be rounded
Max Aggression The aggression level at which to cap the used pricingmodels
Percent to Trade The percentage of the total quantity chosen to actuallysend to the market.
Max % of ADV The percentage of the average daily volume (ADV) atwhich to cap the total quantity. (Optional, defaults to100%)
Randomness Random variation in seconds added to the subslicingfrequency
Start Time Start hour/minute of the strategy, which should fall withinthe start and end time of the chosen volume curve
End Time End hour/minute of the strategy, which should be after thestart hour/minute and fall within the start and end time ofthe chosen volume curve..
Volume Curve Name The name of the volume curve to be used for determiningthe slice quantities Child Order Interval
When you change the value of a parameter, press Enter (while focus is on that field) to persist thechange.
Click Create to save the parameters, and then click on its line on the page to run the strategy. Createas many strategies as you want.
Volume Weighted Average Price (VWAP)
Using Risk Firewalls

Using Risk Firewalls
Algorithmic Trading Accelerator Guide 5.3 36
Financial institutions and investors need to prevent unacceptable trading practices from causingdamage. Many traders have a large appetite for risk, so they willingly push the envelope. In doingso, a series of trades can violate house or client limits.
The firewall rulesets in this chapter show how administrators can define rules that track all thetrading activities on the order desk, recording the specific limits and violations of rules. The result isa comprehensive picture of risk mitigation.
The Home page of the risk firewalls provides access to the overview of rule violations as well as eachof the ruleset pages, as shown:
Note: Instances of firewalls will be persisted. When the application restarts, the firewalls arerestored.
Running the ATA samples
Overview of Active Risk FirewallsThe Overview page in the Firewalls section provides a monitoring station to review the rules that arein effect currently, any outstanding alerts, and details on a selected alert. The Lock/Unlock Firewallbutton allows the Risk Firewall to be locked, which means that it rejects all orders without queryingthe rules.

Using Risk Firewalls
Algorithmic Trading Accelerator Guide 5.3 37
Using Risk Firewalls
Viewing Firewall Rule DetailsEach rule can be evaluated on Rules Detail page, showing all instances of all rules, as shown:

Using Risk Firewalls
Algorithmic Trading Accelerator Guide 5.3 38
Using Risk Firewalls
Firewall Ruleset: Order Price LimitsOrder Price Limit rules define at what price range specified traders can submit orders for specificinstruments before an alert or an objection is raised.
The top section of the page is where new rules are defined. Clicking Add enters the rule in theInstances list.

Using Risk Firewalls
Algorithmic Trading Accelerator Guide 5.3 39
You can modify an order-price-limit rule by selecting a rule, and then clicking Modify. The dialog boxthat opens shows the Warning/Objection settings that you can adjust, as shown:
Note: You cannot modify the list of instrument symbols, or trader identifiers in a rule instance. Ifyou need to do that, you must delete the existing instance and then create a new one.
After making changes, click Modify to update the rule.
Using Risk Firewalls
Firewall Ruleset: Order Quantity LimitsOrder Quantity Limit rules define at what volume range specified traders can submit orders for specificinstruments before an alert or an objection is raised.

Using Risk Firewalls
Algorithmic Trading Accelerator Guide 5.3 40
The top section of the page is where new rules are defined. Clicking Add enters the rule in theInstances list.
You can modify an order-quantity-limit rule by selecting a rule, and then clicking Modify. The dialogbox that opens shows the Warning/Objection settings that you can adjust, as shown:
Note: You cannot modify the list of instrument symbols or trader identifiers in a rule instance. If youneed to do that, you must delete the existing instance and then create a new one.
After making changes, click Modify to update the rule.
Using Risk Firewalls
Firewall Ruleset: Position Limits

Using Risk Firewalls
Algorithmic Trading Accelerator Guide 5.3 41
Position Limit rules define the maximum position that can be held in an instrument for all tradersbefore an alert or an objection is raised.
The top section of the page is where new rules are defined. Clicking Add enters the rule in theInstances list.
You can modify an order-price-limit rule by selecting a rule, and then clicking Modify. The dialog boxthat opens shows the Warning/Objection settings that you can adjust, as shown:
Note: You cannot modify the list of instrument symbols or trader identifiers in a rule instance. If youneed to do that, you must delete the existing instance and then create a new one.
After making changes, click Modify to update the rule.
Using Risk Firewalls

Using Risk Firewalls
Algorithmic Trading Accelerator Guide 5.3 42
Firewall Ruleset: Order Throttle LimitsThe risk firewall rules for Order Throttle Limit define the rate at which specified traders can submitorders for specific instruments before an alert or an objection is raised.
The top section of the page is where new rules are defined. Clicking Add enters the rule in theInstances list.
You can modify an order-throttle-limit rule by selecting a rule, and then clicking Modify. The dialogbox that opens shows the Warning/Objection settings that you can adjust, as shown:
Note: You cannot modify the list of instrument symbols or trader identifiers in a rule instance. If youneed to do that, you must delete the existing instance and then create a new one.
After making changes, click Modify to update the rule.

Using Market Test Scenarios
Algorithmic Trading Accelerator Guide 5.3 43
Using Risk Firewalls
Firewall Ruleset: Client Credit LimitsClient Credit Limit rules define how a customer's account value can be impacted before an alert oran objection is raised. This Firewall rule uses the price of the order being placed to determine theorder value. Note: When placing a Market order, the price in the order will generally be zero as itis ignored. This means that you could breach the firewall warning/objection limits with that order.Once the limits have been breached, you will only be allowed to place orders that bring the accountvalue back into acceptable limits.
The top section of the page is where new rules are defined. Clicking Add enters the rule in theInstances list.
Using Risk Firewalls
Using Market Test ScenariosEmbedded within the Algorithmic Trading Accelerator and under the “Market Tests” table inthe dashboard are two low-level testing scenarios – one for Market Depth and one for Ordermanagement. These are orthogonal to the rest of the Algorithmic Trading Accelerator in that theydo not utilize symbol sets. The fields entered are mapped directly to the input variables on the CMFmarket data and order management SmartBlocks.

Using Market Test Scenarios
Algorithmic Trading Accelerator Guide 5.3 44
Note: Because the test scenarios allow a user to bypass any configured firewall rules and sendorders directly to a connected adapter, these scenarios will typically be removed from theproduction deployment of an Algorithmic Trading solution.
These scenarios are useful for testing integration of Apama with market data and order managementadapters:
Running the ATA samples
Testing with the Order Manager Scenarios

Using Market Test Scenarios
Algorithmic Trading Accelerator Guide 5.3 45
The Order Manager test scenario allows a user to submit and manage orders directly to a connectedadapter or exchange simulator, optionally bypassing any trading restrictions configured by thefirewall. The order parameters on the dashboard are mapped to the corresponding input variables onthe standard Order Manager smart block. Refer to the documentation for these smart blocks for moredetails of how their parameters are interpreted.
To submit a new order, fill in the required parameters, and then click Create. Usually, the followingparameters need to be specified:
Symbol
Price
Quantity
Side
Type
ServiceId
Market
The service id and market values are those used to configure the adapter session where the orderwill be submitted. Consult the adapter documentation for more details of the service and marketidentifiers used by the specific adapter. Generally, these values are the same as those used in asymbol set that operates with that adapter.

Using Market Test Scenarios
Algorithmic Trading Accelerator Guide 5.3 46
Extra parameters can be passed to the order through the ExtraParams field in the formname1=value1;name2=value2;...
To submit an order through the risk firewall rather than directly to the adapter, set the ServiceIdparameter to __ObjectionBasedFirewallController (notice that there are two leading underscores) andadd Firewall.TargetService=serviceId to the ExtraParams field, where serviceId is the service identifierof the adapter to which the order should be sent after it has passed through the firewall (providedthat it is not rejected by any of the configured firewall rules.)
Once an order has been submitted, it displays in the table at the bottom of the dashboard. When anorder from this table is selected, its details display in the top part of the dashboard. The fields on theright hand side of the dashboard show details of any fills (executions) for the selected order.
The selected order can be cancelled by clicking Cancel, or amended by updating any parameters tobe changed, and then clicking Modify. Clicking Delete deletes the scenario instance associated with theselected order, after attempting to cancel the underlying order. Clicking Delete All deletes all scenarioinstances, attempting to cancel any currently active related orders.
Using Market Test Scenarios
Testing with the Market Data ScenariosThe Market Data test scenario allows a user to directly subscribe to market data from a connectedadapter or exchange simulator. The parameters on the dashboard are mapped to the correspondinginput variables on the standard Market Depth and Market Depth and Order Flow smart blocks. Referto the documentation for these smart blocks for more details of how their parameters are interpreted.

Using Market Test Scenarios
Algorithmic Trading Accelerator Guide 5.3 47
To subscribe to market data, fill in the required parameters, and then click Create. Usually, thefollowing parameters need to be specified:
Instrument
ServiceId
Market
Whether to subscribe to Market Depth and/or Tick (trade) data can be configured using thecheckboxes above the Create button.
The service id and market values are those used to configure the adapter session from which themarket data comes. Consult the adapter documentation for more details of the service and marketidentifiers used by the specific adapter. Generally, these values are the same as those used in asymbol set that operates with the that adapter.
Extra parameters can be passed to the order through the ExtraParams field in the formname1=value1;name2=value2;...
To submit an order through the risk firewall rather than directly to the adapter, set the ServiceIdparameter to __ObjectionBasedFirewallController (notice that there are two leading underscores!) andadd Firewall.TargetService=serviceId to the ExtraParams field, where serviceId is the service identifierof the adapter to which the order should be sent after it has passed through the firewall (providedthat it is not rejected by any of the configured firewall rules.)
Once a subscription has been made, it will appear in the Current subscriptions table in the center of thedashboard. When a subscription from this table is selected, its details display in the top part of the

Using Market Test Scenarios
Algorithmic Trading Accelerator Guide 5.3 48
dashboard. Any market data received from the subscription is displayed in the fields at the bottom ofthe dashboard.
The selected subscription can be cancelled by clicking Delete, or amended by updating anyparameters to be changed, and then clicking Commit. Deleting a subscription also deletes thecorresponding scenario instance. Click Delete All to delete all these scenario instances and cancel allthe active subscriptions.
Using Market Test Scenarios

Architecture overview
Algorithmic Trading Accelerator Guide 5.3 49
Chapter 3: Developing and deploying custom ATA applications
n Architecture overview ........................................................................................................................................ 49
n Importing the ATA Project into Apama Studio ................................................................................................... 52
n Quick steps to a new algorithm ........................................................................................................................ 53
n Deploying the ATA to a Web Application Server ............................................................................................... 53
n Adding Adapters ................................................................................................................................................ 54
n Adding Symbol Sets .......................................................................................................................................... 56
Once you have explored the pre-defined ATA locally, you are ready to start working on developmentof your custom ATA in Apama Studio.
Architecture overviewIn preparation for using the ATA to create a custom solution, you should be familiar with thearchitecture of its components and the hierarchy of its folders.
Developing and deploying custom ATA applications
Components of the Algorithmic Trading solutionThe Algorithmic Trading Accelerator contains the following components:

Architecture overview
Algorithmic Trading Accelerator Guide 5.3 50
The functionality of an Algorithmic Trading Accelerator instance is determined by the sequence ofevents, monitors and scenarios injected into the Algorithmic Trading correlator when it is launched.
Architecture overview
Directory structureThe following table describes the contents of the Apama Capital Markets Foundation 5.3/accelerators/ATAfolder:
Directory Description
adapters Location for IAF XML files (and any required libraries)that start adapters.
build Events and monitorscript files that need to be injectedinto the Correlator are placed here when a ant buildcommand runs. Also, WAR deployment files are deployedfrom here.
catalogs/ATA Blocks Includes utilities such as the MarketParticipationGraph.Events and monitorscript files that need to be injectedinto the Correlator are placed here when a projectbuild command runs. Also, WAR deployment files aredeployed from here.
catalogs/ATA Functions include a function to extract values from an “extraparams” field, specifically for extracting extra paramvalues from those values associated with a Symbol Set.
config Contains the dashboard configuration to be used whendeploying dashboards.
dashboards/algos Contains the sample algos. To add a new algo, create anew subdirectory, and then put your algo's dashboardfiles (RTV files) in that directory , together with image.files it uses. The parent directory (dashboards) alsoincludes the dashboard project file and the frameworkdirectory (which includes the main Algorithmic TradingAccelerator dashboards). The only file in this folderthat you should edit is panels.ini, which you shouldextend to make your custom Algos appear in the maindashboard panel. The background properties of yourdashboards should be 850 wide by 650 high.
extensions A folder of useful examples which can be usedas illustrations or modified and used within theAlgorithmic Trading Accelerator. Includes an examplethat dynamically creates SymbolSets.

Architecture overview
Algorithmic Trading Accelerator Guide 5.3 51
Directory Description
src Custom algos are defined in the six src directories. Thefolders enable complex scenarios to be constructedthat require custom SmartBlocks (which should bestored in the catalogs/ATA blocks directory) and thatrequire custom event types, service monitors and orinitialization monitors and files.
src/Algo_Scenarios Create a folder for each of your Scenario Managerscenarios in a separate sub-folder.
src/EventTypes Any custom event types (SmartBlocks or ServiceMonitors) required by your algo.
logs The default location of log files for the AlgorithmicTrading solution, the correlator, and any adaptersstarted. Log file name patterns include:
* correlator_Log_DATE.log – The correlator log file; alsoincludes a log of all orders submitted and modified.DATE is time when the Correlator was started.
* replay_Log_<DATE>.log – The ReplayLog for thecorrelator that was started at DATE.
* <IAF_File.xml>.log – A list of log files from the IAFprocess. Name of the log file is the name of the IAFXML file with a ‘.log’ suffix.
src/framework Contains the Scenarios and Monitors that make up theAlgorithmic Trading Accelerator.
src/InitialiseFiles Any Monitors or event files required by your Algos/SmartBlocks
src/Monitors Any custom monitors required by your algo.
symbolsets A directory of SymbolSets event files
The Apama Capital Markets Foundation 5.3 folder also contains resources for ATA:
Directory Description
bin Script that sets up the CMF environment.
doc Contains the menu, start.htm, which links to the PDFbooks that document the Capital Markets solutions.Also stages the help JAR that is installed in the ApamaStudio. Provides access to the online API referencewhen you open doc\reference\index.html in a browser.

Importing the ATA Project into Apama Studio
Algorithmic Trading Accelerator Guide 5.3 52
Directory Description
lib All the external libraries required by the AlgorithmicTrading solution.
Architecture overview
Importing the ATA Project into Apama StudioWhen you have Apama Studio and CMF installed, you can modify the ATA that is pre-defined as anEclipse project.
Note: If you ran the ATA through its startDemo script, an ATA_{version}\build directory was created.That directory will cause issues if it is imported as part of an existing project. You must delete theATA_{version}\build directory before starting the project import procedure. The project will then createits build directory in its workspace.
To import the Algorithmic Trading project:
1. In Apama Studio, choose the Apama Developer perspective.
2. Select File > Import.
3. On the Import dialog box, select General > Existing Projects into Workspace.
4. Click Next.
5. Confirm that the option Copy projects into workspace is selected.
6. At Select root directory, click Browse.
7. Select the ATA directory that you copied to your custom location, and then click OK.
8. Click on Algorithmic Trading Accelerator.
9. Click Finish.
10. Select Project > Clean.
11. Choose to rebuild all projects.
The project is imported and built in the Apama Studio.
12. You can run the ATA within the Apama Studio by right-clicking on the Algorithmic Trading Acceleratorproject, and then choosing Run as > Apama Application.
Note: Using this launch profile runs the Apama server and a dashboard locally. The launchexpects to start the correlator, so check to see that it is stopped before performing a launch.(Before using the launch profile for the first time, you should close and re-open the AlgorithmicTrading project, or restart Apama Studio. That will work around an issue in Apama Studiowhere the block and function catalogs of a newly imported project might not be found on its firstrun.)
Developing and deploying custom ATA applications

Quick steps to a new algorithm
Algorithmic Trading Accelerator Guide 5.3 53
Quick steps to a new algorithmDefining a new algorithm can be as easy as copying an existing one, and then adjusting itsnames and functions to make it your own. The following copy/paste/rename tasks can beperformed in the file system at the corresponding locations in the \Users\{username}\SoftwareAG\ApamaWork_5.3\studio_workspace.
To define a new algorithm from an existing one:
1. On the Apama Studio's Project menu, clear the option on Build Automatically.
2. Three elements are required to clone a strategy. The strategy implementation that has built in the ApamaEvent Modeler, the dashboards that display the strategy and its dialogs, and the initialization events thatprovide access to the strategy from relevant lists and pulldowns.
If you encounter synch alerts, do a refresh (F5) to resynchronize the files.
3. To clone the Crossover strategy:
a. Copy the folder src/Algo_Scenarios/Crossover/ and then click on src/Algo_Scenarios/ and paste it.
b. Rename the folder myCrossover, and then rename the file myCrossover.sdf.
c. Change something simple like the text message.
d. Save the myCrossover.sdf file. This will now be injected when the correlator restarts.
4. The dashboards run and display the new strategy, and its dialog box for creating instances. To clone thedashboards
a. Copy the folder dashboards/algos/Crossover/, and then paste it dashboards/algos/.
b. Rename the folder myCrossover, and then rename the files myCrossover.rtv and myCrossover_Create.rtv
c. Open each dashboard in Apama Dashboard Builder, revise the name label to myCrossover, revise thecommand's target scenario to myCrossover, and any other locations that are assigned the strategy name.)
d. Save both dashboard files.
5. To add the new strategy to get it on the menu, copy the file src/InitialiseFiles/scenario_metadata/CrossoverDescription.evtPaste it as myCrossoverDescription.evt. Update the first two strings in the file to"myCrossover".
6. Build and the run the project.
The algo menu displays your addition.
Choosing the myCrossover algo, and then clicking Create displays its dashboards.
Developing and deploying custom ATA applications
Deploying the ATA to a Web Application ServerThe ATA can run on a single machine, and allow multiple trading clients to connect to it usingdashboards that have been deployed using a Web Application Server of the user's choice.
To deploy the ATA to a Web Application Server:

Adding Adapters
Algorithmic Trading Accelerator Guide 5.3 54
1. If you need to adjust the dashboard deployment properties (such as the port that the display server uses),edit the file %APAMA_FOUNDATION_HOME%/config/dashboard_deploy.xml in the ATA directory to set anyappropriate settings that are required for deployment.
2. In the Start menu, expand Software AG > Apama Capital Markets 5.3 and choose the CMF CommandPrompt. This sets up the environment of Apama and the CMF in a Command Prompt located in theworking directory.
3. Change directories to set the path to the ATA directory, %APAMA_FOUNDATION_HOME%/accelerators/ATA
4. Enter deploy.bat
When successful, a WAR file for the deployment of the Algorithmic Trading Accelerator is createdin the ATA's deploy directory. This WAR file can then be deployed as a Web Application Server ofthe user's choice. Users should follow the deployment instructions for their chosen Web ApplicationServer, which should be run with the Java version supported by Apama.
This deployment WAR file will be signed with a self-signed certificate supplied with the ATA.This may cause authentication warnings on client machines with some Java runtime environmentversions.
For a workaround to these warnings, see the following topic in the Apama documentation:Deploying and Managing Apama Applications > Deploying Dashboards > Applet and WebStartDeployment. A Certificate Signing Request (CSR) file, DashboardKeystore.csr , is included in the ATA/dashboards directory for this purpose. If you wish to sign the deployment WAR file with your ownkey store then update the properties in the Deploy and Keystore properties section of the ATA/build.xmlfile.
Developing and deploying custom ATA applications
Adding AdaptersWhen you are ready to move away from test data to real data, you must access data feeds, and thenset up appropriate Apama adapters that will deliver their data to the correlator.
1. Edit the file adapters.xml to define the adapters you want to start and reference their non-customdependencies. You have access to the properties defined in the APAMA_PROPERTIES files to locate these:${apama.home} and ${apama.work}.
2. Modify the ant xml script target adapters with the following inner tasks:
a. <start-iaf>
Starts an Adapter (.xml). The attributes you can use for the target are:
- config: the xml adapter configuration file location
- port: the port to use for the iaf process
- log: the log file to use
- loglevel: the iaf log level to use
- console: when true, launch a separate console to launch the process.
For example:
<start-iaf config=”FIX.xml” loglevel=”ERROR” port=”16778” />

Adding Adapters
Algorithmic Trading Accelerator Guide 5.3 55
<start-iaf config=”FIX.xml” />
b. <engine-inject>
Injects a MonitorScript file (.mon) located anywhere on disk. This also takes a <filelist> or<fileset> path definition. The attributes that can be used with this target are:
- host: the target correlator host
- port: the target correlator port
- file: an optional file to send
- parallel: when true, all files to inject will be batched into one call.
- failonerror: fails on the first engine send fault.
For example:
<engine-inject file=”my_file.mon” />
c. <engine-send>
Send event files (.evt). also takes a <filelist> or <fileset> path definition. The attributes that canbe used with this target are:
- host: the target correlator host
- port: the target correlator port
- file: an optional file to send
- parallel: when true, all files to inject will be batched into one call.
- failonerror: fails on the first engine send fault.
For example:
<engine-inject file=”my_file.evt” />
For more information about specifying ant path types refer to the following resources:
File lists: http://ant.apache.org/manual/CoreTypes/filelist.html
File sets: http://ant.apache.org/manual/CoreTypes/fileset.html
The order of your entries defines the order in which they will injected or started. For example:<target name="adapters" description="Main target for Apama adapters"> <echo message="Starting adapters ..." /> <engine-inject> <filelist> <file name=”file1.mon” /> <file name=”file2.mon” /> </filelist> </engine-inject> <engine-send> <filelist> <file name=”file1.evt” /> <file name=”file2.evt” /> </filelist> </engine-send> <start-iaf config=”my_adapter_config.xml” /> <echo message="Adapters done." /></target>

Adding Symbol Sets
Algorithmic Trading Accelerator Guide 5.3 56
Developing and deploying custom ATA applications
Adding Symbol SetsThe ATA infrastructure must be aware of the type of data that will be coming in on feeds. TheSymbol Attributes smartblock handles this functionality. You can create a temporary symbol setin the dashboard to be used for demonstration or testing purposes or you can add a symbol setpermanently by initializing it in the server.
Developing and deploying custom ATA applications
Getting Symbol attributesIf you want to create a custom algorithm, you will use the Symbol Attributes SmartBlock that isdistributed with the Algorithmic Trading Accelerator to handle symbols. The SmartBlock takes twoparameters—the symbol name and the name of the symbol set to which the symbol belongs.
Given these names the SmartBlock requests the correct information from an underlying symbolsetservice and returns the required symbology details. The ATA supports two concurrent symbologieswithin a single SymbolSet. This allows one to be used to request market data and another to be usedto trade upon (for example, receive Reuters RICs and trade a proprietary symbol via FIX.)
This information comes from three output feeds on the Symbol Attributes SmartBlock:
Order Execution — This feed holds the following fields which are used to setup the OrderManager SmartBlock and in other places where the symbol details for order management (e.g.Order placement/amendment) are required.
Broker
Market
Exchange
extraParams
Market Data — This feed holds the following fields which are used to setup the Market DepthSmartBlock and in other place where the symbol details for market data (e.g. Depth/Tick) arerequired.
Service Id
Broker
Market
Exchange
extraParams
Symbols — The symbol for OMS and MarketData might vary on some platforms. Under suchcircumstance, the attributes block also returns the relevant symbol for OMS, remember that asinput parameter it takes the symbol for marketdata.
SymbolForMarketData

Adding Symbol Sets
Algorithmic Trading Accelerator Guide 5.3 57
SymbolForOMS
Adding Symbol Sets
Adding temporary Symbol SetsA client can create symbol sets that will be available to all users throughout the correlator session byusing the Add Symbol Set dialog on their user display.
Using the Add a Symbol Set dialog box
To create a temporary symbol set, click Add Symbol Set on the Setup page.
Enter the values for your symbol set. In the illustration, the minimal data was entered: a name anda comma-delimited list of market symbols. Note that the entries are not quoted and the group is notset in brackets. Clicking Add Symbol Set injected the definition into the correlator, making it availableto all users of dashboards connected to the server, as shown:

Adding Symbol Sets
Algorithmic Trading Accelerator Guide 5.3 58
When the correlator is stopped, the temporary symbol sets are dropped, and are not reinstated whenthe correlator restarts.
To create durable symbol sets, use the following technique to define a symbol set in an event (.evt)file on the server.
Adding Symbol Sets
Adding Symbol Sets on the serverWhen you define symbolset event files on the server in the \Users\{username}\SoftwareAG\ApamaWork_5.3\studio_workspace folder, those symbolsets are available to all clients that login to thatserver, and persist through restarts of the server. You must define market and order symbols. This abstraction enables use of different adapters for markets and orders, allowing for variations inmarket symbol labels.
When you prepare to use actual adapters, each adapter will need to be configured as described in itsdocumentation. The service, exchange, and market values of the adapter configuration will be valuesthat you are propagating into a SymbolSet.
The following elements define a single event of the SymbolSet type:event SymbolSet {string id; // the name of the symbol set, e.g. EUBondsstring serviceMKT; // the service ID to access prices/market data

Adding Symbol Sets
Algorithmic Trading Accelerator Guide 5.3 59
string marketMKT; // the market ID under the service ID for market datastring exchangeMKT; // the exchange ID filter for market datadictionary <string, string> extraParamsMKT; // Extra Params for market datastring serviceOMS; // the service ID to access exchange to buy/sellstring brokerOMS; // the broker ID under the service ID abovestring marketOMS; // the market ID under the service IDstring exchangeOMS; // the exchange ID filter for the service ID abovedictionary <string, string> extraParamsOMS; // Extra Parameters for OMSsequence<string> symbolsMKT; // list of symbols for Flow/Depthsequence<string> symbolsOMS; // list of symbols for Ordersdictionary <string, string> extraParamsSymbolSet; // Extra Parameters for // the SymbolSet }
For example, SymbolSet-FX.evt contains:com.apama.ata.SymbolSet("FX","ADAPTERSERVICE","","",{}, "ADAPTERSERVICE","","","",{},["EUR/USD","USD/JPY","GBP/USD","USD/CHF","USD/CAD","AUD/USD", "NZD/USD","USD/SAR","USD/KWD","EUR/JPY","EUR/GBP","EUR/CAD","EUR/AUD","GBP/JPY", "EUR/CHF","GBP/CAD","CHF/JPY","AUD/JPY","AUD/CAD"],["EUR/USD","USD/JPY","GBP/USD", "USD/CHF","USD/CAD","AUD/USD","NZD/USD","USD/SAR","USD/KWD","EUR/JPY","EUR/GBP", "EUR/CAD","EUR/AUD","GBP/JPY","EUR/CHF","GBP/CAD","CHF/JPY","AUD/JPY","AUD/CAD"], {"SIMULATION_MODE":"DEFAULT"})
Note that the service, market and exchange values need to have position placeholders in the string,and that "" will defer each field to its default setting.
Consider another example, SymbolSet-myEquities.evt:com.apama.ata.SymbolSet("myEquities","Reuters","EQUITIES","NASDAQ", {"ATT1":"VAL1", "ATT2":"VAL2"},"FIX","JPMC","EQUITIES","NASDAQ", {"OMStimeout":"10","OMSwindow":"OPEN"}, ["AAPL","MSFT","APMA"], ["AAPL","MSFT","APMA"], {})
Note: When you leave the SIMULATION_MODE setting as the place holder value, {}, the value that will beinjected is {"SIMULATION_MODE"="DEFAULT"}.
To add a new symbol set in text, create a new file using an existing set as a template. For example:SymbolSet-My3.evt. Be sure to set its ID to correspond to the name.
Scenarios access new symbolsets by using the ""Symbol Attributes" SmartBlock distributed withthis pack. This Smart Block will return all these values when given a SymbolSet identifier. See anexample scenario (such as Iceberg) within the pack for usage. The simulation mode is also set via thesymbolset. This is done by adding the simulation mode key to the extra parameters. For example:com.apama.ata.SymbolSet("My3","","","", {},"","", "","",{}, ["MSFT","AAPL","APMA"],["MSFT","AAPL","APMA"], { "SIMULATION_MODE":"BASIC"})
The ATA has four simulation modes, distinguished by their keyword:
BASIC — A realistic simulator that includes an orderbook and a matching engine. It includes abuilt-in orderflow generator that simulates an orderflow to fill the book.
MARKETDATADRIVEN — A simulator that includes the ability to feed market data, infer orderflow from it, and then run that orderflow through the matching engine and orderbook.
OLDSTYLE or DEFAULT — The BTexchange simulator from early releases of this solution. It is thedefault setting.
NONE — No simulator is to be used.

Adding Symbol Sets
Algorithmic Trading Accelerator Guide 5.3 60
Adding Symbol Sets

Algorithmic Trading Accelerator Guide 5.3 61
Chapter 4: Troubleshooting
The following items are issues you might encounter:
There are symbols in the OMS screen, but all the prices are zero -- The symbols appear in theOMS screen from a “scenario” level and request data on the Service and Market ID specified in thesymbol set event files. The symbols appear in the Dashboard as a result of a request for data. If theend system (simulator monitor, IAF and service monitors) are not loaded or functioning correctlythen all values will be zero as no price updates are being received. If the back end system has beenverified as functioning correctly ensure that the service and market values defined in the symbols setEVT files are specified correctly.
Orders have been submitted but they do not reach the market -- Orders appear in the blotter asthe result of the OMS screen or an other scenario issuing a request to submit an order. The blottertable intercepts these requests and presents them on-screen. Thus, a request to submit an order ispresented; but if that order does not reach the market then no updates will be received and thusno updates will be visible. This is possibly due to an incorrectly configured IAF/Service Monitor orincorrect values entered in the Symbol Set EVT definition files.
Symbol Set attributes are not returning values -- Move the Symbol Attributes SmartBlock to thebottom of the column in the Scenario Manager, click Deploy, and then restart the Algorithmic Tradingserver.
Marketdata and OMS data needs to go through a firewall or other CMF boundaries-- All marketdata events (such as Depth, SubscribeDepth, Tick) that have the service-Id :__SimpleMarketDataFirewallGatewayExternal and all OMS events (such as NewOrder, AmendOrder) thathave the service-id: __ObjectionBasedFirewallControllerExternal go through the firewall and other CMFgateway boundaries. Once the CMF services have dealt with these events, they replace the event’sservice Id with the value given in the extraParameter: Firewall.TargetService and route the modifiedevent.

Algorithmic Trading Accelerator Guide 5.3 62
Note: Replay logs The project.properties file at the root of apama-work\ATA_{version} is set to inputto minimize the logs that can accrue while exploring sample data . When directed by support toproduce a replay log, modify the properties file as follows: # ========================================= # Replay logging mode. Log is in the ${apama.work}/logs folder # REPLAY_LOG_MODE=replayTo learn more about replay logs, see Deploying and Managing Apama Applications.