![Clarity and Complexity in the Bias Rule [44] MULR](https://static.fdokumen.com/doc/165x107/63327df8b0a33e52010697a4/clarity-and-complexity-in-the-bias-rule-44-mulr.jpg)
CA Clarity PPM PMO Accelerator Product Guide
298
PMO Accelerator Product Guide v3.0.00 CA Clarity™ PPM
-
Upload
khangminh22 -
Category
Documents
-
view
2 -
download
0
Transcript of CA Clarity PPM PMO Accelerator Product Guide

PMO Accelerator Product Guide v3.0.00
CA Clarity™ PPM

This documentation, which includes embedded help systems and electronically distributed materials, (hereinafter referred to as the “Documentation”) is for your informational purposes only and is subject to change or withdrawal by CA at any time.
This Documentation may not be copied, transferred, reproduced, disclosed, modified or duplicated, in whole or in part, without the prior written consent of CA. This Documentation is confidential and proprietary information of CA and may not be disclosed by you or used for any purpose other than as may be permitted in (i) a separate agreement between you and CA governing your use of the CA software to which the Documentation relates; or (ii) a separate confidentiality agreement between you and CA.
Notwithstanding the foregoing, if you are a licensed user of the software product(s) addressed in the Documentation, you may print or otherwise make available a reasonable number of copies of the Documentation for internal use by you and your employees in connection with that software, provided that all CA copyright notices and legends are affixed to each reproduced copy.
The right to print or otherwise make available copies of the Documentation is limited to the period during which the applicable license for such software remains in full force and effect. Should the license terminate for any reason, it is your responsibility to certify in writing to CA that all copies and partial copies of the Documentation have been returned to CA or destroyed.
TO THE EXTENT PERMITTED BY APPLICABLE LAW, CA PROVIDES THIS DOCUMENTATION “AS IS” WITHOUT WARRANTY OF ANY KIND, INCLUDING WITHOUT LIMITATION, ANY IMPLIED WARRANTIES OF MERCHANTABILITY, FITNESS FOR A PARTICULAR PURPOSE, OR NONINFRINGEMENT. IN NO EVENT WILL CA BE LIABLE TO YOU OR ANY THIRD PARTY FOR ANY LOSS OR DAMAGE, DIRECT OR INDIRECT, FROM THE USE OF THIS DOCUMENTATION, INCLUDING WITHOUT LIMITATION, LOST PROFITS, LOST INVESTMENT, BUSINESS INTERRUPTION, GOODWILL, OR LOST DATA, EVEN IF CA IS EXPRESSLY ADVISED IN ADVANCE OF THE POSSIBILITY OF SUCH LOSS OR DAMAGE.
The use of any software product referenced in the Documentation is governed by the applicable license agreement and such license agreement is not modified in any way by the terms of this notice.
The manufacturer of this Documentation is CA.
Provided with “Restricted Rights.” Use, duplication or disclosure by the United States Government is subject to the restrictions set forth in FAR Sections 12.212, 52.227-14, and 52.227-19(c)(1) - (2) and DFARS Section 252.227-7014(b)(3), as applicable, or their successors.
Copyright © 2011 CA. All rights reserved. All trademarks, trade names, service marks, and logos referenced herein belong to their respective companies.

Contact CA Technologies
Contact CA Support
For your convenience, CA Technologies provides one site where you can access the information you need for your Home Office, Small Business, and Enterprise CA Technologies products. At http://ca.com/support, you can access the following:
■ Online and telephone contact information for technical assistance and customer services
■ Information about user communities and forums
■ Product and documentation downloads
■ CA Support policies and guidelines
■ Other helpful resources appropriate for your product
Providing Feedback About Product Documentation
If you have comments or questions about CA Technologies product documentation, you can send a message to [email protected].
If you would like to provide feedback about CA Technologies product documentation, complete our short customer survey, which is available on the CA Support website at http://ca.com/docs.


Contents 5
Contents
Chapter 1: Overview 11
About the PMO Accelerator ....................................................................................................................................... 11
Review the Add-In Before Applying ........................................................................................................................... 12
Apply the Add-In ........................................................................................................................................................ 13
Upgrade to Universes with New Security [PMO] ....................................................................................................... 14
Chapter 2: Project Lifecycle and Processes 15
About the Project Lifecycle ........................................................................................................................................ 15
Project Lifecycle Processes ......................................................................................................................................... 15
Project Templates ...................................................................................................................................................... 16
How to Work with the Idea Review Process .............................................................................................................. 18
Create an Idea ..................................................................................................................................................... 19
How to Work with the Create Major IT Project Process ............................................................................................ 21
How to Work with the Document Review Process .................................................................................................... 22
Upload and Submit Documents for Review ........................................................................................................ 22
Create a Project from a Project Template .................................................................................................................. 25
How to Work with the Issue Review and Escalation Process ..................................................................................... 27
Create Issues ....................................................................................................................................................... 28
Chapter 3: Business Alignment and Status Reports 31
About Business Alignment and Status Reports .......................................................................................................... 31
Define Alignment Factors ........................................................................................................................................... 32
Create a Status Report ............................................................................................................................................... 34
Chapter 4: General Pages and Portlets 37
Sponsor ...................................................................................................................................................................... 37
Projects KPIs by OBS Portlet ................................................................................................................................ 37
Project Schedule Portlet ..................................................................................................................................... 41
Project Planned Cost Portlet ............................................................................................................................... 42
Portfolio Dashboard ................................................................................................................................................... 42
My Portfolios Portlet ........................................................................................................................................... 42
Portfolio Benefits and Costs Portlet .................................................................................................................... 43
Portfolio Investment Benefits by Goal Portlet .................................................................................................... 43
Program Dashboard ................................................................................................................................................... 44
Program Manager Cost Dashboard Portlet ......................................................................................................... 44

6 PMO Accelerator Product Guide
Program Manager Schedule Dashboard Portlet ................................................................................................. 50
PM Alerts .................................................................................................................................................................... 53
Schedule Performance Portlet ............................................................................................................................ 54
Milestones Portlet ............................................................................................................................................... 58
Current Issues Portlet ......................................................................................................................................... 60
Staffing Portlet .................................................................................................................................................... 63
Project Dashboard ...................................................................................................................................................... 64
Project Manager Schedule Dashboard Portlet .................................................................................................... 65
Project Manager Cost and Effort Dashboard Portlet .......................................................................................... 69
Issues and Risks .......................................................................................................................................................... 72
Issue Management Portlet .................................................................................................................................. 72
Risk Management Portlet ................................................................................................................................... 74
Chapter 5: Portfolio Pages and Portlets 79
About the Dashboard View ........................................................................................................................................ 79
PMO Portfolio Layout Page ........................................................................................................................................ 80
Scorecard Tab ............................................................................................................................................................. 80
Balance Portlet .................................................................................................................................................... 81
Investments Portlet ............................................................................................................................................. 82
Financials Portlet ................................................................................................................................................. 84
Comparison Tab ......................................................................................................................................................... 87
Prioritization of Investments Portlet ................................................................................................................... 88
Resource Demand on Investments Portlet ......................................................................................................... 89
Capacity Tab ............................................................................................................................................................... 91
Investment Gantt Portlet .................................................................................................................................... 91
Portfolio Role Capacity and Demand Portlet ...................................................................................................... 93
Resources Tab ............................................................................................................................................................ 94
Resource Allocation Portlet ................................................................................................................................ 95
Resource Capacity and Allocation Portlet ........................................................................................................... 96
Financials Tab ............................................................................................................................................................. 97
Capital vs Expense Budget and Forecast Portlet ................................................................................................. 98
Capital vs Expense by Period Portlet ................................................................................................................. 102
Capital vs Expense Variance by Period Portlet .................................................................................................. 103
Performance Tab ...................................................................................................................................................... 105
Key Performance Indicators Portlet .................................................................................................................. 106
Cost and Effort Performance Portlet ................................................................................................................. 110
Chapter 6: Program and Project Pages and Portlets 117
About Dashboard Views ........................................................................................................................................... 117
PMO-Program Status Page Layout ........................................................................................................................... 118
Cost and Schedule Overview Portlet ................................................................................................................. 118

Contents 7
Schedule and Progress Portlet .......................................................................................................................... 123
Resource Utilization Portlet .............................................................................................................................. 125
PMO-Project Status Page Layout ............................................................................................................................. 126
Project Indicators Portlet .................................................................................................................................. 126
Upcoming Milestones Portlet ........................................................................................................................... 128
Project Baselines Portlet ................................................................................................................................... 130
Status Report Indicators Portlet ........................................................................................................................ 130
Actuals by Transaction Type Portlet ................................................................................................................. 131
Team Utilization Portlet .................................................................................................................................... 132
PMO-Project Storyboard Page Layout...................................................................................................................... 133
Team Capacity Portlet ....................................................................................................................................... 133
Upcoming Milestones Portlet ........................................................................................................................... 133
Issues by Priority Portlet ................................................................................................................................... 135
Earned Value Analysis by Phase Portlet ............................................................................................................ 135
Chapter 7: Project Costs Drill Down Portlets 137
About the Project Costs Drill Down Portlets ............................................................................................................ 137
Project Costs by Phase Portlet ................................................................................................................................. 137
Project Costs by Task Portlet .................................................................................................................................... 142
Project Costs by Resource Portlet ............................................................................................................................ 146
Chapter 8: Resource Management Portlets 149
Timesheet Overview ................................................................................................................................................ 149
Investment Timesheet Summary Portlet ................................................................................................................. 150
Investment Timesheet Review Portlet .............................................................................................................. 150
Timesheet Notes Portlet ................................................................................................................................... 152
Pending Estimates Review Portlet ........................................................................................................................... 152
Timesheet Review Portlet ........................................................................................................................................ 154
Chapter 9: Financial Management Portlets 157
About Financial Management Portlets .................................................................................................................... 157
Posted Transaction Review Portlet .......................................................................................................................... 157
Posted Transaction Review Portlet [Investment Level] ........................................................................................... 160
Chapter 10: Additional Portlets 163
About the Additional Portlets .................................................................................................................................. 163
Project Cycle Time Analysis Portlet .......................................................................................................................... 163
Project Lifecycle Review Portlet ............................................................................................................................... 164
Process Bottlenecks Portlet...................................................................................................................................... 167

8 PMO Accelerator Product Guide
Project Analysis Portlet ............................................................................................................................................ 168
Resource Utilization Percentage by Month Portlet.................................................................................................. 171
Late Tasks and Milestones Portlet ........................................................................................................................... 172
Team Member Task Summary Portlet ..................................................................................................................... 174
Chapter 11: Lookup Mapping Object 179
About Lookup Mapping ............................................................................................................................................ 179
Create a Lookup Mapping List .................................................................................................................................. 179
Delete a Lookup Mapping List .................................................................................................................................. 180
Chapter 12: Crystal Reports 181
About Default Crystal Reports .................................................................................................................................. 181
Access to Crystal Reports ......................................................................................................................................... 181
Capacity vs. Demand By Role Report ....................................................................................................................... 183
Capacity vs. Demand By Resource Report ............................................................................................................... 186
Program Schedule Review Report ............................................................................................................................ 189
Project Storyboard Report ....................................................................................................................................... 193
Resource Availability Report .................................................................................................................................... 199
Resource Forecasted Utilization Report ................................................................................................................... 200
Resource Forecasted Utilization Detail Report ........................................................................................................ 203
Timesheet Detail Report .......................................................................................................................................... 206
Chapter 13: Access Groups 209
About Access Groups ............................................................................................................................................... 209
PMO Accelerator Business Sponsor Group .............................................................................................................. 209
PMO Accelerator Portfolio Manager Group ............................................................................................................. 211
PMO Accelerator Program Manager Group ............................................................................................................. 218
PMO Accelerator Project Manager Group ............................................................................................................... 226
PMO Accelerator Team Member Group .................................................................................................................. 234
Chapter 14: Sample Data 237
About Sample Data .................................................................................................................................................. 237
Portfolios .................................................................................................................................................................. 238
Programs .................................................................................................................................................................. 241
Projects ..................................................................................................................................................................... 242
Ideas ......................................................................................................................................................................... 243
Applications .............................................................................................................................................................. 244
Assets ....................................................................................................................................................................... 245
Services .................................................................................................................................................................... 245

Contents 9
Resources ................................................................................................................................................................. 246
Resource Roles ......................................................................................................................................................... 247
Cost/Rate Matrices ................................................................................................................................................... 247
Consulting Cost and Billing Matrix .................................................................................................................... 248
Financial Cost and Rate Matrix ......................................................................................................................... 248
Project Plan Templates............................................................................................................................................. 249
Development Lifecycle Template ...................................................................................................................... 249
Organizational Breakdown Structures (OBS) ........................................................................................................... 249
Business Unit OBS ............................................................................................................................................. 250
Resource Pool OBS ............................................................................................................................................ 250
Security OBS OBS .............................................................................................................................................. 251
Security OBS - Pages OBS .................................................................................................................................. 251
Appendix A: PMO Accelerator Object Views 253
About PMO Accelerator Object Views ..................................................................................................................... 253
Assignment ............................................................................................................................................................... 254
Assignment Properties ...................................................................................................................................... 254
Assignment List Views ....................................................................................................................................... 254
Baseline .................................................................................................................................................................... 255
Baseline Properties ........................................................................................................................................... 255
Baseline List Views ............................................................................................................................................ 256
Baseline Filter Views ......................................................................................................................................... 256
Cost and Benefit Plan ............................................................................................................................................... 257
Cost and Benefit Plan Properties ...................................................................................................................... 258
Cost and Benefit Plan List Views ....................................................................................................................... 258
Cost and Benefit Plan Filter Views .................................................................................................................... 259
GL Allocation and Resource Credit ........................................................................................................................... 260
GL Allocation and Resource Credit Properties .................................................................................................. 261
GL Allocation and Resource Credit List Views ................................................................................................... 262
GL Allocation and Resource Credit Filter Views ................................................................................................ 263
Investments .............................................................................................................................................................. 264
Investment Properties ...................................................................................................................................... 265
Investment List Views ....................................................................................................................................... 268
Investment Filter Views .................................................................................................................................... 269
Portfolio ................................................................................................................................................................... 271
Portfolio Properties ........................................................................................................................................... 271
Portfolio List Views ............................................................................................................................................ 272
Portfolio Filter Views ......................................................................................................................................... 272
Project ...................................................................................................................................................................... 273
Project Properties ............................................................................................................................................. 274
Project List Views .............................................................................................................................................. 278
10 PMO Accelerator Product Guide
Project Filter Views ........................................................................................................................................... 280
Resource ................................................................................................................................................................... 282
Resource Properties .......................................................................................................................................... 283
Resource List Views ........................................................................................................................................... 284
Resource Filter Views ........................................................................................................................................ 286
Task .......................................................................................................................................................................... 288
Task Properties .................................................................................................................................................. 289
Task List Views .................................................................................................................................................. 290
Task Filter Views ................................................................................................................................................ 292
Team ......................................................................................................................................................................... 293
Team Properties ................................................................................................................................................ 294
Team List Views ................................................................................................................................................. 294
Team Filter Views .............................................................................................................................................. 297

Chapter 1: Overview 11
Chapter 1: Overview
This section contains the following topics:
About the PMO Accelerator (see page 11) Review the Add-In Before Applying (see page 12) Apply the Add-In (see page 13) Upgrade to Universes with New Security [PMO] (see page 14)
About the PMO Accelerator
The PMO Accelerator add-in is a collection of content and view configurations designed for project portfolio management not tied to any specific industry. The PMO Accelerator provides a collection of CA Clarity PPM ready content that your organization does not have to create. The add-in enables you to support the existing program management office (PMO) operations. The add-in is useful for managing and gaining insight into portfolio, program, and project performance.
The topics describe the collection of content and include detailed information about the following included in the add-in:
■ Dashboard pages
■ Portlets
■ Processes
■ Reports
■ View configurations
■ Access groups
The portlets provide an overall view across your projects, giving you a clear understanding of what is going on in your business.

Review the Add-In Before Applying
12 PMO Accelerator Product Guide
Sample data is included with the PMO Accelerator, but only as an optional installment. The sample data includes portfolios, programs, projects, ideas, applications, assets, services, resources, resource roles, a project plan template, cost/rate matrices, and organizational breakdown structures (OBS).
The PMO Accelerator guide references the following CA Clarity PPM guides that you can review:
■ Installation Guide
■ Administration Guide
■ Studio Developer's Guide
■ Personalizing CA Clarity PPM User Guide
■ Project Management User Guide
Review the Add-In Before Applying
Install the PMO Accelerator add-in on your CA Clarity application server so that the content is available to you. See the CA Clarity PPM Installation Guide for information about installing the PMO Accelerator add-in.
Follow these steps:
1. Log in to CA Clarity PPM.
2. Open Administration, and from Studio, click Add-ins.
The Add-Ins page appears.
3. Click the Accelerator: Program Management Office add-in (ID: csk).
The Add-In Details page appears.
4. Review the changes to installed add-in items and new add-in items.
If you have previously configured views, the configurations are preserved and are not overwritten during installation. You can decide which new or updated views to apply. Use the details page of the add-in in Studio to select new or modified items and apply them. Applying a Studio object overwrites the existing configuration of the Studio object views.
For more information about how PMO Accelerator configures views, see Object Views (see page 253).

Apply the Add-In
Chapter 1: Overview 13
The Studio Add-In Details page lists all of the items that are included with the add-in. The following fields display on the page:
Name
Indicates the add-in name in a hierarchical relationship determined by dependencies among the items.
Status
Indicates if the add-in item is applied or not in CA Clarity PPM.
Values:
■ Not Installed. New items that are new to the add-in version or that you did not apply from a previous add-in version.
■ Upgrade Ready. Modified items that you applied from a previous add-in version and then configured. An update to the item is included in the current add-in version.
Important! Consider the configurations you have made to items before applying them. Applying modified items overwrites your configurations.
■ Installed. Items that are installed.
Type
Indicates the item type.
Values: Object, Lookup, Page, Tab, Portlet, Query, Custom View, Menu, Group, Project, Process, Role, and Report/Job
ID
Displays the add-in item code, which is the identifier of the applied add-in item.
Apply the Add-In
Perform the steps described in this section if you have an existing installation of the add-in, or if you have previously configured CA Clarity PPM Studio objects.
Follow these steps:
1. Log in to CA Clarity PPM.
2. Open Administration, and from Studio, click Add-Ins.
The Add-Ins page appears.

Upgrade to Universes with New Security [PMO]
14 PMO Accelerator Product Guide
3. Click the Accelerator: Program Management Office add-in (ID: csk).
The Add-In Details page appears.
4. Review the items in the list and select the items that are “Upgrade Ready” or “Not Installed.”
Note: By default, when you upgrade to the current add-in version, the items that are new or modified are pre-selected.
5. (Upgrade Only) For all active process instances with the "Upgrade Ready" status, cancel and delete the process instance.
Contact your CA Clarity PPM administrator or see the Administration Guide for more information.
6. Click Apply.
Note: Selected items with dependency on other items are also updated.
A list of updated items displays on the confirmation or install page.
7. Click Yes to update or install the items.
If a user has previously changed an item listed on the confirmation or install page, publish the item before displaying the update to the users.
See the Studio Developer’s Guide for more information.
Upgrade to Universes with New Security [PMO]
The add-in includes the Business Intelligence Archive Resource (BIAR) file named CA_Clarity_CSK.BIAR.
The BIAR file contains the CA Clarity PMO universe (CA_Clarity_csk) and PMO reports. Import the BIAR file using the Business Objects Import Wizard. Repeat the steps you followed for importing the CA Clarity PPM universe and stock reports to import the BIAR file for the PMO Accelerator add-in.
See the Installation Guide for more information.

Chapter 2: Project Lifecycle and Processes 15
Chapter 2: Project Lifecycle and Processes
This section contains the following topics:
About the Project Lifecycle (see page 15) Project Lifecycle Processes (see page 15) Project Templates (see page 16) How to Work with the Idea Review Process (see page 18) How to Work with the Create Major IT Project Process (see page 21) How to Work with the Document Review Process (see page 22) Create a Project from a Project Template (see page 25) How to Work with the Issue Review and Escalation Process (see page 27)
About the Project Lifecycle
The idea can go through an approval process or can be fast tracked to project creation. When the idea is ready to be converted, the Idea Review process starts a project creation process. The process is based on the following idea type and idea category combinations. The project creation process converts the idea to a project using the applicable project template. Also copies the field values from the idea to the project.
Idea Type Idea Category Project Creation Process
Project Template
Major Project Not applicable Create Major IT Project
Major IT Project Template
Infrastructure Deployment
Not applicable Create Infrastructure Project
IT Infrastructure Deployment Template
Application Change
Enhancement Create Application Change Project
Application Change Template
Application Change
COTS Evaluation Create Application COTS project
Application COTS Template
Project Lifecycle Processes
The following automated processes are included to help you manage the project lifecycle, starting from idea review and approval to project creation:

Project Templates
16 PMO Accelerator Product Guide
Document Review
The Document Review process manages the review workflow for Proposal or Operations types of documents.
Idea Review
Ideas let you conduct analysis that is more expedient at an earlier stage. The analysis is in an attempt to filter out poor, or financially unfeasible ideas before they become investments. You can track and convert ideas into investment opportunities.
Issue Review and Escalation
The Issue Review and Escalation process manages the review workflow for high-priority project issues.
Create Application Change Project
The Create Application Change Project process creates a project based on the Application Change Template.
Create Application COTS Project
The Create Application COTS Project process creates a project based on the Application COTS Template.
Create Infrastructure Project
The Create Infrastructure Project process creates a project based on the IT Infrastructure Deployment Template.
Create Major IT Project
The Create Major IT Project process creates a project based on the Major IT Project Template.
Project Templates
Project templates allow you to create projects based on standard tasks and role assignments for that project type. Templates help ensure consistency and efficiency in creating projects.
The Idea Review process uses these templates to create these types of projects for you. Alternatively, you can use these templates to create projects.

Project Templates
Chapter 2: Project Lifecycle and Processes 17
You can change the templates to suit your organization demands and requirements. You can also duplicate these templates to create new project templates for each of your organization project types.
Important! To use the Major IT Project approval and gate review processes, change the names and properties of the last tasks in each phase. But do not change the IDs. The gate review process starts when tasks with the specific IDs are completed.
See the Project Management User Guide for more information.
The following project templates are included:
Application Change
The Application Change template helps manage projects to change software applications.
The Create Application Change Project process uses the project template. The process provides an automated workflow to create projects. You can also use the template to create new application change projects.
Application COTS
The Application COTS template is designed to manage Commercial Off-the-Shelf (COTS) application selection. Use this project template to manage the activities when you select a vendor to provide a new product.
The Create Application COTS Project process uses the project template. The process provides an automated workflow to create projects. You can also use the template to create application COTS projects.
IT Infrastructure Deployment
The IT Infrastructure Deployment template helps manage the deployment of an infrastructure enhancement.
The Create Infrastructure Project process uses the project template. The process provides an automated workflow to create projects. You can also use the template to create IT infrastructure deployment projects.
Major IT Project
The Major IT Project template provides a framework for the application enhancement and development processes. This template helps project manager take the project through all gate reviews.
The Create Major IT Project process uses the project template. The process provides an automated workflow to create projects and manage the approval and gate review workflows. You can also use the template to create projects. This template includes a sample work breakdown structure (WBS). The WBS has six major phases, each with subtasks.

How to Work with the Idea Review Process
18 PMO Accelerator Product Guide
How to Work with the Idea Review Process
The following tasks are involved in the Idea Review process:
1. The originating requester does the following:
a. Creates the idea. (see page 19)
b. When the idea is ready, submits the idea. (see page 19)
2. The Idea Review Process starts, and does one of the following:
■ Fast tracks to project creation.
If the Fast Track check box is selected, the project creation process starts based on the selected idea type and idea category combination. A WBS and baseline are created. The process ends for all project creation processes except for the Create Major IT Project process.
■ Starts the idea review process.
If the Fast Track check box is cleared, an action item is sent to the business owner to review the idea.
3. The business owner evaluates the functional and technical benefits and analyzes the cost benefits of the idea. The business owner selects one of the following options for the action item:
■ Reject. The idea status is set to “Rejected” and the process ends.
■ Incomplete. The idea status is set to “Incomplete.” An action is sent to the originating requester to update the idea with additional information. Also, to change the status of the action item to “Done”. A new action is sent to the business owner to review the idea.
■ Approve. The idea status is set to “Approved.” An action item is sent to the originating requester to change the status of the action item to “Done.”
4. The project creation process starts.
The type of process that starts is based on the idea type and idea category combination. A WBS and baseline are created. The project creation process ends except for Major IT projects.
5. For a major IT project, the Gate Review process starts. (see page 21)

How to Work with the Idea Review Process
Chapter 2: Project Lifecycle and Processes 19
Create an Idea
Use the Ideas page to create an idea. You can save the idea and submit it when the idea is ready for approval. Alternatively, you can fast track the idea and bypass the approval process and convert the idea into a project.
Before you can create an idea, autonumbering must be set up for the Project ID.
Contact your CA Clarity PPM administrator or see the Administration Guide for more information.
Follow these steps:
1. Open Home, and from Demand Management, click Ideas.
The ideas page appears.
2. Click New.
The create page appears.
3. Complete the following fields:
Subject
Defines the summary/name for the idea. The subject links the investment to the idea when you convert the idea into an investment. The subject of the idea becomes the description of the investment.
Idea ID
Defines the unique ID for the idea.
Idea Type
Specifies the type of idea.
Values: Major Project, Infrastructure Deployment, or Application Change
Required: No
Idea Category
Specifies the idea category. The values that are available depend on the Idea Type you select. Your CA Clarity PPM administrator defines the field associations.
Values: New Development, Compliance/Regulatory, New Product or Service, Other, Enhancement, COTS Evaluation, Distributed, Network/Telecom, or Desktop
Required: No
Idea Priority
Specifies the priority of the idea.
Values: Low, Medium, and High

How to Work with the Idea Review Process
20 PMO Accelerator Product Guide
Fast Track
Specifies to convert the idea to a project by bypassing the review and approval step of the Idea Review process.
Default: Cleared
Required: No
Objective
Defines the objective of the idea.
Limits: 200 characters
Requester
Defines the name of the resource originating the idea.
Default: The name of the resource currently logged in
Business Owner
Defines the name of the business owner owning the idea and approves the conversion of the idea into a project. The business owner of the idea becomes the business owner for the project once the idea is converted.
Note: If the Fast Track check box is cleared, the Idea Review Process requires a value for the field.
Manager
Defines the name of the resource that manages and owns the idea. The idea manager has access to the budget and schedule properties of the idea.
Start Date
Defines the start date for the idea.
Finish Date
Defines the finish date for the idea.
Objective
Defines the objective for the idea.
Limits: 200 characters
Organizational
Defines the organizational OBS for the idea.
Department
Defines the department OBS for the idea.

How to Work with the Create Major IT Project Process
Chapter 2: Project Lifecycle and Processes 21
4. Do one of the following:
■ Save the idea.
■ Click Submit for Approval to start the Idea Review process.
The idea is created.
How to Work with the Create Major IT Project Process
The process for managing Major IT projects is done using the following processes:
■ Create Major Project process. Starts when a project is created using the Major Project template.
■ Project Gate Review Subprocess. Manages a gate review workflow for all major IT projects. The process starts three times from the Create Major IT Project process: To manage the gate approvals as the project moves to the Planning Stage, the Building Stage, and the Closing Stage.
The following tasks are involved in the managing the lifecycle of a major IT project using an automated process:
1. After the Create Major IT Process starts and the project is created, the project manager can define the Project Management Office (PMO) stakeholder.
With the project open, go to the properties page, and in the Stakeholders section, select the Project Management Office stakeholder. Then, click Submit.
An action item is sent to the PMO stakeholder to review and approve the project.
2. The PMO stakeholder selects one of the following options for the action item:
■ Approved. An action item is sent to the project manager that the project has been approved. The project status is set to "Approved." The Create Major IT Project process initiates the Planning stage.
■ Rejected. An action item is sent to the project manager that the project has been rejected. The project status is set to "Rejected."
3. When the last task in the Planning phase is completed, the project manager updates the task. Also, changes the % Complete field to 100 percent and the Status field to "Completed."
An action item is sent to the PMO stakeholder for approval to move to the next gate.
How to Work with the Document Review Process
22 PMO Accelerator Product Guide
4. The PMO stakeholder selects one of the following options for the action item:
■ Approved. The Project Gate Review Subprocess initiates the next phase. An action item is sent each of the following:
– The originating requester and is notified that the PMO stakeholder has approved the project.
– The project manager. When the last task of the current phase is completed, changes the % Complete field to 100 percent. The status of the last task of the current phase to "Completed."
■ Rejected.
■ Resubmit. An action item is sent to the project manager to revise the project information. When complete, the project manager changes the status of the action item to "Done."
An action item is sent to the PMO stakeholder to approve the project and proceed to the next phase.
5. The Project Gate Review Subprocess repeats for the remaining phases.
6. When the Closing phase is complete, the project manager closes the project.
How to Work with the Document Review Process
The Document Review process takes a submitted proposal or operations document through the following review cycle:
1. The team member uploads the proposal or operations document and submits the document for review when ready.
An action item is sent to the project manager.
2. The project manager reviews the document and updates status for the action item:
■ Approve. Sets the document status is set to "Approved."
■ Reject. Sets the document status is set to "Rejected."
An action is sent to the document owner who is notified of the project manager decision.
Upload and Submit Documents for Review
You can use the Document Review process to move project-related documents through a review and approval process. This process starts when the category is set to Proposal or Operations and the document status is set to "Submitted."
How to Work with the Document Review Process
Chapter 2: Project Lifecycle and Processes 23
Follow these steps:
1. Open the project.
The properties page appears.
2. Click Collaboration.
The collaboration page appears.
3. Open the Properties menu and click Add Documents.
The add multiple documents page appears.
4. Complete the following fields on this page:
Current Location
Displays the current location of the document.
Select Files
Specifies the files you are adding to the folder.
Limits: Five files at a time
Status
Specifies the status of the document.
Values: Submitted, Approved, or Rejected
Starts Review Process: Submitted
Category
Specifies the category for the document.
Values: Proposal, Planning, Development, Implementation, and Operations
Starts Review Process: Proposal or Operations
Date Created
Defines the date the document is uploaded.
Owner
Defines the owner that manages the document. The resource verifies that the document is managed and tracked appropriately through its lifecycle.

How to Work with the Document Review Process
24 PMO Accelerator Product Guide
Access
Indicates the type of access for the document.
Values:
■ All Participants. Indicates granting to all the participants in the group, read/write access to the folder.
■ Select Participants. Indicates that individual resources are from the existing participant group.
Default: All Participants
Allow Non-Participants to Access Document
Indicates that non-participants can access the document.
Default: Cleared
Enable Check Out
Indicates if resources with appropriate access can check out and edit the document.
Default: Selected
Enable Versioning
Indicates resources with appropriate access can create another version of the document.
Default: Selected
Notify Resources/Groups
Indicates if resources that have access to the files are notified when documents are added.
Default: Cleared
Description
Defines the description of the document.
Comments
Specifies any comments about the document.
5. Click Add.
The document is uploaded and submitted for review.

Create a Project from a Project Template
Chapter 2: Project Lifecycle and Processes 25
Create a Project from a Project Template
Follow these steps:
1. Open Home, and from Portfolio Management, click Projects.
The list page appears.
2. Click New from Template.
The select page appears.
3. Select one of the following templates, and click Next:
■ Application Change Template
■ Application COTS Template
■ IT Infrastructure Deployment Template
■ Major IT Project Template
The create project page appears.
4. Complete the following fields:
Project Name
Defines the unique name for the project.
Limits: 80 characters
Required: Yes
Project ID
Defines the unique identifier for the project. On lists and portlets, the value for the field is display only.
Limits: 20 characters
Required: Yes
Start Date
Displays the date of starting the project.
Finish Date
Displays the date of completing the project.
Objective
Defines the objectives for this project.
Limits: 200 characters
Status
Indicates the status of the task.
Values: Started, Not started, and Completed

Create a Project from a Project Template
26 PMO Accelerator Product Guide
Progress
Indicates the level of work completed on the tasks.
Values:
■ Completed (100 percent)
■ Started (1 - 99 percent)
■ Not Started (0 percent)
Default: Not Started
Required: Yes
Assignment Pool
Specifies the pool of resources allowed when assigning resources to projects.
Values:
■ Team Only. Allow only staff members.
■ Resource Pool. Allow team staff members and resources you have access to for booking to a project. With this option, when you assign a resource to a project, the resource is also added as a team staff member.
Dashboard View
Specifies the dashboard view selected for the project. Click the drop-down to select a view option.
Example: Use Project Default Layout value to view the default labor and team utilization charts on the project dashboard page.
Values: PMO-Project Status, PMO-Program Status, PMO-Project Storyboard, Program Layout, or Project Default Layout
Default: Project Default Layout
% Complete Calculation
Defines the method to use for calculating percentage completion of tasks on this project.
Values: Manual, Effort, Duration
Organizational
Defines the organizational OBS associated with the project.
Department
Defines the departmental OBS associated with the project.
Template Name
Displays the name of the template.

How to Work with the Issue Review and Escalation Process
Chapter 2: Project Lifecycle and Processes 27
Scale Work By
Defines the percentage of increase or decrease in the work estimates on each task for the new project, relative to the template.
Default: Zero percent means no change
Scale Budget By
Defines the percentage (positive or negative) as the scaling factor for the dollar amounts defined in project cost plans and benefit plans.
Default: Zero percent means no change
Convert resources to roles
Select the option to convert all resources from the project template into roles in the new project.
Default: Cleared
5. Save the changes.
The project is created.
How to Work with the Issue Review and Escalation Process
The Issue Review and Escalation process is designed to take high-priority project issues through a review and escalation workflow. To start the process for an existing issue, open the issue, and start the process using the Processes menu.
See the Project Management User Guide for more information.
The following tasks are involved in escalating an issue:
1. The project manager verifies that the Project Management Office and Business Owner stakeholder are defined. With the project open, review these fields from the Stakeholder section of the general properties page.
2. With the project open, a team member creates an issue (see page 28) and sets the Priority field to "High."
The Issue Review and Escalation process starts. An action item is sent to the project manager to review the issue.

How to Work with the Issue Review and Escalation Process
28 PMO Accelerator Product Guide
3. The project manager reviews the issue and selects one of the following options for the action item:
■ Rejected. An action item is sent to the issue owner to resubmit the issue for review.
■ Resolved. An action item is sent to the business owner to sign off on the resolution of the issue.
4. The business owner selects one of the following options for the action item:
■ Approved. The status of the issue is set to "Resolved." An action item is sent to the issue owner and project manager that the issue has been resolved.
■ Rejected. An action item is sent to the issue owner to update the resolution. The process is restarted when the issue owner changes the status of the action item to "Done."
Create Issues
Follow these steps:
1. Open the project and click Risks/Issues/Changes.
The risks page appears.
2. Open the Risks/Issues/Changes menu and click Issues.
The issues page appears.
3. Click New.
The create page appears.
4. Complete the following fields in the General section:
Issue Name
Defines the short name for the issue. If you create an issue from a closed risk, the value for this field is from the Risk Name field on the risk properties page.
Limit: 64 characters
Required: Yes
Issue ID
Defines the identifier for the issue.
Required: Yes
Description
Defines the short description for the issue. If you create an issue from a closed risk, the value for the field is derived from the Description field on the risk properties page.
Required: No

How to Work with the Issue Review and Escalation Process
Chapter 2: Project Lifecycle and Processes 29
Category
Defines the issue category to assign this issue. If you create an issue from a closed risk, the value for the field is derived from the Category field on the risk properties page.
Values: Objectives, Sponsorship, Funding, Resource Availability, Interdependencies, Technical, Human Interface, Organizational Culture, Supportability, Implementation, and Flexibility
Owner
Defines the name of the resource who is managing the risk. This resource is responsible for verifying that the issue is managed and tracked appropriately through its lifecycle. If you create an issue from a closed risk, the value for this field is from Owner field on the risk properties page.
Default: The resource currently logged in
Required: Yes
Status
Specifies the status of the issue.
Values: Open, Work in Progress, Closed, or Resolved
Default: Open
Required: Yes
Creator
Displays the name of the resource who created the issue.
Default: The resource currently logged in
Updated by
Displays the name of the resource who last updated the issue.
Default: The resource currently logged in
5. Complete the following fields in the Details section of the page:
Target Resolution Date
Defines the date for resolving the issue. The date requires to be the same or earlier than the impact date.
Default: Current date
Priority
Defines the priority level for the issue.
Values: Medium, Low, and High
Default: Low
6. Complete the following field in the Attachments section:

How to Work with the Issue Review and Escalation Process
30 PMO Accelerator Product Guide
Document
Specifies one or more attachments.
7. Complete the following fields in the Resolution section:
Resolution
Defines the final resolution of the issue after the matter is resolved.
Required: No
8. Save the changes.

Chapter 3: Business Alignment and Status Reports 31
Chapter 3: Business Alignment and Status Reports
This section contains the following topics:
About Business Alignment and Status Reports (see page 31) Define Alignment Factors (see page 32) Create a Status Report (see page 34)
About Business Alignment and Status Reports
The following objects are available to help you define, measure, document, and report on the business alignment and status of your investments.
Set auto-numbering on the ID of each of the objects.
See the Studio Developer’s Guide for more information.
Business Alignment
You can use alignment factors to calculate the business alignment for an investment.
Investments: All Investments
Status Reports
You can use status reports to create a weekly, monthly, or quarterly status report. A status report indicates how a project or program is doing in terms of schedule, cost, and scope where compared to the plan.
Investments: Project and Program
Before defining the business alignment factors and status reports, the investment is required to exist. You can access the pages from the properties menu of your investment.

Define Alignment Factors
32 PMO Accelerator Product Guide
Define Alignment Factors
Define the alignment factors to track the business alignment, goals, and corporate priorities of your investments.
Follow these steps:
1. Open the investment.
The properties page appears.
2. Open the Properties menu and click Alignment & Risk. For projects, click Business Alignment.
The alignment and risk page appears. For projects, the business alignment page appears.
3. Complete the following fields in the Alignment and Risk section:
Business Alignment
Displays the business alignment score as a stoplight. This score is the average of the scores for each factor selected on this page. A higher score indicates better alignment.
Stoplights:
■ Red (0 through 33). The investment is poorly aligned to the business.
■ Yellow (34 through 67). The investment has average alignment to the business.
■ Green (68 through 100). The investment is aligned to the business.
Goal
Defines the goal of the investment.
Values: Cost Avoidance, Cost Reduction, Grow the Business, Infrastructure Improvement, or Maintain the Business
Risk
Defines the risk for the investment. A lower value indicates a lower risk. For projects, this field is available on the risk rating page.
Stoplights:
■ Red (0 through 33). The investment has a low risk.
■ Yellow (34 through 67). The investment has a medium risk.
■ Green (68 through 100). The investment has a high risk.
Required
Indicates if the investment is required for the business for compliance purposes.

Define Alignment Factors
Chapter 3: Business Alignment and Status Reports 33
4. Complete the following options from the Alignment Factors section, and save.
Corporate Priority
Defines the corporate priority of an investment.
Stoplights:
■ Green. The investment is either a high or higher priority.
■ Yellow. The investment is a medium priority.
■ Red. The investment is a low priority.
Business Unit Priority
Defines the business unit priority of an investment.
Stoplights:
■ Green. The investment is either a high or higher priority.
■ Yellow. The investment is a medium priority.
■ Red. The investment is a low priority.
Architectural Fit
Defines the architectural fit for an investment.
Stoplights:
■ Green. The investment is either a high or higher fit.
■ Yellow. The investment is a medium fit.
■ Red. The investment is a low fit.
Commercial Value
Defines the commercial value associated with the investment.
Stoplights:
■ Red. The investment has a low commercial value.
■ Yellow. The investment has a medium commercial value.
■ Green. The investment has either a high or higher commercial value.
Regulatory Compliance
Displays the regulatory compliance status of an investment.
Stoplights:
■ Green. The investment is required for compliance.
■ Yellow. The investment supports compliance activities.
■ Red. The investment is not applicable for compliance.

Create a Status Report
34 PMO Accelerator Product Guide
Technology Compliance
Displays the technology compliance status of an investment.
Stoplights:
■ Green. The investment is in compliance with architecture standards.
■ Yellow. The investment is not in compliance but stable.
■ Red. The investment is not in compliance.
The alignment factor is defined.
Create a Status Report
You can create a status reports to track the progress of a project or program.
Follow these steps:
1. Open the project or program.
The properties page appears.
2. Open the Properties menu and click Status Reports.
3. Click New.
The create page appears.
4. Complete the following fields:
Status Report Name
Defines the name of the status report.
Report Date
Displays the date the report was created.
Status Report Update
Displays the overall project or program status including the latest updates.
Key Accomplishments
Describes the main accomplishments or deliverables for the reported period.
Upcoming Activities
Describes the upcoming activities.

Create a Status Report
Chapter 3: Business Alignment and Status Reports 35
Schedule Status
Specifies a stoplight indicating the schedule status for the project.
Stoplights:
■ Green. The project or program is on track.
■ Yellow. The project or program has minor variance from the schedule.
■ Red. The project or program has significant variance from the schedule.
Current Phase
Displays the current phase of the project or program.
Next Milestone on Track?
Indicates if the next milestone is on track.
Default: Cleared
Variance Explanation
Provides an explanation for a variance in the project or program schedule.
Limits: 2000 characters
Scope Status
Indicates the status of the project or program scope.
Stoplights:
■ Green. The project or program scoping is on track.
■ Yellow. The project or program scoping has minor variance.
■ Red. The project or program scoping has significant variance.
Scope Change Required?
Indicates if a change in the project scope is required.
Default: Cleared
Deliverable Scope Changed?
Indicates if the scope of the project deliverable has changed.
Default: Cleared
Project Objective Changed?
Indicates if the project objective has changed.
Default: Cleared
Change Explanation
Provides an explanation for a change in the project objective.
Limits: 2000 characters

Create a Status Report
36 PMO Accelerator Product Guide
Cost and Effort Status
Displays the cost and effort status of the project.
Stoplights:
■ Green. The cost and effort status is on track.
■ Yellow. The cost and effort status has a minor variance.
■ Red. The cost and effort status has a significant variance.
Review Approval Problems?
Indicates if the project is encountering any review approval problems.
Default: Cleared
Staffing/Availability Issues?
Indicates if the project is encountering staffing availability issues.
Default: Cleared
Project Affected by External Factors?
Indicates if external factors affect the project.
Default: Cleared
Cost and Effort Explanation
Provides an explanation for the cost and effort status.
Limits: 2000 characters
5. Save the changes.
The status report is created.

Chapter 4: General Pages and Portlets 37
Chapter 4: General Pages and Portlets
This section contains the following topics:
Sponsor (see page 37) Portfolio Dashboard (see page 42) Program Dashboard (see page 44) PM Alerts (see page 53) Project Dashboard (see page 64) Issues and Risks (see page 72)
Sponsor
Use the overview sponsor page to analyze the sponsor view of project alignment, risk, budget, and schedule. This page consists of the following portlets:
■ Project KPIs by OBS (see page 37)
■ Project Schedule (see page 41)
■ Project Planned Cost (see page 42)
Follow these steps:
1. Open Home, and from Personal, click General.
The overview general page appears.
2. Click Sponsor.
The overview sponsor page appears.
Use the page-level filter to filter all portlets at once by business owner.
Projects KPIs by OBS Portlet
The Project KPIs by OBS portlet displays key performance indicators (KPIs) for projects organized by OBS. The portlet provides a quick update on KPIs, such as business alignment, schedule %, days late, projected cost and effort variance %, risk, issues, and change requests.
The portlet displays information from both an OBS and a project perspective. The project information rolls up to each level in the OBS.

Sponsor
38 PMO Accelerator Product Guide
This portlet includes the following fields:
OBS/Project
Displays the OBS or project name. Expand an OBS name to display all projects that belong to that OBS. Click a project link to go to the project dashboard.
Manager
Displays the project manager. Click a manager link to go to the properties page of the resource.
Email Icon
Displays an email icon. Click this icon to send an email to the project manager.
Business Alignment
Displays how well the project aligns to the organization business goal. The higher the value, the stronger the alignment. The metric is used in portfolio analysis when you use comparable business alignment criteria across all portfolio investments. For each OBS unit, the average alignment is calculated.
Stoplights:
■ Green (68 through 100). The project has good alignment with the business.
■ Yellow (34 through 67). The project has average alignment with the business.
■ Red (0 through 33). The project has poor alignment with the business.
■ White. The project alignment data is undefined.
Schedule %
Displays a stoplight indicating days late as a percentage of the project timeframe, which is finish date minus start date. The calculation takes into account the project progress and baseline (if a baseline exists). The color of the stoplight indicates if the project is on schedule or late. For each OBS unit, the average schedule percentage is calculated.
Stoplights:
■ Green. The project is ahead of schedule or on schedule.
■ Yellow. The project is between one and ten percent late.
■ Red. The project is more than ten percent late.
■ White. The schedule % is undefined.
Sponsor
Chapter 4: General Pages and Portlets 39
Days Late
Displays the number of days by which a project is late considering the following:
■ Whether or not a baseline exists
■ Project progress
For each OBS unit, the average days late is calculated.
If a baseline exists, then days late is calculated as project finish date minus baseline finish date. A positive number indicates that the project is late according to the baseline. A negative number indicates that it is early according to the baseline.
If a baseline exists and the project finish date is the same as the baseline finish date, then the project is considered late if it is not completed and it was due before today’s date. In this case, days late is calculated as today’s date minus project finish date.
If there is no baseline, then days late is calculated if the project is not completed and it was due before today’s date. In this case, days late is calculated as today’s date minus project finish date.
Projected Cost Variance %
Displays a stoplight indicating the projected cost variance as a percentage of BAC cost. For each OBS unit, the average projected cost variance percentage is calculated.
Formula: (((ETC Cost + Actual Cost (ACWP)) - BAC Cost) / BAC Cost) * 100
Stoplights:
■ Green. The EAC cost is less than or equal to the baseline.
■ Yellow. The EAC cost is between one and ten percent over the baseline.
■ Red. The EAC cost is more than ten percent over baseline.
■ White. No baseline data exists.
Projected Effort Variance %
Displays a stoplight indicating the projected effort variance as a percentage of BAC effort. For each OBS unit, the average projected effort variance percentage is calculated.
Formula: ((EAC Effort – BAC Effort) / BAC Effort) * 100
Stoplights:
■ Green. The EAC effort is less than or equal to the baseline.
■ Yellow. The EAC effort is between one and ten percent over the baseline.
■ Red. The EAC effort is more than ten percent over the baseline.
■ White. No baseline data exists.

Sponsor
40 PMO Accelerator Product Guide
Risk
Displays a stoplight based on the project risk score. The project risk score determines the color of the stoplight. For each OBS unit, the average risk score is calculated.
Stoplights:
■ Green (0 through 33). The project is low risk.
■ Yellow (34 through 67).The project is medium risk.
■ Red (68 through 100). The project is high risk.
Issue
Displays a stoplight based on the highest issue priority of the issues on the project. Issues with a status of “Resolved” or “Closed” are excluded. For each OBS unit, the issue stoplight is calculated as the highest issue priority of its projects.
Stoplights:
■ Green. All issues that exist on the project are low priority.
■ Yellow. At least one medium priority issue and no high priority issues exist on the project.
■ Red. At least one high priority issue exists on the project.
Change
Displays a checkmark if at least one change request exists on the project. Change requests with a status of “Resolved” or “Closed” are excluded. For each OBS unit, the change checkmark displays if at least one project in the OBS has a change request.
The following fields are available for this portlet and you can add them through the configure option:
See the Personalizing CA Clarity User Guide for more information.
Days Late %
Displays days late as a percentage of the project timeframe, which is the finish date minus the start date. The calculation takes into account the project progress and baseline (if a baseline exists). The days late percentage shows the proportion by which a project is late. One day late in a six-month project does not have the same impact as one day late in a one-month project. For each OBS unit, the average days late percentage is calculated.

Sponsor
Chapter 4: General Pages and Portlets 41
Schedule
Displays a stoplight indicating the number of days a project is late, considering the project progress and whether a baseline exists for the project. The color of the stoplight indicates if the project is on schedule or late. For each OBS unit, the average schedule is calculated.
Stoplights:
■ Green. The project is ahead of schedule or on schedule.
■ Yellow. The project is between one and ten days late.
■ Red. The project is more than ten days late.
■ White. The schedule is undefined.
Projected Cost Variance
Displays the variance between the estimated plus actual cost and the baseline cost. For each OBS unit, the average projected cost variance is calculated.
Formula: ((ETC Cost + Actual Cost (ACWP)) - BAC Cost)
Projected Effort Variance
Displays the variance between EAC effort and baseline effort. For each OBS unit, the average projected effort variance is calculated.
Formula: (EAC Effort – BAC Effort)
Project Schedule Portlet
The Project Schedule portlet displays project alignment, risk, planned cost, and schedule in a Gantt chart format.
The following fields display on the portlet:
Project
Displays the name of the project. Click the project name link to go to the project dashboard and obtain detailed information about the project.
Risk
Displays a stoplight that helps you assess the risk of a project. The total risk score of the project determines the color of the stoplight.
Stoplights:
■ Green (0 through 33). The project is low risk.
■ Yellow (34 through 67). The project is medium risk.
■ Red (68 through 100). The project is high risk.

Portfolio Dashboard
42 PMO Accelerator Product Guide
Planned Cost
Displays the amount of planned cost for the project.
Schedule
Displays a Gantt chart. Each Gantt bar in the chart represents the length of a project.
See the Project Management User Guide for more information.
Project Planned Cost Portlet
The Projects Planned Cost portlet displays a pie chart that shows the percentage amount of the planned cost for each project. Each pie slice corresponds to a project. Click a pie slice to go to the project dashboard.
Portfolio Dashboard
Use the overview portfolio dashboard page to review portfolios, select investments for the next investment period, and to adjust current in-flight portfolios. This page provides portfolio managers more visibility and control into portfolio governance.
The overview portfolio dashboard page consists of the following portlets:
■ My Portfolios (see page 42)
■ Portfolio Benefits and Costs (see page 43)
■ Portfolio Investment Benefits by Goal (see page 43)
Follow these steps:
1. Open Home, and from Personal, click General.
The overview general page appears.
2. Click Portfolio Dashboard.
The overview portfolio dashboard page appears. Use the page-level filter to filter all portlets at once by parent portfolio.
My Portfolios Portlet
The My Portfolios portlet lists portfolios and their cost performance indicator.
The following fields display on the portlet:
Portfolio Dashboard
Chapter 4: General Pages and Portlets 43
Cost Variance Indicator
Displays a stoplight that shows a view of the portfolio performance.
Stoplights:
■ Green. Approved investment planned cost is under the portfolio planned cost.
■ Red. Approved investment planned cost is over the portfolio planned cost.
Portfolio
Displays the portfolio name. Click a portfolio name to go to the portfolio scorecard page.
Portfolio Planned Cost
Displays the planned cost of the portfolio.
Investments Planned Cost
Displays the approved planned investment cost for all investments in the portfolio.
Cost Variance
Displays the variance by subtracting the total cost of investments from the portfolio planned cost.
Portfolio Planned Benefit
Displays the total planned benefit for the portfolio.
Portfolio Benefits and Costs Portlet
The Portfolio Benefits and Costs portlet displays a column graph showing the total planned benefit and cost of each portfolio. The page displays the portfolios that you manage, or have access to. The values on the Y-axis display the portfolio planned benefit and planned cost amounts.
Click one of the bars in the graph to open the portfolio scorecard. Click a legend to hide columns in the graph.
Portfolio Investment Benefits by Goal Portlet
The Portfolio Investment Benefits by Goal portlet displays a pie graph showing the proportion of the portfolio investment planned benefit per corporate goal. Each pie segment represents a corporate goal to which at least one investment in the portfolio is mapped. Also, the size of the segment represents the benefit. The legend represents the investment corporate goals. Click a legend to hide a pie slice in the graph.

Program Dashboard
44 PMO Accelerator Product Guide
Program Dashboard
Use the overview program dashboard page to review the program cost and schedule. Compare this data to the cost and schedule of projects belonging to the program. The page provides program managers more visibility and control into program governance.
The overview program dashboard page consists of the following portlets:
■ Program Manager Cost Dashboard (see page 44)
■ Program Manager Schedule Dashboard (see page 50)
Follow these steps:
1. Open Home, and from Personal, click General.
The overview general page appears.
2. Click Program Dashboard.
The overview program dashboard page appears. Use the page-level filter to filter both portlets at once by the program.
Program Manager Cost Dashboard Portlet
The Program Manager Cost Dashboard portlet displays cost and effort performance of projects belonging to a program. This portlet compares a program budget to the cost performance of its projects.
The information displayed in this portlet is also available on the Schedule & Performance and Financial Summary properties of each project.
See the Project Management User Guide and Financial Management User Guide for more information.
The following fields display on the portlet:
Properties Icon
Displays an icon that links to the properties page of the project.
Project
Displays the name of the project. Click a project name link to go to the project dashboard.

Program Dashboard
Chapter 4: General Pages and Portlets 45
Risk
Displays a stoplight based on the project risk score. The project risk score determines the color of the stoplight.
Stoplights:
■ Green (0 through 33). The project is low risk.
■ Yellow (34 through 67). The project is medium risk.
■ Red (68 through 100). The project is high risk.
Stage
Displays the stage in the project lifecycle.
Finish
Displays the finish date of the project.
Planned ROI
Displays the ratio of money gained or lost on this project relative to the amount of money invested.
Source: Financial Summary properties page of the project.
Planned IRR
Displays the Internal Rate of Return or the discount rate used to achieve zero NPV for an investment.
Source: Financial Summary properties page of the project.
BAC Cost
Displays the system-calculated value of baseline at completion, which is the baseline cost at the time of the current baseline revision.
Source: Schedule & Performance properties page of the project.
Actual Cost
Displays the system-calculated value of actual cost of work performed (ACWP), which is the total direct cost incurred in performing work based on posted actuals.
Source: Schedule & Performance properties page of the project.
EAC Cost
Displays the system-calculated value of estimate at completion, which is the total cost of actual work completed to date and the predicted cost of finishing the remaining work.
Source: Schedule & Performance properties page of the project.

Program Dashboard
46 PMO Accelerator Product Guide
Projected Cost Variance
Displays the variance between the estimated plus actual cost and the baseline cost.
Source: Schedule & Performance properties page of the project.
Formula: ((ETC Cost + Actual Cost (ACWP)) - BAC Cost)
Projected Cost Variance%
Displays a stoplight indicating the projected cost variance as a percentage of BAC cost.
Source: Schedule & Performance properties page of the project.
Formula: (((ETC Cost + Actual Cost (ACWP)) - BAC Cost) / BAC Cost) * 100
Stoplights:
■ Green. The EAC cost is less than or equal to the baseline.
■ Yellow. The EAC cost is between one and ten percent over baseline.
■ Red. The EAC cost is more than ten percent over baseline.
■ White. A baseline does not exist.
Cost Drill Down
Displays an icon that links to a page with the following portlets:
■ Project Costs by Phase (see page 137)
■ Project Costs by Task (see page 142)
■ Project Costs by Resource (see page 146)
The following aggregate amounts are provided at the bottom of the page:
Project
Displays the aggregate percentages and cost amounts of projects belonging to the program. The aggregate amounts are averages for Planned ROI and Planned IRR. The aggregate amounts are sums for BAC Cost, Actual Cost, EAC Cost, and Projected Cost Variance.
Program
Displays the program Budgeted Cost.
Source: Financial Summary properties page of the program.

Program Dashboard
Chapter 4: General Pages and Portlets 47
Variance
Displays the difference between the program Budgeted Cost and the total EAC cost of the projects in the program.
The following fields are available for this portlet and you can add them through the configure option:
See the Personalizing CA Clarity User Guide for more information.
Start
Displays the start date of the project.
Project Manager
Displays the project manager of the project.
Planned Cost
Displays the planned cost of the project.
Source: Financial Summary properties page of the project.
Planned Benefit
Displays the planned benefit of the project.
Source: Financial Summary properties page of the project.
Planned NPV
Displays the net present value of the project by calculating the total cost of capital and a series of future payments and income.
Source: Financial Summary properties page of the project.
Planned Breakeven
Displays the date when the expected cash flow equals the cash outlay for the project. The breakeven date matches with the payback period.
Source: Financial Summary properties page of the project.
Planned MIRR
Displays the Modified Internal Rate of Return or the rate used to measure the attractiveness of the project.
Source: Financial summary page of the investment.
Planned Payback (Months)
Displays the number of periods (in months) needed for the sum of the expected cash flows to equal the initial cash outlay for the project.
Source: Financial Summary properties page of the project.

Program Dashboard
48 PMO Accelerator Product Guide
BAC
Displays the system-calculated value of the baseline effort (actuals plus remaining ETC) at the time of the current baseline revision.
Source: Schedule & Performance properties page of the project.
Actuals
Displays the system-calculated value of the actual effort posted to the tasks in the project.
Source: Schedule & Performance properties page of the project.
ETC
Displays the system-calculated value of the estimated effort to complete the project.
Source: Schedule & Performance properties page of the project.
EAC
Displays the system-calculated value of the estimated effort at completion (actuals plus remaining ETC) of the project.
Source: Schedule & Performance properties page of the project.
Projected Effort Variance
Displays the variance between EAC effort and baseline effort.
Source: Schedule & Performance properties page of the project.
Formula: (EAC Effort – BAC Effort)
Projected Effort Variance %
Displays a stoplight indicating the projected effort variance as a percentage of BAC effort.
Source: Schedule & Performance properties page of the project.
Formula: ((EAC Effort – BAC Effort) / BAC Effort) * 100
Stoplights:
■ Green. The EAC effort is less than or equal to the baseline.
■ Yellow. The EAC effort is between one and ten percent over the baseline.
■ Red. The EAC effort is more than ten percent over the baseline.
■ White. No baseline data exists.

Program Dashboard
Chapter 4: General Pages and Portlets 49
Planned Value (BCWS)
Displays the system-calculated value of budgeted cost of work scheduled (BCWS) or the budgeted amount you can spend on the project in a given time. If time is not specified, either the current date for the project or the system date is used. BCWS is also referred to as the planned value (PV).
Source: Schedule & Performance properties page of the project.
Earned Value (BCWP)
Displays the system-calculated value of budgeted cost of work performed (BCWP). The value is calculated and recorded when you baseline a project, or when you update earned value totals. BCWP is also referred to as the earned value (EV) and represents the amount of budgeted cost (BAC) completed based on performance. Performance is measured using the Task EV Calculation method.
Source: Schedule & Performance properties page of the project.
Cost Variance (CV)
Displays the system-calculated value of cost variance. The cost variance is the value of what is accomplished to date as opposed to what is spent to date.
Source: Schedule & Performance properties page of the project.
Schedule Variance (SV)
Displays the system-calculated value of schedule variance. The schedule variance is the value of what is scheduled to date as opposed to what is performed to date. A positive value indicates that the work is ahead of the baseline schedule. A negative value indicates that the work is behind the baseline schedule.
Source: Schedule & Performance properties page of the project.
Cost Variance %
Displays cost variance as a percentage. It is calculated as the percentage of cost variance over the amount of the budgeted cost of work performed (BCWP).
Source: Schedule & Performance properties page of the project.
Formula: ((BCWP – ACWP) / BCWP) * 100
Schedule Variance %
Displays schedule variance as a percentage. It is calculated as the percentage of schedule variance over the amount of the budgeted cost of work scheduled (BCWS).
Source: Schedule & Performance properties page of the project.
Formula: ((BCWP – BCWS) / BCWS) *100

Program Dashboard
50 PMO Accelerator Product Guide
Cost Performance Index (CPI)
Displays the system-calculated value of cost performance index (CPI), which is an efficiency rating for work accomplished. A value greater than or equal to one indicates a favorable condition. A value of less than one indicates an unfavorable condition.
Source: Schedule & Performance properties page of the project.
Schedule Performance Index (SPI)
Displays the system-calculated value of schedule performance index (SPI), which is the ratio of work performed to work scheduled. A value greater than or equal to one indicates work is on schedule. A value of less than one indicates the work is behind schedule.
Source: Schedule & Performance properties page of the project.
Program Manager Schedule Dashboard Portlet
The Program Manager Schedule Dashboard portlet displays schedule performance of a program and projects belonging to the program.
The following fields display on the portlet:
Properties Icon
Displays an icon that links to the properties page of the program or project.
Program/Project
Displays the program or project name. Click a program or project link to open the program or project dashboard.
Start
Displays the start date of the program or project.
Finish
Displays the finish date of the program or project.
Overall Status
Displays a stoplight indicating the overall status of each program or project, based on the status report with the most recent report date.
Stoplights:
■ Green. The program or project is on track.
■ Yellow. The program or project has a minor variance.
■ Red. The program or project has a significant variance.
■ White. The program or project status is undefined.

Program Dashboard
Chapter 4: General Pages and Portlets 51
Schedule %
Displays a stoplight indicating days late as a percentage of the program or project timeframe, which is finish date minus start date. The calculation takes into account the program or project progress and baseline (if a baseline exists). The color of the stoplight indicates if the program or project is on schedule or late.
Stoplights:
■ Green. The program or project is ahead of schedule or on schedule.
■ Yellow. The program or project is between one and ten percent late.
■ Red. The program or project is more than ten percent late.
■ White. The schedule % is undefined.
Days Late
Displays the number of days late considering the following:
■ Whether or not a baseline exists
■ Program or project progress
If a baseline exists, then days late is calculated as project finish date minus baseline finish date. A positive number indicates that the project is late according to the baseline. A negative number indicates that it is early according to the baseline.
If a baseline exists and the project finish date is the same as the baseline finish date, then the project is considered late if it is not completed and it was due before today’s date. In this case, days late is calculated as today’s date minus project finish date.
If there is no baseline, then days late is calculated if the program or project is not completed and it was due before today’s date. In this case, days late is calculated as today’s date minus program or project finish date.
Gantt Schedule
Displays a Gantt chart comparing the program finish date with the schedules of associated projects. The color of the Gantt bars is based on the Schedule % as follows:
■ Green. The program or project is ahead of schedule or on schedule.
■ Yellow. The program or project is between one and ten percent late.
■ Red. The program or project is more than ten percent late.
■ White. The schedule % is undefined.

Program Dashboard
52 PMO Accelerator Product Guide
The following fields are available for this portlet and you can add them through the configure option:
See the Personalizing CA Clarity User Guide for more information.
Baseline Start
Displays the baseline start date of the project.
Baseline Finish
Displays the baseline finish date of the project.
Project Manager
Displays the program or project manager.
Days Late %
Displays days late as a percentage of the program or project timeframe, which is the finish date minus the start date. The calculation takes into account the program or project progress and baseline (if a baseline exists). The days late percentage shows the proportion by which a program or project is late. One day late in a six-month program or project does not have the same impact as one day late in a one year program or project.
Schedule
Displays a stoplight indicating the number of days a program or project is late, considering the program or project progress and whether or not a baseline exists for the project. The color of the stoplight indicates if the program or project is on schedule or late.
Stoplights:
■ Green. The program or project is ahead of schedule or on schedule.
■ Yellow. The program or project is between one and ten days late.
■ Red. The program or project is more than ten days late.
■ White. The schedule is undefined.
Status Indicator
Displays a stoplight that shows the status of each program or project based on its status indicator.
Source: Schedule & Performance properties page of the program or project.
Stoplights:
■ Green. The program or project is on track.
■ Yellow. The program or project is at risk.
■ Red. The program or project is critical.
■ White. The program or project status indicator is undefined.

PM Alerts
Chapter 4: General Pages and Portlets 53
PM Alerts
The overview PM alerts page provides a high-level, exception-based view of project manager activity. Alerts indicate potential problem areas to monitor within the days outlook range. By default, the days outlook considers 45 days in the past and 45 days in the future based on the current date.
If you provide a value for As of Date, the portlets display results based on the As of Date entered instead of using the current date. The results, based on the As of Date, are 45 days in the past and 45 days in the future.
If you provide a value for Days Outlook, the portlets display results based on the Days Outlook entered instead of using the default of 45 days.
You can also combine As of Date and Days Outlook.
The PM alerts page consists of the following portlets:
■ Schedule Performance (see page 54)
■ Milestones (see page 58)
■ Current Issues (see page 60)
■ Staffing (see page 63)
Follow these steps:
1. Open Home, and from Personal, click General.
The overview general page appears.
2. Click PM Alerts.
The overview PM alerts page appears.
Use the page-level filter to filter all portlets at once by OBS, Project Manager, As of Date, and Days Outlook.

PM Alerts
54 PMO Accelerator Product Guide
Schedule Performance Portlet
The Schedule Performance portlet displays the number of late tasks categorized as critical late, past due, or scheduled late within the days outlook as follows:
■ Critical Late. Represents tasks are late and on the critical path for the project.
■ Past Due. Represents noncritical tasks are that are past their finish date.
■ Scheduled Late. Represents noncritical tasks are due as of the current date or in the future depending on when the tasks were scheduled.
Summary tasks and milestones are not included in this portlet. Also, tasks with a status of "Completed" are not included in this portlet.
Tasks are considered late if they have a days late value, which is calculated as follows:
■ If a baseline exists, then days late is calculated as task finish date minus baseline finish date.
■ If a baseline exists and the task finish date is the same as the baseline finish date, then the task is considered late if it is not completed and it was due before today’s date.
■ If there is no baseline, then days late is calculated if the task is not completed and it was due before today’s date. In this case, days late is calculated as today’s date minus task finish date.
No columns on the graph imply that all the tasks within the days outlook are completing as scheduled.
Click a bar on the graph to go to the schedule performance drill-down page (see page 54). The Schedule Performance portlet displays on this page.
Schedule Performance Drill Down Page
The Schedule Performance Drill Down Page includes the Schedule Performance Details portlet. This portlet displays a list of the critical late, past due, or scheduled late tasks within the days outlook.
Summary tasks and milestones are not included in this portlet. Also, tasks with a status of "Completed" are not included in this portlet.
To view this portlet, click a bar on the graph on the Schedule Performance portlet (see page 54).
The following fields display on the portlet:
Properties Icon
Displays an icon that links to the properties page of the project.

PM Alerts
Chapter 4: General Pages and Portlets 55
Project
Displays the project name. Click a project name to view the project dashboard.
Task
Displays the name of the task. Click a task name to view the task properties.
Status
Indicates the status of the task.
Values: Not Started and Started
Classification
Displays the task grouping.
Values: Critical Late, Past Due, and Scheduled Late
Finish
Displays the finish date of the task.
Schedule %
Displays a stoplight indicating days late as a percentage of the summary task or project timeframe, which is finish date minus start date. If the task has a parent task in the WBS, then the parent task timeframe is used in the calculation. If the task is at the top level of the WBS and does not have a parent task, then the project timeframe is used in the calculation.
The calculation takes into account the task status and baseline (if a baseline exists). The color of the stoplight indicates if the task is on schedule or late.
Stoplights:
■ Green. The task is ahead of schedule or on schedule.
■ Yellow. The task is between one and ten percent late.
■ Red. The task is more than ten percent late.
■ White. The schedule % is undefined.

PM Alerts
56 PMO Accelerator Product Guide
Days Late
Displays the number of days late considering the following:
■ Whether or not a baseline exists
■ Task status
If a baseline exists, then days late is calculated as task finish date minus baseline finish date. A positive number indicates that the task is late according to the baseline. A negative number indicates that it is early according to the baseline.
If a baseline exists and the task finish date is the same as the baseline finish date, then the task is considered late if it is not completed and it was due before today’s date. In this case, days late is calculated as today’s date minus task finish date.
If there is no baseline, then days late is calculated if the task is not completed and it was due before today’s date. In this case, days late is calculated as today’s date minus task finish date.
BAC
Displays the system-calculated value of the baseline effort (actuals plus remaining ETC) at the time of the current baseline revision.
Actuals
Displays the system-calculated value of the actual effort posted for the task in the project.
ETC
Displays the system-calculated value of the estimated effort to complete the task.
EAC
Displays the system-calculated value of the estimated effort at completion (actuals plus remaining ETC) of the task.
Projected Effort Variance
Displays the variance between EAC effort and baseline effort.
Formula: (EAC Effort – BAC Effort)

PM Alerts
Chapter 4: General Pages and Portlets 57
Projected Effort Variance %
Displays a stoplight indicating the projected effort variance as a percentage of BAC effort.
Formula: ((EAC Effort – BAC Effort) / BAC Effort) * 100
Stoplights:
■ Green. The EAC effort is less than or equal to baseline.
■ Yellow. The EAC effort is between one and ten percent over baseline.
■ Red. The EAC effort is more than ten percent over baseline.
■ White. No baseline data exists.
The following fields are available for this portlet and you can added them through the configure option:
Start
Displays the task start date.
Baseline Start
Displays the task baseline start date.
Baseline Finish
Displays the task baseline finish date.
Days Late %
Displays days late as a percentage of the summary task or project timeframe, which is finish date minus start date. If the task has a parent task in the WBS, then the parent task timeframe is used in the calculation. If the task is at the top level of the WBS and does not have a parent task, then the project timeframe is used in the calculation. The calculation takes into account the task status and baseline (if a baseline exists).
Schedule
Displays a stoplight indicating the number of days a task is late, considering the task status and whether or not a baseline exists for the task. The color of the stoplight indicates if the task is on schedule or late.
Stoplights:
■ Green. The task is ahead of schedule or on schedule.
■ Yellow. The task is between one and ten days late.
■ Red. The task is more than ten days late.
■ White. The schedule is undefined.

PM Alerts
58 PMO Accelerator Product Guide
Milestones Portlet
The Milestones portlet provides a list of project milestones and schedule indicators within the days outlook.
The portlet includes the following fields:
Properties icon
Displays an icon that links to the properties page of the project.
Project
Displays the name of the project. Click a project name link to go to the project dashboard.
Milestone
Displays the milestone name. Click the name of the milestone to go to the task properties page.
Finish
Displays the finish date for the milestone to be complete.
Schedule %
Displays a stoplight indicating days late as a percentage of the summary task or project timeframe, which is finish date minus start date. If the milestone has a parent task in the WBS, then the parent task timeframe is used in the calculation. If the milestone is at the top level of the WBS and does not have a parent task, then the project timeframe is used in the calculation.
The calculation takes into account the milestone status and baseline (if a baseline exists). The color of the stoplight indicates if the milestone is on schedule or late.
Stoplights:
■ Green. The milestone is ahead of schedule or on schedule.
■ Yellow. The milestone is between one and ten percent late.
■ Red. The milestone is more than ten percent late.
■ White. The schedule percentage is undefined.
PM Alerts
Chapter 4: General Pages and Portlets 59
Days Late
Displays the number of days late considering the following:
■ Whether or not a baseline exists
■ Milestone status
If a baseline exists, then days late is calculated as milestone finish date minus baseline finish date. A positive number indicates that the milestone is late according to the baseline. A negative number indicates that it is early according to the baseline.
If a baseline exists and the milestone finish date is the same as the baseline finish date, then the milestone is considered late if it is not completed and it was due before today’s date. In this case, days late is calculated as today’s date minus milestone finish date.
If there is no baseline, then days late is calculated if the milestone is not completed and it was due before today’s date. In this case, days late is calculated as today’s date minus milestone finish date.
The following fields are available for this portlet and you can add them through the configure option:
See the Personalizing CA Clarity User Guide for more information.
Start
Displays the milestone start date.
Baseline Start
Displays the milestone baseline start date.
Baseline Finish
Displays the milestone baseline finish date.
Days Late %
Displays days late as a percentage of the summary task or project timeframe, which is finish date minus start date. If the milestone has a parent task in the WBS, then the parent task timeframe is used in the calculation. If the milestone is at the top level of the WBS and does not have a parent task, then the project timeframe is used in the calculation. The calculation takes into account the milestone status and baseline (if one exists).

PM Alerts
60 PMO Accelerator Product Guide
Schedule
Displays a stoplight indicating the number of days a milestone is late, considering the milestone status and whether or not a baseline exists for the milestone. The color of the stoplight indicates if the milestone is on schedule or late.
Stoplights:
■ Green. The milestone is ahead of schedule or on schedule.
■ Yellow. The milestone is between one and ten days late.
■ Red. The milestone is more than ten days late.
■ White. The schedule is undefined.
Current Issues Portlet
The Current Issues portlet displays issues within the days outlook, grouped by priority across projects. Issues are not included in this portlet if their status is “Resolved” or “Closed”.
Data is displayed as a pie chart. Each pie segment reflects the number of issues by priority, giving an overall view of a project status in terms of issues raised. Click a pie slice to open the details of the issue on the Current Issues Drill Down (see page 60) page. The Current Issues Listing portlet on this page displays details about issues within the days outlook range.
Current Issues Drill Down Page
The current issues drill down page includes the Current Issues Listing portlet. Use this portlet to assess the priority and schedule of the issues and decide on action plans to resolve them. Issues are not included in this portlet if their status is “Resolved” or “Closed”.
To view the current issues drill down page, click a pie slice in the Current Issues portlet (see page 60).
The following columns display on the Current Issues Listing portlet:
Properties Icon
Displays an icon that links to the properties page of the project.
Project
Displays the name of the project. Click a project name link to go to the project dashboard.
Issue
Displays the name of the issue.

PM Alerts
Chapter 4: General Pages and Portlets 61
Description
Displays the description of the issue.
Priority
Displays a stoplight that indicates the priority of the issue.
Stoplights:
■ Green. The issue priority is low.
■ Yellow. The issue priority is medium.
■ Red. The issue priority is high.
Schedule
Displays a stoplight for the schedule, which is a days late calculation. The schedule stoplight is calculated as today’s date minus the issue target resolution date. A positive number indicates that the issue target resolution date is late according to today’s date. A negative number indicates that it is early according to today’s date. The color of the stoplight indicates if the issue is on schedule or late.
Values:
■ Green. The target resolution is on schedule.
■ Yellow. The target resolution is one or two days late.
■ Red. The target resolution is late by more than two days.
■ White. The target resolution date is undefined.
Target Resolution
Displays the target resolution date of the issue.
Category
Displays the category assigned to the issue.
Values: Flexibility, Funding, Human Interface, Implementation, Interdependencies, Objectives, Organizational Culture, Resource Availability, Sponsorship, Supportability, or Technical.
Owner
Displays the name of the owner of the issue.

PM Alerts
62 PMO Accelerator Product Guide
Displays an email icon. Click this icon to send an email to the issue owner.
The following fields are available for this portlet and you can add them through the configure option:
See the Personalizing CA Clarity User Guide for more information.
Created By
Displays the name of the resource that created the issue.
Created Date
Displays the date when the issue was created.
Issue ID
Displays the Issue ID, which is the identifier of the issue.
Last Updated By
Displays the name of the resource who last updated the issue.
Last Updated Date
Displays the date when the issue was last updated.
Priority Name
Displays the priority as text instead of as a stoplight.
Values: High, Medium, Low
Resolution
Displays the final resolution of the issue.
Resolved Date
Displays the date when the issue was resolved.
Status
Displays the status of the issue.

PM Alerts
Chapter 4: General Pages and Portlets 63
Staffing Portlet
The Staffing portlet lets you identify projects where resources are not assigned to tasks within the days outlook. The portlet displays in a bar chart format the unstaffed ETC hours, which are hours assigned to a role instead of a resource. The Y-axis of the chart displays project names. The X-axis displays the number of hours assigned to roles instead of resources for each project.
Summary tasks and milestones are not included in this portlet. Also, tasks with a status of "Completed" are not included in this portlet.
The portlet helps you identify projects with tasks where resources are not assigned. You can analyze the results and replace roles with resources that can complete the work. Click a bar on the graph to go to the Staffing Outlook Drill Down page (see page 63). The Staffing Details portlet displays on this page.
Staffing Outlook Drill Down Page
The Staffing Outlook Drill Down page includes the Staffing Details portlet. Use the portlet to view a list of unstaffed tasks for the selected project.
To view this portlet, click a bar on the chart on the Staffing portlet (see page 63).
The Staffing Details portlet includes the following columns:
Properties icon
Displays an icon that links to the properties page of the project.
Project
Display the project name. Click a project name to go to the project dashboard.
Task
Displays the name of the task. Click a task name to view the task properties.
Team
Displays the Resources icon. Click the icon to go to the project team staff page and assign resources to the unstaffed roles.
Unstaffed Role
Displays the role name that is unstaffed. Click the role link to open the role properties page.
Assignment Start
Displays the start date of the assignment for the task.
Assignment Finish
Displays the finish date of the assignment for the task.

Project Dashboard
64 PMO Accelerator Product Guide
ETC
Displays the unstaffed ETC hours for the assignment.
Gantt Schedule
Displays a Gantt chart indicating when the assignment starts and finishes.
The following field is available for this portlet that you can add them through the configure option:
See the Personalizing CA Clarity User Guide for more information.
Project ID
Displays the Project ID, which is the identifier of the project.
Project Dashboard
The overview project dashboard page lists projects as a hierarchy. The hierarchy allows you to drill from a project through its work breakdown structure to the lowest level of resource assignments. The hierarchy also includes the ability to drill through subprojects. The dashboard provides more visibility and control into project governance through the use of project schedule, cost, and effort metrics.
See the Project Management User Guide for more information.
This project dashboard overview page consists of the following portlets:
■ Project Manager Schedule Dashboard Portlet (see page 65)
■ Project Manager Cost and Effort Dashboard Portlet (see page 69)
Follow these steps:
1. Open Home, and from Personal, click General.
The overview general page appears.
2. Click Project Dashboard.
The overview project dashboard page appears.
Use the page-level filter to filter all portlets at once by OBS and project manager.

Project Dashboard
Chapter 4: General Pages and Portlets 65
Project Manager Schedule Dashboard Portlet
The Project Manager Schedule Dashboard portlet displays project schedule performance and a Gantt. You can filter the results by the projects you manage or list all projects you have access to, including subprojects. Subprojects are always included under their master projects, but you can also display the subprojects in the top level of the portlet list. Displaying subprojects in the top level lets you filter on subprojects, using the filter options available in the portlet. For this reason, there is a Show Subprojects in List filter option of Yes that allows you to include Subprojects in the top level of the portlet list.
By default, this filter option is set to No, which means subprojects are not displayed in the top level of the portlet list.
The following fields display on the portlet:
Project/WBS/Resource
Displays the name of the project, WBS element, or resource. Click a Project/WBS/Resource link to open the properties page of the project, WBS element, or resource.
Subprojects Icon
Displays an icon that indicates the project is a subproject and links to the properties page of the subproject. The column heading is not displayed for this column to minimize the width.
Start
Displays the start date of the project, task, or assignment.
Finish
Displays the finish date of the project, task, or assignment.

Project Dashboard
66 PMO Accelerator Product Guide
Schedule %
Displays the following:
■ Project calculation. Displays a stoplight indicating days late as a percentage of the project timeframe, which is finish date minus start date. The calculation takes into account the project progress and baseline (if a baseline exists). The color of the stoplight indicates if the project is on schedule or late.
■ Task calculation. Displays a stoplight indicating days late as a percentage of the summary task or project timeframe, which is finish date minus start date. If the task has a parent task in the WBS, then the parent task timeframe is used in the calculation. If the task is at the top level of the WBS and does not have a parent task, then the project timeframe is used in the calculation.
The task calculation takes into account the task status and baseline (if a baseline exists). The color of the stoplight indicates if the task is on schedule or late.
There is no calculation for resource assignments so the schedule % will display as a white stoplight.
Stoplights:
■ Green. The project or task is ahead of schedule or on schedule.
■ Yellow. The project or task is between one and ten percent late.
■ Red. The project or task is more than ten percent late.
■ White. The schedule percentage is undefined.
Days Late
Displays the number of days late considering the following:
■ Whether or not a baseline exists
■ Project progress or task status
If a baseline exists, then days late is calculated as project or task finish date minus baseline finish date. A positive number indicates that the project or task is late according to the baseline. A negative number indicates that it is early according to the baseline.
If a baseline exists and the project or task finish date is the same as the baseline finish date, then the project or task is considered late if it is not completed and it was due before today’s date. In this case, days late is calculated as today’s date minus project or task finish date.
If there is no baseline, then days late is calculated if the project or task is not completed and it was due before today’s date. In this case, days late is calculated as today’s date minus project or task finish date.
There is no calculation for resource assignments so the days late will not be populated.

Project Dashboard
Chapter 4: General Pages and Portlets 67
Gantt Schedule
Displays a Gantt chart that shows the start and finish dates of the projects, subprojects, WBS elements, and assignments. The color of the Gantt bars is based on the schedule percentage as follows:
■ Green. The project or task is ahead of schedule or on schedule.
■ Yellow. The project or task is between one and ten percent late.
■ Red. The project or task is more than ten percent late.
■ White. The schedule percentage is undefined.
The Project Manager Schedule Dashboard and the Project Manager Cost and Effort Dashboard (see page 69) are based on the same query. Hence, you can configure fields from either portlet to appear on the other portlet.
See the Personalizing CA Clarity User Guide for more information.
In addition, the following fields are available for you to add through the configure option:
% Complete
Defines the percentage of work completed on the project or task.
Sources:
■ Schedule & Performance properties page of the project.
■ General properties page of the task.
Baseline Start
Displays the baseline start date of the project, task, or assignment.
Baseline Finish
Displays the baseline finish date of the project, task, or assignment.
Charge Code
Displays the charge code of the project or task.
Sources:
■ Settings properties page of the project.
■ Settings properties page of the task.
Dashboard Icon
Displays a dashboard icon. Click the icon link to open the project dashboard.

Project Dashboard
68 PMO Accelerator Product Guide
Days Late %
Displays the following:
■ Project Calculation. Displays days late as a percentage of the project timeframe, which is finish date minus start date. The calculation takes into account the project progress and baseline (if a baseline exists).
■ Task Calculation. Displays days late as a percentage of the summary task or project timeframe, which is finish date minus start date. If the task has a parent task in the WBS, then the parent task timeframe is used in the calculation. If the task is at the top level of the WBS and does not have a parent task, then the project timeframe is used in the calculation.
The task calculation takes into account the task status and baseline (if a baseline exists).
There is no calculation for resource assignments so the days late percentage will not be populated.
Schedule
Displays a stoplight indicating the number of days a project or task is late, considering the following:
■ Project progress or task status
■ Whether or not a baseline exists for the project or task.
The color of the stoplight indicates if the project or task is on schedule or late.
There is no calculation for resource assignments so the days late will not be populated.
Stoplights:
■ Green. The project or task is ahead of schedule or on schedule.
■ Yellow. The project or task is between one and ten days late.
■ Red. The project or task is more than ten days late.
■ White. The schedule is undefined.
ETC
Displays the system-calculated value of the estimated effort to complete the project or task.
Sources:
■ Schedule & Performance properties page of the project.
■ Performance properties page of the task.

Project Dashboard
Chapter 4: General Pages and Portlets 69
ETC Cost
Displays the system-calculated value of estimate to complete, which is the predicted cost of finishing the remaining work.
Sources:
■ Schedule & Performance properties page of the project.
■ Performance properties page of the task.
Open for Time Entry
Indicates if the project or task is open for time entry.
Project Manager
Displays the project manager of the project or subproject.
Project Progress or Task Status
Displays the project progress or task status.
Values: Not Started, Started, and Completed
Project Manager Cost and Effort Dashboard Portlet
The Project Manager Cost and Effort Dashboard displays project cost and effort performance amounts and variances. You can filter the results by the projects you manage or list all projects you have access to, including subprojects. Subprojects are always included under their master projects, but you can also display the subprojects in the top level of the portlet list. Displaying subprojects in the top level lets you filter on subprojects, using the filter options available in the portlet. For this reason, there is a Show Subprojects in List filter option of Yes that allows you to include Subprojects in the top level of the portlet list.
By default, this filter is set to No, which means subprojects will not display in the top level of the portlet list.
Milestones do not have hours or cost so there are no values for milestones in this portlet.
The following fields display on the portlet:
Project/WBS/Resource
Displays the name of the project, WBS, or resource. Click a Project/WBS/Resource link to open the properties page of the project, WBS element, or resource.

Project Dashboard
70 PMO Accelerator Product Guide
BAC Cost
Displays the system-calculated value of baseline at completion, which is the baseline cost at the time of the current baseline revision.
Sources:
■ Schedule & Performance properties page of the project.
■ Performance properties page of the task.
Actual Cost
Displays the system-calculated value of actual cost of work performed (ACWP), which is the total direct cost incurred in performing work based on posted actuals.
Sources:
■ Schedule & Performance properties page of the project.
■ Performance properties page of the task.
EAC Cost
Displays the system-calculated value of estimate at completion, which is the total cost of actual work completed to date and the predicted cost of finishing the remaining work.
Sources:
■ Schedule & Performance properties page of the project.
■ Performance properties page of the task.
Projected Cost Variance
Displays the variance between the estimated plus actual cost and the baseline cost.
Source: Schedule & Performance properties page of the project.
Formula: ((ETC Cost + Actual Cost (ACWP)) - BAC Cost)
Projected Cost Variance %
Displays a stoplight indicating the projected cost variance as a percentage of BAC cost.
Source: Schedule & Performance properties page of the project.
Formula: (((ETC Cost + Actual Cost (ACWP)) - BAC Cost) / BAC Cost) * 100
Stoplights:
■ Green. The EAC cost is less than or equal to the baseline.
■ Yellow. The EAC cost is between one and ten percent over baseline.
■ Red. The EAC cost is more than ten percent over baseline.
■ White. No baseline data exists

Project Dashboard
Chapter 4: General Pages and Portlets 71
BAC
Displays the system-calculated value of the baseline effort (actuals plus remaining ETC) at the time of the current baseline revision.
Sources:
■ Schedule & Performance properties page of the project.
■ Performance properties page of the task
Actuals
Displays the system-calculated value of the actual effort posted for the task in the project.
Sources:
■ Schedule & Performance properties page of the project
■ Performance properties page of the task
EAC
Displays the system-calculated value of the estimated effort at completion (actuals plus remaining ETC) of the project.
Sources:
■ Schedule & Performance properties page of the project
■ Performance properties page of the task
Projected Effort Variance
Displays the variance between EAC effort and baseline effort.
Source: Schedule & Performance properties page of the project.
Formula: (EAC Effort – BAC Effort)
Projected Effort Variance %
Displays a stoplight indicating the projected effort variance as a percentage of BAC effort.
Source: Schedule & Performance properties page of the project.
Formula: ((EAC Effort – BAC Effort) / BAC Effort) * 100
Stoplights:
■ Green. The EAC effort is less than or equal to the baseline.
■ Yellow. The EAC effort is between one and ten percent over the baseline.
■ Red. The EAC effort is more than ten percent over the baseline.
■ White. No baseline data exists.

Issues and Risks
72 PMO Accelerator Product Guide
The Project Manager Schedule Dashboard and the Project Manager Cost and Effort Dashboard are based on the same query. Several fields are available for both of these portlets that you can add through the configure option. You can configure the fields from either portlet to appear on the other portlet. For the complete list of fields that you can configure, see the Project Manager Schedule Dashboard portlet (see page 65) description.
Issues and Risks
The overview issues and risks page provides a place to manage all the issues and risks you track in CA Clarity PPM.
This page includes the following portlets:
■ Issue Management
■ Risk Management
Follow these steps:
1. Open the Home menu, and click General under Personal.
The overview general page appears.
2. Click Issues and Risks.
The overview issues and risks page appears.
Use the page-level filter to filter all portlets at once by OBS and project manager.
Issue Management Portlet
The Issue Management portlet displays a list of issues associated to projects you have access to. The portlet has a default filter set to limit the issues to only the issues with a status of “Open” or “Work in Progress”.
The following fields display on the portlet:
Properties icon
Displays an icon that links to the properties page of the project.
Project
Displays the project name. Click a project name link to go to the project dashboard.
Issue
Displays the name for the issue. Click an issue link to go to the issue properties page.

Issues and Risks
Chapter 4: General Pages and Portlets 73
Description
Displays the description of the issue.
Priority
Displays a stoplight indicating the priority of an issue.
Stoplights:
■ Green. The issue priority is low.
■ Yellow. The issue priority is medium.
■ Red. The issue priority is high.
Schedule
Displays a stoplight for the schedule, which is a days late calculation. The schedule stoplight is calculated as today’s date minus the issue target resolution date. A positive number indicates that the issue target resolution date is late according to today’s date. A negative number indicates that it is early according to today’s date. The color of the stoplight indicates if the issue is on schedule or late.
Values:
■ Green. The target resolution is on schedule.
■ Yellow. The target resolution is one or two days late.
■ Red. The target resolution is late by more than two days.
■ White. The target resolution date is undefined.
Target Resolution Date
Displays the target resolution date of the issue.
Category
Displays the category assigned to the issue.
Values: Flexibility, Funding, Human Interface, Implementation, Interdependencies, Objectives, Organizational Culture, Resource Availability, Sponsorship, Supportability, or Technical
Owner
Displays the name of the owner of this issue.
Displays an email icon. Click the icon to send an email to the issue owner.

Issues and Risks
74 PMO Accelerator Product Guide
The following fields are available for this portlet and you can add them through the configure option:
See the Personalizing CA Clarity User Guide for more information.
Created By
Displays the name of the resource who created the issue.
Created Date
Displays the date when the issue was created.
Issue ID
Displays the Issue ID, which is the identifier of the issue.
Last Updated
Displays the date when the issue was last updated.
Project ID
Displays the Project ID, which is the identifier of the project.
Resolution
Displays the final resolution details of the issue.
Resolved Date
Displays the date when the issue was resolved.
Status
Displays the status of the issue.
Updated By
Displays the name of the resource who last updated the issue.
Risk Management Portlet
The Risk Management portlet displays a list of risks associated with projects to which you have access. The portlet has a default filter set to limit the risks to only the risks with a status of "Open" or "Work in Progress".
The following fields display on the portlet:
Properties Icon
Displays an icon that links to the properties page of the project.
Project
Displays the project name. Click a project name link to go to the project dashboard.

Issues and Risks
Chapter 4: General Pages and Portlets 75
Risk
Displays the name of the risk. Click a risk link to go to the risk properties page.
Description
Displays the description of the risk.
Priority
Displays a stoplight indicating the priority of the risk.
Stoplights:
■ Green. The risk priority is low.
■ Yellow. The risk priority is medium.
■ Red. The risk priority is high.
Probability
Displays a stoplight indicating the probability of the risk occurrence.
Values:
■ Green. The probability of the risk occurring is low.
■ Yellow. The probability of the risk occurring is medium.
■ Red. The probability of the risk occurring is high.
■ White. The probability of the risk occurring is undefined.
Impact
Displays a stoplight indicating the risk impact.
Values:
■ Green. The risk impact is low.
■ Yellow. The risk impact is medium.
■ Red. The risk impact is high.
■ White. The risk impact is undefined.
Above Threshold
Displays a checkmark indicating that the calculated risk is greater than the system-level overall risk threshold. The CA Clarity PPM administrator defines the system-level overall risk threshold in the project management risk settings.
One of two indicators appear in the column:
■ Checkmark Icon. The calculated risk is greater than or equal to the system-level overall risk threshold.
■ No Icon. The risk score is less than the system-level overall risk threshold.

Issues and Risks
76 PMO Accelerator Product Guide
Target Resolution Date
Displays the target resolution date of the risk.
Category
Displays the category assigned to the risk.
Values: Flexibility, Funding, Human Interface, Implementation, Interdependencies, Objectives, Organizational Culture, Resource Availability, Sponsorship, Supportability, or Technical.
Owner
Displays the name of the owner of the risk.
Displays an email icon. Click this icon to send an email to the risk owner.
The following fields are available for this portlet and you can add them through the configure option:
See the Personalizing CA Clarity User Guide for more information.
Assumptions
Defines the assumptions in determining that this item is a risk. You can verify these assumptions to help ensure that they stay valid though the life of the risk. If the assumptions change, the impact or probability of the risk may also change.
Calculated Risk
Displays the score calculated based on the selections you make in the Probability and Impact fields on the risk properties.
Date Last Updated
Displays the date when the risk was last updated.
Impact Date
Defines the date by which repercussions from this risk can start affecting the project.
Impact Description
Defines the impact the risk has on the project.
Project ID
Displays the project ID, which is the identifier of the project.
Resolution
Displays the final resolution of the risk.

Issues and Risks
Chapter 4: General Pages and Portlets 77
Resolved Date
Displays the date when the risk was resolved.
Response Type
Defines the type of response you want to make with this risk.
Risk ID
Displays the Risk ID, which is the identifier of the risk.
Risk Symptoms
Defines the symptoms that identify this item as a risk.
Status
Displays the risk status.
Updated By
Displays the name of the resource who last updated the risk.


Chapter 5: Portfolio Pages and Portlets 79
Chapter 5: Portfolio Pages and Portlets
This section contains the following topics:
About the Dashboard View (see page 79) PMO Portfolio Layout Page (see page 80) Scorecard Tab (see page 80) Comparison Tab (see page 87) Capacity Tab (see page 91) Resources Tab (see page 94) Financials Tab (see page 97) Performance Tab (see page 105)
About the Dashboard View
You can select the following dashboard view or page layout from the Settings properties page of a portfolio.
■ PMO Portfolio Layout Page (see page 80)
The PMO Portfolio Layout provides a series of tabs with portlets on each tab that you can use to plan and monitor the execution of your portfolio.
To select a dashboard view
1. Open Home, and from Portfolio Management, click Portfolios.
The list page appears.
2. Open the portfolio by click the properties icon.
The properties page appears.
3. Open the Properties menu and select Settings.
The settings page appears.
4. Click the Dashboard View drop-down menu and select a view.
5. Save your view and click Scorecard.

PMO Portfolio Layout Page
80 PMO Accelerator Product Guide
PMO Portfolio Layout Page
Use the PMO Portfolio Layout page to view a series of tabs with portlets that you can use to plan and monitor the execution of your portfolio. This dashboard view includes comparison portlets ranking investments by priority, investment schedules compared to capacity and demand across those investments, and performance of the investments. This page includes the following tabs:
■ Scorecard Tab (see page 80)
■ Comparison Tab (see page 87)
■ Capacity Tab (see page 91)
■ Resources Tab (see page 94)
■ Financials Tab (see page 97)
■ Performance Tab (see page 105)
Scorecard Tab
Having added your organization's investments as contents to your portfolio, examine your portfolio and evaluate its performance. Portfolio planning and analysis occurs within the time window of the start and finish date of the portfolio. This is referred to as the portfolio planning horizon. The amounts displayed in the portfolio portlets are restricted to the portfolio planning horizon.
Use the portlets on the scorecard tab to view alignment and schedule of investments in a bubble graph and to see a list of investments included in the portfolio. In addition, you can create scenarios to perform what-if analysis in the portfolio with your mix of investments. Each portlet helps support the decision-making process to approve, reject, postpone, add, or remove investments from the portfolio.
See the Portfolio Management User Guide for more information.
This scorecard tab consists of the following portlets:
■ Balance Portlet (see page 81)
■ Investments Portlet (see page 82)
■ Financials Portlet (see page 84)

Scorecard Tab
Chapter 5: Portfolio Pages and Portlets 81
Follow these steps:
1. Open Home, and from Portfolio Management, click Portfolios.
The list page appears.
2. Click a portfolio link.
The portfolio scorecard appears.
Use the page-level filter to filter all portlets at once by scenario, compare to scenario, status, roles and booking status. When comparing scenarios, red-lined values indicate differences in values between scenarios.
By default, investments shown in the portlets represent approved investments in the portfolio. To view unapproved or all investments, select the status from the Status drop-down on the portfolio page-level filter.
Balance Portlet
The Balance portlet is a bubble graph that displays how the planned cost and risk of investments balance between their business alignment and finish dates. Each bubble on the graph represents an investment and the size of the bubble is determined by the planned cost of the investment.
The portfolio investments are scored on the following factors:
■ Business Alignment
■ Risk
■ Planned Cost
To view this portlet, open a portfolio and click Scorecard.
The following describes the portlet:
Bubble Graph
You can click a bubble to open the properties page of the investment. You can also mouse over a bubble in the graph to display details of each investment. The details include the name of the investment, start date, business alignment score, and planned cost. The graph legend indicates the color grouping of the bubbles by risk. Click a legend entry to exclude that group from the graph.
X-axis and Y-axis
Values for business alignment display on the Y-axis, with a background zone color on the graph. Values for investment finish dates display on the X-axis.

Scorecard Tab
82 PMO Accelerator Product Guide
Business Alignment
Displays how well the investment aligns to the organization business goal. Investments appear on the graph somewhere between good and poor alignment. Investments with a high alignment scores will be in the green zone of the graph, which is the upper third of the y-axis. Investments with low alignment scores will appear in the red zone of the graph, which is the lower third of the y-axis.
Values:
■ Green (68 through 100). The investment has good alignment with the business.
■ Yellow (34 through 67). The investment has average alignment with the business.
■ Red (0 through 33). The investment has poor alignment with the business.
Risk
Displays the risk score for an investment. The investment risk score determines the color of the bubble:
Values:
■ Green (0 through 33). The project is low risk.
■ Yellow (34 through 67).The project is medium risk.
■ Red (68 through 100). The project is high risk.
This portlet is based on the Portfolio: All Investment Types system provider. Fields included in the system provider are available to this portlet and may be added through the configure option.
Investments Portlet
The Investments portlet displays information about investments included in a portfolio. Use this portlet to view the stage, alignment, risk, cost, and role demand of the investments in the portfolio.
To view this portlet, open a portfolio and click Scorecard. If the page is maximized to display only one portlet at a time, select Investments from the maximized portlet drop-down.
The following fields display on the portlet:
Investment
Displays the name of the investment. Click an investment name to view the detailed properties for that investment.
Hierarchy Icon
Click the icon to open the hierarchy page for that investment and view the child investments.

Scorecard Tab
Chapter 5: Portfolio Pages and Portlets 83
Grid with Plus Icon
Click this icon to open the create scenario page to add a scenario. If you select a scenario in the portfolio page level filter and you edit an investment in the scenario, the Grid with Plus icon will change to a Grid with Checkmark icon. This change indicates that the investment has been modified within the scenario selected.
Goal
Displays the goal of the investment.
Values: Cost Avoidance, Cost Reduction, Grow the Business, Infrastructure Improvement, or Maintain the Business.
Stage
Displays the stage in of the investment lifecycle as a progress bar. The gray squares indicate completed stages and the current stage is represented as a color, based on the Business Alignment of the investment.
Business Alignment
Displays how well the investment aligns to the organization business goal. The higher the business alignment value is, the stronger the alignment.
Stoplights:
■ Green (68 through 100). The investment has good alignment with the business.
■ Yellow (34 through 67). The investment has average alignment with the business.
■ Red (0 through 33). The investment has poor alignment with the business.
■ White. The alignment data is undefined.
Risk
Displays a stoplight based on the investment risk score. The investment risk score determines the color of the stoplight.
Stoplights:
■ Green (0 through 33). The investment is low risk.
■ Yellow (34 through 67). The investment is medium risk.
■ Red (68 through 100). The investment is high risk.
Start
Displays the start date of the investment.
Planned Cost
Displays the planned cost of the investment.
Actual Cost
Displays the actual cost posted to the investment.
Scorecard Tab
84 PMO Accelerator Product Guide
Remaining Cost
Displays the difference between the planned cost and the actual cost.
Role Allocation Demand
Displays the role allocation demand from the investment team for resources with a role included in the portfolio contents and for roles included in the portfolio contents.
Role Actuals
Displays the actual effort posted to the investment for resources with a role included in the portfolio contents.
Remaining Role Allocation
Displays the difference between role allocation demand and role actuals.
The following aggregate amounts are provided for the portfolio at the bottom of the portlet:
Investment Total
Displays the total planned cost, actual cost, remaining cost, role allocation demand, role actuals, and remaining role allocation for investments in the portfolio.
Portfolio Comparison
Displays the portfolio planned cost, from the portfolio properties page, below the planned cost column of the portlet. If a scenario is selected in the portfolio page-level filter, then it displays the scenario planned cost amount.
Displays the total portfolio role capacity, from the portfolio contents, below the role allocation demand column of the portlet. If a scenario is selected in the portfolio page-level filter, then it displays the scenario role capacity.
Variance
Displays the difference between the portfolio comparison and investment total values. A negative variance value indicates the investment totals exceed the portfolio amounts.
This portlet is based on the Portfolio: All Investment Types system provider. Fields included in the system provider are available to this portlet and may be added through the configure option.
Financials Portlet
The Financials portlet displays financial information about investments included in a portfolio. Use this portlet to view the planned benefit, planned cost, actual cost, planned ROI, planned IRR, and planned payback period of the investments in the portfolio.

Scorecard Tab
Chapter 5: Portfolio Pages and Portlets 85
To view this portlet, open a portfolio and click Scorecard. If the page is maximized to display only one portlet at a time, select Financials from the maximized portlet drop-down.
The following fields display on the portlet:
Investment
Displays the name of the investment. Click an investment name to view the detailed properties for that investment.
Hierarchy Icon
Click the icon to open the hierarchy page for that investment and view the child investments.
Grid with Plus Icon
Click this icon to open the create scenario page to add a scenario. If you select a scenario in the portfolio page level filter and you edit an investment in the scenario, the Grid with Plus icon will change to a Grid with Checkmark icon. This change indicates that the investment has been modified within the scenario selected.
Planned Benefit
Displays the total planned benefit for the investment.
Source: Financial Summary properties page of the investment.
Planned Cost
Displays the planned cost of the investment.
Source: Financial Summary properties page of the investment.
Actual Cost
Displays the actual cost posted to the investment.
Remaining Cost
Displays the difference between the planned cost and the actual cost.
Planned NPV
Displays the net present value of the investment by calculating the total cost of capital and a series of future payments and income.
Source: Financial Summary properties page of the investment.
Planned ROI
Displays the ratio of money gained or lost on this investment relative to the amount of money invested.
Source: Financial Summary properties page of the investment.

Scorecard Tab
86 PMO Accelerator Product Guide
Planned IRR
Displays the Internal Rate of Return or the discount rate used to achieve zero NPV for an investment.
Source: Financial Summary properties page of the investment.
Planned MIRR
Displays the Modified Internal Rate of Return or the rate used to measure the attractiveness of the investment.
Source: Financial summary page of the investment.
Planned Payback
Displays the number of periods (in months) needed for the sum of the expected cash flows to equal the initial cash outlay for the investment.
Source: Financial Summary properties page of the investment.
Planned Breakeven
Displays the date when the expected cash flow equals the cash outlay for the investment. The breakeven date matches with the payback period.
Source: Financial Summary properties page of the investment.
The following aggregate amounts are provided for the portfolio at the bottom of the portlet:
Investment Total
Displays the total planned benefit, planned cost, actual cost, remaining cost, and planned NPV for investments in the portfolio.
Portfolio Comparison
Displays the portfolio planned benefit and cost, from the portfolio properties page, below the planned benefit and cost columns of the portlet. If a scenario is selected in the portfolio page-level filter, then it displays the scenario planned benefit and cost amounts.
Variance
Displays the difference between the portfolio comparison and investment total values. A negative variance value indicates the investment totals exceed the portfolio amounts.
This portlet is based on the Portfolio: All Investment Types system provider. Fields included in the system provider are available to this portlet and may be added through the configure option.
Comparison Tab
Chapter 5: Portfolio Pages and Portlets 87
Comparison Tab
Use the portlets on the comparison tab to compare two scenarios in a side-by-side visualization. You can also compare one scenario to the plan of record in the same side-by-side comparison. You can analyze the scenarios and evaluate trade-offs before selecting a specific course. You can also do what-if analysis and investigate the changes you can make to the investments contained within your portfolio.
The tab initially displays only the base scenario portlets until you select two scenarios to compare in the portfolio page level-filter. If you select a scenario and a compare to scenario in the portfolio page-level filter and click the filter button, you will see four portlets on the tab. The [--Base Scenario--] portlets show the scenario results and the [--Compare To Scenario--] portlets show the compare to scenario results.
See the Portfolio Management User Guide for more information.
The comparison tab consists of the following portlets:
■ Prioritization of Investments Portlet (see page 88)
■ Resource Demand on Investments Portlet (see page 89)
Follow these steps:
1. Open Home, and from Portfolio Management, click Portfolios.
The list page appears.
2. Click a portfolio link.
The portfolio scorecard tab appears.
3. Click Comparison.
The portfolio comparison tab appears.
Use the page-level filter to filter all portlets at once by scenario, compare to scenario, status, roles, and booking status.
By default, investments shown in the portlets represent approved investments in the portfolio. To view unapproved or all investments, select the status from the Status drop-down on the portfolio page-level filter.

Comparison Tab
88 PMO Accelerator Product Guide
Prioritization of Investments Portlet
The Prioritization of Investments portlet is a bubble graph that displays how the planned cost and risk of investments balance between their priority and finish dates. Each bubble on the graph represents an investment and the size of the bubble is determined by the planned cost of the investment.
By default, the comparison tab displays only the Prioritization of Investments [--Base Scenario--] portlet. You can select a scenario from the portfolio toolbar and compare it to the plan of record or to another scenario. When you compare scenarios, the Prioritization of Investments [--Compare To Scenario--] portlet also displays.
The following describes the portlet:
Bubble Graph
You can click a bubble to open the properties page of the investment. You can also mouse over a bubble in the graph to display details of each investment. The details include the name of the investment, start date, priority, and planned cost. The graph legend indicates the color grouping of the bubbles by risk. Click a legend entry to exclude that group from the graph.
X-axis and Y-axis
Values for priority display on the Y-axis, with a background zone color on the graph. Values for investment finish dates display on the X-axis.
The following describes the priority and risk:
Priority
Displays the priority of an investment. Investments appear on the graph somewhere between high and low priority. Investments with a high priority will be in the red zone of the graph. Investments with low priority will appear in the green zone of the graph.
Values:
■ Green (24 through 36). The investment is low priority.
■ Yellow (12 through 23).The investment is medium priority.
■ Red (0 through 11). The investment is high priority.

Comparison Tab
Chapter 5: Portfolio Pages and Portlets 89
Risk
Displays the risk score for an investment. The investment risk score determines the color of the bubble:
Values:
■ Green (0 through 33). The project is low risk.
■ Yellow (34 through 67).The project is medium risk.
■ Red (68 through 100). The project is high risk.
This portlet is based on the Portfolio: All Investment Types system provider. Fields included in the system provider are available to this portlet and may be added through the configure option.
Resource Demand on Investments Portlet
The Resource Demand on Investments portlet displays priority, planned cost, and resource demand information for investments included in the portfolio.
By default, the comparison tab displays only the Resource Demand on Investments [--Base Scenario--] portlet. You can select a scenario from the portfolio toolbar and compare it to the plan of record or to another scenario. When you compare scenarios, the Resource Demand on Investments [--Compare To Scenario--] portlet also displays.
The following fields appear on the portlet:
Investment
Displays the name of the investment. Click an investment name to view the detailed properties for that investment.
Grid with Plus Icon
Click this icon to open the create scenario page to add a scenario. If you select a scenario in the portfolio page level filter and you edit an investment in the scenario, the Grid with Plus icon will change to a Grid with Checkmark icon. This change indicates that the investment has been modified within the scenario selected.
Priority
Displays a value and stoplight based on the investment priority. The investment priority determines the color of the stoplight.
Stoplights:
■ Green (24 through 36). The investment is low priority.
■ Yellow (12 through 23). The investment is medium priority.
■ Red (0 through 11). The investment is high priority.

Comparison Tab
90 PMO Accelerator Product Guide
Start
Displays the investment start date.
Finish
Displays the investment finish date.
Planned Cost
Displays the planned cost of the investment.
Role Demand
Displays the role allocation demand from the investment team for resources with a role included in the portfolio contents and for roles included in the portfolio contents.
The following aggregate amounts are provided for the portfolio at the bottom of the portlet:
Investment Total
Displays the total planned cost and role demand for investments in the portfolio.
Portfolio Comparison
Displays the portfolio planned cost, from the portfolio properties page, below the planned cost column of the portlet. If a scenario is selected in the portfolio page-level filter, it displays the scenario planned cost amount.
Displays the total portfolio role capacity, from the portfolio contents, below the role demand column of the portlet. If a scenario is selected in the portfolio page-level filter, it displays the scenario role capacity.
Variance
Displays the difference between the portfolio comparison and investment total values. A negative variance value indicates the investment totals exceed the portfolio amounts.
This portlet is based on the Portfolio: All Investment Types system provider. Fields included in the system provider are available to this portlet and may be added through the configure option.

Capacity Tab
Chapter 5: Portfolio Pages and Portlets 91
Capacity Tab
Use the portlets on the Capacity tab to view the investment Gantt schedule on the top of the page. You can also view demand, which is grouped by role, for the investments on the bottom of the page. The role demand of the investments is compared to the role capacity of the portfolio or scenario.
This capacity tab consists of the following portlets:
■ Investment Gantt Portlet (see page 91)
■ Portfolio Role Capacity and Demand Portlet (see page 93)
Follow these steps:
1. Open Home, and from Portfolio Management, click Portfolios.
The list page appears.
2. Click a portfolio link.
The portfolio scorecard tab appears.
3. Click Capacity
The portfolio capacity tab appears.
Use the page-level filter to filter all portlets at once by scenario, compare to scenario, status, roles, and booking status. When comparing scenarios, red-lined values indicate differences in values between scenarios.
By default, investments shown in the portlets represent approved investments in the portfolio. To view unapproved or all investments, select the status from the Status drop-down on the portfolio page-level filter.
See the Portfolio Management User Guide for more information.
Investment Gantt Portlet
The Investment Gantt portlet displays the schedule, allocation demand, and planned cost for each investment included in a portfolio. Use this portlet to view the list of portfolio investments and compare their schedules.
To view this portlet, open a portfolio and click Capacity.
The portlet displays the following fields:
Investment
Displays the name of the investment. Click an investment name to view the detailed properties for that investment.

Capacity Tab
92 PMO Accelerator Product Guide
Grid with Plus Icon
Click this icon to open the create scenario page to add a scenario. If you select a scenario in the portfolio page level filter and you edit an investment in the scenario, then the Grid with Plus icon will change to a Grid with Checkmark icon. This change indicates that the investment has been modified within the scenario selected.
Approved
Displays a checkmark if the status of the investment is "Approved."
Start
Displays the start date of the investment.
Planned Cost
Displays the planned cost of the investment.
Role Demand
Displays the role allocation demand from the investment team for resources with a role and for roles included in the portfolio contents.
Gantt
Displays the investment schedules.
The following aggregates are provided for the investments at the bottom of the page:
Investment Total
Displays the total planned cost and role demand for investments in the portfolio.
Portfolio Comparison
Displays the portfolio planned cost, from the portfolio properties page, below the planned cost column of the portlet. If a scenario is selected in the portfolio page-level filter, then it displays the scenario planned cost amount.
Displays the total portfolio role capacity, from the portfolio contents, below the role demand column of the portlet. If a scenario is selected in the portfolio page-level filter, then it displays the scenario role capacity.
Variance
Displays the difference between the investment total and the portfolio comparison values. A negative variance value indicates that the investment totals exceed the portfolio amounts.
This portlet is based on the Portfolio: All Investment Types system provider. Fields included in the system provider are available to this portlet and you can add them using the configure option.

Capacity Tab
Chapter 5: Portfolio Pages and Portlets 93
Portfolio Role Capacity and Demand Portlet
The Portfolio Role Capacity and Demand portlet displays a histogram by month. The histogram displays the resource and role allocation demand, grouped by investment role, for the portfolio investments and the portfolio role capacity threshold on a monthly basis. The yellow columns represent the demand for a role in the portfolio investments. The red columns represent the amount that exceeds the portfolio role capacity threshold.
If you prefer to view the portlet as numeric values instead of a histogram, you can configure the portlet to display numeric values for Capacity, Demand, and Variance. With this configuration, redlining can work for scenario comparisons as it does on the Resources tab.
The amounts in the portlet tab display in hours or FTE determined by the Capacity Unit Type field on the portfolio properties.
To view this portlet, open a portfolio and click Capacity.
Note: This portlet honors the planning horizon of the portfolio; therefore, the monthly periods in the portlet are within the portfolio start and finish dates. Also, this portlet does not display aggregate hierarchical allocation demand. The portlet only displays the allocation demand of the investments directly included in the portfolio and does not calculate the aggregate demand of any child investments.
The portlet displays the following fields:
Role
Displays the roles included in the portfolio contents that are also allocated to portfolio investments. Resources and roles allocated to investments are grouped by investment role to determine the demand in this portlet. Click a role to view the role allocations page. This is not meant to be a drill-down to display the details of the portfolio demand because the role allocations page only displays role allocations, not resource allocations, and it does not filter by the portfolio contents. If you want to view the details of the portfolio demand, refer to the portlets on the Resources tab in the portfolio.
Demand/Capacity (by Month)
Displays the demand/capacity histogram by investment role for investments in a portfolio.
The following portfolio aggregates appear at the bottom of the portlet:
Investment Demand
Displays the total role demand by month for the investments contained in the portfolio.

Resources Tab
94 PMO Accelerator Product Guide
Portfolio Average Capacity
Displays the portfolio role capacity as an average by month.
Portfolio Remaining Capacity
Displays the difference between the portfolio average capacity and investment demand. A negative variance value indicates that the investment demand exceeds the portfolio average capacity.
Resources Tab
Use the portlets on the Resources tab to view resource allocation for the portfolio investments and compare it to the resource capacity.
The Resources tab includes the following portlets:
■ Resource Allocation Portlet (see page 95)
■ Resource Capacity and Allocation Portlet (see page 96)
Follow these steps:
1. Open Home, and from Portfolio Management, click Portfolios.
The list page appears.
2. Click a portfolio link.
The portfolio scorecard tab appears.
3. Click Resources.
The portfolio resources tab appears.
Use the page-level filter to filter all portlets at once by scenario, compare to scenario, unstaffed roles, overallocated resources, status, roles, and booking status. When comparing scenarios, red-lined values indicate differences in values between scenarios.
By default, investments shown in the portlets represent approved investments in the portfolio. To include unapproved or all investments, select the status from the Status drop-down on the portfolio page-level filter.
See the Portfolio Management User Guide for more information.

Resources Tab
Chapter 5: Portfolio Pages and Portlets 95
Resource Allocation Portlet
The Resource Allocation portlet displays resource allocation by month, for investments and roles included in a portfolio. Use this portlet to view the list of resources and roles that are allocated to the portfolio investments. You can compare scenarios in the page level filter, and the portlet redlines any amounts modified.
The amounts in the portlet can display in hours or FTE determined by the Capacity Unit Type field on the portfolio properties.
To view this portlet, open the portfolio and click Resources. If the page is maximized to display only one portlet at a time, select Resource Allocation from the portlet drop-down.
Note: This portlet honors the planning horizon of the portfolio; therefore, the monthly periods in the portlet are within the portfolio start and finish dates. Also, this portlet does not display aggregate hierarchical allocation demand. The portlet only displays the allocation demand of the investments directly included in the portfolio and does not calculate the aggregate demand of any child investments.
The portlet includes the following fields:
Resource
Displays the name of the resource or role that is allocated to the portfolio investments. Click the resource or role name to view the Resource/Role Allocations page. This is not meant to be a drill-down to display the details of the portfolio demand because this page does not filter by the portfolio contents. This page does give you visibility to the investment allocations of the resource or role so you can edit the plan of record or the scenario.
Role
Displays the investment role of the resource or role that is allocated to the portfolio investments.
Allocation (by Month)
Displays the allocation demand on portfolio investments for each resource or role by month.

Resources Tab
96 PMO Accelerator Product Guide
Resource Capacity and Allocation Portlet
The Resource Capacity and Allocation portlet displays resource capacity, allocation demand, and variance by month for investments and roles included in a portfolio. Use this portlet to view the list of resources and roles that are allocated to the portfolio investments and identify over-allocated and under-allocated resources. You can compare scenarios in the page level filter, and the portlet redlines any amounts modified.
The amounts in the portlet can display in hours or FTE determined by the Capacity Unit Type field on the portfolio properties. The capacity in the portlet is actual capacity, not portfolio capacity, and is displayed for resources only. Roles do not have capacity in CA Clarity PPM. In the page level filter, if you set Unstaffed to “No”, then the portlet displays resources only. This allows you to analyze over-allocated resources without including roles which are all over-allocated because they do not have capacity. The reason roles are displayed in the portlet is because they contribute to the allocation demand on investments and including them allows you to view the allocation demand in total for a particular role.
To view this portlet, open the portfolio and click Resources. If the page is maximized to display only one portlet at a time, select Resource Capacity and Allocation from the portlet drop-down.
You can configure Variance to display as a stoplight with the following colors:
■ Green. Allocation does not exceed capacity.
■ Red. Allocation exceeds capacity.
Note: This portlet honors the planning horizon of the portfolio; therefore, the monthly periods in the portlet are within the portfolio start and finish dates. Also, this portlet does not display aggregate hierarchical allocation demand. The portlet only displays the allocation demand of the investments directly included in the portfolio and does not calculate the aggregate demand of any child investments.
The portlet includes the following fields:
Resource
Displays the name of the resource or role that is allocated to the portfolio investments. Click the resource or role name to view the Resource/Role Allocations page. This is not meant to be a drill-down to display the details of the portfolio demand because this page does not filter by the portfolio contents. This page gives you visibility to the investment allocations of the resource or role so you can edit the plan of record or the scenario.
Role
Displays the investment role of the resource or role that is allocated to the portfolio investments.

Financials Tab
Chapter 5: Portfolio Pages and Portlets 97
Capacity (by Month)
Displays the capacity of each resource that is allocated to portfolio investments. Roles do not have capacity so the capacity is zero for roles.
Allocation (by Month)
Displays the allocation demand on portfolio investments for each resource or role by month.
Variance (by Month)
Displays the difference between capacity and allocation. A negative variance value indicates that the allocation demand exceeds the capacity.
Financials Tab
Use the portlets on the Financials tab to track and analyze capital cost and operational cost.
To view data in the portlets, do the following:
■ Set up charge codes with the following Charge Code IDs: Capital, Expense. The portlets reference these IDs so the charge codes must be set up with these exact IDs.
See the Administration Guide for more information.
■ Group cost plans for an investment by charge code of Capital or Expense to view the budget and planned cost.
■ Use charge codes of Capital or Expense on financial transactions and timesheets to view actual cost.
■ Post transactions to WIP to view actual cost.
This Financials tab includes the following portlets:
■ Capital vs Expense Budget and Forecast Portlet (see page 98)
■ Capital vs Expense By Period Portlet (see page 102)
■ Capital vs Expense Variance By Period Portlet (see page 103)
Follow these steps:
1. Open Home, and from Portfolio Management, click Portfolios.
The list page appears.
2. Click a portfolio link.
The portfolio scorecard tab appears.

Financials Tab
98 PMO Accelerator Product Guide
3. Click Financials.
The portfolio financials tab appears.
Use the page-level filter to filter all portlets at once by scenario, status, and period type. The period type filter applies to the portlets that display amounts by fiscal period. It does not apply to the Capital vs Expense Budget and Forecast Portlet.
By default, investments shown in the portlets represent approved investments in the portfolio. To view unapproved or all investments, select the status from the Status drop-down on the portfolio page-level filter.
Capital vs Expense Budget and Forecast Portlet
The Capital vs Expense Budget and Forecast portlet displays budget, actual, forecast, and variance for each investment included in a portfolio. Use this portlet to compare budget to forecast capital and expense cost of the portfolio investments.
To view this portlet, open the portfolio and click Financials. If the page is maximized to display only one portlet at a time, select Capital vs Expense Budget and Forecast from the portlet drop-down.
To view data in the portlet, do the following:
■ Group cost plans for an investment by charge code of Capital or Expense to view budget and planned cost.
■ Use charge codes of Capital or Expense on financial transactions and timesheets to view actual cost.
■ Post transactions to WIP to view actual cost.
The As of Date filter in the portlet is required to calculate Actual and Forecast amounts. Enter the As of Date so that it is the last day of a fiscal period. If you enter a date other than the last day of a fiscal period in the filter, then the portlet treats it as if it was entered as the last day of the next fiscal period end. For example, if fiscal periods end 10/31 and 11/30 and you enter 11/01 in the As of Date filter, then the portlet treats it as if you entered 11/30 (which is the fiscal period end date of the next fiscal period).
Note: This portlet honors the planning horizon of the portfolio; therefore, the amounts in the portlet are within the portfolio start and finish dates. Also, this portlet does not display aggregate hierarchical cost amounts. The portlet only displays the cost amounts of the investments directly included in the portfolio and does not calculate the aggregate cost amount of any child investments. The portlet displays the home currency of the investment as determined by the department entity. It does not use the portfolio currency to do a currency conversion from the investment home currency.

Financials Tab
Chapter 5: Portfolio Pages and Portlets 99
This portlet displays the following fields:
Investment
Displays the name of the investment. To view the detailed properties for an investment, click the investment name.
Budget (Capital)
Displays the budget cost for the current approved budget where the charge code is Capital.
Budget (Expense)
Displays the budget cost for the current approved budget where the charge code is Expense.
Budget (Total)
Displays the budget cost for the current approved budget that is the total of the Budget (Capital) and Budget (Expense) amounts.
Actual (Capital)
Displays the actual cost for financial and timesheet transactions that have a charge code of Capital. Includes capital transactions posted to WIP with a transaction date on or before the as-of date specified using the As of Date filter.
Actual (Expense)
Displays the actual cost for financial and timesheet transactions that have a charge code of Expense. Includes expense transactions posted to WIP with a transaction date on or before the as-of date specified using the As of Date filter.
Actual (Total)
Displays the actual cost that is the total of the Actual (Capital) and Actual (Expense) amounts. Includes capital and expense transactions posted to WIP with a transaction date on or before the as-of date specified using the As of Date filter.
Forecast (Capital)
Displays the calculated forecast cost for the cost plan of record where the charge code is Capital. Includes capital transactions posted to WIP with a transaction date on or before the as-of date specified using the As of Date filter plus planned cost for fiscal periods after the as-of date specified using the As of Date filter.
Forecast (Expense)
Displays the calculated forecast cost for the cost plan of record where the charge code is Expense. Includes expense transactions posted to WIP with a transaction date on or before the as-of date specified using the As of Date filter plus planned cost for fiscal periods after the as-of date specified using the As of Date filter.

Financials Tab
100 PMO Accelerator Product Guide
Forecast (Total)
Displays the calculated forecast cost that is the total of the Forecast (Capital) and Forecast (Expense) amounts. Includes capital and expense transactions posted to WIP with a transaction date on or before the as-of date specified using the As of Date filter plus planned cost for fiscal periods after the as-of date specified using the As of Date filter.
Budget to Forecast Var (Capital)
Displays a stoplight that shows whether the capital forecast cost exceeds the budget
Stoplights:
■ Green: Indicates that the forecast does not exceed the budget.
■ Red: Indicates that the forecast exceeds the budget.
Budget to Forecast Var (Expense)
Displays a stoplight that shows whether the expense forecast cost exceeds the budget.
Stoplights:
■ Green: Indicates that the forecast does not exceed the budget.
■ Red: Indicates that the forecast exceeds the budget.
Budget to Forecast Var (Total)
Displays a stoplight that shows whether the capital and expense forecast cost exceeds the budget:
Stoplights:
■ Green: Indicates that the forecast does not exceed the budget.
■ Red: Indicates that the forecast exceeds the budget.
The following fields are available for this portlet and you can add them using the configure option:
See the Personalizing CA Clarity User Guide for more information.
Budget to Actual Var (Capital)
Displays a stoplight that shows whether the capital actual cost exceeds the budget.
Stoplights:
■ Green: Indicates that actual cost does not exceed the budget.
■ Red: Indicates that actual cost exceeds the budget.

Financials Tab
Chapter 5: Portfolio Pages and Portlets 101
Budget to Actual Var (Expense)
Displays a stoplight that shows whether the expense actual cost exceeds the budget.
Stoplights:
■ Green: Indicates that actual cost does not exceed the budget.
■ Red: Indicates that actual cost exceeds the budget.
Budget to Actual Var (Total)
Displays a stoplight that shows whether the capital and expense actual cost exceeds the budget.
Stoplights:
■ Green: Indicates that actual cost does not exceed the budget.
■ Red: Indicates that actual cost exceeds the budget.
Planned Cost Remaining (Capital)
Displays the planned cost remaining for the cost plan of record where the charge code is Capital. Includes planned cost for fiscal periods after the as-of date specified using the As of Date filter.
Planned Cost Remaining (Expense)
Displays the planned cost remaining for the cost plan of record where the charge code is Expense. Includes planned cost for fiscal periods after the as-of date specified using the As of Date filter.
Planned Cost Remaining (Total)
Displays the planned cost remaining that is the total of the Planned Cost Remaining (Capital) and Planned Cost Remaining (Expense) amounts. Includes planned cost for fiscal periods after the as-of date specified using the As of Date filter.

Financials Tab
102 PMO Accelerator Product Guide
Capital vs Expense by Period Portlet
The Capital vs Expense by Period portlet displays planned cost by fiscal period, and in total, for each investment included in a portfolio. Use this portlet to compare planned capital to planned expense cost of the investments.
To view this portlet, open the portfolio and click Financials. If the page is maximized to display only one portlet at a time, select Capital vs Expense by Period from the portlet drop-down.
To view planned cost data in the portlet, you must group cost plans for an investment by charge code of Capital or Expense.
Note: This portlet honors the planning horizon of the portfolio; therefore, the fiscal periods in the portlet are within the portfolio start and finish dates. Also, this portlet does not display aggregate hierarchical cost amounts. The portlet only displays the cost amounts of the investments directly included in the portfolio and does not calculate the aggregate cost amount of any child investments. The portlet displays the home currency of the investment as determined by the department entity. It does not use the portfolio currency to do a currency conversion from the investment home currency.
The portlet displays the following fields:
Investment
Displays the name of the investment. Click an investment name to view the detailed properties for that investment.
Total Planned Capital
Displays the planned cost for the cost plan of record where the charge code is Capital.
Total Planned Expense
Displays the planned cost for the cost plan of record where the charge code is Expense.
Total Planned Investment
Displays the total planned cost as the sum of the Total Planned Capital and Total Planned Expense amounts.
Capital (by Fiscal Period)
Displays the planned cost by fiscal period, for the cost plan of record, where the charge code is Capital.

Financials Tab
Chapter 5: Portfolio Pages and Portlets 103
Expense (by Fiscal Period)
Displays the planned cost by fiscal period, for the cost plan of record, where the charge code is Expense.
The Capital vs Expense by Period and the Capital vs Expense Variance by Period portlets are based on the same query. Accordingly, you can configure the fields from either portlet to appear on the other portlet. In addition, the following fields are available and you can add them using the configure option:
See the Personalizing CA Clarity User Guide for more information.
Portfolio Actual Cost
Displays the actual cost of the investment, within the portfolio planning horizon. It includes all actual cost transactions, regardless of whether the transaction has a charge code of capital or expense.
Portfolio Planned Cost
Displays the planned cost of the investment for the cost plan of record, within the portfolio planning horizon. It includes all planned cost amounts, regardless of whether the cost plan is grouped by a charge code of capital or expense.
Investment ID
Displays the Investment ID, which is the identifier of the investment.
Capital vs Expense Variance by Period Portlet
The Capital vs Expense Variance by Period portlet displays the following information for each investment included in a portfolio:
■ Planned, actual, and variance cost by fiscal period
■ Planned cost in total
Use this portlet to compare planned capital and expense to actual capital and expense costs of the investments.
To view this portlet, open the portfolio and click Financials. If the page is maximized to display only one portlet at a time, select Capital vs Expense Variance by Period from the portlet drop-down.
To view data in the portlet, do the following:
■ Group cost plans for an investment by charge code of Capital or Expense to view planned cost.
■ Use charge codes of Capital or Expense on financial transactions and timesheets in order to view actual cost.
■ Post transactions to WIP in order to view actual cost.

Financials Tab
104 PMO Accelerator Product Guide
The cost amounts display by fiscal period and are grouped by charge code for the following categories:
■ Planned
■ Actual
■ Variance (Planned minus Actual)
Note: This portlet honors the planning horizon of the portfolio; therefore, the fiscal periods in the portlet are within the portfolio start and finish dates. Also, this portlet does not display agate hierarchical cost amounts. The portlet only displays the cost amounts of the investments directly included in the portfolio and does not calculate the aggregate cost amount of any child investments. The portlet displays the home currency of the investment as determined by the department entity. It does not use the portfolio currency to do a currency conversion from the investment home currency.
The portlet displays the following fields:
Investment
Displays the name of the investment. Click an investment name to view the detailed properties for that investment.
Total Planned Capital
Displays the planned cost for the cost plan of record where the charge code is Capital.
Total Planned Expense
Displays the planned cost for the cost plan of record where the charge code is Expense.
Total Planned Investment
Displays the total planned cost as the sum of the Total Planned Capital and Total Planned Expense amounts.
Capital (by Fiscal Period)
Displays the planned cost, actual cost, and variance by fiscal period, for the cost plan of record, where the charge code is Capital.

Performance Tab
Chapter 5: Portfolio Pages and Portlets 105
Expense (by Fiscal Period)
Displays the planned cost, actual cost, and variance by fiscal period, for the cost plan of record, where the charge code is Expense.
The Capital vs Expense by Period and the Capital vs Expense Variance by Period portlets are based on the same query. Accordingly, you can configure the fields from either portlet to appear on the other portlet. In addition, the following fields are available and you can add them using the configure option:
See the Personalizing CA Clarity User Guide for more information.
Portfolio Actual Cost
Displays the actual cost of the investment, within the portfolio planning horizon. It includes all actual cost transactions, regardless of whether the transaction has a charge code of capital or expense.
Portfolio Planned Cost
Displays the planned cost of the investment for the cost plan of record, within the portfolio planning horizon. It includes all planned cost amounts, regardless of whether the cost plan is grouped by a charge code of capital or expense.
Investment ID
Displays the Investment ID, which is the identifier of the investment.
Performance Tab
Use the portlets on the Performance tab to view the key performance indicators, including alignment, risk, schedule, cost and effort of investments in a portfolio.
The Performance tab includes the following portlets:
■ Key Performance Indicators (see page 106)
■ Cost and Effort Performance (see page 110)
Follow these steps:
1. Open Home, and from Portfolio Management, click Portfolios.
The list page appears.
2. Click a portfolio link.
The portfolio scorecard tab appears.

Performance Tab
106 PMO Accelerator Product Guide
3. Click Performance.
The portfolio performance tab appears.
Use the page-level filter to filter all portlets at once by scenario and status.
By default, investments shown in the portlets represent approved investments in the portfolio. To view unapproved or all investments, select the status from the Status drop-down on the portfolio page-level filter.
Key Performance Indicators Portlet
The Key Performance Indicators portlet displays performance indicators for each investment included in a portfolio. Use this portlet to analyze the ongoing performance of portfolio investments.
To view this portlet, open the portfolio and click Performance. If the page is maximized to display only one portlet at a time, select Key Performance Indicators from the portlet drop-down.
Note: This portlet has some fields that are populated for projects only and are identified accordingly in their field descriptions. The portlet has an Investment Type filter so you can filter the portlet to display only projects. You may want to filter on projects because some of the indicators are not populated for non-project investments.
The portlet displays the following fields:
Investment
Displays the name of the investment. Click an investment name to view the detailed properties for that investment.
Manager
Displays the manager associated to the investment.
Stage
Displays the stage of the investment lifecycle as a progress bar. The gray squares indicate completed stages and the current stage is represented as a color, based on the Business Alignment of the investment.
Start
Displays the investment start date.
Finish
Displays the investment finish date.

Performance Tab
Chapter 5: Portfolio Pages and Portlets 107
Schedule %
Displays a stoplight indicating days late as a percentage of the investment timeframe, which is finish date minus start date. The calculation takes into account the investment progress and baseline (if one exists). The color of the stoplight indicates if the investment is on schedule or late.
Stoplights:
■ Green. The investment is ahead of schedule or on schedule.
■ Yellow. The investment is between one and ten percent late.
■ Red. The investment is more than ten percent late.
■ White. The schedule percentage is undefined.
Days Late
Displays the number of days late considering the following:
■ Whether or not an investment baseline exists
■ Investment progress
If a baseline exists, then days late is calculated as investment finish date minus baseline finish date. A positive number indicates that the investment is late according to the baseline. A negative number indicates that it is early according to the baseline.
If a baseline exists and the investment finish date is the same as the baseline finish date, then the investment is considered late if it is not completed and it was due before today’s date. In this case, days late is calculated as today’s date minus investment finish date.
If there is no baseline, then days late is calculated if the investment is not completed and it was due before today’s date. In this case, days late is calculated as today’s date minus investment finish date.
Projected Cost Variance%
Displays a stoplight indicating the projected cost variance as a percentage of BAC cost. This field is populated for projects only.
Source: Schedule & Performance properties page of the project.
Formula: (((ETC Cost + Actual Cost (ACWP)) - BAC Cost) / BAC Cost) * 100
Stoplights:
■ Green. The EAC cost is less than or equal to the baseline.
■ Yellow. The EAC cost is between one and ten percent over the baseline.
■ Red. The EAC cost is more than ten percent over the baseline.
■ White. No baseline data exists.

Performance Tab
108 PMO Accelerator Product Guide
Projected Effort Variance %
Displays a stoplight indicating the projected effort variance as a percentage of BAC effort. This field is populated for projects only.
Source: Schedule & Performance properties page of the project.
Formula: ((EAC Effort – BAC Effort) / BAC Effort) * 100
Stoplights:
■ Green. The EAC effort is less than or equal to the baseline.
■ Yellow. The EAC effort is between one and ten percent over the baseline.
■ Red. The EAC effort is more than ten percent over the baseline.
■ White. No baseline data exists.
Risk
Displays a stoplight based on the investment risk score. The investment risk score determines the color of the stoplight.
Stoplights:
■ Green (0 to 33). The investment is low risk.
■ Yellow (34 to 67).The investment is medium risk.
■ Red (68 to 100). The investment is high risk.
Issue
Displays a stoplight based on the highest issue priority of the issues on the project. Issues with a status of “Resolved” or “Closed” are excluded. This field is populated for projects only.
Stoplights:
■ Green. All issues that exist on the project are low priority.
■ Yellow. At least one medium priority issue and no high priority issues exist on the project.
■ Red. At least one high priority issue exists on the project.
Change
Displays a checkmark if at least one change request exists on the project. Change requests with a status of “Resolved” or “Closed” are excluded. This field is populated for projects only.

Performance Tab
Chapter 5: Portfolio Pages and Portlets 109
The following fields are available for this portlet and you can add them using the configure option:
See the Personalizing CA Clarity User Guide for more information.
Baseline Start
Displays the baseline start date of the investment.
Baseline Finish
Displays the baseline finish date of the investment.
Business Alignment
Displays how well the investment aligns to the organization business goal. The higher the business alignment value is, the stronger the alignment.
Stoplights:
■ Green (68 through 100). The investment has good alignment with the business.
■ Yellow (34 through 67). The investment has average alignment with the business.
■ Red (0 through 33). The investment has poor alignment with the business.
■ White. The alignment data is undefined.
Days Late %
Displays days late as a percentage of the investment timeframe, which is the finish date minus the start date. The calculation takes into account the investment progress and baseline (if one exists). The days late percentage shows the proportion by which an investment is late. One day late in a six-month investment does not have the same impact as one day late in a one-month investment.
Schedule
Displays a stoplight indicating the number of days an investment is late, considering the investment progress and whether a baseline exists for the investment. The color of the stoplight indicates if the investment is on schedule or late.
Stoplights:
■ Green. The investment is ahead of the schedule or on schedule.
■ Yellow. The investment is between one and ten days late.
■ Red. The investment is more than ten days late.
■ White. The schedule is undefined.
Stage Name
Displays the stage in the lifecycle of the investment.

Performance Tab
110 PMO Accelerator Product Guide
Cost and Effort Performance Portlet
The Cost and Effort Performance portlet displays cost and effort performance amounts and variances for investments included in a portfolio. Use this portlet to analyze the effort and cost of ongoing portfolio investments.
To view this portlet, open the portfolio and click Performance. If the page is maximized to display only one portlet at a time, select Cost and Effort Performance from the portlet drop-down.
Note: Most of the fields in this portlet are populated for projects only and are identified accordingly in their field descriptions. The portlet has an Investment Type filter so you can filter the portlet to display only projects. You may want to do this because most fields are not populated for non-project investments. Also, this portlet does not display aggregate hierarchical cost amounts for any of the project only fields. The portlet only displays the cost amounts of the projects directly included in the portfolio and does not calculate the aggregate cost amount of any child investments.
The portlet displays the following fields:
Investment
Displays the name of the investment. Click the investment name to view the detailed properties for an investment.
Manager
Displays the manager that is associated with the investment.
Start
Displays the investment start date.
Finish
Displays the investment finish date.
BAC
Displays the system-calculated value of the baseline effort (actuals plus remaining ETC) at the time of the current baseline revision. This field is populated for projects only.
Source: Schedule & Performance properties page of the project.
Actuals
Displays the system-calculated value of the actual effort posted to the tasks in the project. This field is populated for projects only.
Source: Schedule & Performance properties page of the project.

Performance Tab
Chapter 5: Portfolio Pages and Portlets 111
ETC
Displays the system-calculated value of the estimated effort to complete the project. This field is populated for projects only.
Source: Schedule & Performance properties page of the project.
EAC
Displays the system-calculated value of the estimated effort at completion (actuals plus remaining ETC) of the project. This field is populated for projects only.
Source: Schedule & Performance properties page of the project.
Projected Effort Variance
Displays the variance between EAC effort and baseline effort. This field is populated for projects only.
Source: Schedule & Performance properties page of the project.
Formula: (EAC Effort – BAC Effort)
Projected Effort Variance %
Displays a stoplight indicating the projected effort variance as a percentage of BAC effort. This field is populated for projects only.
Source: Schedule & Performance properties page of the project.
Formula: ((EAC Effort – BAC Effort) / BAC Effort) * 100
Stoplights:
■ Green. The EAC effort is less than or equal to the baseline.
■ Yellow. The EAC effort is between one and ten percent over the baseline.
■ Red. The EAC effort is more than ten percent over the baseline.
■ White. No baseline data exists.
BAC Cost
Displays the system-calculated value of baseline at completion, which is the baseline cost at the time of the current baseline revision. This field is populated for projects only.
Source: Schedule & Performance properties page of the project.
ETC Cost
Displays the system-calculated value of the estimated cost to complete the project. ETC cost is the aggregated total for the remaining labor and non-labor cost to complete the project. This field is populated for projects only.
Source: Schedule and performance page of the project.

Performance Tab
112 PMO Accelerator Product Guide
Actual Cost
Displays the system-calculated value of actual cost of work performed (ACWP), which is the total direct cost incurred in performing work that is based on posted actuals. This field is populated for projects only.
Source: Schedule & Performance properties page of the project.
EAC Cost
Displays the system-calculated value of estimate at completion, which is the total cost of actual work completed to date and the predicted cost of finishing the remaining work. This field is populated for projects only.
Source: Schedule & Performance properties page of the project.
Projected Cost Variance
Displays the variance between the estimated plus actual cost and the baseline cost. This field is populated for projects only.
Source: Schedule & Performance properties page of the project.
Formula: ((ETC Cost + Actual Cost (ACWP)) - BAC Cost)
Projected Cost Variance %
Displays a stoplight indicating the projected cost variance as a percentage of BAC cost. This field is populated for projects only.
Source: Schedule & Performance properties page of the project.
Formula: (((ETC Cost + Actual Cost (ACWP)) - BAC Cost) / BAC Cost) * 100
Stoplights:
■ Green. The EAC cost is less than or equal to the baseline.
■ Yellow. The EAC cost is between one and ten percent over the baseline.
■ Red. The EAC cost is more than ten percent over the baseline.
■ White. No baseline data exists.

Performance Tab
Chapter 5: Portfolio Pages and Portlets 113
Cost Drill Down
Displays an icon that links to a page with the following portlets:
Projects Costs by Phase (see page 137)
Project Costs by Task (see page 142)
Project Costs by Resource (see page 146)
The following fields are available for this portlet and you can add them using the configure option:
See the Personalizing CA Clarity User Guide for more information.
Planned Cost
Displays the planned cost of the investment.
Source: Financial Summary properties page of the investment.
Planned Benefit
Displays the planned benefit of the investment.
Source: Financial Summary properties page of the investment.
Planned NPV
Displays the net present value of the investment by calculating the total cost of capital and a series of future payments and income.
Source: Financial Summary properties page of the investment.
Planned ROI
Displays the ratio of money gained or lost on this investment relative to the amount of money invested.
Source: Financial Summary properties page of the investment.
Planned Breakeven
Displays the date when the expected cash flow equals the cash outlay for the investment. The breakeven date matches with the payback period.
Source: Financial Summary properties page of the investment.
Planned IRR
Displays the Internal Rate of Return or the discount rate used to achieve zero NPV for an investment.
Source: Financial Summary properties page of the investment.
Planned MIRR
Displays the Modified Internal Rate of Return or the rate used to measure the attractiveness of the investment.
Source: Financial summary page of the investment.

Performance Tab
114 PMO Accelerator Product Guide
Planned Payback (Months)
Displays the number of periods (in months) needed for the sum of the expected cash flows to equal the initial cash outlay for the investment.
Source: Financial Summary properties page of the investment.
Planned Value (BCWS)
Displays the system-calculated value of budgeted cost of work scheduled (BCWS) or the budgeted amount you can spend on the project in a given time. If time is not specified, either the current date for the project or the system date is used. BCWS is also referred to as the planned value (PV). This field is populated for projects only.
Source: Schedule & Performance properties page of the project.
Earned Value (BCWP)
Displays the system-calculated value of budgeted cost of work performed (BCWP). The value is calculated and recorded when you baseline a project, or when you update earned value totals. BCWP is also referred to as the earned value (EV) and represents the amount of baseline cost (BAC) completed based on performance. Performance is measured using the Task EV Calculation method. This field is populated for projects only.
Source: Schedule & Performance properties page of the project.
Cost Variance (CV)
Displays the system-calculated value of cost variance. The cost variance is the value of what is accomplished to date as opposed to what is spent to date. This field is populated for projects only.
Source: Schedule & Performance properties page of the project.
Schedule Variance (SV)
Displays the system-calculated value of schedule variance. The schedule variance is the value of what is scheduled to date as opposed to what is performed to date. A positive value indicates that the work is ahead of the baseline schedule. A negative value indicates that the work is behind the baseline schedule. This field is populated for projects only.
Source: Schedule & Performance properties page of the project.
Cost Variance %
Displays cost variance as a percentage. It is calculated as the percentage of cost variance over the amount of the budgeted cost of work performed (BCWP). This field is populated for projects only.
Source: Schedule & Performance properties page of the project.
Formula: ((BCWP – ACWP) / BCWP) * 100

Performance Tab
Chapter 5: Portfolio Pages and Portlets 115
Schedule Variance %
Displays schedule variance as a percentage. It is calculated as the percentage of schedule variance over the amount of the budgeted cost of work scheduled (BCWS). This field is populated for projects only.
Source: Schedule & Performance properties page of the project.
Formula: ((BCWP – BCWS) / BCWS) *100
Cost Performance Index (CPI)
Displays the system-calculated value of cost performance index (CPI), which is an efficiency rating for work accomplished. A value greater than or equal to one indicates a favorable condition. A value of less than one indicates an unfavorable condition. This field is populated for projects only.
Source: Schedule & Performance properties page of the project.
Schedule Performance Index (SPI)
Displays the system-calculated value of schedule performance index (SPI), which is the ratio of work performed to work scheduled. A value greater than or equal to one indicates work is on schedule. A value of less than one indicates the work is behind schedule. This field is populated for projects only.
Source: Schedule & Performance properties page of the project.
Actual Cost (Portfolio)
Displays the actual cost posted to the investment. This actual cost is from the portfolio investment provider and is populated for all investment types in the portfolio.
EAC vs Planned Variance
Displays the variance between EAC Cost and Planned Cost. As EAC Cost is only populated for projects, this calculation is only valid for projects.
Formula: (EAC Cost – Planned Cost)
EAC vs Planned Variance %
Displays a stoplight indicating the EAC vs Planned Variance as a percentage of Planned Cost. As EAC Cost is only populated for projects, this calculation is only valid for projects.
Formula: ((EAC Cost – Planned Cost) / Planned Cost) * 100
Stoplights:
■ Green. The EAC cost is less than or equal to planned cost.
■ Yellow. The EAC cost is between one and ten percent over planned cost.
■ Red. The EAC cost is more than ten percent over planned cost.

Performance Tab
116 PMO Accelerator Product Guide
Remaining Planned Cost
Displays the variance between Planned Cost and Actual Cost (Portfolio).
Formula: (Planned Cost – Actual Cost (Portfolio))
Remaining Planned Cost %
Displays a stoplight indicating the Actual Cost (Portfolio) minus Planned Cost as a percentage of Planned Cost.
Formula: ((Actual Cost (Portfolio) – Planned Cost) / Planned Cost) * 100
Stoplights:
■ Green. The actual cost is less than or equal to planned cost.
■ Yellow. The actual cost is between one and ten percent over planned cost.
■ Red. The actual cost is more than ten percent over planned cost
Chapter 6: Program and Project Pages and Portlets 117
Chapter 6: Program and Project Pages and Portlets
This section contains the following topics:
About Dashboard Views (see page 117) PMO-Program Status Page Layout (see page 118) PMO-Project Status Page Layout (see page 126) PMO-Project Storyboard Page Layout (see page 133)
About Dashboard Views
You can select from the following dashboard views or page layouts from the properties page of a project or program.
■ PMO-Program Status (see page 118)
■ PMO-Project Status (see page 126)
■ PMO-Project Storyboard (see page 133)
Each view provides a different set of portlets that you can use to analyze various project information.
To select a dashboard view
1. Open Home, and from Portfolio Management, click Projects or Programs.
The list page appears.
2. Open the program or project by clicking the Properties icon.
The properties page appears.
3. Open the Properties menu and select Settings.
The settings page appears.
4. Click the Dashboard View drop-down menu and select a view.
5. Save your view and click Dashboard.
The selected dashboard view appears.

PMO-Program Status Page Layout
118 PMO Accelerator Product Guide
PMO-Program Status Page Layout
Use the PMO-Program Status dashboard view to display program variances in cost, schedule, and risk alerts.
This page includes the following portlets:
■ Cost and Schedule Overview (see page 118)
■ Schedule and Progress (see page 123)
■ Resource Utilization (see page 125)
Cost and Schedule Overview Portlet
The Cost and Schedule Overview portlet shows metrics, performance indicators, and risk information of each project associated to a program. Use this portlet to analyze the performance of ongoing projects.
The following fields display on the portlet:
Properties Icon
Displays an icon that links to the project properties page.
Project
Displays the project name. Click a project name to view the project dashboard.
BAC Cost
Displays the system-calculated value of baseline at completion, which is the baseline cost at the time of the current baseline revision.
Source: Schedule & Performance properties page of the project.
Actual Cost
Displays the system-calculated value of actual cost of work performed (ACWP), which is the total direct cost incurred in performing work based on posted actuals.
Source: Schedule & Performance properties page of the project.
EAC Cost
Displays the system-calculated value of estimate at completion, which is the total cost of actual work completed to date and the predicted cost of finishing the remaining work.
Source: Schedule & Performance properties page of the project.

PMO-Program Status Page Layout
Chapter 6: Program and Project Pages and Portlets 119
Projected Cost Variance
Displays the variance between the estimated plus actual cost and the baseline cost.
Source: Schedule & Performance properties page of the project.
Formula: ((ETC Cost + Actual Cost (ACWP)) - BAC Cost)
Projected Cost Variance%
Displays a stoplight indicating the projected cost variance as a percentage of BAC cost.
Source: Schedule & Performance properties page of the project.
Formula: (((ETC Cost + Actual Cost (ACWP)) - BAC Cost) / BAC Cost) * 100
Stoplights:
■ Green. The EAC cost is less than or equal to the baseline.
■ Yellow. The EAC cost is between one and ten percent over baseline.
■ Red. The EAC cost is more than ten percent over baseline.
■ White. A baseline does not exist.
Start
Displays the start date of the project.
Finish
Displays the finish date of the project.
Baseline Finish
Displays the baseline finish date of the project.
Schedule %
Displays a stoplight indicating days late as a percentage of the project timeframe, which is finish date minus start date. The calculation takes into account the project progress and baseline (if a baseline exists). The color of the stoplight indicates if the project is on schedule or late.
Stoplights:
■ Green. The project is ahead of schedule or on schedule.
■ Yellow. The project is between one and ten percent late.
■ Red. The project is more than ten percent late.
■ White. The schedule percentage is undefined.

PMO-Program Status Page Layout
120 PMO Accelerator Product Guide
Days Late
Displays the number of days late considering the following:
■ Whether or not a baseline exists
■ Project progress
If a baseline exists, then days late is calculated as project finish date minus baseline finish date. A positive number indicates that the project is late according to the baseline. A negative number indicates that it is early according to the baseline.
If a baseline exists and the project finish date is the same as the baseline finish date, then the project is considered late if it is not completed and it was due before today’s date. In this case, days late is calculated as today’s date minus project finish date.
If there is no baseline, then days late is calculated if the project is not completed and it was due before today’s date. In this case, days late is calculated as today’s date minus project finish date.
Risk
Displays a stoplight based on the project risk score. The project risk score determines the color of the stoplight.
Stoplights:
■ Green (0 through 33). The project is low risk.
■ Yellow (34 through 67).The project is medium risk.
■ Red (68 through 100). The project is high risk.
High Priority Risks
Displays the total number of high-priority risks. Risks are not included if their status is “Resolved” or “Closed”.
High Priority Issues
Displays the total number of high-priority issues. Issues are not included if their status is “Resolved” or “Closed”.
High Priority Changes
Displays the total number of high-priority change requests. Change requests are not included if their status is “Resolved” or “Closed”.
The following aggregated amounts appear at the bottom of the portlet:
Project
Displays the total BAC cost, actual cost, EAC cost, and projected cost variance for the projects associated to the program.
Program
Displays the program budget cost.

PMO-Program Status Page Layout
Chapter 6: Program and Project Pages and Portlets 121
Variance
Displays the difference between the program budget and total project EAC costs. A negative variance value indicates the program is over budget.
The following fields are available for this portlet and can be added through the configure option:
See the Personalizing CA Clarity User Guide for more information.
Baseline Start
Displays the project baseline start date.
Business Alignment
Displays how well the project aligns to the organization business goal. The higher the business alignment value is, the stronger the alignment.
Stoplights:
■ Green (68 to 100). The project has good alignment with the business.
■ Yellow (34 to 67). The project has average alignment with the business.
■ Red (0 to 34). The project has poor alignment with the business.
■ White. The alignment data is undefined.
BAC
Displays the system-calculated value of the baseline effort (actuals plus remaining ETC) at the time of the current baseline revision.
Source: Schedule & Performance properties page of the project.
Actuals
Displays the system-calculated value of the actual effort posted for the tasks in the project.
Source: Schedule & Performance properties page of the project.
ETC
Displays the system-calculated value of the estimated effort to complete the project.
Source: Schedule & Performance properties page of the project.
EAC
Displays the system-calculated value of the estimated effort at completion (actuals plus remaining ETC) of the project.
Source: Schedule & Performance properties page of the project.

PMO-Program Status Page Layout
122 PMO Accelerator Product Guide
Projected Effort Variance
Displays the variance between EAC effort and baseline effort.
Source: Schedule & Performance properties page of the project.
Formula: (EAC Effort – BAC Effort)
Projected Effort Variance %
Displays a stoplight indicating the projected effort variance as a percentage of BAC effort.
Source: Schedule & Performance properties page of the project.
Formula: ((EAC Effort – BAC Effort) / BAC Effort) * 100
Stoplights:
■ Green. The EAC effort is less than or equal to the baseline.
■ Yellow. The EAC effort is between one and ten percent over the baseline.
■ Red. The EAC effort is more than ten percent over the baseline.
■ White. No baseline data exists.
Planned Benefit
Displays the planned benefit of the project.
Planned Cost
Displays the planned cost of the project.
Planned Value (BCWS)
Displays the system-calculated value of budgeted cost of work scheduled (BCWS) or the budgeted amount you can spend on the project in a given time. If time is not specified, either the current date for the project or the system date is used. BCWS is also referred to as the planned value (PV).
Source: Schedule & Performance properties page of the project.
Earned Value (BCWP)
Displays the system-calculated value of budgeted cost of work performed (BCWP). The value is calculated and recorded when you baseline a project, or when you update earned value totals. BCWP is also referred to as the earned value (EV) and represents the amount of baseline cost (BAC) completed based on performance. Performance is measured using the Task EV Calculation method.
Source: Schedule & Performance properties page of the project.

PMO-Program Status Page Layout
Chapter 6: Program and Project Pages and Portlets 123
Schedule
Displays a stoplight based on the number of days a project is late, considering the project progress and whether or not a baseline exists for the project. The color of the stoplight indicates if the project schedule is on schedule or late.
Stoplights:
■ Green. The project is ahead of schedule or on schedule.
■ Yellow. The project is between one and ten days late.
■ Red. The project is more than ten days late.
■ White. The schedule is undefined.
Days Late %
Displays days late as a percentage of the project timeframe, which is the finish date minus the start date. The calculation takes into account the project progress and baseline (if a baseline exists). The days late percentage shows the proportion by which a project is late. One day late in a six-month project does not have the same impact as one day late in a one-month project.
Schedule and Progress Portlet
The Schedule and Progress portlet displays a bubble graph that shows how the score of each project balances between its scheduled variance and its current finish date. Each bubble on the graph represents a project associated to the program. Rolling your cursor over a bubble in the graph displays project details such as the name, finish date, schedule %, and planned cost. Changing a project planned cost changes its bubble size. Clicking a bubble takes you to the project dashboard.
The X-axis displays the project finish dates and the Y-axis displays their schedule %. Projects appear on the graph according to their schedule. Projects behind schedule appear below the 0 y-coordinate. Projects ahead of schedule appear above the 0 y-coordinate.
Projects are scored based on their schedule, cost, and progress. The graph legend indicates the color translations. Click a legend entry to exclude that group from the graph.
The following describes the metrics used in the graph:
Schedule %
Indicates days late as a percentage of the project timeframe, which is finish date minus start date. The calculation takes into account the project progress and baseline (if a baseline exists).

PMO-Program Status Page Layout
124 PMO Accelerator Product Guide
Progress
Indicates the project progress.
Values: Not Started, Started, or Completed
Planned Cost
Displays the planned cost of the project.
The following metrics are available for adding by configuration to this portlet.
See the Personalizing CA Clarity User Guide for more information.
ETC
Displays the system-calculated value of the estimated effort to complete the project.
Source: Schedule & Performance properties page of the project.
Planned ROI
Displays the ratio of money gained or lost on this project relative to the amount of money invested.
Planned IRR
Displays the Internal Rate of Return or the discount rate used to achieve zero NPV for a project.
Planned MIRR
Displays the Modified Internal Rate of Return or the rate used to measure the attractiveness of this project.
Planned NPV
Displays the net present value of the project by calculating the total cost of capital and a series of future payments and income.
Schedule
Displays a stoplight indicating the number of days a project is late, considering the project progress and whether or not a baseline exists for the project. The color of the stoplight indicates if the project is on schedule or late.
Stoplights:
■ Green. The project is ahead of schedule or on schedule.
■ Yellow. The project is between one and ten days late.
■ Red. The project is more than ten days late.
■ White. The schedule is undefined.

PMO-Program Status Page Layout
Chapter 6: Program and Project Pages and Portlets 125
Days Late
Displays the number of days by which a project is late considering the following:
■ Whether or not a baseline exists
■ Project progress
If a baseline exists, then days late is calculated as project finish date minus baseline finish date. A positive number indicates that the project is late according to the baseline. A negative number indicates that it is early according to the baseline.
If a baseline exists and the project finish date is the same as the baseline finish date, then the project is considered late if it is not completed and it was due before today’s date. In this case, days late is calculated as today’s date minus project finish date.
If there is no baseline, then days late is calculated if the project is not completed and it was due before today’s date. In this case, days late is calculated as today’s date minus project finish date.
Days Late %
Displays days late as a percentage of the project timeframe, which is the finish date minus the start date. The calculation takes into account the project progress and baseline (if a baseline exists). The days late percentage shows the proportion by which a project is late. One day late in a six-month project does not have the same impact as one day late in a one-month project.
Resource Utilization Portlet
The Resource Utilization portlet displays allocation versus assignment by month, illustrated in an area graph. Use the Resource Utilization portlet to view the amount of resource effort required or expected to complete the projects associated to a program.
Note: Assign staff to tasks before viewing resource utilization.
By default, the area graph displays total effort by month for all resources allocated to projects in the program. The Y-axis shows the effort in hours. The X-axis shows the corresponding month. Click a legend entry to exclude that group from the graph.

PMO-Project Status Page Layout
126 PMO Accelerator Product Guide
PMO-Project Status Page Layout
Use the PMO-project status page layout of dashboard to view the overall picture and performance summary of a project. The dashboard displays the project indicators, status report indicators, upcoming milestones, and team utilization for a project.
This page includes the following portlets:
■ Project Indicators Portlet (see page 126)
■ Upcoming Milestones Portlet (see page 128)
■ Project Baselines Portlet (see page 130)
■ Status Report Indicators Portlet (see page 130)
■ Actuals by Transaction Type Portlet (see page 131)
■ Team Utilization Portlet (see page 150)
Project Indicators Portlet
The Project Indicators portlet displays key performance indicators (KPIs) for the project. The portlet provides a quick update on KPIs, such as stage, schedule %, days late, projected cost variance %, projected effort variance %, risk, issues and change requests.
The following fields display on this portlet:
Stage
Displays the stage of the project lifecycle as a progress bar. The gray squares indicate completed stages and the current stage is represented as a color, based on the business alignment of the project.
Schedule %
Displays a stoplight indicating days late as a percentage of the project timeframe, which is finish date minus start date. The calculation takes into account the project progress and baseline (if one exists). The color of the stoplight indicates if the project is on schedule or late.
Stoplights:
■ Green. The investment is ahead of schedule or on schedule.
■ Yellow. The investment is between one and ten percent late.
■ Red. The investment is more than ten percent late.
■ White. The schedule percentage is undefined.
PMO-Project Status Page Layout
Chapter 6: Program and Project Pages and Portlets 127
Days Late
Displays the number of days by which a project is late considering the following:
■ Whether or not a baseline exists
■ Project progress
If a baseline exists, then days late is calculated as project finish date minus baseline finish date. A positive number indicates that the project is late according to the baseline. A negative number indicates that it is early according to the baseline.
If a baseline exists and the project finish date is the same as the baseline finish date, then the project is considered late if it is not completed and it was due before today’s date. In this case, days late is calculated as today’s date minus project finish date.
If there is no baseline, then days late is calculated if the project is not completed and it was due before today’s date. In this case, days late is calculated as today’s date minus project finish date.
Projected Cost Variance%
Displays a stoplight indicating the projected cost variance as a percentage of BAC cost.
Source: Schedule & Performance properties page of the project.
Formula: (((ETC Cost + Actual Cost (ACWP)) - BAC Cost) / BAC Cost) * 100
Stoplights:
■ Green. The EAC cost is less than or equal to the baseline.
■ Yellow. The EAC cost is between one and ten percent over baseline.
■ Red. The EAC cost is more than ten percent over baseline.
■ White. A baseline does not exist.
Projected Effort Variance %
Displays a stoplight indicating the projected effort variance as a percentage of BAC effort.
Source: Schedule & Performance properties page of the project.
Formula: ((EAC Effort – BAC Effort) / BAC Effort) * 100
Stoplights:
■ Green. The EAC effort is less than or equal to the baseline.
■ Yellow. The EAC effort is between one and ten percent over the baseline.
■ Red. The EAC effort is more than ten percent over the baseline.
■ White. No baseline data exists.

PMO-Project Status Page Layout
128 PMO Accelerator Product Guide
Risk
Displays a stoplight based on the project risk score. The project risk score determines the color of the stoplight.
Values:
■ Green (0 to 33). The project is low risk.
■ Yellow (34 to 68). The project is medium risk.
■ Red (68 to 100). The project is high risk.
■ White. Risk data is undefined.
Issue
Displays a stoplight based on the highest issue priority of the issues on the project. Issues with a status of “Resolved” or “Closed” are excluded.
Values:
■ Green. All issues that exist on the project are low priority.
■ Yellow. At least one medium priority issue and no high priority issues exist on the project.
■ Red. At least one high priority issue exists on the project.
Change
Displays a checkmark if at least one change request exists on the project. Change requests with a status of “Resolved” or “Closed” are excluded.
Upcoming Milestones Portlet
The Upcoming Milestones portlet provides a list of all the milestones for a project. This portlet includes the following fields:
Milestone Name
Displays the milestone name. Click the milestone name to view the task properties page.
Finish
Displays the finish date of the milestone.

PMO-Project Status Page Layout
Chapter 6: Program and Project Pages and Portlets 129
Schedule %
Displays a stoplight indicating days late as a percentage of the summary task or project timeframe, which is finish date minus start date. If the milestone has a parent task in the WBS, then the parent task’s timeframe is used in the calculation. If the milestone is at the top level of the WBS and does not have a parent task, then the project’s timeframe is used in the calculation.
The calculation takes into account the milestone status and baseline (if one exists). The color of the stoplight indicates if the milestone is on schedule or late.
Stoplights:
■ Green. The milestone is ahead of schedule or on schedule.
■ Yellow. The milestone is between one and ten percent late.
■ Red. The milestone is more than ten percent late.
■ White. The schedule percentage is undefined.
Days Late
Displays the number of days late considering the following:
■ Whether or not a baseline exists
■ Milestone status
If a baseline exists, then days late is calculated as milestone finish date minus baseline finish date. A positive number indicates that the milestone is late according to the baseline. A negative number indicates that it is early according to the baseline.
If a baseline exists and the milestone finish date is the same as the baseline finish date, then the milestone is considered late if it is not completed and it was due before today’s date. In this case, days late is calculated as today’s date minus milestone finish date.
If there is no baseline, then days late is calculated if the milestone is not completed and it was due before today’s date. In this case, days late is calculated as today’s date minus milestone finish date.
Gantt Schedule
Displays a Gantt chart that shows the finish dates of the milestones. The color of the Gantt is based on the schedule percentage as follows:
■ Green. The milestone is ahead of schedule or on schedule.
■ Yellow. The milestone is between one and ten percent late.
■ Red. The milestone is more than ten percent late.
■ White. The schedule percentage is undefined.
PMO-Project Status Page Layout
130 PMO Accelerator Product Guide
Project Baselines Portlet
The Project Baselines portlet displays a line graph that charts the baseline activity against the usage or hours worked on the project. The X-axis displays monthly periods and the Y-axis displays cumulative project hours. A line appears for each baseline on the project and the current project plan.
Status Report Indicators Portlet
The Project Status Reports portlet displays status report indicators from the most recent status report, based on report date.
Note: To display information in this portlet, a project status report must exist.
The following fields display on the portlet:
Overall Status
Displays a stoplight indicating how the project is doing overall. The metric is based on the Overall Status stoplight in the status report.
Stoplights:
■ Green. The overall status of the project is on track.
■ Yellow. A minor variance in the overall status of the project exists.
■ Red. A significant variance in the overall status of the project exists.
Report Date
Displays the date that the status report was created. Click the date to view the status report properties page.
Project Manager
Displays the project manager name.
Schedule
Displays a stoplight indicating whether or not the project schedule is on track. The metric is based on the Schedule section in the status report.
Stoplights:
■ Green. The project schedule is on track.
■ Yellow. The project schedule has a minor variance.
■ Red. The project schedule has a significant variance.

PMO-Project Status Page Layout
Chapter 6: Program and Project Pages and Portlets 131
Scope
Displays a stoplight indicating whether or not the project scope is on track. The metric is based on the Scope section in the status report.
Stoplights:
■ Green. The project scope is on track.
■ Yellow. A minor variance in the project scope exists.
■ Red. A significant variance in the project scope exists.
Cost and Effort
Displays a stoplight indicating whether or not the project cost and effort are on track. The metric is based on the Cost and Effort section in the status report.
Values:
■ Green. The cost and effort of the project are on track.
■ Yellow. A minor variance in the cost and effort of the project exists.
■ Red. A significant variance in the cost and effort of the project exists.
Status Reports
Displays an icon that links to the status reports of the project.
Actuals by Transaction Type Portlet
The Actuals by Transaction Type portlet displays the actual cost totals organized by the transaction type. Transaction types include: equipment, expense, labor, and material. To view data in the portlet, first enter project transactions and post the transactions to WIP.
Quantity and cost amounts roll up in the hierarchy. The Totals for the portlet reflect the sum of the individual transactions.
The following fields display on the portlet:
Transaction/Resource/Date
Displays the transaction type, resource name, and transaction date.
Task
Displays the name of the task.
Quantity
Displays the transaction quantity.
Cost
Displays the transaction actual cost.

PMO-Project Status Page Layout
132 PMO Accelerator Product Guide
Team Utilization Portlet
The Team Utilization portlet displays total effort per resource across all the assigned tasks of the project. You can drill down from this view to see utilization by individual resource and task.
See the Resource Management User Guide for more information.
The following fields display on the portlet:
Properties Icon
Click the icon to view the staff member properties page. Use the page to update the properties of a staff member.
Resource Allocation Icon
Click this icon to open the resource/role allocations page. Use the page to update the allocation of a resource.
List of Tasks Icon
Click this icon to open the task resource utilization list page for that resource.
Resource
Displays the name of the associated resource. Click the resource name to view the resource properties page.
Average Allocation %
Displays the average percentage of available time for a resource.
Time Period
Displays the time periods for a task. This field varies according to the selected Time Scaled Values option. Data for the time period displays in a colored histogram.
Values:
■ Green. Represents actual hours recorded to date.
■ Yellow. Represents the availability threshold for that resource (the maximum number of hours a resource is available for work).
■ Red. Represents resource as overallocated.

PMO-Project Storyboard Page Layout
Chapter 6: Program and Project Pages and Portlets 133
PMO-Project Storyboard Page Layout
Use the PMO-project storyboard page layout to view detailed information about the overall picture and the performance of a project.
This page consists of the following portlets:
■ Team Capacity portlet (see page 133)
■ Upcoming Milestones portlet (see page 133)
■ Issues by Priority portlet (see page 135)
■ Earned Value Analysis by Phase Portlet (see page 135)
Team Capacity Portlet
The Team Capacity portlet displays future resource needs of projects. The portlet shows the resource demand on the project compared to the allocation of team members staffed on the project.
The graph begins with the current month (based on the current calendar date) and moves forward for the duration of the project. The staff allocation value is equal to the remaining allocation on the project. The assignment value is the value entered in the ETC field on the task assignments plus any actuals posted.
See the Project Management User Guide for more information.
Upcoming Milestones Portlet
The Upcoming Milestones portlet provides a list of all the milestones for a project. This portlet includes the following fields:
Milestone Name
Displays the milestone name. Click the milestone name to view the task properties page.
Finish
Displays the finish date of the milestone.

PMO-Project Storyboard Page Layout
134 PMO Accelerator Product Guide
Schedule %
Displays a stoplight indicating days late as a percentage of the summary task or project timeframe, which is finish date minus start date. If the milestone has a parent task in the WBS, then the parent task’s timeframe is used in the calculation. If the milestone is at the top level of the WBS and does not have a parent task, then the project’s timeframe is used in the calculation.
The calculation takes into account the milestone status and baseline (if one exists). The color of the stoplight indicates if the milestone is on schedule or late.
Stoplights:
■ Green. The milestone is ahead of schedule or on schedule.
■ Yellow. The milestone is between one and ten percent late.
■ Red. The milestone is more than ten percent late.
■ White. The schedule percentage is undefined.
Days Late
Displays the number of days late considering the following:
■ Whether or not a baseline exists
■ Milestone status
If a baseline exists, then days late is calculated as milestone finish date minus baseline finish date. A positive number indicates that the milestone is late according to the baseline. A negative number indicates that it is early according to the baseline.
If a baseline exists and the milestone finish date is the same as the baseline finish date, then the milestone is considered late if it is not completed and it was due before today’s date. In this case, days late is calculated as today’s date minus milestone finish date.
If there is no baseline, then days late is calculated if the milestone is not completed and it was due before today’s date. In this case, days late is calculated as today’s date minus milestone finish date.
Gantt Schedule
Displays a Gantt chart that shows the finish dates of the milestones. The color of the Gantt is based on the schedule percentage as follows:
■ Green. The milestone is ahead of schedule or on schedule.
■ Yellow. The milestone is between one and ten percent late.
■ Red. The milestone is more than ten percent late.
■ White. The schedule percentage is undefined.

PMO-Project Storyboard Page Layout
Chapter 6: Program and Project Pages and Portlets 135
Issues by Priority Portlet
The Issues by Priority portlet displays a pie chart grouping issues by priority. Issues with a status of “Resolved” or “Closed” are excluded.
Each pie segment reflects the number of issues of that priority, giving a graphical and overall view of the status of a project in terms of issues raised. Click a pie slice to open the details of the issue on the Current Issues Drill Down page.
Earned Value Analysis by Phase Portlet
Use the Earned Value Phase Analysis portlet to track work performance to account for cost and schedule variances.
This portlet includes the following fields:
Phase
Displays the phase of the project.
Planned Value (BCWS)
Displays the system-calculated value of budgeted cost of work scheduled (BCWS) or the budgeted amount you can spend on the project in a given time. If time is not specified, either the current date for the project or the system date is used. BCWS is also referred to as the planned value (PV).
Source: Schedule & Performance properties page of the project.
Earned Value (BCWP)
Displays the system-calculated value of budgeted cost of work performed (BCWP). The value is calculated and recorded when you baseline a project, or when you update earned value totals. BCWP is also referred to as the earned value (EV) and represents the amount of baseline cost (BAC) completed based on performance. Performance is measured using the Task EV Calculation method.
Source: Schedule & Performance properties page of the project.
Actual Cost (ACWP)
Displays the system-calculated value of actual cost of work performed (ACWP), which is the total direct cost incurred in performing work based on posted actuals.
Source: Schedule & Performance properties page of the project.
Cost Variance (CV)
Displays the system-calculated value of cost variance. The cost variance is the value of what is accomplished to date as opposed to what is spent to date.
Source: Schedule & Performance properties page of the project.

PMO-Project Storyboard Page Layout
136 PMO Accelerator Product Guide
Schedule Variance (SV)
Displays the system-calculated value of schedule variance. The schedule variance is the value of what is scheduled to date as opposed to what is performed to date. A positive value indicates that the work is ahead of the baseline schedule. A negative value indicates that the work is behind the baseline schedule.
Source: Schedule & Performance properties page of the project.
Cost Performance Index (CPI)
Displays the system-calculated value of cost performance index (CPI), which is an efficiency rating for work accomplished. A value greater than or equal to one indicates a favorable condition. A value of less than one indicates an unfavorable condition.
Source: Schedule & Performance properties page of the project.
Schedule Performance Index (SPI)
Displays the system-calculated value of schedule performance index (SPI), which is the ratio of work performed to work scheduled. A value greater than or equal to one indicates work is on schedule. A value of less than one indicates the work is behind schedule.
Source: Schedule & Performance properties page of the project.

Chapter 7: Project Costs Drill Down Portlets 137
Chapter 7: Project Costs Drill Down Portlets
This section contains the following topics:
About the Project Costs Drill Down Portlets (see page 137) Project Costs by Phase Portlet (see page 137) Project Costs by Task Portlet (see page 142) Project Costs by Resource Portlet (see page 146)
About the Project Costs Drill Down Portlets
You can drill down to the following cost views from the Program Manager Cost Dashboard Portlet (see page 44) or from the Cost and Effort Performance Portlet (see page 110) on the portfolio performance page:
■ Project Costs by Phase Portlet (see page 137)
■ Project Costs by Task Portlet (see page 142)
■ Project Costs by Resource Portlet (see page 146)
Project Costs by Phase Portlet
The Project Costs by Phase portlet displays cost performance amounts and variances by phase. Use the portlet to identify the phases of the project plan that are over baseline from a cost standpoint.
To view this portlet, do one of the following:
■ Click the Costs Drill Down icon in the Program Manager Cost Dashboard Portlet (see page 44)
■ Click the Costs Drill Down icon in the Cost and Effort Performance Portlet (see page 110)
The following fields display on this portlet:
Project
Displays the project name. Click a project name to view the project properties page.
Phase
Displays the phases of a project. Click a phase to view the task properties page.
Status
Displays the phase status (Not Started, Started, Completed).

Project Costs by Phase Portlet
138 PMO Accelerator Product Guide
Start
Displays the phase start date.
Finish
Displays the phase finish date.
BAC Cost
Displays the system-calculated value of baseline at completion, which is the baseline cost at the time of the current baseline revision.
Source: Performance properties page of the task.
Actual Cost
Displays the system-calculated value of actual cost of work performed (ACWP), which is the total direct cost incurred in performing work based on posted actuals.
Source: Performance properties page of the task.
ETC Cost
Displays the system-calculated value of the estimated cost to complete the task. ETC cost is the aggregated total for the remaining labor and non-labor cost to complete the task.
Source: Performance properties page of the task.
EAC Cost
Displays the system-calculated value of estimate at completion, which is the total cost of actual work completed to date and the predicted cost of finishing the remaining work.
Source: Performance properties page of the task.
Projected Cost Variance
Displays the variance between the estimated plus actual cost and the baseline cost.
Source: Performance properties page of the task.
Formula: ( (ETC Cost + Actual Cost (ACWP)) - BAC Cost )

Project Costs by Phase Portlet
Chapter 7: Project Costs Drill Down Portlets 139
Projected Cost Variance %
Displays a stoplight indicating the projected cost variance as a percentage of BAC cost.
Source: Performance properties page of the task.
Formula: ( ( (ETC Cost + Actual Cost (ACWP)) - BAC Cost) / BAC Cost) * 100
Stoplights:
■ Green. The EAC cost is less than or equal to the baseline.
■ Yellow. The EAC cost is between one and ten percent over the baseline.
■ Red. The EAC cost is more than ten percent over the baseline.
■ White. No baseline data exists.
The following fields are available for adding by configuration to this portlet.
See the Personalizing CA Clarity User Guide for more information.
Baseline Start
Displays the task baseline start date.
Baseline Finish
Displays the task baseline finish date.
BAC
Displays the system-calculated value of the baseline effort (actuals plus remaining ETC) at the time of the current baseline revision.
Source: Performance properties page of the task.
Actuals
Displays the system-calculated value of the actual effort posted to the tasks in the project.
Source: Performance properties page of the task.
ETC
Displays the system-calculated value of the estimated effort to complete the task.
Source: Performance properties page of the task.
EAC
Displays the system-calculated value of the estimated effort at completion (actuals plus remaining ETC) of the task.
Source: Performance properties page of the task.

Project Costs by Phase Portlet
140 PMO Accelerator Product Guide
Projected Effort Variance
Displays the variance between EAC effort and baseline effort.
Source: Performance properties page of the task.
Formula: (EAC Effort – BAC Effort)
Projected Effort Variance %
Displays a stoplight indicating the projected effort variance as a percentage of BAC effort.
Source: Performance properties page of the task.
Formula: ( (EAC Effort – BAC Effort) / BAC Effort) * 100
Stoplights:
■ Green. The EAC effort is less than or equal to the baseline.
■ Yellow. The EAC effort is between one and ten percent over the baseline.
■ Red. The EAC effort is more than ten percent over the baseline.
■ White. No baseline data exists.
Planned Value (BCWS)
Displays the system-calculated value of budgeted cost of work scheduled (BCWS) or the budgeted amount you can spend on the task in a given time. If time is not specified, either the current date for the task or the system date is used. BCWS is also referred to as the planned value (PV).
Source: Performance properties page of the task.
Earned Value (BCWP)
Displays the system-calculated value of budgeted cost of work performed (BCWP). The value is calculated and recorded when you baseline a project, or when you update earned value totals. BCWP is also referred to as the earned value (EV) and represents the amount of baseline cost (BAC) completed based on performance. Performance is measured using the Task EV Calculation method.
Source: Performance properties page of the task.
Cost Variance (CV)
Displays the system-calculated value of cost variance. The cost variance is the value of what is accomplished to date as opposed to what is spent to date.
Source: Performance properties page of the task.

Project Costs by Phase Portlet
Chapter 7: Project Costs Drill Down Portlets 141
Schedule Variance (SV)
Displays the system-calculated value of schedule variance. The schedule variance is the value of what is scheduled to date as opposed to what is performed to date. A positive value indicates that the work is ahead of the baseline schedule. A negative value indicates that the work is behind the baseline schedule.
Source: Performance properties page of the task.
Cost Variance %
Displays cost variance as a percentage. The variance is calculated as the percentage of cost variance over the amount of the budgeted cost of work performed (BCWP).
Source: Performance properties page of the task.
Formula: ((BCWP – ACWP) / BCWP) * 100
Schedule Variance %
Displays schedule variance as a percentage. The variance is calculated as the percentage of schedule variance over the amount of the budgeted cost of work scheduled (BCWS).
Source: Performance properties page of the task.
Formula: ((BCWP – BCWS) / BCWS) *100
Cost Performance Index (CPI)
Displays the system-calculated value of cost performance index (CPI), which is an efficiency rating for work accomplished. A value greater than or equal to one indicates a favorable condition. A value of less than one indicates an unfavorable condition.
Source: Performance properties page of the task.
Schedule Performance Index (SPI)
Displays the system-calculated value of schedule performance index (SPI), which is the ratio of work performed to work scheduled. A value greater than or equal to one indicates work is on schedule. A value of less than one indicates the work is behind schedule.
Source: Performance properties page of the task.

Project Costs by Task Portlet
142 PMO Accelerator Product Guide
Project Costs by Task Portlet
The Project Costs by Task portlet displays cost performance amounts and variances by task. You can use the portlet to identify tasks of the project plan that are over baseline from a cost standpoint.
To view this portlet, do one of the following:
■ Click the Costs Drill Down icon in the Program Manager Cost Dashboard Portlet (see page 44)
■ Click the Costs Drill Down icon in the Cost and Effort Performance Portlet (see page 110)
The following fields display on the portlet:
Project
Displays the project name. Click a project name to view the project properties page.
Phase
Displays the phases of a project. Click a phase to view the task properties page.
Task
Displays the tasks of a project. Click a task to view the task properties page.
Status
Displays the task status (Not Started, Started, Completed).
Start
Displays the task start date.
Finish
Displays the task finish date.
BAC Cost
Displays the system-calculated value of baseline at completion, which is the baseline cost at the time of the current baseline revision.
Source: Performance properties page of the task.
Actual Cost
Displays the system-calculated value of actual cost of work performed (ACWP), which is the total direct cost incurred in performing work based on posted actuals.
Source: Performance properties page of the task.

Project Costs by Task Portlet
Chapter 7: Project Costs Drill Down Portlets 143
ETC Cost
Displays the system-calculated value of the estimated cost to complete the task. ETC cost is the aggregated total for the remaining labor and non-labor cost to complete the task.
Source: Performance properties page of the task.
EAC Cost
Displays the system-calculated value of estimate at completion, which is the total cost of actual work completed to date and the predicted cost of finishing the remaining work.
Source: Performance properties page of the task.
Projected Cost Variance
Displays the variance between the estimated plus actual cost and the baseline cost.
Source: Performance properties page of the task.
Formula: ( (ETC Cost + Actual Cost (ACWP)) - BAC Cost )
Projected Cost Variance %
Displays a stoplight indicating the projected cost variance as a percentage of BAC cost.
Source: Performance properties page of the task.
Formula: ( ( (ETC Cost + Actual Cost (ACWP)) - BAC Cost) / BAC Cost) * 100
Stoplights:
■ Green. The EAC cost is less than or equal to the baseline.
■ Yellow. The EAC cost is between one and ten percent over the baseline.
■ Red. The EAC cost is more than ten percent over the baseline.
■ White. No baseline data exists.
The following fields are available for adding by configuration to this portlet.
See the Personalizing CA Clarity User Guide for more information.
Baseline Start
Displays the task baseline start date.
Baseline Finish
Displays the task baseline finish date.
BAC
Displays the system-calculated value of the baseline effort (actuals plus remaining ETC) at the time of the current baseline revision.
Source: Performance properties page of the task.

Project Costs by Task Portlet
144 PMO Accelerator Product Guide
Actuals
Displays the system-calculated value of the actual effort posted to the tasks in the project.
Source: Performance properties page of the task.
ETC
Displays the system-calculated value of the estimated effort to complete the task.
Source: Performance properties page of the task.
EAC
Displays the system-calculated value of the estimated effort at completion (actuals plus remaining ETC) of the task.
Source: Performance properties page of the task.
Projected Effort Variance
Displays the variance between EAC effort and baseline effort.
Source: Performance properties page of the task.
Formula: (EAC Effort – BAC Effort)
Projected Effort Variance %
Displays a stoplight indicating the projected effort variance as a percentage of BAC effort.
Source: Performance properties page of the task.
Formula: ( (EAC Effort – BAC Effort) / BAC Effort) * 100
Stoplights:
■ Green. The EAC effort is less than or equal to the baseline.
■ Yellow. The EAC effort is between one and ten percent over the baseline.
■ Red. The EAC effort is more than ten percent over the baseline.
■ White. No baseline data exists.
Planned Value (BCWS)
Displays the system-calculated value of budgeted cost of work scheduled (BCWS) or the budgeted amount you can spend on the task in a given time. If time is not specified, either the current date for the task or the system date is used. BCWS is also referred to as the planned value (PV).
Source: Performance properties page of the task.
Project Costs by Task Portlet
Chapter 7: Project Costs Drill Down Portlets 145
Earned Value (BCWP)
Displays the system-calculated value of budgeted cost of work performed (BCWP). The value is calculated and recorded when you baseline a project, or when you update earned value totals. BCWP is also referred to as the earned value (EV) and represents the amount of baseline cost (BAC) completed based on performance. Performance is measured using the Task EV Calculation method.
Source: Performance properties page of the task.
Cost Variance (CV)
Displays the system-calculated value of cost variance. The cost variance is the value of what is accomplished to date as opposed to what is spent to date.
Source: Performance properties page of the task.
Schedule Variance (SV)
Displays the system-calculated value of schedule variance. The schedule variance is the value of what is scheduled to date as opposed to what is performed to date. A positive value indicates that the work is ahead of the baseline schedule. A negative value indicates that the work is behind the baseline schedule.
Source: Performance properties page of the task.
Cost Variance %
Displays cost variance as a percentage. The variance is calculated as the percentage of cost variance over the amount of the budgeted cost of work performed (BCWP).
Source: Performance properties page of the task.
Formula: ((BCWP – ACWP) / BCWP) * 100
Schedule Variance %
Displays schedule variance as a percentage. The variance is calculated as the percentage of schedule variance over the amount of the budgeted cost of work scheduled (BCWS).
Source: Performance properties page of the task.
Formula: ((BCWP – BCWS) / BCWS) *100
Cost Performance Index (CPI)
Displays the system-calculated value of cost performance index (CPI), which is an efficiency rating for work accomplished. A value greater than or equal to one indicates a favorable condition. A value of less than one indicates an unfavorable condition.
Source: Performance properties page of the task.

Project Costs by Resource Portlet
146 PMO Accelerator Product Guide
Schedule Performance Index (SPI)
Displays the system-calculated value of schedule performance index (SPI), which is the ratio of work performed to work scheduled. A value greater than or equal to one indicates work is on schedule. A value of less than one indicates the work is behind schedule.
Source: Performance properties page of the task.
Project Costs by Resource Portlet
The Project Costs by Resource portlet displays cost performance amounts and variances by resource. Use the portlet to identify the resources that are over baseline from a cost standpoint.
To view this portlet, do one of the following:
■ Click the Costs Drill Down icon on the Program Manager Cost Dashboard Portlet (see page 44)
■ Click the Costs Drill Down icon on the Cost and Effort Performance Portlet (see page 110)
The following fields display on the portlet:
Project
Displays the project name. Click a project name to view the project properties page.
Team Icon
Displays an icon that links to the team staff page of the project.
Resource/Role
Displays the resource or role allocated to the project. Click a resource or role to view the properties page of the resource or role.
Project Role
Displays the project role for the resource.
Resource Type
Displays the resource type (for example, labor, material, expense, or equipment).
Employment Type
Displays the employment type for the resource (for example, employee or contractor).
BAC Cost
Displays the system-calculated value of baseline at completion, which is the baseline cost at the time of the current baseline revision.

Project Costs by Resource Portlet
Chapter 7: Project Costs Drill Down Portlets 147
Actual Cost
Displays the system-calculated value of actual cost of work performed (ACWP), which is the total direct cost incurred in performing work based on posted actuals.
ETC Cost
Displays the system-calculated value of the estimated cost to complete the project. ETC cost is the aggregated total for the remaining labor and non-labor cost to complete the project.
EAC Cost
Displays the system-calculated value of estimate at completion, which is the total cost of actual work completed to date and the predicted cost of finishing the remaining work.
Projected Cost Variance
Displays the variance between the estimated plus actual cost and the baseline cost.
Formula: ( (ETC Cost + Actual Cost (ACWP)) - BAC Cost )
Projected Cost Variance %
Displays a stoplight indicating the projected cost variance as a percentage of BAC cost.
Formula: ( ( (ETC Cost + Actual Cost (ACWP)) - BAC Cost) / BAC Cost) * 100
Stoplights:
■ Green. The EAC cost is less than or equal to the baseline.
■ Yellow. The EAC cost is between one and ten percent over the baseline.
■ Red. The EAC cost is more than ten percent over the baseline.
■ White. No baseline data exists.
The following fields are available for adding by configuration to this portlet.
See the Personalizing CA Clarity User Guide for more information.
BAC
Displays the system-calculated value of the baseline effort (actuals plus remaining ETC) at the time of the current baseline revision.
Actuals
Displays the system-calculated value of the actual effort posted to the tasks in the project.
ETC
Displays the system-calculated value of the estimated effort to complete the task.

Project Costs by Resource Portlet
148 PMO Accelerator Product Guide
EAC
Displays the system-calculated value of the estimated effort at completion (actuals plus remaining ETC) of the task.
Projected Effort Variance
Displays the variance between EAC effort and baseline effort.
Source: Performance properties page of the task.
Formula: (EAC Effort – BAC Effort)
Projected Effort Variance %
Displays a stoplight indicating the projected effort variance as a percentage of BAC effort.
Formula: ( (EAC Effort – BAC Effort) / BAC Effort) * 100
Stoplights:
■ Green. The EAC effort is less than or equal to the baseline.
■ Yellow. The EAC effort is between one and ten percent over the baseline.
■ Red. The EAC effort is more than ten percent over the baseline.
■ White. No baseline data exists.

Chapter 8: Resource Management Portlets 149
Chapter 8: Resource Management Portlets
This section contains the following topics:
Timesheet Overview (see page 149) Investment Timesheet Summary Portlet (see page 150) Pending Estimates Review Portlet (see page 152) Timesheet Review Portlet (see page 154)
Timesheet Overview
This section discusses the Timesheet Overview section of the Resource Management menu and the Timesheet Review action on the Team tab of projects. The pages and portlets in this section display information about the actual and planned time spent on investments.
Use timesheets to record time worked on assignments. For projects, time is recorded at the task level by period. For investments, time is recorded to an effort task by period.
Timesheets track time at the task level on a daily basis. The time entries for a resource are recorded at the task level based on the duration of the task and the overall duration of the project or other investments. The timesheet actuals are generated from the approved hours that project team members record on timesheets.
Once approved, the Post Timesheets job runs to post the timesheets. The job updates the Actuals value on the resource assignment properties page. The job also processes the actuals (the recorded number of hours worked) against a resource task assignment. Posting also updates the remaining work or ETC. Project managers can compare the actuals with estimates and modify their plans as needed.
Use the Timesheet Overview page to review summary and detailed information about team timesheets and any modified estimates entered by the team members. To access this page, open Home, and from Resource Management, select Timesheet Overview.
This page includes the following portlets:
■ Investment Timesheet Summary (see page 150)
■ Pending Estimates Review (see page 152)
Use the page-level filter to filter all portlets at once by investment OBS, investment manager, employment type, timesheet status, and timesheet period.

Investment Timesheet Summary Portlet
150 PMO Accelerator Product Guide
Investment Timesheet Summary Portlet
The Investment Timesheet Summary portlet displays pending and posted actuals by investment. Use this portlet to compare pending actuals to actuals posted through timesheets.
The following fields appear on this portlet:
Investment
Displays the investment name. Only investments with existing timesheet entries appear on this portlet. Click an investment name link to go to the investment properties.
Manager
Displays the investment manager name.
Pending Actuals
Displays the pending actuals amount for the investment.
Posted Actuals
Displays the posted actuals amount for the investment.
Total Actuals
Displays the total including the pending and posted actuals.
Timesheet Details Icon
Displays a side arrow icon. Click the icon to drill down to more detailed information about timesheets on the Timesheet Details page.
The Timesheet Details page includes the following:
■ Investment Timesheet Review portlet (see page 150)
■ Timesheet Notes portlet (see page 152)
Investment Timesheet Review Portlet
The Investment Timesheet Review portlet on the Timesheet Details page displays pending and posted actuals by task, resource, and time period. Use this portlet to compare pending actuals to posted actuals by task and by resource.
There is an Adjustment filter on this portlet. If this filter is set to Yes, then adjustment timesheets are displayed. Once an adjustment has been posted, the original adjusted timesheets are not shown in this portlet. If the Timesheet Status filter is set to Adjusted, no results are returned. This prevents the duplication of actuals in the portlet. If you click the timesheet icon to view the adjustment timesheet, you can access the adjusted timesheet from the [Adjusted Timesheet] link at the top of the timesheet page.

Investment Timesheet Summary Portlet
Chapter 8: Resource Management Portlets 151
The portlet displays the following fields:
Timesheet
Displays the timesheet icon. Click the icon to go to the timesheet page for the corresponding resource.
Notes Attached
Displays an icon if there are any notes attached to a timesheet entry. Click the icon to drill down to the Timesheet Notes page.
Investment
Displays the name of the investment. Click an investment name to view the detailed properties for that investment.
Task
Displays the task name associated with the timesheet entry. Click a task name to view the task properties.
Resource
Displays the resource name associated with the timesheet entry. Click a resource name to view the resource assignment properties.
Employment Type
Displays the resource employment type (for example, employee or contractor).
Status
Displays the timesheet status.
Adjustment
Displays an icon if the timesheet is an adjustment timesheet. The original adjusted timesheets are not included in this portlet to prevent duplication of actuals.
Period Start
Displays the timesheet period start date.
Period End
Displays the timesheet period end date.
Pending Actuals
Displays the actuals that have not been posted for the given time reporting period.
Posted Actuals
Displays the posted actuals for the given time reporting period.
Total Actuals
Displays the total actuals (pending and posted) for the given time reporting period.

Pending Estimates Review Portlet
152 PMO Accelerator Product Guide
Timesheet Notes Portlet
Team members, project managers, and resource managers may add notes to timesheets to communicate with one another regarding the timesheet. Notes can be added for the entire timesheet, or for a single timesheet entry.
The Timesheet Notes portlet lists notes attached to a single timesheet entry.
The following fields appear on this portlet:
Note
Displays the note attached to the timesheet.
Category
Displays the note category.
Task
Displays the task associated to the note.
Created By
Displays the resource responsible for creating the note.
Created Date
Displays the date that the note was created.
Modified By
Displays the resource responsible for modifying the note.
Modified Date
Displays the date that the note was modified.
Pending Estimates Review Portlet
Depending on whether more or less time is required for a task, a team member can increase or decrease the ETC on a task. They can do this using Timesheets. However, the project manager must approve these modifications before the change is reflected in CA Clarity PPM.
The Pending Estimates Review portlet displays pending estimates and recommended changes by project, task and resource. Use this portlet to compare pending estimates to planned estimates by task and by resource.
This portlet displays the following fields:
Project
Displays the project name. Click a project name to view the project properties.

Pending Estimates Review Portlet
Chapter 8: Resource Management Portlets 153
Task
Displays the name of the task. Click a task name to view the task properties.
Resource
Displays the name of the resource assigned to the task. Click a resource name to view the resource assignment properties page.
Start
Displays the start date of the task assignment.
Finish
Displays the finish date of the task assignment.
Pending ETC
Displays the ETC amount that was added to the timesheet.
Plan ETC
Displays the ETC amount that was initially assigned to the task.
Pending Actuals
Displays the amount of unposted actuals for the task.
Adjusted Plan ETC
Displays the adjusted plan ETC amount.
Formula: (Plan ETC – Pending Actuals)
Recommended Change in ETC
Displays the ETC amount that is the recommended change to the current Plan ETC.
Formula: (Pending ETC – Adjusted Plan ETC)
Increase/Decrease in ETC
Displays a stoplight indicating the recommended change in ETC.
Stoplights:
■ Green. The recommended change is to decrease the ETC for the task.
■ Red. The recommended change is to increase the ETC for the task.

Timesheet Review Portlet
154 PMO Accelerator Product Guide
Timesheet Review Portlet
The Timesheet Review portlet displays pending and posted actuals by task, resource, and time period. Use this portlet to compare pending actuals to posted actuals by task and by resource.
As in the Investment Timesheet Review portlet, there is an Adjustment filter on this portlet. If this filter is set to Yes, then adjustment timesheets are displayed. Once an adjustment has been posted, the original adjusted timesheets are not shown in this portlet. If the Timesheet Status filter is set to Adjusted, no results are returned. This prevents the duplication of actuals in the portlet. If you click the timesheet icon to view the adjustment timesheet, you can access the adjusted timesheet from the [Adjusted Timesheet] link at the top of the timesheet page.
Follow these steps:
1. With the project open, click Team.
The project team staff page appears.
2. Open the Actions menu, and from Views, click Timesheet Review.
The following fields display on this portlet:
Timesheet
Displays the timesheet icon. Click the icon to go to the timesheet page for the corresponding resource.
Notes Attached
Displays an icon if there are any notes attached to a timesheet entry. Click the icon to drill down to the Timesheet Notes page.
Resource
Displays the resource name associated with the timesheet entry. Click a resource name to view the resource assignment properties.
Employment Type
Displays the resource employment type (for example, employee or contractor).
Task
Displays the task name associated with the timesheet entry. Click a task name link to view the task properties.
Status
Displays the timesheet status.
Adjustment
Displays an icon if the timesheet is an adjustment timesheet. The original adjusted timesheets are not included in this portlet to prevent duplication of actuals.

Timesheet Review Portlet
Chapter 8: Resource Management Portlets 155
Period Start
Displays the timesheet period start date.
Period End
Displays the timesheet period end date.
Pending Actuals
Displays the unposted actuals for the given time reporting period.
Posted Actuals
Displays the posted actuals for the given time reporting period.
Total Actuals
Displays the total actuals (pending and posted) for the given time reporting period.


Chapter 9: Financial Management Portlets 157
Chapter 9: Financial Management Portlets
This section contains the following topics:
About Financial Management Portlets (see page 157) Posted Transaction Review Portlet (see page 157) Posted Transaction Review Portlet [Investment Level] (see page 160)
About Financial Management Portlets
The financial management portlets display information about the total costs posted through transactions associated with investments.
The Posted Transaction Review Portlet is available at the individual investment level and also across all investments. To display data on this portlet, verify investment and resource financial properties are completed and transactions are posted for the investments.
See the Financial Management User Guide for more information.
Posted Transaction Review Portlet
The Posted Transaction Review portlet displays financial transactions across investments by transaction date and includes quantity, cost, and currency information. Use this portlet to compare transaction currency amounts to converted currency amounts by task and by resource.
See the Financial Management User Guide for more information.
To access this portlet, open Home, and from Financial Management, click Posted Transaction Review.
The following fields appear on this portlet:
Transaction Date
Displays the date of the transaction.
Investment
Displays the investment name associated with the transaction. Click an investment name to view the investment properties.

Posted Transaction Review Portlet
158 PMO Accelerator Product Guide
Task
Displays the task name associated with the transaction. Click a task name to view the task properties.
Charge Code
Displays the charge code associated with the transaction (for example, Expense or Capital).
Resource
Displays the resource name associated with the transaction. Click a resource name to view the resource properties.
Transaction Class
Displays the transaction class associated with the transaction (for example, Internal Labor or External Labor).
Input Type Code
Displays the input type code associated with the transaction.
Quantity
Displays the transaction quantity.
Transaction Cost
Displays the transaction cost.
Transaction Amount
Displays the transaction amount.
Transaction Currency
Displays the currency of the transaction cost and amount.
Converted Cost
Displays the transaction cost in the converted currency.
Converted Amount
Displays the transaction amount in the converted currency.
Converted Currency
Displays the converted currency.

Posted Transaction Review Portlet
Chapter 9: Financial Management Portlets 159
Converted Rate
Displays the conversion rate used to convert the transaction cost and amount to the converted cost and amount.
The following fields are available for this portlet and you can add them through the configure option:
See the Personalizing CA Clarity User Guide for more information.
Investment Class
Investment Department
Investment Entity
Investment ID
Investment Location
Notes Entered on the Transaction
Resource Class
Resource Department
Resource ID
Resource Location
Task ID
Transaction Number
Transaction Rate
Transaction Type
User Lov 1
User Lov 2
WIP Class
Billing Cost
Billing Amount
Billing Currency
Billing Rate
Reporting Cost
Reporting Amount
Reporting Currency
Reporting Rate

Posted Transaction Review Portlet [Investment Level]
160 PMO Accelerator Product Guide
Posted Transaction Review Portlet [Investment Level]
The Posted Transactions Review portlet at the investment level displays financial transactions for an investment by transaction date and includes quantity, cost, and currency information. Use this portlet to compare transaction currency amounts to converted currency amounts by task and resource.
Follow these steps:
1. Open an investment and click Financial Plans.
The cost plans list page appears.
2. Click a cost plan name.
The cost plan details page appears.
3. Open the Actions menu and click Posted Transaction Review.
The following fields appear on this portlet:
Transaction Date
Displays the date of the transaction.
Task
Displays the task name associated with the transaction. Click a task name to view the task properties.
Charge Code
Displays the charge code associated with the transaction (for example, Expense or Capital).
Resource
Displays the resource name associated with the transaction. Click a resource name to view the resource properties.
Transaction Class
Displays the transaction class associated with the transaction (for example, Internal Labor or External Labor).
Input Type Code
Displays the input type code associated with the transaction.
Quantity
Displays the transaction quantity.
Transaction Cost
Displays the transaction cost.

Posted Transaction Review Portlet [Investment Level]
Chapter 9: Financial Management Portlets 161
Transaction Amount
Displays the transaction amount.
Transaction Currency
Displays the currency of the transaction cost and amount.
Converted Cost
Displays the transaction cost in the converted currency.
Converted Amount
Displays the transaction amount in the converted currency.
Converted Currency
Displays the converted currency.

Posted Transaction Review Portlet [Investment Level]
162 PMO Accelerator Product Guide
Converted Rate
Displays the conversion rate used to convert the transaction cost and amount to the converted cost and amount.
The following fields are available for this portlet and you can add them through the configure option:
See the Personalizing CA Clarity User Guide for more information.
Investment Class
Investment Department
Investment Entity
Investment ID
Investment Location
Notes Entered on the Transaction
Resource Class
Resource Department
Resource ID
Resource Location
Task ID
Transaction Number
Transaction Rate
Transaction Type
User Lov 1
User Lov 2
WIP Class
Billing Cost
Billing Amount
Billing Currency
Billing Rate
Reporting Cost
Reporting Amount
Reporting Currency
Reporting Rate

Chapter 10: Additional Portlets 163
Chapter 10: Additional Portlets
This section contains the following topics:
About the Additional Portlets (see page 163) Project Cycle Time Analysis Portlet (see page 163) Project Lifecycle Review Portlet (see page 164) Process Bottlenecks Portlet (see page 167) Project Analysis Portlet (see page 168) Resource Utilization Percentage by Month Portlet (see page 171) Late Tasks and Milestones Portlet (see page 172) Team Member Task Summary Portlet (see page 174)
About the Additional Portlets
This section contains additional portlets that are included with the PMO Accelerator add-in, but are not included on any pages after the installation. You can use Studio to add the portlets and CA Clarity PPM pages.
Contact your CA Clarity PPM administrator or see the Administration Guide for more information.
Project Cycle Time Analysis Portlet
The Project Cycle Time Analysis portlet displays the number of days spent in each project phase illustrated as a bar graph. Use this portlet to compare time spent in each phase for projects based on the same methodology. The project templates installed with the PMO Accelerator add-in are considered project methodologies. To use this portlet, select a methodology.
Follow these steps:
1. With the project open, open the Properties menu, and click Settings.
The project settings page appears.
2. Click the Methodology drop-down menu and select a project methodology.
By default, the bar graph displays duration of each project phase in the methodology. The X-axis shows the duration in days. The Y-axis shows the corresponding project phase. The length of each bar in the graph represents the distribution of project duration by phase. Click one of the bars to open the properties page of the specific project. Click a graph legend entry to exclude that group from the graph.

Project Lifecycle Review Portlet
164 PMO Accelerator Product Guide
Project Lifecycle Review Portlet
The Project Lifecycle Review portlet displays the schedule status of each project phase. Use this portlet for a phase schedule overview of projects based on the same project methodology.
To use this portlet, select a methodology.
Follow these steps:
1. With the project open, open the Properties menu, and click Settings.
The project settings page appears.
2. Click the Methodology drop-down menu and select a project methodology.
The portlet displays the following fields:
Properties Icon
Displays an icon that links to the properties page of the project.
Project
Displays the project name. Click a project name to view the project dashboard.
Project Manager
Displays the name of the project manager.
Stage
Displays the stage of the project lifecycle as a progress bar. The gray squares indicate completed stages and the current stage is represented as a color, based on the Business Alignment of the investment.
Start
Displays the project start date.
Finish
Displays the project finish date.

Project Lifecycle Review Portlet
Chapter 10: Additional Portlets 165
Schedule%
Displays a stoplight indicating days late as a percentage of the project timeframe, which is finish date minus start date. The calculation takes into account the phase status and baseline (if a baseline exists). The color of the stoplight indicates if the phase is on schedule or late.
Stoplights:
■ Green. The phase is ahead of schedule or on schedule.
■ Yellow. The phase is between one and ten percent late.
■ Red. The phase is more than ten percent late.
■ White. The schedule percentage is undefined.
The following fields are available for this portlet and you can add them through the configure option:
See the Personalizing CA Clarity User Guide for more information.
Business Alignment
Displays how well the project aligns to the organization business goal. The higher the business alignment value is, the stronger the alignment.
Stoplights:
■ Green (68 through 100). The project has good alignment with the business.
■ Yellow (34 through 67). The project has average alignment with the business.
■ Red (0 through 33). The project has poor alignment with the business.
■ White. The alignment data is undefined.
Stage Name
Displays the stage in the lifecycle of the project.

Project Lifecycle Review Portlet
166 PMO Accelerator Product Guide
Days Late
Displays the number of days late considering the following:
■ Whether or not a baseline exists
■ Phase status
If a baseline exists, then days late is calculated as phase finish date minus baseline finish date. A positive number indicates that the phase is late according to the baseline. A negative number indicates that it is early according to the baseline.
If a baseline exists and the phase finish date is the same as the baseline finish date, then the phase is considered late if it is not completed and it was due before today’s date. In this case, days late is calculated as today’s date minus phase finish date.
If there is no baseline, then days late is calculated if the phase is not completed and it was due before today’s date. In this case, days late is calculated as today’s date minus phase finish date.
Schedule
Displays a stoplight indicating the number of days a phase is late, considering the phase status and whether or not a baseline exists for the phase. The color of the stoplight indicates if the phase is on schedule or late.
Stoplights:
■ Green. The phase is ahead of schedule or on schedule.
■ Yellow. The phase is between one and ten days late.
■ Red. The phase is more than ten days late.
■ White. The schedule is undefined.
Days Late %
Displays days late as a percentage of the project timeframe, which is finish date minus start date. The calculation takes into account the phase status and baseline (if a baseline exists).
Phase Status
Displays a stoplight for the phase status.
Stoplights:
■ Green. The phase is completed.
■ Yellow. The phase is started and on schedule, based on days late.
■ Red. The phase is started and late, based on days late.
■ White. The phase is not started or the phase does not exist on the project.

Process Bottlenecks Portlet
Chapter 10: Additional Portlets 167
Process Bottlenecks Portlet
The Process Bottlenecks portlet displays initiated processes and indicates how long an assigned resource took to respond to each process milestone step. Use this portlet to analyze if an action is taking longer than the required time and to reevaluate internal processes.
To view this portlet, select a process type from the filter at the top of the portlet. Verify the following:
■ The process type has at least one step designated as a milestone.
■ Before you activate a process, navigate to each process step considered a milestone and verify the milestone field.
See the Administration Guide for more information.
The following fields appear on this portlet:
Process
Displays the name of the process.
Instance
Displays the process instance name.
Flow Diagram
Displays the flow diagram icon. Click this icon to display the process flow diagram.
Initiated by
Displays the name of the person that initiated the process.
Duration Status
Displays a stoplight indicating the process step status, for each process milestone step.
Stoplights:
■ Green. The process step duration is less than three days.
■ Yellow. The process step duration is greater than or equal to three days and less than five days.
■ Red. The process step duration is five or more days.
Duration and Reviewers
Displays the duration and the reviewer names, for each process milestone step.
Project Analysis Portlet
168 PMO Accelerator Product Guide
Project Analysis Portlet
The Project Analysis portlet provides program managers with a view into the projects and tasks that are part of the program. Use this portlet to analyze the schedule of ongoing projects in the program.
You can configure this portlet to display on a program dashboard. This portlet does not display any data if it is placed on a page that is not a dashboard tab on the program object.
The following fields display on this portlet:
Project/Task
Displays the project name with the associated tasks under it. Click the project name to view all tasks for a project. Click a project name to view the project properties or a task name to view the task properties.
Team Icon
Displays an icon that links to the project team staff page.
Project Manager
Displays the project manager name.
Stage
Displays the stage in the lifecycle of the project.
Start Date
Displays the start date of the project or task.
Finish Date
Displays the finish date of the project or task.
Overall Status
Displays a stoplight indicating the overall status of each project based on its latest status report, based on report date.
Stoplights:
■ Green. The project status is on track.
■ Yellow. There is a minor variance in the project status.
■ Red. There is a significant variance in the project status.
■ White. The project status is undefined.

Project Analysis Portlet
Chapter 10: Additional Portlets 169
Schedule %
Displays the following:
■ Project Calculation. Displays a stoplight indicating days late as a percentage of the project timeframe, which is finish date minus start date. The calculation takes into account the project progress and baseline (if one exists). The color of the stoplight indicates if the project is on schedule or late.
■ Task Calculation. Displays a stoplight indicating days late as a percentage of the summary task or project timeframe, which is finish date minus start date. If the task has a parent task in the WBS, then the parent task’s timeframe is used in the calculation. If the task is at the top level of the WBS and does not have a parent task, then the project’s timeframe is used in the calculation.
The calculation takes into account the task status and baseline (if one exists). The color of the stoplight indicates if the task is on schedule or late.
Stoplights:
■ Green. The project or task is ahead of schedule or on schedule.
■ Yellow. The project or task is between one and ten percent late.
■ Red. The project or task is more than ten percent late.
■ White. The schedule percentage is undefined.
Days Late
Displays the number of days late considering the following:
■ Whether or not a baseline exists
■ Project progress or task status
If a baseline exists, then days late is calculated as project or task finish date minus baseline finish date. A positive number indicates that the project or task is late according to the baseline. A negative number indicates that it is early according to the baseline.
If a baseline exists and the project or task finish date is the same as the baseline finish date, then the project or task is considered late if it is not completed and it was due before today’s date. In this case, days late is calculated as today’s date minus project or task finish date.
If there is no baseline, then days late is calculated if the project or task is not completed and it was due before today’s date. In this case, days late is calculated as today’s date minus project or task finish date.

Project Analysis Portlet
170 PMO Accelerator Product Guide
Gantt Schedule
Displays a Gantt chart that shows the start and finish dates of the projects and tasks. The color of the Gantt bars is based on the schedule percentage as follows:
■ Green. The project or task is ahead of schedule or on schedule.
■ Yellow. The project or task is between one and ten percent late.
■ Red. The project or task is more than ten percent late.
■ White. The schedule percentage is undefined.
The following fields are available for this portlet and you can add them through the configure option:
See the Personalizing CA Clarity User Guide for more information.
Baseline Start
Displays the baseline start date of the project or task.
Baseline Finish
Displays the baseline finish date of the project or task.
Business Alignment
Displays how well the project aligns to the organization business goal. The higher the business alignment value is, the stronger the alignment.
Stoplights:
■ Green (68 through 100). The project has good alignment with the business.
■ Yellow (34 through 67). The project has average alignment with the business.
■ Red (0 through 33). The project has poor alignment with the business.
■ White. The alignment data is undefined.
Status Indicator
Displays a stoplight that shows the status of each project based on its status indicator.
Source: Schedule & Performance project properties page.
Stoplights:
■ Green. The project is on track.
■ Yellow. The project is at risk.
■ Red. The project is critical.
■ White. The project status indicator is undefined.

Resource Utilization Percentage by Month Portlet
Chapter 10: Additional Portlets 171
Days Late %
■ Project Calculation. Displays days late as a percentage of the project timeframe, which is finish date minus start date. The calculation takes into account the project progress and baseline (if a baseline exists).
■ Task Calculation. Displays days late as a percentage of the summary task or project timeframe, which is finish date minus start date. If the task has a parent task in the WBS, then the parent task timeframe is used in the calculation. If the task is at the top level of the WBS and does not have a parent task, then the project timeframe is used in the calculation.
The calculation takes into account the task status and baseline (if a baseline exists).
Schedule
Displays a stoplight indicating the number of days a project or task is late, considering the following:
■ Project progress or task status
■ Whether or not a baseline exists for the project or task.
The color of the stoplight indicates if the project or task is on schedule or late.
Stoplights:
■ Green. The project or task is ahead of schedule or on schedule.
■ Yellow. The project or task is between one and ten days late.
■ Red. The project or task is more than ten days late.
■ White. The schedule is undefined.
Resource Utilization Percentage by Month Portlet
The Resource Utilization Percentage by Month portlet displays resource assignments as a percentage of allocations by month, illustrated in a column graph. Use this portlet to verify that all resources assigned to the projects are fully utilized.
You can configure this portlet to display on a program dashboard.
The X-axis of the column graph is months, starting with the current month. The Y-axis of the graph displays resource utilization as a percentage. You can configure the graph to display resource allocation and assignment hours on the Y-axis.

Late Tasks and Milestones Portlet
172 PMO Accelerator Product Guide
Late Tasks and Milestones Portlet
The Late Tasks and Milestones portlet provides a list of late tasks and milestones for a project and includes a Gantt chart. Use this portlet to view a list of tasks that are not completed or late.
You can configure the Late Tasks and Milestones portlet to display on a project Dashboard.
The following fields display on this portlet:
Task
Displays the name of the task. Click a task name link to view the task properties.
Task ID
Displays the ID of the task.
Finish
Displays the task finish date.
Status
Displays the task status (Not Started, Started, or Completed).
Schedule %
Displays a stoplight indicating days late as a percentage of the summary task or project timeframe, which is finish date minus start date. If the task has a parent task in the WBS, then the parent task timeframe is used in the calculation. If the task is at the top level of the WBS and does not have a parent task, then the project timeframe is used in the calculation.
The calculation takes into account the task status and baseline (if a baseline exists). The color of the stoplight indicates if the task is on schedule or late.
Stoplights:
■ Green. The task is ahead of schedule or on schedule.
■ Yellow. The task is between one and ten percent late.
■ Red. The task is more than ten percent late.
■ White. The schedule percentage is undefined.

Late Tasks and Milestones Portlet
Chapter 10: Additional Portlets 173
Days Late
Displays the number of days late considering the following:
■ Whether or not a baseline exists
■ Task status
If a baseline exists, then days late is calculated as task finish date minus baseline finish date. A positive number indicates that the task is late according to the baseline. A negative number indicates that it is early according to the baseline.
If a baseline exists and the task finish date is the same as the baseline finish date, then the task is considered late if it is not completed and it was due before today’s date. In this case, days late is calculated as today’s date minus task finish date.
If there is no baseline, then days late is calculated if the task is not completed and it was due before today’s date. In this case, days late is calculated as today’s date minus task finish date.
Gantt Schedule
Displays a Gantt chart that shows the start and finish dates of the tasks and finish dates of the milestones. The color of the Gantt is based on the schedule percentage as follows:
■ Green. The task is ahead of schedule or on schedule.
■ Yellow. The task is between one and ten percent late.
■ Red. The task is more than ten percent late.
■ White. The schedule percentage is undefined.
The following fields are available for this portlet and you can add them through the configure option:
See the Personalizing CA Clarity User Guide for more information.
Start
Displays the task start date.
Baseline Start
Displays the baseline start date of the task.
Baseline Finish
Displays the baseline finish date of the task.

Team Member Task Summary Portlet
174 PMO Accelerator Product Guide
Schedule
Displays a stoplight indicating the number of days a task is late, considering the task status and whether or not a baseline exists for the task. The color of the stoplight indicates if the task is on schedule or late.
Stoplights:
■ Green. The task is ahead of schedule or on schedule.
■ Yellow. The task is between one and ten days late.
■ Red. The task is more than ten days late.
■ White. The schedule is undefined.
Days Late %
Displays days late as a percentage of the summary task or project timeframe, which is finish date minus start date. If the task has a parent task in the WBS, then the parent task timeframe is used in the calculation. If the task is at the top level of the WBS and does not have a parent task, then the project timeframe is used in the calculation.
The calculation takes into account the task status and baseline (if a baseline exists).
Team Member Task Summary Portlet
The Team Member Task Summary portlet displays resource assignments, ETC, pending actuals, and actuals for project tasks. Use the portlet to analyze task schedule by resource and review estimates and actuals.
You can configure this portlet to display on a project dashboard.
The following fields display on this portlet:
Properties Icon
Displays an icon that links to the properties page of the project.
Project
Displays the project name. Click a project name to view the project dashboard.
Task
Displays the name of the task. Click a task name to view the task properties.
Guidelines
Displays the guidelines icon. Click the icon to go to the guidelines page. This page defines the file path and file name for the guidelines your organization follows for this task.
Team Member Task Summary Portlet
Chapter 10: Additional Portlets 175
Resource/Role
Displays the resource or role assigned to the task. Click a resource or role name link to view the properties.
Priority
Displays a stoplight that indicates the priority status of a task.
Stoplights:
■ Green (24 through 36). The task priority is low.
■ Yellow (12 through 23). The task priority is medium.
■ Red (0 through 11). The task priority is high.
Status
Indicates the status of the task.
Values: Not Started, Started, or Completed
Schedule %
Displays a stoplight indicating days late as a percentage of the summary task or project timeframe, which is finish date minus start date. If the task has a parent task in the WBS, then the parent task timeframe is used in the calculation. If the task is at the top level of the WBS and does not have a parent task, then the project timeframe is used in the calculation.
The calculation takes into account the task status and baseline (if a baseline exists). The color of the stoplight indicates if the task is on schedule or late.
Stoplights:
■ Green. The task is ahead of schedule or on schedule.
■ Yellow. The task is between one and ten percent late.
■ Red. The task is more than ten percent late.
■ White. The schedule percentage is undefined
Team Member Task Summary Portlet
176 PMO Accelerator Product Guide
Days Late
Displays the number of days late considering the following:
■ Whether or not a baseline exists
■ Task status
If a baseline exists, then days late is calculated as task finish date minus baseline finish date. A positive number indicates that the task is late according to the baseline. A negative number indicates that it is early according to the baseline.
If a baseline exists and the task finish date is the same as the baseline finish date, then the task is considered late if it is not completed and it was due before today’s date. In this case, days late is calculated as today’s date minus task finish date.
If there is no baseline, then days late is calculated if the task is not completed and it was due before today’s date. In this case, days late is calculated as today’s date minus task finish date.
ETC
Defines the number of hours estimated to complete a task. Once a task is started, ETC reflects the number of remaining hours estimated to complete it.
Pending Actuals
Displays the amount of unposted actuals for the task.
Actuals
Defines the total number of hours submitted and posted for the task.
Gantt Schedule
Displays a Gantt chart that shows the start and finish dates of the assignments. The color of the Gantt bars is based on the schedule percentage as follows:
■ Green. The task is ahead of schedule or on schedule.
■ Yellow. The task is between one and ten percent late.
■ Red. The task is more than ten percent late.
■ White. The schedule percentage is undefined.
The following fields are available for this portlet and you can add them using the configure option.
See the Personalizing CA Clarity User Guide for more information.
Assignment Start
Displays the start date of the assignment.
Assignment Finish
Displays the finish date of the assignment.

Team Member Task Summary Portlet
Chapter 10: Additional Portlets 177
Project ID
Displays the project ID, which is the identifier of the project.
Days Late %
Displays days late as a percentage of the summary task or project timeframe, which is finish date minus start date. If the task has a parent task in the WBS, then the parent task timeframe is used in the calculation. If the task is at the top level of the WBS and does not have a parent task, then the project timeframe is used in the calculation.
The calculation takes into account the task status and baseline (if a baseline exists).
Schedule
Displays a stoplight indicating the number of days a task is late, considering the task status and whether or not a baseline exists for the task. The color of the stoplight indicates if the task is on schedule or late.
Stoplights:
■ Green. The task is ahead of schedule or on schedule.
■ Yellow. The task is between one and ten days late.
■ Red. The task is more than ten days late.
■ White. The schedule is undefined.


Chapter 11: Lookup Mapping Object 179
Chapter 11: Lookup Mapping Object
This section contains the following topics:
About Lookup Mapping (see page 179) Create a Lookup Mapping List (see page 179) Delete a Lookup Mapping List (see page 180)
About Lookup Mapping
Use the lookup mapping page to manage the available list of Idea Category values. The values are located on the Idea Type section of the create idea page. The following are the different combination types for the Project Type or Category lookups:
■ Application Change and COTS Evaluation
■ Application Change and Enhancement
■ Infrastructure Deployment and Desktop
■ Infrastructure Deployment and Distributed
■ Infrastructure Deployment and Network/Telecom
■ Major Project and Compliance/Regulatory
■ Major Project and New Development
■ Major Project and New Product or Service
■ Major Project and Other
Create a Lookup Mapping List
Follow these steps:
1. Open the Setup menu and click Lookup Mapping.
The lookup filters page appears.
2. Click New.
The create lookup mapping page appears.
3. Complete the following fields in the General section:
Mapping Type
Defines the two lookup values (parent/child) for mapping.
Default: Idea and Project Type/Category

Delete a Lookup Mapping List
180 PMO Accelerator Product Guide
Parent Lookup
Defines the first lookup mapped. The value selected in Mapping Type defines the parent lookup value.
Values: Application Change, Infrastructure Deployment, or Major Project
Child Lookup
Defines the second lookup mapped. The value stores the partition information for a lookup mapping instance.
Values: New Development, Compliance/Regulatory, New Product or Service, Other, Enhancement, COTS Evaluation, Distributed, Network/Telecom, or Desktop
4. Save the changes.
The lookup mapping list is created.
Delete a Lookup Mapping List
You can delete the lookup mappings that you create. Also, the system and system-restricted lookup mappings cannot be deleted.
Note: A deleted mapping gets deleted from the database. Therefore, you cannot reactivate a deleted lookup mapping.
Follow these steps:
1. Open the Setup menu and click Lookup Mapping.
The lookup filters page appears.
2. Click the name of the lookup containing the values to delete.
The list page appears.
3. Select the check box next to the lookup mapping list.
4. Click Delete.
The confirmation page appears.
5. Click Delete.
The lookup mapping list is deleted.

Chapter 12: Crystal Reports 181
Chapter 12: Crystal Reports
This section contains the following topics:
About Default Crystal Reports (see page 181) Access to Crystal Reports (see page 181) Capacity vs. Demand By Role Report (see page 183) Capacity vs. Demand By Resource Report (see page 186) Program Schedule Review Report (see page 189) Project Storyboard Report (see page 193) Resource Availability Report (see page 199) Resource Forecasted Utilization Report (see page 200) Resource Forecasted Utilization Detail Report (see page 203) Timesheet Detail Report (see page 206)
About Default Crystal Reports
Default Crystal Reports are included with PMO Accelerator. This section lists and provides a description of the default reports, the requirements for running the report, and the parameters to filter data.
Contact your CA Clarity PPM administrator or see the Administration Guide for more information.
Access to Crystal Reports
To access the Program Schedule Review and Project Storyboard reports, associate with one of the following access groups to view, execute, or modify the reports. You also require access to view the investment (program or project).
■ PMO Accelerator Business Sponsor
■ PMO Accelerator Project Manager
■ Business Analyst
■ System Administrator
■ Report Administrator
■ Report and Job Administrator

Access to Crystal Reports
182 PMO Accelerator Product Guide
The default Resource Forecasted Utilization, Resource Forecasted Utilization Detail, Capacity vs. Demand by Resource, Capacity vs. Demand by Role, and Resource Availability reports are available. To view, execute, or modify the reports, associate with one of the following access groups:
■ PMO Accelerator Business Sponsor
■ PMO Accelerator Project Manager
■ PMO Accelerator Program Manager
■ PMO Accelerator Portfolio Manager
■ Business Analyst
■ System Administrator
■ Report Administrator
■ Report and Job Administrator
You also require the following global access rights:
Resource - View - All
Lets you view information, except the financial properties of all resources.
Type: Global
Resource - Navigate
Allows you to access resource management pages.
Type: Global
Timesheets - Edit All
Allows users to edit all timesheets.
Type: Global
Timesheets - Navigate
Lets you navigate to timesheet pages.
Type: Global

Capacity vs. Demand By Role Report
Chapter 12: Crystal Reports 183
Capacity vs. Demand By Role Report
Description
This report summarizes resource availability (capacity) against demand at the role level rather than at the individual resource level to facilitate strategic resource management decisions.
If you define a portfolio, the report displays all the roles associated with that portfolio - whether approved or unapproved project is active. The portfolio name is listed at the top of the report. Next, the various roles under that portfolio list. For each role, the total hours for capacity, demand, and available hours (that is, capacity minus demand) list across a given time period. On the far right, a total column is included that sums the hours on a row by row basis. Each instance of a portfolio displays separately.
If you did not define portfolio, the resources do not organize or display by portfolio.
Null or unassigned roles list separately at the bottom of the report and are included in the totals.
Prerequisites
■ Active projects/investments staffed with active resources.
■ Active resources with defined primary roles required.
■ Actual timesheet data required.
■ Allocate and assign resources to specific active projects/investments.
■ Portfolios with active projects/investments exist (optional)
See the Portfolio Management User Guide for more information.
Parameters
Report Name
Indicates the names of the report.
Resource OBS
Indicates the OBS unit that filters the report. Click the Browse icon and select OBS from the list that appears.
Report Periods
Defines the time periods for data to display in the report.
Values: months or weeks
Starting Date
Indicates the starting date for the data displayed in this report.

Capacity vs. Demand By Role Report
184 PMO Accelerator Product Guide
Type of Hours
Indicates the type of hours for the resources.
Values: allocated or assigned
Resource Role
Defines the resource roles for the report.
Resource Manager
Identifies the resource manager whose data displays in the report. Click the Browse icon to select names.
Portfolio
Defines the portfolio is associated with the report.
Report Fields
Portfolio
Displays the defined portfolio associated with the resources.
Database Tables and Columns:
pma_portfolios.name
Resource Role
Displays the role for the associated resource.
Database Tables and Columns:
srm_resources.full_name where srm_resources.id = prj_resources.prprimaryroleid
Demand
Displays the total number of assigned or allocated hours for the associated resource.
Database Tables and Columns:
prj_blb_slices.slice where slice_request_id = (select id from prj_blb_slicerequests
where request_name like 'monthlyresourcealloccurve')
prj_blb_slices.slice where slice_request_id = (select id from prj_blb_slicerequests
where request_name like ' weeklyresourcealloccurve '

Capacity vs. Demand By Role Report
Chapter 12: Crystal Reports 185
Capacity
Displays the total number of available hours for the associated resource.
Database Tables and Columns:
If the period type = “Months” then ptj_blb_slices.slice where - prj_blb_slices.slice_request_id = (select id from prj_blb_slicerequests
where request_name like 'monthlyresourceavailcurve')
If the period type = “Weeks” then prj_blb_slices.slice where - prj_blb_slices.slice_request_id = (select id from prj_blb_slicerequests
where request_name like 'weeklyresourceavailcurve')
Available
Displays the availability for the associated resource.
Calculation: (Capacity - Demand)
Database Tables and Columns:
Calculated field. For more information, see the SQL statement for the report.
Difference
Displays the difference between availability and total demand for the associated resource, based on the following calculation:
Difference = Available - Demand
Database Tables and Columns:
Calculated field. For more information, see the SQL statement for the report.

Capacity vs. Demand By Resource Report
186 PMO Accelerator Product Guide
Capacity vs. Demand By Resource Report
Description
This report shows the availability (capacity) of resources against their demand for specific investments over a given duration. The report lists availability for each resource, the demand for that resource for each investment, and the total demand for that resource for all investments. If you define a portfolio, the report displays all the resources associated with that portfolio regardless of investments that are active (approved or unapproved).
If defined, each resource list separately by portfolio. Under each resource, the total available hours per period (months or weeks) list, with the active investments assigned to a resource. The number of hours assigned (that is, demand) is distributed between the investments. A total demand value displays per period and the difference between availability and total demand. A column on the far right shows the total availability and demand on a row-by-row basis.
If you did not define a portfolio, the resources do not organize or display by portfolio.
Prerequisites
■ Active investments staffed with active resources required in the system.
■ Actual timesheet data required in the system.
■ Allocate and assign resources to specific active investments.
■ Portfolios with active investments exist (optional).
See the Portfolio Management User Guide for more information.
Parameters
Report Name
Indicates the names of the report.
Resource OBS
Indicates the OBS unit that filters the report. Click the Browse icon and select OBS from the list that appears.
Report Periods
Defines the time periods for data to display in the report.
Values: months or weeks
Starting Date
Indicates the starting date for the data displayed in this report.

Capacity vs. Demand By Resource Report
Chapter 12: Crystal Reports 187
Type of Hours
Indicates the type of hours for the resources.
Values: allocated or assigned
Resource Role
Defines the resource roles for the report.
Resource Manager
Identifies the resource manager whose data displays in the report. Click the Browse icon to select names.
Resource Name
Indicates the names of the resource that the report provides data about. Click the Browse icon and select names from the list that appears.
Group By
Indicates the grouping and presenting information in the report. Select an option from the drop-down to group the information.
Portfolio
Defines the portfolio is associated with the report.
Status
Indicates the status of resource timesheets included in the report. You can select multiple statuses.
Report Fields
Investment Name
Displays the name of the investment associated with the resources.
Database Tables and Columns:
nbi_project_current_facts.project_name
Portfolio
Displays the defined portfolio associated with the resources.
Database Tables and Columns:
pma_portfolios.name
Investment Status
Displays the status of the investment for this report.
Database Tables and Columns:
All/Approved/Unapproved (derived from the report parameter "Status.")

Capacity vs. Demand By Resource Report
188 PMO Accelerator Product Guide
Resource Role
Displays the role for the associated resource.
Database Tables and Columns:
srm_resources.full_name
Resource Name
Displays the full name of the resource.
Database Tables and Columns:
srm_resources.last_name
srm_resources.first_name
Capacity
Displays the total number of available hours for the associated resource.
Database Tables and Columns:
srm_resources.full_name
Available
Displays the availability for the associated resource.
Calculation: (Capacity - Demand)
Database Tables and Columns:
Calculated field. For more information, see the SQL statement for the report.
Demand
Displays the total number of assigned or allocated hours for the associated resource.
Database Tables and Columns:
prj_blb_slices.slice where slice_request_id = (select ID from prj_blb_slicerequests
where request_name like 'monthlyresourcealloccurve')
prj_blb_slices.slice where slice_request_id = (select ID from prj_blb_slicerequests
where request_name like 'weeklyresourcealloccurve')
Difference
Displays the difference between availability and total demand for the associated resource, based on the following calculation:
Difference = Available - Demand
Database Tables and Columns:
Calculated field. For more information, see the SQL statement for the report.

Program Schedule Review Report
Chapter 12: Crystal Reports 189
Program Schedule Review Report
Description
This report provides a Gantt chart of the projects within a program, including milestones. The report lists the full or summary detail, and identifies inter-project dependencies.
Prerequisites
■ Define a program.
■ Active projects under a program required with start and finish dates and status and risk fields defined.
■ Detailed work breakdown structure required with milestones for the project tasks.
See the Project Management User Guide for more information.
Parameters
Report Name
Indicates the names of the report.
Program Name
Defines the name of the program for the report.
Starting Month
Indicates the starting month for the report.
Starting Year
Defines the starting year for the report.
Level of Detail
Specifies the level of task detail to generate in the report.
Values: Full WBS, Milestones Only, Summary Only
Type of Period
Indicates the type of periods to generate in the report.
Values: Monthly, Semi-Annually
Report Fields
Program Name
Displays the program name for the report.
Database Tables and Columns:
inv_investments.name

Program Schedule Review Report
190 PMO Accelerator Product Guide
Program ID
Displays the unique ID for the program.
Database Tables and Columns:
inv_investments.code
Description
Displays the program description.
Database Tables and Columns:
inv_investments.description
Start Date
Displays the start date for the program.
Database Tables and Columns:
inv_investments.schedule_start
Finish Date
Displays the finish date for the program.
Database Tables and Columns:
inv_investments.schedule_finish
Base Start
Displays the baseline start date for the program.
Database Tables and Columns:
prj_baseline_details.start_date
Base Finish
Displays the baseline end date for the program.
Database Tables and Columns:
prj_baseline_details.finish_date
Status
Displays the program schedule status (Green, Yellow, or Red)
Database Tables and Columns:
odf_project_v2.status_indicator

Program Schedule Review Report
Chapter 12: Crystal Reports 191
Risk
Displays the program risk status.
Database Tables and Columns:
case
when niku.cmn_null_int_fct(odf_project_v2.risk,
-1) = -1
then 0
when niku.cmn_null_int_fct(odf_project_v2.risk,
-1) <= 33
then 1
when niku.cmn_null_int_fct(odf_project_v2.risk,
-1) > 67
then 3
when niku.cmn_null_int_fct(odf_project_v2.risk,
-1) > 33
then 2
else 0
end
Stage
Displays the current stage of the program.
Database Tables and Columns:
inv_investments.stage_code
WBS
Displays the work breakdown structure for the program.
Database Tables and Columns:
prtask.prname

Program Schedule Review Report
192 PMO Accelerator Product Guide
Status/Risk
Displays the status of risk for the current program.
Database Tables and Columns:
odf_project_v2.status_indicator /
case
when niku.cmn_null_int_fct(odf_project_v2.risk,
-1) = -1
then 0
when niku.cmn_null_int_fct(odf_project_v2.risk,
-1) <= 33
then 1
when niku.cmn_null_int_fct(odf_project_v2.risk,
-1) > 67
then 3
when niku.cmn_null_int_fct(odf_project_v2.risk,
-1) > 33
then 2
else 0
end
Project Name
Displays the project name.
Database Tables and Columns:
inv_investments.name
Finish Date
Displays the finish date of the project.
Database Tables and Columns:
prtask.prfinish

Project Storyboard Report
Chapter 12: Crystal Reports 193
Project Storyboard Report
Description
This report allows project managers to obtain monthly status reporting for project stakeholders. Each section in the report displays information about risks, issues, finances, and schedule status related to the project.
Data divides into the following sections:
■ Project Storyboard information
■ Labor Effort
■ Financial Performance
■ Current Risks and Issues
■ Project Risks
■ More Risks
■ Project Analysis
The Report Fields section describes the fields for each of the previous sections.
The following links are available from the report:
■ Links to more issues and more risks that take you to the Issues and Risks section for this project in CA Clarity PPM. Only a limited number of issues and risks display on the report. Use the links to view additional risks and issue items.
■ Link to the full project plan that drills you down to the task list page for the project in CA Clarity PPM. This page contains the complete task list details. Only a limited number of key tasks can display on the report. Use this link or the More link to look for additional key tasks. The totals compute for all tasks, if not for all the key tasks list.
Prerequisites
The project requires being active (either approved or unapproved) with the following information defined:
■ Start/finish dates
■ Project description
■ Project manager
■ Simple budget or approved financial plan
■ Project status
■ Detailed task lists (WBS)

Project Storyboard Report
194 PMO Accelerator Product Guide
■ Actuals for at least one time period
■ Risks and issues defined for the project
See the Project Management User Guide for more information.
Parameters
Report Name
Indicates the names of the report.
Project Manager
Indicates the manager whose projects appear on the report.
Project
Indicates the project to report data about.
OBS Unit
Indicates the OBS unit to filter the report.
Pie Chart
The report contains a pie chart that shows the sum of all risks and issues. Each pie slice displays the percentages of high priority, medium priority, and low priority risks and issues.
Report Fields
Project Name
Displays the name of the project for the report.
Database Tables and Columns:
Inv_investments.name
Project Manager
Displays the name of the project manager.
Database Tables and Columns:
Inv_investments.manager_id
Approval Status
Displays the approval status for the project. The value calculates using the following formula: (IF INV_INVESTMENTS.approvedtime IS NULL THEN Unapproved else Approved)
Database Tables and Columns:
Inv_investments.approvedtime

Project Storyboard Report
Chapter 12: Crystal Reports 195
Start Date
Displays the original start date for the project.
Database Tables and Columns:
Inv_projects.prbasestart
Finish Date
Displays the original finish date for the project.
Database Tables and Columns:
inv_projects.prbasefinish
Project Description
Displays a description for the project.
Database Tables and Columns:
inv_investments.description
Project Status
Displays the schedule status for the project.
Database Tables and Columns:
inv_investments.status_comment
Total Effort
Indicates the total effort value for the project in days.
Database Tables and Columns:
prassignment.practsum+prassignment.prestsum
Actuals
Displays the actuals effort value for the project.
Database Tables and Columns:
prassignment.practsum
Estimate to Complete
Displays the estimated effort value to complete the project.
Database Tables and Columns:
prassignment.prestsum
Baseline
Displays the baseline value for the project.
Database Tables and Columns:
prj_baseline_details.usage_sum

Project Storyboard Report
196 PMO Accelerator Product Guide
Baseline Variance
Displays the variance in the baseline and the total effort for the project
Calculation: (Baseline - Total Effort)
Database Tables and Columns:
Calculated field. For more information, see the SQL statement for the report.
Remaining Allocation
Displays the remaining allocation value in hours for the project.
Database Tables and Columns:
prj_blb_slices.slice where slice_request_id = 10
Allocation Variance
Displays the difference between Remaining Allocation and Total Effort for the project.
Calculation: (Remaining Allocation - Total Effort)
Database Tables and Columns:
Calculated field. For more information, see the report statement for the report.
ROI
Displays the return on investment value for the project.
Database Tables and Columns:
List
Budget Benefit
Displays the budgeted benefit value for this project.
Database Tables and Columns:
List
Budget Cost
Displays the budgeted cost value for the project.
Database Tables and Columns:
List
Actual Cost
Displays the actual cost value for this project.
Database Tables and Columns:
List

Project Storyboard Report
Chapter 12: Crystal Reports 197
EAC Cost
Displays the expected total cost value for the project based on performance.
Database Tables and Columns:
List
Budget EAC Variance
Displays the difference between the Budget Cost and EAC Cost Value.
Database Tables and Columns:
List
Current Risks and Issues
Displays a pie chart listing the number of risks and issues associated with a project.
Database Tables and Columns:
Calculated field. For more information, see the SQL statement for the report.
Risk ID
Displays a unique identifier assigned to the issue for tracking.
Database Tables and Columns:
List
Risk Description
Displays a short description of the issue.
Database Tables and Columns:
List
Target
Displays the date this issue was targeted to be resolved.
Database Tables and Columns:
List
Assigned to
Displays the name of the user assigned to the risk.
Database Tables and Columns:
List
Task Name
Displays the task name for each project milestone.
Database Tables and Columns:
prtask.prname

Project Storyboard Report
198 PMO Accelerator Product Guide
Start
Displays the start date for each associated task name.
Database Tables and Columns:
prtask.prstart
Finish
Displays the finish date for each associated task name.
Database Tables and Columns:
prtask.prfinish
% Complete
Displays the percentage completed for each associated task name.
Database Tables and Columns:
prtask.prpctcomplete
Status
Displays the status for each associated task name.
Database Tables and Columns:
prtask.prstatus
Planned Value
Displays the rolled up planned value for each task under each milestone.
Database Tables and Columns:
prj_baseline_details.cost_sum
Actual Cost
Displays the rolled up actual costs of each task under each milestone.
Database Tables and Columns:
case when srm_resources.resource_type < 2
then (prassignment.practsum/3600) / niku.prj_hpd_factor_fct()
else prassignment.practsum
end * npr.project_cost_rate
Earned Value
Displays the rolled up BCWP (Budgeted Cost of Work Performed to date) for each task under each milestone.
Database Tables and Columns:
prtask.prpctcomplete * prj_baseline_details.cost_sum

Resource Availability Report
Chapter 12: Crystal Reports 199
Resource Availability Report
Description
This report lists resources on projects and shows their total allocations or assignments over a specified time period.
The first section of this report lists the resource names and their resource roles (primary role) sorted alphabetically based on resource name. The second section lists the number of hours available for each resource based on the reporting periods selected. Total available hours display on a per resource basis (row-by-row) and by period (column).
Prerequisites:
■ Active projects must exist staffed with active resources.
■ Allocate and assign active resources to the specific active projects.
Parameters
OBS Unit
Indicates the OBS unit to filter the report.
Report Name
Indicates the names of the report.
Resource OBS
Indicates the OBS unit that filters the report. Click the Browse icon and select OBS from the list that appears.
Report Periods
Defines the time periods for data to display in the report.
Values: months or weeks
Starting Date
Indicates the starting date for the data displayed in this report.
Resource Role
Displays the role for the associated resource.
Resource Manager
Identifies the resource manager whose data displays in the report. Click the Browse icon to select names.

Resource Forecasted Utilization Report
200 PMO Accelerator Product Guide
Report Fields
Resource Name
Displays the full name of the resource.
Database Tables and Columns:
srm_resources.last_name
srm_resources.first_name
Resource Role
Displays the role for the associated resource.
Database Tables and Columns:
srm_resources.full_name
Role Name
Displays the role name.
Database Tables and Columns:
srm_resources.full_name where prj_resources.prprimaryroleid = srm_resources.id
Availability
Displays the availability (Available - Total Demand) for the associated resource.
Database Tables and Columns:
prj_blb_slices.slice where slice_request_id = (select id from prj_blb_slicerequests
where request_name like 'dailyresourceavailcurve')
Resource Forecasted Utilization Report
Description
This report lists the availability, allocation, and assignment of resources across the business. You can organize your resources into resource pools, which can be up to ten levels deep. By organizing your resources this way, you can summarize the resource availability and demand at each level of the pool.
At the highest level in the resource pool, you can see the hours for all resources. A resource manager can get an overall view of how many hours their resources are available and how they are committed moving into the future. As you drill down through the resource pool, you can view summary hours at each level.

Resource Forecasted Utilization Report
Chapter 12: Crystal Reports 201
Prerequisites
■ Resources must be in active status.
■ Actual timesheet data must exist in the system.
■ Allocate and assign resources to specific active investments (approved or unapproved).
See the Resource Management User Guide for more information.
See the CA Clarity Basics User Guide for more information.
Parameters
Report Name
Indicates the names of the report.
OBS Unit
Indicates the OBS unit to filter the report.
Number of Periods
Indicates the number of periods the report generates.
Starting Date
Indicates the starting date for the data displayed in this report.
Resource Role
Defines the resource roles for the report.
Report Periods
Defines the time periods for data to display in the report.
Values: months or weeks
Manager
Indicates the project manager associated with this report.
Bar Graph
The first section of the report presents a graphical bar chart across multiple time periods (up to ten from the current starting date). For each time period, the following displays (if applicable):
■ Sum of available hours
■ Sum of allocated hours
■ Sum of assigned hours

Resource Forecasted Utilization Report
202 PMO Accelerator Product Guide
Report Fields
Resource Name
Displays the full name of the resource.
Database Tables and Columns:
nbi_resource_time_facts.last_name
nbi_resource_time_facts.first_name
Manager Name
Displays the name of the project manager.
Database Tables and Columns:
nbi_resource_time_facts.manager_last_name
nbi_resource_time_facts.manager_first_name
Period Ending
Displays the period ending date based on whether the timesheet period is set as monthly or weekly.
Database Tables and Columns:
nbi_resource_time_facts.calendar_time_key
Available Hours
Displays the number of available hours for the associated resource.
Database Tables and Columns:
nbi_resource_time_facts.available_hours
Allocated Hours
Displays the number of allocated hours for the associated resource.
Database Tables and Columns:
nbi_resource_time_facts.allocated_hours
Remaining
Displays the remaining number of available hours for the associated resource.
Calculation: (Available Hours - Allocated Hours)
Database Tables and Columns:
Calculated field. For more information, see the SQL statement for the report.

Resource Forecasted Utilization Detail Report
Chapter 12: Crystal Reports 203
Percentage
Displays the percentage of allocated hours for the associated resource.
Calculation: (Allocated Hours/Available Hours * 100).
Database Tables and Columns:
Calculated field. For more information, see the SQL statement for the report.
Assigned Hours
Displays the number of assigned hours for the associated resource.
Database Tables and Columns:
nbi_resource_time_facts.etc_hours + nbi_resource_time_facts.actual_hours
Remaining
Displays the remaining available hours for the assigned resource.
Calculation: (Available Hours - Assigned Hours)
Database Tables and Columns:
Calculated field. For more information, see the SQL statement for the report.
Percentage
Displays the percentage of assigned hours for the associated resource.
Calculation: (Assigned Hours/Available Hours * 100)
Database Tables and Columns:
Calculated field. For more information, see the SQL statement for the report.
Resource Forecasted Utilization Detail Report
Description
This report is similar to the Resource Forecasted Utilization report, except that it adds a detailed schedule for a resource. In addition, it includes a list of the various investments and project tasks to which a resource is assigned and allocated. The report displays a detailed forecasted utilization for specific resources based on the requested start and end date parameters.
For each period ending (start date and end date), the provided totals for available, allocated, and assigned hours.

Resource Forecasted Utilization Detail Report
204 PMO Accelerator Product Guide
Prerequisites
■ All investments (approved or unapproved) must be in active status.
■ Actual timesheet data must exist in the system.
■ Allocate and assign resources to specific active investments.
■ Define charge codes for all active projects.
■ Define financial properties for active projects.
See the Project Management User Guide for more information.
Parameters
OBS Unit
Indicates the OBS unit to filter the report.
Report Name
Indicates the names of the report.
Resource Name
Indicates the names of the resource that the report provides data about. Click the Browse icon and select names from the list that appears.
Start Date
Indicates the start date for the report.
End Date
Indicates the end date for the report.
Report Fields
Project ID
Displays the unique ID of the project for the associated resource.
Database Tables and Columns:
nbi_project_res_task_facts.project_id
Investment Name
Displays the investment name for the associated resource.
Database Tables and Columns:
nbi_project_current_facts.project_name

Resource Forecasted Utilization Detail Report
Chapter 12: Crystal Reports 205
Task Name
Displays the task name for the associated resource.
Database Tables and Columns:
nbi_project_res_task_facts.task_description
Charge Code
Displays the charge code for the investment for the associated resource.
Database Tables and Columns:
nbi_project_res_task_facts.charge_code
Bill Rate
Displays the billing rate for the investment for the associated resource.
Database Tables and Columns:
nbi_project_res_task_facts.billable_rate
Allocated Hours
Displays the number of allocated hours for the associated resource.
Database Tables and Columns:
nbi_project_res_task_facts.allocated_qty
Assigned Hours
Displays the number of assigned hours for the associated resource.
Database Tables and Columns:
nbi_project_res_task_facts.etc_qty
nbi_project_res_task_facts.actual_qty
Resource Name
Displays the full name of the resource.
Database Tables and Columns:
nbi_resource_facrs.last_name
nbi_resource_facts.first_name
Period Ending
Displays the period ending date based on whether the timesheet period is set as monthly or weekly.

Timesheet Detail Report
206 PMO Accelerator Product Guide
Timesheet Detail Report
This report provides a listing of the hours a resource worked for a specified period based on the timesheet. Use this report to view all hours worked during certain time periods at certain regions or locations.
Use this report if you work with the following:
■ Resource Management to oversee time for a resource.
See the Resource Management User Guide for more information.
■ Project management
See the Project Management User Guide for more information.
■ Financial management
See the Financial Management User Guide for more information.
■ Service management
See the IT Service Management User Guide for more information.
■ Demand management
See the Demand Management User Guide for more information.
■ Portfolio management
See the Portfolio Management User Guide for more information.
Prerequisites
■ Resources must be set up and assigned a track mode of Time. Resources must have entered hours worked into their timesheet in CA Clarity PPM for the time period that is selected.
■ To use the OBS Unit parameter to filter the report, at least one OBS must be added to the system. In addition, an OBS unit must be assigned to the programs or projects.
Parameters
Report Name
Indicates the names of the report.
From Period
Defines the beginning of the effective date range for the report. To select a specific end date, select the Specific Date option. Then, type a date in the text field (mm/dd/yyyy format) or click the Date Picker to select a day from the calendar. To select a relative date, select the Relative Date option and select the relative date that applies from the drop-down list for the field.

Timesheet Detail Report
Chapter 12: Crystal Reports 207
To Period
Defines the end of the effective date range for the report. To select a specific day, select the Specific Date option. Then, type a date in the text field (mm/dd/yyyy format) or click the Date Picker to select a day from the calendar. To select a relative date, select the Relative Date option and select the relative date that applies from the drop-down list for the field.
Resource OBS
Indicates the OBS unit that filters the report. Click the Browse icon and select OBS from the list that appears.
Resource Manager
Identifies the resource manager whose data displays in the report. Click the Browse icon to select names.
Resource Name
Indicates the names of the resource that the report provides data about. Click the Browse icon and select names from the list that appears.
Report Fields
Hours
Displays in hours the time worked by a resource.
Database Tables and Columns:
prj_blb_slices.slice
Manager
Displays the name of the manager whose projects are being reported on.
Database Tables and Columns:
nbi_project_current_facts.manager_last_name
nbi_project_current_facts.manager_first_name
Note Category
Displays a category for the note (for example, Project or Personal).
Database Tables and Columns:
prnote.prcategory
Note Description
Displays the contents of the note.
Database Tables and Columns:
prnote.prvalue

Timesheet Detail Report
208 PMO Accelerator Product Guide
Project Name
Displays the name of project being reported on.
Database Tables and Columns:
nbi_project_current_facts. project_name
Resource ID
Displays the unique identifier for the resource.
Database Tables and Columns:
srm_resources.id
Resource Name
Displays the resource being reported on.
Database Tables and Columns:
nbi_resource_facts.full_name
Status
Displays the status of the timesheet for the reporting time period.
Database Tables and Columns:
prtimesheet.prstatus
Task Name
Displays a project task being reported on.
Database Tables and Columns:
prtask.prname
Time Period
Displays the reporting time period that has missing time for the resource. This field indicates the start and end dates of the time period.
Database Tables and Columns:
prtimeperiod.prstart
prtimeperiod.prfinish - 1

Chapter 13: Access Groups 209
Chapter 13: Access Groups
This section contains the following topics:
About Access Groups (see page 209) PMO Accelerator Business Sponsor Group (see page 209) PMO Accelerator Portfolio Manager Group (see page 211) PMO Accelerator Program Manager Group (see page 218) PMO Accelerator Project Manager Group (see page 226) PMO Accelerator Team Member Group (see page 234)
About Access Groups
The following access groups are included with the PMO Accelerator add-in. Content included with this add-in is for these access groups. Each access group is associated with certain access rights, which allow group members access to secured pages, portlets, reports, and queries.
Access rights for Lookup Mapping are not assigned to any group. When necessary, your CA Clarity PPM administrator can add these rights for you.
See the Administration Guide for more information.
PMO Accelerator Business Sponsor Group
Business sponsors are customers of IT, not necessarily in the IT organization. They are primarily concerned with the direction and performance of their investments. This type of resource may be nontechnical. Members of the PMO Accelerator Business Sponsor group monitor project and other work costs and performance. They also enter and respond to demand.
The following are the page views that are included with the instance access rights:
Page - View
Allows users to view a general page in CA Clarity PPM. For instance pages (such as portfolio pages), this right is not required.
Type: Instance
Issues and Risks
Allows users to view the Overview: Issues and Risks page. Click Page - View to view this access right.
Type: Instance

PMO Accelerator Business Sponsor Group
210 PMO Accelerator Product Guide
Sponsor
Allows user to view the Overview: Sponsor page. Click Page - View to view this access right.
Type: Instance
The following are the portlet views that are included with the instance access rights:
Portlet - View
Allows users to view a portlet in the application.
Type: Global
Issue Management
Allows users to view the Issue Management portlet. Click Portlet - View to view this access right.
Type: Instance
Project KPIs by OBS
Allows users to view the Project KPIs by OBS portlet. Click Portlet - View to view this access right.
Type: Instance
Projects by Budgeted Cost
Allows users to view the Projects by Budgeted Cost portlet. Click Portlet - View to view this access right.
Type: Instance
Projects View - View
Allows users to view the Project View portlet. Click Portlet - View to view this access right.
Type: Instance
Risk Management
Allows users to view the Risk Management portlet. Click Portlet - View to view this access right.
Type: Instance
The following global access rights are included with this access group:
Ideas - Create
Lets you create instances of the idea object. The right includes the Ideas - Navigate access.
Type: Global

PMO Accelerator Portfolio Manager Group
Chapter 13: Access Groups 211
PMO Accelerator Portfolio Manager Group
Portfolio managers are primarily concerned with the direction and performance of their investments. This type of resource may be nontechnical. Members of the PMO Accelerator Portfolio Manager group review, model, and approve portfolios of projects and other work.
The following are the page views that are included with the Instance access rights.
Page - View
Allows users to view a general page in CA Clarity PPM. For instance pages (such as portfolio pages), this right is not required.
Type: Instance
Issues and Risks
Allows users to view the Overview: Issues and Risks page. Click Page - View to view this access right.
Type: Instance
Portfolio Dashboard
Allows users to view the Portfolio Dashboard page. Click Page - View to view this access right.
Type: Instance
The following are the portlet views that are included with the Instance access rights.
Portlet - View
Allows users to view a portlet in the application.
Type: Global
Balance
Allows users to view the Balance portlet. Click Portlet - View to view this access right.
Type: Instance
Benefits by Goal
Allows users to view the Benefits by Goal portlet. Click Portlet - View to view this access right.
Type: Instance
Planned Costs
Allows users to view the Planned Costs portlet. Click Portlet -View to view this access right.
Type: Instance

PMO Accelerator Portfolio Manager Group
212 PMO Accelerator Product Guide
Current Issues
Allows users to view the Current Issues portlet. Click Portlet - View to view this access right.
Type: Instance
Issue Management
Allows users to view the Issue Management portlet. Click Portlet - View to view this access right.
Type: Instance
My Portfolios
Allows users to view the My Portfolios portlet. Click Portlet-View to view this access right.
Type: Instance
Prioritization of Investments [--Base Scenario--]
Allows users to view the bubble graph of the Prioritization of Investments portlet showing a base scenario.
Type: Instance
Prioritization of Investments [--Compare To Scenario--]
Allows users to view the bubble graph of the Prioritization of Investments portlet showing a Compare To scenario.
Type: Instance
Resource Demand on Investments [--Base Scenario--]
Allows users to view the grid of the Resource Demand on Investments portlet showing a base scenario.
Type: Instance
Resource Demand on Investments [--Compare To Scenario--]
Allows users to view the grid of the Resource Demand on Investments portlet showing a Compare To scenario.
Type: Instance
Resource Allocation
Allows users to view the Resource Allocation portlet. Click Portlet - View to view this access right.
Type: Instance

PMO Accelerator Portfolio Manager Group
Chapter 13: Access Groups 213
Resource Capacity and Allocation
Allows users to view the Resource Capacity and Allocation portlet. Click Portlet - View to view this access right.
Type: Instance
Role Capacity and Demand
Allows users to view the Role Capacity and Demand portlet. Click Portlet - View to view this access right.
Type: Instance
Portfolio Benefits and Costs
Allows users to view the Portfolio Benefits and Costs portlet. Click Portlet -View to view this access right.
Type: Instance
Financial Performance
Allows users to view the Financial Performance portlet. Click Portlet - View to view this access right.
Type: Instance
Resource Gantt
Allows users to view the Resource Gantt portlet. Click Portlet - View to view this access right.
Type: Instance
Portfolio Investment Benefits by Goal
Allows users to view the Portfolio Investment Benefits by Goal portlet. Click Portlet -View to view this access right.
Type: Instance
Key Performance Indicators
Allows users to view the Key Performance Indicators portlet. Click Portlet - View to view this access right.
Type: Instance
Project Costs by Phase
Allows users to view the Project Costs by Phase portlet. Click Portlet - View to view this access right.
Type: Instance

PMO Accelerator Portfolio Manager Group
214 PMO Accelerator Product Guide
Project Costs by Resource
Allows users to view the Project Costs by Resource portlet. Click Portlet - View to view this access right.
Type: Instance
Project Costs by Task
Allows users to view the Project Costs by Task portlet. Click Portlet - View to view this access right.
Type: Instance
Balance
Allows users to view the Balance portlet. Click Portlet - View to view this access right.
Type: Instance
Financials
Allows users to view the portfolio financial information. Click Portlet - View to view this access right.
Type: Instance
Capital vs Expense Budget and Forecast
Allows users to view the Capital vs Expense Budget and Forecast portlet. Click Portlet - View to view this access right.
Type: Instance
Capital vs Expense by Period
Allows users to view the Capital vs Expense by Period portlet. Click Portlet - View to view this access right.
Type: Instance
Capital vs Expense Variance by Period
Allows users to view the Capital vs Expense Variance by Period portlet. Click Portlet - View to view this access right.
Type: Instance
Investments
Allows users to view the Investments portlet. Click Portlet - View to view this access right.
Type: Instance

PMO Accelerator Portfolio Manager Group
Chapter 13: Access Groups 215
Risk Management
Allows users to view the Risk Management portlet. Click Portlet - View to view this access right.
Type: Instance
Staffing Outlook
Allows users to view the Staffing Outlook page.
Type: Instance
Planned Cost/Benefit
Allows users to view the Planned Cost/Benefit portlet. Click Portlet -View to view this access right.
Type: Instance
Gantt
Allows users to view the Gantt portlet. Click Portlet - View to view this access right.
Type: Instance
Financials
Allows users to view the portfolio financial information. Click Portlet - View to view this access right.
Type: Instance
Investments
Allows users to view the Investments portlet. Click Portlet - View to view this access right.
Type: Instance
Life-cycle Funnel
Allows users to view the Life-cycle Funnel portlet. Click Portlet -View to view this access right.
Type: Instance
Risk/Reward Quadrants
Allows users to view the Risk/Reward Quadrants portlet. Click Portlet - View to view this access right.
Type: Instance
Portfolio Planned ROI/Alignment Zones
Allows users to view the Portfolio Planned ROI/Alignment Zones portlet. Click Portlet - View to view this access right.
Type: Instance

PMO Accelerator Portfolio Manager Group
216 PMO Accelerator Product Guide
The following Group access rights are included with this access group:
Application - Create
Allows users to create Applications. Includes the Application - Navigate right.
Type: Global
Application - Navigate
Allows users to navigate to Application pages. Users need additional rights to view individual Applications.
Type: Global
Asset - Create
Allows users to create Assets. Includes the Asset - Navigate right.
Type: Global
Asset - Navigate
Allows users to navigate to Asset pages. Users need additional rights to view individual Assets.
Type: Global
Knowledge Store - Access
Allows resources to create, edit, and view knowledge store documents for which the resource has been given permission.
Type: Global
Knowledge Store - Administrate
Allows resources to administer knowledge store folders and documents for which the resource has been given permission.
Type: Global
Knowledge Store - View All
Allows resources to view all documents in the knowledge store.
Type: Global
Other Work - Create
Allows resources to create other work.
Type: Global
Other Work - Navigate
Allows resources access to the other work management pages.
Type: Global

PMO Accelerator Portfolio Manager Group
Chapter 13: Access Groups 217
Portfolio - Create
Allows users to create portfolios.
Includes: Portfolio - Navigate to access Portfolio Management menu.
Type: Global
Portfolio - Edit - All
Allows users to view, edit, and delete all portfolios. Users can see only the investments, scenarios, and portlets to which they have access.
Requires: Portfolio - Navigate to access the Portfolio Management menu.
Type: Global
Portfolio - Navigate
Allows users to access the Portfolio Management menu.
Type: Global
Product - Create
Allows users to create products. Includes the Product - Navigate right.
Type: Global
Product - Navigate
Allows users to navigate to product pages. Users need additional rights to view individual products.
Type: Global
Project - Create
Allows you to create new projects and define the general properties.
Includes: Project - Create from Template right to create a project using a template.
Type: Global
Project - Edit Financial
Allows users to edit the general properties, team, key tasks, and financial information for a specific project. This access right also allows the user to add subprojects to the project, and to view and edit the project using a desktop scheduler, such as Open Workbench and Microsoft Project.
Type: Instance
Reports - Access
Allows users to access reports pages. Additional report rights are also required to view, edit, or run reports.
Type: Global

PMO Accelerator Program Manager Group
218 PMO Accelerator Product Guide
Reports - Run - All
Allows you to run any report. This right also allows users to schedule, edit properties, and view the output of any report. The access is dependent on being granted Reports - Access right.
Type: Global
Reports - View Output - All
Allows users to view the output of any report.
Requires: Reports - Access right
Type: Global
Resource - Create
Allows users to create a resource or role, and edit properties. Lets users create labor and nonlabor resources.
Requires: Resource - Navigate
Type: Global
Resource - Navigate
Allows you to access resource management pages.
Type: Global
PMO Accelerator Program Manager Group
A program manager is responsible for multiple projects, and typically has budgetary responsibility. This type of resource may be nontechnical. Members of the PMO Accelerator Program Manager group create and monitor programs and their constituent projects. They also have the rights to create and monitor other work.
The following are the page views that are included with the Instance access rights.
Page - View
Allows viewing of a general page in the application, for instance pages (such as Portfolio pages) this right is not used
Type: Instance
PMO-Program Status
Allows users to view the PMO-Program Status page. Click Portlet -View to view this access right.
Type: Instance

PMO Accelerator Program Manager Group
Chapter 13: Access Groups 219
Issues and Risks
Allows users to view the Overview: Issues and Risks page. Click Page - View to view this access right.
Type: Instance
Program Dashboard
Allows users to view the Program Dashboard page. Click Page - View to view this access right.
Type: Instance
Project Costs by Resource
Allows users to view the Project Costs by Resource page. Click Page - View to view this access right.
Type: Instance
Project Costs by Phase
Allows users to view the Project Costs by Phase page. Click Page - View to view this access right.
Type: Instance
Project Costs by Task
Allows users to view the Project Costs by Task page. Click Page - View to view this access right.
Type: Instance
Program Manager Cost Dashboard Drill Down
Allows users to view the Program Manager Cost Dashboard Drill Down page. Click Page - View to view this access right.
Type: Instance
Project Dashboard
Allows users to view the Project Dashboard page. Click Page - View to view this access right.
Type: Instance
Project Storyboard Drill Down
Allows users to view the Project Storyboard Drill Down page. Click Page - View to view this access right.
Type: Instance

PMO Accelerator Program Manager Group
220 PMO Accelerator Product Guide
The following are the portlet views that are included with the Instance access rights.
Alerts
Allows users to view the Alerts portlet. Click Portlet - View to view this access right.
Type: Instance
Project Baselines
Allows users to view the Project Baselines portlet. Click Portlet - View to view this access right.
Type: Instance
Resource Utilization
Allows users to view the Resource Utilization portlet. Click Portlet - View to view this access right.
Type: Instance
Resource Utilization Percentage by Month
Allows users to view the Resource Utilization Percentage by Month portlet. Click Portlet - View to view this access right.
Type: Instance
Issue Management
Allows users to view the Issue Management portlet. Click Portlet - View to view this access right.
Type: Instance
Earned Value Phase Analysis
Allows users to view the Earned Value Phase Analysis portlet. Click Portlet - View to view this access right.
Type: Instance
Project Quality Attributes
Allows users to view the Project Quality Attributes portlet. Click Portlet - View to view this access right.
Type: Instance
Actuals by Transaction Type
Allows users to view the Actuals by Transaction Type portlet.
Type: Instance

PMO Accelerator Program Manager Group
Chapter 13: Access Groups 221
Program Manager Cost Dashboard
Allows users to view the Program Manager Cost Dashboard portlet. Click Portlet - View to view this access right.
Type: Instance
Program Manager Schedule Dashboard
Allows users to view the Program Manager Schedule Dashboard portlet. Click Portlet - View to view this access right.
Type: Instance
Project Costs by Phase
Allows users to view the Project Costs by Phase page. Click Page - View to view this access right.
Type: Instance
Project Costs by Resource
Allows users to view the Project Costs by Resource page. Click Page - View to view this access right.
Type: Instance
Project Costs by Task
Allows users to view the Project Costs by Task page. Click Page - View to view this access right.
Type: Instance
Cost, Schedule, Risk
Allows users to view the Cost, Schedule, Risk portlet. Click Portlet - View to view this access right.
Type: Instance
Issues by Priority
Allows users to view the Issues by Priority portlet. Click Portlet -View to view this access right.
Type: Instance
Late Tasks and Milestones
Allows users to view the Late Tasks and Milestones portlet. Click Portlet -View to view this access right.
Type: Instance

PMO Accelerator Program Manager Group
222 PMO Accelerator Product Guide
Upcoming Milestones
Allows users to view the Upcoming Milestones portlet. Click Portlet - View to view this access right.
Type: Instance
Program Project Status
Allows users to view the Program Project Status page. Click Portlet - View to view this access right.
Type: Instance
Project Status Report
Allows users to view the Project Status Report portlet. Click Portlet - View to view this access right.
Type: Instance
Project Analysis
Allows users to view the Project Analysis portlet. Click Portlet - View to view this access right.
Type: Instance
Team Capacity
Allows users to view the Team Capacity portlet. Click Portlet - View to view this access right.
Type: Instance
Team Member Task Summary
Allows users to view the Team Member Task Summary portlet. Click Portlet - View to view this access right.
Type: Instance
Risk Management
Allows users to view the Risk Management portlet. Click Portlet - View to view this access right.
Type: Instance
Team Utilization
Displays the team-based utilization for the current project. Provides a detailed picture of total usage compared to allocation.

PMO Accelerator Program Manager Group
Chapter 13: Access Groups 223
The following global access rights are included with this access group:
Application - Create
Allows users to create Applications. Includes the Application - Navigate right.
Type: Global
Application - Navigate
Allows users to navigate to Application pages. Users need additional rights to view individual Applications.
Type: Global
Asset - Create
Allows users to create Assets. Includes the Asset - Navigate right.
Type: Global
Asset - Navigate
Allows users to navigate to Asset pages. Users need additional rights to view individual Assets.
Type: Global
Company - Create
Allows a resource to view and edit all companies and to create new companies. Resources with this access right cannot view documents unless specific access to the folders or documents is also granted.
Type: Global
Company - Document Manager - Administrate - All
Allows resources with access to all documents and forms attached to companies (if other access rights that provide view capability for companies, such as Company - View - All, are also granted). Resources with this access right can do the following:
■ Create new form and document folders
■ Add documents
■ Add forms to folders
■ Attach document templates to forms
■ Delete forms
■ Delete, copy and move documents
■ View document properties, history, versions, permissions and workflows
Type: Global

PMO Accelerator Program Manager Group
224 PMO Accelerator Product Guide
Knowledge Store - Access
Allows resources to create, edit, and view knowledge store documents for which the resource has been given permission.
Type: Global
Knowledge Store - Administrate
Allows resources to administer knowledge store folders and documents for which the resource has been given permission.
Type: Global
Management - Programs
Allows users to access the programs to which you have access. This right is dependent on the user having rights to programs and projects at either the instance level or OBS level.
Type: Global
Other Work - Create
Allows resources to create other work.
Type: Global
Other Work - Navigate
Allows resources access to the other work management pages.
Type: Global
Product - Create
Allows users to create products. Includes the Product - Navigate right.
Type: Global
Product - Navigate
Allows users to navigate to product pages. Users need additional rights to view individual products.
Type: Global
Program Management Plan - Create
Allows resources to create Program Management Plan objects. This right includes the page navigation right.
Type: Global
Program Management Plan - Edit All
Allows resources to edit all Program Management Plan objects. This right includes the page navigation right.
Type: Global

PMO Accelerator Program Manager Group
Chapter 13: Access Groups 225
Program Management Plan - View All
Allows resources to view all Program Management Plan objects. This right includes the page navigation right.
Type: Global
Project - Create
Allows you to create new projects and define the general properties.
Includes: Project - Create from Template right to create a project using a template.
Type: Global
Project - Enable Financial
Allows users to enable financial properties for all projects.
Requires:
■ Project - View
■ Project - View Management or Project - Manager
Type: Global
Quality Attributes - Create
Allows resources to create Quality Attributes objects. This right includes the page navigation right.
Type: Global
Quality Attributes - Edit All
Allows resources to edit all Quality Attributes objects. This right includes the page navigation right.
Type: Global
Quality Attributes - View All
Allows resources to view all Quality Attributes objects. This right includes the page navigation right.
Type: Global
Reports - Access
Allows users to access reports pages. Additional report rights are also required to view, edit, or run reports.
Type: Global
Reports - Run - All
Allows you to run any report. This right also allows users to schedule, edit properties, and view the output of any report. The access is dependent on being granted Reports - Access right.
Type: Global

PMO Accelerator Project Manager Group
226 PMO Accelerator Product Guide
Reports - View Output - All
Allows users to view the output of any report.
Requires: Reports - Access right
Type: Global
Resource - Create
Allows users to create a resource or role, and edit properties. Lets users create labor and nonlabor resources.
Requires: Resource - Navigate
Type: Global
Resource - Navigate
Allows you to access resource management pages.
Type: Global
Timesheets - Navigate
Lets you navigate to timesheet pages.
Type: Global
PMO Accelerator Project Manager Group
A project manager is primarily concerned with keeping a project on track by monitoring goals, schedule, resources, tasks, and risks. This type of resource may be marginally technical. Members of the PMO Accelerator Project Manager group create and monitor project and other work goals, schedule, resources, tasks, risks, and issues.
Resources that are members of this group have view access rights to the most portlets. These portlets deliver exception-based analysis without the need to use any metrics other than the metrics found in a project plan.
The following are the page views that are included with the Instance access rights.
Page - View
Allows users to view a general page in CA Clarity PPM. For instance pages (such as portfolio pages), this right is not required.
Type: Instance
Current Issues Drill Down
Allows users to view the Current Issues Drill Down page. Click Page - View to view this access right.
Type: Instance
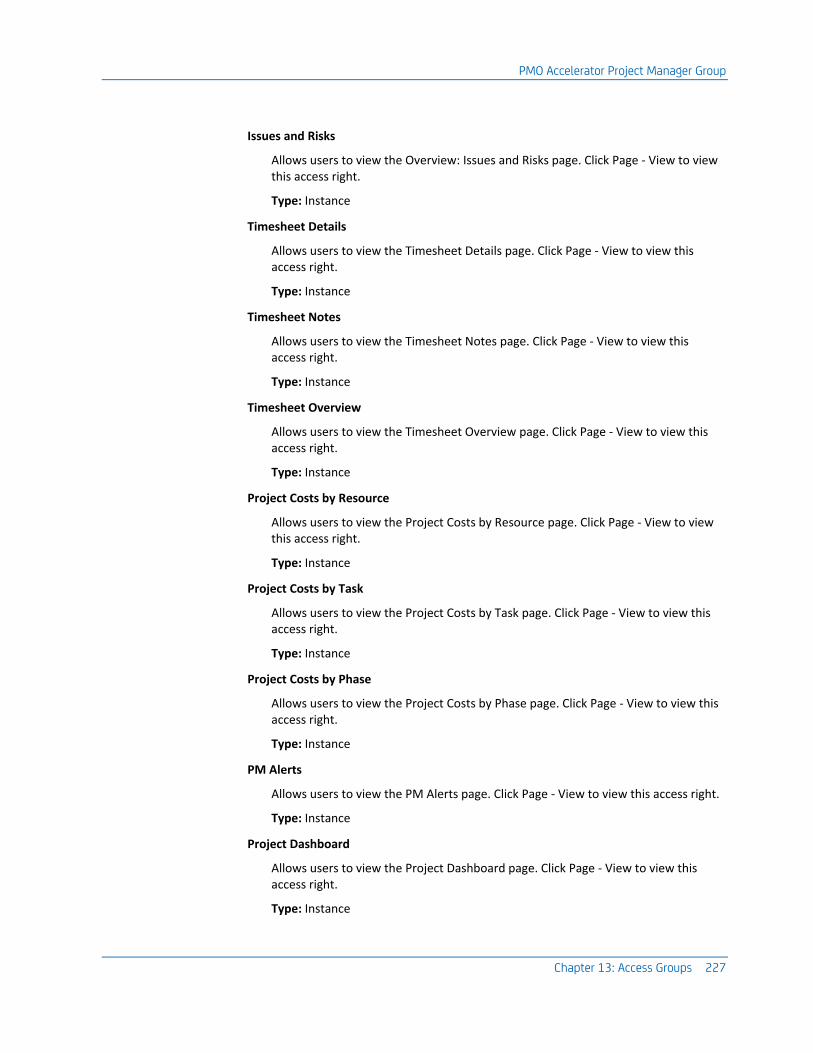
PMO Accelerator Project Manager Group
Chapter 13: Access Groups 227
Issues and Risks
Allows users to view the Overview: Issues and Risks page. Click Page - View to view this access right.
Type: Instance
Timesheet Details
Allows users to view the Timesheet Details page. Click Page - View to view this access right.
Type: Instance
Timesheet Notes
Allows users to view the Timesheet Notes page. Click Page - View to view this access right.
Type: Instance
Timesheet Overview
Allows users to view the Timesheet Overview page. Click Page - View to view this access right.
Type: Instance
Project Costs by Resource
Allows users to view the Project Costs by Resource page. Click Page - View to view this access right.
Type: Instance
Project Costs by Task
Allows users to view the Project Costs by Task page. Click Page - View to view this access right.
Type: Instance
Project Costs by Phase
Allows users to view the Project Costs by Phase page. Click Page - View to view this access right.
Type: Instance
PM Alerts
Allows users to view the PM Alerts page. Click Page - View to view this access right.
Type: Instance
Project Dashboard
Allows users to view the Project Dashboard page. Click Page - View to view this access right.
Type: Instance

PMO Accelerator Project Manager Group
228 PMO Accelerator Product Guide
Project Storyboard Drill Down
Allows users to view the Project Storyboard Drill Down page. Click Page - View to view this access right.
Type: Instance
Schedule Performance Drill Down
Allows users to view the Schedule Performance Drill Down page. Click Page - View to view this access right.
Type: Instance
Staffing Outlook
Allows users to view the Staffing Outlook page.
Type: Instance
The following are the portlet views that are included with the Instance access rights.
Portlet - View
Allows users to view a portlet in the application.
Type: Global
Current Issues
Allows users to view the Current Issues portlet. Click Portlet - View to view this access right.
Type: Instance
Current Issues Listing
Allows users to view the Current Issues Listing portlet. Click Portlet - View to view this access right.
Type: Instance
Alerts
Allows users to view the Alerts portlet. Click Portlet - View to view this access right.
Type: Instance
Project Baselines
Allows users to view the Project Baselines portlet. Click Portlet - View to view this access right.
Type: Instance
Timesheet Notes
Allows users to view the Timesheet Notes portlet. Click Portlet- View to view this access right.
Type: Instance

PMO Accelerator Project Manager Group
Chapter 13: Access Groups 229
Investments Timesheet Summary
Allows users to view the Investments Timesheet Summary portlet. Click Portlet - View to view this access right.
Type: Instance
Issue Management
Allows users to view the Issue Management portlet. Click Portlet - View to view this access right.
Type: Instance
Key Performance Indicators
Allows users to view the Key Performance Indicators portlet. Click Portlet - View to view this access right.
Type: Instance
Earned Value Phase Analysis
Allows users to view the Earned Value Phase Analysis portlet. Click Portlet - View to view this access right.
Type: Instance
Project Quality Attributes
Allows users to view the Project Quality Attributes portlet. Click Portlet - View to view this access right.
Type: Instance
Pending Estimates Review
Allows users to view the Pending Estimates Review portlet. Click Portlet - View to view this access right.
Type: Instance
Investments Timesheet Review
Allows users to view the Investments Timesheet Review portlet. Click Portlet - View to view this access right.
Type: Instance
Actuals by Transaction Type
Allows users to view the Actuals by Transaction Type portlet.
Type: Instance
Project Costs by Phase
Allows users to view the Project Costs by Phase portlet. Click Portlet - View to view this access right.
Type: Instance

PMO Accelerator Project Manager Group
230 PMO Accelerator Product Guide
Project Costs by Resource
Allows users to view the Project Costs by Resource portlet. Click Portlet - View to view this access right.
Type: Instance
Project Costs by Task
Allows users to view the Project Costs by Task portlet. Click Portlet - View to view this access right.
Type: Instance
Project Manager Cost and Effort Dashboard
Allows users to view the Project Manager Cost and Effort Dashboard portlet. Click Portlet - View to view this access right.
Type: Instance
Project Manager Schedule Dashboard
Allows users to view the Project Manager Schedule Dashboard portlet. Click Portlet - View to view this access right.
Type: Instance
Risk Management
Allows users to view the Risk Management portlet. Click Portlet - View to view this access right.
Type: Instance
Schedule Performance Details
Allows users to view the Schedule Performance Details page. Click Page - View to view this access right.
Type: Instance
Staffing Outlook
Allows users to view the Staffing Outlook page.
Type: Instance
Staffing Outlook Details
Allows users to view the Staffing Outlook Details portlet. Click Portlet - View to view this access right.
Type: Instance

PMO Accelerator Project Manager Group
Chapter 13: Access Groups 231
The following Global access rights are included with this access group:
Application - Create
Allows users to create Applications. Includes the Application - Navigate right.
Type: Global
Application - Navigate
Allows users to navigate to Application pages. Users need additional rights to view individual Applications.
Type: Global
Asset - Create
Allows users to create Assets. Includes the Asset - Navigate right.
Type: Global
Asset - Navigate
Allows users to navigate to Asset pages. Users need additional rights to view individual Assets.
Type: Global
Company - Create
Allows a resource to view and edit all companies and to create new companies. Resources with this access right cannot view documents unless specific access to the folders or documents is also granted.
Type: Global
Company - Document Manager - Administrate - All
Allows resources with access to all documents and forms attached to companies (if other access rights that provide view capability for companies, such as Company - View - All, are also granted). Resources with this access right can do the following:
■ Create new form and document folders
■ Add documents
■ Add forms to folders
■ Attach document templates to forms
■ Delete forms
■ Delete, copy and move documents
■ View document properties, history, versions, permissions and workflows
Type: Global

PMO Accelerator Project Manager Group
232 PMO Accelerator Product Guide
Knowledge Store - Access
Allows resources to create, edit, and view knowledge store documents for which the resource has been given permission.
Type: Global
Knowledge Store - Administrate
Allows resources to administer knowledge store folders and documents for which the resource has been given permission.
Type: Global
Other Work - Create
Allows resources to create other work.
Type: Global
Other Work - Navigate
Allows resources access to the other work management pages.
Type: Global
Product - Create
Allows users to create products. Includes the Product - Navigate right.
Type: Global
Product - Navigate
Allows users to navigate to product pages. Users need additional rights to view individual products.
Type: Global
Project - Create
Allows you to create new projects and define the general properties.
Includes: Project - Create from Template right to create a project using a template.
Type: Global
Project - Edit Financial
Allows users to edit the general properties, team, key tasks, and financial information for a specific project. This access right also allows the user to add subprojects to the project, and to view and edit the project using a desktop scheduler, such as Open Workbench and Microsoft Project.
Type: Instance

PMO Accelerator Project Manager Group
Chapter 13: Access Groups 233
Quality Attributes - Create
Allows resources to create Quality Attributes objects. This right includes the page navigation right.
Type: Global
Quality Attributes - Edit All
Allows resources to edit all Quality Attributes objects. This right includes the page navigation right.
Type: Global
Quality Attributes - View All
Allows resources to view all Quality Attributes objects. This right includes the page navigation right.
Type: Global
Reports - Access
Allows users to access reports pages. Additional report rights are also required to view, edit, or run reports.
Type: Global
Reports - Run - All
Allows you to run any report. This right also allows users to schedule, edit properties, and view the output of any report. The access is dependent on being granted Reports - Access right.
Type: Global
Reports - View Output - All
Allows users to view the output of any report.
Requires: Reports - Access right
Type: Global
Resource - Create
Allows users to create a resource or role, and edit properties. Lets users create labor and nonlabor resources.
Requires: Resource - Navigate
Type: Global
Resource - Navigate
Allows you to access resource management pages.
Type: Global

PMO Accelerator Team Member Group
234 PMO Accelerator Product Guide
Scope - Create
Allows resources to create scope objects. This right includes the page navigation right.
Type: Global
Scope - Edit All
Allows resources to edit all scope objects. This right includes the page navigation right.
Type: Global
Scope - View All
Allows resources to view all scope objects. This right includes the page navigation right.
Type: Global
Status Report - Create
Allows users to create status reports. This right includes the page navigation access right.
Type: Global
Status Report - Edit
Allows users to edit specific status reports.
Type: Instance
Status Report - View All
Allows users to view all status reports. This right includes the page navigation access right.
Type: Global
Timesheets - Navigate
Lets you navigate to timesheet pages.
Type: Global
PMO Accelerator Team Member Group
A team member is primarily concerned with monitoring and working with their individual tasks and action items. This type of resource may not be technical. Members of the PMO Accelerator Team Member group enter time and update tasks.
Resources that are members of this group have view access rights to some portlets. These portlets deliver exception-based analysis without the need to use any metrics other than the metrics found in a project plan.

PMO Accelerator Team Member Group
Chapter 13: Access Groups 235
The following are the page views that are included with the Instance access rights.
Page - View
Allows users to view a general page in CA Clarity PPM. For instance pages (such as portfolio pages), this right is not required.
Type: Instance
Issues and Risks
Allows users to view the Overview: Issues and Risks page. Click Page - View to view this access right.
Type: Instance
Project Dashboard
Allows users to view the Project Dashboard page. Click Page - View to view this access right.
Type: Instance
Project Storyboard Drill Down
Allows users to view the Project Storyboard Drill Down page. Click Page - View to view this access right.
Type: Instance
The following are the portlet views that are included with the Instance access rights.
Portlet - View
Allows users to view a portlet in the application.
Type: Global
Alerts
Allows users to view the Alerts portlet. Click Portlet - View to view this access right.
Type: Instance
Issue Management
Allows users to view the Issue Management portlet. Click Portlet - View to view this access right.
Type: Instance
Project Quality Attributes
Allows users to view the Project Quality Attributes portlet. Click Portlet - View to view this access right.
Type: Instance

PMO Accelerator Team Member Group
236 PMO Accelerator Product Guide
Project Manager Schedule Dashboard
Allows users to view the Project Manager Schedule Dashboard portlet. Click Portlet - View to view this access right.
Type: Instance
Issues by Priority
Allows users to view the Issues by Priority portlet. Click Portlet -View to view this access right.
Type: Instance
Late Tasks and Milestones
Allows users to view the Late Tasks and Milestones portlet. Click Portlet -View to view this access right.
Type: Instance
Project Status Report
Allows users to view the Project Status Report portlet. Click Portlet - View to view this access right.
Type: Instance
Team Member Task Summary
Allows users to view the Team Member Task Summary portlet. Click Portlet - View to view this access right.
Type: Instance
Risk Management
Allows users to view the Risk Management portlet. Click Portlet - View to view this access right.
Type: Instance
The following Global access rights are included with this access group:
Project - Create
Allows you to create new projects and define the general properties.
Includes: Project - Create from Template right to create a project using a template.
Type: Global
Timesheets - Navigate
Lets you navigate to timesheet pages.
Type: Global

Chapter 14: Sample Data 237
Chapter 14: Sample Data
This section contains the following topics:
About Sample Data (see page 237) Portfolios (see page 238) Programs (see page 241) Projects (see page 242) Ideas (see page 243) Applications (see page 244) Assets (see page 245) Services (see page 245) Resources (see page 246) Resource Roles (see page 247) Cost/Rate Matrices (see page 247) Project Plan Templates (see page 249) Organizational Breakdown Structures (OBS) (see page 249)
About Sample Data
You can install the PMO Accelerator and sample data to see and use examples of the functionality of CA Clarity PPM.
See the CA Clarity PPM Installation Guide for more information.
Sample data helps demonstrate the product functionality by populating the add-in pages and portlets in a test or development environment with the following:
■ Data-resources
■ Resource roles
■ OBSs
■ Projects
■ Portfolios
■ Programs
■ Ideas
■ Assets

Portfolios
238 PMO Accelerator Product Guide
■ Applications
■ Rate matrices
Use this data to help you decide whether to install the add-in on your production environment.
Important! Sample data is strictly for test or development environments. Do not install the data on your production CA Clarity PPM server. Installing the data on a CA Clarity PPM server that contains data may produce a failure, overwrite existing data, or both. After you install the sample data, you cannot remove it.
Best Practices:
■ Install sample data on a server that does not contain any data and is available for demonstration purposes only.
■ Do not install the sample data on environments with pre-existing customer sample or in-house demo data.
Portfolios
The following predefined portfolio examples are included with the PMO Accelerator sample data. You can modify or inactivate them as required. Use the portfolios to understand how the PMO Accelerator can help you manage, track, and report.
Some of the sample portfolios contain portfolio contents-projects, applications, ideas, scenarios, and financial plans. See the following table for details.

Portfolios
Chapter 14: Sample Data 239
Portfolio Name Portfolio Contents Scenarios Financial Plans
Business Applications ■ Accounts Receivable
■ General Ledger Application
■ Payroll
■ PeopleSoft Base Benefits
■ PeopleSoft Base Human Resources
■ PeopleSoft Benefits Administration
■ SAP Advance Planning & Optimization
■ SAP Event Management
■ SAP Inventory Collaboration Hub
■ Increase Rate of Return
■ Reduce Budget B
√
CIO Master Portfolio ■ Accounts Receivable
■ General Ledger Application
■ Payroll
■ PeopleSoft Base Benefits
■ PeopleSoft Base Human Resources
■ PeopleSoft Benefits Administration
■ SAP Advance Planning & Optimization
■ SAP Event Management
■ SAP Inventory Collaboration Hub
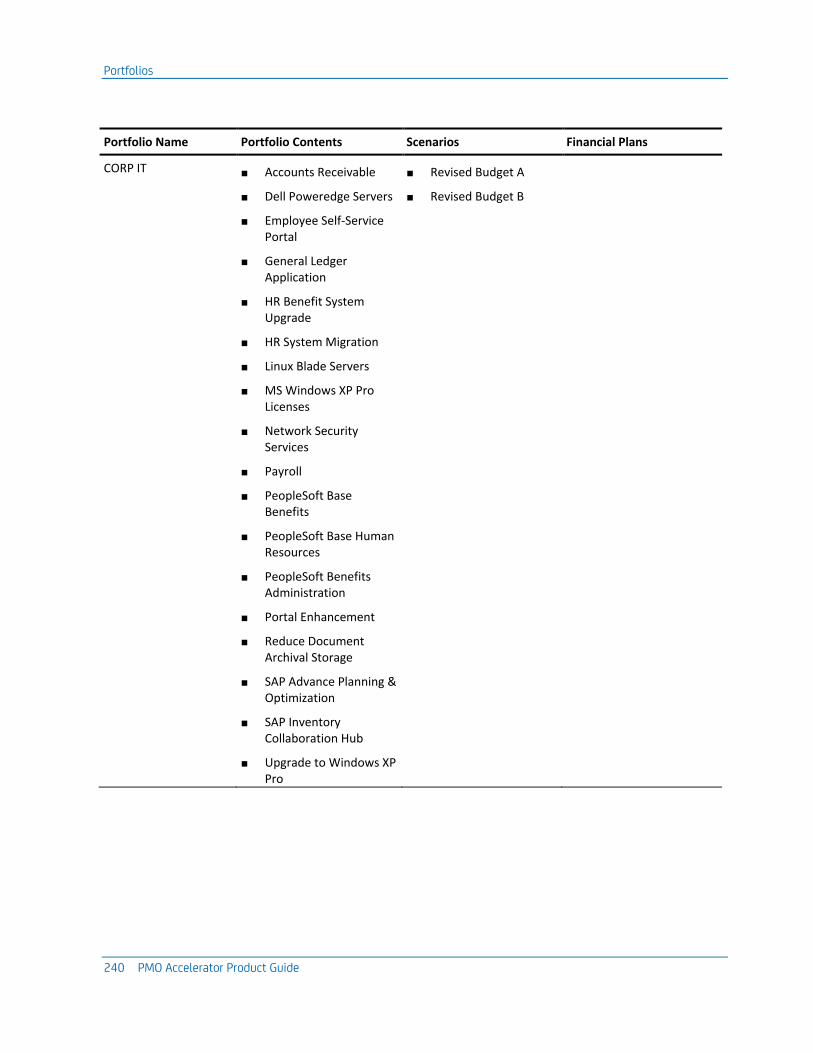
Portfolios
240 PMO Accelerator Product Guide
Portfolio Name Portfolio Contents Scenarios Financial Plans
CORP IT ■ Accounts Receivable
■ Dell Poweredge Servers
■ Employee Self-Service Portal
■ General Ledger Application
■ HR Benefit System Upgrade
■ HR System Migration
■ Linux Blade Servers
■ MS Windows XP Pro Licenses
■ Network Security Services
■ Payroll
■ PeopleSoft Base Benefits
■ PeopleSoft Base Human Resources
■ PeopleSoft Benefits Administration
■ Portal Enhancement
■ Reduce Document Archival Storage
■ SAP Advance Planning & Optimization
■ SAP Inventory Collaboration Hub
■ Upgrade to Windows XP Pro
■ Revised Budget A
■ Revised Budget B

Programs
Chapter 14: Sample Data 241
Portfolio Name Portfolio Contents Scenarios Financial Plans
HR Systems ■ Dell Poweredge Servers
■ Employee Self Service Portal
■ HR Benefit System Upgrade
■ HR System Migration
■ PeopleSoft Benefits Administration
■ Portal Enhancement
■ Increase ROI
■ Reduce Budget
√
Strategic Development - 2007
■ Employee Self Service Portal
■ HR Benefit System Upgrade
■ HR System Migration
■ Portal Enhancement
■ Reduce Document Archival Storage
■ Scenario 1
■ Scenario 2
Programs
The following predefined program examples are included with the PMO Accelerator sample data. You can modify or inactivate them as required. Use the programs to understand how the PMO Accelerator can help you manage and track programs as part of an overall portfolio management strategy.
All the sample programs include resource roles.
Program Name Resource Roles
ERP Program Architect
Business Analyst
Developer
Financial Analyst
Project Manager
Test Engineer

Projects
242 PMO Accelerator Product Guide
Program Name Resource Roles
SOX Compliance Program Architect
Business Analyst
Financial Analyst
Project Manager
Projects
The following predefined project and project template examples are included with the sample data. You can modify or inactivate them as required. Use the projects to understand how the PMO Accelerator can help you track, manage, and report the status of your projects.
Most of the sample projects include resources, resource roles, and tasks; some contain financial plans, risks, issues, and change requests.
Project Name Resource Roles and Resources
Tasks Financial Plans Risks/Issues/Change Requests
Call Center Improvements
√ √ √
Co-Funded CRM Enhancements
√ √
Corporate IT Project √ √
Customer Support Portal
√ √
Development Lifecycle Template
√
Employee Self-Service Portal
√ √ √ √
Enterprise Portal Content Delivery
√ √
Enterprise Portal Infrastructure
√ √
Financial Reporting Capitalized
√ √
HR Benefit System Upgrade
√ √ √ √
HR System Migration √ √ √ √

Ideas
Chapter 14: Sample Data 243
Project Name Resource Roles and Resources
Tasks Financial Plans Risks/Issues/Change Requests
JE Enhancements - Capitalization
√ √
Loan Approval Enhancements
√ √
OXUS System Development
√ √
Portal Enhancement √ √ √ √
Reduce Document Archival Storage
√ √ √ √
Sarbanes Oxley Regulatory Compliance
√ √ √
System Migration √ √ √
T&M Systems Upgrade √ √
UK Systems Rollout √ √
Web Development - OM Interface
√ √
Ideas
The following predefined idea examples are included with PMO Accelerator sample data. You can modify or inactivate them as required. Use the ideas to understand how the PMO Accelerator can help you manage and track ideas as part of an overall portfolio management strategy.
All of the sample ideas include resources and resource roles.
Idea Name Description Resource Roles and Resources
Add HW Spam Filters
As part of IT security, the proposal is to add HW spam filters - in addition to the SW based solutions.
Architect
Business Analyst
Migrate to a new CMDB system
The proposal is to migrate to a new CMDB system that is more tightly integrated to existing ERP system.
Architect
Test Engineer

Applications
244 PMO Accelerator Product Guide
Idea Name Description Resource Roles and Resources
New Proximity Badge System
Proposal is to migrate to a new proximity badge system that ties in to the payroll-attendance/cafeteria comp systems - in addition to the security/access system.
Newburg, Mary
Patel, Sanjay
Upgrade Existing Telecom System
The proposal is to upgrade the existing PABX system to a more integrated IP phone network across all offices.
Architect
Business Analyst
Applications
The following predefined application examples are included with the PMO Accelerator sample data. You can modify or inactivate them as required. Use the applications to understand how the PMO Accelerator can help you manage and track applications as part of an overall portfolio management strategy.
All of the sample applications include resources, resource roles, and financial plans.
Application Name Resource Roles and Resources Financial Plans
Accounts Receivable √ √
Customer Relationship Management
√ √
General Ledger Application √ √
Payroll √ √
PeopleSoft Base Benefits √ √
PeopleSoft Base Human Resources
√ √
PeopleSoft Benefits Administration
√ √
SAP Advance Planning & Optimization
√ √
SAP Event Management √ √
SAP Inventory Collaboration Hub
√ √
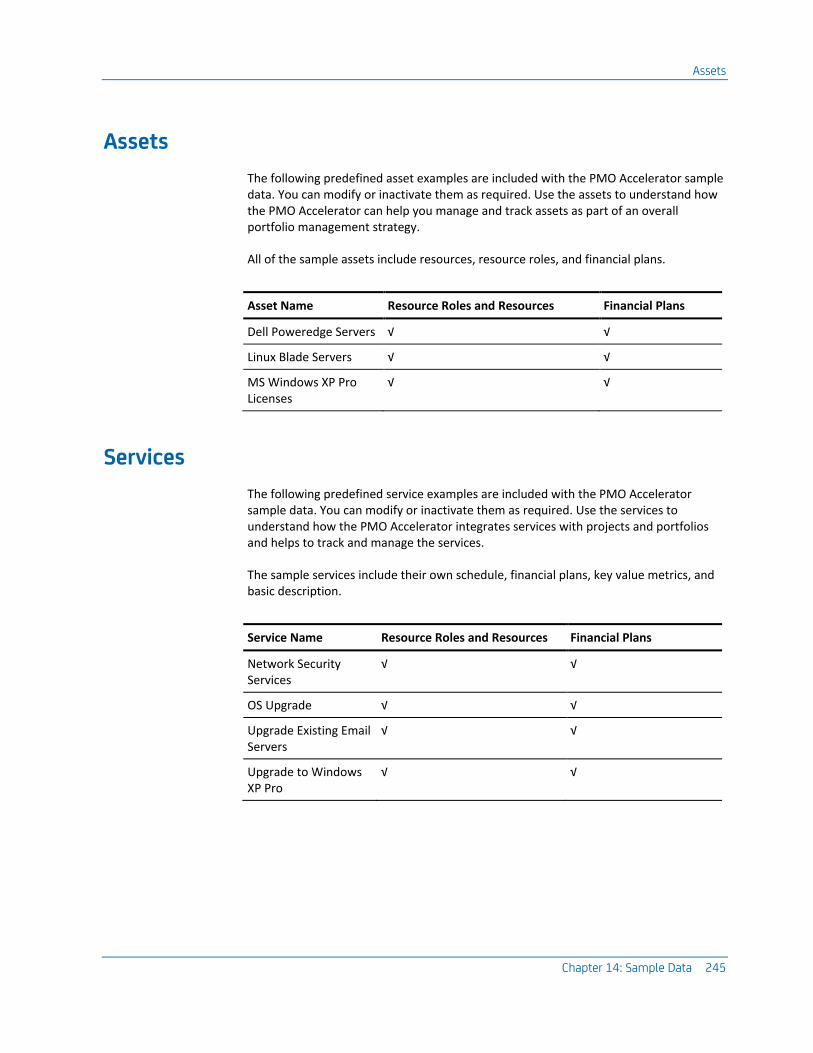
Assets
Chapter 14: Sample Data 245
Assets
The following predefined asset examples are included with the PMO Accelerator sample data. You can modify or inactivate them as required. Use the assets to understand how the PMO Accelerator can help you manage and track assets as part of an overall portfolio management strategy.
All of the sample assets include resources, resource roles, and financial plans.
Asset Name Resource Roles and Resources Financial Plans
Dell Poweredge Servers √ √
Linux Blade Servers √ √
MS Windows XP Pro Licenses
√ √
Services
The following predefined service examples are included with the PMO Accelerator sample data. You can modify or inactivate them as required. Use the services to understand how the PMO Accelerator integrates services with projects and portfolios and helps to track and manage the services.
The sample services include their own schedule, financial plans, key value metrics, and basic description.
Service Name Resource Roles and Resources Financial Plans
Network Security Services
√ √
OS Upgrade √ √
Upgrade Existing Email Servers
√ √
Upgrade to Windows XP Pro
√ √

Resources
246 PMO Accelerator Product Guide
Resources
The following predefined resource examples are included with the PMO Accelerator sample data. Use the resources to view role-oriented content, and modify or inactivate them as required.
■ Abrantes, Arthur
■ Abrams, Arthur
■ Akimoto, Anita
■ Berry, Jason
■ Gillian, Erin
■ Granger, Paula
■ Katect, Art
■ Knutson, Jan
■ Levert, Ed
■ Martin, Paul
■ Morris, Beth
■ Narayanan, Kirthi
■ Newburg, Mary
■ Patel, Sanjay
■ Sampson, Mike
■ Sauer, Jason
■ Sawtelle, Diego
■ Sponsor, Sue
■ Stoneburg, Sam
■ Sutherland, Joy
■ tester, pmo
■ Thompson, Peter

Resource Roles
Chapter 14: Sample Data 247
Resource Roles
The following resource roles are included with the PMO Accelerator sample data. The resource roles are supported from the Development Lifecycle Template project template. These roles are only descriptive role placeholders. Use them while you find resources to fill the roles, and modify or inactivate them as required.
■ Architect
■ Business Analyst
■ Chief Executive Officer
■ DBA
■ Developer
■ Financial Analyst
■ Network Engineer
■ Program Manager
■ Project Manager
■ Senior Business Analyst
■ Senior Project Manager
■ Senior Test Engineer
■ Storage Architect
■ Test Engineer
Cost/Rate Matrices
The following cost/rate matrices are included with the PMO Accelerator sample data:
■ Consulting Cost and Billing Matrix (see page 248)
■ Financial Cost and Rate Matrix (see page 248)
Cost/rate matrices are tables that detail the hourly labor costs for selected resources based on certain set of assumptions. Assumptions pertain to the type of resource (internal or external), resource role, and prevailing market data on labor rates for the resource roles. You can use rate matrices to compute the actual labor costs (using data from the actual approved timesheets) during a project.
To view the list of rate matrices, open Administration, and from the Finance menu, click Manage Matrix. The manage matrix page appears listing the available rate matrices, including the sample rate matrices.
See the Administration Guide for more information.

Cost/Rate Matrices
248 PMO Accelerator Product Guide
Consulting Cost and Billing Matrix
The Consulting Cost and Billing matrix is a generic rate matrix used for projects involving external contract resources or consultants.
Each resource role is added to the matrix as a matrix row. Each row has a billing and cost value of 1 and a rate of $150. You can view the resource roles on the edit matrix rows page.
The following are the provided resource roles and rates for this matrix:
■ Architect (rate: $175)
■ Business Analyst (rate: $180)
■ Developer (rate: $160)
■ Project Manager (rate: $200)
■ Test Engineer (rate: $140)
■ All others (rate: $150)
Best Practices: The rates for the resource roles are the default rates and serve only as a placeholder. Change the rates to reflect your actual rates, which vary by company, project, and location.
Financial Cost and Rate Matrix
The Financial Cost and Rate Matrix is a generic rate matrix that you can use for projects involving internal corporate resources or employees.
Each resource role is added to the matrix as a matrix row. Each row has a billing and cost value of 1 and a rate of $150. You can view the resource roles on the edit matrix rows page.
The following are the provided resource roles and rates for this cost/rate matrix:
■ Architect (rate: $60)
■ Business Analyst (rate: $70)
■ Developer (rate: $50)
■ Project Manager (rate: $80)
■ Test Engineer (rate: $40)
■ All others (rate: $50)
Best Practices: The rates for the resource roles are the default rates and serve only as a placeholder. Change the rates to reflect your actual rates, which vary by company, project, and location.

Project Plan Templates
Chapter 14: Sample Data 249
Project Plan Templates
Project plan templates are a formal generic document used to guide both project execution and project control. Use project plan templates as placeholders for common planning assumptions and decisions, project task lists, project phases, and work breakdown structures. You can apply project plan templates to most projects. You can customize them to suit your individual project needs.
Development Lifecycle Template
The Development Lifecycle Template project template provides a common framework of lifecycle management practices by structuring the IT application enhancement and development processes. The template is a roadmap to address all the project necessary elements.
This template includes a project plan, task list, and sample work breakdown structure.
Organizational Breakdown Structures (OBS)
The following are the provided OBSs with the PMO Accelerator sample data. They represent a best practices approach to basic project and resource alignment.
■ Business Unit OBS (see page 250)
■ Resource Pool OBS (see page 250)
■ Security OBS (see page 251)
■ Security OBS - Pages (see page 251)
Your CA Clarity PPM administrator can modify or inactivate them, and can add additional OBSs as you identify other drill-down and aggregation requirements.
To view the list of OBS samples, in the Administration Tool, select OBS from the Organization and Access menu. The Organizational Breakdown Structures page appears listing the available OBSs, including the OBS samples.
You can view the sample data elements - the unit and level information about the OBS units page. To view the page, select the OBS from the Organizational Breakdown Structures page, and click Units.

Organizational Breakdown Structures (OBS)
250 PMO Accelerator Product Guide
Business Unit OBS
The Business Unit OBS allows your organization to map project work to the business organizations performing the work. The OBS has three levels. You can use the OBS for projects only. All projects must be assigned to a node of the OBS.
Unit Level
All Business Units All
Business Operations Business Unit
Financial Systems Business Group
Operational Systems Business Group
IT Services Business Unit
Data Management Business Group
Network Services Business Group
Resource Pool OBS
The Resource Pool OBS allows your organization to group resources by general deployment categories. The OBS provides an example of how resource pools are frequently used. You can use it in a similar way that you use Business Unit OBS. A separate resource OBS allows organizations to search for team members based on the functional area to which they belong.
The OBS has three levels. Use the OBS for resources only. All resources staffed on projects must be assigned to a node of the OBS.
Unit Level
All Resources All
Development Resource Class
Business Liaisons Functional Area
Development Functional Area
IT Services Resource Class
Leadership Resource Class
Portfolio and Steering Committee Functional Area
Project Office Functional Area

Organizational Breakdown Structures (OBS)
Chapter 14: Sample Data 251
Security OBS OBS
The Security OBS OBS allows your organization to group access rights by general deployment categories. The OBS provides an example of how security pools are typically used.
This OBS has three levels. You can use the OBS to assign access rights to resources.
Unit Level
Corporate All
IT Group
Finance SubGroup
Portfolio SubGroup
Sponsor SubGroup
Team SubGroup
NPD Group
Security OBS - Pages OBS
The Security OBS - Pages OBS allows your organization to group access rights by CA Clarity PPM page. This OBS provides an example of how security pools are typically used.
This OBS has two levels. You can use this OBS to assign access rights to resources.
Unit Level
All All
Portfolio Group
Resource Group


Appendix A: PMO Accelerator Object Views 253
Appendix A: PMO Accelerator Object Views
This section contains the following topics:
About PMO Accelerator Object Views (see page 253) Assignment (see page 254) Baseline (see page 255) Cost and Benefit Plan (see page 257) GL Allocation and Resource Credit (see page 260) Investments (see page 264) Portfolio (see page 271) Project (see page 273) Resource (see page 282) Task (see page 288) Team (see page 293)
About PMO Accelerator Object Views
An object view determines how information displays for that object on a page. The following object views are available in CA Clarity PPM:
■ Properties View. This view displays and allows users to enter information about an object.
■ List Column View. This view displays information about object instances in rows and columns.
■ List Filter View. This view is a section that appears at the top of a list column view and allows users to search for and filter information.
When you install the PMO Accelerator, some object views are reinstalled to display information in a different way than the default CA Clarity PPM installation.
If you previously used CA Clarity PPM Studio to configure the CA Clarity PPM views, these configurations do not change. They are not overwritten by new or changed content during the PMO installation. Use the information provided in this section to compare the PMO views with the default CA Clarity PPM views. You can then decide whether to change your existing CA Clarity PPM configurations, or to apply the new PMO content.

Assignment
254 PMO Accelerator Product Guide
Assignment
The following table shows all assignment views that are modified in the PMO Accelerator.
Object Name View
Assignment Assignment Properties (Edit)
Task Assignment List
To apply the Task Assignment List view, also apply the Assignment Properties view. You can review these dependencies between views on the add-in details page in Studio.
You have the following configurations when you apply PMO Accelerator Assignment views.
Assignment Properties
To view assignment properties, open a task of a project and click the Properties icon in the Assignments section. The Properties page appears by default.
General
Contains general information about assignments that are organized into the following sections:
General
This section includes: Resource, Role, Start, Finish, ETC, Actuals, EAC, Status, Loading Pattern, Baseline Start, Baseline Finish, Pending ETC, Pending Actuals, and Actuals Thru.
ETC Detail
This section is not modified in the PMO Accelerator.
Assignment List Views
To view an assignment list:
1. Open Home.
2. From the menu, click an investment type, such as Projects.
3. Click the Tasks tab.

Baseline
Appendix A: PMO Accelerator Object Views 255
4. Select a task that contains assignments.
The List Column view appears by default. From this view, you can do the following:
■ Link to the properties page for the assignment by clicking the Properties icon.
■ Link to the properties page for the resources or roles by clicking the name of the resources or roles.
■ View the Resource, Role, Loading Pattern, Start, Finish, Actuals, Actual Cost, ETC, and EAC.
■ View a Time-Scaled Value displaying the ETC for each assignment for a seven-week period, starting with the current week.
Baseline
The following table shows all baseline views that are modified in the PMO Accelerator.
Object Name View
Baseline Baseline Revision Properties (Create and Edit)
Baseline Revision List
Baseline Revision Filter
To apply the Baseline Revision List view, also apply the Baseline Revision Properties and Filter views. You can review these dependencies between views on the add-in details page in Studio.
You have the following configurations when you apply PMO Accelerator Baseline views.
Baseline Properties
To view baseline properties, open a baseline revision of an investment. The Properties page appears by default.
General
Contains general information about baseline revisions that are organized into the following sections:
General
This section includes: Revision Name, Revision ID, Description, Baseline Start, Baseline Finish, and Current Revision check box.

Baseline
256 PMO Accelerator Product Guide
Baseline Effort and Cost
This section includes: BAC and BAC Cost.
Performance Against Current Baseline
This section includes: Planned Value (BCWS), Earned Value (BCWP), Actual Cost (ACWP), Cost Variance (CV), Schedule Variance (SV), Cost Performance Index (CPI) and Schedule Performance Index (SPI).
Baseline List Views
To view a list of baselines:
1. Open Home.
2. From the menu click an investment type, such as Projects.
3. Select a project.
4. From the properties content menu, click Baseline.
The List Column view appears by default. From this view, you can do the following:
■ Link to the properties page for the baseline by clicking the name of the baseline revision.
■ View the Revision Name, Revision ID, Current Revision check box, Baseline Start, Baseline Finish, BAC, and BAC Cost. The Current Revision is highlighted in the list.
Baseline Filter Views
By default, the List Filter view appears on the same page as the List Column view, but the List Filter View is in a collapsed state. You can expand the filter by clicking the Plus icon to see the filter options.
From this view, you can do the following:
■ Filter by Revision Name, Revision ID, Current Revision, Baseline Start, and Baseline Finish.
Note: By default, Current Revision is set to All.

Cost and Benefit Plan
Appendix A: PMO Accelerator Object Views 257
Cost and Benefit Plan
The following table shows all cost plan and benefit plan views that are modified in the PMO Accelerator.
Object Name View
Benefit Plan Benefit Plan Properties (Create and Edit)
Benefit Plan List
Benefit Plan Filter
Benefit Plan Detail Benefit Plan Detail Properties (Create and Edit)
Benefit Plan Detail List
Benefit Plan Detail Filter
Cost Plan Cost Plan Properties (Create and Edit)
Cost Plan List
Cost Plan Filter
Budget List
Budget Filter
Cost Plan Detail Cost Plan Detail Properties (Create and Edit)
Cost Plan Detail List
Cost Plan Detail Filter
Budget Plan Detail Filter
To apply the Cost Plan and Benefit Plan List views, also apply the Cost Plan and Benefit Plan Properties and Filter views. You can review these dependencies between views on the add-in details page in Studio.
You have the following configurations when you apply PMO Accelerator Cost Plan and Benefit Plan views.

Cost and Benefit Plan
258 PMO Accelerator Product Guide
Cost and Benefit Plan Properties
To view cost and benefit plan properties, open a cost or benefit plan of an investment and click the Properties icon. The Properties page appears by default.
Benefit Plan
This page includes: Plan Name, Plan ID, Description, Period Type, Start Period, and Finish Period.
Benefit Plan Details
This page includes: Description, Benefit Class, and Benefit Subclass. The Benefit Class and Benefit Subclass are installed with the PMO Accelerator.
Cost and Budget Plan
This page includes: Plan Name, Plan ID, Description, Period Type, Start Period, Finish Period, Benefit Plan, Currency, Plan of Record check box, and Grouping Attributes.
Cost and Budget Plan Details
This page includes the grouping attributes selected for the cost plan.
Cost and Benefit Plan List Views
To view a list of cost or benefit plans:
1. Open Home.
2. From the menu, click an investment type, such as Projects.
3. Click the Financial Plans tab.
4. Select Cost Plans, Benefit Plans, or Budget Plans from the drop-down list.
The List Column view appears by default. From this view, you can do the following:
Benefit Plan
■ Link to the properties page for the benefit plan by clicking the Properties icon.
■ Link to the detail list page for the benefit plan by clicking the name of the benefit plan.
■ View the Plan Name, Period Type, Start Period, Finish Period, and Planned Benefit.
Benefit Plan Details
■ View the Benefit Class, Benefit Subclass, Description, Planned, Realized, and Variance.
■ View a Time-Scaled Value displaying Benefit, Realized, and Variance for each plan detail entry, starting with the plan start period.
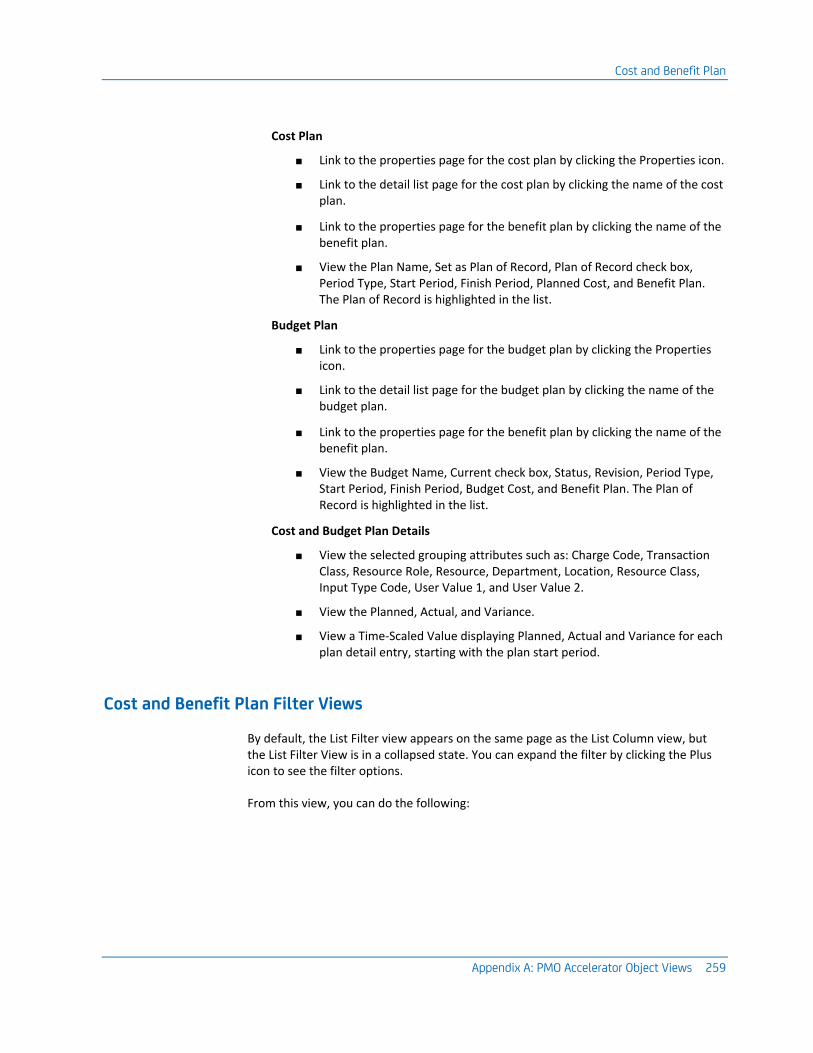
Cost and Benefit Plan
Appendix A: PMO Accelerator Object Views 259
Cost Plan
■ Link to the properties page for the cost plan by clicking the Properties icon.
■ Link to the detail list page for the cost plan by clicking the name of the cost plan.
■ Link to the properties page for the benefit plan by clicking the name of the benefit plan.
■ View the Plan Name, Set as Plan of Record, Plan of Record check box, Period Type, Start Period, Finish Period, Planned Cost, and Benefit Plan. The Plan of Record is highlighted in the list.
Budget Plan
■ Link to the properties page for the budget plan by clicking the Properties icon.
■ Link to the detail list page for the budget plan by clicking the name of the budget plan.
■ Link to the properties page for the benefit plan by clicking the name of the benefit plan.
■ View the Budget Name, Current check box, Status, Revision, Period Type, Start Period, Finish Period, Budget Cost, and Benefit Plan. The Plan of Record is highlighted in the list.
Cost and Budget Plan Details
■ View the selected grouping attributes such as: Charge Code, Transaction Class, Resource Role, Resource, Department, Location, Resource Class, Input Type Code, User Value 1, and User Value 2.
■ View the Planned, Actual, and Variance.
■ View a Time-Scaled Value displaying Planned, Actual and Variance for each plan detail entry, starting with the plan start period.
Cost and Benefit Plan Filter Views
By default, the List Filter view appears on the same page as the List Column view, but the List Filter View is in a collapsed state. You can expand the filter by clicking the Plus icon to see the filter options.
From this view, you can do the following:

GL Allocation and Resource Credit
260 PMO Accelerator Product Guide
Financial Plans
■ For benefit plans, filter by Plan Name, Plan ID, Start Period, and Finish Period.
■ For cost plans, filter by Plan Name, Plan ID, Plan of Record, Start Period, and Finish Period. By default, Plan of Record is set to All.
■ For budget plans, filter by Budget Name, Budget ID, Current, Status, Start Period, and Finish Period. By default, Current is set to All.
Financial Plan Details
■ For benefit plan details, filter by Benefit Class, Benefit Subclass, and Description. By default, Benefit Class and Benefit Subclass are set to All.
■ For cost plan details, filter by Charge Code, Transaction Class, Resource Role, Resource, Department, Location, Resource Class, Input Type Code, User Value 1 and User Value 2. By default, Charge Code, Transaction Class, Resource Class and Input Type Code are set to All.
■ For budget plan details, filter by Charge Code, Transaction Class, Resource Role, Resource, Department, Location, Resource Class, Input Type Code, User Value 1 and User Value 2. By default, Charge Code, Transaction Class, Resource Class and Input Type Code are set to All.
GL Allocation and Resource Credit
The following table shows all GL allocation and resource credit views that are modified in the PMO Accelerator.
Object Name View
GL Allocation GL Allocation Debits Properties (Create and Edit)
Standard Rule Debits Properties (Create and Edit)
Debit Rule List
Debit Rule Filter
Standard Rule List
Standard Rule Filter
GL Allocation Detail Overhead Rule Detail Properties (Create and Edit)
Overhead Rule Detail List
Overhead Rule Detail Filter
Debit Rule Detail List
Standard Rule Detail List
Resource Credit Resource Credit Properties (Create and Edit)
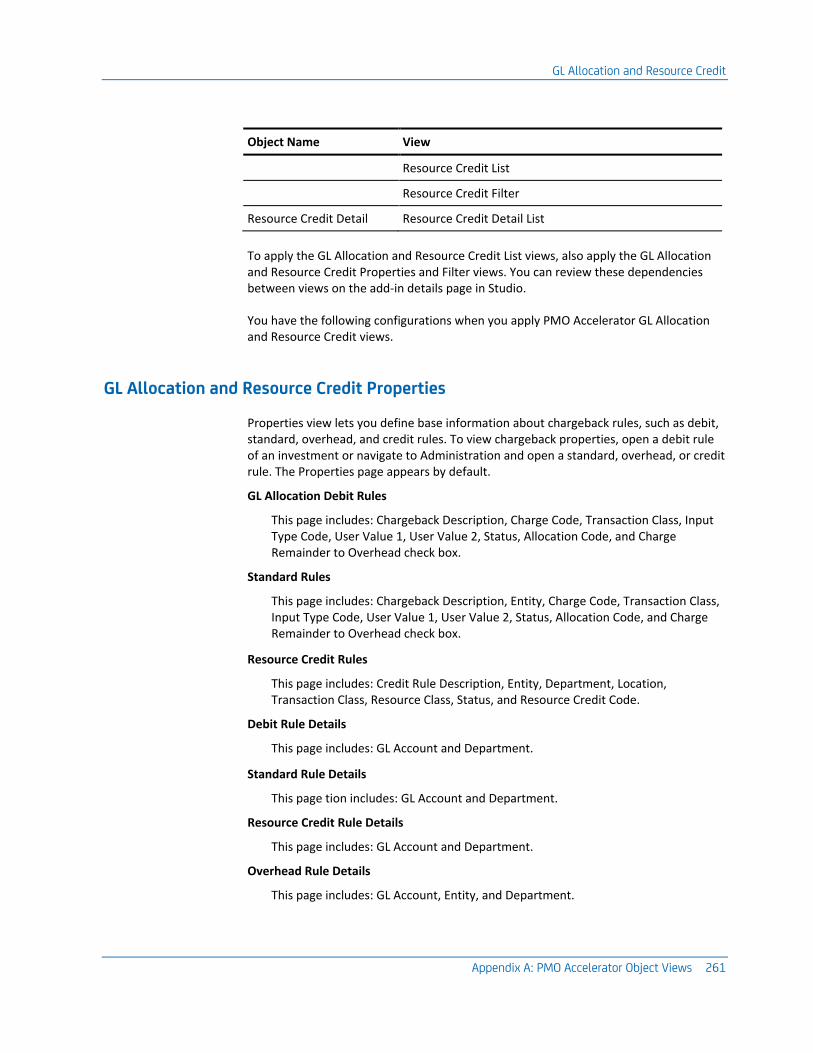
GL Allocation and Resource Credit
Appendix A: PMO Accelerator Object Views 261
Object Name View
Resource Credit List
Resource Credit Filter
Resource Credit Detail Resource Credit Detail List
To apply the GL Allocation and Resource Credit List views, also apply the GL Allocation and Resource Credit Properties and Filter views. You can review these dependencies between views on the add-in details page in Studio.
You have the following configurations when you apply PMO Accelerator GL Allocation and Resource Credit views.
GL Allocation and Resource Credit Properties
Properties view lets you define base information about chargeback rules, such as debit, standard, overhead, and credit rules. To view chargeback properties, open a debit rule of an investment or navigate to Administration and open a standard, overhead, or credit rule. The Properties page appears by default.
GL Allocation Debit Rules
This page includes: Chargeback Description, Charge Code, Transaction Class, Input Type Code, User Value 1, User Value 2, Status, Allocation Code, and Charge Remainder to Overhead check box.
Standard Rules
This page includes: Chargeback Description, Entity, Charge Code, Transaction Class, Input Type Code, User Value 1, User Value 2, Status, Allocation Code, and Charge Remainder to Overhead check box.
Resource Credit Rules
This page includes: Credit Rule Description, Entity, Department, Location, Transaction Class, Resource Class, Status, and Resource Credit Code.
Debit Rule Details
This page includes: GL Account and Department.
Standard Rule Details
This page tion includes: GL Account and Department.
Resource Credit Rule Details
This page includes: GL Account and Department.
Overhead Rule Details
This page includes: GL Account, Entity, and Department.

GL Allocation and Resource Credit
262 PMO Accelerator Product Guide
GL Allocation and Resource Credit List Views
To view a list of debit rules:
1. Open Home.
2. From the menu, click an investment type, such as Projects.
3. Click the Chargebacks tab.
4. Select Debit Rules from the drop-down list.
The List Column view appears by default. From this view, you can do the following:
Debit Rules
■ Link to the properties page for the debit rule by clicking the Properties icon.
■ Link to the debit rule details list page by clicking the chargeback description.
■ View the Chargeback Description, Charge Code, Transaction Class, Input Type Code, User Value 1, User Value 2, and Status.
Debit Rule Details
■ Link to the debit rule detail properties page by clicking the GL Account.
■ View the GL Account and Department.
■ View a Time-Scaled Value displaying allocation percentage by period.
To view a list of standard, overhead, or credit rules:
1. Open Administration.
2. From Chargebacks, click Standard Rules, Overhead Rules, or Credit Rules.
The List Column view appears by default. From this view, you can do the following:
Standard Rules
■ Link to the properties page for the standard rule by clicking the Properties icon.
■ Link to the standard rule details list page by clicking the chargeback description.
■ View the Chargeback Description, Entity, Charge Code, Transaction Class, Input Type Code, User Value 1, User Value 2, and Status.
Standard Rule Details
■ Link to the standard rule detail properties page by clicking the GL Account.
■ View the GL Account and Department.
■ View a Time-Scaled Value displaying allocation percentage by period.
GL Allocation and Resource Credit
Appendix A: PMO Accelerator Object Views 263
Credit Rules
■ Link to the properties page for the credit rule by clicking the Properties icon.
■ Link to the credit rule details list page by clicking the credit rule description.
■ View the Credit Rule Description, Entity, Department, Location, Transaction Class, Resource Class, and Status.
Credit Rule Details
■ Link to the credit rule detail properties page by clicking the GL Account.
■ View the GL Account and Department.
■ View a Time-Scaled Value displaying allocation percentage by period.
Overhead Rule Details
■ Link to the overhead rule detail properties page by clicking the GL Account.
■ View the GL Account, Entity and Department.
■ View a Time-Scaled Value displaying allocation percentage by period.
GL Allocation and Resource Credit Filter Views
By default, the List Filter view appears on the same page as the List Column view, but the List Filter View is in a collapsed state. You can expand the filter by clicking the Plus icon to see the filter options.
From this view, you can do the following:
Debit Rules
■ Filter by Chargeback Description, Charge Code, Transaction Class, Input Type Code, Status, User Value 1, and User Value 2. By default, Charge Code, Input Type Code, Status, User Value 1, and User Value 2 are set to All.
Standard Rules
■ Filter by Chargeback Description, Entity, Charge Code, Transaction Class, Input Type Code, Status, User Value 1, and User Value 2. By default, Charge Code, Input Type Code, Status, User Value 1, and User Value 2 are set to All.
Credit Rules
■ Filter by Credit Rule Description, Entity, Department, Location, Status, Transaction Class, and Resource Class. By default, Status is set to All.
Overhead Rules
■ Filter by GL Account and Department.

Investments
264 PMO Accelerator Product Guide
Investments
The following table shows all investment views that are modified in the PMO Accelerator:
Object Name View
Application Application Properties (Create and Edit)
Application List
Application Filter
Asset Asset Properties (Create and Edit)
Asset List
Asset Filter
Idea Idea Properties (Create and Edit)
Idea List
Idea Filter
Other Work Other Work Properties (Create and Edit)
Other Work List
Other Work Filter
Product Product Properties (Create and Edit)
Product List
Product Filter
Service Service Properties (Create and Edit)
Services List
Services Filter
Service Subscriptions List (Departments)
Service Subscriptions Filter (Departments)
Service Subscriptions List (Add)
Service Subscriptions Filter (Add)
To apply the Investment List views, also apply the corresponding Investment Properties and Filter views. You can review these dependencies between views on the add-in details page in Studio.
You have the following configurations when you apply PMO Accelerator Investment views.

Investments
Appendix A: PMO Accelerator Object Views 265
Investment Properties
To view main properties, open an investment. The Summary page appears by default. You can also access other properties pages by clicking the links from the content menu.
Application Summary
This page includes: Application Name, Application ID, Description, Manager, Category, Platform, Technology, Version, Status, Progress, Stage, Start Date, and Finish Date.
Asset Summary
This page includes: Asset Name, Asset ID, Description, Manager, Category, Status, Progress, Stage, Start Date, and Finish Date.
Idea Summary
This page includes: Subject, Idea ID, Idea Type, Idea Category, Idea Priority, Fast Track checkbox, Objective, Status, Progress, Requestor, Business Owner, Manager, Start Date, and Finish Date.
For information about how Fast Track affects the Idea Review process, see How to Work with the Idea Review Process (see page 18).
Other Work Summary
This page includes: Other Work Name, Other Work ID, Description, Manager, Category, Status, Progress, Stage, Start Date, and Finish Date.
Product Summary
This page includes: Product Name, Product ID, Description, Manager, Category, Version, Status, Progress, Stage, Start Date, and Finish Date.
Service Summary
This page includes: Service Name, Service ID, Description, Manager, Status, Progress, Stage, Start Date, and Finish Date.

Investments
266 PMO Accelerator Product Guide
Description
This page is only available for Ideas. The Description page includes: Description, Impact on Existing Initiatives, Dependencies, Risks, Benefit Description, and General Notes.
Schedule & Performance
This page is organized into the following sections: Schedule and Performance. This page is not available for Ideas.
Schedule
This section includes: Start Date, Finish Date, Status Indicator, and Priority.
Performance
This section includes: Actuals, ETC, EAC, Number of Incidents, Incident Actual Effort, Incident Actual Cost, and Incident Currency. Information about incidents is not available for Services.
Alignment & Risk
This page is organized into the following sections: Alignment and Risk and Alignment Factors.
Alignment and Risk
This section includes: Business Alignment, Risk, Goal, and Required check box.
Alignment Factors
This section includes: Corporate Priority, Business Unit Priority, Regulatory Compliance, Architectural Fit, Commercial Value, and Technology Compliance.
For information about the Business Alignment that is installed with the PMO Accelerator, see About Business Alignment and Status Reports (see page 31).

Investments
Appendix A: PMO Accelerator Object Views 267
Financial Summary
This page is organized into the following sections: Financial Investment Rate Options and Financial Plan Summary.
Financial Investment Rate Options
This section includes: Use System Total Cost of Capital Rate check box, System Total Cost of Capital Rate, Override Total Cost of Capital Rate, Initial Investment, Use System Reinvestment Rate check box, System Reinvestment Rate, and Override Reinvestment Rate.
Financial Plan Summary
This section includes: Calculate Financial Metrics check box, Planned Cost, Planned Cost Start, Planned Cost Finish, Planned Benefit, Planned Benefit Start, Planned Benefit Finish, Planned NPV, Planned ROI, Planned Breakeven, Planned IRR, Planned MIRR, Planned Payback Period (Months), Currency, Budget equals Planned Values check box, Budgeted Cost, Budgeted Cost Start, Budgeted Cost Finish, Budgeted Benefit, Budgeted Benefit Start, Budgeted Benefit Finish, Budgeted NPV, Budgeted ROI, Budgeted Breakeven, Budgeted IRR, Budgeted MIRR, Budgeted Payback Period (Months).
Settings
This page contains all of the investment settings organized into the following sections: General, Time and Staff, Financial, Labor Transaction Matrix, Material Transaction Matrix, Equipment Transaction Matrix, and Expense Transaction Matrix.
General
This section includes: Dashboard View and Active check box.
Time and Staff
This section includes: Track Mode, Open for Time Entry check box, and Default Resource OBS Unit.
Financial
This section includes: Department, Location, Charge Code, Financial Status, WIP Class, Investment Class, and Set Planned Cost Dates check box.
Labor, Material, Equipment, and Expense Transaction Matrix
These sections include: Rate Source, Cost Source, and Exchange Rate Type. These sections are not available for Ideas.
Note: You can secure the Settings page and control which users are allowed to change investment settings.

Investments
268 PMO Accelerator Product Guide
Investment List Views
To view a list of investments:
1. Open Home.
2. From the menu, click an investment type, such as Projects.
The List Column view appears by default. From this view, you can do the following:
Application
■ Link to the properties page for the application by clicking the name of the application or the Properties icon.
■ View the Application, Manager, Stage, Category, Platform, Technology, Version, Start, Finish, and Planned Cost.
Asset
■ Link to the properties page for the asset by clicking the name of the asset or the Properties icon.
■ View the Asset, Manager, Stage, Category, Start, Finish, and Planned Cost.
Idea
■ Link to the properties page for the idea by clicking the name of the idea or the Properties icon.
■ View the Subject, Idea Type, Idea Category, Idea Priority, Start Date, Planned Cost, Planned Benefit, Planned NPV, Planned ROI, and Status.
Other Work
■ Link to the properties page for the other work by clicking the name of the other work or the Properties icon.
■ View the Other Work, Manager, Category, Start, Finish, and Planned Cost.
Product
■ Link to the properties page for a product by clicking the name of the product or the Properties icon.
■ View the Product, Manager, Stage, Category, Version, Start, Finish, and Planned Cost.

Investments
Appendix A: PMO Accelerator Object Views 269
Service
■ Link to the properties page for a service by clicking the name of the service or the Properties icon.
■ Link to the hierarchy page for a service by clicking the Hierarchy icon.
■ Link to the subscriptions page for a service by clicking the Subscription icon.
■ View the Service, Manager, Stage, Start, Finish, and Planned Cost.
Note: Approved investments are highlighted in the list.
To view a list of service subscriptions:
1. Open Home.
2. From the menu, click Departments.
3. Select a department and click the Subscriptions tab.
The List Column view appears by default. From this view, you can do the following:
■ Link to the properties page for the subscription by clicking the Properties icon.
■ Link to the properties page for the service by clicking the name of the service.
■ View the Service Subscription, ID, Description, Start Date, and Finish Date.
To view a list of services you can add as a department subscription, click Add. The List Column view appears by default. From this view, you can do the following:
■ Link to the properties page for the service by clicking the name of the service.
■ View the Service, ID, Manager, Start Date, and Finish Date.
Investment Filter Views
By default, the List Filter view appears on the same page as the List Column view, but the List Filter View is in a collapsed state. You can expand the filter by clicking the Plus icon to see the filter options.
From this view, you can do the following:
Applications
■ Filter by Application Name, Application ID, OBS Unit, OBS Unit – Filter Mode, Category, Manager, Stage, Approved Status, and Active. By default, Category and Approved Status are set to All, and Active is set to Yes.

Investments
270 PMO Accelerator Product Guide
Assets
■ Filter by Asset Name, Asset ID, OBS Unit, OBS Unit – Filter Mode, Category, Manager, Stage, Approved Status, and Active. By default, Category and Approved Status are set to All, and Active is set to Yes.
Ideas
■ Filter by Idea Subject, Idea ID, OBS Unit, OBS Unit – Filter Mode, Idea Type, Idea Category, Requestor, Planned ROI, Idea Priority, Status, and Active. By default, Idea Type, Idea Category, Idea Priority, and Status are set to All, and Active is set to Yes.
Other Work
■ Filter by Other Work Name, Other Work ID, OBS Unit, OBS Unit – Filter Mode, Category, Manager, Stage, Approved Status, and Active. By default, Category and Approved Status are set to All, and Active is set to Yes.
Products
■ Filter by Product Name, Product ID, OBS Unit, OBS Unit – Filter Mode, Category, Manager, Stage, Approved Status, and Active. By default, Category and Approved Status are set to All, and Active is set to Yes.
Services
■ Filter by Service Name, Service ID, OBS Unit, OBS Unit – Filter Mode, Manager, Stage, Approved Status, and Active. By default, Approved Status is set to All, and Active is set to Yes.
To filter a list of service subscriptions:
1. Open Home.
2. From the menu, click Departments.
3. Select a department and click the Subscriptions tab.
The List Filter view appears by default on the same page as the List Column view in an expanded state. From this view, you can do the following:
■ Filter by Service Name, Service ID, OBS Unit, OBS Unit – Filter Mode, Manager, Start Date, and Finish Date.
To view a list of services you can add as a department subscription, click Add. From this view, you can do the following:
■ Filter by Service Name, Service ID, OBS Unit, OBS Unit – Filter Mode, Manager, Start Date, and Finish Date.

Portfolio
Appendix A: PMO Accelerator Object Views 271
Portfolio
The following table shows all portfolio views that are modified in the PMO Accelerator.
Object Name View
Portfolio Portfolio Properties (Create and Edit)
Portfolio List
Portfolio Filter
Portfolio Child List
Portfolio Child Filter
To apply the Portfolio List view, also apply the Portfolio Properties and Filter views. You can review these dependencies between views on the add-in details page in Studio.
You have the following configurations when you apply PMO Accelerator Portfolio views.
Portfolio Properties
To view main properties, open a portfolio. The General page appears by default. You can also access other properties pages by clicking the links from the content menu.
General
This page contains general information about portfolios and is organized into the following sections: General and Cost and Benefit.
General
This section includes: Portfolio Name, Portfolio ID, Description, Manager, Investment Type, Portfolio Type, Department, Start Date, and Finish Date.
Cost and Benefit
This section includes: Planned Cost, Planned Benefit, Currency, Manage Costs Using, Manage Capacity Using, and Capacity Unit Type.
Settings
This page includes: Dashboard View and Active check box.
Note: You can secure the Settings page and control which users are allowed to change portfolio settings.

Portfolio
272 PMO Accelerator Product Guide
Portfolio List Views
To view a list of portfolios:
1. Open Home.
2. From the menu, click Portfolios.
The List Column view appears by default. From this view, you can do the following:
■ Link to the properties page for the portfolio by clicking the Properties icon.
■ Link to the default tab for the portfolio in the page layout by clicking the name of the portfolio.
■ Link to the properties page of the parent portfolio by clicking the name of the parent portfolio.
■ View the Portfolio, Parent Portfolio, Manager, Start, Finish, Planned Cost, and Planned Benefit.
To view a list of child portfolios:
1. Open Home.
2. From the menu, click Portfolios.
3. Open a portfolio.
The Properties page appears by default.
4. Click the Child Portfolios link from the content menu.
The List Column view appears by default. From this view, you can do the following:
■ Link to the properties page for the portfolio by clicking the Properties icon.
■ Link to the default tab for the portfolio in the page layout by clicking the name of the portfolio.
■ View the Portfolio, Manager, Start, Finish, Planned Cost, and Planned Benefit.
Portfolio Filter Views
By default, the List Filter view appears on the same page as the List Column view, but the List Filter View is in a collapsed state. You can expand the filter by clicking the Plus icon to see the filter options.
From this view, you can do the following:
■ Filter by Portfolio Name, Portfolio ID, Parent Portfolio, Portfolio Type, Department, Manager, Investment Type, and Active. By default, Portfolio Type and Investment Type are set to All, and Active is set to Yes.

Project
Appendix A: PMO Accelerator Object Views 273
To filter a list of child portfolios:
1. Open Home.
2. From the menu, click Portfolios.
3. Open a portfolio.
The Properties page appears by default.
4. Click the Child Portfolios link from the content menu.
The List Filter view appears by default on the same page as the List Column view in a collapsed state where only the filter field appears. From this view, you can do the following:
■ Filter by Portfolio Name, Portfolio ID, Portfolio Type, Department, Manager, Investment Type, and Active. By default, Portfolio Type and Investment Type are set to All, and Active is set to Yes.
Project
The following table shows all project and program views that are modified in the PMO Accelerator.
Object Name View
Project Project Properties (Create and Edit)
Project List
Project Filter
Program Properties (Create and Edit)
Program List
Program Filter
My Projects
Subproject Selection List
Subproject Selection Filter
Project Templates Filter
Project Release Filter
Project Requirement Filter

Project
274 PMO Accelerator Product Guide
To apply the Project List view, also apply the corresponding Project Properties and Filter views. You can review these dependencies between views on the add-in details page in Studio.
You have the following configurations when you apply PMO Accelerator Project views.
Project Properties
To view main properties, open a project or program. The Summary page appears by default. You can also access other properties pages by clicking the links from the content menu.
Project Summary
This page is organized into the following sections: Project Summary and Stakeholders.
Project Summary
This section includes: Project Name, Project ID, Project Type, Project Category, Objective, Status, Progress, Stage, Start Date, and Finish Date.
Stakeholders
This section includes: Project Manager, Business Owner, Project Management Office, and Finance and Governance.
Program Summary
This page is organized into the following sections: Program Summary and Stakeholders.
Program Summary
This section includes: Program Name, Program ID, Objective, Status, Progress, Stage, Start Date, and Finish Date.
Stakeholders
This section includes: Program Manager, Business Owner, Project Management Office, and Finance and Governance.
Schedule & Performance
This page is organized into the following sections: Schedule, Performance Effort, and Performance Cost.
Schedule
(Projects) This section includes: Start Date, Finish Date, As Of Date, % Complete, Baseline Start, Baseline Finish, Status Indicator, and Priority.
(Programs) This section includes: Start Date, Finish Date, As Of Date, % Complete, Status Indicator, and Priority.

Project
Appendix A: PMO Accelerator Object Views 275
Performance Effort
This section includes: BAC, Actuals, ETC, EAC, Projected Effort Variance, Projected Effort Variance %, and % Expended.
Projected Effort Variance and Projected Effort Variance % are installed with the PMO Accelerator:
Projected Effort Variance
Displays the variance between EAC effort and baseline effort.
Formula: (EAC Effort – BAC Effort)
Projected Effort Variance %
Displays a stoplight indicating the projected effort variance as a percentage of BAC effort.
Formula: ( (EAC Effort – BAC Effort) / BAC Effort) * 100
Stoplights:
Green. The EAC effort is less than or equal to the baseline.
Yellow. The EAC effort is between one and ten percent over the baseline.
Red. The EAC effort is more than ten percent over the baseline.
White. No baseline data exists.
Performance Cost
This section includes: Planned Value (BCWS), Earned Value (BCWP), Actual Cost (ACWP), BAC Cost, ETC Cost, EAC Cost, Projected Cost Variance, Projected Cost Variance %, Cost Variance (CV), Schedule Variance (SV), Cost Variance %, Schedule Variance %, Cost Performance Index (CPI), and Schedule Performance Index (SPI).
Projected Cost Variance, Projected Cost Variance %, Cost Variance %, and Schedule Variance % are installed with the PMO Accelerator.
Projected Cost Variance
Displays the variance between the estimated plus actual cost and the baseline cost.
Formula: ( (ETC Cost + Actual Cost (ACWP)) - BAC Cost)

Project
276 PMO Accelerator Product Guide
Projected Cost Variance %
Displays a stoplight indicating the projected cost variance as a percentage of BAC cost.
Formula: ( ( (ETC Cost + Actual Cost (ACWP)) - BAC Cost) / BAC Cost) * 100
Stoplights:
Green. The EAC cost is less than or equal to the baseline.
Yellow. The EAC cost is between one and ten percent over baseline.
Red. The EAC cost is more than ten percent over baseline.
White. No baseline data exists.
Cost Variance %
Displays cost variance as a percentage. The variance is calculated as the percentage of cost variance over the amount of the budgeted cost of work performed (BCWP).
Formula: ((BCWP – ACWP) / BCWP) * 100
Schedule Variance %
Displays schedule variance as a percentage. The variance is calculated as the percentage of schedule variance over the amount of the budgeted cost of work scheduled (BCWS).
Formula: ((BCWP – BCWS) / BCWS) *100
Business Alignment
This page is organized into the following sections: Business Alignment and Alignment Factors.
Business Alignment
This section includes: Business Alignment, Goal, and Required check box.
Alignment Factors
This section includes: Corporate Priority, Business Unit Priority, Regulatory Compliance, Architectural Fit, Commercial Value, and Technology Compliance.
For information about the Business Alignment installed with the PMO Accelerator, see About Business Alignment and Status Reports (see page 31).
Risk Rating
This page is organized into the following sections: Risk Rating and Risk Factors.
Risk Rating
This section includes: Risk

Project
Appendix A: PMO Accelerator Object Views 277
Risk Factors
This section includes: Objectives, Sponsorship, Funding, Resource Availability, Interdependencies, Technical, Human Interface, Organizational Culture, Supportability, Implementation, and Flexibility.
Financial Summary
This page is organized into the following sections: Financial Investment Rate Options and Financial Plan Summary.
Financial Investment Rate Options
This section includes: Use System Total Cost of Capital Rate check box, System Total Cost of Capital Rate, Override Total Cost of Capital Rate, Initial Investment, Use System Reinvestment Rate check box, System Reinvestment Rate, and Override Reinvestment Rate.
Financial Plan Summary
This section includes: Calculate Financial Metrics check box, Planned Cost, Planned Cost Start, Planned Cost Finish, Planned Benefit, Planned Benefit Start, Planned Benefit Finish, Planned NPV, Planned ROI, Planned Breakeven, Planned IRR, Planned MIRR, Planned Payback Period (Months), Currency, Budget equals Planned Values check box, Budgeted Cost, Budgeted Cost Start, Budgeted Cost Finish, Budgeted Benefit, Budgeted Benefit Start, Budgeted Benefit Finish, Budgeted NPV, Budgeted ROI, Budgeted Breakeven, Budgeted IRR, Budgeted MIRR, Budgeted Payback Period (Months).
Status Reports
This page contains a list of status reports created for a project or program. The List Column view appears by default. From this view, you can do the following:
■ Link to the properties page for the status report by clicking the Overall Status icon or the name of the status report.
■ View the Overall Status, Status Report Name, Schedule Status, Scope Status, and Cost and Effort Status.
By default, the List Filter view appears on the same page as the List Column view in a collapsed state where only the filter field appears. You can expand the filter by clicking the Plus icon and see more filter options. From this view, you can do the following:
■ Filter by Status Report Name, Report Date, and Current Phase.
For information about the Business Alignment installed with the PMO Accelerator, see About Business Alignment and Status Reports (see page 31).
Settings
This page contains all the project or program settings and is organized into the following sections: General, Time and Staff, Earned Value, Financial, Labor Transaction Matrix, Material Transaction Matrix, Equipment Transaction Matrix, and Expense Transaction Matrix.

Project
278 PMO Accelerator Product Guide
General
This section includes: Dashboard View, Methodology, Scheduler, % Complete Calculation, Program check box, Template check box, and Active check box.
Time and Staff
This section includes: Assignment Pool, Track Mode, Open for Time Entry check box, Default Resource OBS Unit, and Requisition Approval Required check box.
Earned Value
This section includes: EV Calculation Method, Earned Value (BCWP) Override, Earned Value Reporting Period, and Earned Value Last Updated.
Financial
This section includes: Company Name, Affiliated Project, Billing Currency, Department, Location, Charge Code, Financial Status, Type, WIP Class, Investment Class, and Set Planned Cost Dates check box.
Labor, Material, Equipment, Expense Transaction Matrix
These sections include: Rate Source, Cost Source, and Exchange Rate Type.
Note: You can secure the Settings page and control which users are allowed to change project or program settings.
Project List Views
To view a list of projects or programs:
1. Open Home.
2. From the menu, click Projects or Programs.
The List Column view appears by default. From this view, you can do the following:
Project
■ Link to the properties page for the project by clicking the Properties icon.
■ Link to the Dashboard tab for the project by clicking the project name.
■ Link to the Gantt view for the project by clicking the Gantt icon.
■ Link to the Status Reports page for the project by clicking the Status Report icon.
■ Link to the Collaboration tab for the project by clicking the Document Manager icon.
■ View the Project, Manager, Stage, Start, and Finish.
■ View a Gantt chart displaying the schedule status of the project for a six-month period, starting with the current month.
Project
Appendix A: PMO Accelerator Object Views 279
Program
■ Link to the properties page for the program by clicking the Properties icon.
■ Link to the Dashboard tab for the program by clicking the program name.
■ Link to the Subprojects page for the program by clicking the Subprojects icon.
■ Link to the Gantt view for the program by clicking the Gantt icon.
■ Link to the Status Reports page for the program by clicking the Status Report icon.
■ Link to the Collaboration tab for the program by clicking the Document Manager icon.
■ View the Project, Manager, Stage, Start, and Finish.
■ View a Gantt chart displaying the schedule status of the program for a six-month period, starting with the current month.
Note: Approved projects or programs are highlighted in the list.
To view a list of projects or programs you have added to My Projects:
1. Open Home.
2. From the menu, click General.
The Overview page appears by default, displaying the My Projects portal. From this view, you can do the following:
■ Link to the properties page for the project or program by clicking the Properties icon.
■ Link to the Dashboard tab for the project or program by clicking the project or program name.
■ Link to the Team tab for the project or program by clicking the Resources icon.
■ Link to the Gantt view for the project or program by clicking the Gantt icon.
■ Link to the Status Reports page for the project or program by clicking the Status Report icon.
■ Link to the Collaboration tab for the project or program by clicking the Document Manager icon.
■ View the Project and Stage.

Project
280 PMO Accelerator Product Guide
To view a list of investments you can add as subprojects:
1. Open Home.
2. From the menu, click Projects or Programs.
Open a project or program. The Properties page appears by default.
3. From the content menu, click the Subprojects link.
4. Click the Add button.
The List Column view appears by default. From this view, you can do the following:
■ View the Investment, ID, Type, Manager, Status, Start, and Finish.
Project Filter Views
By default, the List Filter view appears on the same page as the List Column view, but the List Filter View is in a collapsed state. You can expand the filter by clicking the Plus icon to see the filter options.
From this view, you can do the following:
Projects
■ Filter by Project Name, Project ID, OBS Unit, OBS Unit – Filter Mode, Project Type, Project Category, Manager, Stage, Scheduler, Approved Status, Template, and Active. By default, Project Type, Project Category, Scheduler, and Approved Status are set to All, Template is set to No, and Active is set to Yes.
Programs
■ Filter by Program Name, Program ID, OBS Unit, OBS Unit – Filter Mode, Manager, Stage, Approved Status, and Active. By default, Approved Status is set to All, and Active is set to Yes.
To filter a list of investments you can add as subprojects:
1. Open Home.
2. From the menu, click Projects or Programs.
Open a project or program. The Properties page appears by default.
3. From the content menu, click the Subprojects link.
4. Click the Add button.
The List Filter view appears by default on the same page as the List Column view in an expanded state. From this view, you can do the following:
■ Filter by the Investment Name, Investment ID, OBS Unit, OBS Unit – Filter Mode, Investment Type, Manager, Approved Status, Template, and Active. By default, Investment Type and Approved Status are set to All, Template is set to No, and Active is set to Yes.

Project
Appendix A: PMO Accelerator Object Views 281
To filter a list of projects you use as a template:
1. Open Home.
2. From the menu, click Projects.
3. Click the New from Template button.
The List Filter view appears by default on the same page as the List Column view in an expanded state. From this view, you can do the following:
■ Filter by Project Name, Project ID, OBS Unit, OBS Unit – Filter Mode, Manager, Template, and Active. By default, Template and Active are set to Yes.
To filter a list of projects or programs you can associate to a release:
1. Open Home.
2. From the menu, click Releases.
3. Open a release.
4. Click the Link button.
5. In the Select Link Option, click Choose Existing.
The List Filter view appears by default on the same page as the List Column view in an expanded state. From this view, you can do the following:
■ Filter by Project Name, Project ID, OBS Unit, OBS Unit – Filter Mode, Manager, Approved Status, Template, and Active. By default, Approved Status is set to All, Template is set to No, and Active is set to Yes.
To filter a list of projects from which you can associate a task or requirement:
1. Open Home.
2. From the menu, click Requirements.
3. Open a requirement.
4. Click the Link button.
5. In the Select Link Option, click Choose Existing.
The List Filter view appears by default on the same page as the List Column view in an expanded state. From this view, you can do the following:
■ Filter by Project Name, Project ID, OBS Unit, OBS Unit – Filter Mode, Manager, Approved Status, Template, and Active. By default, Approved Status is set to All, Template is set to No, and Active is set to Yes.

Resource
282 PMO Accelerator Product Guide
Resource
The following table shows all resource views that are modified in the PMO Accelerator.
Object Name View
Resource Resource Labor Properties (Create and Edit)
Resource Equipment Properties (Create and Edit)
Resource Material Properties (Create and Edit)
Resource Expense Properties (Create and Edit)
Role Labor Properties (Create and Edit)
Role Equipment Properties (Create and Edit)
Role Material Properties (Create and Edit)
Role Expense Properties (Create and Edit)
Resource List
Resource Filter
Select Resources List
Resource Selection List
Resource Finder List
Department Resources List
Select Resources Filter
Resource Selection Filter
Resource Finder Filter
Department Resources Filter
To apply the Resource List view, also apply the corresponding Resource Properties and Filter views. You can review these dependencies between views on the add-in details page in Studio.
You have the following configurations when you apply PMO Accelerator Resource views.

Resource
Appendix A: PMO Accelerator Object Views 283
Resource Properties
To view main properties, open a resource or role. The General page appears by default. You can also access other properties pages by clicking the links from the content menu.
General
This page contains general information about resources or roles and is organized into the following sections: General and Resource Management, in the case of resources.
Role Labor
This page includes: Name, Role ID, Parent Role, Category, Availability, Active check box, and Booking Manager.
Role Equipment and Material
This page includes: Name, Role ID, Parent Role, Category, Availability, and Active check box.
Role Expense
This page includes: Name, Role ID, Parent Role, Category, and Active check box.
Resource Labor
This page includes: Last Name, First Name, Resource ID, and Email Address.
The Resource Management section includes: Primary Role, Category, Date of Hire, Date of Termination, Availability, Resource Manager, Booking Manager, Employment Type, and External check box.
Resource Equipment and Material
This page includes: Resource Name, and Resource ID.
The Resource Management section includes: Primary Role, Category, Date of Hire, Date of Termination, Availability, Resource Manager, Booking Manager, and External check box.
Resource Expense
This page includes: Resource Name, and Resource ID.
The Resource Management section includes: Primary Role, Category, Date of Hire, Date of Termination, Booking Manager, and External check box.
Settings
This page contains resource settings and is organized into the following sections: General and Time Tracking. This page is only available for Resources.
General
This section includes: Include in Datamart check box, and Active check box.

Resource
284 PMO Accelerator Product Guide
Time Tracking
This section includes: Track Mode, Input Type Code, and Open for Time Entry check box.
Note: You can secure the Settings page and control which users are allowed to change resource settings.
Resource List Views
To view a list of resources or roles:
1. Open Home.
2. From the menu, click Resources.
The List Column view appears by default. From this view, you can do the following:
■ Link to the properties page for the resource or role by clicking the name of the resource or role.
■ Link to the Allocation tab for the resource or role by clicking the Resource Allocation icon.
■ View the Resource/Role, Resource/Role ID, Primary Role, Resource Manager, Employment Type, and Resource Type.
To view a list of resources you can add to the investment team:
1. Open Home.
2. From the menu, click the investment type such as Projects.
3. Open a project.
The Properties page appears.
4. Click the Team tab.
5. Click the Add button.
The List Column view appears by default. From this view, you can do the following:
■ Link to the properties page for the resource or role by clicking the name of the resource or role.
■ Link to the Allocation tab for the resource or role by clicking the Resource Allocation icon.
■ View the Resource/Role, Resource/Role ID, Primary Role, Resource Manager, Employment Type, and Resource Type.

Resource
Appendix A: PMO Accelerator Object Views 285
To view a list of resources you can assign to tasks:
1. Open Home.
2. From the menu, click the investment type such as Projects.
3. Open a project.
The Properties page appears.
4. Click the Task tab.
5. Select a task.
6. Click the Assign button.
The List Column view appears by default. From this view, you can do the following:
■ Link to the properties page for the resource or role by clicking the name of the resource or role.
■ Link to the Allocation tab for the resource or role by clicking the Resource Allocation icon.
■ View the Resource/Role, Resource/Role ID, Primary Role, Employment Type, Team Member, Project Role, Start, and Finish.
To find a list of resources with a specific skill set or availability:
1. Open Home.
2. From the menu, click Resource Finder.
The List Column view appears by default. From this view, you can do the following:
■ Link to the properties page for the resource by clicking the name of the resource.
■ Link to the Allocation tab for the resource by clicking the Resource Allocation icon.
■ View the Resource, Resource ID, Primary Role, Employment Type, Availability Match, Skill Match, and Total Match.
To view a list of resources you can associate to a department:
1. Open Home.
2. From the menu, click Departments.

Resource
286 PMO Accelerator Product Guide
3. Open a department.
The Properties page appears.
4. Click the Resources tab.
The Department Resources List Column view appears by default below the department Resource Aggregation portlet. From this view, you can do the following:
■ Link to the properties page for the resource by clicking the name of the resource.
■ View the Resource, Resource ID, Primary Role, Resource Manager, Employment Type, Resource Type, Date of Hire, and Email Address.
Resource Filter Views
By default, the List Filter view appears on the same page as the List Column view, but the List Filter View is in a collapsed state. You can expand the filter by clicking the Plus icon to see the filter options.
From this view, you can do the following:
■ Filter by Resource/Role Name, Resource/Role ID, OBS Unit, OBS Unit – Filter Mode, Primary Role, Filter Mode, Is Role, Resource Manager, Employment Type, Resource Type, Category, and Active. By default, Is Role, Employment Type, and Resource Type are set to All, and Active is set to Yes.
To filter a list of resources added to the investment team:
1. Open Home.
2. From the menu, click the investment type such as Projects.
3. Open a project.
The Properties page appears.
4. Click the Team tab.
5. Click the Add button.
The List Filter view appears by default on the same page as the List Column view in an expanded state. From this view, you can do the following:
■ Filter by Resource/Role Name, Resource/Role ID, OBS Unit, OBS Unit – Filter Mode, Primary Role, Filter Mode, Resource Manager, Employment Type, Resource Type, Category, and Is Role. By default, Employment Type, Resource Type, and Is Role are set to All.

Resource
Appendix A: PMO Accelerator Object Views 287
To filter a list of resources assigned to tasks:
1. Open Home.
2. From the menu, click the investment type such as Projects.
3. Open a project.
The Properties page appears.
4. Click the Task tab.
5. Select a task.
6. Click the Assign button.
The List Filter view appears by default on the same page as the List Column view in an expanded state. From this view, you can do the following:
■ Filter by Resource/Role Name, Resource/Role ID, OBS Unit, OBS Unit – Filter Mode, Primary Role, Filter Mode, Resource Manager, Employment Type, Resource Type, Category, Is Role, and Is Team Member. By default, Employment Type, Resource Type, Is Role, and Is Team Member are set to All.
To find a list of resources with a specific skill set or availability:
1. Open Home.
2. From the menu, click Resource Finder.
The List Filter view appears by default on the same page as the List Column view in an expanded state. From this view, you can do the following:
■ Filter by Resource Name, Resource ID, OBS Unit, OBS Unit – Filter Mode, Role, Filter Mode, Employment Type, Availability, Availability Threshold (%), Include Soft-booked Resources check box, Skills, and Skills Threshold (%). By default, Employment Type is set to All.
To filter a list of resources associated to a department:
1. Open Home.
2. From the menu, click Departments.
3. Open a department.
The Properties page appears.
4. Click the Resources tab.

Task
288 PMO Accelerator Product Guide
The Department Resources List Column view appears by default below the department Resource Aggregation portlet. By default, the List Filter view appears on the Department Resources List Column view in a collapsed state where only the filter field appears. You can expand the filter by clicking the Plus icon and see more filter options.
From this view, you can do the following:
■ Filter by Resource Name, Resource ID, Primary Role, Filter Mode, Show Resources in Sub-departments check box, Resource Manager, Employment Type, Resource Type, and Active. By default, Employment Type and Resource Type are set to All, and Active is set to Yes.
Task
The following table shows all task views that are modified in the PMO Accelerator.
Object Name View
Task Task Properties (Create and Edit)
Task List
Task Filter
Association Task List
Gantt List
Project Requirement Task List
Select Task List
Association Task Filter
Gantt Filter
To apply the Task List view, also apply the Task Properties and Filter views. You can review these dependencies between views on the add-in details page in Studio.
You have the following configurations when you apply PMO Accelerator Task views.

Task
Appendix A: PMO Accelerator Object Views 289
Task Properties
To view task properties, open a task of a project. The General page appears by default. You can also access other properties pages by clicking the links from the content menu.
General
This page contains general information about tasks and is organized into the following sections: General and Assignments.
General
This section includes: Name, ID, Start, Finish, Key Task check box, Milestone check box, Fixed Duration check box, Status, % Complete, Baseline Start, Baseline Finish, Priority, and Excluded from Auto scheduling check box.
Assignments
This section is described in Assignment List Views (see page 254).
Constraints
This page includes: Must Start On, Start No Earlier Than, Start No Later Than, Must Finish On, Finish No Earlier Than, and Finish No Later Than.
Performance
This page contains performance information and is organized into the following sections: Performance Effort and Performance Cost.
Performance Effort
This section includes: BAC, Actuals, ETC, EAC, and % Expended.
Performance Cost
This section includes: Planned Value (BCWS), Earned Value (BCWP), Actual Cost (ACWP), BAC Cost, ETC Cost, EAC Cost, Cost Variance (CV), Schedule Variance (SV), Cost Variance %, Schedule Variance %, Cost Performance Index (CPI), and Schedule Performance Index (SPI).
Cost Variance % and Schedule Variance % are installed with the PMO Accelerator:
Cost Variance %
Displays cost variance as a percentage. The variance is calculated as the percentage of cost variance over the amount of the budgeted cost of work performed (BCWP).
Formula: ((BCWP – ACWP) / BCWP) * 100

Task
290 PMO Accelerator Product Guide
Schedule Variance %
Displays schedule variance as a percentage. The variance is calculated as the percentage of schedule variance over the amount of the budgeted cost of work scheduled (BCWS).
Formula: ((BCWP – BCWS) / BCWS) *100
Settings
This page includes: Open for Time Entry check box, and Charge Code.
Note: You can secure the Settings page and control which users are allowed to change task settings.
Task List Views
To view a list of tasks:
1. Open Home.
2. From the menu, click Projects.
3. Open a project.
The Properties page appears.
4. Click the Task tab.
The List Column view appears by default. From this view, you can do the following:
■ Link to the properties page for the task by clicking the name of the task.
■ View the Task, Task ID, Start, Finish, Baseline Finish, Is Late, Status, % Complete, Critical check box, and Open for Time Entry check box.
To view a project work breakdown structure:
Note: This Gantt view is divided into a work breakdown structure (WBS) on the left and a Gantt chart on the right.
1. Open Home.
2. From the menu, click Projects.

Task
Appendix A: PMO Accelerator Object Views 291
3. Open a project.
4. Click the Task tab.
5. Select Gantt from the drop-down list.
The List Column view appears collapsed by default. You can expand this view by clicking the Collapse View icon and see all columns. From this view, you can do the following:
■ Link to the properties page for the task by clicking the name of the task.
■ View the Task, Assigned Resources, Start, Finish, Duration, Status, % Complete, Actuals, ETC, EAC, Actual Cost, ETC Cost, and EAC Cost.
To view a list of tasks associated to a risk, issue, or change request:
1. Open Home.
2. From the menu, click Projects.
3. Open a project.
The Properties page appears.
4. Click the Risks/Issues/Changes tab.
5. Open a risk or issue.
6. Click the Associated Tasks tab.
The List Column view appears by default. From this view, you can do the following:
■ Link to the properties page for the task by clicking the name of the task.
■ View the Task, ID, Start, Finish, Status, and % Complete.
To view a list of tasks that can be associated to a risk, issue, or change request:
1. Open Home.
2. From the menu, click Projects.
3. Open a project.
The Properties page appears.
4. Click the Risks/Issues/Changes tab.
5. Open a risk or issue.
6. Click the Associated Tasks tab.
7. Click the Add Existing Tasks button.
The List Column view appears by default. From this view, you can do the following:
■ View the Task, ID, Start, and Finish.

Task
292 PMO Accelerator Product Guide
To view a list of projects from which you can associate a task to a requirement:
1. Open Home.
2. From the menu, click Requirements.
3. Open a requirement.
4. Click the Link button.
5. In the Select Link Option, click Choose Existing.
6. Select a project.
The List Filter view appears by default on the same page as the List Column view in an expanded state. From this view, you can do the following:
■ Link to the properties page for the task by clicking the name of the task.
■ View the Task, ID, Start, and Finish.
Task Filter Views
By default, the List Filter view appears on the same page as the List Column view, but the List Filter View is in a collapsed state. You can expand the filter by clicking the Plus icon to see the filter options.
From this view, you can do the following:
■ Filter by Task Name, Task ID, Key Task, Tasks Only, Start, Finish, Status, Is Late, Critical, Milestone, and Open for Time Entry. By default, Key Task is set to “Yes”, and Tasks Only, Status, Is Late, Critical, Milestone, and Open for Time Entry are set to All.
To filter tasks on the project work breakdown structure (WBS):
1. Open Home.
2. From the menu, click Projects.
3. Open a project.
4. Click the Task tab.
5. Select Gantt from the drop-down list.
The List Filter view appears by default on the same page as the List Column view in a collapsed state. In this state, only the filter field appears. You can expand this filter by clicking the Plus icon and see more filter options. From this view, you can do the following:
■ Filter by Task Name, Task ID, Assigned To Resources, Start, Finish, List View check box, Include, Status, Is Late, Critical, Milestone, and Exclude Projects check box. By default, Include, Status, Is Late, Critical, and Milestone are set to All.

Team
Appendix A: PMO Accelerator Object Views 293
To filter a list of tasks associated to a risk, issue, or change request:
1. Open Home.
2. From the menu, click Projects.
3. Open a project.
The Properties page appears.
4. Click the Risks/Issues/Changes tab.
5. Open a risk or issue.
6. Click the Associated Tasks tab.
The List Filter view appears by default on the same page as the List Column view in a collapsed state. In this state, only the filter field appears. You can expand this filter by clicking the Plus icon and see more filter options. From this view, you can do the following:
■ Filter by Tasks Only, Key Task, Status, and Milestone. By default, they are all set to All.
Team
The following table shows all team views that are modified in the PMO Accelerator.
Object Name View
Team Staff Member Properties (Edit)
Project Team Staff List
Project Team Detail List
Team Staff List (Investments)
Team Detail List (Investments)
Resource Allocations List
Resource Allocations Detail List
Team Selection List
Project Team Filter
Team Filter
Resource Allocations Filter
Resource Selection Filter

Team
294 PMO Accelerator Product Guide
To apply the Team List view, also apply the corresponding Team Properties and Filter views. You can review these dependencies between views on the add-in details page in Studio.
You have the following configurations when you apply PMO Accelerator Team views.
Team Properties
To view main properties:
1. Open Home.
2. From the menu, click the investment type, such as Projects.
3. Open a project.
The Properties page appears.
4. Click the Team tab.
5. Click the Properties icon of a team member.
The Properties page appears by default.
General
This page contains general information about team members and is organized into the following sections: General and Resource Search.
General
This section includes: Requirement Name, Start Date, Finish Date, Default Allocation %, Booking Status, Request Status, Resource/Role, Investment Start Date, Investment Finish Date, Investment Role, Staff OBS Unit, and Open for Time Entry check box.
Resource Search
This section includes: Resource Employment Type.
Note: The Planned Allocation and Hard Allocation sections are not modified in the PMO Accelerator.
Team List Views
To view a list of team members:
1. Open Home.
2. From the menu, click an investment type, such as Projects.

Team
Appendix A: PMO Accelerator Object Views 295
3. Open a project.
The Properties page appears.
4. Click the Team tab.
5. Select Staff or Detail from the drop-down list.
The Team Staff List Column view appears by default. From this view, you can do the following:
Staff
■ Link to the properties page for the team member by clicking the Properties icon.
■ Link to the Find Resources page by clicking the Resource Finder icon.
■ Link to the properties page for the resource or role by clicking the name of the resource or role.
■ Link to the allocation page for the resource or role by clicking the Resource Allocation icon.
■ For projects and programs, view the Resource/Role, Project Role, Staff OBS Unit, Booking Status, Open for Time check box, Start, Finish, Average Allocation %, Allocation, Actuals, and ETC.
■ For other investments, view Resource/Role, Investment Role, Staff OBS Unit, Booking Status, Open for Time check box, Start, Finish, Average Allocation %, Allocation, Actuals, Incident Actuals, and Total Actuals.
Detail
■ Link to the properties page for the team member by clicking the Properties icon.
■ Link to the Find Resources page by clicking the Resource Finder icon.
■ Link to the properties page for the resource or role by clicking the name of the resource or role.
■ Link to the allocation page for the resource or role by clicking the Resource Allocation icon.
■ For project and program, view Resource/Role, Project Role, Booking Status, Start, Finish, Allocation, Actuals, and ETC.
■ For other investments, view Resource/Role, Investment Role, Booking Status, Start, Finish, Allocation, and Actuals.
■ View a Time-Scaled Value showing Allocation by Period, displaying a six-month period, starting with the current month.
To view a list of allocations for resources or roles:
1. Open Home.
2. From the menu, click Resources.

Team
296 PMO Accelerator Product Guide
3. Open a resource.
The Properties page appears.
4. Click the Allocations tab.
5. Select Summary or Detail from the drop-down list.
The Summary List Column view appears by default. From this view, you can do the following:
Summary
■ Link to the properties page for the team member by clicking the Properties icon.
■ Link to the Find Resources page by clicking the Resource Finder icon.
■ Link to the properties page for the investment by clicking the name of the investment.
■ View the Investment, Investment Manager, Investment Role, Booking Status, Open for Time, Allocation Start, Allocation Finish, Average Allocation %, Allocation, Actuals, and ETC.
Detail
■ Link to the properties page for the team member by clicking the Properties icon.
■ Link to the Find Resources page by clicking the Resource Finder icon.
■ Link to the properties page for the investment by clicking the name of the investment.
■ View the Investment, Investment Role, Booking Status, Allocation Start, Allocation Finish, Allocation, Actuals, and ETC.
■ View a Time-Scaled Value showing Allocation by Period, displaying a six-month period, starting with the current month.
To view a list of team members you can assign to tasks:
1. Open Home.
2. From the menu, click the investment type, such as Projects.
3. Open a project.
The Properties page appears.
4. Click the Task tab.

Team
Appendix A: PMO Accelerator Object Views 297
5. Select a task.
6. Click the Assign button, followed by the Team button.
Note: The Assignment Pool option must be set to Resource Pool.
The List Column view appears by default. From this view, you can do the following:
■ Link to the properties page for the resource or role by clicking the name or ID of the resource or role.
■ View the Resource/Role, Resource/Role ID, Project Role, Staff OBS Unit, Booking Status, Start, Finish, Average Allocation %, and Allocation.
Team Filter Views
By default, the List Filter view appears on the same page as the List Column view, but the List Filter View is in a collapsed state. You can expand the filter by clicking the Plus icon to see the filter options.
From this view, you can do the following:
■ For projects and programs, filter by Requirement Name, Resource/Role Name, Resource/Role ID, Resource OBS, Resource OBS – Filter Mode, Project Role, Resource Type, Booking Status, Unstaffed, Open for Time, and Resource Active. By default, Resource Type is set to Labor, Booking Status, Unstaffed, and Open for Time are set to All, and Resource Active is set to Yes.
■ For other investments, filter by Requirement Name, Resource/Role Name, Resource/Role ID, Resource OBS, Resource OBS – Filter Mode, Investment Role, Resource Type, Booking Status, Unstaffed, Open for Time, and Resource Active. By default, Resource Type is set to Labor, Booking Status, Unstaffed, and Open for Time are set to All, and Resource Active is set to Yes.
To filter a list of allocations for a resource or role:
1. Open Home.
2. From the menu, click Resources.
3. Open a resource.
The Properties page appears.
4. Click the Allocations tab.

Team
298 PMO Accelerator Product Guide
5. Select Summary or Detail from the drop-down list.
The List Filter view appears by default on the same page as the List Column view in a collapsed state. In this state, only the filter field appears. You can expand the filter by clicking the Plus icon and see more filter options. From this view, you can do the following:
■ Filter by Investment Name, Investment ID, Investment OBS, Investment OBS – Filter Mode, Investment Role, Approved, Investment Manager, Investment Active, Booking Status, and Open for Time. By default, Approved, Booking Status, and Open for Time are set to All, and Investment Active is set to Yes.
To filter a list of team members you can assign to tasks:
1. Open Home.
2. From the menu, click the investment type, such as Projects.
3. Open a project.
The Properties page appears.
4. Click the Task tab.
5. Select a task.
6. Click the Assign button, followed by the Team button.
Note: The Assignment Pool option must be set to Resource Pool.
The List Filter view appears by default on the same page as the List Column view in an expanded state. From this view, you can do the following:
■ Filter by Resource/Role Name, Resource/Role ID, Resource OBS, Resource OBS – Filter Mode, Project Role, Resource Type, Booking Status, and Zero Allocation. By default, Resource Type is set to Labor, Booking Status is set to All, and Zero Allocation is set to No.