Mitofusin 2 Regulates STIM1 Migration from the Ca2+ Store to the Plasma Membrane in Cells with...
44
1 Mitofusin 2 regulates STIM1 migration from the Ca 2+ store to the plasma membrane in cells with depolarised mitochondria. Karthika Singaravelu, Charmaine Nelson, Daniel Bakowski. Olga Martins de Brito 1 , Siaw-Wei Ng, Joseph Di Capite, Trevor Powell, Luca Scorrano 1 and Anant B. Parekh* Running title: Mitofusin2 regulates trafficking of the protein STIM1 Key words: Ca 2+ channels/Mitochondria/Protein Trafficking/STIM1 Department of Physiology, Anatomy and Genetics, University of Oxford. Sherrington Building, Parks Road, Oxford. OX1 3PT. U.K. 1 Dulbecco-Telethon Institute, Venetian Institute of Molecular Medicine, Via Orus 2, 35129 Padova, Italy. * author for correspondence Tel: ++44-1865-272439 Fax: ++44-1865-272488 e-mail: [email protected] http://www.jbc.org/cgi/doi/10.1074/jbc.M110.174029 The latest version is at JBC Papers in Press. Published on January 10, 2011 as Manuscript M110.174029 Copyright 2011 by The American Society for Biochemistry and Molecular Biology, Inc. by guest on July 13, 2016 http://www.jbc.org/ Downloaded from by guest on July 13, 2016 http://www.jbc.org/ Downloaded from by guest on July 13, 2016 http://www.jbc.org/ Downloaded from by guest on July 13, 2016 http://www.jbc.org/ Downloaded from by guest on July 13, 2016 http://www.jbc.org/ Downloaded from by guest on July 13, 2016 http://www.jbc.org/ Downloaded from by guest on July 13, 2016 http://www.jbc.org/ Downloaded from by guest on July 13, 2016 http://www.jbc.org/ Downloaded from by guest on July 13, 2016 http://www.jbc.org/ Downloaded from
-
Upload
independent -
Category
Documents
-
view
2 -
download
0
Transcript of Mitofusin 2 Regulates STIM1 Migration from the Ca2+ Store to the Plasma Membrane in Cells with...

1
Mitofusin 2 regulates STIM1 migration from the Ca2+ store to the
plasma membrane in cells with depolarised mitochondria. Karthika Singaravelu, Charmaine Nelson, Daniel Bakowski. Olga Martins de Brito1, Siaw-Wei Ng, Joseph
Di Capite, Trevor Powell, Luca Scorrano1 and Anant B. Parekh*
Running title: Mitofusin2 regulates trafficking of the protein STIM1
Key words: Ca2+ channels/Mitochondria/Protein Trafficking/STIM1
Department of Physiology, Anatomy and Genetics, University of Oxford. Sherrington Building, Parks
Road, Oxford. OX1 3PT. U.K. 1 Dulbecco-Telethon Institute, Venetian Institute of Molecular Medicine, Via Orus 2, 35129 Padova, Italy.
* author for correspondence
Tel: ++44-1865-272439
Fax: ++44-1865-272488
e-mail: [email protected]
http://www.jbc.org/cgi/doi/10.1074/jbc.M110.174029The latest version is at JBC Papers in Press. Published on January 10, 2011 as Manuscript M110.174029
Copyright 2011 by The American Society for Biochemistry and Molecular Biology, Inc.
by guest on July 13, 2016http://w
ww
.jbc.org/D
ownloaded from
by guest on July 13, 2016
http://ww
w.jbc.org/
Dow
nloaded from
by guest on July 13, 2016http://w
ww
.jbc.org/D
ownloaded from
by guest on July 13, 2016
http://ww
w.jbc.org/
Dow
nloaded from
by guest on July 13, 2016http://w
ww
.jbc.org/D
ownloaded from
by guest on July 13, 2016
http://ww
w.jbc.org/
Dow
nloaded from
by guest on July 13, 2016http://w
ww
.jbc.org/D
ownloaded from
by guest on July 13, 2016
http://ww
w.jbc.org/
Dow
nloaded from
by guest on July 13, 2016http://w
ww
.jbc.org/D
ownloaded from

2
Abstract
Store-operated Ca2+ channels in the plasma membrane (PM) are
activated by the depletion of Ca2+ from the endoplasmic reticulum (ER) and
constitute a widespread and highly
conserved Ca2+ influx pathway. After store emptying, the ER Ca2+ sensor
STIM1 forms multimers, which then migrate to ER-PM junctions where
they activate the CRAC channel
Orai1. Movement of an intracellular protein to such specialised sites where
it gates an ion channel is without
precedence but the fundamental question of how STIM1 migrates
remains unresolved. Here, we show that trafficking of STIM1 to ER-PM
junctions and subsequent CRAC
channel activity is impaired following mitochondrial depolarisation. We
identify the dynamin-related mitochondrial protein mitofusin 2,
mutations of which causes the
inherited neurodegenerative disease Charcot-Marie-Tooth IIa in humans,
as an important component of this mechanism. Our results reveal a
molecular mechanism whereby a
mitochondrial fusion protein regulates protein trafficking across the
endoplasmic reticulum and reveals a
homeostatic mechanism whereby mitochondrial depolarisation can
inhibit store-operated Ca2+ entry, thereby reducing cellular Ca2+
overload.
INTRODUCTION In eukaryotic cells, a variety of
different agonists including hormones,
neurotransmitters and growth factors
elicit cellular responses through a rise in
cytoplasmic Ca2+ concentration (6).
Cytoplasmic Ca2+ can be increased
following Ca2+ release form intracellular
stores, by Ca2+ entry across the plasma
membrane via Ca2+-permeable ion
channels or by both processes. In many
cell types, the emptying of intracellular
Ca2+ stores opens store-operated Ca2+
channels in the plasma membrane (28,
44, 45). The best characterised store-
operated Ca2+ channel is the CRAC
channel, which constitutes the major
Ca2+ entry pathway in immune cells (23,
67). Ca2+ entry through CRAC channels
activates a range of temporally distinct
responses including exocytosis, enzyme
activation and gene transcription (41,
45).
by guest on July 13, 2016http://w
ww
.jbc.org/D
ownloaded from

3
Recently, the molecular basis of
store-operated Ca2+ entry has been teased
apart. Targeted RNAi screens first
identified STIM1, a single
transmembrane-spanning domain protein
found predominantly in the endoplasmic
reticulum (ER), as being essential for
CRAC channel activation (30, 52).
STIM1 has a Ca2+-binding EF-hand that
faces the lumen of the ER and site-
directed mutagenesis has revealed that
this likely senses the Ca2+ content of the
store (30, 65, 66). Upon store depletion,
Ca2+ dissociates from STIM1 and this is
thought to promote multimerization
through the N-terminal sterile α motif
(29), a step that is central to CRAC
channel activation (31). STIM1
multimers then migrate to punctate
structures < 25 nm from the plasma
membrane that correspond to ER-PM
junctions (60). At such sites, STIM1
activates Orai1, a four-transmembrane
domain plasma membrane protein that is
also required for CRAC channel activity
(11, 59, 65). Mutagenesis studies have
established that Orai1 is at least part of
the CRAC channel pore (48, 58, 62). A
cytoplasmic domain of STIM1 binds to
both the N- and C-termini of Orai1 (26,
38, 46, 64), leading to CRAC channel
activation.
Although STIM1 trafficking
towards the plasma membrane is a
critical early step in CRAC channel
activation, an important but unresolved
question is: how is the migration process
controlled? One idea is that STIM1
diffuses randomly in the ER but
becomes trapped at the ER-PM junctions
upon store depletion (61). Alternatively,
it has been suggested that STIM1
reaches the ER-PM junctions by active
transport along microtubules (56) and
STIM1 binds directly to the
microtubule-plus-end-tracking protein
EB1 (17). Interestingly, STIM1 has been
found to co-localise with alpha-tubulin
and microtubule depolymerization
reduces STIM1 puncta formation,
supporting a role for the microtubule
cytoskeleton (56). On the other hand,
STIM1 can form puncta even when
intracellular ATP levels have been
depleted, suggesting its movement is a
passive process (9).
A solid body of evidence has
demonstrated that mitochondria control
CRAC channel activity (15, 16, 20, 21,
42, 43). Although some of the effects of
mitochondria arise from their ability to
by guest on July 13, 2016http://w
ww
.jbc.org/D
ownloaded from

4
buffer cytoplasmic Ca2+ and thus reduce
Ca2+-dependent inactivation of CRAC
channels, growing evidence suggests
that they might have an additional role in
regulating CRAC channels that is
unrelated to their ability to take up Ca2+,
produce ATP and generate reactive
oxygen species (13, 16). Mitochondria
can be positioned adjacent to ER through
interactions between proteins on the two
organelles, with a major role for the
mitochondria-shaping protein mitofusin
2 (Mfn2) (8, 10, 40). Mouse embryonic
fibroblasts lacking Mfn2 display
loosened ER-mitochondria tethering and
reduced rate of mitochondrial Ca2+
uptake following InsP3-mediated Ca2+
release from the ER (10). Whether this
physical uncoupling impacts upon
spatially more distal events is unclear.
We show here that mitochondrial
depolarization suppresses STIM1 puncta
formation and subsequent Orai1-
dependent CRAC currents and these
inhibitory effects can be partially
overcome by overexpression of either
STIM1 or a STIM1 mutant that occupies
ER-PM junctions in non-stimulated cells
with intact stores. In cells lacking Mfn2,
STIM1 puncta formation and CRAC
channel activity was independent of
mitochondrial status and analysis of
Mfn2 mutants revealed a major role for
mitochondrially targeted Mfn2. Our
results identify a new role for
mitochondria in cell biology, that is,
these organelles help regulate the
movement of an ER-resident multimeric
protein complex to the plasma
membrane. Furthermore, our findings
reveal Mfn2 as an important component
in the mechanism whereby
mitochondrial depolarisation inhibits
CRAC channel activity.
MATERIALS AND METHODS Cell Culture and Transfection- Rat basophilic leukemia (RBL-1) cells and HEK293 were bought from ATCC. RBL-1 cells were cultured (37 °C, 5% CO2) in Dulbecco’s modified Eagle medium with 10% fetal bovine serum, 2 mM L-glutamine and penicillin-streptomycin, as previously described (2). HEK293 cells were cultured in RPMI with 10% fetal bovine serum, 2 mM L-glutamine and penicillin-streptomycin. HEK293 cells were cotransfected with cDNA encoding Orai1 (Origene) and eYFP-STIM1 (gift from Dr T. Meyer) using two independent methods: lipofectamine and Amaxa systems, as described (37). eYFP-mutant STIM1 was a gift from Dr J. Putney. RBL-1 cells were transfected with RNAi against Orai1 ((39), purchased from Invitrogen) together with enhanced eYFP using the nucleofection method (Amaxa). Cells were passaged onto glass coverslips and used 36-48 h after plating. Wild type and
by guest on July 13, 2016http://w
ww
.jbc.org/D
ownloaded from

5
mitofusin 2-deficient mouse embryonic fibroblasts (MEFs) were cultured as described in (8). Cells were grown in MEF media (DMEM, 10%FCS, 1X nonessential amino acids, 1 mM L-glutamine, penicillin/streptomycin [Life technologies/GIBCO BRL]) and transfected using LipofectamineTM 2000 (Invitrogen). ICRAC recordings-Patch-clamp experiments were conducted in the tight-seal whole-cell configuration at room temperature (20-25 0C) as previously described (2, 16). Sylgard-coated, fire-polished pipettes had d.c. resistances of 4.2-5.5MΩ when filled with standard internal solution that contained (in mM): Cs+ glutamate 145, NaCl 8, MgCl2 1, Mg-ATP 2, Ethylene glycol-bis(b-aminoethyl ether)-N,N,N’,N’,-tetraacetic acid (EGTA) 10, HEPES 10, pH 7.2 with CsOH. In some experiments, 30 µM InsP3 was added to this solution. A correction of +10 mV was applied for the subsequent liquid junction potential that arose from this glutamate-based internal solution. The composition of the extracellular solution was (in mM): NaCl 145, KCl 2.8, CaCl2 10, MgCl2 2, CsCl 10, D-glucose 10, HEPES 10, pH 7.4 with NaOH. ICRAC was measured by applying voltage ramps (-100 to +100 mV in 50 msec) at 0.5 Hz from a holding potential of 0 mV. Currents were filtered using an 8-pole Bessel filter at 2.5 kHz and digitised at 100 ms. Currents were normalised by dividing the amplitudes (measured from the voltage ramps at - 80 mV) by the cell capacitance. Capacitative currents were compensated before each ramp by using the automatic compensation of the EPC 9 -2 amplifier. For ICRAC, leak currents were subtracted by averaging 2-3 ramp currents obtained just before ICRAC had started to develop, and then subtracting
this from all subsequent currents. Transfected cells were identified by expression of either eYFP or eGFP. Ca2+ imaging-Ca2+ imaging experiments were carried out at room temperature using the IMAGO CCD camera-based system from TILL Photonics, as described previously (37). Cells were alternately excited at 356 and 380 nm (20 msec exposures) and images were acquired every 2 seconds. Images were analysed offline using IGOR Pro for Windows. Cells were loaded with Fura 2-AM (1 µM) for 40 minutes at room temperature in the dark and then washed three times in standard external solution of composition (in mM) NaCl 145, KCl 2.8, CaCl2 2, MgCl2 2, D-glucose 10, HEPES 10, pH 7.4 with NaOH. Cells were left for 15 minutes to allow further deesterification. Ca2+-free solution had the following composition (in mM) NaCl 145, KCl 2.8, MgCl2 2, D-glucose 10, HEPES 10, EGTA 0.1, pH 7.4 with NaOH). The rate of Ba2+ influx (on addition of 2 mM Ba2+) was obtained by measuring the initial slope of the fluorescence rise following readmission of Ba2+ to cells with depleted stores. Ca2+ signals are plotted as R, which denotes the 356/380 nm ratio. Mg2+ imaging-Cytoplasmic Mg2+ was used to measure Mg-ATP (see text). Cells were loaded with mag-fura 2-AM (1 µM) for 40 minutes at room temperature and experiments were carried out as for fura 2. TIRF microscopy-RBL-1 cells were transfected with eYFP-STIM1 and plated onto Willco thin glass bottom dishes (Intracel, UK) 48 hours in advance of experiments. Cells were bathed with the standard external solution that contained (in mM) NaCl 145, KCl 2.8, CaCl2 2, MgCl2 2, D-glucose 10, HEPES 10, pH 7.4 with
by guest on July 13, 2016http://w
ww
.jbc.org/D
ownloaded from

6
NaOH. Images from cells using total internal reflection fluorescence (TIRF) microscopy were collected by a Hamamatsu ORCA-AG, Deep Cooled Digital Camera (Model C4742-80-12AG), connected to an inverted TE2000 microscope with a through-the-lens (prismless) TIRF imaging attachment (Nikon). Samples were viewed through a CFI Apo TIRF 60x oil-immersion high-resolution objective (1.49 N.A.) and excited by the 488 nm line of an argon laser (Spectra Physics 163-A120) via a FITC Filter Block (Excitation 465-495 nm, Dichroic 505 nm, Barrier 515-555 nm). Image collection was controlled by IPLab software (BD Biosciences) at 2s intervals for 8 minutes. Post-collection analysis consisted of each cell being selected by a Region of Interest and the mean pixel intensity calculated for each frame of the collection sequence. Electron microscopy-After specific treatments (as described in the text), eYFP-STIM1-transfected HEK cells were collected and fixed in 4% paraformaldehyde in 0.1 M phosphate buffer for 30 min at room temperature. The cells were blocked with 2% BSA and 1% goat serum in PBS for 1 hr. Staining was performed by incubation with primary antibody (rabbit anti-GFP; 1:50 working dilution; Invitrogen) in PBS containing 0.2% BSA and 0.1% goat serum overnight at 4C. Cells were then incubated with biotinylated secondary antibody (goat anti-rabbit IgG; 1:200 working dilution; Vector Laboratories) for 1 hr at room temperature. The STIM1 protein was detected by using the Elite ABC peroxidase kit according to manufacturer instructions (Vector Laboratories). Cell cultures of all treatments were processed simultaneously with the same solutions
and incubation times. After post fixation with 1% osmium tetroxide for 45 min, cells were stained with 2% aqueous uranyl acetate for 1 hr. Cells were further processed as described previously (36). HEK293 cells were used for electron microscopy for two reasons. First, expression of YFP-STIM1 was much higher than in RBL-1 cells. Second, the HEK cells attached to the coverslips much better and hence less detached during the extensive washing/fixing procedures. Distribution of mitochondria (Supplementary Figure 3) was measured by computing the distance of each mitochondrion from the plasma membrane in the X-Y direction, in sequences of 100 serial sections (each of 50 nm thickness) taken across each cell. Sections were scanned into a G5 Mac computer and superimposed, in order to avoid analysing the same mitochondrion twice. Confocal microscopy-Cells were fixed in 4% paraformaldehyde in phosphate buffer for 30 minutes at room temperature, after stimulation with thapsigargin. All the washes used 0.01% Phosphate buffered saline (PBS; in mM: NaCl 137, KCl 2.7, Na2HPO4 8, KH2PO4 1). The cells were blocked with 2% BSA (bovine serum albumin) and 10% goat serum for 1 hour. Mitofusin 2 was visualized using a monoclonal antibody (kindly provided by Dr Richard Youle, NIH; used at a dilution of 1:250). The secondary anti-rabbit IgG was a HandL chain specific (goat) fluorescein conjugate (excitation at 495nm, emission at 515nm). This was used at 1:2000 in PBS for 2 hours at room temperature. The cells were mounted in Vectashield mounting medium containing a propidium iodide counterstain for DNA, (excitation 535nm, emission 615nm).
by guest on July 13, 2016http://w
ww
.jbc.org/D
ownloaded from

7
Images were obtained using a Leica confocal microscope. ER distribution-HEK293 cells were transfected with cell light ER-RFP, Bacman 2.0 (Invitrogen) and ER distribution was viewed using confocal microscopy of fixed cells. Statistics-Data are presented as the mean±sem. Statistical significance was determined using a student t test. * denotes p<0.01. RESULTS
STIM1 migration and Orai1 activity is
regulated by mitochondria We first confirmed, using patch
clamp recordings, findings originally
made in the HEK293 expression system
(33, 47) and drosophila S2 cells (65) that
co-expression of Orai1 and STIM1 in
RBL cells increased the size of ICRAC. As
shown in supplementary Figures 1A-C,
dialysis of RBL-1 cells transfected with
cDNA for both Orai1 and eYFP-STIM1
resulted in a larger ICRAC (~ 3 to 5-fold)
than was the case with corresponding
controls transfected with eYFP or eGFP
plasmids alone. The current was
identified as ICRAC on the basis of several
characteristics including its steep inward
rectification and positive reversal
potential (supplementary Figure 1B), its
absence when external Ca2+ was
removed (data not shown), inhibition by
the CRAC channel blocker 2-APB (50
µM, data not shown) and ability to
activate when stores were depleted
passively (10 mM EGTA,
supplementary Figure 1C). Transfection
with eYFP-STIM1 alone increased Ca2+
influx < 1.5-fold compared with the
control response (Supplementary Figure
2A). On the other hand, as observed
previously (33, 59), overexpression of
Orai1 alone reduced Ca2+ influx by ~
35% (Supplementary Figure 2A). Hence
recombinant co-expression of STIM1
and Orai1 increases the size of ICRAC. It is
important to note that the increase in
RBL cells is very modest, when
compared with common expression
systems like HEK293 cells where a >
500-fold increase in current can
routinely be obtained (33, 47, 57, 65).
We designed experiments to see if Orai1
also contributed to native ICRAC and
agonist-evoked Ca2+ entry. Knockdown
of Orai1 using an RNAi approach that
we have described recently (39) reduced
the amplitude of ICRAC by ~ 70%
(supplementary Figure 1D). We altered
the expression levels of Orai1 before
challenging intact cells, loaded with the
Ca2+-sensitive fluorescent dye fura-2,
with the endogenous P2Y receptor
by guest on July 13, 2016http://w
ww
.jbc.org/D
ownloaded from

8
agonist ATP. Cells were stimulated with
agonist in Ca2+-free solution and then
Ba2+ was applied. Ba2+ permeates CRAC
channels but, unlike Ca2+, is not
transported out of the cytoplasm by
Ca2+ATPase pumps and therefore
provides a good indication of CRAC
channel activity (5, 45, 53). Exposure to
Ba2+ after challenge with ATP in Ca2+-
free solution resulted in prominent Ba2+
influx (supplementary Figure 1E,
labelled control). The rate and extent of
Ba2+ influx was significantly larger in
cells co-expressing eYFP-STIM1 and
Orai1 (supplementary Figure 1E).
Although STIM1 has been reported to
control non-store-operated Ca2+ entry
pathways, this requires the protein to be
in the plasma membrane (34). eYFP-
STIM1 is not inserted into the plasma
membrane and remains within the ER
where it specifically regulates CRAC
channels (33). Knockdown of
endogenous Orai1 reduced agonist-
evoked Ba2+ influx compared with
control cells (supplementary Figure 1E).
Similar findings were observed when
cells were stimulated with different
concentrations of ATP (supplementary
Figure 1F), demonstrating that ICRAC is
the dominant source of Ca2+ entry over a
range of stimulus intensities.
Mitochondria regulate CRAC
channel activity in several cell types (42,
43, 45). In RBL cells co-expressing
Orai1 and eYFP-STIM1, both store-
operated Ca2+ influx in intact cells
(Figures 1A and B) and ICRAC (Figures
1C and D) were substantially reduced
following mitochondrial depolarisation
by inhibition of complex III of the
respiratory chain with antimycin A
(together with oligomycin to prevent the
F1-F0ATPsynthase from running in
reverse). Similar findings were seen
when mitochondria were depolarised
with the protonophore FCCP (ICRAC was
reduced by 79±4%, data not shown).
Oligomycin alone (15 minutes pre-
treatment) had no inhibitory effect (data
not shown; see also [26]). Importantly,
the extent of Ca2+ release from the stores
was not compromised by mitochondrial
depolarisation (Figure 1A, see also (16)).
Mitochondria therefore target a step
distal to store depletion. Since STIM1
movement occurs after store depletion,
we looked to see whether its migration
towards the plasma membrane was
affected by impairing mitochondrial
activity. Analysis of eYFP-STIM1
by guest on July 13, 2016http://w
ww
.jbc.org/D
ownloaded from

9
movement using confocal microscopy on
fixed cells showed that very little STIM1
was located at the cell periphery in
resting cells (Figure 1E, first panel,
labelled Control). Store depletion with
thapsigargin (applied in Ca2+-free
solution) resulted in strong staining of
the cell periphery together with the
appearance of punctate-like structures in
the cytoplasm (Figure 1E, second panel).
Strikingly, mitochondrial depolarisation
dramatically reduced staining around the
cell surface and increased the number of
punctate-like structures in the cytoplasm
(Figure 1E, third panel), presumably
reflecting formation of intracellular
STIM1 multimers that were unable to
traffic to the plasma membrane.
Inhibition of ATP synthesis with
oligomycin did not affect eYFP-STIM1
movement induced by store depletion
(Figure 1E, fourth panel), consistent
with a recent report that oligomycin does
not impair puncta formation in a breast
cancer cell line (9). Analysis of eYFP-
STIM1 location together with
mitochondria (identified with
mitotracker red) in the same cells
revealed very little co-localisation,
ruling out significant location of STIM1
on mitochondria (Figure 1F).
Mitochondria do not migrate to the
plasma membrane In T cells, mitochondria migrate to the
cell periphery following Ca2+ entry
through CRAC channels (50). To
quantify the distribution of mitochondria
in more detail and to examine whether
they also migrated to the cell periphery
like STIM1 after store depletion, we
compared mitochondrial location in
resting and store-depleted RBL-1 cells
using electron microscopy
(supplementary Figure 3). We measured
the number of mitochondria as a
function of distance from the plasma
membrane, obtained from quantitative
analysis of 100 serial sections, taken
every 50 nm and thus spanning the entire
cell thickness. Within 100 nm of the
plasma membrane, there was a paucity
of mitochondria. To see whether Ca2+
influx through CRAC channels changed
the pattern of mitochondrial distribution,
we stimulated cells with thapsigargin for
10 minutes (in the presence of 2 mM
external Ca2+) and then cut serial
sections. The pattern was similar to that
seen in control cells, indicating that store
depletion and subsequent CRAC channel
activation did not change the
mitochondrial profile near the plasma
by guest on July 13, 2016http://w
ww
.jbc.org/D
ownloaded from

10
membrane, at least with our stimulation
protocol. Most mitochondria were found
around 500 nm to 1 micrometre from the
cell surface. Consistent with these
structural findings, functional evidence
against close apposition of mitochondria
with the plasma membrane was provided
by measuring the rate and extent of rapid
inactivation of CRAC channels. Ca2+
permeation through CRAC channels
results in the build-up of a microdomain
of elevated Ca2+ which can feedback to
inactivate the channels partially (12, 22,
68). The Ca2+ binding site is thought to
reside within 10 nm of the channel pore
because it is reduced by the fast chelator
BAPTA but not the slower EGTA.
Although ICRAC was reduced by
mitochondrial depolarisation, the rate
and extent of fast inactivation was
unaffected (supplementary Figure 3D;
measured using Ca2+ as the charge carrier
and with matched peak amplitudes
between control and
antimycin/oligomycin-treated cells),
suggesting that the organelle was not
sufficiently close to the plasma
membrane to impact upon the buildup of
local microdomains emanating from
open CRAC channels. Collectively,
these findings demonstrate that
mitochondria do not migrate with
STIM1 to the cell periphery following
store depletion. In addition, our results
show that mitochondria can regulate
CRAC channels without needing to be
located very close to the plasma
membrane. This is in good agreement
with a recent report that found
mitochondria were absent from plasma
membrane regions containing active
store-operated Ca2+ channels (14).
STIM1 puncta formation is regulated by mitochondria
To characterize the role for
mitochondria on STIM1 trafficking in a
more quantitative way, we monitored
eYFP-STIM1 movement with total
internal reflection fluorescence (TIRF)
microscopy, which detects events
restricted to within ~100 nm of the
plasma membrane. Stimulation of RBL-
1 cells with thapsigargin resulted in
eYFP-STIM1 movement to the cell
periphery (Figure 2A) and this was
substantially reduced by mitochondrial
depolarisation with antimycin A and
oligomycin (Figure 2A) or FCCP and
oligomycin (supplementary Figure 2B)
but not oligomycin alone (supplementary
Figure 2B). Aggregate data comparing
the total fluorescence rise in TIRF
by guest on July 13, 2016http://w
ww
.jbc.org/D
ownloaded from
11
microscopy mode for cells stimulated
with thapsigargin in the absence and
presence of antimycin A and oligomycin
are compared in Figure 2B, and the half-
times to peak of the eYFP-STIM1
movement is compared in Figure 2C.
Mitochondrial depolarisation
significantly reduced both the rate and
extent of STIM1 trafficking to the
plasma membrane in RBL cells.
No role for mitochondrial Ca2+
buffering in STIM1 migration We designed experiments to
address the mechanism whereby
depolaised mitochondria inhibits STIM1
migration. One important role for
mitochondria is to buffer a rise in
cytoplasmic Ca2+. However, several
pieces of evidence militate against such
a role here. First, with our protocol to
deplete stores (thapsigargin in Ca2+-free
solution for ~5 minutes), very little Ca2+
is taken up by mitochondria (7).
Consistent with this, the amplitude and
time course of Ca2+ release was
unaltered following mitochondrial
depolarisation (Figure 1A; see also (7)).
Second, increasing cytoplasmic Ca2+
buffering by loading cells with the fast
Ca2+ chelator BAPTA virtually
suppressed the cytoplasmic Ca2+ rise
evoked by thapsigargin in Ca2+-free
solution compared with control non-
BAPTA-loaded cells (Figure 3A) but
this did not affect migration of STIM1 to
the cell periphery (compare middle
panels of Figures 3B and 3C).
Movement of STIM1 to the plasma
membrane does not therefore require a
cytoplasmic Ca2+ rise. Importantly, the
robust redistribution of STIM1 to the
periphery in BAPTA-loaded cells was
much less pronounced following
mitochondrial depolarisation (Figure
3C). Therefore mitochondrial
depolarisation impairs STIM1
trafficking even in the absence of a
cytoplasmic Ca2+ rise and therefore in
the absence of the organelle’s ability to
take up Ca2+. Finally, we overexpressed
Orai1 and STIM1 and then measured the
Na+ flux through the CRAC channels
that occurs when cells are exposed to
divalent-free external solution (3, 4, 22,
49). Following dialysis with InsP3 and
10 mM BAPTA, a large Na+ current
developed (Figure 3D), which showed
the characteristics of Na+ flux through
CRAC channels (Figure 3E; inwardly
rectifying current-voltage relationship,
reversal potential of ~ + 60 mV, low
current noise). Mitochondrial
by guest on July 13, 2016http://w
ww
.jbc.org/D
ownloaded from

12
depolarisation substantially reduced the
size of this Na+ current (Figures 3D-F).
Similar results were seen when cells
were dialysed with BAPTA alone. Since
cells were dialysed with 10 mM BAPTA
and no Ca2+ was present outside, the
involvement of mitochondria can clearly
be separated from a Ca2+ buffering role.
No role for mitochondrially-derived ATP
Another important function of
mitochondria is ATP production.
However, several arguments can be
raised against a role for mitochondrially-
derived ATP in STIM1 trafficking. First,
mast and RBL-1 cells are glycolytically
competent and depolarisation of
mitochondria with antimycin A and
oligomycin does not reduce cellular ATP
levels provided glucose is available (35).
In our experiments, we always had 10
mM glucose present. We nevertheless
measured cytoplasmic ATP levels in
single cells using cytoplasmic Mg2+ as
an indicator of Mg-ATP (27, 54). As
Mg-ATP is consumed, free Mg2+ rises
because the hydrolytic product ADP has
significantly lower affinity for Mg2+. In
cells loaded with mag-fura, treatment
with antimycin A and oligomycin failed
to generate a clear rise in Mg2+ levels in
the presence of glucose (Figure 3G). On
the other hand, replacement of glucose
with the non-metabolisable analogue 2-
deoxyglucose together with iodoacetate
(an inhibitor of glycolysis; used at 1
mM) resulted in a substantial rise in
cytoplasmic Mg2+, consistent with
depletion of Mg-ATP. Although mag-
fura can also bind Ca2+, it does so with
an affinity of ~ 50 µM. Experiments
with fura 2 (affinity of ~ 200 nM)
revealed a small and inconsistent rise in
cytoplasmic Ca2+ following exposure to
antimycin A and oligomycin, which was
~ 200 nM in amplitude. This is therefore
too small to impact on the mag-fura
signals of Figure 3G. Although these
global measurements fail to demonstrate
a fall in ATP upon mitochondrial
depolarisation provided glycolysis is
intact, we were concerned that ATP
below the plasma membrane might have
been reduced, especially as this is the
site for STIM1 translocation. To test this
possibility, we stimulated cells with
thapsigargin in Ca2+-free solution and
measured the time course of decay of the
Ca2+ signal (Figure 3H), since the latter
reflects extrusion of Ca2+ by the plasma
membrane Ca2+ATPase. The time
constant of decay was unaffected by
by guest on July 13, 2016http://w
ww
.jbc.org/D
ownloaded from

13
antimycin A and oligomycin (Figure 3I),
arguing against significant depletion of
subplasmalemmal ATP. Finally, block of
the mitochondrial F1F0ATP synthase
with oligomycin failed to affect eYFP-
STIM1 trafficking to the cell periphery
(Figure 1E). Collectively, these results
show that the inhibition of STIM1
trafficking to the cell periphery upon
mitochondrial depolarisation is not due
to cytoplasmic ATP depletion.
STIM1 translocation to ER-
plasma membrane junctions has been
reported to require the C-terminal
polybasic motif which, in other proteins,
binds polyphosphoinositides in the
plasma membrane (29). We do not think
mitochondrial depolarisation depletes
the plasma membrane phosphoinositide
pool because agonist-evoked PIP2
hydrolysis and subsequent InsP3-
dependent Ca2+ release is unaffected by
antimycin A and oligomycin (16).
Furthermore, the amplitude of the
inward rectifier, a K+ current regulated
by phosphoinositides, was unaffected by
mitochondrial depolarisation
(supplementary Figure 4)
We also considered that
mitochondrial depolarisation might alter
the distribution of the endoplasmic
reticulum (ER), the organelle in which
STIM1 is embedded. We used an RFP
construct targeted to the ER (ER-RFP) to
monitor ER distribution. ER-RFP
labelling revealed a reticular network
(supplementary Figure 5) and this was
unaffected by store depletion with
thapsigargin. Mitochondrial
depolarisation with antimycin A and
oligomycin for 15 minutes also had no
discernible effect on ER distribution
(supplementary Figure 5).
Strong overexpression of STIM1
rescues CRAC channel activity
In T cells, two thirds of the
specialised ER-PM junctions where
STIM1 accumulates upon store depletion
are thought to be already pre-formed in
resting cells (60). We reasoned that
extensive overexpression of STIM1
might therefore result in an increased
probability of STIM1 occupying some of
these pre-existing ER-PM junctions, thus
overcoming the inhibitory effects of
mitochondria on STIM1 trafficking and
store-operated influx. HEK293 cells are
an ideal system for testing this idea
because of their high transfection
efficiency and ability to overexpress
recombinant proteins massively. Indeed,
we find absolute eYFP-STIM1
by guest on July 13, 2016http://w
ww
.jbc.org/D
ownloaded from

14
fluorescence in HEK293 cells to be at
least 10 times greater than in RBL-1
cells, consistent with the very large size
of ICRAC seen in HEK293 cells compared
with RBL-1 cells following
overexpression of Orai1 and STIM1
(HEK current ~ -100 to -500 pA/pF, see
also (33, 47); RBL ~ -10 to -12 pA/pF).
We first confirmed that store-operated
Ca2+ entry in HEK293 cells was reduced
by mitochondrial depolarisation. As
shown in Figure 4A, readmission of
external Ca2+ to store-depleted wild type
cells (exposed to thapsigargin in Ca2+-
free external solution at t=0) resulted in
robust Ca2+ entry, which was
significantly reduced by mitochondrial
depolarisation. Ca2+ influx in cells with
depolarised mitochondria has been
normalised to the corresponding control
influx in this and subsequent panels.
Overexpression of eYFP-STIM1 alone
partially rescued Ca2+ influx in cells with
depolarised mitochondria (Figure 4B).
Co-expression of Orai1 and eYFP-
STIM1 resulted in more substantial
recovery of store-operated Ca2+ influx
(Figure 4C), and the rate and extent of
Ca2+ influx in cells expressing Orai1 and
STIM1 with depolarised mitochondria
was larger than in wild-type non-
transfected cells. One interpretation of
these results is that strong
overexpression of STIM1 in HEK cells
rescues the inhibition of Ca2+ entry seen
when mitochondria are compromised.
We were nevertheless concerned that the
Ca2+ signals, particularly after
overexpression of Orai1 and STIM1,
were so large that they saturated the dye
fura 2. Hence the apparent recovery of
the Ca2+ signal could be misleading,
because the control store-dependent
Ca2+ responses (following expression of
either STIM1 or STIM1 together with
Orai1) have been underestimated
because of dye saturation. We therefore
used the lower affinity dye fura 5F to
test this. Although store-operated Ca2+
entry recovered somewhat in cells with
depolarised mitochondria following
overexpression of STIM and Orai1
(Figure 4D), the extent of rescue was
less than that detected with fura 2 as the
Ca2+-sensitive dye (Figure 4C). These
results serve as a salutary warning in
quantifying cytoplasmic Ca2+ signals
following overexpression of
STIM1/Orai1 based on measurements
using high affinity dyes such as fura 2.
We confirmed that overexpressed
STIM1 was able to traffic to the cell
by guest on July 13, 2016http://w
ww
.jbc.org/D
ownloaded from

15
periphery in HEK293 cells even after
mitochondrial depolarisation by
monitoring puncta formation with TIRF
microscopy. Compared with non-
stimulated cells (Figure 4E), store
depletion with thapsigargin led to
numerous puncta being formed (Figure
4F) and these were still prominent when
cells were pre-treated with antimycin A
and oligomycin prior to thapsigargin
(Figure 4G), although these STIM1
puncta appeared to coalesce into larger
structures after mitochondrial
depolarisation (Figure 4G). Fewer,
larger puncta were observed in the
presence of antimycin A and oligomycin
and thapsigargin compared with the
numerous, smaller ones seen in
thapsigargin-treated cells. We analyzed
puncta intensity by measuring eYFP-
STIM1 fluorescence in 1 µm2 sections
spanning the entire cell footprint.
Whereas intensity was largely a normal
distribution in cells exposed to
thapsigargin (Figure 4H, upper panel),
the pattern changed dramatically
following mitochondrial depolarisation
(Figure 4H, lower panel). Now,
numerous high intensity regions formed,
indicative of the merging of puncta.
Nevertheless, partial rescue of Ca2+
influx occurred (Figure 4D).
Electron microscopy provides the
highest spatial resolution for resolving
protein location. We identified the
position of eYFP-STIM1 in serial ultra
thin sections of HEK293 cells prepared
for electron microscopy using the ABC
coupled horseradish peroxidase system
(see Methods for more details).
Following expression of eYFP-STIM1,
cells were fixed and then exposed to
anti-GFP primary antibody followed by
incubation with biotinylated secondary
antibody. We then applied avidin-
coupled horseradish peroxidase, which
bound to the secondary antibody. The
complex was visualised using the DAB
chromagen, which is oxidised by
peroxidase to form an electron dense
precipitate at the site of the reaction,
thereby revealing the location of STIM1.
In micrographs from non-stimulated
HEK293 cells expressing eYFP-STIM1,
we saw very little protein near the
plasma membrane. Instead, most dark
deposits were seen around the nuclear
membrane and ER-like tubular structures
(Figure 5A, box indicated in the left
hand panel has been magnified in the
right hand panel). On the other hand,
by guest on July 13, 2016http://w
ww
.jbc.org/D
ownloaded from

16
store depletion with thapsigargin led to
the formation of electron dense deposits
at the cell periphery (Figure 5B), with a
loss of deposit from the nuclear
membrane. Store depletion after pre-
treatment with antimycin A and
oligomycin resulted in some labelling at
the cell surface, although this was less
extensive (Figure 5C). We compared the
fraction of the cell periphery that stained
for STIM1 between non-stimulated cells,
cells stimulated with thapsigargin and
cells pre-treated with antimycin A and
oligomycin prior to thapsigargin
exposure (Figure 5D). Whereas very
little staining was detectable in control
cells, a substantial portion of the
periphery contained STIM1 after store
depletion. The extent of this was reduced
by antimycin A and oligomycin,
although staining was still prominent.
Because of lateral diffusion, the DABS
reaction product is not restricted just to
the site of HRP. Hence we were unable
to quantify the lateral extent of puncta in
electron micrographs between
thapsigargin-treated cells and those first
exposed to antimycin A and oligomycin,
to see how this related to the changes
observed in the TIRF microscopy
experiments (Figure 4G).
Collectively, these results
confirm that a fraction of the STIM1
pool migrates up to the plasma
membrane following store depletion
after mitochondrial depolarisation in
HEK cells, when STIM1 is strongly
overexpressed.
Ca2+ influx to a STIM1 mutant that
accumulates in ER-PM junctions in non-stimulated cells is insensitive to
mitochondrial depolarization
An explanation of the results so
far is that mitochondrial depolarisation
impairs STIM1 trafficking to the plasma
membrane, but not the events that arise
once STIM1 is at ER-PM junctions. To
test this more directly, we expressed the
mutant D76A STIM1, which localizes to
ER-PM junctions even when stores are
full. This construct has a point mutation
in the Ca2+-binding EF-hand domain, so
that the expressed protein forms
punctate-like structures in cells with
replete Ca2+ stores, resulting in
constitutive store-operated Ca2+ influx
(30, 55, 66). Expression of D76A
STIM1 in HEK293 cells resulted in
formation of puncta close to the cell
periphery (Figure 5E, left hand panel)
and these structures were unaffected by
mitochondrial depolarisation (Figure 5E,
by guest on July 13, 2016http://w
ww
.jbc.org/D
ownloaded from

17
right hand panel). Constitutive Ca2+
influx was revealed by briefly exposing
cells to Ca2+-free external solution for 90
seconds and then readmitting external
Ca2+. The subsequent store-operated Ca2+
influx was unaffected by mitochondrial
depolarisation (Figure 5F; aggregate data
is summarised in Figure 5G), at least
over the duration of mitochondrial
depolarisation we have used (10-15
minutes in this study).
In aggregate, these results have two
important implications. Firstly,
mitochondria are not involved in the late
stages of CRAC channel activation
because i) constitutive store-operated
Ca2+ influx after D76A mutant STIM1
expression was unaffected by impairing
mitochondria (Figure 5 E-G) and ii)
overexpression of eYFP-STIM1 and
Orai1 could partially overcome the block
by mitochondrial depolarisation (Figure
4D). Presumably, the interaction
between STIM1 and Orai1 at the ER-PM
junctions (46) can activate CRAC
channels without a requirement for
mitochondria. Secondly, the tools used
for inducing mitochondrial
depolarisation do not interfere with
store-operated Ca2+ entry non-
specifically or with the CRAC channels
themselves, otherwise neither rescue by
Orai1 and STIM1 nor constitutive Ca2+
influx to the mutant STIM1 would have
been seen in cells with depolarised
mitochondria.
Mitofusin 2 (Mfn 2) regulates STIM1
trafficking Mitochondria can be tethered to
the ER through the mitochondrial
dynamin-related protein Mfn 2 (10). Mfn
2 is found mainly in the outer
mitochondrial membrane, with a small
fraction in the ER. It is particularly
abundant within the contact sites
between the mitochondria and ER,
where it forms transorganellar
homotypic and heterotypic interactions
between mitofusin 1 or 2 on
mitochondria and Mfn 2 on the ER (10).
In mouse embryonic fibroblasts (MEFs)
lacking Mfn 2, mitochondria are
physically uncoupled from ER and the
spatial distance between them is
increased (10, 40). We considered the
possibility that mitochondrial tethering
to the ER might hinder STIM1
movement to the cell periphery. To test
this, we compared STIM1 migration and
store-operated Ca2+ influx between
control mouse embryonic fibroblasts and
those in which Mfn 2 had been knocked
by guest on July 13, 2016http://w
ww
.jbc.org/D
ownloaded from

18
out (10). Stimulation with thapsigargin
in control cells resulted in prominent
STIM1 puncta formation (Figure 6A).
Store-operated Ca2+ entry was also
present (Figures 6C and 6E). Both
STIM1 puncta formation (Figure 6A)
and store-operated Ca2+ entry (Figure
6C) in wild type cells were suppressed
by antimycin A and oligomycin pre-
treatment (aggregate data is summarised
in Figure 6E). Wild-type mouse
embryonic fibroblasts therefore behave
in a manner similar to RBL and HEK
293 cells. In mouse embryonic
fibroblasts lacking Mfn 2, numerous
STIM1 puncta formed after exposure to
thapsigargin (Figure 6B) and this was
followed by store-operated Ca2+ entry
(Figure 6D). The rate of Ca2+ entry was
~2-fold faster than in wild-type cells
(Figures 6D and E). Importantly, in Mfn
2-deficient cells STIM1 puncta
formation (Figure 6B) and store-
operated Ca2+ entry (Figures 6D and E)
were unaffected by mitochondrial
depolarisation. Hence STIM1 puncta
formation and store-operated entry are
insensitive to mitochondrial
depolarisation when Mfn 2 is absent.
It is important to note that the
extent of Ca2+ release and the rate of
recovery of the Ca2+ signal (to
thapsigargin in Ca2+-free solution) were
similar between wild type MEF cells and
those lacking Mfn 2. Hence stores are
loaded with Ca2+ and sufficient ATP is in
the cytoplasm to support Ca2+ATPAse
activity in Mfn 2-/- cells.
Endogenous Mfn 2 has a patchy
distribution throughout the cytoplasm in
resting MEF cells ((10); Figure 7A).
Stimulation with thapsigargin did not
alter the pattern of Mfn 2 and, unlike the
case with STIM1, no clear punctate-like
structures were formed (Figure 7A). We
also transfected cells with a Mfn 2-GFP
construct. However, the distribution of
Mfn 2-GFP was drastically different
from endogenous Mfn 2 in that it formed
aggregates around the nucleus (not
shown), This is in agreement with other
studies that have found that
overexpression of tagged Mfn 2 leads to
a non-physiological distribution (1, 24,
63).
Re-expression of untagged Mfn 2
into MEF Mfn2-/- cells resulted in an
accelerated decline of the thapsigargin-
evoked Ca2+ signal, reflecting a loss of
store-operated Ca2+ entry (Figure 7B).
As with mitochondrial depolarisation,
the inhibitory effect of Mfn 2 could be
by guest on July 13, 2016http://w
ww
.jbc.org/D
ownloaded from

19
overcome by transfecting STIM1
together with Mfn 2 in the MEF Mfn 2-/-
cells (Figure 7B).
Mfn 2 is located on both
mitochondria and ER. This prompted us
to ask whether mitochondrial Mfn 2, ER
Mfn 2 or both were involved in
regulating store-operated Ca2+ entry. To
address this, we expressed Mfn 2
constructs that are selectively expressed
in either the ER (Mfn 2-IYFFT) or
mitochondria (Mfn 2-ActA) in Mfn2-/-
cells and then looked to see whether
either construct could re-introduce
sensitivity to mitochondrial
depolarisation. Cells were stimulated
with thapsigargin in Ca2+-free solution in
the presence of antimycin A and
oligomycin and then Ca2+ was
readmitted. Whereas Mfn 2-/- cells
responded by generating robust Ca2+
influx in the presence of depolarised
mitochondria, Ca2+ entry was
substantially reduced by expression of
the Mfn 2-ActA construct (Figure 7Ci
and ii). Ca2+ release was only slightly
reduced and in several cells it was
indistinguishable from control release
yet was followed by much less Ca2+
entry. On the other hand, store-operated
Ca2+ entry was largely unaffected by
mitochondrial depolarisation following
expression of Mfn 2-IYFFT (Figure 7Di
and ii). These results reveal that Mfn 2
restricted to mitochondria renders store-
operated entry susceptible to
mitochondrial depolarisation whereas an
ER-resident Mfn 2 is less effective.
DISCUSSION
Activation of the ubiquitous
store-operated Ca2+ influx pathway by
the ER Ca2+ sensor STIM1 is a three step
process (29, 31). First, upon store
depletion STIM1 monomers come
together to form multimers in the ER
membrane. Second, the oligomers then
migrate to specialised ER-PM junctions,
resulting in punctate-like structures at
the cell periphery. Finally, STIM1
activates the plasma membrane CRAC
channels by binding to the N- and C-
termini of Orai1 (46, 64). Although
recent studies have provided insight into
how STIM1 senses store depletion and
interacts with Orai1 channels, little is
known about mechanisms that regulate
STIM1 migration to the cell periphery.
Our new results reveal that
mitochondrial depolarisation selectively
regulates trafficking of STIM1
multimers to the plasma membrane, and
by guest on July 13, 2016http://w
ww
.jbc.org/D
ownloaded from

20
in a manner dependent on the
mitochondrial protein Mfn 2.
A substantial body of evidence
has established that mitochondrial
depolarisation inhibits store-operated
Ca2+ entry through CRAC channels and
that energised mitochondria increase the
size of the CRAC current (15,16, 20,
21). A major factor contributing to this
effect involves mitochondrial buffering
of cytoplasmic Ca2+ (42,43).
Mitochondrial Ca2+ uptake reduces the
extent of Ca2+-dependent inactivation of
CRAC channels, and thus leads to an
enhanced Ca2+ entry. Our new findings
add a further component to
mitochondrial gating of CRAC channels
that is independent of the Ca2+ buffering
action and involves an action on STIM1
trafficking.
How might mitochondrial
depolarisation be relayed to STIM1
proteins in the ER? The two organelles
are held in close proximity to one
another through interaction between
proteins spanning the respective
membranes, with a major role for the
dynamin-related protein Mfn 2 (8, 10).
Mfn 2 is abundant at contact sites
between ER and mitochondria, where it
forms transorganellar homotypic and
heterotypic interactions. Knockout of the
Mfn 2 gene in mouse embryonic
fibroblasts uncouples mitochondria from
ER and increases the distance between
them (8, 10). By using Mfn 2-deficient
cells, we found that STIM1 trafficking
and store-operated Ca2+ entry were no
longer impaired by mitochondrial
depolarisation. This suggests that Mfn2
is required to confer sensitivity of store-
operated Ca2+ entry to mitochondrial
depolarisation, at least in MEF cells.
Mfn2 is expressed both in mitochondria
and ER. By expressing Mfn 2 constructs
in either mitochondria or ER in Mfn 2-
deficient MEF cells, we found that
mitochondrial Mfn 2 rendered store-
operated Ca2+ entry sensitive to
mitochondrial depolarisation. It is
unlikely that Mfn 2 senses mitochondrial
depolarisation directly because it is
expressed in the outer mitochondrial
membrane (51). However, it can interact
with inner mitochondrial membrane
proteins including OPA1 (18, 40). Hence
changes in mitochondrial potential could
be relayed to the adjacent ER through
protein-protein interactions with
mitofusin 2 acting as a transducer. How
does mitofusin 2 control STIM1
trafficking and thereby CRAC channel
by guest on July 13, 2016http://w
ww
.jbc.org/D
ownloaded from

21
activation following mitochondrial
depolarisation? Strong overexpression of
Mfn 2 leads to the formation of
aggregates of mitochondria that are
uncoupled from one another and clump
around the nucleus (1, 24). These
mitochondria have a decreased
membrane potential (24). De-energised
mitochondria are less able to buffer
cytosolic Ca2+, and this would result in
stronger Ca2+-dependent inactivation of
CRAC channels (15, 20). Whilst this
mechanism can help account for the
reduced Ca2+ influx seen upon over
expression of Mfn 2, it fails to explain i)
why STIM1 movement after store
depletion is impaired by mitochondrial
depolarisation in the absence of Ca2+
entry and when cytoplasmic Ca2+ is
buffered with BAPTA, conditions that
would prevent Ca2+-dependent
inactivation of CRAC channels and ii)
why STIM1 overexpression, at least
partially, rescues Ca2+ entry in Mfn 2-
overexpressing cells. An alternative
mechanism involves a direct or indirect
physical block on STIM1 movement by
Mfn 2. This could be due either to steric
hindrance whereby mitofusin 2 needs to
be displaced from a site in order for
STIM1 multimers to migrate towards
ER-PM junctions or that a component of
the mitochondrial tethering complex
(which includes Mfn 2, voltage-
dependent anion channel, grp75, sigma 1
receptor and PACS-2; (40)) binds to
STIM1, thus impeding its movement
towards the periphery. In either case,
mitochondrial depolarisation would be
predicted to stabilise this interaction.
Loss of Mfn 2 might therefore be
expected to increase the number of
STIM1 multimers that successfully
migrate to ER-PM junctions, resulting in
increased Ca2+ entry. Consistent with
this, the rate of Ca2+ influx was slightly
higher in Mfn 2-deficient cells (Figure
7E).
Although overexpression of
STIM1 led to partial recovery of store-
operated Ca2+ influx in HEK293 cells
with depolarised mitochondria, the
pattern of puncta formation was
strikingly different from that seen in
normal cells. After mitochondrial
depolarisation, electron micrograph
analysis revealed that ~40% less STIM1
migrated to the cell periphery after store
depletion (Figure 5D). TIRF
measurements showed that although
fewer puncta formed, they had a higher
STIM1 intensity suggesting coalescence
by guest on July 13, 2016http://w
ww
.jbc.org/D
ownloaded from

22
of individual puncta into larger
structures. Despite such changes, store-
operated Ca2+ influx still developed,
albeit to a lesser extent. Hence it would
appear that formation of puncta per se is
sufficient to activate several Orai1
channels, in that numerous discrete
puncta are only moderately(~ 2-fold)
more effective in evoking Ca2+ entry that
larger, merged structures. This would be
consistent with the finding that
disaggregation of microfilaments results
in fewer, larger puncta being formed but
without any effect on CRAC channel
activity (32).
What might be the physiological
relevance for Mfn 2 regulation of STIM1
movement? Mfn 2 is not essential for the
store-operated pathway because store-
operated Ca2+ entry in both MEF
fibroblasts and RBL cells (data not
shown) was prominent despite its
knockdown. Therefore Mfn 2 has a
regulatory role, but not an essential one.
Rather, its effects are manifest only after
mitochondrial depolarisation. Our results
suggest Mfn 2 might serve as a brake,
inhibiting Ca2+ entry only after
mitochondria depolarize. Although
significant fluctuations in the
mitochondrial membrane potential have
been reported in some intact cells, the
sustained mitochondrial depolarization
we have evoked is more typically seen
following glutamate excitotoxicity in
neurons. From a teleological standpoint,
Mfn 2 regulation of STIM1 migration
and subsequent CRAC channel opening
might serve to oppose Ca2+ overload
under conditions where mitochondrial
Ca2+ buffering is compromised, due to
collapse of the mitochondrial membrane
potential.
Precisely how Mfn 2 controls migration
of STIM1, its impact, if any, on Ca2+
entry under physiological levels of
stimulation and whether this mechanism
contributes to mitofusin-related diseases
such as Charcot-Marie tooth neuropathy
await further study.
Acknowledgements. This work was supported by the Medical
Research Council (U.K.) and the British Heart Foundation.
REFERENCES
1. Bach, D., Pich, S., Soriano, F.X., Vega, N., Baumgartner, B., Oriola, J., Daugaard, J.R., Lloberas, J., Camps, M., Zierath, J.R., Rabasa-Lhoret, R., Wallberg-Henriksson, H., Laville, M., Palacin, M., Vidal, H., Rivera, F., Brand, M., and Zorzano, A. (2003) J Biol Chem 278, 17190-17197
by guest on July 13, 2016http://w
ww
.jbc.org/D
ownloaded from

23
2. Bakowski, D., Glitsch, M.D., and Parekh, A.B. (2001) J. Physiol. (Lond) 532, 55-71 3. Bakowski, D. and Parekh, A.B. (2002) Pfluegers Archiv 443, 892-902 4. Bakowski, D. and Parekh, A.B. (2002) Cell Calcium 32, 379-391 5. Bakowski, D. and Parekh, A.B. (2007) Cell Calcium 42, 333-339 6. Berridge, M.J., Bootman, M.D. and Roderick, H.L. (2003). Nature Reviews Molecular Cell Biology 4, 517-529 7. Chang, W.C., Di Capite, J., Singaravelu, K., Nelson, C., Halse, V. and Parekh, A.B. (2008) J Biol Chem 283, 4622-4631 8. Chen, H., Detmer, S.A. Ewald, A.J., Griffin, E.E., Fraser, S.E. and Chan, D.C. (2003). J Cell Biol 160, 189-200 9. Chvanov, M., Walsh, C.M., Haynes, L.P., Voronina, S.G., Lur, G., Gerasimenko, O.V., Barraclough, R., Rudland, P.S., Petersen, O.H., Burgoyne, R.D. and Tepikin, A. (2008) Pfluegers Archiv 457, 505-517 10. de Brito, O.M. and Scorrano, L. (2008) Nature 456, 605-610. 11. Feske, S., Gwack, Y., Prakriya, M., Srikanth, S., Puppel, S-V, Tanasa, B., Hogan, P.G., Lewis, R.S., Daly, M. and Rao, A. (2006) Nature 441, 179-185 12. Fierro, L. and Parekh, A.B. (1999) J Memb Biol 168, 9-17. 13. Frieden, M., James, D., Castelbou, C., Danckaert, A., Martinou, J-C. and Demaurex, N. (2004) J Biol Chem 279, 22704-22714. 14. Giacomello, M., Drago, I., Bortolozzi, M., Scorzeto, M., Gianelle, A., Pizzo, P. and Pozzan, T. (2010) Mol Cell 38, 280-290 15. Gilabert, J-A. and Parekh, A.B. (2000) EMBO J 19, 6401-6407.
16. Glitsch, M.D., Bakowski, D. and Parekh, A.B. (2002) EMBO J 21, 6744-6754. 17. Grigoriev, I., Gouveia, S.M., van der Vaart, B., Demmers, J., Smyth, J.T., Honnappa, S., Splinter, D., Steinmetz, M.O., Putney, J.W.Jr, Hoogenraad, C.C. and Akhmanova, A. (2008) Curr Biol 18, 177-182 18. Guillery, O., Malka, F., Landes, T., Guillou, E., Blackstone, C., Lombes, A., Belenguer, P., Arnoult, D. and Rojo, M. (2008) Biol Cell 100, 315-325 19. Gwozdz, T., Dutko-Gwozdz, J., Zarayskiy, V., Peter, K. and Bolotina, V.M. (2008). Am J Physiol (Cell Physiol) 295, C1133-1140 20. Hoth, M., Button, D. and Lewis, R.S. (2000) Proc Natl Acad Sci USA 97, 10607-10612 21. Hoth, M., Fanger, C. and Lewis R.S. (1997) J Cell Biol 137, 633-648 22. Hoth, M. and Penner, R. (1993) J Physiol (Lond) 465, 359-386 23. Hoth, M. and Penner, R. (1992) Nature 355, 353-356 24. Huang P, Yu T, and Yoon Y. (2007) Europ J Cell Bio 86, 289-302 25. Jousset, H., Freiden, M. and Demaurex, N. (2007) J Biol Chem 282, 1456-1464 26. Kawasaki, T., Lange, I. and Feske, S. (2009) BBRC 385, 49-54 27. Levssens, A., Nowicky, A.V., Patterson, L., Crompton, M. and Duchen, M.R. (1996) J Physiol 496, 111-128 28. Lewis, R.S. (1999) Adv Second Messenger and Phosphoprotein Res 33, 279-307 29. Liou, J., Fivaz, M., Inoue, T. and Meyer, T. (2007) Proc Natl Acad Sci USA 104, 9301-9306 30. Liou, J., Kim, M.L., Heo, W.D., Jones, J.T., Myers, J.W., Ferrell Jr., J.E.
by guest on July 13, 2016http://w
ww
.jbc.org/D
ownloaded from

24
and Meyer, T. (2005) Curr Biol 15, 1235-1241. 31. Luik, R.M., Wang, B., Prakriya, M., Wu, M.M. and Lewis RS. (2008) Nature 454, 538-542 32. Luik, R.M., Wu, M.M., Buchanan, J. and Lewis, R.S. (2006) J Cell Biol 174, 815-825. 33. Mercer, J.C., DeHaven, W., Smyth, J.T., Wedel, B., Boyles, R.B., Bird, G.S. and Putney, J.W.Jr. (2006) J Biol Chem 281, 24979-24990. 34. Mignen, O., Thompson, J.L. and Shuttleworth, T.J. (2007) J Physiol 579, 703-715. 35. Mohr, F.C. and Fewtrell, C. (1990) Am J Physiol (Cell Physiol) 258, C217-226. 36. Moreau, B., Nelson, C. and Parekh, A.B. (2006) Curr Biol 16, 1672-1677. 37. Moreau, B., Straube, S., Fisher, R.J., Putney, J.W,Jr and Parekh, A.B. (2005) J Biol Chem 280, 8776-8783 38. Muik, M., Fahrner, M., Derler, I., Schindl, R., Bergsmann, J., Frischauf, I., Groschner, K. and Romanin, C. (2009) J Biol Chem 284, 8421-8426 39. Ng, S-W., DiCapite, J.L., Singaravelu, K. and Parekh, A.B. (2008) J Biol Chem 283, 31348-31355 40. Parekh, A.B. (2009) Curr Biol 19, R200-R203 41. Parekh, A.B. (2007). Cell Calcium 42, 111-121 42. Parekh, A.B. (2008) Cell Calcium 44, 6-13 43. Parekh, A.B. (2003) J Physiol (Lond) 547, 333-348 44. Parekh, A.B,and Penner, R. (1997) Physiol Revs 77, 901-930 45. Parekh, A.B. and Putney, J.W.Jr. (2005) Physiol Revs 85, 757-810 46. Park, C.Y., Hoover, P.J., Mullins, F.M., Bachhawat, P., Covington, E.D., Rausner, S., Walz, T.,
Garcia, C., Dolmetsch, R.E. and Lewis, R.S. (2009) Cell 136, 1-15 47. Peinelt, C., Vig, M., Koomoa, D.L., Beck, A., Nadler, M.J.S., Koblan-Huberson, M., Lis, A., Fleig, A., Penner, R. and Kinet, J-P. (2006) Nat Cell Biol 8, 771-773 48. Prakriya, M., Feske, S., Gwack, Y., Srikanth, S., Rao, A. and Hogan, P.G. (2006) Nature 443, 230-233 49. Prakriya, M. and Lewis, R.S. (2001) J Physiol (Lond) 536, 3-19 50. Quintana, A., Schwarz, E.C., Schwindling, C., Lipp, P., Kaestner, L. and Hoth, M. (2007) J Biol Chem 281, 40302-40309 51. Rojo, M., Legros, F., Chateau, D. and Lombes, A. (2002) J Cell Science 115, 1664-1674 52. Roos, J., DiGregorio, P.J., Yeromin, A.V., Ohlsen, K., Lioudyno, M., Zhang, S., Safrina, O., Kozak, J.A., Wagner, S.L., Cahalan, M.D., Velicelebi, G. and Stauderman, K.A. (2005) J Cell Biol 169, 435-445 53. Schilling, W.P., Rajan, L. and Strobl-Jager, E. (1989) J Biol Chem 264, 12838-12848 54. Silverman, H.S., Di Lisa, F., Hui, R.C., Miyata, H., Sollott, S.J., Hanford, R.G., Lakatta, E.G. and Stern, M.D. (1994) Am J Physiol (Cell Physiol) 266, C222-233 55. Smyth, J.T., DeHaven, W.I., Bird, G.S. and Putney, J.W. (2008) J Cell Sci 121, 762-772 56. Smyth, J.T., Dehaven, W.I., Bird, G.S. and Putney, J.W. (2007) J Cell Sci 120, 3762-3771 57. Soboloff, J., Spassova, M.A., Tang, X.D., Hewavitharana, T., Xu, W. and Gill, D.L. (2006) J Biol Chem 281, 20661-20665 58. Vig, M., Beck, A., Billingsley, J.M., Lis, A., Parvez, S., Peinelt, C., Koomoa, D.L., Soboloff, J., Gill, D.L.,
by guest on July 13, 2016http://w
ww
.jbc.org/D
ownloaded from

25
Fleig, A., Kinet, J.P. and Penner. R. (2006) Curr Biol 16, 2073-2079 59. Vig, M., Peinelt, C., Beck, A., Koomoa, D.L., Rabah, D., Koblan-Huberson, M., Kraft, S., Turner, H., Fleig, A., Penner, R. and Kinet, J-P. (2006) Science 312, 1220-1223 60. Wu, M.M., Buchanan, J., Luik, R.M. and Lewis, R.S. (2006) J Cell Biol 174, 803-813 61. Wu, M.M., Luik, R.M. and Lewis, R.S. (2007) Cell Calcium 42, 163-172 62. Yeromin, A.V., Zhang, S.L., Jiang, W., Yu, Y., Safrina, O. and Cahalan, M.D. (2006) Nature 443, 226-229 63. Yoon, E., Beom, S., Cheong, H., Kim, S., Oak, M., Cho, D. and Kim, K.M. (2004) BBRC 325, 117-123 64. Yuan, J.P., Zeng, W., Dorwart, M.R., Choi, Y.J., Worley, P.F. and Muallem, S. (2009) Nat Cell Biol 11, 337-343 65. Zhang, S.L., Yeromin, A.V., Zhang, XH-F., Yu, Y., Safrina, O., Penna, A., Roos, J., Stauderman, K.A. and Cahalan, M.D. (2006) Proc Natl Acad Sci USA 103, 9357-9362 66. Zhang, S.L., Yu, Y., Roos, J., Kozak, J.A., Deerinck, T.J., Ellisman, M.H., Stauderman, K.A. and Cahalan, M.D. (2005) Nature 437, 902-905 67. Zweifach, A. and Lewis, R.S. (1993) Proc Natl Acad Sci USA 90, 6295-629 68. Zweifach, A. and Lewis, R.S. (1995) J Gen Physiol 105, 209-226 FIGURE LEGEND Figure 1. Mitochondrial depolarisation
inhibits ICRAC following overexpression
of STIM1 and Orai1. (A), In fura 2-
loaded RBL-1 cells coexpressing eYFP-
STIM1 and Orai1, readmission of
external Ca2+ to cells treated with
thapsigargin (2 µM) results in Ca2+
influx and this is inhibited by
depolarising mitochondria with
antimycin A (5 µg/ml) and oligomycin
(0.5 µg/ml), applied to cells 10 minutes
before thapsigargin. (B), The rate of Ca2+
entry (measured from experiments as in
panel A) is compared (each bar
represents > 60 cells). (C), The large
ICRAC in cells coexpressing eYFP-STIM1
and Orai1 is substantially reduced by
mitochondrial depolarisation and
aggregate data is plotted in panel (D).
Pipette solution contained InsP3 + 10
mM EGTA. Number of cells is 11 for
STIM1 + Orai1 alone and 9 in the
presence of antimycin A and
oligomycin. (E), Images from confocal
microscopy showing the distribution of
eYFP-STIM1 in cells before (labelled
Control) and then after exposure to 2 µM
thapsigargin in Ca2+-free solution for the
various conditions shown. (F), The
distribution of eYFP-STIM1 and
mitochondria (detected with mitotracker
red) are compared. Co-localisation is
indicated in yellow.
by guest on July 13, 2016http://w
ww
.jbc.org/D
ownloaded from

26
Figure 2. STIM1 trafficking to the
plasma membrane is impaired by
mitochondrial depolarisation. (A), TIRF
microscopy images from an RBL-1 cell
expressing eYFP-STIM1. The left hand
panel shows a resting cell and the middle
panel the same cell after stimulation with
thapsigargin (2 µM) in Ca2+-free solution
for 180 seconds. The right hand panel
shows the response to thapsigargin (after
180 seconds) after exposure to antimycin
A and oligomycin. (B), The total
increase in eYFP-STIM1 fluorescence
measured with TIRF microscopy is
compared between cells stimulated with
thapsigargin in the absence (6 cells)
versus presence (5 cells) of antimycin A
and oligomycin. (C), The time at which
this fluorescence reached 50% of its
maximum value (half-time) is compared
for the two conditions.
Figure 3. STIM1 migration does not
depend on mitochondrial Ca2+ buffering
or ATP production. (A), Loading cells
with BAPTA impaired the cytoplasmic
Ca2+ rise evoked by thapsigargin. Cells
were loaded with either fura 2-AM and
0.1% DMSO (control) or fura 2-AM and
BAPTA-AM (10 µM) prior to
stimulation with thapsigargin. (B),
Confocal images from a non-treated cell
showing eYFP-STIM1 distribution at
rest, and then following stimulation with
thapsigargin in the absence and then
presence of antimycin A and
oligomycin. Images represent different
cells. (C), Loading cells with BAPTA
does not impair migration of eYFP-
STIM1 to the cell periphery but
mitochondrial depolarisation still
reduces translocation in BAPTA-loaded
cells. (D), Time course of Na+ current
through CRAC channels in whole cell
patch clamp recording from cells
overexpressing Orai1 and eYFP-STIM1.
Filled circles denote a control cell and
open circles one after exposure to
antimycin A and oligomycin. (E),
Corresponding current-voltage
relationships from panel D are shown,
taken when the currents had peaked. (F),
Aggregate data from 6 control cells and
5 antimcycin A/oligomycin-treated cells
are compared. Amplitude was measured
at -80 mV. (G), Mitochondrial
depolarisation (labelled +Anti./oligo)
does not affect intracellular Mg-ATP
levels (measured through Mg2+
concentration) provided glycolysis is
intact. 2-DOX denotes 10 mM 2-
deoxyglucose. (H), Time course of
decay of the Ca2+ signal to thapsigargin
by guest on July 13, 2016http://w
ww
.jbc.org/D
ownloaded from

27
is unaffected by mitochondrial
depolarisation. This time course
represents Ca2+ removal by the ATP-
dependent plasma membrane Ca2+ pump.
(I), Aggregate data from several
experiments as in panel H is summarised
(control denotes 76 cells and Anti./oligo
85 cells).
Figure 4. Store-operated Ca2+ entry can
be partially rescued by overexpressing
STIM1 in HEK293 cells with
depolarised mitochondria. In panels (A-
C), HEK293 cells were stimulated with
thapsigargin in Ca2+-free solution (at
t=0) and then 2 mM external Ca2+ was
readmitted as shown. Only the Ca2+ entry
component is shown for simplicity. The
extent of Ca2+ release was similar for the
different conditions. (A), Store-operated
entry in wild-type cells is inhibited by
antimycin A and oligomycin. (B),
Overexpression of eYFP-STIM1 results
in modest recovery of store-operated
Ca2+ entry in cells with depolarised
mitochondria. (C), Overexpression of
eYFP-STIM1 and Orai1 results in
substantial rescue of store-operated Ca2+
entry in the presence of antimycin A and
oligomycin. For each graph, the
response in antimycin A and oligomycin
has been normalised to the
corresponding control response. Control
response has been re-calculated as ((R-
R0)/Rpeak)*100%, where R is the
measured ratio (356/380) at any time
point following Ca2+ readmission, Rpeak
is the peak ratio measured in the cell
(maximal response) and R0 is the basal
ratio (resting Ca2+). (D), Ca2+ influx
following overexpression of Orai1 and
STIM1 is compared before and after
mitochondrial depolarisation in cells
loaded with Fura 5F. (E-H), TIRF
images comparing puncta formation in a
resting HEK cell shown in panel (E), and
then after store depletion with
thapsigargin for 4 minutes (F) and after
store depletion following exposure to
antimycin A and oligomycin for 15
minutes (G). (H) The histograms plot the
absolute fluorescence intensity measured
in 1µm2 segments against the frequency
of occurrence. Upper panel represents
cells exposed to thapsigargin and the
lower panel analyses cells pre-exposed
to antimycin A and oligomycin prior to
thapsigargin challenge.
Figure 5. Ca2+ influx following
expression of a mutant STIM1is
unaffected by mitochondrial
depolarization. Scale bar in this and
subsequent left hand panels is 1 µm and
by guest on July 13, 2016http://w
ww
.jbc.org/D
ownloaded from

28
is 0.2 µm in each right hand panel. (A),
Electron micrograph from a HEK293
cell expressing eYFP-STIM1 in the
absence of store depletion. The right
hand panel shows a magnified view of
the box marked in the left hand panel.
(B) and (C), Electron micrographs after
stimulation with thapsigargin in the
absence (B) and presence (C) of
antimycin A/oligomycin. STIM1
location was identified using the DAB
reaction, which is visible as dark
deposits. (D), The fraction of the cell
periphery stained for STIM1-eYFP is
compared for control cells, cells
stimulated with thapsigargin and cells
pre-treated for 15 minutes with
antimycin A and oligomycin prior to
exposure to thapsigargin. (E), Mutant
STIM1 localizes to the cell periphery in
HEK293 cells in the absence of store
depletion and this is not altered by
mitochondrial depolarisation. (F),
Constitutive store-operated Ca2+ entry,
revealed by transiently removing and
then readmitting 2 mM external Ca2+, is
unaffected by mitochondrial
depolarisation. (G), Aggregate data,
measuring the rate of Ca2+ influx from
experiments as in panel F are
summarised. Each bar denotes >50 cells.
Figure 6. STIM1 puncta formation and
subsequent store-operated Ca2+ entry are
unaffected by mitochondrial
depolarisation in mitofusin 2-deficient
cells. A, EYFP-STIM1 distribution is
compared between control (resting)
mouse embryonic fibroblasts and those
stimulated with thapsigargin, in the
absence and then presence of antimycin
A plus oligomycin. WT above the
images denotes wild type fibroblasts. B,
Experiments were conducted as in panel
A but now using mitofusin 2-deficient
(Mfn2-/-) mouse embryonic fibroblasts.
C, After depleting Ca2+ stores with
thapsigargin (2µM) in Fura-2 loaded
cells, readmission of external Ca2+ (2
mM) resulted in a rapid increase in
cytosolic Ca2+ concentration (control)
that was suppressed by depolarising
mitochondria. (D), Ca2+ influx was
prominent in mitofusin 2-deficient cells
and was unaffected by impairing
mtochondria. (E) Bar chart compares
the rate of cytosolic Ca2+ rise upon Ca2+
readmission in control and mitofusin 2-
deficient cells, in the absence and
presence of antimycin A plus
oligomycin. Mitochondrial
depolarisation reduces the rate of Ca2+
entry in WT, but not in mitofusin 2-
by guest on July 13, 2016http://w
ww
.jbc.org/D
ownloaded from
29
deficient cells. The rate of Ca2+ influx in
wild type fibroblasts has been taken as
100%, for comparative purposes.
Figure 7. Mitochondrial Mfn 2 is
involved in regulating store-operated
calcium entry after mitochondrial
depolarisation. A, Confocal images show
distribution of endogenous Mfn 2 in
control, non-stimulated, MEF cells and
following stimulation with thapsigargin
(8 minutes). (B), Comparison of Ca2+
signals to thapsigargin in wildtype MEF
cells, MEF cells transfected with Mfn 2
and MEF cells transfected with Mfn 2
and STIM1. (Ci), Store-operated Ca2+
entry was measured in Mfn 2-/- cells
(black curve) and in Mfn 2-/- cells
(dotted curve) transfected with the Mfn
2-ActA construct, which is expressed in
mitochondria. (Cii), Summary of
aggregate data from several cells (41 for
Mfn 2-/- and 38 for Mfn 2-/- and ActA).
(D), As in panel C but now Mfn 2-/-
cells were transfected with the Mfn 2-
IYFFT construct that expresses
exclusively in the ER (35 cells for Mfn
2-/- and 36 for Mfn 2-/- and IYFFT). In
panels C and (D), cells were pre-treated
with antimycin A and oligomycin for 10
minutes before challenge with 2 µM
thapsigargin.
by guest on July 13, 2016http://w
ww
.jbc.org/D
ownloaded from

1.6
1.4
1.2
1.0
R (3
56/3
80)
8006004002000Time (secs)
Thap. 2 mM Ca2+
STIM1 + Orai1
Antimycin A + oligomycin
10
5
0Rate
of C
a2+ in
flux
((R/
s)*1
0-3) 15
10
5
0
I CRA
C (-p
A/p
F)
-10
-5
0
I CRA
C (p
A/p
F)
150100500Time (seconds)
STIM1 + Orai1
Antimycin A + oligomycin
Control Anti. A + oligo
Control Antimycin A + oligomycin
Thap.
EYFP-STIM1 Merge Mitotracker Red Oligomycin
Anti. A + oligo
Control
Figure 1A B C D
E F
by guest on July 13, 2016http://w
ww
.jbc.org/D
ownloaded from

0.15
0.10
0.05
0.00
F/F0
40
20
0Hal
f-tim
e (s
ec)
A
B
B CFigure 2
Resting
Thap
anti/oligo Thapanti/oligo anti/oligo
Thap
*
*
by guest on July 13, 2016http://w
ww
.jbc.org/D
ownloaded from

-15
-10
-5
0
Na+ c
urre
nt (p
A/p
F)
150100500Time (seconds)
40
20
0Na+ c
urre
nt (p
A/p
F)
3002001000Time (seconds)
+2-DOX+iodoacetate+oligo
+Anti/oligo
Thap./0Ca2+
Figure 3
mV
pA/pF
-5
-10
-15
-50 +50
controlcontrol
Anti/oligoAnti/oligo
control Anti/oligo
A B C
RestingThap.
D E F
R (3
56/3
80)
0
0.9
1.2
1.5 Thapsigargin
Control
BAPTA-loadedAnti./oligo. Resting
Thap.Anti./oligo.
BAPTA-loaded
*
Control
G H I
200 400 600Time (seconds)
0.4R
0 200 400Time (seconds)
1.2
1.4R
control
Anti./oligo
control Anti/oligo
100
200
300
0
by guest on July 13, 2016http://w
ww
.jbc.org/D
ownloaded from

Nor
mal
ised
R (3
56/3
80)
450400350300Time (sec)
Nor
mal
ised
R (3
56/3
80)
450400350300Time (sec)
Nor
mal
ised
R (3
56/3
80)
450400350300Time (sec)
100
0
A B C
Wild-type
Antimycin A + Oligomycin
STIM1
Antimycin A + Oligomycin STIM1+Orai1
Antimycin A
+ Oligomycin
50 50 50
00
Ca2+ Ca2+ Ca2+
100 100
E F G H 6420Fr
eque
ncy
200150100500Intensity/µm26
420Fr
eque
ncy
200150100500Intensity/µm2
D100
50
0
Nor
mal
ised
R (3
56/3
80)
Figure 4
Control Thap. Anti/oligo then thap.
Thap.
Anti/oligo then thap.
Thap.Anti/Oligo
by guest on July 13, 2016http://w
ww
.jbc.org/D
ownloaded from

A B C D
6004002000Time (seconds)
6x10⁻³
4
2
0
Rate
of C
a2+ en
try (R
/s)
E F G
100
50
0Frac
tion
occu
pied
(%)
Figure 5
Control Thap. Anti/oligo then Thap.
1.0
0.9
0.8
Control
Anti/Oligo
ControlAnti/Oligo
Anti/OligoControl
Thap.
+ AntiOligoControl
by guest on July 13, 2016http://w
ww
.jbc.org/D
ownloaded from

200
100
0Rate
of C
a2+ in
flux
(%)1.1
1.0
0.9R (3
56/3
80)
1000800600400200Time (sec)
1.1
1.0
0.9
R (3
56/3
80)
1000800600400200Time (sec)
WT Mfn2-/-
A B
CThap./ 0Ca2+
D E
Antimycin A + oligomycin
Control
Thap. Thap.
2 Ca2+Thap./ 0Ca2+
2 Ca2+
Mfn2-/-WT
anti.+oligo
anti.+oligo
Antimycin A + oligomycin
Control
anti.+oligo
anti.+ oligo
ctrl
ctrl
WT Mfn2-/-Figure 6
*
by guest on July 13, 2016http://w
ww
.jbc.org/D
ownloaded from
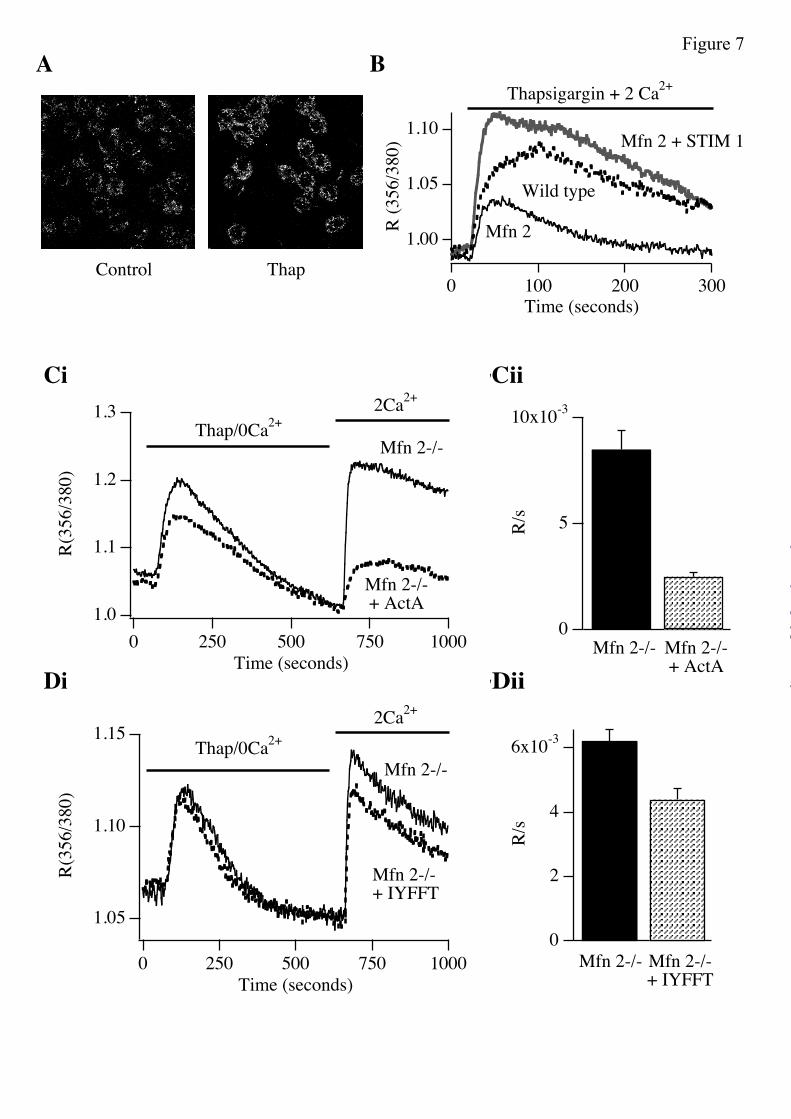
1.15
1.10
1.05
R(35
6/38
0)
10007505002500Time (seconds)
6x10⁻³
4
2
0
R/s
Mfn 2-/- Mfn 2-/-+ IYFFT
Mfn 2-/-
Mfn 2-/-+ IYFFT
1.3
1.2
1.1
1.0
R(35
6/38
0)
10007505002500Time (seconds)
Mfn 2-/-+ ActA
Mfn 2-/-10x10-3
5
0
R/s
Mfn 2-/-+ ActA
Mfn 2-/-
A
Di 'Dii
Ci 'Cii
1.10
1.05
1.00
R (3
56/3
80)
3002001000Time (seconds)
Wild type
Mfn 2 + STIM 1
Mfn 2
Thapsigargin + 2 Ca2+
Thap/0Ca2+
Thap/0Ca2+
2Ca2+
2Ca2+
B
Control Thap
Figure 7
by guest on July 13, 2016http://w
ww
.jbc.org/D
ownloaded from

1.6
1.4
1.2
1.0
R (3
56/3
80)
3002001000Time (seconds)
100 µM ATP +0 Ca2+
Control
STIM1 + Orai1
RNAi to Orai1
Control
STIM1 + Orai1
RNAi to Orai1
20
15
10
5
0Rate
of C
a2+ in
flux
((R/
s)*1
0-3)
10080604020[ATP] µM
-10
-5
0I C
RAC
(pA
/pF)
150100500Time (seconds)
Control
STIM1 + Orai1
15
10
5
0
I CRA
C (p
A/p
F)
InsP3
Ba2+
InsP3
2
1
0
I CRA
C (p
A/p
F)
Control RNAi to Orai1
**
D E F
A CB
STIM1 +Orai1
10 EGTA
-50 +50mV
pA/pF
-3
-6
-9
Control
STIM1 Orai1
+

1.3
1.2
1.1
1.0
0.9
0.8
R (3
56/3
80)
800700600500Time (sec)
2 mM Ca2+
100
50
0
A B
STIM1
Control
Orai1
Thap.
+FCCP (2 µ M)+ Oligo
+Oligo

60
40
20
0
Num
ber o
f mito
chon
dria
40003000200010000Distance from membrane (nm)
60
40
20
0
Num
ber o
f mito
chon
dria
40003000200010000Distance from membrane (nm)
40003000200010000Distance from membrane (nm)
Frac
tion
of m
itoch
ondr
ia
0
1
controlthapsigargin
50 ms
Ai ii
Bi ii
C D

60
45
30
15
0
I Kr (
-pA
/pF)
+ anti./oligo.control
-15
-100 +100 mV
-30
-45
-60 pA/pFcontrol
+ anti.+ oligo.
A B

Resting cell Anti./oligo.Thapsigargin
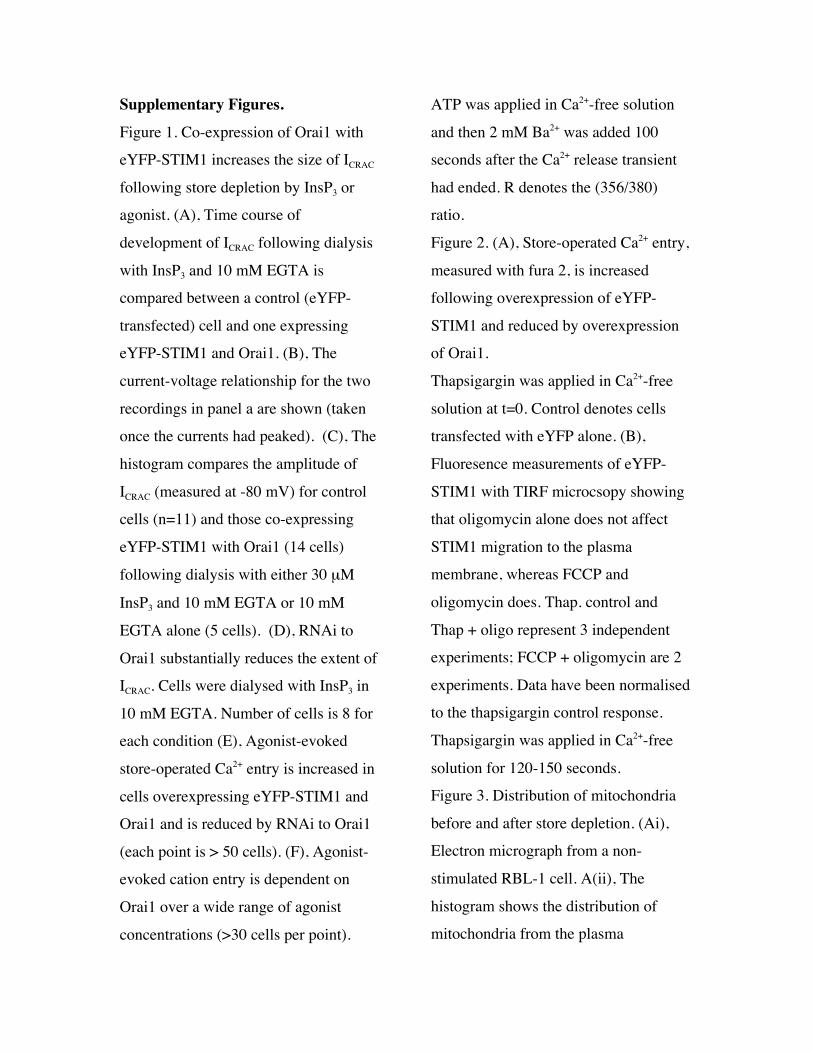
Supplementary Figures.
Figure 1. Co-expression of Orai1 with
eYFP-STIM1 increases the size of ICRAC
following store depletion by InsP3 or
agonist. (A), Time course of
development of ICRAC following dialysis
with InsP3 and 10 mM EGTA is
compared between a control (eYFP-
transfected) cell and one expressing
eYFP-STIM1 and Orai1. (B), The
current-voltage relationship for the two
recordings in panel a are shown (taken
once the currents had peaked). (C), The
histogram compares the amplitude of
ICRAC (measured at -80 mV) for control
cells (n=11) and those co-expressing
eYFP-STIM1 with Orai1 (14 cells)
following dialysis with either 30 µM
InsP3 and 10 mM EGTA or 10 mM
EGTA alone (5 cells). (D), RNAi to
Orai1 substantially reduces the extent of
ICRAC. Cells were dialysed with InsP3 in
10 mM EGTA. Number of cells is 8 for
each condition (E), Agonist-evoked
store-operated Ca2+ entry is increased in
cells overexpressing eYFP-STIM1 and
Orai1 and is reduced by RNAi to Orai1
(each point is > 50 cells). (F), Agonist-
evoked cation entry is dependent on
Orai1 over a wide range of agonist
concentrations (>30 cells per point).
ATP was applied in Ca2+-free solution
and then 2 mM Ba2+ was added 100
seconds after the Ca2+ release transient
had ended. R denotes the (356/380)
ratio.
Figure 2. (A), Store-operated Ca2+ entry,
measured with fura 2, is increased
following overexpression of eYFP-
STIM1 and reduced by overexpression
of Orai1.
Thapsigargin was applied in Ca2+-free
solution at t=0. Control denotes cells
transfected with eYFP alone. (B),
Fluoresence measurements of eYFP-
STIM1 with TIRF microcsopy showing
that oligomycin alone does not affect
STIM1 migration to the plasma
membrane, whereas FCCP and
oligomycin does. Thap. control and
Thap + oligo represent 3 independent
experiments; FCCP + oligomycin are 2
experiments. Data have been normalised
to the thapsigargin control response.
Thapsigargin was applied in Ca2+-free
solution for 120-150 seconds.
Figure 3. Distribution of mitochondria
before and after store depletion. (Ai),
Electron micrograph from a non-
stimulated RBL-1 cell. A(ii), The
histogram shows the distribution of
mitochondria from the plasma

membrane, measured in a stack of 100
serial sections (50 nm apart) taken from
resting RBL-1 cells. (Bi), Electron
micrograph taken through a RBL-1 cell
that had been stimulated with
thapsigargin for 5 minutes. (Bii) plots
the corresponding distribution of
mitochondria from the plasma
membrane. (C), A cumulative plot of the
number of mitochondria as a function of
distance from the plasma membrane (up
to 4000 nm) is compared between
control cells and those pre-exposed to
thaspigargin. No difference was found
between the two groups. D, Ca2+-
dependent fast inactivation was
compared between a control cell and one
exposed to antimycin A and oligomycin.
Membrane potential was stepped from 0
to -120 mV for 250 msec. The pipette
solution contained 10 mM EGTA and
thapsigargin.
Figure 4. Mitochondrial depolarisation
has no effect on the inwardly rectifying
K+ current in RBL-1 cells. A, I-V
relationship for the inward rectifier in
the absence and presence of
mitochondrial depolarisation. B,
aggregate data from several cells is
summarised (6 cells for each condition).
Bath solution contained standard
external ringer with KCl raised to 45
mM and NaCl lowered to 100 mM.
Pipette solution was K-glutamate (145
mM) based.
Figure 5. ER distribution after
mitochondrial depolarisation. The ER
marker ER-RFP was used to identify the
distribution of ER in RBL cells. Cells
were transfected with and images were
taken 36 hours post transfection. The
left hand panel depicts a confocal image
of a resting cell. The middle panel shows
the ER distribution following stimulation
with thapsigargin. The right hand panel
reveals little change in ER distribution
after depolarising mitochondria for 15
minutes with antimycin A and
oligomycin.

Siaw-Wei Ng, Joseph Di Capite, Trevor Powell, Luca Scorrano and Anant B. ParekhKarthika Singaravelu, Charmaine Nelson, Daniel Bakowski, Olga Martins de Brito,
in cells with depolarised mitochondria.Mitofusin 2 regulates STIM1 migration from the Ca2+ store to the plasma membrane
published online January 10, 2011J. Biol. Chem.
10.1074/jbc.M110.174029Access the most updated version of this article at doi:
Alerts:
When a correction for this article is posted•
When this article is cited•
to choose from all of JBC's e-mail alertsClick here
Supplemental material:
http://www.jbc.org/content/suppl/2011/01/10/M110.174029.DC1.html
http://www.jbc.org/content/early/2011/01/10/jbc.M110.174029.full.html#ref-list-1
This article cites 0 references, 0 of which can be accessed free at
by guest on July 13, 2016http://w
ww
.jbc.org/D
ownloaded from


![Near-Membrane [Ca2+] Transients Resolved Using the Ca2+ Indicator FFP18](https://static.fdokumen.com/doc/165x107/631286873ed465f0570a4533/near-membrane-ca2-transients-resolved-using-the-ca2-indicator-ffp18.jpg)