Minigrids for Electrification - DSpace@MIT
72
Minigrids for Electrification: Policies to Promote Industry Growth By Matthew Daniel Brusnahan B.S. Mechanical Engineering, Georgia Institute of Technology (2008) M.S.E. Mechanical Engineering, University of Michigan (2011) Submitted to the Institute for Data, Systems, and Society in Partial Fulfillment of the Requirements for the Degree of Master of Science in Technology and Policy at the MASSACHUSETTS INSTITUTE OF TECHNOLOGY September 2018 2018 Massachusetts Institute of Technology. All Rights Reserved. Signature redacted Sign atu re o f A u th o r..................................................... ijtjljc- aii ti* r, Sii* ci mc ie ty August 10, 2018 C ertified by ............................................... Signature redacted Jose Ignacio P6rez-Arriaga Visiting Professor, Sloan School of Management Professor, Electrical Engineering, Comillas University Thesis Supervisor Signature redacted A c c ep te d b y .......................................... .. ........-- --- --- ---- ---- --- ---- - - CHUSETTS INSTMTTE Munther Dahleh F TECHNOLOGY W. Coolidge Professor, Department of Electrical Engineering and Computer Science Director, Institute for Data, Systems, and Society MASSA C JUN U U LUI LIBRARIES ARCHIVES
-
Upload
khangminh22 -
Category
Documents
-
view
1 -
download
0
Transcript of Minigrids for Electrification - DSpace@MIT

Minigrids for Electrification:Policies to Promote Industry Growth
By
Matthew Daniel Brusnahan
B.S. Mechanical Engineering, Georgia Institute of Technology (2008)
M.S.E. Mechanical Engineering, University of Michigan (2011)
Submitted to the Institute for Data, Systems, and Society inPartial Fulfillment of the Requirements for the Degree of
Master of Science in Technology and Policy
at the
MASSACHUSETTS INSTITUTE OF TECHNOLOGY
September 2018
2018 Massachusetts Institute of Technology. All Rights Reserved.
Signature redactedSign atu re o f A u th o r..................................................... ijtjljc- aii ti* r, Sii* ci mc ie ty
August 10, 2018
C ertified by ...............................................
Signature redactedJose Ignacio P6rez-Arriaga
Visiting Professor, Sloan School of Management
Professor, Electrical Engineering, Comillas University
Thesis Supervisor
Signature redactedA c c ep te d b y .......................................... . . ........-- --- --- - --- - --- --- -- -- - -
CHUSETTS INSTMTTE Munther DahlehF TECHNOLOGY W. Coolidge Professor, Department of Electrical Engineering and Computer Science
Director, Institute for Data, Systems, and Society
MASSAC
JUN U U LUI
LIBRARIES
ARCHIVES

...........
Minigrids for Rural Electrification:Policies to Promote Industry Growth
By
Matthew Daniel Brusnahan
Submitted to the Institute for Data, Systems, and Society in Partial Fulfillment of the Requirements
for the Degree of
Master of Science in Technology and Policy
at the
MASSACHUSETTS INSTITUTE OF TECHNOLOGY
September 2018
AbstractThe International Energy Agency estimates $331 billion dollars will be invested over the next 12
years to provide energy access to the 1.1 billion people who currently lack access to reliableelectricity service. Of the $331 billion, the IEA estimates that 34% of this capital will be directedtowards minigrid systems.
In line with these capital estimates, governments in many countries with low levels of electricityservice are undertaking significant capital expenditures in order to expand the existing electricityinfrastructure. However, this capital is limited and will not be sufficient to provide universal access.One proposed solution to overcome limited government budgets and capacity is to allow off-gridand minigrid services in areas which will not be reached by government-led programs.
This thesis utilizes a computer-based simulation model to explore how minigrid developers respondto commercial, industrial, and residential customers and the type of service these minigriddevelopers may choose to provide to these customers. The effect of government policies andsubsidies is incorporated into the developed simulation model to judge the effect of these policieson firm behavior. The simulation results find that if governments are to prioritize universal accessto rural households, specific policy measures must be put in place to encourage minigrid developersto provide service to low-income consumers.
Thesis Supervisor: Jose Ignacio P6rez-Arriaga
Tide: Visiting Professor, Sloan School of Management; Professor, Electrical Engineering, Comillas
University
-3-

If You Only Have 5 Minutes to Read This ThesisIt can be difficult to find the key figures or central tenet of an argument when first opening amaster's thesis. For the sake of the reader and their precious time, I will suggest a few selectedsections depending on background knowledge and desired time commitment. Perhaps thesesuggestions will assist any reader struggling with the question of "What's the point?"
For the 5 Minute Reader
If the reader is already familiar with the challenges of rural electrification and the proposedsolutions, I recommend skipping the introduction, literature review, and methodology section. Themost significant graphs are contained within the three case studies. I suggest beginning with Figure8, Figure 26, and Figure 36. These figures clearly show the marginal cost for connecting additionalconsumers to a minigrid and assist the reader with understanding why entrepreneurs may be sohesitant to extend a minigrid to residential households.
Figure 4, Figure 21, and Figure 31 show the potential profitability of a minigrid, further emphasizingthe rather narrow market available to minigrid firms.
For the 15 Minute Reader
After perusing the recommend figures above, I recommend the reader briefly skim the explanationof the research question to gain an understanding of why the policy-maker, investor, or minigriddeveloper may be interested in the marginal cost of connecting consumers to a minigrid.
It is then valuable to review the case studies, with particular attention to the willingness to pay(WTP) of each consumer and the profound effect of WTP on the profitability of a given minigrid.
This re-reading of the case studies will lead the reader back to Table 2, Table 4, and Table 6, whichattempt to estimate the subsidy necessary for each minigrid. The key nuances of these tables can beteased out by asking which stakeholders are providing funds/revenue, how much each of thesestakeholders are paying, and what alternative energy options are available for consumers?
I then suggest reading the recommendations for policy-makers to understand the advantages andpitfalls of various pricing approaches and government policies.
If You are Reading This Entire Thesis
After following the recommendations for the 5 minute and 15 minute reader, feel free to read thisthesis from start to finish. While reading, remember that the perspective in this thesis is from theviewpoint of the private minigrid operator delivering energy services. Other structures forownership and operation of energy infrastructure exist, and these structures can significantly changethe formulation and methodology for approaching problems. A government may choose a differentobjective function such as cost minimization or maximizing energy service. In the end, it is apartnership of governments, private operators, and consumers which will enable energy access.Only by considering the perspective of each can a holistic and sustainable energy policy beformulated.
-4-

AcknowledgementsThe past two years have exposed me to the world in ways that I would never have imagined whenstarting at MIT. Through the generosity of the Tata Center for Technology and Design and theTata Trusts, I was able to conduct research in areas of the world that would have been inaccessibleotherwise. First and foremost, I have to thank that Tata Center and Rob Stoner for the opportunityand the support over the past two years.
My advisor, Jose Ignacio Perez-Arriaga, has been a source of knowledge and support over these twoyears and has enabled the amazing work of the Universal Access Lab. He travels more than anyoneI have ever met, and yet somehow finds time to mentor his students and guide their research.
Reja Amatya and Jason Prapas have been a constant source of encouragement and knowledge, andthis work would not have been possible without them.
Finally, I want to thank my traveling companions and colleagues in the Tata Center. Elise and Katiehave been a needed source of friendship and knowledge, both in Delhi and Cambridge. To the restof the research group, Roxanne, Olamide, Turner, Stephen, Cailinn, and Gr6goire, the travels andresearch were wonderful, and I wish you the best.
-5-
Contents:
ABSTRACT -3-
IF YOU ONLY HAVE 5 MINUTES TO READ THIS THESIS -4-
FOR THE 5 MINUTE READER -4-FOR THE 15 MINUTE READER -4-IF YOU ARE READING THIS ENTIRE THESIS -4-
ACKNOWLEDGEMENTS -5-
CONTENTS: -6-
INTRODUCTION -9-
THE UNMET NEED FOR ENERGY SERVICES -9-PROJECTED INVESTMENT THROUGH 2030 -9-THE EXISTING INVESTMENT SITUATION IN RURAL AFRICA AND INDIA -9-MOTIVATION FOR THE RESEARCH QUESTION -10-STATEMENT OF THE RESEARCH QUESTION -10-
LITERATURE REVIEW -11-
BRIEF HISTORY OF THE ELECTRICITY SECTOR IN INDIA -11-PLANNING METHODOLOGIES AND TOOLS FOR RURAL ELECTRIFICATION -12-CUSTOMER WILLINGNESS-TO-PAY AND EXPECTATIONS OF RELIABILITY -13-
METHODOLOGY -15-
THE PRIVATE INVESTMENT FRAMEWORK FOR MINIGRID DESIGN
VALUATION OF MINIGRID PROJECTS
PRESENT VALUE BASED ON FREE CASH FLOWVALUATION METHODS
ASSESSMENT OF RISKWEIGHTED AVERAGE COST OF CAPITAL
ADJUSTED PRESENT VALUE
INTERNATIONAL RISK, CAPITAL STRUCTURE, AND INTEREST RATES
SELECTING THE APPROPRIATE DISCOUNT RATE FOR EQUITY
ASSESSING COUNTRY RISK
ALTERNATIVE METHODS TO MITIGATING COUNTRY RISK
THE EFFECT OF DISCOUNT RATES ON MINIGRID PROJECTS
MAXIMIZATION OF THE PROJECT NET PRESENT VALUEUNDERSTANDING FIRM BEHAVIOR
CUSTOMER SELECTION
RELIABILITY
OPTION TO ABANDON PROJECT
MAXIMIZING FIRM VALUE THROUGH OPTIMIZATION
PROBLEM STATEMENT
OBJECTIVE FUNCTION
EVALUATING THE VALIDITY OF THE CUSTOMER SCORE METRIC
NET PRESENT VALUE OF REVENUE
OPTIMIZATION TECHNIQUE
SUB-OPTIMIZATION
-15 -- 15 -
-15 -- 15 -- 15 --16--16--16 --17-- 17 --18--18--18 --18-- 18 -
-19-- 19 --20-- 20 -- 20 --21--22--22--22-
-6-
OPTIMIZATION ALGORITHM -23 -
SHORTCOMINGS OF THE EXISTING OPTIMIZATION PROBLEM -24-
TEMPORAL ASPECTS: -24-
DISCOUNT RATES FOR OPTIMIZATION: REAL AND NOMINAL RATES -25-
ANNUITY MINIMIZATION VS NET PRESENT VALUE MINIMIZATION -25-
CASE STUDIES FOR MINIGRID FIRM BEHAVIOR -26-
PURPOSE OF CASE STUDIES -26-RENEWABLE ENERGY REQUIREMENTS FOR CASE STUDIES -26-
NIGERIA MINIGRID CASE STUDY: -26-
INTRODUCTION -26-
VILLAGE DEMAND CHARACTERISTICS -26-
VILLAGE ABILITY TO PAY -28-
RESULTS OF FULL DESIGN SPACE SIMULATION -28-
RESULTS OF TIE PROFIT MAXIMIZING MINIGRID DESIGN -29-
RESULTS OF THE UNIVERSAL SERVICE DESIGN -30-
REQUIRED TARIFF AND SUBSIDY FOR PROFITABILITY IN THE NIGERIAN VILLAGE MINIGRID -32-
EXPLORATION OF THE CUSTOMER MARGINAL COST -32-
COMPARISON TO ALTERNATIVE TECHNOLOGIES -35-
THE EFFECT OF MINIMUM RENEWABLE ENERGY REQUIREMENTS ON MINIGRID DESIGNS -36-
THE EFFECT OF DIESEL BANS ON MINIGRID DESIGN AND FIRM BEHAVIOR -38-
THE EFFECT OF DISCOUNT RATE ON MINIGRID PROJECTS -40-
RWANDA MINIGRID CASE STUDY: -41-
INTRODUCTION -41 -
VILLAGE DEMAND CHARACTERISTICS -41 -
VILLAGE ABILITY TO PAY -42-
RESULTS OF TIE FULL DESIGN SPACE - 43 -
RESULTS OF THE PROFIT MAXIMIZING DESIGN -44-
RESULTS OF THE UNIVERSAL SERVICE DESIGN MINIGRID -45-
REQUIRED TARIFFS AND SUBSIDY FOR PROFITABILITY IN THE UNIVERSAL SERVICE DESIGN -47-
EXPLORATION OF THE MARGINAL CUSTOMER COST -47-
COMPARISON TO ALTERNATIVE TECHNOLOGIES -49 -
INDIA MINIGRID CASE STUDY -50-
INTRODUCTION -50-
VILLAGE DEMAND CHARACTERISTICS -50-
ANCHOR LOAD -51-
VILLAGE ABILITY To PAY -52-
RESULTS OF FULL DESIGN SPACE SIMULATION - 52-
RESULTS OF THE PROFIT MAXIMIZING DESIGN - 54-
RESULTS OF THE UNIVERSAL SERVICE DESIGN -54-
REQUIRED TARIFFS AND SUBSIDIES FOR THE UNIVERSAL SYSTEM DESIGN -56 -
EXPLORATION OF THE CUSTOMER MARGINAL COST -56-
COMPARISON TO ALTERNATIVE TECHNOLOGIES -58-
CONCLUSIONS -60-
THE BEHAVIOR OF FIRMS IN THE FREE MARKET -60-
FIRMS ARE INCENTIVIZED TO PROVIDED HIGH RELIABILITY -60-
FIRMS HAVE LITTLE INCENTIVE TO CONNECT RESIDENTIAL CUSTOMERS -60-
FALLING PRICES OF SOLAR PV AND BATTERY STORAGE MAY EXPAND THE MINIGRID MARKET -60-
IMPLICATIONS FOR POLICY -61 -
REGULATIONS FOR RELIABILITY -61 -
-7-
IMPROVING ACCESS THROUGH MINIGRIDS -61-
IMPLICATIONS FOR PLANNING -61-THE USE OF MINIGRIDS IN PLANNING -61 -
THE DIFFICULTLY OF CALCULATING A LEVELIZED COST OF ENERGY -62-
THE IMPACT OF NETWORK AND GENERATION COST IN PLANNING -62-
AREAS FOR IMPROVEMENT -62-RELIABILITY MODELING -62-CONSUMER DEMAND -62-CALCULATION OF MARGINAL COST -62-
BIBLIOGRAPHY -63-
APPENDICES -66-
APPENDIX A: INCOME STATEMENTS FOR MINIGRID PROJECT DESIGNS -66-APPENDIX B: DISCOUNT RATES FOR MINIGRID VALUATION -71-APPENDIX C: COMMON DESIGN PARAMETERS FOR MINIGRID CASE STUDIES -72-
- 8-
Introduction
The Unmet Need For Energy Services
Providing energy access to the world is a wickedly difficult problem. Despite the tremendousinvestment of time and capital to date, 1.1 billion people remain without adequate energy service.On the continent of Africa, the population growth is outpacing the growth in energy infrastructure
[1].
Countries such as the United States electrified throughout the late 1 800s and 1900s entirely throughgrid-extension. Although this approach was effective in wealthy countries with an appetite forenergy, it cannot be transplanted to countries which still have electrification rates below 20%.
Recent efforts in electrification have adopted alternative approaches from both a structural andtechnological perspective. Private capital is moving into the electricity distribution industry at asignificant rate as companies begin to see a market opportunity to provide energy service where thegovernment cannot [2]. These privatized approaches can take the form of firms operating in a free,unregulated market, or as public-private partnerships, which have been seen in utilities throughoutAfrica and India.
In addition to the structural changes in the industry, the technological advancements in solarphotovoltaics, energy storage, and mobile communication networks have enabled new technologiesfor providing energy service. The solar home system market is growing rapidly, and minigriddevelopers are scattered throughout sub-Saharan African and India.
Projected Investment Through 2030The International Energy Agency estimates that $334 billion will be required to increase theworldwide energy access level to 92% by 2030. Due to population growth, this will still leave 602million people in African without access, but will increase the energy access rate from 34% to 64%[1].
Of the $334 billion in investment, over 34% is estimated to for minigrid development and 2 9 % inother off-grid products. This represents an investment of $114 billion in minigrids, or an average of$8.1 billion per year between 2016 and 2030.
Although the split of public and private investment is not delineated in the report from the IEA,there is considerable discussion regarding the business models and regulation for private investment.This discussion suggests that the banks and international agencies believe private 'investment willcomprise a significant portion of the financing.
In the State of Electricity Access Report published by the World Bank, a number of measures areproposed to facilitate the developing minigrid markets. Of particular note are the recommendationsto establish clear rules for scaling the central grid, risk-guarantees, and light-handed regulation [2].
The Existing Investment Situation in Rural Africa and India
Through a combination of reports, internet searches, and industry interviews, it was possible tocompile a list of approximately 38 minigrid firms which are operating throughout sub-SaharanAfrica and India. Most of these firms are small with only a few minigrids. The largest providers areHusk Power, which operates primarily in Bihar and Uttar Pradesh, India, and PowerGen, whichoperates in East Africa [2].
-9-

The investment in the minigrid industry is not growing at the same pace as solar home systems. TheWorld Bank report identifies $160 million in capital raised by pay-as-you go SHS providers in 2015[1]. This is contrasted with the minigrid industry, which has seen one serious equity investment ofonly $20 million [3]. The majority of the minigrid operators have fewer than 20 sites.
Motivation for the Research Question
When this research began in 2016, there were significant amounts of investment flowing into themarket for Solar Home Systems, but a stagnation of funding for minigrids (a notable exceptionbeing Husk Power in January of 2018). Despite the abundant literature on the benefits of minigridsystems and the techno-economic analysis pointing to minigrids as the least-cost approach toelectrification in many scenarios, the industry appeared stagnant.
The literature often cites risk, unfavorable regulation, and lack of anchor customers as barriers tominigrid industry growth. Much of the work in this thesis attempts to explore these barriers, butwith a secondary question of determining which customers are most likely to be served by minigrids.Particularly, this thesis asks, if minigrids were to be constructed at scale would certain customers stillbe left behind? Anecdotal evidence suggests that in the solar home industry, the customers with theleast ability-to-pay are still not being served by the market. Would the same situation occur in theminigrid market?
Statement of the Research Question
In many cases, especially sparse, rural areas, minigrids operated by private firms are the lowest costsolution. However, without adequate government regulation, few of these systems will be built andsolar home systems will fill the market need. This thesis explores how minigrid developers respondin a market free of regulation, and subsequently, in a market with various forms of governmentregulation and incentives.
This thesis first attempts to answer questions related to service quality and reliability of minigridsystems. Anecdotal evidence suggests that high reliability is provided to ensure customer satisfaction,but lower reliability would in fact be more profitable. If higher reliability is indeed more expensive,regulation from the government may be necessary to ensure that consumers are receiving adequateservice quality.
The second question addressed by this thesis is related to the desirability of various customers asseen through the lens of a private developer. Minigrid customers range from anchor customers suchas mobile phone towers, to residential customers requiring only lighting and mobile phone charging.The literature suggest that anchor customers are necessary to the viability of minigrid projects, butdoes not answer the question of how large these customers need to be, how many are required, andhow much benefit they provide.
The thesis recognizes that anchor customers do indeed provide benefits to the minigrid operator,but a customer threshold exists at which the minigrid operator would no longer be willing toconnect additional customers, similar to the behavior of the national electricity grids which are notunder a universal service obligation. The model and framework attempts to identify the threshold atwhich a minigrid provider would no longer be incentivized to add customers to the minigriddistribution network.
- 10 -

Literature Review
Brief History of the Electricity Sector in IndiaPrior to Indian Independence in 1947, 80 percent of generation capacity was privately owned ormanaged by local authorities in India. Vertically integrated state electricity boards were created ineach state after independence, and by 1991, owned approximately 70% of generation. This was agenerally successful practice, with electricity growth of 9.2% year over year, faster than the economicgrowth rate of India.
However, the state electricity boards began to accumulate debts due to low tariff rates for farmers,increasing amounts of theft, and an industrial customer base which was switching to privategeneration.
Starting in 1991, due to untenable state electricity board debt and a clear shift in consensus onelectricity policy, the government began enacting reform. This paralleled the larger economicreforms throughout the country designed to liberalize and open the economy.
The World Bank encouraged India to begin privatizing the electricity industry to encourage privateinvestment. This private investment was meant to help revitalize a failing industry. The StateElectricity Boards were generally bankrupt and servicing large amounts of debt, and were generallydeemed incapable of building the needed infrastructure. Encouraging private investment was seenas a potential solution to building needed infrastructure, but required political reforms in order toensure investors that their investments would remain secure and free from politics.
This began with the Electricity Law Amendment Act in 1991, which allowed for Independent PowerProducers to own, operate, and maintain generation. A number of fast track generation projectswere created, and although the private power producers were generally disgruntled with thebureaucracy of India, private investment did occur [4].
In 1998, the Central Electricity Regulatory Commission was established as well as the state levelcommissions. Throughout 2000-2002, the Electricity Act of 2003 was introduced and slowly workedthrough parliament [4]. The federal government passed the Electricity Act of 2003 in an effort toencourage private generation, establish independent regulatory bodies, and revitalize the industry. Adeparture from the previous policies of India, the reform during the 1990s did not have an explicitconsideration of universal access included. The World Bank supported the argument that betterfiscal management would lead to improved social benefits. However, the recommended policies didnot address the known fact that many in India could not afford electricity at the market rate, andtotal subsidies would increase if an even larger segment of the population was provided electricity[4].
In an effort to address low electrification rates, the government has implemented a number ofprograms to expand existing infrastructure. The Deen Dayal Upadhyaya Gram Jyoti Yojana(DDUGJY) scheme aims to improve the existing electricity infrastructure with feeder separation, aswell as proving new distribution lines to villages and households. Under this scheme, a village isconsidered electrified if electricity infrastructure is present and public buildings as well as 10% ofhouseholds are electrified. The scheme only requires 6-8 hours of power to be provided each day[5]. The Rural Electrification Corporation (REC) is also presently charged with providing loanassistance and capital for generation projects and rural electrification projects [6].
Recently, a number of Solar Home System and Minigrid providers have been operating in India,primarily in the states of Uttar Pradesh and Bihar, were access rates are lowest.
- 11 -
Planning Methodologies and Tools for Rural Electrification
Proper planning and technical assessment tools are required to understand the cost structures of off-grid electrification and the feasibility of certain technology choices. Planning tools can take a variety
of forms in the rural energy space, but can be distinctly characterized by their methodology andpurpose. A number of literature reviews of the minigrid space have been performed which attemptto categorize the types of minigrid planning tools [7]-[9].
S. Mandelli et al. define a number of categories for minigrid research, although for the purposes of
this review, two categories are important: models and methods for simulation and sizing, andtechno-economic feasibility analysis [7].
Bhattacharyya does not distinguish between these categories, instead identifying this combination ofactivity as "methodology" for off-grid projects. The use of the term methodology implies that these
research studies are focused on best practices for minigrid projects. He breaks down themethodologies into four categories: indicator-based approaches, optimization techniques, multi-criteria approaches, and systems analysis [8].
Indicator based approaches depend on minimizing a common metric, which could be levelized costof energy, weighted scoring technique, or sustainability indicators. Among these strategies, levelizedcost of energy appears to give the most objective metric for quality of design. However, despite theappearance of objectivity, use of levelized cost of energy can contain certain assumptions and valuesestablished somewhat subjectively, such as cost of non-served energy [8].
The most technically complex models used for simulation and sizing seek to optimize amathematical formulation (typically cost or net present value) subject to technical constraints. Manyof these models might be considered combinations of simulation and feasibility analysis according toS Mandelli et al., while they would be identified as optimization techniques according toBhattacharyya. These models typically minimize cost, but a variety of objectives are possible. Erdincand Uzunoglu identify a number of algorithms used for hybrid renewable energy systems, citingstudies using each method. They evaluate HOMER, Genetic Algorithms, Particle SwarmOptimization, Simulated Annealing, Linear Programming, Evolutionary Algorithm, NeuralNetworks, Simplex Algorithms, Stochastic approaches, and Design Space based approaches.[9]
Although the number of tools used for minigrid simulation is numerous, it is worthwhile to identifythe most popular tools and methods. Sinha and Chandel focus not on minigrid planning processesand techniques, but review specific minigrid software tools. They identify 19 software toolsdeveloped for hybrid minigrid system design. The most prevalent tools appear to be HOMER,HYBRID2, RETScreen, iHOGA, and TRNSYS, but of these, HOMER is the most popular due tothe number of energy sources included and the ease of use [10]. Erdinc notes that HOMER iswidely used in numerous studies, and it is common to find the software used in a variety of literature
case studies [9].
HOMER is an interactive visual software tool which optimizes minigrid design for lowest NetPresent Cost. The software includes detailed technical models for a variety of generation sourcesand allows for sensitivity analysis to assist with risk assessment. The software provides some
functionality for demand profile creation, although this is done at an aggregated level, not at theindividual appliance or end-user level. HOMER does not include any features for network design.The optimization techniques for HOMER are rigid, and not openly published. The HOMERwebsite claims the use of a derivative free optimization technique, likely an iterative direct searchmethod. [11]
-12 -
Network Planner is a decision support tool developed at Columbia University. The aim of networkplanner is not to simulate the specific designs and network layouts of minigrids, but to optimizeelectrification efforts given economic profiles, costs, and the layout of the existing grids. Althoughthis tool is not designed to plan technical details of minigrids, the cost-benefit analysis and decisionsupport in rural electrification is similar to other tools [12].
GEOSIM is a commercially available tool "dedicated to decision support for planning ruralelectrification aimed at decision-makers and planners." GEOSIM uses geospatial and socioeconomicdata to prioritize rural electrification efforts in the most cost-effective manner. GEOSIM has theability to forecast demand data and select from a number of different electrification technologies,including both grid connection and distributed generation [13].
The Universal Energy Access Group at MIT has developed two models to assist with ruralelectrification planning. The Reference Electrification Model (REM) is a large-scale planning modelwhich assists in electrification planning efforts over a large region. Using geospatial coordinates forconsumers and the characteristics of existing electricity infrastructure, REM selects the appropriateelectrification methodology in the considered area: grid extension, minigrid, or solar home system[14].
Stemming from the research efforts in REM, the UA group has developed a second model, theLocal Reference Electrification Model (LREM), which serves as a decision support tool for ruralminigrid developers. This tool stands out among others due to its breadth of features. LREMprovides features for the entire design process including individual consumer demand profiles,generation sizing, and network design. The tool typically employs a hybrid minigrid designconsisting of solar PV, battery storage, and diesel generation [15].
LREM utilizes an objective function which seeks to find the lowest available annuity. Theoptimization algorithm does not use traditional mathematical programming due to the highly non-linear model, instead utilizing a nested, direct-search approach. The master optimization problemvaries the minigrid generator design while performing a sub-optimization of PV and battery size
[15].
LREM is used extensively throughout this thesis to estimate the cost of providing minigrid servicefor a number of village types and geographies. To understand the investment decisions of privatefirms however, the capital investment and ongoing expenses of a minigrid must also be combinedwith the anticipated revenues from customers and subsidies from the government.
Customer Willingness-to-pay and Expectations of Reliability
The willingness-to-pay of consumers is a crucial component for minigrid developers in the privatesector. Equally important is an accurate estimation of expectations regarding reliability and servicequality. Fortunately, within India, there have been numerous studies conducted to determine the
willingness-to-pay of consumers and their expectations regarding service. These studies generallyfocus on a specific service, either grid-supplied electricity, minigrids, or solar home systems, butgiven the similarity in service between minigrids and grid-supplied electricity, review of these studiesstill provides important insights.
In rural areas where lighting is a primary use of electricity, the trade-offs between kerosene usageand electric lighting are a key component in understanding potential revenue from customers. In arural survey of 1576 rural residents in Barabanki district of Uttar Pradesh, four-fifths responded thatthey were unsatisfied with their lighting. Only 110% of participants believed that solar powered
lighting would be more difficult to use than kerosene. 65% of respondents were willing to pay INR
- 13 -

50 per week for two lights and mobile phone charging. 45% were in favor of solar power, 30%
favored grid electrification, and 25% considered both approaches [16].
In the Unnao district of Uttar Pradesh, surveys found mean willingness-to-pay for a 40 Watt SolarHome System with mobile phone charging and 3-4 lights was 4209.3 INR ($67 USD). The meanwillingness-to-pay for a monthly lease of a similar system was 152.3 INR ($2.43 USD) [17].
In a more recent survey focusing exclusively on solar lanterns with mobile phone charging,willingness-to-pay was on average 134 INR for a single lamp. However, the researchers found thatlearning has a powerful effect on willingness-to-pay for simple household technologies, and thosewho received the treatment through a passive network were willing to pay INR 120 more, and thosewho witnessed a demonstration from peers on the benefits of the solar lantern were willing to payINR 195 more [18]. This hints that if village has few early adopters at a high price, as residentswitness the benefits of a particular service, their willingness-to-pay may increase.
When surveying usage among Mera Gao Power customers (fees of INR 100 per month), users weregenerally happy with the service, but were unwilling to accept increased charges. When asked aboutadditional services, 56% said they would not pay for a fan, 82% said they would not pay extra for aTV [19].
Although many of these studies focus on products and basic lighting services, they do not addressthe customer perceptions on reliability and quality of service.
Surveys of households in rural Madhya Pradesh found that for a bill of 200 INR / month, 75% ofhigh income households would be willing to accept improved service. However, only 45% of poorhouseholds would be willing to pay 200 INR / month, even with improvements in service. [20].
Sagebiel and Rommel find that in the city of Hyperbad, residents are generally unwilling to pay forimprovements in quality of service and additional use of renewable energy. This highlights thatalthough quality of service may be important to some customers, there may be diminishing returnsgiven that the residents of Hyperbad are unwilling to provide the additional revenue necessary forimprovements. [21]
Surveys in urban areas concerning electricity expenditure found that the percent of monthly incomespent on electricity is 6.5% for legally connected households and 3 .5% for illegally connectedhouseholds. Average monthly expenditure range from 290 to 610 Rs for illegal and legalconnections, with mean consumption between 70 to 80 kWh / month. [22]
One final point of concern regarding the willingness-to-pay for electricity service is customerperception of government provided services and privately operated enterprises. Given that mostminigrids and distributed generation technologies would be privately operated, either through profit-making companies or NGOs, customer perception will have an impact on viability.
Aklin finds residents are willing to support reform of the electricity sector when presented thebenefits or reform. However, they did not find that residents support privatization of the industry,regardless of the benefits of privatization [23]. Urpelainen has similar findings in a survey of ruralresidents. Of those surveyed, 65% were in favor of government leadership for electricity supply,while only 26% preferred private companies [16]. Although these studies do not providequantifiable inputs for a techno-economic model such as LREM, they provide import insights whenconsidering the model formation and policy implications.
- 14 -

Methodology
The Private Investment Framework for Minigrid Design
Successful electrification is dependent on the active participation of all stakeholders, including thegovernment, electricity service provider, investors, and most importantly, the consumers.
Although it is possible to examine the minigrid project from the lens of the government, consumers,or even national utility, the research questions laid out by this thesis concern the behavior of privatefirms in the minigrid industry. The appropriate viewpoint for answering these questions is from theperspective of the private firm, which requires a specific framework and methodology whenevaluating investment and design decisions.
Valuation of Minigrid Projects
Investment decisions typically have three elements as laid out by Asquith and Weiss: The StrategyElement, the Valuation Analysis, and the Execution [24]. In examining the role of private firms inbuilding minigrid projects, this thesis focuses on the second of the three elements, the ValuationAnalysis.
A number of options exist for performing valuation analysis, ranging from discounted cash flows,adjustment present values, multiples, or comparable. For the purposes of valuing minigrid projects,this model uses a discounted free cash flow analysis. This thesis follows the Net Present Value Rule:if the project has a positive net present value (NPV), the firm will undertake the project [25].
Present Value Based on Free Cash Flow
Private investors have incentive to maximize returns, and thus seek projects with positive netpresent value. In encouraging private investment in the minigrid market, these individuals seek toprovide assets which provide electricity service, but in exchange, seek a return on these investments.Returns on investment can take many forms, but for the minigrid project, revenue from electricitysales is the primary source of cash flow. If the investor believes they will receive sufficient revenuefrom the investment, the minigrid project may be considered feasible.
Brealey, Myers, and Allen list a four-step procedure for Capital Investment: Forecast after-tax cashflows, assess the project risk, estimate the opportunity cost of capital, then calculate the Net PresentValue [25]. The discussion below first centers on the assessment of risk and the opportunity cost ofcapital before moving on to the methods for estimating the after-tax cash flows.
Valuation Methods
Assessment of Risk
Throughout the literature on minigrids and investments, there is ample discussion of project risk andexpected return. Discerning between the two is not only a difficult problem, but in reality,impossible. Modern Finance theory teaches that the rate of return demanded by an investor isdirectly linked to the risk. Common examples are U.S. Treasuries, which are typically consideredzero risk, and often have the lowest expected rates of return. Alternative examples include commonstocks with high betas, which demand a higher rate of return than the prevailing market portfolio.
In typical infrastructure projects such as a rural minigrids, financing is often provided through acombination of debt and equity. Debt for these projects typically receives a lower interest rate dueto the seniority of the debt-holders in the case of financial distress.
- 15 -
With multiple types of debt and equity on the balance sheet, a method is required to select a singlerate of return at which to discount future cash flows and value a potential minigrid project. TheWeighted Average Cost of Capital approach attempts to overcome this difficulty by providing amethod to estimate an appropriate interest rate as a combination of equity and debt.
Weighted Average Cost of Capital
The most common approach to finding the appropriate discount rate for a project is through theWeighted Average Cost of Capital (WACC). The WACC formula (Eq. 1) is a weighted average ofthe interest rate for equity and debt, each being weighted in proportion to the amount of investmentin the project. The interest rate for debt is typically discounted further due to the tax shieldprovided by debt [25].
Eq. 1 WACC=rD -(C + E+
Determination of the appropriate discount rates for debt and equity is dependent on the risk of theproject and is discussed further in the section on interest rates and perceived risk.
Adjusted Present Value
The weighted average cost of capital approach is often used for valuing projects within firms thathave relatively constant debt and equity ratios. The WACC methodology assumes that the leverageratio of the firm will remain constant over the life of the projects.
With infrastructure projects such as minigrids, the leverage ratio of the project may be changingsignificantly over time, especially if early cash flows are used to pay down significant amounts ofdebt. In these scenarios, it is more appropriate to use the Adjusted Present Value (APV) method[26].
The Adjusted Present Value Method determines the value of the project as the sum of the unleveredproject value combined with the value of the interest tax shield. Any cost of financial distress canthen be subtracted from the total project value if necessary. This approach lends itself to projectfinancing due to the ease at which various levels of debt and changing capital structure can beincorporated into the valuation.
Eq. 2 VL = APV = VU + PV(Interest Tax Shield) - PV(Financial Distress)
Although the Adjusted Present Value method presents some advantages over the WACC method,due to the popularity of use, the WACC method will be used for minigrid valuations in the casestudies.
International Risk, Capital Structure, and Interest Rates
Minigrid projects in emerging economies often have some degree of international investment.Foreign-own firms may see the minigrid industry as an emerging market with growth potential.Impact investors may desire to contribute equity to socially impactful projects. In many cases, theWorld Bank may provide credit guarantees to the project in order to mitigate risk.
In the case of these cross-boundary investments, the debt and equity holders often perceive anincreased risk due to currency exchange, political risk, and regulatory risk. Although these risks canbe mitigated through various financial products and portfolio diversification, others must beappropriately assessed.
- 16 -
Selecting the Appropriate Discount Rate for Equity
For minigrid projects, assessing the risk becomes increasingly difficult due to revenue generation in alocal currency but possible debt payments due in a foreign currency. This can be furthercomplicated by the political risk associated with international investments.
If the minigrid project has domestic financing with revenue generation in domestic currency, theinterest rates should be based on the local risk free rate, with a market premium appropriate for thelocal economy. This can be done with the Capital Asset Pricing Model (CAPM) shown in Eq. 3
Eq. 3 re = rf + # - (rm - rf)
In the case of a foreign investor, currency can be hedged using a swap or forward, although in manycases this becomes nearly impossible in developing economies. The foreign investor must alsodetermine the appropriate risk-free rate, project beta, and market premium.
Brealey et. al suggest that the beta for the project be determined based on the returns of the localmarket compared to the returns on the home market. The home market risk free rate should beused as the risk-free rate, and the home market premium used as the market premium. [25] Thehome market required return can then be converted to the foreign market required return using therisk-free interest rates of the two countries, which should be linked to the inflation rates of the twocountries.
This approach should give relatively modest discount rates for minigrid projects, specifically if theinvestor views these projects similar to energy distribution companies. For reference, companiessuch as Southern Company, Duke Energy, and American Electric Power have betas between -0.03and 0.02 (As of August 2018). Even with conversion due to relatively high inflation rates in theforeign markets, the required returns should remain modest. However, if investors view minigridsfirms similar to firms distributing Solar Home Systems, which could be considered riskiertechnology companies, the beta would be much higher.
Assessing Country Risk
Although regulatory risk is often cited as a barrier to the development of minigrid firms, thefinancial models tend to imply that this risk could be diversified. If investors view regulatory risk asa country risk which requires a premium on the discount rate, investors may not be appropriatelydiversifying their portfolios. Sabal states, "Nevertheless, there are a number of reasons to believethat adding some kind of country risk premium to the CAPM is not the best way to account forcountry (i.e., political) risk." He goes on to argue that country risk is often viewed as systematic risk,but in many cases, it can be diversified, which happens naturally in a diversified portfolio ofpublically traded stocks [27].
Sabal suggests that the Ross Arbitrage Pricing Model may be well-suited to internationalinvestments, but acknowledges that it may be difficult to identify all the appropriate factors for theinternational market [27]. A Local CAPM could also be applied to the country of interest, similar tothe recommendation of [25], but this would only apply to investors who are diversified in thecountry of interest. Additionally, it may be difficult to compute the appropriate betas if the marketsare illiquid [27].
Alternative approaches for calculating the appropriate discount rate are proposed by Lessard, whorecommends adjusting the offshore project beta by multiplying the home market industry by acountry beta for the associated project [28].
- 17 -
The Godfrey and Espinosa model is a CAPM based model, but adds an additional term for countryrisk [29]. Sabal argues that proper diversification should allow the investor to completely eliminate
the necessity for an additional risk premium [27].
Alternative Methods to Mitigating Country Risk
Brealey, Myers, and Allen recommend the involvement of international banks when the perceived
risk from foreign governments is high. Capital can be borrowed from the international banks with
guarantees written on the loan requiring the foreign government to honor the agreements orregulation. In the instance that the foreign government does not honor the agreements, the
government must assume the loan and potentially harm their reputation with the international
banks. In many cases, having an institution such as the World Bank provide the loan is powerful
due to the reluctance of the government to impact their reputation with such a large institution [25].
The Effect of Discount Rates on Minigrid Projects
Selection of the appropriate discount rate for minigrid projects could be the topic of an entire thesis,but the short review of the literature on both minigrids and international investment reveals an
important insight. The minigrid industry perceives high interest rates and risk as a barrier to project
development, but applied finance theory suggests than many of these risks are diversifiable, and
interest rates may be overpriced.
For the purposes of this thesis, the Nigerian Minigrid Case Study will be used as a template for
exploring questions related to discount rate. Examining the project with a range of discount rates
will illuminate the effect of financing cost on the minigrid industry and the potential benefit of lower
discount rates for these projects.
Maximization of the Project Net Present Value
Understanding Firm Behavior
In order to understand how minigrid firms respond to various market and regulatory conditions, we
model the minigrid firm as a profit-seeking firm attempting to maximize shareholder value. Thisapproach leads to vastly different outcomes than a minigrid company which seeks to maximize
social impact or a government entity which may have a universal service obligation.
The view of the profit maximizing firm is chosen due to the inherent desire to identify minigrid
projects which can encourage private investment. The IEA new policies scenario estimates that
$110 billion will be invested in minigrids over the next ten years [1]. If a portion of this investment
will occur through international capital, investors will demand reasonable rates of return. This
results in a firm which will make management decisions to protect investments of both debt-holders
and equity-holders while maximizing the returns for equity-holders.
This thesis focuses on only a few management decisions available to the minigrid firm: System
design, customer selection, and reliability. Each of these decisions will be modeled through the lens
of a manager seeking to maximize shareholder value for the equity-holders.
Customer Selection
In expanding services in rural areas, minigrid operators spend a considerable resouces on site
selection [30]. A significant component for site selection is based on customer demand for
electricity service and the expected revenues for the minigrid. Li identified over 10 different
customer types for a single minigrid, ranging from residential households, health centers, and banks
- 18-
[15]. Recent work by the Universal Access Group at MIT has commonly modeled minigrids withup to 28 customer types.
Through targeting villages with specific mixes of customers, minigrid operators can not onlydiversify their revenue stream, but potentially increase the profitability of projects through theproper selection of customers. Additionally, within a single village, minigrid operators may chooseto connect certain profitable customers, but bypass other customers with low ability to pay or lowservice levels. This would mimic the current ad-hoc diesel minigrids that are active in many parts ofrural sub-Saharan African and India.
Realistic modeling of minigrid firm behavior will incorporate this active decision making process inthe customer connection policy of the firm. Adequate policy in the minigrid realm must addressissues that might arise when a private firm decides not to connect a certain customer group.
Reliability
Throughout many emerging economies, unreliable electricity not only promotes substantial usage ofdiesel generation as back-up power, but encourages distrust between the customer and the energysupplier. In India, almost all utilities are seen as mismanaged and corrupt [31]. Nigeria faces similarproblems, with 60 million Nigerians owning back-up diesel generation due to unreliable electricitysupply [32].
In determining the appropriate level of reliability for minigrid systems, firms must weigh the benefitsof reliability against the increase in cost. This analysis become especially difficult as increases inreliability typically correspond to higher willingness to pay from consumers [33]. At some point, theincreased cost for improved reliability will not be offset by the increased customer willingness-to-pay, and the firm will have little incentive to improve reliability beyond this point. The cut-off forreliability is often set based on past experience for operators in the field, but has not been exploredin detail.
Option to Abandon Project
Minigrid operators often cite weak regulation and unclear planning as a major risk for minigridinvestment [34]-[36]. Unclear planning exacerbates a key concern for minigrid developers that themain grid will expand into the operational area of the minigrid [30].
With uncertain revenue streams that may be disrupted by new regulation or grid expansion,investment is often deferred. However, even with deployment of a minigrid in a particular site,managers still retain the option to abandon the project if revenue streams drop below a sustainablelevel. Abandonment may involve stranding the asset, or salvaging the generation equipment andassets for use at another site.
In properly addressing the value of a minigrid investment, developers must account for someprobability that the central grid will arrive and revenue will decrease significantly. This can haveconsiderable effects on design, motivating developers to choose technologies such as diesel, whichhave low investment cost / high operational cost, over other technologies which have highinvestment cost / low operational cost. Analyzing the effect of this uncertainty on system design andinvestment decision is not thoroughly discussed in the case studies below, but the abandonmentoption has real value which should be explored in future research. The value of this option, whichmay be exercised at any point during the life of the project, is significant and should be incorporatedinto any project valuation and investment decision.
- 19 -
Maximizing Firm Value through Optimization
The decision to maximize minigrid firm value is modeled as an optimization problem with free
parameters of customer selection and reliability level. The model assumes the minigrid firm operates
in a relatively competitive market. Consumers in this market have numerous options for energy
service, ranging from kerosene lanterns, solar home systems, solar appliances, and diesel generators.
This gives the firm the ability to decide how much energy is sold, but not the price consumers are
willing to pay for this energy.
A common definition for the profit maximization function is given below as Eq. 1 [37], where TR
represents Total Revenue and TC represents Total Cost
Eq. 4 w = TR - TC
This profit maximization function is often reformulated to be dependent on quantity, with a specific
value, q *, which presents the units of output where profit is maximized. In the general case, the
profits are maximized when the price equals the marginal cost of production [37].
Eq.5 (q)= pq-c(q)
Problem Statement
Eq. 4 can be modified to include the Net Present Value of the firm, broken into components of cost
and revenue:
Eq. 6 NPVf rm = NPVRevenue - NPVcost
This profit maximization function is then reformulated as the objective function for the
optimization problem with the assumption that firms will choose to maximize firm value when
given a range of investment decisions.
Objective Function
The objective function defining the minigrid firm behavior is formulated as Eq. 7.
Eq. 7 min - NPVjirm = NPVCost - N PVRevenue
s.t.
70% < Reliability < 99%
0 < Customer Score < 100
NPVOst is a function of the minigrid design, customer selection, reliability, generation assets, and a
number of other local factors that contribute to system cost. Given the numerous design variables
available for meeting customer demand, this cost calculation is the result of a sub-optimization
which determines the least-cost design given a required customer load, equipment cost, and local
constraints.
This sub-optimization problem is explored in detail in the work of Li and Ellman [14], [15].
- 20 -
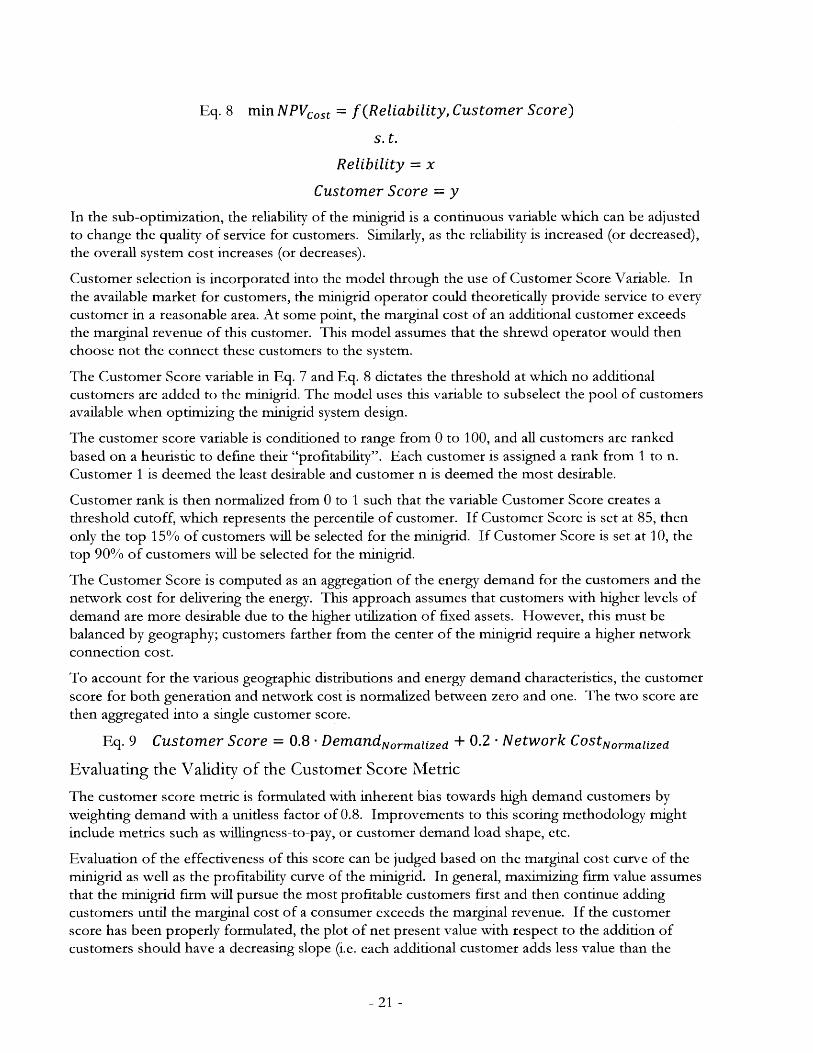
Eq. 8 min NPVcOSt = f (Reliability, Customer Score)
s. t.
Relibility = x
Customer Score = y
In the sub-optimization, the reliability of the minigrid is a continuous variable which can be adjusted
to change the quality of service for customers. Similarly, as the reliability is increased (or decreased),the overall system cost increases (or decreases).
Customer selection is incorporated into the model through the use of Customer Score Variable. In
the available market for customers, the minigrid operator could theoretically provide service to everycustomer in a reasonable area. At some point, the marginal cost of an additional customer exceeds
the marginal revenue of this customer. This model assumes that the shrewd operator would thenchoose not the connect these customers to the system.
The Customer Score variable in Eq. 7 and Eq. 8 dictates the threshold at which no additionalcustomers are added to the minigrid. The model uses this variable to subselect the pool of customersavailable when optimizing the minigrid system design.
The customer score variable is conditioned to range from 0 to 100, and all customers are ranked
based on a heuristic to define their "profitability". Each customer is assigned a rank from 1 to n.Customer 1 is deemed the least desirable and customer n is deemed the most desirable.
Customer rank is then normalized from 0 to 1 such that the variable Customer Score creates athreshold cutoff, which represents the percentile of customer. If Customer Score is set at 85, then
only the top 15% of customers will be selected for the minigrid. If Customer Score is set at 10, thetop 90% of customers will be selected for the minigrid.
The Customer Score is computed as an aggregation of the energy demand for the customers and thenetwork cost for delivering the energy. This approach assumes that customers with higher levels of
demand are more desirable due to the higher utilization of fixed assets. However, this must bebalanced by geography; customers farther from the center of the minigrid require a higher networkconnection cost.
To account for the various geographic distributions and energy demand characteristics, the customer
score for both generation and network cost is normalized between zero and one. The two score arethen aggregated into a single customer score.
Eq. 9 Customer Score = 0.8 - DemandNormalized + 0.2 - Network COStNormalized
Evaluating the Validity of the Customer Score Metric
The customer score metric is formulated with inherent bias towards high demand customers byweighting demand with a unitless factor of 0.8. Improvements to this scoring methodology mightinclude metrics such as willingness-to-pay, or customer demand load shape, etc.
Evaluation of the effectiveness of this score can be judged based on the marginal cost curve of theminigrid as well as the profitability curve of the minigrid. In general, maximizing firm value assumesthat the minigrid firm will pursue the most profitable customers first and then continue addingcustomers until the marginal cost of a consumer exceeds the marginal revenue. If the customerscore has been properly formulated, the plot of net present value with respect to the addition ofcustomers should have a decreasing slope (i.e. each additional customer adds less value than the
- 21 -
previous customer). The weights of 0.8 and 0.2 have been chosen to create these characteristics.The effectiveness of the score will be discussed when evaluating the case studies.
Net Present Value of Revenue
The Net Present Value of the Revenue is based on the customers served by the minigrid(determined through Customer Score) and the reliability of service received by these customers.Customers are only billed for demand which is delivered, and thus as the reliability of the systemincreases, the total number of kilowatt-hours billed also increases. In the below equation, the
NPVRevenue is the sum of revenue for each customer x and then summed for the entire pool ofpotential customers, n.
Eq. 10 NPVRevenue = 1 f,(Reliability, Customer Score)
= [Annual Demands -Reliability -WTPX, Cust Score > Cust Score0, otherwise
Optimization Technique
Sub-optimization
The NPVcost is modified through customer selection and reliability levels but involves a complexsub-optimization to determine the least-cost system for the given criteria.
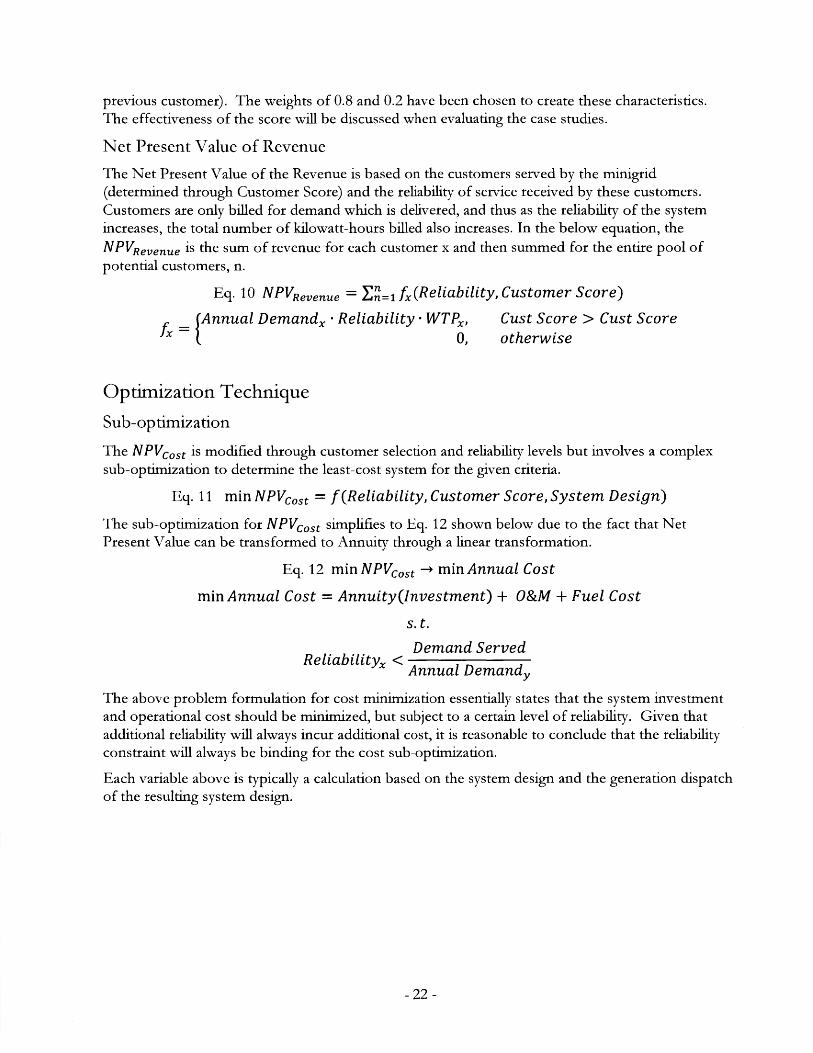
Eq. 11 min NPVcost = f (Reliability, Customer Score, System Design)
The sub-optimization for NPVcost simplifies to Eq. 12 shown below due to the fact that NetPresent Value can be transformed to Annuity through a linear transformation.
Eq. 12 min NPVcst -> min Annual Cost
min Annual Cost = Annuity(Investment) + O&M + Fuel Cost
s. t.
Demand ServedReliabilityx <Annual Demands
The above problem formulation for cost minimization essentially states that the system investmentand operational cost should be minimized, but subject to a certain level of reliability. Given thatadditional reliability will always incur additional cost, it is reasonable to conclude that the reliabilityconstraint will always be binding for the cost sub-optimization.
Each variable above is typically a calculation based on the system design and the generation dispatchof the resulting system design.
- 22 -
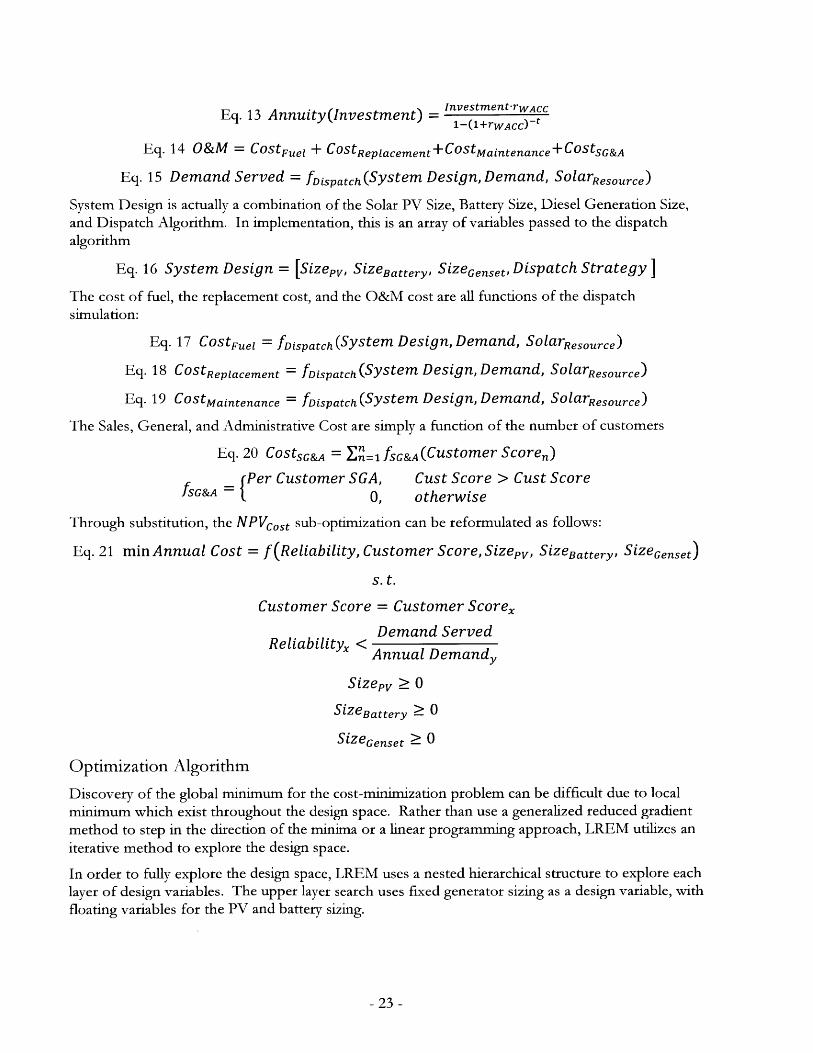
Eq. 13 Annuity(Investment) = Investment-rWACC1-(1+rWAcc)-t
Eq. 14 O&M = COStFuel + COstReplacement+COStMaintenance+COStSG&A
Eq. 15 Demand Served = fDispatch(System Design, Demand, SolarResource)
System Design is actually a combination of the Solar PV Size, Battery Size, Diesel Generation Size,and Dispatch Algorithm. In implementation, this is an array of variables passed to the dispatchalgorithm
Eq. 16 System Design = [Sizepv, SizeBattery, SizeGenset, Dispatch Strategy]
The cost of fuel, the replacement cost, and the O&M cost are all functions of the dispatch
simulation:
Eq. 17 COstFuel = fDispatch (System Design, Demand, SolarResource)
Eq. 18 COStReplacement = fDspatchf(System Design, Demand, SolarResource)
Eq. 19 COstMaintenance = fDispatch (System Design, Demand, SolarResource)
The Sales, General, and Administrative Cost are simply a function of the number of customers
Eq. 20 CoStSG&A = fSG&A (Customer Scoren)
- fPer Customer SGA, Cust Score > Cust ScoreSG&A - 0, otherwise
Through substitution, the NPVc0 st sub-optimization can be reformulated as follows:
Eq. 21 min Annual Cost = f(Reliability, Customer Score, Sizepv, SizeBattery, SizeGenset)
s. t.
Customer Score = Customer Scorer
Demand Served
Reliabilityx <Annual Demandy
Sizepv 0
SizeBattery > 0
SizeGenset 0
Optimization Algorithm
Discovery of the global minimum for the cost-minimization problem can be difficult due to local
minimum which exist throughout the design space. Rather than use a generalized reduced gradient
method to step in the direction of the minima or a linear programming approach, LREM utilizes an
iterative method to explore the design space.
In order to fully explore the design space, LREM uses a nested hierarchical structure to explore each
layer of design variables. The upper layer search uses fixed generator sizing as a design variable, with
floating variables for the PV and battery sizing.
- 23 -
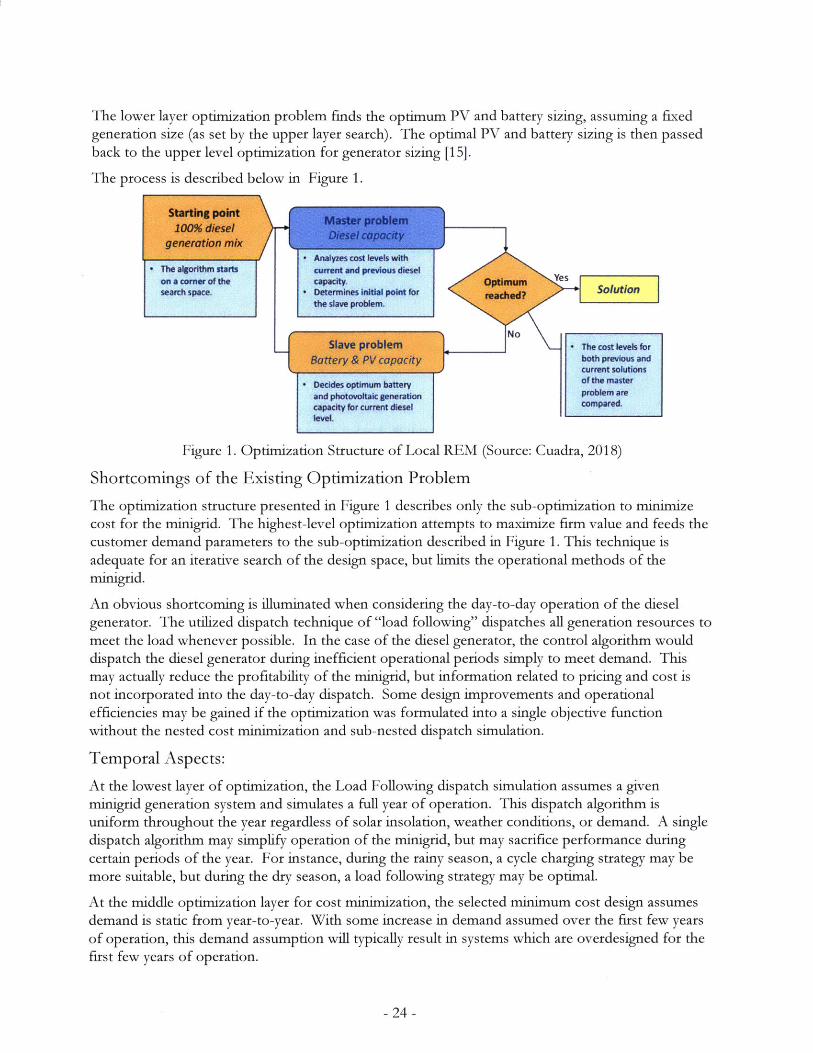
The lower layer optimization problem finds the optimum PV and battery sizing, assuming a fixedgeneration size (as set by the upper layer search). The optimal PV and battery sizing is then passedback to the upper level optimization for generator sizing [15].
The process is described below in Figure 1.
Starting point Master problem100% diesel Maester poble y
generation mixAnalyzes cost levels with
The algorithm starts current and previous dieselon a corner of the capacity. ptMUM ssearch space. Determines initial point for reached? $olution
the slave problem.
Slave problem The cost levels forBattery & PV capacity both previous and
current solutionsDecides optimum battery of the masterand photovoltaic generation problem arecapacity for current diesel compared.level.
Figure 1. Optimization Structure of Local REM (Source: Cuadra, 2018)
Shortcomings of the Existing Optimization Problem
The optimization structure presented in Figure 1 describes only the sub-optimization to minimizecost for the minigrid. The highest-level optimization attempts to maximize firm value and feeds the
customer demand parameters to the sub-optimization described in Figure 1. This technique is
adequate for an iterative search of the design space, but limits the operational methods of the
minigrid.
An obvious shortcoming is illuminated when considering the day-to-day operation of the diesel
generator. The utilized dispatch technique of "load following" dispatches all generation resources to
meet the load whenever possible. In the case of the diesel generator, the control algorithm would
dispatch the diesel generator during inefficient operational periods simply to meet demand. Thismay actually reduce the profitability of the minigrid, but information related to pricing and cost isnot incorporated into the day-to-day dispatch. Some design improvements and operational
efficiencies may be gained if the optimization was formulated into a single objective function
without the nested cost minimization and sub-nested dispatch simulation.
Temporal Aspects:
At the lowest layer of optimization, the Load Following dispatch simulation assumes a given
minigrid generation system and simulates a full year of operation. This dispatch algorithm isuniform throughout the year regardless of solar insolation, weather conditions, or demand. A single
dispatch algorithm may simplify operation of the minigrid, but may sacrifice performance during
certain periods of the year. For instance, during the rainy season, a cycle charging strategy may be
more suitable, but during the dry season, a load following strategy may be optimal.
At the middle optimization layer for cost minimization, the selected minimum cost design assumes
demand is static from year-to-year. With some increase in demand assumed over the first few years
of operation, this demand assumption will typically result in systems which are overdesigned for the
first few years of operation.
- 24 -
From an engineering perspective, over-estimation of demand provides a margin of safety, but doesincrease cost. Because battery and diesel replacement must take place every 3-7 years, an iterativedesign process may provide significant cost savings. An optimization which accounts for year-to-year fluctuations in demand may produce system designs in year 1 and 2 which are significantlydifferent from the system design required in year 20.
Discount Rates for Optimization: Real and Nominal Rates
When selecting the discount rate for the optimization, aside from the importance of selecting a ratewhich properly incorporates the investor perception of risk, the rate must properly correspond tothe incoming and outgoing cash flow of the project. The annuity calculation shown in Eq. 13assumes that the cost incurred every few years year for battery, ICE, or PV replacement does notincrease. In reality, inflation is a significant factor which causes the prices of fuel, operation, andcapital expenditures to increase each year.
For the purposes of optimization, the nominal discount rate provided by the CAPM and WACCmust be converted to a real discount rate. This complicates the calculation of non-annual annuities,which must properly incorporate the growth rates due to inflation. An accurate calculation of thereal discount rate for annuities is shown in Eq. 22. Although this calculation will not hold forperiodic investment occurring at 3 years, 5 years, or 25 years, it will be suitable for the purpose ofoptimization.
Eq. 22 (1 + rnominal) = (1 + rreal) - (1 + rinflation)
(1 + rnominal)
(i + rinflation)
Annuity Minimization vs Net Present Value Minimization
The optimization structure which maximizes the net present value as an annuity is appropriate for aproject which extends indefinitely, but many minigrid projects anticipate incorporation into thenational grid at a later date.
There is some difference in project valuation if the minigrid project is assumed to terminate after 25years or continue indefinitely. However, any cash flows in year 20 or beyond are so heavilydiscounted that they cannot be assumed to create any significant changes in cost for the purposes ofoptimization. However, if the minigrid operator only plans to operate a minigrid for 10 years, thedifference in design between a 10-year project and an indefinite project could be significant.
- 25 -

Case Studies For Minigrid Firm Behavior
Purpose of Case StudiesThese case studies of three minigrid markets attempt to anticipate how investors may design andimplement minigrid projects. The use of the optimization structure described previously allows forexploration of issues related to reliability and customer selection.
Throughout these case studies, the sensitivity of project valuation to parameters such as renewableenergy standards and discount rate will be evaluated.
The three case studies examine ninigrid project in Northern Nigeria, Rwanda, and Bihar, India.
Renewable Energy Requirements for Case Studies
For each of the case studies presented below, the generation design is constrained to maintain 60%renewable energy. This choice of constraint derives from government preferences to supportrenewable energy such as solar photovoltaics but still allows for some diesel generation.
This constraint results in interesting designs in which the diesel generator is not fully utilizedthroughout the year. With the Load Following algorithm selected for these case studies, the dieselgenerator is typically only used during evening hours when the battery capacity reaches the minimumallowable state of charge. However, due to the minimum renewable energy threshold, excess dieselcapacity is typically available, resulting in minigrid designs which always maintain high levels ofreliability.
Nigeria Minigrid Case Study:
Introduction
The urban electrification rate of Nigeria is 86%, but the rural electrification rate is 28% [1]. Toaddress the low electrification rates in Nigeria, the Rural Electrification Agency plans to develop10,000 minigrids throughout Nigeria by 2023 [38].
The Universal Access Group at MIT is currently working with the Rural Electrification Agency ofthe Government of Nigeria in order to assess the viability and cost of these systems in rural Nigeria.An accurate assessment of the behavior of these firms is crucial to understanding the effectivedesign of policy for these systems.
Village Demand Characteristics
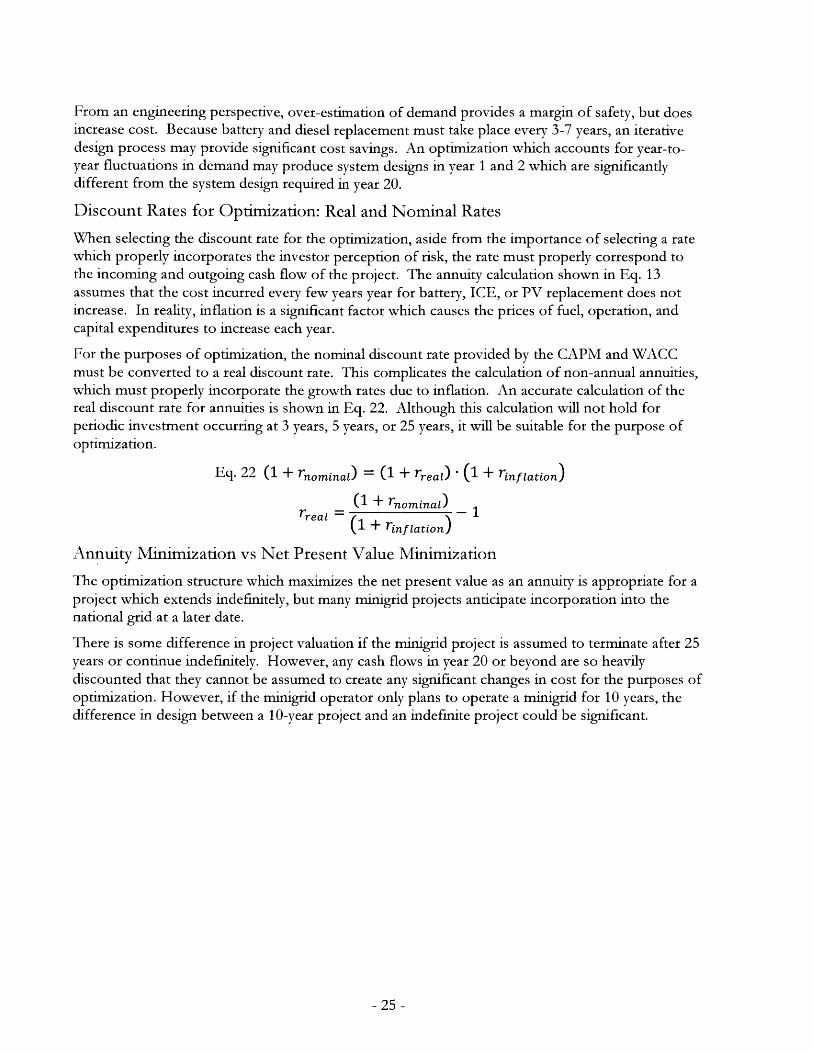
The Nigerian Village used in this case study is a mix of industrial, commercial, and residentialcustomers. Table 1 below describes the characteristics of each customer type.
- 26 -
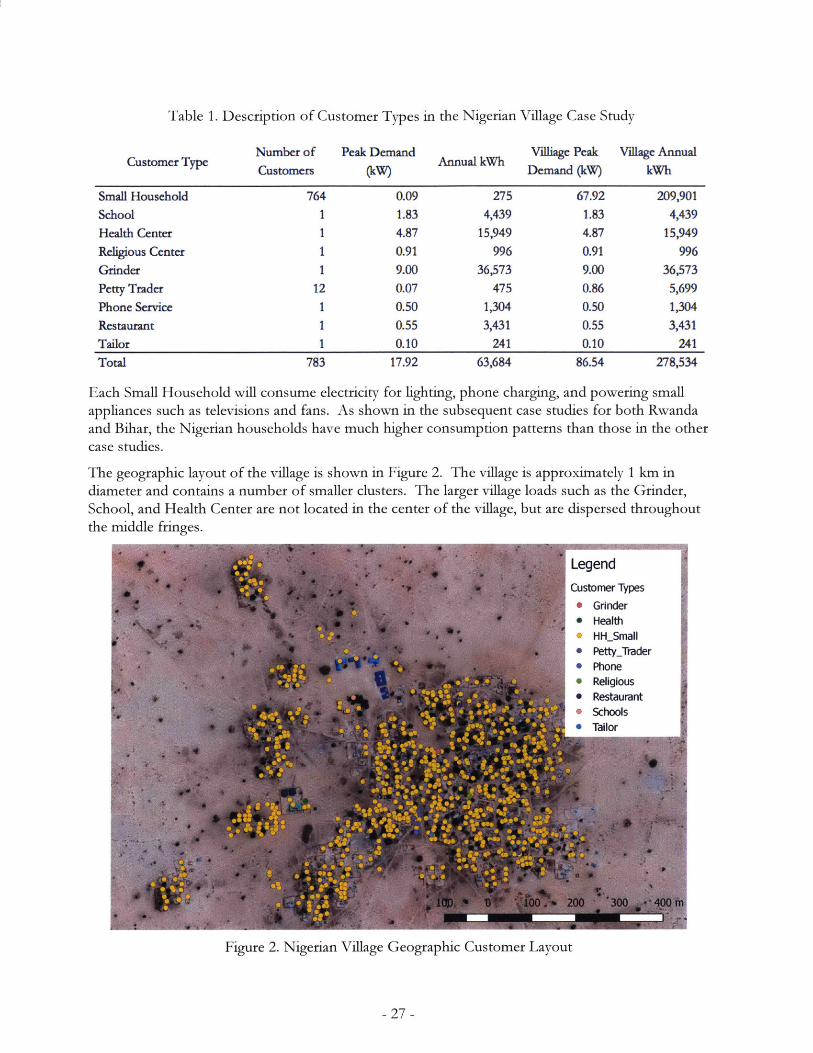
Table 1. Description of Customer Types in the Nigerian Village Case Study
Customer TypeNumber of Peak DemandCustomers (kW)
Villiage PeakAnnual kWh Demand (kW)
Village AnnualkWh
Small Household 764 0.09 275 67.92 209,901School 1 1.83 4,439 1.83 4,439
Health Center 1 4.87 15,949 4.87 15,949
Religious Center 1 0.91 996 0.91 996Grinder 1 9.00 36,573 9.00 36,573Petty Trader 12 0.07 475 0.86 5,699Phone Service 1 0.50 1,304 0.50 1,304
Restaurant 1 0.55 3,431 0.55 3,431
Tailor 1 0.10 241 0.10 241
Total 783 17.92 63,684 86.54 278,534
Each Small Household will consume electricity for lighting, phone charging, and powering smallappliances such as televisions and fans. As shown in the subsequent case studies for both Rwandaand Bihar, the Nigerian households have much higher consumption patterns than those in the other
case studies.
The geographic layout of the village is shown in Figure 2. The village is approximately 1 km in
diameter and contains a number of smaller clusters. The larger village loads such as the Grinder,School, and Health Center are not located in the center of the village, but are dispersed throughoutthe middle fringes.
Figure 2. Nigerian Village
16% 1 U %100. 200 300
Geographic Customer Layout
27 -
A
Village Ability to Pay
The Government of Nigeria Rural Electrification Agency reports that consumers in Nigeria typicallypay approximately $0.40 / kWh for diesel generation. This model assumes this is the upper limit forlarger commercial and industrial consumers given the alternative of diesel generation. The ability topay of rural households may be above $0.40 / kWh for very low levels of consumption. However,at the levels of consumption shown in Table 1, $0.40 / kWh corresponds to approximately $9 permonth. The initial tariff for the profit maximization model throughout the village in a free-marketscenario is set at $0.40 / kWh.
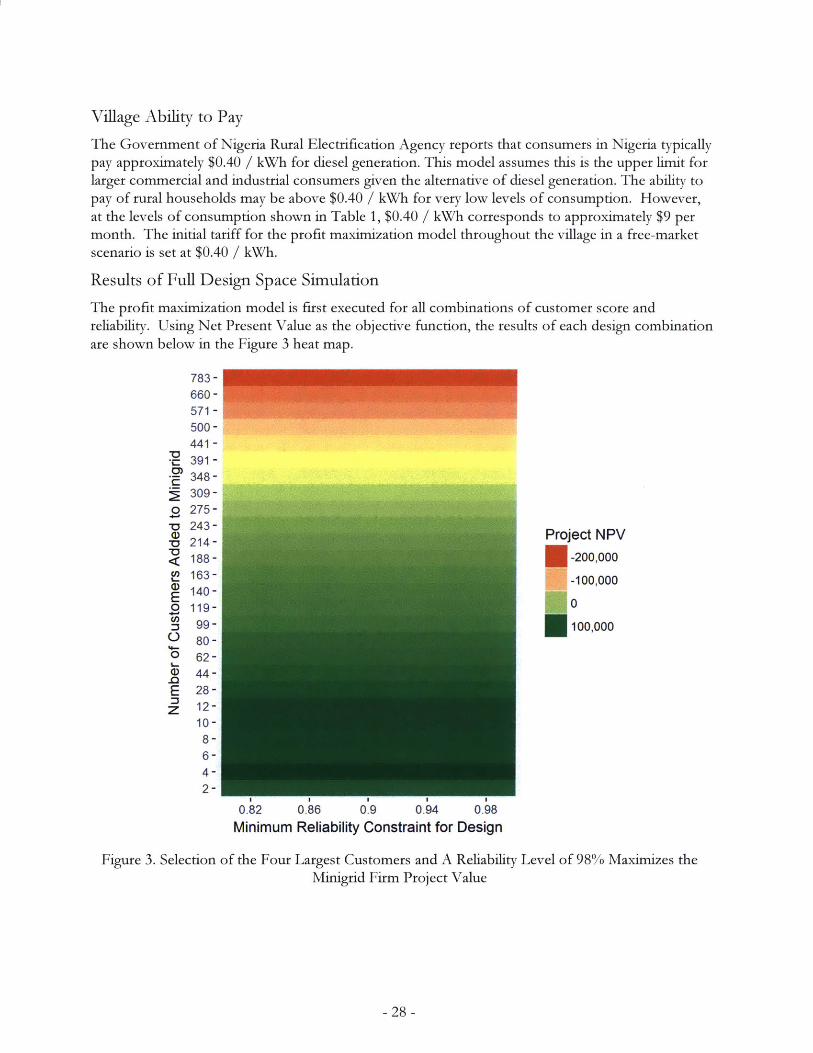
Results of Full Design Space Simulation
The profit maximization model is first executed for all combinations of customer score andreliability. Using Net Present Value as the objective function, the results of each design combinationare shown below in the Figure 3 heat map.
Project NPV-200,000
-100,000
0
E100,000
0.82 0.86 0.9 0.94 0.98Minimum Reliability Constraint for Design
Figure 3. Selection of the Four Largest Customers and A Reliability Level of 98% Maximizes theMinigrid Firm Project Value
- 28 -
-D0)
(DE0
0
C,
E
03Z~
783 -660 -571 -500 -441 -391 -348-309-275-243-214-188-163-140 -119-
99-80-62-44-28-12-10-8-6-4-2-
100,000 -
0-
0.z
E. -100,000-
-200,000 -
0 200 400 600Number of Customers Added to Minigrid
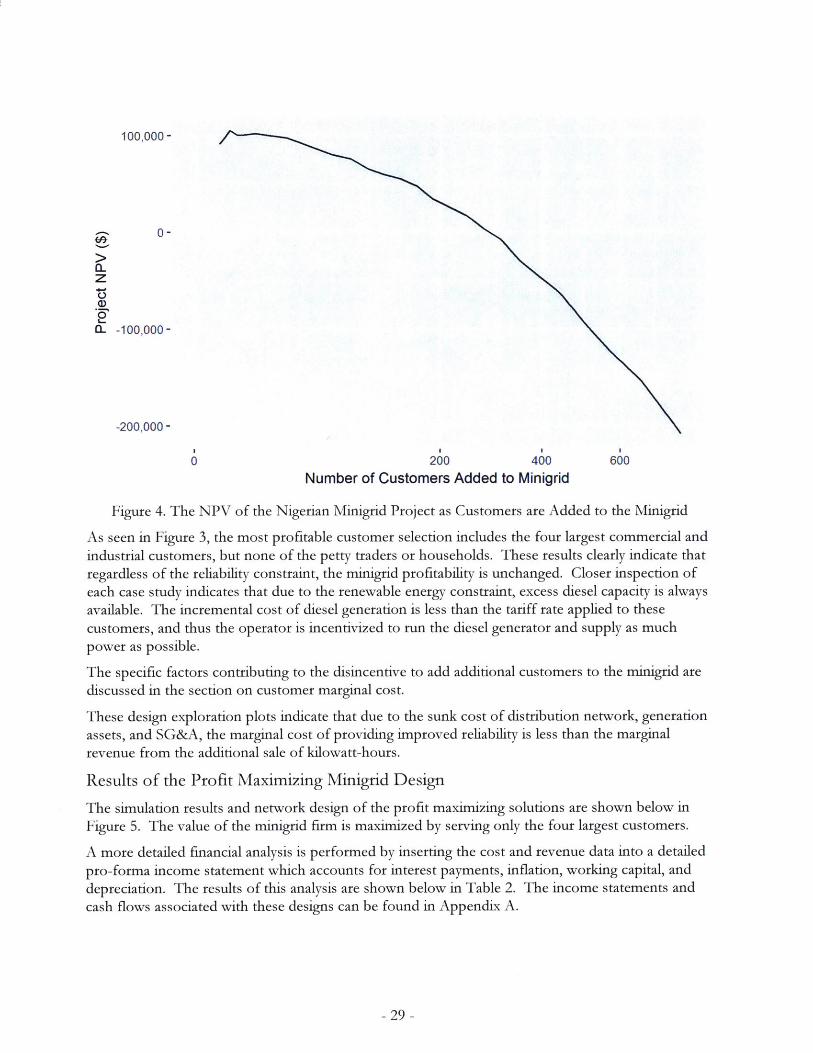
Figure 4. The NPV of the Nigerian Minigrid Project as Customers are Added to the Minigrid
As seen in Figure 3, the most profitable customer selection includes the four largest commercial andindustrial customers, but none of the petty traders or households. These results clearly indicate thatregardless of the reliability constraint, the minigrid profitability is unchanged. Closer inspection ofeach case study indicates that due to the renewable energy constraint, excess diesel capacity is alwaysavailable. The incremental cost of diesel generation is less than the tariff rate applied to thesecustomers, and thus the operator is incentivized to run the diesel generator and supply as muchpower as possible.
The specific factors contributing to the disincentive to add additional customers to the minigrid arediscussed in the section on customer marginal cost.
These design exploration plots indicate that due to the sunk cost of distribution network, generationassets, and SG&A, the marginal cost of providing improved reliability is less than the marginalrevenue from the additional sale of kilowatt-hours.
Results of the Profit Maximizing Minigrid Design
The simulation results and network design of the profit maximizing solutions are shown below inFigure 5. The value of the minigrid firm is maximized by serving only the four largest customers.
A more detailed financial analysis is performed by inserting the cost and revenue data into a detailedpro-forma income statement which accounts for interest payments, inflation, working capital, anddepreciation. The results of this analysis are shown below in Table 2. The income statements andcash flows associated with these designs can be found in Appendix A.
- 29 -
Legend* - *Customer Types
* 0 Grinder- 44Health
- Restaurant* Schools
A Generation7 LV Distribution
4
0 ~ 100. 200 30 ,400 m
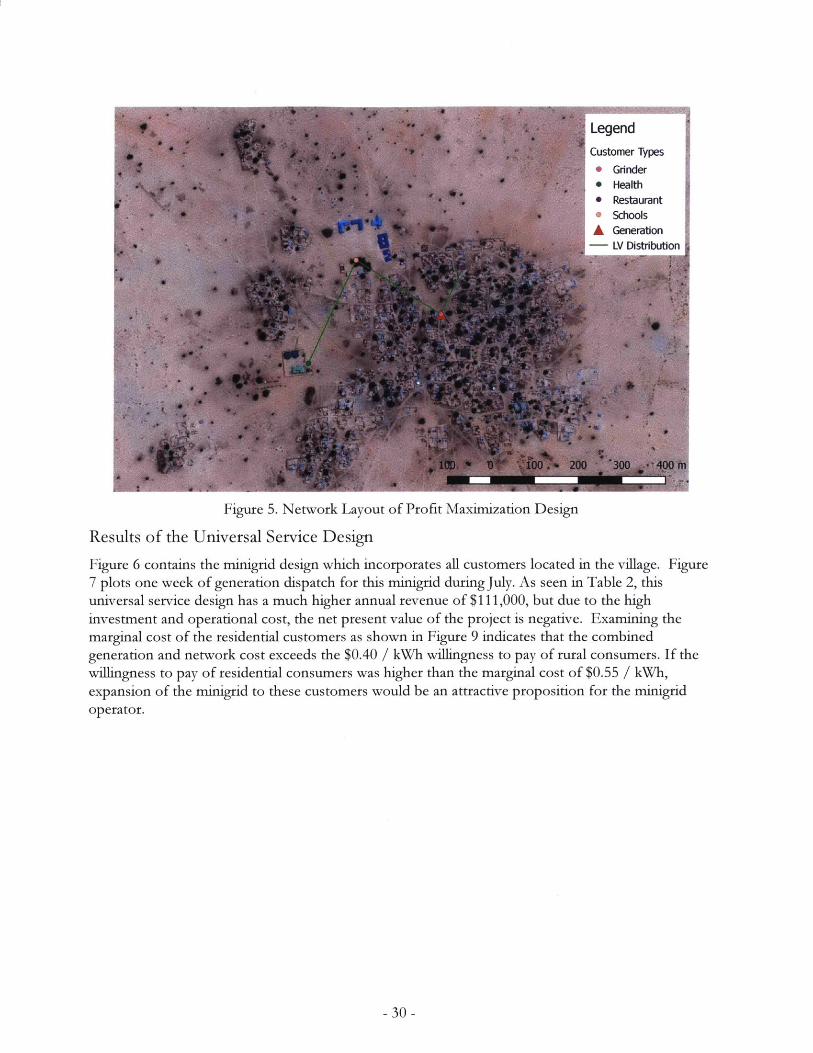
Figure 5. Network Layout of Profit Maximization Design
Results of the Universal Service Design
Figure 6 contains the minigrid design which incorporates all customers located in the village. Figure7 plots one week of generation dispatch for this minigrid during July. As seen in Table 2, thisumiversal service design has a much higher annual revenue of $111,000, but due to the highinvestment and operational cost, the net present value of the project is negative. Examining themarginal cost of the residential customers as shown in Figure 9 indicates that the combined
generation and network cost exceeds the $0.40 / kWh willingness to pay of rural consumers. If thewillingness to pay of residential consumers was higher than the marginal cost of $0.55 / kWh,expansion of the minigrid to these customers would be an attractive proposition for the minigridoperator.
- 30 -
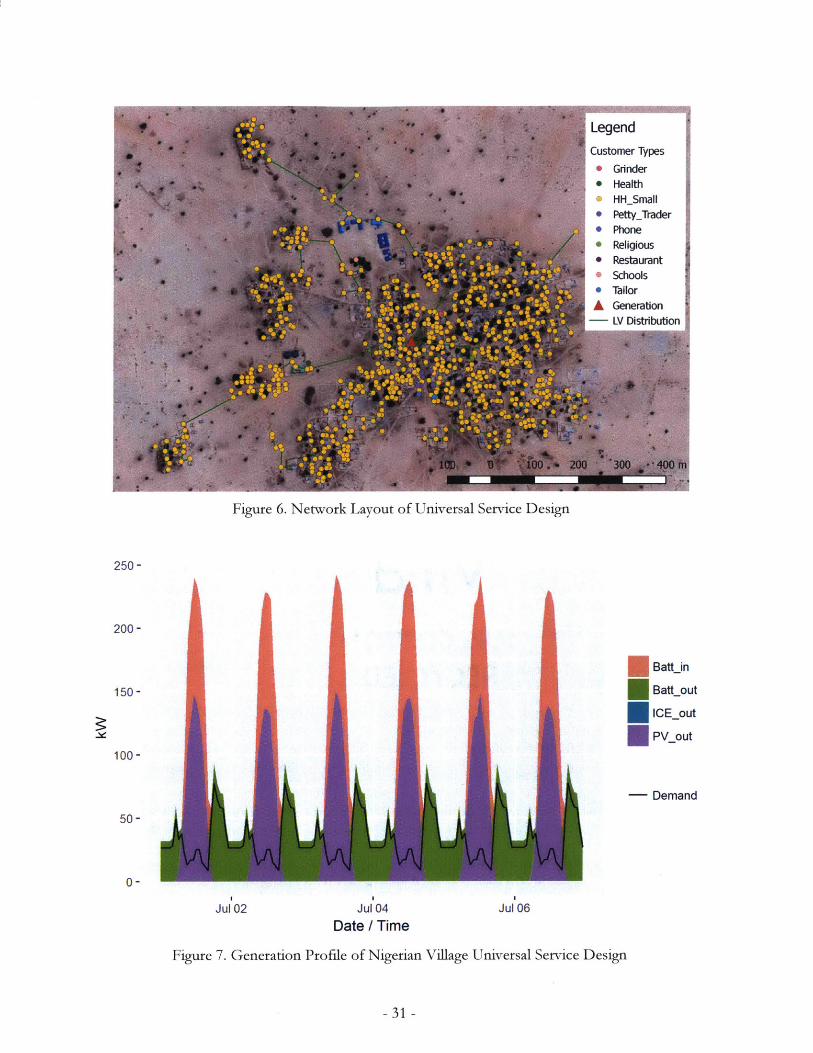
Figure 6. Network Layout of Universal Service Design
250-
I200 -
150-
100-
NAJul 02
- Demand
LAJul 04
Date / TimeJul 06
Figure 7. Generation Profile of Nigerian Village Universal Service Design
- 31 -
50-
UUUU
Battin
Baltout
ICEout
PVout
-. j
0-
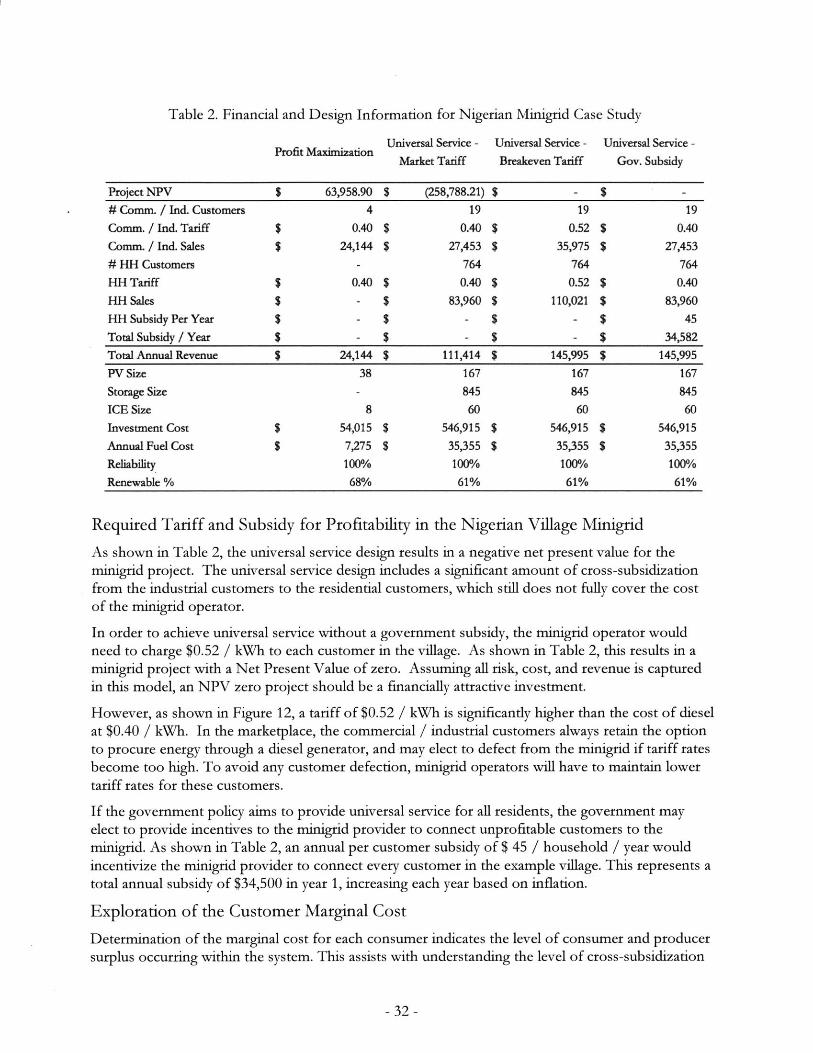
Table 2. Financial and Design Information for Nigerian Minigrid Case Study
Profit MaximizationUniversal Service -
Market Tariff
Universal Service -
Breakeven Tariff
Universal Service -
Gov. Subsidy
Project NPV $ 63,958.90 $ (258,788.21) $ - $ -# Comm. / Ind. Customers 4 19 19 19
Comm. / Ind. Tariff $ 0.40 $ 0.40 $ 0.52 $ 0.40
Comm. / Ind. Sales $ 24,144 $ 27,453 $ 35,975 $ 27,453
# HH Customers - 764 764 764
HH Tariff $ 0.40 $ 0.40 $ 0.52 $ 0.40
HH Sales $ - $ 83,960 $ 110,021 $ 83,960
HH Subsidy Per Year $ - $ - $ - $ 45
Total Subsidy / Year $ - $ - $ - $ 34,582
Total Annual Revenue $ 24,144 $ 111,414 $ 145,995 $ 145,995
PV Size 38 167 167 167
Storage Size - 845 845 845
ICE Size 8 60 60 60
Investment Cost $ 54,015 $ 546,915 $ 546,915 $ 546,915
Annual Fuel Cost $ 7,275 $ 35,355 $ 35,355 $ 35,355
Reliability 1000/0 1000/ 1000/ 1000/
Renewable % 68% 61% 61% 61%
Required Tariff and Subsidy for Profitability in the Nigerian Village Minigrid
As shown in Table 2, the universal service design results in a negative net present value for theminigrid project. The universal service design includes a significant amount of cross-subsidizationfrom the industrial customers to the residential customers, which still does not fully cover the costof the minigrid operator.
In order to achieve universal service without a government subsidy, the minigrid operator wouldneed to charge $0.52 / kWh to each customer in the village. As shown in Table 2, this results in aminigrid project with a Net Present Value of zero. Assuming all risk, cost, and revenue is capturedin this model, an NPV zero project should be a financially attractive investment.
However, as shown in Figure 12, a tariff of $0.52 / kWh is significantly higher than the cost of dieselat $0.40 / kWh. In the marketplace, the commercial / industrial customers always retain the optionto procure energy through a diesel generator, and may elect to defect from the minigrid if tariff ratesbecome too high. To avoid any customer defection, minigrid operators will have to maintain lowertariff rates for these customers.
If the government policy aims to provide universal service for all residents, the government mayelect to provide incentives to the minigrid provider to connect unprofitable customers to theminigrid. As shown in Table 2, an annual per customer subsidy of $ 45 / household / year wouldincentivize the minigrid provider to connect every customer in the example village. This represents atotal annual subsidy of $34,500 in year 1, increasing each year based on inflation.
Exploration of the Customer Marginal Cost
Determination of the marginal cost for each consumer indicates the level of consumer and producersurplus occurring within the system. This assists with understanding the level of cross-subsidization
- 32 -

which is occurring throughout the village and the threshold at which minigrid firms are no longerincentivized to connect consumers.
Figure 8 colors each customer according to the marginal cost of connecting the particular consumerto the minigrid.
Legend
* Marginal Cost ($/kWh)
9 0.213 - 0.250* 0.250 - 0.300
- 0.300 - 0.3500.350 - 0.4000.400 - 0.4500.450 - 0.5000.500 - 0.5500.550 - 0.582
44-V
1 100. 200 300 400 m
Figure 8. Marginal Cost of Service for Nigerian Village Customers
From this figure, the lowest cost customers are quickly identified as the commercial customers
(green) and are also found in the Figure 5 profit maximization design. Apart from the large
commercial customers, the least expensive customers are found in the center of the village and then
radiate outwards in bands. As expected from a physical constraints of network design, the higher
marginal cost customers are located on the fringes of the village.
The banding effect seen as customer are added to the minigrid is due to the discrete sizing of the
diesel generators. The increased marginal cost of generation occurs when the generator is increased
in size to meet load. This results in ample capacity but a necessity to operate at lower efficiencies.
Figure 9 indicates that the marginal cost of adding additional customers to the minigrid is driven
primarily by the generation cost of energy. The network cost for each additional customer does not
appear to rise above $0.10 / kWh due to the density of the village and the relatively high
consumption per household.
Figure 10 and Figure 11 plot the details of the generation technology as customers are added to the
minigrid design. As expected, the marginal cost of diesel generation tends to decrease as greater
efficiencies are seen with larger generators, but the marginal cost of solar PV and battery remains
relatively flat. Figure 11 also clearly indicates that the large commercial and industrial customers are
the least expensive due to the daytime load and reliance on solar PV and diesel generation for all
required power.
- 33 -

iv0 200 400 600
Number of Customers Added to Minigrid
Figure 9. Marginal Cost Breakdown for Village Consumers in Nigerian Village Minigrid
PV
Battery
ICE
0 200 400 600Number of Customers Added to Minigrid
Figure 10. Marginal Cost Breakdown of Generation in Nigerian Village Minigrid
300
- 34-
0.6-
0.4-
E0CO)
0.2-
0.0-
Generation
Network
SG&A
Total
0.0750.0500.0250.000
0.3
0.2
0.1
0.0'
0.4
0.3
0.2
0.1~
E)0
c
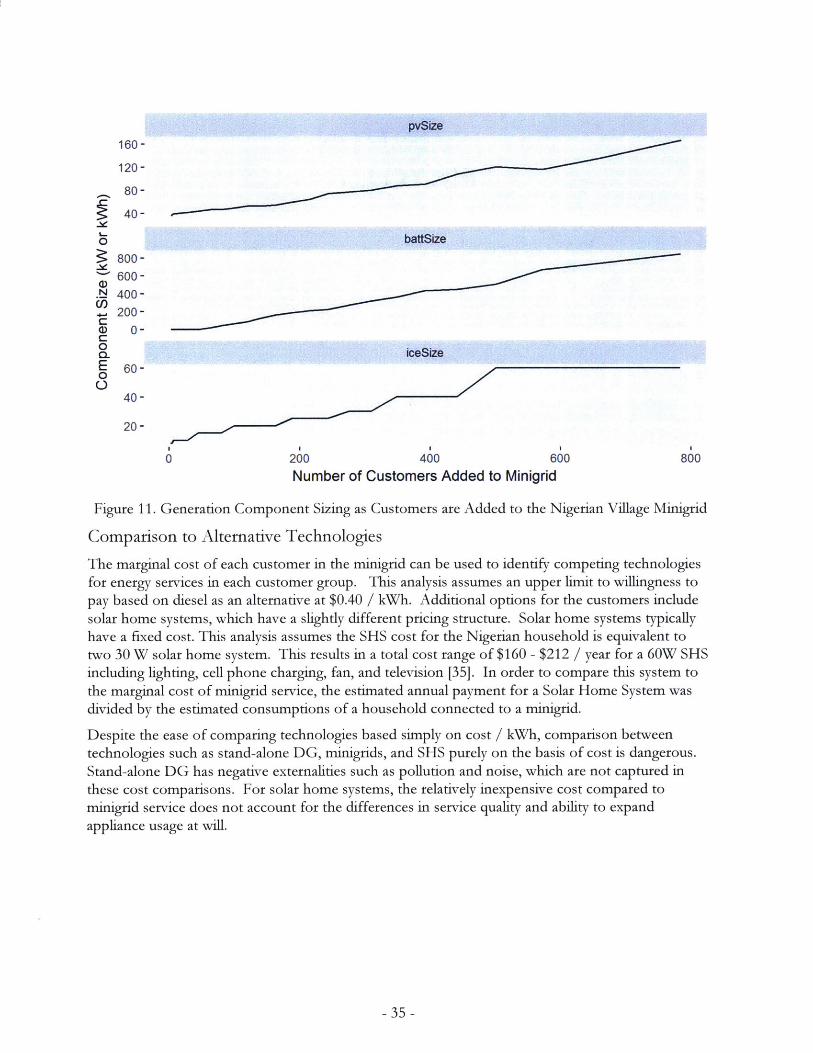
~1
pvSize160-
120-
80-
~40-0 battSize
i> 800-E 600-U~ 400-
. 200-
) 0-0
E 60-0
40-
20-
0 200 400 600 800Number of Customers Added to Minigrid
Figure 11. Generation Component Sizing as Customers are Added to the Nigerian Village Minigrid
Comparison to Alternative Technologies
The marginal cost of each customer in the minigrid can be used to identify competing technologies
for energy services in each customer group. This analysis assumes an upper limit to willingness to
pay based on diesel as an alternative at $0.40 / kWh. Additional options for the customers include
solar home systems, which have a slightly different pricing structure. Solar home systems typicallyhave a fixed cost. This analysis assumes the SHS cost for the Nigerian household is equivalent to
two 30 W solar home system. This results in a total cost range of $160 - $212 / year for a 60W SHSincluding lighting, cell phone charging, fan, and television [35]. In order to compare this system to
the marginal cost of minigrid service, the estimated annual payment for a Solar Home System was
divided by the estimated consumptions of a household connected to a minigrid.
Despite the ease of comparing technologies based simply on cost / kWh, comparison between
technologies such as stand-alone DG, minigrids, and SHS purely on the basis of cost is dangerous.
Stand-alone DG has negative externalities such as pollution and noise, which are not captured in
these cost comparisons. For solar home systems, the relatively inexpensive cost compared to
minigrid service does not account for the differences in service quality and ability to expand
appliance usage at will.
- 35 -
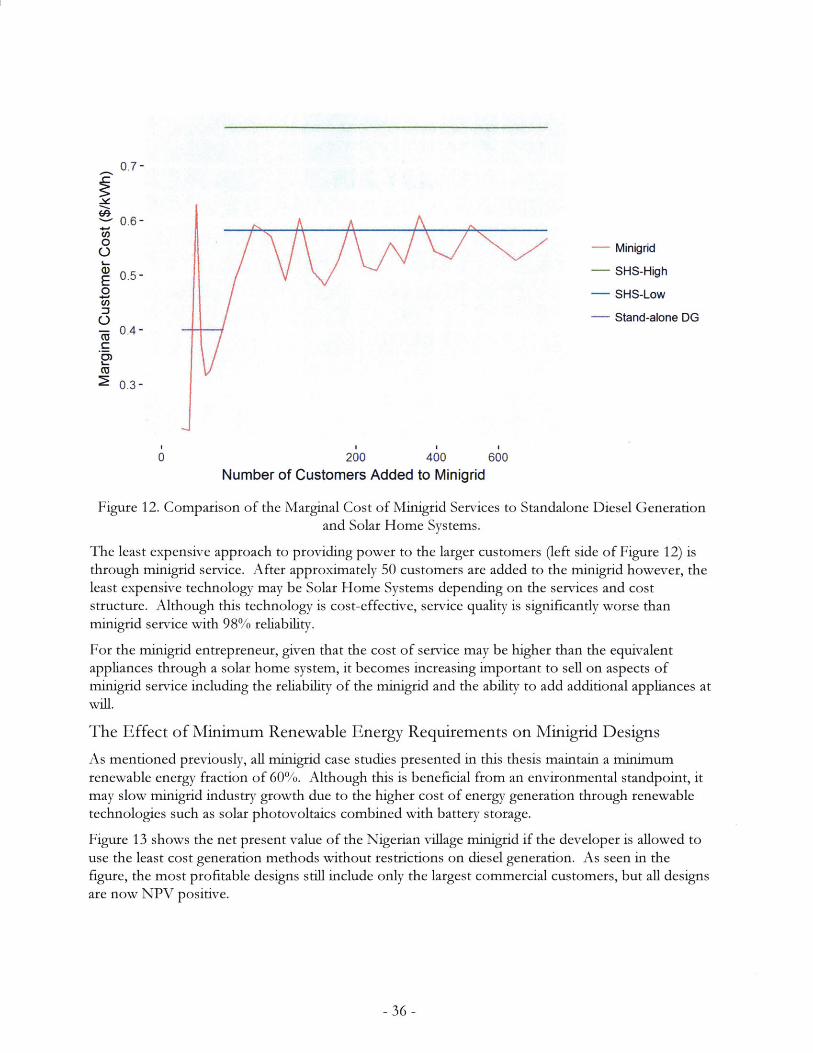
0.7-
ft'2 0.6-.0-0 I A A AA0-- Minigrid
D0.5-- SHS-High
05-- SHS-Low
- Stand-alone DG0.4-
CU
0.3-
0 200 400 600Number of Customers Added to Minigrd
Figure 12. Comparison of the Marginal Cost of Minigrid Services to Standalone Diesel Generation
and Solar Home Systems.
The least expensive approach to providing power to the larger customers (left side of Figure 12) is
through minigrid service. After approximately 50 customers are added to the minigrid however, the
least expensive technology may be Solar Home Systems depending on the services and cost
structure. Although this technology is cost-effective, service quality is significantly worse than
minigrid service with 98% reliability.
For the minigrid entrepreneur, given that the cost of service may be higher than the equivalent
appliances through a solar home system, it becomes increasing important to sell on aspects of
minigrid service including the reliability of the minigrid and the ability to add additional appliances at
will.
The Effect of Minimum Renewable Energy Requirements on Minigrid Designs
As mentioned previously, all minigrid case studies presented in this thesis maintain a minimum
renewable energy fraction of 6 0%. Although this is beneficial from an environmental standpoint, it
may slow minigrid industry growth due to the higher cost of energy generation through renewable
technologies such as solar photovoltaics combined with battery storage.
Figure 13 shows the net present value of the Nigerian village minigrid if the developer is allowed to
use the least cost generation methods without restrictions on diesel generation. As seen in the
figure, the most profitable designs still include only the largest commercial customers, but all designs
are now NPV positive.
- 36 -
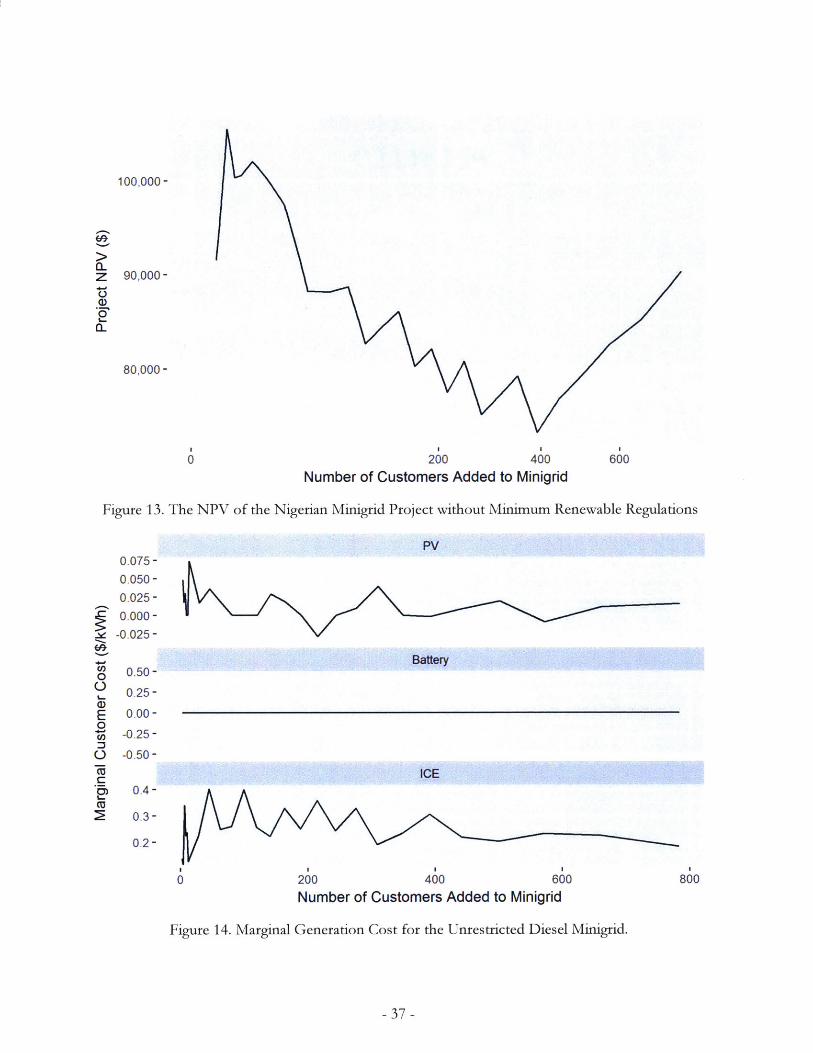
100,000-
0.z 90,000-
()
I.-
80,000 -
0 200 400 600Number of Customers Added to Minigrid
Figure 13. The NPV of the Nigerian Minigrid Project without Minimum Renewable Regulations
0.075-0.050-0.025-0.000-
-0.025 -
0.50-
0.25-
0.00-
-0.25-
-0.50-
0.4 -
0.3-
0.2-
PV
Batteiy
ICE
0 200 400 600
Figure 14. Marginal
800Number of Customers Added to Minigrid
Generation Cost for the Unrestricted Diesel Minigrid.
- 37 -
0
0
C
Cu
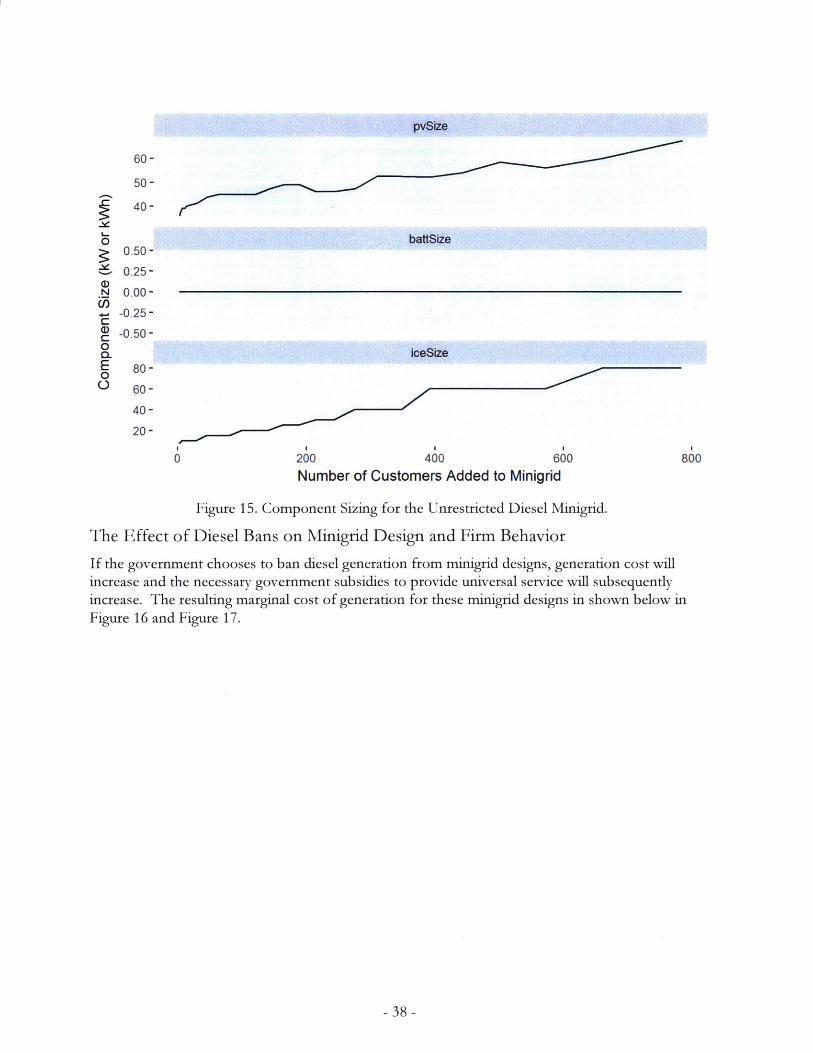
pvSize
60-
50-
40-
0 - battSize0.50-0.25-
a)N 0.00-(/).- -0.25-C
0.
E 80-00 60-
40-
20-
0 200 400 600 800Number of Customers Added to Minigrid
Figure 15. Component Sizing for the Unrestricted Diesel Minigrid.
The Effect of Diesel Bans on Minigrid Design and Firm Behavior
If the government chooses to ban diesel generation from minigrid designs, generation cost will
increase and the necessary government subsidies to provide universal service will subsequently
increase. The resulting marginal cost of generation for these minigrid designs in shown below in
Figure 16 and Figure 17.
- 38 -
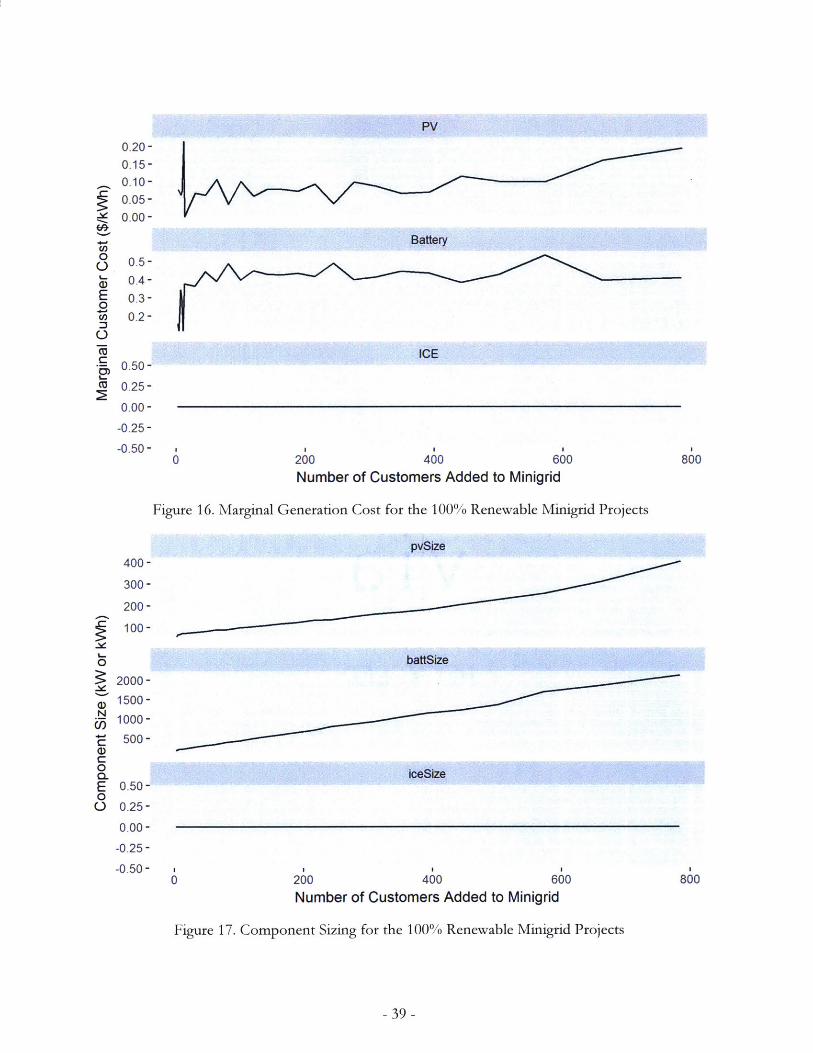
PV
0.20-0.15-0.10-0.05-0.00-
Battery
0.5-0.4-0.3-0.2-
0.50-
0.25-
0.00-
-0.25-
-0.50-0 200
ICE
400 600Number of Customers Added to Minigrid
Figure 16. Marginal Generation Cost for the 100% Renewable Minigrid Projects
pvSize400-
300 -
200 -
100-
2000 -
1500-
1000-
500-
0.50-
0.25-
0.00-
-0.25-
-0.50-
battSize
iceSize
0 200 400 600Number of Customers Added to Minigrid
Figure 17. Component Sizing for the 100% Renewable Minigrid Projects
- 39 -
6.6-
0a)
E0.1--
C--
(U2>
800
L-0
N
C)a)C0CLE0U
800
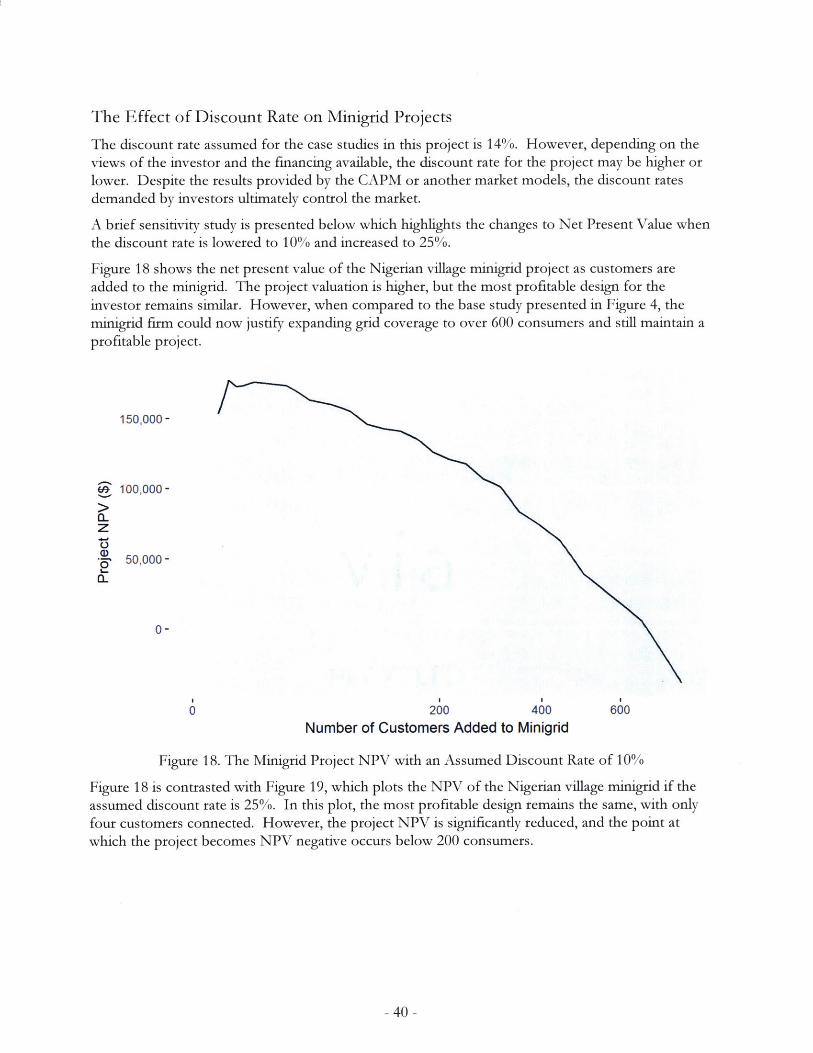
The Effect of Discount Rate on Minigrid Projects
The discount rate assumed for the case studies in this project is 14%. However, depending on theviews of the investor and the financing available, the discount rate for the project may be higher orlower. Despite the results provided by the CAPM or another market models, the discount ratesdemanded by investors ultimately control the market.
A brief sensitivity study is presented below which highlights the changes to Net Present Value whenthe discount rate is lowered to 10% and increased to 25%.
Figure 18 shows the net present value of the Nigerian village minigrid project as customers areadded to the minigrid. The project valuation is higher, but the most profitable design for theinvestor remains similar. However, when compared to the base study presented in Figure 4, theminigrid firm could now justify expanding grid coverage to over 600 consumers and still maintain aprofitable project.
150,000 -
100,000 -
z
-, 50,000-1.2'
0-
0 200 400Number of Customers Added to Minigrid
600
Figure 18. The Minigrid Project NPV with an Assumed Discount Rate of 10%
Figure 18 is contrasted with Figure 19, which plots the NPV of the Nigerian village minigrid if theassumed discount rate is 25%. In this plot, the most profitable design remains the same, with onlyfour customers connected. However, the project NPV is significantly reduced, and the point atwhich the project becomes NPV negative occurs below 200 consumers.
- 40 -

0-
> -100,000-a-z
0- -200,000-
-300,000 -
0 200 400Number of Customers Added to Minigrid
600
Figure 19. The Minigrid Project NPV with an Assumed Discount Rate of 25%
Rwanda Minigrid Case Study:
Introduction
The current electrification rate in Rwanda is 72% for urban areas, but only 12% for rural areas [1].A number of minigrid entrepreneurs have built projects in these areas, the most widespread beingthose of MeshPower [39].
Throughout 2017 and 2018, the Universal Access Group at MIT has been working with theGovernment of Rwanda and the Rwanda Energy Group Limited (REG) to develop a masterelectrification plan for the country. Minigrids are a significant component of this plan, providingservice for villages in areas beyond the reach of the national grid.
Village Demand Characteristics
The village selected for this case study contains 402 residential customers and 15 commercial
customers. The proposed minigrid site would include each of these customers and provideelectricity service for the next 25 years.
The residential households in this village have a lower consumption pattern than the households inthe Nigerian village. Each household is assumed to own two 5 W LED lights and one 5 W phonecharger. These appliances are used primarily at night and rarely during the day. The annualconsumption for these customers is 57 kWh, which is approximately 1/ 5th the consumption of theaverage household in the Nigerian village.
The businesses in the village range from welding shops, hair salons, restaurants/bars, tailors, to foodstorage. The aggregated load for the village is 100,000 kWh for a single year.
- 41 -
4

The 417 households and business are spread across an area that spans 1 km by 1 km, with themajority of the businesses located in the center of the village. Figure 20 shows the geographicdispersion of the customers.
Table 3. Rwanda Village Description
Customer TypeNumber of
Customers
Peak Demand
(kW)Annual kWh Villiage Peak
Demand (kW)
Village Annual
kWh
LightResHH 402 0.01 57 4.42 22,858
Restaurant 3 0.64 4,583 1.92 13,750
Refrigeration 3 0.81 7,052 2.42 21,155
Welding 2 4.82 11,189 9.64 22,378Tailor 2 2.42 5,773 4.84 11,546
Hair Salon 1 0.74 1,786 0.74 1,786
Shop 1 0.01 88 0.01 88
Mill 1 0.99 3,832 0.99 3,832
Phone Charging 1 0.03 123 0.03 123
Popcorn 1 1.31 3,160 1.31 3,160
Total 417 - - 26.30 100,674
Figure 20. Customer Locations in the Rwanda Village
Village Ability to Pay
We assume that each household in the village can afford to pay approximately $0.45 / kWh, which isapproximately $2.14 / month, or $25.65 / year.
- 42 -

Existing business must rely on diesel generation in order to operate, which gives an existing marketprice for electricity in the area. Similar to the Nigerian village case study, this case study assumesdiesel generation is approximately $0.40 / kWh.
These pricing assumptions assume that customers would be willing to substitute their existingenergy sources for minigrid service provided they received the same or better quality of service.
Results of the Full Design Space
Based on the results from the Nigerian Village Case Study, the Rwandan village design space is onlyexplored for reliability levels of 98%. Figure 21 plots the project net present value as additionalcustomers are added to the minigrid. A clear peak of maximum firm value occurs at 12 customers.Table 4 list the results of the more detailed financial analysis for a number of minigrid projects. Theprofit maximizing design has an estimated net present value of $18,000.
Despite the peak profitability of the minigrid occurring at only 12 customers, a minigrid providercould choose to add additional customers to the minigrid project and still remain profitable. For thegiven household tariff rates of $0.45 / kWh in this project, additional customers could be addeduntil approximately 250 customers are attached to the minigrid.
20,000 -
z
a)2' 0-
-20,000 -
0 100 200 300 400Number of Customers Added to Minigrd
Figure 21. NPV of the Rwanda Minigrid is maximized at 12 customers.
- 43 -
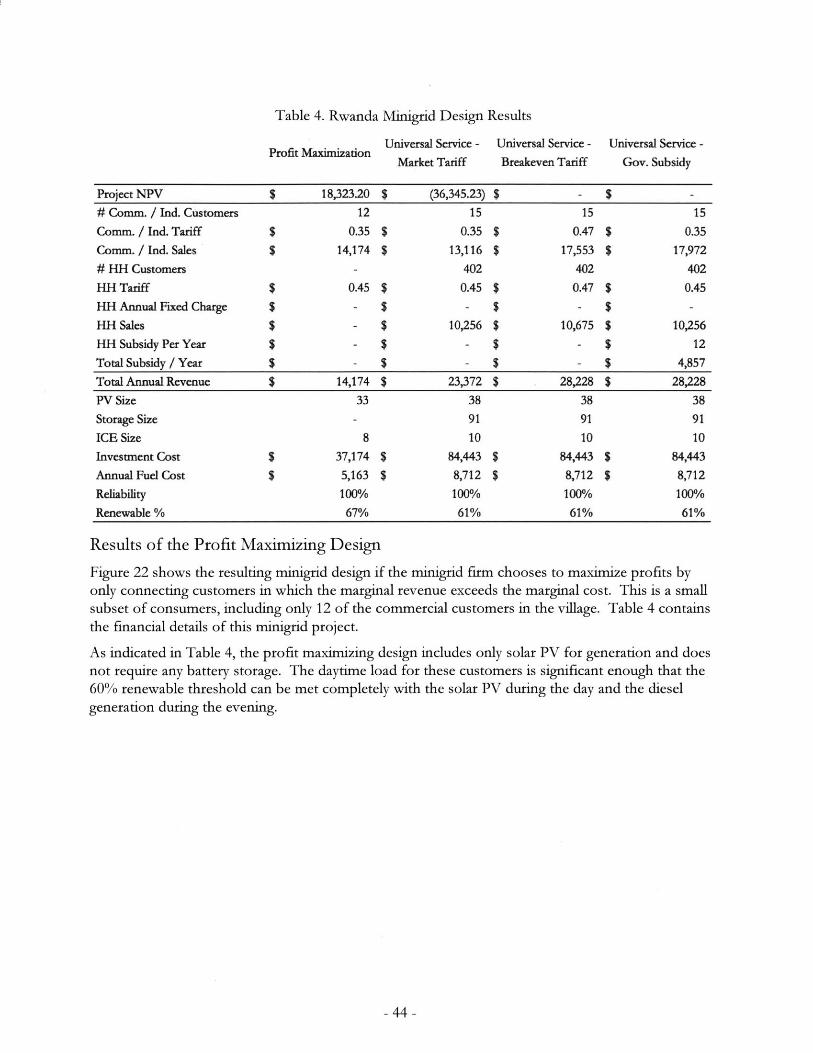
Table 4. Rwanda Minigrid Design Results
Profit MaximizationUniversal Service -
Market Tariff
Universal Service -
Breakeven Tariff
Universal Service -
Gov. Subsidy
Project NPV $ 18,323.20 $ (36,345.23) $ - $ -# Comm. / Ind. Customers 12 15 15 15
Comm. / Ind. Tariff $ 0.35 $ 0.35 $ 0.47 $ 0.35Comm. / Ind. Sales $ 14,174 $ 13,116 $ 17,553 $ 17,972
# HH Customers - 402 402 402
HH Tariff $ 0.45 $ 0.45 $ 0.47 $ 0.45
HH Annual Fixed Charge $ - $ - $ - $ -HH Sales $ - $ 10,256 $ 10,675 $ 10,256HH Subsidy Per Year $ - $ - $ - $ 12
Total Subsidy / Year $ - $ - $ - $ 4,857
Total Annual Revenue $ 14,174 $ 23,372 $ 28,228 $ 28,228PV Size 33 38 38 38Storage Size - 91 91 91
ICE Size 8 10 10 10Investment Cost $ 37,174 $ 84,443 $ 84,443 $ 84,443
Annual Fuel Cost $ 5,163 $ 8,712 $ 8,712 $ 8,712Reliability 100/0 100%/n 1000/ 100/0Renewable % 67% 61% 61% 61%
Results of the Profit Maximizing Design
Figure 22 shows the resulting minigrid design if the minigrid firm chooses to maximize profits byonly connecting customers in which the marginal revenue exceeds the marginal cost. This is a small
subset of consumers, including only 12 of the commercial customers in the village. Table 4 containsthe financial details of this minigrid project.
As indicated in Table 4, the profit maximizing design includes only solar PV for generation and doesnot require any battery storage. The daytime load for these customers is significant enough that the60% renewable threshold can be met completely with the solar PV during the day and the diesel
generation during the evening.
- 44 -
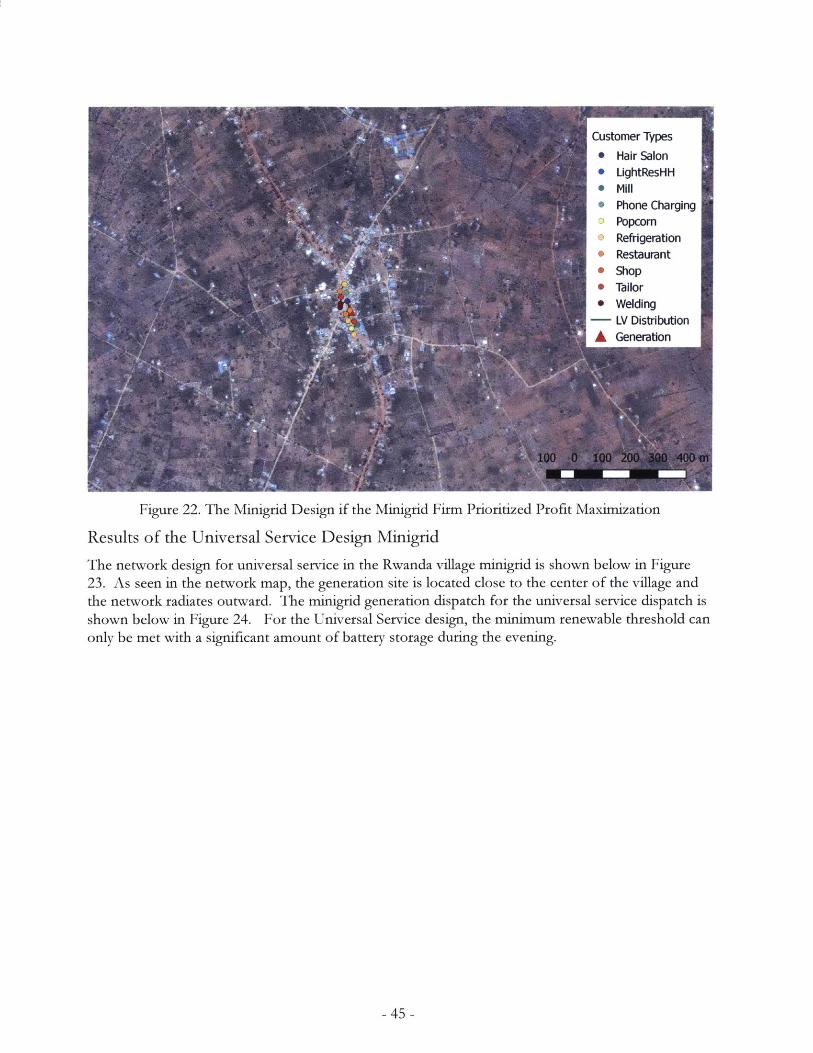
Figure 22. The Minigrid Design if the Minigrid Firm Prioritized Profit Maximization
Results of the Universal Service Design Minigrid
The network design for universal service in the Rwanda village minigrid is shown below in Figure23. As seen in the network map, the generation site is located close to the center of the village andthe network radiates outward. The minigrid generation dispatch for the universal service dispatch is
shown below in Figure 24. For the Universal Service design, the minimum renewable threshold canonly be met with a significant amount of battery storage during the evening.
- 45 -
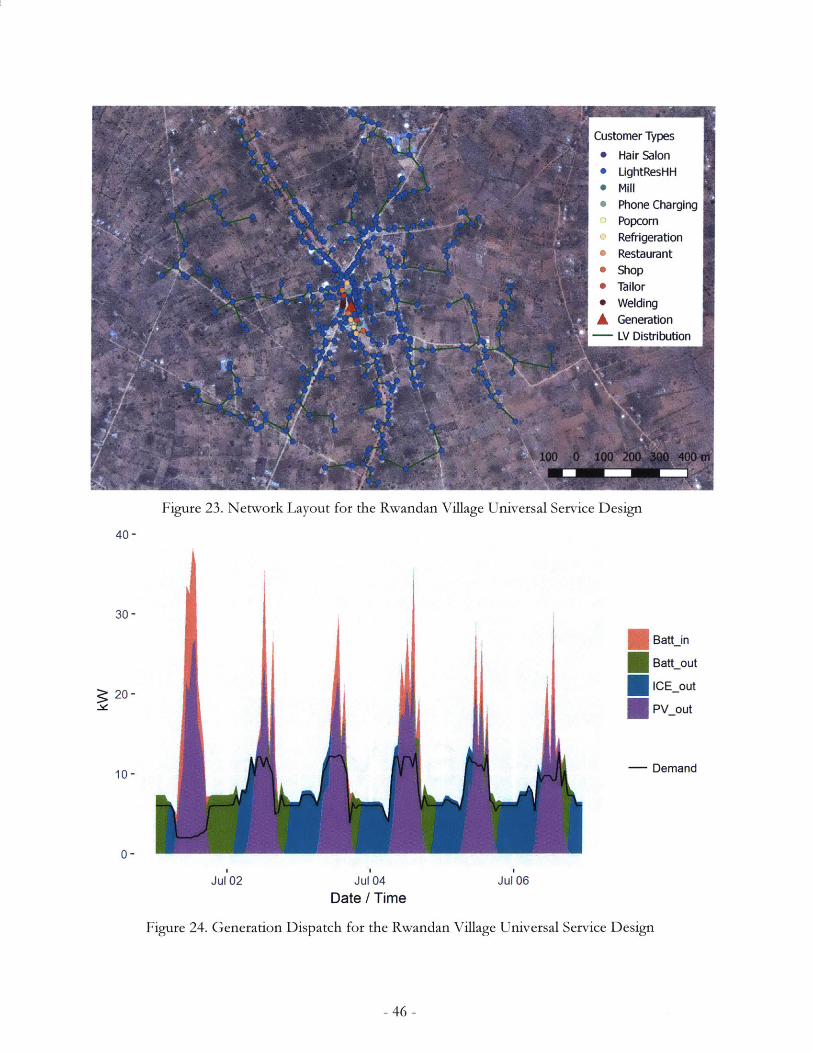
Figure 23. Network Layout for the Rwandan Village Universal Service Design
40-
i
I Irir-iA
UBattin
Battout
ICE-out
PV out
-- Demand
Jul 02 Jul 04 Jul 06Date / Time
Figure 24. Generation Dispatch for the Rwandan Village Universal Service Design
- 46 -
30-
20-
10-
0-
I
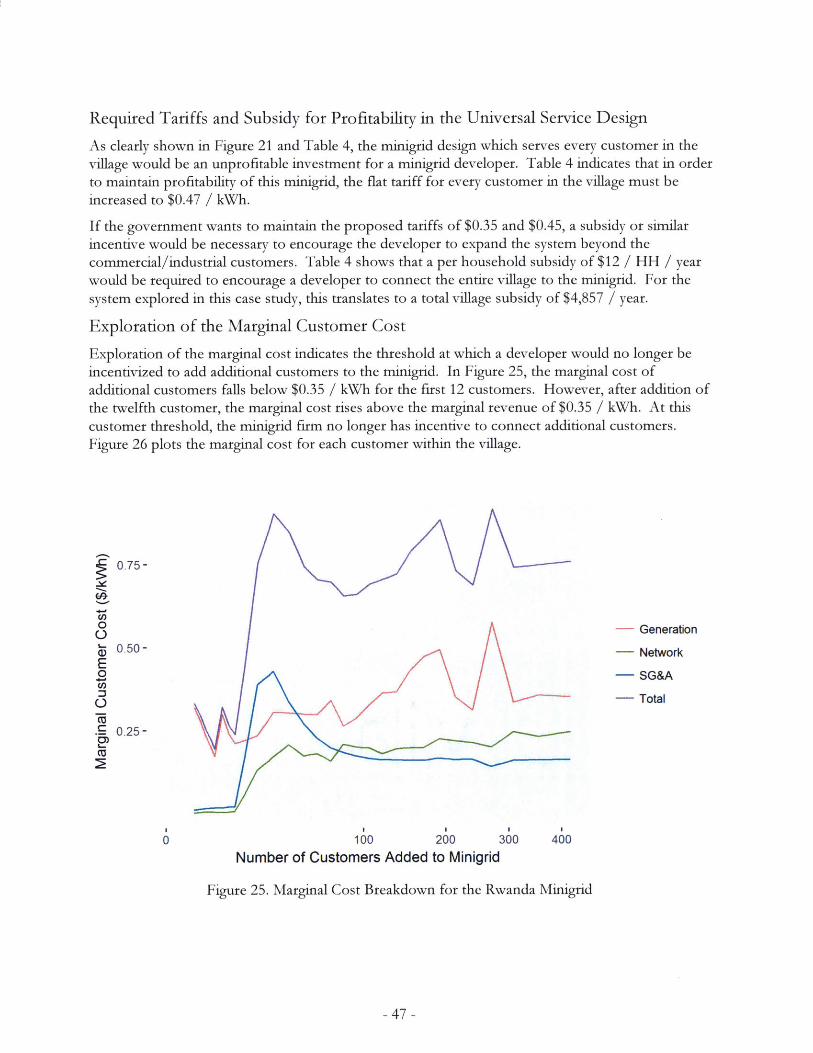
Required Tariffs and Subsidy for Profitability in the Universal Service Design
As clearly shown in Figure 21 and Table 4, the minigrid design which serves every customer in thevillage would be an unprofitable investment for a minigrid developer. Table 4 indicates that in orderto maintain profitability of this minigrid, the flat tariff for every customer in the village must beincreased to $0.47 / kWh.
If the government wants to maintain the proposed tariffs of $0.35 and $0.45, a subsidy or similarincentive would be necessary to encourage the developer to expand the system beyond thecommercial/industrial customers. Table 4 shows that a per household subsidy of $12 / HH / yearwould be required to encourage a developer to connect the entire village to the minigrid. For thesystem explored in this case study, this translates to a total village subsidy of $4,857 / year.
Exploration of the Marginal Customer Cost
Exploration of the marginal cost indicates the threshold at which a developer would no longer beincentivized to add additional customers to the minigrid. In Figure 25, the marginal cost ofadditional customers falls below $0.35 / kWh for the first 12 customers. However, after addition ofthe twelfth customer, the marginal cost rises above the marginal revenue of $0.35 / kWh. At thiscustomer threshold, the minigrid firm no longer has incentive to connect additional customers.Figure 26 plots the marginal cost for each customer within the village.
0
I I
100 200 300Number of Customers Added to Minigrid
- Generation
- Network
- SG&A
- Total
400
Figure 25. Marginal Cost Breakdown for the Rwanda Minigrid
- 47 -
0.75-
0
0.50-E0
4-AC)
.~0.25-
2)CU
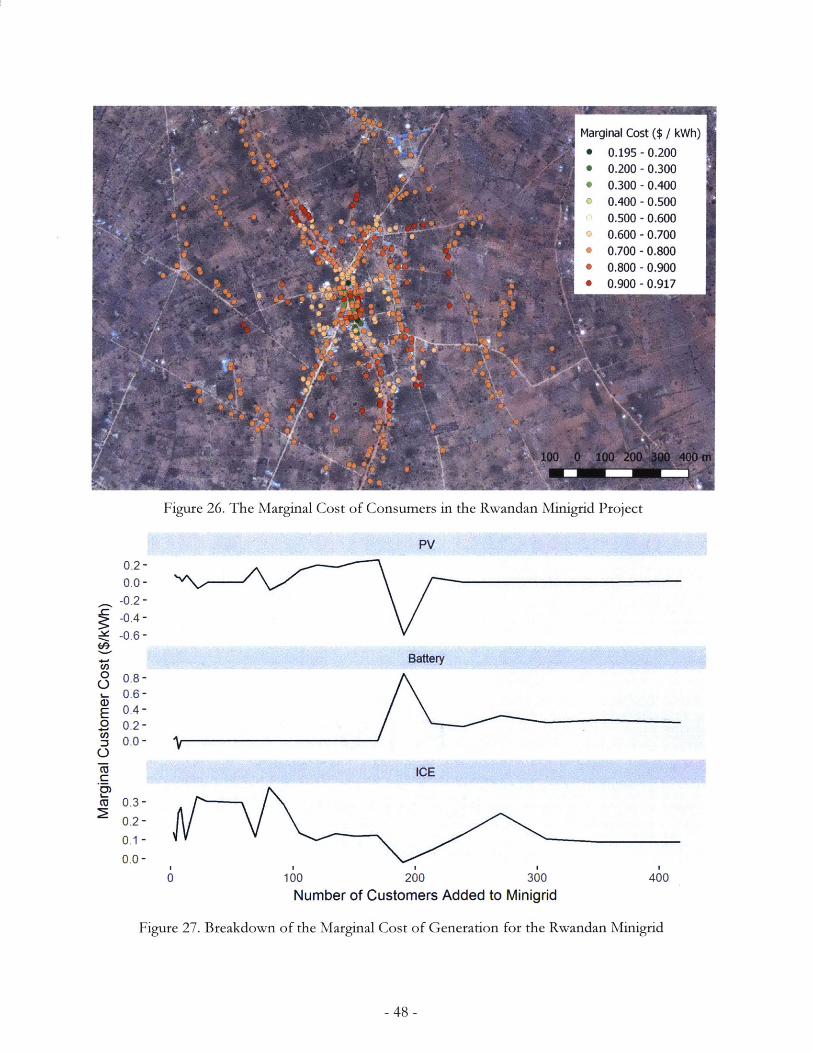
Figure 26. The Marginal Cost of Consumers in the Rwandan Minigrid Project
PV
0.2-0.0-
-0.2--0.4--0.6-
6ftBattery
3 0.8-L- 0.6-E 0.4-.0 0.2-
0.0-
ICE
cu 0.3-0.2-0.1 -0.0-
0 100 200 300 400Number of Customers Added to Minigrid
Figure 27. Breakdown of the Marginal Cost of Generation for the Rwandan Minigrid
- 48 -
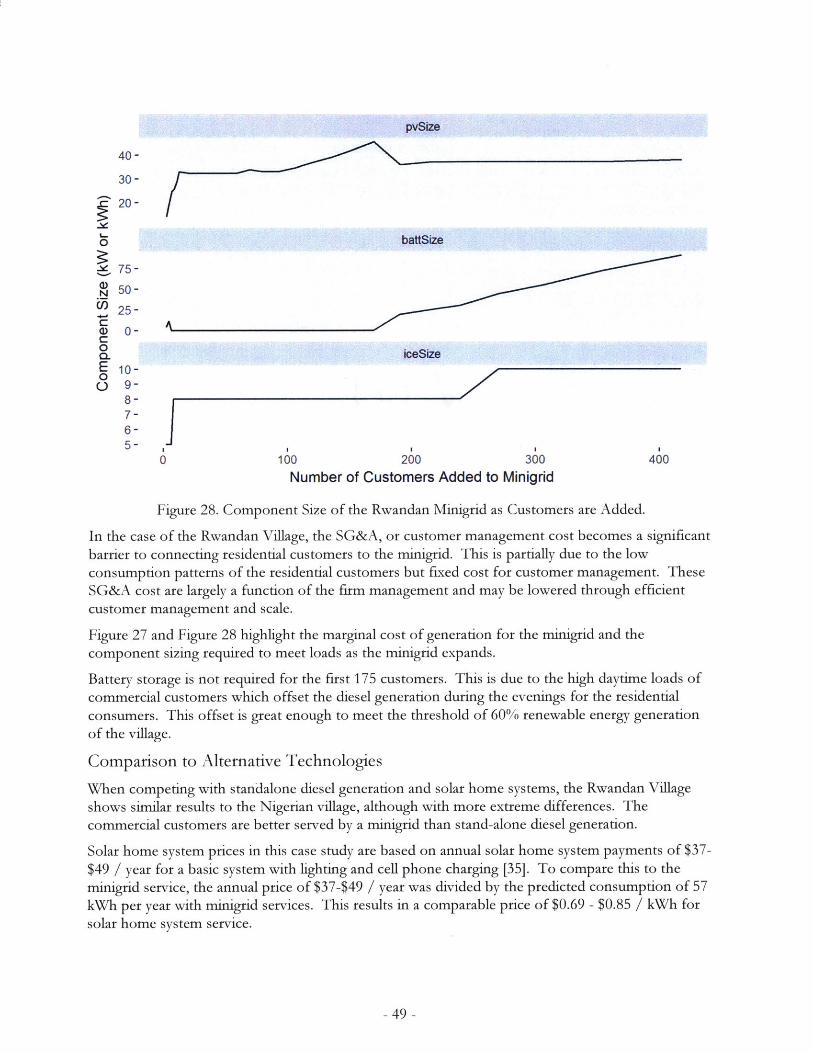
pvSize
40-
30-
~20-
0 battSize
d. 75-
3 50-U25-CA4) 0-C0. CL ice~izeE 10-0S9-
8-7-6-5-
0 100 200 300 400Number of Customers Added to Minigrid
Figure 28. Component Size of the Rwandan Minigrid as Customers are Added.
In the case of the Rwandan Village, the SG&A, or customer management cost becomes a significant
barrier to connecting residential customers to the minigrid. This is partially due to the lowconsumption patterns of the residential customers but fixed cost for customer management. TheseSG&A cost are largely a function of the firm management and may be lowered through efficientcustomer management and scale.
Figure 27 and Figure 28 highlight the marginal cost of generation for the minigrid and thecomponent sizing required to meet loads as the minigrid expands.
Battery storage is not required for the first 175 customers. This is due to the high daytime loads ofcommercial customers which offset the diesel generation during the evenings for the residentialconsumers. This offset is great enough to meet the threshold of 60% renewable energy generationof the village.
Comparison to Alternative Technologies
When competing with standalone diesel generation and solar home systems, the Rwandan Villageshows similar results to the Nigerian village, although with more extreme differences. Thecommercial customers are better served by a minigrid than stand-alone diesel generation.
Solar home system prices in this case study are based on annual solar home system payments of $37-$49 / year for a basic system with lighting and cell phone charging [35]. To compare this to theminigrid service, the annual price of $37-$49 / year was divided by the predicted consumption of 57kWh per year with minigrid services. This results in a comparable price of $0.69 - $0.85 / kWh forsolar home system service.
- 49 -
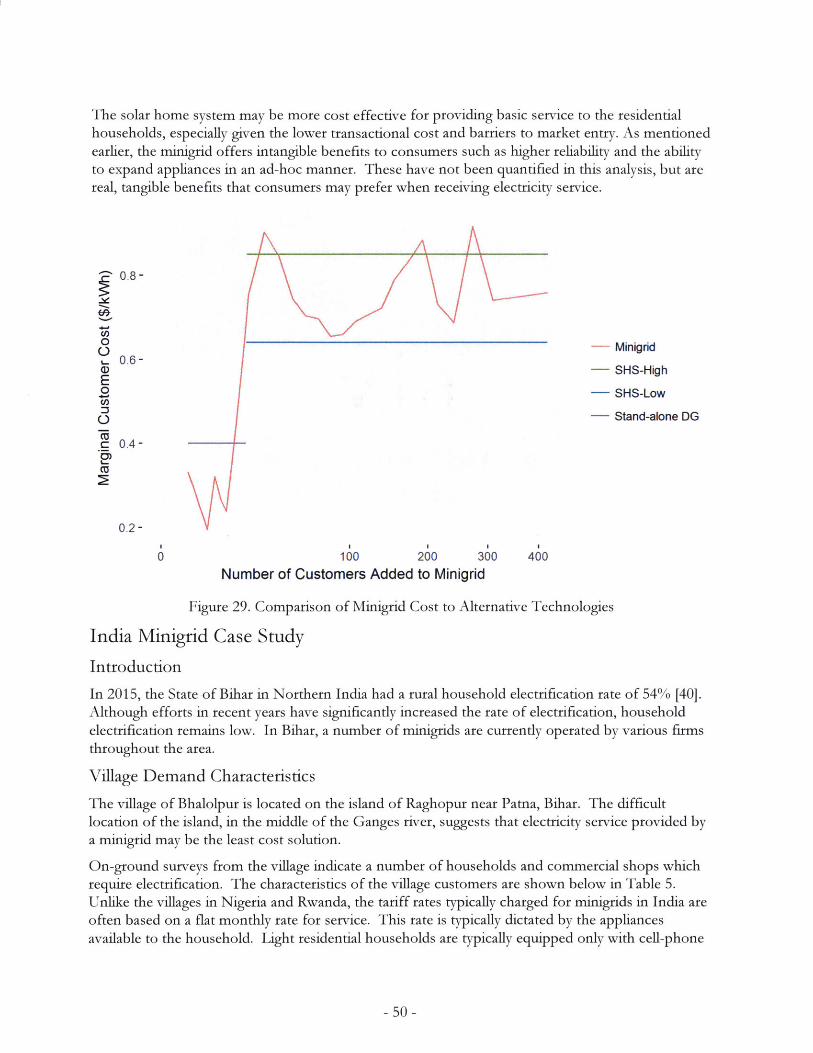
The solar home system may be more cost effective for providing basic service to the residentialhouseholds, especially given the lower transactional cost and barriers to market entry. As mentionedearlier, the minigrid offers intangible benefits to consumers such as higher reliability and the abilityto expand appliances in an ad-hoc manner. These have not been quantified in this analysis, but arereal, tangible benefits that consumers may prefer when receiving electricity service.
0.8-
60
- Minigrd
0.6 - - SHS-HighE.1-- SHS-LowCO
S- Stand-alone DG
0.4-
CU
0.2-S SII I
0 100 200 300 400Number of Customers Added to Minigrid
Figure 29. Comparison of Minigrid Cost to Alternative Technologies
India Minigrid Case Study
Introduction
In 2015, the State of Bihar in Northern India had a rural household electrification rate of 54% [40].Although efforts in recent years have significantly increased the rate of electrification, household
electrification remains low. In Bihar, a number of minigrids are currently operated by various firms
throughout the area.
Village Demand Characteristics
The village of Bhalolpur is located on the island of Raghopur near Patna, Bihar. The difficultlocation of the island, in the middle of the Ganges river, suggests that electricity service provided by
a ninigrid may be the least cost solution.
On-ground surveys from the village indicate a number of households and commercial shops which
require electrification. The characteristics of the village customers are shown below in Table 5.
Unlike the villages in Nigeria and Rwanda, the tariff rates typically charged for minigrids in India areoften based on a flat monthly rate for service. This rate is typically dictated by the appliances
available to the household. Light residential households are typically equipped only with cell-phone
50 -
7
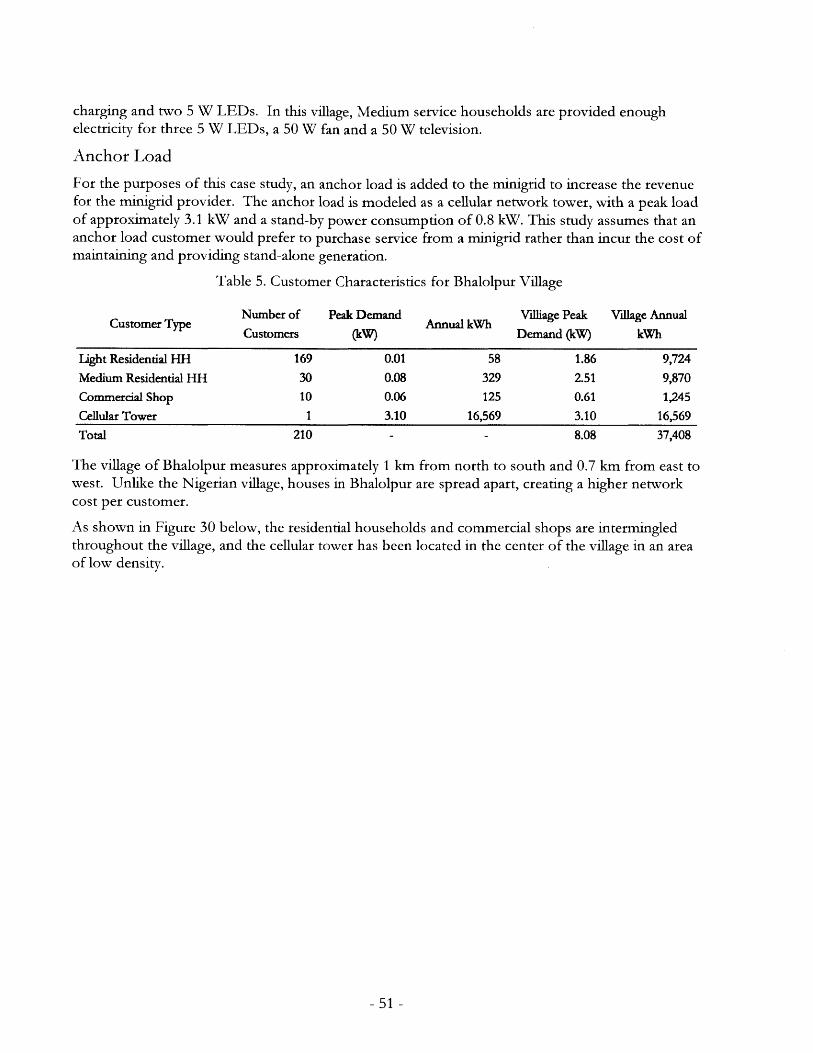
charging and two 5 W LEDs. In this village, Medium service households are provided enoughelectricity for three 5 W LEDs, a 50 W fan and a 50 W television.
Anchor Load
For the purposes of this case study, an anchor load is added to the minigrid to increase the revenuefor the minigrid provider. The anchor load is modeled as a cellular network tower, with a peak loadof approximately 3.1 kW and a stand-by power consumption of 0.8 kW. This study assumes that ananchor load customer would prefer to purchase service from a minigrid rather than incur the cost ofmaintaining and providing stand-alone generation.
Table 5. Customer Characteristics for Bhalolpur Village
Number of Peak Demand Villiage Peak Village AnnualCustomer Type Annual kWh ViagPek Yla Anl
Customers (kW) Demand (kW) kWh
Light Residential HH 169 0.01 58 1.86 9,724
Medium Residential HH 30 0.08 329 2.51 9,870Commercial Shop 10 0.06 125 0.61 1,245Cellular Tower 1 3.10 16,569 3.10 16,569Total 210 - - 8.08 37,408
The village of Bhalolpur measures approximately 1 km from north to south and 0.7 km from east towest. Unlike the Nigerian village, houses in Bhalolpur are spread apart, creating a higher networkcost per customer.
As shown in Figure 30 below, the residential households and commercial shops are intermingledthroughout the village, and the cellular tower has been located in the center of the village in an areaof low density.
- 51 -
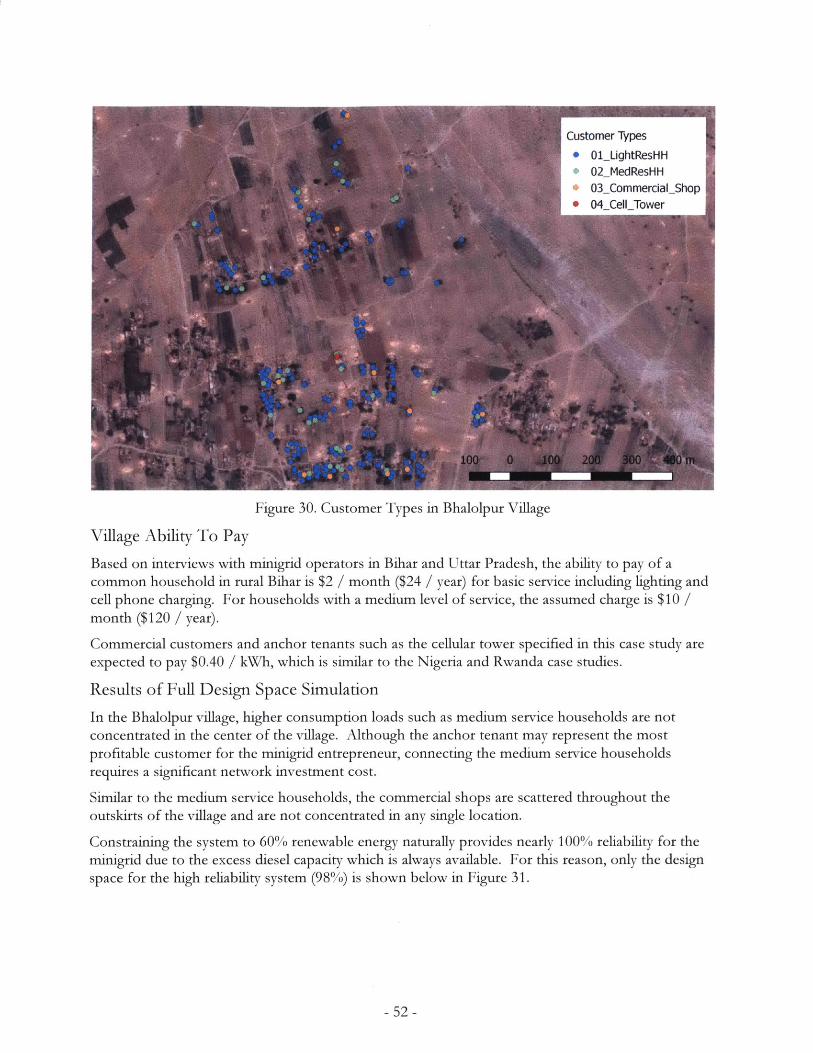
Figure 30. Customer Types in Bhalolpur Village
Village Ability To Pay
Based on interviews with minigrid operators in Bihar and Uttar Pradesh, the ability to pay of acommon household in rural Bihar is $2 / month ($24 / year) for basic service including lighting andcell phone charging. For households with a medium level of service, the assumed charge is $10 /month ($120 / year).
Commercial customers and anchor tenants such as the cellular tower specified in this case study areexpected to pay $0.40 / kWh, which is similar to the Nigeria and Rwanda case studies.
Results of Full Design Space Simulation
In the Bhalolpur village, higher consumption loads such as medium service households are notconcentrated in the center of the village. Although the anchor tenant may represent the most
profitable customer for the minigrid entrepreneur, connecting the medium service householdsrequires a significant network investment cost.
Similar to the medium service households, the commercial shops are scattered throughout theoutskirts of the village and are not concentrated in any single location.
Constraining the system to 60% renewable energy naturally provides nearly 100% reliability for theminigrid due to the excess diesel capacity which is always available. For this reason, only the designspace for the high reliability system (98%) is shown below in Figure 31.
- 52 -
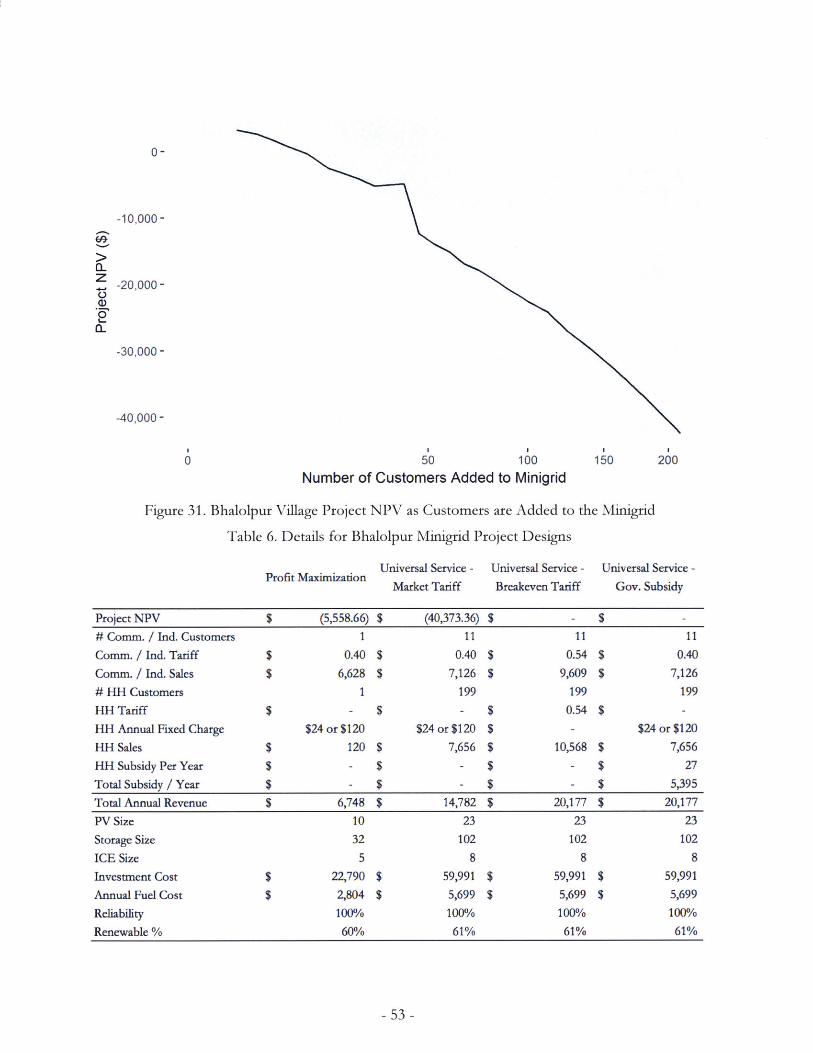
0-
-10,000-
_ -20,000-
0
-30,000 -
-40,000 -
50 100Number of Customers Added to Minigrid
150 200
Figure 31. Bhalolpur Village Project NPV as Customers are Added to the Minigrid
Table 6. Details for Bhalolpur Minigrid Project Designs
Profit MaximizationUniversal Service -
Market Tariff
Universal Service -Breakeven Tariff
Universal Service -
Gov. Subsidy
Project NPV $ (5,558.66) $ (40,373.36) $ - $ -
# Comm. / Ind. Customers 1 11 11 11
Comm. / Ind. Tariff $ 0.40 $ 0.40 $ 0.54 $ 0.40
Comm. / Ind. Sales $ 6,628 $ 7,126 $ 9,609 $ 7,126
# HH Customers 1 199 199 199
HH Tariff $ - $ - $ 0.54$ -
HH Annual Fixed Charge $24 or $120 $24 or $120 $ - $24 or $120
HH Sales $ 120 $ 7,656 $ 10,568 $ 7,656
HH Subsidy Per Year $ - $ - $ - $ 27
Total Subsidy / Year $ - $ - $ - $ 5,395
Total Annual Revenue $ 6,748 $ 14,782 $ 20,177 $ 20,177
PV Size 10 23 23 23
Storage Size 32 102 102 102
ICE Size 5 8 8 8
Investment Cost $ 22,790 $ 59,991 $ 59,991 $ 59,991
Annual Fuel Cost $ 2,804 $ 5,699 $ 5,699 $ 5,699
Reliability 100%/o 1000/0 1000/ 1000/
Renewable % 60% 61% 61% 61%
- 53 -
0
-j

As shown in Figure 31, the Net Present Value of the minigrid project begins at a positive value with
the anchor load and a single medium residential household located adjacent to the anchor load.
However, beginning with only the addition of a few medium residential households, the project
quickly becomes NPV negative. This low net present value is due to the sparse customer dispersion
in the village and the low-ability to pay. For the medium residential households paying $10 /month, this revenue stream is not capable of supporting appliances such as fans and televisions.
Results of the Profit Maximizing Design
Figure 32 maps the resulting minigrid design when including only the anchor load customer and thenearest medium residential household. The details of this minigrid design are included in Table 6.
Table 6 highlights that despite the apparent profitability from the design calculation, once otherfinancial aspects are added to the project such as working capital, taxes, depreciation, and finiteproject lifetimes, the project may no longer be viable.
Figure 32. The Minigrid Design if the Minigrid Firm Prioritized Profit Maximization
Results of the Universal Service Design
Figure 33 and Figure 34 display the network design and generation dispatch for the Bhalolpur
minigrid project. As can be seen in Figure 33, significant amounts of network are required to
connect customers on the outskirts of the village.
- 54 -
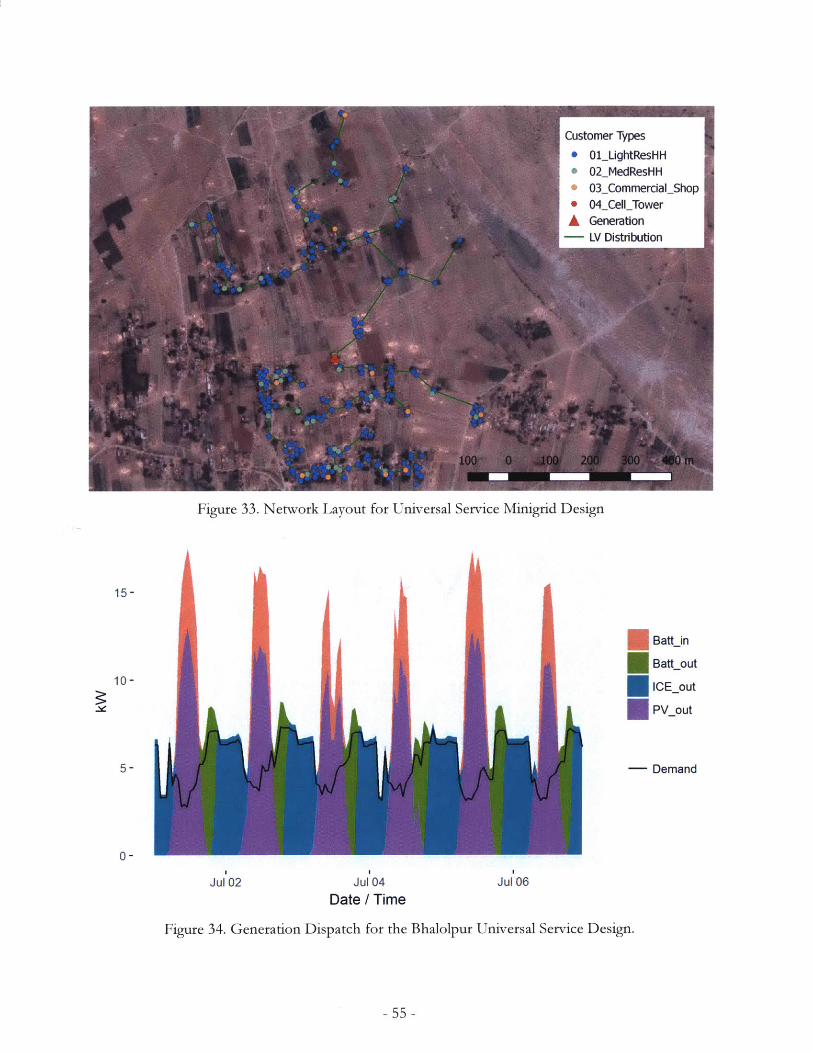
Figure 33. Network Layout for Universal Service Minigrid Design
I .
15-
Batt-in
Batt out10-
10 - ICE out
PV-out
5-- Demand
0-
Jul 02 Jul 04 Jul 06Date / Time
Figure 34. Generation Dispatch for the Bhalolpur Universal Service Design.
- 55 -
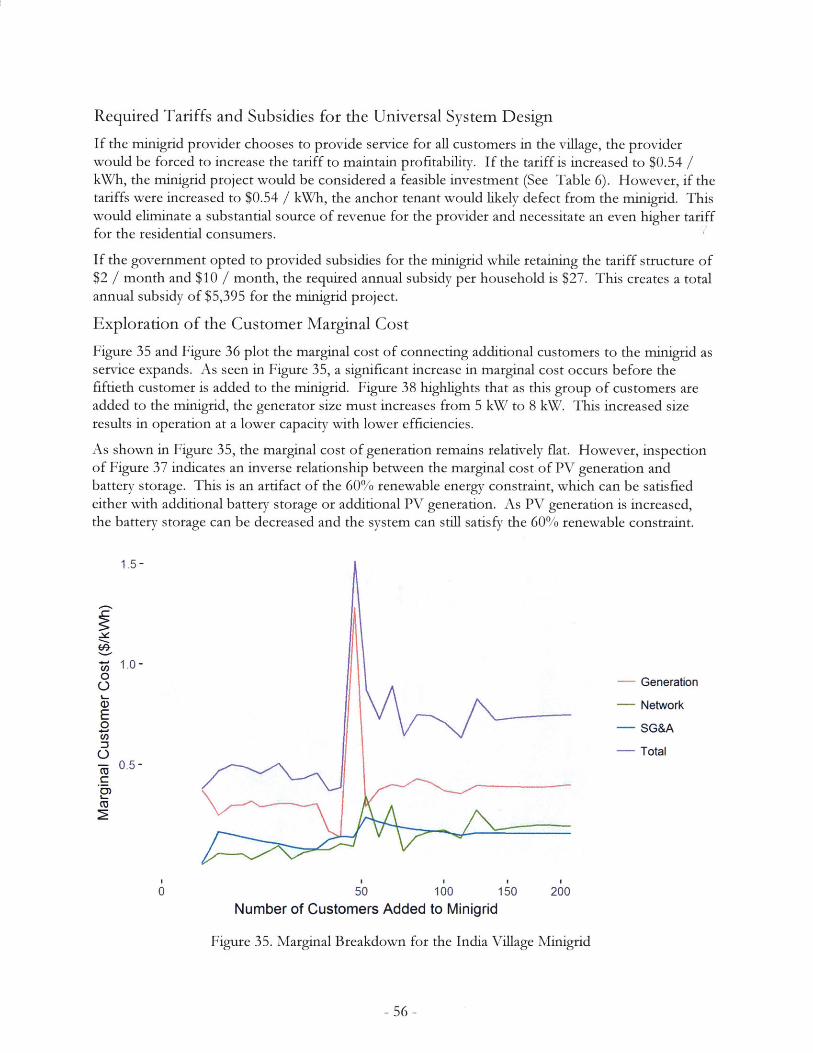
Required Tariffs and Subsidies for the Universal System Design
If the minigrid provider chooses to provide service for all customers in the village, the providerwould be forced to increase the tariff to maintain profitability. If the tariff is increased to $0.54 /kWh, the minigrid project would be considered a feasible investment (See Table 6). However, if thetariffs were increased to $0.54 / kWh, the anchor tenant would likely defect from the minigrid. Thiswould eliminate a substantial source of revenue for the provider and necessitate an even higher tarifffor the residential consumers.
If the government opted to provided subsidies for the minigrid while retaining the tariff structure of$2 / month and $10 / month, the required annual subsidy per household is $27. This creates a totalannual subsidy of $5,395 for the minigrid project.
Exploration of the Customer Marginal Cost
Figure 35 and Figure 36 plot the marginal cost of connecting additional customers to the minigrid asservice expands. As seen in Figure 35, a significant increase in marginal cost occurs before thefiftieth customer is added to the minigrid. Figure 38 highlights that as this group of customers areadded to the minigrid, the generator size must increases from 5 kW to 8 kW. This increased sizeresults in operation at a lower capacity with lower efficiencies.
As shown in Figure 35, the marginal cost of generation remains relatively flat. However, inspectionof Figure 37 indicates an inverse relationship between the marginal cost of PV generation andbattery storage. This is an artifact of the 6 0% renewable energy constraint, which can be satisfiedeither with additional battery storage or additional PV generation. As PV generation is increased,the battery storage can be decreased and the system can still satisfy the 60% renewable constraint.
- Generation
- Network
- SG&A
- Total
0 50 100 150 200Number of Customers Added to Minigrid
Figure 35. Marginal Breakdown for the India Village Minigrid
- 56 -
1.5-
- 1.0-00
E0CO,=3
00.5-
C.
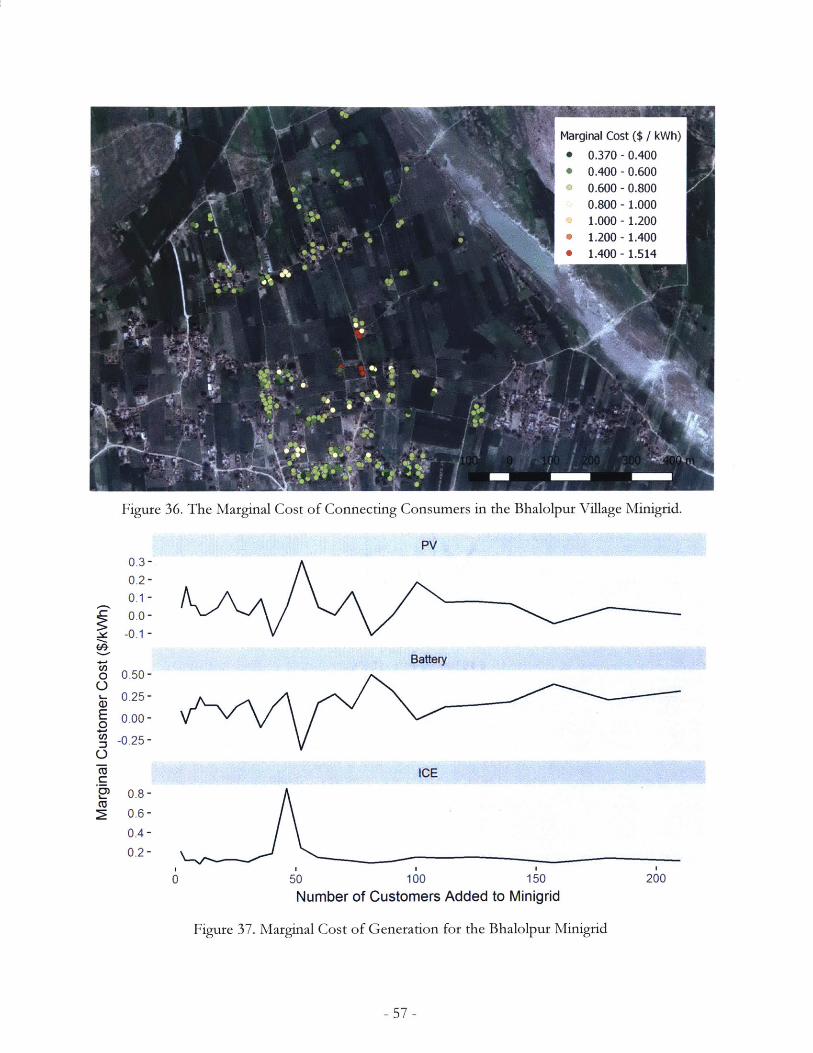
Figure 36. The Marginal Cost of Connecting Consumers in the Bhalolpur Village Minigrid.
Pv0.3-0.2-0.1 -0.0 -2 -0.1j
BaftBatteryCO,o 0.50-
0.25-E o.00-0
-0.25-
ICE0.8-
CU3 0.6-
0.4-
0.2-
50 100 150 260Number of Customers Added to Minigrid
Figure 37. Marginal Cost of Generation for the Bhalolpur Minigrid
- 57 -

pvSize
battSize
ceSize
50 100 150 200Number of Customers Added to Minigrd
Figure 38. The size of PV, Battery, and ICE as the Bhalolpur Village Minigrid Expands.
Comparison to Alternative Technologies
1.5-
1.2-
0
- SHS-High
- SHS-Low
- Stand-alone DG
50I I I
100 150 200
Number of Customers Added to Minigrid
Figure 39. Comparison of Bhalolpur Minigrid to Alternative Technologies
58-
)20-
16-
12-
100-
80-
60-
40-
8-
L-0
N
CL
E00
7-
6-
5-0
(D
E0.9-
U)
CME
CU 0.6 -
0
I A
V V

Figure 39 compares the cost of minigrid service to the cost of alternative technologies such as dieselgeneration and solar home systems. The niinigrid is less expensive than diesel generation for thecellular communications tower (anchor load), but only by a slight margin.
The residential consumers may be better served by solar home systems in this area. In this location,there is not a clear cost advantage with either technology, although quality of service with a minigridwould be higher.
- 59 -
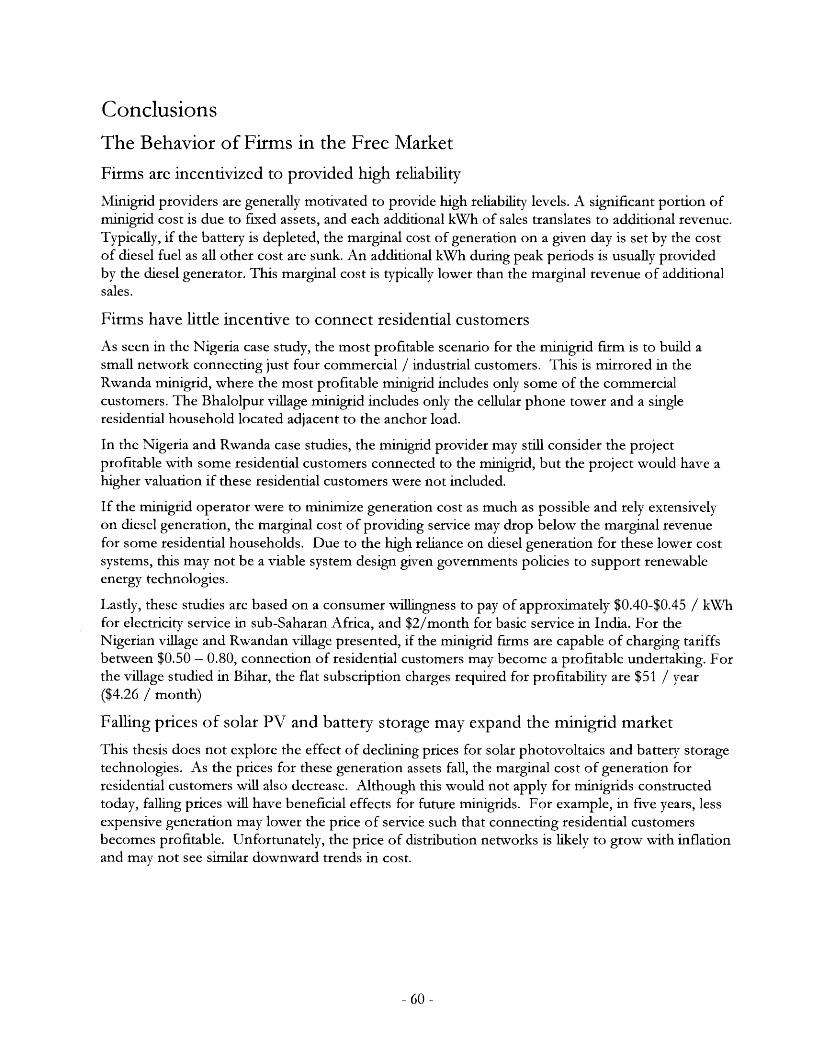
Conclusions
The Behavior of Firms in the Free Market
Firms are incentivized to provided high reliability
Minigrid providers are generally motivated to provide high reliability levels. A significant portion ofminigrid cost is due to fixed assets, and each additional kWh of sales translates to additional revenue.Typically, if the battery is depleted, the marginal cost of generation on a given day is set by the costof diesel fuel as all other cost are sunk. An additional kWh during peak periods is usually providedby the diesel generator. This marginal cost is typically lower than the marginal revenue of additionalsales.
Firms have little incentive to connect residential customers
As seen in the Nigeria case study, the most profitable scenario for the minigrid firm is to build asmall network connecting just four commercial / industrial customers. This is mirrored in theRwanda minigrid, where the most profitable minigrid includes only some of the commercialcustomers. The Bhalolpur village minigrid includes only the cellular phone tower and a singleresidential household located adjacent to the anchor load.
In the Nigeria and Rwanda case studies, the minigrid provider may still consider the projectprofitable with some residential customers connected to the minigrid, but the project would have ahigher valuation if these residential customers were not included.
If the minigrid operator were to minimize generation cost as much as possible and rely extensivelyon diesel generation, the marginal cost of providing service may drop below the marginal revenuefor some residential households. Due to the high reliance on diesel generation for these lower costsystems, this may not be a viable system design given governments policies to support renewableenergy technologies.
Lastly, these studies are based on a consumer willingness to pay of approximately $0.40-$0.45 / kWhfor electricity service in sub-Saharan Africa, and $2/month for basic service in India. For theNigerian village and Rwandan village presented, if the minigrid firms are capable of charging tariffsbetween $0.50 - 0.80, connection of residential customers may become a profitable undertaking. Forthe village studied in Bihar, the flat subscription charges required for profitability are $51 / year($4.26 / month)
Falling prices of solar PV and battery storage may expand the minigrid market
This thesis does not explore the effect of declining prices for solar photovoltaics and battery storagetechnologies. As the prices for these generation assets fall, the marginal cost of generation forresidential customers will also decrease. Although this would not apply for minigrids constructedtoday, falling prices will have beneficial effects for future minigrids. For example, in five years, lessexpensive generation may lower the price of service such that connecting residential customersbecomes profitable. Unfortunately, the price of distribution networks is likely to grow with inflationand may not see similar downward trends in cost.
- 60 -

Implications for Policy
Regulations for Reliability
Reliability levels should naturally remain high without regulatory intervention, however, if policy-makers desire to regulate the minimum reliability for minigrids, they can do so without fear ofcreating an additional cost burden.
This should be caveated with the condition that minigrid operators be allowed to utilize someamount of diesel generation which allows for excess capacity and high reliability levels.
Improving Access Through Minigrids
An aggressive cross-subsidization tariff at a minigrid site will not encourage providers to connect themost distant customers. Once the marginal cost of connecting a consumer exceeds the revenueprovided, the minigrid expansion will halt. Customers which are overcharged, such as industrial and
commercial customers, may disconnect if the tariff exceeds the cost of alternatives such as stand-
alone diesel generation.
Adding baseload customers will not incentivize expansion of the minigrid. Adding baseload
customers will not affect the marginal cost of adding additional customers, and minigrid expansion
halts based on the threshold at which marginal cost exceeds marginal revenue. The addition of
profitable baseload will not shift this boundary.
Incentives or subsidies based on maximizing customer connections will help extend minigrids to apoint. However, this tariff or subsidy could be viewed as simply an increase in the marginal revenue
per customer. The firm will still halt expansion once the increased marginal revenue due to the
subsidy is exceeded by the marginal cost.
Strict stipulations on the number of customer connections are required if universal service is to be
achieved. In a given territory, the firms must be incentivized to connect all consumers. Theseincentives must be maintained year-over-year. Given the high cost of battery replacement and diesel
generation, unless the incentives are tied to future performance of the minigrid, operators may cut
service to high cost customers. These high cost customers are typically residential customers withhigh evening loads requiring battery and diesel generation.
Cross-subsidizing remains a dangerous plan for governments to use in promoting minigrids. For
high profit margin customers which could be used to cross-subsidize service, firms face competition
from not only stand-alone generation, but other energy service firms. Other firms could offer
cheaper service by serving only the commercial and industrial customers.
Implications for Planning
The Use of Minigrids in Planning
Due to the inherent market forces working against cross-subsidization schemes, unless the ability-to-
pay of residential customers increases substantially, universal access through minigrids may only be
achieved with significant subsidies from the government. With the decreasing price of solar home
systems, minigrid providers will likely be competing with these firms when offering service to
smaller households. Due to the competition from both diesel generation and solar home systems,minigrid providers should focus on high consumption customers who would realize benefits byswitching from stand-along diesel generation to minigrid service. Planning for large-scale minigrids
- 61 -
with hundreds of residential customers may be a least-cost solution in many cases, but will likely notattract significant investment unless government subsidies and service territories are guaranteed.
The Difficultly of Calculating a Levelized Cost of Energy
Planning tools such as LREM and HOMER provide a levelized cost of energy (LCOE) for minigridservice or distributed generation, but these numbers should not be construed as a price which couldbe offered to consumers.
These calculations do not account for the taxes which must be paid based on profits. LCOEcalculations typically do not account for any net working capital and may not properly account forthe tax advantage (or disadvantage) due to depreciation standards.
A pro-forma income statement which projects expected cash flows, accounts for working capital,and incorporates any necessary debt payments should be used when determining the tariffs requiredfor a minigrid project.
The Impact of Network and Generation Cost in Planning
As expected, the generation costs remain relatively flat for residential consumers regardless of thegeographic distribution of these customers. The marginal cost of the distribution network varies. InIndia, the marginal cost of the distribution network is as high as $0.25 / kWh for some residentialcustomers. In Nigeria, due to higher consumption patterns, the marginal cost for the distributionnetwork is only $0.10 / kWh for the fringe customers.
Areas for Improvement
Reliability modeling
The model assumes the same willingness to pay for all reliability levels. Higher reliability levels arerewarded due to higher quantities of sale for the minigrid operator. A model which modifiesconsumer willingness to pay based on reliability may provide a more accurate representation of thisimportant minigrid characteristic.
Consumer Demand
Consumer demand is currently considered as a static input to the model with the assumption thatconsumers will not change behavior based on price. There are shortcomings to the approach. Basicmicroeconomics teaches that consumers will likely respond to price changes. Given the significantdifference in energy cost between day-time consumption and evening consumption, it is possiblethat consumers may shift consumption patterns if minigrid providers used time-of-use pricing. Aconsumer demand model which varies demand based on price may yield interesting insights,although this would significantly increase the complexity of the model and expand the design space.
To some extent, the willingness to pay for various consumption levels is captured through the casestudies. The Nigerian village represents the high consumptions customers with a lower willingnessto pay on a per-unit basis ($0.40 / kWh). In the context of the Indian village, a flat willingness-to-pay of $2/month corresponds to a rate of approximately $0.41 / kWh for the modeled service.
Calculation of Marginal Cost
The model currently calculates a flat tariff regardless of the time during which energy is consumed.Additional complexity could allow minigrid providers to see the marginal cost for daytime load andevening load.
- 62 -
Bibliography[1] I. International Energy Agency, "WEO-2017 Special Report: Energy Access Outlook," 2017.
[2] The World Bank, "The State of Electricity Access Report, 2017," 2017.
[3] Husk Power Systems, "Husk Power Systems receives $20 million investment from Shell,Swedfund, ENGIE Rassembleurs d'Energies to scale renewable mini-grid business in Africa
and Asia - Husk Power Systems," 2018. [Online]. Available:http://www.huskpowersystems.com/husk-power-systems-receives-20-million-investment-from-shell-swedfund-engie-rassembleurs-denergies/. [Accessed: 29-Jul-2018].
[4] N. Dubash et al., "Power Politics: Equity and Environment in Electricity Reform,"Washington, D.C., 2002.
[5] I. E. A. IEA, "India Energy Outlook," World Energy Outlook Spec. Rep., pp. 1-191, 2015.
[6] "Rural Electrification Corporation Limited." [Online]. Available:http://www.recindia.nic.in/index.php?lang=en. [Accessed: 15-Feb-2017].
[7] S. Mandelli, J. Barbieri, R. Mereu, and E. Colombo, "Off-grid systems for rural electrification
in developing countries: Definitions, classification and a comprehensive literature review,"
Renew. Sustain. Energy Rev., vol. 58, pp. 1621-1646, 2016.
[8] S. C. Bhattacharyya, "Review of alternative methodologies for analysing off-grid electricity
supply," Renew. Sustain. Energy Rev., vol. 16, pp. 677-694, 2011.
[9] 0. Erdinc and M. Uzunoglu, "Optimum design of hybrid renewable energy systems:
Overview of different approaches," Renew. Sustain. Energy Rev., vol. 16, pp. 1412-1425, 2011.
[10] S. Sinha and S. S. Chandel, "Review of software tools for hybrid renewable energy systems,"
Renew. Sustain. Energy Rev., vol. 32, pp. 192-205, Apr. 2014.
[11] "HOMER Pro - Microgrid Software for Designing Optimized Hybrid Microgrids." [Online].Available: http://www.homerenergy.com/HOMER-pro.html. [Accessed: 04-Mar-2017].
[12] Columbia University, "Network Planner." [Online]. Available:
http://networkplanner.modilabs.org/. [Accessed: 04-Mar-2017].
[13] "GEOSIM - Products." [Online]. Available:http://www.geosim.fr/index.php?page=products. [Accessed: 22-Mar-2017].
[14] D. Ellman, "The Reference Electrification Model: A Computer Model for Planning Rural
Electricity Access," 2015.
[15] V. Li and J. I. P6rez-arriaga, "The Local Reference Electrification Model: A Comprehensive
Decision-Making Tool for the Design of Rural Microgrids by," MASSACHUSETTSINSTITUTE OF TECHNOLOGY, 2016.
[16] J. Urpelainen, "Energy poverty and perceptions of solar power in marginalized communities:
Survey evidence from Uttar Pradesh, India," Renew. Energy, vol. 85, pp. 534-539, Jan. 2016.
[17] J. Urpelainen and S. Yoon, "Solar home systems for rural India: Survey evidence on
awareness and willingness to pay from Uttar Pradesh," Energy Sustain. Dev., vol. 24, pp. 70-78,Feb. 2015.
[18] Y. Alem and J. Urpelainen, "Passive Learning and Incentivized Communication: A
- 63 -
Randomized Controlled Trial in India *," 2016.
[19] M. Aklin, P. Bayer, S. P. Harish, and J. Urpelainen, "Consumer Demand and Experience withMera Gao Power in Barabanki, Uttar Pradesh A Field Survey Report," 2014.
[20] H. Gunatilake, N. Maddipati, and S. Patil, "Willingness to Pay for Electricity SupplyImprovements in Rural India," J. Resour. Energy Dev., vol. 10, no. 2, pp. 55-78, Jun. 2013.
[21] J. Sagebiel and K. Rommel, "Preferences for electricity supply attributes in emergingmegacities - Policy implications from a discrete choice experiment of private households inHyderabad, India," Energy Sustain. Dev., vol. 21, pp. 89-99, Aug. 2014.
[22] L. M. Mimmi, "From informal to authorized electricity service in urban slums: Findings froma household level survey in Mumbai," Energy Sustain. Dev., vol. 21, pp. 66-80, 2014.
[23] M. Aklin, P. Bayer, S. P. Harish, and J. Urpelainen, "Information and energy policypreferences: a survey experiment on public opinion about electricity pricing reform in ruralIndia," Econ. Gov., vol. 15, no. 4, pp. 305-327, Nov. 2014.
[24] P. Asquith and L. A. Weiss, Lessons in Corporate Finance. Hoboken, New Jersey: John Wiley &Sons, Inc., 2016.
[25] R. A. Brealey, S. C. Myers, and F. Allen, Principles of Corporate Finance. New York, NY:McGraw-Hill/Irwin, 2011.
[26] J. Berk and P. DeMarzo, Corporate Finance. Boston: Pearson, 2006.
[27] J. Sabal, "The Discount Rate in Emerging Markets: A Guide," J. App. Corp. Financ., vol. 16,no. 2/3, pp. 155-166, 2004.
[28] D. R. Lessard, "Incorporating Country Risk in the Valuation of Offshore Projects," J. Appl.Corp. Financ., vol. 9.3, 1996.
[29] S. Godfrey and R. Espinosa, "A Practical Approach to Calculating Costs of Equity forInvestments in Emerging Markets," J. Appl. Corp. Financ., vol. 9.3, 1996.
[30] IFC, "OPERATIONAL AND FINANCIAL PERFORMANCE OF MINI-GRIDDESCOS," Washington, D.C., 2017.
[31] S. Lal, "Can Good Economics Ever Be Good Politics? Case Study of India's Power Sector,"Washington, D.C., 2006.
[32] E. C. of Nigeria, "60m Nigerians now own power generators -MAN," 2009..
[33] M. Aklin, P. Bayer, S. P. Harish, and J. Urpelainen, "Information and energy policypreferences: a survey experiment on public opinion about electricity pricing reform in ruralIndia," Econ. Gon., vol. 15, no. 4, pp. 305-327, Nov. 2014.
[34] S. D. Comello, S. J. Reichelstein, A. Sahoo, and T. S. Schmidt, "Enabling Mini-gridDevelopment in Rural India," 2016.
[35] Hystra, "Reaching Scale in Access to Energy," 2017.
[36] D. Schnitzer, D. S. Lounsbury, J. P. Carvallo, R. Deshmukh, J. Apt, and D. M. Kammen,"Microgrids for Rural Electrification : A critical review of best practices based on seven casestudies," p. 122, 2014.
[37] S. Banerjee, Intermediate microeconomics: a tool-building approach. .
- 64 -

[38] Nigeria Rural Electrification Agency, "MINI-GRIDS - REA." [Online]. Available:http://rea.gov.ng/mini-grids/. [Accessed: 24-Jul-2018].
[39] "MeshPower - Home." [Online]. Available: http://www.meshpower.co.rw/index.html.[Accessed: 09-Jul-2018].
[40] Government of India - Ministry of Health and Family Welfare, "National Family HealthSurvey 4 - State Fact Sheet - Bihar," 2015.
- 65 -
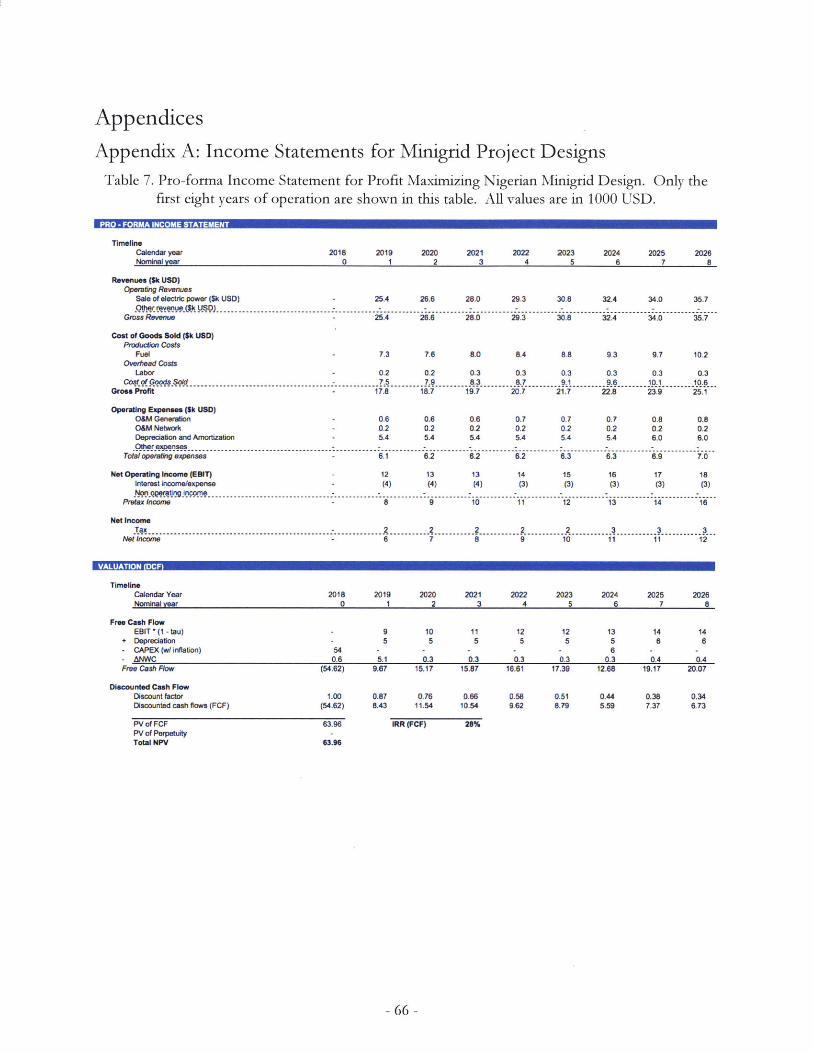
Appendices
Appendix A: Income Statements for Minigrid Project Designs
Table 7. Pro-forma Income Statement for Profit Maximizing Nigerian Minigrid Design. Only thefirst eight years of operation are shown in this table. All values are in 1000 USD.
PRO - FORMA INCOME STATEMENT
TimellneCalendaryer 2018 2019 2020 2021 2022 2023 2024 2025 2026Nominal year 0 1 2 3 4 5 6 7 8
Revenues ($k USD)Cperating Revenues
Sale of electric power (Sk USD) - 25.4 26.6 28.0 29.3 30.8 32.4 34.0 35.7tOr- revenue ($k USC):
Gross Revenue - 25.4 28.6 28.0 29.3 30.8 32.4 34.0 35.7
Cost of Goods Sold ($k USD)Pmduc*on Costs
Fuel - 7.3 7.6 8.0 8.4 8.8 9.3 9.7 10.2Overweed Costs
Labor - 0.2 0.2 0.3 0.3 0.3 0.3 0.3 0.3Costof GoodsSold - 7.5 7.9 8.3 87 9.1 9.6 10.1 10.6
Goes Pro t - 17.8 18.7 19.7 20.7 21.7 22.8 23.9 25.1
Operating Expenses (Sk USD)O&M Generation - 0.6 0.6 0.6 0.7 0.7 0.7 0.8 0.8O&M Network - 0.2 0.2 0.2 0.2 0.2 0.2 0.2 0.2Depreciation and Amortization - 5.4 5.4 5.4 5.4 5.4 5.4 6.0 6.0
Total operaftg expenses - 6.1 6.2 6.2 6.2 6.3 6.3 6.9 7.0
Net Operating Income(EslT) - 12 13 13 14 15 16 17 18Interest kicomelexpense - (4) (4) (4) (3) (3) (3) (3) (3)
Pretaxlnccrne - 8 9 10 11 12 13 14 16
Net IncomeTax -2 2 2 2 2 3 33
N6 ncome - 8 7 8 9 10 11 11 12
VALUATION (DCF)
TimelineCalendar Year 2018 2019 2020 2021 2022 2023 2024 2025 2026Nominal Year 0 1 2 3 4 5 6 7 8
Free Cash FlowEBIT * (1 - tau) - 9 10 11 12 12 13 14 14
+ Depreciation - 5 5 5 5 5 5 6 6. CAPEX (w/ inflation) 54 - - - - - 6 - -- NWC 0.6 5.1 0.3 0.3 0.3 0.3 0.3 0.4 0.4Free Cash Flow (54.62) 9.67 15.17 15.87 16.61 17.39 12.68 19.17 20.07
Discounted Cash FlowDiscount factor 1.00 0.87 0.76 0.86 0.58 0.51 0.44 0.38 0.34Discounted cash flows (FCF) (54.62) 8.43 11.54 10.54 9.62 8.79 5.59 7.37 6.73
PV of FCF 63.96 IRR (FCF) 28%PV of Perpetuity -Total NPV 63.96
- 66 -
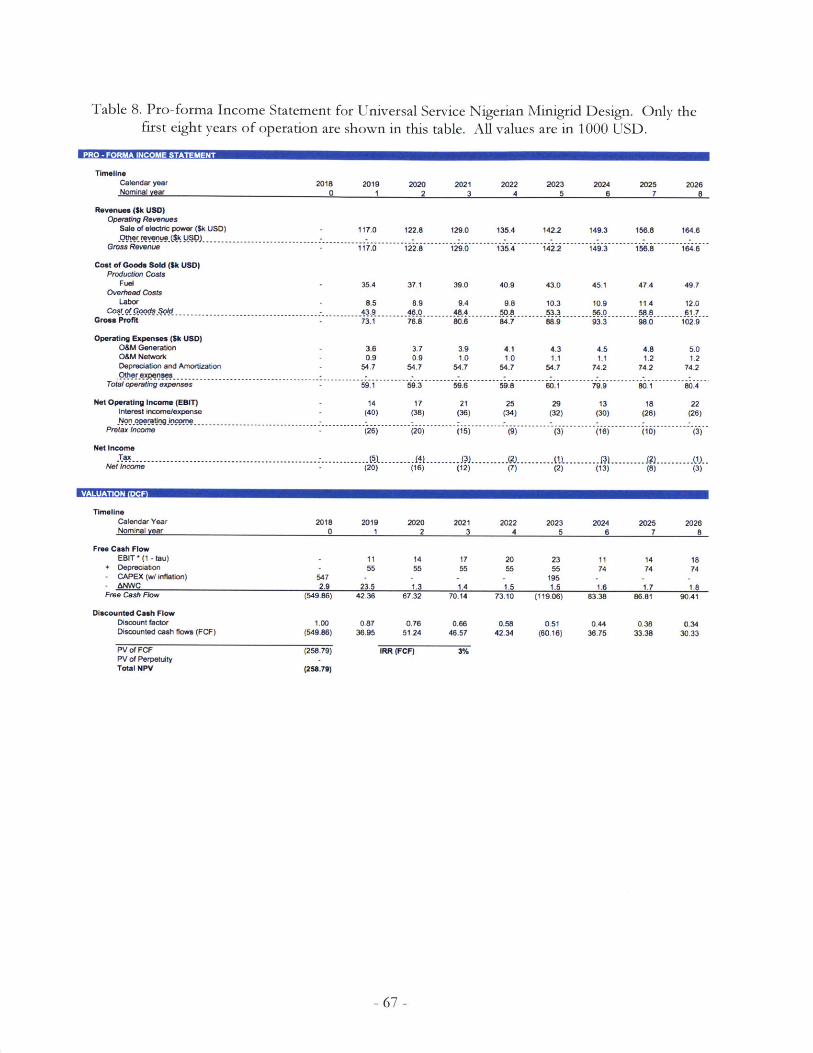
Table 8. Pro-forma Income Statement for Universal Service Nigerian Minigrid Design. Only thefirst eight years of operation are shown in this table. All values are in 1000 USD.
PRO - FORMA INCOME STATEMENT
TimelineCalendar year 2018 2019 2020 2021 2022 2023 2024 2025 2026Nominal year 0 1 2 3 4 5 6 7 8
Revenues (Sk USD)Operatng Revenues
Sale of electric power (Sk USD) - 117.0 122.8 129.0 135.4 142.2 149.3 156.8 164.6
GramsRevwn" 117.0 122.8 129.0 135.4 142.2 149.3 156.8 184.6
Cost of Goods Sold (5k USD)Production Costs
Fuel - 35.4 37.1 39.0 40.9 43.0 45.1 47.4 49.7ov0 ead Costs
Labor - 8.5 8.9 9.4 9.8 10.3 10.9 11.4 12.0CotofGoods Sold 43.9 46.0 48.4 50.8 53.3 56.0 58.8 61.7
Gross Profit - 73.1 76.8 80.6 84.7 88.9 93.3 98.0 102.9
Operating Expenses (5k USD)OSM Generation - 3.6 3.7 3.9 4.1 4.3 4.5 4.8 5.0O&M Network 0.9 0.9 1.0 1.0 1.1 1.1 1.2 1.2Depreciation and Amortization - 54.7 54.7 54.7 54.7 54.7 74.2 74.2 74.2
Total operating expenses - 59.1 59.3 59.6 59.8 60.1 79.9 80.1 80.4
Net Operating Incoem (EBIT) 14 17 21 25 29 13 18 22interest incomnelexpense - (40) (38) (36) (34) (32) (30) (28) (26)Ngn ogeratigmicome
Preae Income . (26) (20) (15) (9) (3) (16) (10) (3)
Net IncomeTax......................................2)(7)..........1.......13. (8)
NetIncore - (20) (16) (12) (7) (2) (13) (8) (3)
VALUATION (DCF)
Timeline
Calendar Year 2018 2019 2020 2021 2022 2023 2024 2025 2026Nominal year 0 1 2 3 4 5 6 7 8
Free Cash FlowEBIT (1 - tau) - 11 14 17 20 23 11 14 18
+ Deprciation - 55 55 55 55 55 74 74 74- CAPEX (w/ inflation) 547 - - - - 195 - -- ANWC 2.9 23.5 1.3 1.4 1.5 1.5 1.6 1.7 1.8Free Cash Flow (549.86) 42.36 67.32 70.14 73.10 (119.06) 83.38 86.81 90.41
Discounted Cash FlowDiscount factor 1.00 0.87 0.76 0.66 0.58 0.51 0.44 0.38 0.34Discounted cash flows (FCF) (549.86) 36.95 51.24 46.57 42.34 (60.16) 36.75 33.38 30.33
PV of FCF (258.79) IRR (FCF) 3%PV of PerpetuityTotal NPV (258.79)
67 -
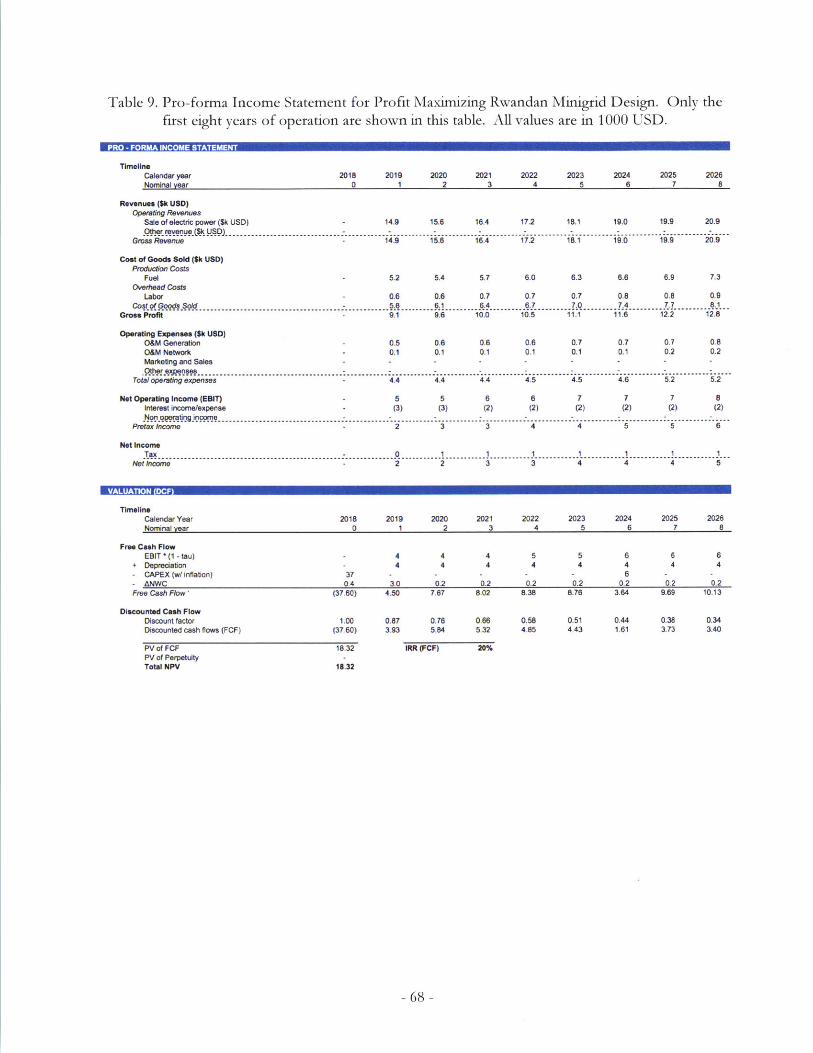
Table 9. Pro-forma Income Statement for Profit Maximizing Rwandan Minigrid Design. Only the
first eight years of operation are shown in this table. All values are in 1000 USD.
PRO - FORMA INCOME STATEMENT
TimellneCalendar year 2018 2019 2020 2021 2022 2023 2024 2025 2026Nominal year 0 1 2 3 4 5 6 7 8
Revenue. ($k USD)Operating Revenues
Sale of electric power (Sk USD) - 14.9 15.6 16.4 17.2 18.1 19.0 19.9 20.9Other reeek I---U-SD) - - --
Gross Revenue - 14.9 15.8 16.4 17.2 18.1 19.0 19.9 20.9
Cost of Goods Sold ($k USD)Production Costs
Fuel - 5.2 5.4 5.7 6.0 8.3 6.6 6.9 7.3Overhwad Costs
Labor - 0.6 0.6 0.7 0.7 0.7 0.8 0.8 0.9Cost of Goods Sold - 5.8 6.1 8.4 6.7 7.0 7.4 7.7 8.1
Gross Profit - 9.1 9.6 10.0 10.5 11.1 11.6 12.2 12.8
Operating Expenses ($k US)O&M Generation 0.5 0.6 0.6 0.6 0.7 0.7 0.7 0.8O&M Network 0.1 0.1 0.1 0.1 0.1 0.1 0.2 0.2Marketing and Sales - - - - - -
Mter.QM.......................................... :.................................................. :............ ..............................Total operating expenses - 4.4 4.4 4.4 4.5 4.5 4.6 5.2 5.2
Not Operating Income (EBIT) - 5 5 6 6 7 7 7 8Interest income/expense - (3) (3) (2) (2) (2) (2) (2) (2)
PrWAx Income 2 3 3 4 4 5 5 6
Net IncomeTax -0 1 1 1 1 1 1
Net Income - 2 2 3 3 4 4 4
VALUATION (DCF)
TimellneCalendar Year 2018 2019 2020 2021 2022 2023 2024 2025 2026Nominal year 0 1 2 3 4 5 6 7 8
Free Cash FlowEBIT*(1-tau) - 4 4 4 5 5 6 6 6
+ Depreciation - 4 4 4 4 4 4 4 4- CAPEX (w/ inflation) 37 - - - - - 6 - -
AWC 0.4 3.0 0.2 0.2 0.2 0.2 0.2 0.2 0.2Free Cash Flow' (37.60) 4.50 7.67 8.02 8.38 8.76 3.64 9.69 10.13
Discounted Cash FlowDiscount factor 1.00 0.87 0.78 0.66 0.58 0.51 0.44 0.38 0.34Discounted cash flows (FCF) (37.60) 3.93 5.84 5.32 4.85 4.43 1.61 3.73 3.40
PV of FCF 18.32 IRR (FCF) 20%PV of Perpetuity -Total NPV 18.32
- 68 -

Table 10. Pro-forma Income Statement for Universal Service Rwandan Minigrid Design. Only thefirst eight years of operation are shown in this table. All values are in 1000 USD.
PRO -FORMA INCOME STATEMENT
TimelinCalendar yearNominal ver
2018 2019 2020 2021 2022 2023 2024 2025 20260 1 2 3 4 5 a 7 8
Revenues ($k USD)operatng Revenues
Sale of electric power (Sk USD) 24.5 25.8 27.1 28.4 29.8 31.3 32.9 34.5
Gross Revenue - 24.5 25.8 27.1 28.4 29.8 31.3 32.9 34.5
Cost of Goods Sold (5k USO)Poducion Costs
Fuel - 8.7 9.1 9.6 10.1 10.6 11.1 11.7 12.3Ovedhead Costs
Labor - 5.0 5.3 5.6 5.8 6.1 6.4 6.8 7.1CosgofGSo ... Sol. 13.8 14. 15.2 15.9 16.7 17.6 18.4 19.4
Gross Profit - 10.8 11.3 11.9 12.5 13.1 13.8 14.5 15.2
Operating Expenses ($k USD)O&M Generation - 0.8 0.9 0.9 1.0 1.0 1.1 1.1 1.2O&M Network - 0.2 0.2 0.2 0.2 0.3 0.3 0.3 0.3Depreciation and Amortization - 8.4 8.4 8.4 8.4 8.4 8.4 10.7 10.7
.................................... ........... :......................... ................. ............ .......... .........Total operating expenses 9.5 9.5 9.6 9.6 9.7 9.8 12.0 12.1
Net Operating Income (EBIT) - 1 2 2 3 3 4 2 3Interest incorne/expense - (6) (6) (5) (5) (5) (4) (4) (4).Nglo gerating incoe...........................................................
Pretax AnCorne (5) (4) (3) (2) (1) (0) (2) (1)
Net IncomeTax ------------------------- tt--------- il--------- 1)---------- C)---------- M--------- 11.....1)---------- - (). LO).)- P
N -t -nc-- - - (4) (3) (2) (2) (1) (0) (1) (1)
VALUATION (DCF)
TImellneCalender YearNominal vear
2018 2019 2020 2021 2022 2023 2024 2025 20260 1 2 3 4 5 6 7 8
Free Cash FlowEBIT(1 -lau)
+ Depreciation- CAPEX (wf inflation)- ANWFree Cash Flow
840.7
(85.17)
Discounted Cash FlowDiscount factorDiscounted cash flows (FCF)
PV of FCFPV of PerpetuityTotal NPV
1 1 2 2 3 3 28 8 8 8 8 8 11
- 22 -4.9 0.3 0.3 0.3 0.3 0.3 0.4
4.54 9.59 9.99 10.40 10.84 (10.82) 12.22
211
75.4
5.86
1.00 0.87 0.76 0.66 0.58 0.51 0.44 0.38 0.34(85.17) 3.96 7.30 6.63 6.02 5.48 (4.77) 4.70 1.97
(38.35)
(36.35)
IRR (FCF) 6%
- 69 -
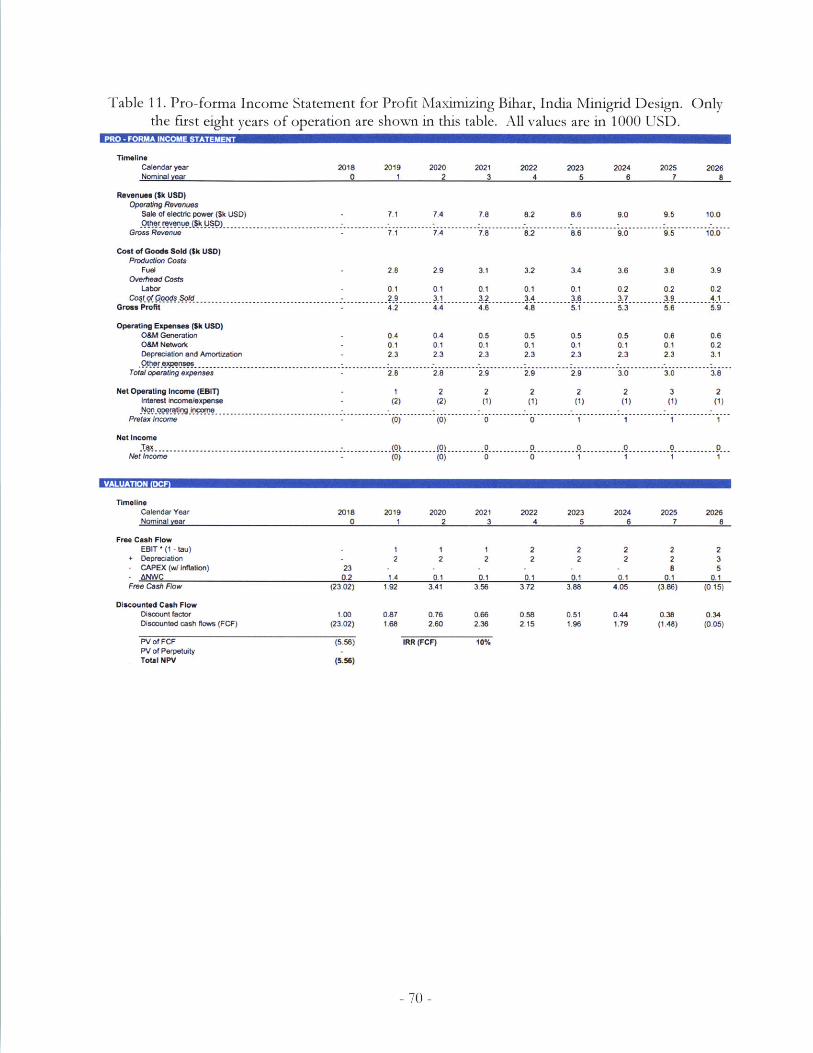
Table 11. Pro-forma Income Statement for Profit Maximizing Bihar, India Minigrid Design. Onlythe first eight years of operation are shown in this table. All values are in 1000 USD.
PRO -FORMA INCOME STATEMENT
TimeIlneCalendar year 2018 2019 2020 2021 2022 2023 2024 2025 2026Nominal Year 0 1 2 3 4 5 6 7 8
Revenues ($k USD)Operatng Revenues
Sale of electric power (Sk USD) - 7.1 7.4 7.8 8.2 8.6 9.0 9.5 10.0Other reventue A$ USC) - ------------- I : :
Gross Revenue - 7.1 7.4 7.8 8.2 8.6 9.0 9.5 10.0
Cost of Goods Sold ($k USO)Production Costs
Fuel - 2.8 2.9 3.1 3.2 3.4 3.6 3.8 3.9Overhead Costs
Labor - 0.1 0.1 0.1 0.1 0.1 0.2 0.2 0.2
Gross ProfIt - 4.2 4.4 4.6 4.8 5.1 5.3 5.6 5.9
Operating Expenses ($k USD)O&M Generation - 0.4 0.4 0.5 0.5 0.5 0.5 0.6 0.6O&M Network - 0.1 0.1 0.1 0.1 0.1 0.1 0.1 0.2Depreciation and Amortization - 2.3 2.3 2.3 2.3 2.3 2.3 2.3 3.1
Total operating expenses - 2.8 2.8 2.9 2.9 2.9 3.0 3.0 3.8
Net Operating Income (EBIT) - 1 2 2 2 2 2 3 2Interest incomelexpense (2) (2) (1) (1) (1) (1) (1) (1)
Pretax Income - (0) (0) 0 0 1 1 1 1
Net IncomeTax ..... (.......)a.... 10...... 0 0 0 0 00
Net --come - (0) (0) 0 0 1 1 1 1
VALUATION (DCF)
TimellneCalendar Year 2018 2019 2020 2021 2022 2023 2024 2025 2026Nominal Year 0 1 2 3 4 5 6 7 8
Free Cash FlowEBIT*(1-tau) - I 1 1 2 2 2 2 2
+ Depreciation - 2 2 2 2 2 2 2 3CAPEX (wl Inflation) 23 - - - - - - a 5ANWC 0.2 1.4 0.1 0.1 0.1 0.1 0.1 0.1 0.1
Free Cash Flow (23.02) 1.92 3.41 3.56 3.72 3.88 4.05 (3.86) (0 15)
Discounted Cash FlowDlscount factor 1.00 0.87 076 0.66 0,58 0.51 0.44 0.38 0.34Discounted cash flows (FCF) (23.02) 1.68 2.60 2.36 2.15 1.96 1.79 (1.48) (0.05)
PV of FCF (5.58) IRR (FCF) 10%PV of PerpetuityTotal NPV (5.56)
- 70 -
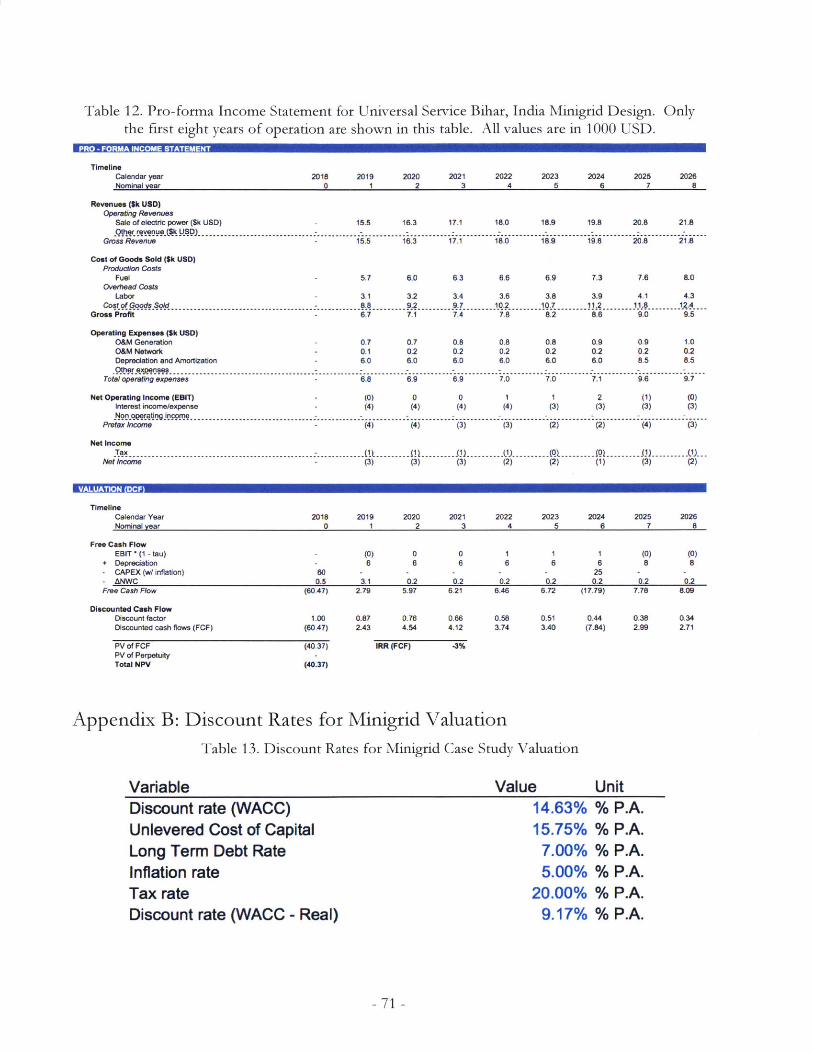
Table 12. Pro-forma Income Statement for Universal Service Bihar, India Minigrid Design.the first eight years of operation are shown in this table. All values are in 1000 USD.
PRO - FORMA INCOME STATEMENT
TimellneCalendar yearNnmIna! yeer
Only
2018 2019 2020 2021 2022 2023 2024 2025 20260 1 2 3 4 A 5 7 R
Revenues (Sk USD)Operating Revenues
Sale of electric power (Sk USD) - 15.5 16.3 17.1 18.0 18.9 19.8 20.8 21.8
Gross Revenue ii1.5 18.3 17.1 18.0 18.9 19.8 20.8 21.8
Cost of Goods Sold ($k USD)Production Costs
Fuel 5.7 6.0 6.3 6.6 6.9 7.3 7.6 8.0Overhead Costs
Labor - 3.1 3.2 3.4 3.6 3.8 3.9 4.1 4.3CostofGoods Sold .8 9.2 9.7 10.2 10.7 11.2 11.8 12.4
Gross Profit - 6.7 7.1 7.4 7.8 8.2 8.8 9.0 9.5
Operating Expenses ($k USD)O&M Generation - 0.7 0.7 0.8 0.8 0.8 0.9 0.9 1.0O&M Network - 0.1 0.2 0.2 0.2 0.2 0.2 0.2 0.2Depredation and Amortization - 6.0 6.0 6.0 6.0 6.0 6.0 8.5 8.5
Total operating expenses - 6.8 6.9 6.9 7.0 7.0 7.1 9.6 9.7
Not Operating Income (EBIT) - (0) 0 0 1 1 2 (1) (0)Interest income/expense - (4) (4) (4) (4) (3) (3) (3) (3)Non operatina Income.....................................................................................
Pretax Income - (4) (4) (3) (3) (2) (2) (4) (3)
Net IncomeTax---------------------------(it - 11 . (1) (1) - (M) - (O9 () (1)
Nef -ncome - (3) (3) (3) (2) (2) (1) (3) (2)
VALUATION CF
TimellneCalendar YearNomninol veer
2018 2019 2020 2021 2022 2023 2024 2025 20260 1 2 3 4 5 a 7 8
Free Cash FlowEBIT * (1 - tau)
+ Depreciation- CAPEX (w/ inflation)- ANWCFree Cash Flow
Discounted Cash FlowDiscount factorDiscounted cash flows (FCF)
PV of FCFPV of Perpetuity
(0) 0 0- 6 6 6s0 - -
0.5 3.1 0.2 0.2
16
0.2
16
0.2
625
0.2(60.47) 2.79 5.97 6.21 6.46 6.72 (17.79) 7.78 8.09
1.00 0.87 0.76 0.66 0.58 0.51 0.44 0.38 0.34(60.47) 2.43 4.54 4.12 3.74 3.40 (7.84) 2.99 2.71
(40.37) IRR (FCF) -3%
Total NPV (40.37)
Appendix B: Discount Rates for Minigrid Valuation
Variable
Table 13. Discount Rates for Minigrid Case Study Valuation
Value UnitDiscount rate (WACC)Unlevered Cost of CapitalLong Term Debt RateInflation rateTax rateDiscount rate (WACC - Real)
14.63% % P.A.15.75% % P.A.
7.00% % P.A.5.00% % P.A.
20.00% % P.A.9.17% % P.A.
- 71 -
(0)8
0 .2
(0)8
0.2
Nominal veer
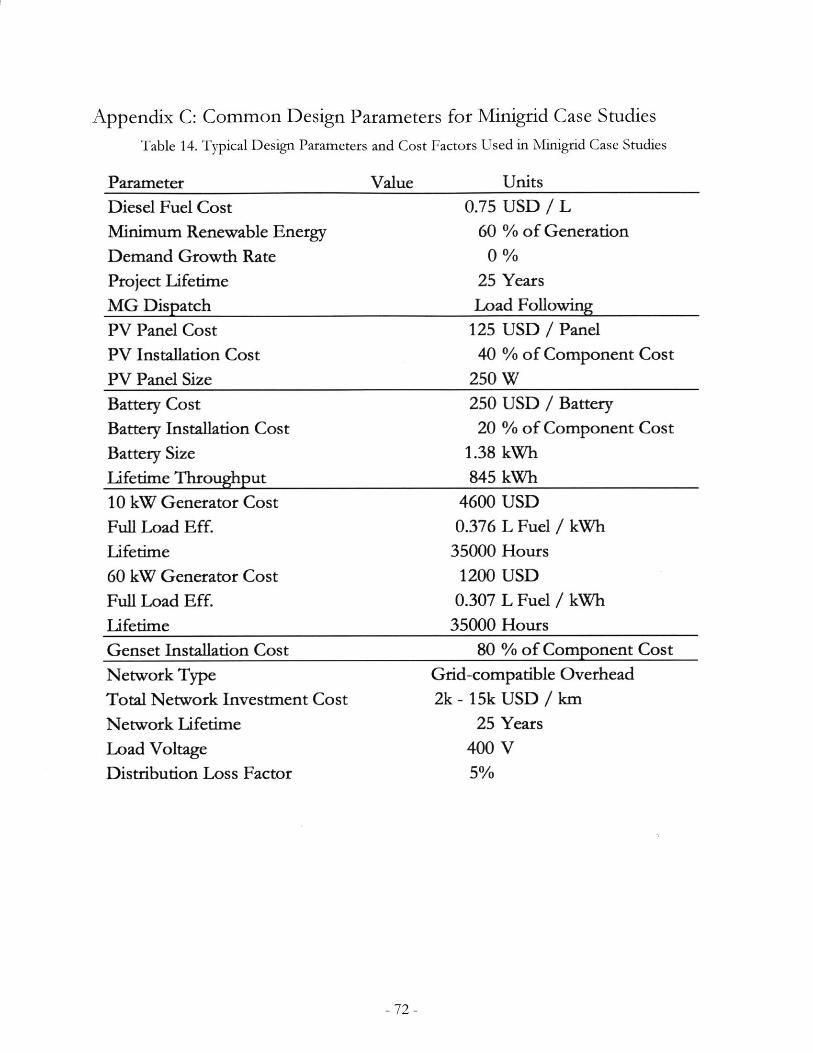
Appendix C: Common Design Parameters for Minigrid Case Studies
Table 14. Typical Design Parameters and Cost Factors Used in Minigrid Case Studies
ParameterDiesel Fuel CostMinimum Renewable EnergyDemand Growth RateProject LifetimeMG DispatchPV Panel CostPV Installation CostPV Panel SizeBattery CostBattery Installation CostBattery SizeLifetime Throughput10 kW Generator CostFull Load Eff.Lifetime60 kW Generator CostFull Load Eff.LifetimeGenset Installation CostNetwork TypeTotal Network Investment CostNetwork LifetimeLoad VoltageDistribution Loss Factor
Value Units
0.75 USD / L60 % of Generation
0%25 Years
Load Following
125 USD / Panel
40 % of Component Cost
250 W250 USD / Battery
20 % of Component Cost
1.38 kWh
845 kWh
4600 USD0.376 L Fuel / kWh
35000 Hours
1200 USD
0.307 L Fuel / kWh
35000 Hours
80 % of Component Cost
Grid-compatible Overhead
2k - 15k USD / km
25 Years
400 V
5%
- 72 -
-A