'LL1 4 - DSpace@MIT
57
December 1, 1970 ENGINEERING PROJECTS ,NGINEERING PROJECTS 1GINEERING PROJECTS INEERING PROJECTS NEERING PROJECTS 'EERING PROJECTS 'ERING PROJECTS RING PROJECTS ING PROJECTS 4G PROJECTS PROJECTS PROJECTS ROJECT POJECTS POETS REFRIGERANT FORCED- CONVECTION CONDENSATION INSIDE HORIZONTAL TUBES Soonhoon Bae John S. Maulbetsch Warren M. Rohsenow Report No. DSR 72591-71 American Society of Heating, Refrigerating and Air Conditioning Engineers Contract No. ASHRAE RP 63 Engineering Projects Laboratory Department of Mechanical Engineering Massachusetts Institute of Technology Cambridge, Massachusetts 02139
-
Upload
khangminh22 -
Category
Documents
-
view
3 -
download
0
Transcript of 'LL1 4 - DSpace@MIT

A
'LL1
4
December 1, 1970
ENGINEERING PROJECTS,NGINEERING PROJECTS
1GINEERING PROJECTSINEERING PROJECTSNEERING PROJECTS'EERING PROJECTS
'ERING PROJECTSRING PROJECTS
ING PROJECTS4G PROJECTS
PROJECTSPROJECTS
ROJECT
POJECTSPOETS
REFRIGERANT FORCED- CONVECTIONCONDENSATION INSIDE HORIZONTALTUBES
Soonhoon BaeJohn S. MaulbetschWarren M. Rohsenow
Report No. DSR 72591-71
American Society of Heating, Refrigeratingand Air Conditioning EngineersContract No. ASHRAE RP 63
Engineering Projects LaboratoryDepartment of Mechanical EngineeringMassachusetts Institute of TechnologyCambridge, Massachusetts 02139

TECHNICAL REPORT NO. 72591-71
REFRIGERANT FORCED-CONVECTION CONDENSATION
INSIDE HORIZONTAL TUBES
by
Soonhoon BaeJohn S. MaulbetschWarren M. Rohsenow
Sponsored by:-
TECHNICAL COMMITTEE 1.3
AMERICAN SOCIETY OF HEATING, REFRIGERATING AND AIR CONDITIONING ENGINEERS
Contract No: ASHRAE RP63
DSR Project No: 72591-71
December 1, 1970
Heat Transfer LaboratoryMechanical Engineering Department
Massachusetts Institute of Technology
Massachusetts Avenue, Cambridge, 02139

- 1 -
REFRIGERANT FORCED-CONVECTION CONDENSATION
INSIDE HORIZONTAL TUBES
by
Soonhoon Bae, York Division, Borg-Warner CorporationJohn S. Maulbetsch, Dynatech Corporation
Warren M. Rohsenow, Massachusetts Institute of Technology
ABSTRACT
High vapor velocity condensation inside a tube was studied theoreti-
cally. The heat transfer coefficients were calculated by the momentum
and heat transfer analogy. The Von Karman universal velocity dis-
tribution was applied to the condensate flow. Pressure drop was
calculated by the Lockhart-Martinelli method and the Zivi void fraction
equation.
Experimental data was obtained for the mass velocities from 150,000
to 555,000 lbm/ft2 hr for R-12 and R-22 condensing in a 0.493" I.D.
18 ft. long test section. The measured heat transfer coefficients
agreed with the prediction within 10% except a few points in the very
low quality region.

- 2 -
INTRODUCTION
When condensation takes place inside a horizontal tube with high
vapor velocity, condensate flows in an annular shape on the tube wall
and vapor flows in the core.
Many investigators have studied this subject both experimentally
and analytically. Empirical correlations involving non-dimensional
groups were not quite successful because the correlations did not
include all the flow variables [1], [2], [5], [7], [12]. Carpenter
and Colburn [6] considered only the laminar sublayer of condensate flow
and derived an equation with an empirical constant. This method was
modified by later investigators [3], [15]. For a small range of the
Prandtl Number, this equation gives good agreement with empirical data.
But the equation has no general applicability. Rohsenow, Webber and
Ling [14] analyzed the liquid film on the vertical plate and the heat
transfer coefficient was obtained by the heat and momentum transfer
analogy. A similar approach appeared in later papers [8], [9]. This
method will be developed further for the annular flow regime in this
paper.
THEORY
Flow Model
For condensation inside a horizontal tube with high vapor velocities,
annular flow is the predominent flow pattern and slug flow may appear
at very low vapor qualities. Annular flow with a uniform liquid layer
thickness around the circumference of a tube is assumed to exist in
the parameter ranges of interest. The condensate accumulation at
the bottom of a horizontal tube has a negligible effect except at
very low vapor flow rates. At very high vapor flow rates entrainment

- 3 -
of liquid droplet in the vapor may occur but this will be neglected
in the following analysis.
Consider a length element of a tube, shown in Fig. 1. For the
entire cross-section the momentum equation is
-( )A S + A -[ap +dz o0 z0 v (1 -a) p ] = Md (vV + Wz) (1)
where a is an acceleration due to the external body force. Rearranging
Eq. (1) yields
-( ) = T -y + (1 - a)pz] + 1 d (UvWV + U W ) (2)dz 0Az o0 o z z v k9
The above equation shows that the total static pressure gradient
is the sum of pressure gradients due to friction,gravity and momentum
change.
fdP\ /O (dP (dPI\dz) Z) fdz +dz \dz
f g ) m(3)
Comparing Eq. (2) and (3),
(dP \d-z
C dPd z
S-T o A
z
- [apy + (1-a)pz]
g A d (UvW + U W )dz vvz
The friction pressure drop was obtained by an approximation of the
Lockhart-Martinelli method (11] as follows:
(4)
(5)
(6)

- 4-
f G gD z g D
(dz f G 2/PV z G 2/P
0.0523
+ 5. 7(Pi)yv
0.105
+ 8.11 -yv P)
(1 - x)
(1 - x)
-0.09 GD -0.2
Vv1.8 +
0.470 1.33 PV 0.261
x
0.94 0.86 pv 0.522
x )- ])xl
This empirical approximation was developed by Soliman et al [15]
who used this equation to calculate T . Here it is used to calcu
T0 as Lockhart-Martinelli suggest.
The gravity term, Eq. (5), can be rewritten in the following
form:
dPN go =D 1 [ - Ba]dz g G 2/pv v
where
F (G/p ) 2
Fr = aD
is the Froude number based on the total flow and
B - -
Pv
is the buoyancy modulus. In the gravity field
a = g sin 6
The Zivi equation for local void fraction [17] is recommended for
use in Eq. (8), as in reference [15].
(7)
Late
(8)
(9)
(10)
(11)
(12)
1+ ( X-)(v 2/3

- 5
The momentum term, Eq. (6), can be written with Eq. (12) as follows:
gD = - D('d~P ) g2
m G /py
2/3
+ (1 - 2x) ()
[2x + (1 -
- 2(1 - x) ]
2x)(p v
p2,
1/3
(13)
where in Eq. (6)
W = GAzx = AzaUvP
(14)
W = GA z(1-x) = A z(1-a)Up
The momentum equation for the entire liquid layer element, Fig.2, is
- (d A + TvSAv ~ S +- p90 21
1 d(Uk W Y) dW i
go dz
Az S= F + v
0 o S V S
dP a 1 d(U kW )F -- + 0 - g A ' dz ~o dzz
dW ii dz
(15a)
(15b)
(16)
Since for most of the tube length the liquid film is thin,
a simple flat plate analysis will suffice for the heat transfer
coefficient derivation.
The A /S ~ 6 and Sv/S ~ 1; so Eq. (15b) becomes
(17)T =F 6 + T0 0 v
where

- 6 -
The quantity F may be expressed in terms of x and a by substituting
Eqs. (12) and (14) into Eq. (16). Further from the universal velocity,
Eq. (B-1), distribution (U /U ,) E may be obtained as a unique
function of 6+ as shown in Fig. 3. Then Eq. (17) becomes
F = dP a G dx 1 1/30 djz). g 0 0pvdz Lia K P
(1 -x)(2 - / v (18)
S (1 - a)2 / kPP
where E /U is given by Fig. 3.
To determine the heat transfer coefficient it is assumed that
the Karman momentum-heat transfer analogy analysis is applicable
in the liquid layer. Then
p dvT= (V + E: ) Z (19a)g V+m dy
q/A = p c ( + h (19b)
The universal velocity distribution is used to determine dvz/dy,
em is assumed equal to Ch, and dT/dy and T(y) is determined by combining
the above two equations. The procedure is identical with that presented
in detail by Rohsenow, Webber and Ling [14] with two exceptions. In
determining this temperature distribution, the momentum equation for
the element (6-y) of Fig. 2 was approximated as
T = F 0(6-y) + Ty

- 7 -
and no criterion for transition from laminar to turbulent flow in
the film was used. The suggestion of Dukler [8] to integrate the
equations and let the universal velocity distribution establish
the flow regime was adopted. The details of the analysis are outlined
in Appendix B. The results are
hzD pzc D uTNuz - - (21a)z k Y kk F2
or h
uSt z - (21b)z Pk ck u F 2
where
U =r L 0(22)
and
for 0 < 6+ < 5: F = 6 Pr (23a)
for 5 < 6+ < 30: F2 = 5Pr + 52n[l + Pr ( + 1)] (23b)
for 6 > 30: V' = 5Pr + 5n(l + 5Pr) + '5-- x
2 1 +Pr 6+
21-+ 1 10 M 6 1 1 0M 72m-1 + M - 1 - 1 +
xln (23c)
1 10 __ 60 +1+ M2M-1 - 1 + Yr+ +M -1 + 1 + P6 6
Here F 6 veM 0 (24)
0 T
and
6 E 6 u /v (25)

- 8 -
Further Re defined as
6+
Re- (-x)GD -= -- 4 dy = 4 y dy + (26)k I Pydyjz v z
0 0
is evaluated from the velocity distribution Eq. (B-1) with the
following results:
6+ < 5 Re = 2(6+)2 (27a)
5 < 6+ < 30 Re = 50 - 32.2 6 + 206+1n6+ (27b)
6+ > 30 Re = -256 + 126 + 106+1n6+ (27c)
A plot of Re vs 6+ is shown in Fig. 4.
For any assumed magnitude of Pr, 6+ and M, calculate Re from
Eq. (27), F2 from Eq. (23) and St from Eq. (21b). Then curves
*of St vs Re for various M can be constructed. Fig. 5 for Pr = 1
and 5 was drawn by this procedure.
The calculation procedure starts by dividing the tube length
in increments of changes in quality x and for a given flow rate and
fluid conditions calculate the increment of length required to
accomplish this quality change. The calculation is a step-wise
one requiring trial-and-error at each step. The procedure is outlined
in a sample calculation in Appendix A.
Average Heat Transfer Coefficient
For the case of uniform wall temperature a mean heat transferL
coefficient hm may be defined by hm = (1/L) f hzdz. Then.0
(28)q = r7Dh = h AT fDLL fgm

- 9 -
For an element of length dz
dq = rD h dF = h AT rD dz (29)gh z
Rearrange Eq. (29) and integrate
rL LrLdl' AT AT L
= dz = -L= (30)ho h ho z fg o fg m
Then from Eq. (30) with Eq. (26)
1 1 dF 1 [e~e dRek (31)
h r" h Re hm e o z 2 e o z
or since Re -(l-x) from Eq. (26), this becomes
dx (32)m e x ze
From the hz calculated along the length, this length mean
heat transfer coefficient may be calculated integrating with respect
to quality as an alternative.
EXPERIMENT
The basic apparatus, schematically shown in Figure 6, consists
of a closed-loop refrigerant flow circuit driven by a mechanical-
sealed rotor pump. Upstream of the test section, an electrically
heated boiler produces vapor, which passes through a flow meter and
a throttle valve to the test section. Downstream of the test section,
an after-condenser was provided to ensure fully condensed refrigerant
at the pump inlet. The pump flow was set for any test run and flow

- 10 -
rate in the test section was controlled by the by-pass loop. The
pressure level was set by adjusting the heat input to the boiler and
the throttle valve.
The test section itself is an annular shaped heat exchanger
with refrigerant flowing through the inner tube and cooling water
flowing in the outer annulus counter-currently. The 0.493 in. ID.
smooth nickel tube test section was divided into six 3 ft-long sections.
Each section has a separate cooling water circuit and the sections
are connected smoothly with specially made stainless steel fittings
in order not to disturb the condensate flow.
Each of the six sections except the third section from the
inlet was separately and identically instrumented to give basic
data on the condensing refrigerant. Two thermocouples are placed
in the middle of the 3 ft section at the side; one at the outside
of the condenser tube and the other one in the vapor at the center
of the tube. Two differential thermocouples between the inlet and
the outlet of the cooling water circuit are located in two different
radial positions in order to detect any possible non-uniformity in
temperature. On the third section, in addition to the above thermo-
couples, two more thermocouples are placed at the top and bottom of
the tube wall to measure any circumferential variation of the wall
temperature.
All the thermocouples were made of 0.005 in. O.D. nylon-sheathed
copper and constantan wire.
Seven pressure taps were installed at every connection between
the 3 ft sections for measurement of local pressure gradients.

- 11 -
All the loop except the part from the pump to the boiler was
insulated with fiberglass. The heat transfer between the test section
and the atmosphere was not measurable in a blanked off run with no
vapor flow.
Data were taken after steady state had been attained for one hour
in the system. The heat flux to the coolant was obtained from the
coolant flow rate and the temperature change. The condensing wall
temperature was determined from the outside tube wall temperature and
the heat flux. All the measurements were done on one 3 ft section at
a time from up-stream to down-stream. The coolant flow was regulated
such that the wall temperatures were kept almost constant through
the test section and the temperature change of the coolant was in the
range of 1 to 3*F.
Heat balance was checked with total enthalpy change from the inlet
of the test section to the outlet of the after-condenser. In most
runs, except Run 1, the heat balance error was less than + 6%.
The data for both R-12 and R-22 are tabulated in the Appendix.
Pressure drop data was taken only for R-22. Figures 7, 8, 9 are
samples of the plot of the data but are representative of all of the
data. Additional plots of the data are presented in references [18]
and [19].
DISCUSSION OF RESULTS
Since the theoretical analysis was based on the annular flow
model, the results are applicable only to the case where annular
flow is developed. To date no successful investigation has been
made of condensation flow regimes. For gas and oil mixtures,

- 12 -
a flow regime map was drawn by Baker [4], but it may not be applicable
to two-phase flow with condensation. However, it surely gives an
approximate view of the flow regime boundaries of condensation.
Quandt [13] analyzed qualitatively the force field of gas-liquid
flow. Still a quantitative figure of the flow regime boundaries
cannot be obtained from an analysis. Therefore, until more re-
liable information about flow regimes of vapor-liquid flow with
condensation is available, it is recommended that the Baker plot
be used for determining probable flow regimes.
In most cases of practical forced-convection flow the regime
appears to be annular except at the very low quality region. This
analysis is not applicable to the very low quality region because
the flow regime may be different and because the condensate film
is so thick that the flat plate analysis is no longer valid for a
tube. The present method is therefore not suggested for use when
the vapor quality is less than 20%. A fared curve between the present
correlation at x = 0.20 and McAdams equation for single phase flow
(x = 0) will give useful information for the low quality region.
Entrainment of liquid in the vapor core was neglected in the
analysis. Since thermal resistance is mainly offered by the laminar
sublayer and the buffer layer, the entrainment effect is not signif-
icant when the condensate film thickness is larger than that of the
high thermal resistance layers (6+ > 30). However, as expected,
the effect appears to be significant at the very high vapor quality
region where a very thin film exists (6+ < 5), as shown in some
of the test runs. In a few runs at very high vapor flow rate when
a considerable amount of entrainment was produced, the theory predicted

- 13 -
lower values of h than those measured.
As the total flow rate decreases to low values, the thickness
of the liquid film on the wall of a horizontal tube may be changed
significantly. Even though the flow shape becomes an eccentric
annulus, the analysis may give a good prediction because the heat
transfer coefficient increases at the top and decreases at the
bottom of the tube when this happens. However when truly stratefied
flow exists another theory should be used.
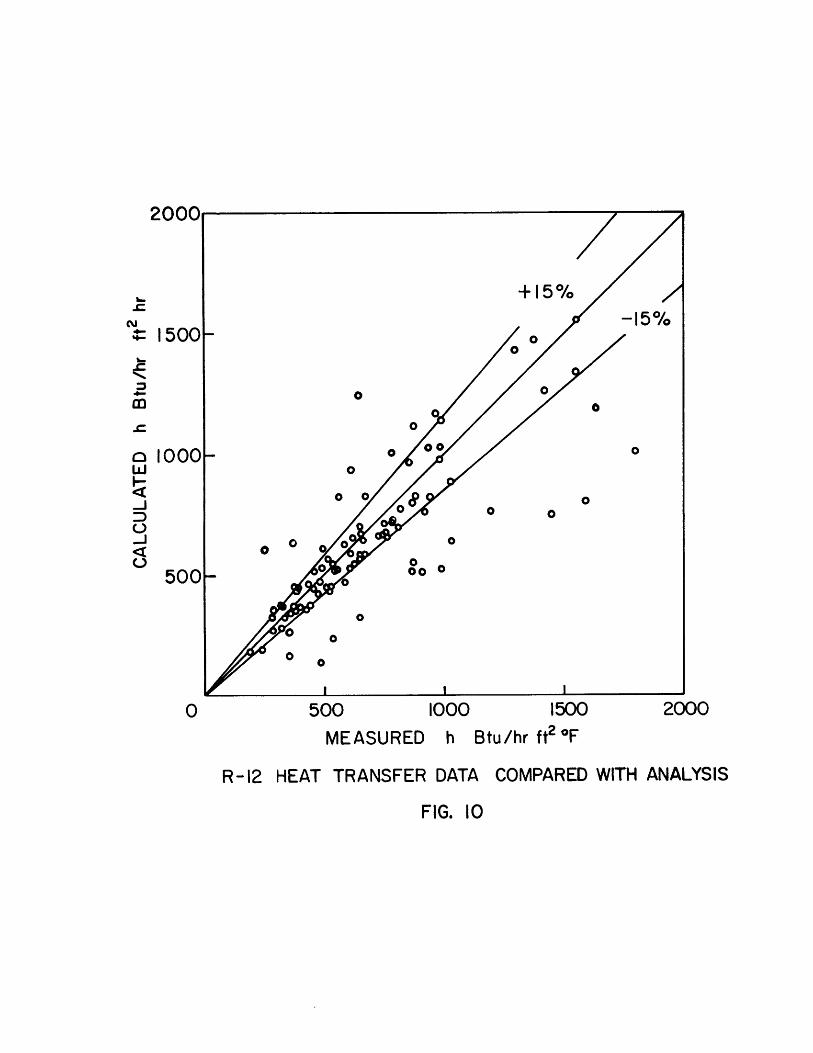
The agreement with the present data is within 10% except for
a few low quality points. In general predictions are slightly lower
than the experimental data within the range of measurement accuracy,
Figs. 7, 8, 10, and 11. The pressure drop measurements, Figs. 9
and 12, also show good agreement except for Run 8. It is interesting
to note that at the upstream end of the condensing tube the predicted
pressure gradient has a negative slope. However, the measurement
shows the opposite trend. Except for Runs 5 and 8, the pressure drop
of the first section is always higher than that of the other sections.
Other Comparisons
Figure 13 shows the present data plotted on coordinates suggested
by Akers and Rosson [2]. The solid lines represent their recommended
correlation equations. Practically all of the data fall well above
this recommendation. A plot of this same data [18] on coordinates
suggested by Brauser [5] shows an equally large scatter. It is not
surprising that such scatter should exist. In Fig. 13 the h for
a given AT and pressure is essentially a function of Gv independent
of quality. For the same Gv the liquid layer thickness, which
- 14 -
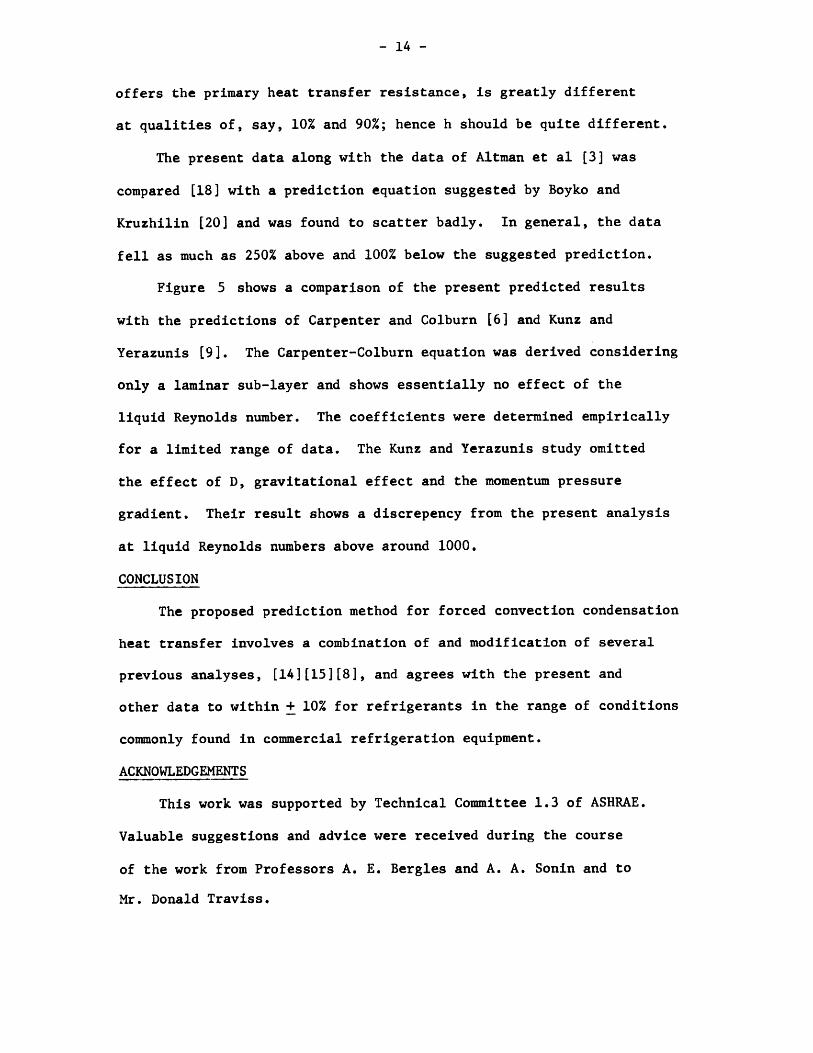
offers the primary heat transfer resistance, is greatly different
at qualities of, say, 10% and 90%; hence h should be quite different.
The present data along with the data of Altman et al [3] was
compared [18] with a prediction equation suggested by Boyko and
Kruzhilin [20] and was found to scatter badly. In general, the data
fell as much as 250% above and 100% below the suggested prediction.
Figure 5 shows a comparison of the present predicted results
with the predictions of Carpenter and Colburn [6] and Kunz and
Yerazunis [9]. The Carpenter-Colburn equation was derived considering
only a laminar sub-layer and shows essentially no effect of the
liquid Reynolds number. The coefficients were determined empirically
for a limited range of data. The Kunz and Yerazunis study omitted
the effect of D, gravitational effect and the momentum pressure
gradient. Their result shows a discrepency from the present analysis
at liquid Reynolds numbers above around 1000.
CONCLUSION
The proposed prediction method for forced convection condensation
heat transfer involves a combination of and modification of several
previous analyses, [14][15][8], and agrees with the present and
other data to within + 10% for refrigerants in the range of conditions
commonly found in commercial refrigeration equipment.
ACKNOWLEDGEMENTS
This work was supported by Technical Committee 1.3 of ASHRAE.
Valuable suggestions and advice were received during the course
of the work from Professors A. E. Bergles and A. A. Sonin and to
Mr. Donald Traviss.

- 15 -
REFERENCES
1. Akers, W. W., H. A. Deans and 0. K. Crosser, "Condensing HeatTransfer Within Horizontal Tubes," Chemical Engineering Progress,Vol. 54, pp. 89 (1958).
2. Akers, W. W. and H. F. Rosson, "Condensation Inside a HorizontalTube," Chemical Engineering Progress, Symposium Series, HeatTransfer, Storrs, Vol. 56, No. 30 (1960).
3. Altman, M., F. W. Staub and R. H. Norris, "Local Heat Transferand Pressure Drop for Refrigerant-22 Condensing in HorizontalTubes," ASME-AIChE, Heat Transfer Conference, Storrs, Conn. (1959).
4. Baker, 0., "Simultaneous Flow of Oil and Gas," The Oil and GasJournal, Vol. 53, pp. 185-195 (1954).
5. Brauser, S. 0., "Turbulent Condensation in a Horizontal Tube,"Ph.D. Thesis, Dept. of Mechanical Engineering, Kansas StateUniversity (1966).
6. Carpenter, E. F. and A. P. Colburn, "The Effect of Vapor Velocityon Condensation inside Tubes," Proceedings of the General Discussionof Heat Transfer, I. Mech. E. and ASME (1951).
7. Chen, C. J., "Condensing Heat Transfer in a Horizontal Tube,"M.S. Thesis, Dept. of Mechanical Engineering, Kansas StateUniversity (1962).
8. Dukler, A. E., "Fluid Mechanics and Heat Transfer in VerticalFalling-Film System," Chem. Eng. Symposium Series, Vol. 56, No.30 (1960).
9. Kunz, H. R. and S. Yerazunis, "An Analysis of Film CondensationFilm Evaporation, and Single-Phase Heat Transfer for LiquidPrandtl Numbers From 10-3 to 104," Heat Transfer Conference,Seattle, Washington, Paper No. 67-HT-1 (1967).
10. Linehan, J. H., "The Interaction of Two-Dimensional, Stratified,Turbulent Air-Water and Steam-Water Flows," Argonne NationalLaboratory, ANL-7444 (1968).
11. Lockhart, R. W. and R. C. Martinelli, "Proposed Correlationof Data for Isothermal Two-Phase, Two-Component Flow in Pipes,"Chemical Engineering Progress, Vol. 45, No. 1, pp. 39 (1949).
12. Patel, S. P., "Film Coefficient of Heat Transfer of Freon-12
Condensing inside a Single Horizontal Tube," M.S. Thesis, Kansas
State University (1956).
13. Quant, E., "Analysis of Gas-Liquid Flow Patterns," AIChE, 6thNational Heat Transfer Conference, Preprint 47, (1963).

- 16 -
14. Rohsenow, W. M., J. H. Webber and A. T. Ling, "Effect of VaporVelocity on Laminar and Turbulent-Film Condensation," Trans.ASME, pp. 1637 (1956).
15. Soliman, M., J. R. Schuster and P. J. Berenson, "A General HeatTransfer Correlation for Annual Flow Condensation," Trans. ASME,Journal of Heat Transfer, Series C, Vol. 90, No. 2 (1968).
16. "Thermodynamic Properties of Freon-22," Du Pont (1964).
17. Zivi, S. M., "Estimation of Steady-State Steam Void-Fractionby Means of the Principle of Minimum Entropy Production,"Journal of Heat Transfer, Trans. ASME, Series C, Vol. 86, pp.247 (1964).
18. Bae, S., J. S. Maulbetsch and W. M. Rohsenow, "Refrigerant-12Forced-Convection Condensation Inside Horizontal Tubes,"Rep. No. DSR 79760-59, Heat Transfer Lab., Mass. Inst. of Tech.,Cambridge, Mass., Nov. 1, 1968.
19. Bae, S., J. S. Maulbetsch and W. M. Rohsenow, "Refrigerant-22Forced-Convection Condensation Inside Horizontal Tubes,"Rep. No. DSR 79760-64, Heat Transfer Lab., Mass. Inst. of Tech.,Cambridge, Mass., Nov. 1, 1969.
20. Boyko, L. D. and G. N. Kruzhilin, "Heat Transfer and HydraulicResistance during Condensation of Steam in a Horizontal Tubein a Bundle of Tubes," Int. Jrl. Heat and Mass Transfer, Vol.10, p. 361, March 1967.
21. Kosky, P. G. and F. Staub, "Local-Condensing Heat TransferCoefficient in the Annular Flow Regime," To be presented atAIChE 63rd Annual Meeting, Nov. 1970.

- 17 -
Nomenclature
A cross section area ft2z
a actual gravitational acceleration in the axial direction,g sin e ft/hr2
B buoyancy modulus, Eq. (10)
Cp specific heat Btu/lbm *F
D tube inner diameter ft
F defined in Eq. (16) lbf/ft 2/ft
F2 defined in Eq.(23a, b, c)
Fr Froude number, Eq. (9)
g gravitational acceleration ft/hr2
82g constant, 4.17 x 10 lbm ft/lbf hr2
G total mass velocity lbm/ft 2
h local heat transfer coefficient Btu/hr ft2 *Fz
h mean heat transfer coefficient Btu/hr ft2 *Fm
K conductivity of the liquid Btu/ft hr *F
M defined in Eq. (24)
(dP/dz) Pressure Gradient lbf/ft 2/ft
Pr Prandtl number y C /K
(q/A) heat flux Btu/ft 2hr
Re local liquid Reynolds number G(l-x)D
S perimeter ft
St Stanton Number zZ p uT
T temperature *F
U mean velocity ft/hr
u friction velocity \ 0 ft/hrT ' Pk

- 18 -
vz
W 9
Wv
x
y
z
6
e:
p
T
Tvv
Subscript
6
e
f
g
h
i
local velocity in the axial direction ft/hr
liquid flow rate ibm/hr
vapor flow rate ibm/hr
quality
radial distance from the wall ft
axial distance from the condensation starting point ft
void fraction
thermal diffusivity K/pCp ft2 hr
U /UL
thickness of the condensate film ft
eddy diffusivity ft2hr
angle of inclination
viscosity lbm/ft hr
kinematic viscosity ft 2/hr
density lbm/ft3
shear stress lbf/ft 2
vapor shear stress on the liquid film lbf/ft 2
liquid flow rate per unit circumference lbm/ft hr
liquid vapor interface
exit
friction
gravity
thermal
interface
liquid

- 19 -
L total condensing length
m momentum
o wall
v vapor
z local
- 20 -
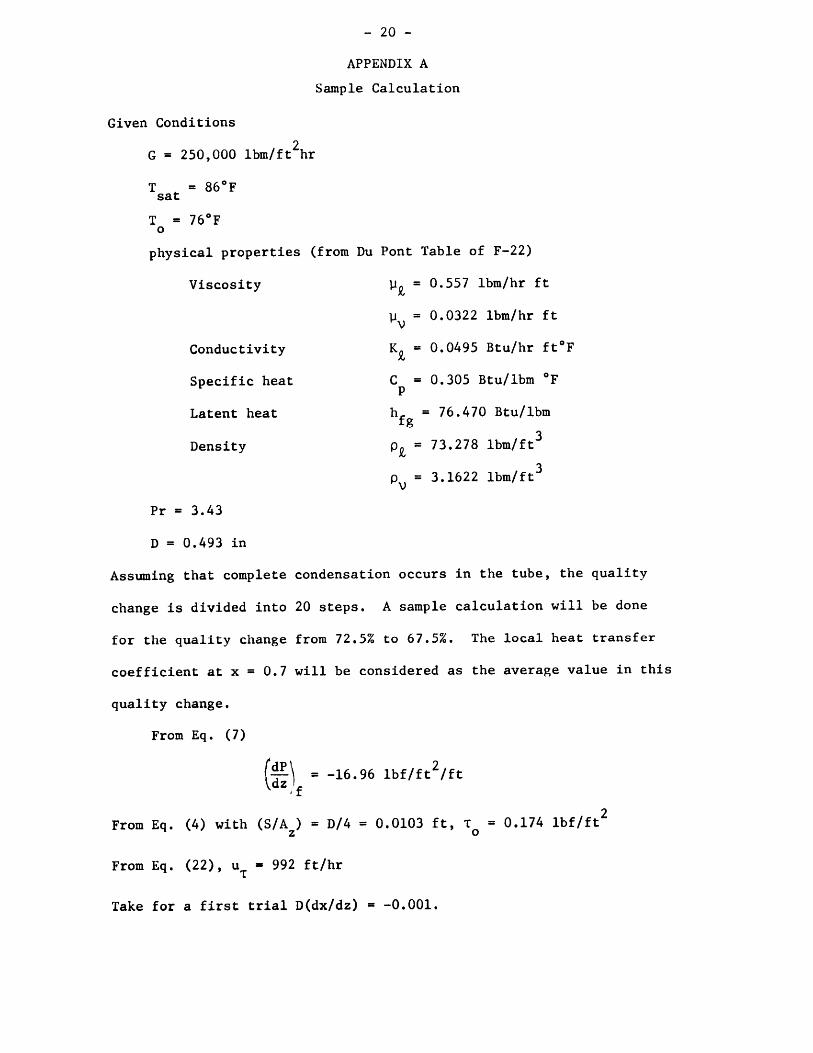
APPENDIX A
Sample Calculation
Given Conditions
G = 250,000 lbm/ft 2hr
Tsat = 86*F
T = 760F0
physical properties (from Du Pont Table of F-22)
Viscosity l = 0.557 lbm/hr ft
y = 0.0322 lbm/hr ft
Conductivity K = 0.0495 Btu/hr ft*F
Specific heat C = 0.305 Btu/lbm *F
Latent heat h = 76.470 Btu/lbm
Density p = 73.278 lbm/ft3
p = 3.1622 lbm/ft3
Pr = 3.43
D = 0.493 in
Assuming that complete condensation occurs in the tube, the quality
change is divided into 20 steps. A sample calculation will be done
for the quality change from 72.5% to 67.5%. The local heat transfer
coefficient at x = 0.7 will be considered as the average value in this
quality change.
From Eq. (7)
~dlf = -16.96 lbf/ft 2/ftdz
From Eq. (4) with (S/A ) = D/4 = 0.0103 ft, T = 0.174 lbf/ft2
z 0
From Eq. (22), u~ - 992 ft/hr
Take for a first trial D(dx/dz) = -0.001.

- 21 -
From Eq. (13), d = 1.36 lbf/ft 2/ft
For a horizontal tubedz = 0
d\ ) g
From Eq. (3), = -16.96 + 1.36 = -15.60 lbf/ft 2/ft
From Eq. (12), a = 0.95
From Eq. (26), Re = (1 - 0.7)(250,000)(0.493) = 5532Z (0.557) (12)
From Eq. (27c), 5532 = -256 + 126+ + 106+1n6+
By trial and error calculate 6 + 99.7
Then from Fig. 3 at 6+ = 99.7, = .25
From Eq. (18), F0 = 19.20lbf/ft 2/ft
From Eq. (24), M = 0.084
From Eq. (23c), F2 = 34.82
From Eq. (21b), h - (73.278)(0.305)(992) = 637 Btu/hr ft2Fz (34.82)
D2 G hSince = h AT E D G Ax
A z 4 irD Az
Ax 4 hz AT 4(637)(10) 0G h -(250,000) (76.470) = 0.00133
fg
Recalculate using this magnitude instead of 0.001. The final results
hz = 637, convergence is very rapid. Then
(z (x)(D) _ (0.05)(0.493) = 1.53 ft0.00133 (0.00133) (12)
the increment of length required to change the quality from 72.5%
to 67.5%.

- 22 -
A similar calculation should be made for each Ax of 5% to
determine the corresponding h and Az. A plot of h and x vsz z
z may be constructed. Also P vs x or z may be plotted.

- 23 -
APPENDIX B
Heat Transfer Analysis
The universal velocity was assumed in the liquid layer
0 < 6+ < 5
5 < 6 < 30
30 < y
v = v / gT/p = vu ;Z Z 0 0 Z T
v +z
v += -3.05 + 5 ln y +z
v_+ = 5.5 +2.5in y+
(B-1)
6+ go 0V F!p
Rewrite Eq. (19a) as follows
P9 Em 2T = -- (1 + -- u
g V T
Solve this for cm with Eq. (B-1)
0 < 6+< 5, T ~T
5 < 6+ < 30, T ~ T
dvz
dy +
E =0m
o m = 5
30 < 6 +, T = F (6-y) + T and V << eo In
14i2.5
FM
T
(B-3)
( +) 2
6,v
Rewrite Eq. (19b) in the following form assuming q/A ~~ (q/A) :
1 = T6 - T
h z (q/A) 0- O
dy"p C ( +6h)u
where
(B-2)
where
(B-4)

- 24 -
Taking eh = em, substitute Eq. (B-3) into (B-4) and obtain
Eq. (21) where F2 is given by Eq. (23) in the three zones.
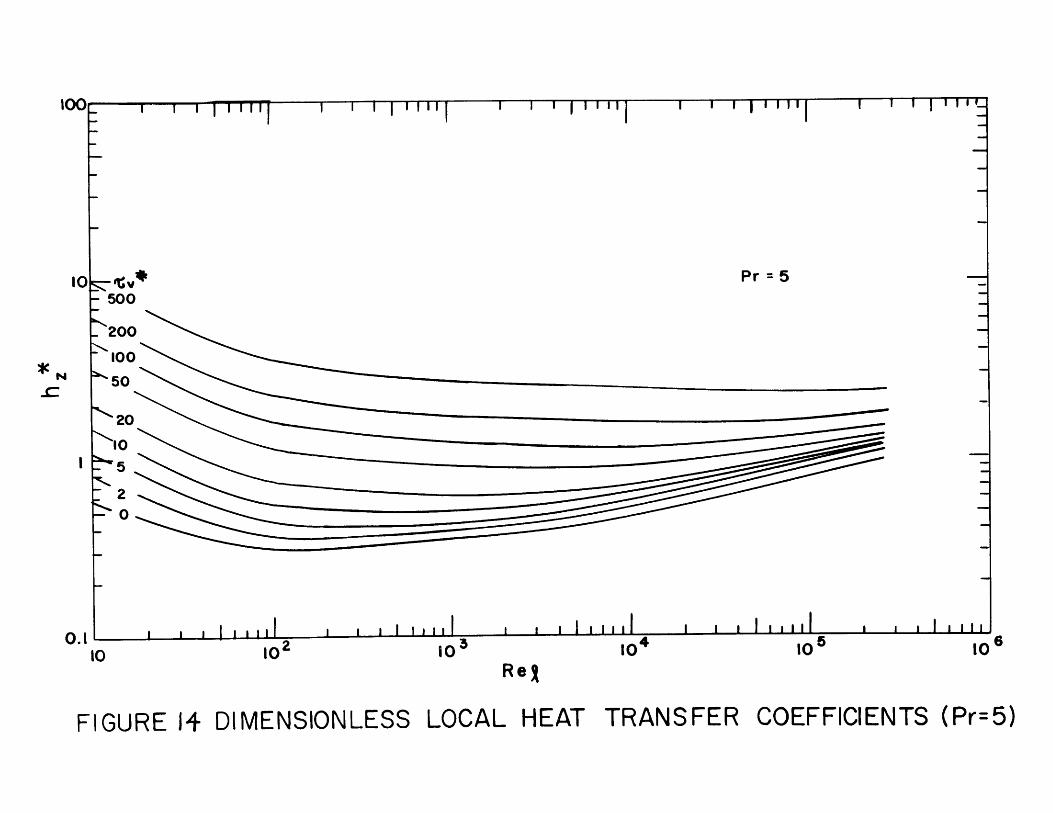
The results of this analysis can be put in an alternative
form. Eq. (21) can be rewritten as follows:
h =Pr 6+ 1/3
1/3
h = - g 0z k g0 F0 /
(B-5)
(B-6)
The results can be plotted as shown in Fig. 14 and involve
T vT
v F0 (gF0) -1/3
(B-7)
(B-8)
(oF9)-1/3
+ * * * 1/26 = 6 (6 + T
M = 1 *1+T /6
(B-9)
The momentum equation for the vapor core, Fig. 1, is
dP A -TS + a-dz v v v g0
p A =1 d (UW) - Uv v g dz y v i
Again substituting Eq. (12)and (14) in Eq. (B-10)
4 dP +*v aD dz 0
G2
gPDv dxg D dz
2/3+ (1-x) (a(1-a) PL
where
Then
dWVdz
(B-10)
2
+ 1-2x v
a (p V9(B-ll)

- 25 -
For assumed magnitudes of 6 , Pr and T , calculate Re from
Eq. (28), M from Eq. (B-9), 6 from Eq. (B-8), F2 from Eq. (26)
and h from Eq. (B-5). With these calculations, Fig. 14 can bez
drawn and is an alternative presentation of results.

- 26 -
APPENDIX C
Tables of Data
Run 1 G = 303,000 lbm/ft2 hr Tsat = 860F R-22
Measured
Sec T T0 WTdPdNo Tvapor T out Wwater w dP/dz
1 83.17 71.25 2400 1.482 15.32 82.97 71.45 2134 1.450 24.73 82.40 69.47 2718 1.250 21.24 82.31 70.89 1807 1.531 14.15 12.04 70.06 1953 1.473 15.36 81.88 67.92 2254 1.186 9.4
Calculated
Sec TONo Q/A in AT h m
1 9200 72.73 10.44 880 93.82 7990 72.74 10.23 780 82.53 8450 70.83 11.57 730 72.24 7150 71.05 10.26 696 62.45 7450 71.26 10.78 692 53.36 6820 69.03 12.85 530 44.3
Heat Balance Error -8.5%
Run 2 G - 485,000 lbm/ft 2hr Tsat = 81*F R-22
Measured
Sec T0T W AT dP/dzSe vapor out water w
1 81.64 72.81 1690 2.61 73.22 81.19 70.79 2800 1.58 62.53 81.01 70.12 1920 2.29 57.84 80.19 68.84 1510 2.85 47.25 79.62 68.13 1730 2.50 53.06 79.44 67.89 1910 2.20 43.6
Calculated
Sec TNo Q/A in AT h Xm
1 9,440 74.33 7.31 1290 96.42 11,400 72.64 7.55 1330 88.33 11,350 71.95 9.06 1250 79.44 11,100 70.63 9.56 1160 70.65 11,200 69.93 9.69 1150 61.86 10,850 69.64 9.80 1100 53.3
Heat Balance Error +1.6%

- 27 -
Run 3 G = 250,000 lbm/ft2hr Tsat
Measured
SecNo
123456
Tvapor
86.5786.3985.9685.7785.6985.58
T0 out
70.3771.0270.1269.3869.6771.04
water
331025602490291027901750
Calculated
Q/A
10,8509,7308,8108,0507,3506,150
Balance Error
in
72.1273.0971.5470.6870.8572.03
+4.65%
Run 4 G = 470,000 lbm/ft2hr Tsat = 85*F R-22
Measured
SecNo
123456
SecNo
123456
Tvapor
85.5385.0185.0084.5484.1983.64
Q/A
12,2009,700
12,8009,6109,8409,900
Heat Balance Error
out
74.2375.1071.9673.9272.2271.28
Toin
76.1976.6874.0275.4773.8172.87
+6.05%
Wwater
266016703500197024703090
Calculated
AT
9.348.33
10.989.07
10.3810.77
= 860F R-22
w
1.271.471.371.071.021.36
dP/dz
24.220.517.013.013.0
7.1
SecNo
123456
Heat
AT
14.4513.3014.4215.0914.8413.55
h
750730610535495455
xm
91.174.359.646.734.123.0
ATw
1.772.271.421.881.541.24
h
1,3001,1601,1651,060
950920
dP/dz
62.360.957.047.447.238.5
xm
95.185.676.066.959.051.0
- 28 -
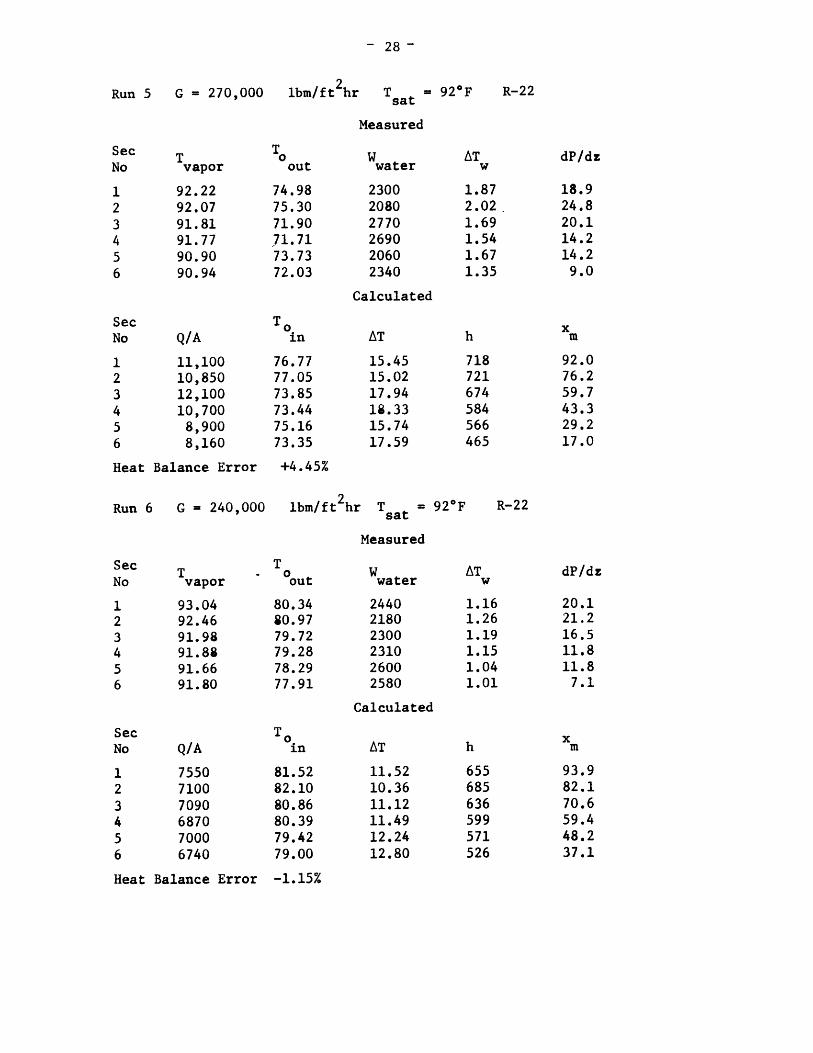
Run 5 G = 270,000 lbm/ft 2hr Tsat = 92*F R-22
Measured
Sec T To W AT dP/dzNo vapor out water w
1 92.22 74.98 2300 1.87 18.92 92.07 75.30 2080 2.02, 24.83 91.81 71.90 2770 1.69 20.14 91.77 71.71 2690 1.54 14.25 90.90 73.73 2060 1.67 14.26 90.94 72.03 2340 1.35 9.0
Calculated
Sec ToNo Q/A in AT h m
1 11,100 76.77 15.45 718 92.02 10,850 77.05 15.02 721 76.23 12,100 73.85 17.94 674 59.74 10,700 73.44 18.33 584 43.35 8,900 75.16 15.74 566 29.26 8,160 73.35 17.59 465 17.0
Heat Balance Error +4.45%
Run 6 G = 240,000 lbm/ft 2hr Tsat = 920F R-22
Measured
Sec T - To W AT dP/dzNo vapor out water w
1 93.04 80.34 2440 1.16 20.12 92.46 80.97 2180 1.26 21.23 91.98 79.72 2300 1.19 16.54 91.88 79.28 2310 1.15 11.85 91.66 78.29 2600 1.04 11.86 91.80 77.91 2580 1.01 7.1
Calculated
Sec ToNo Q/A in AT h m
1 7550 81.52 11.52 655 93.92 7100 82.10 10.36 685 82.1
3 7090 80.86 11.12 636 70.64 6870 80.39 11.49 599 59.45 7000 79.42 12.24 571 48.26 6740 79.00 12.80 526 37.1
Heat Balance Error -1.15%

- 29 -
Run 7 G = 308,000 lbm/ft 2hr Tsat = 920F R-22
Tvapor
98.0797.8097.3797.0296.9896.93
SecNo
123456
SecNo
123456
Heat
out
80.9682.1280.0679.2678.5877.26
T0in
82.8783.7781.7981.2380.2378.63
+0.9%
Measured
water
251018602410280028402080
Calculated
AT
15.2014.0315.5815.7916.7518.80
Run 8 G = 316,000 lbm/ft 2hr Tsat = 103 0 F R-22
Tvapor
103.12102.91101.79101.33100.98100.98
Q/A
13,70010,40010,10011,60011,10011,300
Balance Error
out
84.6386.7385.3383.7280.9979.66
Toin
86.8588.4186.9687.5982.7881.48
5.5%
Measured
Wwater
253013902480300030703330
Calculated
AT
16.2714.5014.8315.7418.2019.50
ATw
1.832.131.721.691.391.58
Q/A
11,85010,20010,70012,20010,2008,500
Balance Error
dP/dz
25.423.621.216.516.511.8
h
780726687770610452
xm
92.478.164.649.835.323.2
SecNo
123456
SecNo
123456
Heat
ATw
2.102.891.581.501.401.31
h
842717680737610610
dP/dz
15.328.327.120.020.015.3
xm
91.275.862.648.734.119.8
- 30 -
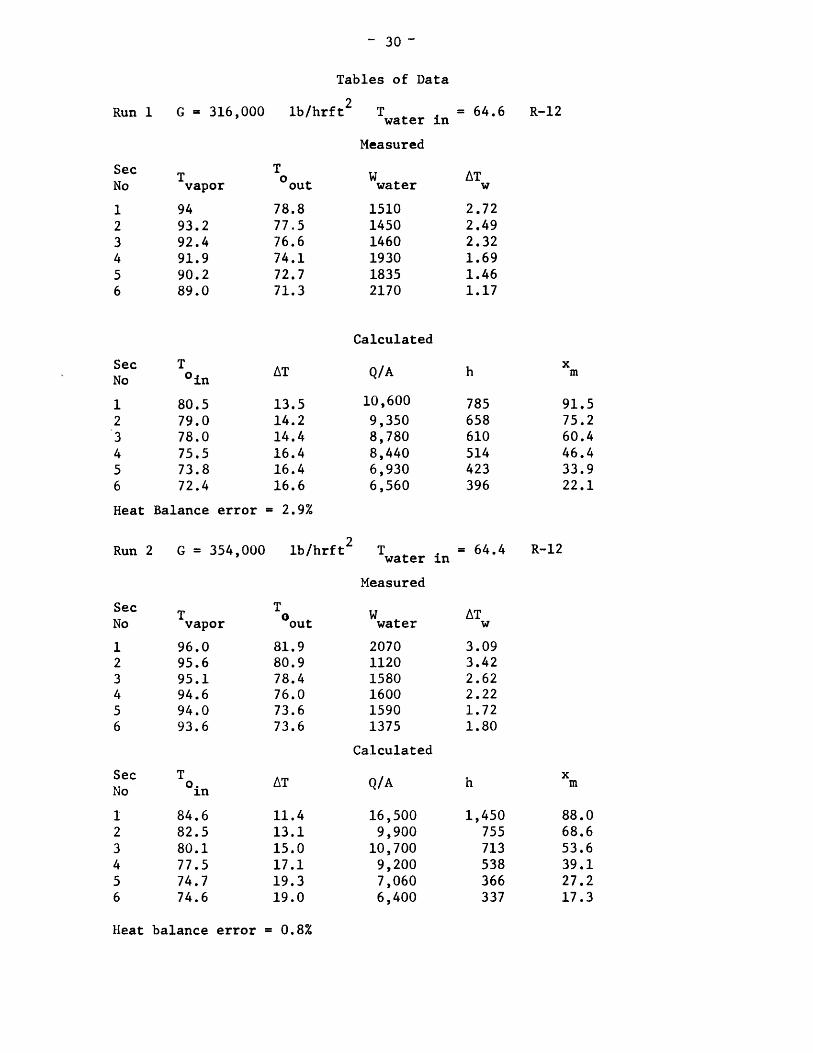
Tables of Data
Run 1 G = 316,000 lb/hrft 2
SecNo
123456
vapor
9493.292.491.990.289.0
T0 out
78.877.576.674.172.771.3
Twater
Measured
water
151014501460193018352170
= 64.6 R-12
ATw
2.722.492.321.691.461.17
Calculated
Toin
80.579.078.075.573.872.4
Balance error
13.514.214.416.416.416.6
= 2.9%
Run 2 G = 354,000 lb/hrft2 Twater
Measured
= 64.4 R-12
Wwater
207011201580160015901375
Calculated
Q/A
16,5009,900
10,7009,2007,0606,400
Heat balance error = 0.8%
Q/ASecNo
123456
Heat
10,600
9,3508,7808,4406,9306,560
785658610514423396
91.575.260.446.433.922.1
SecNo
123456
SecNo
123456
Tvapor
96.095.695.194.694.093.6
T0.in
84.682.580.177.574.774.6
T0 out
81.980.978.476.073.673.6
AT
11.413.115.017.119.319.0
ATw
3.093.422.622.221.721.80
h
1,450755713538366337
xm
88.068.653.639.127.217.3
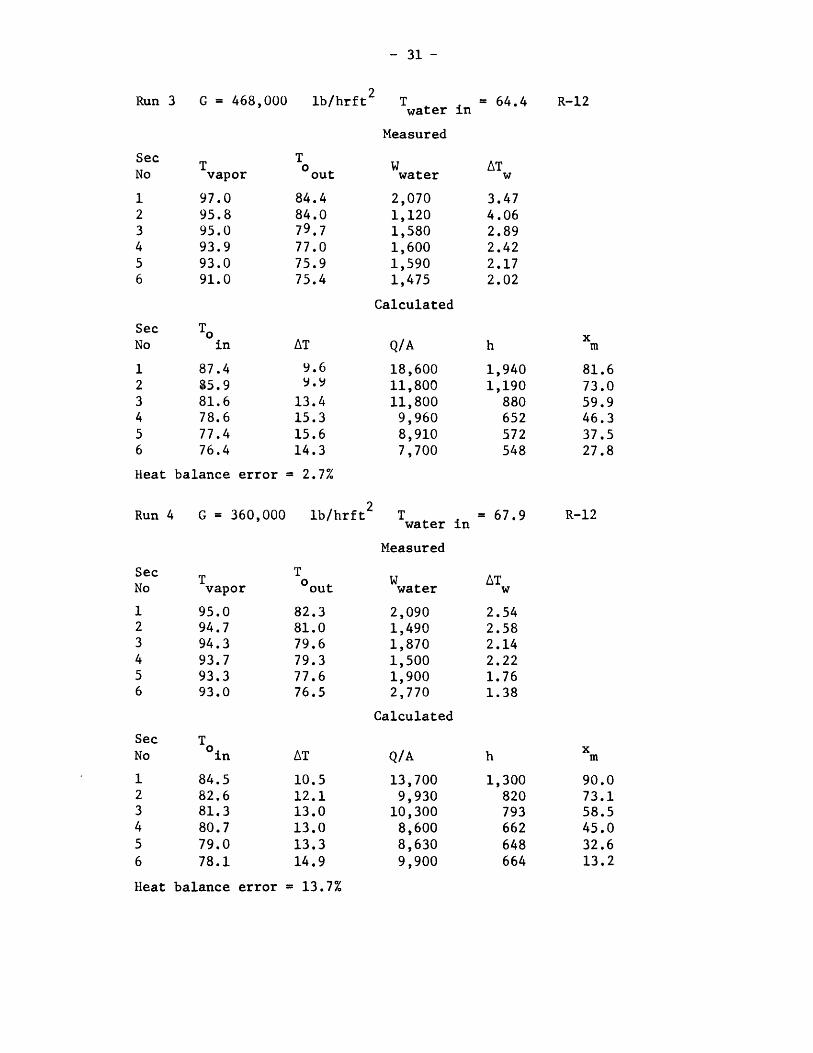
- 31 -
Run 3 G = 468,000
SecNo
SecNo
Tvapor
97.095.895.093.993.091.0
in
87.4$5.981.678.677.476.4
lb/hrft2 Twater in = 64.4
Measured
Taout
84.484.079.777.075.975.4
AT
9.69.9
13.415.315.614.3
Heat balance error = 2.7%
Run 4 G = 360,000 lb/hrft 2
wwater
2,0701,1201,5801,6001,5901,475
Calculated
Q/A
18,60011,80011,8009,9608,9107,700
Twater
Measured
R-12
3.474.062.892.422.172.02
1,9401,190
880652572548
= 67.9 R-12
Tvapor
95.094.794.393.793.393.0
T0 in
84.582.681.380.779.078.1
balance error
T0 out
82.381.079.679.377.676.5
AT
10.512.113.013.013.314.9
= 13.7%
water
2,0901,4901,8701,5001,9002,770
Calculated
Q/A
13,7009,930
10,3008,6008,6309,900
81.673.059.946.337.527.8
ATw
2.542.582.142.221.761.38
SecNo
SecNo
123456
Heat
1,300820793662648664
90.073.158.545.032.613.2

- 32 -
Run 5 G = 254,000
SecNo
123456
SecNo
123456
Tvapor
93.092.191.791.491.0
TOin
81.279.977.976.376.1
lb/hrft 2 Twater in
Measured
T0out
79.478.676.675.475.0
AT
11.813.213.815.114.9
water
2,0901,4901,8701,5001,900
Calculated
Q/A
11,0008,1007,7005,7406,400
= 67.9
w
2.032.101.591.48
1.30
h
932613558380428
Run 6 G = 265,000
Tvapor
99.097.897.396.996.596
TOin
84.081.679.277.977.675.2
balance error
lb/hrft 2
out
81.880.177.876.875.574.0
AT
15.016.218.119.019.920.8
= 1.5%
Twater in
Measured
water
2,0901,4901,8701,5001,9002,770
Calculated
Q/A13,2009,1508,7006,7506,8307,160
R-12
xm
89.069.853.740.227.9
= 67.9 R-12
ATw
2.442.381.80
1.741.391.00
SecNo
123456
SecNo
123456
Heat
h
879565478355344344
xm
87.065.247.432.219.0
3.5

- 33 -
Run 7 G = 155,000
SecNo
123456
SecNo
123456
Heat
Tvapor
84.684.283.883.582.079.4
Tin
68.963.763.661.659.255.8
balance error
Run 8 G = 445,000
lb/hrft2 water
Measured
T0out
67.262.762.460.558.255.2
AT
15.720.320.221.922.823.6
= 4.9%
wwater
1,7601,5001,6101,9002,2602,360
Calculated
Q/A
10,6007,4507,4006,8705,8403,440
lb/hrft2 Twater in
Measured
= 51.4 0 F
w
2.321.921.781.400.840.56
h
675367366314256143
= 51.6
vapor
87.886.785.785.184.584.0
0. in
T0out
72.668.966.766.263.460.4
AT
74.9 12.971.3 15.468.8 16.967.9 17.265.0 19.561.6 22.4
balance error = 1.9%
wwater
2,6702,4702,3001,7302,0502,260
Calculated
Q/A
20,15014,70013,00010,3509,4307,500
R-12
m
82.853.829.7
8.8
R-12
SecNo
123456
SecNo
ATw
2.822.302.182.311.781.28
123456
Heat
1,560955768602484335
88.668.753.039.828.819.3

- 34 -
Run 9 G = 440,000
SecNo
123456
vapor
88.387.786.686.185.885.1
lb/hrft 2
T0
out
72.069.168.267.864.760.9
Twater
Measured
Wwater
2,5802,3501,9001,4701,4601,190
Calculated
TOin
75.171.670.669.366.161.8
balance error
Run 10 G = 220,000
AT
13.216.116.016.819.723.3
= 1.9%
Q/A
19,20015,50013,5009,2508,3605,350
lb/hrft2 Twater
MeasuredT%out
73.669.266.761.6
AT
25.930.132.336.5
Wwater
1,9702,2302,2301,860
Calculated
Q/A
15,30014,40012,2007,060
= 51.4 R-12
ATw
2.882.652.762.602.211.74
SecNo
123456
Heat
h
1,450962856551425230
xm
89.269.252.639.529.421.6
R-12in = 52.2
Tvapor
102.0101.7101.0
98.8
SecNo
123456
SecNo
123456
3.012.50
2.121.47
0in
76.171.668.762.3
h
590478378194
xm
81.642.814.5

- 35 -
Run 11 G = 272,000
Tvapor
94.594.293.993.693.091.0
in
86.185.284.381.380.078.8
balance error
lb/hrft2 Twater
out
84.784.183.280.479.378.3
AT
8.49.09.6
12.313.012.2
= 0.4%
Measured
Wwater
1,7501,4201,5101,2701,9151,565
Calculated
Q/A
8,7806.6806,4905,9004,0302,740
in = 75.0
ATw
1.941.821.661.800.810.68
h
1,045743676482310275
Run 12 G = 477,000
Tvapor
93.092.291.090.287.085.0
T0in
84.582.079.274.470.369.5
balance error
lb/hrft2 Twater
T0 out
82.080.577.372.969.468.7
AT
8.510.211.815.816.715.5
= 2.3%
Measured
Wwater
1,8201,0301,9152,2802,0702,280
Calculated
Q/A
15,3009,350
11,6008,8405,3504,720
in = 64.0
ATw
3.263.502.361.500.910.80
h
1,800916984558320304
R-12
SecNo
123456
SecNo
123456
Heat
xm
91.875.164.654.647.140.7
R-12
SecNo
123456
SecNo
123456
Heat
xm
91.878.667.256.248.643.0

- 36 -
Run 13 G = 154,000 lb/hrft2 Twater
SecNo
123456
SecNo
123456
Tvapor
97.096.295.795.295.090.0
0in
79.375.073.772.171.168.6
Heat balance error
TOout
76.973.572.671.170.068.0
AT
17.721.222.023.123.921.4
= 17.2%
Run 14 G = 326,000
Measured
water
2,8002,0301,5901,8502,3901,730
Calculated
Q/A
14,7008,8506,8406,2206,3603,480
lb/hrft2 Twater
Measured
ATw
2.041.621.671.301.030.78
h
831417311269266163
= 63.9
Tvapor
98.598.197.997.597.096.5
0in
84.382.681.077.973.581.7
balance error
out
81.880.778.976.173.380.6
AT
14.215.516.919.423.524.8
= 2.7%
water
1,8701,3101,6601,9501,7602,280
Calculated
Q/A
15,50011,30012,00010,8006,9906,600
= 63.8 R-12
xm
75.335.6
9.6
R-12
ATw
3.203.332.802.161.531.12
SecNo
123456
SecNo
123456
Heat
h
1,090728710556298266
xm
87.766.447.829.515.8
4.4

- 37 -
Run 15 G = 425,000
Tvapor
99.098.597.897.496.596.4
T0 in
86.984.282.380.276.274.1
Balance error
lb/hrft2 water
Measured
out
83.981.480.077.874.772.8
AT
12.114.315.517.220.322.3
= 3.9%
water
2,2402,7202,1202,8702,1402,380
Calculated
Q/A
18,60017,20014,20014,8009,2108,000
= 64.9
w
3.202.452.602.001.671.30
h
1,5401,200
916860454359
Run 16 G = 372,000
Sec TNo vapor
1 96.02 95.43 94.94 94.45 93.46 92.5
Sec TNo 0in
1 81.72 78.93 78.64 76.35 81.96 70.7
Heat balance error =
lb/hrft2 Twater
Measured
T0out
79.276.576.674.370.869.7
AT
14.316.516.318.121.521.8
1.06%
Wwater
2,2402,7202,1202,8702,1402,380
Calculated
Q/A
15,35014,55012,30012,4006,9006,270
= 63.5
ATw
2.652.072.251.671.301.02
h
1,070882755685322288
R-12
SecNo
123456
SecNo
123456
Heat
m
88.766.847.529.815.1
4.5
R-12
xm
89.168.550.032.719.314.9

- 38 -
Run 17 G = 358,000 lb/hrft2 water in = 65 R-12
Measured
Sec T T W ATNo vapor out water w
1 101.0 83.3 2,240 3.102 100.8 81.6 2,720 2.623 100.1 79.2 2,120 2.434 99.5 75.8 2,870 1.685 98.8 72.5 2,140 1.316 98.4 71.2 2,380 1.02
Calculated
Sec TNo in AT Q/A h m
1 86.2 14.8 17,900 1,210 87.72 84.6 16.2 18,400 1,140 61.33 81.3 18.7 13,300 713 38.04 77.8 21.7 12,500 576 19.25 73.7 25.1 7,250 289 4.86 72.2 26.2 6,270 240 -
Heat balance error = 4%
Run 18 G = 506,000 lb/hrft2 water in 63.9 R-12
Measured
Sec T T0WANo vapor out water w
1 91.0 79.4 2,200 2.642 90.3 76.7 1,970 2.243 89.0 74.7 2,210 1.904 88.1 75.0 1,880 1.985 87.0 73.0 1,490 1.746 86.0 71.4 1,340 1.50
Calculated
Sec ToNo in AT Q/A h m
1 81.8 9.2 15,000 1,630 92.42 78.5 11.8 11,400 965 79.33 76.4 12.6 10,800 856 67.74 76.6 11.5 9,650 839 57.75 74.1 12.9 6,700 519 49.46 72.2 13.8 5,200 377 43.5
Heat balance error = 0.9%

- 39 -
Run 19 G = 556,000 lb/hrft2 Twater
Measured
Tvapor
88.086.985.283.981.681.2
SecNo
123456
SecNo
123456
Heat
T0 out
77.076.374.971.368.068.1
AT
8.88.78.411.413.012.7
error = 22.8%
Run 20 G = 257,000
wwater
2,2001,9702,2101,8801,4901,340
Calculated
Q/A
13,60011,90011,6007,3504,0103,460
lb/hrft2 Twater
Measured
ATw
2.392.342.031.511.041.00
h
1,5501,3701,390
645319272
= 68.8
vapor
94.694.293.893.493.092.6
Tin
84.084.280.580.677.278.5
balance error
Toout
82.082.379.179.276.377.5
AT
10.610.013.312.815.814.1
= 20.8%
Wwater
2,0201,7901,7201,6201,5401,330
Calculated
Q/A
12,40011,6008,6008,4805,7206,130
i 62.9 R-12
Tin
79.278.276.872.568.668.7
balance
xm
94.082.171.662.657.554.2
R-12
ATw
2.38
2.501.932.021.441.78
SecNo
123456
SecNo
123456
Heat
h
1,1701,160
647660362435
xm
84.679.058.547.738.9
4.2

- 40 -
Run 21 G = 308,000 lb/hrft2 Twater
Measured
SecNo
123456
SecNo
123456
Heat
Run 22 G = 307,000
Tvapor
109.0108.1107.9107.7107.5107.2
T0in
93.693.592.391.990.890.3
balance error
Tvapor
104.2103.9103.6103.2102.8102.4
TOin
91.792.885.885.579.180.0
balance error
TT out
88.790.483.883.878.078.9
AT
12.511.117.819.723.722.4
= 22.8%
lb/hrft2 Twater in
Measured
out
91.891.890.990.689.689.2
AT
15.214.615.615.816.716.9
= 4.9%
Wwater
1,8701,7101,4501,4201,4001,270
Calculated
Q/A
11,25010,6008,7008,3007,5606,800
ATw
3.383.262.812.471.782.05
wwater
2,0201,7901,7201,6201,5401,330
Calculated
Q/A
18,50015,10012,50010,7007,0907,050
= 79
w
2.332.392.322.262.092.07
h
740723553525453402
= 68.8 R-12
h
1,4801,360
703543299315
xm
84.055.425.714.6
3.0
R-12
SecNo
123456
SecNo
123456
Heat
xm
90.271.254.339.425.513.0

Run 23 G = 314,000
Tvapor
110.5110.0109.6109.2108.8108.4
SecNo
123456
SecNo
123456
Heat
- 41 -
lb/hrft2 Twater
Measured
0out
95.894.593.792.691.491.0
wwater
1,8701,7101,4501,4201,4001,270
Calculated
= 79.5
w
2.772.792.782.562.362.36
Q/A
13.513.514.215.116.016.1
= 4.3%
13,40012,30010,4009,4008,5507,750
992914734623534482
Run 24 G = 327,000
vapor
118.7118.4118.1117.8117.5117.1
in
100.1100.8
98.494.590.190.0
balance error
lb/hrft2 Twater
Measured
out
97.598.296.492.988.988.9
18.617.619.723.327.427.1
= 4.7
Wwater
1,8701,7101,4501,4201,4001,270
Calculated
Q/A
16,10015,80012,7009,8707,6706,560
= 79.1
ATw
3.323.573.382.692.122.00
h
865896643424280242
R-12
T0 in
97.096.595.494.192.892.3
balance error
88.666.544.531.214.7
3.7
R-12
SecNo
123456
SecNo
123456
Heat
xm
86.559.435.616.6
4.1

Figure Captions
Figure No.
1 Control Volume of a Tube Element
2 Elemental Volume In the Condensate
3 U /U vs 6
4 Dimensionless Film Thickness 6+
*5 Stanton Number St
6 Schematic Diagram of Apparatus
7 Heat Transfer Data for R-12
8 Heat Transfer Data for R-22
9 Pressure Drop Data for R-22
10 Predicted vs Measured Heat Transfer Data, R-12
11 Predicted vs Measured Heat Transfer Data, R-22
12 Predicted vs Measured Pressure Drop Data, R-22
13 Comparison of Data with Akers-Rosson RecommendedCorrelation
Dimensionless Local Heat Transfer Coefficient
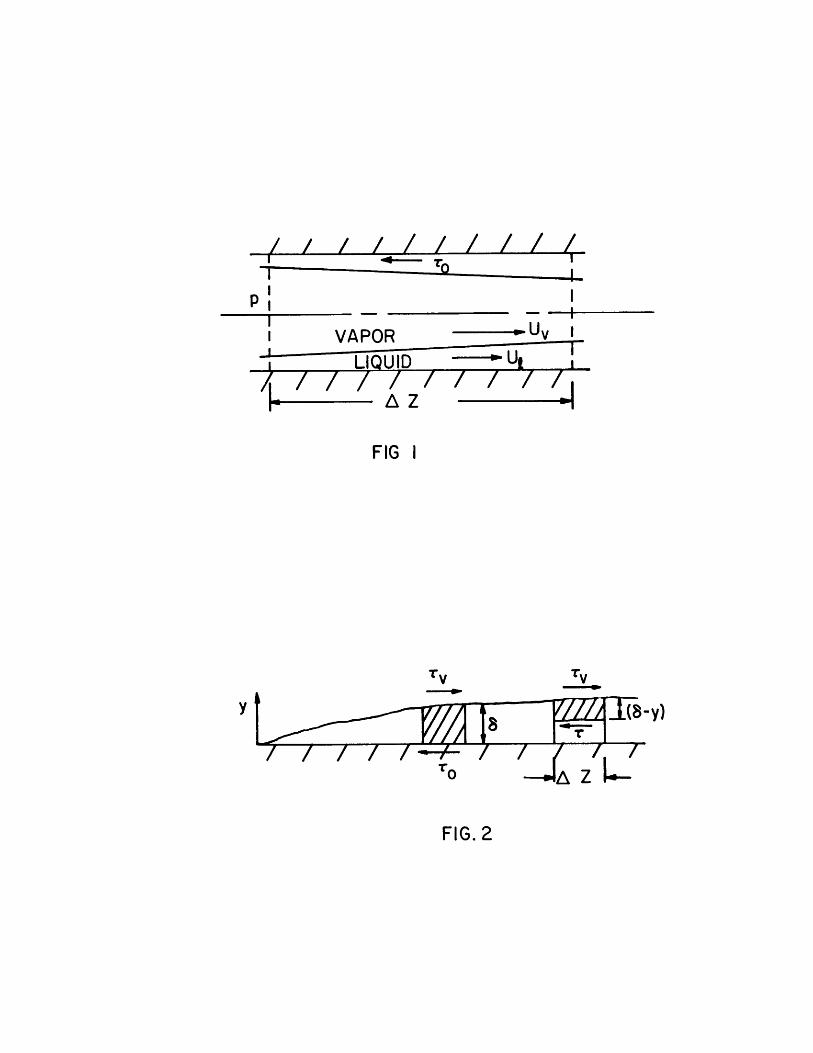
TI I
p
I VAPOR UI LIQUID -U
L ~A Z
FIG I
T v TV
yt mT77V-
FIG. 2
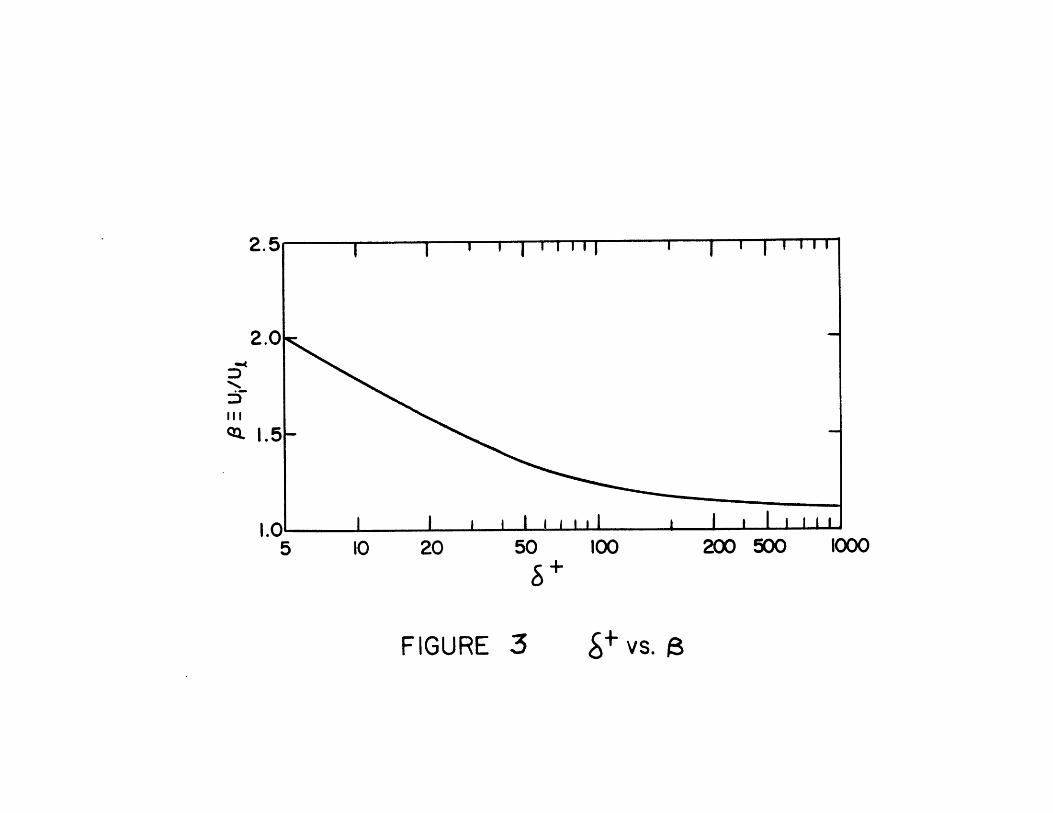
2.5 i
2.0
2-
1.5
1.0 1Ii ' ' ' ' ' ' '5 10 20 50 100 200 500 1000
F+
FIGURE 3 v.i

1000 fil
1001 0 - -__ _ _ _ _ _ _- -_ _ _ __~ ~__ _
2 3 4 o5.0 00001 1
Re,
FIGURE 4 DIMENSIONLESS FILM THICKNESS

I.0
st*C
0.(
0.1
Re2e
FiG 5

TEST SECTION19.2J'
SINK
'CONDENSER
DIAGRAM OF APPARATUS
0
FIGURE 6 SCHEMATIC

R-12 RUN IG = 316000
AT= 13 -16 *F
PREDICTEDMEASURED
41-
z
LL-
0C-)
LiJ
z
-LJ0I
0.6 0.4 0.2VAPOR QUALITY x
FIG.7 LOCAL HEAT TRANSFER COEFFICIENTCOMPARED WITH ANALYSIS
FOR R-12
RUN6G=254000AT= 12 -15 *F
1.0 0.8

I I
* MEASURED- PREDICTED
R-22Lia
0
4-
I-w0
w80w
z
0.6 0.4 0.2QUALITY
FIGURE 8 LOCAL HEAT TRANSFERCOEFFICIENTS
20001
RUN 7
III I
15001-
10001-
500-
0.8
-- - -
I
VALUES
VALUES

- RUN 7 * MEASURED- PREDICTED
VALUESVALUES
R-22
I I - - I I
0.6QUALITY
FIGURE 9 TOTAL STATIC PRESSUREGRADIENTS
100
4-
N4-
.0
\O
IL
1.0 0.8 0.4 0.2
200
-15%
1500- 00
0 0
0
|000- 0 00 0W 0
I- 0 0
0 0005000 0
00
00 0
0 500 1000 1500 2000
MEASURED h Btu/hr ft2 *F
R-12 HEAT TRANSFER DATA COMPARED WITH ANALYSIS
FIG. 10

1000
500
..O
MEASURED BTU/ft 2
DATA COMPARED WITH PRESENT ANALYSIO
II
1500
500 1000
hr* F
150
FIGU RE 11

60
40-
0.0
40 +15%
30-
20- 00
10-
SI I
0 10 20 30 40 50 60MEASURED AP psi
R-22 PRESSURE DROP DATA COMPARED WITH ANALYSIS
FIG. 12

I i I I I I I I I III I I I I I~ I I! I I
o Akers and Rosson (211000 A Altman, Staub and Norris [31
0 Chen [7]* The Present Data
0%
* . A@
0
Rio
100& 0
00 0@§0 A:. 00%
0 o 0o
b '90A k e r -- R o s n R c m e d e o r l t o
10 10
R e y= G- D j'/x 1
Fig.23. Data on Akers-Rosson Plot
I i I
I I I I I I I 'II I I I I1 I1I1 I I I I III t-
I I I |I I 1 1 1 1 I I I I I I I I I
100
10
14
-500
200
100
50
a It I I I iiI a ' - - ' ' ' ' ' ' '
I I I 111111 i i I I
IOU
Rel
FIGURE 14 DIMENSIONLESS LOCAL HEAT TRANSFER COEFFICIENTS (Pr=5)
Pr = 5
0.1102
I II I
10 w
I I