F TCOLY - DSpace@MIT
112
A FLEXIBLE DESIGN FRAMEWORK FOR AUTONOMOUS MOWING BY JUSTIN KRAFT Submitted to the System Design & Management Program In Partial Fulfillment of the Requirements for the Degree of Master of Science in Engineering and Management at the Massachusetts Institute of Technology January 2011 ARCHIVES MASSACHUSETS INSTITUTE F TCOLY C 2011 Justin Kraft. All rightsreserved. The author hereby grants to MITpernission to reproduce and to distribute publicly paper and electronic copies of this thesis document in whole or in part. Signature of Author System Design & Management Program Justin A. Kraft Januarv 6, 2011 Certified by Olivier L. de Weck Thesis Supervisor Associate Professor of Aeronautics & Astron (t n eeri g.Syste Accepted by Patrick Hale Director, SDM Fellows Program
-
Upload
khangminh22 -
Category
Documents
-
view
3 -
download
0
Transcript of F TCOLY - DSpace@MIT

A FLEXIBLE DESIGN FRAMEWORK FOR AUTONOMOUS
MOWING
BY
JUSTIN KRAFT
Submitted to the System Design & Management Program
In Partial Fulfillment of the Requirements for the Degree of
Master of Science in Engineering and Management
at the
Massachusetts Institute of Technology
January 2011
ARCHIVES
MASSACHUSETS INSTITUTE
F TCOLY
C 2011 Justin Kraft. All rights reserved.
The author hereby grants to MITpernission to reproduce and to distribute publicly paper and
electronic copies of this thesis document in whole or in part.
Signature of Author
System Design & Management Program
Justin A. Kraft
Januarv 6, 2011
Certified by
Olivier L. de Weck
Thesis Supervisor
Associate Professor of Aeronautics & Astron (t n eeri g.Syste
Accepted by
Patrick Hale
Director, SDM Fellows Program

This page left intentionally blank.
[- 2 -]

A FLEXIBLE DESIGN FRAMEWORK FOR AUTONOMOUS MOWING
BY
JUSTiN KRAFT
Submitted to the System Design & Management Program on January 6, 2011
in Partial Fulfillment of the Requirements for the Degree of
Master of Science in Engineering and Management
at the
Massachusetts Institute of Technology
ABSTRACT
This work outlines the creation of a flexible design framework for autonomous mowing to meetchanging customer needs and functionality across a spectrum of applications from residentialareas to sport complexes. The thesis has the objective of creating an optimized architecture tomeet a range of functionality that delivers value in diverse customer mission segments.Additionally, autonomous mowing is supported by fast moving technology domains that createthe need for technology selection strategies that anticipate future trends in critical metrics.Currently an early dominant design has been produced, but increasing competition is activelyadvancing the current state of the art for autonomous mowing. An analysis to determine wherethe value lies in the system, much like the evolution of the PC, determines when to shift betweenmodular and integrated designs. As designs become modular and flexible the importance ofknowing which areas of the system capture value and lead to revenue is critical for a company'scontinued success in the domain. Using this framework Pareto frontiers were developed usinggenetic algorithms that clearly show the sensitivity between manufacturing costs and total lifecycle cost to the consumer using 970 generations. A platform architecture analysis provided a9% increase in a portfolio Net Present Value by determining an optimum commonality anddifferentiation plan over that of individually optimized customer segment offerings. This analysisalso determines if an open source approach to innovation is viable for increased customersatisfaction while supporting increased manufacturer revenues (Hippel, 2005).
Thesis Supervisor: Olivier L. de Weck
Title: Associate Professor of Aeronautics & Astronautics and Engineering Systems
[- 3 -]

This page left intentionally blank.
[- 4 -]

ACKNOWLEDGEMENT S
I would like to thank the support of John Deere which provided me with the opportunity to
develop this project. For all those who have lent time or effort in getting me to this point, a
sincere Thank You is expressed. An special acknowledgement is extended to Professor Oli de
Weck for his guidance in creating an opportunity to apply the teachings learned from the System
Design and Management program. He was crucial in the completion of this thesis and provided
the insight to make this endeavor a success. His expertise and knowledge was invaluable in the
process. And to all of the faculty and students of the SDM program the teachings, conversations,
and experiences truly molded my systems view and provided the tools to accomplish this project.
Also, I would like to thank my wonderful wife Christina that gave me all the love and support
needed to accomplish my work and goals during this two year journey. In that time we had a
beautiful daughter Ellie that made our time in Boston even more special. Without Christina and
Ellie this thesis would not be possible and certainly a journey less memorable.
[- 5 -]

This page left intentionally blank.
[- 6 -]
CONTENTS
A b stra ct ................................................................................................................................. - 3
Acknow ledgem ents ................................................................................................................ - 5
Table of Figures ................................................................................................................... - 11
Nom enclature....................................................................................................................... 13
Introduction ......................................................................................................................... - 15
1.0 Sensem aking .................................................................................................................. - 19
1.1 Patent search .............................................................................................................. - 19
1.2 Lead user research...................................................................................................... - 22
1.3 Evolution of supporting technologies.......................................................................... - 23
1.3.1 Computational Power .......................................................................................... - 23
1.3.2 Cost versus computational perform ance............................................................... - 25
1.3.3 Relationship between computation power and vehicle performance ..........-.... 27
1.3.4 Local Positioning ................................................................................................. - 30
1.3.6 Distributed networking ........................................................................................ - 33
1.4 M arket segm entation grid and product fam ily design.................................................. - 34
1.5 House of Quality ........................................................................................................ - 35
2.0 5C's of m arketing........................................................................................................... - 39
2.1 Company.................................................................................................................... 39
2.2 Context....................................................................................................................... 39
2.3 Channel...................................................................................................................... 40
2.4 Collaborator ............................................................................................................... - 40
2.5 Competitor ................................................................................................................. - 41
3.0 Architecture Analysis ..................................................................................................... - 43
3. 1Modeling of autonomous lawn mower architectures using OPM and DSM.................. - 43
[- 7 -]

3.2 Synthesis of Architectures .......................................................................................... - 48 -
3.2.1 Combinatorial schem es - morphological m atrix................................................... - 48 -
3.2.2 Prelim inary screening using figures of merit ........................................................ - 50 -
3.2.3 Pugh Concept Selection ....................................................................................... - 52 -
3.3 Open source considerations for innovation ................................................................. - 54 -
4.0 Autonomous M ower M odel Developm ent ...................................................................... - 57 -
4.1 M odel Derivation for M ulti Disciplinary System Optim ization................................... - 57 -
4.1.1 Powertrain Subsystem .......................................................................................... - 58 -
4.1.2 Cutting Subsystem ............................................................................................... - 59-
4.1.3 Battery Subsystem ............................................................................................... - 60-
4.1.4 Cost Subsystem ................................................................................................... - 60 -
4.1.5 System Operating Cost ........................................................................................ - 61 -
4.2 Genetic Algorithm for M ulti Disciplinary System Optim ization ................................. - 63 -
5.0 Architecture Optim ization .............................................................................................. - 67 -
5.1 Optim ization Results for Single Segm ents of Yard size .............................................. - 67 -
6.0 Business Case................................................................................................................. 73 -
6.1 Product Plan ............................................................................................................... 73 -
6.2 Net Present Value Calculation .................................................................................... - 73 -
6.3 Uncertainty Defined ................................................................................................... - 76-
7.0 Real Options Analysis .................................................................................................... - 81 -
7.1 Commonality and Product Platform Analysis ............................................................. - 81 -
7.1.1 Differentiation Plan ............................................................................................. - 81 -
7.1.2 Commonality Plan ............................................................................................... - 82 -
7.2 Final Recomm endations ............................................................................................. - 85 -
8.0 Summ ary and Conclusions ............................................................................................. - 87 -
[- 8 -]

8.1 Summ ary of m ethodology .......................................................................................... - 87
8.2 Key Results ................................................................................................................ - 89
8.3 Implem entation Challenges ......................................................................................... 90
8.4 Application to other agricultural m achine products ..................................................... - 90
W orks Cited ......................................................................................................................... - 93
Appendix ............................................................................................................................. 97
M odel Calibration ............................................................................................................ - 97
DOE Results ................................................................................................................. - 99
Total Pow er Consumption .......................................................................................... - 104
Autonom ous M ow er Patents........................................................................................... - 110
W alk Behind M ow er Patents .......................................................................................- 111
[- 9-]

This page left intentionally blank.
[- 10 -]

TABLE OF FIGURES
F igure 1 - T hesis R oadm ap ................................................................................................... - 18 -
Figure 2 - Patent Domain for Autonomous mower ..........................................................- 20 -
Figure 3 - Patent Activity versus Year for autonomous mower Domain............................- 21 -
Figure 4 - Comparsion of Walk Behind Mower and Autonomous Mower Patents ............ - 22 -
Figure 5 - MIPs requirements for Different Algorithms........................................................ - 29 -
Figure 6 - Typical GPS cost vs. accuracy ............................................................................. - 32 -
Figure 7 - Segm entation M ap ............................................................................................... - 34 -
Figure 8 - H ouse of Q uality .................................................................................................. - 35 -
Figure 9 - OPM Diagram for an Autonomous Mower........................................................... - 43 -
Figure 10 - Typical System Scope Diagram.......................................................................... - 44 -
Figure 11 - DSM of Autonomous Mower .............................................................................- 45 -
Figure 12 - Autonmous Mower DSM with Chassis Interactions............................................ - 47 -
Figure 13 - Functional attribute hierarchy............................................................................. - 49 -
Figure 14 - M orphological M atrix ........................................................................................ - 50 -
Figure 15 - Solution Applicabilty Rating for Morphological Matrix ..................................- 51 -
Figure 16 - Pairwise Ranking of Figures of Merit................................................................. - 52 -
Figure 17 - Pugh Concept Selection Results ......................................................................... - 53 -
Figure 18 - N2 Diagram of Autonomous Mower Vehicle. Subsystem decomposition and internal
variable feed forward and feedback loops. ........................................................................... - 57-
Figure 19 - DSM to MDSO decomposition Mapping............................................................ - 58 -
Figure 20 - Rolling Resistance versus Hill Incline ................................................................ - 59 -
Figure 21 - Slope variation for a Typical Yard...................................................................... - 68 -
Figure 22 - Optimization Results for 0-500m^2 Segment ..................................................... - 69 -
Figure 23 - Optimization Results for 500-1500M^2 Segment............................................... - 69 -
Figure 24 - Optimization Results for 1500-2500MA2 Segment ......................... - 69 -
Figure 25 - Comparsion Results for all Segments ................................................................. - 70 -
Figure 26 - Bass Model for Autonomous Mower Adoption .................................................. - 74 -
Figure 27 - Histogram of NPV Values ................................................................................. - 78 -
Figure 28 - Cumulative Distrubution of NPV Values............................................................ - 79 -
Figure 29 - Engineering Metrics for Target Segments........................................................... - 81 -
[- 11 -]

Figure 30 - G V I M atrix ........................................................................................................ - 82 -
Figure 31 - Typical Autonomous Mower Cost Breakdown................................................... - 84 -
Figure 32 - NPV for Common Chassis Platform Option vs. Base Option ............................. - 84 -
Figure 33 - NPV Histogram for Base vs. Option Case .......................................................... - 85 -
Figure 34 - Cumulative NPV Distrubution for Base vs. OPTION Case................... - 85 -
Figure 35 - Blade Design Parameter Effects on Loaded Power ......................... - 99 -
Figure 36 - Blade Design Parameter effects on Unloaded power........................ - 101 -
Figure 37 - B lade Sketch .................................................................................................... - 102 -
Figure 38 - Pareto Chart for Experiment 2.......................................................................... - 103 -
Figure 39 - Total power Data for Flat terrain, Units of Watts......................... - 105 -
Figure 40 - Statistical summary of flat mission................................................................... - 106 -
Figure 41 - H ill m ission profile data................................................................................... - 106 -
Figure 42 - H ill data sum m ary............................................................................................ - 107 -
Figure 43 - M onte Carlo R esults......................................................................................... - 108 -
Figure 44 - Simulation Correlation to flat terrain mission ................................................... - 109 -
Figure 45 - Simulation Overlay for Flat Terrain.................................................................. - 109 -
[- 12 -]

NOMENCLATURE
A = Area of the yard [M 2]
Ac = Area covered by the cutter [n 2 ]
3 = Number of battery charge cycles allowed [cycles]#8c = Number of battery charge cycles required [cycles]CDL = Number of total cuts in design life [#]CWR = Number of cuts requested per week [#]DB = Cost of the battery [E]Dc = Cost of the cutting system [E]DINV = Inventory cost [E]DM = Cost of the mower [E]DMFG = Manufacturing cost [E]DTco = Total cost of ownership [E]FRR = Force of rolling resistance [N]g = Acceleration of gravity [m2/s]yy = Angle of the yard incline [deg]hcR = Height of grass to be cut [mm]hD = Height of grass requested [mm]ho = Height of grass initially [mm]LA VG = Design life of the system [yrs]LEXP = Life of the system expected by customers [yrs]l0 = Optimal length of yard [m]Mc = Battery cell capacity [mAh]m = Mass of the mower [kg]Np = Number of parallel battery cells [#]Ns = Number of series battery cells [#]7c = Efficiency of cutting [%]nc act = Speed of the cutter [rot/s]
7cM = Efficiency of the cutting motor [%]7G = Efficiency of the gearbox [%]77M = Efficiency of the drive motor [%]7R = Efficiency of the route [%]nw = Speed of the wheels [m/s]Pc = Power required for cutting [W]PT = Power for traction [W]PTOT = Power required by the system [W]Pw = Power to drive wheels [W]rw = Radius of mower wheels [m]tB = Battery runtime [hr]tc = Time to cut yard [min]
rc = Torque required for cutting [Nm]rw = Torque required for powering the wheels [Nm]
VM = Velocity of the mower [m/s]Vc = Voltage of battery cell [V]Vs YS = Voltage of the battery system [V]
WC = Width of the cutter [m]
Xc = Number of battery charges needed per year [cycles / yr]YB = Total years before battery replacement [yrs]YM = Total years of mowing [yrs]
[- 13 -]

This page left intentionally blank.
[- 14 -]
INTRODUCTION
The purpose of this thesis is to develop a framework to help synthesize an optimize product
architectures for a robotic lawnmower. Robotics is a growing area of interest for household
automation. Autonomous mowing is the most recent innovation in outdoor power products for
lawn care and is very dependent on regulation and supporting technology developments. These
dependencies force necessary tradeoffs in product requirements to make cost effective and
functional products. By common definition autonomous mowers do not require human operators
and replace people in the required need of guiding a mowing system from start to finish over a
defined surface area of grass. Therefore, scheduling and the determination of total time per week
of mowing is an important interface between the vehicle and the user which determines the
quality of the job completed and the overall lifecycle cost of the vehicle. Low maintenance for
mechanicals and wear items is expected from the consumers with current mowers only needing
blade and battery replacements during their expected lives. These primary relationships are
reduced to a tradeoff between higher upfront capital costs for an autonomous mower system
versus lower operational cost during the expected lifetime. Overall lifecycle costs are an
important dimension that is used to determine the utility of the mower to different stakeholders
in the system. One of the key questions is to identify over which set of market segmentation
parameters and supporting technologies are autonomous mowers competitive to existing mowing
solutions. Also, which autonomous mower architectures are likely to be most successful from a
design, manufacturing and market perspective is analyzed. Examples of market parameters for
autonomous mowers are the climate in which they operate, the surface area to be mowed, type of
grass, the gradation of the land, the existence of various boundary conditions and obstacles as
well as whether the customers are private individuals, golf courses and other sports facilities,
commercial businesses such as hotels and office parks or public entities.
However, in order to truly become a game changer autonomous mowers may have to offer more
functionality than simply cutting grass and replacing human labor. Some value-added functions
of autonomous lawn mowers could be a health assessment of the grass as it is being mowed,
targeted seeding and fertilizing, aeration, processing of clippings and even the cutting of patterns
such as letters and other motifs into the grass. The question is how to synthesize and select
autonomous lawn moving architectures that can be competitive in the market today, while
[- 15 -]

providing a pathway to future enhanced functionality and competitiveness across a large range of
market segments. An additional challenge is how to incorporate the fast moving underlying
technologies and anticipating future regulation changes. Using systems architecture and
engineering framework to drive the design, reduce ambiguity, enhance creativity and manage
complexity are the elements of this challenge.
Compounding the problem of designing autonomous mowing systems over time is the fact that a
product family of autonomous mowers from more basic models to more advanced models is
desired. Thus, questions of component sharing and commonality across the product family are
inescapable. Balancing the expenditures of capital investment across a product family and the
need to meet product segmentation performance goals creates opportunity to enhance overall
project profitability. Reduced capital expenditure is enabled through the use of common parts,
such as a chassis.
The primary objective of the thesis is to examine how to optimize an autonomous mower to
minimize manufacturing costs while simultaneously reducing life cycle costs to the consumer.
The secondary consideration is to provide a robust framework for synthesizing and selecting
product/platform architectures that maximize the return on the investment for an autonomous
mower product development project. These objectives are fulfilled through the analysis of
customer needs, proper product segmentation, and supporting technology evaluation for
applicability.
The remainder of the thesis is structured and explained by the following brief chapter
descriptions:
Chapter 1 - This chapter is an overview of the past and current state of the autonomous mower
domain. Patent activity and lead user research provides a view into the beginnings of the early
products. Supporting technologies are reviewed for application to autonomous mowers for future
development trends. The chapter ends with segmentation of the autonomous mower market and
subsequent generation of a House of Quality to quantify customer needs and related engineering
characteristics.
Chapter 2 - This chapter explains the five aspects of a marketing analysis. Definition is given to
the following areas; company, collaborator, channel, context, and competitor.
[- 16 -]

Chapter 3 - Analyzing architecture for an autonomous mower is conducted in the third chapter.
An Object Process Methodology (OPM) model is constructed to understand the solution neutral
value statement of the product. Next, dependencies between processes and objects are evaluated
by using a Design Structure Matrix for the autonomous mower. Using figures of merit, a
morphological matrix, and Pugh concept selection a final architecture is synthesized for
optimization. Finally, lead user contributions are examined for potential impact on the
architecture using user toolkits and user configuration tools for customized products.
Chapter 4 - The model derivation for a multi disciplinary system optimization is detailed in this
chapter. Subsystems are defined with supporting equations derived and explained for the reader.
Synthesis of an autonomous mower architecture is completed by using figures of merit,
morphological matrix, and Pugh Concept Selection. Finally, an explanation of the optimization
algorithm is provided for the reader.
Chapter 5 - Final optimization results and selection of optimum design parameters for each
market segment are detailed in this chapter. Results are provided for each and insights are drawn
for important design tradeoffs.
Chapter 6 - A strawman business case is defined in this chapter. This process begins with the
definition of a preliminary product plan for the customer segments. Additionally, a Net Present
Value calculation is utilized with a Monte Carlo analysis to define the uncertainty in the business
plan.
Chapter 7 - A Real Options analysis is provided in this chapter. Definition of a commonality and
differentiation plan is provided. A Generational Variety Index calculation for selecting potential
communized components is provided. A typical cost structure breakdown is provided to further
evaluate the use of common components in product. Final platform recommendations are given.
Chapter 8 - A review of the methodology, key results, and implementation challenges fills the
final chapter. Application to other potential products is elaborated in the final segment.
[- 17 -]

A graphical map of the thesis structure for further clarification is provided in Figure 1 below.
Introduction
Patent SearchLead User Research
Computational Power
Chapter 1- Sensemaking Local Postioning~Evolution of Supporting TechnologiessensorsDistributed Networking
Market Segmentation Grid and Product Family Design
CompanyContext
Chapter 2 -5C's of Marketing Elaboration oft Channel
C.ollboator
K CompetitorModeling using OPM and DSM
Chapter 3 -Architecture Analysis Architecture Synthesis and Selection
<A FlexibeDe sin Frsn torltk om~ ousMow u <Open source investigationSubsystem Model Derivation
Chapter4- Autonomous Mower Model Developement 1 Selecting a preliminary architecture to analyze
Definition of the Optimizaation Problem
Chapter 5-Architecture Optimization Final results for segments
Product Plan definition
Chapter 6 - Business Case NPV calculation Bass Model Definition
Monte Carlo Analysis Distrubution Shape assumptions for selected parameters
Commonality PlanDifferentiation Plan
Chapter 7- Real Options Analysis - -4 GVI calculation
Final Platform Recommendations
Summary of MethodologyKey Results
Chapter 8 - Summary and Conclusionsplementation Challenges
Application to other Areas of Interest
FIGURE 1 - THESIS ROADMAP
[- 18 -]
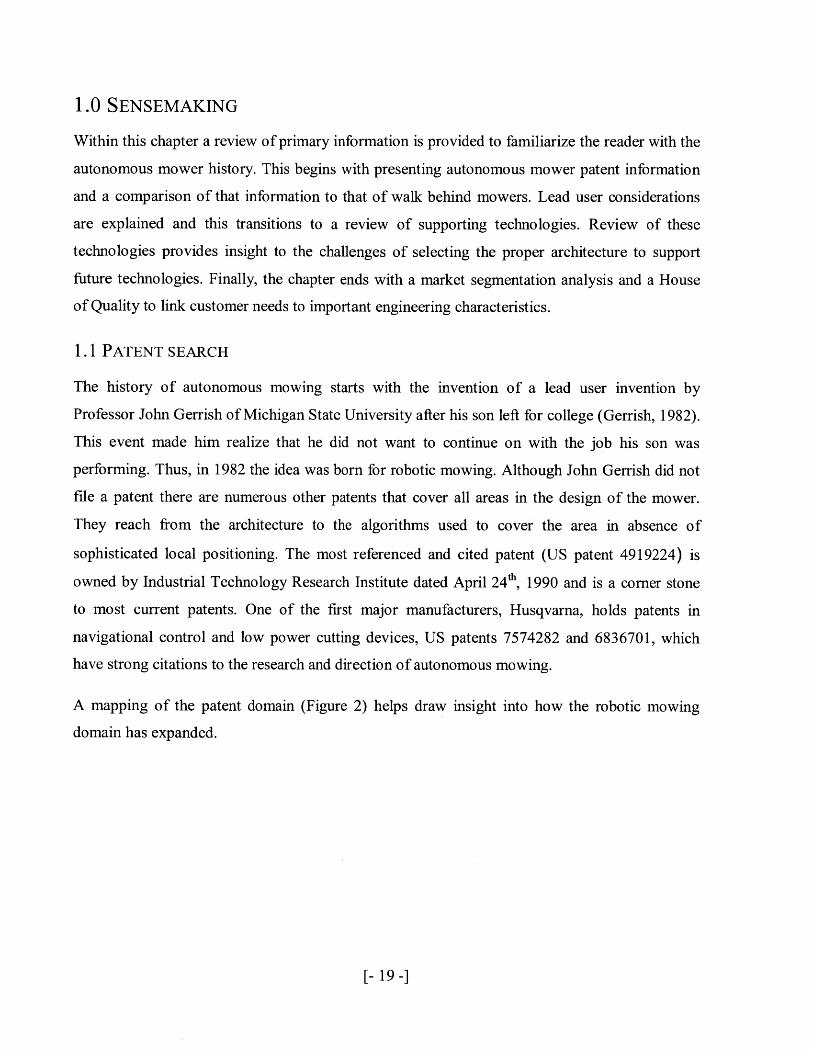
1.0 SENSEMAKING
Within this chapter a review of primary information is provided to familiarize the reader with the
autonomous mower history. This begins with presenting autonomous mower patent information
and a comparison of that information to that of walk behind mowers. Lead user considerations
are explained and this transitions to a review of supporting technologies. Review of these
technologies provides insight to the challenges of selecting the proper architecture to support
future technologies. Finally, the chapter ends with a market segmentation analysis and a House
of Quality to link customer needs to important engineering characteristics.
1.1 PATENT SEARCH
The history of autonomous mowing starts with the invention of a lead user invention by
Professor John Gerrish of Michigan State University after his son left for college (Gerrish, 1982).
This event made him realize that he did not want to continue on with the job his son was
performing. Thus, in 1982 the idea was born for robotic mowing. Although John Gerrish did not
file a patent there are numerous other patents that cover all areas in the design of the mower.
They reach from the architecture to the algorithms used to cover the area in absence of
sophisticated local positioning. The most referenced and cited patent (US patent 4919224) is
owned by Industrial Technology Research Institute dated April 24 , 1990 and is a corner stone
to most current patents. One of the first major manufacturers, Husqvarna, holds patents in
navigational control and low power cutting devices, US patents 7574282 and 6836701, which
have strong citations to the research and direction of autonomous mowing.
A mapping of the patent domain (Figure 2) helps draw insight into how the robotic mowing
domain has expanded.
[- 19 -]

Push TypeArchitecture
Ride On Type
Manual
Remote Control
Mechanical GuidanceNavigation Algorithms,
________- lectronic GuidanceMow ng Guidance I- - OPS
Autonomous ISensors 'Vision
InfraRed
Prograrmable
Rotary Blade
FIGURE 2 - PATENT DOMAIN FOR AUTONOMOUS MOWER
Primarily the field of application had started in forming the architecture related to the mowing
platform. The application of adding supporting technologies to existing architectures, such as
adding sensors and computers to a traditional mower, created a technology push for the
autonomous mower. This technology push is supported by the fact that autonomous mowers are
still developing the required functionality to replace existing push style type mowers. Even with
modern technology the autonomous mower is not robust enough to handle all customer lawns.
Extreme hills and narrow corridors often confuse autonomous mowers and require the use of
existing tools to complete the job.
Patents for autonomous mowing were filed regarding descriptions that varied from whether the
mower utilized a riding or push mower platform. Combined in this timeframe are developments
of the mowing techniques used. Coarse descriptors of mowing developments are rotary and reel
cutting techniques. There is a logical relationship that the platform architecture and the cutting
architecture are dependent and that an iterative pattern to these two categories exists as
technologies change. At the decline of the architectural patents activity a trend in patents began
that addressed the automation of the mower. Designs that specified the type of guidance used
emerged into two major categories; mechanical and electronically controlled autonomous
[- 20 -]

operation. The category of automatic or autonomous mowing has the most patent activity in the
years of 1980 and 1989. This time frame can be considered to have the highest activity for the
domain and where the emergence of the first consumer based mowers had occurred (Figure 3).
Patent Activity6 120.00%
5 --- -- 100.00%
4 - 80.00% Patents Filed
c 3 - -- 60.00% Cumulative4 0 Patents (%)
2 - - - - -- - - - - - - 40.00%
1 20.00%
0 ---- 0.00%1960 1970 1980 1990 2000 2010 2020
Year
FIGURE 3 - PATENT ACTIVITY VERSUS YEAR FOR AUTONOMOUS MOWER DOMAIN
For comparison the patent activity for walk behind mowers was researched. Patents regarding the
first mower were found in 1914 which defined the innovation of adding a motor to a manual
lawn mower. Patent activity was researched until 1979 where there were a total of 116 patents
filed in 66 years. This is compared to the autonomous mower domain filing 43 patents in 42
years. To compare the trends in patent data the years of each category were normalized to the
year of the first patent filed. Currently the autonomous mower patents are outpacing that of the
walk behind mowers. However, in the late 1970's the walk behind mowers experienced a boom
in patent activity due to self propelled drives, mulching, and bagging innovations. If the patent
trends remain similar between the respective categories a similar boom is due for autonomous
mowing within the next 20 years. Please see the appendix for all supporting patent tables and
listings.
[- 21 -]

Patent Comparison140
I 1:0u.
-60 -Walk Behind Mowers
-- Autonomous Mowers
E 40
20
0 -----.-----.-.- --.--
0 10 20 30 40 50 60 70
Years elapsed from first patent
FIGURE 4 - COMPARSION OF WALK BEHIND MOWER AND AUTONOMOUS MOWER PATENTS
1.2 LEAD USER RESEARCH
At this time there currently are two primary open source hardware platforms that address
autonomous mowing: Roomba Create and RoboCut. Indirectly, the Roomba open source
hardware platform is based on delivering value to educational projects and allows the users to
program the operating behaviors (iRobot, 2006). This open source hardware platform has a
dedicated website to help develop contributions and apply shared user experiences to the realm
of robotics, computer science, and engineering. The forum currently has contributions from 691
registered users (iRobot, 2006).
The RoboCut project is a "Do-it-Yourself' project for creating an autonomous mower (RoboCut,
2001). This very public development project was created in the spring of 2000 and allowed the
consumer to build their own autonomous mower. Activity on this site has stopped since 2004 and
no information can be found addressing the status of the project. Upon reflection the project was
very close to becoming a platform for an open source based product. RoboCut never developed
the ability to add user contributions and this is where they may have failed. By introducing the
product as a kit the ability to capture lead user innovations was greatly diminished. This strategy
to produce a user assembled kit did not create enough value to displace market leaders or gain
significant adoption in the market place. The ability to add user innovations was greatly
[- 22 -]

hampered by the closed nature of the kit itself. User modifications to the software or hardware
were not openly encouraged by the RoboCut. The kit specifications for components were not
easily accessible or sourced from other retail sources due to the closed nature of the design itself,
making user contributions difficult. RoboCut only delivered an unassembled product for a lower
cost and did not focus on creating a development platform. Designing the kit as a development
platform creates opportunity for a customer to innovate enable by the open information sharing
of the design. This is especially true for a customer who is willing to build a product that they are
purchasing for an unmet need, such as an autonomous mower. Capturing lead user innovations is
critical in a market place driven by heterogeneous customer needs, and this is indeed the case in
residential mowing. Each customer's yard provides a different challenge that constitutes a
massive range of unique and heterogeneous requirements. By utilizing lead user contributions
the most needed innovations can be rapidly introduced to the market place and any clusters or
groupings of user requirements could be "naturally" discovered in this way.
Creating spaces for people to share and create contributions has value in this space due to the
heterogeneity of the customer needs and the rapid ability to innovate from the lead users. The
manufacturers then can have the ability to adopt and manufacture the emerging dominant design
by supporting the use of user development kits and electronic resources.
1.3 Evolution of supporting technologIES
1.3.1 COMPUTATIONAL POWER
Increased efficiency of the autonomous mower is directly influenced by a number of vehicle
characteristics. Vehicle speed, cutting efficiency, and route efficiency are some of the most
important aspects to the performance of the vehicle. Primarily, the route efficiency is controlled
by the sensor selection and the computational power of the system. The functionality of creating
maps and path navigation creates the need to handle large amounts of data in real time to make
decisions for the vehicle when needed. When selecting the sensor system used to navigate the
vehicle around the work area, the designer must also consider the need for the additional
computational capacity for the sensor and navigation algorithm associated with the software and
hardware architectures. Therefore, the need for computational capacity trends is important as
technologies in local positioning and coverage algorithms progress.
[- 23 -]

The use of microprocessors over dedicated hardware circuitry is a consideration that must be
analyzed in the design of an autonomous vehicle. The advantages of using microprocessors are
multiple over that of discrete digital circuitry for appliance applications (Query & Tescher,
1990). Benefits include;
e reduced parts count
e smaller circuit boards
e improved performance and reliability
" cost reductions
" increased flexibility
" decreased response times
By utilizing these advantages of the microprocessor development costs and schedules can be
reduced for the project. Along with these advantages the design becomes more flexible in the
hardware and software application which provides an ability to capture the fast growing
capabilities of the microprocessor technology domain. Growing applications such as consumer
media entertainment, personal computers, and mobile computing drive rapid improvements to
performance of digital microprocessors. However, these processors need to be carefully
protected from the harsh temperature, moisture and vibration environment that they will
experience inside the autonomous mowing chassis.
The performance increases in computing power have been growing at an exponential pace. In
fact the integer performance of microprocessors has been growing at a minimum of 40% per year
for that of Intel products (Entiemble, 2002). RISC processors have a performance increase of
55% per year in the study topping that of Intel products. Arithmetic performance is an advantage
for autonomous mowing given that as path planning demands increase the ability of the
microprocessor to perform real time calculations also needs to increase. The steady growth of
microprocessor performance indicates that the processing performance is not the technology
bottleneck but other factors such as cost, flexibility, and size are the main parameters in selecting
a microprocessor for the autonomous mower. In fact since 1950 the increase in computing power
for high performance computing has followed Moore's Law with little deviation (Strohmaier,
Dongarra, Meuer, & Simon, 2005). Their research indicates that the overall average of
[- 24 -]

computing performance exceeds Moore's law, but the individual contributions of processor
performance and number of processors on computing power are slight lower than Moore's law.
This indicates that performance is not purely based on the design of the chip itself, but on the
architecture of the computing system in question. Additionally, how the architecture scales is
important to determine how applicable the technology is to mobile or household electronics.
A recent shift to mobile electronics has emphasized the need to have scalable microprocessor
architectures for mobile electronics. Over 90% of desktop computer cycles are spent on "media"
applications (Kozyrakis & Patterson, 1998). Having a scalable architecture is important to
mobile electronics as the demand for changing requirements compared to desktop applications
becomes increasingly apparent. Differentiated requirements of increased performance for
multimedia applications, high energy and power efficiency, small size, and low complexity for
mobile electronics are primary to delivering value to the household appliance industry. Scalable
architectures allow for easy transitions into the low power application of robotic products, or
battery powered products in general. Having the ability of high bandwidth for multimedia and
low power consumption allows the system architects to utilize more complex algorithms for
increase efficiency in navigation of the workspace. Recent data shows that the sales for PCs
have declined due to competition with the iPad (Scherr & Solsman, 2010).
The overall trends in computing power indicate that gains are happening at an exponential rate.
Increasing suitability due to the mobile electronics market is changing requirements to higher
performance and low power applications which benefit the autonomous mower domain.
Therefore, computational power is not a key limiting factor in the development of autonomous
mowing and is a benefactor of surrounding business domains of microprocessor technology. For
typical requirements of processor computational power versus different algorithm applications
refer to section 1.3.3.4.
1.3.2 COST VERSUS COMPUTATIONAL PERFORMANCE
The cost of computing performance is controlled by a number of parameters such as the chipset
market size and segmentation, technology advancements, and computing architectures. Having
increased transistor counts and density on microprocessors dramatically increase performance in
accordance to Moore's law, but this performance comes with a penalty. Increased transistor
density also increases the capital cost of the manufacturing of the microprocessor at an
[- 25 -]

exponential rate (Yu, Albert; Intel, 1996). Costly tooling requirements need increasingly larger
sales volumes to create adequate returns on investment. Therefore, the newest and most
advanced chipsets have a barrier to production of needing larger and larger markets for the
development expenditures. This increases the risk of creating cutting edge megaperformance
chipsets. Future investment of microprocessor design has indicated a shift to smaller and more
power efficient designs (Scherr & Solsman, 2010). This is a beneficial aspect to autonomous
mowing as the technological trends of the microprocessor market are focusing on important
metrics of processor performance.
Cost for constant performance is another metric to indicate the time frame for processor
performance to reach certain levels for entry into different markets other than the personal
computers. Moore's law explains the evolving nature of the highest performance
microprocessors, but does not fully explain the mechanisms of how higher performance come at
the same cost. The evolution of more powerful microprocessors allows the formation of sub class
derivatives (Bell, 2008). A new computer class forms and approximately doubles each decade
driving costs down for similar performance. New classes are formed to deliver new functionality
and unique price ranges and ultimately derive a new class of "minimal" computers. Minimal
computers are defined by using fewer components compared to the state of the art computers
(Bell, 2008). These more general purpose classes generally overtake the original class which
spawned the faster evolving minimal class. Bell also states the when the class size doubles that a
10-15% cost reduction in manufacturing is a result. These actions result in decreased cost for
constant performance and increased adoption of the faster innovating technology. A useful
metric to establish the increased gains of performance versus cost is millions of instructions per
second (MIPS) over the cost of the processor. From 1969 to 1989 the MIPS/dollar ratio had
increased by a factor of over one million (Gelsinger, Patrick P.; Gargini, Paolo A.; Parker,
Gerhard H.; Yu, Albert Y.C.;Intel, 1989).
The development of computer microprocessors is supportive to the development of autonomous
mowing for future capabilities. Trends to low power computing, small size, low complexity, real
time calculation driven by multimedia capabilities, and a growing business ecosystem for
portable electronics create economies of scale for the autonomous mowing applications. The
[- 26 -]

flexibility and computing power of microprocessors is also supportive of reduced development
times and creates a platform for rapid development.
1.3.3 RELATIONSHIP BETWEEN COMPUTATION POWER AND VEHICLE PERFORMANCE
Computational power is needed for autonomous mowing in order to have efficient route planning
and mapping of the workspace. The increased efficiency of the route planning allows the
operating time requirements of the vehicle to be reduced. Less run time per mowing translates to
smaller batteries and lower overall life requirements for the design life of the components.
Increases to overall system reliability are achievable without large cost increases due to over
demanding subsystem requirements.
1.3.3.1 TYPICAL MIPS REQUIREMENTS FOR DIFFERENT PROCESSES
Route planning requires real time mapping and decision making which increases the operations
per second of the processor. Sensor systems that create large amounts of data create the need for
increased memory and speed of calculation. Algorithm development for the path planning
decision and navigation create additional demand for the processing power. In order to
understand the computational power needed for different applications related to autonomous
mowing similar applications were used as benchmarks. A range of processes from simple to
elaborate are compared in Figure 5. The first process was a PID control that used Fast Fourier
Transform to condition the data (ST Micro, 2010). A simple hand calculation was based from the
execution time given in the documentation of 0.819ps. This PID loop requires 0.15 MIPS if
running at the assumed 500Hz sample rate. The equation used for this calculation is listed below:
( CloCk SpeedMIPSPID = x task time x task execution frequency
k# of wait states)
This calculation does not take into account all the needed processes for a robotic machine to
function and is is grossly oversimplified. To evaluate the MIPs needed to run a basic robot up to
an advanced optical mapping system a different approach was taken. Examples of processor used
in these applications were found in current literature. Using this data creates a comprehensive
evaluation of the realistic application code and MIPs needed to run a robotic system. The first
example is a basic robot vehicle that used an Atmel ATmega32 microcontroller supplying 16
MIPs at 16Mhz (Usov, Stramigioli, van Amerongen, van Oort, & Dertien, 2006). This was used
[- 27 -]

for basic control of the robot which was primarily utilized for steering functionality. The highest
level of control processing power was taken from a quadcopter aerial vehicle. Control of this
type of vehicle is an upper limit of processing power due to the fast dynamics and control
algorithms needed for three translations and three rotations of movement. The required
processing power for a quadcopter is a DSP unit providing 150 MIPs (Courbon, Mezouar, &
Guenard, 2009).
The last examples given are for utilizing Simultaneous Localization and Mapping (SLAM) and
real time optical image processing for mapping capabilities of the robot. These examples are the
probable upper limit needed for processing power from the use of the most advanced navigation
techniques. The first example using these techniques is taken from same reference as the steering
robot mentioned in the previous paragraph (Usov, Stramigioli, van Amerongen, van Oort, &
Dertien, 2006). In this work the mapping and navigation abilities were processed using a separate
VIA C3 E-Series 1.2 GHz Processor Nehemiah core chipset. This chipset is capable of
approximately 1581 MIPs. This work is an excellent parallel to autonomous mowing production
needs as the developers were cost conscience of the design and used these as criteria for the
selection of the processor. The second design was the BeBot, a modular mobile development
platform robot (Herbrechtsmeier, Witkowski, & Ruckert, 2009). This robot uses an ARM
Cortex-A8 processor with NEON SIMD coprocessor capable of 1200 MIPs. It becomes apparent
that mapping in real time is computationally expensive and needs computational power
equivalent to that of a notebook computer. Increased computational power is needed for real time
mapping due to the frame rate of the mapped images being proportional to the processor
capability (Karlsson, Niklas; Munich, Mario E.; Goncalves, Luis; Ostrowski, Jim ; Di Bemardo,
Enrico ; F'irja, Paolo;, 2004). Increased frame rates are desirable to increase the accuracy of the
maps and decreasing response times for navigation decisions. Current autonomous mowers use
approximately 90 MIPs for the system. However, with increased development the mapping
algorithms become more efficient and lessen the requirements for processing power. Areview of
these results is shown in Figure 5.
[- 28 -]

FIGURE 5 - MIPS REQUIREMENTS FOR DIFFERENT ALGORITHMS
Algorithm efficiency is a separate aspect that is related to the development time of the product.
More sophisticated control and mapping algorithms allow lower performance processors to be
used at the expense of development time. It could be suggested that the development of control
algorithms follow much of the same evolution of the processors themselves. First a complex
algorithm is developed that creates the needed functionality, but requires many computational
operations per second. This code then is followed by a minimal set of coding that contains only
the minimal functionality to run on cost effective hardware. This platform of hardware and
software evolves and potentially surpasses the original functionality of the higher end equipment
at a lower cost. This hypothesis is supported by the recent developments in autonomous robotic
vacuum cleaners. Previous generations of autonomous vacuums used random algorithms to cover
the area as this is simple and cost effective to manufacture. Neato Robotics has raised the
performance of robotics at a cost effective price point by introducing a local positioning
approach using laser scanning and Simultaneous Localization and Mapping (SLAM) for
$399.00. (Taylor, 2010). This development in state of the art algorithm development on low cost
hardware and consumer products supports that path planning and decision making are possible at
a competitive price point with surrounding products.
By increasing the processing power, memory, and the ability of sensors to map the work area
performance of an autonomous mower is increased. Creating an algorithm that prevents overlap
and re-traveling over areas of the lawn already cut reduce the time to mow and thus the overall
durability requirements of the vehicle. Reduced durability requirements create additional
opportunities for cost reduction and cost competiveness of the product. Path planning also
enables the ability to cover all areas of the lawn and reducing the need for trimming and
[- 29 -]
Algorithm Processor DMIPsPID STM32F10x DSP 0.15Simple steering robotsystem Atmel ATmega32 16Quadcopter stabilization N/A 150SLAM and optical based ARM Cortex-A8 processornavigation Robot #1 with NEON SIMD 1200SLAM and optical based VIA C3 E-Series 1.2 GHznavigation Robot #2 Processor Nehemiah core 1581
additional tools needed by the owner. These are among the highest rated customer requirements
as shown in the House of Quality provided in this paper.
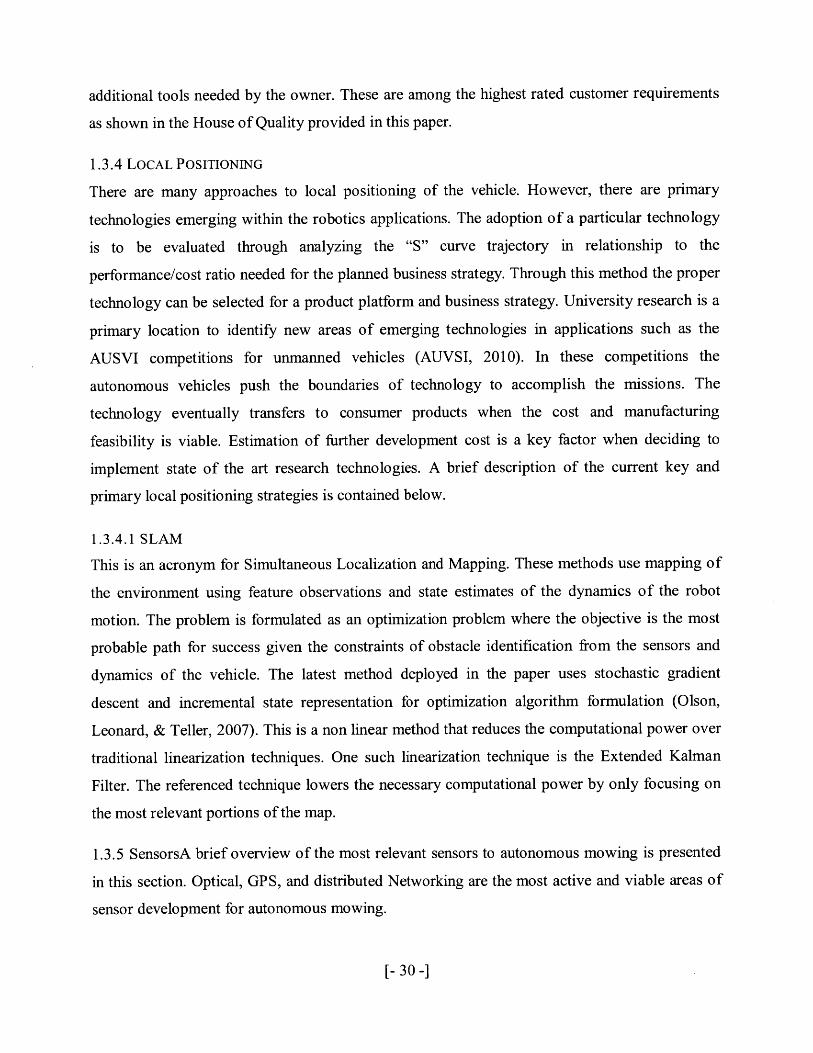
1.3.4 LOCAL POSITIONING
There are many approaches to local positioning of the vehicle. However, there are primary
technologies emerging within the robotics applications. The adoption of a particular technology
is to be evaluated through analyzing the "S" curve trajectory in relationship to the
performance/cost ratio needed for the planned business strategy. Through this method the proper
technology can be selected for a product platform and business strategy. University research is a
primary location to identify new areas of emerging technologies in applications such as the
AUSVI competitions for unmanned vehicles (AUVSI, 2010). In these competitions the
autonomous vehicles push the boundaries of technology to accomplish the missions. The
technology eventually transfers to consumer products when the cost and manufacturing
feasibility is viable. Estimation of further development cost is a key factor when deciding to
implement state of the art research technologies. A brief description of the current key and
primary local positioning strategies is contained below.
1.3.4.1 SLAM
This is an acronym for Simultaneous Localization and Mapping. These methods use mapping of
the environment using feature observations and state estimates of the dynamics of the robot
motion. The problem is formulated as an optimization problem where the objective is the most
probable path for success given the constraints of obstacle identification from the sensors and
dynamics of the vehicle. The latest method deployed in the paper uses stochastic gradient
descent and incremental state representation for optimization algorithm formulation (Olson,
Leonard, & Teller, 2007). This is a non linear method that reduces the computational power over
traditional linearization techniques. One such linearization technique is the Extended Kalman
Filter. The referenced technique lowers the necessary computational power by only focusing on
the most relevant portions of the map.
1.3.5 SensorsA brief overview of the most relevant sensors to autonomous mowing is presented
in this section. Optical, GPS, and distributed Networking are the most active and viable areas of
sensor development for autonomous mowing.
[- 30 -]

1.3.5.1 OPTICAL
Optical sensors have become the most used and developed technology in robotic sensing. The
main types of optical sensors are CCD stereo cameras or laser scanning devices that provide data
for maps of the surrounding terrain or obstacles. Both of these methods have limitations. These
limitations are best described in findings from autonomous indoor aerial vehicles applications.
This realm of robotics is a lead user of the technologies and extract critical limitations in trying
to achieve their goal of flying autonomously in areas were GPS is not available. Laser range
finding is useful when the objects in the workspace are unique and not homogeneous and since it
formats the data into 2D slice it does not perceive objects outside the tuned range (Achtelik,
Bachrach, He, Prentice, & Roy, 2009). Therefore, navigating long corridors present difficulty for
these sensors due to the limited range and the extents of the corridor are only traversable by
exploration, In contrast stereo vision cameras provide large quantities of 3D data but have
difficulty distinguishing unique items in the field of view. Distinguishing important and useful
navigational characteristics is a critical challenge with using optical cameras and delivering
usable maps. Low light environments increase this challenge for camera systems with decreased
exposure levels and contrast for locating objects. The mentioned proceedings also indicate that
stereo cameras have a limited angle of view and become computationally expensive to utilize the
data generated. However, the growing research and application of optical based sensors are
continuing to grow due to the functionality of operating indoors and increased accuracy of that
over GPS.
1.3.5.2 GPS
Global Positioning Systems have proved their useful functionality in providing location
information data in such products as cell phones and car navigation units. The specifications of
these products provide important insight for the feasibility in application to autonomous mowers.
A critical reason for this is they are commercial products that compete heavily on cost for
increased adoption. Comparing the accuracy of these cost sensitive systems gives creates the
understanding to the performance limitations of GPS to that of autonomous mowing. In contrast
to the optical based technologies, GPS systems are only functional in locations with a line of
sight to the sky. Indoor applications are not suitable for GPS systems, as no data is available
from the satellites without this line of site. This drawback does not exclude the sensor system
from use on an autonomous mowing vehicle since these products work exclusively outdoors.
[- 31 -]
However, the drawback to using GPS for local positioning is the overall accuracy of the sensor
system.
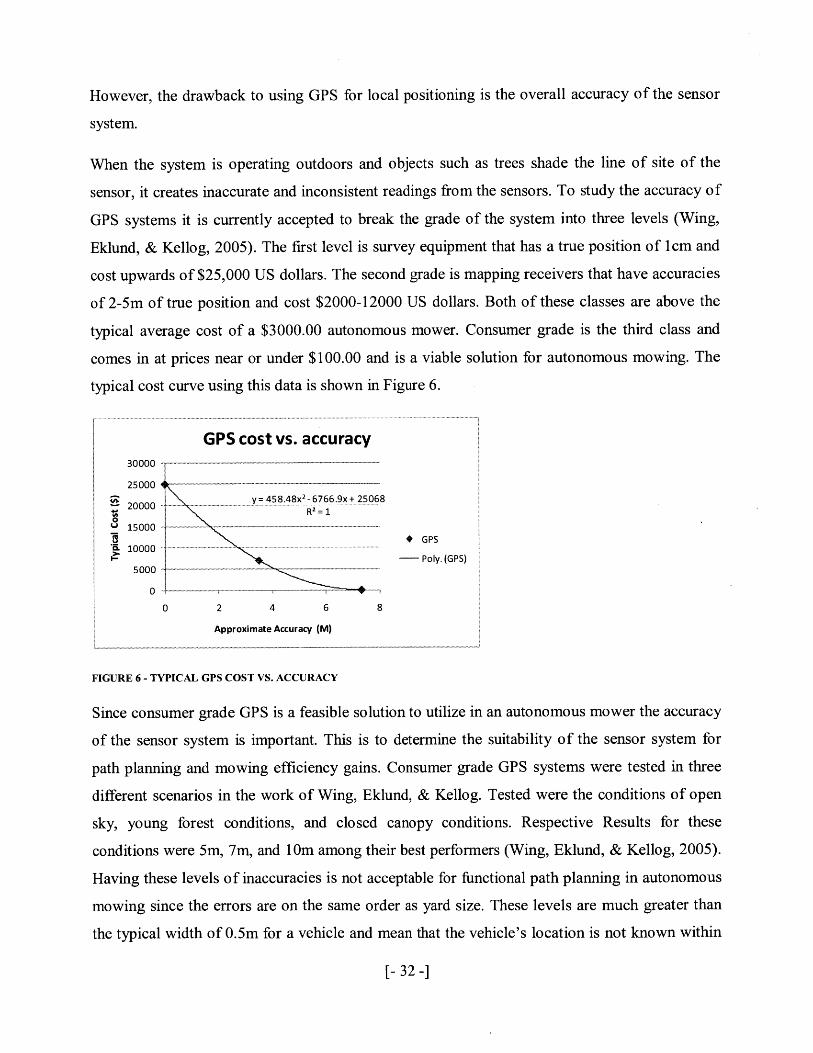
When the system is operating outdoors and objects such as trees shade the line of site of the
sensor, it creates inaccurate and inconsistent readings from the sensors. To study the accuracy of
GPS systems it is currently accepted to break the grade of the system into three levels (Wing,
Eklund, & Kellog, 2005). The first level is survey equipment that has a true position of lcm and
cost upwards of $25,000 US dollars. The second grade is mapping receivers that have accuracies
of 2-5m of true position and cost $2000-12000 US dollars. Both of these classes are above the
typical average cost of a $3000.00 autonomous mower. Consumer grade is the third class and
comes in at prices near or under $100.00 and is a viable solution for autonomous mowing. The
typical cost curve using this data is shown in Figure 6.
GPS cost vs. accuracy30000
25000 4
y= 458.48X2-6766.9x+ 25068
015000 -------
5 + GPSTi10000
- - Poly. (GPS)5000
0 -
0 2 4 6 8
Approximate Accuracy (M)
FIGURE 6 - TYPICAL GPS COST VS. ACCURACY
Since consumer grade GPS is a feasible solution to utilize in an autonomous mower the accuracy
of the sensor system is important. This is to determine the suitability of the sensor system for
path planning and mowing efficiency gains. Consumer grade GPS systems were tested in three
different scenarios in the work of Wing, Eklund, & Kellog. Tested were the conditions of open
sky, young forest conditions, and closed canopy conditions. Respective Results for these
conditions were 5m, 7m, and 1Oim among their best performers (Wing, Eklund, & Kellog, 2005).
Having these levels of inaccuracies is not acceptable for functional path planning in autonomous
mowing since the errors are on the same order as yard size. These levels are much greater than
the typical width of 0.5m for a vehicle and mean that the vehicle's location is not known within
[- 32 -]

an order of magnitude of the vehicle's size. This lack of precision makes path planning an
unlikely success with consumer grade GPS. At 10 meters of precision the vehicle would trample
important items such as flower gardens and mow far outside the owner's property.
However, compared to the current products that randomly navigate the yard, GPS enables coarse
map generation to create relatively complete coverage of the work space. Instead of complete
path planning the vehicle can navigate to different areas of the yard that have not been addressed
in reasonable time frames. An example of this functionality is if a steep hill is within the work
area. The GPS can enable the vehicle to completely navigate to the top of the hill and counter act
the effects of gravity and tire slip in pulling the vehicle to the bottom the hill. If a random
coverage algorithm was used the total time in the yard needed to cover the top of the hill is
increased compared to that of a GPS enabled machine. A minimal and coarse map from the GPS
is enough to save valuable coverage time over the current random techniques. Although these
efficiency gains are not ideal compared to complete path planning the benefits are still
substantial in large areas. In large yard segments the coarse maps save significant portions of
time and minimize the need for excessively large batteries and costs. Small efficiency gains
create large amounts of time saved in large yards and have significant impact to the required life
of the vehicle in design hours, Less design hours translates in increased reliability and potential
for smaller components.
1.3.6 DISTRIBUTED NETWORKING
Distributed network systems are utilized in areas where the position of nodes is estimated
through distance measurements. This is an algorithm that can be utilized in noisy sensor
environments such as ultrasonic, radio frequency, or infrared sensor technologies. The
application has been utilized in mapping the working area of a mobile robot using ultrasonic
sensors (Moore, Leonard, Rus, & Teller, 2004). Instead of using a high cost GPS, laser, or
camera vision system; a low cost sensor network such as RFID is utilized to map the workspace.
Combining a robust network localization algorithm using low cost passive sensors distributed
within the workspace creates a viable means of creating a form of path planning and increasingly
efficient navigation. However, for this to work local (powered) beacons would have to be, at a
minimum, installed in the corners of the yard.
[- 33 -]

1.4 MARKET SEGMENTATION GRID AND PRODUCT FAMILY DESIGN
The primary market segmentation variable to the autonomous lawn mower is yard size.
Additional consideration to customer segment variables of grass type, maximum incline of the
yard, and yard complexity are considered. Current lawn mowers are primarily segmented by
lawn size and this has become an industry standard. However, to better suit the need of the
customer and establish additional axes of comparison the two variables for complexity of the
yard are to be added to the segmentation map. The first variable is the maximum slopes of the
yard and the second is if the yard has narrow corridors between large parcels of grass. As the
terrain slope increases the tractive power and navigational abilities of the vehicle have to
increase to adequately cover the property. Large slopes increase the difficulty of the vehicle
getting to the top consistently due to traction needed and the effects of gravity pulling the vehicle
to the bottom of the hill. Increased navigational abilities are needed to offset these additional
demands and create even coverage for the entire yard in an efficient manner.
>20% Grade
5.1-20% Grade
<5% Grade
501-1000MA2 >1 OOOMA2
FIGURE 7 - SEGMENTATION MAP
[- 34 -]

1.5 HOUSE OF QUALITY
Construction of the HOQ is dependent on the segmentation plan and context of the problem that
the customer is trying to solve through the use of the product in question. Primary segmentation
variables are shown in Figure 7 and consist of yard size, corridors contained in the yard, and
maximum gradient within the yard. These are physical attributes of the yard size and difficulty
that allow insight into the context of "how" the vehicle needs to operate to provide value.
However, additional context to what the customer is trying to accomplish is provided through
additional market research. A preview description of the customers is given in 5C's of marketing
portion of this work. Autonomous mowing is targeted to a segment that enjoys having a well
kept yard, but is limited on time and has to conform to regulations on sound output. Additionally,
this customer possibly considers that mowing is more of a chore than a productive way to spend
their time. The data provided in the below HOQ was provided derived through field interviews
of current owners of autonomous mowers.
..b..e__...._.....__A ..1 94 1. .4 ..... .9. 993 3.. 3 3. .
L1 3 41 3 9
Ovawgomisb 9 4 54 9 45 123 3 10 2 24 u u4 u 3 u 12 as 1 9 95 9 93 2 Jo 91 1 5 s 3Relative~ % 5% 5% 5% 5% 5% 5% 5% 5% 4% 4% 4% 9% 4 % 3 3 3 3% 4% 3% 3 % 3 3 % 2 % % 2 %
Tage Vau/Se t
3~ 3 odo 9 b 9 1 1 3 9 3 9 ; 113;DvivvPvviy 1 31 9 33 1 1 1 1 1 9F
Cuasytomaer requree nt wer afiiie thrug cutoe comet fro the fil viis Nin
L- - 1 9A~t41 33 1 3
HeLpI le 3oire 9 31~3 9 3 93 9 t
Relative lK 5%1 5r 391 5% 5% 5% 3% 432 4 4 % 4 3% % 3 %4 % 3 % 3 3 % 2% % 2% % 1% 0
Custmr requirements areristedwithimpdtoncgfrh customer mmes from thae fied viss.ocite
with a ranked order of the most important engineering characteristics. Each customer
requirements is described below:
[- 35 -]

1. "Do a good job" - This is related to mower keeping the lawn looking well kept. No
clippings that are visible and grass that is maintained to an even cut for the desired
height. This requirement also includes that high cut quality is desired in the rain and
inclement conditions.
2. "Easy to install/learn to use" - Customers require that the system does not take a lot
of time or experience to install and have the intended performance. Also, the
customer expects that the controls are intuitive and easy to use and program.
Elaborate efforts in wither dimension creates a product that is difficult to use and
extract the intended value of saving time while having a well maintained yard.
Customers want minimal changes to existing property and proper feedback that the
system is operating correctly. Wear to the grass due to traveling over the same areas
repeatedly is not desired.
3. "Easy to own (reliable/save time)" - Customers are interested in a product that saves
them time and is free from breakdown and interventions to help the vehicle along.
The vehicle should not damage itself and should be easy to maintain and clean. Time
savings to the customer is the intended consideration.
4. "Durable"- The product is viewed as a durable household appliance and is expected
to have a useful life of ten years.
5. "Low cost of ownership" - Customers are expecting low costs to operate the vehicle
in terms of electricity or fuels cost. Also, replacement parts are to affordable if needed
to be replaced, i.e. batteries.
6. "Low damage to property" - The system should mow the yard without damaging
objects in or surrounding the work space. Constant bumping or riding up and on to is
not desired and cause wear to both the machine and the property.
7. "Navigates the entire yard" - The vehicle need to perform on inclines, through
ditches, and in wet conditions without getting stuck.
8. "Aesthetics" - The vehicle should be pleasing to look at in shape and in function.
Styling is be associated with cutting edge technology. Smooth operation and the
appearance that the vehicle is operating correctly is important feed back to the owner.
Debris build up on the vehicle is not desired.
[- 36 -]

9. "Help the environment" - Low noise emission and carbon footprint is customer need
supported by increasing regulatory enforcement. Quiet operation allows the system to
operate in all hours of the day and keeping the neighbors and regulators satisfied.
[- 37 -]

This page left intentionally blank.
[- 38 -]

2.0 5C's OF MARKETING
The 5C's are utilized to create a situational analysis for an integrated marketing plan detailed in
the following sections. (Kotler & Lane, 13th ed.)
2.1 CoMPANY
Most companies interested in this business are primary located in two possible domains, the
traditional outdoor power products business or the larger comparative business of electronics and
computer products. A key characteristic of the business ecosystem is that the entrants need to
establish a clear retail channel for the distribution of the product. Companies that have existing
relationships to mass or dealer channels have a competitive advantage over upstart companies in
the domain. This creates a barrier to entry due to the inability to support and sell the product. As
the functionality of the machine increases and the product becomes a commodity, this advantage
is decreased. When autonomous mowers meet the customer requirements of completely
maintaining the yard without any additional tools, easy to no installation, and with no required
assembly, this barrier to entry is eliminated. A product that meets these needs is ready for mass
market adoption due to the decreased need of requiring heuristic knowledge about the system for
correct functionality through fuzzy installation requirements.
2.2 CONTEXT
The context to an autonomous mower is that it is for a person who wants to enjoy the look and
feel of well-kept turf without the effort required by traditional means of maintenance or without
hiring a lawn care service. Autonomous mowing has been targeted toward the upper income
segments of the population due the initial high relative cost of the product. The current primary
market exists in Europe where the social demands make lawn care with traditional products a
difficult undertaking. Noise regulation and the disturbance that traditional mowers create
constrains the customer on when they can accomplish their lawn care (e.g. no mowing allowed
on Sundays) Restrictions on time and increasingly busier time schedules compound the problem
in addition to the noise regulations. The autonomous mower creates value by allowing the lawn
care to occur with respect to the ever increasing constraints. By creating a quiet product that runs
on electricity that can mow without intervention eases these constraints and allows the consumer
to enjoy the benefits of a well kept lawn. This context should also be expanded to a parallel view
[- 39 -]

of a company that needs to maintain a turf field at the lowest effort and cost, i.e. corporations and
sports complexes. The complexity of a sports field is lower relative to heterogeneous
homeowner's lawns. This is due to sports fields being clearly regulated in size and shape. Even
though the size and shape of a sports field is easier to path plan and creates fewer unknown
terrain conditions, the scheduling portion of a sports field is complex. An autonomous mower
needs to completely mow the field during off peak hours and therefore needs increased
efficiency and mowing power to complete the job in a timeframe of hours. This is in contrast to a
consumer autonomous mower that completes the mowing job over the course of days to keep the
complexity and cost of the product low.
2.3 CHANNEL
Primary autonomous mower sales are through Europe and North America. Included regions
other than these are Australia and portions of South America. Primary sales channels are through
dealer networks moving to mass retail channels, as the product becomes a commodity. Currently,
autonomous mower sales are not tracked by the leading international trade association, Outdoor
Power Equipment Institute (OPEI). This is due to the relatively new nature of the product and
low number of sales up to this point. Husqvama has sold 120,000 units in its dealer channel since
1995, making the company the global leader in autonomous mowing (Husqvarna, 2010).
2.4 COLLABORATOR
Main collaborators for product development are universities, electronic hardware, and software
providers. Sensors, control algorithms, and processing speed need the latest advancements in
technology to give performance at a reasonable cost to the consumer. At this point the mower
does not meet all the needs of the customer even at a premium price. Not all needs are met due to
the fact that there is grass left behind that needs trimming along the perimeter of the lawn, i.e. a
string trimmer to clean the edge of the yard is needed. Current directives for safety require
adequate space or guarding to protect ingress of limbs into the mower (IEC draft 60335-2-107).
Results of these passive safety measures are most likely to decrease the trimability and cut
quality of the vehicle. Active sensors to guard against ingress are an alternative solution to the
safety directive that is less likely to compromise important vehicle qualities. Therefore, to
increase adoption the autonomous mower is benefitted from a strong collaborative relationship
[- 40 -]

outside the normal outdoor products business domain to increase innovation and value to the
customer.
2.5 COMPETITOR
Currently the major competitors are Husqvarna, Zuchetti, Friendly Robotics, and Toro. However,
outside the outdoor power products domain competitors could come from companies such as
Honda, iRobot, Samsung, and Boston Dynamics and of course John Deere.
[- 41 -]

This page left intentionally blank.
[- 42 -]

3.0 ARCHITECTURE ANALYSIS
3.1 MODELING OF AUTONOMOUS LAWN MOWER ARCHITECTURES USING OPM AND
DSM
Consideration of the complexity of an autonomous mower system is an analysis step that
provides insight to the interaction and interfaces that need to be defmed. The first step to
defining the system is provided through the use of an Object-Process Methodology (OPM)
diagram. Creating an OPM diagram allows for a solution neutral problem statement that is
related to the context of the problem. Figure 9 is the OPM for the autonomous mower and
defines the context/intent and solution neutral problem statement.
& Decomposes to
A Specializes to
A Has attributes of
........................ A...........
RoboticMower
IntentForm
Function
FIGURE 9 - OPM DIAGRAM FOR AN AUTONOMOUS MOWER
Included in the above diagram is the form relationship of concept definition of the solution. This
column is the dependent of the available technology available at the time and the ability to
innovate suitable architectures to meet the need of the customer's intent. The form is what this
[- 43 -]

work is concentrated on defining and optimizing to provide maximum value to all stakeholders.
However, the baseline and start point to this analysis is established as the current dominant
architecture available in the market place. This autonomous mower form is currently defined by
the attributes of a wheeled vehicle that can perform zero radius turns and wire containment. The
current dominant system design scope is diagramed below in Figure 10. The current scope and
primary elements of an autonomous mower consists of the vehicle, wire containment system,
charge and charge station. A simple functional break down of these elements determines that
there is a need to mow the grass, a way to define what grass needs to be mowed, and a means to
provide energy transfer and conversion.
r--------- C
I Wireless Module:IYa rd.. ..
Future SystemI I Boundary
Boundary wire
Communications (I way)
Wireless Capabiliy for
GPS
Boundary Wire
------------- - - -.. - - - - - - - - - - -System
ConfigurationBoundary
User Interfao
Item KeyWireless Connection Point
FIGURE 10 - TYPICAL SYSTEM SCOPE DIAGRAM
In order to establish the interdependencies among the components in the system a Design
Structure Matrix (DSM) tool is utilized to graphically show these relationships. Included in the
DSM analysis are functional considerations of the system alongside of the components
[- 44 -]

relationships. Providing functional interdependencies in the analysis allows understanding of
which components impact the functional operation of the system and to which degree. The DSM
of the current architecture is shown in Figure 11 below.
Components Function
DD'D D D D D D:D D:D DD Key
X D D D A-attachesA XD C-connects
A A XD :D D D D-dependsSAX:D D :D :D I-instrument
X DID D E-enablesA X D D D D D
X D DD
V. ~C C C X D D D D D D D DAC X D DAC X DD D
AC X DA ~ A C X D
t ~AC X ___ :DX D DD D
I11 1 1 1 I I X D
FIGURE 11 -OSM OF AUTONOMOUS MOWER
In the above DSM the order of each element has been shifted to create modules with the least
amount of feed-back situations. Clear partitioning of the system into modules creates natural
subsystems that need information to travel across important interfaces to reduce rework and
omissions of intended functionality. Within the DSM there are three modules which are the
subsystems of;
0 The vehicle chassis subsystem which acts as the main bus to integrate all of the
subcomponents. This grouping is represented by the large upper left square in the matrix.
The physical layout of the chassis facilitates and allows the intended functionality of the
autonomous mower to emerge. The large amount of dependent interactions to the bottom
[- 45 -]
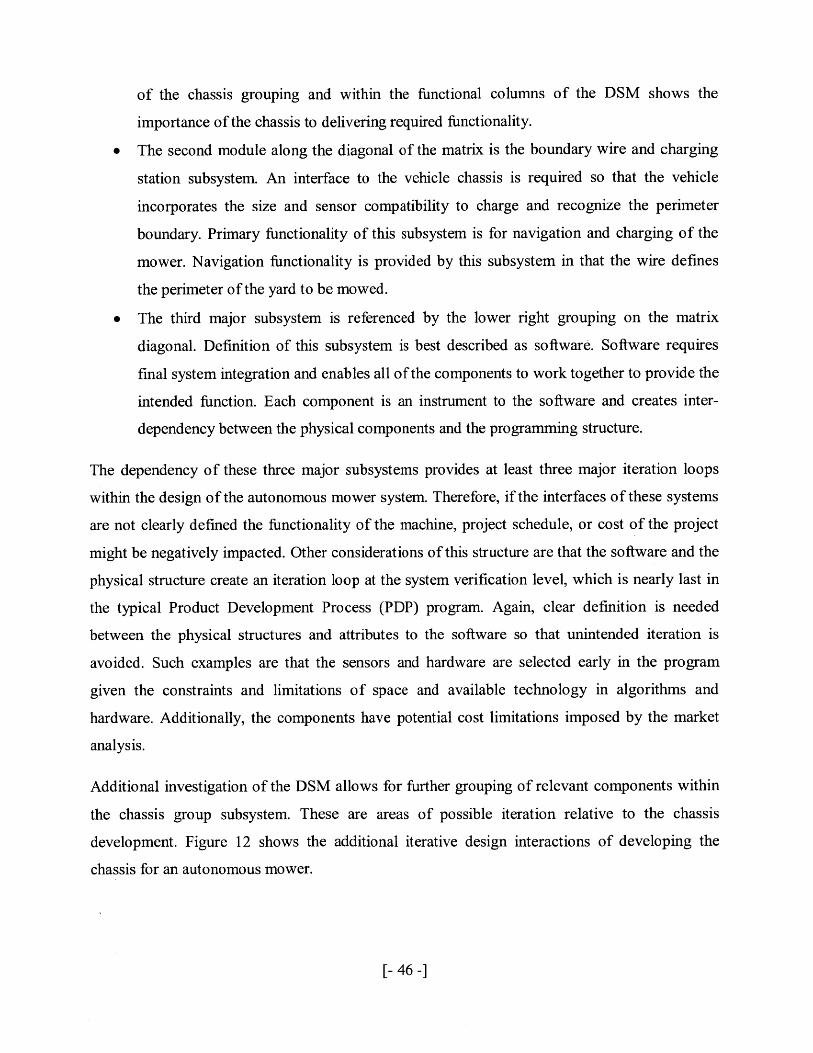
of the chassis grouping and within the functional columns of the DSM shows the
importance of the chassis to delivering required functionality.
" The second module along the diagonal of the matrix is the boundary wire and charging
station subsystem. An interface to the vehicle chassis is required so that the vehicle
incorporates the size and sensor compatibility to charge and recognize the perimeter
boundary. Primary functionality of this subsystem is for navigation and charging of the
mower. Navigation functionality is provided by this subsystem in that the wire defines
the perimeter of the yard to be mowed.
" The third major subsystem is referenced by the lower right grouping on the matrix
diagonal. Definition of this subsystem is best described as software. Software requires
final system integration and enables all of the components to work together to provide the
intended function. Each component is an instrument to the software and creates inter-
dependency between the physical components and the programming structure.
The dependency of these three major subsystems provides at least three major iteration loops
within the design of the autonomous mower system. Therefore, if the interfaces of these systems
are not clearly defined the functionality of the machine, project schedule, or cost of the project
might be negatively impacted. Other considerations of this structure are that the software and the
physical structure create an iteration loop at the system verification level, which is nearly last in
the typical Product Development Process (PDP) program. Again, clear definition is needed
between the physical structures and attributes to the software so that unintended iteration is
avoided. Such examples are that the sensors and hardware are selected early in the program
given the constraints and limitations of space and available technology in algorithms and
hardware. Additionally, the components have potential cost limitations imposed by the market
analysis.
Additional investigation of the DSM allows for further grouping of relevant components within
the chassis group subsystem. These are areas of possible iteration relative to the chassis
development. Figure 12 shows the additional iterative design interactions of developing the
chassis for an autonomous mower.
[- 46 -]

X.D D D D D D D D D D D D D D D KeyX D D D A-attaches
A X D C-connectsAA X D D 0 D D-depends
A X __ D D D D I-instrumentX D D D E-enablesA X DDD D D
X 0 DOA A A X DA CC C X D D DDD D D DA C X D 0
C X D D D
SAA C X D
A C X D.A. C. ... . X D__ _ _D D
...... X D O DD
CXCI X D
II I I I I I I I I I I I I E E :X D
FIGURE 12 - AUTONMOUS MOWER DSM WITH CHASSIS INTERACTIONS
Three additional groupings within the chassis are apparent iterative interfaces that determine the
final solution of the vehicle. Modules within the DSM were partitioned using manual techniques
to rearrange the elements. The first main grouping on the diagonal is the major layout of the
chassis itself Locations of the wheels, traction motors, and user interface are integral to space
claims and functional layout of the chassis. This layout determines the overall weight distribution
of the vehicle through such parameters as overall mass, wheelbase, and track width. Navigation
and mowing functions are directly impacted by these parameters as they contribute to the overall
grip and traction of the vehicle.
The second grouping along the chassis subsystem diagonal is the cutting sub assembly.
Designing the cutting system can be separated from the design of the previous sub group, but
only if the interfaces and resource requirements (power, computation, physical volume) are well
defined. As described by the OPM the primary function of an autonomous mower is to maintain
[- 47 -]

the height of grass within certain limits. Therefore, this subsystem is a large part of creating this
function through such parameters as total range of cut height, cutting type, and power used to
cut. These parameters drive the location of the subassembly and therefore affect the chassis
subsystem and related functionality. This subsystem is an instrument of the primary process of
mowing.
The last grouping within the chassis subsystem is the electronics and sensors group. The main
bus of this group is the Vehicle Control Unit (VCU). Creating the overall behavior of the vehicle
and processing capability of the sensors is handled by the hardware design of the VCU.
Integration of the algorithms, sensors, and power handling capability are primary functions of
this subsystem. Clear interfaces between the chassis and software subsystems are needed to
determine the best solution to the overall required system functionality and to avoid costly
unplanned iterations.
In summary a very high percentage of the value delivered is from the software that is
programmed to create the required functionality, but is highly dependent on the subsystems
interactions and iterative feedbacks. To compound the iterative feedback issues is that software
programming is often done after the physical design has been established, so the probability of
finding unintended design flaws becomes apparent late in a PDP program unless controlled.
Recovering from these possible late feedbacks has costly impact and increased risk. It is in the
relationship between the physical design (both the physical vehicles and electronics hardware)
and the functional software that the complex interactions are needed to be clearly defined early
in the development of the product. Rapid prototyping can drive early understanding of these
relationships in physical form and is recommended to understand the complexities before large
capital expenditures in final production tooling.
3.2 SYNTHESIS OF ARCHITECTURES
Evaluation of the architecture design space of an autonomous mower is investigated through a
framework that evaluates morphological types, initial screening using figures of merit, and
followed by a Pugh concept selection.
3.2.1 COMBINATORIAL SCHEMES - MORPHOLOGICAL MATRIX
[- 48 -]

A morphological matrix is constructed using primary functionality provided through the DSM
analysis shown in Figure 12. Primary functionality is described in this analysis but more
elaboration is needed. A functional attribute hierarchy is provided as a logical breakdown of the
needed attributes of an autonomous mower and a way to evaluate possible solutions.
FIGURE 13 - FUNCTIONAL ATTRIBUTE HIERARCHY
A clear description of the autonomous mower functional attributes leads to a well defined
morphological matrix. A morphological matrix is a current view of possible solutions. Future
updates to the possible solutions which account for evolving technologies is necessary to evolve
the matrix and possible solution architectures.
[- 49 -]

Attributes Solutions
Hill Climbing/Traction rubber tires tracks ballon tires articulated legs
Steering rack and pinion tank steer articulated chassis zero radius turn
Propulsion 2 wheel drive 4 wheel drive locomotion hover craft
Efficient guidance track GPS IR optical randomCoverage/Localization system
Object Sensing optical IR strain gauge ultrasonic capacitance_______________ bumpers _______________
Perimeter Sensing o ptic wire network sensors grass sensing
Cutting Method laser rotary blade reel/shearing rotary string
Range Adjustment linkage spacers automatic/electric
Power Generation battery gas IC diesel IC hybrid solar
Home Finding guide wires rf signal odometry mapping
Docking/Charging contacts electric field
Load Carrying/Structural truss injection molded welded carbon fiber
FIGURE 14 - MORPHOLOGICAL MATRIX
The matrix shown in Figure 14 identifies many possible combinations that are suitable for the
solution of an autonomous mowing system further resolution in analysis is needed to filter the
solutions for applicability and feasibility to a project and overall constraints of that project.
3.2.2 PRELIMINARY SCREENING USING FIGURES OF MERIT
The morphological matrix provides an overall view of the solution space that is currently
available for the design of an autonomous mower system. However, the solutions are in need of
evaluation in terms of figures of merit or performance metrics that are ultimately related to a
value proposition to the customer and meets relevant stakeholders needs. A House of Quality
(HOQ) is a tool that translates customer needs to engineering characteristics. Creation of useful
figures of merit begins with careful translation of the customer's needs into measurable
engineering characteristics that drive the figures of merit. The figures of merit that are
established are to be utilized in filtering the morphological matrix and then in Pugh concept
selection for recommended direction in architecture and solution.
The customer requirements allow an initial screening of the concepts through creation of figures
of merit. Therefore, the following figures of merit have been synthesized by the HOQ customer
requirements and engineering characteristics.
[- 50 -]

e Trim distance - maximum grass left uncut
* Coverage efficiency - square meters cut per hour
* Mass - kg
* Maximum slope capability - degrees
* Runtime - hours
e Size - LxWxH
" Obstacle Avoidance - bump force
e Noise - decibels
e Maneuverability - turn radius cm
These basic figures of merit are to be utilized in a coarse review of the solutions listed in the
morphological matrix. This first pass review is graded on relative applicability to the customer's
needs, feasibility to bring to market, and performance in the respective listed figures of merit.
Attributes Solutions
-ApplicabiltyHill Climbing/Traction tracks ba llo n tiresScl Scale
Steerng tarticulated chassis
Propulsion 2 w heel drive Medium
EffcintGPS IR o ptica I adoCovera elLocalization GSI pia
Object Sensing optical IR strain gaugebumoers
rotary string
Perimeter Sensing i pticCutting Method
Range Adjustment linkage
Home Finding
Docking/Charging
Load Carrying/Structurall truss
FIGURE 15 - SOLUTION APPLICABILTY
Each of the solutions in Figure
a typical PDP project that need
of the current dominant archite
art solution. A rubber tired, ze
selected by the providing the b
rf signal odometry mapping
electric field
welded
RATING FOR MORPHOLOGICAL MATRIX
14 have been rated in applicability of being a produ
s to meet constraints of scope, schedule, and cost. T
cture is shown in the weighting as this is the curre
-ro turn radius, wire perimeter, and random cover
est performance in respect to the figures of merit
[- 51 -]
ct to market in
he emergence
nt state of the
age vehicle is
listed. Further

analysis on the concept that is most suitable to the application is continued through a Pugh
Concept selection.
3.2.3 PUGH CONCEPT SELECTION
Using the morphological matrix and figures of merit gave a cursory look at the most applicable
solution. However, more analysis is needed to expand and understand the best concept related to
customer needs that are prioritized to the selected segment. Using the Pugh method of concept
rating the solutions can be expanded and morphed to more functional architectures. The output
from the coarse morphological matrix framework provides a baseline for the Pugh method.
Weighting the criteria allows the Pugh method to be tailored to the actual needs of the customer
that are highly valued. Interpretation of the weighting of the criteria is based from quantitative
market research and interpreted from the HOQ through a pair wise comparison.
B ovrag Efcinc
C MA
0 0)Cu >
CL 0 >
D~ Max. Slope Capability A B DRuntime A B E D
Size A_ B C DE
Obstacle avoidance A G G G G GNoise A H H H H H H
Maneuverability A B I I H
__ oranceRati 5 4 2 3 2 1 4 5 5
FIGURE 16 - PAIRWISE RANKING OF FIGURES OF MERIT
The pair wise comparison is a systematic method to objectively give weighting to the importance
of the figures of merit. The highest weighting is biased towards trim distance and noise, both
important to the context of the autonomous mower. Low noise allows the mower to operate at
anytime during day or evening and the low trim distance insures the vehicle can mow completely
up to objects. This eliminates extra tools, work, and keeps the lawn looking well kept.
[- 52 -]
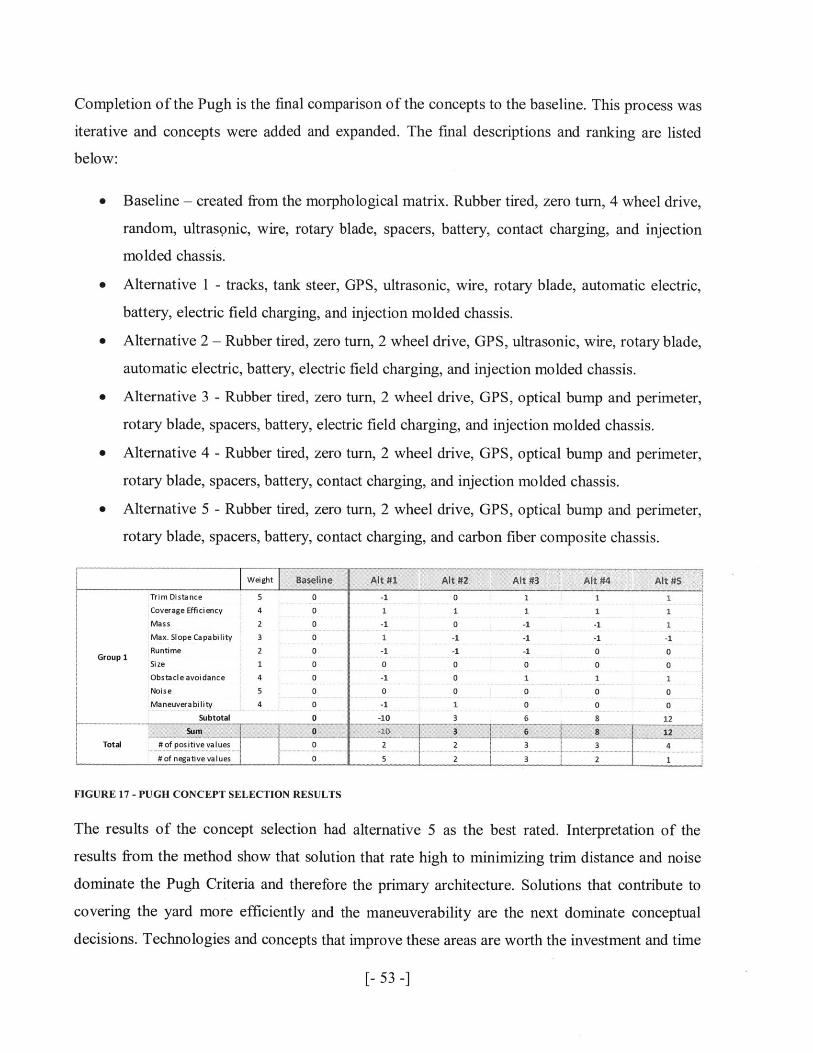
Completion of the Pugh is the final comparison of the concepts to the baseline. This process was
iterative and concepts were added and expanded. The final descriptions and ranking are listed
below:
" Baseline - created from the morphological matrix. Rubber tired, zero turn, 4 wheel drive,
random, ultrasonic, wire, rotary blade, spacers, battery, contact charging, and injection
molded chassis.
" Alternative 1 - tracks, tank steer, GPS, ultrasonic, wire, rotary blade, automatic electric,
battery, electric field charging, and injection molded chassis.
" Alternative 2 - Rubber tired, zero turn, 2 wheel drive, GPS, ultrasonic, wire, rotary blade,
automatic electric, battery, electric field charging, and injection molded chassis.
* Alternative 3 - Rubber tired, zero turn, 2 wheel drive, GPS, optical bump and perimeter,
rotary blade, spacers, battery, electric field charging, and injection molded chassis.
" Alternative 4 - Rubber tired, zero turn, 2 wheel drive, GPS, optical bump and perimeter,
rotary blade, spacers, battery, contact charging, and injection molded chassis.
" Alternative 5 - Rubber tired, zero turn, 2 wheel drive, GPS, optical bump and perimeter,
rotary blade, spacers, battery, contact charging, and carbon fiber composite chassis.
Weight Baseline Alt #1 Alt #2 Alt #3 Alt #4 Alt #5
Trim Distance 5 0 -1 0 1 1 1
Coverage Efficiency 4 0 1 1 1 1 1
Mass 2 0 -1 0 -1 -1 1
Max. Slope Capability 3 0 1 -1 -1 -1 -1
Runtime 2 0 -1 -1 -1 0 0Group Si ze 1 0 0 0 0 0 0
Obstacleavoidance 4 0 -1 0 1 1 1
Noise 5 0 0 0 0 0 0
Maneuverability 4 0 -1 1 0 0 0
Subtotal 0 -10 3 6 812
Total # of pos itive.values 0 2 2 3 3 4
#ofnegativevalues 0 5 2 3 2 1
FIGURE 17 - PUGH CONCEPT SELECTION RESULTS
The results of the concept selection had alternative 5 as the best rated. Interpretation of the
results from the method show that solution that rate high to minimizing trim distance and noise
dominate the Pugh Criteria and therefore the primary architecture. Solutions that contribute to
covering the yard more efficiently and the maneuverability are the next dominate conceptual
decisions. Technologies and concepts that improve these areas are worth the investment and time
[-53-]
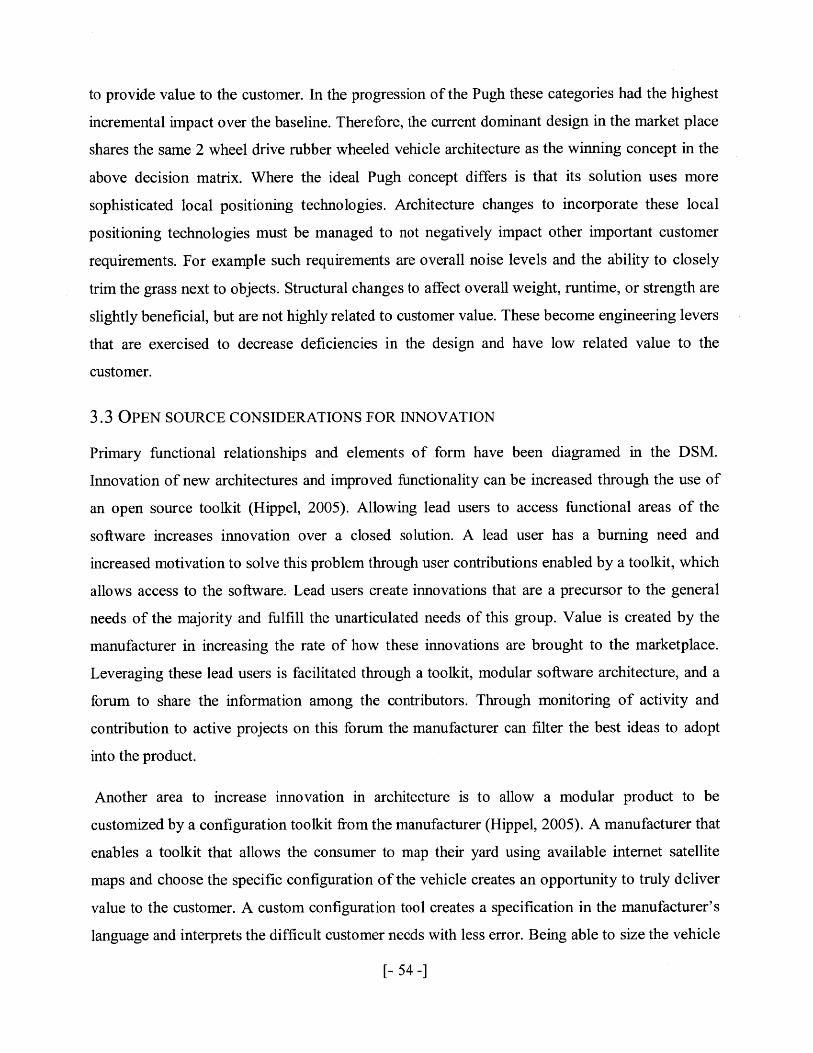
to provide value to the customer. In the progression of the Pugh these categories had the highest
incremental impact over the baseline. Therefore, the current dominant design in the market place
shares the same 2 wheel drive rubber wheeled vehicle architecture as the winning concept in the
above decision matrix. Where the ideal Pugh concept differs is that its solution uses more
sophisticated local positioning technologies. Architecture changes to incorporate these local
positioning technologies must be managed to not negatively impact other important customer
requirements. For example such requirements are overall noise levels and the ability to closely
trim the grass next to objects. Structural changes to affect overall weight, runtime, or strength are
slightly beneficial, but are not highly related to customer value. These become engineering levers
that are exercised to decrease deficiencies in the design and have low related value to the
customer.
3.3 OPEN SOURCE CONSIDERATIONS FOR INNOVATION
Primary functional relationships and elements of form have been diagramed in the DSM.
Innovation of new architectures and improved functionality can be increased through the use of
an open source toolkit (Hippel, 2005). Allowing lead users to access functional areas of the
software increases innovation over a closed solution. A lead user has a burning need and
increased motivation to solve this problem through user contributions enabled by a toolkit, which
allows access to the software. Lead users create innovations that are a precursor to the general
needs of the majority and fulfill the unarticulated needs of this group. Value is created by the
manufacturer in increasing the rate of how these innovations are brought to the marketplace.
Leveraging these lead users is facilitated through a toolkit, modular software architecture, and a
forum to share the information among the contributors. Through monitoring of activity and
contribution to active projects on this forum the manufacturer can filter the best ideas to adopt
into the product.
Another area to increase innovation in architecture is to allow a modular product to be
customized by a configuration toolkit from the manufacturer (Hippel, 2005). A manufacturer that
enables a toolkit that allows the consumer to map their yard using available internet satellite
maps and choose the specific configuration of the vehicle creates an opportunity to truly deliver
value to the customer. A custom configuration tool creates a specification in the manufacturer's
language and interprets the difficult customer needs with less error. Being able to size the vehicle
[- 54 -]
and choose intended reliability, a feature list, and final cost transfers the correct and proper
customer information to the manufacturer and simultaneously sets the expectations for the
consumer. Decreased miscommunication of the customer needs creates the opportunity to have
the product be exactly what was needed and expected the first time. Customization is especially
important in a domain where the needs of the customer are heterogeneous. Autonomous mowing
is a heterogeneous needs domain as every consumers yard is uniquely different in shape and
required mower capability/functionality.
[- 55 -]

This page left intentionally blank.
[-56-]
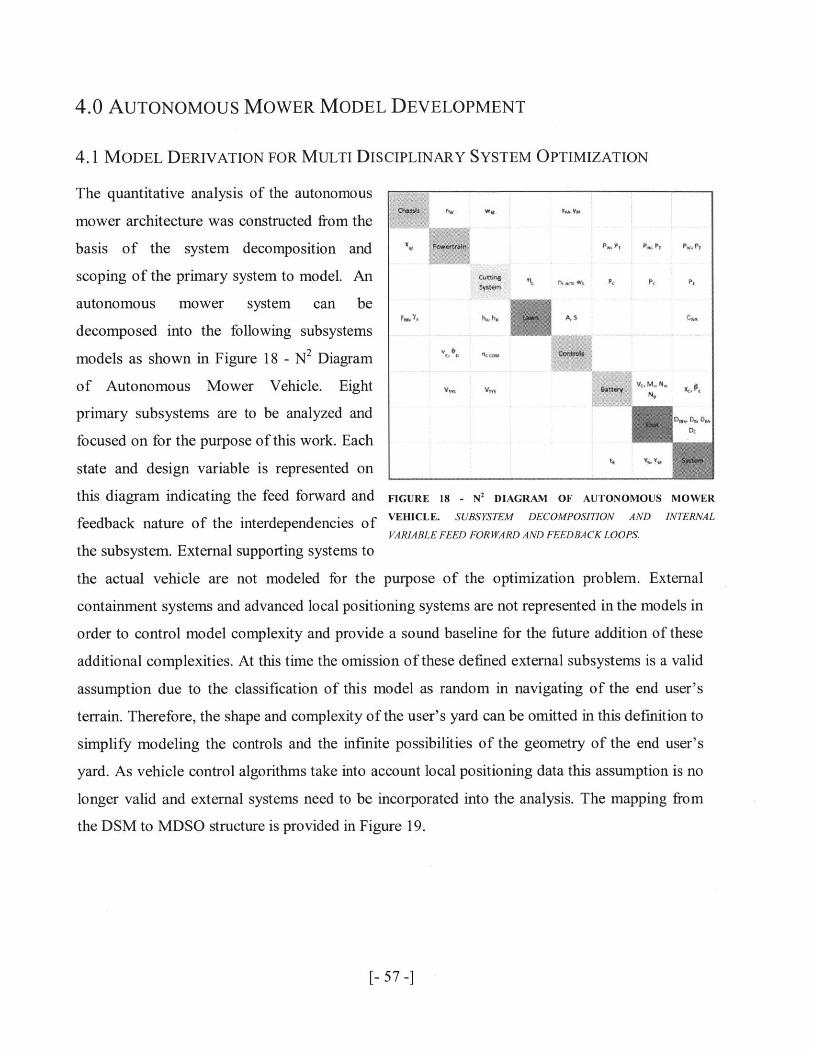
4.0 AUTONOMOUS MOWER MODEL DEVELOPMENT
4.1 MODEL DERIVATION FOR MULTI DISCIPLINARY SYSTEM OPTIMIZATION
The quantitative analysis of the autonomous
mower architecture was constructed from the
basis of the system decomposition and
scoping of the primary system to model. An
autonomous mower system can be
decomposed into the following subsystems
models as shown in Figure 18 - N2 Diagram V N
of Autonomous Mower Vehicle. Eight VM
primary subsystems are to be analyzed and
focused on for the purpose of this work. Each
state and design variable is represented on
this diagram indicating the feed forward and FIGURE 18 - N2 DIAGRAM OF AUTONOMOUS MOWER
feedback nature of the interdependencies of VEHICLE. SUBSYSTEM DECOMPOSITION AND INTERNAL
VARIABLE FEED FORWARD AND FEEDBACK LOOPS.
the subsystem. External supporting systems to
the actual vehicle are not modeled for the purpose of the optimization problem. External
containment systems and advanced local positioning systems are not represented in the models in
order to control model complexity and provide a sound baseline for the future addition of these
additional complexities. At this time the omission of these defined external subsystems is a valid
assumption due to the classification of this model as random in navigating of the end user's
terrain. Therefore, the shape and complexity of the user's yard can be omitted in this definition to
simplify modeling the controls and the infinite possibilities of the geometry of the end user's
yard. As vehicle control algorithms take into account local positioning data this assumption is no
longer valid and external systems need to be incorporated into the analysis. The mapping from
the DSM to MDSO structure is provided in Figure 19.
[- 57 -]

DSM Modules NA2 Paramteric ModulesChassis C has s is
Cuttn Ssem Powertrain
Electronic__kqj anqesrs utn Systern
Chare SttionLawn
FIGURE 19 - DSM TO MDSO DECOMPOSITION MAPPING
The primary mathematical modeling was conducted within the powertrain, cutting system,
battery, cost, and system elements of the autonomous vehicle mower system model. Each of
these models is to be examined to understand the relationships and assumptions that govern the
response of the model. The reason we concentrate on these physical subsystems in the MDO
model is that they drive the unit manufacturing cost of each autonomous mowing unit. The
autonomy software on the other hand drives primarily the development cost expressed as Non-
Recurring Engineering (NRE).
4.1.1 POWERTRAIN SUBSYSTEM
The powertrain subsystem model outputs the power required to move the vehicle at the
commanded speed. First, the rolling resistance force to propel the vehicle for the requested yard
incline is calculated per Eq. (1).
F, = m x g x sin y x 1 0
The rolling resistance force for grass as a function of typical grass hill inclines and vehicle
weights is shown in Figure 20.
[-58-]

Rolling Resistance Force vs. Incline70
60
50
Z 40
0 30IU-
20
10
--------- ----- 10 Kg
- 15 Kg
- 20 Kg0~ -
0 5 10 15 20 25
Incline (degrees)
FIGURE 20 - ROLLING RESISTANCE VERSUS HILL INCLINE
Next, the powertrain receives input from the chassis model in the form of wheel radius to
calculate the total torque required to propel the vehicle per Eq. (2).
[ x=r x R] (2)W W 2
Finally, the torque required is used to calculate the total power to propel the vehicle per Eq. (3)
and Eq. (4).
PP77 G (3)
PT= 2 x*
4.1.2 CUTTING SUBSYSTEM
The primary output of the cutting system model is to calculate the power required to cut
the grass. This can be calculated from the empirical relationship shown in Eq. (5). Through
product research and development the empirical relationship has been found through a series of
Design of Experiments. The required cutting power is a function of the vehicle speed, cut
efficiency of the mower deck, and changes in grass height requested.
[- 59 -]

PC = h x h AC 0 2 x (5.9576 x eO 896v) (5)25.4 )0.30482
4.1.3 BATTERY SUBSYSTEM
In the battery subsystem the runtime of the mower is calculated. Runtime is a function of the
needed power to perform the operations and the size of the battery in mAh. The power consumed
by the vehicle has been calculated in Eq. (4) and Eq. (5) and determines the runtime for one fully
charged battery per Eq. (6).
tB MC X NP x s x601000 X PTOT (6)
4.1.4 CosT SUBSYSTEM
Cost modeling for the vehicle was only modeled for the batteries, cutting motor, and traction
motors. Cost fits for the batteries were taken from recently supplied data from manufacturers of
lithium polymer cells. To further expand the range of the battery models data was added from
published consumer resources, such as Internet wholesalers for the remote control hobby
industry. The cost for the batteries is modeled per Eq. (7).
DB C x(69.322xlog(B)-397.85)xK)j2000 1.37
Cost modeling for the traction and cutting motors were empirically derived only from supplier
data. Both motor models are primarily the same cost relationship as a function of power, except
for the traction motors having an additional 10 Euro offset for the addition of a gearbox drive.
The cost equation for the cutting motor is represented by Eq. (8) while the traction motor cost is
Eq. (9).
Dm = 4.5268 x Pc0.5397 (8)
[- 60 -]

Dm = (4.5268 x P5397)+10 (9)
One additional cost that was represented as a constant was the manufacturing part cost of the
vehicle chassis. Changes in architecture or any surrogate representative variable to chassis cost
were not included in this analysis.
4.1.5 SYSTEM OPERATING COST
The system component of the model calculates the overall required time to mow the requested
yard area. This time is a function of the route efficiency, vehicle speed, mower width, and cut
efficiency. In order to calculate the time to cut the area of the yard is converted to linear feet by
Eq. (10).
10=WM (10)
Therefore, a vehicle with a perfectly planned route would mow the yard the time as defined by
Eq. (11).
tc = 1VM (11)
However, due to the random navigation of the vehicle the time to cut needs to be adjusted
by a route efficiency factor. The route efficiency factor is the amount of repetitive overlap when
navigating the yard. Route efficiency equal to one represents no overlap and perfect path
planning. Increased route efficiency is only achieved with additional cost from the additional of
additional sensors and processing power. In addition to the route efficiency factor the time to cut
is adjusted by a cut efficiency factor. The cut efficiency factor represents the percentage of grass
successfully trimmed in a single pass. Therefore, the time to cut is represented in final form by
Eq. (12).
t
(1R2 )C
Mc 60 (12)
[- 61 -]
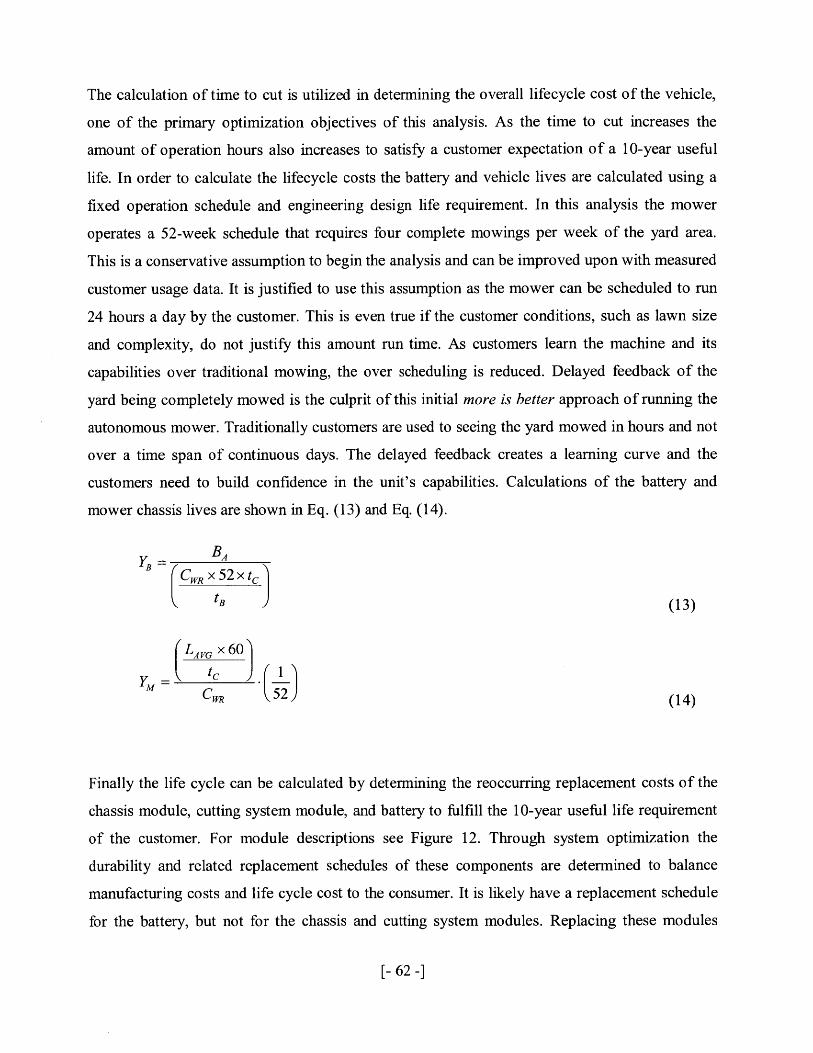
The calculation of time to cut is utilized in determining the overall lifecycle cost of the vehicle,
one of the primary optimization objectives of this analysis. As the time to cut increases the
amount of operation hours also increases to satisfy a customer expectation of a 10-year useful
life. In order to calculate the lifecycle costs the battery and vehicle lives are calculated using a
fixed operation schedule and engineering design life requirement. In this analysis the mower
operates a 52-week schedule that requires four complete mowings per week of the yard area.
This is a conservative assumption to begin the analysis and can be improved upon with measured
customer usage data. It is justified to use this assumption as the mower can be scheduled to run
24 hours a day by the customer. This is even true if the customer conditions, such as lawn size
and complexity, do not justify this amount run time. As customers learn the machine and its
capabilities over traditional mowing, the over scheduling is reduced. Delayed feedback of the
yard being completely mowed is the culprit of this initial more is better approach of running the
autonomous mower. Traditionally customers are used to seeing the yard mowed in hours and not
over a time span of continuous days. The delayed feedback creates a learning curve and the
customers need to build confidence in the unit's capabilities. Calculations of the battery and
mower chassis lives are shown in Eq. (13) and Eq. (14).
BA
CWR x 52 x tctB (13)
_ LAVG X60
t 1YM tC
CWR (52) (14)
Finally the life cycle can be calculated by determining the reoccurring replacement costs of the
chassis module, cutting system module, and battery to fulfill the 10-year useful life requirement
of the customer. For module descriptions see Figure 12. Through system optimization the
durability and related replacement schedules of these components are determined to balance
manufacturing costs and life cycle cost to the consumer. It is likely have a replacement schedule
for the battery, but not for the chassis and cutting system modules. Replacing these modules
[- 62 -]

represents the customer replacing the entire vehicle within the 10 year expected life span. This
becomes a disposable product strategy and therefore needs a very low manufacturing cost for
viability. A low manufacturing cost keeps the purchase price low enough to minimize total life
cycle costs to the customer as they purchase multiple vehicles in the 10 year period. By utilizing
the costs calculated in Eq. (7), Eq. (8), and Eq. (9) the total life cycle cost is determined Eq. (15).
DTCO =rLEXP -(DINV+DM +Dj+±( LEXP xDBY, j YB(15)
The final objective utilized in the multi-objective optimization is the manufacturing cost of the
vehicle and is represented by Eq. (16).
DMFG= DINV +DM +Dc +DB+DP +Ddh (16)
4.2 GENETIC ALGORITHM FOR MULTI DISCIPLINARY SYSTEM OPTIMIZATION
Now that the autonomous mower architecture has been defined and the governing equations
established and calibrated' we can attempt to optimize the autonomous mower design. We
proceed in three main phases: exploration of the design space through the use of Design of
Experiments, gradient based optimization methods, and the use of Genetic algorithms. By
investigating each of these techniques a final hybrid approach was utilized to find the global
minimum in a multi-modal design objective space of the autonomous mower. The optimization
problem formulation is shown in Eq. (17).
Min. J (xp) where: J= [DTco(x) DMFG(x)]T
x =[vm Mc nCACT wc NR Ns N, Dhrs]T
s.t. g (x~p) 0 g = T ]
1 For detailed analysis of the model calibration please see the supporting section located in the appendix.
[- 63 -]

h (xp) = 0
0.22 < um< 0. 6 6 7 1
500 <Mc< 3000
1860 < nCACT 3660
0.299 < wc < 0.3556
0.1 < NR 1.0
6 <Ns< 8
1 <N 4
1000 < Dhrs< 5000
Description of the design variables and constraints is as follows:
- VM is the velocity of the vehicle in meters per second. The range is converted to 0.5 to
1.5 miles per hour and represents reasonable constraints that are evenly distributed
around 1 MPH. The upper range is chosen to minimize energy in collisions and is the
upper end of top speed in current products.
- Mc is the cell capacity in milliamp hours. The constraints are chosen due to the
available sizes of lithium polymers batteries in the market place. This variable is
encoded so that it is in discrete steps of 100 mAh.
- nCACT is the RPM of the cutting blade. The upper and lower constraints are selected
to bracket the continuous RPM limits of available brushless DC motors in the
marketplace.
- wc is the width of the cutting blade in meters. Constraints were chosen to compete
with overall dimensions of current products. As the blade gets larger the overall size
of the vehicle increase along with the weight.
- NR is is the route efficiency of the vehicle. This represents the type of algorithm and
sensor package utilized for navigation of the mower. The lower limit of 0.1 represents
a random algorithm and 1.0 represents perfect path planning.
- N is the number of cell in series for the assembled battery pack. The limits were
chosen to give adequate system voltage for the available brushless DC motors
[- 64 -]

between 24 and 36 volts. The variable was discretized as an integer due to the
impossibility of using only part of a cell.
- N is the number of cells in parallel for the assembled battery pack. The upper and
lower limits were selected to provide an adequate range for optimization. The
variable was discretized as an integer due to the impossibility of using only part of a
cell.
- Dhrs is the required design life hours for the machine. The upper limit was selected as
a feasible limit to complete a test plan in a PDP program. The lower limit was
selected to provide adequate exploration space for optimization.
The description of optimization objectives is as follows:
- DTcO is the life cycle cost to the consumer for a ten year expected life. This represents
the total out of pocket cost for the consumer from replacing or repairing components
of the mower during service. The goal is to minimize life cycle cost to the consumer
to provide the greatest value proposition through increased durability and
functionality. Consumers try to attain the lowest life cycle cost and purchase products
that provide the best value proposition.
- DMFG is the manufacturing cost of the autonomous mower. This is the necessary
manufacturing cost to provide the needed durability and functionality to the customer.
The manufacturer needs to minimize this cost to improve the cost versus price ratio
and profitability to the company.
A heuristic method was chosen to further study the nature of the optimization problem. The
particular method that was implemented was a Genetic algorithm (Hassan, Cohanim, & de
Weck, 2005). The primary reason that this method was utilized was due to the robust nature of
the algorithm to converge on a global minimum. However, this robustness is tempered by the
fact that on average of a one order of magnitude increase in run time was experienced with the
technique. Also, final convergence of the algorithm to small tolerances of approximately 1 e-6 is
difficult and is better suited to gradient-based techniques. However, the heuristic technique is
very well suited to a hybrid approach that uses it to robustly find a near global minimum and
then uses a gradient-based technique to converge to the more exact global minimum. This takes
advantage of the quick progress made of the Genetic algorithm in finding the global minimum
[- 65 -]

and then offsets the disadvantageous and extremely long run time to converge by the more
efficient gradient based technique. Additional reasoning for using the Genetic algorithm was due
to the fact of the ability to handle discrete variables. This was an important consideration for
handling limited choices in available technology or selection among different architectures.
Although this was not incorporated in this analysis, it is a consideration for future addition. One
example is the selection of battery chemistry and associated properties by the use of a discrete
variable, which allows for the analysis of the most optimum battery type to be utilized
Tuning the Genetic algorithm was primarily made through three main factors; the mutation rate,
population size, and convergence tolerance. Actual tuning was done through an iterative process
that best balanced consistency in the optimum value attained and the length of run time.
Mutation rates of 3%, a population size that was 10 times the length of the input bit string and a
convergence tolerance of le-5 gave the best results versus runtimes. All variables were
discretized using 16 bit length numbers.
Constraints for the genetic algorithm were handled primarily through the use of the upper and
lower bounds while encoding the design variables. Future constraints that cannot be handled this
way are to be enforced through the use of a penalty function on the fitness value. The GA
selected used a roulette wheel fitness selection and therefore implementing a penalty to fitness is
an efficient manner to remove members that violate constraints from the population.
Finally, a Multi Objective Genetic Algorithm was implemented to find the Pareto front between
manufacturing and life cycle costs. The primary difference in tuning from the single GA was the
use of elitism to aid in finding a more complete coverage of the Pareto front. Mutation rate was
also increased to 10% for the same reason.
[- 66 -]

5.0 ARCHITECTURE OPTIMIZATION
The initial screening of most promising architectures was conducted through an increasing
resolution framework of tools. Identifying important customer needs and engineering
characteristics led to figures of merit that were traceable to customer value. Finally with the Pugh
Concept selection the evolution of different architectures was performed to increase the
perceived performance of the system to the figures of merit. The baseline of Pugh comparison
was taken from the evaluation of the morphological matrix, which provided that the current
dominant design of a two-wheel drive zero point turn architecture provides the best composite
performance.
The framework has shown that the primary steering, propulsion, and chassis layout has evolved
into a configuration that best meets the range of performance needed by the customer. However,
optimization of the components within the selected vehicle architecture is addressed in this
section of the thesis. The base architecture of the optimization problem is in the configuration of
the wheeled vehicle that can perform zero point turns for increased maneuverability. The
optimization problem addresses the decisions of how to properly configure and size the
components to give adequate life and still meet primary cost constraints.
Information provided by the House of Quality provided such primary requirements that the
system be durable, have high cut quality, and be easy to install. The expected life of the system is
related to consumer durable products with a useful life of 10 years. Using the genetic algorithm
stated previously in this work the optimization problem was defined and each segment was
optimized for the multi objective goal of minimizing the cost to manufacture and the total cost of
ownership for a 10 year life to the consumer. Relationships between the design vector, power
required, and objective functions are explained in the model derivation chapter of this paper.
5.1 OPTIMIZATION RESULTS FOR SINGLE SEGMENTS OF YARD SIZE
The optimization routine was run for the primary yard segments listed in Figure 7 -
Segmentation Map. Other dimensions of the segmentation dimensions for the optimization
routine are set for one contiguous segment and a maximum grade for the yard slope of 20
degrees. The typical variation in yard slope is shown below in Figure 21 and 5.5 degrees is the
mean value. Using the maximum slope to generate optimized configurations is appropriate for
[- 67 -]

this individual analysis and creates a conservative analysis. This is because the tractive power
not the largest consumption of total power and ensures that the vehicle is able to climb the
necessary inclines in heterogeneous customer terrain profiles. This assumption is highly related
to the customer need of keeping all areas of the yard looking kept and satisfying this need. This
is the start point of the optimization runs for the mission profile.
Histogram of hill incline
.120
100 eeymms
80 gr.
60
40
20
0
DegreeN'. rV' eb r o Q N N* Kb, NtK N:)* NA Nc b
Degrees
0-500msegment
* -*
4000
120.00%
100.00%
80.00%
60.00% -mm Frequency-a- Cumulative%
40.00%
20.00%
0.00%
FIGURE 21 - SLOPE VARIATION FOR A TYPICAL YARD
Each segment result for the optimization runs are shown below. The utopia point for the
optimization is located in the bottom left corner of each graph.
Pareto Front'ann
500 -
0= 400w
0o 300(
200
100|
0 1000 2000 3000Manufacturing Cost - Euros
5000
[- 68 -]
-
-

FIGURE 22 - OPTIMIZATION RESULTS FOR 0-500MA2 SEGMENT
2500
2000
1500
1000
Pareto Front
2
*500-1500m2 segment
*
S-
-
500 1000 1500 2000 2500 3000 3500 4000 4500Manufacturing Cost - Euros
FIGURE 23 - OPTIMIZATION RESULTS FOR 500-1500MA2 SEGMENT
3500
3000
o 2500
' 200000
1500
1000
500
Pareto Front
1500-2500m2 segment
- -
-.
0' ' I500 1000 1500 2000 2500 3000 3500 4000 4500
Manufacturing Cost - Euros
FIGURE 24 - OPTIMIZATION RESULTS FOR 1500-2500MA2 SEGMENT
[- 69 -]

2000
(02
L: 1500
(0
.~1000
500 F
Pareto Front
* 0-500m2 segment* 500-1500m2 segment -
* 1500-2500m2 segment
600 800 1000 1200 1400 1600 1800 2000 2200Manufacturing Cost - Euros
FIGURE 25 - COMPARSION RESULTS FOR ALL SEGMENTS
0 - 500mA2 500 - 1500mA2 1500 - 2500mA2Velocity (m/s) 0.57 0.66 0.64Cell capacity (mAh) 1498 3058 2061Blade RPM 3602 3406 3646Deck Width (m) 0.28 0.33 0.32Route Effeciency 0.50 0.51 0.52Series Cells 6 6 6Parallel Cells 1 1 2Design Hours 3330 3546 3085Manufacturing Cost (Euro) 607 655 675Total Life Cycle Cost (Euro) 211 659 1197
TABLE 1 - OPTIMUM DESIGN VECTORS FOR EACH SEGMENT
The tension between delivering low life cycle cost and manufacturing cost is apparent in the
optimization results. An obvious relationship is that in order to reduce total life cycle cost (Eq.
15) to the consumer, the cost to manufacturer increases due to adding more capability, capacity,
and reliability to the product. However, general trends in the analysis are clear in Table 1 on how
each design variable is optimized as the yard segment size is changed. Each optimum point is
located as a star on Figure 25.
Comparison of the first two segments shows that increasing speed, cell capacity, and blade width
is necessary to provide the lowest cost to the consumer and the manufacturer. An increase in
design life hours is necessary when moving from the smallest to mid size yard segments. The
largest necessary change is to provide nearly twice the battery capacity while keeping the
[- 70 -]
*1
a,
F
number of parallel and series cells constant. A slight decrease in RPM is noticed between these
two segments. However, when comparing the largest segment to the mid-sized one, an
interesting development appears in the battery trend. Due to the discrete number of available
options for batteries the previous configuration was not able to be utilized for the largest yard
segment. Although the single cell battery capacity goes down the overall battery capacity is
increased by adding a parallel cell. The discrete jump adds enough battery capacity to relax the
requirements of the other design parameters, allowing for slightly less design hours and vehicle
speed. Optimized total battery capacity for each of the three models is 1.5, 3, and 4 amp-hours
respectively.
The cost of providing increased performance in path planning and increased route efficiency is
apparent by the small incremental increase in route efficiency across the optimized segments. It
is simply more cost effective to increase the blade speed, vehicle speed, deck width, and design
hours to provide the necessary productively for a 10 year useful life. This is an important insight
to the current state of design for the autonomous mower, but is an area that can change rapidly in
the future. As the cost of path planning becomes more affordable, specifically less than the cost
of the incremental total life cycle costs between models of two adjacent segments, the
technology is in the customer's best interest to purchase. This is because by paying more for a
product with path planning it would save money through the life of the vehicle by reducing
replacement costs by minimizing total necessary time to maintain the yard. Less time in the yard
contributes to less wear to the grass and improved overall capacity to keep up with fast growing
grass conditions, both important to the highest ranked need of "doing a good job".
Manufacturing cost show increases across each of the segments mostly due to the increase of the
battery capacity. Also, due to the limited choices of the battery combinations and the useful life
of 1000 charge cycles the total life cycle cost of the autonomous mower increases across the
segments. The charge cycle durability of the battery forces replacements within the 10 year life
of the vehicle, no matter the size or cost. Minimizing time in the yard through increased route
efficiency helps this battery technology constraint, but does not eliminate the need for scheduled
battery replacements. Larger yards force more necessary time in the yard and therefore the
increased life cycle costs to the consumer within the upper and lower bound limits of the design
variables stated Karush-Kuhn-Tucker conditions in the optimization problem.
[- 71 -]

This page left intentionally blank.
[- 72 -]
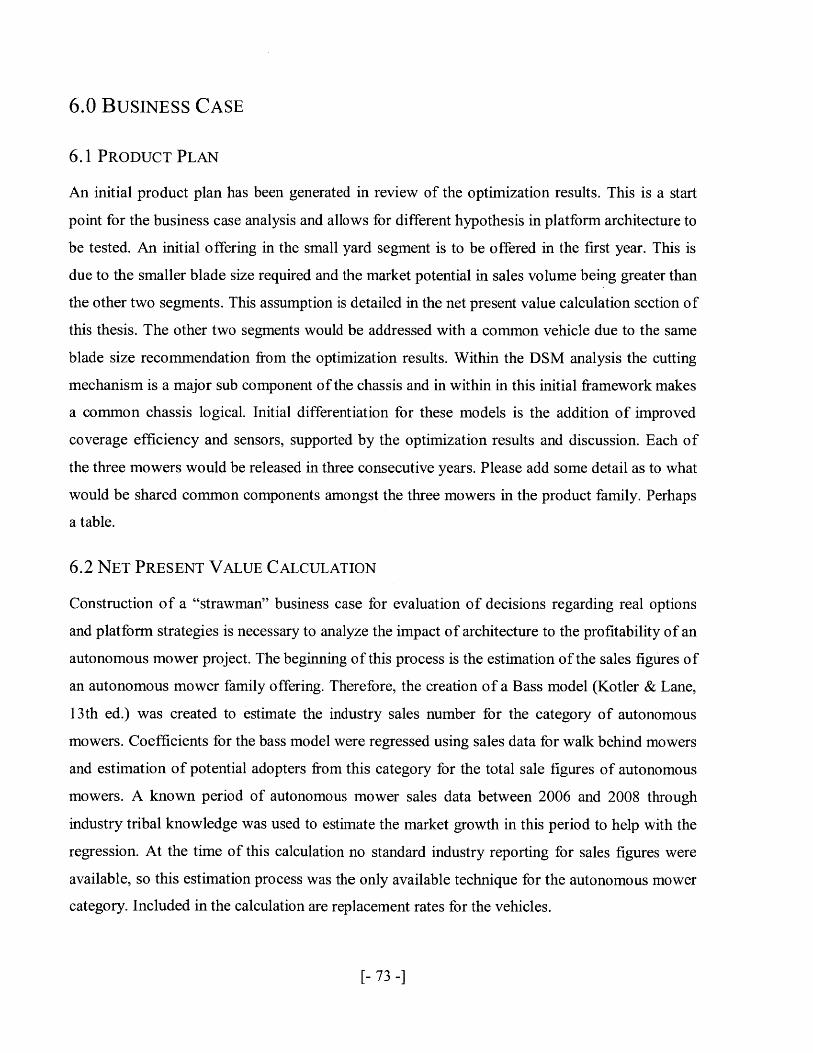
6.0 BUSINESS CASE
6.1 PRODUCT PLAN
An initial product plan has been generated in review of the optimization results. This is a start
point for the business case analysis and allows for different hypothesis in platform architecture to
be tested. An initial offering in the small yard segment is to be offered in the first year. This is
due to the smaller blade size required and the market potential in sales volume being greater than
the other two segments. This assumption is detailed in the net present value calculation section of
this thesis. The other two segments would be addressed with a common vehicle due to the same
blade size recommendation from the optimization results. Within the DSM analysis the cutting
mechanism is a major sub component of the chassis and in within in this initial framework makes
a common chassis logical. Initial differentiation for these models is the addition of improved
coverage efficiency and sensors, supported by the optimization results and discussion. Each of
the three mowers would be released in three consecutive years. Please add some detail as to what
would be shared common components amongst the three mowers in the product family. Perhaps
a table.
6.2 NET PRESENT VALUE CALCULATION
Construction of a "strawman" business case for evaluation of decisions regarding real options
and platform strategies is necessary to analyze the impact of architecture to the profitability of an
autonomous mower project. The beginning of this process is the estimation of the sales figures of
an autonomous mower family offering. Therefore, the creation of a Bass model (Kotler & Lane,
13th ed.) was created to estimate the industry sales number for the category of autonomous
mowers. Coefficients for the bass model were regressed using sales data for walk behind mowers
and estimation of potential adopters from this category for the total sale figures of autonomous
mowers. A known period of autonomous mower sales data between 2006 and 2008 through
industry tribal knowledge was used to estimate the market growth in this period to help with the
regression. At the time of this calculation no standard industry reporting for sales figures were
available, so this estimation process was the only available technique for the autonomous mower
category. Included in the calculation are replacement rates for the vehicles.
[- 73 -]
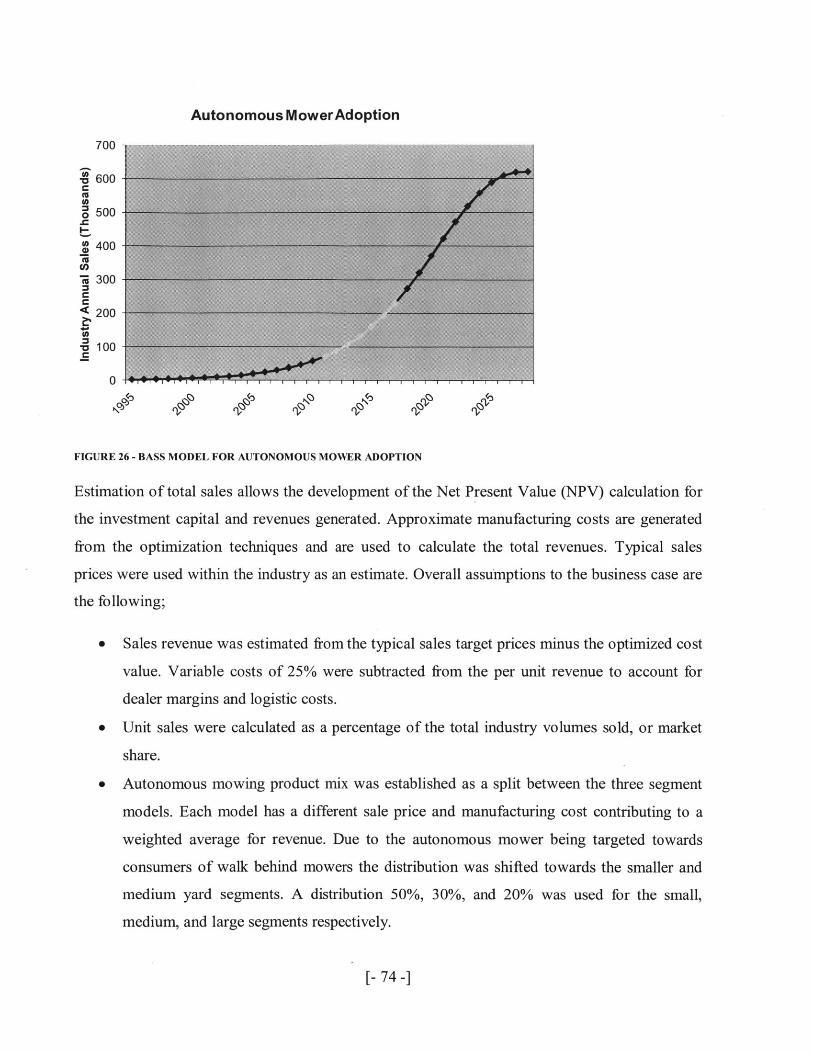
Autonomous MowerAdoption
700
-E 600
8500
400
-4 300
200
100
.... ..... ....
0
FIGURE 26 - BASS MODEL FOR AUTONOMOUS MOWER ADOPTION
Estimation of total sales allows the development of the Net Present Value (NPV) calculation for
the investment capital and revenues generated. Approximate manufacturing costs are generated
from the optimization techniques and are used to calculate the total revenues. Typical sales
prices were used within the industry as an estimate. Overall assumptions to the business case are
the following;
* Sales revenue was estimated from the typical sales target prices minus the optimized cost
value. Variable costs of 25% were subtracted from the per unit revenue to account for
dealer margins and logistic costs.
" Unit sales were calculated as a percentage of the total industry volumes sold, or market
share.
* Autonomous mowing product mix was established as a split between the three segment
models. Each model has a different sale price and manufacturing cost contributing to a
weighted average for revenue. Due to the autonomous mower being targeted towards
consumers of walk behind mowers the distribution was shifted towards the smaller and
medium yard segments. A distribution 50%, 30%, and 20% was used for the small,
medium, and large segments respectively.
[- 74 -]

* Fixed costs of E20,000 per month were estimated for manufacturing space costs and
support. This is an estimate to pay for the utilized floor space of an existing factory.
* Capital expenditures of 1.5 million euro were estimated for the first and second years to
account for tooling of the two separate vehicle chassis's and supporting substructures
such as the mowing height of cut assembly and charge station. Third year expenditures
for capital expenditures were estimated at one third of this amount to account for
functionality add-ons for better coverage efficiency associated with the third large yard
segment model.
* Initial discount rate was set to 16% to evaluate the net present value of the product
program. This is also in response to the volatility of the changing technology within in
this domain.
* The time frame of the analysis was set to 10 years. Beyond this time frame it is uncertain
than any assumptions would be of value or accurate in cost. The high discount rate also
insures that returns are made within in this time frame to establish a positive net present
value.
NPV Model for the Autonomous Mower
UNCERTAINT ASSUMPTIONSAnnual volatility of demand growth 0
Machine MixSmall Yard 50Medium Yard 30Large Yard 20
Market Share 8Aerage weighted revenue E 1,29Aerage uriable operating costs E 64Mfg & other fixed costs E 20,00Initial Investment E 1,500,00
Capacity limit N/A
Time horizonDiscount rate
YearDemand projectionDemand growth projectionRealised demand growthRealised demandCapacitySalesReesnueOperating costsFixed Costs/yearCashfilowDCFPresent alue of cas hfowCapacity cost for up to two levelsCapacity costs for levels aboe 2Net present value
4 points of growth projection
Cost Sales Price Revanu%4 E 607 E 1,500% 8 655: 2,200% E 675 E 2,600
58 per Unit of Capacity0 p.a.0 E 1,500,000 E 500,000
units
10 years16%
0 1:0 70,696.
70,6960 70,696
2,002E80 E2,592,120:E0 E1,296,060:E 0 E 1,520,000;80 -E 223,940
-E 193,0528 30.729,006
E 08 0
E 30,729,006
84478 464E 385
Demand
700 000600 000
S400:000300 000
o 200 000100 000
1 3 5 7 9 11 13 15
ITime (annual period*) j ~
2 3 4 5 6 7 8 9 1087,033 106,754 130,354 159,545 192,500 230,402 273,124 320,090 370,150
23% 23% 22% 22% 21% 20% 19% 17% 16%:23% 23% 22% 22% 21% 20%. 19 17% 16%
87,033 86,715 106,274 130,659 157,280 190,958 228,194 270,021 315,83987,033 106,754 130,354 159,545 192,500 230,402 273,124 320,090 370,1504,003 . 8,007 9,777 11,966 14,438 17,280 20,484 24,007 27,761
E 5,184,240 E 10,368,480 8 12,660,674 E 15,495,766 8 18,696,575 E 22,377,810 E 26,527,215 831.088,760 835,950,8248 2,592,120 8 5,184,240 E 6,330,337 E 7,747,883 8 9,348,288 E 11,188,905 E 13,263,608 E 15,544,380 E 17,975,4128 1,520,000 E 520,000 E 20,000 8 20,000 E 20,000 8 20,000 E 20,000 E 20,000 8 20,00081,072,120 4,664,240 E 6,310,337 E 7,727,883 E 9,328,288 8 11,168,905 8 13,243,608 E 15,524,380 E 17,955,412
E 796,760 E 2,988,181 E 3,485,143 3,679,346 E3,828,723 E3,951,888 E4,039,637 8 4,082,182 E 4,070,197
TABLE 2 - NPV TABLE FOR BUSINESS BASE CASE
[- 75 -]

With the aforementioned assumptions the "strawman" business case shows a net positive value
of approximately 30.7 million euro. As shown from the Bass model the adoption of autonomous
mowers is in a steep ascent as the market transitions from early adopters to the early majority.
The assumption of a 7.5% market capture creates healthy revenue for a typical asking price and
inclination that autonomous mowing is a profitable business venture. However, the uncertainty
of many of the above options is to be tested through an uncertainty analysis and Monte Carlo
simulation.
6.3 UNCERTAINTY DEFINED
Many areas of the business case assumptions have inherent uncertainty and create diminished
confidence that a single NPV point can capture real world scenarios. Due to uncertainty the
previous deterministic analysis is changed to a stochastic Monte Carlo analysis to model the
most volatile areas of uncertainty. Beta distributions were fit to three major areas of uncertainty
in the business case and 2000 simulated runs were performed to analyze the likely variation in
NPV results.
Actual sales of the autonomous mower are a primary area of uncertainty that is explored in the
modeling if the Monte Carlo analysis. The prediction of the Bass model is fairly representative of
the current adoption trends of the autonomous mowing market. However, the captured market
share of this market is highly unknown and most likely differs from the base case's 7.5%.
Depending on marketing, sales channel, and overall functionality of the product this share could
vary over a much larger range. A probable range for market share is from zero market shares to
upward of one third of the market. There are two major current manufacturers in the market
place making a one third market share an optimistic endeavor.
The second area of uncertainty is the overall model mix sales for the three primary yard size
segments. The transition of current walk behind mower owners to the autonomous mower is the
most probable and lends towards higher volume in the smaller segment and assumption of the
Bass model. Lower purchase and life cycle costs decrease the barrier to entry and make the small
yard offering the easiest to adopt and therefore sell. The uncertainty is how many larger yard
owners may by the product. The small yard product is likely to have a range between 5 and 60
percent of the model lineup sales. The remaining two model offerings contribute to the
[- 76 -]

remaining market share sales. A final assumption is that the remainder of market share sales
consists of two thirds of the middle model and one third the large yard model.
Finally, the last area of uncertainty is the capital expenditure of the program. Introducing the
platform of autonomous mowers requires investment in tooling for each chassis of approximately
1.5 million euro. The original assumption was each chassis for the small and medium yards
requires the 1.5 million euro and the large yard update requires 500,000 euro capital. Variation in
these expenditures is created from the quality on quality feedback cycle that produces rework
and associated additional costs for that rework. Costs for capital are increased when the proposed
design does not meet the necessary requirements and are replaced with new designs. Unknown
scope changes or lack of critical customer requirement information also creates this rework and
increased capital expenditures. Variation of the capital expenditure is at a minimum of 1.5
million euro and a maximum of 10 million euro per tooled small or medium yard segment
chassis. The expected capital expenditure value is 2 million euro for a these two segments
vehicles. The large yard chassis, which is a common chassis to the medium segment, is estimated
to cost an additional one third of a medium chassis to the capital expenditure.
Each of these uncertainties is modeled as a Beta distribution and the associated fit parameters are
shown below:
Pessimistic OptimisticDemand Demand
(A) (B) TE TV Alpha Beta Median
1 33 10.67 28.44 1.99 4.60 7.5
Pessimistic OptimisticDemand Demand
(A) (B) TE TV Alpha Beta Median
5 60 37.50 84.03 4.55 3.15 40
Pessimistic OptimisticDemand Demand
(A) (B) TE TV Alpha Beta Median
1500000 10000000 3250000.00 2006944444444.44 1.01 3.88 2000000
MarketShare
Small Yardsales
CapitalExpenditure
TABLE 3 - BETA DISTRIBUTION PARAMETERS FOR UNCERTAINTY FACTORS
[- 77 -]

The results from the Monte Carlo analysis are NPV values that range from approximately -3
million to 132 million with an expected value 45 million euro. Confidence bounds and
percentiles for the NPV are listed in Table 4. Results for the histogram and cumulative
distribution are shown in
Simulation - Randomized NPV Model
Initial 1st year CapexAverage
Standard deviationAverage between
95% Confidence Interval onAverage between
TABLE 4 - MONTE CARLO NPV VAL
and
and
FIGURE 27 - HISTOGRAM OF NPV VALUES
[- 78 -]
E 89,728,498.26
95th Percentile
Histogram
5.0%4.5%4.0%3.5% I Base Case3.0%
" 2.5%2.0%
LL 1.5%
1.0%0.5%
0.0%.
r- W MBin 0 0 a- u- es CD MV ~ 0 D CN M 0 - M 0 0) - N M M 0) CC - V C W N C
- N (N CD ~) 0 C 0 - r ) M D W V ) M C - WD N CD M~ 0) V
-~ ~ V VN (N (C O C D D N N C ) 0 0 -- - (N M M 0 )
Bin values
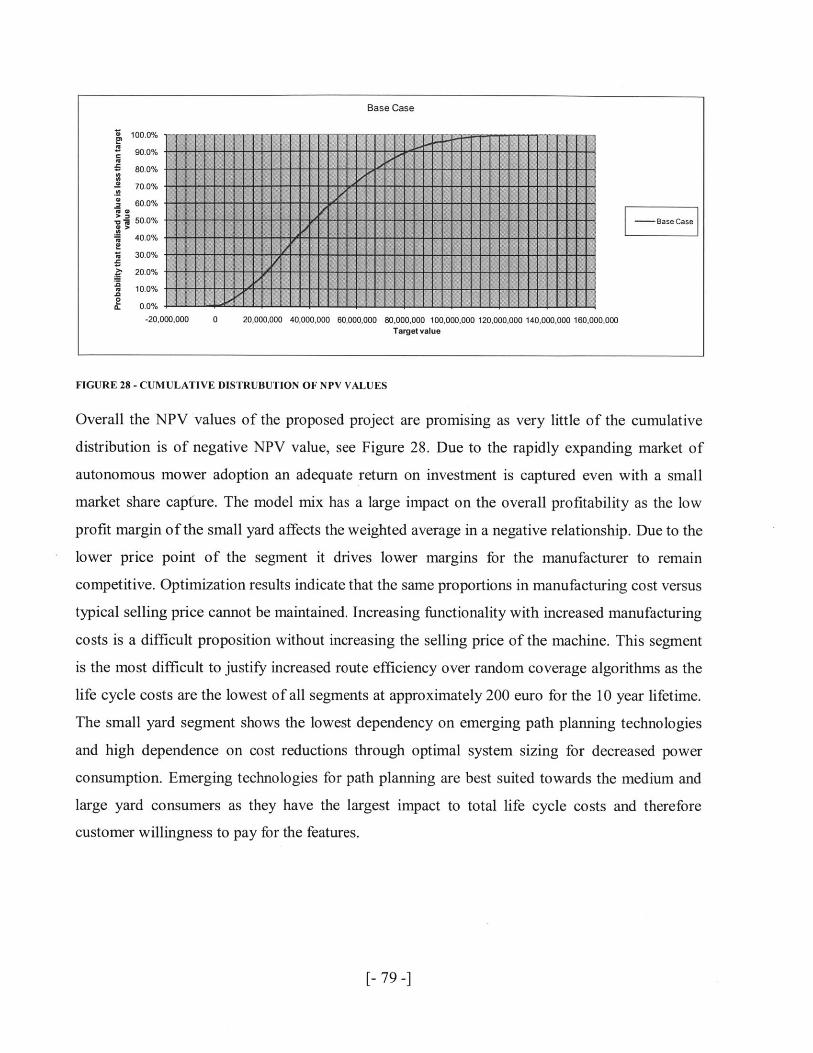
Base Case
100.0%
90.0%
5 80.0%
- 70.0%S. 60.0%
e50.0%
i 40.0%
1 30.0%
. 20.0%
" 10.0%
a. 0.0%
-20,0
- Base Case
00,000 20,000,000 40,000,000 60,000,000 80,000,000 100,000,000 120,000,000 140,000,000 160,000,000Target value
FIGURE 28 - CUMULATIVE DISTRUBUTION OF NPV VALUES
Overall the NPV values of the proposed project are promising as very little of the cumulative
distribution is of negative NPV value, see Figure 28. Due to the rapidly expanding market of
autonomous mower adoption an adequate return on investment is captured even with a small
market share capture. The model mix has a large impact on the overall profitability as the low
profit margin of the small yard affects the weighted average in a negative relationship. Due to the
lower price point of the segment it drives lower margins for the manufacturer to remain
competitive. Optimization results indicate that the same proportions in manufacturing cost versus
typical selling price cannot be maintained. Increasing functionality with increased manufacturing
costs is a difficult proposition without increasing the selling price of the machine. This segment
is the most difficult to justify increased route efficiency over random coverage algorithms as the
life cycle costs are the lowest of all segments at approximately 200 euro for the 10 year lifetime.
The small yard segment shows the lowest dependency on emerging path planning technologies
and high dependence on cost reductions through optimal system sizing for decreased power
consumption. Emerging technologies for path planning are best suited towards the medium and
large yard consumers as they have the largest impact to total life cycle costs and therefore
customer willingness to pay for the features.
[- 79 -]
C

This page left intentionally blank.
[- 80 -]
7.0 REAL OPTIONS ANALYSIS
The investigation of a real option is the creation of a common platform for the autonomous
mower family. The proposed option is to have a modular frame that can be configured to meet
future demands through modularity. Use of adaptors and defined space claims for future options
and differentiation of components allows for less expenditure in the largest project expense of
capital expenditure for tooling. Combined with potential user toolkits this option can keep costs
low while still providing a superb product to the customer that has rapid innovation potential. In
the context of this framework the commonality and platform analysis is considered a real option
for possible exercise in the development of the project.
7.1 COMMONALITY AND PRODUCT PLATFORM ANALYSIS
The framework utilized to analyze the ability to create platform components across the family of
mowers was to perform Generational Variety Index calculation (GVI) (Martin & Ishii, 2002).
Using the house of quality in Figure 8, a list of expected changes was constructed to estimate
target engineering values to satisfy the new segment requirements. These parameters were
translated from the HOQ engineering characteristics and are shown below for the expected
changes across yard segments. The product plan was previously explained as two primary
chassis's for the small and medium yard segments. The large yard segment was a vehicle based
on the medium yard chassis with additional coverage capability by adding increased hardware
and software capabilities for path planning.
7.1.1 DIFFERENTIATION PLAN
Changes for engineering parameters are listed below;
E 2
SE c e 0
W_ _ to QJ 0 N ~ 0
Sml ad 100 2 1 Foam 0.5 120 2 100 0.28 20 45 s 8 2x3O1500 3300SmallYard I I 7I11x09
150 1 1 Rubber 0.5 160 3 150 0.32 30 60 m 12 71592200 3500Medium Yard x305_____
150, 1 1 Rubber 0.5 180 3 250 0.33 40 75 1 16, 1x5 260031000Large Yard ____x305 __
FIGURE 29 - ENGINEERING METRICS FOR TARGET SEGMENTS
[- 81 -]

Addressing the major engineering metrics that are likely to change and are linked to the house of
quality is helpful in creating a view that shows differentiation among the segments. Figure 29 is
the creation of a differentiation plan for the platform of vehicles. Each one of the parameters are
highly related to the segmentation product plan and are performance metrics or features that a
marketing plan can utilized to sell the different type of vehicles. As consumer shops a product
they are utilizing an internal specification list that is similar to these metrics. This is a logical
conclusion as these metrics were generated from the house of quality, which is directly related to
the customer needs. What is not addressed is a framework that addresses the commonality plan
for the platform.
7.1.2 COMMONALITY PLAN
Addressing the commonality is analyzed through the creation of a GVI matrix. Each of the
engineering metrics in the differentiation plan is evaluated against the components in the system
for difficulty of change. Evaluating the each component's score indicates which items are
relatively more suitable for being a common component across the platform. Results of the GVI
calculation are shown in Figure 30.
Engineering Charactheristics
Trim Distance (m) 3 b b 9 1 1Charge Time (hr) 6 9
Run Time (hr)1 1 6 3 1 3 9 3
Sealing Type 3 6Vehicle S eed (m/s) 9 6 9 1 9Area Coverage (mA2/hr) 6 3 9 3 1Sensor Configuration 1 6 3 3 3 3 6Boundar Wire Lengh 9 3Blade Size 9 9 9 9 3 6 3
Traction Power (W) 1 9 9 3 6 3Blade Power (W) 1 3 9 3 1 6 1 3Ul Type 3 9 3.
Mass (kg) 9 3 9 6 1 9 3 6 6Size (Ixwxh) 9 9 9 9Cost (euro) 1 3 3 3 6 3 9 9 3 3 6MTBF (hr) 1 9 6 9 3 3 6GVI 33 1818 43 6435125 32 45 64 9 5 3 3 9 13 36 9
Scale
1 small change3 moderate change6 large change9 complete redesign
FIGURE 30 - GVI MATRIX
[- 82 -]

Results from the GVI matrix indicate the battery, blade motor, VCU, mower blade, and traction
motors are the most difficult to change and provide the needed product differentiation. These
were the highest scoring components and are recommended that the sizing and design be
optimized across the platform. These findings are supported by the results of the optimization in
Table 1 - Optimum Design Vectors for each Segment. These components are the major cost
drivers within the system and drive manufacturing costs to suboptimum levels if leveraged
across all segments. However, one area of the GVI has potential for a common segment
application. The chassis has a moderate GVI score and is a candidate for further analysis.
Further investigation of creating a common chassis for the platform shows that this component
has high tooling costs and has high impact to the size and mass of the vehicle. Reference to the
DSM also indicates that the components that attach to the chassis have low GVI ratings and
therefore are easier to make common in the platform. Further investigation to the house of
quality indicates that the size and mass are of moderate importance with an overall score of four
out of five. These two attributes are not ranked among the top five and is the 12th ranked
attribute out of a total of 31. The cost savings associated is most directly tied to the savings in
capital expenditure of the program. Tooling only one chassis is a savings of a approximated
minimum of 1.5 million euro, a one half reduction to the largest contributor to capital in the
estimated product program.
Costs to the program are further scrutinized by the investigation of the effects of adding a larger
chassis to small yard segment. This is an introduction of un-optimality to the size of the chassis.
The largest impact to cost is the addition plastic for the chassis due to being 17% larger than the
optimum suggestion. Total size of the vehicle is related to the blade size chosen as in the design
adequate space around the cutting mean is dictated by safety standards. The scope of the safety
standards is beyond the scope of this work, but support the relationship between total vehicle size
and blade size as a linear one. Therefore, the cost to the mechanical section increases by 17% for
the increase in size over an optimized design. This translates to a 3% cost add over total cost of
the small yard segment optimized design. The cost breakdown for a representative medium sized
vehicle is provided in Figure 31 and used as the basis of this cost impact analysis.
[- 83 -]
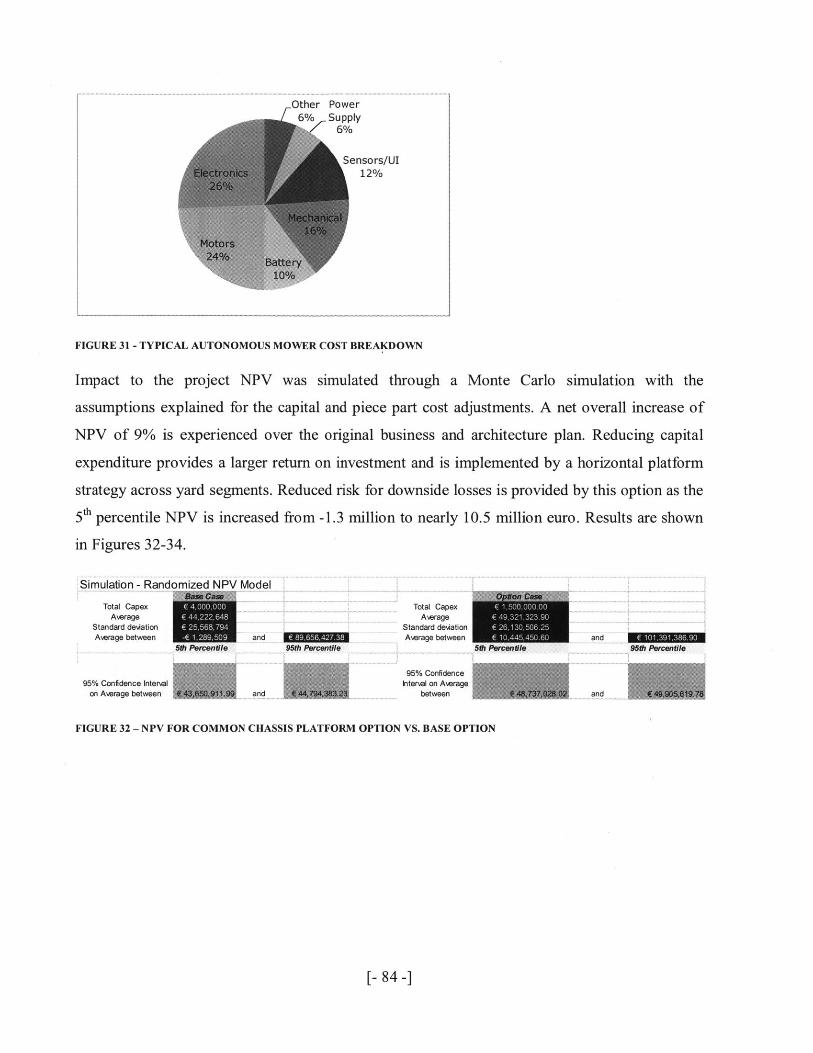
Other Power6% Supply
Sensors/UI12%/
FIGURE 31 - TYPICAL AUTONOMOUS MOWER COST BREAKDOWN
Impact to the project NPV was simulated through a Monte Carlo simulation with the
assumptions explained for the capital and piece part cost adjustments. A net overall increase of
NPV of 9% is experienced over the original business and architecture plan. Reducing capital
expenditure provides a larger return on investment and is implemented by a horizontal platform
strategy across yard segments. Reduced risk for downside losses is provided by this option as the
5 percentile NPV is increased from -1.3 million to nearly 10.5 million euro. Results are shown
in Figures 32-34.
Simulation - Randomized NPV Model
Total Capex ..4.00..00Average
Standard deviationAverage between -E 1,289,509 and
5t0 Percentfle 95th PArcantile
95% Confidence Intervalon Average between
Total CapexAMerage
Standard deviationAverage between
95% ConfidenceInterval on AMerage
between
95th Percentle
FIGURE 32 - NPV FOR COMMON CHASSIS PLATFORM OPTION VS. BASE OPTION
[- 84 -]

FIGURE 33 - NPV HISTOGRAM FOR BASE VS. OPTION CASE
100.0%
90.0%
80.0%
70.0%
60 0%
5 - Base Case
-. Option Case40.0%
30.0%
2. 20.0%
10.0%
(L 0.0%
-50,000,000 0 50,000,000 100,000,000 150,000,000Target value
FIGURE 34 - CUMULATIVE NPV DISTRUBUTION FOR BASE VS. OPTION CASE
7.2 FINAL RECOMMENDATIONS
A common chassis is recommended across all segments of yard size. Commonality of this
component allows for an increased NPV value of the project by reducing the capital expenditure
and lowering the downside risk of loss. Increased vehicle size for the small yard segment is not
highly dependent to delivering customer value. Differentiation is provided through different
batteries, tractions and blade motors, overall blade size, height of cut adjustment, and overall
blade size. Differentiation of these components creates maximum cost savings due to these
[- 85 -]
Histogram
6.0%
>1 5.0%Base Case
4.0% a Option Case
1" 3.0%
LL 2.0%
1.0% -
0.0% -
Bn 0) v) alW~U M* W V 0 W - ) CN A a) Ul CD r- n -M WC)
C4Cq 4t Ul U) WD fl- r. Co CO () 0) 0 N N C Cn
Bin values

components being a majority of the cost within the product as shown in Figure 31. Optimization
of the vehicle for minimum power consumption is the primary consideration in delivery low
manufacturing and life cycle cost and creates positive NPV returns. Forcing commonality across
the power electronics creates a situation of severely increasing life cycle costs to the consumer or
providing a highly over designed vehicle to the small yard segment. The risk of over design in
the small yard segment is magnified by smaller margins and the risk of diluted profits if this
small yard model increases in popularity over the other two segments. Implementation of a
common chassis that is modular in nature and uses standard interfaces for components is
recommended for future flexibility.
[- 86 -]
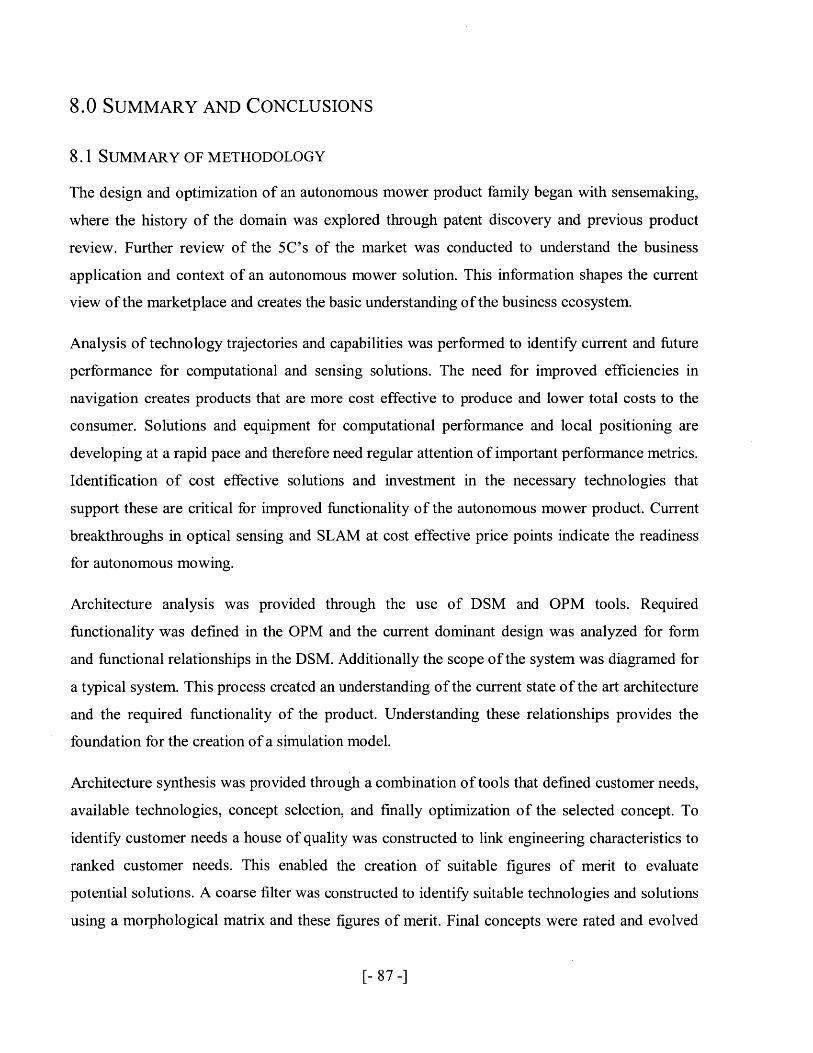
8.0 SUMMARY AND CONCLUSIONS
8.1 SUMMARY OF METHODOLOGY
The design and optimization of an autonomous mower product family began with sensemaking,
where the history of the domain was explored through patent discovery and previous product
review. Further review of the 5C's of the market was conducted to understand the business
application and context of an autonomous mower solution. This information shapes the current
view of the marketplace and creates the basic understanding of the business ecosystem.
Analysis of technology trajectories and capabilities was performed to identify current and future
performance for computational and sensing solutions. The need for improved efficiencies in
navigation creates products that are more cost effective to produce and lower total costs to the
consumer. Solutions and equipment for computational performance and local positioning are
developing at a rapid pace and therefore need regular attention of important performance metrics.
Identification of cost effective solutions and investment in the necessary technologies that
support these are critical for improved functionality of the autonomous mower product. Current
breakthroughs in optical sensing and SLAM at cost effective price points indicate the readiness
for autonomous mowing.
Architecture analysis was provided through the use of DSM and OPM tools. Required
functionality was defined in the OPM and the current dominant design was analyzed for form
and functional relationships in the DSM. Additionally the scope of the system was diagramed for
a typical system. This process created an understanding of the current state of the art architecture
and the required functionality of the product. Understanding these relationships provides the
foundation for the creation of a simulation model.
Architecture synthesis was provided through a combination of tools that defined customer needs,
available technologies, concept selection, and finally optimization of the selected concept. To
identify customer needs a house of quality was constructed to link engineering characteristics to
ranked customer needs. This enabled the creation of suitable figures of merit to evaluate
potential solutions. A coarse filter was constructed to identify suitable technologies and solutions
using a morphological matrix and these figures of merit. Final concepts were rated and evolved
[- 87 -]

in a Pugh concept selection which provides increased resolution and adaptability. Optimizations
were conducted on the selected architecture were results were produced for each customer
segment. Trend and groupings of design parameter vectors were able to be utilized in a
preliminary commonality strategy.
Model development of an autonomous mower was provided through a multi discipline approach.
Subsystems were defined models were developed for each area. Empirical models were built to
simulate the power required by an autonomous mower. Cost modeling is included to predict
manufacturing and life cycle costs for optimization objectives. Calibration of the model was
conducted through DOE experimentation with representative machines and statistical analysis of
the predicted variation of different mission scenarios. An accurate system model is utilized in a
multi discipline system optimization using a genetic algorithm. Design variables, constraints, and
objectives were defined for the KKT conditions were a multi objective approach was utilized.
Pareto fronts were created between the life cycle and manufacturing cost to provide direction to
an optimized vehicle.
The final component of the framework is the development of the business case which includes
platform architecting components. Development of a Bass model was based upon previous sales
data and assumptions that contain replacement schedules and adoption from adjacent product
offerings. NPV was calculated using optimized costs and sale figures defined from the previous
tools. However, large amount of uncertainty remained and therefore was defined using a Monte
Carlo Simulation for the NPV. Three main components of uncertainty were defined using beta
distributions and a range of NPVs were calculated. An option was defined for platform
architecting were the product, differentiation, and commonality plan was analyzed for alignment
and impact to the business case. A GVI matrix was completed to recognize potential components
for common use across segment offerings. Results from the GVI matrix were further scrutinized
and modeled in a Monte Carlo simulation for impact to the business case. These results let to a
final recommendation for a platform architecture that provides increased value to the consumer
and increased profitability to the manufacturer. A platform architecture analysis provided a 9%
increase in a portfolio Net Present Value by determining an optimum commonality and
differentiation plan over that of individually optimized customer segment offerings.
[- 88 -]

8.2 KEY RESULTS
The results from this framework first and foremost indicate the current and future potential of
autonomous mowing as a viable business endeavor. Investment in applying new computational
and local positioning technologies is reaching a point that implementation is a cost effective
solution to the autonomous mowing domain. Improved vehicle efficiency is an outcome of these
technologies and creates cost savings to the consumer and manufacturer. Lower costs, improved
reliability of the system, and better overall quality of lawn care deliver to critical customer needs
and logically increase the adoption of the product.
Understanding the variability of power consumption is critical to optimizing a vehicle. Poorly
defined segmentation variables create difficult requirements to be placed on the power system
and vehicle design. These overarching assumptions create cost and suboptimal designs if poorly
defined and over generalized. Clear segmentation plans create clear mission requirements and
provide the optimum value to the consumer and manufacturer through delivering intended
performance and value. Day to day variation of power required to complete missions is higher
than the influence of critical design parameters and compounds the problem of overreaching with
one design. Power consumption from the blade is the highest consumer of all the system and is
clearly an area that is optimized for each customer segment. Path planning and improved
efficiency increase the ability of the autonomous mower to serve larger segments and add
robustness to the inherent customer and environmental variability in mission profiles.
Finally, the potential increased adoption from a small yard segment reduces overall margins in
family offering as the selling price is the largest incremental decrease. The adoption potential for
this model is high as many current walk behind mower owners and European land owners have
small yards and recognize the value of the solution. It is also the most cost effective segment to
the consumer as life cycle costs for a ten year life span are very low with the current random
coverage algorithms and are most likely to meet current customer expectations. Emphasis in cost
reduction and optimizing the power consuming components is required in this category. When
the incremental cost of increased coverage efficiency is less than the life cycle cost for a segment
the technology is a viable solution. This is an easier hurdle for the larger segments as the life
cycle costs are a minimum of three times greater than that of the small yard segment. Newer
technologies that improve efficiencies for coverage are first implemented to the large yard
[- 89 -]
segments where the decreased to life cycle cost justify the necessary price increase to the
consumer. Technologies that improve power efficiency of the components are implemented first
in the small yard segments to primarily impact manufacturing cost and improved margins.
8.3 IMPLEMENTATION CHALLENGES
Current implementation challenges of this framework are in the development and tracking of
supporting technologies that improve route efficiencies or computational power. Optical and
laser based sensors combined with increased computational power have a large impact on the
optimized architecture of the autonomous mower platform. Major change in the cost versus
performance ratios of these technologies is critical information for the business and design
strategies. Due to rapid development cycles of electronics and the historically slow innovation
domain of outdoor power products create the need for rapid changes in business strategy and
execution for incumbent manufacturers. Large enterprise changes to rapidly deliver innovation
through optimized platform architectures may best be handled by corporations already in the
electronics domain or by enterprising startups. Disruption of the current dominant architecture
from competition outside the outdoor power products domain is likely. However, this is
countered by the need of an appropriate channel to distribute the product in which current is an
advantage of the incumbents.
Another area of implementation and execution of this framework is the hardware and software
development cycles create two dependent optimization paths. The DSM indicates a high depends
between the software architecture and the hardware architecture. Rapid development creates a
possible divergent solution path in satisfying intended customer needs if these interactions are
not managed correctly. Careful execution of the framework minimizes these challenges by
increasing knowledge of these interdependencies before incurring large project costs. A primary
cost to the development is production tooling, which is costly to replace and has high negative
impact to the NPV of the project if major iterations are needed.
8.4 APPLICATION TO OTHER AGRICULTURAL MACHINE PRODUCTS
Primary application of this framework can be applied to platform projects where optimization
and rapid innovation is necessary and user needs can be clearly differentiated by variation in key
requirements similar to yard size, yard. Projects that include electrification are well suited to the
[- 90 -]

framework as optimization and consideration of heterogeneous mission profiles are important
steps to a successful product. Hybrid or electric off road vehicles are prime application for the
framework due to the importance of recognizing technologies and architectures that meet current
customer needs while being power efficient. Electrification of large agricultural equipment such
as tractors and combines can especially benefit for the MDSO approaches. This framework
produces a set of tools to evaluate trades offs in delivering customer value while developing
unique and innovative solutions using advancing, but limited technologies. Application to the
electric car market is a possible extension of this framework as the design is required to perform
in a wide variety of mission profiles with developing technologies.
[- 91 -]

This page left intentionally blank.
[- 92 -]

WORKS CITED
Achtelik, M., Bachrach, A., He, R., Prentice, S., & Roy, N. (2009). Stereo Vision and Laser
Odometry for Autonomous Helicopters in GPS-denied Indoor Environments. Proceedings of the
SPIE Unmanned Systems Technology X. Orlando, FL: Technische Universit-at M*unchen,
Germany;Massachusetts Institute of Technology, Cambridge, MA, USA.
AUVSI. (2010). Association for Unmanned Vehicle Systems International. Retrieved 11 15,
2010, from AUVSI:
http://www.auvsi.org/auvsi/auvsi/Events/AUVSIStudentCompetitions/Default.aspx
Bell, G. (2008, January Vol. 51, No.1). Bell's Law for the Birth and Death of Computer Classes.
Communications of the ACM, pp. 86-94.
Courbon, J., Mezouar, Y., & Guenard, N. (2009). Visual navigation of a quadrotor aerial vehicle.
IEEE/RSJ International Conference on Intelligent Robots and Systems (p. 4). St. Louis: IEEE.
Entiemble, D. (2002). Computer arithmetic and harware: "off the shelf' microprocessors versus
"custom hardware". Elsevier Science , Theoretical Computer Science 279 3-27.
Gelsinger, Patrick P.; Gargini, Paolo A.; Parker, Gerhard H.; Yu, Albert Y.C.;Intel. (1989).
Microprocessors circa 2000. IEEE Spectrum , 43-47.
Gerrish, T. C. (1982). Robotic Lawn Mower. Michigan Turf Grass Conference (pp. 52-53).
http://turf.msu.edu/msu-turfgrass-research-reports.
Hassan, R., Cohanim, B., & de Weck, 0. (2005). A Comparison of Particle Swarm Optimization
and the Genetic Algorithm. AIAA.
Herbrechtsmeier, S., Witkowski, U., & Ruckert, U. (2009). BeBot: A Modular Mobile Miniature
Robot Platform Supporting Hardware Reconfiguration and Multi-standard Communication.
FIRA 2009, CCIS 44 (pp. 346-356). Heidelberg: Springer-Verlag.
Hippel, E. V. (2005). Democratizing Innovation. Cambridge, Mass.: MIT Press.
Husqvama. (2010, November 16). Husqvarna Automower Solar Hybrid wins European
Consumers Choice Award. Retrieved January 20, 2011, from Husqvarna Social media
[- 93 -]
newsroom: http://newsroom.husqvarna.com/2010/11/16/husqvarna-automowerc2%ae-solar-
hybrid-wins-european-consumers-choice/
Husqvarna. (2008, N/A N/A). Specification for Automower 230A CX. Retrieved January 23,
2011, from Husqvarna USA: http://www.husqvama.com/us/homeowner/products/robotic-
mowers/automower-230-acx/#specifications
iRobot. (2006). iRobot Create Community. Retrieved 10 12, 2010, from Create - iRobot Create
Community: http://createforums.irobot.com/irobotcreate/
iRobot. (2006). iRobot Educational & Research Robots. Retrieved 10 10, 2010, from iRobot:
http://store.irobot.com/shop/index.jsp?categoryld=3311368
Karlsson, Niklas; Munich, Mario E.; Goncalves, Luis; Ostrowski, Jim ; Di Bemardo, Enrico
F'irja, Paolo;. (2004). Core Technologies for Service Robotics. Proceedlngs of 2004 IEEE/RSJ
International Conference on Intelligent Robots and Systems (pp. 2979-2984). Sendai, Japan:
IEEE.
Kotler, P., & Lane, K. L. (13th ed.). Marketing Management. New Jersey: Pearson Prentice Hall.
Kozyrakis, C. E., & Patterson, D. (1998). A New Direction for Computer Architecture Research.
IEEE Computer, 24-3 2.
Martin, M. V., & Ishii, K. (2002). Design for Variety: Developing Standardized and Modularized
Product Platform Architectures. Research in Engineering Design , 213-225.
Moore, D., Leonard, J., Rus, D., & Teller, S. (2004). Robust Distributed Network Localization.
Proceedings of the Second ACM Conference on Embedded Networked Sensor Systems (SenSys
'04), (pp. 50-61). Baltimore, MD.
Olson, E., Leonard, J., & Teller, S. (2007). Spatially-Adaptive Learning Rates for Online
Incremental SLAM. Cambridge, MA: MIT Computer Science and Artificial Intelligence
Laboratory.
Pound, W. E., & Street, J. R. (n.d.). Ohio State University Extension Fact Sheet. Retrieved
January 23, 2011, from Fact Sheet Extension: http://ohioline.osu.edu/hyg-fact/4000/4020.html
[- 94 -1

Query, D. S., & Tescher, G. (1990). Advantages of Microprocessors versus Discrete Digital
Electronics in Appliance Controls. IEEE Transactions on Industry Applications , Vol. 26, No. 6.
RoboCut. (2001, 11 11). Welcome to RoboCut. Retrieved 10 5, 2010, from RoboCut Kit:
http://www.robotshop.se/micro/wwwrc-us/indext.htm
Scherr, I., & Solsman, J. E. (2010, October 14). PC Sales Rise at Slower Pace. Wall Street
Journal.
ST Micro. (2010, June). UM0585 User Manual STM32F Ox DSP library. Doc ID 14988 Rev 21.
Strohmaier, E., Dongarra, J. J., Meuer, H. W., & Simon, H. D. (2005). Recent trends in the
marketplace of high performance computing. Elsevier , Parallel Computing 261-271.
Taylor, M. (2010, January 7). Neato Robotics Challenges iRobot. Retrieved 10 15, 2010, from
IEEE Spectrum inside technology: http://spectrum.ieee.org/automaton/robotics/home-
robots/neato-robotics-challenges-irobot
Usov, M., Stramigioli, p. S., van Amerongen, p. J., van Oort, i. G., & Dertien, i. E. (2006).
Vision Based Mobile Robot Navigation. Enschede,Netherlands: Control Engineering, EE-Math-
CS, University of Twente.
Wing, M. G., Eklund, A., & Kellog, L. D. (2005, June). Consumer-Grade Global Positioning
System (GPS) Accuracy and Reliability. Journal ofForestry , p. 169.
Yu, Albert; Intel. (1996). The Future of Micrprocessors. IEEE Micro , 46-53.
[- 95 -]

This page left intentionally blank.
[- 96 -]

APPENDIX
MODEL CALIBRATION
The model calibration was examined using field data from prototype machines in actual field
conditions. Experiments were conducted to determine operational performance of various
operational mission parameters versus the design concepts. In addition to the structured
experiments the performance of a prototype machine was measured in field conditions to study
the variation of normal operations in the most realistic situations.
Efforts to further define the cutting subsystem model were first conducted using the Design of
Experiments (DOE) method to model the relationships between the blade design and the power
required to cut the grass. The cut quality and the related power that is consumed during mowing
is highly related to the customer requirements of "doing a good job" and the life of the mower. If
the cut quality is low the vehicle would need to cover the yard many additional times to
adequately mow the lawn to satisfy customer expectations. Due to the additional time in the yard
for a single observed mowing the reliability of the mower needs to be extended to meet the
expected useful life of ten years. This increases the cost to the manufacturer as the major
components need to be specified to handle the additional incremental increase in design life
hours. Therefore, for model calibration the power to cut the grass is an important aspect to the
design of the mower. Additionally the relationship between the power required and the quality of
the cut is a fundamental trade off in the design of the mower cutting subsystem.
Initial testing was performed to determine the important parameters to that of the blade design.
Design parameters of blade rpm, the number of blade tips, the length of the blade that was
sharpened, and the thickness of the blade were tested. These parameters are easily modified and
from design experience are hypothesized to having the largest impact on cut quality and the
power required to cut. Each design parameter has potential impact on the measured outputs of
power to cut and cut quality in the following logic;
e The primary consideration is the effect of the blade RPM on cut quality and power
consumed. It is estimated the cut quality is improved with increases in the blade RPM.
[- 97 -]

However, power required to cut is estimated to increase in a non linear fashion to the
increase in blade RPM.
" By increasing the number of blade tips the mower blade has increased probability to cut a
single piece of grass per revolution. The number of blade tips to be tested was two and
four tips. Power to cut is hypothesized to increase as the tips of the blade increase in
number.
" Increasing the length of the blade that is sharpened is estimated to have the effect of
increasing cut quality and reducing the power required to cut. By increasing the amount
of the blade that is sharpened the blade can cut grass closer to the center of rotation. This
minimizes grass "tangling" and reduces power to cut while providing more blade length
to improve cut quality. The sharpened length tested was 8 and 15mm.
" Changes to the blade thickness were considered for improvements in the sharpness of the
blade. Two blade thicknesses were tested from 0.5 to 1mm. Each blade type was
sharpened to a 30 degree angle and tested. By increasing the sharpness of the blade the
power required to cut is estimated to be reduced along with an increase of cut quality.
An additional set of experiments were conducted to further study the effects of lowering the
cut edge of the mower blade to that of the mounting plane. This design was named the
"Gullwing" and ensured that the cutting edge was the only material making contact with the
grass during the blades rotation. Also, during this testing the effects of the grass being dewy
or wet were investigated on the effect on power required to cut. All tests were run so that the
grass height was reduced by 25.4mm. This level is related to that an autonomous mower
operates on a cyclical and scheduled nature and therefore in a maintenance mode of taking
small amounts of grass off at a time. Traditional manual mowing would have longer periods
in between the mowing sessions and required a larger required cut differential due to the
grass growth and thus higher power requirements.
By designing a mower to work in more continuous fashion the overall required power to
mow is reduced. This effect is from the inability of the grass to grow to any appreciable
length between the scheduled mowing sessions, i.e. daily outings. This continuous mode of
service also keeps the yard looking well kept by minimizing the large increases in grass
height often experienced with manual mowing. However, the drawback to this operation is
[- 98 -]

for yards that have not been well maintained. It would be recommended to set the cut height
one inch below that of the initial grass height and transition the yard slowly to the
recommended maintained height. This allows the yard to maintain its best health by reduced
clipping buildup and allow the autonomous mower to operate at maximum efficiency. For
best turf health it is recommended that only 1/3 of the leaf blade length be trimmed during a
mowing session (Pound & Street).
The input run listing for each experiment is listed below. Experiment one was a full factorial
2 level matrix with four factors with one replicate for a total of 32 runs. The second
experiment was a mixed level full factorial with four factors and a total of 20 runs.
DOE RESULTS
Figure 35 below shows the results of the first experiment and the required power to cut the
grass versus design parameters for the mowing blade.
Pareto Chart of Standardized Effects; Variable: Loaded Power Average W4 factors at two levels; MS Residual=22.23192
DV: Loaded Power Average W
(1)RPM 1.463427
(3)Sharpened Length -1.14675
1by4 -1.11615
2by3 .8016701
1by3 -.732256
(4)Blade Thickness -.724065
2by4 .4458782
(2)Blade Tips .1836186
3by4 -.163941
1by2 -.148298
p=.05
Standardized Effect Estimate (Absolute Value)
FIGURE 35 - BLADE DESIGN PARAMETER EFFECTS ON LOADED POWER
RPM has shown the most significant impact on the power required to cut followed by the
sharpened length of the blade. Next most important was the interaction between the RPM and
the blade thickness. The least significant design parameter was the number of blade tips.
Analysis of the effects is listed in tabular form below to study the impact of the changes in
the absolute values measured in the experiment.
[- 99 -]

Effect Estimates; Var.:Loaded Power Average W; R-sqr.27504; Adj:0. (SpreadsheetS)4 factors at two levels; MS Residual=22.23192DV: Loaded Power Average W
Effect Std.Err. t(20) p -95.% +95.% Coeff. Std.Err. -95.% +95.%Factor Cnf.Limt Cnf Limt Coeff. Cnf.Limt Cnf.LimtMean/Interc. 11.29543 1.115826 10.12293 0.000000 8.96786 13.62300 11.29543 1.115826 8.96786 13.62300(1)RPM 3.26586 2.231652 1.46343 0.158890 -1.38928 7.92100 1.63293 1.115826 -0.69464 3.96050(2)Blade Tips 0.40108 2.184284 0.18362 0.856161 -4.15526 4.95741 0.20054 1.092142 -2.07763 2.47871(3)Sharpened Length -2.55914 2.231652 -1.14675 0.265021 -7.21428 2.09600 -1.27957 1.115826 -3.60714 1.04800(4)Blade Thickness -1.61586 2.231652 -0.72406 0.477411 -6.27100 3.03928 -0.80793 1.115826 -3.13550 1.519641 by 2 -0.32392 2.184284 -0.14830 0.883593 -4.88026 4.23241 -0.16196 1.092142 -2.44013 2.116211 by 3 -1.63414 2.231652 -0.73226 0.472507 -6.28928 3.02100 -0.81707 1.115826 -3.14464 1.510501 by 4 -2.49086 2.231652 -1.11615 0.277589 -7.14600 2.16428 -1.24543 1.115826 -3.57300 1.082142 by 3 1.75108 2.184284 0.80167 N32166 -2.80526 6.30741 0.87554 1.092142 -1.40263 3.153712 by 4 0.97392 2.184284 0.44588 0.660475 -3.58241 5.53026 0.48696 1.092142 -1.79121 2.765133 by 4 -0.36586 2.231652 -0.16394 0.871423 -5.02100 4.28928 -0.18293 1.115826 -2.51050 2.14464
TABLE 5 - BLADE DOE LOADED POWER FACTOR EFFECTS
The initial results of the experiment show an average loaded power of 11.3 watts, much less the
typical 2-3 kW of a walk behind mower. Traditional walk behind mowers use blades that
produce aerodynamic lift to help the mower deposit grass into bagging equipment. Even if
bagging equipment is not used the lift is beneficial to aid in pulling the grass by vacuum into the
blade. Lifting the grass in to the blade provides a better quality of overall grass cut. Maintaining
tall grass heights benefit the most from the vacuum effect as the stiffness of the grass cannot
support the grass to stand straight up for mowing. The grass tends to fall over at these tall heights
and not reach the cutting blade without assistance. A large difference in these powers is
attributed to the aerodynamic drag of traditional blade designs. The blade used in this experiment
is flat and produces minimal aerodynamic drag and lift. Low power to operate the vehicle is also
shown in a specification listing for the Husqvarna autonomous mower. On their website it lists a
power consumption of 42 watts for the vehicle (Husqvarna, 2008). Disassembly of this particular
mower supported this specification and showed that the cutting motor was a 45 watt brushless
DC version. This benchmark is much closer to the results of this experiment and the remainder
of the difference is likely due to sparse and dry grass conditions. As this analysis progresses the
measured power for cutting increases due to environmental conditions. These highly variable
environmental conditions create great difficulty in optimizing an autonomous mower due to the
need of a large power operating range from their impact.
Another interesting fact in this experiment is that the leading main effect is only contributing to
3.3 watts for the range of RPM tested between 1800 and 2600 RPM. This was quite a small total
power increase for largest measured factor in the experiment. Continuing to analyze the
[- 100 -1

experimental data shows that in Figure 4 that all of the main effects were under the significance
test of p<=0.5, showing that the experiment had greater error than 5 percent among the
relationships of the variables. Many of the factors show that the average power required to cut
was nearly random to the design parameter as measured by the p level statistical significance
test. This brings into question what was occurring during the loaded portion this test.
In question to the low level of accuracy of this first test the additional analysis of the unloaded
data was performed. Data was collected when the mower was on a hard surface and no grass
cutting was performed. The main objective of this extra step was to examine the aero loading of
the blade designs, but became valuable in further determining the strength of the variables.
During this test the Pareto chart showed that the RPM was the most significant and significantly
significant parameters with a p value equal to 0.014. Figure 36 below shows the unloaded power
average effects for each design parameter.
Pareto Chart of Standardized Effects; Variable: Unloaded Power Ave W4 factors at two levels; MS Residual=7.270486
DV: Unloaded Power Ave W
(i)RPM 2.6816
1by4 -1.36915
(3)Sharpened Length -1.07952
I by3 -1.05993
(4)Blade Thickness -.840236
2by4 .7632286
2by3 .7178201
(2)Blade Tips .3775792
1by2 -.162803
3by4 -.037072
p=.05
Standardized Effect Estimate (Absolute Value)
FIGURE 36 - BLADE DESIGN PARAMETER EFFECTS ON UNLOADED POWER
[- 101 -]

Effect Estimates; Var.:Unloaded Power Ave W; R-sqr .43867; Adj:.158 (DOE1.sta)4 factors at two levels; MS Residual=7.270486DV: Unloaded Power Ave W
Effect Std.Err. t(20) p -95.% +95.% Coeff. Std.Err. -95.% +95.%Factor Cnf.Limt Cnf.Limt Coeff. Cnf.Limt Cnf.LimtMean/Interc. 9.12366 0.638101 14.29813 0.000000 7.79260 10.46471 9.123656 0.638101 7.79260 10.45471(1)RPM 3.42231 1.276203 2.68164 0.014342 0.76020 6.08442 1.711156 0.638101 0.38010 3.04221(2)Blade Tips 0.47164 1.249116 0.37758 0.709720 -2.13397 3.07725 0.235820 0.624557 -1.06698 1.53862(3)Sharpened Length -1.37769 1.276203 -1.07952 0.293203 -4.03980 1.28442 -0.688844 0.638101 -2.01990 0.64221(4)Blade Thickness -1.07231 1.276203 -0.84024 0.410709 -3.73442 1.58980 -0.535156 0.638101 -1.86721 0.794901 by2 -0.20336 1.249115 -0.16280 0.872307 -2.80897 2.40225 -0.101680 0.624557 -1.40448 1.201121 by|3 -1.35269 1.276203 -1.05993 0.301809 -4.01480 1.30942 -0.676344 0.638101 -2.00740 0.654711 by34 -1.74731 1.276203 -1.36915 0.186133 -4.40942 0.91480 -0.873656 0.638101 -2.20471 0.457402by 3 0.89664 1.249115 0.71782 0.481170 -1.70897 3.50225 0.448320 0.624557 -0.86448 1.751122by4 0.95336 1.249115 0.76323 0.454236 -1.65225 3.55897 0.476680 0.624557 -0.82612 1.779483 by 4 -0.04731 1.276203 -0.03707 0.970795 -2.70942 2.61480 -0.023656 0.638101 -1.35471 1.30740
TABLE 6 - BLADE DOE UNLOADED POWER FACTOR EFFECTS
The general order for the main effects remains the same in this experiment helping prove the
general trend of how the parameters rank. This helps provide some working confidence of the
direction of the effect, but only in an unloaded state does the parameter of RPM show any
statistical significance to the power consumption. One source of the error is likely contributed
from the randomness of the environmental conditions during the time of the test. Such
parameters as the grass density, type of grass, and grass moisture were not measured in this test
and could provide large variation or noise to the results. This first test was not performed in a
controlled test plot for the grass and was more typical to a sparse and poor quality lawn. The
second experiment was conducted in a test plot with more uniform conditions and is biased
towards very heavy and lush grass conditions.
The second experiment studied a reduced number of parameters due to the knowledge learned in
the first experiment. Only the sharpened length from the first experiment was over to the second
runs. The additional parameters of gullwing depth, grass wetness, and pass level were added to
study. The gullwing depth is defined by the distance from the rotation plane of the blade to that
of the cutting tip. A simple sketch of this dimension is shown in Figure 37.
0 Gullwing Depth
FIGURE 37 - BLADE SKETCH
[- 102 -]

Grass wetness was only measured through observation and was conducted in a high humidity
location in the early morning when the grass has accumulated a large amount of moisture due to
condensation. This is heuristically considered the highest amount of moisture content due to the
fine water droplets create the maximum amount of water on the grass. This is opposed to the
larger rain droplets which tend to create enough impact to shake a majority of the water off of the
blade of grass. The scale was 0 for dry grass and 1 for "dewy" grass in the morning and with
observed maximum moisture content. Finally the last parameter was called the pass level. This
was simply the total number of passes over the same path of grass. The protocol was to mow for
a certain number of feet straight out and then turn the machine around to re-cover the grass
already mowed. The logic was that the mower leaves a certain amount of grass uncut and then
the power needs to be evaluated for multiple passes when there is less grass to mow. This is
important due to the fact that a randomly planned vehicle passes over the same areas multiple
times and the power level is hypothesized to be lower on these additional passes. The pass
number was 1, 2, or 3. A total of twenty runs were evaluated for the mixed level experiment.
Pass level was the quadratic tri-level variable analyzed in the experiment with all other being two
level linear terms.
The effects Pareto of the experiment is shown in Figure 38 below.
Pareto Chart of Standardized Effects; Variable: Average Power W3 2-level factors, 1 3-level factors, 20 Runs
DV: Average Power W; MS Residual=41.09668
(2)Carrier Sharpened(L) -2.70
(3)Grass Wetness(L) 2.6577-
(4)Pass Level(L) -2.47811
Pass Level(Q) -.904569
(1)Gullwtng Depth mm(L) -.049469
p=.05Standardized Effect Estimate (Absolute Value)
FIGURE 38 - PARETO CHART FOR EXPERIMENT 2
[- 103 -]

Effect Estimates; Var.:Average Power W; R-sqr=.76559; Adj:.68187 (Spreadsheetl)3 2-level factors, 1 3-level factors, 20 RunsDV: Average PowerW; MS Residual=41.09668
Effect Std.Err. t(14) p -95.% +95.% Coeff. Std.Err. -95.% +95.%Factor I Cnf.Limt Cnf.Limt I Coeff. Cnf.Limt Cnf.LimtMean/Interc. 40.4400 2.161036 18.71325 0.000000 35.8050 45.07497 40.44001 2.161036 35.80505 45.07497(1)Gullwing Depth mm(L) -0.1728 3.493489 -0.04947 0.961245 -7.6656 7.31997 -0.08641 1.746745 -3.83280 3.65999(2)Carrier Sharpened(L) -7.8725 2.910053 -2.70529 0.017079 -14.1140 -1.63108 -3.93626 1.455026 -7.05698 -0.81554(3)Grass Wetness(L) 11.7145 4.407666 2.65776 0.018743 2.2610 21.16801 5.85726 2.203833 1.13050 10.58401(4)Pass Level(L) -10.7106 4.322072 -2.47811 0.026566 -19.9805 -1.44066 -5.35529 2.161036 -9.99025 -0.72033Pass Level(Q) -3.2476 3.590183 -0.90457 0.380997 -10.9477 4.45261 -1.62378 1.795091 -5.47387 2.22630
In this particular experiment the largest effects are from the carrier sharpened length, grass
wetness, and pass level linear term. The results of the experiment again indicate that the
sharpened length of the blade is the most important design factor among both experiments.
However, the grass wetness has become an important insight into the behavior of power that the
mower consumes. By changing the time of day and moisture of the grass the power required to
cut is increased by 11.7 watts. This environmental factor proves to be one of the most important
influences, yet it is not directly controlled by the design of the mower. This translates directly to
the expectation of when the autonomous mower needs to perform its intended function.
Requiring the mower to operate in the rain or in "dewey" conditions has more influence than the
adjusting the operating RPM by a factor of nearly four times.
TOTAL POWER CONSUMPTION
The variety of environmental conditions is further elaborated in data collection in performing
another experiment that consisted of running two mission profile runs used to understand the
total power consumption of the vehicle. The first mission was mowing one inch of grass on flat
ground with morning dew grass conditions. The second mission consisted of mowing one inch of
dry grass on a 15 degree incline. Comparison of the missions was first analyzed by looking at the
data in histogram form and fitting the best statistical distribution. Knowing the distribution shape
allowed the proper comparison technique to be utilized. If the distribution of power was
Gaussian a statistical t test would be utilized to determine the power of the difference. Non
Gaussian distributions would use a sign test for non parametric variable comparison.
Flat data was taken first and the distribution was non Gaussian in nature. The distribution of the
data is shown in Figure 39.
[- 104 -]

4500
4000
3500
3000
2500
2000
1500
1000
500
0
Histogram of FlatSpreadsheet1 10v*37800c
Flat = 36586*6.1228*lognorm(x, 4.0542, 0.494)
Flat
FIGURE 39 - TOTAL POWER DATA FOR FLAT TERRAIN, UNITS OF WATTS
As the data shows the distribution is indeed non normal in nature. The intuition in to the shape of
the power usage is supported in the fact that the power consumption cannot be a negative value.
The large variation is due to the variability in the density and the length of the grass. Further
modeling of a normal distribution shows that the prediction is invalid with the 95% prediction
bounds leaving a majority of the high power data out of range. Also, the skewness of the data is a
positive 1.394 indicating a right skewed distribution. Statistics of the flat run data is shown in
Figure 40.
[- 105 -]

Graphical Summary for Flat
20000
18000
16000
14000
12000
10000
8000
6000
4000
2000
-50 0 50 100 150 203 250 300 350
Median, Inter-quartile Range & Non-outlier Range
Mean &95% Confidence Interval
Mean & 95% Prediction Interval
kt50 0 50 100 150 200 250 300 350
Shapiro-Wilk p: n/a
Mean: 64.61
Std.Dev.: 32.24
Variance: 1039
Std.Err.Mean 0.169
Skewness: 1.394
Valid N: 36586
Minimum: 10.28
Lower Quartile 42.35
Median: 57.47
Upper Quartile 80.70
Maximum: 316
95% Confidence for Std DevLower 32.01
Upper 32.47
95% Confidence for MeanLower 6448
Upper 65.14
95% Prediction for ObservationLower 1.620
Upper 128
FIGURE 40 - STATISTICAL SUMMARY OF FLAT MISSION
An additional and identical analysis was performed on the data for the hill profile mission run.
Again the data shows a non normal distribution that is right skewed. Figure 41 and Figure 42
shows the overall evaluation of the hill mission data.
Histogram of HillSpreadsheet1 10v*37800c
Hill = 37800*4.8078*lognorrn(x, 3.9511, 0.5624)3500
3000 F-
2500 .
2000 -.-
1500 -. -
1000
500-
------- - ----- -----
Lt'~rJc)-n- ~ o m~toc o5- NLR-)~ocmo
6llolqojajconede N~ajc4& d WLOduid46N N R-mmmn6.2
c66L66O~o00
FIGURE 41 - HILL MISSION PROFILE DATA
[- 106 -]

Graphical Summary for Hill
12000
10000
8000
6000
4000
2000
0-40 -20 0 20 40 60 80 100 120 140 160 120 200 220 240 260 280
Median, Inter-quartile Range & Non-outlier Range
Mean & 95% Confidence Interval
Mean & 95% Prediction Interval
-40 -20 0 20 40 60 80 100 120 140 160 180 200 220 240 260 280
Shapiro-Wilk p: n/a
Mean: 60.05
Std.Dev.: 31.10
Variance: 967
Std.Err.Mean 0.160
Skewness: 0.757
Valid N: 37800
Minimum: 0.00100
Lower Quartile 34.33
Median. 55.39
Upper Quartile 80.41
Maximum: 240
95% ConfIdence for Std DevLower 30.88
Upper 31.32
95% Confidence for MeanLower 59.73
Upper 60.3695% Prediction for Observation
Lower -0.898
Upper 121
FIGURE 42 - HILL DATA SUMMARY
Overall analysis of the data shows that the mission profiles are not normally distributed.
Therefore, a statistical t test is not in order for testing a proposed null hypothesis that the two
data sets are the same. Two alternative methods were used to determine the magnitude of the
differences. The first was a non parametric sign test and the second was subtracting the two data
sets and plotting the probability distribution of the differences. Both methods allowed insight to
the differences between the data sets. This method is also to be used later for the comparison of
the simulation runs to that of the flat data run. Statistical differences were measured between the
hill and the flat showing a mean difference of 4.7 watts. The difference is statistically significant
with a p value less than 0.05, i.e. p=O. The low p value is due to the large number of samples for
the supplied data. In comparing the runs a deeper understanding of the important variability is
calculated in conjunction with the results of DOE. The DOE has directly measured the effects of
the grass wetness while the mission runs calculate the effects of a 15 degree hill. Using the two
runs the calculated effect for the 15 degree hill was 16.38 watts when blocking the effects of the
wet grass known from the DOE experiment. These power effects measured through the
experimentation are added to the above equations to empirically model the power consumption
of the mower.
[- 107 -]

Final model calibration was first accomplished by running a Monte Carlo simulation of the
above equations were the input parameters were varied to simulated the mission profile. The
inputs that were varied were the terrain profile and total length of cut requested. The variation for
the terrain profile was a beta distribution of 0 to 5 degrees and mean value of 2 degrees. This was
necessary due to the fact that the test conditions were not perfectly flat. Actual conditions had
terrain inconsistent terrain that resulted in variation to the total power consumed. Another large
part of the variation was represented in the inconsistent level of the grass being cut. Traveling
between areas of large and small required cut lengths added another source of variation to the
problem. Another beta distribution was added to have a mean of 20mm and bounds between 5
and 25.4 mm. The stochastic model was calibrated to the flat ground profile as this was a
baseline condition to the mower. The same statistical methods that were used to compare the
mission runs were repeated again for the final model calibration. If the equations were able to
produce the same variation and mean values; the model is calibrated. Results of the Monte Carlo
simulation are shown below in Figure 43.
Graphical Summary for run5
500
450
400
350
300
250
200
150
100
50
-20 0 20 40 60 80 100 120 140 160 180 200 220 240 260
Median, Inter-quartile Range & Non-outlier Range
Mean & 95% Confidence Interval
Mean & 95% Prediction Interval
-20 0 20 40 60 80 100 120 140 160 180 200 220 240 260
Shapiro-Wilk p: <0.00001
Mean: 64.53Std.Dev.: 38.69
Variance: 1497Std.Err.Mean 0.865Skewness: 0.849
Valid N: 2001
Minimum: 10.17Lower Quartile 33.72
Median 56 10
Upper Quartile 89.12Maxirum: 219
95% Confidence or Std DevLower 37.53
Upper 39.93
95% Confidence for MeanLower 62.83Upper 66.23
95% Prediction for ObservationLower -11.37Upper 140
FIGURE 43 - MONTE CARLO RESULTS
When the above results are compared to the flat run profile it can be seen that the results are very
similar. The differences between the mean and the standard deviation between the experimental
data and the simulation are compared in tabular form below.
[- 108 -]

Correlation Measures for Total PowerFinalSimulation Percent
Flat Run Difference
Mean 64.81 64.53 -0.43STD Deviation 32.24 38.69 20.01
FIGURE 44 - SIMULATION CORRELATION TO FLAT TERRAIN MISSION
Additionally the histogram of the simulation and the actual data is shown below for graphical
comparison in Figure 45. Equation 5 for cutting power predicts the mean value within 0.43% and
the standard deviation within 20% for the selected mission and provided model for optimization
of the platform.
220
200
180
160
140
120
100
80
60
40
20
0
Histogram of multiple variableslawn data2.sta 17v*2001c
VqODVOxO M Flat~~K7,1 run5
FIGURE 45 - SIMULATION OVERLAY FOR FLAT TERRAIN
The non parametric sign test was also performed to test the null hypothesis that the two data sets
had the same mean values. Statistical significance was established with a p value equal to
0.000022 for the sign test indicating that the simulation results were indeed identical to that of
the flat run. Qualitatively the results show the same right skewed distribution that has a similar
tail for the simulation run as compared to the flat test data. However, the simulation run is
slightly more left skewed, predicting lower power values than measured in test data.
[- 109 -]

AUTONOMOUS MOWER PATENTS
Patent Description3381456 UNTETHERED, SELF-PROPELLED DEVICE OPER-ATING IN A P3381456 UNTETHERED, SELF-PROPELLED DEVICE OPER-ATING IN A P3425197 VEHICLE GUIDANCE APPARATUS3570227 SELF-P ROPELLED RANDOM MOTION LAWNMOWER4133404 Automatic lawn mower4133404 Automatic lawn mower4180964 Self-propelled self-guiding lawn mower4180964 Self-propelled self-guiding lawn mower4184559 Self-piloting lawn mower4184559 Self-piloting lawn mower4533998 Control apparatus for omnidirectonal, polar coordinated platform for4679152 Navigation system and method fora mobile robot4694639 Robotic lawn mower4777785 Method of guiding a robotic lawnmower4777785 Method of guiding a robotic lawnmower4831813 System for automatic performance of agricultural tasks such as lawn4831813 System for automatic performance of agricultural tasks such as lawn4887415 Automated lawn mower or floor polisher4887415 Automated lawn mower or floor polisher4919224 Automatic working vehicular system5007234 Automatic sef-guiding lawn mower and mowing method5007234 Automatic self-guiding lawn mower and mowing method5081585 Control system for autonomous automotive vehicle or the like5163273 Automatic lawn mower vehicle5204814 Autonomous lawn mower5204814 Autonomous lawn mower5334986 Device for determining the position of a vehicle5444965 Continuous and autonomous rnowing systen m5444965 Continuous and autonomous mowing system5528888 Autonomous mowing vehicle and apparatus for detecting boundary o5563786 Autonomous runni ng control system for vehicle and the method there5974347 Automated lawn mower5974347 Automated lawn mower6009358 Programnable lawn mower6009358 Programmable lawn mower6255793 Navigation method and system for autonomous machines with marke
D451931 Robotic lawnmower710345 Programmable lawn mower
7107132 Programmable lawn mower7107132 Programmable lawn mower7185478 Automated lawn cutting and vacuum system7239944 Programmable lawn mower7239944 Programmable awn mower
REDETERMINED PATTERN.REDETERMINED PAT17TERN
mowingmowing
f mowed fieldof i
rs dlefining
[- 110 -]
Issue Date1-May-681-May-681-Feb-691-Mar-719-Jan-799-Jan-791-Jan-801-Jan-80
22-Jan-8022-Jan-806-Aug-85
7-Jul-8722-Sep-8718-Oct-8818-Oct-88
23-May-8923-May-8919- Dec-8919- Dec-8924-Apr-9016-Apr-9116-Apr-9114-Jan-92
17-Nov-9220-Apr-9320-Apr-932-Aug-94
29-Aug-9529-Aug-9525-Jun-968-Oct-96
26-Oct-9926-Oct-9928-Dec-9928-Dec-99
3-Jul-0111-Dec-015-Sep-06
12-Sep-0612 Sep-06
6-Mar-073-Jul-073-Jul-07

WALK BEHIND MOWER PATENTS
Patent Number1138730
1249385
1579563
1625886
182510918838171894312
20431481857445
re2l 4812121428
2220552
2319038
2300461
2285230
2464695
2597107
2445842
2489274
2696888
2705861
2740462
2941610
2924928
3150720
3170278
3429110
3485314
3511034
3511035
3811033
3563012
3668845
3728070
3731472
37589673759022
3782085
3781118
3797213
3600902
3908913
3834392
3935895
3942804
3842505
3942308
3045178
39402604
3958401
3958398
3958056
3953104
387335/8
3974629
4012052
4012052
4014159
4014159
4020619
4020818
4024885
TitleMotor Lawkt - MowerHajocanClareSteering AttachmentLawn Mowing AppabatttsLawn Edge TrimmerPower MoweeLawn EdgerCutting ApparatusAttachement for Mowing MachinesAttachement for Mowing MachinesLawn EdgerMowerPower Dnving Deuce for LawnLawn MowerLawn EdgekKotary Soil - Working Devce
TrevAnoTractor HitchPower Driven Lawn Mower and Control
Ground Roller mounting for Lawn MowerStege manO Clemson
Power Mower with Rotary CutterHartnett
Air Supported Lain MowerStrasel Gang LawnmowerArticle Carrying VehicleArticulate connectionLift Means
Strasel Gang LawnmowerStrasel Gang LawnmowerLAWN MOWER APPARATUSSTAGGERED BLADE MOWER
ROTARY MOWER SPINDLE BRAKEYARD MAINTENANCE APPARATUSMOWER COMBLAWN MOWER AND AU)LIARY UNITHANDLE SUPPORT FOR A WALK-COMBINED SAFETY GUARD AND FUP-
METHOD AND APPARATUS FOR THEShredder attachment for mtary mowers
Debns collector for lawn and gardenNon-marking lawn mowerSafety system for lawn mowers or otherLawn mower starting interlockChemical dispensing lawn mowerCombination power dnien lawn-mower
Lawn mower
Collapsible handle for lawn mower or the
Lawn mowerGrass collection apparatusStarter interlock for self-propelled lawnLawn mower reeving systemSelf cleaning rotary lawn mower blade andDeuce for conerting a conventional lawn
Powered lawn mower hydraulic system
Lawn mower with impmed mulchingDevice for limiting pivotal movements of aDevice for limitng piatal movements of aS pnng bracket for lawn mower grassSpring bracket for lawn mower grassFull self-propelled lawn mowerFull self-propelled lawn mower
Lawn mower
AssigneeFiling Issue Date (Publication Dat Inventors1914
1917192319251927
192919321932
1932 Deere
19371937
19391938
1940
19471946 nentoa avse
19471948 Intemationsl Harvester
1850
1956
1956
1961
1862
1965 Jacobsen1967
1968 Jacobsen1968 Jacobsen1968 Jacobsen1968 Jacobsen
March 9, 1970 June 13, 1972 Parker; James M (DeeAugust 11, 1969 April 10, 1973 Klosterman; Albert L.
March 27, 1972 May 8, 1973 Kamlukin; Igor (MequoMay 14,1971 September 18, 1973 Thompson, David R. (DJune 1, 1971 September 18, 1973 Snyder, Merton F. (MinJanuary 17, 1972 January 1, 1974 Parker; James M. (EllsMay 14, 1973 February 12, 1974 Wykhuis; Lloyd ArnoldJanuary2, 1973 March 19, 1974 Sadow, Jr.; Peter ThomSeptember 26, 1972 Apnl 2, 1974 Keller, Richard E. (Tow
August 29, 1974 September 30, 1975 Cushman; Maurice E.
November4, 1974 January 27, 1976 Moery; John A (WillowMay 2, 1974 February 3, 1976 Many, Richard C. (Oak
August 13, 1974 March 9, 1976 Black 111, Charles E. (M
August 5, 1974 March 9, 1976 Tillotson, Henry B (MirJune 10, 1974 March 9, 1976 Vicendese, Anthony PSeptember 16, 1974 March 23, 1976 Vicendese, Anthony P.October 31, 1974 Aprl 6, 1976 Whftechester; Thomas
May 2, 1975 ApnI 20, 1976 McKaig, Russel Manus
May 14, 1974 April 27, 1976 Van Sweanngen, EarlSeptember 5, 1974 May 25, 1976 Carpenter Eugene C.July 24. 1974 May 25, 1976 Fuelling, Jr.; William (GJune 21, 1974 May 25, 1976 Keiley, deceased, Johr
Apnl 24, 1975 June 1, 1976 Smith; Davd M. (HobaApnl 28, 1975 June 15, 1976 Grimm; Helmut (Mount
April 24, 1975 August 10, 1976 Ecker, Franklin A (RaJune 18, 1975 August 17, 1976 Russell; Lionel E (Ool
October 2, 1975 March 15 1977 Engdahl; Karl TorstenOctober 2, 1975 March 15, 1977 Engdahl, Karl Torsten
March 17, 1976 March 29, 1977 Piazza, Charles J (Wa
March 17, 1976 March 29, 1977 Piazza, Charles J. (Wa
December 8, 1975 May 3, 1977 Massaro, Joseph (San
December 8, 1975 May 3, 1977 Massaro; Joseph (SanAugust 7, 1975 May 24, 1977 Haseloff; Fritz (35 Kas
Parkton Corporation (Alsip, IL)Tore Manufactunng CorporationSimplicity Manufacturing Company, Inc.Rental Equipment Manufacturing CoTom Manufacturing CorporationParkton Corporation (Ellsworth, KS)Deere & Company (Moline, IL)The Black and Decker Manufacturing
Intemational Harester Company
Indak Manufactunng CorporationThe Tom Company (Minneapolis, MN)
Gilson Brothers Company (Canada) Ltd.
Outboard Marine Corporation
Outboard Marlne Corporation
The Raymond Lee Organization, Inc.(
Jacobsen Manufacturing Company
Flymo Societe Anonyme (Zug, CH(Flymo Societe Anonyme (Zug, CH)
[- 111 -]
Application Number
rfield, IL)Cincinnati, OH),n, WI)enver, CO)neapolis, MN),worth, KS), Rydin;(Mayalle, WI)as (Cockeysalle,nship of Wash., NJ)Chestertown, MD)
Spnngs, IL), Trefz;vlle, Ontano, CA)ount Prospect, IL)nneapolis, MN)(Berkeley Heights,(Berkeley Heights,J (Yakima, WA)
(Bramalea, CA)C. (Cape Coral, FL)Galesburg, IL)alesburg, IL),A. (late of Atlanta,
rt, IN), Mennen;ainside, NJ)cine, WI), Saia,ogah, OK), McNabb,Lennart (Malmo,Lennart (Malmo,llington, NJ)llington, NJ)Antonio, TX)Antonio, T)
sel, DT)
05/017,75304/849, 03405/238,38705/149,400
05/148,574
05/218,15005/359, 86205/320,06505/292,447
05/501,8225/520, 753
05/466,162
05/497,087
05/494, 895
05/477, 59505/506,34705/519,69405/573,936
05/469,88005/503,348
05/491,36705/481,833
05/571,490
05/572,162
05/571,24905/587,956
5/618, 801
05/618, 80105/667,61405/667,61405/638,4975/6,497
05/602, 632

Lawn mowerLawn mowerLawn mowerLawn mower blade control apparatusLawn mower blade control apparatusSef-propelled rotary lawn moserSelf-propelled rotary lawn mower
Mower blade asnembly for a lawn mowerMower blade assembly for a lawn mower
Lawn mower
Lawn mower blade clutch and brakeReversible sickle-bar type lawn mower andEngine shroud for rotary lawn mowerLawn mower planetary gear blade clutch
August 7 1975September 4, 1975September 4 1975May 27 1975May 27, 1975March 25. 1975
March 29 1975December 29 1976December 29. 1976March 18, 1976May 27 1976June 18, 1976May 7, 1976July 12, 1978
4024696
4027463402746340164
4035994
4041679
4041679
40431044043104
4044534
4044533
40487914051048
4004022
4064679
4065913
407990
4081947
4083168408795640903468
4097059
4108456
41079064107901
4112653
41143544117651
4214M412382
4122652
41349%0
4126086
41269850
41342804133404
4134249
4115351
41368404146105
41401734148158
4140363
4149362
415264
4152881
415080
41514
4167093
May 24 1977June 7 1977June 7, 1977July 19. 1977July 19, 1977August 16 1977August 16 1977August 23 1977August 23 1977August 30 1977August 30 1977September 20, 1977October 4, 1977October8 1 1977
December 27, 1977January 3, 1978March 21. 1978
April 4 1978Apil 11, 1978May 9 1978May 2. 1978June 27 1978
August 22, 1978
August 22 1978August 22 1978September 12, 1978September 19 1978October 3, 1978October 24 1978October 31 1978October 31, 1978November 28. 1978November 28 1978November 28. 1978January 2 1979January 9 1979January 16 1979January 23 1979January 30 1979March 27 1979
Apl 10 1979Apni 10 1979Apni 17 1979Apni 17 1979
May 8 1979May 8 1979May 29 1919June 19 1979June 26, 1979July 3 1979September 11 1979
Haseloff Fritz (35 Kassel DT)Takahashi Katsuhiko (Tokorozawa JA),Takahashi Katsuhiko (Tokorozawa JA),Hoff Stephen J (Richmond IN)Hoff Stephen J (Richmond, IN)Seifert Lester H (Kiel WI), Powers.
Seifert, Lester H (Kiel, WI) Powers-Jones Kenneth R (Thiensille WI)
Jones Kenneth R (Thiensville WI)Day Stanley R (Grosse Pointe MI) Day'Wck; Gerald H (Galesburg IL)Treen J Paul (New Orleans, LA)Uhlinger Charles E (Des Moines, IA),Wick Gerald H (Galesburg, IL)Spinner Davnd (Willowdale CA)Fisher, Gerald C (Shelby, OH) Scanland,Carson Raymond M (Faxon OK)Szymanis Edward (Midhurst, CA)Oscarsson Jerker Evert (Tranas SW)Szymanis Edward (Midhurst, CA)Do Hachiro (Kamifukuoka JA)Springer, Sr Joseph E (Hemando FL)
Woelifer Neill Carl (Racine WI1) Grandrud-
Cousino Walter F (St Toledo OH)Moore Robert J (Fontana, CA)Ballas George C (Houston T<), Mitchell;Moms Richard L (Galesburg, IL)Martin Jr' Herman H (Galesburg IL)Wolf Elmar (Wissembourg (Eas-Rhin) FR)Conner Joe D (Aubum GA)Holtemnann Theodore J (Milwaukee WI)Fisher Gerald C (Savannah GA),Kidd Earl H (Galesburg IL)~akahashi Katsuhiko (Tokorozawa, JP),Jones Kenneth R (Thiensville WI),Gffin, Hugh A (Greenfield, IN)Wuerker. Charles A (Racine, WI)
Akgulian Sahag C (Racine, WI)Bates Charles A (Portland OR)Scag Dane T (Elm Grove VW)Hot Stephen J iRichmond, IN)Hewitt John J H (London WC2B 4JYW/oelffer Neill C (Racine, WI), Gandrud
Hafie Donald G (Glendale WI),Gandrud, Merin H (Sturtevant WI),Hof, Stephen J (Richmond, IN)Dunn Ronald K (Evansville, IN),Thomas George A IDes Moines IA)Rabinow, Jacob (Bethesda, MD)Thomas George A IDes Moines IA)Pfeidfer Rainer (Stuttgart-Feuerbach DE)
Fuso Keigakin Co Ltd Tokyo JA)Fuso Keigokim Co Ltd (Tokyo JA)Hoffco. Inc (Richmond IN)Hoftco Inc (Richmond, IN)Seifert Lester H (Kiel, WI)
Seifert Lester H (Kiel, WI)Allis-Chalmers Corporation (Milwaukee,
Allis-Chalmers Corporation (Milwaukee,
Outboard Manse Corporation
AMF Incorporated (White Plains, NY)Outboard Marine Corporation
Unisette Realty Ltd (Willowdale CA)
Roper Corporation (Kankakee IL)
Canadian General Electric CompanyStiga AB(SW)Canadian General Electnc Company
Fuso Keigokin Co Ltd (JA)
Jacobsen Manufacturing Company
Weed Eater, Inc (Houston TX)
Weed Eater Inc (Houston TX)
Cutboard Marse CorporationOutboard Manse Corporation
Outboard Manne Corporation
Roper Corporation (Kankakee, IL)Outboard Manne Corporation
Fuso Keigokin Co Ltd (Tokyo JP)Allis-Chalmers Corporation (Milwaukee,
Agile Systems, Inc (Greenfield, IN)Jacobsen Manufacturing CompanyJacobsen Manufacturing Company
V/isconsin Mane, Inc (Lake Mills WI)Hoffco Inc (Richmond IN)
Jacobsen Manufacturing CompanyJacobsen Manufacturing CompanyJacobsen Manufactuong Company
Hotfo Inc (Richmond IN)Clarke-Gravely Corporation (MuskegonAMF Incorporated (White Plans NY)
Hall & Myers (Potomac MD)AMF Incorporated (White Plans NY)Fntz Rcth KG (Stuttgart-Feuerbach, DE)
[- 112 -]
Combination lawn mower, snow blower and April 16. 1976Safe cutter disc assembly for rotary lawn February 7, 1977Towing hrtch for laws mower October 18 1976Rotary lawn mower with separate grass August 16 1976Casing for a lawn mower with a honzentally June 9. 1976Rotary lawn mower with improved grass August 16 1976Lawn mower construction December 23 1975Connecting bracket arrangement for towing September27 19768Lawn mower handle mounting July 15 1977Impact actuated lawn mower February 16 1977Lawn mower with mechanical line feed January 3 1977
Lawn mower and method April 7 1976
Lawn mower blade mounting November 5, 1976Lawn mower with cutter blade sterlock July 12. 1976Grass-cutting and an-mpelling means for a November 22. 1976Positionally adjustable lawn mower hitch May 6, 1977Lawn mower blade clutch and brake July 16, 1976
Cutter disc assembly for rotary lawn mower August 18, 1976Grass collection bag for rotary lawn mower November 19. 1976Lawn mower Febmary 24 1977Peersbly mountable clutch control handle August 5, 1977Automatic lawn mower August 25, 1976Mulching type of lawn mower February 25 1977Rotary lawn mower grass mulcher July 1. 1977Cord take-up reel for an electric lawn January 23 1978Lawn mower May 13 1977Lawn mower blade control apparatus January 3, 1977Lawn mower blade gsnder May 12. 1977Lawn mower catcher July 25 1977Combned lawn mower and grass catcher July 26, 1977Lawn mower with catcher accommodation July 22 1977Lawn mower blade rotation warning devce May 5, 1977
Lawn mower bag December 27 1977Rotary lawn mower July 28. 1977
Rotary blade coupling for lawn mower September 20 1977Lawn mower controls October 27 1977Lawn mower January 27, 1977
05,602.832
05/610 22205161022205/581.029
051581 029
05/561.98505561 98505..5.155
05/755 155051668 315
05690 63205i697 474
05i684,38705i704 283
05/677.631
05/766,37705'733 51705/714 974
05169442005/714,975051643.756
05726.495Oi,815 815
05/769.206051756,50605,674,32305/739 322
05,704,282
05/743,66905!794.686061706.122
051714,96206/743 36205i771 567
05.822 27905/717 87005771 92805i812 047
05871.70705/796 61605 756 20005/796.139
05-818 927051818 92105/818 168051794.010
05/98 506
05'819.74705/834 93105,14623305/762.964