Thesi s Supervisor - DSpace@MIT
121
AN ECONOMIC ANALYSIS OF THE SOUTH AFRICAN COAL INDUSTRY WITH A FOCUS ON EXPORTS by PHILLIP ALLEN ELLIS B.S., University of California at (1973) Davis M.A., George Washington University (1977) SUBMITTED IN PARTIAL FULFILLMENT OF THE REQUIREMENTS FOR THE DEGREE OF MASTER OF SCIENCE at the MASSACHUSETTS INSTITUTE OF TECHNOLOGY (June 1979) QPhillip Allen Ellis 1979 Signature of Author... , .... . ...... .. Sloan SchooJP of Management, May 18, 1979 May 18, 1979 Certified by.. .. Thesis Supervisor Thesi s Supervisor Accepted by............. ARCHIVES Chairman, Department Committee MASSACHUSETTS INSTITUTE JUOF TECHNLOGY JUN 2 5 1979 LIBRARIES
-
Upload
khangminh22 -
Category
Documents
-
view
1 -
download
0
Transcript of Thesi s Supervisor - DSpace@MIT

AN ECONOMIC ANALYSIS OF THE SOUTH AFRICAN
COAL INDUSTRY WITH A FOCUS ON EXPORTS
by
PHILLIP ALLEN ELLIS
B.S., University of California at(1973)
Davis
M.A., George Washington University(1977)
SUBMITTED IN PARTIAL FULFILLMENTOF THE REQUIREMENTS FOR THE
DEGREE OF
MASTER OF SCIENCE
at the
MASSACHUSETTS INSTITUTE OF TECHNOLOGY(June 1979)
QPhillip Allen Ellis 1979
Signature of Author... , .... . ...... ..Sloan SchooJP of Management,
May 18, 1979May 18, 1979
Certified by.. .. Thesis SupervisorThesi s Supervisor
Accepted by.............ARCHIVES Chairman, Department Committee
MASSACHUSETTS INSTITUTEJUOF TECHNLOGY
JUN 2 5 1979LIBRARIES

AN ECONOMIC ANALYSIS OF THE SOUTH AFRICAN
COAL INDUSTRY WITH A FOCUS ON EXPORTS
By
PHILLIP ALLEN ELLIS
Submitted to the Alfred P. Sloan School of Management onMay 18, 1979, in partial fulfillment of the requirements
for the Degree of Master of Science.
South Africa, as the world's seventh largest producerand the fifth or sixth greatest exporter of coal, is a majorfocus of the growing attention directed towards an under-standing of the potential for growth in world coal trade.Moreover, South Africa is widely regarded as a "pivotal"supplier in projections of coal trade; in other words, itsimportance in the future of coal trade outweighs its cur-rent ranking among major exporters. This is true in partbecause of the relatively very low cost of South Africancoal exports, and, of course, cost is a major factor inprojecting world trade flows. Of equal signifance, however,is the highly uncertain outcome of the internal SouthAfrican debate regarding the optimal use of its coal re-sources--a debate which is motivated by South Africa'sintensifying isolation in a world which largely condemnsits racial policies. The resolution of this debate maycall for continuance of the current policy of expansionof steam coal exports. Alternatively, the outcome couldswing national policy to an abandonment of exports alto-gether, and to the use of coal resources to support SouthAfrica in its isolation. This isolation would be madepossible, for example, through production of the lion'sshare of the country's liquid fuel requirements from itssophisticated "Sasol" coal conversion process.
This study addresses the South African coal industryfrom several perspectives. First, a discussion of theinstitutions which most profoundly affect the South Africancoal industry is presented. Emphasis is placed on under-standing its historical ties with the gold mining industry.In addition, an examination is made of the impact on thecoal industry of government-imposed price controls. Second,one must evaluate the concept of reserves as it relates

to reserve estimates presented in a major study of SouthAfrican coal resources, The Report of the Commission ofInquiry into the Coal Resources of the Republic of SouthAfrica, otherwise known as the Petrick Commission Report.Recommendations are proposed for making reserves a moreeconomically relevant figure. The "marginal mine" conceptis presented as a tool for evaluating reserves over time,and this provides the foundation for the subsequent pre-sentation of a systematic method for estimating the costsassociated with the process of depletion. Resourcecurves are then constructed using this methodology. Thefollowing two sections analyze costs of labor, capital,and transportation in South African coal mining. In lightof these first six sections, an essay on the potential forSouth African coal exports is presented. A rough forecastof costs is presented, and the results are compared withreasonable estimates of future U.S. coal prices. Thiscomparison provides insight into the rapid change in thestructure of world coal trade which may be expected asit is influenced by South Africa. The study concludesby suggesting that the present cost advantage of SouthAfrican coal exports will deteriorate significantlybefore 1990 due to rapid labor and capital cost increases.
Thesis Supervisor: Martin B. Zimmerman
Assistant ProfessorTitle:

TABLE OF CONTENTS
Abstract ............................................... 2
Table of Contents .................. .............. . ...4
Table of Tables.......................................5
Table of Figures.......................................7
Section I: Introduction................................8
Section II: The Structure of the SouthAfrican Coal Industry ..................... 13
Price Controls .......................... 18
Section III:Coal Reserves in South Africa:How Meaningful a Figure? .................. 26
American Coal Reserves:An Illustration ......................... 27
The South African Example............... 32Some Definitions .................... 32Petrick Commission Results..........38New Marginal Mines in S.A........... 4Two Challenges to Petrick
Reserves Conclusions............52
Section IV: The Cost of Coal Depletionin South Africa ........................... 59
A Discussion of Complications...........77
Section V: Labor and Capital Costs
Labor Costs..........
Capital Costs........
Section VI: Transportation Costs...
Rail.................
Ports................
Shipping.............
Section VII:The Potential for SouthCoal Exports...........
Section VIII:Conclusion............
Bibliography .......................
.........
.........
.........
.. o.o.oo..
.........
...... ego
African
.........0 0 a 0 0African0 0 * 0 .
.......... 84
..........85
.......... 96
......... 103
......... 103
......... 104
......... 106
......... 108
....... ........... 118
.119

TABLE OF TABLES
1. South African Output and Value, 1965-1977..
2. Allocation of South African Coals to EndUses, 1977 and 1970 ........................
3. Controlled Prices for Domestically-Consumed Coal: South Africa ................
4. Coal Resource/Reserve Criteria, United Stat
5. South African Reserve Specifications .......
6. South African Resources and Reserves.......
7. New Mines in South Africa..................
8. New Mines by End-Use Market................
9. Bituminous and Anthracite Reserve Estimatesfor South Africa: A Recent History.........
........
14
........ 16
...... 19
...... 28
...... 33
........ 39
........ 44
........ 49
...
... 55
10. Specifications for Typical South African Mines ..... 68
11. High-Grade Coal Reserves By Seamin South Africa.................................... 72
12. Low-Grade Coal Reserves by Seam in South Africa....73
13. Depletion Cost Estimates ........................... 75
14. Trends in Real Wages by Racial Groupin South Africa: 1965-1975 ....................... 86
15. Trends in Nominal Wages in South Africa,1973-1977........... ............................... 89
16. White Versus Black Benefits in Gold Mines.......... 90
17. Trends in Productivity and Labor CostPer Employee: 1966-1976............................ 95
18. Projections of Real Capital Costs per Ton ofCoal Mined in South Africa, 1975-2000(3 scenarios)......................................98
(continued)

6
(table of tables continued)
19. Cost Scenarios for High-Grade Coal.................111
20. DRI Real Cost Increase Forecast:
"Control Scenario".................................115
TABLE OF FIGURES
1. Low and High-Grade Coal Under Price Controls ........ 21
2. Vertical Cross Section of a South AfricanCoal Field..........................................65
3. Resource Curve for High-Grade Steam Coal:South Africa........................................ 70
4. Resource Curve for Low-Grade Steam Coal:South Africa........................................ 71
5. Real Annual Wages Among Racial Groupsin Coal Mining, 1965-1975........................... 87

"...South Africa might play the dominantrole in the emerging steam coal marketthrough the early 1990's..."(International Energy Agency)1
Section I: Introduction
The possibility of expanded world trade in coal is
receiving increasing attention from several quarters.
Existing and potential coal producing nations are re-eval-
uating, or creating for the first time, their energy
plans to consider the location and the magnitude of
markets for their coal resources. With each increase
in oil prices, these resources become more reasonable
as a source of energy supply to energy-importing nations.
South Africa, as the world's seventh largest
producer and the fifth or sixth greatest exporter of
coal, is a major focus of the growing attention directed
towards an expansion of world coal trade. Moreover,
South Africa is widely regarded as a "pivotal" supplier
in projections of coal trade; in other words, its import-
ance in the future of coal trade outweighs its current
ranking among major exporters. This is true in part
because of the relatively very low cost of South African
coal exports, and, of course, cost is a major factor

in projecting world trade flows. Of equal signifance,
however, is the highly uncertain outcome of the internal
debate regarding the optimal use of its coal resources--
a debate which is motivated by South Africa's intensifying
isolation in a world which largely condemns its racial
policies. The resolution of this debate may call for
continuance of the current policy of expansion of steam
coal exports. Alternatively, the outcome could swing
national policy to an abandonment of exports altogether,
and to the use of coal resources to support South Africa
in its isolation. This isolation would be made possible,
for example, through production of the lion's share of
the country's liquid fuel requirements from its sophis-
ticated "Sasol" coal conversion process.
It is clear that an understanding of the South
African coal industry and of its national debate is cru-
cial if one is to construct an informed point of view
regarding the future of world coal trade. This study,
which comprises both a "practical" and theoretical
examination of South African literature and personal
communications with South African coal industry officials,
attempts to deepen this understanding. This thesis
thus repairs a major gap in our appreciation of the
internal workings of this industry.
This study addresses the South African coal industry
from several perspectives. First, a discussion of the

institutions which most profoundly affect the South
African coal industry is presented. Emphasis is placed
on understanding its historical ties with the gold mining
industry. In addition, an examination is made of the
impact on the coal industry of government-imposed price
controls. Second, one must evaluate the concept of reserves
as it relates to reserve estimates presented in a major
study of South Africa's coal resources, The Report of the
Commission of Inquiry into the Coal Resources of the Repub-
lic of South Africa, otherwise known as the Petrick Com-
mission Report. Recommendations are proposed for making
reserves a more economically relevant figure. The "margin-
al mine" concept is presented as a tool for evaluating
reserves over time, and this provides the foundation for
the subsequent presentation of a systematic method for
estimating the costs associated with the process of de-
pletion. Resource curves are then constructed using this
methodology. The following two sections analyze costs
of labor, capital, and transportation in South African
coal mining. In light of these first six sections, an
essay on the potential for South African coal exports is
presented. A rough forecast of costs is presented, and the
results are compared with reasonalbe estimates of future
U.S. coal prices. This comparison provides insight into
the rapid change in the structure of world coal trade which

may be expected as it is influenced by South Africa. The
study concludes by suggesting that the present cost advantage
of South African coal exports will deteriorate significantly
before 1990 due to rapid labor and capital cost increases.
Note that while the recent cutoff of direct oil ship-
ments from South Africa's major supplier, Iran, directly
affects the long-term future of South Africa, that specific
event is not addressed in this study. However, the growing
isolation of South Africa is analyzed in terms of its effect
of increasing labor and capital costs. Furthermore, since
the effect of the Iranian embargo is similar to that of
previous anti-South African developments in other parts of
the world,- little insight is lost by focusing on the diffi-
culties resulting from growing isolation in general. The
impact of this intensified isolation is addressed through-
out this study.

12
FOOTNOTES
Chapter 1
1. International Energy Agency, Steam Coal Prospects to2000, Organization for Economic Cooperation and Devel-opment, 1978, p. 134.
2. Republic of South Africa, Department of Mines, Reportof the Commission of Inquiry into the Coal Resourcesof the Republic of South Africa (The Petrick CommissionReport), 1975.

Section II: The Structure of the South African
Coal Industry
The discussion which follows is a brief description of
the institutional environment within which the South African
coal industry operates. National policies which have guided
the evolution of this environment are described as well.
This section thus provides necessary background for a more
complete understanding of the chapters which follow.
South Africa's profile of energy use is unique in the
world: production of indigenous coal provides over 75% of
the country's primary energy supply.1 (The remaining 25%
is in the form of oil, mostly for private transport.) Table
1 provides the recent history of coal output in South Africa,
and displays some important trends which I mention at this
stage only briefly. First, tons mined increased at the
rapid pace of 8.0% per year from 1972 to 1977; this compares
with the lower annual rate of 4.9% over the entire time span,
1965-1977. Second, and most striking and significant for
our purposes, is the sensationally expanding role of exports.
The "sensations" are of two natures: growth in tons and
increase in price. 2 We will return to these phenomena in
detail later. Finally, note the spread between domestic

mea smms~amaNý /M m0 V-4 ý U) " m) t- to 10) m mIt) to 0oo LA) P-4 q w wt - 1.4 %n m m. . . . . . . . . . . . .0M tN to ) N 010 N 1 1 ) k 1F-4 1- P4OM~ambeabeameahMMM ~~~b
If) t - 0 0) M W P-4 v-4 %0 U)
vN m mWLmo 100)0 0 Ll 10 w 00 F-4N-to) m0 ai Q N %0 U -e soVO - V-4
N& N tnU) vo 0 " w 0) No' 0 N e v %0 m w I) r LA
S0 N " 0N t N" 0 0Nt N N r- q-4 -4 F4 P4 f-4
-4
-4 0 N N N (to r-4I- N MNo 0% N, 00 to P-4 M) 0) I) 00 1- %0 %0
N9U) L N N N 4 -P-V- -4 V-4
I)
0CCDLn
Lnno A N
G t No ~- -9-4 0 U00 N N
NQ 0 o) M e %t. " 00W p-q M) M l) to "C n> I 0 t -4 A N 0 4 tt0 m) M %0 0 Nq 0) n)
N 0) %0 " a) ) ") " -4 0 U)N I)N n 1* u0 '0 w) If) LM If )o )
A t 0 m 0 N w N N N w-4m N rl 0w9 - U) ýo so kt) L) LA ,- M U) -1) 0 - '0d
m 0 to 4) 0)10 1 to 0 4)U) 0 ) 1 N 00 10 N ,- ) 0ccN 1 1 1 U I) ) f)U)~ )-4)
o rw-4 N
%0 C NNJ 0 003 )
it ii
If-. e o e m Cý o0 0 4 10 4) ' 0 N 0 N 0 t
10 4 N ý CZ 0 ' 00 00 to 0) toM )tm0 m t ta - o m e C0 n t. U' LAt" N rN - N N N N 6 Let 0 1
r-4-~ 9 4 v~ -4 P-4i t-4 P-4 P-4 -4 9-4 9-4 v14
u,U)),4J U.4 U.·ws
4 44Q *4
041:4
444P
mt * ·aacE
$4 o0-40 ) 0
at )"g b4-I
1--
$4 4 (00 -4 u) 4Jao>
tn 4 cctr" :3 4)005
,q 4.4)044).09o 4)N.-4 k:0 0
N 0l>40 ccc 4 o 1
4 X0 04)4>0)I4* UO 0nu0 40
-0 i54J 34J U-4)
w F-4 0004 4 445-X 5 0 .4
. f 444o .5-p 4)ui :
5-o 004)04)
04 U 5-
9-: 4)4)0
- Nt
PSp 05- 40 [-
dr-4xto0
4104
MWow8 r
0
0o a>0
-44)
9-4/4)0
U.,q
4-) W-4)4)coB00
00 4)rae
WWna80
4)
ten
If~t
coOH S

average value and export average value. The magnitude of
this difference is not due to quality difference alone, but
is due in large part to controlled domestic prices. These
controlled prices are a focal point in the current South
African coal debate.
The mix of demand for South African coal is represented
in Table 2 for 1970 and 1977. Notice the sustained dominance
of the electricity generating sector of consumers, the slip-
page in domestic commercial demand, the growth in importance
of oil from coal and exports, and the relative stagnation of
domestic metallurgical consumption. These relative changes
accompany a rapid growth in total coal consumption -- a
growth of 7.2% per year compounded annually.
The path to this heavy dependence on coal was laid as
early as 1922, with signing of the Electricity Act of 1922.3
The state thus recognized the importance of hard rock, espec-
ially gold, mining in South Africa by promising to build and
maintain a nationwide electricity grid fueled by cheap coal
whose price was to be controlled by the state. Much of this
very cheap electricity was destined for the electricity-
hungry gold mining industry. The subserviant position of
coal mining was thus institutionalized. This early relation-
ship led to the complications which fuel the current South
African coal debate. I quote the Petrick Commission:

o\o
O m o
NN N-(NI ml
0 LO00 C M
S . . I..
r N - ) L C) o 0
Nq 0 0 0 No\ cm rn v o (N
H
0
0 ,-iC43
,-I 00 U
HO
c)-Hi43
H
Cd0•-H
H 5edO
WXC 0
d rd
"Q >1r p
. 4
4a-P
04 0GO OHU r
002 H
-P r
a) 4-4
0 O
--i EL 00: -my po .m
4- 0 0 -a) ONn C= -4 0
04-H-,- . o 8r •
,d o> 0Z 0 -
4-4
0- 040 rd ci44 0 4u Ln (aSaWe E-1
4 OE-40H tt 41
,0a)02
4-3
,-I
0
)o
O4 r
0
4-10
0'-H
9O0
04-
ro
OC)0)430
0
NTl

The demand for the vast amounts of power requiredin convenient form to carry out extensive hardrock mining and milling, soon led to the acquisi-tion and development of known coal fields...assources of fuel for the steam plants of electri-cal power stations. In the event all major coalproducing areas have come directly under theownership and control of the larger gold mininghouses.
The emphasis of mining interests on low costelectric power, and the establishment of theElectric Supply Commission (Escom) to generate anddistribute power on a 'no profit' basis as a matterof State policy, have led to the acceptance ofcheap energy as a matter of ordinary providence bythe many other sections of consumption that weregenerated either directly by gold mining or whichcame into being after gold mining had placed theeconomy on firm footing. 4
Two gold mining concerns dominate coal mining in South
Africa. The General Mining and Finance Corporation, Limited,
is "responsible for approximately 40% of South Africa's
total coal production." 5 Anglo American Corporation of South
Africa, Limited, adds another 26-27%,6 making these two
concerns producers of two-thirds of South Africa's coal. It
is clear, therefore, that the gold and coal mining industries
are closely related. Further, it is clear that there is
potential for coal price manipulation in the domestic market.
However, as mentioned above, the potential is eliminated since
these domestic prices are controlled by the state.

Price Controls:
The long-standing committment of the state to low
electricity (and therefore coal) prices is manifested in
domestic price controls on coal. The current price-setting
structure was established under the Price Control Act of
1964, which is administered by the Department of Commerce.
Table 3 shows a collection of domestic prices for various
dates and coal types. This table provides greater detail of
the trends hinted at in Table 1. The price spread between
Grade A exports and Grade A coal consumed internally amounts
to nearly $15. Naturally, coal producers are eager to sell
exports. This eagerness is fortified by the knowledge that
they (the producers), not the government, set export prices
and allocate export rights via producers associations -- the
Transvaal Coal Owners Association (1923) Limited, the Natal
Associated Colliences (Pty) Limited, the Anthracite Producers
Association (Pty) Limited, and the Coke Producers (Pty)
Limited. The export rights themselves are controlled by
government policy7 and constrained in the short term by port
capacity. However, export prices remain uncontrolled.
Let us examine the prices for domestically-consumed
Grade Acoal (with a heating value of around 12,000 BTU per
pound) and Grade D coal (about 10,700 BTU per pound)----
prices which held in the July, 1976 to January, 1978 period.

Table 3
CONTROLLED PRICES FOR DOMESTICALLY-CONSUMED COAL:
SOUTH AFRICA
Rand/ $/Metric Metric
Type of Coal Date Effective Ton Ton
Grade Ab Feb., 1978 7.76 8.92
July, 1976-Jan.,1978 6.93 7.96
Grade D July, 1976-Jan.,1978d 6.68 7.68
June, 1976 3.46 3.98
Escom 1977 6.12 7.04
Exports(Grade A) 1978 20.72 23.83
Anthracite(Domestic) 1978 20.59 23.68
Anthracite(Export) 1978 22.72 26.13
a - $1.15 = R1.00
b - Grade A coal has a heating value ofabout 12,000 BTU/pound.
c - Grade D coal has a heating value ofabout 10,700 BTU/pound.
d - Latest dates available.
e - Coal which is burned by the government-controlled generating plants of theElectricity Suppy Commission.
Sources: Granville, A., and A.J. Venter, "South Africa'sCoal Industry Expands, World Coal, November 1978,p. 53. See also Sealey, A.A., "South Africa'sDepleting Quality Coal: How to Save the BestReserves," South African Mining and EngineeringJournal, December, 1977, pp. 27-28.

Grade A coal at $7.96 per metric ton averaged 30.14 per
million BTU. It is surprising that Grade D coal cost more
per million BTU at 32.64. If we consider BTU content alone,
therefore, consumers would naturally prefer low-cost high-
grade coal -- if they can get it.
It is natural that producers bring some reservations
about meeting these demands for we know that, in general,
price controls decrease the total amount of coal produced
for domestic consumption, and alter the mix of coal grades
produced. For price controls to be effective they must, of
course, be less than the equilibrium price of coal (See
Figure 2). Thus, in our situation, the equilibrium price of
coal per million BTU, PE' is greater than the controlled
price of low-grade coal, PLC' which is greater than the
controlled price of high grade coal, PHC' PE is determined
by adding (horizontally) the supply curves for low grade (SL )
and high-grade (SH) coal to reach a total supply curve (SL+H)'
This curve meets the total demand curve (DL+H ) at a price,
PE' and quantity, QTE. The reader can see from our example
that at this equilibrium price, this quantity is comprised
of QLE tons of low-grade coal at around 3/5 of the total,
with QHE tons of high grade coal filling the other two-fifths.
Contrast this with the current regime of controlled prices.
At PLC only QLC is produced, while at PHC only QHC is produced.
Total tons produced under controlled prices is QTC. Of this

z~~1
U]
SU
04
4
+C

amount (which, as is readily seen, is much less than quantity
produced without price controls) a much smaller proportion
is high grade coal than under market equilibrium. Thus, the
supply and demand responses run counter to one another. Under
price controls, consumers desire more coal, and in this case
want more of that coal to be high-grade (since PLC > PHC).
Producers are unwilling to produce the coal demanded, and
they will produce a smaller proportion of high-grade coal
than without price controls.
Note that this analysis has assumed that Grade A and
Grade D coals possess different supply curves. Grade A
usually requires washing, which adds to costs and differen-
tiates the Grade A supply function from the "no-wash" case.
However, in many cases, collieries are constructed to supply
coal as fuel for one use only. Originally, a major singular
use was generation of electricity for gold mining in the
region of the coal mine. Coal was transferred within the
gold mining company from its subservient coal mining sub-
sidiary to the gold mining site as the coal was needed.
Little or no market existed for the coal the gold mine didn't
use. Usually only the highest quality (highest heat content)
coal was mined since its production cost per BTU was lower
than that of lower quality coal within the same seam (in
layers over- or underlying the better coal) or in seams

nearby. The result was an irrational and wasteful use of
high quality coal on a process that could easily have used
lower quality material.
Current "tied" operations are not limited to supplying
the needs of gold mining. Iscor (the state-regulated steel-
producing organization) and Escom (the state electricity-
generating entity) operations are often fed by a single
colliery. While the seams being mined usually contain a
breadth of coal types, the singular purpose of the colliery
prohibits the effective mining and marketing of these different
materials. Such practices have led to a call for "rationali-
zation" of coal mining in South Africa. That is, there is
a growing movement to locate and develop markets for different
coal types.
Thus, price controls of two types have resulted in
inefficient allocation of coal resources for domestic use in
South Africa: explicit price controls operating on multiple-
purpose mining operations effect economic disequilibrium for
the several types of coal mined; implicit controls -- that is,
the internal "pricing" schemes of gold mining, Iscor, and
Escom tied-colliery operations -- encouraged wasteful use of
different coals for a single purpose.8
In general, the coal mining "(i)ndustry believes that
the present controlled price is not sufficient to justify

the opening of new mines to support the (domestic) commer-
cial market." 9 Fortunately, price controls do not apply to
the focus of this study -- export coals. These coals
realize what the world market will bear which, as we have
seen, is a great deal more than that allowed by domestic
controls. Therefore, as long as the bounds of the constraint
of national policy and railway/port capacity (See Section 6)
are not reached, new mines will be opened for the export
market.

FOOTNOTES
Section II:
1. Granville, A., and A.J. Venter, "South Africa's CoalIndustry Expands," World Coal, Nov. 1978, p. 52.
2. Table 2 really says almost nothing about price. The"value" presented includes a range of transactionprices, some of which are determined by long-termcontracts signed years ago. Marginal value is dis-cussed later.
3. Smith, Jan H., "The South African Energy Situation,"The South African Mechanical Engineer, Vol 25, Nov. 1975,P. 348.
4. Republic of South Africa, Department of Mines, Reportof the Commission of Inquiry into the Coal Resourcesof the Republic of South Africa, (Henceforth referredto as the Petrick Commission Report), 1975, Paragraph1.2.3.
5. Letter to the author from S.P. Ellis, General Manager,Coal Division, General Mining and Finance CorporationLimited, Johannesburgh, South Africa, dated September26, 1978.
6. Granville and Venter, Ibid. Eight mining groups produced94% of total output in 1977.
7. The Fuel Research and Coal Act, Act 35 of 1963, is theprincipal regulation governing export policy. It isadministered by the Department of Industries.
8. Petrick Commission Report, Ibid.
9. Sealey, A.A., "South Africa's Depleting Quality Coal:How to Save the Best Reserves," S.A. Mining and Engin-eering Journal, December 1977, p. 27. (1977 controlledprices). Sealey describes a price per ton for highquality coal which he believes is the correct price.He assumes Grade D coal sells for R6.675, as in 1976-1977, and that washing costs are 50¢ per ton. At 70%yield, washed Grade A coal should equal (R6.675/0.7)+0.5 = R10.04 per ton for a parity with Grade D. Sealeyusesa washery yield of 62%, which seems low.

Section III: Coal Reserves in South Africa:
How Meaningful a Figure?
A contentious debate regarding the optimal way to
extract and to utilize domestic coal resources is now raging
in South Africa. The rhetoric deployed in this conflict is
familiar to observers of American energy policy -- energy
independence, price controls, balance of trade problems,
environmental degradation, and labor "shortages" (rapidly
increasing wages) play a part in the billowing verbiage.
The sides break down roughly into two groups: one that be-
lieves that South Africa's coal resources are not extensive
and that coal should be conserved "at almost any cost"' the
other "maintains that there is sufficient coal till well
into the next century and that (South Africa) should not take
any precipitate action on coal at this stage."l The position
one takes largely depends on one's perception of the extent
of coal reserves.
This concept of "reserves" as it applies to South
Africa will be examined in this section. It is necessary
to determine whether recently published estimates of South
African coal resources define reserves as that coal which is
economically extractable given today's technology and market
conditions. If this definition of reserves is that which

informs published reserve estimates, then one is better able
to judge opposing arguments on South African coal utiliza-
tion -- including the debate over coal exports which provides
the basis for this study.
American Coal Reserves: An Illustration
The problem of defining American coal reserves illus-
trates the issues and provides a basis for understanding the
meaning of reserves in South Africa. Table 4 displays the
categories of resources used by the U.S. Bureau of Mines and
the definition of each category according to seam depth and
thickness. Total resources, identified resources, reserves,
and subeconomic resources are each further defined by degree
of geologic assurance as measured, indicated, or inferred.
To classify as measured, "the points of observation and measure-
ment are so closely spaced and the thickness and extent of
coal beds so well defined that the calculated tonnage is judged
to accurate within 20 percent of the true tonnage.! 3 In
general, the points of observation are no further apart than
1/2 mile.
Resources qualify as "indicated" based on boreholes,
outcrops, mine workings, or other observation points that are
no more than 1 1/2 miles apart from beds of "known continuity".
The "inferred" category consists of coal whose existence is

SmY)
0 0 0co o \o
kOO k000
000
00so o ,
0 0
0 000 < O 0o1 , \- M
I I
0 0
00EE
o o00on oe o
0000
\0a0
0 0
00
Ot o
0 0o toto n
o o
r 1
* U)
* * 0O
0
IL 4 10
'U )
00
b* 0 C
Cl)
0 0 re ,0
0 00040 0 0
0 0U ,d 00 0 U)U
o0) 0 U
00o 0 C oIM 0I 4
rd*.
o Uo• +Jrdkb
u uo0 Qi t J
S 00 0
0 00U*aed 1
SQ. 0 0•4 4-- -0
0 aH) H UH
o• *o •.tnco4-p 4 0 *-
0 -d*H 0+
0 o *' 09 4- r d U) 0 rd -H (
0 D cH -H O0r- u
T k 00 (1+
LH U 4-)
. 0 0 r 0 (
U 4 H -9 H a .S UN 5 **
'- 4 0 I-
000000
O I000
0SC
o CO rHK i
0C :'--
0
0r)
0
0t9U
0*H
oU)
oO
0o

based on judgement using available geological evidence.
The reserve category in Table I is supposed to contain
coal which "could be mined commercially" at the present,
either by strip or underground methods. In examining the
meaning of "commercial", one must first note that (a) the
theory of resource economics predicts that the cheapest re-
sources will be exploited first, and (b) in the long run in a
competitive industry, the cost of the last unit of output
produced will equal the minimum average cost of production.
This latter premise must be modified for a mineral industry
such as coal. Contrary to the usual interpretation, in the
coal industry
...(all) firms are not identical. Mines in betterdeposits, in this case, thicker seams and generallymore favorable mining conditions, will coexist withless productive mines. As mining proceeds from moreto less favorable deposits, costs rise. Those minesopened under more favorable conditions will earn ahigh rate of return at prices that are just highenough to keep the less favored mines in business. 4
The cost function for coal production, therefore, is determined
by geologic conditions as well as rate of output. Large mines
may be opened at the same time as small mines and operate with
equal costs at the outset because of different geological
conditions. As cumulative production from these mines increases,
mining will progress to less favorable deposits. The "less
favored" mine which just breaks even at current prices pro-
duces coal at a rate and under geologic conditions which

minimize average cost. This mine will be referred as an
"incremental mine". The incremental mine is the last mine
opened to satisfy demand, and is the first to close if demand
decreases. Its minimum average cost is the long-run marginal
cost of the coal industry. The incremental mine can be
studied over time to determine how economics and geology can
be combined to produce a cost curve for coal. If new mines
are extracting coal reserves which lie on the least attractive
fringes of the definition of reserves offered by the Bureau
of Mines, then reserves likely reflect today's economically-
exploitable coal.
Work completed elsewhere concludes that, in fact, the
U.S. reserves as defined in Table I include much coal that
cannot be extracted economically using today's technologies
at today's prices, especially coal mined by underground
methods. This work concludes that a major determinant of
geologic conditions, and therefore costs, is seam thickness.
However, the thickness categories used by the Bureau of Mines
are too broad to be of much assistance in estimating costs.
Further, while thickness is the single most important deter-
minant of production costs, other less easily observed geo-
logic characteristics are collectively of equal importance.
Roof, floor, water, grade and gas conditions are included among
these factors; yet none is considered in the BOM definition
of reserves.

The interactions among all cost-affecting conditions
must be better understood in order to estimate the behavior
of costs over time and cumulative production. That is, it
is the combination of all cost-affecting factors which
determines the cost of production in any mine. More specifi-
cally, marginal mine A may extract steam coal from a seam
three metres thick, while marginal mine B produces the same
quality of coal from a seam only one metre in thickness. The
two mines produce at the same cost because, in this case,
mine A is characterized by methane gas leakages which force
the mine to close periodically for ventilation. Conversely,
mine B's seam may exhibit no gradient, minimal water seepage,
and no gas leakage problems. Seam thickness is an important
cost determinant in both mines (if you have ever seen
crouched miners work in a one-metre seam, you realize the
constraints to human and machine mobility). But it is the
tradeoffs among all cost-effecting factors that determine
production costs.
These are the insufficiencies of definition which
confuse the concept of "reserves" in American coal estimates.
These inconsistencies are no less confusing in the analysis
of South African coal.

The South African Example
The need to define U.S. coal reserves in an economically
meaningful way can be applied as well to South African reserves
and resources. The principal source for South African esti-
mates to which I refer is the influential Report of the Commis-
sion of Inquiry into the Coal Resources of the Republic of
South Africa, better known as the Petrick Report, which was
published in 1975.6 It contains an important discussion of
reserves and the parameters which define reserves as repro-
duced here in Table 5. I suggest that this South African
interpretation of reserves is, on the surface, more thoughtful
and more concisely defined than that employed by the U.S.
Bureau of Mines.7 However, I shall argue that the report,
by failing to recognize the importance of the interaction of
numerous geologic conditions which affect costs, paints an
inaccurate picture of the potential for South African coal
production.
Some Definitions
The Petrick Commission calls "coal in situ" (the U.S.
Bureau of Mine's "total resources") "an academic figure which
will not be published." 8 With this dismissal, one immediately
recognizes a conservatism resulting perhaps from a fear of

33
TABLE 5
SOUTH AFRICAN RESERVE SPECIFICATIONS
NUntER OF DORdiotL S-OR ADlTS PER 2000 Ph
I L I ABI L ITY POVEfN: INDIJCATeD: NrEDm o
P• rac - To. •eW I
VTERBERG 8 7-3 2SOW• RAND 0 9-3 2SPRINGFIELD: VESTERi AREALIMPOPO: SPRING80K FLATS 10 9-5 4SOUTPARSURtG
S.V.A. .IBEO:I S. .A. OVM ..OO.r.s.-veROFONTE m"V9REIEN IGI15-ASOLSMG 10 9-3 2,vIITANIK SEANIS 2, 4 I4 IUPIs .m•Uew 2, 4 & S
PAFWEI
EASTERN rMVASVA M Ol20 1' o4CM.I•PtIER : VRYNE IOD: ZUIA 19 4
omrtroot . ,o30 29-S 4Vt i SiMS 1, 3 1 5 30 29- 9Ni6l9NWIO SCAS I & 3
itia i ) .. ),- - - -"NETRC TDONSat tareX (f) 30 3 2 :A D OP . IfTS -08 15" I40 W-00 1C -500
hTN1CJCN:SSo O 10D MNg As R 15-1f irlmA(A M(lt 10SS OF PI LLAR ILSCI To LMNMD10% I S BE SE M.AK ! M PILLA IL
FFlirw T) . .P.A I•lMolr ..
• RIPpAATIo " TOS IPTO)O1. WTD1:.
A3 MNrrLOE CaRL
SPCcrI.wi.aS C IPOR MEAUL COAL Fa SITI (b) )liff of 4 1 IV S 1 0IIO ANMITM1IC
COAL -V e COAL
PIACtOR LOCAL LO wetW GpD t HALE- k TCtMI Sttac*AL S1WiACOA LCOICA ALCOAl, ,SYMBOl .sC IHSC. IL AXi
Pax 300 400 a* nSoO
("ETRES) l4l1 15 15 15 15
lottSOLE e 6 6 6 6(P'RES) IN4 1,2 1,2 0,7 0,.
Mi1lhs YIELD R 70X 501 60AT s... "_,6 1,4 1.,AS* Im• E 35u 7r 14% _ 5_
S l IMA - -- 14%A5I*fRE.VOLATLES a 16 16 S
SbLL ING I. II5_ _ _
PlOFRITY FORI TIL ,lITRACTION OF(CLAt. SEAiS
%Wl*,, ARE LIKELT TO UI CLOSE TOSEYTHe '
PRIORITY
Irust Tsaep TaiIp Fousa ?Fth]P E r I n
Y•,ESOIISAIA' 26r - - .Imw 7 56 s8 3 2J' 7. 4 r- -l1l0imb. 4 4 UP -...
gout% Me VA*VA MAIK loiIOLD SPRit .W€ Im.b 2A ., ?A I
a1.5-. VItoernT mrr - - - -
5._.A. O WfEON 1 5 - - - -S... II.O N •~ I ! . . .

Notes to Table 5
(a) Coal is a carbonaceous rock of sedeimentary origin containing not morethan 50% of ash.
(b) Coal is situ is the total amount of coal in a given area occurringin its natural environment; since it includes all coal, however deep or thin itmay be, this is an academic figure, which will not be published.
(c) mineable coal in situ is that portion of the coal in situ which can be minedby existing techniques.
(d) Extractable coal is that portion of the mineable coal in situ whichis extractable in prevailing or slightly less rigorous economic conditions.
(e) Minimum tonnage means the smallest tonnage which will make an isolatedproperty a viable proposition -;'but two or more smaller properties within 5 kmn.of each 6ther and making up the required tonnage are admissable.
(f) washery discards allowed for.
Source for Table 5: The table was taken in its entirety from the PetrickCommission Report, op. cit.

misrepresenting the huge, but economically meaningless,
resource estimates. Instead, coal is broken down into the
categories of (a) mineable in situ, and (b) extractable.
Mineable in situ is "that portion of the coal in situ which
can be mined by existing technologies...Extractable coal is
that portion of the mineable coal in situ which is extractable
in prevailing or slightly less rigorous economic conditions." 9
Let us explore these terms more fully.
Mineable coal is broken down into the following types:
low grade steam coal, high grade steam coal, metallurgical
coal, and anthracite, High grade steam coal, met coal, and
anthracite all have to be washed due to the generally high
ash content of South African coal. The distinction between
low grade and high grade steam coal in the raw (pre-washed)
state is based on BTU content. High grade steam coal contains
more than 9000 BTU per pound. Low grade steam coal, because
of its low heat content (below 9000 BTU per pound) is not
economical to wash and must be used, if at all, for electric
power generation, liquefaction, or gasification. Met coal is
distinguished by its relatively low ash content and its
swelling index. 1 0
The mineability of each coal type depends, in part,
on the depth of seam burial. Low grade coal is assumed to be
mineable to 300 metres (984 feet), while high grade steam

coal is mineable to 400 metres (1312 feet), and met coal to
500 metres (1641 feet). These changing depth constraints
suggest that mineable coal in situ is contaminated by the
economics of each coal type. However, the "mineability" --
that is, the physical ability to remove coal -- depends on
roughly the same technology for each coal type. This category
of "mineable in situ" should be immune, therefore, to econo-
mics and should not require different depth cutoff points.
The economic considerations introduced by varying depth con-
straints among coal types make the usefulness of the "mineable
coal" category unclear in this South American case. One must
proceed, therefore, to an evaluation of "extractable coal" --
that is, coal which by the Petrick definition is economically
mineable. This is the coal category which corresponds closely
to what Americans call "reserves".
Extractable coal, a subset of proven plus indicated
resources, is subdivided into underground and strippable coal.
Underground coal reserves are constrained by four categories
of requirements:
1. Minimum tons: this constraint establishes the
"smallest tonnage which will make an isolated property a viable
proposition..." The constraint recognizes the importance of
economies of scale in the South African coal mining industry
2. Range of depth: defined above for mineable coal.
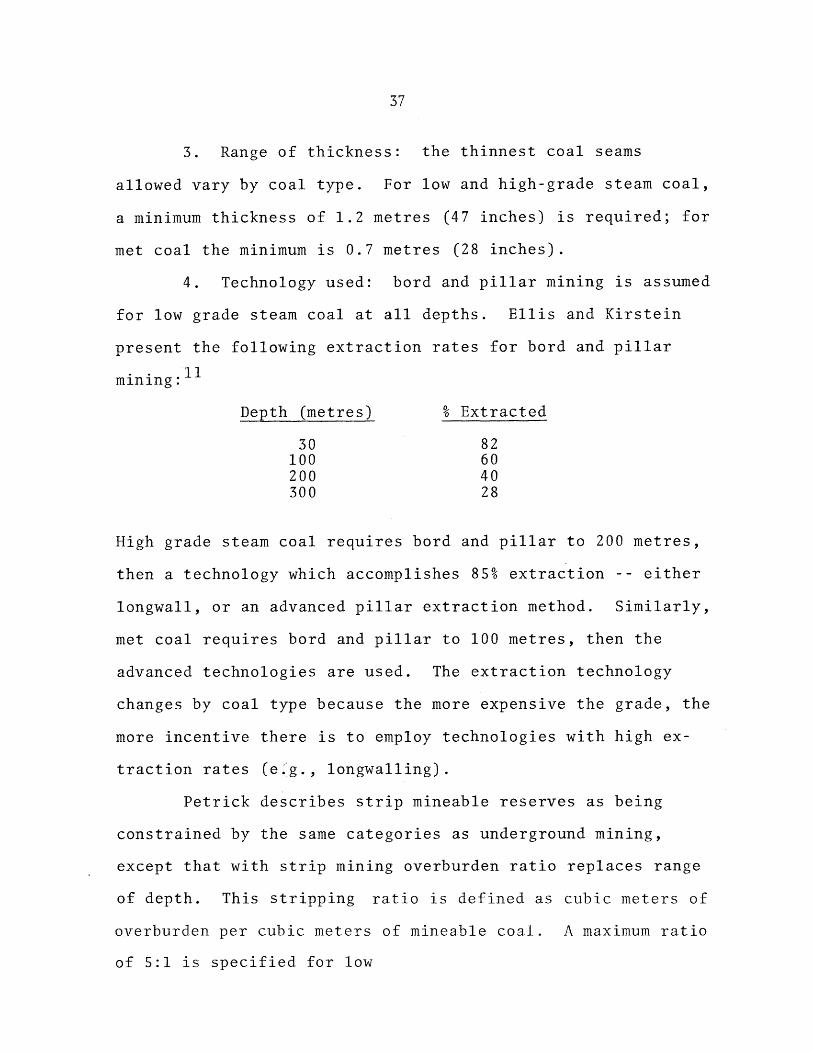
3. Range of thickness: the thinnest coal seams
allowed vary by coal type. For low and high-grade steam coal,
a minimum thickness of 1.2 metres (47 inches) is required; for
met coal the minimum is 0.7 metres (28 inches).
4. Technology used: bord and pillar mining is assumed
for low grade steam coal at all depths. Ellis and Kirstein
present the following extraction rates for bord and pillar
mining: 11
Depth (metres) % Extracted
30 82100 60200 40300 28
High grade steam coal requires bord and pillar to 200 metres,
then a technology which accomplishes 85% extraction -- either
longwall, or an advanced pillar extraction method. Similarly,
met coal requires bord and pillar to 100 metres, then the
advanced technologies are used. The extraction technology
changes by coal type because the more expensive the grade, the
more incentive there is to employ technologies with high ex-
traction rates (e:g., longwalling).
Petrick describes strip mineable reserves as being
constrained by the same categories as underground mining,
except that with strip mining overburden ratio replaces range
of depth. This stripping ratio is defined as cubic meters of
overburden per cubic meters of mineable coal. A maximum ratio
of 5:1 is specified for low

grade coal, and 10:1 for high grade and met coal. These
ratios translate into roughly 3.4:1 and 6.9:1 in cubic metres
of overburden per ton of coal. 1 2
The reliability of reserve estimates is judged by the
number of boreholes or adits per 2000 hectares (7.72 square
miles). These drilling requirements change by minefield in
accordance with the varying degrees of geological continuity
associated with each area. Thus, while proven reserves in
the Waterburg field, for example, are established by using
only about one borehole per square mile, to prove Highveld
coal requires nearly four drillings per square mile. This
practice, by recognizing local geology, is superior to the
more aggregated methods of the U.S. Bureau of Mines.
Petrick Commission Report Results:
Underground Reserves: Employing the constraints
specified above, Petrick concludes that extractable coal
(reserves) total 24,915,000,000 metric tons (out of
81,274,000,000 mineable metric tons) (See Table 6). Of
these reserves, high grade (washed) steam coal amounts to
10.5 billion tons, with met coal comprising only 705 million
tons. Subtracting the high grade and met coals from total
underground reserves leaves about 13.4 billion tons of low
grade reserves as extractable under ground.

IABLESOUTH AFPJCAN RESOUIRCES AND kESERVES
PEPUBLIC OF $CFtl AfRICA
SUMMARY OF THE RESOURCES 1974 : MILLIONS OF TONNES
SEAM DEPTH AND SEAM THICKNESS IN METRES
RAtW stVl1rOUs COAL (a)
A40% 0V- 101i' #-via 26'sir 2P totaPRovE - 1" ;i• 3 i9l, 6 .1 . 7 91 _ 13 582 32 23
Doc rto -. 6 2 Mzs 5 5,1 5 _ . 11 785 15 O8flopelO - 2 1"9 2_ s 3 515 5 479 1 98 23 0
tOTA L I4 8 625 jS 2iO T 1 565 31 350
WASHED SITUMINOUS COAL
CALORLIFnIC MaG AJOULt.5 P". KLO4PAM4
S vALUE -ts ' S*.- " TOTAL. . ,. . ,,PROVE 1 374 2 135 2 675 4 033 to 217
M•I ALLURCICAL COAL IWAS1D . A4NTWSACITIC COAL IWASM•OH
,OV' 443 ,ov to IlaIDI'ECICO ( 0DICATO . 3811wrI pto t 32r4 009EeFA 245TOAL 3 451 OTAL .
PAW sI1UMIvIOUS COAL (14
otE 001 Val S - l TOTAL
o s0 so I l7I • 66 b 69Sso 2oo 3 832 8 671 8 2192oo o0 370 51 126 997
SOTAL 5 347 8 193 3694 g2
O WASHIM IIuUMIErOuS COAL
S,1 pit-# O S2o I( s -2dC TorTAO I ~.. 2 F99 1 463 Z ?59 9 220
S00oo do 446 523 ?16 1 2TOTAL 3 344 3 9.3 3 135 10 462
D MI TALI URGIC AL 39 2
COAL ,0oo 00oo 7
I..
w O.- 0. - 2.O 2 - ( 2L -T •OTALAInRA oCI IC i - - 1•4
.9 .c
COAtL 2•,~0o o I 211 - - 211
(b) STaIPPING NATeO O: 1.'s.- S. i, SIAM DoIri (r)
0 TOE2 2TA O-l S l") s.ro400 Toro FA o0s V-s•o T.so TA lOYAL AT o I480 ,g400e TOTAL
0 PAw SnU.Vous (*) 454 6 361 4 204 II 023 S70 D1003 13135 . 600 571 10663 17 160 217 94. COAL
c wasCto A ous 10C4 t 147 3 I 636 l85 2. 916 z 1081 5 20 21?7 3 506 4 214 7 937C Z M COAL
S MTLLURA~IoCALt j 7 . 5 . 7 11 7 27 7 43 14 124Y' 0 i COAL
S •* .AAc. 0 21 2. 6 0 27 S .3COAL I I
TOTAL . 375

40
NOTES TO TABLE 6
(a) Contains the washed bituminous coal and the metallurgical coal.
(b) Cannot be added to coal extractable by underground mining.
(c) Coal from 0-15 metres can only be extracted by open cast mining.
Source for Table 6: The table was taken in its entirety from thePetrick Commission Report, op. cit.

Strippable Reserves: Reserves extractable by strip
mining methods are presented by coal type, overburden ratio;.
and depth. While "extractable" coals are listed for ratios
up to 15:1 and for depths to 100 metres,
...the present maximum stripping ratio is about 5:1,and the maximum depth for opencasting is about 50metres...(Therefore) the figures in the strippingratio columns of less than 10:1 and less than 15:1 donot represent coal extractable under present economic 13conditions, but are inserted to indicate the potential.
With this caveat in mind, strippable reserves total 6.8 million
metric tons.
We could assume that all coal which can be strip mined
will be strip mined. This is supported by current trends in
South African mining. In fact, strip mining
...has been so successful that the...method isplanned for wide use in South Africa, and it islikely that all future coal mines with a low 14enough stripping ratio will adopt the technique.
Under this assumption, strip reserves are a subset of under-
ground reserves and we may simply subtract the strip reserves
from the total reserves "extractable by underground mining"
to obtain a figure for reserves which will truly be mined
underground. However, I hesitate to do this for two reasons.
First, the Petrick Commission warns that "strip coal reserves
cannot be added to coal extractable by underground mining" to
yield total reserves. No explanation is offered for this --
nor have I been able to find a satisfactory explanation in

4'
the literature or in conversations with mining officials.
While this does not preclude the assumption that strip reserves
are a subset of underground reserves, the statement and lack
of explanation introduces a lack of clarity which muddies
reserves definitions.
The second reason I hesitate to assume strip reserves
are a subset of underground reserves is that some strip
reserves will be unfit for underground mining. That is, in
South Africa, as in the United States, some of the shallower
strippable coal is really not underground mineable -- surface
subsidence is a problem which prohibits underground activity
at some shallower depths in some areas.
New Marginal Mines in South Africa:
Literature describing recent mine openings in South
Africa mentions some of the parameters characteristic of the
new mines which Petrick used to define reserves. I examined
these data on seam thicknesses, overburden ratios, depth of
burial, ash content, and technology to see if the limits of
the reserve constraints prescribed in Petrick are being
approached. My conclusion is that the Petrick report fails
to adequately describe economically extractable coal in South
Africa. The least economically attractive fringes of each
of the parameters used to define "extractable" coal do not

characterize coal to be extracted by mines which are scheduled
to be opened between now and 1981. Characteristics other
than seam thickness, depth, ash content, and minimum tonnage
are, therefore, of great importance in determining costs. 16
Table 7 lists each incremental mine along with some
distinguishing features. Planned levels of output vary from
180,000 to 12 million tons per year. This obviously demon-
strates the insufficiency of output in determining production
costs. Thicknesses range from 0.8 metres to 9 metres -- evi-
dence that thickness alone is an inadequate determinant of
costs (See above, p.30). Calorific, water, and ash values
are also broadly spread. There clearly must be an interaction
of these and other geologic factors in determining costs.
Finally, the technological specifications of the Petrick
Report do not appear to be verified by the limited data we have
on new mines. The Coalbrook Colliery uses the longwall method
to mine low grade coal. Petrick suggested that only bord and
pillar mining would be practiced on low grade coal.
It is clear that in South Africa, as in the United
States, seam thickness is the major determinant of mining
costs. Evidence for this view exists in Table 5(d), "Priority
for the Extraction of Coal Seams Which are Likely to be Close
Together." Within each coal field, the seam extraction priority
matches exactly the progression of seam thicknesses. For example,
the Witbank seam hierarchy begins with number 2 seam as the

C
cdC
Cd 4r- 4 U
4-)
0
ScPCo
0 .LA Zcato u
c0 ·If H
0 2
LA
'CU 'C~I (tNJ
'CU
$-4lr-t o 4-J- .u
eC•.
00*"M ,C
0 c'- r
Z * H 4-J
0'C •0 0 'H X
U4 0
S- UH r H-4cd ,- 9 co =
* m
.->00C13
oF
o+C
'H ,9 cd
o 0 m c .
0;*H ,H 4-)E 0 rtoO ::: * . .UO0 P-,JU
0
r-H
*H 0 C.•O
LA edPI 7C
V3 V
0 -C
4- Ico
0
0ý4uo0OOL•
ed0 CU
<t" 0 0
,CU
0
C
S.
4I
*H
9
to
c
CIS --4 *4
0 *H. 4-a, •O a":E n: -•
C14
•.•
N
0(N
CU
O{/1
IsLA -4 N 00
c *- *
0 W < Co
*Nr (,J
LA
0
(Ni
0
OO
U
S'
0 Uo
k HcdO: ,,oF .,-
0COO
r- U,-* 0
CE
V)
00 ,- -
N r. 94P\
Sa4 OO -
r,--
0 r
V)o 0
U)0o'-e
o) 0
00H r
rclm
COuclC
0 OUO,--I
,c
ý4 u0l 0 0(NJ I C .•
OOO H r O
hl l

450 uEtn,.- 0 V) r..
ed 0 'H 4 Cd H Cd•.H C .,-H 0
5 oH C C N C 0 0 0 0
0 . o ,C e
,.. .. ,-, .c. 00
00 N - , '- 0 V "V 0 0$--
S.1 N 10 000 C1J 0 c'-4P4
4o u
4-0 (A40 *0
• 0 LIn Lf. . r-• . o)0 -00 0 0
0 d ,. *,O- \O = 0 . 00
o ou .• o .cn -- 4 .. V 0 0r04E- -. 4' -
F-. *H4-0 U .'
0*H O
'I-',U.' '0 31 (• J. ,.•O . /0 00 * n 1 O 0.O -. 0 09 , , 0 CI 0
-r H $- •4 0 *, ,o 0 . 0"
*#:•O .-.C n•, o • 0 ON • 0-o H 4. f4-s 4-4C. -• C44 4-1 Uoz0 • 0 .
I• o•,.• • •.• o •• O 0 0o,
0 0 "• '• 0 O .• •-c 0 U.• *• q-0: 0 0 0 H•00 C. ~.n u
• f *I 9 n U: 0 .a -H.H -H 0 4 - - ,-0 $4
ez O OI * M -H :3: 4 V) UH 0 0-'24 _u 00 -D $-H '0 -4 'r--4 L44n
cu. . - -J 0- F-.-4 0 -r-q 0 F-H ~ 00 --: o E P. 00U 0 H *0
•z u 0 +ca -H0 4 a0 H 4- 0 0 .
<LI.0 1 -4 .0 0)i.'H4-
' 3 F-.o o 0 r- .u 43' ý -H 0 +0 4- $-04.0
' 0. 0 O F-O. 0N 1~00 0-H-H, 0 toM o0t 0 C D r t,4- 0 0m 0 0 0 0 $-<0 0. o 0 0 m 0 *-HV1 V) 4oX
01n 0, o' 0. 0 04-3 U.' 0 * . - 0r 000 9 oe-o 0 m00
0 -H 0 0 cH *4-4) .,-1 '-H+J 4-. 4- F- 0- u.4F-. u'.. - 4-
E U' . 4-0 *H+j0O000 *H - -H 0 U -H see H F (4-
4-'9 -H >' 0 U.' $- ed .0.Q 00 0*Hcc r-4 0 v- 0 0 0 0+ Oj
C Z < U UNC - n>,aý 0c nvi Mý c0 c 0 - Q) a).- U U '0'004-U H*H -4 0 0&co0
Q) 4J H*H H-H -F-i;a 00- 04''..
4HJ0 04-'
H 0 00 0 U c0c-o o-. V) .0 4.0 U m 4 +
- 4J -H ' n 0 0
0
q r. H0 00- >4 0C M U4C = -49ýf 0 0
zOI)'.c. Ci..Hd Cd P4a -q 00 -ýE z C C. zpq uu t rl- t-4 v > rO
-4 t0 V W, -

46
4c, -4. . )--4 a)
o .4-1 . -i ,$ -4 *H-040 •
a) 0-H -H 0 )-ý
I c.a) U, En
0 •C - ~ l. 0 0F Orl q.4 • : u
C, k 4 -i ,c l
,-C O 0 • 0 IV.r *4 H f5 H
m M'.e ' )C/) C -4
0 0 0 E ·rll . .-4a) *C ,.: a s u C a 0, .h
.0C ,-C H• l• --c,
0 in n 00 0 * no 0 P E o -0 ,,4-4 aO >1 t C
-H U~ 0 4 e0 0,
0 . ~ C0. 0 M Tu c0 a)0, r- L 6, in mlo C a) Q1- 0
. - -a ,- 0 )u 0-
S0 0,- -M • , 04O
Oa *H4-• )a) , ,- c/CSo o ~ 0 m .Co >c) . Cd 0U a Po 1 0 - 0 m 0 0f
10 ,r 0 c• 4 , m zC d a) 0 a) " 0a- -4 0H 0 .n u - -))
-H C0 0 0 i l 0 (n4- H 0a)- 0 In; *H 0or--f 00 U • F 0, -- 4•- 4o so• oo Fo o
-H0 o O - . 04H +JC U 4- 9 uC0 b - n * 1 $ ) a 4
h a H / a0 in (CaH + 4-4 r= CA O0 ,.001 0000 oOze z =- ri $-4 > -H o
0 E- -l \4 40 1 +j .,1cn 0- r= i M ,Cm, E toS cu m 0 u toa"
>U r:; 4 J P C a, P. 0
)0 m V) V Q E 4.
H * c' , ý s U En C 14$4 0 (o ) - o 0 I ed - r.dI+ Ia o cI V) +o rlýC1 4)
0o 9 > 9 >r-I Cd 4 ()() r Q) N
*H Q) 9 () * (0 ) r cis t
9 c =) 0 9 (1) . tn4
0
0;..

most attractive, then number 1i, then number 4. The number 2
seam is also the thickest at six metres, followed by number 1
at 2.9 and number 4 at 2.3 metres. The seam extraction hier-
archy corresponds with the seam thicknesses hierarchy for each
field.
It is impossible to infer, however, the hierarchy among
fields from Table 5(d). This ranking may be clarified by
referring once again to the marginal mine concept. Refer
again to Table 7, which displays the specifications of eighteen
new mines. In a competitive market, and assuming that all
coal mined is homogeneous in quality, we could use the facts
that (a) all these marginal mines should have equal costs,
(b) seam thickness is a major determinant of costs, and (c)
the range of seam thicknesses mined is very wide, to draw
conclusions regarding the size of epsilon (all unobserved
cost-effecting factors) among fields. By associating an
epsilon with each mine field, and knowing the thickness of
all seams in each field, we could rank the economic attractive-
ness of all fields in South Africa.
Unfortunately, the domestic market is not competitive
and coal is anything but homogeneous in physical composition
(or end-use). Therefore we must control for the end-use variable
before we can estimate economic preference among mine fields.
This is done in Tables 8a to 8d.
The quality (market) categories for new mines are coal

for export, domestic electric power, domestic steel, conver-
sion to oil, and domestic commercial. A glance at the mean
seam thickness for each category verifies our expectations
concerning the effect of price on the choice of seam. The
lucrative export mines exhibit the lowest group average seam
thickness at 2.7 metres. Metallurgical coal is next at 2.9
metres followed by conversion to oil, electric power genera-
tion, and low-grade (commercial) coal.
Within each group we see wide variation in seam thick-
nesses for these marginal mines. As explained above, this
demonstrates the importance of cost-effecting parameters
other than seam thickness. The last column ranks the magni-
tude of these "other" factors by simply associating the
highest (1 is highest) ranking with the thickest seam in the
group.
This method has some shortcomings. First, only eight
of sixteen fields are represented. The remaining fields are
remote (high transport costs), contain poor quality seams,
and/or are not fully prospected. Second, within each end-
use market-defined group of new mines, there is a maximum of
six entries. Little information can be gathered from these
small samples. Finally, the seam thicknesses are the average
thicknesses supplied by the Petrick Report. Applying them
to specific mines as we do in Tables 8A to 8D is probably
misleading for the purpose of estimating unobserved cost-

49
Table 8
New Mines by End-Use Market
A. New Mines Producing for Export
Mine
Aloe
Annyspruitt
Boschkrans
Ermelo
Heritage
Kleinkopj e
Reitspruitt
Simple Mean
Field
Vryheid
Witbank
Vryheid
E. Transvaal
Vryheid
Witbank
Witbank
Th
1.8
1.8
Less Than 1
0.5
1.8
6.0
6.0
Ranking of
1 Magnitude ofUnobserved Cost-
Th Affecting Factors
.555
.555
1
2.0
.555
.167
.167
2.7
B. New Mines Producing
Coalbrook Vareeniging
Duvha Witbank
Kriel Highveld
Matla Highveld
Optimum Witbank
Springfield South Rand
for Domestic Electric Power
3.4
1.1
4.1
4.1
6.0
9.0
.294
.909
.244
.244
.167
.111
Simple Mean 4.61

C. New Mines Producing For Domestic
Steel Production
Mine
Boschmans
Grootegeluk
Navigation
Field
Witbank
Waterburg
Klipriver
Th
6.2
1.0
1.5
1
Th
.161
1.0
.667
Ranking ofMagnitude ofUnobserved Cost-Affecting Factors
Simple Mean 2.9
D. New Mines Producing for Conversion
Bojesspruitt Highveld
E. New Low-Grade Coal Mines
Coalbrook
Matla
Vareeniging
Highveld
Springfield South Rand
Simple Mean
to Oil
4.1 .244
3.4
4.1
9.0
5.5
.294
.244
.111

affecting factors. Thus, while the method is correct in
theory, it is rather crude in practice.17
We therefore rely on seam thickness as our sole guide
to the economic priority of seam extraction. By doing so we
recognize the principal determinant of extraction costs and
de-emphasize some very important cost-effecting parameters.
The resource curves, derived in the next section should,
therefore, be considered as useful first approximations of
the effect of cumulative production on extraction costs in
South Africa. Data are far too limited to provide better
estimates of epsilon.
I conclude that there is little evidence that the
Petrick Report recognizes current mining practice in its
estimate of currently mineable coal. On the other hand, the
geologic conditions other than those which Petrick uses are
not sufficiently described in available literature to allow
us to present a better estimate of today's economic resources.
These definitional problems, however, do lead me to conclude
that much time and effort are wastefully spent attempting
to define an ephemeral, and therefore not very helpful, con-
cept -- reserves. If every marginal cost-producing mix of
geologic factors could be defined, that definition would be
obsolete with any change in economic conditions. Since economic
conditions are changing continuously, so is the theoretical
reserve figure.

An alternative to relying on reserve figures for
national coal utilization planning would be to (a) describe
resources by as many cost-effecting physical parameters as
possible, (b) identify those end-use markets for coal which
are of interest to the national plan, and (c) identify the
location and amount of the coal of interest by specifying the
appropriate parameter ranges. This process recognizes that
coal is a multitude of substances, and that the worth of
coal in the ground is largely determined by the conditions of
existing and projected markets which require specific types
of coal.
The Petrick Commission does not go this far, nor does
any other national coal utilization program of which I am
aware. I therefore use the Petrick Commission numbers as a
basis for this report. This basis provides an important
input into the depletion study which comprises Section II.
Before we abandon this reserves analysis to pursue this deple-
tion study (the result of which will be the construction of
resource curves) let us examine current opposition to the
Petrick results within South Africa.
Two Challenges to the Petrick Reserves Conclusions:
R.E. Burnton, a senior engineer at the General Mining
and Finance Corporation, believes that the Petrick estimates

are far too low. He argues that approximately ten billion
tons can now be added due to "new reserve discoveries, the
shift of reserves from the inferred category into the proven
category; and a legitimate reduction in the minimum mining
height in terms of today's technology and economics."1 8 He
further suggests that using "today's technology and higher
prices, one can confidently consider over 60% of the in situ
reserves as being economically recoverable." He arrives at
an estimate of 61 billion metric tons of recoverable reserves,
a little less than triple the Petrick estimate.
Burnton's definitions and estimate betray his confu-
sion regarding the concept of reserves. His suggestion that
60% of reserves can be economically recovered displays his
rather cavalier definition of reserves. Reserves are, by
definition, economically recoverable. Further, reserves
should be recoverable at today's prices, not at some unidenti-
fied level of "higher" prices. A less bothersome point, but
still an annoyance, is Burnton's failure to specify the
reasons for the "legitimate reduction" of the minimum height.
Most objectionable is Burnton's use of Petrick's mineable
in situ and washable category as his recoverable high grade
reserves. As noted in Section II, mineable coal is not an
economically meaningful concept. It includes a lot of coal
that is not economic at today's prices or technologies.
Burnton would have been closer (but still -off the mark) if he

used the 10.5 billion tons of washable extractable coal
(using underground methods) for his high grade steam coal
estimates. However, this would have made his 61 billion ton
reserve estimate even more questionable.
A recent article by R.K. Dutkiewicz present problems
similar to those of Burnton, only in a more informed manner.
He reminds us of the gradual increases characteristic of
reserve estimates of most minerals, and he points out the
32% increase in reserves estimated in the Petrick Report over
the 1969 van Rensburg Report 19 (see Table 9). Coal reserve
estimates have been climbing in South Africa since the first
national study was completed in 1947. After setting this
moderate tone, Dutkiewicz ventures into guesses about future
coal availability.
Assuming coal recovery increases to 60% by the end of
the century (from about 40% on average today) and increasing
allowable ash levels to 60% (assuming fluidized bed technolo-
gies are in wide use) by 2000, Dutkiewicz concludes that coal
production may peak at over 900 million tons per year in 2075
-- fifty years after the Petrick peak of 300 million tons per
year. This scenario is highly speculative with its very
optimistic recovery factor and fluidized bed assumptions.
Dutkiewicz is candid in presenting these events as being very
"iffy". However, his projections of coal production in South
Africa are less candidly speculative. He provides a bell

Table 9
Bituminous and Anthracite Reserve Estimatesfor South Africa: A Recent History
(Millions of Tons)*
Mineable in situ Extractable
1947 Commission
Venter
Mineral Resourcesof S.A.
Coal AdvisoryBoard
PetrickCommission
Author
11,065
67,908
72,455
1947
1952
1959
1969
1975 81,274
18,877
25,290
*Metric

curve of coal production which suggests that eventually over
100 billion tons of coal will be extracted from South Africa
by some time after 2150. Assuming 60% recovery, this implies
that coal in situ totals about 167 billion tons -- over twice
Petrick's estimate of "mineable" coal in situ. I believe it
to be unlikely that another 80 billion tons of coal will be
found within the confines of South Africa. The Petrick
Commission repeatedly warns that while discoveries of new
coal continue to be made, the magnitude of these discoveries
is bound to be small compared with currently estimated resources.
Dutkiewicz's optimistic and speculative scenario is, there-
fore, of little practical use in expanding upon the Petrick
estimates.
Finally, the International Energy Agancy states that
"(w)ith present prices for coal in the international market,
the (IEA) Secretariat estimates that economically recoverable
coal reserves in South Africa could be as high as 55 billion
tons." 20 However, the IEA is comfortable with the Petrick
estimates, which they use in the only table on reserves in-
cluded in their report. We must assume that their 55 billion
tons reserve estimate is anticipating future developments.

FOOTNOTES
Section III:
1. Dutkiewicz, R.K,, "Energy, The Road Ahead," in The SouthAfrican Mechanical Engineer, Vol. 28, July 1978, p. 265.
2. US Bureau of Mines, Department of the Interior, Informa-tion Circular 8678, "The Resource Base of Coal for Under-ground Mining in the Western United States," 1975, p. 5.
3. Ibid, p. 6.
4. Zimmerman, Martin B., Draft report on US coal reservesto EPRI, 1/79, p. 8.
5. Ibid., p. 26.
6. Petrick Commission Report, op. cit.
7. Of course, it is much easier to be concise since theindustry is about one-seventh the size of the US industry(production basis).
8. Petrick Commission Report, Section 5.1.6.5.
9. Ibid, Table 5.3/1.
10. We do not consider anthracite in this study due to itsrelative lack of importance in South African production.
11. Ellis, S.P., and F.E. Kirstein, "A Review of Mining Methodsand Their Effects on the Reserves of Coal in SouthernAfrica," Paper 4-2, Energy Utilization Unit, University ofCape Town, 1977, p. 6.
12. Zimmerman, Draft Report, p. 11.
13. Petrick Commission Report, Section 5.5.8.2.
14. South African Mining and Engineering Journal, "OptimumColliery Takes Lead with Open Cast Restoration," Sept.1977, p. 26. 01. Petrick, Table 5.3/2. P. Burnton, R.E.,"The Road Ahead: Coal as a Source of Energy," 1820Settles National Foundation 1978 Conference, 1978, p. 14.
15. The strip and underground categories overlap. See Inter-national Energy Agency, Steam Coal Prospects to 2000,Paris 1978, p. 131.

16. The Petrick Commission presents a range of seam thick-nesses for the reserve thickness constraint ratherthan a single lower bound. This appearsat first tosuggest that the Commission, in judging whether toinclude a specific body of coal into reserves (extrac-table coal), may have adjusted for allowable seam thick-ness based on other cost-effecting factors. That is,a thick seam with otherwise poor characteristics (gasand water leakage, steep gradient, etc.) might beexcluded from reserves while a much thinner seam withno other negative conditions might be included. How-ever, since the commission states that its reserveestimates "are based on physical parameters to determineextractability, but do not allow for the direct use ofeconomic parameters...", it is clear that the range ofthickness, and indeed all other specifications, for themost part ignore economics. I conclude, therefore,that no economic adjustment of seam thickness tookplace.
17. See p. 30 for a discussion of cost-affecting factors other thanseam thickness.
18. Burnton, R.E., "The Road Ahead: Coal as a Source ofEnergy," 1820 Settlers National Monument Foundation 1978Conference, p. 13.
19. Dutkiewicz, p. 265.
20. International Energy Agency, Steam Coal Prospects to 2000,Paris 1978, p. 131.

Section IV: The Cost of Coal Depletion
in South Africa
One cause of increasing costs in mineral extraction
is the process of moving to less geologically and economi-
cally attractive seams as cumulative production increases.
This is especially true for coal in South Africa since, as
argued above, further substantial additions to known resources
are unlikely. Therefore, according to the theory of resource
economics, the priority of seams to be extracted can be con-
structed based upon observable cost-affecting geologic
conditions alone.
In this section we will address the process of depletion
in South African coal. To this end, we first examine the
method and results of a previous study of U.S. coal depletion
to provide a vocabulary and frame of reference for our dis-
cussion of South Africa.1 This method is a useful synthesis
of geology, economics, and statistics. It relates the margin-
al cost of extracting a ton of coal to the thickness of the
seam from which it is extracted, and to "non-observable"
geologic conditions. This approach includes the following
steps for underground mining:
1. Using data for Pike County, Kentucky, it is
established that the distribution of tons of coal in the

ground by seam thickness closely approximates lognormal. It is
assumed that the variance of this lJgnprmal distribution is
constant and, that it holds throughout the United States.
2. Using Bureau of Mines reserve data, which breaks
reserves into tons in seams 28 inches to 48 inches thick, and
tons in seams greater than 48 inches thick, a representative
(mean) thickness for each state is calculated. This is
possible due to the assumption of lognormality.
3. For underground mining, Bureau of Mines and other
data are used to statistically deprive:
a. Production per mining unit2 as a function of
seam thickness, number of producing units, and number of
openings to the mine. Zimmerman's equation for the United
States is:
v' log q = .7568 v, + 1.1071(logTH)/• - .2185(log s)/V +
(SE) (.4842) (.1205) (.0594)
(t-STAT.) (1.5630) (9.1906) (-3.6762)
+ .0283 (log OP)Vs
(.0655)(.4314)
s = number of mining units.
q = total output of the mine.

Th = thickness of the coal seam in feet.
OP = number of openings to the mine.
b. This leads to a relationship describing the
number of mining units required as a function of annual
production, seam thickness, and mine openings:
1.2796
-1.1071 02831566.579Th OP'
Q = annual production.
c. Total annual underground cost as a function of
number of mining units and mine openings:
TC = $1,743,222 + $2,122,480(s) + 1,085,771(OP)
$1,743,222 + 2,122,480[1.27961
1.66.579 1071 0 .02831566.579 OP
+ 1,805,771(0P)
d. Minimum efficient scale (annual production) of
a mine as a function of thickness and number of mine openings
(using "a" and "b" above):
Q* 1,743,222 + 1,085,771(OP) .7815 1567Th1.1071 OP.0283
593,445

e. Minimum average cost as a function of thickness
(assuming two openings):
AC* K
ThY E
Note that the constants,K and y are unique to the method
of mining used. For U.S. mines using continuous mining techni-
ques, K = 2567. y = 1.1071. E (this error term is a proxy
for less observable mining conditions) is assumed to be log-
normally distributed. This suggests that the representative
new mine seam thickness is the geometric mean of marginal mine
seam thicknesses. Ideally, a relationship for longwall and
conventional mining methods should also be derived and used to
compute costs for coals extractedbythose methods. In this
way, if reserves are defined by assuming a technology of
extraction, the proper constant can be readily used to compute
depletion costs.
For strip mining, the author (assuming a lognormal dis-
tribution of tons of coal in the ground by seam thickness
from Powder River and Illinois data) derives the following:
a. Maximum Usefulness Factor3 as a function of
overburden removed (RQ) and number of machines in use (N):
(eq.a)MUF = -.446684 + .612306(logRQ) + .506967(logN)
(SE) (2.31895) (.145663) (.229134)
(t-STAT) (-.192623) (4.20357) (2.21254)

b. Total annual costs as a function of MUF
and annual production. The value for MUF is substituted
into the following equation for total annyal costs of a
strip mine:
(eq.b) TC= 3,170,223 + 467,262(MUF) + .96Q
c. Average cost as a function of annual out-
put and overburden ratio:
(eq.c) AC= 3,170,223/Q + 467,262(MUF)/Q + .96
d. Since E is assumed to be lognormal, the
"best guess" for an average MUF is derived by solving for
MUF in equation (a) using the geometric mean of the ob-
served value of overburden removed (RQ) and a value of
one (the geometric mean) for e . This value of MUF
is substituted into equation (c), and the equation is
solved for Q*, the minimum efficient scale. At this
level of output, minimum average cost, AC , is reached.
The expression for the Powder River Basin is the following:
(eq.d) AC*= .52R 1.63317 + .96
e. Using the Bureau of Mines' data on reserves
and using the above relationships describing cost as a
function of thickness and tons of coal in the ground for
each seam thickness, the distribution of coal in the ground
according to cost of exploitation can be derived.
f. By specifying a cumulative output total,

64
this exploitation cost distribution can be solved, the upper
limit of which is the marginal cost for having mined that much
coal. These are the marginal costs that construct Zimmermaants
resource curves.
The South African Example
I have modified this method to accomodate the
data available for South Africa. A vertical seam cross
section is available for each mining district (an example is
presented in Figure 2), as are reserves by district (see
Table 5 for South African reserves). (Table 6 details
reserve specifications.) Using this information, the ratio
of a given (economically-exploitable) seam's thickness to
the sum of all the seam thicknesses in a mining district is
assumed to equal the share of that district's total reserves
which are contained in that seam. Since we have this tons
per seam information, we avoid having to assume that the
distribution of tons of coal in the ground by seam thickness
is lognormal (or perhaps some other distribution).
This analysis, as mentioned above, estimates depletion
exclusively for coal mined underground. The underground
technology which is assumed is continuous mining with room
and pillar extraction. Recall that Zimmerman assumes the
same method. He arrives at an equation that relates produc-
tivity per mining unit (see p. 60above) to seam thickness,
number of mining units, and number of openings to the mine.5

FIGRE 2
The South Rand Coalfield
In the triangle Heidelberg - Villiers -Deneysville lies the South RandCoalfield between the HighveldCoalfleld and the Old SpringfieldCoalfield.
Because of the great thicknessof the seams this field, althoughnot large in area, contains arelatively large tonnage of coal.
SuperflclDeposl
Tillite
Coal Amygdalod
Mudstono
Conglomerate
Dolerlteo
Pro-Karoo
CoalCoam Meters
99
42
22
14
587
T17
Main (Top)
Main (Middle)
Main (Bottom)
Sandstonej
Lilor I
Shale Gritt

The thickness coefficient in this log-form productivity
equation becomes the exponent of thickness in the minimum
average cost equation.
In South Africa, labor costs are much lower relative
to capital costs than U.S. labor costs are to U.S. capital
costs. This results in a widespread use of mining techniques
in South Africa which are less efficient and more labor-
intensive than continuous mining. However, assuming that
continuous mining is the technology of the underground margin-
al mine, the change in productivity arising from changes in
seam thickness will likely be very close in both the U.S. and
South Africa. Therefore, the coefficient of seam thickness
which Zimmerman derives for U.S. continuous mining is likely
to be a close approximation of the South African thickness
coefficient. Note from Table 7 that only four out of eight
new underground mines in South Africa will use continuous
mining. However, 78% of all new underground production will
com-efrom mines using continuous mining techniques. Further, as
I noted in Section 2, a committment exists to waste less coal
in mining. And in Section 5 on labor costs I point out that
the transition to more capital-intensive mining methods is
accelerating to counter rising labor costs. In addition, the
equipment used in South Africa for these capital-intensive
methods is, for the most part, identical to that used in the
United States. Therefore, the coefficient of seam thickness

in the minimum average cost equation for South Africa should
be very close to the U.S. coefficient of 1.1. I use this
value for the remainder of the analysis. Further, in this
exercise we assume that the variance of the error term,
which represents unobserved cost-effective conditions, is
the same in South Africa as it is in the U.S. This allows us
to examine, in an approximating way, the cost of depletion
in South Africa.
To supply the appropriate constant, K, for the South
African minimum available cost equation, we rely on cost
estimates of a "typical" mine suggested by the Energy Utiliza-
tion Unit of the University of Cape Town6 (see Table 10).
The room (bord) and pillar mine is 70 metres (233 feet) deep,
and the seam is five metres (16 feet) thick.7 The mine is
large with an annual output of three million tons. 8
The cost data for a "typical" mine which appears in
Table 10 allow us to compute the constant K, for both washed
and unwashed coal.
Considering the "bord and pillar" example, we compute
K using the following two steps:
1. Assume the industry is competitive. Therefore,
the price is the marginal cost adjusted for an "adequate"
return. 10

r-4Cld
*rI &O
*r-4
03F
b.0
O H0 :2
b0P4 rl*H *H
+l *HkF
r--
00UU
OC)tor
0
a)
a)0 0u L)
U)U)
4- 4
r--
,O.IJ..*-H 00
r-4Cid4-J 4-)1 0*u
on
'C o*H
a)..
U
a
4
U)
0
O
a)
0
CdvH 0
S)U
uOa)0
CI
a)©d
O4-1
0
V)
*H U
*O
*0o4 t
V)
S*0
"a)Hn 4-
4-J
La)
0 a)
U )
-4 0
v- ~4U*cI*HC/
t p c:t
(

2. We use the relationship:
Constant Kmarginal cost = Constant K or
Thicknessconstant(Y) Error Term (E)
(*) MC = K , (assuming E equals its mean value
Th of 1)
Therefore, MC • Th Y = K
But we have the marginal cost (R4.60 per ton), the
thickness (5 metres or 16.4 ft), and the coeffi-
cient of thickness (1.1).
Therefore:
1.1(R4.60) (16.4) = K
99.82 = K
For washed coal:
(R8.15) (16.4) 1 .1 = K
176.86 = K
To estimate the cost for a given seam, we simply sub-
stitute the appropriate thickness into equation (*). I did
this for each economically exploitable seam in South Africa.
The results appear in Figures 3 and 4. Tables 11 and 12 list
the name, tonnage, and cost of extraction for each seam and
the step on the resource curve in which the seam in included.
While the South African resource curves consist of
concrete steps, it is easy to imagine a "smoothed" version of

.1
Cu
O00
ow
aX
a ..
S 0 to 14% t to V O C
(uojL/ S9L6L) uolloPOJd 0o IS03 ISulBJUI
II r I | I I I
....i·
I.
IIe
o I,r
Bs
(i
L,
Ui
6.
?.
e
ot
'....•,m tI _ I _ . I I ,,, ! I :• -
-- A
0
c
0Co
0
0.0aE
C,,-
0-- ~ nil =- - - -- - i

I I I I I I- I I I I
04
-
c"1
I I 1 I I i I I(uo•i$ 8L60) UOljonpoJd 0o 90so0 leulBIJW
W
ooSUe
0oo ,
00
0I-.
_m
lou)
rO0m
iD
- -- --~ - - - ---- ~-r -·r L r ~ C- C
t,
I
cm9!% eil N fs 0% f4h f% 04 oif 04 I ̀
w
qm
YI

Table 11
High-Grade Coal Reserves by Seam
In South Africa
"Step" LabelMining District(s)
and Seam(s)
Witbank 2
Highveld 4
South Rand H2*
East Transvaal H2*Klipriver Top
Witbank 1
Highveld 2
Witbank 4
East Transvaal C (UP)
Utrecht Moss
East Transvaal H3*
East Transvaal At?" " B (UP)
Metric Tons
1,602
2,757
774
1,748
774
261
235
131131131
TOTAL
Cost
10.78
13.45
16.44
16.5216.84
17.06
19.31
22.02
25.68
27.18
32.82
55.0555.0555.05
118.25118.25118.25
8,923

Table 12
Low-Grade Coal Reserves by Seam
in South Africa
"Step" LabelMining District(s)
and Seam(s)
South Rand H1*OFS-Vierfontein BottomLimpopo BottomWitbank 2
Highveld 4
Vareeniging 2A
Vareeniging 2B
Varreniging 31' 1
East Transvall H2*South Rand H2*
Witbank 1
Klipriver Top
Highveld 2
Witbank 4
East Transvaal C(UP)
Utrecht Moss
Vareeniging 5
East Transvaal H3*South Rand H3*
East Transvaal A" "it B(UP)
1" B
Metric Tons
352236126156
3,316
236
216
197197
20233
201
2,103
117
119
108
91117
East Transvaal C" " D"i 't E
TOTAL
Cost
5.295.295.295.29
6.60
7.37
8.08
8.958.95
9.329.32
9.63
10.86
10.90
12.42
14.49
15.33
17.33
18.5318.53
31.0731.0731.07
66.6166.6166.61
8,663

each which would nicely approximate the shape of a classic
long-run supply curve. This becomes intuitive when we consider
that the depletion effect should hold for specific seams as
it does for all of South Africa. As a seam is exploited,
the cost of doing so will increase because of the progression
to thinner and otherwise less desirable parts of the seam.12
This seam depletion effect should in theory cause rising
marginal costs from the start of extraction. Therefore, the
"steps" should begin by sloping gently upward, then more
rapidly, in a manner similar to the entire resource curve.
Further smoothing would yield a continuous marginal cost (long-
run supply) curve.
It would be helpful to get a feeling for the magnitude
of increases in costs due to depletion that could occur to
the year 2000. To this end, I made the following assumptions:
(a) Future levels of production: Granville and
Venter argue that coal production in South Africa will increase
10% annually in the period 1977-1980, 5.7% in 1980-1987, and
133.5% in 1987-2000. (See Table 13.)
I use the Granville and Venter numbers because of
their proximity to the situation, and because the difference
in the magnitude of depletion costs arising from other studies
is insignificant.
(b) Smoothing of step functions: First, I calculate
the rate of cost increase per ton of coal available for each

Table 13
Depletion Cost Estimates
TotalaProduction
(MillionMetric
Year Tons)
1975
1976
1977
1978
1979
1980
1981
1982
1983
1984
1985
1986
1987
1988
1989
1990
1991
1992
1993
1994
1995
1996
1997
1998
1999
2000
TOTAL
78
87
93
102
113
124
131
139
146
155
164
173
183
189
196
203
210
217
225
233
241
249
258
267
276
286
4738
LowGrade
(MillionMetricTons)
45.24
50.46
53.94
59.16
65.54
71.92
85.15
09.35
"94.90
100.75
106.60
121.10
128.10
132.30
137.20
14.210
147.00
151.90
157.50
163.10
168.70
174.30
180.60
186.90
193.20
200.20
3208.21
DepletionCost
(US$1975)
.05
.12
.18
.26
.34
.43
.54
.66
.78
.95
.12
.26
.33
.35
.39
.42
.45
.49
.52
.56
.60
.64
.68
.73
.77
HighGrade
(MillionMetricTons)
32.76
36.54
39.06
42.84
47.46
52.08
45.85
48.65
51.10
54.25
57.40
51.90
54.90
56.70
58.80
60.90
63.00
65.10
67.50
69.90
72.30
74.70
77.40
80.10
82.80
85.80
1529.79
DepletionCost
(US$1975)
.05
.10
.17
.23
.30
.38
.45
.53
.61
.69
.78
.87
.96
1.05
1.15
1.25
1.35
1.46
1.57
1.69
1.81
1.95
2.08
2.23
2.38

step. I then apply an exponent, which represents the number
of tons of coal (high or low-grade) mined during the year of
interest, to the rate of increase per ton appropriate to the
given step. This yields an increment to depletion cost for
that year, which must be added to the sum of depletion
charges for previous years to yield current depletion charges.
Let us calculate the depletion charge of 304 for high-
grade coal in 1980. Notice that all depletion occurs on the
first step of the resource curve. (This first step contains
1,602,000,000 metric tons, while only 1,539,790,000 tons of
high grade coal is mined by 2000 under this production scenario.)
Cost increases from $10.78 to $13.45 over this step due to
depletion. The rate of cost increase for this step per
1000 tons mined is thus:
1
($13.45 1,602,000 = 1.000000138$10.78
Given the projected production of 52,080,000 metric tons of
high-grade coal in 1980, the increment to depletion charge
is thus computed:
a. (1.000000138)52080 = 1.0072
Apply this figure to the initial cost.

b. (1.0072)($10.78) - $10.78 = $.07
Add this to the cumulative depletion change for
1976-1979.
c. $0,23 + $.07 = $.30
= the depletion charge for 1980.
3. Proportion of coal that is washed:
About 48% of raw coal production is now washed. I
assume this proportion slips to 35% in 1981-1985, and 30%
in 1985-2000. Further, I assume all high-grade coal is
washed. These assumptions are supported by recent trends in
mining in South Africa. 14
The projections of depletion costs made under the above
assumptions appear in Table 13. These costs, (in $1975),reach
$1.77 and $2.38 in the year 2000 for low and high-grade coal,
respectively. Further, these costs (as is pointed out below) will
likely not exceed 4% of total selling price.
A Discussion of Complications:
Note that mining may occur at the same time for more
than one, or all, of the steps which make up Figures 3 and 4.
This does not violate the assumption of "cheapest seams first",
because factors other than seam thickness contribute to costs
of extraction. Thus, while seam "B" is thinner than seam "A",

gas or water or grade conditions may be unfavorable enough
in seam "A" to increase the cost of extraction to parity
with seam "B". An increase in demand could similarly bring
into production seams of varying thicknesses. Some mines
will earn large rents due to favorable conditions relative
to the marginal mine.
As we discovered above, however, marginal (new) mines
in South Africa produce from a wide range of seam thicknesses.
This suggests that ranking costs by seam thickness, and there-
fore establishing the national priority of seams to be ex-
tracted, is simplistic. We only know that within each mine
field the mining priority is established by seam thicknesses
(see Table 3(d)). In other words, the variation in cost-
effecting factors other than seam thickness is perceived by
the Petrick Commission to be insignificant. In addition,
we would like some measure of the variation in these factors
(the "E" in equation 3(e), p. 62 ) among the fields.
Evidence of a qualitative nature regarding the charac-
teristics of these factors among fields does exist. This
(admittedly circumstantial) evidence supports the resource
curves derived in this section as good first approximations
of the effect of depletion on costs. The following points
are relevant:
(1) Seam continuity among the major coal fields is
similar. Table 3(a) shows that the Highveld, South Rand,

Vareeniging, and Witbank coal fields, which hold 80% of all
raw extractable coal in South Africa, require more than 10
borkholes per 2000 hectores for inclusion of a seam in the
"proven" category. The fact that horizontal discontinuity
is of roughly the same magnitude for these fields suggests
that this cost-effecting factor is similar on average for
most of the coal in South Africa.15 Further, there is "a
correlation between seams of the Witbank-Middleburg field
with those of the Highveld and Vareeninging-Sasolburg coal-
fields. There is thus a remarkable continuity of coal seams
over large areas." 16
(2) The vertical cross-section of each field contained
in the Petrick Commission Report illustrates the similar
nature of strata overlying seams among coal fields.
These arguments are made to support the concept of seam
thickness as the major determinant of extraction cost among
coal fields. One can just as easily argue that, given the
data presented in Section 3 on marginal mines, seam thick-
ness alone gives an incomplete picture. This view was, in
fact, a primary thesis of Section 3 (See especially
Table 8). But it is clear that in light of widespread lateral
continuity in the coal seams and vertical similarity in types
of overlying strata, seam thickness takes on an even more
important role than would be expected under more variable
circumstances. I therefore rely on Figures 11 and 12,

80
which were derived from research done for this study, as adequate
first approximations of the cost of depletion in South African
coal.

FOOTNOTES
Section IV:
1. Zimmerman, Martin B., "Estimating a Policy Model of USCoal Supply," unpublished paper. 10/7/77. Also seeModelling Depletion in a Mineral Industry: The Case ofCoal," Bell Journal of Economics, Vol. 8, #1, Spring 1977.
2. A mining unit consists of a continuous mining machine,two shuttle cars, and a complement of miners.
3. Productivity for strip mines is defined as output perunit size of the dragline. The unit of "size" isdefined by Zimmerman to be the maximum usefulness factor(MUF), which is equal to the product of the capacity ofthe dragline bucket and the dumping "reach." (Horizontalreach within which a dragline can dig coal.)
4. I believe that the inclusion of strip-mineable coal wouldnot alter significantly the conclusions derived here re-garding depletion.
5. The number of mining units can be shown to be a functionof output of the mine, seam thickness, and number ofopenings to the mine. Openings are assumed to equal two --a result validated by the data. Therefore, with acoefficient of .0283, the"opening" term equals 1.0198.This is an insensitive term. Eight openings would yielda term equal to 1.06. Output is determined by a minimumefficient scale equation which is the offspring of a totalannual cost equation for U.S. underground mines using thecontinuous mining technique. Minimum efficient scale is,therefore, a function of seam thickness only. At thatefficient level of output, cost is minimized.
6. Ellis, S.P., and F.E. Kirstein, "A Review of Mining Methodsand Their Effects on the Reserves of Coal in SouthernAfrica," Energy Utilization Unit of the University of CapeTown, Paper 4.2, 1975.
7. Continuous miners cannot currently mine face heights muchover 10 feet on one pass. Recovery of coal in seams whichare thicker than 10 feet would likely result in decreasedproductivity per mining unit per shift due to the need forgreater roof support. This suggests a break from y = 1.1to a figure somewhat smaller. However, we assume here that

the y for this "typical" mine remains at 1.1, which allowsus to compute a constant for the marginal cost function.Given the likelihood of continuing technology improvementsin roof support systems, it is unlikely that this produc-tivity break, if it does indeed exist, will exist for long,or that it is significant in magnitude.
8. Washed coal is coal processed to reduce the ash and sulfurcontent. There are several technologies available to dothis. We refer to washed coal as "high-grade steamcoal."
9. These costs are quite close to those suggested by Smith,ibid.
10. The return varies among the three technologies. This islikely due to varying risk. To compute the return oncapital investment for room and pillar mining, we firstestimate the capital charge per ton. To do this we sub-tract the operating cost per ton (R2.50) from the price(R4.60) to yield the capital charge (R2.10). This charge,divided by the capital required (R24 million for unwashedcoal) yields the percent return on each dollar of capitalinvested (8.75% for bord and pillar unwashed; 13.93% forunwashed longwall 5.80% unwashed strip).
11. In the United States the usual maximum seam thicknessactually mined is 10-12 feet. The South Africa figuresof 16.4 feet for a typical mine appears, therefore, tobe somewhat generous. That is, will productivity increasewith thickness all the way to 16 feet? I am assuming thatwith the usual South African practice of leaving largepillars behind to support the roof, mining height canapproach 16 feet with accompanying productivity increases.If we assume the U.S. maximum of 12 feet, South Africancosts constants would equal 70.77 for unwashed, and125.39 for washed coal. Required price would be loweredby 299,in both cases for each step in the resource curve(See Figures 3 and 4, see also footnote 7 above.)
12. Capital aging should also cause the cost of extraction toincrease from the start. But this is a time-related cost,and is not reflected in the resource curve.
13. Granville and Venter, op.cit., p. 53.
14. Note the proportion of unwashed coal to be produced fromnew mines in Table 7.

83
15. Note that some Witbank and Highveld seams require 30boreholes instead of 10. The seams requiring such exten-sive verification hold, however, a small minority of thetotal reserves in these fields.
16. Petrick Report, op. cit., paragraph 4.3.3.

Section V: Labor and Capital Costs
It is clear from the previous discussion that costs
associated with depletion of coal resources will not reach
a magnitude in this century that would threaten the compe-
titive advantage of South African coal exports. This con-
clusion does not hold for labor and capital costs. In
this section I shall argue that both of these costs will
probably escalate in real terms at rates which may eliminate
South Africa as the world's lowest cost producer of coal.
The Petrick Commission provides a suitable introduction to
this discussion -- an introduction which once again under-
scores the interaction of the gold and coal mining industries:
Recent developments in Southern Africa have ledto a retardation in expansion in the unskilledlabour available to the' South African miningindustry: this has had a particularly severeeffect on the Republic's gold mining industrywhich obtained more than 70 per cent of itsunskilled labour from outside the Republic.
As a result of these developments the gold miningindustry has dramatically increased its wagesfor unskilled labourers and has intensified itsefforts to obtain a much greater proportion ofits unskilled labour forces from within theRepublic; this recruitment will take place incompetition with other employers -- includingthe coal industry.
The result could be soarihg labor costs for thecoal mining industry at a time when its capitalcosts are already increasing at an unprecedentedrate. Unless these cost increases are matchedby higher prices, they must lead to a reductionin the extractable reserves and to the shelving

of plans to increase the percentage extractionof in situ coal by the use of more costlymining methods and, indeed, to the opening upof new pits. 1
Labor Costs
South African labor statistics demonstrate eloquently
the extent to which segregation of races is institutionalized
in the South African socio-economic system. All statistics
are broken down into the categories of "White", "Bantu",
"Colored", and "Asiatics". Racial distinctions determine
economic stratification, as one may conclude from studying
Table 14 and Figure 5. But the magnitude of the differences
among racial groups appears to be diminishing. In 1975,
whites earned 9.4 times the real wage of blacks; the ratio
was 20.6 to 1 in 1965. (The rates slipped further in 1977
to 8:1.) This closing gap is reflected in the annual real
increase in wages from 1970 to 1975. White real wages
increased during 1970-1975 at a compound annual rate of 2.9%
-- down from 6.5% per year from 1965-1970. Black wages
shot up at 22.2 per cent per year in the 1970-75 period, up
from only 4.9% annually during 1965-1970. I should emphasize
that the difference between black and white wages remains
huge -- R572 (about $658) to R5375 ($6181). However, the
gap is narrowing -- if not out of a budding desire for social
equity, then out of a growing shortage of black labor. (See

Cl Cl
Cl C.4 .
NY N
NL.dUI 0
N~ Nc; 04
N; N
* Co-4,.
inSInNO N
o~ 0
S4Al C4
in .
N Cl 0% N
. 4 .4 .4 In
44 I I
N
I !
8N N
I I I *
I I I I
N N N N64 4 .
04 Cl 0 .
Cl040
O in a In T. 0 mC. L m N 0 o aF- 4004 0
4440
r% 0
o 4 In f 4 Cl 40 .4 6.4 04 40 .4 U
O0 6 0D OD Im IA N %P 40 IN N4 ~V4 04 r. ml Nl Cl Cl l Cl Cl Cl
In~i In N0 N4 Cl 0 0 0 0 Cl
LM 0 04 04 04 Cl kA Cl C 04 N
.4 'IV 0% In 0 0% 0 m% 0 N% w
N 4 64I0 0 0 0 % Cl I04 Nl 0 n I 0 0% 64 6 C04 Cl .4 . .4 .4
64 r4 N4 6D 0 In Cl n 0 Cl ClmN4 94 N 04 Nl N4 .M in f" m4 v04 Cl C N
N ( m a 61 NO %
4(4~ 64 0r. 4 In Clm % CC, 64 40 0% $% 0 0 P4 I Cl 64
Na In 64 Cl In c- to4' 0
%D I n In N4 i4 6 4 6
04 64 0 % C% 0- IN 04 0IW N No p No u
OD ý . % t f r 11 c gIn o OD 04 4 40 m 4 0N 40 Incr InI 0%, NV Cl 40 In
Cl ~$ Cl C l C l 0 4 0 4 6
40 64 In 64 0 40 4 4
0% NNO 64 ))O N %0N n
40 04 4 N( 40 40 N 40 N N
N N q' N NY 64 6 4~
04 0 N . Cl .40 r) ~ 04 0 4 4 4 0 0 4
04 0 ". I 64 .4 0%
64 I 64 0 . 64 64 n64N N N 64 N l N O
44. 4 .4 . . . . 4 4 .4 .
1 0
w > >41 4
U)
a 8o
3 -ccr 0
pqm
0 P
`4
0
41'00
U
H .o

0* 0
O
Lt)
b-.
·en
= ,*H
c0.,-4
•~r
LiO
r-
I-
0o 4-0 P-Oe 4- c
>aI) oG '-
0= •
) *O
,-
ed
Ln
H-C--II C•C. .-
o H
orl0
bG a;
bd 1
Vo
,r-i
4,-
-)U)r'
uc,
0U;-4
co
u
Oc/3
en

below) Since nearly 90% of the mining labor force is Black,
the rapid percentage increase in total wages was a real
11.5% per year from 1970 to 1975. Table 15 displays the
behavior of nominal wages among groups from 1973-1977.2
In 1977, the white South African miner
earned $12,305 on average ($1977). His Black counterpart
earned $1490 -- about one eighth the white wage. Coloreds --
those people of mixed Black/white ancestry -- earned $8803,3
while "Asiatics" averaged $4065 per person in 1977.
This difference among mine workers, and especially
the large premium paid white workers over other groups,
reflects two realities: First, "management" in South Africa
is synonymous with "white", and mine managers are better
paid than miners the world over. 4 Second, white miners
who perform the same tasks as Black (or other) miners, are
paid more. This advantage is true for wages and benefits.
Table 16 lists categories of labor charges which are
applicable to., white and Black miners in a typical gold
mine. 5 Given the close bonds between gold and coal mining
industries, and their competition for both Black and white
labor, these categories are probably identical or very similar
for coal mines. 6
A growing political sophistication and job frustra-
tion resulted in "widespread mine rioting" in 1974 and 1975.7

89
Cý LO C)Ln 4 0 r CD,o ý 10 rý rd rý u4 I ýI I
00e t m %r0co t a LO-t -M e allcOMMnb HN\0 CD o- ()\0O \0
r--4 C) Itt 00 m -l - r4r
\mem0 Nr)lr) 0MbbCN eMase vmm
ctcn mtIt =" I o C) r- -ý nC) fI4r) n\CO C) n) N.
LnN CDor- i ý Ln
\0 N) \CO0C0N 00CCrno h ON)0N NON
r- CO -d()N. \. "NCN. 0 N.ow \0 N.
00 U) Ot U) rIC13 d 13 E
01 a: 0 a): 0O k.U O kU O0
a)~0c: a ) .Z~4:c a)N.HC*U N.U. *U MNN* ~ t b*H Oc ~·led OM b*QAHU< 04+04 QAa~9= m:: 9= a m:
0O r-l_
**l iOa
U d
V1C) c'o cm
tn*wom03Nm***** MrNNM
q 0M0 \0~~ Co 0\v-N) rI Co ~-
L) 0) N. 00\0 LO) \0to tn n
C-4 V ) td)'-I
1-: r- N-4 ) -:I
V,00tnI -
C)l 00 Co N)Vý r rl
)N.Nmo vs
N. N.re ms.mm a lr
MemNH CCTrlr scNman .
uU)
$-40
0 ocb
U a
O) 4)C, O
Va) co.H HU 0
U )
000. 4 0tcn
ua 0 Po*H .
U+J 0>U Hz 00a) Ha
r< Ua
Cd
.,I> > CI CC
U 0Ucd d cr
$-,
U)
V) r-4M) a r--a) bit 0
*H 4JrdCaf
cada)
coa I
.001
(--i
actCUOa ba)P a>- 0 *-
CaM
V)1 On \0c r-4CO -4 N. \cL) \0 tn b -I
N)
m comC14 r-4 r--
LntI) C:) 0 00
oc \ o co C
LO r-4M~ r-ý 00
0 - c U)tA ( *A
HU)U)<0a), r40 c+-) U ý *-HMN.IC 0 M)
O
OI
0',N)
N)
\0a
Ca
HU)a)
NO.*
SUa:i
cda0O= =
U)
a):
odOv,
0U)
mU)
U
CO4uze
I I

90
TABLE 16
White versus Black Benefits
White Labor Charges
1-Wages and salaries
2-Cost of living allowance
3-Holiday leave pay & allowance,sick & accident leave and exgratia payments
4-Red Cross fees & bonusesfor possessing first-aidcertificate
5-Transport & otherallowances
6-Housing allowance and/orsubsidy
7-Providence Fund: MinersDeath Benefit Fund
8-Providence Fund: contri-butions
9-Retiring gratuities
10-Unemployment Benefit Fund
11-Accident insurance
12-Government Miners TrainingSchool
13-Refund of class fees &learners subscriptions
14-Welfare, education &recreational facilities
15-Pension Fund - mine officials
16-Pension Fund - mine employees
17-Pension Fund - additionalbenefits
18-Death Benefit Fund - mineofficials
19-Death Benefit Fund - mineemployees
in Gold Mines
Black Labor Charges
1-Wages and Overtime
2-First-aid bonuses
3-Pass fees: Mozambique &tropical areas
4-Black employees recruitingexpenses
5-Black employees accidentinsurance
6-Other charges: gratuities,welfare, education &recreation
Source: Storrar, C.D.,South African Mine Valua-tion, Chamber of Mines ofSouth Africa, Johannesburg1977, p. 136-137.

A result has been not only higher wages but large expendi-
tures on housing, sanitization and kitchen facilities at
some mine sites. These advances are still thought to be
unsatisfactory by the more militant Black miners, who would
support the formation of now-illegal Black unions.
The legalization of Black unions is probably not far
off. As one South African economist claims, legal restric-
tions on Black labor unions will be
...in a matter of time, so completely obsolete as tocall for really fundamental adjustment to economicreality.8
The head of Anglo-American Corporation's Gold & Uranium
Division, when asked whether his firm would allow "a resem-
blance of a Black trade union on industrial mines" replied:
We certainly would...I must say...that we don'tconsider it our business to bring trade unionsinto existence. Nowhere in the world doesmanagement do that. It must rise spontaneouslyfrom the men. But if men come to us, with agood constitution, sound, and appear to havethe support of a great number of workers, ofcourse we would start talking to them.9
The president of the Chamber of Mines of South Africa
portrays the economic necessity of change in mining labor
practices in remarks to the 1978 Annual General Meeting:
Many restrictive (labor) practices had theirorigins in the depressed economic conditionsbetween the two world wars which were accompaniedby an oversupply of White labour. In the future,however, the demand for skilled and semi-skilledlabour will go well beyond the projected supply...It is clear that cost escalation in the absence of

progressive relaxation of the restrictions onthe more productive employment of labour canonly lead to the destruction of the miningindustry. Yet it is on mining that the countryabsolutely depends for the economic thrust onwhich solutions to the country's problems, 10political as well as economic, ultimately depend.(Emphasis added.)
An important move toward eventual wage parity among
races and legalization of Black trade unions is likely to
come from the Recommendations of the Wiehan Commission,
which "will be presented to Parliament soon. Ill The Wiehan
Commission was appointed by the Minister for Labor and Mines,
S.P. Botha, to critique the national policy of the "'reservation
system', by which certain jobs can be reserved for whites."
The backing of a state ministry provides political legitimi-
zation of the Commission's conclusions, and therefore gives
official recognition and approval of recent trends toward
wage parity and equal job opportunity. This development
cannot help but sustain the momentum of the wage increases
of recent years. One can only conclude that the enormous
difference between Black and white wages and benefits will
continue to shrink rapidly. Thus, the wage charge per ton
of coal mined will continue to skyrocket.
The transition to this era of equal Black participa-
tion and renumeration will be accompanied by growing white
labor unrest in the mines. In March, 1979, the white mine
workers went on strike to protest the recommendations of the

93
Wiehan Commission. White miners oppose the elimination of
the practice of reserving for white miners only the right
to "handle explosives, ventilation, and hoist-shaft opera-
tion." 1 2 It is logical to assume that whites will protest
for increased wages and benefits to counter this loss of
exclusivity should the Wiehan recommendations be made law
as is generally expected. The structural change now occurring
in mining labor may therefore be a costly change indeed.
To combat increasing labor costs, producers will
continue their attempts to increase productivity by using
more capital-intensive mining methods, including strip-
mining, continuous mining with pillar extraction, and long-
wall techniques. One better realizes the boost in producti-
vity which could theoretically result in light of the
following understatement:
In 1977 only 13 collieries out of 68 (total inSouth Africa) employed hand-loading techniques,producing about 8,500,000 saleable tons, repre-senting 10% of total sales. 1 3 [Emphasis added.]
"Only" indeed! Clearly, as Black miners command higher
wages hand-loading will become an impossibly expensive
method.
A major increase in productivity is expected from
the expansion of strip mining methods. In 1977, 15% of
tons produced were extracted by strip methods, up from a
negligible amount in 1963. Judging by the number of new

94
strip mines opening in the near future (See Section 2 and
Table 7 ), the proportion of strip mined production could
exceed one-third by 1990. But the productivity increase
will not be of a magnitude one might expect under the geolo-
gical and political conditions of, say, the United States.
The overburden in South Africa is, in general, extremely
rocky and difficult to blast. In addition, the availability
of stripping equipment and the financing for equipment
purchases may be constrained by political events -- including
further economic sanctions. Nonetheless, a steady rise in
productivity from 1966-1976 is indicated in Table 17.
The average output per employee (miners, management,
and others) has been steadily increasing in this period --
from 710 tons per employee per year in 1966, to 1080 in
1976, an increase of 4.3% per year. Crude though this measure
is, the improvement is persuasive.
However, the 3.7% annual increase in gross productivity
per employee during 1970-1976 was accompanied by a 6.8%
annual increase in labor costs per employee. These rough
measures suggest that increased productivity due to the
adoption of more capital-intensive mining techniques is not
keeping pace with labor costS.
In addition, an increase in the use of strip mining
methods to compensate for increasing labor costs will
accelerate increases in costs due to depletion. As rising

LO
C)O
U >0S)0
LO 00 0: 00 r- V LO 4 r ma). \O0 a) 0) m~ C0 -4 LA nN- LA NO ~ LA Id LA) N- 00t~ C) 0 O 00 N- 00 LO tn00 \0 LA -I-9:4
C C C 0 0 0 0 0 0 0 00 0 000 ~ ~4 0 N- C- 0 N
0 0 0 0 0 00a 00~ M ~-4 '~
r-"4 C-i LAqt 00 c--C) LO 00
0-4 C -t- N- N-
o * a ~OC 0 \I-' \ - \
- N-N e D
-t N-
1 a - -
LA 10 r-4 q
Ln V r-tn LO
N- N-
4-J.d4-)UJ
a)
0
P0) OY) LA \Z0
00 t~ 0) V'l
0 O LA LA
0 C) 00 N-
N- \0 \D NC a- C 11r-- r 4 r-4 r-
rc-o
C) H
Q) tf14 000MOdOkQ O
HM
iOO
cdOr
ONd
> 1.
0U
op -CISO
4-J c.H4-)
o\•
o\o\oo
o" o\o'
N- 00 a N- °
tn 1 -Zr' 4
r-4
e,-I
U>0,00 0
0 0'o
;2:
cl00 V)
U 4- 0
1 00O ýE- I
o\o00 0) 0 D 0
0 00 C -
r,-

wages encourage the move to strip mining, the focus of mining
activity will shift to the shallower seams which are reachable
by strip technology. As the pace of extraction from these
seams quickens, increases in costs due to depletion will also
accelerate. These depletion cost increases thus mitigate the
cost-effectiveness of strip mining techniques.
Capital Costs
It is realistic to expect that South Africa willcontinue to be exposed in the year ahead to inter-national hostility, reflected in a continued de-cline in the availability of foreign capital,mounting pressure for economic sanctions and supportfor terrorist activity.14
Fear of foreign capital sanctions pervades South African
literature. These fears are especially intense regarding the
mineral extraction industries. As we have noted, the coal
industry is rapidly increasing the capital-intensity of its
operations. Political constraints on capital would, therefore,
hit the coal mining sector hard in a critical period of rapid
expansion of production. Industry officials claim that
"...if the capital is not found, our indigenous energy re-
sources may cease to be a natural asset." 15 Further, South
Africa "can only remain relatively independent of external
energy resources if (South Africa) continues to temain reason-
ably independent of external capital supplies." 16 This latter
point suggests that South Africa places a national security
premium on native supply of financing and equipment -- that South

97
Africa will tolerate the higher cost of sustaining the coal
industry with indigenous capital to the degree made necessary
by foreign capital sanctions.
Forecastsaf capital cost increases are, unfortunately,
not available in South African literature. Therefore, for
the purposes of our discussion on future South African coal
export costs, I use three scenarios based either on- forecasts
of U.S. capital cost increase in the coal mining sector, or on
"naive" projections of capital costs based on reasonable
guesses concerning future capital constraints. These scenarios
are presented in Table 18.
The low-cost scenario uses the U.S. real machinery
cost increase projections of Data Resources Incorporated
through 1990.17 These annual cost increases hover at around
2%. Scenarios 2 and 3, the medium and high cost scenarios,
project annual cost increases of 5% and 10% respectively.
It is my opinion that a 5% real yearly increase is not
unlikely given trends in international public opinion re-
garding sales and financing to South African enterprises.
It seems likely that negative global attitudes toward
apartheid will push cost increases beyond possible rates of
U.S. machinery cost increases reflected in Scenario 1.
The high cost scenario is pure speculation and is presented
to depict the general magnitude of cost increases that might
occur with the advent of severe capital sanctions. The

98
TABLE 18
Projection of Real Capital Costs Per
Ton of Coal Mined in South Africa:
1975 - 2000
Scenario 1: Low-Cost Case
Cost Per TonLow Grade
$2.42
2.46
2.50
2.51
2.53
2.55
2.57
2.61
2.65
2.70
2.76
2.82
2.88
2.94
3.01
3.08
Cost Per TonHigh Grade
$7.477.58
7.70
7.74
7.79
7.84
7.91
8.03
8.17
8.33
8.50
8.68
8.86
9.05
9.26
9.48
% Real Increase
1.5a
1.5
1.6
0.5
0.7
0.6
0.9
1.5
1.7
2.0
2.1
2.1
2.1
2.2
2.3
2.4
(Continued)
a, Estimated by the author. Values for 1976 to 1990 fromDRI, Coal Review, Nov., 1978, p. 6. (Using "TRENDLONG"implicit flight deflator assumptions supplied by DRI).
Year
1975
1976
1977
1978
1979
1980
1981
1982
1983
1984
1985
1986
1987
1988
1989
1990

99
TABLE 18: Continued
Scenario 2: Medium Cost Case(5% Real Increase Per Year)
Year Low Grade High Grade
1975 $2.42 $7.471976 2.54 7.84
1977 2.66 8.24
1978 2.80 8.65
1979 2.94 9.08
1980 3.08 9.53
1981 3.24 10.01
1982 3.40 10.51
1983 3.57 11.04
1984 3.75 11.59
1985 3.93 12.17
1986 4.13 12.78
1987 4.34 13.42
1988 4.55 14.09
1989 4.78 14.79
1990 5.02 15.53
(Continued)

100
TABLE 18 : Continued
Scenario
(10% Real
Year
1975
1976
1977
1978
1979
1980
1981
1982
1983
1984
1985
1986
1987
1988
1989
1990
3: High Cost Case
Increase Per Year)
Low Grade
$2.422.66
2.92
3.21
3.54
3.89
4.28
4.71
5.18
5.69
6.26
6.89
7.58
8.34
9.17
10.09
High Grade
$7.478.22
9.04
9.94
10.94
12.03
13.23
14.56
16.01
17.61
19.38
21.31
23.44
25.79
28.37
31.20

101
implications for coal exports of the numbers present in
Table 18 will be made clear in Section 7.

102
FOOTNOTES
Section 5
1. Petrick Commission Report, op. cit., paragraph 5.1.6.19.
2. Department of Mines, Republic of South Africa, MiningStatistics, various years.
3. Note that "coloured" wages more than doubled in 1977over 1976.
4. This exclusivity is changing. See below.
5. Sturrar, C.D., South African Mine Valuation, Chamberof Mines of South Africa , Johannesburg, 1977, p. 136-137.
6. Section 2 above points out the interrelatedness of goldand coal mining.
7. Journal of South African Mining, "Report Gives New Insighton the Black Miner": An Analysis of the "Moodie Report".
8. Botha, J.J., "An Economic Boycott of South Africa," SouthAfrican Journal of Economics, Vol. 46, No. 3, 9/78, p. 27.
9. Journal of South African Mining, Ibid.
10. Chamber of Mines of South Africa, Presidential Addressby L.W.P. van den Bosch, 88th Annual General Meeting(of the Chamber), 6/27/78, pp. 8-9.
11. Business Week, "Pretoria's Turn Toward More LiberalRacial Policies, 4/23/79, p. 65.
12. Ibid.
13. Granville and Venter, op. cit., p. 53.
14. Van den Bosch, op. cit., p. 12. (See footnote 10 above)
15. Smith, Jan H., op. cit., p. 348.
16. Ibid.
17. Data Resources, Inc., Coal Review, Nov., 1978, p. 6.

103
Section 6: Transportation
We are interested in estimating trends in the costs
of rail transport to Richards Bay, and of ocean transport to
foreign ports. We use Western Europe as the destination
for illustrative purposes. With these estimations of
transport (and transport-related) costs, we will have com-
piled the cost estimates necessary to examine export price
scenarios in the next section.
Rail
Rail cost estimates range between 1.5* and 2.54 per
ton-mile.1 A rough average of the trip length is 150 miles;
this leads to an estimate of $2.25 to $3.75 per ton each
trip to Richards Bay (about the same to Durban Bay).
Opinions regarding the trend of these costs vary.
The IEA suggests that, due to favorable terrain and current
satisfactory capacity, "rail transport costs from major
producing regions to export harbours are to remain constant
in real terms through the year 2000..."2 This projection
takes into consideration "Phase Three" of the national
export "plan", which calls for exports increasing from 20
million tons per annum in 1980 to over 40 million in 1985.
(See Section 7 on Exports.)
Not all observers agree with this assessment. R.L.

104'
Cohen, of Anglo-American Corporation, believes the third
phase "involves substantially higher costs for both mines
and infrastructure." 3 Another observer adds that "(the)
capacity of the rail line between the Transvaal Coal fields
and Richards Bay is one of the crucial factors governing the
amount of coal which can be exported."4 He quotes a
Richards Bay official as saying that "the line could probably
handle at least 20 million tons per year." 5 However, since
Cohen is not specific, and because the ICT information is
more than two years old, I use the IEA assessment of "no
real increases through the year 2000" as my assumption in
the rough projections used in the next section.
Ports
The opening of Richards Bay harbor in 1976 was motivated
by the signing of a low-ash metallurgical coal export con-
tract with Japan by the TCOA.6 The harbor, which is about
100 miles north of Durban Bay, the old export port on the
Natal coast of the Indian Ocean, is running close to capacity
at 12 million tons per year. By 1980 the capacity will
reach 20 million tons.
It is unclear whether the third stage of export expan-
sion will be accomplished by expanding Richards Bay once
more, or by opening "otherpossible port sites on the Indian

105
Ocean..." 7 The ease with which Richards Bay is being brought
to its capacity of 20 million tons per year suggests that,
ceteris parabus, these new port developments will present
few obstructions to reaching a capacity 40 million tons per
year. As we have seen, however, coal exports are essentially
"a matter of policy";8 this policy will not, however, be
constrained by any difficulties regarding port expansion.
In order to adequately consider future export prices,
we need to estimate the costs per ton associated with an
increase in the port capacity to, say, 40 million metric
tons by the mid-80's. The costs of building the first stage
of export capacity at Richards Bay was $42.6 million ($1975)
for 12.6 million tons capacity 9 -- equal to $3.55 per-
annual ton. Using this figure, and assuming (a) 20 million
tons of capacity is added in 1985, (b) all funds were raised
by 5 or 10 years debt at either 10% or 15% per year, and
(c) yearly payments are equal in nominal dollars, then the
following matrix of cost per ton for the port capacity
additions for 1985 in 1975 dollars is derived:
Port Capacity Cost Per Ton ($1975)
10% 15%
5 years 0.97 1.40
10 years 0.58 0.87

106
To arrive at real annual costs for the period 1985-1990,
these annual charges must be discounted at the appropriated
interest rate. This is done in computing the desired price
for exports in the next section.
Shipping
Ocean freight charges present more formidable predictive
challenges. I assume for the limited purpose of this report,
that real per ton freight rates remain constant at $12.00
through 1990. More importantly, I assume that the spread
between coal freight costs to Western Europe from South
Africa and the United States remains constant. This latter
assumption is both more crucial and reasonable than
the constant real cost assumption. Unless shipping sanctions
are imposed on South Africa, they should pay a rate per ton-
mile which approximates the charge to U.S. exporters.

107
FOOTNOTES
Section 6
1. Conversation with Alex Sargent, MIT Energy Lab, 2/2/79.
2. IEA, Steam Coal: Prospects to 2000..., op. cit., p. 132.
3. Cohen, R.L., Coal Division, Anglo American Corporationof South Africa, Limited, Letter to Prof. C.L. Wilson,MIT, 5/8/78, p. 2.
4. International Coal Trade, U.S. Bureau of Mines, vol. 45,no. 11, 11/76, p. 23.
5. Ibid.
6. Horsfall, D.W., "Coking Coal: South Africa's Needs andResources Reviewed," in South Africa Mining and EngineeringJournal, 1/78, p.51.
7. IEA, Steam Coal: Prospects to 2000, op. cit. p. 134.
8. Ibid.
9. International Coal Trade, U. S. Bureau of Mines, (Report onSouth African exports and Richards Bay) vol. 45, no. 11,11/76.

108
Section VII: The Potential for South African
Coal Exports
Government control over the price of domestically-
consumed coal makes South African mining companies eager to
sell coal for export. During 1977, the average price of
bituminous coal exports was $23.83 per metric ton, up from
$9.10 in 1970. The same type of coal sold for consumption
within South Africa at $8.71 per ton in 1977, up from $1.98
in 1970.1 But opposition to expansion of exports beyond
the 20 million ton level increases as the government's
perception of political and economic isolation becomes more
critical and realistic. Nonetheless, expansion to 45, or
perhaps 50 million metric tons of exports by the mid-1980's
is likely. Commitment beyond this amount has not been made
by either government or mining industry officials. The
General Manager of Coal Operations for the General Mining
and Finance Corporation -- the largest producer of coal in
South Africa -- states that
"...(South Africa) expects to maintain this(45-50 million ton per year) rate of expor-tation until the first decade of the twenty-first century.2
A representative of the second largest producer of coal,
the Anglo-American Corporation of South Africa, Ltd., concurs:

109
..... it would appear that a figure of 40-50MTPA from RSA is reasonable (to the year2000). To increase above this figure couldgive concern in some governmental areasregarding the future availability of coalfor RSA needs. 3
Regarding metallurgical coal exports, the International
Energy Agency suggests:
It is clear that no more exports of blendcoking coal will be allowed apart from thecurrent contract with Japan. 4
Judging from these sentiments, the national mood is not
consistent with the ambitious suggestion by the IEA, men-
tioned in the Introduction, that South Africa may "play the
dominant role in the emerging steam coal market through the
early 1990's."5
The caution which characterizes South Africa's projec-
tions of future coal exports reflects, as we have seen, not
only external political realities, but also the likelihood
of rapidly-rising real costs of production. I have constructed
three sets of projections of possible real production costs
for high grade export coal based on the conclusions of sec-
tions 4 through 6. The low cost case assumes operating cost
increases in real terms of 10% per year, and capital cost
increases of about 2% annually.6 The medium, or "most-
likely", case assumes 10% and 5%, respectively. (Also see
Table 20). The high cost case presumes annual increases in
operating and capital costs of 15% and 10%. Depletion costs
in all three cases are based on production levels forecast
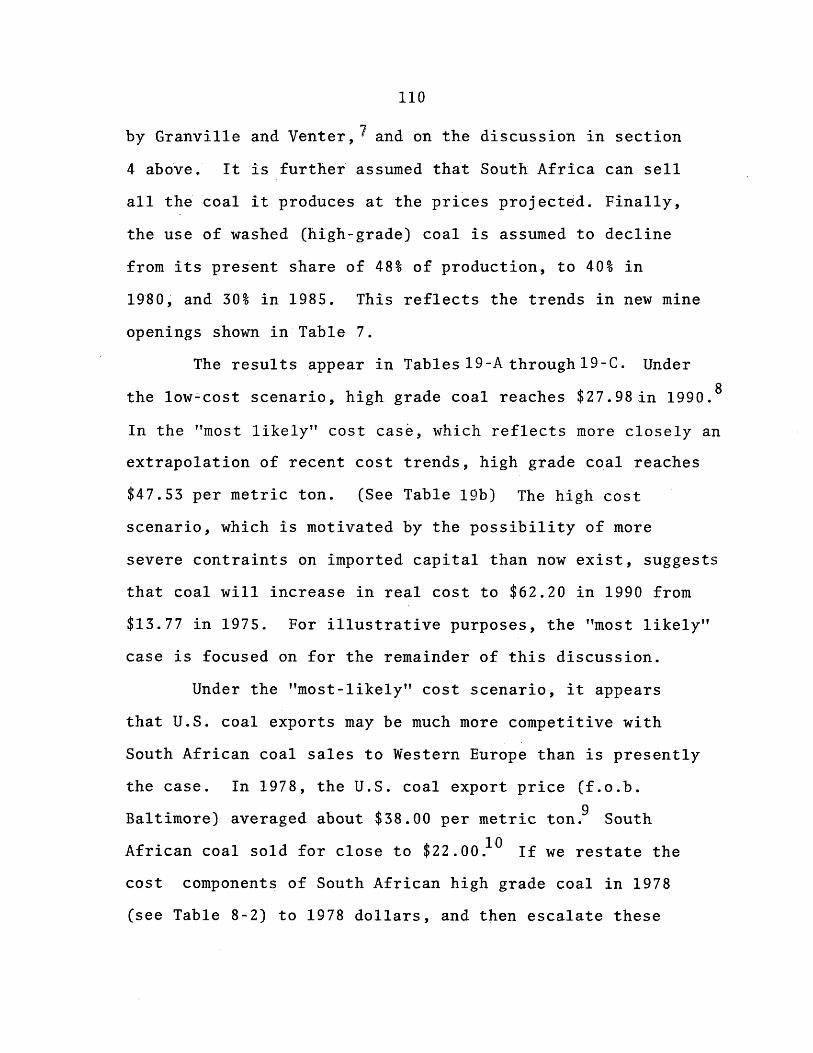
110
by Granville and Venter, 7 and on the discussion in section
4 above, It is further assumed that South Africa can sell
all the coal it produces at the prices projected. Finally,
the use of washed (high-grade) coal is assumed to decline
from its present share of 48% of production, to 40% in
1980, and 30% in 1985. This reflects the trends in new mine
openings shown in Table 7.
The results appear in Tables19-A through19-C. Under
the low-cost scenario, high grade coal reaches $27.98 in 1990.8
In the "most likely" cost case, which reflects more closely an
extrapolation of recent cost trends, high grade coal reaches
$47.53 per metric ton. (See Table 19b) The high cost
scenario, which is motivated by the possibility of more
severe contraints on imported capital than now exist, suggests
that coal will increase in real cost to $62.20 in 1990 from
$13.77 in 1975. For illustrative purposes, the "most likely"
case is focused on for the remainder of this discussion.
Under the "most-likely" cost scenario, it appears
that U.S. coal exports may be much more competitive with
South African coal sales to Western Europe than is presently
the case. In 1978, the U.S. coal export price (f.o.b.
Baltimore) averaged about $38.00 per metric ton.9 South
African coal sold for close to $22.00.10 If we restate the
cost components of South African high grade coal in 1978
(see Table 8-2) to 1978 dollars, and then escalate these

111
TABLE 19A
Low Cost Scenario for High Grade Coal: 1975-1990
($1975 per metric ton)
Assumption of Annual Real Cost Increases:
Operating: 10% per yearCapital: 2% per yearDepletion: See Text, Section 4Transport: Constant to 1983, then add
charge for port expansion.(See p. ).
MinimumDesired
Operating Capital Depletion Transport Price(f.o.b.)Year Cost Cost Cost Cost Port, RSA)
1975 $3.30 $7.47 - $3.00 $13.77
1976 3.63 7.62 .05 3.00 14.30
1977 3.99 7.77 .10 3.00 14.56
1978 4.39 7.93 .17 3.00 15.49
1979 4.83 8.09 .23 3.00 16.15
1980 5.31 8.25 .30 3.00 16.86
1981 5.85 8.41 .38 3.00 17.64
1982 6.43 8.58 .45 3.00 18.46
1983 7.07 8.75 .53 3.97 20.32
1984 7.78 8.93 .61 3.88 21.20
1985 8.56 9.11 .69 3.80 22.16
1986 9.42 9.29 .78 3.73 23.22
1987 10.36 9.47 .87 3.66 24.36
1988 11.39 9.66 .96 3.00 25.01
1989 12.53 9.86 1.05 3.00 26.44
1990 13.78 10.05 1.15 3.00 27.98

112
TABLE 19B
"Most Likely" Cost Scenario for High Grade Coal: 1975-1990
($1975 per metric ton)
Assumption of Annual Real Cost Increases:
Operating: 15% per yearCapital: 5% per yearDepletion:Transport:
See text, section 4Constant to 1983, thenadd a charge for portexpansion (see p. )
OperatingYear Cost
1975
1976
1977
1978
1979
1980
1981
1982
1983
1984
1985
1986
1987
1988
1989
$3.30
3.80
4.36
5.02
5.77
6.64
7.63
8.78
10.09
11.61
13.35
15.35
17.66
20.20
23.35
CapitalCost
$7.47
7.84
8.24
8.65
9.08
9.53
10.01
10.51
11.04
11.59
12.17
12.78
13.42
14.09
14.79
DepletionCost
$.05.10
.17
.23
.30
.38
.45
.53
.61
.69
.78
.87
.96
1.05
TransportCost
$3.00
3.00
3.00
3.00
3.00
3.00
3.00
3.00
3.97
3.88
3.80
3.73
3.66
4.00
4.00
15.53 1.15 4.00
MinimumDesiredPrice(f.o.b.)Port, RSA)
$13.7714.69
15.70
16.84
18.08
19.47
21.02
22.74
25.63
27.69
30.01
32.64
35.61
39.35
43.19
47.531990 26.85

113
TABLE 19C
High Cost Scenario for High Grade Coal: 1975-1990
($1975 per metric ton)
Assumption of Annual Real Cost Increases:
Operating: 15% per yearCapital: 10% per yearDepletion: See text, section 4Transport: Constant to 1983, then add
a charge for port expansion(See p.105)
OperatingYear Cost
1975
1976
1977
1978
1979
1980
1981
1982
1983
1984
1985
1986
1987
1988
1989
1990
$3.30
3.80
4.36
5.02
5.77
6.64
7.63
8.78
10.09
11.61
13.35
15.35
17.66
20.30
23.35
26.85
CapitalCost
$7.478.22
9.04
9.94
10.94
12.03
13.23
14.56
16.01
17.61
19.38
21.31
23.44
25.79
28.37
31.20
DepletionCost
$.05.10
.17
.23
.30
.38
.45
.53
.61
.69
.78
.87
.96
1.05
1,15
TransportCost
$3.00
3.00
3.00
3.00
3.00
3.00
3.00
3.00
3.97
3.88
3.80
3.73
3.66
3.00
3.00
3.00
MinimumDesiredPrice(f.o.b.Port, RSA)
$13.7715.07
16.50
18.13
19.94
21.97
24.24
26.79
30.60
33.71
37.22
41.17
45.63
50.05
55.77
62.20

114
components at 15% per year for operating costs, and 5% for
capital costs, we reach a desired price per ton in 1990 of
$63.32 in 1978 dollars.11 Assuming that the current shipping
costs per ton from the U.S. and South African to Western
Europe stay constant in real terms at their present levels
of $8 and $12 respectively, then the U.S. f.o.b. price could
rise to $67.32 ($1978) and command the same delivered price
as will South African coals in Western Europe in 1990 under
the "most likely" scenario -- that is, $75.32 ($63.32 + $12).
This implies that U.S. coal could increase in price from
its current $38.00 at a real 4.9% per year to reach $67 in
1990 with South African coal in Western Europe.
The 4.9% estimate of the annual real increase in
costs of U.S. coal through 1990 is high relative to cost
increases projected elsewhere. Data Resource forecasts a
nominal increase of 10.4% per year through 1990 under their
"control" forecast.12 This "control" forecast assumes yearly
nominal cost increases of 9.1% for transporation, 4.8% for
scrubbing, 7.1% for mining machinery, 7.8% for wages, about
1% annual decline in productivity, and a 10% rate of return
to arrive at its yearly overall increase in costs of 10.4%.
Adjusting for DRI's inflation estimates, the real annual
cost increase reaches its lowest level in 1980 at 3.9%,
then gradually increases to 5.7% by 1990. Applying the DRI
real cost:increases to the current U.S. export price, f.o.b.,

115
TABLE 20
DRI Real Cost Increase Forecast
"Control" Scenario
Nominal CostIncrease
10.4%
"I
I?
t,
,I
,!
,1
'I
t,
,!
,1
I?"
"
Implicit PriceDeflation
5.5%
6.6
6.4
6.5
6.2
5.6
5.4
5.1
5.0
5.0
5.0
4.9
4.8
4.7
Real CostIncrease
4.9%
3.8
4.0
3.9
4.2
4.8
5.0
5.3
5.4
5.4
5.4
5.5
5.6
5.7
1977
1978
1979
1980
1981
1982
1983
1984
1985
1986
1987
1988
1989
1990

116
Baltimore, of $38.00, a 1990 f.o.b., Baltimore price of
$68.36 is calculated. This is about $1.00 above the price
of $67.32 at which U.S. coal would compete on an equal cost
basis with South African coal under the "most likely" case
presented above. Based on this evidence, it is concluded
that the great price advantage which South African export
coal currently enjoys in deliveries to Western Europe would
be nearly eliminated under the reasonable cost increase
assumptions presented in this section.

117
FOOTNOTES
Chapter 7
1. Department of Mines of South Africa, Mining Statistics,1970 and 1977, Table 12.
2. Ellis, S.P., General Manager, Coal Division, GeneralMining and Finance Corporation Limited, Letter to theauthor, 9/26/78.
3. Cohen, R.L., Anglo American Corporation of South AfricaLimited, Letter to Professor C.L. Wilson, 5/8/78, p. 2.
4. IEA Coal Research, Published Plans and Projections forCoal Production, Trade and Consumption, by Hugh M. Lee,12/1977, p. 57.
5. IEA, Steam Coal Prospects..., op. cit., p. 134.
6. Data Resources Incorporated forecasts annual nominalincreases of 7.1% in mining machinery costs throughthe year 1990. Applying the implicit price deflatorin Table 20 , which is also DRI's forecast, real machin-ery cost increases can be computed. They range between0.5% and 2.4%, with the more rapid real increase occur-ing at the end of the period. I chose the 2% realincrease for South Africa to approximate the increasesexpected by DRI in the U.S. Given fears of capitalsanctions and the generally riskier environment in SouthAfrica, it seems that this 2% estimate reflects areasonable lower bound. See Data Resources, Inc., CoalReview, Nov. 1978, p. 6.
7. Granville and Venter, op. cit., p. 53.
8. High grade coal is the coal exported from South Africa.Little low grade coal leaves the country.
9. See, for example, Coal Week, Vol. 6, No. 15, 4/9/79,p. 6.
10. Ibid.
11. The general consumer price index for 1975 (1970 = 100)was 156.7, for 1976 = 174.1, 1977 = 193.8, 1978 = 213.2(1978 derived by assuming a 10% inflation rate in 1978).
12. DRI, (See footnote (6)), Ibid.

118
Section VIII: Conclusion
The aim of this paper has been to describe and
analyze the South African coal industry in an economic, geo-
logical and political framework. A broader purpose was to
explore some of the obstacles an expanded world coal export
industry will face in the remainder of this century. It is
clear that political isolation and rapid changes in the
structure of the South African work force will greatly
diminish the present export advantage enjoyed by South Africa
during the next decade.
The implications regarding competitive positions for
other coal exporters, including the United States, are clear.
Elimination of South Africa as lowest cost major coal expor-
ter will improve the relative competitiveness of other
producers. However, the extent of the absolute increase in
export coal production is uncertain. It is therefore impossible
to estimate at this time the impact of the conclusions
presented in this study on the future volume of world coal
trade. This study has demonstrated, however, that the
future export levels of a major producer will be profoundly
affected by national politics. It is suggested that
observers of the coal industry proceed cautiously, therefore,
in their attempts to estimate global growth in coal trade.
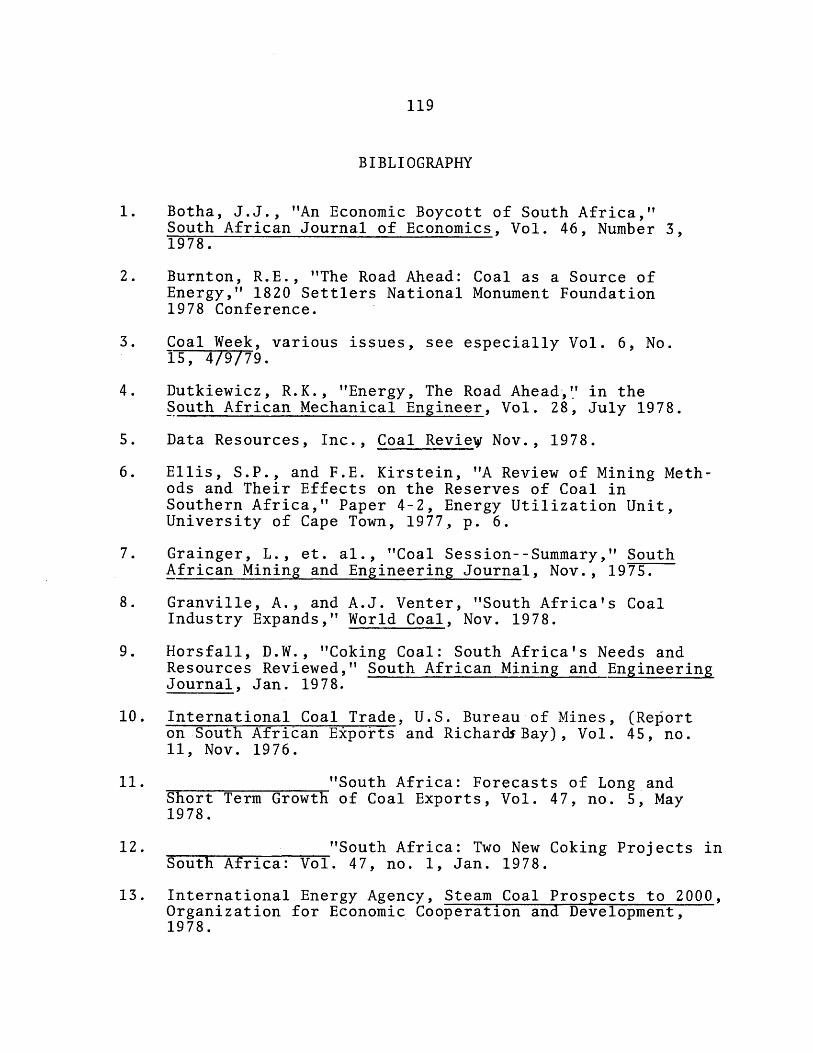
119
BIBLIOGRAPHY
1. Botha, J.J., "An Economic Boycott of South Africa,"South African Journal of Economics, Vol. 46, Number 3,1978.
2. Burnton, R.E., "The Road Ahead: Coal as a Source ofEnergy," 1820 Settlers National Monument Foundation1978 Conference.
3. Coal Week, various issues, see especially Vol. 6, No.15, 4/9/79.
4. Dutkiewicz, R.K., "Energy, The Road Ahead," in theSouth African Mechanical Engineer, Vol. 28, July 1978.
5. Data Resources, Inc., Coal Review Nov., 1978.
6. Ellis, S.P., and F.E. Kirstein, "A Review of Mining Meth-ods and Their Effects on the Reserves of Coal inSouthern Africa," Paper 4-2, Energy Utilization Unit,University of Cape Town, 1977, p. 6.
7. Grainger, L., et. al., "Coal Session--Summary," SouthAfrican Mining and Engineering Journal, Nov., 1975.
8. Granville, A., and A.J. Venter, "South Africa's CoalIndustry Expands," World Coal, Nov. 1978.
9. Horsfall, D.W., "Coking Coal: South Africa's Needs andResources Reviewed," South African Mining and EngineeringJournal, Jan. 1978.
10. International Coal Trade, U.S. Bureau of Mines, (Reporton South African Exports and RichardrBay), Vol. 45, no.11, Nov. 1976.
11. "South Africa: Forecasts of Long andShort Term Growth of Coal Exports, Vol. 47, no. 5, May1978.
12. "South Africa: Two New Coking Projects inSouth Africa: Vol. 47, no. 1, Jan. 1978.
13. International Energy Agency, Steam Coal Prospects to 2000,Organization for Economic Cooperation and Development,1978.

120
Bibliography continued:
14. International Energy Agency Coal Research, PublishedPlans and Projections for Coal Production, Trade andConsumption, by Hugh M. Lee, December, 1977.
15. Journal of South African Mining, "Report Gives New Insighton the Black Miner," (An Analysis of the Moodie Report).
16. Republic of South Africa, Department of Mines, Reportof the Commission of Inquiry into the Coal Resourcesof the Republic of South Africa, (The Petrick CommissionReport), 1975.
17. ,Mining Statistics, 1976 and 1977.
18. Sealey, A.A., "South Africa's Depleting Quality Coal:How to Save the Best Reserves," South African Miningand Engineering Journal, December, 1977, p. 27.
19. Smith, Jan H., "The South African Energy Situation,"The South African Mechanical Engineer,Vol. 25, Nov.1975, p. 348.
20. South African Mining and Engineering Journal,"CoalNeed for Power Supply to Quadruple in 25 Years,"April, 1977, pp54 -57 .
21. ,"Longwall Fulfills its Promise," July, 1977,pp 19-27.
22. , "Looking at the Energy Picture," Jan. 1977,PP55-59.
23. , "Major Export Coal Mines Will Deliver FiveMillion Tons a Year," May, 1978, p. 66.
24. , "Optimum Colliery Takes Lead with Open CastRestoration,: Sept., 1977, p. 26 ff.
25. _, "Solving Preparation Problems for SouthAfrican Coal,", Nov 1977, p 63 ff.
26. Sturrar, C.D., South African Mine Valuation, Chamberof Mines of South Africa, Johannesburg, 1977, p. 136-137. (This is a study which focuses mainly on gold mines).

121
Bibliography continued:
27. To the Point, (A South African news magazine), "Energy:Starting to Break the Chains," Jan. 26, 1979, pp.8-11.
28. van den Bosch, L.W.P., President of the Chamber of Minesof South Africa, "Presidential Address", 88th AnnualGeneral Meeting of the Chamber of Mines, June 27, 1978,see labor discussion on pages 7-9,especially.
29. Zimmerman, Martin B., Draft report on U.S. coal reservesprepared for the Electric Power Research Institute,Jan. 1979.
30. , Modelling Depletion in a Mineral Industry: TheCase of Coal," Bell Journal of Economics, Vol. 8, no. 1,Spring, 1977.
31. , "Estimating a Policy Model of U.S. CoalSupply," unpublished paper, Oct. 7, 1977.