Migration and Human Development in India
90
Human Development Research Paper 2009/13 Migration and Human Development in India Priya Deshingkar˚ and Shaheen Akter
-
Upload
independent -
Category
Documents
-
view
2 -
download
0
Transcript of Migration and Human Development in India

Human DevelopmentResearch Paper
2009/13Migration and
Human Developmentin India
Priya Deshingkar and Shaheen Akter

United Nations Development ProgrammeHuman Development ReportsResearch Paper
April 2009
Human DevelopmentResearch Paper
2009/13Migration and
Human Developmentin India
Priya Deshingkar and Shaheen Akter

United Nations Development ProgrammeHuman Development Reports
Research Paper 2009/13April 2009
Migration and Human Developmentin India
Priya Deshingkar and Shaheen Akter
Priya Deshingkar is Research Fellow at the Overseas Development Institute, London.E-mail: [email protected].
Shaheen Akter is Researcher Assistant at the Overseas Development Institute, London.E-mail: [email protected].
Comments should be addressed by email to the author(s).
Abstract
The paper discusses how gaps in both the data on migration and the understanding of the role ofmigration in livelihood strategies and economic growth in India, have led to inaccurate policyprescriptions and a lack of political commitment to improving the living and working conditionsof migrants. Field evidence from major migrant employing sectors is synthesised to show thatcircular migration is the dominant form of economic mobility for the poor; especially the lowercastes and tribes. The authors argue that the human costs of migration are high due to faultyimplementation of protective legislation and loopholes in the law and not due to migration per se.The paper discusses child labour in specific migration streams in detail stressing that this issueneeds to be addressed in parallel. It also highlights the non-economic drivers and outcomes ofmigration that need to be considered when understanding its impacts. The authors calculate thatthere are roughly 100 million circular migrants in India contributing 10% to the national GDP.New vulnerabilities created by the economic recession are discussed. Detailed analysis ofvillage resurveys in Madhya Pradesh and Andhra Pradesh are also presented and these showconclusively that migration is an important route out of poverty.
Keywords: India; circular migration; caste; tribe; child labour; human development.
The Human Development Research Paper (HDRP) Series is a medium for sharing recentresearch commissioned to inform the global Human Development Report, which is publishedannually, and further research in the field of human development. The HDRP Series is a quick-disseminating, informal publication whose titles could subsequently be revised for publication asarticles in professional journals or chapters in books. The authors include leading academics andpractitioners from around the world, as well as UNDP researchers. The findings, interpretationsand conclusions are strictly those of the authors and do not necessarily represent the views ofUNDP or United Nations Member States. Moreover, the data may not be consistent with thatpresented in Human Development Reports.

1
1. Background and Introduction
Migration in India is not new and historical accounts show that people have moved in search of
work, in response to environmental shocks and stresses, to escape religious persecution and
political conflict. However improved communications, transport networks, conflicts over natural
resources and new economic opportunities have created unprecedented levels of mobility. But as
we discuss in following sections, the increase in mobility is not fully captured in larger surveys
often leading to erroneous conclusions about mobility levels in India.
Although significant in recent years, growth has been unequal in India (Balisacan and Ducanes
2005), characterised by industry in developed states such as Gujarat, Maharashtra and Punjab
drawing labour from agriculturally backward and poor regions such as eastern Uttar Pradesh,
Bihar, southern Madhya Pradesh, western Orissa and southern Rajasthan. High productivity
agricultural areas (“green revolution areas”) continue to be important destinations, but rural-
urban migration is the fastest growing type of migration as more migrants choose to work in
better paying non-farm occupations in urban areas and industrial zones. Delhi and the states of
Gujarat and Maharashtra are top destinations for inter-state migrant labour. Labour mobility has
grown and will probably continue to grow once the economy recovers from the current crisis.
Migrant labour makes enormous contributions to the Indian economy through major sectors such
as construction, textiles, small industries, brick-making, stone quarries, mines, fish and prawn
processing and hospitality services. But migrants remain on the periphery of society, with few
citizen rights and no political voice in shaping decisions that impact their lives (Kabeer 2005).
Unlike countries in Southeast Asia and East Asia, the bulk of the migrant workforce in India has
little or no education (Srivastava 2003). In fact migrants are poorly endowed all-round: they
come from poor families where access to physical, financial and human capital is limited and
where prospects for improving living standards are constrained by their inferior social and
political status. Historically disadvantaged communities such as the Scheduled Castes, Scheduled
Tribes1 and Other Backward Castes are heavily represented in migration. Poor migrants are
1 These groups accounted for more than 250 million people in India in 2001 (167 million SCs, 86 millions STs and other minorities). Official statistics show that SCs and STs are more deprived than other social groups. At the all India level, poverty among STs was about two times higher than non SC/STs, the poverty gap ratio being 2.10 and 1.7 times higher among SCs compared to non SC/ST groups. But there were variations across states. The disparity

absorbed in informal sector jobs, much maligned for being insecure, poorly paid and
unproductive but offering the only option for labourers to improve their capabilities.
2. Structure of the paper
The paper begins with a brief critique of official statistics, discussing their major shortcomings.
This is followed by detailed accounts of the different sectors and subsectors employing migrant
workers with case studies showing how migrants are recruited and the conditions in which they
work and live. This is followed by an assessment of the magnitude of migration and the
contribution of migrant labour to the Indian economy. The third part of the paper focuses on the
human development impacts of internal migration using secondary as well as primary data
collected from Andhra Pradesh and Madhya Pradesh in 2001/2, 2003/4 and 2006/7. The analysis
addresses questions related to poverty reduction and political participation. The paper ends with
policy recommendations to provide more support to migrants, reform policy and improve data.
3. Official estimates of migration
The two main sources of data on migration are the National Census and the National Sample
Survey (NSS) and most estimates of migration are based on these.
The total population of India at the last Census was over a billion. According to the National
Census for 2001 30% of the population or 307 million were migrants. Of these, nearly a third
had migrated during the previous decade. It is topical to note at the outset that both the National
Census and the National Sample Survey (NSS) use definitions of migration that are not
employment related. These are change in birthplace and change in last usual place of residence.
Secondly they give only the main reason for migration and thus miss secondary reasons which
are often work related particularly in the case of women, third they count migrant stocks and not
flows which are actually more important for policy and finally, they seriously underestimate
between SCs and nonSC/ST groups was particularly high in Punjab, Haryana, and Rajasthan with poverty disparity ratios of 5.31, 3.98, and 3.72 respectively. Thus, poverty among the SCs was about five times higher in Punjab, about four times higher in Haryana, and about two and half times higher in Rajasthan than the rest of the nonSC/ST population (Thorat and Mahamallik 2005).

3
categories of work that employ migrant workers. The findings of the Census and NSS on
migration must be viewed against this backdrop.
Other patterns revealed by the census were:
• There were 65.4 million female migrants and 32.8 million male migrants. However a
majority (42.4 million) of female migrants had not migrated for work and had cited
marriage as the main reason for the change in residence. Among males the most
important reason for migration was ‘Work/Employment’ given b y 12.3 million male
migrants.
• Rural to rural migration still dominated and accounted for 53.3 million; Rural to urban
migration: 20.5 million Urban to rural migration: 6.2 million and Urban to urban
migration: 14.3 million.
• Interstate migration has grown by 53.6%. The total number of interstate migrants was
42.3 million. Uttar Pradesh (-2.6 million) and Bihar (-1.7 million) were the two states
with the largest net outmigration.
The 55th round of NSS of 1999-00 was the first to cover short-duration migration defined as:
“persons staying away from usual place of residence for 60 days or more for employment or
better employment or in search of employment”. It estimates that roughly 1% of the Indian
population or 10 million people migrated temporarily (NSSO 2001). But this is also a gross
underestimate because the data do not properly count part-time occupations and short term
migrations. The true figure probably lies at around 100 million as we argue later.
In sum, there are six major shortcomings of official data:
• They tend to underestimate short term movements and thus underestimate or miss altogether,
seasonal and circular migration which, according to recent village studies account for the
bulk of migratory movements for work.

• Women’s migration is not adequately captured because the surveys ask for only one reason
for migration to be stated. This is usually stated as marriage and the secondary reason i.e.
finding work at the destination may not be mentioned.
• They do not capture migration streams that are illegal or border on illegality i.e. trafficking
for work and various forms of child labour. The census of India reported 12.66 million
working children but estimates by agencies working against child labour such as The Global
March and the International Center on Child Labor and Education (ICCLE) calculate that
there are roughly 25-30 million child workers in India (ITUC 2007) and Human Rights
Watch says that more than 100 million could be working because so many are out of
education. Smaller studies and NGO assessments (some of which are reviewed later) show
that child migrants form a large part of the workforce in several major sectors such as
construction, brick-kilns, small industries, domestic work and farm work.
• They do not count properly rural-rural circulatory migrants who work on commercial farms
and plantations or rural-urban migrants who migrate for a few months at a time to work in
very small industries.
• They do not capture adequately the movement of scheduled caste and scheduled tribe people
mainly because these groups are engaged in short term migration and this is not measured
properly in the surveys for the reasons stated above. There are numerous case studies which
show high mobility levels among these groups.
• They mis-represent the relationship between poverty and migration. While village studies
show high levels of migration amongst the poor (not the poorest), official statistics show that
migration is higher among better off groups because they cover mainly permanent migration
which has a higher representation of people from more affluent and better educated
backgrounds.
Much of the quantitative evidence in the Indian literature on migration is drawn from these
datasets and so inevitably exhibits a number of shortcomings. For example Dubey et al (2006)
argue on the basis of their analysis of the 1999-2000 round of the NSS that individuals from
scheduled castes and scheduled tribes and those with little or no education are less likely to
migrate to urban areas. Kundu and Sarangi (2007) compare migrant and non-migrant populations

5
to argue that the probability of being poor among migrants (both urban-urban and rural-urban
including seasonal migrants) is lower than among non-migrants.
4. Major Migrant Employing Sectors
The Magnitude and Economic Contribution of Migration and the Characteristics of
Migration Streams in these Sectors
A search through published and grey literature on migration shows that there is large number of
studies which portray a very different picture of migration. They show that circular migration is
the main form of mobility for work and that such migration is higher among the poor and
especially SCs and STs . They also show higher rates of migration among women and children.
All three sectors of the Indian economy namely agriculture, industry and services employ very
large numbers of migrant workers. Field evidence shows that the major subsectors using migrant
labour are textiles, construction, stone quarries and mines, brick-kilns, small scale industry
(diamond cutting, leather accessories etc), crop transplanting and harvesting, sugarcane cutting,
plantations, rickshaw pulling, food processing including fish and prawn processing, salt panning,
domestic work, security services, sex work, small hotels and roadside restaurants/tea shops and
street vending. We piece together available information on the numbers of workers involved and
their contribution to the economy. There are gaps in the information and we have not been able
to cover all sectors but we can convey the significance of migration to India’s economy. Some of
the sectors are strongly associated with specific migration streams (e.g. migration from western
Orissa for brick kiln work in Andhra Pradesh and migration from Bihar for agricultural work in
Punjab) which have differing recruitment and remuneration patterns and varying impacts on
human development. A small number are discussed here to provide insights into the recruitment
practices of companies and agents and how they circumvent the legal system to extract cheap
labour in return for few obligations to migrant labourers and their families. The earnings and
human development impacts of these migration streams are discussed wherever evidence has
been available. These accounts also show that distinctions between migration, trafficking,
bonded labour and child labour are often difficult to make because of the widespread use of child
labour in agriculture, industry and services and the poor working conditions of migrants. The

next part pulls together all the available evidence to analyse the implications of migration for
human development and how policy distortions and implementation failures can be addressed.
5. Industry
5.1 Construction
The construction industry provides direct employment to at least 30 million workers in India
(Chen 2007) but recent expansions (before the economic crisis) had resulted in a higher number:
trade Unions estimate that there were roughly 40 million migrant construction workers in India
in 2008 (Sarde 2008). Although numbers will have gone down with the recent economic crisis
there will nevertheless be a continuation of urban construction which will attract migrant
workers. There is anecdotal evidence that some categories of returnee migrants from the Gulf
have been absorbed in construction2. Construction attracts both skilled workers (masons,
carpenters) and unskilled workers and although there is some scope for upward mobility, poorer
and lower caste/tribe migrants tend to remain in low-paid unskilled jobs. This is because of
discrimination against them and being excluded from opportunities to gain skills. Women work
mainly as unskilled workers.
Migration for construction work has brought economic gains and freedom for many but has also
brought incredible hardship and personal risk. Many analysts have concluded that it is coping at
best and does not result in any long term accumulation for the poor (Reddy 1990, Srivastava
2003, Sundari 2005). However the situation has changed in some locations recently as migrants
have acquired more confidence and knowledge of the labour market and have begun to negotiate
jobs by themselves without depending on agents and contractors. This has led to faster
improvements in living standards (for Madhya Pradesh see Deshingkar et al 2008).
As the discussion below shows, the failure to properly implement labour laws has resulted in
heavy costs of such migration especially because of the deterioration in living conditions, the
inability to educate children and access health or subsidised food schemes. Two major streams of
2 Andhra absorbs many Gulf returnees in construction sector, Thaindian News, August 24th, 2008. Available at http://www.thaindian.com/newsportal/uncategorized/andhra-absorbs-many-gulf-returnees-in-construction-sector_10087940.html

7
migration involving construction workers are discussed below; one involving tribals from
southern Madhya Pradesh and the other involving scheduled caste workers from a drought-prone
district in the southern state of Andhra Pradesh.
Tribal areas of southern Madhya Pradesh
Tribal and forested areas of Madhya Pradesh have been identified among the 15 pockets of
chronic poverty in India (Shah 2007). Migration is an important livelihood activity and research
by Mosse et al (1997) in the tribal districts of southern Madhya Pradesh covered under the DFID
funded Western India Rainfed Farming Project revealed that 65 per cent of households included
migrants who worked mainly in the construction sector. The incidence of migration was clearly
growing in the area as a few years later another study in the same area found that in many
villages up to three-quarters of the population were absent between November and June (Virgo et
al, 2003).
Madhya Pradesh has ranked among the least developed states in India. It has the largest
population of Scheduled Tribes of all states and a high proportion of Scheduled
Castes. Landlessness, nominal and unproductive landholdings and the inability to invest in
farming continue to characterize the tribal population of the state. Migration has long been a
livelihood strategy for tribals from the southern districts. Many migrate to the neighbouring
states of Maharashtra and Gujarat.
Until about 2005 the recruitment of migrant construction workers from this area was largely
done by agents locally known as mukkaddams. Mukkaddams provide the labourers a cash
advance to help the family left behind in the absence of the migrant. The advance is also used by
the migrant to purchase essentials for the journey. The advances are repaid through migrant
wages and the length of time that this takes depends on the payment that the migrant receives at
the destination. The mukkaddam recruits migrants in groups who stay together at the destination.
Mukkaddams take care of other needs as well including small health expenses, travel expenses,
shelter and communication with the family in the village. Mukkaddams are almost never
registered with the government although they are required to do so under the Inter-state Migrant
Workmen Act (ISMWA) of 1979. The Act makes it mandatory for contractors to register

themselves and their workers and provide them with decent accommodation, crèche facilities,
access to health care and minimum wages. Activists and researchers of labour laws3 say that it is
extremely difficult to prosecute agents from one state in another state. They feel that that the
ISMWA in its current form is non-implementable.
Migrants work long hours in harsh conditions; injuries are common and there is inadequate
medical assistance or compensation (Mosse et al 2002). Water, fuel, sanitation and security are
major problems. A study by DISHA, an NGO in Gujarat found that over half the migrants slept
in the open and the rest had very perfunctory accommodation. They face harassment, abuse,
theft, forcible eviction or the demolition of their dwellings by urban authorities or police. The
sexual exploitation of women by masons, contractors, the police and others is routine but
unreported by women for fear of the consequences (loss of employment, violence). Children are
even more vulnerable to such abuse. Although unions have taken up the cause of such migrants,
many do not register with unions because of their continuously changing work destinations.
Mahbubnagar in Andhra Pradesh
The poor, drought prone district of Mahbubnagar in the Telangana region of Andhra Pradesh is
well known all over India for its construction workers. Andhra Pradesh (AP) is the poorest
southern State in India and ranks lowest among south Indian States on human development
indicators as well as growth and per capita income. The origins of rural labour migration for
manual work in Andhra Pradesh can be traced back to the pre-Independence era. Rural labourers
were mobilized for executing major public works in both rural and urban areas such as irrigation
projects and public buildings.
Migration has been an important way of coping with drought in Mahabubnagar which has huge
tracts of unirrigated land with only a single cropping season (Deb et al 2002). The Village Level
Studies (VLS) conducted by ICRISAT (International Crop Research Institute for Semi-Arid
Tropics) over the last three decades in two villages of Mahbubnagar district in Andhra Pradesh
3 Pers.comm. Vipul Pandya of Disha in Ahmedabad; Ashok Khandelwal, legal expert on labour laws and Action Aid staff in Hyderabad.

9
show that both seasonal and permanent migration have increased during the reference period
(Deb et al 2002). A majority of construction workers from this district are SCs (Samal 2006).
The situation here is similar to that found in southern MP: workers are recruited by contractors
and agents (mestries) who are hired by construction companies to find labourers. The companies
pay the agent and not the workers and underpayment of workers is common. In early 2008, a
group of workers interviewed by Deshingkar during the course of research for the DFID funded
Andhra Pradesh Rural Livelihoods Project, showed that they were receiving the equivalent of Rs
1200 per month in cash and food even though the mestris were being given Rs 150 per worker
per day (Rs 4500 per month). Mestris recruit workers against an advance of Rs 20-25000 and
this lump sum is used to repay older debts. Underpayment traps the workers in a continuous
cycle of debt. There is a strong power relationship between the worker and the agent: Olsen and
Ramanamurthy (2000) show the variety of insidious ways in which migrant construction workers
are exploited by mestries ranging from trapping them in bonded labour by paying less than
subsistence level, extracting overtime and child labour and using caste based and patriarchal
modes of oppression to maintain exploitative labour relations. The workers are aware of the
exploitation but do not migrate independently because they do not have the information to find
work regularly and the risks are too great. And sadly, workers believe that the mestries will help
them during times of difficulty because of the feudal history of the region and their faith in
patron-client relationships.
Living conditions at construction sites are appalling and mestris provide only the most basic
shelter. Drinking water and sanitation are not easily accessible and girls and children left are
highly vulnerable to disease, injuries and sexual abuse. Harassment by the police, urban
authorities and contractors is common. Additionally migrants do not have access to propoor
schemes such as subsidised food, health care and schooling and must pay for everything
themselves. Here too unionisation of workers has been difficult and violation of labour laws is
widespread with the result that migrants are underpaid and excluded from urban services.
These are not isolated examples and similar conditions have been noted elsewhere in the
construction industry in India. One study of 800 migrants in urban areas of Tamil Nadu notes
``Among the mothers who take their child to the workplace, 62 per cent have breastfed their

children with supervisors shouting at them''4. On the whole, construction workers do not have
access to social security5, compensation for injuries, access to drinking water or healthcare. India
has the world’s highest accident rate among construction workers - a recent ILO study shows
that 165 out of every 1000 workers are injured on the job (quoted in Sarde 2008).
5.2 Brick kilns
Closely linked to the construction industry is the brick kiln industry which also employs large
numbers of low caste and tribal circular migrants. There are 50,000 brick kilns all over India,
employing, on an average, 100 workers6 (ILO 2005). Brick-kiln workers often migrate with their
wives and children and if women are counted as well, the number of brick kiln workers in India
is at least 10 million. Recruiting is done through an agent who gives the family in the village a
wage advance of Rs 15-20,000. This is a substantial lump sum and is wrongly perceived by the
workers and their families as a cheap loan because there is not interest. The money has to be paid
back through work and the wages paid are well below the legal minimum effectively making the
arrangement a kind of debt-bondage. The entire family comprising the husband, wife and
children live on the site and work as one unit for the full season. The overall situation is
exploitative as everything necessary to manage daily needs is sold by the employers and agents
(at higher rates than the market) on credit and subsequently deducted from actual wages. Each
couple earns between Rs 70-130 a day and many are cheated out of their full payment. They
spend heavily on country liquor and usually come home with a saving of not more than Rs.1000-
2000 at the end of the season. Some are perpetually in debt and migrate again the following year
so that they can get a lump sum to repay outstanding debts.
This kind of migration appears to be the domain of the poorest migrants. Two streams of brick
kiln workers are discussed here: the migration of tribals from Western Orrisa and the migration
of musahars in Bihar. While both involve inter-state migrants they differ in the level of
representation that they have received from supportive civil society organisations.
4 The study was conducted by TN-Forces (Tamil Nadu Forum for Creche and Childcare Services); the quote is from an interview with a Ms Bhuvaneshwari a TN-Forces staff member involved in the study, published in The Hindu `Migrant woman labourers facing economic disparity' 30 April 2002. 5 The newly passed Social Security for Unorganised Sector Workers bill may provide some benefits but how effective the implementation will be remains to be seen. 6 This figure includes only those male workers who are on the muster rolls of the employers
11
Migration from Western Orissa
Western Orissa has long been a major source area for migrants because of its highly unequal land
distribution, high levels of poverty among landless and marginal farmers and low levels of
human capital, industrialisation, urbanisation and diversification into non-farm occupations
combined with poor governance. It suffers from multiple social, political and economic
disadvantages leaving the poor with few local options for making a living.
ActionAid estimates that nearly 200,000 people migrate from Western Orissa to brick kilns
surrounding major cities of Andhra Pradesh (ActionAid, 2005). Research conducted under the
DFID-funded Western Orissa Rural Livelihoods Project (WORLP) in Nuapada and Bolangir
shows a dominance of STs and SCs in migration streams from these poor districts (Panda 2005).
The poorest and the richest as well as the upper castes did not migrate seasonally. In Bolangir
more than 90% migrants were going to work in brick-kilns in Andhra Pradesh. The WORLP
research also shows that although migration rates among females are lower than males,
significant numbers of females do migrate (39% of the migrants in Khariar block were female).
There were also many migrating children: male children (below 14 years) constituted 14.89% of
the total number of migrants and female children (below 14 years) constituted 13.47% of the
total migrating individuals in the sample.
Workers are usually recruited by an agent or contractor known as a Sardar or Khatadars. This is
the notorious “Dadan” system attracted attention for being highly exploitative and led to the
formulation of the Inter-State Migrant Workmen Act. At the time of recruitment Sardars give the
worker an advance and promise a wage which is to be adjusted against the advance at the end of
every month. But this promise is rarely kept. Brick kiln workers are usually paid Rs 175-200 for
1,000 bricks made. They work for 12 to 15 hours, sometimes 18 hours a day to make more
money. Wages are settled at the end of the brick-making season and it is common for the
workers to be cheated because they are illiterate.
Children are an essential part of the workforce hired by contractors for brick work. A recent
unpublished study of 300 brick kilns around Hyderabad showed that as many as 35% of the total

migrants were children, of which 22% were of elementary school age. According to Sristi child
labour is much a part of the brick making process that if a family does not have a child, a child
from another family is hired (Sristi 2008). These child labourers are extremely vulnerable and
become part of unwritten, exploitative, contracts with labour contractors. Hardly 10% of the
migrants are registered with the labour department. Often, contractors take migrants in the
middle of the night to escape detection. Many migrating children eventually drop out of school.
A recent unpublished study of 300 brick kilns around Hyderabad revealed that as many as 35%
of the total migrants were children, of which 22% were of elementary school age (Panigrahi
2006). Although migrants are allowed to send their children to schools in other states, there are
often language barriers and schools may not be available near work sites. The working
conditions of brick kiln workers have been widely condemned. Brick kiln work has many of the
characteristics of bonded labour – restricted freedom, hiring workers against advances, long
working hours, underpayment and physical and verbal abuse of the workers by contractors and
employers.
Two NGOs - Vikalpa and Lok Drishti together with Action Aid have worked to free labourers
from bondage and provide education for their children. But the strong links between political
interests and contractors make it difficult to improve the conditions of employment of kiln
workers. A number of large labour contractors who supply tribal workers to brick-kilns in
Andhra Pradesh also have close links with government officials. There are strong vested interests
in keeping the workforce pliable and poor so that cheap labour continues to be available for brick
making. The experience of NGOs working with cross-border migrants has shown that it is
difficult for any contractor to be prosecuted in another state and there have been very few cases
to date (personal communication Umi Daniel, Action Aid). There is also a view that the Orissa
government is reluctant to take any action because it would be like admitting that there are so
many poor seasonal migrants in bondage. Not only would this show that the Orissa government
has been ineffective in controlling migration but it would also call into question the resource
allocations received by the state from the Centre based on population (personal communication
Umi Daniel, Action Aid).

13
Migration from Bihar
A large number of people belonging to the musahar caste migrate from Bihar to brick kilns in
Uttar Pradesh and West Bengal where they stay for 7-8 months in a year. The musahar (literal
translation is rat-eaters), are classified as a scheduled caste and they have remained largely on the
periphery of society7 . They are usually found in the least paid and most degrading jobs with the
worst terms of employment. Apart from brick kiln work, large numbers of musahar work in crop
harvesting, which is also one of the least well paid occupations. Recruiting for brick kiln work is
done through an agent who gives their families a wage advance similar to the practice seen in
Orissa.
The striking difference between the brick-kiln migrants here and the migrants in Orissa is that
there is no one to fight on behalf of the musahar for better working conditions and wages. While
Orissa has NGOs which have given the issue national and international publicity, the musahar
are less visible. Although there are NGOs in Bihar working on issues that touch the lives of
migrants such as HIV/AIDS there do not appear to be any initiatives for providing schooling for
their children.
Thus brick kiln workers continue to work without any form of social protection or social security
and the overall benefit for the migrant is being able to eat regularly. However in the absence of
education and health systems that cater to migrants, the costs have remained very high.
5.3 Textile Industry
The textile industry in India (including the garment industry) is the largest foreign exchange
earner among all other industrial sectors and provides direct employment to around 35 million
people8. A large proportion of these workers are migrants, judging from micro-studies (Unni and
Bali 2006) but it is difficult to put a precise figure on the numbers. The textile industry is
extremely complex in its structure, with handlooms and home-based production at one end of the
spectrum, to capital intensive, large mills at the other. Small, privately owned power looms now
dominate the industry. Yarn production is still in large mills but 78 per cent of the cloth 7 Mukul 1999.Everyday Life of Musahars in North Bihar EPW Special Articles December 4, 1999 8 Estimates of textile workers from Ministry of Textiles http://texmin.nic.in/msy_20010621.htm

production occurs in smaller power looms and handlooms. According to labour statistics
published by the Labour Bureau 31% of the workers in the manmade textile industry were
migrants.
The conditions of textile workers are described by in a study of Bhiwandi, the largest power
loom site in Maharashtra “A visit to Bhiwandi reminds one of scenes usually associated with the
beginning of the Industrial Revolution: thousands of persons sleeping in or next to numberless
ramshackle sheds in which the deafening sound of the looms is heard 24 hours a day, with no
ventilation, proper light, children doing tedious work for long hours, and dust and dirt
everywhere. The exact number of power looms is unknown, as is the specification of their
production, the ownership of looms, the quantity of work done on behalf of the mills.”
(Ramaswamy and Davala 2008).
The garment industry is a sub-sector of the textile industry and also generates many jobs for
migrant workers. India’s readymade garment exports increased significantly as a share of total
exports (12% or Rs 254,780 million in 2001-2). There were 1,001,000 garment workers in 2004
(Mezzadri 2008)
While the number of workers in formal employment is going down due to fewer registered
factories, the numbers in small and unregistered units is growing and employers often choose to
employ migrants because they are easily controlled (Ghosh 2001). In order to evade stringent
labour laws, larger factories have now split their operations into groups of 11-15 workers who
work on the same premises. If any worker divulges information during labour inspections he or
she is given no further work from the next day (Unni and Bali 2006).
The Garment Industry in Delhi
A case study of the Delhi garment industry which accounts for 35-40 per cent of the value of the
country’s total garment exports estimated that there are 3,000-4,000 production units where poor,
first generation industrial workers are hired by contractors known as thekedars from rural areas.
Migrant workers are preferred because they do not pose the threat of unionization. The workers
stay in the city for the production cycle and then return to their villages (Mezzardi 2008).

15
Garment units employ large numbers of women migrants. The work is characterized by long
hours, and a lack of health and welfare benefits, minimum wages, and job security. Work-related
illnesses and disorders include: headaches and stress-related fatigue, back problems, disturbances
of the menstrual cycle, repetitive strain injury, loss of weight, respiratory problems, kidney and
bladder infections from retaining urine for long periods of time, and sinus problems and allergies
from the dust and materials used.
Embroidery work is now big business for traders and exporters in the garment sector. Many of
the workers are Muslim boys and young men from Bihar who work in small units in villages
outside Delhi. Workers are paid piece rates and are almost completely invisible in the global
supply chain. Interviews and group discussions with migrants in sending areas of Bihar show
that these jobs are regarded as well paid and have helped many families to accumulate assets and
repay debts (Deshingkar et al 2006).
Silk Industry
Sericulture is a labour-intensive industry and employs roughly 6 million people in different
stages of production including rearing silk worms, reeling thread, twisting, dyeing, weaving,
printing and finishing (Ministry of Textiles) in all its phases, namely, cultivation of silkworm
food plants, silkworm rearing, silk reeling, and other post-cocoon processes such as twisting,
dyeing, weaving, printing and finishing. It provides employment to approximately 6 million
persons, most of them being small and marginal farmers, or tiny & household industry mainly in
the hand reeling and hand weaving sections. Mulberry silk is produced extensively in the states
of Karnataka, West Bengal and Jammu and Kashmir. About 85 per cent of the country's
production is contributed by the Karnataka9. Silk thread making and sari folding have now
become notorious for employing large numbers of children (see box).
Box 1 Child Labour In The Silk Industry
The prevalence of child labour in the silk industry was exposed after a Human Rights Watch
Report in 2003. HRW says “Boiling cocoons, hauling baskets of mulberry leaves, and
9 From a note on the Sericulture industry in India and its potential. Available at http://www.krishiworld.com/html/seri_ind1.html

embroidering saris, children are working at every stage of the silk industry. Conservatively, more
than 350,000 children are producing silk thread and helping to weave saris. The children work
twelve or more hours a day, six and a half or seven days a week, under conditions of physical
and verbal abuse. Starting as young as age five, they earn from nothing at all to around Rs. 400
(U.S.$8.33) a month, some or all of which is deducted against loans ranging from around Rs.
1,000 to 10,000 (U.S.$21 to $208).”
Source: Human Rights Watch (2003)
Migration from Eastern Orissa to Gujarat
Surat is one of the main destinations for migrants from eastern Orissa. Many go to work in the
textile industry and the diamond cutting and polishing industry. A study by Jagori, an NGO in
Delhi put the number of Oriya power loom workers in Surat at roughly 100,000 in 2001 (Jagori,
2001). However later informal estimates are higher and increasing: A Times of India report
(Times of India 18 May 2003) mentions 500,000 Oriya workers in Surat; Narasimham (2004)
estimated that there were roughly 800,000 Oriya labourers in Gujarat of which 80 per cent work
in the power loom and diamond polishing businesses (see under small industries below) in and
around Surat and the others are spread across the state, working in various factories including
plastics, textiles, salt manufacturing, pharmaceuticals, brick manufacturing, and fertilisers.
Increases in migrants from Orissa have been widely attributed to the super cyclone of 1999,
severe drought of 2000 and unprecedented floods after that. The most recent informal estimates
suggest that there are around 900,000 Oriya migrant workers in Surat of whom 600,000 are from
Ganjam district alone (UNDP 2007).
There has also been a shift in the caste composition of migrants: earlier studies (e.g. Nayak 1993,
Sahoo 1993) note that a majority of migrants belonged to the other castes (i.e. upper castes) and
a much smaller proportion belonged to the scheduled castes and tribes. Furthermore earlier
studies noted that most migrants belonged to the small and marginal farmer category. However
towards the end of the last decade migration streams had a high proportion of SCs (Samal 1998).
By all accounts working and living conditions of textile workers are dismal. Workers are not
named on factory books and employers do not provide them with anything other than their

17
wages. Most of them aim to maximise their savings so that they can send money home and spend
very little at the destination. Living quarters are shared and crowed with only the most basic
facilities. Since many migrants to industrial zones are single men, problems associated with the
separation from family such as visiting brothels and alcoholism are common. Oriya migrants to
Surat have been named in AIDS control projects as a highly vulnerable group. Although more
educated and better connected than the tribal migrant from western Orissa, migrants from eastern
Orissa are vulnerable in different ways. Sahoo (1993) documents the numerous ways in which
workers are deprived of their legal rights in the factories of Surat: they are not registered under
their real names; they are not issued with ID cards; they remain casual workers without a
permanent contract even if they have worked there for more than 10 years; they work in shifts of
12 hours with 30 minute breaks. If other workers are absent they may have to work without a
break for 24 hours and they are given only one (unpaid) holiday every week.
5.4 Other Small Industries In The Informal Sector
Small industry is a broad term used to describe the millions of manufacturing units in the
informal sector which make (among other things), shoes, bags, steel utensil, vehicle parts, plastic
goods, glassware and electrical items. Until the early 1990s, large manufacturing units in the
organised sector attracted intrastate migrant workers. But the pattern has changed now and small,
unregulated and often completely illegal manufacturing units have become the new destination
for interstate migrants from poorer states to the more developed areas around the capital city and
western India.
Leather Industry
The Indian leather industry with an economic value of around US $ 2 billion employs roughly
two million people (CUTS International 2008). One of the major centres of the leather
accessories industry is in Dharavi, Mumbai (the largest slum in Asia). The industry now attracts
large numbers of migrants from Bihar and UP although only a few years ago a majority were
from poorer parts of Maharashtra (Pais 2006).
Parts of the leather industry also employ large numbers of children. For example, the footwear
industry in India which ranks second in global production after China employs children in the

ages between 10 and 15 in assembling shoes. The industry is concentrated in Tamil Nadu,
Mumbai, Uttar Pradesh, Punjab and Delhi. 80 percent of the children work for contractors at
“home” i.e. small units which can evade the law. The rooms are cramped, poorly lit and poorly
ventilated. Many suffer from respiratory problems, lung diseases and skin infections through
constant exposure to glue and fumes. They are also exposed to risk of nasal cancer, neurotoxicity
and adverse physical factors (Tiwari 2005).
Yet this kind of work is perceived as a good work opportunity because it is well-paid compared
to work at home. Interviews with migrants and key informants in rural Bihar indicate that those
families who have migrants in such occupations regard themselves as fortunate and acquire the
jobs through social networks. In Barhi village in Bihar for example, there is migration to many
different kinds of industry in different parts of the country.
Box 2 Migration for Industrial Employment from Rural Bihar
Barhi is a large and remote village in Madhubani district populated by Yadavs (BCs), Muslims
and SCs with 470 households. Hardly anyone is educated beyond high school and local
employment opportunities are limited. Migration rates are very high among the BCs and SCs and
most BCs and Muslims are working in industries in Mumbai, Delhi, Gurgaon, Surat,
Ahmedabad, Kolkata, Arunachal Pradesh, Trivandrum, Kathmandu and Nepal. Earnings vary
but are usually “good”. In the mattress industries of Gurgaon for example they earn Rs 1500-
2000 a month and manage to get 10 days of overtime work in a month (there is competition for
scarce overtime work) taking their earnings upto Rs 2500. In bag making and shoe industries in
Delhi and Mumbai they earn Rs 3000-3500 if they work 12 hours a day.
In an autorickshaw workshop in Delhi workers are paid Rs 2000 per month (of which some
proportion is cut for the Provident Fund each month). The attraction of this job is that they get
PF payments even if they work for a few months. In wires and coil industries in Delhi workers
are paid Rs 2500-3000 per month (Rs 9/hr for overtime). Most of these industries have shifts of 8
hours but workers try to work overtime as often as possible. Many also work as welding
machine operators and earn Rs 4000-5000 per month. Others who work as their helpers earn Rs
2500-3000 per month.

19
Barhi village is typical of Madhubani district where migration rates are extremely high.
Migration from Madhubani has been increasing steadily over the last 10 years because of poor
yields in farming and reduced job opportunities locally with the closure of several large
industries10. According to key informants about 70% of the households are engaged in migration
each with 1-4 male members working outside. Roughly 60-75% of SC households have migrants
and 40% of OBC households have migrants.
Source: adapted from Deshingkar et al (2006)
Migration to industries has resulted in rapid improvements in living standards and contributed to
improved well being through improvements in assets and agriculture (see next section on Human
development impacts). But on the down side, those working in Mumbai reported a constant
threat of being bullied by local hooligans and the police. None of the women left behind in the
village had heard of AIDS and they never used any contraceptives which made them especially
vulnerable to infections brought back by migrating husbands.
5.5 Mines and Quarries
By one estimate there are around 3 million people working in artisanal and small mines in India
(Lahiri-Dutt 2006) which are mainly illegal. Other estimates are higher: a Rajasthan-based NGO,
the Mines and Labour Protection Campaign, estimates that there are two million workers in the
M&Q sector in the state (quoted in Lahiri-Dutt 2006). There are additionally 4-5 million quarry
workers in Maharashtra according to Santulan, an NGO working on education (quoted in AIF
2006). This is in contrast to the formal mining industry in India which employs just 560,000
people and this number is coming down.
Mica Industry
A case study of the mica mining and processing industry in Andhra Pradesh by the People’s
Union for Civil Liberties (PUCL) shows widespread under-reporting of both production and
employment in order to escape royalty payments to the government. Mica production in India is
concentrated in Bihar, Andhra Pradesh and Rajasthan. Mica mine owners do not report casual 10 Anand Kumar Jha, Samadhan, Madhubani, Ram Pramod Yadav (Master Trainer, Swayamsiddha Project-Samadhan), Madhubani, Dr. Yogendra Thakur, Director, Society for Rural Development, Madhubani

and temporary workers on the rolls and do not show them in their statutory returns to the
Director General of Mines safety (Subrahmanyam 1985). Mica processing units are operated by
the mica owners, the dealers who work as middlemen between the mine owner and the exporters.
All these agencies besides recruiting their own workers also outsource to home splitters. A
common malpractice is to employ workers on a temporary basis even though the mine is under
continuous operation. In Andhra Pradesh, such workers are listed in a 'B' register. These 'B'
registers are the muster rolls for workers who have been working for more than three months. To
avoid the statutory requirements of changing the status of a temporary labourer into a permanent
labourer after three months, the names of the workers along with the names of their parents are
altered. In this way the mine owner avoids paying the minimum wages, provident fund, bonus
and other benefits.
Migrant workers are preferred because they are not unionised and are employed by the contractor
so do not create disputes. They also tend to work harder under the direct supervision of the
contractor and they do not have to be paid bonuses, provident fund payments etc. The mine
owners approach contractors (sirdars) whenever they need more workers. The contractor recruits
a group of 30-30 workers and pays a small advance to each worker, at their native village on
signature of a promissory note in which they specify their assets (cattle or small land holdings) as
collateral. The workers stay in dormitories at the site. The mine management pays the daily
wages of these workers to the contractor who makes a profit because he pays the workers much
less than he receives.
Working in mines and quarries is dangerous and outside regulatory regimes. There are no safety
standards, medical care or protective clothing. The methods and machines used are primitive and
injuries are common. When workers take time off work due to injuries they have to pay for their
own food, fuel, water and medical expenses (Sarde 2008). A study on the health of mining and
quarry workers by Tiwari et al (2007) published in the Indian Journal of Occupational and
Environmental Medicine found that the prevalence of TB among stone crushers was 10.7%
which was higher than the average while among slate pencil workers it was as high as 22.5%.
In India, the value of mineral production has more than tripled since the sector was ‘liberalised’,
from about Rs 250,000 million in 1993-94 to more than Rs 840,000 million in 2005-06, an
astounding growth rate of 10.7%. But according to CSE the contribution of mining to the

21
nation’s GDP has stagnated at 2.2-2.5% for more than a decade now because it contributes very
little to the exchequer through taxes and royalties (CSE 2007).
6. Agriculture
Peak season operations in agriculture continue to be performed by migrant labour. For example
there were more than 819,000 migrant workers, mainly from Uttar Pradesh and Bihar, in rural
Punjab in 2007 accounting for 23% of the workforce engaged in agriculture sector activities
(Singh, Singh and Ghuman 2007). Although most find work for only 50 days in a year in
agriculture they migrate in the hope of finding casual work in urban areas after the peak seasons
of wheat harvesting, paddy sowing and paddy harvesting are over. Many are absorbed by small
industries. Similarly paddy transplanting and harvesting in the Bardhmann region of West
Bengal attracts around 500,000 migrant workers every season (Rogaly et al 2001, 2002).
In addition to these there are migration streams which involve the poorest migrants such as
sugarcane cutting and child workers such as cottonseed work which we discuss below.
6.1 Sugarcane Cutting In Western India
Maharashtra, Gujarat and Karnataka are the leading producers of sugar in India. The
Maharashtra sugar industry alone produces nearly 40 percent of India's sugar. According to
official statistics issued by the Maharashtra State Sugar Cooperative Federation, there are 1.6
million sugarcane farmers growing the crop on 0.7 million hectares of land, producing 60 million
tonnes of sugarcane. There are 172 sugar factories in the State providing employment, directly or
indirectly, to 15 million people.
The industry employs more than a million cane-cutters who are almost always SC, ST and OBC
migrants with little or no land from the poor, arid districts of the Marathwada region. The cutting
cycle lasts for six months from November to April/May. Cane cutters usually migrate in families
and are recruited by a contractor against an advance payment. The contractor provides very basic
accommodation without proper sanitation. Access to fuel and drinking water are difficult and this
increases the work burden on women. While the earnings from such work are good compared to
work in the village, the working and living conditions are so poor that they have been named as

one of the most exploited labour groups in India by researchers such as Jan Breman who
famously said that even dogs are better off (Breman 1990).
But the most serious cost of such migration is that children who accompany their parents miss
school and eventually drop out altogether. A study11 in six districts in Western Maharashtra by
the Centre for Development Research and Documentation in 2003 found that roughly 200,000
children migrate with their parents and half of them are in the age group of 6 – 14. According to
Janarth, an NGO working on education for migrant workers’ another 200,000 migrate from the
Khandesh region in Maharashtra to sugar factories in Surat in Gujarat and 100,000 migrant
workers come into Belgaum in Karnataka each year (all quoted in AIF 2006).
6.2 Cottonseed farms
Cottonseed production relies heavily on migrant child workers. It is concentrated in five states
namely Andhra Pradesh, Gujarat, Karnataka, Maharashtra and Tamilnadu. These five states
account for more than 95% of the area under cottonseed production in the country. In 2003-04,
nearly 55,000 acres were under cottonseed production in the country, out of which Gujarat
accounted for 26,000 acres, Andhra Pradesh 14,000 acres and Karnataka 4,000 acres. Andhra
Pradesh was the largest cottonseed producing state in the country until recently but Gujarat
surpassed its production (Venkateswarlu 2004). Venkateswarlu estimates that roughly 286,000
workers were employed in cottonseed farms in Gujarat in 2003-04. Of these around 91,000 were
children in the age group of 8 to 14 years. His calculations for Karnataka show that nearly
26,800 child labourers (7-14 years) were employed in cotton seed farms in 2003-4 and 88% of
them were girls. A large number of the child migrants in cotton fields in Gujarat are tribals from
southern Rajasthan (Katiyar 2005).
Estimates of the numbers of children working in cottonseed farms vary. According to UNICEF
cotton plantations in AP employ 200,000 children below the age of 14. The vast majority are
girls, as they are preferred over boys. The Environmental Justice Foundation puts the number at
around 100,000. Children working in cottonseed farms are recruited by agents who pay their
parents an advance. The children pay off this money by working long days from July to
February. The children work 13 hours a day for around Rs 30 which is less than 50 pence per
11 6406 households were selected randomly from 25 sugar factories
23
day12. On average 10 to 12 girls work per acre and are mostly drawn from the traditionally
oppressed and marginalised communities whose families are heavily indebted and have pledged
their child’s labour to pay off the debt. Even if parents do not want to exploit their children, they
are often compelled to do it because of desperate poverty and debt. Living and working
conditions are basic and many children drop out of school. A UNICEF case study found that 60
per cent of the children working in cottonseed fields have dropped out of school and 29 per cent
have never attended school. As about half of them began working before the age of 11, literacy
levels are very low13.
6.3 Food Processing
There were 7.85 million workers directly employed in the food Processing Industry including
Sea Food and Marine Products factories14 in 2001-02, and this number was expected to grow to
8.6 million persons in 2006-07 (Ministry of Labour 2008, NCAER). The size of the food
processing industry has been estimated at over USD 70 billion by the Ministry of Food
Processing, contributing 6-7% of the GDP15. Fish and cashew nut processing employ large
numbers of migrant women (ICSF/SIFFS/NFF 2004). The cashew processing industry alone
employs around 2 million people across India. (Action Aid 2008b) Many of these workers are
migrant women who earn as little as Rs 25 (50 cents) a day, less than half of the minimum wage.
Work in fish processing involves standing in damp and cold conditions for 14-16 hours a day
without any protective equipment such as warm clothing, tall boots or gloves (Misra 2008). Skin
problems and fatigue are common and separation from families causes stress and depression. The
women live within the factory premises in quarters that have been described as inhuman and
marked by congestion, poor ventilation and inadequate sanitation. Women who raise their voice
against the facilities provided are sent back home. In 1997 around 250 women were sent back to
12 http://www.ejfoundation.org/page330.html 13 http://www.unicef.org/india/child_protection_1739.htm 14 Canning and Preservation of Fruits and Vegetables (Industry code 202), Processing, Canning and Preservation of fish, etc. (Industry code 203), Production of Common salt (Industry code 208), Manufacture of Cocoa Products, Confectionery (Except Sweet Meat) (Industry code 209), Malted Food, Grinding and Processing of Spices, Papads, Appalams, Sago and Sago Products etc (Industry code 219). 15 Cited in Denmark Indian Food Processing Sector– Technology and Market Trends. http://foedevarer.di.dk/NR/rdonlyres/8FCD16B9-0966-4A20-9242-DBA6F8D17DE2/0/TechnologyandMarketTrends.pdf

Kerala and Tamil Nadu and this subdued others from asking the factory management for better
conditions and pay.
When the earnings of workers in food processing are viewed against the revenue generated it
becomes obvious how much migrants are contributing to the economy and how little they are
receiving in return. While the monthly earnings for fish processing workers would be around Rs
3000, the total GDP from fisheries was Rs 300,000 million in 2008.
7. Services
Although the latest figures for the Indian economy show that the service sector now contributes
more than 60% to the GDP, it is likely that workers and the economic contribution of certain
categories of services are not counted properly. These include domestic services, certain kinds of
transport services such as rickshaw pulling, security services and sex work. All are discussed
briefly below.
7.1 Domestic Work
With the rise of the middle class in India16, domestic work has emerged as an important new
occupation for migrant women and girls. Some 20 million people (mainly women and girls)
migrate for domestic work to Mumbai, Delhi and other large cities from the eastern states of
Bihar, Orissa, Chhattisgarh, Jharkhand, Assam and Mizoram (Social Alert quoted in SCF 2005).
Roughly 20% of these workers are under the age of 14. A study of domestic workers in Delhi
(Neetha 2004) shows that although domestic work has brought higher incomes to many women
and their families it is still far from decent work being characterised by long working hours, low
wages and hardly any social security. The study covered 465 women in part-time domestic work
living in three settlements in Delhi. Most were employed through placement agencies. Often 15-
20 girls were forced to stay in a small room without proper washing and toilet facilities. The
agencies took up to half of the migrant’s salary and savings were therefore meagre.
16 According to the National Council for Applied Economic Research, 13 per cent of India’s population will have an annual income of £2,439-£12,500 by 2009-10, compared with only 3 per cent in 1995-96

25
NGOs working in sending areas of Bihar such as Gaya district say that the numbers of child
migrants for domestic work has increased in the last five years because poor families have had
no other choices for supporting their children. The children are in the age group of 13-18 and
belong to musahar and manjhee castes (SC and BC). Roughly 500 children (girls and boys) had
migrated in 2006 through middlemen. There have been cases of sexual exploitation and physical
abuse and according to a key informant from an NGO knows as AVS, 10-20% of the children
have experienced serious difficulties. Some have come back with diseases (one 14 year old boy
came back with HIV/AIDS). Their earnings are used by their families to buy essentials and repay
debts.
Domestic workers are more vulnerable than other kinds of workers because they are not
officially classified as workers at all and are therefore not covered by laws that apply to workers.
However a few civil society organisations have campaigned on behalf of domestic workers and
have succeeded in obtaining state government orders related to working hours, minimum wages
and weekly days.
7.2 Rickshaw Pulling
There are roughly eight million cycle rickshaw pullers in India according to the Centre for Rural
Development (CRD)17 which runs self-employment projects for rickshaw pullers in several
states. Cycle rickshaws have remained an important mode of transport in old town/city centres
with narrow streets all over India. There are still at least 100,000 rickshaws operating in Delhi
(Kurosaki et al 2007). Most rickshaw pullers in Delhi originate in Uttar Pradesh and Bihar and
belong predominantly to the scheduled castes, tribes and other backward castes with little or no
education. A pilot sample survey of 80 rickshaw pullers in Delhi indicates that rickshaw pulling
may help migrants and their families break out of poverty. More than 40% of the migrants
reported that they had been unemployed in their villages while the others were engaged in very
small scale cultivation or other activities like agricultural and non-agricultural casual labour and
their economic status before rickshaw pulling was “almost desperate”.
Rickshaw pullers do not migrate in groups under an agent like construction or brick-kiln
workers. They migrate on their own through social networks. If work is available regularly their
17 http://www.crdev.org/rb.asp

earnings and remittances can be good. Kurosaki et al estimate that out of a monthly income of
Rs.2,400-3,300, a rickshaw puller was able to spare Rs.900-1,800 for his family back home after
meeting his expenses on food and lodging and these levels of income and remittance were
enough to put both the migrant and his family in the village above the poverty line (which was
Rs.24200 per household per annum for Delhi) especially if the income of other family members
was taken into account. Although Kurosaki and his team did not explore the impacts of this
additional income on the family, other qualitative studies have found that the money is used for a
variety of purposes including leasing in land, improving the family house, marriage expenses,
health and children’s education (Deshingkar et al’s 2006 study of migration from Bihar).
However rickshaw pullers have few rights and entitlements in the urban destinations where they
ply their trade. While organisations such as CRD have made some difference, the majority
continue to sleep in the open and have to rely on private providers for meeting basic health and
food needs. They are highly vulnerable to government “cleanup” drives where rickshaw pullers
have been asked to move out to reduce urban congestion, as occurred in Delhi a couple of years
ago.
7.3 Restaurants, “Dhabas” And Tea Shops
Nearly all urban centres are dotted with thousands of small, illegal restaurants, dhabas (roadside
eateries) and tea shops and these mostly run on migrant labour. Child labour is high in this
subsector and is driven by poverty, typically employing children from extremely poor scheduled
caste families.
Although there has been a ban on child labour in such establishments, this is completely
ineffective in practice and restaurant and dhaba owners openly employ children. The parents of
the children are aware that working at such a young age compromises their prospects for the
future, but they have little choice.
Child migration from Purnia, Madhubani and Sitamarhi districts in Bihar to towns in Uttar
Pradesh and Bihar for work in “dhabas” has been on the increase over the last 10 years
(Deshingkar et al 2006). These are mainly children from SC families and they migrate for 8-9

27
months a year. They are paid Rs.500-1500 a month with food. Often the payment is given
directly to the parents as an advance and the child repays the debt.
This appears to be one of the least visible and least supported migration streams and this is
perhaps why there are so many child workers in it. There do not appear to be many (or even any)
NGOs working specifically with this category of service providers. They remain unprotected and
vulnerable to exploitation at the hands of agents and employers. Working hours are long and the
boys often have to sleep on the premises without proper bath and toilet facilities. Verbal and
physical abuse is the norm. Yet for the families, the extra cash can make a huge difference.
7.4 Sex Work
Sex work is a rapidly growing business as recent research in small towns in Andhra Pradesh and
Karnataka shows (Deshpande 2008; Rao 2008). A significant proportion of sex workers are
seasonal migrants and commuters. In the town of Tenali in coastal Andhra Pradesh for example,
many sex workers migrate or commute from nearby villages. They are managed by a pimp or
“madam” who takes half of their earnings and protects them from the police. With increasing
pressure from the police, sex workers have become home-based or roadside based rather than
operating through brothels. Notwithstanding these pressures, the number of sex workers is on the
rise, because “people have more disposable income, poor women are looking for ways of earning
money and it is easy for poor and illiterate women to get into the trade” says a local NGO. There
are no formal estimates of sex workers but a widely circulated figure among HIV control
agencies and NGOs is 2 million for the whole of India (Sarde 2008; Asia Times 20 April 2004).
Research on migrant sex workers by the Population Council in India shows that increasing
numbers of poor and illiterate women are drawn into sex work because the returns are greater in
this occupation than almost any other that they can enter. A study of Andhra Pradesh showed
that contrary to popular perceptions, a majority of sex workers were not trafficked into the trade
(only 1-5% had been trafficked), but had begun working in the trade because of poverty and debt
(Population Council 2008). This poor economic situation was often the result of being left
destitute by the death of the parents or husband, after divorce/separation, or the husband having a
chronic debilitating sickness. A large proportion of the sex workers interviewed in the AP case

study had cell phones and bank accounts which have allowed them to become independent of
exploitative touts. NGOs are playing a key role in sensitising sex workers about health risks. But
they remain vulnerable on account of being ostracised by society and government alike.
Discussions with slum dwellers in small towns Maharashtra and Karnataka showed that slums
with a high population of sex workers were the most neglected by urban service providers
(Deshpande 2008).
8. The Economic Contribution of Migrant Labour
Field evidence and micro studies confirm that poor migrant labour is now the most preferred
labour by agriculturalists, industrialists and service providers for operations that do not require
sophisticated skills. Migrant workers provide the ultimate flexible workforce to employers who
can hire and fire them without any obligations whatsoever and extract cheap labour for very little
payment.
Adding up the numbers in the sectors reviewed above we estimate that there are around 100
million circular migrants in India today. These workers have played a huge role in sustaining and
building India’s economy but their contribution remains unrecognised because of the lack of
data.
The economic contribution of migrants is a hotly debated issue at the moment especially in the
context of international migration to the EU. While some analysts contend that migrants pose a
net drain on resources and threaten local employment (see for example publications of Migration
Watch UK) others argue that they do not compete for the same jobs and provide cheap labour
that boosts economic growth. The same arguments apply to internal migrants and the evidence
suggests that circular migration in particular has win-win outcomes for sending and receiving
areas. The discussion is hampered by the lack of data and serious under-reporting in illegal and
informal sector units. Nevertheless, we make an attempt here.

29
8.5 Methodology
We have already identified the sectors that employ large numbers of migrant labour. We first
provide a brief overview of the sector contributions to GDP followed by numbers of workers in
each sector (as shown in official statistics). We then compute the economic contribution of
migrant workers using the number of migrants as estimated by us and the value added per worker
(VAPW) obtained from the National Sample Surveys.
The GDP contributions of different sectors since 1999-00 at constant prices is provided in the
table below.

Table 1 GDP by Economic Activity (in ten million Rupees, descending order)
1999-
00
2000-
01
2001-
02
2002-
03
2003-
04
2004-
05
2005-
06
2006-
07
NI
C
Co
de
44651
5
44540
3
47324
9
43896
6
48267
6
48244
6
51101
3
53023
6
1 agriculture,forestry
& fishing
25414
3
26732
6
29307
5
31322
1
34474
3
37115
5
40620
3
44067
7
6 trade,hotels and
restaurants
26411
3
28457
1
29180
3
31168
5
33236
3
36111
5
39355
7
44077
0
3 manufacturing
26670
7
27923
9
29071
5
30215
3
31851
4
34034
2
36488
3
39002
0
9 community, social
23355
0
24304
8
26073
7
28155
0
29725
0
32308
0
35994
2
41003
0
8 financing,insurance
,real estate &
business services
13337
1
14832
4
16077
2
18347
1
21162
7
24469
3
28053
5
32720
7
7 transport,storage&
comm
10200
7
10836
2
11269
2
12165
0
13622
4
15821
7
18425
5
20633
8
5 construction
44526 45439 46228 48423 50735 54745 57309 60737 4 elect.gas & water
supply
41594 42589 43335 47168 48626 52591 55150 58294 2 mining &
quarrying
17865
25
18643
00
19726
06
20482
87
22227
58
23883
84
26128
47
28643
09
10 gross GDP at factor
cost
Source: Adapted from Statement 10 National Accounts 2008

31
Figures on the numbers of workers in different segments of the industry are available through the
National Sample Survey Organisation (NSSO) surveys and the Annual Survey of Industries. The
National Sample Survey conducts surveys on Employment and Unemployment which include
informal workers in both the informal/unorganised sector18 and the formal sector and are
therefore most relevant to our analysis here. Organised enterprises in the public (government)
sector, private corporate sector and co-operatives, manufacturing units registered under the
Indian Factories Act, 1948 or the Bidi and Cigar Workers Act, 1966 are covered by the Annual
Survey of Industries.
The latest data available are from the 61st Round 2004-5 of the National Sample Survey (Table
2). Data from this round indicate that the number of informal workers was more than 422 million
in 2004-5, up from 361.7 million 1999-00 or an increase of 61 million in five years. To put it
into perspective, this number is more than the population of several European countries. Given
that these data are already four years old it is possible that at least another 50 million have been
added to the informal workforce since the last enumeration.
Of the 422 million informal workers in 2004-5, 393 million were informal workers in the
informal sector19 and 29 million were informal workers in the formal sector. This latter category
is the one that would include migrant workers working for large construction firms,
manufacturing companies and export houses low down in the value chain.
18 The definition of informal worker used by the surveys is presented in appendix x. The Unorganised Sector comprises: Own Account Manufacturing Enterprises (OAME) - manufacturing enterprise operating with no hired worker employed on a regular basis; - Non-Directory Manufacturing Establishments (NDME) - units employing less than 6 workers including household workers and - Directory Manufacturing Establishments (DME) - units employing 6 or more workers with at least one hired worker but not registered under the Factory Act. 19 The term ‘informal sector’ has been used for the first time in the Indian National Sample Survey (NSS) in its 55th Round (1999-2000). In this survey, informal enterprises were defined as the units or enterprises (other than those covered under the Annual Survey of Industries) having type of ownership as either proprietary or partnership. The partnership could be within the same household or from different households. The definition adopted in the survey is broadly consistent with that recommended by the Fifteenth ICLS. Thus the informal sector, as defined in the NSS 55th Round, is really a sub-set of the so-called unorganised sector as described in the official statistics or in the NAS.
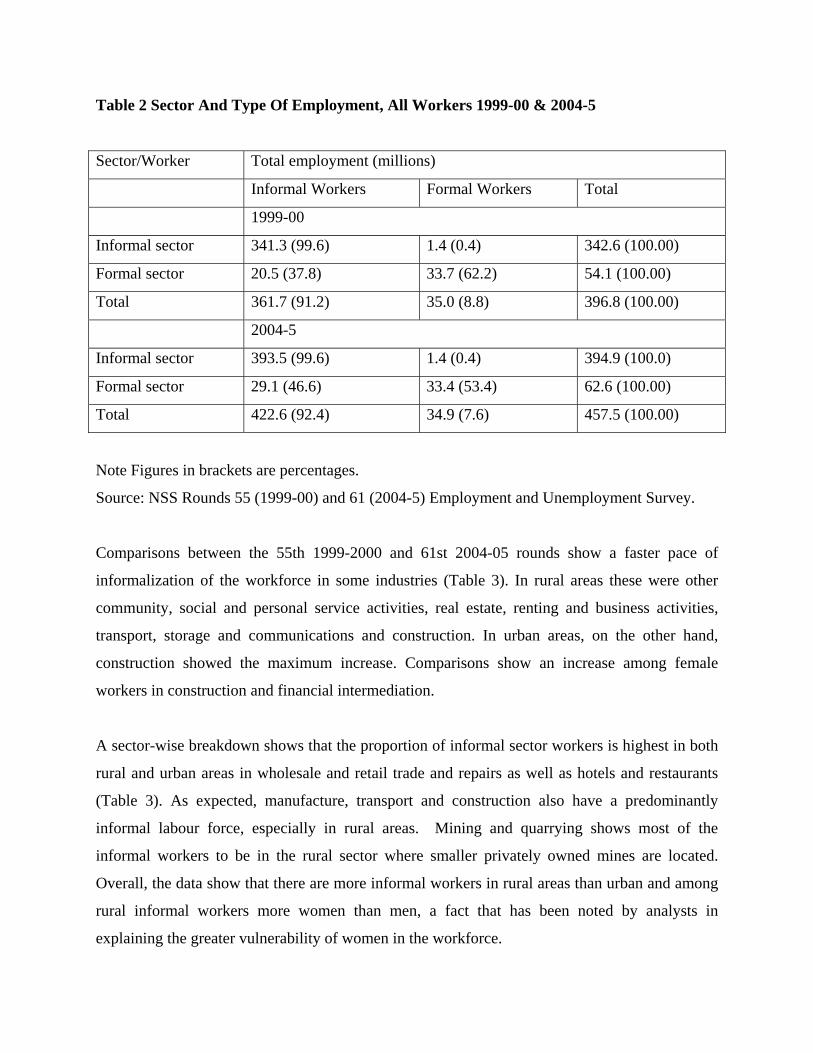
Table 2 Sector And Type Of Employment, All Workers 1999-00 & 2004-5
Sector/Worker Total employment (millions)
Informal Workers Formal Workers Total
1999-00
Informal sector 341.3 (99.6) 1.4 (0.4) 342.6 (100.00)
Formal sector 20.5 (37.8) 33.7 (62.2) 54.1 (100.00)
Total 361.7 (91.2) 35.0 (8.8) 396.8 (100.00)
2004-5
Informal sector 393.5 (99.6) 1.4 (0.4) 394.9 (100.0)
Formal sector 29.1 (46.6) 33.4 (53.4) 62.6 (100.00)
Total 422.6 (92.4) 34.9 (7.6) 457.5 (100.00)
Note Figures in brackets are percentages.
Source: NSS Rounds 55 (1999-00) and 61 (2004-5) Employment and Unemployment Survey.
Comparisons between the 55th 1999-2000 and 61st 2004-05 rounds show a faster pace of
informalization of the workforce in some industries (Table 3). In rural areas these were other
community, social and personal service activities, real estate, renting and business activities,
transport, storage and communications and construction. In urban areas, on the other hand,
construction showed the maximum increase. Comparisons show an increase among female
workers in construction and financial intermediation.
A sector-wise breakdown shows that the proportion of informal sector workers is highest in both
rural and urban areas in wholesale and retail trade and repairs as well as hotels and restaurants
(Table 3). As expected, manufacture, transport and construction also have a predominantly
informal labour force, especially in rural areas. Mining and quarrying shows most of the
informal workers to be in the rural sector where smaller privately owned mines are located.
Overall, the data show that there are more informal workers in rural areas than urban and among
rural informal workers more women than men, a fact that has been noted by analysts in
explaining the greater vulnerability of women in the workforce.
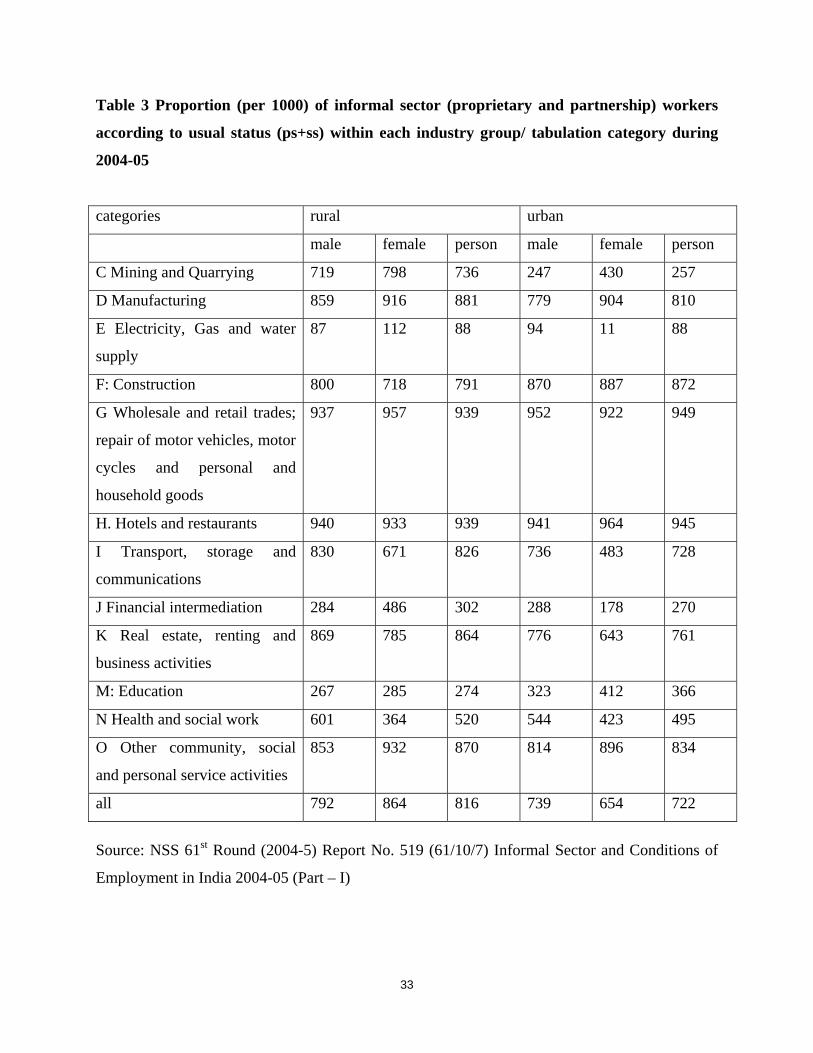
33
Table 3 Proportion (per 1000) of informal sector (proprietary and partnership) workers
according to usual status (ps+ss) within each industry group/ tabulation category during
2004-05
categories rural urban
male female person male female person
C Mining and Quarrying 719 798 736 247 430 257
D Manufacturing 859 916 881 779 904 810
E Electricity, Gas and water
supply
87 112 88 94 11 88
F: Construction 800 718 791 870 887 872
G Wholesale and retail trades;
repair of motor vehicles, motor
cycles and personal and
household goods
937 957 939 952 922 949
H. Hotels and restaurants 940 933 939 941 964 945
I Transport, storage and
communications
830 671 826 736 483 728
J Financial intermediation 284 486 302 288 178 270
K Real estate, renting and
business activities
869 785 864 776 643 761
M: Education 267 285 274 323 412 366
N Health and social work 601 364 520 544 423 495
O Other community, social
and personal service activities
853 932 870 814 896 834
all 792 864 816 739 654 722
Source: NSS 61st Round (2004-5) Report No. 519 (61/10/7) Informal Sector and Conditions of
Employment in India 2004-05 (Part – I)
However some categories of workers that are critical to our discussion here, namely individuals
working as housemaids, cooks, gardeners, ayahs (child minders), watchmen and other service
providers are not adequately covered by the unorganized sector surveys. This could be due to the
difficulties in classifying the activities of casual labourers and certain other categories of persons
as enterprises. Also, it has been noted by experts on informal employment that street-based
occupations and seasonal occupations are underestimated by the NSS (Unni 2006) and these two
categories again are dominated by migrant workers.
An idea of the difficulties in counting informal workers can be gained by comparing the results
of the 55th round data collected through the household survey method and unorganized enterprise
survey methods (Table 4). The NSSO conducted an integrated survey of households and
informal enterprises in its 55th round during July 1999 to June 2000. The subjects covered were
household consumer expenditure, employment-unemployment and non-agricultural enterprises
in the informal sector. For the first time the 55th Round aimed to estimate the number of workers
in the informal sector through two different approaches, one based on the household approach
and the other based on the enterprise approach.
In the household approach, through the schedule on employment-unemployment, details about
enterprises where the household members of the sample households had been working were
collected. In the enterprise approach, the sampling units were the informal non-agricultural
enterprises in manufacturing; construction; trading and repair services; hotels and restaurants;
transport, storage and communications; financial intermediation; real estate, renting and business
activities; education, health and social work; and other community, social and personal service
activities (excluding domestic services). Table 4 below shows a comparison of the number of
workers at all-India level for different activities as per the alternative approaches. It may be seen
that estimates based on the two approaches are broadly comparable except in case of
Construction, Transport, storage and communication; and Other community, social and personal
services, for which estimates based on household approach are much higher. (e.g. the categories
of individual service providers mentioned earlier).

35
Table 4 Estimates of Number of Workers based on Enterprise Survey Approach (Schedule
2.0) and Household Survey Approach (Schedule 10)
Activity Estimated number of workers (‘000)
Sch. 2.0 Sch. 10 Difference
1. Manufacturing 29661 30465 804
2. Construction 2669 10987 8317
3. Trading & repair
services
28403 28244 -159
4. Hotels & restaurants 4291 3566 -725
5. Transport, storage and
communications
5226 8677 3451
6. Financial
intermediation
333 421 88
7. Real estate, renting and
business services
1528 1767 239
8. Education 1739 2077 338
9. Health and social work 1203 1029 174
10. Other community,
social and personal
services
4729 6623 1894
All activities 79783 93856 14073
Note: Estimates based on Schedule 10 give total number of usual status workers considering both
principal and subsidiary status.
The estimates of value added per worker (VAPW) are taken from the enterprise surveys
conducted by the NSSO and again suffer the shortcoming of not covering all the occupations that
we are interested in. The value added per worker of the units in a particular industry group is
estimated as the ratio of gross value added to the total employment in all the units of the
particular industry group. As can be seen from table 5 there are wide differences in the VAPW

depending on the type of enterprise with figures in unorganised enterprise typically much lower
than organised enterprise. Given that the majority of migrant workers are typically employed in
the lowest end jobs which almost always informal, we will take the lowest figures under each
category. Table 5 shows value added per worker for all major sectors included in the NIC 1998
classification for which VAPW are available in Sundaram (2008).

Migration and Human Development in India
37
Table 5 Employment, Net Value Added and Labour Productions in the Organised and the Unorganised Segments of Non-Agriculture by
Broad Industry Divisions: All-India, 1999-2000-2004-05. Work Force (000)
Workers Net Value-Added (Rs. Crores) NVA Per Worker (Rs.)
S.No. Ind. Division
(NIC 1998)
Total Organised Unorganised Total Organised Unorganised Total Organised Unorganised
1 Mining&Quarrying 1883 650 1233 32975 30208 2767 175119 464738 22441
2 Manufacturing 44260 9903 34357 206126 128653 77473 46572 129913 22549
3 Electricity, Gas&Water 1054 975 79 24204 23546 658 229639 241497 83291
4 Construction 17747 1680 16607 99312 40691 58621 55960 242208 35299
5 Trade, Hotels &
Restaurants
41453 1305 40148 248196 38822 209374 59874 297487 52151
6 Transport,Communication
& Storage
14848 3312 11536 105793 46249 59544 71251 139641 51616
7 FIREBS 4925 1977 2948 137516 110002 27514 279220 556409 93331
8 Social,Community and
Personal Services
33727 16343 17384 246738 189843 56845 73157 116162 32700
9 Total Non-Agriculture 159897 36145 123752 1100860 608014 492846 68848 168215 39825
Panel B: 2004-05
Work Force (000) Net Value-Added (Rs. Crores) NVA Per Worker (Rs.)
Sr.
No.
Ind. Division
(NIC 1998)
Total Organised Unorganised Total Organised Unorganised Total Organised Unorganised

1 Mining&Quarrying 2548
(6.24)
996
(8.91)
1552
(4.71)
42324
(5.12)
38982
(5.23)
3342
(3.85)
166107
(-1.05)
391386
(-3.38)
21534
(-0.82)
2 Manufacturing 55900
(4.78)
12,304
(4.44)
43,596
(4.88)
277237
(6.11)
181617
(7.14)
95620
(4.30)
49595
(1.27)
147608
(2.59)
21933
(-0.55)
3 Electricity, Gas&Water 1211
(2.82)
1152
(3.39)
59
(-5.67)
28727
(3.49)
27363
(3.05)
1364
(15.70)
237217
(0.65)
237526
(-0.33)
231186
(22.65)
4 Construction 25998
(7.94)
1437
(-3.08)
24561
(8.14)
150510
(8.67)
56533
(6.80)
93977
(9.90)
57893
(0.68)
393410
(10.19)
38263
(1.63)
5 Trade, Hotels &
Restaurants
49593
(3.65)
967
(-5.82)
48626
(3.91)
365739
(8.06)
59768
(9.01)
305971
(7.88)
73748
(4.26)
618077
(15.75)
62923
(3.83)
6 Transport,Communication
& Storage
18587
(4.59)
3458
(0.87)
15129
(5.57)
202097
(13.82)
84580
(12.83)
117517
(14.57)
108730
(8.82)
244592
(11.86)
77677
(8.52)
7 FIREBS 7780
(9.58)
3021
(8.86)
4759
(10.04)
213974
(9.24)
165144
(8.47)
48830
(12.16)
275031
(-0.30)
546473
(-0.36)
102627
(1.91)
8 Social,Community and
Personal Services
37619
(2.21)
18194
(2.17)
19425
(2.25)
316853
(5.13)
229140
(3.83)
87713
(9.06)
84227
(2.86)
125943
(1.63)
45155
(6.67)
9 Total Non-Agriculture 199236
(4.50)
41529
(2.82)
157707
(4.97)
1597461
(7.73)
843127
(6.76)
754334
(8.89)
80179
(3.09)
203021
(3.83)
47831
(3.73)
Source: Sundaram (2008)

Migration and Human Development in India
39
Finally we compute our estimates of the contribution of migrant workers using our own figures on
migrant workers in each sector and the VAPW from the NSS and other sources such as the World
Development Indicators. A lacuna in this computation is that we do not have estimates for all
sectors and can therefore provide an estimate based only on the major sectors that we have covered
earlier in the report.
Table 6 The Economic Contribution Of Migrant Workers By Sector
Sector Number of Migrants Value Added per
Worker in the
Unorganised Sector
Total Contribution
to the Economy
(millions)
Agriculture At least 10,000,000
Migrant farm workers
1000,000 cane cutters
500,000 cottonseed
workers 2,000,000
cashew processors
$ 385.73 (World
Development
Indicators Database)
= Rs 18745
253057.50
Ind. Division (NIC 1998)
Mining&Quarrying 6,000,000 21534 129204.00
Manufacturing 35,000,000 textile
workers
21933 767655.00
Electricity, Gas&Water 231186
Construction 40,000,000 38263 1530520.00
Trade, Hotels &
Restaurants
10,000,000 street
vendors
62923
629230.00
Transport,Communication
& Storage
8,000,000 rickshaw
pullers
77677 621416.00
FIREBS 102627
(1.91)
Social,Community and
Personal Services
20,000,000 domestic
workers
45155
(6.67)
903100.00
Total 4834182

The contribution of migrant workers to the Indian economy is at least Rs 4834182 Million ($
99,479 million). The total value of India’s GDP was Rs 47,131,480 million which means that
migrant labourers contribute 10% of the GDP.
Although there are some very robust informal estimates of the numbers of workers in particular
sectors it has not been possible to get such information for all sectors that employ migrant workers.
Further exhaustive research is required to calculate precisely which parts of the economy of the
economy employ undocumented migrants and child labour so that it can be worked out where the
contributions are being made and where government and the private sector have responsibility to
improve conditions and pay.
9. Impact of the Economic Recession
Available data at the aggregate level for 2007-8 show that the contribution of the three major
subsectors was: Services (62.9%) followed by Industry (19.4%) and Agriculture (17.8%) (RBI
2008). Data from the National Accounts for 2008 on growth in different sectors shows that trade,
hotels, transport and communication registered the fastest growth followed by construction and
manufacturing (Table 7) as explained in the following paragraph. Estimates of Gross Domestic
Product (GDP) for the second quarter (July-September) Q2 of 2008-09, at constant (1999-2000)
prices are prepared by the Central Statistical Organisation (CSO), Ministry of Statistics and
Programme Implementation. Quarterly GDP at factor cost at constant (1999-2000) prices for Q2 of
2008-09 was estimated at Rs. 7,71,4510 million, as against Rs. 7,16,9820 million in Q2 of 2007-08,
showing a growth rate of 7.6 per cent over the corresponding quarter of previous year. The top two
economic activities in terms of growth in Q2 of 2008-09 over Q2 of 2007-08 were, ‘trade, hotels,
transport and communication’ showing an increase of 10.8 per cent, ‘construction’ with an increase
of 9.7 percent and ‘manufacturing’ at 5 per cent. The growth rate in ‘agriculture, forestry & fishing’
was estimated at only 2.7 per cent in this period (National Accounts Quarterly Estimates of GDP for
the second Quarter (July08-Sept08)).

41
Table 7 Quarterly Estimates Of GDP At Factor Cost In Q2 (July-September) OF 2008-09 (At
1999-2000 Prices)
Source National Accounts 2008
However the economy is showing signs of being affected by the economic downturn and some
migrant employing sectors have been badly hit.
9.1 Employment Outlook
According the Manpower Employment Outlook Survey conducted by Manpower Inc. (2009),
employers in India reported the second strongest hiring intentions globally, with a Net Employment
Outlook20 of 19%. However the study notes that this Outlook represents a considerable decrease of
24 percentage points quarter-over-quarter and 27 percentage points year-over-year. Mining and
Construction continued to be strong for employment despite jobs becoming scarcer during the first
quarter of 2009. Employers in the Mining & Construction sector for the third consecutive quarter
reported the most optimistic hiring intentions with a Net Employment Outlook of 23%, but the
Outlook shows a steep decline in employer hiring confidence of 31 and 30 percentage points 20 The Net Employment Outlook is derived by taking the percentage of employers anticipating total employment to increase and subtracting from this the percentage expecting to see a decrease in employment at their location over the next quarter.

quarter-over-quarter and year-over-year, respectively. Wholesale & Retail trade employers reported
the least optimistic hiring intentions with a Net Employment Outlook of 11%.
9.2 Job losses
The actual change in employment in the last quarter of 2008 October-December, 2008 was
monitored by The Labour Bureau (2009) in a study in on the impact of the economic downturn on
employment. The sample was drawn from Mining and Construction, Textiles, Metals, Gems &
Jewellery, Automobiles, Transport, IT and Business Processing Outsourcing (BPO) units. These
had contributed more than 60% to the GDP in the year 2007-08. The results of the survey show that
the most affected sectors were Gems & Jewellery, Transport and Automobiles where employment
declined by 8.58 %, 4.03%, and 2.42 % respectively during the period Oct-Dec, 2008. In Textile
sector, 0.91 per cent of the workers lost their jobs.
The report notes that data on the construction industry could not be collected due to non-compliance
with the Labour Bureau’s request for details on contract workers and other aspects of employment.
Table 8 Industry wise change in Employment of Direct21 and Contract workers
Industries Direct Contract Total
Mining -0.06 -0.81 -0.33
Textiles -1.11 4.6 -0.91
Metals -1.04 -4.53 -1.91
Gems &Jewellery -9.27 -3.86 -8.58
Automobile -0.77 -12.37 -2.42
Transport 1.96 -9.93 -4.03
IT/BPO .51 1.6 0.55
Overall -0.63 -3.88 -1.01
Source: Labour Bureau (2009)
21 It is not clear what “Direct” workers refers to – this category could include home based workers as well as workers with formal contracts.

43
9.3 Industry-Watchers’ estimates
Industry estimates and informal estimates by observers provide an indication of changes occurring
in particular sectors. Export oriented units were the worst hit and among these the more labour
intensive sectors such as textiles, leather, gems and jewellery and marine products.
The Confederation of the Indian Textile Industry reports that 700000 people have already lost their
jobs, and the total could reach one million this fiscal year22. The retrenchments seen currently are
described as 'the tip of the ice berg'. A majority of the layoffs are targeted at daily labourers who
make up 25-35% of the work force, and 35 million out of the total workers in the Indian Textile
Industry.
The gems and jewellery industry had laid off about 100,000 workers by December 2008. The
diamond industry is worth 50 billion dollars and employs more than 700,000 workers from various
parts of the country. Over 1.3 million people and their families depend on the industry23.
What is clear is that migrant labourers have been among the first to lose their jobs. The economic
crisis has therefore highlighted a new dimension of vulnerability and this needs to be recognised at
the policy level when formulating relief packages.
10. Human Development Impacts of Migration
The preceding section shows that migration has both positive and negative impacts on human
development. On the positive side it brings in cash which may or may not result in an improvement
in living standards. It can also result in the learning of new skills and an improvement in social
status. On the negative side migration carries the risk of injury, exposure to life threatening
diseases, loneliness and increased work burdens for women left behind. The overall outcome of
migration depends on how these positives and negatives add up – for the better connected and better
educated, migration can result in rapid accumulation of assets and a faster escape from poverty
compared to those who belong to historically oppressed communities where underpayment and
exploitation are worst.
22 T&C Industry the Engine of Growth for Employment, Exports and Economy as a whole combined presentation for the media by AEPC, CITI, SRTEPC, TEXPROCIL, 12 January 2009 23 Recession robs the sheen off from diamond industry in Surat, Asian News International October 21, 2008

In the villages in MP and other parts of western India studied by David Mosse and colleagues, for
instance, migration for construction work was generating more than 86% of the cash income for
migrating households in the mid 1990s (Mosse et al 1997). The gross annual earnings from
migration were about Rs 8,000 per family but few broke out of poverty due to a combination of
outstanding debts, the uncertainty of finding work, high costs at the destination and underpayment.
Another study in southern MP also found that migration earnings were an important source of
income: Narain et al (2005) studied 550 households in 60 villages in Jhabua district in 2000/1 it was
seen that households in the three poorest quartiles earned 65-70% of their total wage income from
seasonal migration. In contrast, households in the top quartile earned the largest share of total
labour income (63%) from regular jobs in the private or public sector and only about 30% from off-
village labour.
On the whole migration among poor tribals in southern MP may be helping the households to
maintain their standard of living rather than breaking away from poverty: qualitative data collected
by Shah and Sah (2004) from 212 households in a village in Bhadwani district in southern MP
shows that migration helped landless households to maintain their standard of living over a decade.
The researchers assessed the change in well-being rank over ten years and found that 180
households had retained their original well-being status (including those that were already poor),
7% experienced an improvement, and the remaining 38% deteriorated in status. The analysis
suggested that (a) improvement was generally associated with access to irrigation through private
sources or obtaining a salaried job; (b) deterioration was largely due to division of landholdings
and, at times, due to indebtedness and (c) some households, especially the landless, could retain
their well-being status in the better-off or medium categories due to migration.
Another aspect of the impacts of migration is that many families with migrants in southern MP
continue to remain in debt because there has been an increase in borrowing and spending for social
purposes (see box below).
Box 3 Social Spending Of Migration Earnings
In Jhabua district in addition to financing essential needs when household food supplies run out five
to six after the harvest, migration money is financing two important social customs known as
‘Notra’ and ‘Bhagoriya’. This district has a large population of Bhil and Bhilala tribals where the
45
average landholding is about one acre per household and the average household size is five to six
persons. Notra refers to a system of community contribution among the Bhils. A household in need
borrows from another in cash or kind. The borrowing is marked by a feast for family, neighbours
and friends. Repayments are made with “interest” i.e. the amount or quantity returned is greater
than that borrowed. Records of contributions received are meticulously maintained. Receiving notra
from a family and not repaying them during the notra organised by them, constitutes a serious
violation of village rules. The Panchayat is called in to decide on the punishment to be meted out to
the erring family. The expenses of the feast and repayments require heavy spending and it has been
mentioned that migration money is the reason for this escalation. Spending lavishly during the notra
ceremony raises the social status of the family and much importance is placed on this custom in
Bhil society. Bhagoriya is another custom wherein boys choose a girl to marry and pay a bride price
to the girl’s family. The young couple then migrate to repay moneylenders or relatives from whom
the money was borrowed.
In contrast to these migrants are the workers in small industries who also work without any formal
protection but earn better. Discussions with NGOs in several parts of Bihar in 2006 (Deshingkar et
al 2006) showed the different livelihood enhancing ways in which migration money is used. In
Muzzaffarpur district in Bihar for example where several families send circular migrants to Mumbai
about 10% of the households have leased in small plots of land using migration earnings
(discussions with staff from NIRDESH an NGO working in the area). Another 5% have used
remittances to buy livestock, repair or upgrade their houses and set up small businesses. In Jai
Nagar block, Madhubani district about 15% migrants have used remittances for leasing in land
according to staff of the Swayamsiddha Project. Focus group discussions with migrants and NGO
staff in Sitamarhi district show that many people are leasing in land. According to the group,
remittances were used previously for loan repayment and consumption. But as the families became
wealthier they started investing in farming, share cropping and leasing land. They estimate that
more than 50% migrants have acquired some land in the last 7-8 years. In Gaya district migration
money is being used to lease in land for growing vegetables.
Studies of industrial workers from rural UP by UNDP-TAHA (2007) have found mixed impacts. In
one study of 310 families from Jaunpur, UP, women said that their economic situation had
improved but most continued to work locally because of the uncertainty of receiving remittances.
Participants in focus group discussions with male migrants spoke of a shift towards a ‘better life’ in
terms of better access to food, clothing and education. 86% of the women interviewed reported

better access to schooling for their children, 84% reported an improvement in food intake and 51%
reported better access to healthcare. Other positive impacts identified were an improved ability to
spend on health, the ability to repay debts and renovate or build a house. While 50% earned less
than Rs 3000 a month, 40% earned more (probably skilled workers). This was a substantial amount
of money in 2007 as it predated the sudden increase in global prices that occurred in mid 2008. The
inflow of cash adds to the family status as it reduces the need to borrow money in times of need.
Post migration, 11% of the families were able to buy mobile phones and other gadgets.
Migration is thus highly differentiated: at one extreme are the poorest such as the tribals from
southern MP, western Orissa and the musahar from Bihar for whom migration is no more than a
coping strategy providing at best subsistence and the money for repaying debts; while for better
educated and better connected migrants, it provides additional income which can be used to fund
agriculture, education, housing and social functions which lead to economic and social gains.
10.1 Migration as an Exit Choice
Recent studies in Bihar document that migrants belonging to historically disadvantaged groups such
as the scheduled castes and tribes frequently said that working outside the village had given them
the opportunity to work with dignity and freedom24. Bihari migrants said that caste hierarchies in
rural society were rigid and humiliating. One worker from Purnia district said that the wives of
farmers who employed them for crop harvesting in Bihar would always address them rudely and
give them food in a very insulting manner. He said that in Punjab the farmers wives treated them
with more respect. NGOs working in Parbhani district in Maharashtra feel that migration has given
dalits and women an opportunity to escape caste divisions and atrocities25. Shah’s research on
migration to brick-kilns from Jharkhand shows that migration gives young men and women the
opportunity to pursue amorous relationships away from social restrictions in the village (Shah
2009).
Migraton has also led to a shift in social and power relations in the Bundelkhand region of Madhya
Pradesh. Dr M.M. Rehman of the V.V.Giri National Labour Institute who has been studying the
area for several years notes “there has been a shift in power because of migration and education.
Now youth work outside and they wear jeans and carry cell phones”. Migration has clearly led to
24 Interviews conducted by Sushil Kumar published in Deshingkar et al (2006). 25 Personal Communication Ganpat Bhise, Pratigya, Parbhani, Maharashtra.

47
lower dependencies on the village elite and an accompanying shift in power relations. The poor can
now work and live without having to observe humiliating obsequiousness to their employers.
10.2 Who Accumulates And Who Copes?
Whether or not saving and accumulation occurs as a result of migration depends on the mode of
recruitment, skill and wage levels, the ability to access remunerative work which in turn depends on
social networks, education and assets, location, caste and gender. In general those who migrate
through middlemen earn and save less than those who have good contacts and migrate
independently. Such migrants are usually poor, uneducated and unskilled. Personal business
acumen, entrepreneurial skills and confidence also matter a great deal. For example research on
seasonal migration conducted under the Andhra Pradesh Rural Livelihoods Project by Samal (2006)
in two villages in Mahabubnagar district and two villages in Ananthapur found that most
households did not save much but some did accumulate wealth and one of the major factors leading
to the accumulation of assets was the repetition of migration to the same destination. Long-term
migration to places like Mumbai, Hyderabad and Bangalore enabled migrant households to
accumulate because of the relatively higher wages and absence of middlemen. Migrants were
predominantly from the lower social strata of SCs, STs and BCs (95 per cent). They were mainly
illiterate, landless labourers and marginal farmers.
The WORLP surveys (Panda 2005) found that skilled workers did particularly well in getting
remunerative work in brick-kilns and construction sites. While this did not mean that migration was
viewed as the ideal form of employment, it was certainly seen as better paid and more secure than
employment in the village.
10.3 Debt And Migration
In some cases migration reduces the need to borrow. In a village in southern MP studied by
Llewellyn, migration to brick kilns has reduced borrowing from moneylenders, and reduced bonded
labour. Migrant work appeals to villagers because it presents the chance to earn more money or a
larger in-kind payment than they could earn in the village. Llewellyn states “In a shock situation,
people who previously would have had no choice but to submit to a year’s bonded labour for
Rs.5000 can now weigh the option of soliciting an advance from a contractor and migrating
instead.”

But the relationship between debt and migration is not straightforward. While some analysts have
concluded that migration increases debt levels because of higher expenditures during transit and at
the destination, others have argued that migration improves the creditworthiness of households and
they are able to borrow more because of that (Ghate, 2006).
10.4 Exclusion From Government Services
All migrants are excluded from government schemes to varying degrees. Entitlements to services
are based on residence and the “ration card” is a key document to access subsidised food under the
public food distribution system (PDS) and various other schemes. To obtain a ration card one must
first prove one’s poverty status and obtain a below the poverty line (BPL) certificate. Other schemes
for specific communities such as SCs and BCs require a caste certificate. Corruption and
mistargeting in the allocation of certificates has been well documented and as a rule those who are
more influential in the village and able to spend on bribes are able to get the necessary documents
faster.
Two programming examples – namely education and access to subsidised food - offer particularly
interesting insights into the opportunities and pitfalls of introducing social protection for migrant
workers. Here we draw on case studies of schemes that have aimed to provide subsidised food and /
or schooling to migrants in four Indian states (Orissa, Maharashtra, Rajasthan and Andhra Pradesh).
10.5 Education
Children who migrate on their own or migrate with their parents miss school. There are no official
estimates of the numbers of migrating children out of school but 6 million is now a widely accepted
figure for India (AIF 2006). The inability to educate children perpetuates poverty beyond the
present generation into the next one and the government of India recognises the need to reach
migrating children, at least through legislation. The underlying assumption is that educating the
children of poor workers will interrupt the intergenerational transmission of poverty.
The scheme for universal primary education, the Sarva Shiksha Abhiyan (SSA) and the Education
Guarantee Scheme and Alternative and Innovative Education (EGS & AIE) programme promise a
number of facilities to make education more accessible to mobile children. These include mobile
schools, examinations on demand; bridge courses, residential camps and drop-in centres for street

49
and slum children. The goals of the SSA are shown in Box 1. Within these programmes, three
experiments are reviewed across very different state contexts in terms of the political milieu.
Box 4 Goals of the Sarva Shiksha Abhiyan (SSA)
• All children in the 6–14 age group in school/EGS centre/bridge course by 2003
• All children in the 6–14 age group complete five years of primary education by 2007
• All children in the 6–14 age group complete eight years of schooling by 2010
• Focus on elementary education of satisfactory quality with emphasis on education for life
• Bridging of all gender and social category gaps at primary stage by 2007 and at elementary
education level by 2010
• Universal retention by 2010
10.6 Schools for sugarcane workers’ children (“sakharshala”) in Maharashtra
At study26 in six districts in Western Maharashtra by the Centre for Development Research and
Documentation in 2003 found that roughly 200,000 children migrate with their parents and half of
them are in the age group of 6 – 14. In Maharashtra the SSA is implemented through the Mahatma
Phule Sikshan Hami Yojna (MPSHY) which became operational in 2002. A government order
makes it mandatory for sugar mills in the state to provide education to migrant worker’s children
through the MPSHY.
Janarth, an NGO based in Aurangabad in Maharashtra, set up the first schools for migrant workers’
children (sakharshalas) in 2002-2003 at two sugar factories. These schools together had a capacity
for teaching 600 children. Janarth now runs 126 sakharshalas covering 15,000 children. Other
NGOs in the state have also begun to run sakharshalas. Although the number of sakharshalas is
growing steadily, progress is slow. Research by Janarth has identified several reasons for this
including:
a) It is difficult to prove how many migrant children there are in order, make a case for
addressing the problems that they face. A majority of the migrants at sugar factories are
seasonal migrants and these are not counted properly by official surveys such as the
26 6406 households were selected randomly from 25 sugar factories

National Census and National Sample Survey. As a result they are not recognised by
Government.
b) Children are critical to household livelihoods forcing their parents to make difficult choices
about sending them to school. Children often work in the field, making bundles of sugar
cane tops which are sold as fodder for about two rupees each. Older children work with their
parents or help with chores and looking after younger siblings. The children are effectively
working in one way or another from the age of six and sending them to school involves an
opportunity cost for the parents. Sugarcane cutters are among the poorest labouring groups
in the country (famously described by Jan Breman as being worse off than dogs because of
their harsh living and working conditions)
c) Lack of economic, social or political incentives for factory officials to implement the
scheme because there are no immediate gains for them. Successful schools have come up
only in locations where NGOs have lobbied government officials and sugar mills.
d) Social exclusion of migrant children who belong to the Scheduled Castes or Scheduled
Tribes. Teachers and other students discriminate against children from poor backgrounds
and this may take the form of verbal and physical abuse
e) Insufficient resources for effective implementation. The MPSHY pays for a teacher’s salary
(Rs1500 a month) only when the sakharshalas are running, and for educational materials (Rs
40 per child) and miscellaneous expenses (Rs. 1000 per centre). This is based on the
assumption that other essentials will be provided by existing government education
schemes. However, given the problem identified in a) above, provision of resources through
government education schemes is not necessarily made and so the meagre resources under
MPSHY are insufficient to run a school properly
f) The linkages between schools at sugarcane factories and village schools were weak or non-
existent. Janarth found that few children went to school when they returned to their villages.
The migration season coincides with the second trimester of the school and the children
return to face final exams at the school (if the school lets them sit for the exams) which they
often fail even though the sakharshalas follow the government curriculum. They then lose
interest if they have to repeat the same class. It was not possible for the Janarth to follow up
their education in the village.
g) There were different groups of children at the factory each year. Continuity in teaching
would be possible only if all sites had a similar school and this has not happened yet.
h) Only a few other NGOs have also started similar schools and the total capacity of
Sakharshalas is still relatively small.

51
Schools, hostels and bridge courses for Oriya brick kiln workers’ children in Andhra
Pradesh.
In 2004-2005, two NGOs - Vikalpa and Lok Drishti - started running 16 hostels in the high
outmigration districts of Bolangir and Nuapada. Migrating parents had the option of leaving their
children behind in the hostels where they would continue with their schooling. By 2005-2006,
schools had been established in 60 villages covering 1,700children. Vikalpa also established bridge
courses (courses meant to help children to catch up with missed school lessons) in sending villages
for returning migrant children.
At the same time, Action Aid and local NGOs such as Sristi to set up schools at brick kilns in
Andhra Pradesh for children migrating with their parents. There are currently three areas under this
programme (Rangareddy, Timmaipalli and Medak) covering more than 2700 children. Oriya
speaking teachers are recruited to teach the children in the Oriya language, and Oriya text books are
arranged for these site schools. Classes are either run in temporary structures at brick kilns or in
nearby government schools. The running of the schools has been possible
Like the sugar plantations and factories of Maharashtra, taking children away from work in the
brick kilns was a challenge and creating awareness among officials and employers involved
constant lobbying and advocacy. The situation was complicated further by the strong relationships
between political interests and contractors which made it difficult to improve the conditions of
employment and educate the children of kiln workers. A number of large labour contractors who
supply tribal workers to brick-kilns in Andhra Pradesh also hold important official positions in
government. There are strong vested interests in keeping the workforce pliable and poor so that
cheap labour continues to be available for brick making. The experience of NGOs working with
cross-border migrants has shown that it is difficult for any contractor to be prosecuted in another
state and there have been very few cases to date. In such a context educating the children of tribal
migrant workers has required continuous monitoring. The continuation of these efforts depends on
securing political commitment and resources.
Overall, the education case studies from Andhra Pradesh and Maharashtra show that simply passing
a law or government order has not been enough to ensure that migrant children are educated. A
number of other prerequisites need to be in place and a few NGOs have been making efforts to
create these conditions so that the SSA and other programmes can be more effectively utilised. The

case studies illustrate the importance of civil society and local government working together to
achieve the goals set out in national enabling legislation; they also show how changing political
priorities and cross-border issues can interfere with the upscaling and sustainability of such efforts.
10.7 Food
In India foodgrains are allocated to the States by the Food Ministry under the Targeted Public
Distribution System (TPDS) on the basis of state poverty levels and on the directions of other
Ministries for welfare schemes (Rural Development and Human Resource Development). The
foodgrains are provided to BPL (below the official poverty line) households through more than
400,000 Fair Price Shops covering 160 million families. The scale of this welfare programme
makes it the largest distribution network of its type in the world, at least on paper (Saxena 2007). A
Planning Evaluation Organisation study in 2005 found that about 58 per cent of the subsidized
foodgrain did not reach the intended beneficiaries because of identification errors, nontransparent
operation and corrupt practices in the implementation of TPDS. There are errors of wrong inclusion
and of “ghost” cards and non-BPL households being included (Saxena 2007). Performance is
geographically uneven with “backward” states such as Bihar and Jharkhand showing very poor
results.
10.8 Temporary Ration Cards for Intra-State Migrants In Nashik City, Maharastra.
Nashik city is an important religious and industrial hub and attracts a large number of seasonal
migrants. It had a population of 1.1 million according to the 2001 census. Seasonal migrants to
Nashik are predominantly tribal and come from poorer parts of the state (districts of Marathwada
and Vidarbha), and also other states (Andhra Pradesh, Bihar, Gujarat, Karnataka, Madhya Pradesh
and Uttar Pradesh) (Borhade 2006). These migrants typically seek work in the city for 8–10 months
of the year, between October and June. They usually go back to their villages during the monsoon
and festive seasons.
Migrant workers stand at labour recruitment points or “nakas” waiting for prospective employers.
However, whether or not they find work, seasonal migrants are typically unable to access PDS at
their work destinations because PDS cards are not portable. Whilst Maharashtra was one of the first
states to pass a Government Resolution (GR) in 2000 allowing seasonal migrants to obtain
temporary ration cards after surrendering their ration cards in the village, the resolution was not

53
implemented and it took years of lobbying by NGOs in Nashik city, before cards were actually
issued.
In 2004 Disha Foundation began working at four nakas, covering roughly 350 migrant households.
A third of the migrant workers found at the nakas were single men and the rest were families. A
majority of the migrants were illiterate. Men usually work as manual construction labourers while
women are employed as domestic workers, head-loaders or agricultural labourers. Most of these
migrants did not have PDS cards and were not aware of the government resolutions and their rights
to a temporary card. They faced acute food shortages when they didn’t get work and often had to
resort to begging.
The existence of the Government Resolution was discovered by Disha Foundation during the course
of its own research. It then brought this to the notice of the relevant authorities who themselves
were unaware of its existence and provisions. This is not untypical in a country where there are
numerous laws and resolutions and only those with high political value are implemented properly.
Disha Foundation met officials repeatedly and explained the provisions under the GR and the
responsibility of the authorities to them. Following consultations with representatives of the Public
Distribution System and the Ration Department, and three on-site visits by the authorities, an order
was issued to provide seasonal migrants with temporary ration cards for four months (extendable to
12 months) against their existing ration cards. Seasonal migrants must have the cards cancelled by
the ration department when they return to their villages and these can be renewed when they return.
Progress has been slow: thus far a mere 25 cards have been issued to the families that Disha
Foundation is working with. Possible explanations for this are a lack of clear directions from
superiors that the implementation of the scheme must be expedited; low political value of the
scheme because migrants are not voters and therefore the bureaucracy does not have to be
accountable to them.
10.9 Poor Implementation Of Labour Laws
The discussion of employment in different sectors showed that labour laws are not adhered to and
flouting them is the norm. Minimum wage and equal remuneration laws are not implemented
properly and neither is the Inter-State Migrant Workmen Act. The case studies also showed that
child labour is rampant although the Constitution of India states that no child below the age of 14
years shall work in any factory or mine or engage in any other hazardous employment (Article 24).

The Child Labour (Prohibition and Regulation) Act, 1986 prohibits the employment of children
below the age of 14 years in 13 occupations and 57 processes that are hazardous to their lives and
health. The Factories Act, 1948, prohibits the employment of children below the age of 14 years in
factories. A new law was enacted in 2006 which bans domestic work and restaurant and hotel work
by children under the age of 14. However, enforcement of these laws is weak and employers are
rarely punished.
One of the reasons for the continuing neglect of these violations is that official inspection system is
seriously under-resourced (personal communication labour department officials in Karnataka who
cannot be named). The underlying problem is a lack of political commitment and pressure from
politically influential industrialists and farmers to maintain the status quo.
11. Findings from AP and MP
This section draws on the analysis of three surveys conducted in 2001-2, 2003-4 and 2006-7 under
the DFID funded Livelihood Options Project (LOP) and follow up studies in twelve villages (6
each) in Andhra Pradesh and Madhya Pradesh. Data were collected from twelve villages in
Madhya Pradesh and Andhra Pradesh (6 each) in 2001/2, 2003/4 and 2006/7. Both quantitative and
qualitative data were collected as it was felt that relying on questionnaire surveys alone would not
provide a complete understanding of migration. Three contrasting districts were chosen for study in
each state. In each district two villages were selected, one relatively well connected in terms of road
connectivity and proximity to market and urban centres and the other relatively remote. It was
hoped that studying such contrasting villages would provide insights on the importance of
connectivity, rural urban links and market links in livelihood diversification27. Village selection was
done in consultation with the district administration, academics, NGOs and other key informants.
Each round involved more than one survey. The 2001/2 round began with a census covering all the
households in all six villages (4,647 households in AP and 1,297 households in MP). The census
collected data on basic household characteristics on the household structure, education, age, gender,
occupations, asset ownership and whether or not the household had a migrant. This was followed by
two seasonal surveys in the kharif and rabi seasons where data on household income and
expenditure for that season and debt levels were collected. Each seasonal survey covered a smaller
27 The data were originally collected for a DFID funded project on understanding livelihood diversification strategies in Madhya Pradesh and Andhra Pradesh.

55
stratified sample of 40-80 households (depending on the size of the village). Stratification was done
by land holding and caste. The primary purpose of the 2001/2 round was to collect data on
livelihood diversification and data on migration were minimal.
The next round in 2003/4 was undertaken with the specific purpose of collecting more detailed data
on patterns of migration, livestock keeping and land ownership and leasing. The last round was
undertaken in 2006/7 collecting detailed data on patterns of migration and income from non-
migration sources. While the 2003 resurvey covered all 6 villages as before, the last round covered
only 5 because the richest villages, namely KA in Andhra Pradesh and PR in Madhya Pradesh, had
very low migration rates. The sample sizes differ between the seasonal surveys for rabi and kharif
in 2001/2 and the 2003/4 and 2006/7 surveys, because the latter two rounds covered only
households with at least one person working outside the village. However they were drawn from the
same population and can be identified with a unique household number.
During each round, key informant interviews and Focus Group discussions were conducted at the
same time as the questionnaire survey. Key informants included migrant labourers, their family
members, Sarpanch (head of local government), members of the Gram Panchayat (local
government) , village and Mandal level government officials, labour recruiting agents (mestris),
District level officials, donor funded livelihood projects, the police and NGOs. Focus group
discussions were held with women and men in each village and each hamlet within the villages.
Migration rates in MP have been consistently higher than AP. The census from the first survey
(2001/2) showed that more than half the households in four out of six study villages in Madhya
Pradesh had at least one person who was a temporary migrant. The proportion was as high as 75 per
cent in the most remote and hilly tribal village (PT) with infertile soils. Data for the next round
consisted of 108 migrants and commuters; and drawn from a sample of 302 households shows that
the proportion of households with at least one person working outside the village was 36% in
2003/4. This included circular migrants, commuters and permanent migrants. The last round
included only five villages and comparing the situation in these five villages in 2003/4 and 2006/7 it
is seen that the proportion of households with at least one person outside the village had increased
to 52% by 2006/7 from 42% in 2003/4.
Household level data do not provide a complete picture of mobility. Data for individuals show that
while the number of households with migrants and commuters had increased from 106 to 136

between the last two rounds, the total number of individuals had increased from 169 in 2003/4 to
232 in 2006/7.
11.1 Commuting Is On the Rise
There has been more than a doubling in the proportion of commuters in Andhra Pradesh between
the last two surveys. This dramatic change can be explained by the growing road network,
improved communications, and rapid rate of urbanisation in Andhra Pradesh especially the growth
of small towns. Data on the year of first migration and commuting (not shown in a table)
corroborates the view that mobility has sharply increased over the last five years or so. The findings
show that for 55.4% of commuters the year of first commuting/migration falls between 2000 and
2006 and for 40.3% of commuters the first year of commuting/migration fell between 2003 and
2006.
Commuting was undertaken for work of all kinds – in the formal sector as well as informal skilled
and unskilled work, farm and non-farm work. Although the absolute number of commuters
increased, their relative proportion fell because of a greater increase in the number of circular
migrants. A significant proportion of commuters were travelling to nearby towns. Permanent
migration rates were lower than other kinds of mobility and there were just two cases in 2006/7.
The explanation lies in the fact that MP is comparatively backward with a very poor road network
(it is said that this was one of the reasons for the defeat of the previous government) and has
relatively lower levels of urbanization. Commuting is therefore difficult and people tend to migrate
on a short-term basis to large cities within the state and outside.
11.2 Migration highest among Scheduled Castes and Tribes
The distribution of mobile workers by caste categories in AP and MP in 2006/7 reveals that circular
migration is the most important option for the Scheduled Tribes. There are hardly any permanent
migrants among the STs probably because of their poorer levels of skills/education and also lack of
social networks at the destination. SCs in AP are marginally ahead of the STs in this respect but
they commute for low paid agriculture labour work. The distribution of the mobility streams among
the OBCs, shows a more balanced spread indicating their intermediate level in the rural hierarchy.
In line with the broad state level trend in AP, the largest proportion of mobile workers among the
upper castes is permanent migrants.

57
Logistic regression analysis was carried out for commuters and, circular migrants and permanent
migrants with 2001/2 and 2003/4 data (ref). In AP belonging to a well connected village in a
prosperous region increased the likelihood of commuting and belonging to a remote village in a
poor region decreased it28. In MP, significant predictors are land holding, stock of livestock, caste
and gender of commuters. Other predictors are not statistically significant. The probability of
commuting was seen to decrease significantly with the increase in land and livestock holding.
Households having an additional acre of land per adult member have about 90% less probability of
commuting than households with an average level of holding. Women’s probability of commuting
was more than four times higher than males.
12. Human Development Impacts
Income data were available for both 2001/2 and 2006/7 for only 155 households with mobile
earners (commuters, seasonal and permanent migrants) from 5 villages; the sample distribution by
village is reported in Table 9. These households were drawn from 300 households surveyed in
2001/2. While all the households were migrating households in 2006/7, this was not the case in
previous rounds where some were non-migrants.
Table 9. Distribution of Migrant Households In Sample Villages, 06/07 Survey, Andhra
Pradesh, India
Villages
Frequency Percent
OP 24 15.5
VP 31 20.0
KO 33 21.3
GU 38 24.5
MD 29 18.7
Total 155 100.0
28 Permanent migration was almost absent in MP.

12.3 Migration and poverty status in AP
Head count income poverty was calculated using poverty lines of Rs 3100.68 per person per annum
for 2001/2, and Rs 4028.65 per person per annum for 2006/7. These poverty lines were computed
using GDP deflators and the Andhra Pradesh rural poverty line of Rs 292.95 per person per month
for 2004/529.
Households were first classified as poor and non-poor based on the poverty line for both 2001/2 and
2006/7. It was possible to trace the poverty status of the same households over a period of five years
and those who remained poor in both periods were classified as chronically poor. Those who were
poor in one of the periods i.e. 2001/2 or 2006/7 were regarded as vulnerable. Those who were non-
poor in both periods were classified as stable. Poverty was proportionately higher among the
schedule tribes, marginal farmers and located proportionally more in poorly-connected villages
(Akter et al. 2008).
Comparing the two rounds of 2001/2 and 2006/7 and by tracing the situation of the same
households (using household ID) it was seen that the proportion of households with migrants in the
category of poor had gone down from 45% to 29% (table 10).
Using poverty transition matrices (see table 10) we calculate that the average mobility out of 100
households is 41; upward mobility is more than double the downward mobility. This is represented
in Figure 1. Upward mobility means movement from poor to non-poor and downward mobility is
the opposite. In this period the crude probability of becoming poor given that a person was non-
poor is 23% and the probability of escaping poverty given that a person was poor is 64%. It
appeared from the quintile based analysis that over this period 36.2% moved upward and 34.1%
downward; consistent with the developing country situation where immobility ranges from 30% to
40% over a five year period (Baulch and McCulloch 1998, Baulch and Hoddinot 2000).
Furthermore the analysis shows that upward movement is the highest (45.2%) among the most
experienced migrants (those who were already migrants in 2001/2 are taken here as the most
experienced migrants). This indicates positive contribution of migration towards poverty reduction.
More experienced people may be more resilient and are capable of using opportunities to move
upward. Although upward movement is the highest in the experienced cohort, the poverty head 29 The official poverty line for 2004/5 was updated based on the 61st round of National Sample Survey Organisation (NSSO) conducted in 2004/5 using the Expert Group Method (GOI 2007). According to this method the estimates of poverty are made by the Planning Commission from the large sample survey data on household consumer expenditure conducted by the NSSO. According to head count method the poor are the number of households which have per capita income below the poverty line, otherwise the households are non-poor.

59
count is still the highest (37.1%) in this group. This may be due to the fact that less poor households
entered migration and commuting streams in later rounds as they became more attractive with rising
wages and other factors.
Figure 1 Poverty transition categories, Andhra Pradesh, India
1. Chronic poor, Poor 2001/02,
Poor 2006/716%
2. Poor 2001/02, Non-poor 2006/7,
vulnerable28%
3. Non-poor 2001/02,
Poor 2006/7,
vulnerable13%
4. Non-poor 2001/02, Non-poor 2006/7, stable43%
Transition categories

Table 10 Poor/Non-Poor Transition Matrix by migration/commuter* category, Andhra
Pradesh, India
Poor’06/07 Non-poor’06/07 Total
No % No % No %
All Household
Poor’01/02 25 16.1 44 28.4 69 44.5
Non-poor’01/02 20 12.9 66 42.6 86 55.5
Total 45 29.0 110 71.0 155 100.0
Long term migrants
Poor’01/02 11 17.7 28 45.2 39 62.9
Non-poor’01/02 12 19.4 11 17.7 23 37.1
Total 23 37.1 39 62.9 62 100.0
Started migration in 03/04
Poor 2001/02 6 11.1 23 42.6 29 53.7
Non-poor’01/02 9 16.7 16 29.6 25 46.3
Total 15 27.8 39 72.2 54 100.0
New migrants’06/07
Poor’01/02 3 7.7 15 38.5 18 46.2
Non-poor’01/02 4 10.3 17 43.6 21 53.8
Total 7 17.9 32 82.1 39 100.0
* includes commuter, seasonal and permanent migration.
Pearson Chi-Square = 3.129, DF=1, Asymp. Sig. (2-sided) = 0.077 for ‘All Households’, Pearson
Chi-Square = 3.562, DF=1, Asymp. Sig. (2-sided) = 0.059 for ‘Long term migrants’, Pearson Chi-
Square = 1.569, DF=1, Asymp. Sig. (2-sided) = 0.210 for ‘Started migration in 03/04’ and the test is
not applicable for ‘New migrants’06/07’ because 2 cells have counts less than 5.
Data source: Livelihood options study surveys: rounds 2001-2 and 2006-7.
The results show that the first more experienced group started to earn more from migration by
2006/7; the income share from migration was 14% in 2001/2 and that increased to 60% in 2006/7
(Table 11). This group had the lowest per capita income in 2001/2 and other better off households

61
entered migration later. The other groups which were relatively richer were earning more than 50%
of the income from other sources than migration/commuting.
Table 11 Impact of migration/commuting on household income, Andhra Pradesh, India
Category N Migration
income %
Per capita income in 01/2
(06/7 prices)
Per capita income in 06/7
01/2 06/7 Mean Median Std
Dev
Mean Median Std
Dev
Long term
migrants
62 14.1 60.3 7035 4464 6698 7452 4642 6927
Started migration
in 03/04
54 - 48.2 8417 4054 16685 8172 4200 17058
New
migrants’06/07
39 - 46.2 9418 3193 21162 10998 7929 13609
All Household 155 3.14 52.5 8110 4077 14965 8603 5383 12823
12.4 Political Participation
Questions related to political participation were included in the rabi 2002 questionnaire in Andhra
Pradesh30. A total of 360 households from 6 villages were interviewed to assess participation in
socio-political/administrative forums and voting. Data were collected on a number of dimensions of
political participation including attending meetings, raising issues, voting, campaigning and
communicating with officials.
30 The data were collected for a component on political participation under the Livelihood Options Project

Table 12 Distribution of politically active households in 2001/2 in migration and commuting
Political activities in 2001/2 % said yes % of non-migrant
saying yes
% of Migrants/
commuters saying yes
Attend Gram Sabha (GS) 65.6 66.5 63.2
Speak at GS 21.4 23.2 17.0
Raise issues at GS 61.1 60.2 63.2
Attend district meeting 3.6 3.5 3.8
Attend Mandal meeting 5.8 4.7 8.5
Attend watershed /forest
committee meeting (WFM) 6.1 6.3 5.7
Vote Gram Panchayat 85.0 86.2 82.1
Campaign GP election 22.2 22.0 22.6
Vote Mandal election 95.6 95.7 95.3
Campaign Mandal election 15.8 15.0 17.9
Vote Zilla Parishad 74.4 72.8 78.3
Campaign Zilla Parishad 6.1 4.3 10.4
Vote Assembly 68.1 65.4 74.5
Campaign Assembly 5.8 4.7 8.5
Vote Lok Sabha 66.9 65.7 69.8
Met MDO Official 22.8 23.2 21.7
Met MRO Official 23.9 22.0 28.3
Met VAO/VS/RI 41.1 37.8 49.1
Collective protest 5.0 5.9 2.8
Total households 360 254 106
The data clearly show that participation in voting was the highest among various political activities
with the highest levels of participation (96%) in Mandal elections followed by village council
(Gram Panchayat or GP) elections (85%), District Council (Zilla Parishad) elections (74%), State
Assembly elections (68%) and parliamentary elections (Lok Sabha) at 67% (Table 12). This may be
due to the fact that campaigning for district, mandal and village elections was greater than national
elections and/or because voters perceived those elections as more important for their welfare.
Households with migrants participated in elections in similar proportions because family members

63
voted while the migrants were away. One would expect migrants to be less able to participate in
elections but it is not possible to comment on this because political participation data was not
collected for individuals. The proportion of households with migrant/commuters who participated in
Zilla Parishad, Assembly and Lok Sabha elections was higher, possibly because of their greater
levels of awareness (due to contact with the outside world) of the importance of higher level
elections.
The data also show that those who migrate are slightly less able to participate in the Gram Sabha
(village assembly) which is the key forum for microplanning and discussing issues that have a
direct bearing on the lives of the poor such as welfare schemes and microfinance initiatives: 66% of
the respondents said that they attended the Gram Sabha; the proportion from migrating households
was 63% while the proportion from non-migrationg households was 67%; 21% said they spoke at
the GS, the proportion was 17% from migrants group. However the differences were not
statistically significant; also, proportionately more migrants raised issues at the GS, although here
too the difference was negligible.
Less than half (41%) of all respondents said that they had met the Village Accounts Officer (VAO)
showing how inaccessible the VAO is despite being the key signatory for essential documents
needed by village residents for accessing government schemes (caste certificate, below poverty line
certificate, widow certificate etc). Here, the proportionate participation of migrants was 49% which
was higher than non-migrants possibly because they were able to assert greater pressure on the
VAO due to their superior confidence, reduced subservience to traditional masters, and knowledge
of political processes. Even fewer people (24%) met the Mandal Revenue Officer (MRO) also a key
person for accessing government schemes, probably on account of the distance and cost involved in
travelling to the Mandal Office. The proportion of migrants among those who met the MRO was
28%, also higher than non-migrant category possibly because they had more money to spend on
transport and more confidence in dealing with officials due to their exposure to the outside world.
Roughly 23% of the respondents said that they met the Mandal Development Officer (MDO)
another important official for accessing government schemes, and here the proportion from
migrants and non-migrants categories was nearly the same. While campaigning in GP elections
attracted 22% of the respondents, and equal proportions from migrants and non-migrants,
campaigning in other elections involved fewer people but migrants made up a much higher
proportion of the campaigners. About 50% of the campaigners in the Zilla Parishad elections and
43% in the State Assembly elections were migrants (the proportion of migrants in the sample was
29%). Qualitative cross checking reveals that this was because of the timing of the campaigning
which occurred when migrants were back in the village.
A striking figure is that only 6% of the respondents said that they attended watershed or forest
committee meetings and the proportion was nearly the same for migrants and non-migrants. The
reason for this low figure is that not all the villages had watershed and forestry projects and perhaps
also because attending them was not perceived as important by them or they could not attend them
due to other time commitments. Mandal and district meetings were poorly attended by villagers in
general but the proportion of migrants among the attendees was slightly higher. However the actual
numbers of migrants in these last two categories were too small to draw any definite conclusions.
Qualitative data for the same period show that different groups of migrants had different levels of
participation in political processes in the village through the gram sabha. The vaddis who are a caste
of diggers and stone crushers (BC) from Chittoor district, have become very influential politically
in their village. Digging work has brought them much wealth which can be seen from their new
multi-storeyed houses in the village and generous donations to the temple. On the other hand
communities which have remained poor in the village despite migration and entire families
migrating have been less represented during GP meetings.
Thus the analysis shows that where political access is restricted, it is more or less equally restricted
to both migrants and non-migrants and where access is greater, it is more or less equally accessed
by both migrants and non-migrants. Although migrants did seem to do better at accessing certain
processes and personnel, the differences were not significant. Multivariate analysis presented
below, provides more insights into political participation.
12.5 Multivariate Analysis: Political Participation
This section is based on logistic regression analysis that considers different bivariate participation
activities (yes or no) such as speaking and raising issues in the Gram Sabha, voting in elections (two
variables – one representing voting in local government elections and the other is voting in state
assembly elections), meeting officials etc. as dependent variables and a set of household
characteristic and social factors as independent variables.
Political participation is assumed to be associated with household characteristics such as age and
education, social status, caste and gender, connectedness of the village (remote or well-connected)

65
and information sources. In the Indian rural context social status is often determined by access to
land, more ownership means better status and better political access. Age and education may
increase political awareness and this would result in more political participation. Social factors like
gender and caste may also be related to political access; women and historically disadvantaged
groups such as lower castes and tribes would be expected to participate less in the political process.
Families with migrants or commuters may have better access to information and hence participate
more in political activities, conversely, adult members may be away due to migration/ commuting
and so may not be able to take part in political activities. Three of the 6 villages studied were well
connected to urban centres and those who live in the well connected villages are expected to be
better informed and more politically active. These variables are defined in the first column of
Tables 13&14. Logistic regression analysis was chosen because the dependent variable is a binary
choice of participation and thus restricted to 0 and 1. Another candidate could be probit, but
exponents of logit coefficients are odds (ratios of success to failure; here ratios of politically active
to non-active) that are easier to interpret. The goodness of fit of all models is statistically significant
shown by Wald chi square statistics. The results, in general, show that households with more land,
with a younger head of household, more family education, more adult male members, and migrants
are more politically active.
Table 13 reports the relationship between speaking and raising issues in the Gram Sabha. The
significant variables that are mostly associated with speaking at the GS are migration and village
connectedness. Households with migrants/commuters had less than half the probability of speaking
at the GS than the non-migrant household. It is not clear whether this was because they were not
able to attend the meeting due to their absence or whether they were prevented by others from
speaking at the GS on account of being regarded as part-time residents with livelihood sources
outside the village or, whether they were not interested in the GS process themselves.
Participation in the GS is lowest in the prosperous coastal villages of KO and KA. This data was
collected when the Telugu Desam Party (TDP) was in power before the Congress government took
over in 2004. It was a time when the Gram Sabha was widely perceived as a powerless forum, in
which panchayat leaders would simply confirm decisions already taken by the sarpanch and other
GP leaders (Johnson, Deshingkar and Start 2002). However the GS was used to select beneficiaries
for the well funded Janmabhoomi and Food for Work programmes. The MDO was consistently
involved in GS meeting during that time. It has been argued that TDP’s populist policies such as the
Janmabhoomi programme and village level institutions created by line departments such as the

Water Users Associations, Forest Management Committees and Self Help Groups became powerful
at the expense of decentralised government (Manor 2002, Reddy 2002, Mathew 2001). The TDP’s
electoral success depended on the support of the Backward Castes (BCs), SC and BC women and
landless labourers (Moooij 2002, Suri 2002). These village institutions were particularly powerful
in coastal areas and this may explain the reason for low levels of participation in the Gram Sabha.
Regarding raising of issues at the Gram Sabha, the number of adult males in the household and
gender of the head of the household along with village connectedness are significant determinants.
The probability of participation in this activity is 43% higher for the households having an extra
adult male member in the family indicating male dominance in this activity, However the
participation of female heads of households was very high indicating that they were able to
participate and raise issues in an otherwise male-dominated forum, also probably because of the
Janmabhoomi programme and women’s self help groups. All houses in the village MD participated
in this activity. VP, KO and KA appear to have the lowest probability of participating. Family
education appears to play some role in speaking and raising issues but not significant at 5%.
Table 13 Logistic regression analysis showing relationship between speaking/raising issues at
GS and associated factors, Andhra Pradesh, 2001/2
Variables Coef. Odds
ratio
Robust Std. Err. z P>|z|
Speak at Gram Shava (GS)
Land own (acres) 0.025 1.025 0.014 1.730 0.084
Age of household head (years) -0.008 0.992 0.013 -0.640 0.523
Head education (years) 0.025 1.026 0.048 0.530 0.596
Av education of 6 plus members 0.140 1.150 0.074 1.880 0.060
Gender (head is female) 0.557 1.745 0.634 0.880 0.380
Member in migration/commuting -0.906 0.404 0.372 -2.440 0.015
Adult male 18 plus 0.142 1.152 0.190 0.750 0.455
Adult female 18 plus -0.097 0.907 0.267 -0.360 0.716
Schedule tribe* 1.239 3.451 0.991 1.250 0.211
Schedule caste 1.046 2.845 0.560 1.870 0.062
Backward caste 0.455 1.577 0.418 1.090 0.276

67
Village dummy (VP=1)* 0.496 1.642 0.486 1.020 0.308
Village dummy (KO=1) -4.213 0.015 1.043 -4.040 0.000
Village dummy (KA=1) -3.451 0.032 0.850 -4.060 0.000
Village dummy (GU=1) -0.900 0.407 0.497 -1.810 0.070
Village dummy (MD=1) -0.717 0.488 0.640 -1.120 0.263
Constant -1.181 1.034 -1.140 0.253
No. of obs = 359, Wald chi2(16) = 66.90, Prob > chi2 = 0.00, Pseudo R2 = 0.27
Raise issues at GS
Land own (acres) 0.078 1.081 0.047 1.640 0.101
Age of household head (years) -0.017 0.983 0.009 -1.860 0.062
Head education (years) -0.019 0.981 0.037 -0.520 0.603
Av education of 6 plus members 0.044 1.045 0.052 0.840 0.403
Gender (head is female) 1.086 2.963 0.462 2.350 0.019
Member in migration/commuting -0.058 0.944 0.263 -0.220 0.825
Adult male 18 plus 0.358 1.431 0.170 2.110 0.035
Adult female 18 plus -0.211 0.810 0.190 -1.110 0.266
Schedule tribe -0.066 0.936 0.697 -0.090 0.925
Schedule caste 0.487 1.627 0.372 1.310 0.191
Backward caste -0.194 0.824 0.296 -0.650 0.513
Village dummy (VP=1) -1.063 0.345 0.401 -2.650 0.008
Village dummy (KO=1) -1.073 0.342 0.402 -2.670 0.008
Village dummy (KA=1) -0.945 0.389 0.452 -2.090 0.037
Village dummy (GU=1) -0.602 0.548 0.404 -1.490 0.137
Constant 1.353 0.608 2.220 0.026
No. of obs = 359, Wald chi2(15) = 27.80, Prob > chi2 =0.02, Pseudo R2 = 0.07
* Other caste is the base and the base village is OP in Tables P1, P2 and P3.

Table 14 Logistic regression analysis showing relationship between voting elections and
associated factors, Andhra Pradesh, 2001/2
Variables Coef. Odds
ratio
Robust Std. Err. z P>|z|
Vote Gram Panchayat
Land own (acres) 0.008 1.008 0.048 0.160 0.876
Age of household head (years) -0.005 0.995 0.015 -0.360 0.722
Head education (years) 0.077 1.081 0.060 1.290 0.197
Av education of 6 plus members 0.031 1.032 0.087 0.360 0.718
Gender (head is female) 0.518 1.679 0.650 0.800 0.425
Member in migration/commuting -0.728 0.483 0.468 -1.550 0.120
Adult male 18 plus 0.503 1.654 0.297 1.690 0.090
Adult female 18 plus 0.050 1.051 0.395 0.130 0.900
Schedule tribe -0.502 0.605 0.810 -0.620 0.536
Schedule caste 0.699 2.011 0.569 1.230 0.219
Backward caste 0.520 1.682 0.529 0.980 0.325
Village dummy (VP=1) -1.052 0.349 1.176 -0.890 0.371
Village dummy (KO=1) -3.684 0.025 1.077 -3.420 0.001
Village dummy (KA=1) 0.566 1.762 1.519 0.370 0.709
Village dummy (GU=1) -0.417 0.659 1.214 -0.340 0.731
Village dummy (MD=1) 0.716 2.046 1.615 0.440 0.657
Constant 2.332 1.362 1.710 0.087
No. of obs = 359, Wald chi2(16) = 74.90, Prob > chi2 = 0.00, Pseudo R2 = 0.38
Vote Assembly
Land own (acres) -0.028 0.973 0.018 -1.490 0.136
Age of household head (years) 0.007 1.007 0.014 0.530 0.596
Head education (years) 0.091 1.095 0.051 1.790 0.073
Av education of 6 plus members -0.027 0.973 0.078 -0.350 0.729
Gender (head is female) -1.062 0.346 0.655 -1.620 0.105
Member in migration/commuting 0.502 1.652 0.401 1.250 0.211
Adult male 18 plus -0.425 0.654 0.239 -1.780 0.075
Adult female 18 plus 0.688 1.990 0.292 2.350 0.019

69
Schedule tribe 0.036 1.037 0.736 0.050 0.961
Schedule caste 0.608 1.836 0.493 1.230 0.217
Backward caste 0.393 1.482 0.445 0.880 0.377
Village dummy (VP=1) 0.277 1.319 0.804 0.340 0.731
Village dummy (KO=1) -4.167 0.016 0.703 -5.930 0.000
Village dummy (KA=1) -2.471 0.084 0.682 -3.620 0.000
Village dummy (GU=1) 1.477 4.379 0.944 1.570 0.118
Village dummy (MD=1) 1.566 4.788 1.375 1.140 0.255
Constant 1.056 1.075 0.980 0.326
No. of obs = 359, Wald chi2(16) = 121.98, Prob > chi2 = 0.00, Pseudo R2 = 0.50
Table 14 exhibits the relationship of voting with the same variables. The probability of voting in the
GP election is significantly lower in the coastal village of KO, other factors are not significant at the
5% level, although signs of the coefficients are similar to that obtained in the previous table. For
example, the probability increases with education but decreases with migration/commuting. Being
an adult male member increases the probability of voting. Regarding the National Assembly
election, the probability of voting was the lowest again in the coastal villages KO and KA, probably
for the reasons stated above.
Table 15 reveals the relationship of meeting MDO and MRO officials with the same independent
variables. Land ownership, caste status and village connectedness play a significant role in meeting
MDO officials. Lower castes appear to have more access to the MDO and MRO than higher castes
and this is most certainly due to the fact that these officials were travelling to villages at the time for
the Janmabhoomi programme meetings during which they would receive applications from people
for assistance and also disburse pensions and other benefits. Roughly 61% of the respondents met
the MROs for a ration card and 58% met MDOs regarding general development schemes. Under
normal circumstances such interaction with Mandal officials would be difficult for poor people
because of the transport costs involved. It is not clear how such interactions have fared since the
Janmabhoomi programme ended (with the change in government).
While education appears to influence political participation the results are not statistically
significant except for meeting MROs. Village connectedness and social factors are the most
important determinants of political participation across all political activities.

Table 15 Logistic regression analysis showing relationship between meeting officials and
associated factors, Andhra Pradesh, 2001/2
Variables Coef. Odds
ratio
Robust Std. Err. z P>|z|
Met MDO Official
Land own (acres) 0.051 1.052 0.023 2.170 0.030
Age of household head (years) -0.002 0.998 0.012 -0.160 0.876
Head education (years) -0.013 0.987 0.046 -0.290 0.775
Av education of 6 plus members 0.035 1.036 0.070 0.500 0.617
Gender (head is female) 0.165 1.179 0.567 0.290 0.771
Member in migration/commuting -0.157 0.855 0.357 -0.440 0.660
Adult male 18 plus 0.316 1.372 0.174 1.820 0.069
Adult female 18 plus 0.017 1.017 0.232 0.070 0.941
Schedule tribe 1.472 4.359 0.740 1.990 0.047
Schedule caste 0.463 1.589 0.458 1.010 0.312
Backward caste 0.448 1.566 0.381 1.180 0.240
Village dummy (VP=1) -0.252 0.777 0.442 -0.570 0.568
Village dummy (KO=1) -2.216 0.109 0.501 -4.420 0.000
Village dummy (KA=1) -2.799 0.061 0.633 -4.420 0.000
Village dummy (GU=1) -1.462 0.232 0.434 -3.370 0.001
Village dummy (MD=1) -2.750 0.064 0.770 -3.570 0.000
Constant -0.942 0.819 -1.150 0.250
No. of obs = 359, Wald chi2(16) = 59.46, Prob > chi2 = 0.00, Pseudo R2 = 0.19
Met MRO Official
Land own (acres) 0.090 1.095 0.040 2.250 0.024
Age of household head (years) -0.006 0.994 0.011 -0.530 0.595
Head education (years) -0.053 0.948 0.045 -1.180 0.238
Av education of 6 plus members 0.160 1.174 0.067 2.380 0.017
Gender (head is female) 0.759 2.136 0.510 1.490 0.137
Member in migration/commuting 0.201 1.223 0.314 0.640 0.522
Adult male 18 plus -0.133 0.875 0.181 -0.740 0.462

71
Adult female 18 plus 0.095 1.099 0.229 0.410 0.680
Schedule tribe 1.983 7.263 0.745 2.660 0.008
Schedule caste 1.209 3.352 0.487 2.480 0.013
Backward caste 0.511 1.667 0.409 1.250 0.211
Village dummy (VP=1) -0.385 0.681 0.474 -0.810 0.417
Village dummy (KO=1) -1.130 0.323 0.453 -2.500 0.013
Village dummy (KA=1) -2.787 0.062 0.622 -4.480 0.000
Village dummy (GU=1) -1.403 0.246 0.486 -2.890 0.004
Village dummy (MD=1) -1.380 0.252 0.614 -2.250 0.025
Constant -1.241 0.882 -1.410 0.160
No. of obs = 359, Wald chi2(16) = 50.83, Prob > chi2 = 0.00, Pseudo R2 = 0.14
12.6 Migration and Poverty Status In MP
In MP income data were available for 128 households with mobile earners (Table 16). These
households were drawn from 302 households surveyed in 2001/2.
Table 16 Distribution of sample villages, 06/07 survey, Madhya Pradesh, India
Villages Frequency Percent
LJ 47 36.7
GG 24 18.8
PT 23 18.0
SM 17 13.3
MB 17 13.3
Total 128 100.0
Head count income poverty in the MP sample was measured using poverty lines of Rs 3434.30 per
person per annum for 2001/2, and Rs 4462.25 per person per annum for 2006/7. These figures are
based on the Madhya Pradesh rural poverty line of Rs 324.48 per person per month for 2004/5 was
being deflated/inflated by GDP deflators to arrive at the values for the reference years. Of the 128
households which had at least one migrant/commuter in 06/07 in the Madhya Pradesh study
villages, 76 of them had migration/commuting income in 2001/2. Migration route reduced head
count income poverty from about 81% to 59% in this period of approximately 5 years beginning

01/02. Average mobility out of 100 households is 32; upward mobility is more than five times the
downward mobility (Figure 2). Upward mobility means movement from poor to non-poor and
downward mobility is the opposite. In this period the crude probability of becoming poor given that
a person was non-poor is 25% and the probability of escaping poverty given that a person was poor
is 34%.
Table 17 presents a transition matrix by experience based migration category; those who were
already migrants in 01/02 are more experienced. The analysis shows that unlike Andhra Pradesh,
proportionately more households were escaping poverty using the migration/commuting route.
Figure 2 Poverty transition categories in Madhya Pradesh
1. Chronic poor, Poor 2001/02,
Poor 2006/754%
2. Poor 2001/02, Non-poor 2006/7,
vulnerable
3. Non-poor 2001/02,
Poor 2006/7, vulnerable
5%
4. Non-poor 2001/02, Non-poor 2006/7, stable14%
Transition categories

73
Table 17 Poor/Non-Poor Transition Matrix by migration/commuter* category, Madhya
Pradesh, India
Poor’06/07 Non-poor’06/07 Total
No % No % No %
All Household
Poor’01/02 69 27.3 35 53.9 104 81.3
Non-poor’01/02 6 14.1 18 4.7 24 18.8
Total 75 41.4 53 58.6 128 100.0
* includes commuter, seasonal and permanent migration.
Pearson Chi-Square = 3.129, DF=1, Asymp. Sig. (2-sided) = 0.077 for ‘All Households’, Pearson
Chi-Square = 8.920, DF=1, Asymp. Sig. (2-sided) = 0.003 for ‘Long term migrants’, and the test is
not applicable for two other groups such as ‘Started migration in 03/04’ and ‘New migrants’06/07’
because 2 cells in each group have counts less than 5.
Data source: Livelihood options study surveys: rounds 2001-2 and 2006-7.
Table 18 shows that in MP the income pattern is different. Unlike AP, migration experience
reduced dependency on migration income in 06/07 in MP; the income share from migration was
45% in 01/02 that decreased to 35% in 06/07 for the group identified with migrants in 01/02. Those
who were early entrants into the migration route were less poor possibly because they were
extremely poor when they started to migrate. Households having migrants in MP are much poorer
than those in AP and their income inequality was also lower compared to AP.
On average, per capita income increased by Rs 2041, nearly double the per capita income in 2001/2
(which means that per capita annual income growth was around 14%). This growth in income is
much higher than the national average.
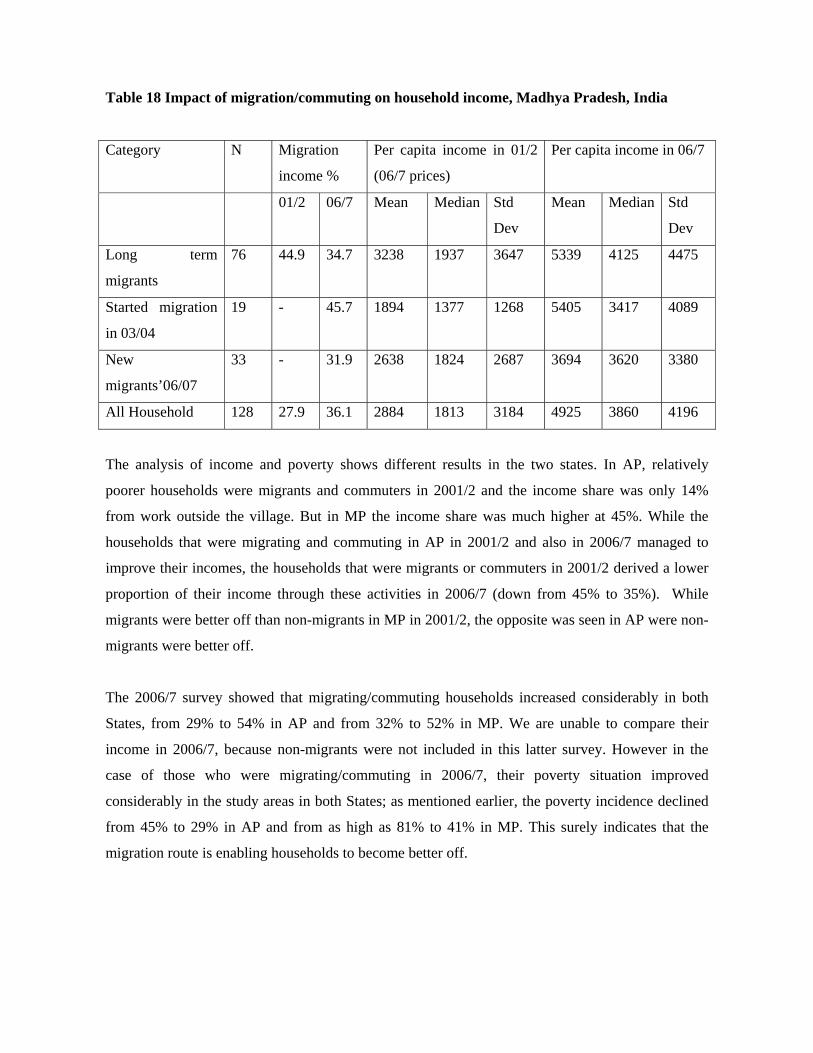
Table 18 Impact of migration/commuting on household income, Madhya Pradesh, India
Category N Migration
income %
Per capita income in 01/2
(06/7 prices)
Per capita income in 06/7
01/2 06/7 Mean Median Std
Dev
Mean Median Std
Dev
Long term
migrants
76 44.9 34.7 3238 1937 3647 5339 4125 4475
Started migration
in 03/04
19 - 45.7 1894 1377 1268 5405 3417 4089
New
migrants’06/07
33 - 31.9 2638 1824 2687 3694 3620 3380
All Household 128 27.9 36.1 2884 1813 3184 4925 3860 4196
The analysis of income and poverty shows different results in the two states. In AP, relatively
poorer households were migrants and commuters in 2001/2 and the income share was only 14%
from work outside the village. But in MP the income share was much higher at 45%. While the
households that were migrating and commuting in AP in 2001/2 and also in 2006/7 managed to
improve their incomes, the households that were migrants or commuters in 2001/2 derived a lower
proportion of their income through these activities in 2006/7 (down from 45% to 35%). While
migrants were better off than non-migrants in MP in 2001/2, the opposite was seen in AP were non-
migrants were better off.
The 2006/7 survey showed that migrating/commuting households increased considerably in both
States, from 29% to 54% in AP and from 32% to 52% in MP. We are unable to compare their
income in 2006/7, because non-migrants were not included in this latter survey. However in the
case of those who were migrating/commuting in 2006/7, their poverty situation improved
considerably in the study areas in both States; as mentioned earlier, the poverty incidence declined
from 45% to 29% in AP and from as high as 81% to 41% in MP. This surely indicates that the
migration route is enabling households to become better off.

75
12.7 Migration, Health and Education
Measurement of the impact of migration on human development indicators such as health,
education, consumption, income (in general, welfare) is difficult. McKenzie and Sasin (2007)
identified three sets of challenges that researchers face on analysing the impact of migration. The
first set relates to data and definition used, the second set relates to endogeniety/selectivity/omitted
variable problems; decisions on migration, expenditure allocation, education and health care
choices are usually made simultaneously. Many variables that explain migration also determine
expenditure choices making it difficult to establish causality. The third set relates to indirect socio-
economic effects (extra burden to members living in the origin, transferring knowledge/information,
exchange of ideas/culture, emotional stress on children etc.).
Our panel data has the advantage of having detailed information on skill specific jobs, migrants’
income and qualitative multiple responses on the purpose of spending migration income but lacks
quantitative indicators on health and education variables and income for non-migrant households. In
this situation, we decided to carry out informative cross-tabulation based on the data available in the
panel.
Regarding health and education, permanent and seasonal/circular migrants were asked to prioritise
their use of income from migration; one person was permitted to indicate four most important
purposes. The first choice identified health and education less important than consumption, paying
off debts and investment. In MP health/education and investment/savings were being valued nearly
equally (Deshingkar et al. 2008, Pramod et al. 2008). However, health was listed as the second most
important use followed by paying off debt and consumption. There are differences in opinion
between caste categories. In MP upper castes (the general caste category) placed most importance
to health/education, whilst in AP scheduled caste category listed it as most important.
When the multiple choices of the migrants on the purpose of spending migration income were given
equal weight without considering any ranking, health/education appeared as an important use of
migration income next to consumption, in both AP and MP (Table 19 and Table 20).

Table 19 Distribution of the responses on purpose of spending or planning to spend migration
income, Andhra Pradesh, India
2003/04 2006/07
Use of migration income Count % of
Responses
% of
Cases
Count % of
Responses
% of
Cases
Consumption 96 46.6 99.9 135 35.2 99.3
Education and health 52 25.2 54.8 99 25.8 72.8
Investment and savings 20 9.7 21.1 86 22.4 63.2
Paying off debt 38 18.4 40.0 64 16.7 47.1
Total responses 206 100.0 215.8 384 100.0 282.4
Data source: Livelihood options study surveys: rounds 2003-4 and 2006-7.
Table 20 Distribution of the responses on purpose of spending or planning to spend migration
income, Madhya Pradesh, India
2003/04 2006/07
Use of migration income Count % of
Responses
% of
Cases
Count % of
Responses
% of
Cases
Consumption 163 43.8 97.0 146 40.2 100.0
Education and health 79 21.2 47.0 99 27.3 67.8
Investment and savings 60 16.1 35.7 49 13.5 33.6
Paying off debt 70 18.8 41.7 69 19.0 47.3
Total responses 372 100.0 221.4 363 100.0 248.7
Data source: Livelihood options study surveys: rounds 2003-4 and 2006-7.
When the data are viewed by migration type (tables 21&22) it is seen that between 7.7 and 9.1% of
the migration income was spent on health across all categories. But the spending on education
showed variation with long term migrants (i.e. those who were already migrants in 2001) spending
proportionately more. This could be due to their improved economic situation which was allowing

77
them to send their children to school. This is confirmed through case studies and interviews.
However interestingly, the most recent migrants show higher spending on education than those who
started to migrate around 2003/4. The reasons for this are not clear as qualitative research did not
show any such pattern.
Table 21 Percentage expenses of temporary/circular migrants on Health and Education at the
destination, Andhra Pradesh, 06/07, India
Category N Migration income % spent on
health
% spent on
education
Long term migrants 56 18687 7.3 9.5
Started migration in 03/04 18 18957 9.1 1.6
New migrants’06/07 9 18336 8.1 4.1
All Household 83 18708 7.7 7.2
Table 22 Percentage expenses of temporary/circular migrants on Health and Education at the
destination, Madhya Pradesh, 06/07, India
Category N Migration income % spent on
health
% spent on
education
Long term migrants 116 4768 9.9 0
Started migration in 03/04 23 9287 19.8 0.2
New migrants’06/07 36 4424 12.3 0
All Household 175 5291 11.7 0
In MP average incomes from migration were lower but proportionate spending on health was
higher. Qualitative research shows that this was due to the poor state of public health services in
tribal areas where spending on private practitioners was high. In sharp contrast to AP, spending on
education was almost nil in MP.
This points to the fact that positive health impacts in terms of spending on health are felt with the
little bit of extra cash that migration brings in but the impacts on education are felt only after a
certain threshold of income has been crossed.
Case histories and focus group discussions in all the villages studied did show a range of positive
impacts such as having more disposable income to spend on health, clothes, food, education and
status-raising events such as marriages. But the qualitative research also showed that migration has
heavy costs and risks.
However as the discussion in Part II showed these costs are mainly due to faulty implementation of
labour laws and poorly designed propoor schemes which are based on rigid residence criteria.
Removing these distortions in the labour market and the policy regime should become top priority
for India.
13. Conclusion
Sector reviews and case studies show that migrant labourers live and work in extremely difficult
and dangerous conditions. They are on the margins of society both economically and socially and
face unnecessary high costs and risks because of non-recognition at the policy level and faulty
implementation of labour laws. Both secondary and primary data show that migration is an
important route out of poverty. But the impacts of migration on poverty reduction and the
contribution that migrants make to the economy are under-recognised. Our estimates show that
migrants contribute around 10% to the National GDP.
Nearly all sectors employ migrant workers (including children) through a complex system of
contractors and agents who are well-positioned to exploit illiterate and poor workers. Where
workers have become more experienced and confident the hold of market intermediaries has
weakened but in the absence of effective employment exchanges for the poor, agents and
contractors provide vital information and job opportunities to people who would otherwise be
unemployed in villages.
The lack of data and the laxity in implementing labour laws indicate an underlying lack of political
commitment to improving the lives of migrant workers (adults and children). India seems to be
struggling with being told by the ILO and labour unions on the one hand that labour laws need to be
made more stringent but being told at the same time by neo-liberal economists that existing labour
laws are too rigid and are stifling productivity. However there has to be a level beyond which

79
human rights violations will not be tolerated and India needs to take a stronger position on
protecting migrant workers.
The immediate need is to change the policy level discourse on migration by reviewing key
documents and policies and moving away from theory and language which portrays migration as
bad and something that must be stopped. Other Asian countries have recognised the need to support
migrant workers and reduce their vulnerability by improving their access to education, housing and
health programmes. India needs to take similar steps urgently.
Without such recognition and action large parts of the population will continue to be excluded and
this will compromise India’s prospects for poverty reduction and reaching the Millenium
Development Goals.

References
AIF (2006) Locked Homes and Empty Schools. Zubaan /America India Foundation, New Delhi.
Action Aid (2008a) Bonded workers freed from Jaipur sari hellhole. Available at
http://www.actionaid.org/india/index.aspx?PageID=3889
Action Aid (2008b) Just nuts: Supermarkets thrive on women cashew workers’ poverty.Available at
http://www.actionaid.org/india/index.aspx?PageID=2819
ActionAid (2005) From Hunger to Suffering … a Journey: Migrant Workers in the Brick Kilns –
Interventions Report. Hyderabad ActionAid.
Akter S, Farrington J, Deshingkar P, and Freeman A (2008). Livestock, Vulnerability and Poverty
Dynamics in India, Discussion Paper (forthcoming). Targeting and Innovation. ILRI
(International Livestock Research Institute), Nairobi, Kenya.
Balisacan, A.M. and Ducanes, G.M. (2005) Inequality in Asia: A Synthesis of Recent Research on
the Levels, Trends, Effects and Determinants of Inequality in its Different Dimensions,
The Inter-Regional Inequality Facility, London: Overseas Development Institute
Baulch, B. and J. Hoddinot, 2000, ‘Economic Mobility and Poverty Dynamics in Developing
Countries’, Journal of Development Studies, 36(6): 1-24.
Baulch B and McCulloch N (1998). Being Poor and Becoming Poor: Poverty Status and Poverty
Transitions in Rural Pakistan, Working Paper 79, Institute of Development Studies,
Sussex.
Borhade, A. (2007) Addressing the needs of seasonal migrants in Nashik, Maharashtra Disha
Foundation/Population Council, New Delhi.
Breman, J. (1990) 'Even dogs are better off': The ongoing battle between capital and labour in the
cane-fields of Gujarat. Journal of Peasant Studies, Volume 17, Issue 4 July, pages 546 –
608.
Business maps of India. Role of Textile Industry in India GDP
http://business.mapsofindia.com/india-gdp/industries/textile.html
Chen, M. 2007. Skills, Employability and Social Inclusion: Women In The Construction Industry.
Harvard University, WIEGO Network
CSE (2007) Mining: A Guide To India’s Wealth, Its Resource Curse. Centre for Science and
Environment, New Delhi
CUTS International (2008) Exploring the post-1990s trade-labour linkage in India. A set of case
studies from West Bengal, Maharashtra and Gujarat. CUTS International, Jaipur.

81
GOI (2007). Poverty Estimates for 2004-05, Government of India Press Information Bureau, New
Delhi.
Deb, U. K., Nageswara Rao, G.D., Mohan Rao, Y., Slater, R. (2002) Diversification and Livelihood
Options: A Study of Two Villages in Andhra Pradesh, India 1975–2001 Working Paper 178
Overseas Development Institute, London.
Deshingkar, P., S. Kumar, H. Kumar Chobey and D. Kumar. (2006) The Role of Migration and
Remittances in Promoting Livelihoods in Bihar. Bihar Rural Livelihoods Project (BRLP)
India.
Deshingkar, P., P. Sharma, S. Kumar, S. Akter and J. Farrington (2008) Circular migration in
Madhya Pradesh: Changing patterns and Social Protection Needs. The European Journal
of Development Research Vol. 20, No. 4, December 2008, 612–628
Deshpande, M. (2008) Migration dynamics in Nipani and Ichalkaranji, Karnataka. Report prepared
for the International Institute for Environment and Development, Project on Migration and
small town governance. Mimeo.
Deshpande, Sudha L. and L. K. Deshpande (1990), Labour mobility in Bombay’s manufacturing
Sector, ILO-ARTEP Working Papers, ILO, New Delhi.
Dubey et al 2006 Surplus Labour, Social Structure and Rural to Urban Migration: Evidence from
Indian Data. The European Journal of Development Research, Volume 18, Issue 1 March
2006, pages 86 – 104.
Fan, S., C. Chan-Kang, and A. Mukherjee (2005) Rural and Urban Dynamics and Poverty:Evidence
from China and India FCND Discussion Paper 196. DSG Discussion Paper 23 Food
Consumption And Nutrition Division, International Food Policy Research Institute,
Washington D.C.
Ghate, P. 2006. Remittances by domestic migrants. The Economic Times, March 24, 2006
Ghate, P. (2005) Serving Migrants Sustainably Remittance Services Provided by an MFI in Gujarat
Economic and Political Weekly April 23, 2005. Pp 1740-1746
Ghosh, J. (2001) “Globalisation, Export- Oriented Employment for Women and Social Policy: A
Case Study of India.” Prepared for UNRISD Project on Globalization, Export-Oriented
Employment for Women and Social Policy, July 2001.
ICSF/SIFFS/NFF (2004) Report from India workshop on the proposed ILO comprehensive standard
on conditions of work in the fishing sector Kovalam, Trivandrum, 2-3 April 2004,
International Collective In Support Of Fishworkers, National Fishermen’s Forum, South
India Federation of Fishermen Societies

ITUC (2007) Internationally Recognised Core Labour Standards In India. Report For The WTO
General Council Review Of The Trade Policies Of India. International Trade Union
Confederation (ITUC) (Geneva, 23 and 25 May 2007.
Jagori, (2001) Migration, trafficking and sites of work: vulnerabilities and rights. A pilot study,
initial findings from Rajasthan and Gujarat. New Delhi: Jagori.
Johnson C., P. Deshingkar and D. Start (2006) Does governance matter?power and politics in Gram
Panchayats in Farrington et al (2006). Pp 373-394
Kabeer Naila (2006) Social Exclusion and the MDGs: The Challenge of ‘Durable Inequalities’ in
the Asian Context Parallel Group 3A: Topic Paper 4
Kurosaki, T. Y. Sawada, A. Banerji and S.N. Mishra (2007) Rural-Urban Migration and Urban
Poverty:Socio-Economic Profiles of Rickshaw Pullers and Owner-Contractors in North-
East Delhi CIRJE Discussion Paper CIRJE-F-485
Kundu, A. and N.Sarangi (2007). Migration, Employment Status and Poverty An Analysis across
Urban Centres. Economic and Political Weekly January 27, 2007 pp 299-306.
Labour Bureau (2009) Report on Effect of Economic Slowdown on Employment in India (October
– December 2008), Government of India, Ministry of Labour & Employment, Chandigarh
Lahiri-Dutt K. (2006). Gendered Livelihoods in Small Mines and Quarries in India: Living on the
edge. Working Paper Rajiv Gandhi Institute for Contemporary Studies, New Delhi And
Australia South Asia Research Centre, Canberra.
Manor, J. (2002) Democratic Decentralisation in Two Indian States, Past and Present in The Indian
Journal of Political Science. 63, pp 51-72.
McKenzie D and Sasin M J. 2007. Migration, Remittances, Poverty, and Human Capital:
Conceptual and empirical challenges, World Bank Policy Research Working Paper 4272
(WPS4272), 16pp.
Mezzadri, A. (2008) How Globalised Production Exploits Informal-Sector Workers: Investigating
the Indian Garment Sector. Development Viewpoint No 12. Department of Development
Studies, SOAS
Ministry of Labour (2008) Socio-Economic Conditions Of Women Workers In Selected Food
Processing Industries
Misra, N. Working Conditions in the Fish Processing Industry in India ICSF, Chennai.
http://base.d-p-h.info/fr/fiches/premierdph/fiche-premierdph-5855.html
Mitra, A. (2004) Industry and Informal Sector in the Context of Globalisation. Institute of
Economic Growth, Delhi University Enclave.

83
Mooij, J. (2002) Welfare policies and politics, A study of three government interventions in Andhra
Pradesh, India. Working Paper 181, Overseas Development Institute, London.
Mosse, D., Gupta, S., Mehta, M., Shah, V. & Rees, J. (1997) Seasonal labour migration in Tribal
(Bhil) Western India. KRIBP Working Paper, Centre for Development Studies University of
Wales, Swansea.
Mosse, D. Gupta, S. Mehta, M. Shah, V. & Rees, J. (2002) ‘Brokered Livelihoods: Debt, Labour
Migration and Development in Tribal Western India’, Journal of Development Studies
38(5), June, pp. 59–87.
Narasimham 2004 Money Talks ... and Walks, India Together. March 2004
Nayak 1993 Determinants & Consequences of Inter-State Labour Migration from Orissa (A Case
Study of Selected Villages) NCDS.
Neetha, N. (2004). Making of Female Breadwinners Migration and Social Networking of Women
Domestics in Delhi. Economic and Political Weekly April 24, 2004 pp1681-1688
NSSO. 2001. Migration in India 1999-2000, NSS 55th ROUND. Report No. 470. National Sample
Survey Organisation Ministry of Statistics & Programme Implementation, Government of
India September 2001
Olsen, W. and R. V. Ramanamurthy (2000) ‘Contract Labour and Bondage in Andhra Pradesh
(India)’, Journal of Social and Political Thought, Vol. 1, No. 2 June
http://www.yorku.ca/jspot.
Panda, A. (2006) A report on Migration. Western Orissa Rural Livelihoods Project.Mimeo
Pais J. (2006) Migration and Labour mobility in the Leather Accessories Manufacture in India, A
Study in the Light of Economic Reforms Institute for Studies in Industrial Development
(ISID), Delhi
Population Council. 2008. Patterns of Mobility and HIV Risk among Female Sex Workers: Andhra
Pradesh. Population Council: New Delhi.
PUCL Gujarat (2007) Silicosis- A Death Trap For Agate Workers In Gujarat An Enquiry Report,
People’s Union of Civil Liberties, Gujarat.
Ramachandran, S. (2007) India's diamond trade under fire. Asia Times Nov 14, 2007
http://www.atimes.com/atimes/South_Asia/IK14Df01.html
Ramaswamy, U. and S. Davala (2008) Women in the Indian Textile and Garment Industry
Friederich Ebert Stiftung
Rao, S. L.(2008) Migration dynamics in Tirupati and Tenali, Andhra Pradesh. Report prepared for
the International Institute for Environment and Development, Project on Migration and
small town governance. Mimeo.

RBI (2008) Macroeconomic and Monetary Developments. Mid-Term Review 2008-09 Reserve
Bank of India, Mumbai
Reddy, D. N. (1990) Rural Migrant Labour in Andhra Pradesh, report submitted to the National
Commission on Rural Labour, Government of India.
Reddy, G. Krishna (2002) New populism and liberalisation: regime shift under Chandrababu Naidu
in AP. Economic and Political Weekly. 32(9) pp 871-33.
Rogaly, B., Coppard, D., Ratique, A., Rana, K., Sengupta, A. and Biswas, J. (2002) Seasonal
Migration and Welfare/Illfare in Eastern India: A Social Analysis. Journal of Development
Studies 38.5: 89–114
Saha, Asim Anjali Nag, and Pranab Kumar Nag. Occupational injury proneness in Indian women:
A survey in fish processing industries J Occup Med Toxicol. 2006; 1: 23
Sahoo, U.C. 1993. Migrant Oriya Workers and Surat Art-Silk Industry: an appraisal. Orissa Review
July 1993 pp 28-30.
Samal C. K. (2006) Remittances And Sustainable Livelihoods In Semi-Arid Areas. Asia-Pacific
Development Journal Vol. 13, No. 2: 73-92
Samal, K. 1998 Some Aspects of Informal Sector Growth in Orissa. Journal of Entrepreneurship,
Vol. 7, No. 1, 83-91 (1998).
Sarde, S.R. 2008. Migration in India, Trade Union Perspective in the context of neo-liberal
globalisation. International metalworkers federation, New Delhi, Mimeo.
Saxena, N. C. (2007) Rural poverty reduction through centrally sponsored schemes. Indian J Med
Res 126, October 2007, pp 381-389
SCF (2005) Child Domestic Work, A violation of Human Rights. Save The Children Fund.
Shah, Alpa. (2006) The labour of love: Seasonal migration from Jharkhand to the brick kilns of
other states in India. Contributions to Indian Sociology (n.s.) 40, 1 SAGE Publications
New Delhi/Thousand Oaks/London
Shah Amita.and D.C. Sah 2004 Poverty among Tribals in South West Madhya Pradesh: has
anything changed over time? Journal of Human Development Vol. 5, No. 2, July 2004. pp
249-263.
Srivastava, R. (2003) An overview of migration in India, its impacts and key issues. Paper prepared
for the Regional Conference on Migration, Development and Pro-Poor Policy Choices in
Asia. 22–24 June 2003 Dhaka, Bangladesh.
Subrahmanyam (1985) Palamur migrant labour in mica mining. PUCL Bulletin, Special Article,
April 1985.

85
Sundari, S. (2005) Migration as a Livelihood Strategy: A Gender Perspective. Economic and
Political Weekly May 28-June 4: 2295-2303.
Sundaram, K. (2008) Employment, Wages and Poverty in the Organized and the Unorganized
Segments of the Non-Agricultural Sector in India: All-India, 2000-2005. Working Paper
No. 165 Centre for Development Economics. Department of Economics, Delhi
School of Economics.
Suri, K.C. (2002) Democratic Process and electoral politics in Andhra Pradesh, India, Working
Paper 181 ODI.
Thorat S. and M. Mahamallik (2005). Persistent Poverty – Why Do Scheduled Castes And
Scheduled Tribes Stay Chronically Poor Indian Institute Of Public Administration, New
Delhi/ Chronic Poverty Research Centre.
Tiwari Rajnarayan R.Child labour in footwear industry: Possible occupational health hazards Indian
Journal of Occupational and Environmental Medicine, Vol. 9, No. 1, January-April, 2005,
pp. 7-9
UNDP (2007) Journey to Safety Information and Communication Technologies (ICT) for Reducing
HIV and other Vulnerabilities of Migrants, their Families and Communities. United
Nations Development Program, New Delhi.
UNDP-TAHA (2007) Settled to Move, UNDP New Delhi.
Unni, J. (2006) Informal Employment: Estimating Home-based and Street-based Workers in India,
Paper No 3.National Commission for Enterprises in the Unorganised Sector, New Delhi.
Unni, J. and N. Bali (2001). Subcontracted Women Workers in the Garment Industry in India
Gujarat Institute of Development Research, Ahmedabad
Venkateswarlu D. (2004) Child Labour In Hybrid Cottonseed Production In Gujarat And Karnataka
http://www.indianet.nl/Guj-Karn_cottonseed.doc
Virgo, K. R. Yadav, Y. Kanugo & R. Bond 2003 Agriculture or livelihoods? Experiences of
practitioners and beneficiaries of the DFID-funded Western India Rainfed Farming
Project. Paper presented at Tropical Agriculture Association Seminar, University of Bath,
3 July.
Unattributed and undated. Surveys on Informal Sector: Objectives, Method of Data Collection,
Adequacy of the Procedure and Survey Findings. Available at
http://www.wiego.org/program_areas/statistics/SANTIAGO%20PAPER.doc

Appendix 1