
Gender and Migration in India: KEY FINDINGS
126
1
Transcript of Gender and Migration in India: KEY FINDINGS
2
CENTRAL RESEARCH TEAM
Indu Agnihotri Indrani Mazumdar
Neetha N
Research Associates
Taneesha Devi Mohan Shruti Chaudhry
Administrative Assistance & Project Coordination
Nandan Pillai

3
ACKNOWLEDGEMENTS
Gender and Migration has been a theme which has been recurrently visited by scholars attached to the CWDS. This engagement first started with the meetings held in West Bengal with peasant women, who incessantly brought in the issue of ‘namal’ or seasonal migration in the course of discussions. A visible outcome of this was the Action Research Project of the Centre, which is now three decades old. It is perhaps not surprising, therefore, that for Faculty attached to the CWDS migration has been an engrossing issue. It is in this context that we would like to acknowledge our debt to Prof. Vina Mazumdar, Dr. Kumud Sharma, Shri Narayan Banerjee, Dr. Malavika Karlekar and Leela Kasturi for this accumulated knowledge and rich field based data and information, some of which remains unknown in the form of internal reports which have never been published. It is this which dictated to us that there was a need to focus on internal migration, even as the discourse on migration was being driven by international debates. We would also express our thanks to Dr. Mary E. John, Director CWDS, for having provided full support to this Project, work on which theme was first begun on a pilot basis from CWDS’ own resources. This Project, undertaken as a countrywide study between the years 2008-2011, would not have been possible without support from the IDRC. It is the IDRC Project grant which enabled us to dedicate a team and resources to undertake field research and a large questionnaire based survey which, on the face of it, appeared to be an insurmountable task and ambitious, as many of our friends continued to remind us. We on our part, consciously pitched the study on a meso –level with a multi-site focus on rural as well as urban contexts of internal migration in order to capture both the complexity and diversity of these processes. The field visits were both revealing and enriching and enabled us to arrive at a fuller picture of processes on the ground. We thank the IDRC for providing us the opportunity to conduct this study. We would especially like to thank Dr. Stephen McGurk, Regional Head for South Asia at the IDRC and Dr. Navsharan Singh, Senior Programme Specialist. Navsharan has followed the trajectory of this study from the stage of the initial proposal to its present outcomes and borne with our limitations with great patience and a smile. A special thank you for Navsharan. We may also express our thanks to the financial and administrative team at the IDRC which advised us from time to time.
4
A countrywide study conducted by a small core team such as ours, rides on the strength of the support and goodwill of academics/ scholars, activists, students/ field investigators and many others. We, on our part, have accumulated more debts than we can ever hope to even acknowledge with sufficient gratitude leave alone repay. Our guides in/ into the field were many, multiple and varied. It is not possible to name all of them even as we cherish vivid memories of conversations and frantic calls for help, which always met with a positive response. There was always light at the end of the tunnel for us, even as we knew that there was often enough not even the faint glimmer of hope for those whose lives we studied. Our greatest debt is to those countless men and women who gave freely of their time to share moments of their lives, problems and challenges, even as they knew that this would be another study, one more survey, which may or may not ever change the grim circumstances of their daily lives or of their families. We would like to salute the fortitude with which these vast armies of mobile men and women continue on their march to their sites of work, back to their base across the rural and urban expanse of India, only to start out again, with renewed hope that something may happen and change may come, at last. We share that hope and draw strength from their courage, even as we are humbled by the limitations of our own intellectual/ academic meanderings. For the record we would like to list out some of those whose support we must not allow to be forgotten. The Advisory Committee Members, whose expertise we drew upon both in their formal capacity and the numerous times we impinged on their time over countless sessions of brainstorming in different settings at short or no notice were generous and sporting, to say the least. We take this opportunity to thank Prof. Amitabh Kundu, Dr. Indira Hirway, Prof. Jayati Ghosh, Dr. Kumud Sharma, Dr. K. Nagaraj, Mr. N.K. Banerjee, Prof. Malini Bhattacharya, Mr. P. Sainath, Prof. Ravi S. Srivastava, Dr. Ratna Sudarshan, Dr. Satish B. Agnihotri, Prof. Virginius Xaxa and Prof. Sabyasachi Bhattacharya all of whom gave freely of their time whenever called upon. The survey work involved making new partnerships with a range of institutions, across the country. We take this opportunity to thank: Rural & Environmental Development Society (REDS), [Anantapur]; Kula Vivaksha Porata Samithi (KVPS) ; (AP) OKD Institute of Social Change and Development; Women’s Studies Research Centre, Dibrugarh University; (Assam); Local School Teachers/Principal, Siwan, Begusarai; and UNICEF Polio Programme Coordinator, Nawada, (Bihar); local NGO workers in individual capacity in Rajnandgaon, Raipur and Bilaspur; and Public

5
Sector employees in the state of Chhatisgarh; Centre for Labour Research and Action , Ahmedabad, Dahod and Panchmahal; as also Faculty members, Centre for Social Studies, Surat;, All India Democratic Women’s Association, Haryana state unit; the Department of Development Studies, Kannada University, Hampi, Women’s Studies Centre, Mysore University, and activists of Bharat Gyan Vigyan Samiti in Karnataka; Mohammed Kutty Kakkakunnan, Reader, Economics and Prof. K.N. Ganesh, University of Calicut; (Kerala); Director. Centre for Community Development. Shivaji University, Kolhapur; WSRC, Pune University, Snehalaya Vikas Kendra; Rajya Gram Rojgar Sevak Sangathana, Parbhani, Beed; and agricultural Workers, Nandurbar; (Maharashtra); Mahila Chetna Manch , Bhopal, (MP); Faculty in Economics and History, Manipur University, Imphal; Faculty, of Public Administration and, Social Work, Mizoram University, Aizawl; Institute of Socio-Economic Development, Bhubaneshwar; Fellowship, Bhadrak and Faculty in Political Science, Berhampur, Ganjam (Orissa); Faculty and Research officers, Economics Department, Punjabi University, Patiala, also for assistance in Sangrur, Bhatinda, Jalandhar; Professors of Department of Economics and Sociology, Punjab Agricultural University, Ludhiana; Seva Mandir, Udaipur; Prayas, Udaipur and All India Kisan Sabha, Sikar, Rajasthan; Madras Institute of Development Studies, Chennai ; Mananmaniam Sundaranar University, Tirunelveli; Mother Teresa Women’s University, Kodaikanal, Dindigul; Centre for Women Development Research, Chennai (CWDR), Tamilnadu; Shri Ramanand Saraswati Pustakalaya (SRSP), Azamgarh and Gandhian Institute of Studies, Varanasi, Faculty members at the Jat College in Baghpat, (U.P.); Women’s Studies Research Centre, Calcutta University; Nari Bikash Sangha, Bankura; Lokenath Ray and CWDS Action Research Field Staff, West Medinipur; (West Bengal); The following helped us in identifying sites/ sectors; facilitating field surveys and /or conduct of the same along with case studies: Bhanuja, D. Ramadevi, P. Sarat Babu, S. Punyavathi, Sudha Bhaskar (Andhra Pradesh); Abutaleb Haque, Bhupen Sarmah, Daisy Bora Talukdar, Indrani Dutta, Kalilur Rehman, Pumani Kalita (Assam); Aasma Fayaz, Abdur Rehman, Bhagwan Prasad Sinha, Kedarnath Singh, Mukund Kumar, Pancham Kumar , Pushpa Kumari, Rabab Imam, Sabita Kumari, Saiful Islam, Santosh Kumar, Sushant Kumar, Ramendra Singh and Sabita in Chhapra and Siwan (Bihar); Pradeep K. Sharma, Jyoti Kusum Patel (Chattisgarh); Anshu Singh, Nayan Tara, Neha Chaudhry, Preeti Jha, Sameer, Shilpy Verma, Sudha Nayak, Surbhi Gupta, Suthopa Bose (Delhi); Vipual Pandaya, Preeti Oza, Reena Parmar, Renuka R. Revdiwala, Arun Mehta, Dayabhai and S. Katara. (Gujarat); K. Sudharani Nayak, Neha Chaudhry, Sudha Nayak, Urmi Bhattacharyya, Savita, Jagmati Sangwan (Haryana); Megha Behl, Naqueeb Ahmad, Samuel Sumi, Sujata Soy, Trilok Narayan, Zilpa Modi (Jharkhand); Bheemesh, M.
6
Indira, M.L. Pampapathi, M.S. Mangala, Sanna Devendra Swamy, TR Chandrasekharan,Yellappa (Karnataka); Anandhi T.K, Sajikumar/Irshad Ahmed, Mohamed Kutty Kakkakunnan, Sreevidhya V. (Kerala); Kamble Sambhaji Shrirang, Kumar Shirlalkar, Manjusha Deshpande, Rajan Kshirsagar Sugandhi, Prakash and Ramakumar, (Maharashtra); Charis Mine P Khonglah, Mornrina J Nongkynrih (Meghalaya); Lalruatkimi, Lalsiampuii (Mizoram); Balaji Pandey, Bijoya Bohidar, Bishnu Sharma, Drishanka Dyutisikha, Kishore Kr. Mohanty, Lalit Sahu, Manasi Mohanty, Sandhya Rani Patnaik, Sanjay Mishra, Sikha Birwal, Susanta Kumar Mishra (Orissa); Aman Preet Kaur, Aman Preet Kaur Sandhu, Amar Preet Kaur, Jaspreet Kaur, S.S. Gill, Satwinder Singh, Surender K.Singla, Kamal Vatta, (Punjab); Ganesh Birwal ( Rajasthan); Annunitha, Arun, Lenin Raja, Malathi, Mani Kumar, Manikumar K.A., Marianmal S, Meenakshi, Nagaraj K., Nala Chandrasekaran B., Rashmi, M.D, Sundari S., (Tamil Nadu); Muneeza Khan, Neizhanuo Golmei, Sudharani Nayak, Hina Desai, (Uttar Pradesh); Antara Kabiraj , Arpan Kumar Singha, Ashutosh Pradhan, Faruk Abdullah, Ishita Mukhopadhyay, Payel Das, Ratan Kumar Paul , Rokeya Begum, Sanchari, Sarforaj Alam , Sreyasi Chatterjee , Suthopa Bose , Swagata Dasgupta, Swati Ghosh , Urmi Basu (West Bengal). We would also record our thanks for tremendous help rendered at different points of time by K.S. Gopal, K.S. Vimala, Kiran Moghe, Meera Velayudhan; Sukhmaity and the activists/volunteers in North Bengal and Assam. Joginder in Baoli/Baghpat, provided the entry for the pilot survey, not to forget Shanker, our guide on the road to Badaun. We would like to thank Archana Prasad, Balaji Pandey; Ishita Mukhopadhyay, Jeta Sankritayana and Vasanthi Raman for contributions based on sector based studies. The numerous scholars who contributed to make Regional consultations meaningful for us need a special mention. The series of regional consultations drew upon support from several host Institutions whose administrative staff co-operated with us against several odds. We would like to mention : Asha Nivas, Chennai; Centre for Studies in Social Science, University of Calcutta, Kolkata; St. Ann’s Retreat cum Seminar Centre, Secunderabad; National Institute of Health and Family Welfare, New Delhi; Gujarat Vidyapith,, Ahmedabad; Omeo Kumar Das Institute Of Social Change And Development (OKDISCD), Guwahati and RCVP Noronha Academy of Administration & Management, Bhopal. We would specially like to thank Brinda Karat and Thomas Isaac for their suggestions, ideas and support; Nirmala Buch for her insights and in identifying critical site locations and assistance in MP and Chhatisgarh; and
7
activists associated with Ajeevika, Prayas and mass organizations of women, agricultural workers, trade unions, students and youth. Thanks are also due to Balwant Mehta, Nidhi Mehta, the team at The Vision, Gomti Nagar, Lucknow for Data Entry and Analysis of household and individual questionnaires; and the CWDS team which entered the Village Census data, comprising Nandan Pillai, Neeru Mehta, Swapna Guha and Kiran. The CWDS faculty put up with incessant demands, prolonged absences of the Project team and endless informal sessions to hear us out in our first flush of excitement at our discoveries/ findings and challenges on our return from each fresh round from the field. We thank them for bearing with us and for the disturbance and distractions. The CWDS Library team, led by Ms Anju Vyas, is always a solid support for facilitating research and we would take this opportunity to thank them; also specially for the resource base/ bibliography compiled focusing on Gender and Migration based on CWDS resources. We would like to make a special mention of the library team comprising Anju Vyas, Meena Usmani, Madhusree, Akhlaq Ahmed, Ratna and Deepa. The Administrative and financial support and guidance provided by the Administrative and Financial sections of the CWDS, headed by V.N.S. Soumyanarayanan and C. Prakash enabled us to meet many of our deadlines and commitments. K. Lalitha explained many of the intricacies of budgeting and record keeping. The administrative and support staff are not being mentioned here separately by name since the list is too long. Many pitched in at short notice. Timely delivery of reprographs and questionnaires by S.K. Mishra ensured that survey work proceeded unhindered. The team of support staff at CWDS, Kavan, Bisht, Sunil, Rampal and Selvakumar ensured that fewer trains /flight were missed and cartons packed in time, even us Babu and Kaushalya kept the team supplied with endless cups of tea. Their support once again conveyed to us the strength of the team spirit which CWDS has been known for. This acknowledgement would be way incomplete if I did not put on record my gratitude to the team members who made this study possible. The project was at all levels, a team effort and different members brought to it their different strengths in different phases. Neetha N. deserves a special acknowledgement. But for her the analysis of data and delineation of the trends and presentation of the same, given the scale, diversity and wide range of region and sector, could not have been possible.

8
This study was initiated and envisaged by Indrani Mazumdar, whose persistence in pushing both the scale and pace of the project matched her commitment to seek clarification on the ground as well as through the data generated. This too was another form of intervention in the discourse on Migration, which remains critical to studying the dynamics of social change in present times. If this report is before you it is largely due to the effort put in by her, and her ability to carry the weight of the Project, ably assisted by Shruti and Taneesha who showed tremendous resourcefulness in the conduct of field studies. Nandan showed a remarkable ability to straddle different domains while providing administrative assistance in the co-ordination of different segments of the Project. These years saw some members of the team grappling with enormous challenges that they faced in view of specific compulsions of age and their own location, including in this unending process of migration which was as much part of their lives as was the case with the subjects of this study. Many names, we can be sure, have been left out in this list of acknowledgements. However, if this study can contribute in any way to changing the life of the women and men we met in their varied locations in the conduct of this study, we would consider it as due acknowledgement of the help that those who remain unnamed here rendered, in the hope and belief that they too were contributing to that change in their own way.
Indu Agnihotri Project Director
Centre for Women’s Development Studies 3rd March 2012 New Dellhi
9
Gender and Migration: Negotiating Rights
A Women’s Movement Perspective
The Background This study grew out of a twofold engagement with the changes taking place in women’s lives in the era of liberalization and globalization. On one side was the social science researchers’ and women’s studies’ engagement with analysis based on the explicit study of categories, quantitative data, and qualitative observation of relations and developments. On the other side were the compulsions and experience of those engaged in organizing women into mass organizations, whose wide outreach and observations of social processes, had thrown up several questions that they felt were being ignored or sidelined in policy discussions. The idea of this research in fact grew in response to the demand by mass organizations, for better documentation of women’s migration in India amid reports from activists of great increases in and new and more vulnerable forms of female labour migration from the 1990s onwards. At the core of urgency behind the demand voiced for further documentation and research on women’s migration was the instinctive connection that mass organization workers made between heightened vulnerabilities of migrating women, the centrality of agrarian crisis, and the sharpening of social differentiation and inequalities in the era of liberalization/deregulation and open market dependent strategy of growth. Agrarian crisis had unfolded within a decade of the structural shift in India’s policy regime towards liberalization, whose most visible and dramatic face has been the large scale suicides by farmers. The crisis cannot be delinked from the dramatic step up in non agrarian growth and the rapid decline in share of agriculture in the country’s GDP. Non-agrarian growth has however, been unable to provide commensurate expansion in employment. Agrarian crisis was thus perceived by movement activists as aggravating vulnerability and distress in migration. As a result they were impatiently chafing at the limitations of existing research. Gender sensitive studies of women’s migration had indeed come to the fore since the 1980s and had no doubt fleshed out several features and issues particularly in relation to survival migration by tribal and other poor women. But these rarely connected with the policy frameworks or the macro context except in over-specific or over-general terms.1
1 There were several excellent micro-studies on women’s migration from the 1980s , not all of
which were published. Most of these studies have been referred to in Loess Schenk-Sandbergen (ed), Women and Seasonal Labour Migration, Sage, New Delhi, 1995.

10
Before the study actually got under way, the most significant concession from the Indian state to the high tide of agrarian distress had come in the form of the enactment of the National Rural Employment Guarantee Act, 2005 (NREGA), that provides for on - demand unskilled manual work/employment and wage for 100 days per rural household per year, whose collateral effect was expected to reduce distress migration in and from rural areas. Women’s share of NREGA employment across the country rose from a relatively high 41 per cent of person days in 2006-07 (367.9 million women days) to 48 per cent in 2009-10 (1364.05 million women days), and then to 49 per cent in 2010-11 (1227.42 million women days).2 Yet even as NREGA appeared to be providing employment to millions of women in rural India, all India employment surveys by the National Sample Survey Organization (NSSO) showed that the same period saw a dramatic fall in rural women’s work participation rates, resulting in a reduction in the overall female workforce by over 21 million between 2004-05 and 2009-10.3 Confounding the picture further, was the National Sample Survey (NSS) data on enhancement of female migration rates (i.e., proportions of migrants in the female population), which accelerated in rural India and maintained a steady increase in urban areas across a somewhat longer, if less up to date time frame, i.e., between 1999 and 2007-08. 4 In contrast, across the same period, male migration rates actually fell in rural areas and stagnated in urban areas.5 A Women’s Movement Perspective As the title of this study indicates, we have approached the subject of migration in India from a women’s movement perspective. Many eyebrows may be raised at such an assertion, ranging from those who would question such declared partisanship - to those who query the notion of a women’s movement, given the diversity of ideologies and sectional interests that lay claims to the movement (or movements as they may say). A few words of clarification are therefore in order. From our point of view, what defines a movement perspective is its premise in the mobilization of women in their independent but not necessarily individualistic capacities as a social movement. A movement perspective is thus distinct from those of general development administration or institutions engaged in ‘beneficiary’ oriented scheme delivery that inherently involve some form of patron client relationships. That such a social movement would contain several strands of opinion is inevitable, but it
2 It may be noted that although the share of women rose in 2010-11, the number of work days
had beden reduced from the preceding year. 3 See Mazumdar, Indrani and Neetha, N. Gender Dimensions: Employment Trends in India,
1993-94 to 2009-10, Economic and Political Weekly 2011. 4 While employment data is drawn from the major quinquennial surveys of the NSSO,
unfortunately, migration data was not collected in either the 2004-05 survey or the 2009-10 survey. For migration, we thus have to refer to the surveys of 1999-2000 and 2007-08.
5 Where the rural female migration rate rose from 42.6 per cent to 47.7 per cent between 1999-2000 and 2007-08, in contrast to the fall in rural male migration rates from 6.9 per cent to 5.4 per cent, in urban areas, female migration rates increased from 41.8 to 45.6 per cent, while for males there was a nominal increase from 25.7 to 25.9 per cent.

11
would be difficult to deny that while opinion leaders or ideological emissaries may initiate processes of mass mobilization, the social movement that is so generated has an aggregated force that is compellingly and historically greater than its individual strands. Analytical assumptions of a division into autonomous vs. party led women’s organisations have underwritten much of academic discourse on the contemporary women’s movement in India. However our understanding is in line with the argument that ‘in fact the history of the movement shows no such clear dichotomy ever existed at the level of issue-based understanding ….. neither the ‘autonomous’ nor the mass organisations had a fully unified understanding, either amongst or between themselves. This could be demonstrated with regard to the issue of dowry, rape, maintenance rights, sati, work, representation, population policies – the whole gamut. On all these there was a criss-cross between the two categories’. (Agnihotri, 2001). With the raison d’être for the women’s movement in India being the drive for women’s emancipation through social transformation, migration as a narrow escape route for a few individuals has been only a secondary issue. More importantly, from a strategic perspective of collective struggle of Indian women for acquiring command over their destiny, the movement’s concerns have been oriented towards grappling with social, economic and political forces and policies that shape the major internal migration patterns and their social and their developmental outcomes for women. Concern for specific conditions and forms of vulnerability faced by migrants is thus necessarily combined with questions regarding the socio-historical direction of the specific forms of migratory employment in which women are majorly located. The question that is paramount for the movement relates to the conditions of migration, i.e., does it move women and society towards gender equality or does it enhance inequalities. Further, given its compelling social base among women of the labouring poor in India, it is their migratory movements and related issues that hold pride of place in the concerns of the movement, including the not so obvious links between marriage and other social institutions and women’s work/labour in migration processes. The broader picture within which such questions have become so vital comes from the periodic evidence provided by research (from the mid 1970s onwards) of the relatively greater impoverishment and exclusion of women from general developmental/growth gains and the experience of an expanded terrain of regressive patriarchies and unequal social practices. That the programme of the women’s movement is at one level multi-class and geared towards equality for women as women is axiomatic and does not perhaps require much elaboration. Less self evident, but equally compulsive is the movement’s arraignment with women as members of social classes who can broadly be termed peasants and workers, and include a range of petty producers/sellers/service providers in artisanal as well as for modern technology
12
based industry. For, it is women from these social classes, who have provided the anchor of a durable social base to the country wide women’s movement. As such, the material force of the class character of majority of women in the movement in shaping its agendas has been far more than what some of the purely academic discourses might suggest.6 It would not be wrong to attribute the quite remarkable and continuing expansion of the movement in India to the inextricably entwined phenomena of a spreading tide of organic female ferment across classes and community categories on the one hand, and on the other, more conscious attempts to extend the representative base of women’s organizations. In the process, discrimination against, and the differentiated/specific conditions of women as dalits and tribals and even as members of religious minorities have emerged as focal issues for the movement more than ever before. For the movement, such foci have become intrinsic particularities of a composite struggle against subordination and oppression of women. The expansion of the movement has also compelled increasing comprehension of the need for a principal engagement with the agrarian question and its continuity as the crux of any transformative social movement for Indian society. It has also brought forth a critique of the neo-liberal strategy of unbridling the inequalising force of globalised capitalist development, including in expanding urban arenas. As such, a contemporary women’s movement perspective in India invokes gender issues and women’s rights as women, as peasants and workers, as members of particularly oppressed communities, and as citizens. To our minds, empirical research that draws its perspective from the women’s movement would necessarily have to interweave into its enquiry issue based questions based on the tactical advances of the movement while maintaining the strategic framing of overarching questions. For us, the importance of combining and referencing tactical with strategic perspectives cannot be overstated enough. For one, it is rooted in awareness of the broad historical tendency in structurally unequal societies for every relative advance in women’s status/conditions to simultaneously contain elements of relative regression, a point that has emerged sharply in the course of this study. Secondly, we believe that it is only through testing our enquiry results against both tactical advantage and strategic objective parameters that a fuller and more purposive rendering of gendered social processes in relation to migration, can be developed. At a third level, in relation to the cumulative elements that are currently part of both debates and actualities of women’s rights, it is well to remember that they have been shaped through multiple inequalities and through social and economic policies and developments on which the women’s movement has had, as yet, only peripheral impact. In order to reflect and reflect on these cumulative elements, the linking of the tactical with the strategic, of concrete or immediate issues with general objectives has enduring value as a guiding method
6 See ‘The Multiple Struggles of Women’ in Brinda Karat, Survival and Emancipation, Three
Essays Collective, New Delhi, 2005.
13
and perspective for the women’s movement and its researchers. It is such an approach that informs and frames this study of gender and migration in India. Negotiating Rights At a preliminary level, the negotiation of rights covers a wide range of issues including an engagement with law and policy, their principles, and practice. However, that such engagements by the women’s movement have been contingency determined cannot be denied. The field of contingent determination of principles based on extant realities of direct social correlations/contradictions/conflicts/adjustments may pose theoretical dilemmas that can only be overcome by a continual reading of the differences but interconnectedness of tactics and strategy into the process of engagement. We would stress the fact that contingent debates and arguments take place through cumulative operations of the women’s movement in negotiating rights. The cumulative context that is so shaped includes a set of principles that have emerged not so much from the realm of abstract thought as from the bedrock of concrete engagements with policy frameworks, social processes and developments - their impact on the lives of women in India, and the conditions/nature of their reception/reactions.7 Among the several such engagements, three that are of special relevance to this study on gender and migration, need to be flagged. The first is at a direct and immediate policy level, in the opposition of the movement to differentiating between sections of the poor in the name of better ‘targeting’ of welfare entitlements. Narrowed targeting, as is known, has grown out of fiscal conservatism, and is inextricably linked with promotion of the idea that the market is the prime and best instrument of dissemination of welfare, and related reduction of universal welfare regulation/interventions by the state. Official positions on poverty have thus been suborned by an administrative thrust towards restriction of welfare entitlements (including the basic entitlement to food security) to only those declared as officially below the poverty line (BPL).8 The women’s movement has consistently opposed
7 The approach to rights that has emerged from such engagements by the women’s movement,
is however, quite different in lineage and practice to the “rights based approach” that has become quite popular in international development agencies. The package of measures that constitute what has come to be known as the “rights-based approach” have been identified as 1) Pressure for formal rights as laid down within some legal system, stipulation, rules, or regulations, 2) The implementation of such rights through legal campaigns and stronger links with the legal profession, 3) A more complete system of interconnected rights, rather than single rights, 4) Adherence to international rights and a hierarchy of rights at local, national, and international scales, 5) A perception of rights as a development goal to be achieved independent of other goals, 6) The explicit acknowledgement that engaging with rights requires, an overtly political approach (Hickey and Mitlin, 2009) In contrast, the women’s movement does not centre its approach on the legal realm, even as it does maintain a continuing engagement with the law.
8 BPL has become discredited but the renaming of priority sections as has been done in the Food Security Bill does not alter the basic premise of an artificial administrative division of society in order to restrict entitlement.

14
such restrictive reconfiguring of universal entitlements to a BPL targeted policy framework that has led to massive exclusions of the larger poor in the country from even the limited welfare that was earlier accessed under a policy regime based on a more universal rights orientation. Migrants, who have long tended to fall between the cracks of such entitlements, are now faced with a double weight of exclusion under the targeted policy regime. The second addresses a larger set of social rights/questions relating to women’s work. With the gender dimensions of labour migration being central to this study, the debate on women’s work perhaps merits some elaboration. Since the mid 1970s, the women’s movement has had to confront the experience of decline/marginalization of women in employment in India and the concentration of the major part of the female workforce in low income unorganized and informal work (CSWI, Shramshakti). Simultaneously, a three decade long critique of the inability of national data sets to fully measure the nature and extent of women’s economic activities, particularly when such work is performed within the home/household, has also been waged with only partial success (Hirway, Saradamoni, Krishnaraj). The invisibilisation/marginalisation of women’s paid and unpaid work in the existing and developing socio-economic setting is an issue that yet awaits fuller conceptual and statistical resolution, particularly in a context of increasing market determination of the value of work. It is however, well established that a range of material production-oriented activities are undertaken by women for direct subsistence consumption as well as for the market that do not easily fit into the popularly accepted categories of work/employment. The output of workers engaged in ‘economic activities’ such as production/collection of material resources is indeed included in calculations of GDP, and even when unpaid, such workers do get officially included in the country’s workforce figures.9 Nevertheless, lack of recognition, underreporting and undercounting of several such paid and unpaid economic activities of women remains a feature of social life and is reflected in the macro-data sets. At an international level, feminists pressing for rethinking ‘the Economy’ have of course taken the argument further beyond the realm of only activities defined as ‘economic’. They have argued, that the unpaid ‘care economy’ in which people ‘produce services for their families, friends and neighbours on the basis of social obligation, altruism and reciprocity’ (which normatively encompasses a substantial part of women’s work) also needs to be taken into account along with the ‘commodity economy’. It has been further argued that although unpaid care work is outside the ‘production boundary’, apart from its importance for human well-being, its operation has implications for what goes on inside the production boundary in that it affect the quantity and quality of labour supplied to production and the quantity and quality of goods demanded from production (Elson, 2001). Such issues of social reproduction and the sphere of unpaid labour in the lives of women, have 9 Of course, those women who are solely engaged in unpaid work for domestic life (cooking,
cleaning, care for family members, etc.) are not included.
15
indeed found indirect expression in the Indian women’s movement’s longstanding focus on public provisioning of basic civic amenities – water, toilets, ration cards, access to health, shelter/housing conditions, etc. (for such purposes, the distinction between unpaid work that falls within or outside the production boundary would be immaterial). On the other hand, the women’s movement in India cannot forget that the patriarchal social context necessarily makes the unpaid labour of women both cause and consequence of their economic dependence, related unfreedom, and a constraint on equality of opportunity for independent employment/income and economic independence, - economic independence which, in turn, remains an important pre-condition for opening up greater possibilities for social independence and freedom for women. At the same time, the evidence has accumulated in India, of paid employments themselves promoting gender inequality, whether in the form of unequal wages or concentration of a relatively larger proportion of the female workforce in particularly low income/productive informal/unorganized forms of employment, etc. This is apart from the fact that paid employment has generally made for a double burden, with women having to combine unpaid domestic work alongside work for income from outside. Just as, particularly for women struggling against poverty, it has also extended the boundaries of their subordination in the patriarchal family to subordination, and perhaps additional vulnerability as workers for a variety of classes of employers, - employers whose primary interests in recruiting/employing female is rarely and only tangentially influenced by the needs and demands of women workers/employees themselves for decent wages/incomes/hours of work and conditions of life. Income earning mass self employment has not provided any better alternative in a world of sinking incomes from petty production and the inexorable march of integrated markets favouring larger entities at the cost of petty producers (Ghosh, 2006). Ambiguity towards paid/income earning labour and employment outside the purely family relations setting and related migration is thus underwritten for women workers themselves, particularly from among the large majority of the laboring poor, who often associate their need for paid work, and related migration with family poverty and other distress conditions rather than with attempts at denting patriarchal oppression. It follows then, that for a women’s movement perspective, it is the terms and conditions of paid labour by women that must hold centre stage in an approach to labour migration, even as other questions persist for a strategic social framing of issues that accords due significance to women’s unpaid work in the economy, state and society at large and also related to migration. At the same time, the macro-view of the movement requires constant attention to and questioning of social processes that generate gender inequalities in the sphere of work, the value of work, and access to paid employment – and its effects on either compelling or restricting of women’s migration/mobility.
16
The third area of engagement is with the specific conditions of discrimination faced by social groups, whose outcast status has a long history that continues to resonate at multiple levels in contemporary social processes. While discrimination is an issue that extends across rural and urban boundaries, there can be little doubt that in the women’s movement, issues related to the particularities of oppression faced by dalit/scheduled castes/tribes, acquired special importance through an engagement with the rural context where the majority of women live. The subject of atrocities on dalits and tribals has been part of the contemporary history of the women’s movement since the 1970s. The campaign against custodial rape in 1978 had centred around the crime committed against a tribal girl who was a minor at the time the incident happened. The repeated incidents of sexual violence against tribals in Tripura had drawn the attention of joint women’s organizations in the late 1980s. Tribal women were clearly caught in the crossfire of the struggle to advance their rights even as they maintained their distinct identity. Similarly, successive incidents of mass violence and atrocities against landless labourers in Bihar since late 1970s focused on both, sexual and class based / economic exploitation of dalit landless women. However, with the growing agrarian crisis the women’s movement came to focus on the complexities of caste, class and gender based violence with a more well defined focus and understanding. The manner in which politics around caste erupted on the political scene in the context of implementation of the Mandal Commission recommendations and upper caste resistance and opposition to it - couched in the name of merit -subsequently ensured a place for caste and identity on the political canvas as never before. It also ensured that movements for equality could not, henceforth, be immune to the entrenched basis of caste based inequalities. Discussions on women’s rights subsequently could not ignore the assertion of identity. While this gave a critical edge to movements for equality, mass based women’s organizations moved on from here to re-conceptualize the issues emerging from identity based experience and assertion into their overall perspective of interrogation of social inequalities. While work amongst minorities had been specifically carved out for special focus since the 1980s itself, now the challenge of intervening with special attention to aspects of social exclusion and discrimination –including dalits and tribals – was marked out as for fresh examination with a view to interventions. Documents from the mass organizations of women point to growing concern at the impact of rising poverty levels in the 1999s on the marginalized sections of society comprising large section of dalits and tribals. These also highlight the plight of the rural masses in the face of declining employment rates and reduced work opportunities. With dalit women comprising the bulk of the agricultural labour force, the intertwining of multiple forms of oppression and patriarchal pressures was there for all to see. It was recognized that changes in cropping patterns and agricultural practices, including mechanization, affected dalit women more specifically. The shrinking of common lands due to privatization and land grabbing by upper caste landlords and elites enjoying political patronage led to the loss of
17
traditional rights as well as loss of critical resources which had thus far provided livelihood. This was apart from the difficulty faced in finding open spaces to meet even basic civic needs in the absence of toilet and sanitation facilities for the poor in both rural and urban India. Landless women continuously pointed to the loss of work, loss of common land for fodder for cattle/ livestock or, as the potter community women bemoaned that even mud for the making of pots was no longer available. These losses added up to growing concerns of food security and livelihood. The 1990s saw growing involvement of dalit women in land struggles across India. These were against dispossession, right to lands that they had cultivated for long periods and against takeover of common / shamilati/ panchami lands. Tribal women reported that legal amendments made in 1988 made their entry into forests difficult in the name of stringent forest/environmental protection measures which threatened livelhiood based on forest produce. The last decade and more have added to this with an alarmingly high level of displacement of tribals as corporate driven capitalism brazenly marches into tribal dominated areas known for their rich wealth in minerals and natural resources. The path of development followed since the 1990s has brought the dalit landless groups and tribals into direct conflict with development policies. Often, it is the women amongst them who have had to shoulder the burden of shrinking incomes and resources combined with assaults on their dignity. With the shrinking of employment opportunities in the public sector the scope for jobs got further reduced since the private sector did not apply/implement the policy of reservation. This affected dalits and tribals at several levels. In both groups starvation deaths across different states, particularly among the tribals, raised the issue of basic food security. The involvement of women, including dalit women, on issues of food security became more prominent as spiraling food prices and inflation gave a critical edge to livelihood concerns even as the government, in its espousal of neo-liberal development policies, opted for targeting in the Public Distribution System. As official machinery spent more time and energy in identifying groups for exclusion from the category of poor as per the officially defined Below Poverty Line, the struggle to be recognized as poor became an intrinsic part of the struggle for survival. As mentioned earlier, the women’s movement with its long history of involvement in the food movement (often referred to as feminine engagement due to domestic burdens), was in the forefront of the struggle for a universalized PDS. However, unlike the more visible pro-identity politics representation of experiences of marginalization within academic discourse, organized mass based women’s activism approached the issue of dalit and tribal women’s rights from the multiple and manifold sites of oppression in their formulation of demands, including for policy based interventions. This contextualized oppression, discrimination and denial within the differential social location of women as well as their experience of citizenship and allowed for a multi layered strategy to fight gender based oppression . This also made space for specific focus on sectoral issues while mobilizing on a common platform to build a unity in struggle. The approach sought
18
to deflect separatist perspectives and strategies visible within the political and academic discourse. It is in such a context that we approached the subject of gender and migration. Constitutionally speaking, citizens of independent India have never been restricted from migrating internally within and across states in either rural or urban areas. The decade of the 1990s had witnessed a substantial increase in inter-state migration by both men and women (although in general, more than three fourths of female and close to three fourths of male migration in India are still within the state of origin). And yet, firm domiciliary status in a particular state, municipality or panchayat (rural self government institution)10 is a ubiquitous procedural requirement for access, particularly by poorer sections of Indian society to some basic rights, including ration cards, employment schemes, housing programmes, formal credit, maternity benefit schemes, etc. It could be argued that there is an inbuilt tension between the right to freedom of movement or migration within the Indian Union and access, particularly to even the limited range of welfare entitlements that have been put in place since the adoption of the Constitution. The ability of any Indian citizen – man or woman - to actually avail of economic and social protections is of course limited at the first principle level by the limited range and applicability of legislative enactments that have made into law any of the social security and social justice objectives which, in the Constitution are outlined in the non-justiciable Directive Principles of State Policy. Further, access to even legally stipulated social and economic protections is more often ruled by a citizen’s location in social hierarchies and the persistently inequitable economic conditions that fall squarely in the realm of development, its agents, its policies, processes and outcomes. So also in the case of migrants in India, it is primarily social and economic processes, developments, and policies rather than conditioning by law that shapes the nature and content of most of the rights accessible to them. Gender, Migration and Development Paradigms: Questioning the Database Approaches to migration in development discourses and theories have been, in the main, preoccupied with the expected and desired transition from an agrarian to an industrial or even post industrial social and economic order for which rural to urban migration is often seen as a rough proxy. The focus on transition was of course central to the earlier policy regime of decolonization oriented and state led industrialization and ‘development’ policy in India from the 1950s till the early 1980s. Its proxy in rural to urban migration has perhaps received even greater attention under the present regime of liberalization, privatized resource driven, and globalized market led ‘growth’ formally inaugurated by the Industrial Policy of 1991, albeit with more of an individual and less of a structural focus. Nevertheless, a 10 Panchayats refer here to rural self government institutions in the Constitution, not to be
confused with non-constitutional caste panchayats.
19
common underlying thread running through otherwise divergent economic policy paradigms, is the broad understanding that the migration process leads to some form of settlement at a particular destination (probably urban), usually accompanied by occupational/sectoral change, enhanced incomes and perhaps some degree of social mobility. In actuality, the experience in India has been of a relatively slow rate of urbanization, the continuance of agriculture as the majority employment in the workforce, and the expansion of more circular forms of migration in, to, and around rural as well as urban areas. Temporary and circular migration appear to have further gained ground in the face of the increasing rather than decreasing weight of unorganized/informal and intermittent forms of employment in rural and urban areas, and by the unsettling and shrinking of more durable organized sector employment across the past three decades. As such, the premises and prognostications of the dominant development approaches to migration have long come under question. Circular movements of labour, were of course brought into the debates on migration, not from any analysis of the macro-data, but rather through a not insubstantial body of work drawing primarily on qualitatively inclined anthropological research on labour, localized development activities of a few NGOs, and micro-surveys in some regions. It is this body of work that initially drew attention to the significant proportions of women in short term labour migration, particularly in rural areas (Breman, Banerjee, Karlekar, Teerink). Some of these studies have framed short term or circular migration as a mode of survival migration by the poor, some have focused on it is a livelihood strategy of families, some have located it in a more structural understanding of labour circulation and its relationship with accumulation regimes. Although mostly region or even community specific, these studies have all contributed to making available fairly detailed descriptions and analysis of migration patterns that cannot be extracted from the macro-data. There is now sufficient evidence that members of peasant households move to employments outside agriculture to keep themselves clothed and fed as well as for sustaining their agricultural activities.11 High rates of self employment in rural and even in urban areas have demonstrated that petty production in agriculture and non-agriculture still accounts for a major part of the workforce, including migrants. All migrants cannot therefore be subsumed into the single dominant (actual or potential) relation of labour and capital as is assumed in neo-classical development theories. There is evidence, for example, of wages in modern (often urban) industry or services not always covering the cost of social reproduction of workers and their offspring/families, which then continues to be borne by rural peasant based subsistence activities. In such cases, a degree of difficulty exists in binding social categories and indeed even individuals as economic agents into an analytical frame
11 This has become even more significant in the contemporary period of agrarian crisis where a
large proportion of peasant households are confronted with deficits in agriculture and look for external incomes to fill the gaps.
20
based only on economic theories and categories that are derived from developed capitalism. To us, it appears that the complete jettisoning of the much criticized dualistic frame of early development theories would pose additional problems rather than resolve them, and leads to unwarranted evasion of the agrarian question that remains central to understanding the patterns of labour migration in contemporary times.12 National data sets have however, been slow to respond to research on circular, seasonal and short term migration and have remained anchored in what has been called a ‘permanent settlement paradigm’.13 The welcome recent inclusion of a separate category of short term migrants in the 2007-08 migration survey by NSSO as also an additional question on temporary migration, is still dogged by definitional weaknesses that persist in excluding a large proportion of short term and circular migrants. It is of course also true that the official migration data relates primarily to population movements, in contradistinction to development or economic theories of migration which are primarily based on labour migration (Ravi Srivastava, 2009), and there are genuine difficulties and a degree of fuzziness encountered in trying to distinguish between the two. Nevertheless, the data on migration for employment (as a reason for migration) has long been thought to approximate levels of economic/labour migration. In general, while female migrants vastly outnumber male migrants in the population movement/migration data for India, the proportions of female migrants identified as moving for employment related reasons is so small as to be rendered insignificant, in contrast to males where the proportions migrating for employment reasons are the most significant. We believe that it is the mono-causal approach (i.e., the attribution of a single reason for migration) followed by the macro surveys that has been a major factor in camouflaging at least some economic/labour based decisions in women’s migration under other apparently non-economic social reasons. For example, some implicit or actual labour migration by women may appear in the data as marriage migration or as other forms of associational movement by women simply because both may coincide, but the social reason is presumed to be all important. Even where women of a migrant family enter the paid or income earning workforce in their individual capacity at any given destination, it is still possible that marriage or family movement would be given as
12 Even though the model of growth, accumulation and development of modern technology
and industry leading to a reduction of both mass underemployment and the concentration of labour in low productive sectors (that underlay the dualistic model), has been belied by experience in India, and it is increasingly clear that that the conditions and constraints of the present stage of capitalism on a worldwide scale were only partially taken into account by the classic development model, its sector based conception cannot be dismissed as irrelevant for a developmental perspective on labour migration.
13 Graeme Hugo (2003), ‘Circular Migration: Keeping Development Rolling?’ http://www.migrationinformation.org/feature/display.cfm?ID=129
21
the reason for migration since the social (marriage and family and movements) and economic (employment, business, etc.) reasons for migration are often congruent to the point of intersection in the case of women. When combined with lack of adequate attention to short term migration, where explicit labour migration by women is known to be not insignificant, an underestimation of female labour migration appears to be inbuilt into the data. Several decades of macro-data on migration have thus presented a largely unchanging picture of women migrating for mainly social reasons and men for economic reasons. The net result has been an entrenched and reasoned proclivity towards using male migration (a perceived proxy for labour or employment oriented economic migration) as the primary indicator in development oriented discussions on migration at the cost of gendered analysis. Finally, there is the question of the unit of labour. Anthropological research has already drawn attention to the circulation of family units or male female pairs for wage labour in some industries/activities that are virtually completely manned by migrants. For example, millions of migrant workers are recruited in pairs (jodis) or family unit by contractors for brick making near and in kilns across the country and for harvesting sugarcane across large areas in western and southern India. That social or employment relations are all based on individual units of labour is clearly not as universal as is assumed by the employment and migration data and indeed even by the laws related to labour. It seems to us that an orientation towards a permanent settlement paradigm, a monocausal approach to migration that tends to a rigid distinction economic and social reasons for migration, a lack of focus on circular modes of labour migration, and a flattened out and purely individual labour unit based conception/definition of work/employment, inclines the macro-data towards concealing more than revealing many important features and trends in relation to labour, gender and migration that operate on the ground. It is in such a context that the Centre for Women’s Development Studies undertook a research project on gender and migration, whose centerpiece was a meso-level survey. CWDS Gender and Migration Survey Since the central questions addressed in the CWDS survey related to labour migration, a key methodological issue that had to be addressed was whether the survey should be directed at households or individuals. After an initial pilot round, it was decided to use two sets of questionnaires in tandem, one for collecting household details and characteristics, and one for collecting information on individual experiences. A second question related to how the survey could be pitched at both source and destination of migrants. Both were deemed necessary for a better understanding or comprehension of migration processes, including its compulsions, trajectories, outcomes. As such, two categories of sites were taken for

22
the questionnaire based surveys: one comprising ‘village sites’, broadly representing source areas of migration, (with room for including in-migrants to the village) and the second comprising of a range of ‘sector sites’. The latter targeted industries/occupations in both rural and urban areas, where prior information indicated concentration of women migrant workers.14 In the village sites, households were selected following a village census and selection of a stratified sample, with social groups/caste categories as the primary axis, and perceived economic status as a secondary factor for sample selection. A major bias towards households with migrants was emplaced along with a minimum one third quota for Scheduled Castes or Tribes.15 From these selected households individual migrant workers were then selected with a minimum quota of one third of women.16 In urban areas, broadly considered to be destination sites, only sector based surveys were conducted. In the identified sectors/occupations, a flexible method was used, and a purposive selection of only women. Thus, while several male migrants were individually covered by the surveys at village sites, in general they were excluded from the sector based surveys. The same questionnaires were used for village sites and sector sites, although differentiated methods of respondent selection were adopted. At the village sites, details of male and female members of all households were gathered for all respondents, and individual migrants were identified from the stratified household sample. However, where the entry was effected at the sector level, the household details followed the selection of individual migrant worker respondents. Selection of both village and sector sites was done with an eye to dispersion among several states and prominent catchment areas of migrant labour recruitment, and not on the basis of agro-climatic zones. While such a method could not obviously generate statistically validated information, the utility of such a meso level survey lies precisely in filling opacities or gaps in the available macro-statistics, and introducing an intermediary level survey incorporating greater spatial diversities and empirical breadth than more localised micro-surveys. Over a period of 24 months commencing January 2009, surveys with the pair of detailed and structured questionnaires were conducted across 20 states covering 5,007 individual migrants and 5,558 households. These were drawn from village surveys as well as sector based surveys. Comprehensive village surveys were conducted in 35 districts across 17 states. Preliminary censuses covered 16,010 households in 43 village sites, eliciting 14 There were two kinds of information that guided the selection of sector sites. The first was
the employment patterns in urban areas based on NSS employment surveys, and the second was field based information as to the sectors where women migrants were concentrated.
15 The quota for SC/ST was put in place because of our observation that women of these communities had a higher compulsion/propensity to be involved in labour migration.
16 The minimum quota for individual women migrant worker could not however be filled everywhere, particularly in UP and Bihar.
23
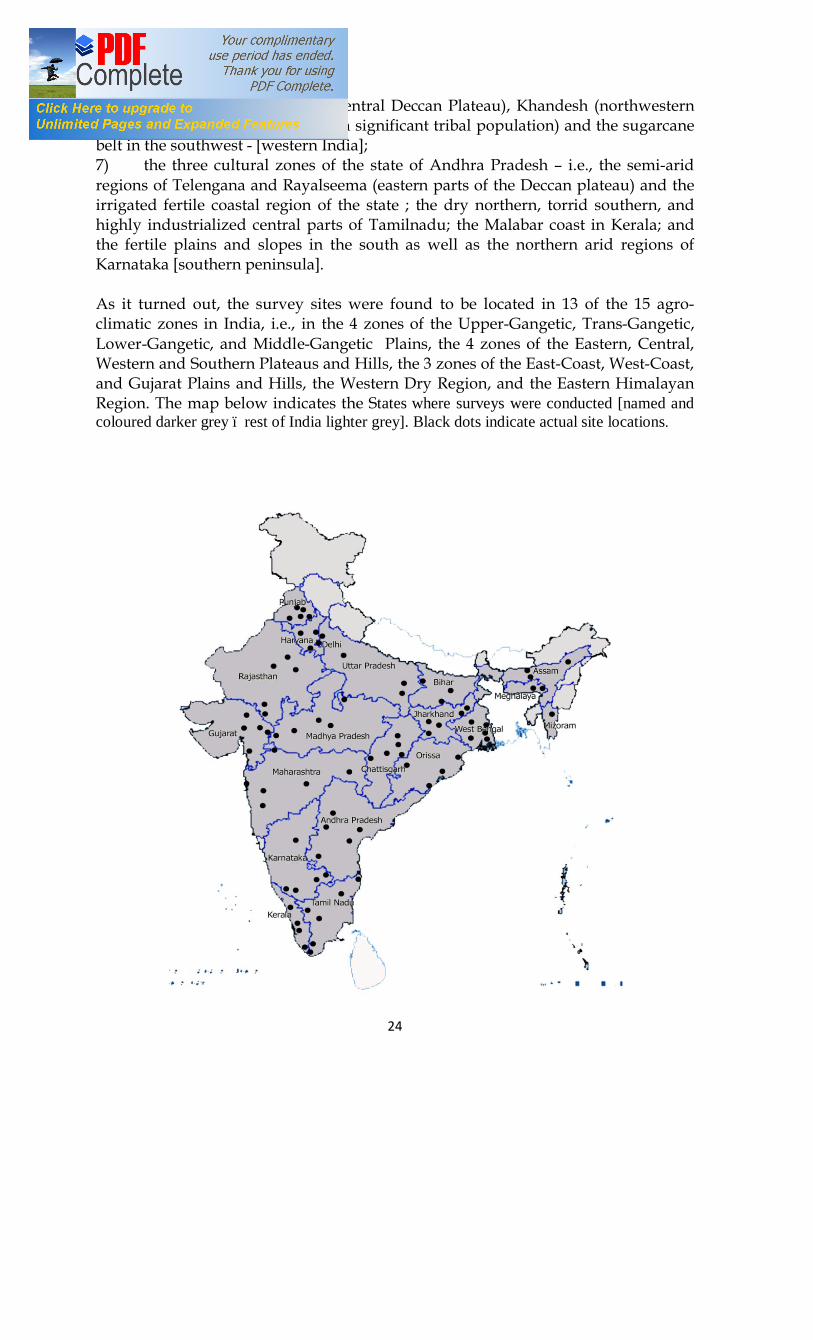
information on caste, relative economic status, and on the number of economic migrants. These were followed by detailed questionnaires covering a total of 673 households without migrants and 2,564 individual migrants and their households. Of the individual migrants covered by the village surveys, 1,903 were males and 661 were females. Sector based surveys directed at women migrant workers were conducted in 20 states in rural as well as urban areas, of which the urban areas comprised of 7 large cities and 10 medium and smaller towns. Sector based surveys covered 2,443 individual migrants and their households. In all, 3,073 female migrant workers and 1,934 male migrant workers and their households were covered by the survey. Of the 3,073 women migrants, 1,594 were surveyed in rural areas and 1,479 in urban. In combination, the village and sector based migrant workers were accessed across more than 75 districts, apart from the 7 large cities. Whether regions/terrains should be classified into socio-cultural/historical, ecological or agro-climatic zones for surveys on migration in India, a country with multiple scales of diversity, is still an open question for us. But for a rough idea of the mix that characterized the areas where this series of micro-surveys were located, we may list the areas where the surveys were conducted. They included 1) the agriculturally developed heartland of Malwa and Doaba regions of the state of Punjab; the developed but semi-arid western zone and eastern trans-Gangetic plains of Haryana; the upper Doab, Rohilkhand and Purvanchal regions of the country’s most populated state of Uttar Pradesh [all part of the landlocked north to northwest of the country]; 2) the north-western, north-eastern as well as southern alluvial plains of the predominantly agricultural state of Bihar; the laterectic, red and gravely undulating region in the western part of West Bengal (eastern reaches of middle India’s Chotanagpur plateau with a sizable tribal population), as well as the deltaic alluvial plains in the south of the state [north central and the coast of east India]; 3) the ethnically highly diverse humid subtropical hills and valleys of three states of Assam, Meghalaya and Mizoram, [the northeast], 4) the arid inland western parts as well as the coastal regions of Orissa state [east coast]; in the newly formed mineral rich states of Jharkhand and Chhattisgarh with large forest cover and tribal populations; in the arid plains of Bundelkhand , the underdeveloped parts of the Malwa plateau area and agriculturally developed upper plains of the Narmada river basin in the country’s second largest state of Madhya Pradesh [central highlands]; 5) the semi-arid southwestern reaches of the Aravalli Hills and sandy eastern plains in the physically largest state, Rajasthan [north-west India]; 6) the significantly industrialised southern and the more backward north eastern parts of the state of Gujarat; and in the otherwise most industrialised state of
24
Maharashtra: Marathwada (west-central Deccan Plateau), Khandesh (northwestern corner of the Deccan plateau with a significant tribal population) and the sugarcane belt in the southwest - [western India]; 7) the three cultural zones of the state of Andhra Pradesh – i.e., the semi-arid regions of Telengana and Rayalseema (eastern parts of the Deccan plateau) and the irrigated fertile coastal region of the state ; the dry northern, torrid southern, and highly industrialized central parts of Tamilnadu; the Malabar coast in Kerala; and the fertile plains and slopes in the south as well as the northern arid regions of Karnataka [southern peninsula]. As it turned out, the survey sites were found to be located in 13 of the 15 agro-climatic zones in India, i.e., in the 4 zones of the Upper-Gangetic, Trans-Gangetic, Lower-Gangetic, and Middle-Gangetic Plains, the 4 zones of the Eastern, Central, Western and Southern Plateaus and Hills, the 3 zones of the East-Coast, West-Coast, and Gujarat Plains and Hills, the Western Dry Region, and the Eastern Himalayan Region. The map below indicates the States where surveys were conducted [named and coloured darker grey – rest of India lighter grey]. Black dots indicate actual site locations.
25
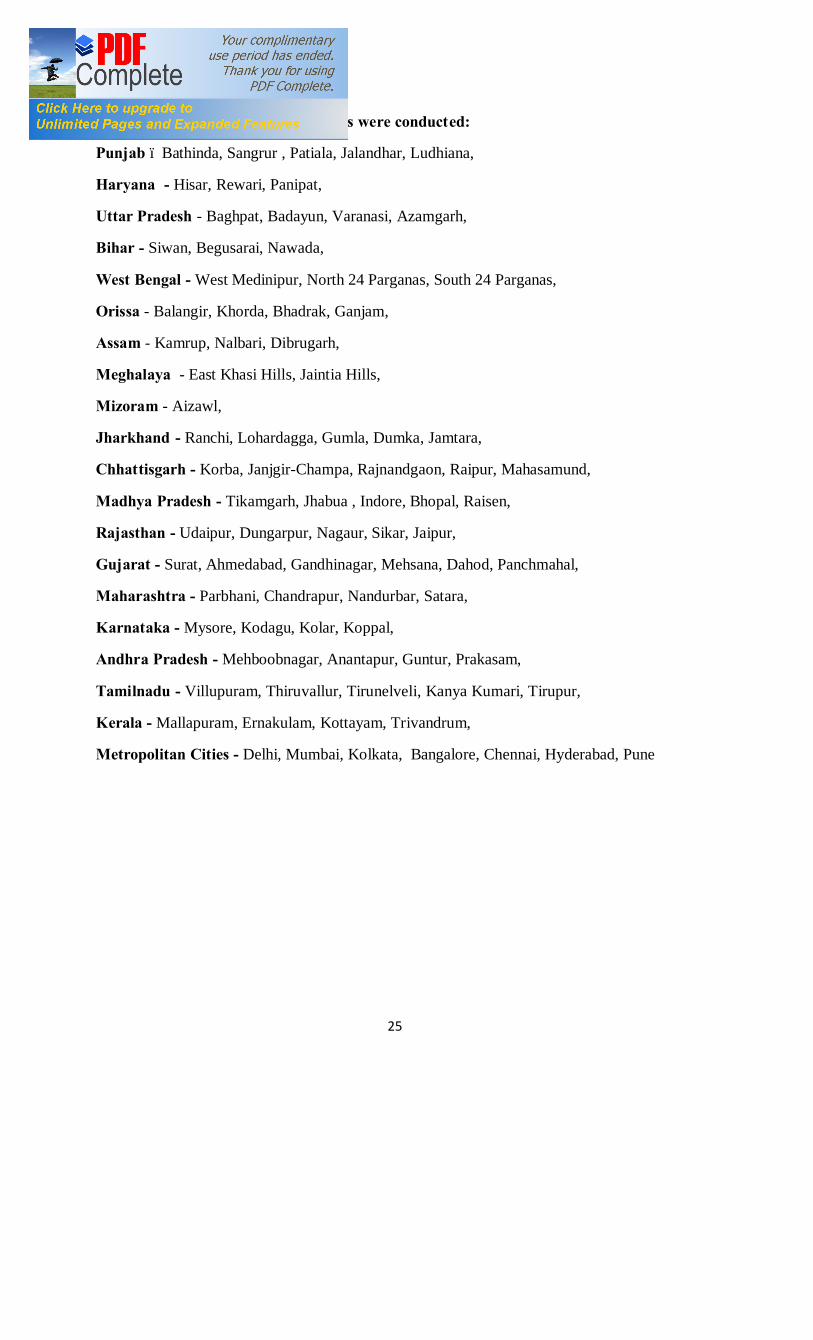
States and Districts where the surveys were conducted:
Punjab – Bathinda, Sangrur , Patiala, Jalandhar, Ludhiana,
Haryana - Hisar, Rewari, Panipat,
Uttar Pradesh - Baghpat, Badayun, Varanasi, Azamgarh,
Bihar - Siwan, Begusarai, Nawada,
West Bengal - West Medinipur, North 24 Parganas, South 24 Parganas,
Orissa - Balangir, Khorda, Bhadrak, Ganjam,
Assam - Kamrup, Nalbari, Dibrugarh,
Meghalaya - East Khasi Hills, Jaintia Hills,
Mizoram - Aizawl,
Jharkhand - Ranchi, Lohardagga, Gumla, Dumka, Jamtara,
Chhattisgarh - Korba, Janjgir-Champa, Rajnandgaon, Raipur, Mahasamund,
Madhya Pradesh - Tikamgarh, Jhabua , Indore, Bhopal, Raisen,
Rajasthan - Udaipur, Dungarpur, Nagaur, Sikar, Jaipur,
Gujarat - Surat, Ahmedabad, Gandhinagar, Mehsana, Dahod, Panchmahal,
Maharashtra - Parbhani, Chandrapur, Nandurbar, Satara,
Karnataka - Mysore, Kodagu, Kolar, Koppal,
Andhra Pradesh - Mehboobnagar, Anantapur, Guntur, Prakasam,
Tamilnadu - Villupuram, Thiruvallur, Tirunelveli, Kanya Kumari, Tirupur,
Kerala - Mallapuram, Ernakulam, Kottayam, Trivandrum,
Metropolitan Cities - Delhi, Mumbai, Kolkata, Bangalore, Chennai, Hyderabad, Pune
26
Key Findings of the Study
Part I
Of Marriage and Migration
Paradoxes and Puzzles in the Macro-Data 1. The most striking feature of the migration data from the National Sample
Survey (NSS), is the increase in rates of female migration for both rural and urban India between 1993 and 2007-08, in contradistinction to male migration rates that have fallen in rural India and moved towards stagnation after an initial increase in urban areas.17 It may be underlined that as per the latest survey of 2007-08, females constituted more than 80 per cent of all migrants [migrants being defined as persons ‘whose last place of usual residence (UPR), anytime in the past was different from the place of enumeration’]. About a decade and a half earlier, in 1993, the female share of migrants was 72 per cent.
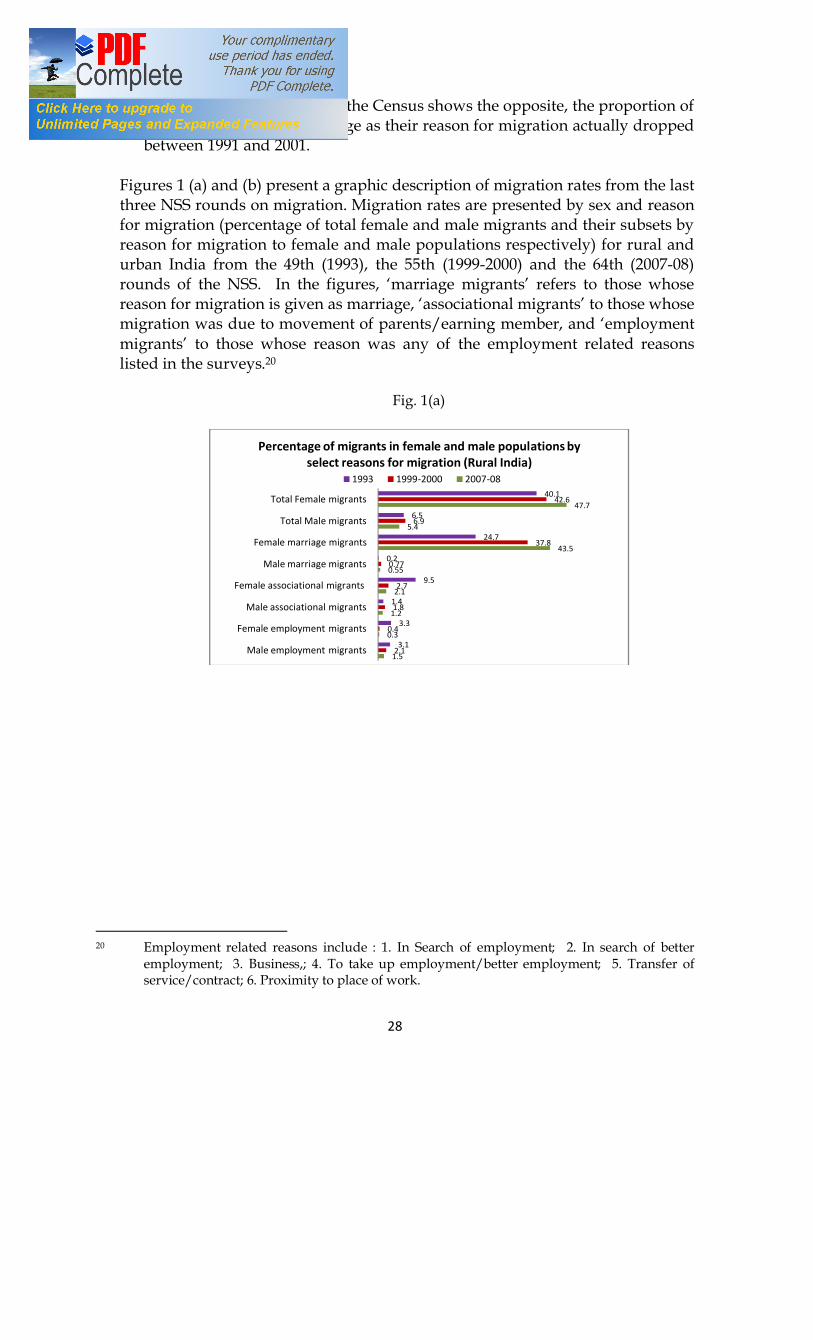
2. The enhancement of female migration in both rural and urban areas, appears
to have been driven by a sharp increase in migration for marriage. While overall female migration rates in rural India increased by close to 8 percentage points from 40.1 per cent in 1993 to 47.7 in 2007-08, its subset – the female marriage migration rate rose by more than double that figure, increasing by 19 percentage points from 24.7 per cent in 1993 to 43.5 per cent in 2007-08 [Fig. 1(a)]. Similarly, in urban areas, while the overall female migration rate increased by some 7 percentage points, the female marriage migration rate rose by around 16 percentage points [Fig. 1(b)].18 The major jump in female marriage migration can be seen to have taken place between 1993 and 1999-2000, when the proportion of marriage migrants in the female population rose by more than 13 percentage points in rural areas and by more than 12 percentage points in urban areas. The censuses of 1991 and 2001 show that the decadal growth rate of currently married women in the 1990s was 21.9%, just marginally above the general population growth rate of 21.5% and the mean age at marriage for women actually rose from 17.7 to 18.3 years. One can only conclude that the data indicates not larger proportions of married women, but rather larger proportions of women migrating for marriage.
17 The 2007-08 NSS data on migration is the most recent of available macro-surveys on
migration in India. 18 At the same time, the female migration rate due to movement of parents/earning member
(associational) fell by over 7 percentage points in rural India from 9.5 per cent in 1993 to 2.1 in 2007-08 and similarly from 18.9 to 13.4 per cent in urban India.
27
3. A fall in employment oriented migration rates of women is observable from
3.3 to 0.3 per cent in rural areas.19 Female migrants dropped from a position of more than half of rural employment oriented migrants in 1993 to less than a quarter of an already shrinking force of rural migrants for employment in 2007-08. In urban areas, employment oriented migration by women has always appeared as more marginal, no doubt related to the exceedingly low female work participation rates in urban India. But even the marginal share of migrants for employment in the female population declined from 1.9 per cent in 1993 to 1.2 per cent in 2007-08. In contrast male employment oriented migration increased from 9.9 per cent of the urban male population in 1993 to 14.4 per cent by 2007-08. As such, in the NSS data, while, declining employment oriented migration rates among women are visible in both rural and urban areas, among men they have increased significantly in urban areas. It is pertinent to note here that the expectations of expanding employment opportunities and demand for women workers under a liberalized policy regime (the so-called feminization of labour), that were further expected to fuel migration, are not borne out by the NSS data on either employment or migration.
4. There is evidence of some exaggeration of female marriage migration in the
NSS when compared with the Census, more sharply visible for urban areas, if only slightly for rural areas. Comparing the NSS surveys (1993 and 1999-2000) with the Census (1991 and 2001) highlights the following: (a) the NSS appears to underestimate the extent of increase in and actual scale of migration by both women and men in rural areas during the 1990s, (b) again for rural areas, the drop in employment oriented migration by women and men across the decade as appears in the NSS is not borne out by the census, although the proportion for both sexes at the end of the decade are a close match, (c) for urban areas, the NSS estimates of the decline and proportions of female employment oriented migration are almost exactly the same as the census counts, whereas for urban males the NSS estimates of the increase in employment oriented migration in the 1990s appear to be exaggerated, but the proportion at the end of the decade is again very close to exact match, (d) In the Census counts, an increasing and substantial proportion of male and female migrants in urban and rural areas appear to have given ‘other reasons’ for migration, not reflected in the NSS survey estimates at all, and (e) while the increase in marriage migration by women in rural areas is reflected in both NSS and Census, for urban areas, there is divergence between the two. The NSS estimates a doubling in proportions of urban female marriage
19 The proportion of employment oriented male migration also dropped by more than half in
rural areas, but the fall for women was much steeper.
28
migrants in the 1990s, while the Census shows the opposite, the proportion of urban women giving marriage as their reason for migration actually dropped between 1991 and 2001.
Figures 1 (a) and (b) present a graphic description of migration rates from the last three NSS rounds on migration. Migration rates are presented by sex and reason for migration (percentage of total female and male migrants and their subsets by reason for migration to female and male populations respectively) for rural and urban India from the 49th (1993), the 55th (1999-2000) and the 64th (2007-08) rounds of the NSS. In the figures, ‘marriage migrants’ refers to those whose reason for migration is given as marriage, ‘associational migrants’ to those whose migration was due to movement of parents/earning member, and ‘employment migrants’ to those whose reason was any of the employment related reasons listed in the surveys.20
Fig. 1(a)
20 Employment related reasons include : 1. In Search of employment; 2. In search of better
employment; 3. Business,; 4. To take up employment/better employment; 5. Transfer of service/contract; 6. Proximity to place of work.
1.5
0.3
1.2
2.1
0.55
43.5
5.4
47.7
2.1
0.4
1.8
2.7
0.77
37.8
6.9
42.6
3.1
3.3
1.4
9.5
0.2
24.7
6.5
40.1
Male employment migrants
Female employment migrants
Male associational migrants
Female associational migrants
Male marriage migrants
Female marriage migrants
Total Male migrants
Total Female migrants
Percentage of migrants in female and male populations by select reasons for migration (Rural India)
1993 1999-2000 2007-08

29
Fig. 1(b)
Interconnected Processes: Increasing Marriage Migration, expanding Village Exogamy, growth of Dowry, and devaluation of Women’s Work We would go along with the census evidence that there is a substantial increase in migration rates for marriage in rural areas and not so much in urban. 21 The question then has to be directed specifically to trying to understand developments that have led to a substantial rise in migration for marriage in rural areas. At a preliminary level, at least for the 1990s, some part of the increase in women moving more for marriage may be explained by the fact that they may be following increasing proportions of migrating men in rural India between 1993 and 1999-2000. Such an explanation is however insufficient, since the increase in numbers and proportion of women migrating for marriage was more than double the increase in male migration across the same period. There are then perhaps three other interrelated reasons that could be explanatory for such an increase in marriage migration in village India. 1. The first is that more village exogamous marriages may be taking place in
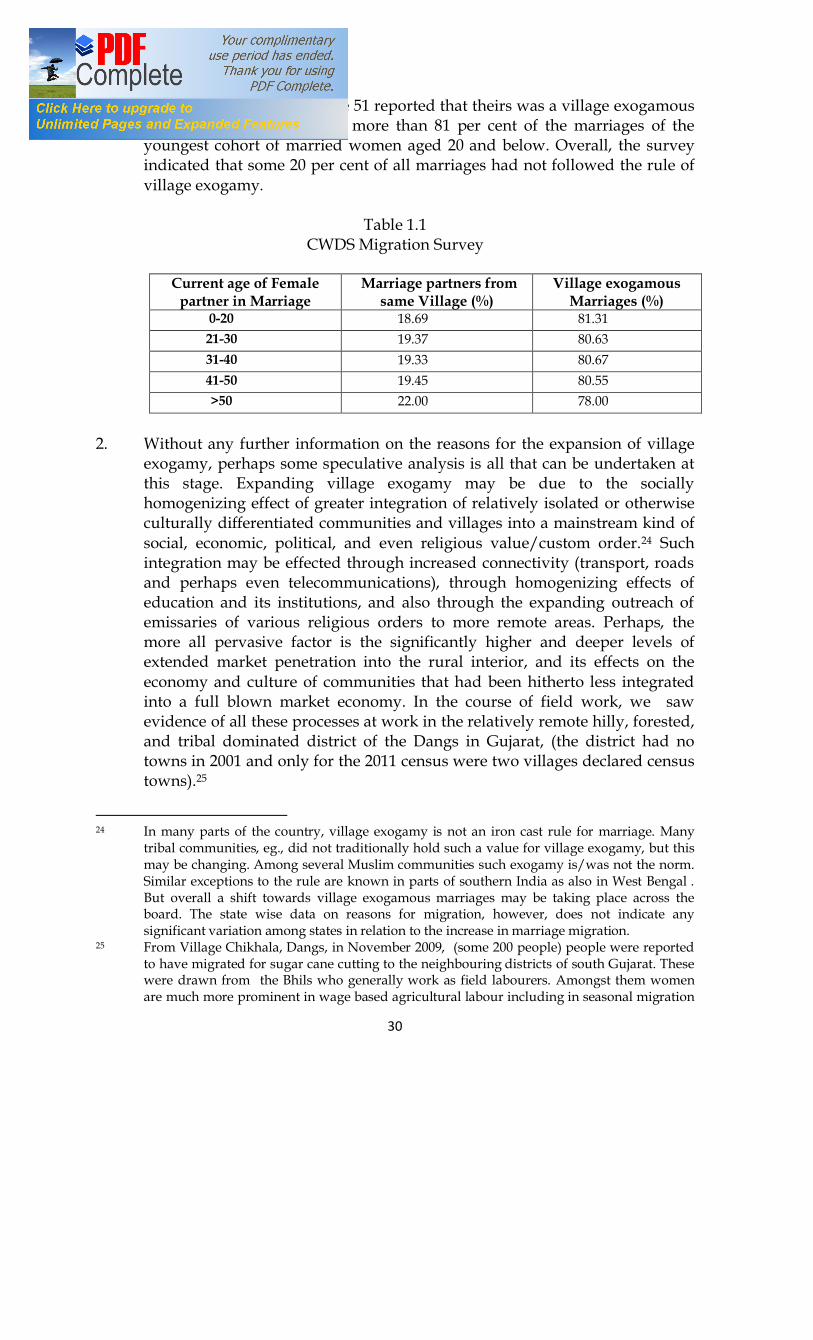
comparison to the past.22 That marriages beyond village boundaries has indeed increased is indicated by marriage details of 5,774 couples drawn from the CWDS primary household questionnaire based survey on Gender and Migration presented in Table 1.1.23 As may be seen, 78 per cent of the women
21 It is possible that with the increase in urban female population between 2001 and 2011
exceeding the increase in rural female population (unlike in the case of men), there has been an increase in female migration rates including for marriage in urban areas as well.
22 It needs to be borne in mind that in such a large and diverse country, despite the wide prevalence of village exogamy, assumption of its universality across all castes, communities, and localities must necessarily be tempered by the limitations of our knowledge of the full spectrum of diversity.
23 20 per cent of these households were surveyed in urban settlements, 70 per cent in village settlements, 6 per cent in non-settlement areas. 12 per cent of the households had no economic migrants. The remaining 88 per cent were households with at least one economic migrant.
14.4
1.2
6
13.4
0.4
27.7
25.9
45.6
13.3
1.3
6.9
12.9
0.4
24.5
25.7
41.8
9.9
1.9
6.8
18.9
0.2
12.1
23.9
38.2
Male employment migrants
Female employment migrants
Male associational migrants
Female associational migrants
Male marriage migrants
Female marriage migrants
Total Male migrants
Total Female migrants
Percentage of migrants in female and male populations by select reasons for migration (Urban India)
1993 1999-2000 2007-08
30
in the older age group above 51 reported that theirs was a village exogamous marriage. This had risen to more than 81 per cent of the marriages of the youngest cohort of married women aged 20 and below. Overall, the survey indicated that some 20 per cent of all marriages had not followed the rule of village exogamy.
Table 1.1
CWDS Migration Survey
Current age of Female partner in Marriage
Marriage partners from same Village (%)
Village exogamous Marriages (%)
0-20 18.69 81.31 21-30 19.37 80.63 31-40 19.33 80.67 41-50 19.45 80.55 >50 22.00 78.00
2. Without any further information on the reasons for the expansion of village
exogamy, perhaps some speculative analysis is all that can be undertaken at this stage. Expanding village exogamy may be due to the socially homogenizing effect of greater integration of relatively isolated or otherwise culturally differentiated communities and villages into a mainstream kind of social, economic, political, and even religious value/custom order.24 Such integration may be effected through increased connectivity (transport, roads and perhaps even telecommunications), through homogenizing effects of education and its institutions, and also through the expanding outreach of emissaries of various religious orders to more remote areas. Perhaps, the more all pervasive factor is the significantly higher and deeper levels of extended market penetration into the rural interior, and its effects on the economy and culture of communities that had been hitherto less integrated into a full blown market economy. In the course of field work, we saw evidence of all these processes at work in the relatively remote hilly, forested, and tribal dominated district of the Dangs in Gujarat, (the district had no towns in 2001 and only for the 2011 census were two villages declared census towns).25
24 In many parts of the country, village exogamy is not an iron cast rule for marriage. Many
tribal communities, eg., did not traditionally hold such a value for village exogamy, but this may be changing. Among several Muslim communities such exogamy is/was not the norm. Similar exceptions to the rule are known in parts of southern India as also in West Bengal . But overall a shift towards village exogamous marriages may be taking place across the board. The state wise data on reasons for migration, however, does not indicate any significant variation among states in relation to the increase in marriage migration.
25 From Village Chikhala, Dangs, in November 2009, (some 200 people) people were reported to have migrated for sugar cane cutting to the neighbouring districts of south Gujarat. These were drawn from the Bhils who generally work as field labourers. Amongst them women are much more prominent in wage based agricultural labour including in seasonal migration
31
3. A second reason may be related to increased difficulties in localized commons
based subsistence activities in some areas, in a context of general demographic pressure, propelling a search for marriage partners outside the immediately local. The context for such enhanced difficulty is a spurt in enclosure of village or forest commons or common property resources (CPR) by private interests and/or through administrative measures, which perhaps most affects areas characterized by dispersed village hamlets, often tribal based, where village exogamy may not have been so much of a traditional rule of marriage.26 Such enclosure and concomitant exclusion of locals from traditional foraging for food and marketable produce from CPR, necessarily has a negative effect on the value of the contribution of local women to hitherto commons dependent households. As households then shift from commons based subsistence to other activities, in such circumstances, other considerations (including possibilities of dowry from elsewhere) may have become more important than the value of the local knowledge of local women, leading to an extension of the boundaries of search for female marriage partners.27 Conversely, brides and their families may feel the need to look elsewhere for male marriage partners too.28
for sugarcane cutting in southern Gujarat. Since sugar cane cutters are recruited and work in male female pairs (koytas), among the Bhils of the area, no shift to dowry has taken place and bride price is reportedly ‘high’ (around Rs 35,000 or so). A degree of class differentiation among is visible the tribal peasantry both within tribes and between tribes. The larger land owners (above 2.5 hectares), some better educated, were from the tribe of Kunbis. They also appeared to be more Hinduised, practicing village exogamy the region reported that a paltry Rs 250 is the bride price given in their marriages now and though no cash dowry is given, household goods and commodities are given by the bride’s family. It appears that only ritual remnants of bride price continue, and a shift to dowry is taking place among Kunbis, although the grooms still initiate the marriage negotiations as is frequently the case among many non-Hinduised tribal communities. Kunbi women do work in the fields, but some of the better off hh, have only hired workers and women then concentrate on domestic life, even if agriculture is only for own consumption. As a young man of the Kunbi tribe said, “In families where someone needs someone to help with the housework then they get married even at the age of 17.” It may be noted that this area has seen a visible increased activity of religious organizations, Hindu and Christian and was at the centre of a wave of communal attacks on Christians in the late 1990s and militant opposition to conversion, including a visit by Swami Aseemanand, prime accused in the Samjhauta Express blast case, in 1995, See ‘From itinerant preacher in the Dangs to a bomb-for-bomb ideologue’, Times of India, Jan 9, 2011.
26 The highest proportion of Households collecting CPR (exceeding 50%) are concentrated in the eastern, southern and western plateaus and hills, (Menon and Vadivelu), some areas of which are mineral rich, and have been more opened to private exploitation in the reform era.
27 In many of the tribal communities so affected, it is the groom who initiates the marriage proposal.
28 Analysing the 1998 NSS round data on CPR products, Menon and Vadivelu have shown that 48% of the households used common property resources for consumption, and CPR contributed around 3.02% of hh consumption for the country as a whole.
32
4. The third and perhaps the most generalized of all reasons, relates to agrarian crisis. Arguably, across a longer time scale, an overall shift from the custom of bride price in many peasant communities to a more general universalization of the custom of dowry, has, in part, been a reflection of the increasing devaluation of women’s productive labour in agriculture and household industry. Historical research has established that as peasant and artisanal household economies began to absorb the impact of colonial interest driven commercialization, it had the effect of reducing the relative value of labour performed by daughters and wives of peasants, agricultural labour and artisans. 29 This in turn laid some of the ground for the spread of dowry to classes and communities that had earlier traditionally followed a system of bride price.30 The body of insights from historical research into connections between marriage practices and developments related to women’s work in the agrarian base of Indian society can be usefully applied for developing a better understanding increased marriage migration in the present.
It is our contention that the progressive devaluation of what was traditionally women’s work is the core issue that is propelling several gendered social processes which are unfolding in the countryside including expanding marriage migration. Arguably such devaluation could be compensated by expansion of other employment opportunities, particularly in paid work. That it has not happened is evident in the contemporary patterns of growth of employment.
29 Commercialization entailed turning more things into commodities, bringing more people
into market exchange, making more social transactions commercial transactions, and interpreting more of the value of things through pricing.
30 Ranjana Sheel (EPW, July 12, 1997), observes that in the early colonial period, Blunt found the practice of bride-price prevalent among many of the hierarchically lower castes. He listed such castes and noted the average amount of bride-price transacted in their marriages. (Blunt 1912: 71). Turner in 1931 Census Report, found the fast declining control of tribal customs or caste panchayats over the amount of bride-price. He noted that its amount was now getting settled more and more in the nature of business transaction and not by traditional customs [Turner 1933: 312. The growing economic dependency contributed to what has been referred to as the negative net worth of women, and also augmented structural factors leading to the expansion of dowry. A 1915 article [Stree Darpan (1915, Dec: VI): 418-24] noted the link between women's economic decline and the rise of dowry system, and argued that the new rich classes that had emerged demanded ten times more dowry than they did before because women, even of respectable families, had lost their traditional occupations due to the rise of mill industry and also because women's work for living had acquired bad connotations for the status maintenance. It may be interesting to link these changes with other changes coming about in the colonial period, with regard to the marginalization of women’s role in production and emerging sectors of employment. See M. Mukherjee, Impact of Modernization on Women’s Occupations: A case Study of the rice-husking industry in Bengal in J. Krishnamurthy (ed.) Women in Colonial India : Essays on Survival, Work and the State, OUP, Delhi, 1999.
33
The Macro-Context: Contemporary Patterns of Growth, Employment, Differentiation and Inequality The most striking features of the macro-context that have to be borne in mind are agrarian crisis and the twin tendencies of a crisis of employment generation in the economy as a whole, along with the growth of temporary and predominantly casual forms of labour. The impact of these twin tendencies has been most visible among rural women workers.31In our view, the pattern of growth under liberalization contains a vicious rather than virtualous circle in relation to employment, whose impact appears to have first concentrated on women, and is most strikingly reflected in the aggregate picture of trends in female work participation rates, declining in rural India and stagnating at extremely low levels in urban areas. It is our contention that the agrarian crisis is inextricably linked to the skewed growth and employment pattern. Together, their impact on women’s work participation on the one hand, and the restricted conditions in which even male workers are effecting transition out of agriculture, has had repercussions in the social sphere of marriage arrangements, part of which is making an appearance in the increased levels of marriage migration. The gender based specificities in relation to work, employment and marriage, we therefore argue, have to be located within a common frame of a crisis in employment generation in the economy as a whole. Indeed such a crisis has imposed a set of limitations/barriers to the role of labour migration in development transition. In terms of employment, this is relatively easy to establish empirically. More difficult is the working out of how such a growth process and related employment difficulties as well as inequality is impacting our social history. One thing appears to us to be clear is that there is a link between devaluation of women’s work and declining female work participation rates, growth of dowry, expanding village exogamy, that together are reflected in increasing migration for marriage by women. At the core of the macro-context in which all these interlinked processes are playing out is the agrarian crisis, which, since the mid 1990s is known to be distinct from the creeping or slow crisis that characterized Indian agriculture of the pre-liberalization period of decolonization. Earlier crisis was typically because land monopoly had not been broken down, and with the persistence of sub economic modes of exploitation, there was an inability to substantially reduce the mass poverty concentrated in rural areas. These conditions still continue to operate, if in modified forms, but some critical developments and elements related to the liberalization orientation of policy have intervened with more immediate force transforming the context, features, and terms of the current crisis that is gripping the countryside. For one, the share of
31 Within the overall picture of declining female work participation rates, the number of female
self employed workers with income (own account + employers) in rural India dropped from 18.9 million in 2004-05 to 16.7 million in 2007-08, while the numbers of female casual labour increased from 38.6 to 42.6 million. Regular salaried employment remained insignificant. (Mazumdar and Neetha, EPW).
34
agriculture in the country’s GDP has declined at a more precipitous pace precisely when other sectors of the economy have seen accelerated growth. Such accelerated growth in other sectors, has, however failed to generate commensurate employment. The major part of the workforce thus continues to be concentrated in, and a major part of the population remains rooted in and dependent on agriculture, unable to be absorbed or to find employment in the high growth segments of industry and services.32 The two decades following 1991 saw a precipitate drop in the share of agriculture from around 28 per cent of GDP to the present 14 per cent. With just 14 % of GDP, agriculture employs 47% of the male and 69% of the female workforce. In contrast, the service sector, with 58% of GDP, employs around 29% of the male workforce and just about 15% of the female workforce. Industry, (including manufacturing, mining and construction) with a 28 per cent share of GDP, employs 24% of the male and 16% of the female workforce.33 In other words, the major part of the working population and their families has remained concentrated in the lowest and rapidly declining income sector with adverse implications in relation to poverty, inequality and the returns to agricultural work/employment. Given the relatively greater concentration of the female workforce in agriculture, it would be obvious that the effect of the precipitate decline in the income share of agriculture has had a proportionately greater effect in pushing down the value of women’s work. As evident from the estimates of numbers of workers given in Table 1.2 and the overall decline in female work participation rates, there has been a particularly negative influence on female employment in absolute as well as relative terms. The declining value and increasing non-viability of peasant agriculture has meant that the still significant population of the agricultural workforce and their families, is increasingly unable to be supported by agriculture alone (possibly compelling a search for marriage partners outside agriculture, which may be a factor in increasing marriage migration). At the same time, the inverse relation between sector shares of GDP and employment has set limits to employment oriented migration out of agriculture. Within agriculture, while some commercial crops have continued to employ women as field labourers and a few (such as in the MNC controlled contract farming in cotton seed production) may actually have generated new demand for female labour for certain operations. However, an accelerated spread of mechanization of agricultural operations has led to a generalized fall in the number of available work days per capita for agricultural labour.34 A characteristic feature
32 In the five decades from 1951 to 1999 , the share of agriculture went from being more than
half of India’s GDP to around a quarter. But the two decades following 1991 saw a precipitate drop in the share of agriculture from around 28 per cent of GDP to the present 14 per cent.
33 GDP figures are for 2011, employment shares are drawn from the 2009-10 NSS employment survey estimates by industrial classification.
34 The impact of mechanization is evident in the fall in the share of human energy use in agriculture, which dropped from around 23.3 per cent of total energy used in 1990-91 to less than 15 per cent in 2000-01 in contrast to the share of mechanical energy which rose from 58 per cent to 76 per cent across the same period. See Table 16 in Kulkarni SD. (2009), Mechanization of Agriculture - Indian Scenario, unapcaem. At this point we may also note that mechanization as well as new varieties of commercial crops introduced through the
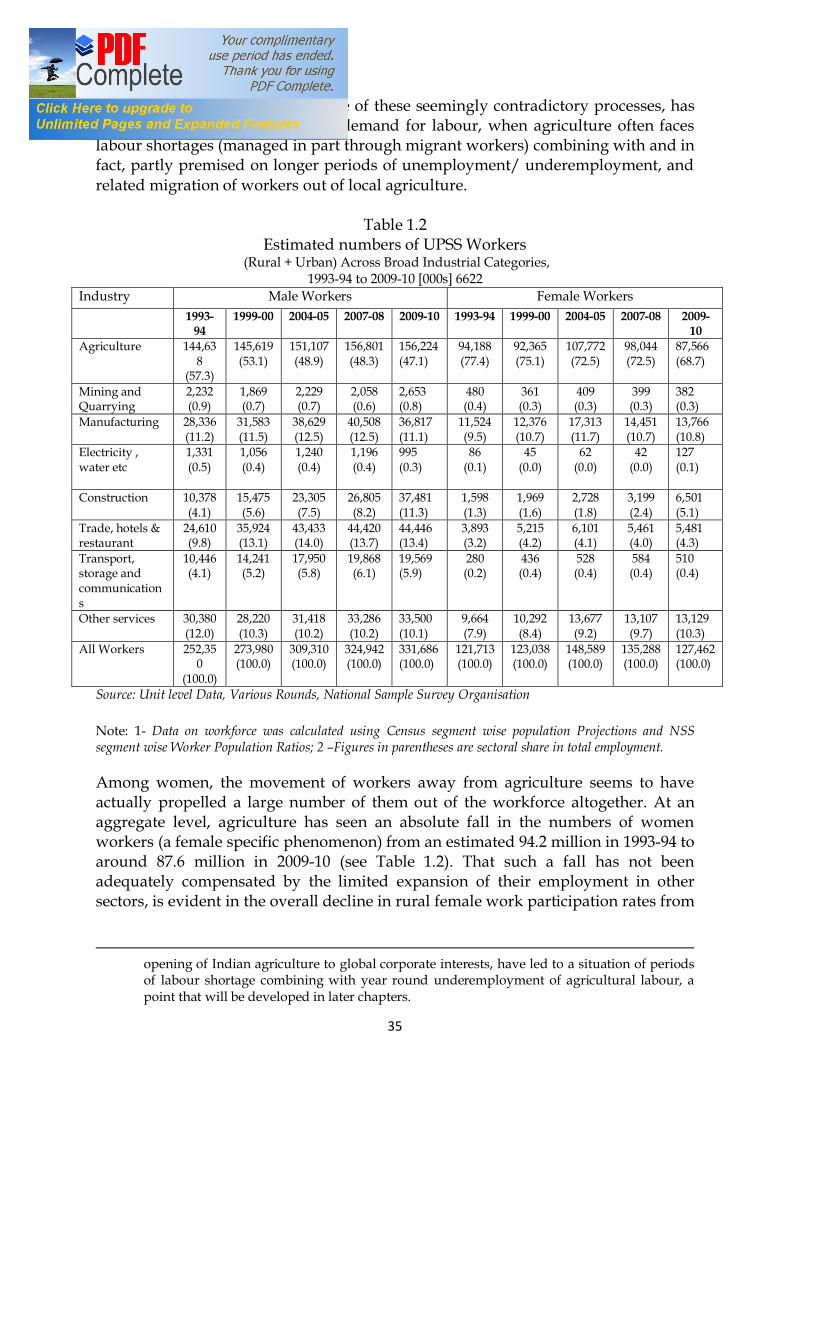
35
that is both cause and consequence of these seemingly contradictory processes, has been shorter periods of intensive demand for labour, when agriculture often faces labour shortages (managed in part through migrant workers) combining with and in fact, partly premised on longer periods of unemployment/ underemployment, and related migration of workers out of local agriculture.
Table 1.2
Estimated numbers of UPSS Workers (Rural + Urban) Across Broad Industrial Categories,
1993-94 to 2009-10 [000s] 6622 Industry Male Workers Female Workers 1993-
94 1999-00 2004-05 2007-08 2009-10 1993-94 1999-00 2004-05 2007-08 2009-
10 Agriculture 144,63
8 (57.3)
145,619 (53.1)
151,107 (48.9)
156,801 (48.3)
156,224 (47.1)
94,188 (77.4)
92,365 (75.1)
107,772 (72.5)
98,044 (72.5)
87,566 (68.7)
Mining and Quarrying
2,232 (0.9)
1,869 (0.7)
2,229 (0.7)
2,058 (0.6)
2,653 (0.8)
480 (0.4)
361 (0.3)
409 (0.3)
399 (0.3)
382 (0.3)
Manufacturing 28,336 (11.2)
31,583 (11.5)
38,629 (12.5)
40,508 (12.5)
36,817 (11.1)
11,524 (9.5)
12,376 (10.7)
17,313 (11.7)
14,451 (10.7)
13,766 (10.8)
Electricity , water etc
1,331 (0.5)
1,056 (0.4)
1,240 (0.4)
1,196 (0.4)
995 (0.3)
86 (0.1)
45 (0.0)
62 (0.0)
42 (0.0)
127 (0.1)
Construction 10,378 (4.1)
15,475 (5.6)
23,305 (7.5)
26,805 (8.2)
37,481 (11.3)
1,598 (1.3)
1,969 (1.6)
2,728 (1.8)
3,199 (2.4)
6,501 (5.1)
Trade, hotels & restaurant
24,610 (9.8)
35,924 (13.1)
43,433 (14.0)
44,420 (13.7)
44,446 (13.4)
3,893 (3.2)
5,215 (4.2)
6,101 (4.1)
5,461 (4.0)
5,481 (4.3)
Transport, storage and communications
10,446 (4.1)
14,241 (5.2)
17,950 (5.8)
19,868 (6.1)
19,569 (5.9)
280 (0.2)
436 (0.4)
528 (0.4)
584 (0.4)
510 (0.4)
Other services 30,380 (12.0)
28,220 (10.3)
31,418 (10.2)
33,286 (10.2)
33,500 (10.1)
9,664 (7.9)
10,292 (8.4)
13,677 (9.2)
13,107 (9.7)
13,129 (10.3)
All Workers 252,350
(100.0)
273,980 (100.0)
309,310 (100.0)
324,942 (100.0)
331,686 (100.0)
121,713 (100.0)
123,038 (100.0)
148,589 (100.0)
135,288 (100.0)
127,462 (100.0)
Source: Unit level Data, Various Rounds, National Sample Survey Organisation Note: 1- Data on workforce was calculated using Census segment wise population Projections and NSS segment wise Worker Population Ratios; 2 –Figures in parentheses are sectoral share in total employment. Among women, the movement of workers away from agriculture seems to have actually propelled a large number of them out of the workforce altogether. At an aggregate level, agriculture has seen an absolute fall in the numbers of women workers (a female specific phenomenon) from an estimated 94.2 million in 1993-94 to around 87.6 million in 2009-10 (see Table 1.2). That such a fall has not been adequately compensated by the limited expansion of their employment in other sectors, is evident in the overall decline in rural female work participation rates from
opening of Indian agriculture to global corporate interests, have led to a situation of periods of labour shortage combining with year round underemployment of agricultural labour, a point that will be developed in later chapters.
36
32.8 per cent in 1993-94 to 26.1 per cent in 2009-10.35 The devaluation of women’s work reflected in the declining work participation rates has implications for marriage practices. It has played a role in both expansion of dowry, and has compounded difficulties in marriage arrangements. In meeting such difficulties, exogamous marriages appear to be on the rise, and it is then reflected in the macro-data on migration. The Dowry Question and Marriage Practices: Primary Survey Findings In foregrounding the links between marriage migration and the political economy of contemporary growth in India, dowry has emerged as a focal point around which many of the features of contemporary gender relations are being shaped. Early sociological writings had tended to focus on dowry as flowing from the cultural concepts of kanyadana (gift of the daughter/virgin), dakshina (voluntary offering imbued with high spiritual content) and stridhana (women’s wealth) each of which was felt to have moral and spiritual attributes.36 It was the context of a resurgent women’s movement critique of dowry, that provided the background to sociological discussion around the different meaning/content of dowry in ‘modern’ as compared to pre-modern India, the linking of the spread of dowry as a ‘modern monstrosity’ with volatile money economy, increased agricultural prosperity (in the post second world war period) on the one hand and hypergamy, caste endogamy, early marriage on the other, as well as emulation of higher castes by lower castes (Srinivas, 1984).37 In the women’s movement, the moral compass of particularly upper caste ‘tradition’ was in any case being challenged, and the emergence of ‘bride burning’ and ‘dowry deaths’ as a widespread social phenomenon in the watershed decades of the 1970s and 1980s formed the backdrop for dowry taking the centre stage of the movement’s resurgence. Under pressure from the movement, dowry also became an issue of legislative action leading to more stringent laws to deal with dowry based violence against women in the 1980s. Nevertheless, as is well known, more general public outrage against unchecked dowry based violence receded as more and more women took recourse to the new laws, while dowry itself appeared to acquire fresh support and social, if not legal, sanction in a context of increasing consumption desires and needs, that were not necessarily all being met by the employment/income of individuals. As links were established between escalating dowry with pockets of female infanticide and then with the later more widespread targeting of female
35 A brief spike in FWPR in the NSS’ quinquennial round of 2004-05 was largely attempts to
prop up incomes through self employment with family labour, whose lack of success became evident in the following larger NSS surveys of 2007-08 and 2009-10 when it fell precipitately. (See Mazumdar and Neetha, 2011 for more details). It may be borne in mind that agricultural employment is not confined only to rural areas, and has remained a significant share of female employment even in areas designated urban by the NSS and Census.
36 Ranjana Sheel, op.cit provides a review of this early literature which was mostly based on sociological interpretations of marriage practices among various high caste Hindus in The Political Economy of Dowry, (1999) Manohar, New Delhi
37 M.N. Srinivas, Some Reflections on Dowry, OUP, Delhi, 1984.
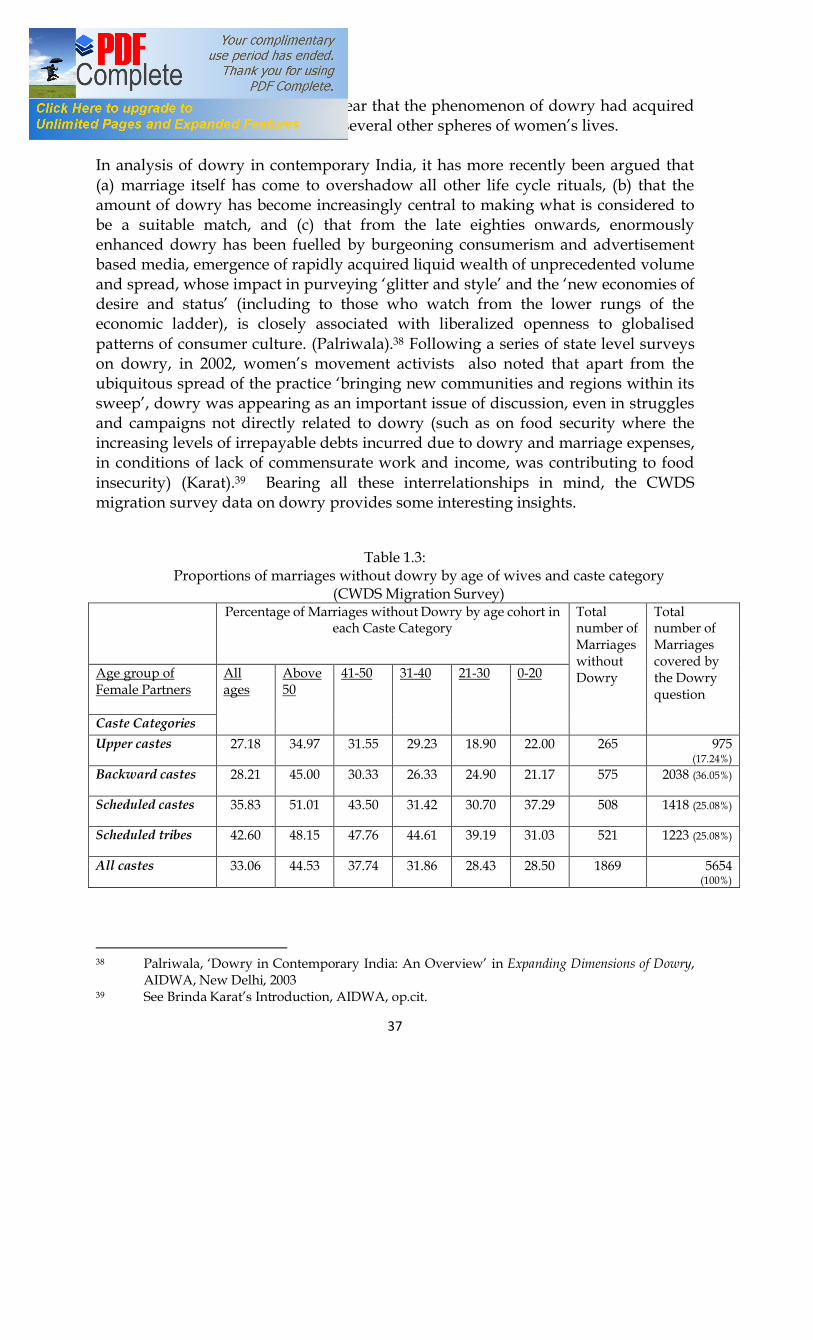
37
foetuses for abortion – it became clear that the phenomenon of dowry had acquired an insidious force penetrating into several other spheres of women’s lives. In analysis of dowry in contemporary India, it has more recently been argued that (a) marriage itself has come to overshadow all other life cycle rituals, (b) that the amount of dowry has become increasingly central to making what is considered to be a suitable match, and (c) that from the late eighties onwards, enormously enhanced dowry has been fuelled by burgeoning consumerism and advertisement based media, emergence of rapidly acquired liquid wealth of unprecedented volume and spread, whose impact in purveying ‘glitter and style’ and the ‘new economies of desire and status’ (including to those who watch from the lower rungs of the economic ladder), is closely associated with liberalized openness to globalised patterns of consumer culture. (Palriwala).38 Following a series of state level surveys on dowry, in 2002, women’s movement activists also noted that apart from the ubiquitous spread of the practice ‘bringing new communities and regions within its sweep’, dowry was appearing as an important issue of discussion, even in struggles and campaigns not directly related to dowry (such as on food security where the increasing levels of irrepayable debts incurred due to dowry and marriage expenses, in conditions of lack of commensurate work and income, was contributing to food insecurity) (Karat).39 Bearing all these interrelationships in mind, the CWDS migration survey data on dowry provides some interesting insights.
Table 1.3: Proportions of marriages without dowry by age of wives and caste category
(CWDS Migration Survey)
Percentage of Marriages without Dowry by age cohort in each Caste Category
Total number of Marriages without Dowry
Total number of Marriages covered by the Dowry question
Age group of Female Partners
All ages
Above 50
41-50
31-40
21-30
0-20
Caste Categories Upper castes 27.18 34.97 31.55 29.23 18.90 22.00 265
975
(17.24%) Backward castes 28.21 45.00 30.33 26.33 24.90 21.17 575
2038 (36.05%)
Scheduled castes 35.83 51.01 43.50 31.42 30.70 37.29 508
1418 (25.08%)
Scheduled tribes 42.60 48.15 47.76 44.61 39.19 31.03 521
1223 (25.08%)
All castes 33.06 44.53 37.74 31.86 28.43 28.50 1869
5654 (100%)
38 Palriwala, ‘Dowry in Contemporary India: An Overview’ in Expanding Dimensions of Dowry,
AIDWA, New Delhi, 2003 39 See Brinda Karat’s Introduction, AIDWA, op.cit.
38
The table confirms the expected pattern of the smallest proportions of marriages without any dowry among the upper castes, and the maximum among the Scheduled Tribes, when all marriages, regardless of the age of the female partners are taken together. The picture by age groups, also confirms the expectation of a generalized trend decline over time in proportions of marriages without dowry. The proportions of marriages without dowry across all castes dropped from 33 per cent of all the married women in the oldest age cohort (above 50) to between 28 and 29 per cent in the younger cohort of up to 30 years of age. In other words, the practice of dowry marriages has spread over roughly four decades from around 65 per cent of the marriages in the oldest age cohort to over 71 per cent in the youngest. The more differentiated picture of trends for each caste category is even more interesting. What is particularly striking is the steep decline in marriages without dowry, reflecting a steep increase in the practice of dowry among the Backward Castes (OBC), from around 55 per cent of the marriages for the oldest age cohort to around 79 per cent among the youngest. The increase in dowry marriages is also steep among Scheduled Tribes, where the indications are that dowry marriages rose from around 52 per cent of the older marriages to 69 per cent of the marriages of the youngest. Among Scheduled Castes, where marriages without dowry appear to have been the majority practice even a few decades back, the proportion of such marriages rapidly declined at the same pace as among the OBCs till about the beginning of the last decade. However, there is a suggestion that the process of continuous reduction in proportions of marriages without dowry may be reversing. Where marriages without dowry show a steep decline from 51 per cent of the marriages in the above 50 age group to less than 31 per cent in the 20-30 age cohort, in the youngest age group of 20 and below, their proportion then increased by almost 7 per cent. The table shows a similar pattern among the upper castes, where however, the domination of dowry marriages among the oldest age cohort (at 65%) was clearly the most pronounced (relative to all other caste categories) and spread further till about a decade ago. But since then, like in the case of Scheduled Castes, there are indications of some barrier to further expansion of dowry marriages even among upper castes. Caution has of course, to be exercised in reading too much into the trends from the above table, particularly in relation to the specifics of each caste category. The sample, although drawn from across the country, is after all too small for credible generalized analysis. Further, although legally defined caste categories are most commonly used and have been used here too as tools for explicating socio-economic stratification, discrimination and related indicators, specificities and internal differences (including of caste, class and gendered social practices) do exist within and even between the multiplicity of castes that are included in each category. Given the biases emplaced in the selection of households for a gender and labour migration oriented survey, as may be seen, the sample is tilted towards some particular caste categories and not in line with their proportions in the general
39
population.40 Nevertheless, the table does open up some lines for more detailed enquiry. Curiously, there is some evidence that mounting dowry also entails mounting marriage expenses that even extend to expenditures incurred by bridegrooms. In investigating the relatively new phenomenon of the cross regional marriages of predominantly Muslim women taking place between Kerala and Mysore (popularly known in Kerala as Mysore marriages), we found that while escalating dowry in Kerala had compelled the search for grooms from Mysore who were ready to accept less dowry, at the Mysore end grooms were prepared to accept less dowry from the Kerala brides (when compared to the dowry brought by brides from their own region/community) because it entailed less expenditure on the marriage and could be quickly undertaken. It is of course well known that the rule of village exogamy was neither rigid nor universal in southern states like Kerala, and these Mysore marriages may thus be expanding migration for marriage. Our case studies of such marriages indicated that while the Kerala brides were predominantly from agricultural labour (‘coolie’) or small farmer households, the Mysore grooms who were Kannada, Dakhini (Urdu) or Tamil speaking were most often from the urban laboring poor, some of whom then came to work near the natal homes of their brides.41
What is interesting however, is that similar processes and motivations were also found in cross regional marriages in the north. It has been pointed out that in the low sex ratio district of Badaun in western Uttar Pradesh, where brides were brought from distant and culturally different regions of Bengal and eastern Bihar (here including Hindus and Muslims), ‘the compulsions driving long distance/cross regional marriage migration at the source area included poverty, landlessness or marginal landholdings and the inability to meet the dowry demands of local men whether Hindu or Muslim.’ At the destination end, ‘the compulsions of the grooms also included landlessness or marginal landownership combined with one or other factors such as “flawed” reputation, previous marriage, lack of family elders, older age, etc.’ (Chaudhry and Mohan, 2011) 42
Compulsions of poverty and dowry were also found to be factors that had led to brides being sent from Bihar, Jharkhand and Bengal to the western Uttar Pradesh district of Baghpat for marriage. There were here however, additional reasoning operating at the destination end. Field work in Baoli, one of the biggest villages in this area, indicated that apart from the more general problem of a shortage of girls 40 As can be seen in the table, SCs and STs together constitute around 50 per cent of the sample
marriages, while their proportions in the general population was less than half that figure in 2001.
41 This point is based on discussions with some Mysore marriage returnees in Nilambur, Kerala and with groom families located in what is known as the bidi colony of Mysore.
42 S. Chaudhry & T. Devi Mohan, Of Marriage and Migration : Bengali and Bihari brides in a
UP Village, IJGS, Sage, 18(3) pp. 311-340
40
because of a declining sex ratio, young male brick kiln (bhatta) workers were facing particular difficulty in finding brides. Some clearly reported reluctance on the part of local families to marry their daughters into a lifetime of the hard manual labour and migratory conditions and related disruption of settled family life - all features of bhatta labour. Green brick makers, function almost universally across the country as family labour units with the core team usually comprising of a husband and wife (Jodi). As such, inability to find local brides propelled male bhatta workers to search for brides from afar to fulfill the requirement for the Jodi in the bhattas. Most visible in dalit communities who had lost out on their traditional artisanal livelihoods and become migratory bhatta workers, similar cross region marriages were observed among Muslims in the same line of work. While for this particular line, the value of women’s labour, albeit in degraded conditions, is operating as a factor in extension of the search for brides beyond traditional boundaries, the more generalized phenomenon of devaluation of women’s work as reflected in the declining female work participation rates in rural India, are obviously eroding such traditional boundaries of marriage arrangements in sending areas.
There is thus on the one hand macro-data on increasing marriage migration by women and falling female workforce participation rates. On the other hand there is primary survey data indicating expansion of village exogamy, sundry field observations in several parts of the country and case studies of cross regional marriage migration that provide evidence that dowry and the changing value of women’s work are factors operating in extending the boundaries of traditional marriage arrangements. Taken together they indicate complex and often seemingly contradictory criss-crossing of inter-linkages between individual motivations, cultural reflections of changes in the significance of women’s work in the agrarian economy, expansion of dowry and marriage expenses, and marriage migration. It is notable that with all the cultural specificities and diversity in the sets of individual motivations and perceptions, the indications are that they all converge towards a more generalized tendency of expanding marriage migration/village exogamy/extension of traditional boundaries of marriage. In our view, developments in the sphere of women’s work – paid and unpaid - and its valuation is a key link in the process of evolution of broader sets of social practices, including expanding dowry and its pressures on marriage arrangements. Any meaningful explanation of enhanced migration for marriage, would therefore require looking beyond locally specific cultural factors to the more general processes whereby diverse levels of pre-capitalist economic and social relations are being brought through the expansion of market and commerce into an increasingly homogenized, if disturbed system of social relations.
41
Part II
Gender and Labour Migration The continuous erosion of the value of women’s work in the natural economy and the expansion of commercially oriented work and employment would imply that the opportunities for income from labour should increasingly become more important for women. In the face of devaluation of their traditional work encompassing paid and unpaid labour, diversification and expansion of the arena of paid or income earning employment is perhaps the only way forward for women, for which an examination of labour migration by women, acquires great salience. It is from such a perspective that the following sections investigate the gender dimensions of labour migration in contemporary India. We begin with an attempt to construct a picture of the number of labour migrants and their distribution across sectors/industries, from the most recent NSS survey on migration conducted in 2007-08.43 Before that, it bears mention that the employment survey that ran in tandem with the 2007-08 migration survey had revealed that between 2004-05 and 2007-08, some 13.3 million women had been eliminated from the paid+unpaid workforce, and around 1.8 million from the paid workforce. Even more were to be eliminated by 2009-10 (Mazumdar and Neetha, 2011). NSS 2007-08: A Macro View of Labour Migration in India A preliminary point that needs to be laid on the table is our emphasis on the paid/income earning segment of migrant workers as a running thread of all our analysis of NSS data for the purposes of understanding the links between migration and the labour market. We have elsewhere pointed out that the workforce data as given in the published reports of NSS can be somewhat misleading in terms of the extent of women’s paid or income earning employment, and argued for the need to maintain a distinction between paid and unpaid work, when assessing employment opportunities for women (Mazumdar and Neetha, 2011). Unit level data from NSS does provide for some useful sub-categories by employment/activity status [broad status categories are 1) self employed, 2) regular salaried workers, 3) casual labour] that allow for separation of unpaid helpers from other workers (at least from among the self employed) following which, it is possible to focus on paid/income earning workers alone by excluding unpaid helpers from the calculation of the employed. It is this procedure that has been followed by us for migrant workers, where from the NSS we have counted only paid/income earning workers in the category of labour migrants/migrant workers. It may be underlined that the emphasis on paid/income earning workers is for the purposes of understanding the features of labour mobility/markets and for eliciting the gender structure of the market for migrant labour and not as a negation of the importance of unpaid labour.
43 NSSO, Migration in India 2007-08, MOSPI, Govt. India, 2010.

42
Attempts to understand labour or work based migration by women based on the NSS data on migrants [defined as those who have change of usual place of residence (UPR)], have hitherto concentrated on the difference in work participation before and after migration. It has been shown that generally women have higher work participation rates after migration in comparison to before, albeit with some regional variation (Shanthi, 2006). Useful as such analysis is in showing that social reasons for migration including marriage may in effect also act as a transfer of female labour or the capacity to work, for example from natal to marital home/village/town, we believe that such a method has little utility for gauging the extent and features of labour mobility/migration for women. The reason for our skepticism is because of the large number of women recorded as migrants only because they have married into another village/area, and who, even if they are workers there, may be so only in their immobile and local capacity as wives and daughters in law of the village they have married into. As such the industrial distribution of all female migrants after migration appears as virtually the same as the overall industrial distribution of the female workforce in the country. From such a procedure, it is neither possible to understand the relative importance of the sectors/industries driving labour migration, nor is it possible to distinguish migrant workers from immobile local workers in the case of women. In order to overcome such problems, we believe that the nature of the NSS data offers us little option but to exclude female marriage migrants from the frame as a preliminary step towards identifying patterns of female labour migration. This is notwithstanding our own argument that marriage as a reason for migration may and indeed does camouflage some labour migration by women. But elimination of such camouflaged labour migration is a lesser error when compared with the immensely distorted and inflated picture of female labour mobility that would be the result of inclusion of all marriage migrants who are workers as labour migrants. From among the category of migrants by UPR, those who gave ‘employment’ as their reason for migration may of course, ab initio be identified as employment/labour migrants. However, to our minds, a better estimation of labour migration could be made if all usual status paid/income earning workers from among migrants by UPR, who may have given as an initial reason for migration ‘family movement’, ‘education’ and ‘other reasons’ were also counted as labour migrants, since the nature of their employment may be presumed to be premised on their having moved from some other area of origin. The second category of Short term migrants could also ipso facto be counted as labour migrants, since they are defined as those who did not change their UPR but undertook short-term movements and stayed away from village/town for a period of 1 month or more but less than 6 months for employment or in search of employment .44
44 Short term migrants were defined by the NSS as those who stayed away from village/town
for a period of one month or more but less than 6 months for employment. It is important that spells of 15 days and more were included in the calculation of duration. Short term migrants are explicitly labour migrants in contradistinction to the general data on migration
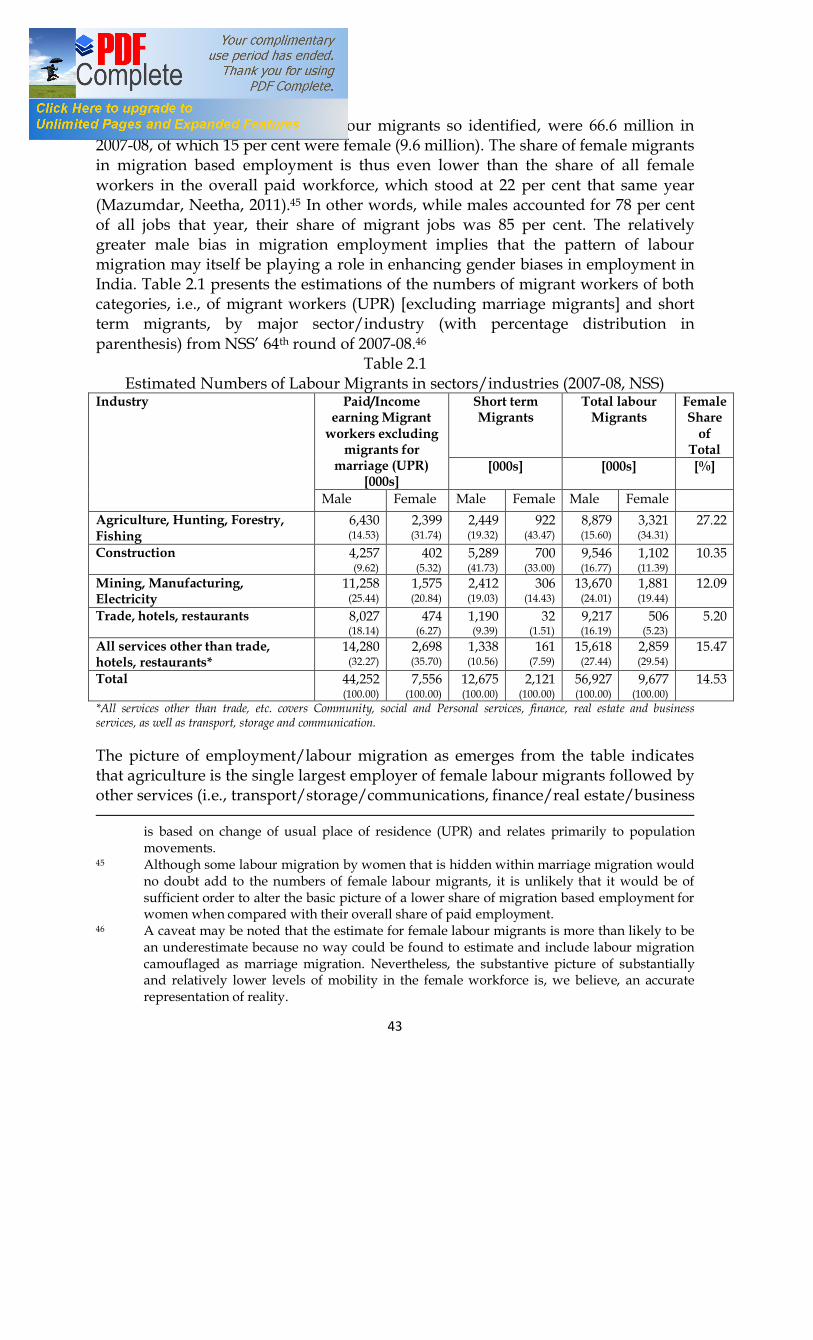
43
The estimated total number of labour migrants so identified, were 66.6 million in 2007-08, of which 15 per cent were female (9.6 million). The share of female migrants in migration based employment is thus even lower than the share of all female workers in the overall paid workforce, which stood at 22 per cent that same year (Mazumdar, Neetha, 2011).45 In other words, while males accounted for 78 per cent of all jobs that year, their share of migrant jobs was 85 per cent. The relatively greater male bias in migration employment implies that the pattern of labour migration may itself be playing a role in enhancing gender biases in employment in India. Table 2.1 presents the estimations of the numbers of migrant workers of both categories, i.e., of migrant workers (UPR) [excluding marriage migrants] and short term migrants, by major sector/industry (with percentage distribution in parenthesis) from NSS’ 64th round of 2007-08.46
Table 2.1 Estimated Numbers of Labour Migrants in sectors/industries (2007-08, NSS)
Industry Paid/Income earning Migrant
workers excluding migrants for
marriage (UPR) [000s]
Short term Migrants
Total labour Migrants
Female Share
of Total
[000s] [000s] [%]
Male Female Male Female Male Female Agriculture, Hunting, Forestry, Fishing
6,430 (14.53)
2,399 (31.74)
2,449 (19.32)
922 (43.47)
8,879 (15.60)
3,321 (34.31)
27.22
Construction 4,257 (9.62)
402 (5.32)
5,289 (41.73)
700 (33.00)
9,546 (16.77)
1,102 (11.39)
10.35
Mining, Manufacturing, Electricity
11,258 (25.44)
1,575 (20.84)
2,412 (19.03)
306 (14.43)
13,670 (24.01)
1,881 (19.44)
12.09
Trade, hotels, restaurants 8,027 (18.14)
474 (6.27)
1,190 (9.39)
32 (1.51)
9,217 (16.19)
506 (5.23)
5.20
All services other than trade, hotels, restaurants*
14,280 (32.27)
2,698 (35.70)
1,338 (10.56)
161 (7.59)
15,618 (27.44)
2,859 (29.54)
15.47
Total 44,252 (100.00)
7,556 (100.00)
12,675 (100.00)
2,121 (100.00)
56,927 (100.00)
9,677 (100.00)
14.53
*All services other than trade, etc. covers Community, social and Personal services, finance, real estate and business services, as well as transport, storage and communication. The picture of employment/labour migration as emerges from the table indicates that agriculture is the single largest employer of female labour migrants followed by other services (i.e., transport/storage/communications, finance/real estate/business
is based on change of usual place of residence (UPR) and relates primarily to population movements.
45 Although some labour migration by women that is hidden within marriage migration would no doubt add to the numbers of female labour migrants, it is unlikely that it would be of sufficient order to alter the basic picture of a lower share of migration based employment for women when compared with their overall share of paid employment.
46 A caveat may be noted that the estimate for female labour migrants is more than likely to be an underestimate because no way could be found to estimate and include labour migration camouflaged as marriage migration. Nevertheless, the substantive picture of substantially and relatively lower levels of mobility in the female workforce is, we believe, an accurate representation of reality.
44
services, and community/social/personal services).47 For males, other services followed by mining/manufacturing/electricity, etc. (i.e., basic components of industry minus construction) appear as the prime drivers of labour/employment migration. It may be noted that in the table, trade, hotels and restaurants have been given separately while all other services have been clubbed together.48 If trade and other services are combined and construction added to mining/manufacturing/electricity, a broad idea of the distribution of migrant workers across agriculture, industry and services may be had. Among male migrants, the distribution would roughly be as follows: Agriculture – 15.6%, Industry – 40.8% and Services – 43.6%. In contrast, among female migrant workers the distribution would be: Agriculture – 34.3%, Industry – 30.8% and Services – 34.8%. At an overall level, it does appear that services have emerged as the major driver of migration in contemporary times, and it is interesting that the sector/industry distribution of labour migrants is quite different from the composition of the overall paid/income earning male and female workforce.49 The principal difference between the industrial distribution of migrant workers in comparison to all workers, of course lies in the relative share of agriculture. Agriculture, which accounted for a just 15.6 per cent of male labour migrants in 2007-08, otherwise constituted 46.6 per cent of the country’s income earning male workforce in the same year. In female labour migration, agriculture is of course much more prominent, but its 34.3 per cent share in female labour migration was almost half the 65 per cent share of agriculture in the country’s income earning female workforce in 2007-08. 50 As further evident from Table 2.2, it would appear that the agricultural workforce is overwhelmingly more local cultivator/agricultural labour oriented when compared with all non-agricultural industries. Only 7 per cent of its male workforce and even less (6%) of its paid/income earning female workforce were migrants. Nevertheless, in comparison to all other sectors/industries, the share of women remained the highest among migrants for agriculture at more than 27 per cent, which is more than double their share of around 12 per cent in migration based employment for all other sectors/industries when taken together. As such, in any approach to female labour migration in India, agricultural migration merits special attention. 47 In other services, community/social/personal services are the major employment for
women. 48 Trade is particularly important and requires some specific delineation because of the size of
the workforce and also because of the very large proportions of the self employed in primarily petty retail trade, which in turn numerically dominates the workforce profile of workers in trade, hotels, restaurants.
49 In 2007-08 among the overall paid workforce the distribution of male workers was as follows: Agriculture – 48%, Industry – 23%, Services – 30%. In the female workforce, it was: Agriculture – 65%, Industry – 17%, Services – 18%.
50 While in the male workforce, services had increased its share of general employment from 26 per cent in 1993-94 to 30 per cent in 2007-08, among the female workforce the increase was from 12 to 14 per cent. By 2009-10, among males the share of services actually declined marginally by around 0.4 per cent, while among females it continued increasing, although it was still low at 15 per cent of the total female workforce.
45
A striking feature is the relative insignificance of trade in female migration. Trade, hotels and restaurants accounted for a mere 5 per cent of female labour migration and a similar share in migrant worker based employment in trade. It appears that migration for trade related employment (mostly of a self employed nature) is most heavily weighted in favour of males. While trade, etc. accounted for 16 per cent of male migrants, more importantly, 95 per cent of all migrant workers in trade were male. Other services, accounting for around 30 per cent of female labour migrants and 27 per cent of male labour migrants, initially appears as more significant in driving female labour migration in comparison to male. However, the limited supply and perhaps demand for women migrants in this segment of the labour market becomes apparent when one realizes that 85 per cent of the jobs for migrant workers in other services had gone to men. A similar pattern of an even larger scale of male domination of migration based employment in manufacturing, etc. is evident from the fact that men commanded 88 per cent of migrant jobs in manufacturing. If one looks for comparison to the overall workforce (migrant+non-migrant), the male share is less at 73 per cent in other services and 78 per cent in manufacturing. It thus appears that the impact of diversification of female employment through migration is of a relatively more limited nature than is suggested by the remarkably even distribution of female migrant workers across the three broad sectors of agriculture, industry and services. In 2007-08, migration for construction too seemed to be overwhelmingly male, with women accounting for just 10 per cent of construction jobs for migrant workers. Since then, given an increase in the share of female employment in construction in the latest employment survey (2009-10), it is possible that the female share of migration for construction may also have increased a little after 2007-08. However, such increases are unlikely to change the overall picture of construction labour migrants being overwhelmingly male at an all India level.51 Nevertheless, it is significant that among female short term migrants, construction is second only to agriculture, while among female migrants by UPR, the numbers in construction are less than in any other sector. It would then appear that for women, migration for construction work does not offer opportunities for more durable employment or for effecting a more permanent movement out of agriculture. In looking at the role of migration from the demand side, Table 2.2 presents an interesting picture of which sectors/industries draw more upon migrants and where migration fits into the country’s paid/income earning labour and employment profile. In general, as would be expected, manufacturing/mining/quarrying and construction are the industries that display a higher share of migrants in their workforce, as predominantly evident from the proportions of migrants in their male workforce. However, for their female workers, manufacturing/mining/quarrying appears to rely much less on migrants, and it is the construction industry that relies 51 Construction is the one industry where there is very little unpaid labour. Standard workforce
figures for construction may thus be taken as roughly the same for the paid workforce.
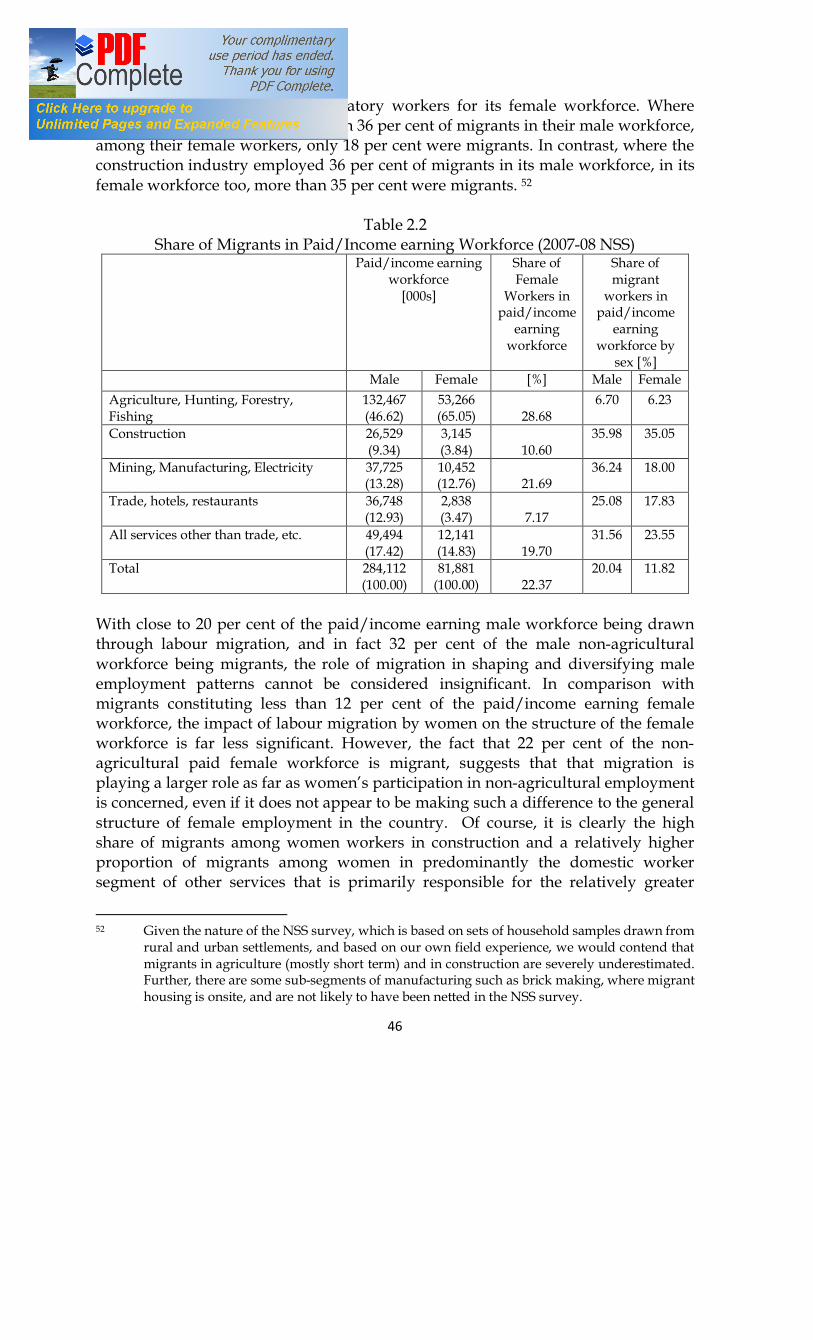
46
to a much greater extent on migratory workers for its female workforce. Where manufacturing employed more than 36 per cent of migrants in their male workforce, among their female workers, only 18 per cent were migrants. In contrast, where the construction industry employed 36 per cent of migrants in its male workforce, in its female workforce too, more than 35 per cent were migrants. 52
Table 2.2 Share of Migrants in Paid/Income earning Workforce (2007-08 NSS)
Paid/income earning workforce
[000s]
Share of Female
Workers in paid/income
earning workforce
Share of migrant
workers in paid/income
earning workforce by
sex [%] Male Female [%] Male Female Agriculture, Hunting, Forestry, Fishing
132,467 (46.62)
53,266 (65.05) 28.68
6.70 6.23
Construction 26,529 (9.34)
3,145 (3.84) 10.60
35.98 35.05
Mining, Manufacturing, Electricity 37,725 (13.28)
10,452 (12.76) 21.69
36.24 18.00
Trade, hotels, restaurants 36,748 (12.93)
2,838 (3.47) 7.17
25.08 17.83
All services other than trade, etc. 49,494 (17.42)
12,141 (14.83) 19.70
31.56 23.55
Total 284,112 (100.00)
81,881 (100.00) 22.37
20.04 11.82
With close to 20 per cent of the paid/income earning male workforce being drawn through labour migration, and in fact 32 per cent of the male non-agricultural workforce being migrants, the role of migration in shaping and diversifying male employment patterns cannot be considered insignificant. In comparison with migrants constituting less than 12 per cent of the paid/income earning female workforce, the impact of labour migration by women on the structure of the female workforce is far less significant. However, the fact that 22 per cent of the non-agricultural paid female workforce is migrant, suggests that that migration is playing a larger role as far as women’s participation in non-agricultural employment is concerned, even if it does not appear to be making such a difference to the general structure of female employment in the country. Of course, it is clearly the high share of migrants among women workers in construction and a relatively higher proportion of migrants among women in predominantly the domestic worker segment of other services that is primarily responsible for the relatively greater
52 Given the nature of the NSS survey, which is based on sets of household samples drawn from
rural and urban settlements, and based on our own field experience, we would contend that migrants in agriculture (mostly short term) and in construction are severely underestimated. Further, there are some sub-segments of manufacturing such as brick making, where migrant housing is onsite, and are not likely to have been netted in the NSS survey.

47
presence of migrants in the non-agricultural female workforce. It is doubtful that either or both together would ensure a durable move out of agriculture for many of the women currently working in these segments. Finally, apart from the sectoral composition of migrant labour, it may be noted that ‘short term migrants’ constituted some 21 per cent of male labour migration and 22 per cent of female labour migration in 2007-08. Further, some 10 per cent of UPR based female migrants and 7 per cent of male migrants reported that their migration was temporary. Acceleration in return migration also appears to have taken place between 1993 and 2007-08, with the proportions of return migrants increasing from 12.2 to 16.1 per cent in the case of male migrants and from 4.4 to 10.6 per cent in the case of female migrants. Although they may not all be labour migrants, nevertheless it suggests that term migration is increasing relative to permanent. Taken together, the NSS data seems to suggest that the movement of roughly one third of all labour migration is definitively temporary. Although the 2007-08 migration survey does give us a rough outline of labour migration in India, among the several important features that the NSS fails to capture, probably the most significant is its inability to cognize the different types of labour migration, and particularly the circular types of labour migration. Despite attempts to make some distinction between temporary and permanent migration in the UPR data and the important step taken through a separate focus on short term migration, a failure to capture the full extent of temporary migration and its features remains a persistent problem with the macro-data. Our own assessment, supported by the findings of the CWDS meso-level survey presented below, is that when a more worked out typology of migration is applied, the actual proportions of temporary labour migrants among both men and women appear far greater than the macro-data suggests.53 With the gaps in the macro-data regarding types of labour migration in mind, the CWDS survey had applied a typology of migration that gave particular space to circularity and duration. These are discussed along with some other aspects of the survey’s findings in the following sections. The Predominance of the Temporary in Labour Migration: Types of Migration The household questionnaire generated data on types of migration undertaken for 16,156 labour migrants, of which 7,398 were female and 8,758 were male when the two categories of sites, i.e., sector based and village based were taken together. Their distribution by type of migration, are presented in Fig. 2.1 (a) 3(a) and 2.1(b) for females and males respectively. Although we have presented the distribution in percentage terms, it should be clear that no claim is being made that any of these percentages can be applied to the general population of labour migrants in the 53 The CWDS research project on Gender and Migration was made possible because of support
by the IDRC, which is gratefully acknowledged.
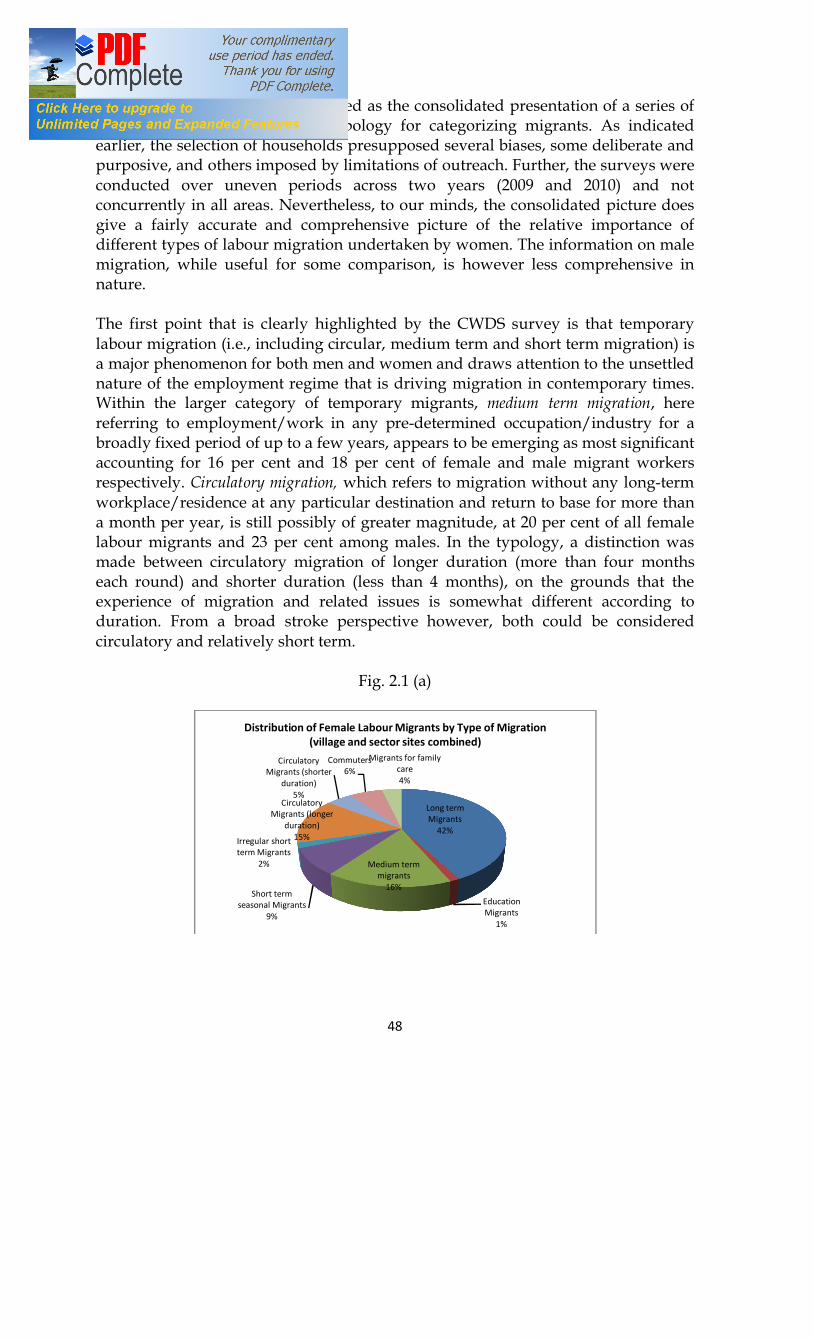
48
country. Rather, they may be viewed as the consolidated presentation of a series of micro-surveys using the same typology for categorizing migrants. As indicated earlier, the selection of households presupposed several biases, some deliberate and purposive, and others imposed by limitations of outreach. Further, the surveys were conducted over uneven periods across two years (2009 and 2010) and not concurrently in all areas. Nevertheless, to our minds, the consolidated picture does give a fairly accurate and comprehensive picture of the relative importance of different types of labour migration undertaken by women. The information on male migration, while useful for some comparison, is however less comprehensive in nature. The first point that is clearly highlighted by the CWDS survey is that temporary labour migration (i.e., including circular, medium term and short term migration) is a major phenomenon for both men and women and draws attention to the unsettled nature of the employment regime that is driving migration in contemporary times. Within the larger category of temporary migrants, medium term migration, here referring to employment/work in any pre-determined occupation/industry for a broadly fixed period of up to a few years, appears to be emerging as most significant accounting for 16 per cent and 18 per cent of female and male migrant workers respectively. Circulatory migration, which refers to migration without any long-term workplace/residence at any particular destination and return to base for more than a month per year, is still possibly of greater magnitude, at 20 per cent of all female labour migrants and 23 per cent among males. In the typology, a distinction was made between circulatory migration of longer duration (more than four months each round) and shorter duration (less than 4 months), on the grounds that the experience of migration and related issues is somewhat different according to duration. From a broad stroke perspective however, both could be considered circulatory and relatively short term.
Fig. 2.1 (a)
Long term Migrants
42%
Education Migrants
1%
Medium term migrants
16%Short term
seasonal Migrants9%
Irregular short term Migrants
2%
Circulatory Migrants (longer
duration)15%
Circulatory Migrants (shorter
duration)5%
Commuters6%
Migrants for family care4%
Distribution of Female Labour Migrants by Type of Migration (village and sector sites combined)
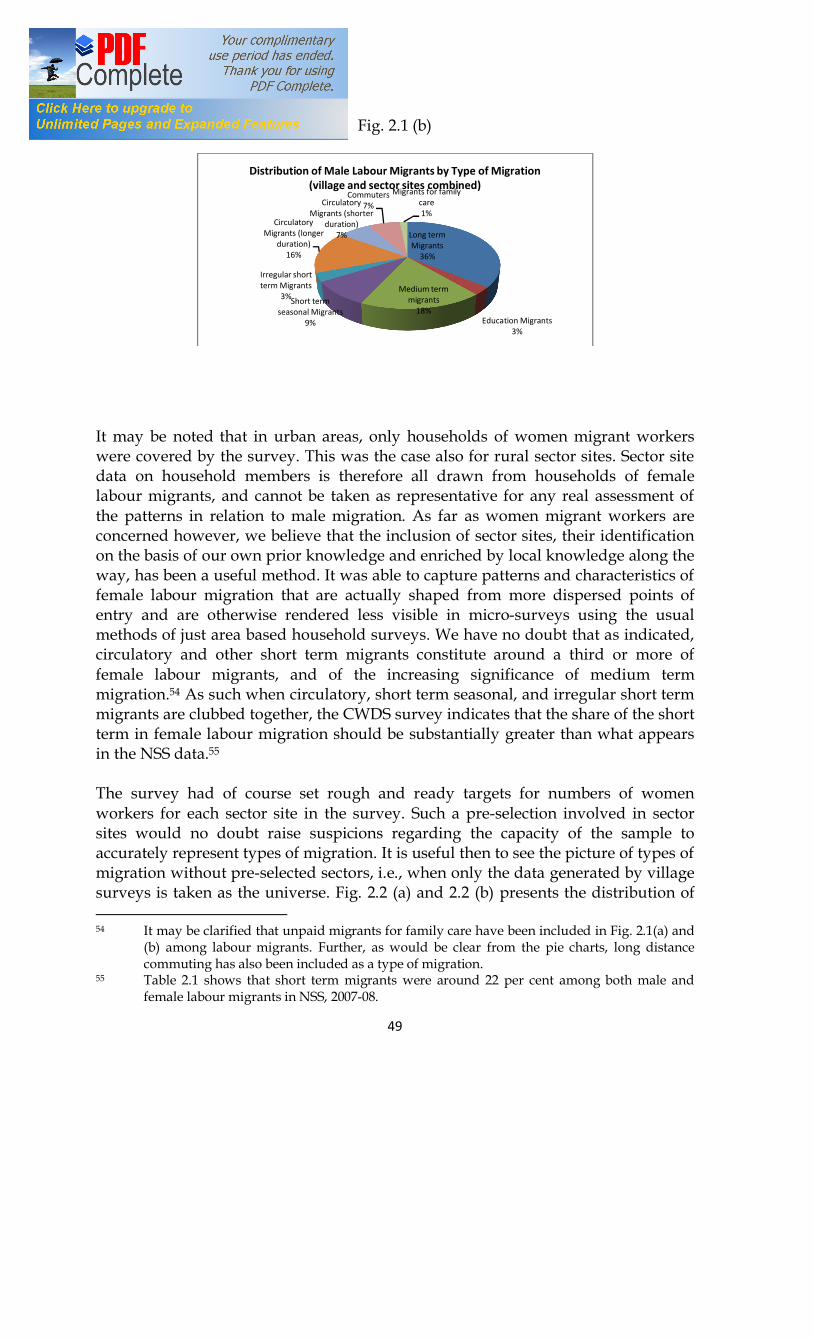
49
Fig. 2.1 (b)
It may be noted that in urban areas, only households of women migrant workers were covered by the survey. This was the case also for rural sector sites. Sector site data on household members is therefore all drawn from households of female labour migrants, and cannot be taken as representative for any real assessment of the patterns in relation to male migration. As far as women migrant workers are concerned however, we believe that the inclusion of sector sites, their identification on the basis of our own prior knowledge and enriched by local knowledge along the way, has been a useful method. It was able to capture patterns and characteristics of female labour migration that are actually shaped from more dispersed points of entry and are otherwise rendered less visible in micro-surveys using the usual methods of just area based household surveys. We have no doubt that as indicated, circulatory and other short term migrants constitute around a third or more of female labour migrants, and of the increasing significance of medium term migration.54 As such when circulatory, short term seasonal, and irregular short term migrants are clubbed together, the CWDS survey indicates that the share of the short term in female labour migration should be substantially greater than what appears in the NSS data.55 The survey had of course set rough and ready targets for numbers of women workers for each sector site in the survey. Such a pre-selection involved in sector sites would no doubt raise suspicions regarding the capacity of the sample to accurately represent types of migration. It is useful then to see the picture of types of migration without pre-selected sectors, i.e., when only the data generated by village surveys is taken as the universe. Fig. 2.2 (a) and 2.2 (b) presents the distribution of 54 It may be clarified that unpaid migrants for family care have been included in Fig. 2.1(a) and
(b) among labour migrants. Further, as would be clear from the pie charts, long distance commuting has also been included as a type of migration.
55 Table 2.1 shows that short term migrants were around 22 per cent among both male and female labour migrants in NSS, 2007-08.
Long term Migrants
36%
Education Migrants3%
Medium term migrants
18%Short term
seasonal Migrants9%
Irregular short term Migrants
3%
Circulatory Migrants (longer
duration)16%
Circulatory Migrants (shorter
duration)7%
Commuters7%
Migrants for family care1%
Distribution of Male Labour Migrants by Type of Migration (village and sector sites combined)
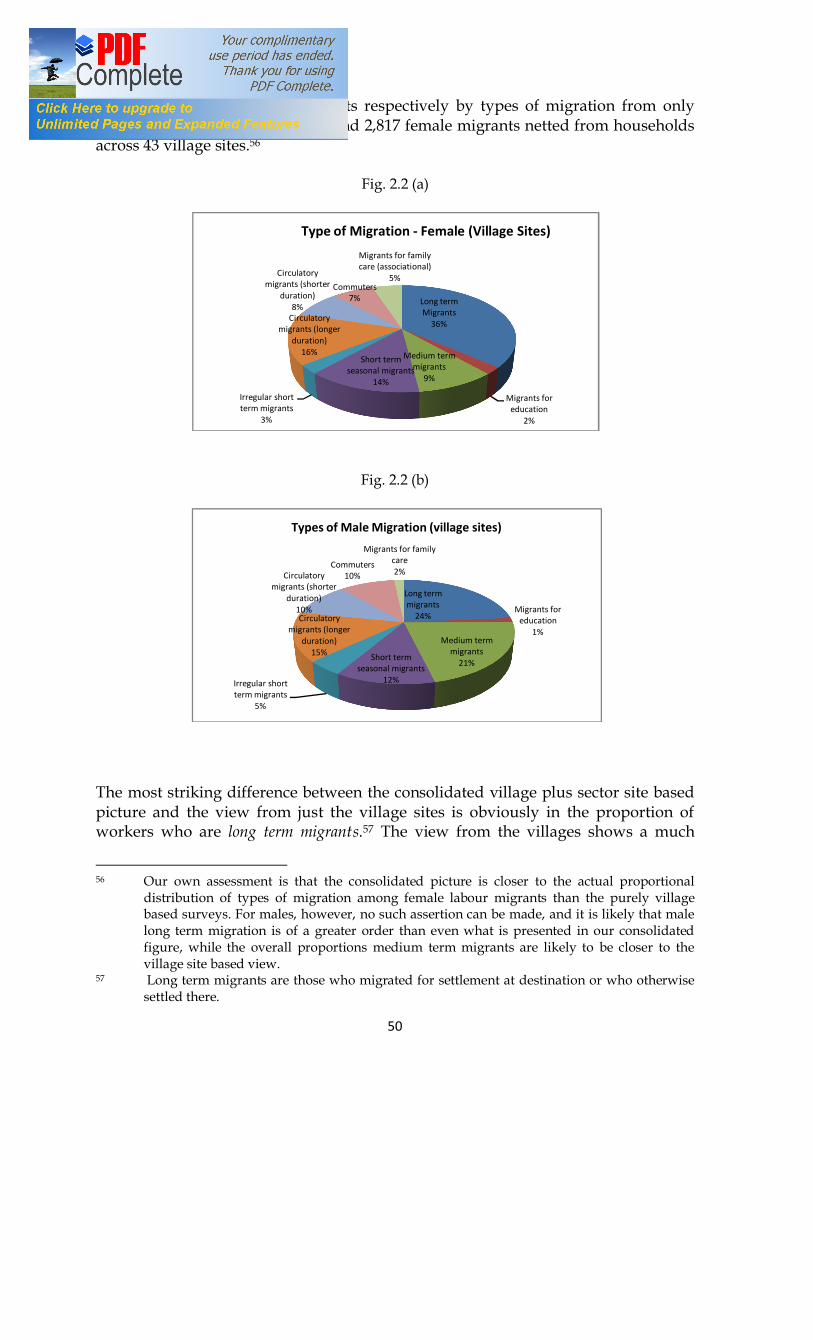
50
female migrants and male migrants respectively by types of migration from only village sites. It covers 4,471 male and 2,817 female migrants netted from households across 43 village sites.56
Fig. 2.2 (a)
Fig. 2.2 (b)
The most striking difference between the consolidated village plus sector site based picture and the view from just the village sites is obviously in the proportion of workers who are long term migrants.57 The view from the villages shows a much
56 Our own assessment is that the consolidated picture is closer to the actual proportional
distribution of types of migration among female labour migrants than the purely village based surveys. For males, however, no such assertion can be made, and it is likely that male long term migration is of a greater order than even what is presented in our consolidated figure, while the overall proportions medium term migrants are likely to be closer to the village site based view.
57 Long term migrants are those who migrated for settlement at destination or who otherwise settled there.
Long term Migrants
36%
Migrants for education
2%
Medium term migrants
9%
Short term seasonal migrants
14%
Irregular short term migrants
3%
Circulatory migrants (longer
duration)16%
Circulatory migrants (shorter
duration)8%
Commuters7%
Migrants for family care (associational)
5%
Type of Migration - Female (Village Sites)
Long term migrants
24%Migrants for
education1%
Medium term migrants
21%Short term
seasonal migrants12%Irregular short
term migrants5%
Circulatory migrants (longer
duration)15%
Circulatory migrants (shorter
duration)10%
Commuters10%
Migrants for family care 2%
Types of Male Migration (village sites)

51
lower proportion of long term migrants and a higher proportion of temporary migrants among both men and women. This perhaps indicates that a considerable proportion of urban long term migrant having shifted their families and may have only residual connections with their village. On the other hand, it is noticeable that medium term migration looks to be more prominent among male migrants when viewed from the village end and less prominent when some destination sites of female labour migrants get included.58 In contrast, among female migrant workers, medium term migration appears more when sector destination sites are included and significantly less when viewed from the village end. This would suggest that the points of origin of medium term female migrant workers are more thinly dispersed across rural and urban areas, and/or may be drawn/recruited from particular catchment pockets, rather than the more generalised kind of medium term movement from village India that appears to be the case among male migrants. Expectedly, the proportions of short term seasonal migrants are more significant for both women and men when the view is from the village sites alone (14% and 12% respectively) and drops somewhat when the urban sector sites are included in the universe (9% for both), since most of such migration is for agriculture. Short term seasonal migration here refers to those who migrate for work of a seasonal nature for a period ranging from a few days to around 3 months, and is distinguished from circulatory in that migrants do not keep circulating back and forth, but spend most of the year at their base area.
As may be seen, the proportions of unpaid migrants for family care59 do not appear as very significant at close to 4 per cent of female migrants and close to 2 per cent among males in the consolidated figure. The proportion increases slightly for women when only village sites are taken. But it is notable that even some men have migrated for family care. A part of this may reflect termination of migration and return to home village because of family responsibilities in relation to aging parents and in relation to land.60 Commuters, referring here to those who commute across long distances, accounted for some 6% of the women migrants when sector and village site households were combined, increasing by only 1% from the universe of only village sites. 61 Among 58 ‘Medium term migration’ refers to migration for employment/work in any pre-determined occupation/industry for a broadly fixed period of up to a few years 59 ‘Migrants for family care’ refers to those who migrant under the expectation that they will
perform various kinds of unpaid care work for those who have migrated for employment, and are separated from marriage migrant within unspecified purposes.
60 Close to 8 per cent of all male migrants were returnees in comparison to close to 5 per cent of
female migrants (percentage here of all migrants, i.e., including for marriage and education for both sexes)
61 For commuters to be considered migrants, the distances involved at least 50 kms, normally travel to another district - from villages to towns/cities, from cities to rural areas, from one
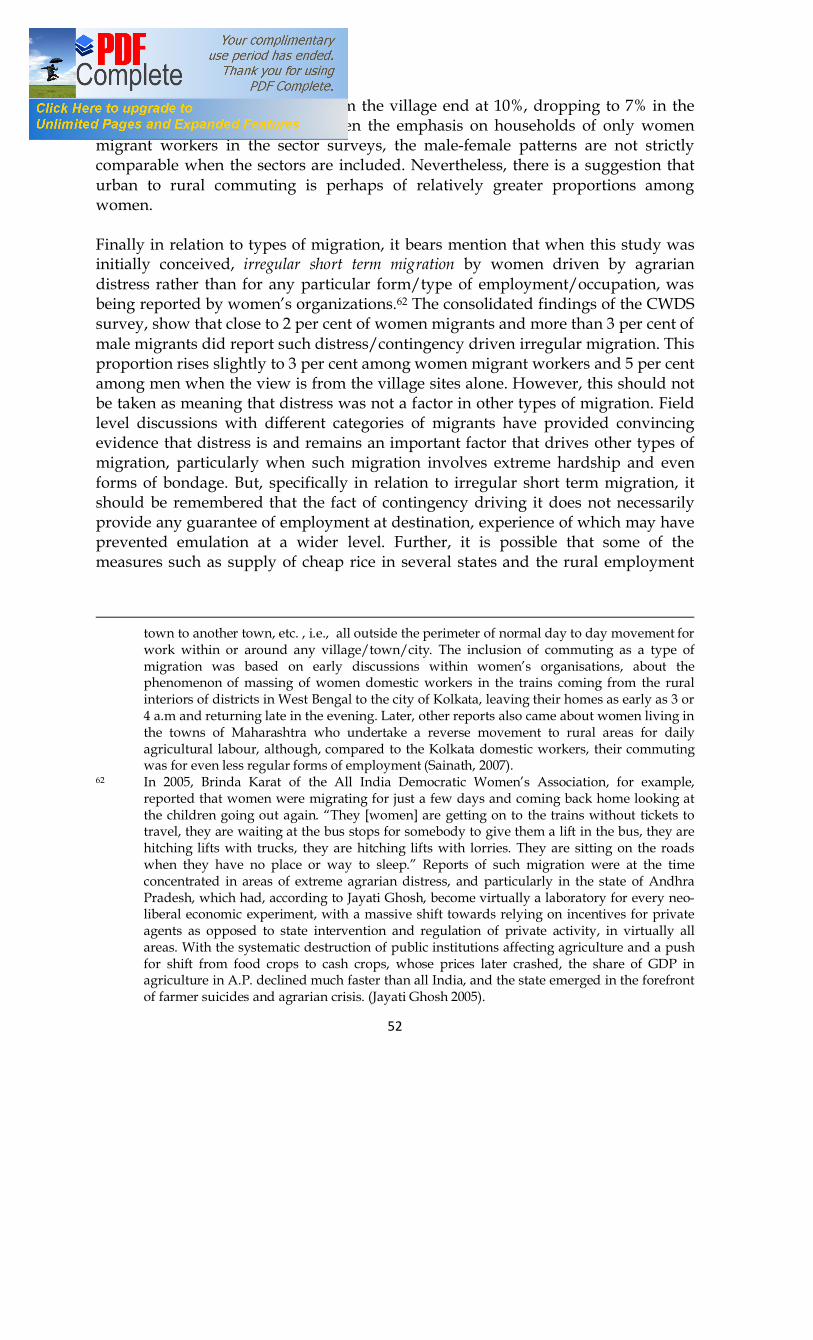
52
men, it was significantly more from the village end at 10%, dropping to 7% in the combined universe. Of course given the emphasis on households of only women migrant workers in the sector surveys, the male-female patterns are not strictly comparable when the sectors are included. Nevertheless, there is a suggestion that urban to rural commuting is perhaps of relatively greater proportions among women. Finally in relation to types of migration, it bears mention that when this study was initially conceived, irregular short term migration by women driven by agrarian distress rather than for any particular form/type of employment/occupation, was being reported by women’s organizations.62 The consolidated findings of the CWDS survey, show that close to 2 per cent of women migrants and more than 3 per cent of male migrants did report such distress/contingency driven irregular migration. This proportion rises slightly to 3 per cent among women migrant workers and 5 per cent among men when the view is from the village sites alone. However, this should not be taken as meaning that distress was not a factor in other types of migration. Field level discussions with different categories of migrants have provided convincing evidence that distress is and remains an important factor that drives other types of migration, particularly when such migration involves extreme hardship and even forms of bondage. But, specifically in relation to irregular short term migration, it should be remembered that the fact of contingency driving it does not necessarily provide any guarantee of employment at destination, experience of which may have prevented emulation at a wider level. Further, it is possible that some of the measures such as supply of cheap rice in several states and the rural employment
town to another town, etc. , i.e., all outside the perimeter of normal day to day movement for work within or around any village/town/city. The inclusion of commuting as a type of migration was based on early discussions within women’s organisations, about the phenomenon of massing of women domestic workers in the trains coming from the rural interiors of districts in West Bengal to the city of Kolkata, leaving their homes as early as 3 or 4 a.m and returning late in the evening. Later, other reports also came about women living in the towns of Maharashtra who undertake a reverse movement to rural areas for daily agricultural labour, although, compared to the Kolkata domestic workers, their commuting was for even less regular forms of employment (Sainath, 2007).
62 In 2005, Brinda Karat of the All India Democratic Women’s Association, for example, reported that women were migrating for just a few days and coming back home looking at the children going out again. “They [women] are getting on to the trains without tickets to travel, they are waiting at the bus stops for somebody to give them a lift in the bus, they are hitching lifts with trucks, they are hitching lifts with lorries. They are sitting on the roads when they have no place or way to sleep.” Reports of such migration were at the time concentrated in areas of extreme agrarian distress, and particularly in the state of Andhra Pradesh, which had, according to Jayati Ghosh, become virtually a laboratory for every neo-liberal economic experiment, with a massive shift towards relying on incentives for private agents as opposed to state intervention and regulation of private activity, in virtually all areas. With the systematic destruction of public institutions affecting agriculture and a push for shift from food crops to cash crops, whose prices later crashed, the share of GDP in agriculture in A.P. declined much faster than all India, and the state emerged in the forefront of farmer suicides and agrarian crisis. (Jayati Ghosh 2005).
53
guarantee law, however inadequately and tardily implemented, may have held back further expansion of such a highly vulnerable type of migration. Social Trajectories Interesting insights into the social implications of different types of migration is revealed when the distribution of the relative shares of the various types of migration among female migrants is seen by social group/caste categories. Table 2.3 below presents such a distribution. It is noticeable that for upper caste women the share of long term and medium migration is predominant with 75 per cent of them concentrated in long and medium term migration. In contrast, short term and circulatory migration accounted for 59 percent of migrant women workers from scheduled tribes and 41 percent of scheduled caste women migrants. The concentration of scheduled castes and tribes in this mass of general labour that circulates at the lower end of the productive economy, in which casual labour in agriculture, construction and brick making figure prominently, draws attention to the limitations of the migration enterprise as conditioned by the prevailing economic system, in effecting transformation of degrading feudal hierarchies. At the same time, it is noticeable that among upper caste women irregular short term migration is more significant than for all other caste categories. This is possibly because responses to pauperization may be differentiated along the status grades established by the caste system, with sections of upper caste women being driven to migrate for work only in dire emergencies.
Table 2.3
Caste wise Distribution of Migrant Women Workers by Type of Migration (%)
Type of Migrant General OBC MBC SC ST Long term migrant 44.51 41.56 21.51 25.98 20.81 Medium term migrant 30.02 22.98 30.11 17.36 10.48 Short term migrant 3.93 11.91 10.75 14.54 25.16 Irregular short term migrant 6.42 1.13 1.08 1.08 1.45 Circulatory migrant of longer duration
2.90 9.93 5.38 19.52 22.10
Circulatory migrant of shorter duration
4.55 6.95 4.30 6.06 10.00
Daily/weekly commuters 4.97 3.69 25.81 14.67 8.71 Migrant for family care 2.69 1.84 1.08 0.81 1.29 All 100 100 100 100 100 Short term and Circulatory Combined 17.81 29.93 21.51 41.18 58.71
Types of migration are very closely correlated with sectors and occupations. The diversified service occupations, for example, are more linked with long term and medium term migration. Hard manual labour based occupations, generally attached
54
to degraded conditions of work, are on the other hand, more closely correlated with short term and circular migration. When examining the more detailed data on individual migrant workers, we found that 66 percent of upper caste female migrant workers were in the fairly diversified service sectors such as professional technical and related workers, call centre, sale workers, nursing and other white collared services. As we went further down the caste hierarchy we found progressive concentrations in bhatta (brick kilns), seasonal agriculture and paid domestic work. Migrant women workers from other backward castes/classes (OBC) were also relatively more concentrated in paid domestic and agricultural seasonal work although 36 per cent of them were distributed across a wide ranging white collared services. Scheduled Caste (SC) women appeared to be more concentrated in bhatta labour, while Scheduled Tribe (ST) migrant women were more concentrated in construction. More than 22 per cent of SC women migrants were in brick making while 28 per cent ST women migrants were construction workers. The corollary of such concentrations of SC and ST women in hard labour based manual occupations of a casual nature was their low proportions in white collar services. White collar services accounted for 19 percent of SC and 18 percent of ST women migrants. In contrast to these extremes separating workers across caste categories, paid domestic work occupied a significant place in the occupational profiles of all caste categories while textile based manufacturing was significant in all categories other than among ST migrant women workers. As such, the indications are that concentration in migrant manual labour in agriculture, construction and brick-making at one end, and more diversified and relatively more settled forms of employment for migrants at the other end, are more determined by initial location in caste hierarchies. On the other hand, gender that is not so differentiated along caste lines is the primary axis that determines migration for paid domestic work. The migrant female workforce in production work in modern textiles, also appeared to have less of a caste bias, although our data indicate that ST women had almost no entry into such work. The individual migrant worker questionnaire covered 5007 migrant workers of which 3,073 were women and 1,934 were men. Of the 3,073 women migrants, 1,594 were surveyed in rural areas and 1,479 in urban, while the men were all covered in rural areas. Table 2.4 presents the migration streams from the details provided by these workers. Since for men, the individual migrant survey was only village site based, their direction appears as only from that source. As may be seen the majority of male migrants from village India (62%) are taking an urban direction. A similar pattern may be observed of over 50 per cent of female labour migration being in the rural to urban stream. All told urban destinations accounted for close to 73 per cent of the female labour migrants surveyed. On the face of it, such a picture of a predominantly urbanwards direction to labour migration would appear to be in conformity with general development theory expectations of migration streams. It is only when we look at the occupations of migrant workers that the content of development expectations of diversification of

55
employment come under question as far as women are concerned, including in the urbanwards migration stream.
Table 2.4
Percentage Distribution of Migration Streams of Individual Migrant Workers
Percentage Distribution of Migration Streams of Individual Migrant Workers Male Female Rural to rural 37.66 36.92 Rural to urban 62.37 50.44 Urban to urban 12.13 Urban to rural 0.47 100 100
Diversification or Concentration? Changes in Occupations Through Migration Fig. 2.3 presents a comparison between the occupational distribution of male and female migrant workers emphasizing the sectors/occupations in which women workers are concentrated. In explicating sector/occupations, we have included some sub-categories that are not generally made in industrial or occupational classifications in order to look more closely at the occupations/industries with relatively greater concentrations of women migrants. Most of the sector/occupations given in the figure are of course self explanatory, but it perhaps requires clarification that the last category of ‘others’ includes a wide range of occupations, mainly in services (including in education, various professions, transport, etc.). As may be seen, four occupations/sectors, namely agriculture (17.5%), paid domestic work (15.9%), brick making (11.8%), and construction (14.3%) together account for around 60 per cent of the surveyed migrant women workers. For male migrants, who were all drawn from the village site sample, three of these sector/occupations, i.e., agriculture (17.4%), bhattas (8.9%) and construction (22.2%) are also prominent. Manufacturing, dominated by Textiles and products and including other production workers was less prominent accounting for 8 per cent for both females and males. Of course, if brick making is included in manufacturing, as is the case in the NIC, the share of manufacturing would rise to 20 per cent among women migrants and to 16 per cent among males. To our way of thinking, however, the actual labour process in brick making in India, although no longer artisanal in nature, should be clearly distinguished from other modern industrial manufacturing and the employment of family labour.63
63 Brick manufacture involves only manual operations with mud and earth in green brick
making and again manual firing of kilns, etc.,
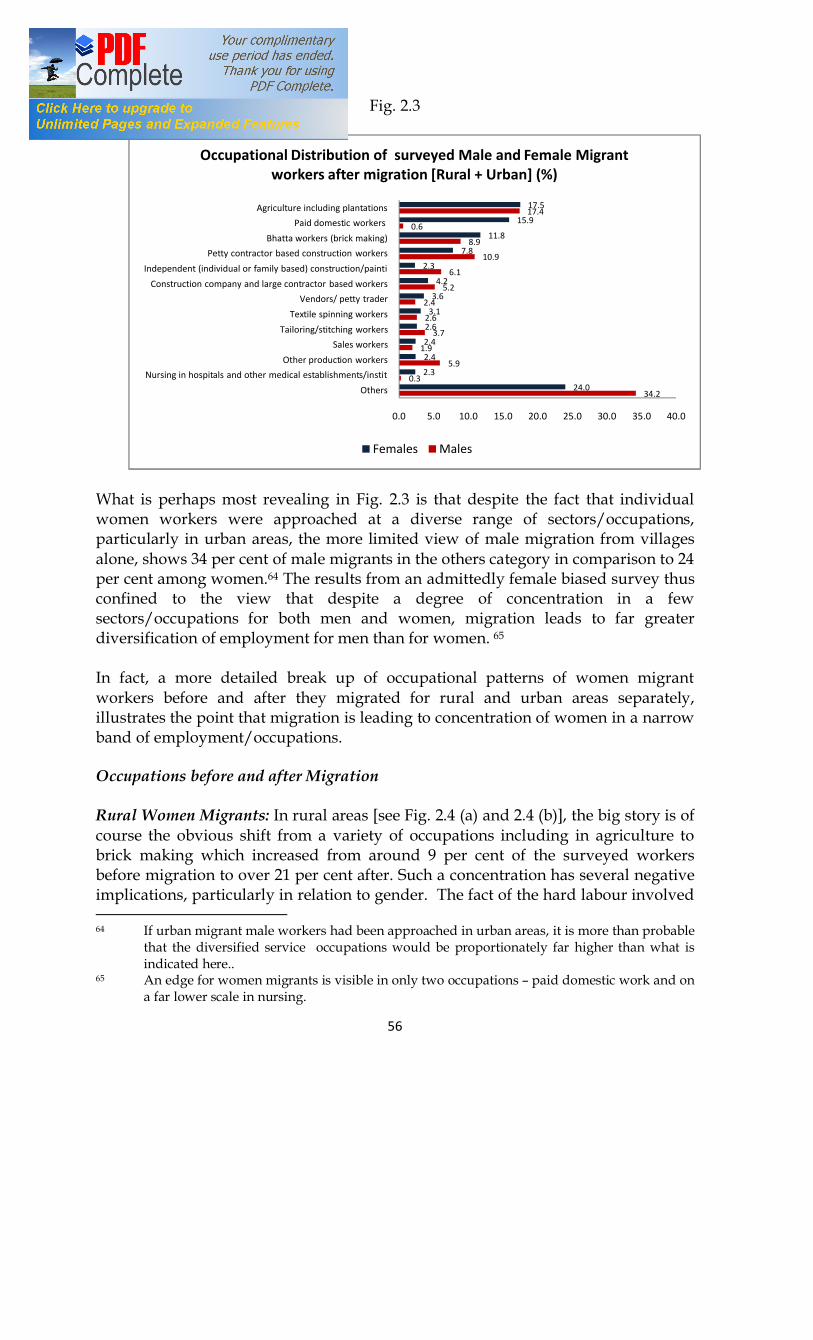
56
Fig. 2.3
What is perhaps most revealing in Fig. 2.3 is that despite the fact that individual women workers were approached at a diverse range of sectors/occupations, particularly in urban areas, the more limited view of male migration from villages alone, shows 34 per cent of male migrants in the others category in comparison to 24 per cent among women.64 The results from an admittedly female biased survey thus confined to the view that despite a degree of concentration in a few sectors/occupations for both men and women, migration leads to far greater diversification of employment for men than for women. 65 In fact, a more detailed break up of occupational patterns of women migrant workers before and after they migrated for rural and urban areas separately, illustrates the point that migration is leading to concentration of women in a narrow band of employment/occupations. Occupations before and after Migration Rural Women Migrants: In rural areas [see Fig. 2.4 (a) and 2.4 (b)], the big story is of course the obvious shift from a variety of occupations including in agriculture to brick making which increased from around 9 per cent of the surveyed workers before migration to over 21 per cent after. Such a concentration has several negative implications, particularly in relation to gender. The fact of the hard labour involved 64 If urban migrant male workers had been approached in urban areas, it is more than probable
that the diversified service occupations would be proportionately far higher than what is indicated here..
65 An edge for women migrants is visible in only two occupations – paid domestic work and on a far lower scale in nursing.
34.2
0.3
5.9
1.9
3.7
2.6
2.4
5.2
6.1
10.9
8.9
0.6
17.4
24.0
2.3
2.4
2.4
2.6
3.1
3.6
4.2
2.3
7.8
11.8
15.9
17.5
0.0 5.0 10.0 15.0 20.0 25.0 30.0 35.0 40.0
Others
Nursing in hospitals and other medical establishments/instit
Other production workers
Sales workers
Tailoring/stitching workers
Textile spinning workers
Vendors/ petty trader
Construction company and large contractor based workers
Independent (individual or family based) construction/painti
Petty contractor based construction workers
Bhatta workers (brick making)
Paid domestic workers
Agriculture including plantations
Occupational Distribution of surveyed Male and Female Migrant workers after migration [Rural + Urban] (%)
Females Males
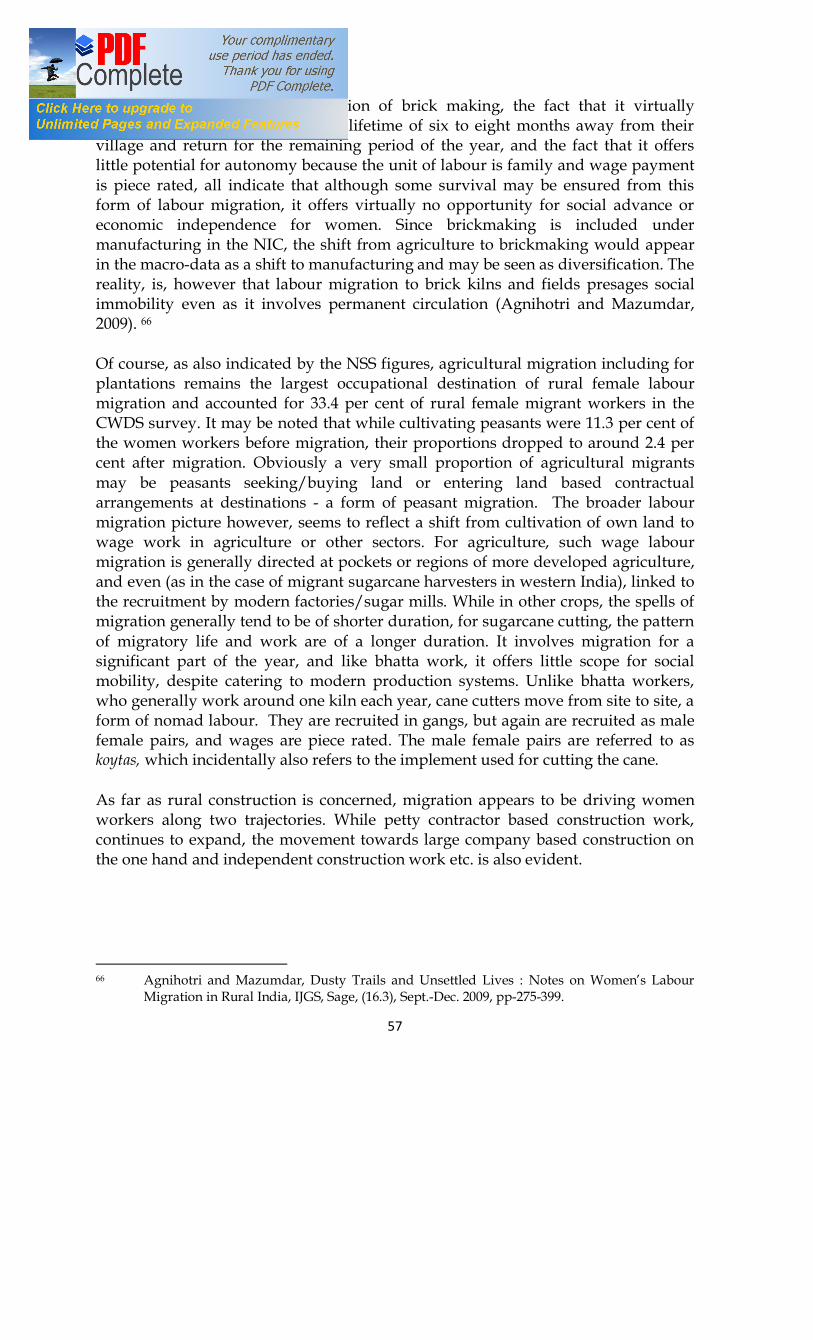
57
in the circular migratory occupation of brick making, the fact that it virtually condemns women (and men) to a lifetime of six to eight months away from their village and return for the remaining period of the year, and the fact that it offers little potential for autonomy because the unit of labour is family and wage payment is piece rated, all indicate that although some survival may be ensured from this form of labour migration, it offers virtually no opportunity for social advance or economic independence for women. Since brickmaking is included under manufacturing in the NIC, the shift from agriculture to brickmaking would appear in the macro-data as a shift to manufacturing and may be seen as diversification. The reality, is, however that labour migration to brick kilns and fields presages social immobility even as it involves permanent circulation (Agnihotri and Mazumdar, 2009). 66 Of course, as also indicated by the NSS figures, agricultural migration including for plantations remains the largest occupational destination of rural female labour migration and accounted for 33.4 per cent of rural female migrant workers in the CWDS survey. It may be noted that while cultivating peasants were 11.3 per cent of the women workers before migration, their proportions dropped to around 2.4 per cent after migration. Obviously a very small proportion of agricultural migrants may be peasants seeking/buying land or entering land based contractual arrangements at destinations - a form of peasant migration. The broader labour migration picture however, seems to reflect a shift from cultivation of own land to wage work in agriculture or other sectors. For agriculture, such wage labour migration is generally directed at pockets or regions of more developed agriculture, and even (as in the case of migrant sugarcane harvesters in western India), linked to the recruitment by modern factories/sugar mills. While in other crops, the spells of migration generally tend to be of shorter duration, for sugarcane cutting, the pattern of migratory life and work are of a longer duration. It involves migration for a significant part of the year, and like bhatta work, it offers little scope for social mobility, despite catering to modern production systems. Unlike bhatta workers, who generally work around one kiln each year, cane cutters move from site to site, a form of nomad labour. They are recruited in gangs, but again are recruited as male female pairs, and wages are piece rated. The male female pairs are referred to as koytas, which incidentally also refers to the implement used for cutting the cane. As far as rural construction is concerned, migration appears to be driving women workers along two trajectories. While petty contractor based construction work, continues to expand, the movement towards large company based construction on the one hand and independent construction work etc. is also evident.
66 Agnihotri and Mazumdar, Dusty Trails and Unsettled Lives : Notes on Women’s Labour
Migration in Rural India, IJGS, Sage, (16.3), Sept.-Dec. 2009, pp-275-399.
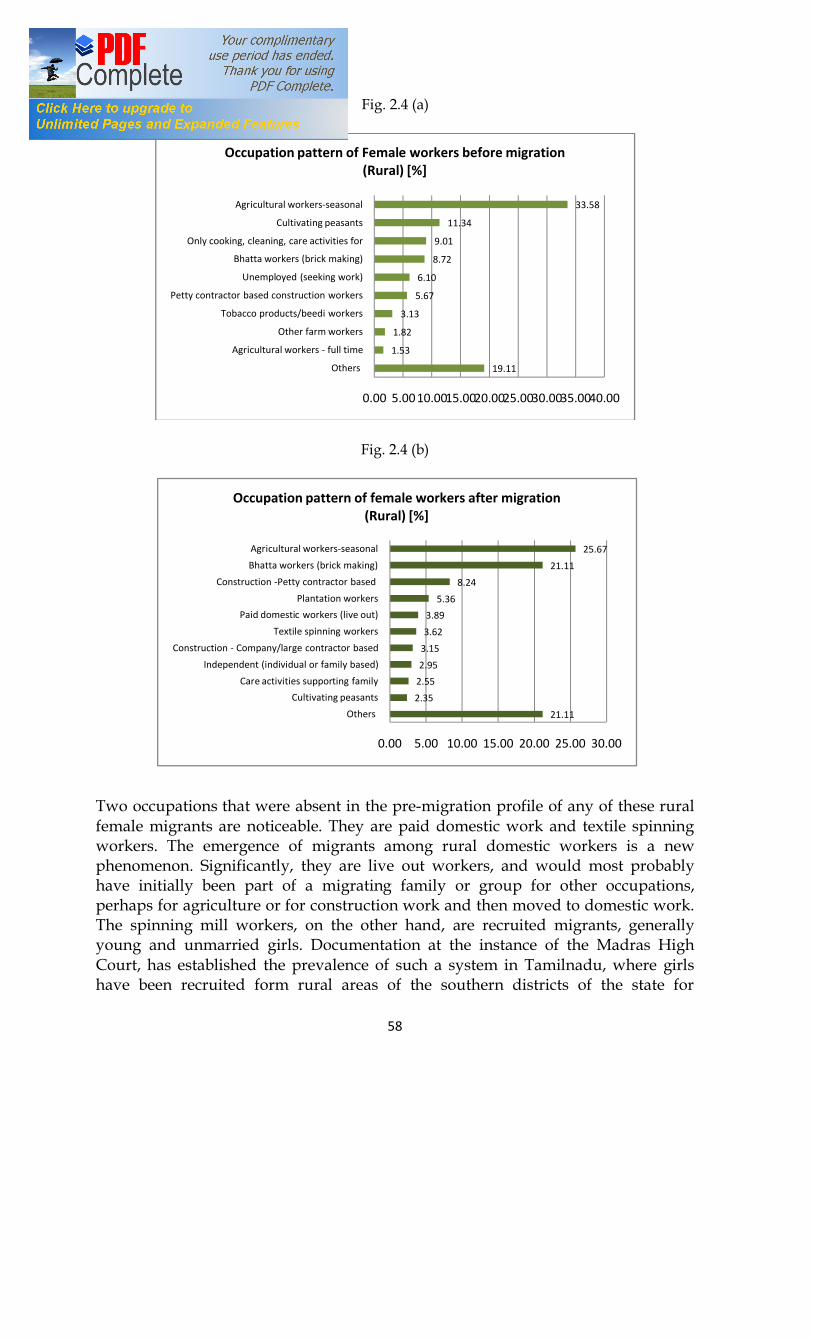
58
Fig. 2.4 (a)
Fig. 2.4 (b)
Two occupations that were absent in the pre-migration profile of any of these rural female migrants are noticeable. They are paid domestic work and textile spinning workers. The emergence of migrants among rural domestic workers is a new phenomenon. Significantly, they are live out workers, and would most probably have initially been part of a migrating family or group for other occupations, perhaps for agriculture or for construction work and then moved to domestic work. The spinning mill workers, on the other hand, are recruited migrants, generally young and unmarried girls. Documentation at the instance of the Madras High Court, has established the prevalence of such a system in Tamilnadu, where girls have been recruited form rural areas of the southern districts of the state for
19.11
1.53
1.82
3.13
5.67
6.10
8.72
9.01
11.34
33.58
0.00 5.0010.0015.0020.0025.0030.0035.0040.00
Others
Agricultural workers - full time
Other farm workers
Tobacco products/beedi workers
Petty contractor based construction workers
Unemployed (seeking work)
Bhatta workers (brick making)
Only cooking, cleaning, care activities for …
Cultivating peasants
Agricultural workers-seasonal
Occupation pattern of Female workers before migration(Rural) [%]
21.11
2.35
2.55
2.95
3.15
3.62
3.89
5.36
8.24
21.11
25.67
0.00 5.00 10.00 15.00 20.00 25.00 30.00
Others
Cultivating peasants
Care activities supporting family
Independent (individual or family based) …
Construction - Company/large contractor based
Textile spinning workers
Paid domestic workers (live out)
Plantation workers
Construction -Petty contractor based
Bhatta workers (brick making)
Agricultural workers-seasonal
Occupation pattern of female workers after migration(Rural) [%]
59
production work in spinning mills in the districts of Erode, Dindigul, Tirupur/Coimbatore. For some years such labour recruitment operated under the guise of an apprenticeship cum marriage assistance scheme, known as ‘Sumangali Marriage Scheme’, whereby girls worked on a 2-3 year contract with a spinning mill, at the end of which a lumpsum was given to them purportedly for use in their marriage (read dowry). Since the girls were confined to residential camps run by the mill managements, it became known as a ‘camp coolie system’ and following a court order in 2007, decreeing it as bonded labour, the scheme as such has gone underground, although the pattern of migration it initiated, does not appear to have changed. Not so well known is the emergence of District Rural Development Agency (DRDA) as a labour market institution mediating the recruitment and migration of girls for a whole range of new spinning and textile factories located in the rural areas of southern India. In the course of field work, we met with several young girls, from the backward districts of Ananthapur and Vizianagram/Srikakulam in Andhra Pradesh and from Bhadrak, Orissa for spinning mills in rural Guntur, located in the agriculturally developed coastal region of Andhra Pradesh. Some were recruited with the help of the DRDA. A similar DRDA arranged migration was also found in Ganjam, Orissa from where such girls were being sent to work in factories in Kerala. Often, these girls are provided with hostel accommodation either within or near the factories. Some of these mills are state of the art in terms of technology, but located in rural isolation. Hard and unhealthy, though the work is, as day in and day out cotton fluff is inhaled, sticking to the body and entering the lungs, migration to these mills have, no doubt, brought employment to otherwise unemployed young women. Fig. 5 (a) and (b) make it clear that a significant proportion of unemployed or housebound women effected entry into paid employment through rural migration. Among the rural women migrant workers who were surveyed, 6 per cent were unemployed before migration and another 6 per cent were only involved in unpaid family care work. Urban Women Migrant Workers Concentration in some limited sectors/occupations appears to be the outcome of migration even in urban areas where otherwise one would expect much more diversification [see Fig. 2.5 (a) and 2.5 (b)]. Some diversification is indeed evident but so too is the concentration, most strikingly in paid domestic work. At a broad stroke level, agriculture, construction, and domestic work (at 13%, 10% and again 10% respectively), together accounted for around one third of the pre-migration profile of the surveyed urban migrant women workers, and another 31 per cent were either unemployed or involved in only cooking, cleaning, care activities within their families. Such a profile became converted through migration to paid domestic work and construction (at 28% and 16% respectively), together accounting for 44 per

60
cent of the migrant worker sample in the urban context. Further, where some 12 per cent of the sample worked in manufacturing/production, the pre-migration profile had only 5 per cent in the same line. The share of vendors/petty traders doubled from 2.6 per cent pre-migration to 6 per cent of the post migration sample. The share of nurses also almost doubled from 2.6 to 4.24 per cent. Apart from the above, the urban sample had some 36 per cent in more diverse services (including sales workers, beauticians, call centre workers and professional/technical related workers), whereas the pre-migration profile showed less than 27 per cent in diversified services. On the one hand, diversification may be seen with the inclusion and extension of a wider range of occupations in the employment profiles of urban female migrants such as sales workers, beauticians, hair dressers, call centre workers, professional, technical and related workers. The first four of these are singularly absent in the pre-migration profile of the sample. On the other hand, an intensification of concentration is most noticeable in the case of domestic workers, whose share in the post migration urban sample is three times what it was in the pre-migration profile. As may be seen, this is the case for both live in and live out domestic workers.67 Interestingly, among urban women migrants in construction, it appears that independent and petty contractor based construction (both in roughly equal measures) and large scale companies are all involved in drawing women into urban construction activity. From around 10 per cent before migration, the numbers in the post migration urban sample had risen to 15 per cent. The greater presence of independent construction workers, would indicate that the migration of these workers to urban areas was less contractor driven and more based on independent expectations of finding employment. But the most significant change effected by urban wards migration that needs to be highlighted, is that 31 per cent of the surveyed women workers who were unemployed or involved in only family based domestic duties (in a sense housewives) before migration, were able to effect entry into paid employment in urban areas. At the same time, it is noticeable that only around 14 per cent of the urban workers had actually made a transition from agricultural to non-agricultural employment.
67 Live in domestic workers are those who reside on the premises of their employer (generally
full time workers). Live outs are those whose residence is independent of the employer and who may be working in many households.

61
Fig.2.5 (a)
Fig.2.5 (b)
The fact that only a small proportion of urban migrant women workers are being drawn from the agricultural workforce, and a much larger proportion are being drawn from unemployed or hitherto housebound women, of course reinforces the point that emerged from the NSS data that female labour migration is not leading to a large scale shift of the female workforce out of agriculture. However, the reasons
26.71
1.5
1.7
2.6
2.6
2.7
2.7
3.2
3.7
4.3
4.7
5.5
7.3
12.8
18.0
0.00 5.00 10.00 15.00 20.00 25.00 30.00
Others
Food/beverage processing/manufacturing workers
Independent (individual or family based) …
Vendors/ petty trader
Nursing in hospitals/establishments/institutes
Agricultural workers - full time
Paid domestic workers in households(live-in)
Tailoring/stitching workers
Construction company and large contractor based …
Petty contractor based construction workers
Agricultural workers-seasonal
Cultivating peasants
Paid domestic workers (live out)
Only cooking/cleaning/ care for family
Unemployed (seeking work)
Occupation pattern of female migrant workers before migration (Urban) [%]
19.051.95
2.783.413.693.89
4.104.174.244.59
5.495.986.19
9.67
20.79
0.00 5.00 10.00 15.00 20.00 25.00
Others
Teachers in private schools
Beauticians, hairdressers and other related workers
Other production workers
Call centre employees
Professional, technical and related …
Tailoring/stitching workers
Sales workers
Nursing in hospitals/establishments/institutes
Textile spinning and weaving workers
Construction - Company/large contractor
Vendors/ petty trader
Paid domestic workers in households(live-in)
Construction-Independent/petty contractor
Paid domestic workers (live out)
Occupation pattern of female migrant workers after migration (Urban) [%}

62
perhaps need to be located in the different attitudes/compulsions that control or direct women’s involvement in relation to paid employment along feudal caste and status hierarchies. It is well known that upper caste women were traditionally restricted from working outside the home, and certainly less involved in the manual labour involved in agriculture. Conversely, lower social and caste status propels/compels greater involvement of women in paid work in agriculture. The more diversified and less stigmatized service occupations that have developed in urban areas, have obviously opened up more opportunities for hitherto more restricted upper caste women than for traditional female workers in agriculture, who are drawn more from SC, ST and some from OBC backgrounds. Evidence of this can be seen in the differences in the caste composition of urban migrants in comparison to rural (See Table 2.5).
Table 2.5
Destination of migration by Social Group/Caste composition of women workers (%) Upper/General OBC MBC SC ST
Urban 24.9 28.9 3.7 21.5 21.1 Rural 10.9 23.3 4.2 35.4 26.2
As is obvious from the above table, almost three quarters of upper caste women migrants (71.4%) and more than half of the women of OBC/MBC background (54.2%) had migrated urban wards. In comparison, among the Scheduled caste women, the majority (62.3%) had migrated to rural destinations and a similar pattern was visible among Scheduled Tribe women (55.4%).68 The greater proportions of women from OBC backgrounds in urban migration perhaps reflects the greater levels of internal differentiation that has taken place within the large omnibus category of OBCs.
Of Contractors and Independence: Modes and Manner of Migration Interestingly, information gathered on the mode of migration, given in Figure 2.6 indicates the prevalence of strong independent motivations involved in labour migration by women in both rural and urban migration streams. Such independence is substantially greater among urban women migrant workers (80.7%). Of course, this independent mode of migration also includes decisions taken by couples/nuclear families and not necessarily in a purely individual capacity. Nevertheless, it is significant that a great majority of the female migrant workers in both rural and urban areas felt a degree of involvement in decisions related to their 68 The unusually higher proportion of ST women in urban-wards migration in comparison the
SC women is probably explained by the concentration of ST women in circular migration for construction, much of which is located in urban areas.
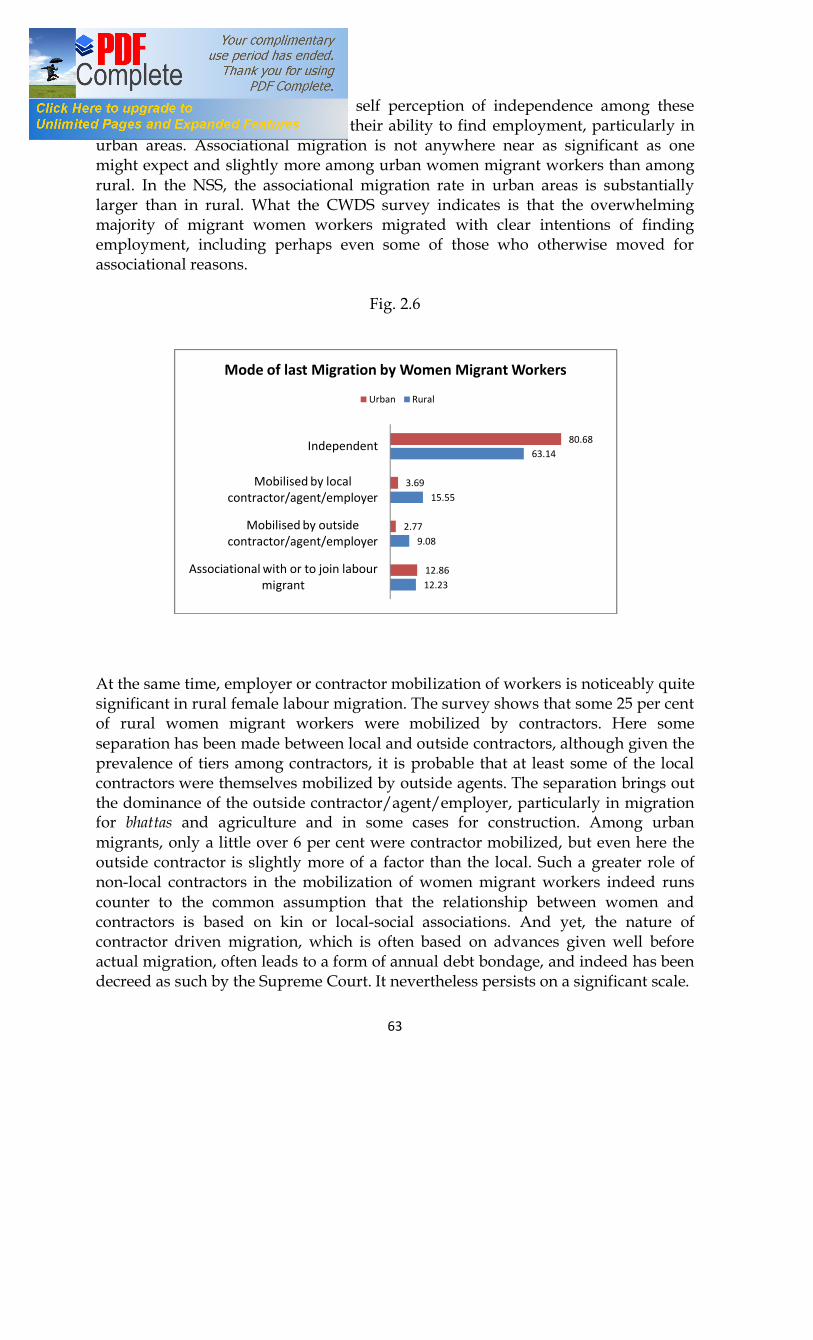
63
migration. It is possible that such self perception of independence among these women may have played a role in their ability to find employment, particularly in urban areas. Associational migration is not anywhere near as significant as one might expect and slightly more among urban women migrant workers than among rural. In the NSS, the associational migration rate in urban areas is substantially larger than in rural. What the CWDS survey indicates is that the overwhelming majority of migrant women workers migrated with clear intentions of finding employment, including perhaps even some of those who otherwise moved for associational reasons.
Fig. 2.6
At the same time, employer or contractor mobilization of workers is noticeably quite significant in rural female labour migration. The survey shows that some 25 per cent of rural women migrant workers were mobilized by contractors. Here some separation has been made between local and outside contractors, although given the prevalence of tiers among contractors, it is probable that at least some of the local contractors were themselves mobilized by outside agents. The separation brings out the dominance of the outside contractor/agent/employer, particularly in migration for bhattas and agriculture and in some cases for construction. Among urban migrants, only a little over 6 per cent were contractor mobilized, but even here the outside contractor is slightly more of a factor than the local. Such a greater role of non-local contractors in the mobilization of women migrant workers indeed runs counter to the common assumption that the relationship between women and contractors is based on kin or local-social associations. And yet, the nature of contractor driven migration, which is often based on advances given well before actual migration, often leads to a form of annual debt bondage, and indeed has been decreed as such by the Supreme Court. It nevertheless persists on a significant scale.
12.23
9.08
15.55
63.14
12.86
2.77
3.69
80.68
Associational with or to join labour migrant
Mobilised by outside contractor/agent/employer
Mobilised by local contractor/agent/employer
Independent
Mode of last Migration by Women Migrant Workers
Urban Rural
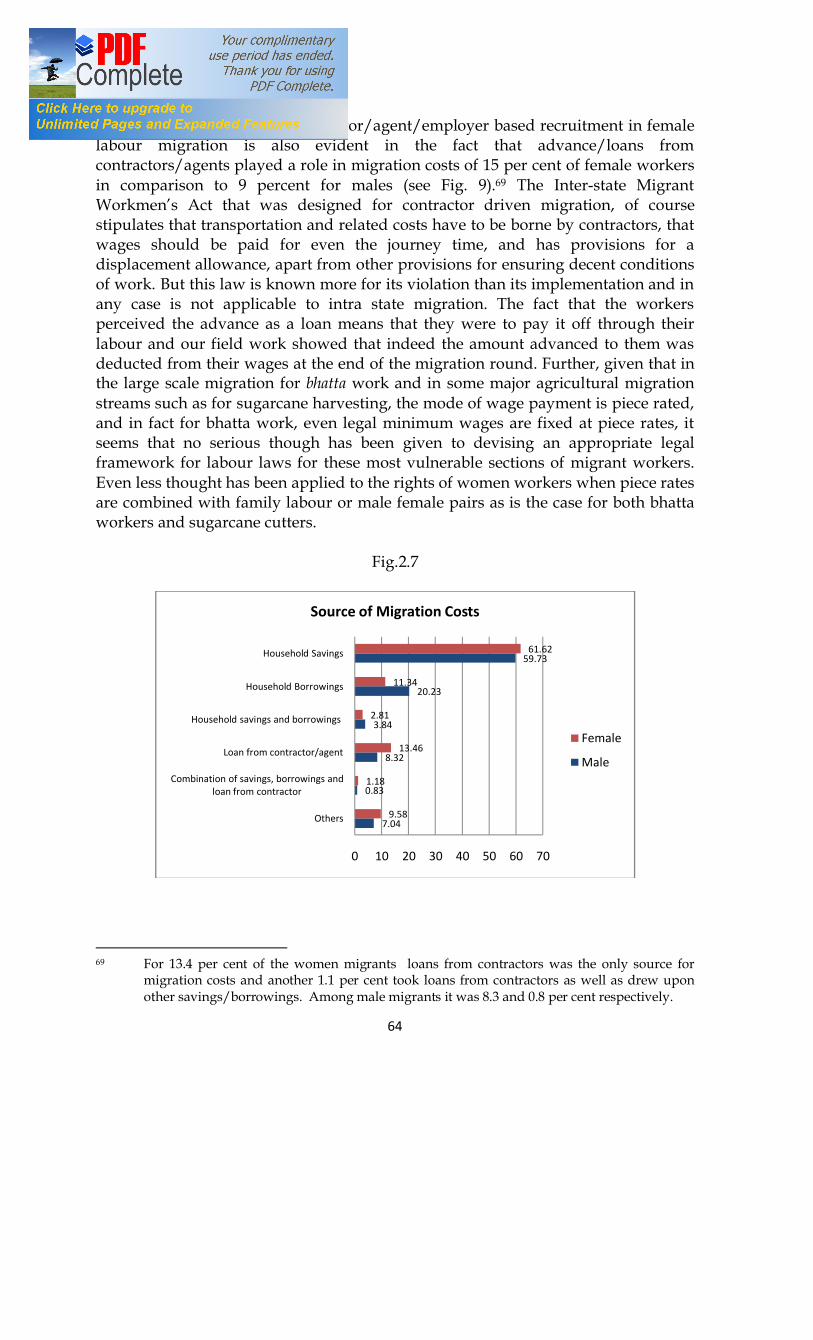
64
A relatively greater role of contractor/agent/employer based recruitment in female labour migration is also evident in the fact that advance/loans from contractors/agents played a role in migration costs of 15 per cent of female workers in comparison to 9 percent for males (see Fig. 9).69 The Inter-state Migrant Workmen’s Act that was designed for contractor driven migration, of course stipulates that transportation and related costs have to be borne by contractors, that wages should be paid for even the journey time, and has provisions for a displacement allowance, apart from other provisions for ensuring decent conditions of work. But this law is known more for its violation than its implementation and in any case is not applicable to intra state migration. The fact that the workers perceived the advance as a loan means that they were to pay it off through their labour and our field work showed that indeed the amount advanced to them was deducted from their wages at the end of the migration round. Further, given that in the large scale migration for bhatta work and in some major agricultural migration streams such as for sugarcane harvesting, the mode of wage payment is piece rated, and in fact for bhatta work, even legal minimum wages are fixed at piece rates, it seems that no serious though has been given to devising an appropriate legal framework for labour laws for these most vulnerable sections of migrant workers. Even less thought has been applied to the rights of women workers when piece rates are combined with family labour or male female pairs as is the case for both bhatta workers and sugarcane cutters.
Fig.2.7
69 For 13.4 per cent of the women migrants loans from contractors was the only source for
migration costs and another 1.1 per cent took loans from contractors as well as drew upon other savings/borrowings. Among male migrants it was 8.3 and 0.8 per cent respectively.
7.04
0.83
8.32
3.84
20.23
59.73
9.58
1.18
13.46
2.81
11.34
61.62
0 10 20 30 40 50 60 70
Others
Combination of savings, borrowings and loan from contractor
Loan from contractor/agent
Household savings and borrowings
Household Borrowings
Household Savings
Source of Migration Costs
Female
Male
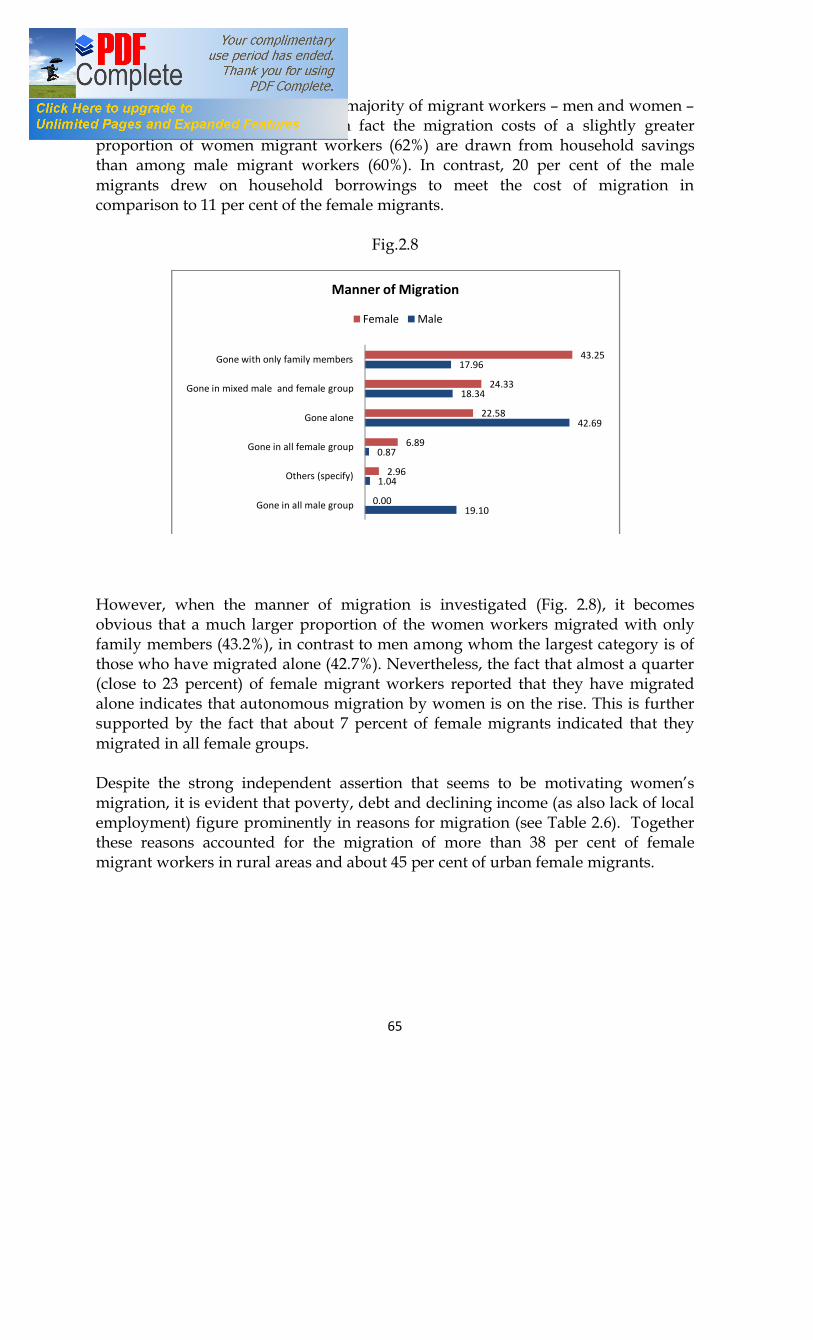
65
Nevertheless, as Fig. 2.7 shows the majority of migrant workers – men and women – are paying for their migration. In fact the migration costs of a slightly greater proportion of women migrant workers (62%) are drawn from household savings than among male migrant workers (60%). In contrast, 20 per cent of the male migrants drew on household borrowings to meet the cost of migration in comparison to 11 per cent of the female migrants.
Fig.2.8
However, when the manner of migration is investigated (Fig. 2.8), it becomes obvious that a much larger proportion of the women workers migrated with only family members (43.2%), in contrast to men among whom the largest category is of those who have migrated alone (42.7%). Nevertheless, the fact that almost a quarter (close to 23 percent) of female migrant workers reported that they have migrated alone indicates that autonomous migration by women is on the rise. This is further supported by the fact that about 7 percent of female migrants indicated that they migrated in all female groups. Despite the strong independent assertion that seems to be motivating women’s migration, it is evident that poverty, debt and declining income (as also lack of local employment) figure prominently in reasons for migration (see Table 2.6). Together these reasons accounted for the migration of more than 38 per cent of female migrant workers in rural areas and about 45 per cent of urban female migrants.
19.10
1.04
0.87
42.69
18.34
17.96
0.00
2.96
6.89
22.58
24.33
43.25
Gone in all male group
Others (specify)
Gone in all female group
Gone alone
Gone in mixed male and female group
Gone with only family members
Manner of Migration
Female Male
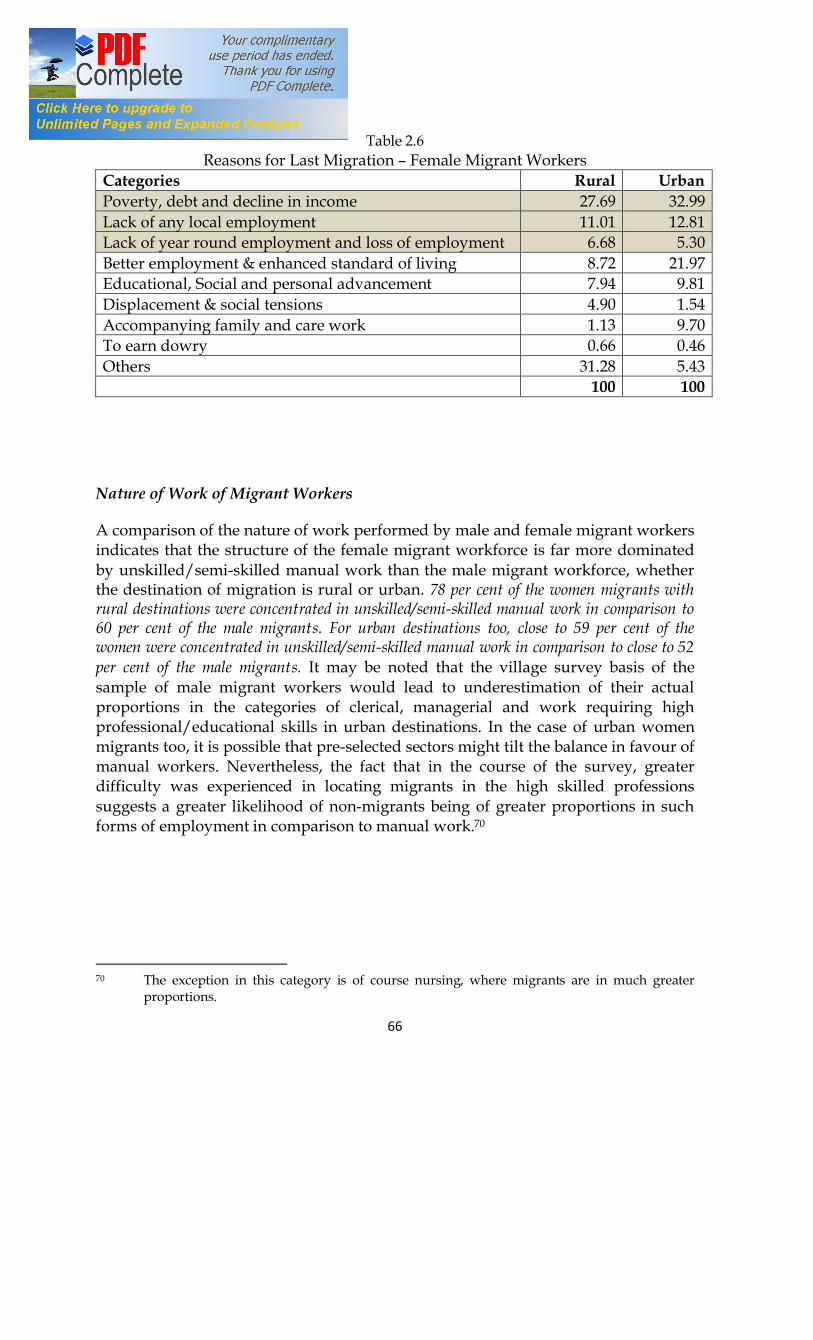
66
Table 2.6 Reasons for Last Migration – Female Migrant Workers
Categories Rural Urban Poverty, debt and decline in income 27.69 32.99 Lack of any local employment 11.01 12.81 Lack of year round employment and loss of employment 6.68 5.30 Better employment & enhanced standard of living 8.72 21.97 Educational, Social and personal advancement 7.94 9.81 Displacement & social tensions 4.90 1.54 Accompanying family and care work 1.13 9.70 To earn dowry 0.66 0.46 Others 31.28 5.43
100 100
Nature of Work of Migrant Workers
A comparison of the nature of work performed by male and female migrant workers indicates that the structure of the female migrant workforce is far more dominated by unskilled/semi-skilled manual work than the male migrant workforce, whether the destination of migration is rural or urban. 78 per cent of the women migrants with rural destinations were concentrated in unskilled/semi-skilled manual work in comparison to 60 per cent of the male migrants. For urban destinations too, close to 59 per cent of the women were concentrated in unskilled/semi-skilled manual work in comparison to close to 52 per cent of the male migrants. It may be noted that the village survey basis of the sample of male migrant workers would lead to underestimation of their actual proportions in the categories of clerical, managerial and work requiring high professional/educational skills in urban destinations. In the case of urban women migrants too, it is possible that pre-selected sectors might tilt the balance in favour of manual workers. Nevertheless, the fact that in the course of the survey, greater difficulty was experienced in locating migrants in the high skilled professions suggests a greater likelihood of non-migrants being of greater proportions in such forms of employment in comparison to manual work.70
70 The exception in this category is of course nursing, where migrants are in much greater
proportions.
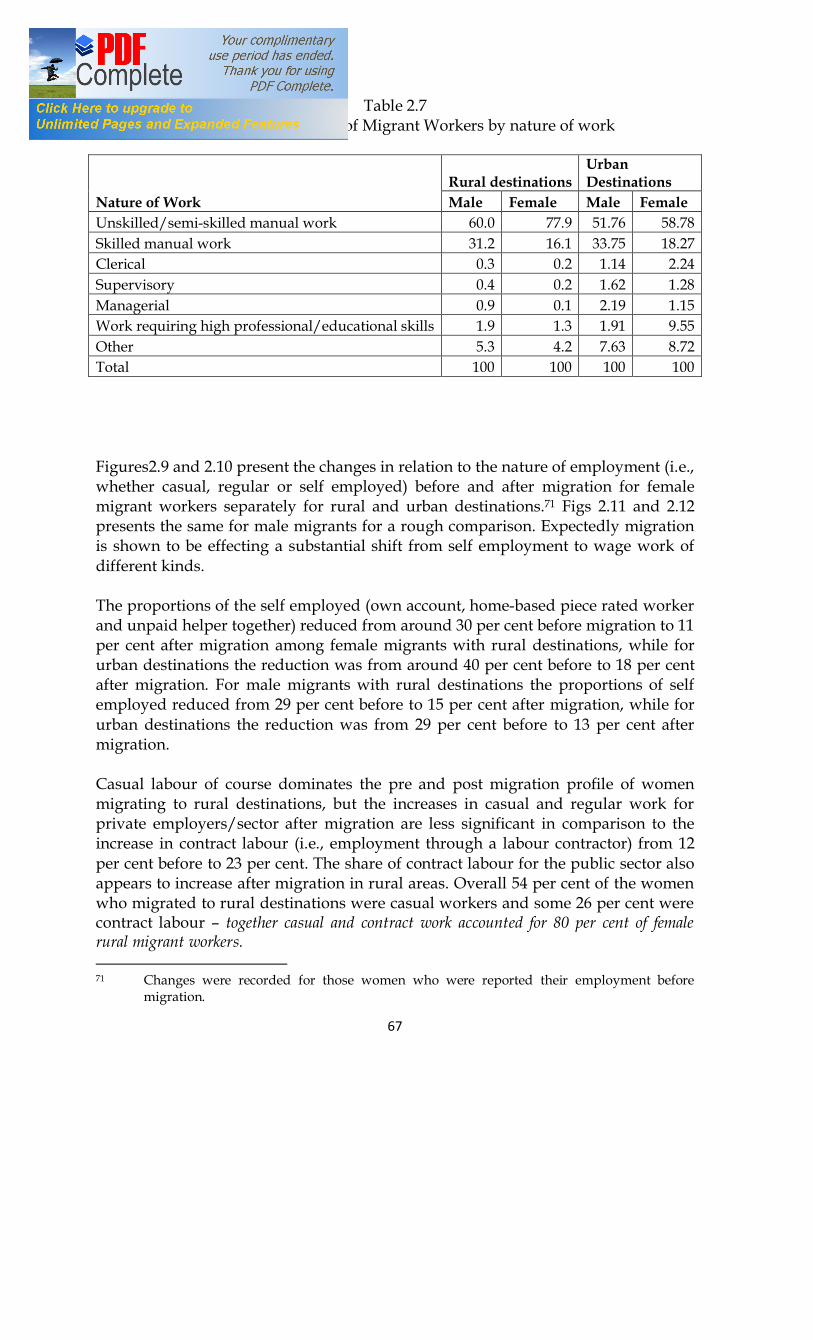
67
Table 2.7 Percentage distribution of Migrant Workers by nature of work
Nature of Work Rural destinations
Urban Destinations
Male Female Male Female Unskilled/semi-skilled manual work 60.0 77.9 51.76 58.78 Skilled manual work 31.2 16.1 33.75 18.27 Clerical 0.3 0.2 1.14 2.24 Supervisory 0.4 0.2 1.62 1.28 Managerial 0.9 0.1 2.19 1.15 Work requiring high professional/educational skills 1.9 1.3 1.91 9.55 Other 5.3 4.2 7.63 8.72 Total 100 100 100 100 Figures2.9 and 2.10 present the changes in relation to the nature of employment (i.e., whether casual, regular or self employed) before and after migration for female migrant workers separately for rural and urban destinations.71 Figs 2.11 and 2.12 presents the same for male migrants for a rough comparison. Expectedly migration is shown to be effecting a substantial shift from self employment to wage work of different kinds. The proportions of the self employed (own account, home-based piece rated worker and unpaid helper together) reduced from around 30 per cent before migration to 11 per cent after migration among female migrants with rural destinations, while for urban destinations the reduction was from around 40 per cent before to 18 per cent after migration. For male migrants with rural destinations the proportions of self employed reduced from 29 per cent before to 15 per cent after migration, while for urban destinations the reduction was from 29 per cent before to 13 per cent after migration. Casual labour of course dominates the pre and post migration profile of women migrating to rural destinations, but the increases in casual and regular work for private employers/sector after migration are less significant in comparison to the increase in contract labour (i.e., employment through a labour contractor) from 12 per cent before to 23 per cent. The share of contract labour for the public sector also appears to increase after migration in rural areas. Overall 54 per cent of the women who migrated to rural destinations were casual workers and some 26 per cent were contract labour – together casual and contract work accounted for 80 per cent of female rural migrant workers. 71 Changes were recorded for those women who were reported their employment before
migration.

68
Fig. 2.9
Fig. 2.10
In urban destinations, however, the major increase appears to be in regular salaried work, whose share increased from 21 per cent in the pre-migration profile of urban female migrant workers to 41 per cent in the post migration profile. Pre-migration casual work was 27 per cent – reduced to 24 per cent after. Although the share of casual labour at labour mandis increased, the share of other public and private sector casual labour decreased after migration. Contract labour, on the other hand, increased from 12 per cent to 18 per cent, and noticeably the share of homebased piece rated work was halved from around 10 per cent pre-migration to 5 per cent post. The 6 per cent of unpaid helpers in the pre-migration profile, obviously made the transition to paid employment after migration.
0.63
3.09
7.36
3.88
8.54
23.42
44.3
2.45
1.11
5.06
1.94
4.36
23.84
5.62
3.88
12.4
40.7
0.39
1.45
5.43
Unpaid helper in production/ …
Home based piece rate worker
Self employed (own account)
Casual work for hire at labour mandi
Regular work for private employer
Contract labour in private sector
Casual labour in private sector
Contract labour in public sector
Regular work in public sector
Casual labour in public sector
Nature of Employment before and after Migration (Rural Destinations) [Females] (%)
Before Migration After Migration
0.31
5.49
12.08
7.15
40.51
13.32
15.29
4.56
0.12
1.17
6.4
9.94
23.54
4.91
21.26
10.51
20
1.37
0.23
1.83
Unpaid helper in production/ sale/service activities
Home based piece rate worker
Self employed (own account)
Casual work for hire at labour mandi
Regular work for private employer
Contract labour in private sector
Casual labour in private sector
Contract labour in public sector
Regular work in public sector
Casual labour in public sector
Nature of Employment before and after Migration (Urban Destinations) [Females] (%)
Before Migration After Migration

69
Fig. 2.11
Fig. 2.12
Unlike in the case of females, among male migrants with rural destinations, the share of general casual labour actually decreased from 57 before to 55 per cent after, although the share of contract labour increased from 6% to 12%. Yet again, it would appear that the share of casual and contract labour in the structure of the male migrant workforce at 67 per cent, is of lesser proportion than in the rural female migrant workforce. This is also indicated in the slightly larger share of regular work among male migrants at 14 per cent in comparison to 10 per cent among rural female migrants.
0
3.01
11.6
5.01
12.75
13.61
40.83
2.44
1.15
9.03
0.15
2.43
26.25
5.31
6.83
5.16
44.46
1.06
0.91
7.44
Unpaid helper in production/ sale/service …
Home based piece rate worker
Self employed (own account)
Casual work for hire at labour mandi
Regular work for private employer
Contract labour in private sector
Casual labour in private sector
Contract labour in public sector
Regular work in public sector
Casual labour in public sector
Nature of Employment before and after Migration (Rural Destinations) [Males] (%)
Before Migration After Migration
0.09
0.93
11.74
3.08
23.21
19.76
34.48
3.26
0.75
2.7
0.99
2.31
25.47
3.4
12.84
17.01
32.16
2.09
0.44
3.29
Unpaid helper in production/ sale/service activities
Home based piece rate worker
Self employed (own account)
Casual work for hire at labour mandi
Regular work for private employer
Contract labour in private sector
Casual labour in private sector
Contract labour in public sector
Regular work in public sector
Casual labour in public sector
Nature of Employment before and after Migration (Urban Destinations) [Males] (%)
Before Migration After Migration

70
The structure of the urban male migrant workforce is less well captured because of the village based sample – but it does show an increase in regular work for private employer from 13 to 23 per cent, casual work only slightly from 39% pre to 40 % post migration, and again an increase in contract labour from 19% to 23%, apart from the shift away from self employment. When rural and urban destinations are combined, post migration, the greatest increases can be seen in regular work for private employers – from close to 12 per cent before to nearly 27 per cent post migration in the case of women and from around 10 per cent to 19 per cent in the case of men. Noticeably, however, regular work in the public sector is an insignificant driver of migration, remaining at around 1% or less for all migrant workers – male female, rural urban. The overall proportions in casual work appear to have remained virtually the same for male migrants – whether for private or public sector. Among women migrants, the proportions in casual work actually reduced slightly after migration. On the other hand, the proportions involved in contract labour increased significantly after migration among both women and men, most significantly for the private sector, but also in the public sector. Contract labour for the private sector increased from around 12 per cent before migration to 18 per cent after among women migrants and from 12 to 17 per cent among male migrants. The nature of the contractor regime is of course multi-layered – even regular and casual workers may initially be recruited through contractors. However, the above figures refer to the contractor as a continuing intermediary between the principal employers and the workers, which in turn indicates a marked utilization of migrant workers for accumulation without commitment or responsibility for social security and other conditions of work. At the same time, the significant rise in regular employment after migration to urban areas is obviously responsible for the marked urbanwards direction of labour migration from village India among both men and women. Nevertheless, it needs to be borne in mind that such regular work is not necessarily secure or permanent and that it does not offer much social security as becomes obvious from other aspects of the conditions of work. Conditions of Work of Migrant Workers Table 2.8 presents a picture of access of migrant workers to minimum wage, provident fund, health insurance, protections against occupational hazards and crèche facilities. It makes clear that around one third of the rural and a quarter of the urban women migrants had no knowledge of minimum wage entitlements. Male migrants were only slightly more informed with a quarter of the rural and 22 per cent of the urban male migrants also having no such knowledge. The disparity is however, more marked in relation to actual access to minimum wages with 51 per cent of the rural male migrants having minimum wages in comparison to 32 per cent of the rural female migrants. Somewhat greater access is visible in urban destinations, where 45 per cent of the women and 59 per cent of the men receiving

71
minimum wages.72 Noticeably, there is little gender disparity in the proportions of those migrants who had access to earnings above minimum wages. The greatest disparity is evidently in the proportions of male and female migrants who earn less than minimum wages. 32 per cent of the rural and 19 per cent of the urban women migrants earned less than the minimum wage in comparison to 18 and 9 per cent of the rural and urban male migrants respectively. Of course many of those who reported lack of knowledge of minimum wages would also be earning less. Wages, along with larger number of days of employment, are the crucial drivers of migration, and it is striking that such a significant proportion of rural women migrants had below minimum wages even after the NREGA had kicked into action.
Table 2.8: Minimum Wages and other Entitlements of Migrant Workers (%)
Rural Destinations Urban Destinations Male Female Total Male Female Total Below Minimum Wage 18.0 31.6 26.7 9.0 19.4 15.1 Minimum Wage 51.0 31.5 38.6 58.5 44.6 50.3 Above Minimum Wage 5.9 4.8 5.2 10.4 10.9 10.7 Don't know about minimum wage
25.1 32.0 29.5 22.2 25.0 23.9
Total of above 100 99.9 100 100.1 99.9 100 Provident Fund 8.7 6.2 7.1 6.5 14.7 11.3 Health Insurance 6.3 4.7 5.3 6.3 13.5 10.5 Protections from Occupational Hazard
10.6 6.5 8.0 8.3 15.8 12.7
Daycare/Creche Facilities 4.4 3.4 3.7 2.2 4.4 3.5
Only 7 per cent of the rural female migrants had provident fund provisions, and a mere 5 per cent had health insurance. In urban destinations, 15 per cent of them had provident fund and 14 per cent had health insurance. Rural male migrants had only slightly greater access to both provident fund and health insurance. From the table, it would appear that in urban destinations male migrants had even less access than females to such social security. However, as mentioned in relation to other aspects, the urban sample of male migrants is not sufficiently representative. Although among women migrants, access to social security appears greater in urban compared to rural destinations, the overall picture is grim, with more than 85 per cent of all migrants (men and women) having no access to any social security entitlement. Unsurprisingly, daycare/crèche facilities were available to less than 5% of the workers. Such a situation highlights - on the one hand, the disenabling labour
72 Minimum wages here refers to the legally stipulated minimum wages, which vary from state
to state. Gujarat, for example, has maintained extremely low levels of minimum wages, and many grossly underpaid workers would actually be receiving above minimum wages in the state.
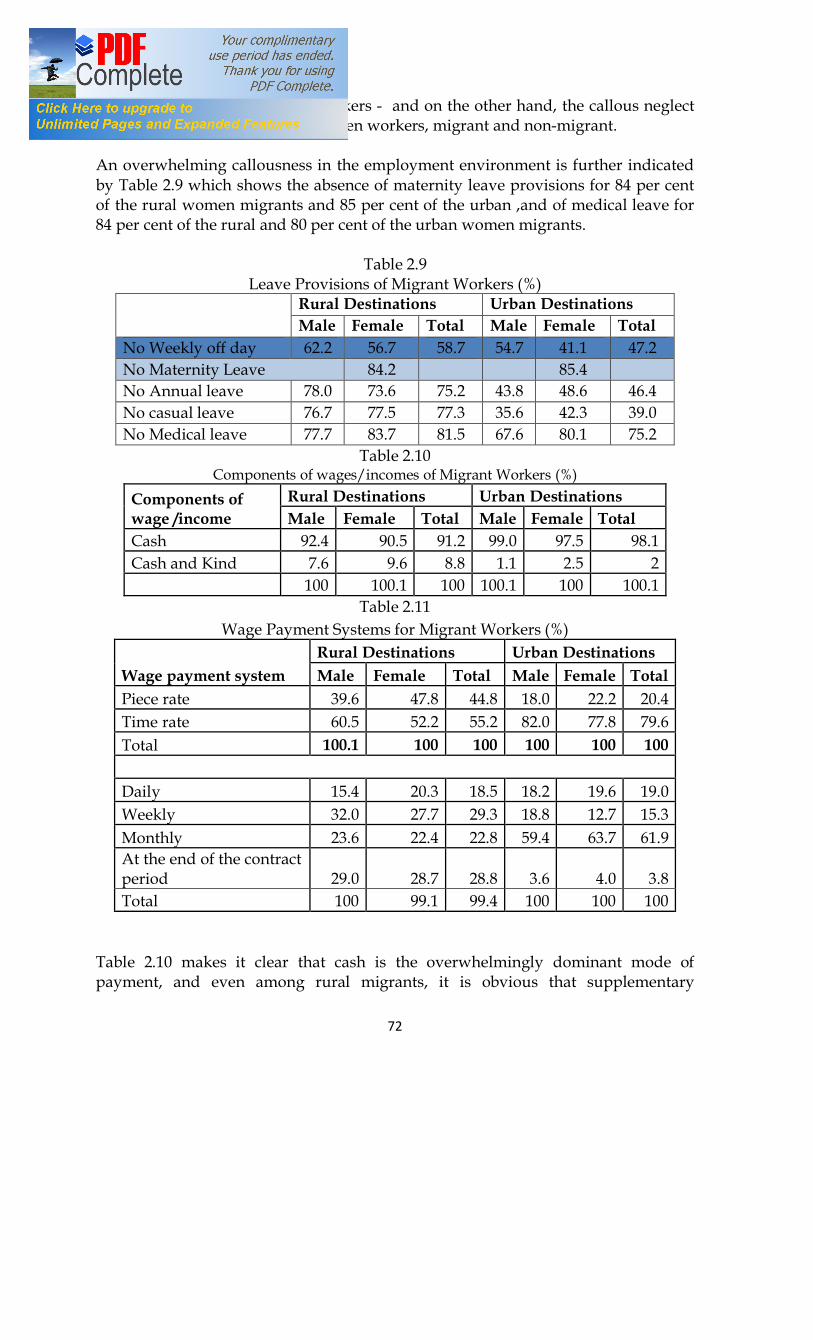
72
market conditions for women workers - and on the other hand, the callous neglect of the needs of the children of women workers, migrant and non-migrant. An overwhelming callousness in the employment environment is further indicated by Table 2.9 which shows the absence of maternity leave provisions for 84 per cent of the rural women migrants and 85 per cent of the urban ,and of medical leave for 84 per cent of the rural and 80 per cent of the urban women migrants.
Table 2.9 Leave Provisions of Migrant Workers (%)
Rural Destinations Urban Destinations Male Female Total Male Female Total
No Weekly off day 62.2 56.7 58.7 54.7 41.1 47.2 No Maternity Leave 84.2 85.4 No Annual leave 78.0 73.6 75.2 43.8 48.6 46.4 No casual leave 76.7 77.5 77.3 35.6 42.3 39.0 No Medical leave 77.7 83.7 81.5 67.6 80.1 75.2
Table 2.10 Components of wages/incomes of Migrant Workers (%)
Components of wage /income
Rural Destinations Urban Destinations Male Female Total Male Female Total
Cash 92.4 90.5 91.2 99.0 97.5 98.1 Cash and Kind 7.6 9.6 8.8 1.1 2.5 2
100 100.1 100 100.1 100 100.1 Table 2.11
Wage Payment Systems for Migrant Workers (%)
Wage payment system Rural Destinations Urban Destinations Male Female Total Male Female Total
Piece rate 39.6 47.8 44.8 18.0 22.2 20.4 Time rate 60.5 52.2 55.2 82.0 77.8 79.6 Total 100.1 100 100 100 100 100
Daily 15.4 20.3 18.5 18.2 19.6 19.0 Weekly 32.0 27.7 29.3 18.8 12.7 15.3 Monthly 23.6 22.4 22.8 59.4 63.7 61.9 At the end of the contract period 29.0 28.7 28.8 3.6 4.0 3.8 Total 100 99.1 99.4 100 100 100
Table 2.10 makes it clear that cash is the overwhelmingly dominant mode of payment, and even among rural migrants, it is obvious that supplementary
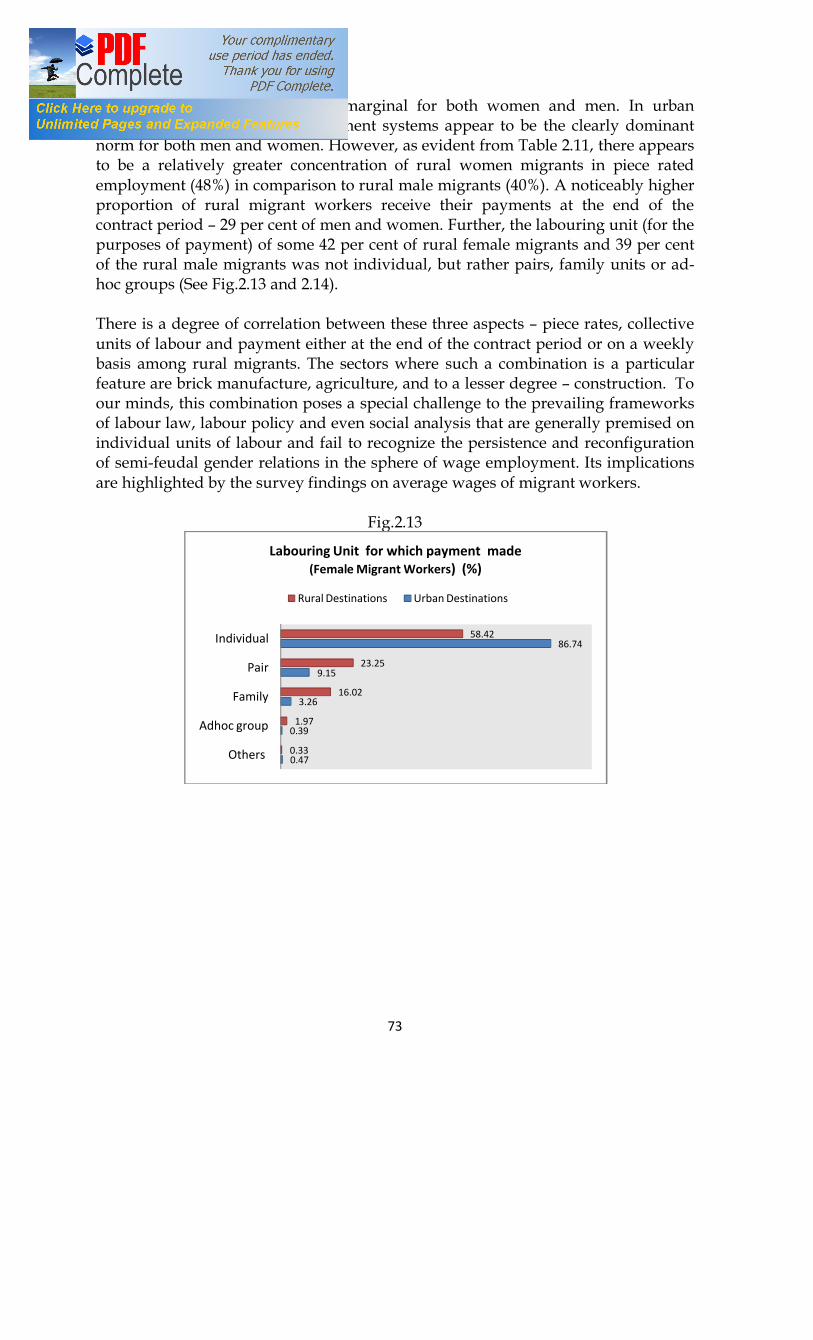
73
payments in kind have become marginal for both women and men. In urban destinations time rated wage payment systems appear to be the clearly dominant norm for both men and women. However, as evident from Table 2.11, there appears to be a relatively greater concentration of rural women migrants in piece rated employment (48%) in comparison to rural male migrants (40%). A noticeably higher proportion of rural migrant workers receive their payments at the end of the contract period – 29 per cent of men and women. Further, the labouring unit (for the purposes of payment) of some 42 per cent of rural female migrants and 39 per cent of the rural male migrants was not individual, but rather pairs, family units or ad-hoc groups (See Fig.2.13 and 2.14). There is a degree of correlation between these three aspects – piece rates, collective units of labour and payment either at the end of the contract period or on a weekly basis among rural migrants. The sectors where such a combination is a particular feature are brick manufacture, agriculture, and to a lesser degree – construction. To our minds, this combination poses a special challenge to the prevailing frameworks of labour law, labour policy and even social analysis that are generally premised on individual units of labour and fail to recognize the persistence and reconfiguration of semi-feudal gender relations in the sphere of wage employment. Its implications are highlighted by the survey findings on average wages of migrant workers.
Fig.2.13
0.47
0.39
3.26
9.15
86.74
0.33
1.97
16.02
23.25
58.42
Others
Adhoc group
Family
Pair
Individual
Labouring Unit for which payment made(Female Migrant Workers) (%)
Rural Destinations Urban Destinations
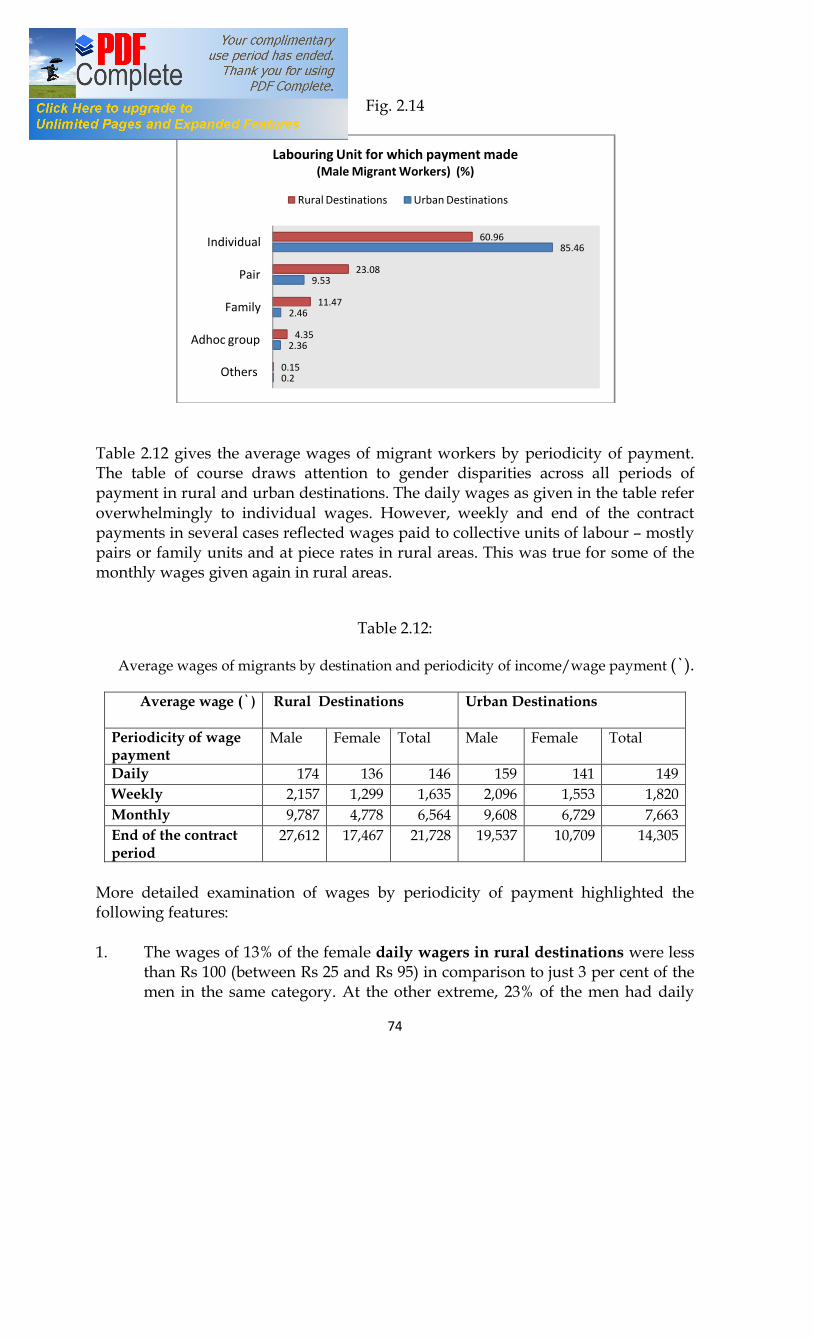
74
Fig. 2.14
Table 2.12 gives the average wages of migrant workers by periodicity of payment. The table of course draws attention to gender disparities across all periods of payment in rural and urban destinations. The daily wages as given in the table refer overwhelmingly to individual wages. However, weekly and end of the contract payments in several cases reflected wages paid to collective units of labour – mostly pairs or family units and at piece rates in rural areas. This was true for some of the monthly wages given again in rural areas.
Table 2.12:
Average wages of migrants by destination and periodicity of income/wage payment (`).
Average wage (`)
Rural Destinations Urban Destinations
Periodicity of wage payment
Male Female Total Male Female Total
Daily 174 136 146 159 141 149 Weekly 2,157 1,299 1,635 2,096 1,553 1,820 Monthly 9,787 4,778 6,564 9,608 6,729 7,663 End of the contract period
27,612 17,467 21,728 19,537 10,709 14,305
More detailed examination of wages by periodicity of payment highlighted the following features: 1. The wages of 13% of the female daily wagers in rural destinations were less
than Rs 100 (between Rs 25 and Rs 95) in comparison to just 3 per cent of the men in the same category. At the other extreme, 23% of the men had daily
0.2
2.36
2.46
9.53
85.46
0.15
4.35
11.47
23.08
60.96
Others
Adhoc group
Family
Pair
Individual
Labouring Unit for which payment made(Male Migrant Workers) (%)
Rural Destinations Urban Destinations
75
wages of Rs 250 and above in contrast to a mere 0.2% of the women. 87% of the women and 73% of daily wagers earned between Rs 100 and Rs 240. Among the male daily wagers, the largest numbers were construction workers (47%), followed by agricultural workers (18%) and then bhatta workers (16%). Among the women, agricultural workers including in plantations were more prominent (47%), followed by bhatta workers (28%) and then production/manufacturing workers (8%).
2. Among women receiving weekly payments in rural destinations 22%
received less than Rs 1,000 for a week (Rs 433 to Rs 931) in comparison to 14% of men. At the other extreme, 22% of the men received Rs 3,500 and above for a week, in comparison to just 0.7% of the women. 64% of the men and 77% of the women in this category earned between Rs 1,000 and Rs 3,500, although the women were all earning between Rs 1,020 and Rs. 2,281 in this group, while the male incomes in the same group ranged between Rs 1500 and Rs 5,250. Among all the weekly payment receiving migrants, the majority of the men were bhatta workers (59%) and another 12% were agricultural workers. Among the women, 39% were agricultural workers (including in plantations), 36% were bhatta workers and 13% were construction workers.
3. The picture in relation to migrants with monthly payments in rural
destinations was slightly different. At the lower end 6% of these women earned less than Rs 2000 a month in comparison to 2% of the men. At the middle to higher end however, the proportions of women earning above Rs 5,000 a month were 39% - higher than the 36% of the men in that income group. Still, when it came to monthly earnings above Rs 10,000, the proportions among women were 7% in comparison to 14% among men. 61% of the men and 55% of the rural women with monthly payment systems had incomes ranging from Rs 2,000 to Rs 4,500. Overall among the male monthly earners, the largest number were manufacturing workers (45%), dominated by electronics and textile manufacturing. Tenant cultivators were also quite prominent among these male migrants, alone accounting for 13% of all rural male monthly earners. Among rural women monthly earners, on the other hand, domestic workers were the largest group (27%) followed by manufacturing/production workers (23%), agricultural workers (10%) and construction workers (also 10%). Rural construction workers with monthly payments were predominantly working with large companies/contractors. 13% of these women were in a range of services, teachers, shopkeepers and petty traders, beauticians, etc.
4. Among daily wage migrants in urban destinations 17% of the women had
wages below Rs 100 in comparison to 2% of the men. At the other end of the spectrum - Rs 250 and above, it was 2% among both men and women. 97% of the men and 81% of the women among these daily wagers earned between Rs 100 and Rs 240. Among the male daily wagers, construction accounted for
76
48%, among whom petty contractor based workers were the largest number followed by large companies/contractor based workers and then independent construction workers. Loaders were also in significant proportions among male daily wagers (10%) as also a range of transport workers (rickshaw/handcart/ pullers, motor vehicle drivers, and even railway workers), together constituting another 10%. Construction was even more prominent among the urban women daily wagers (67%) of whom well over three fifths were working for petty contractors followed by independent and then large construction/contractor based construction. Among these women daily earners, the second largest group, were vendors/petty traders and various other sales workers (9%), followed by various kinds of manufacturing, including in textiles, fish processing (7%).
5. Among weekly earners in urban destinations, 77% of the women earned
less than Rs 1,000 a week in comparison to 53% of the men. At the other end, 28% of the men earned between Rs 3,500 and Rs 6,000 a week in comparison to 9% of the women. 19% of the men earned between Rs 1200 and Rs 3,000 in comparison to 14% of the women. Among these women weekly earners, construction workers were the largest group (34%) followed by manufacturing workers including a more significant presence of fish processing workers (20%), loaders (11%). Various services including nursing, catering, sales workers, dhaba and hotel workers, etc. together accounted 13% of the women weekly earners, and even some mining and quarrying workers were among the urban women migrants with weekly payments (7%). Among the male migrants, the majority in the weekly payment group were petty contractor based construction workers, sanitation, and fish processing workers.
6. Among monthly earners in urban destinations the picture that emerged was
7% of the male migrants had earnings of less than Rs 5,000 per month in comparison to 60% of the women. Of course in this monthly payment group, a large proportion among the women were live out and live in domestic workers (together around one third of all female monthly earners in the sample). Various production workers dominated by textiles and textile products (13% of all female monthly earners), construction workers (Construction company and large contractor based workers as well as independent construction workers, who together constituted almost three quarters of the 6% of the construction workers with monthly earnings), and shopkeepers (2% of the women who gave monthly earnings) were also relatively significant.
57% of the urban monthly earners among male migrants earned between Rs 5,000 to below Rs 10,000 of whom the majority were manufacturing workers including textiles, electronics, food processing (28% of all urban male monthly earners). In comparison, 13% of the migrant women were in this

77
income group, among whom the largest group was of beauticians (3% of urban female migrants with monthly payments), health and social workers including nurses (4% of the urban migrant women with monthly payment) and teachers in private schools (3% among the migrant monthly earners).
29% of these monthly earners among the male migrants earned between Rs 10,000 to below Rs 15,000, of whom the largest group was of transport workers (9% of the male migrant monthly earners), sales workers and petty traders/vendors (8% of the male monthly earners). In comparison, 14% of the women monthly earners were in the same income group, among whom the largest category was nurses in hospitals/medical establishments (6% of the monthly earners), and sales workers (also 6%).
3% of the male workers in this category earned between Rs 15,000 to less than 20,000 among whom teachers in private schools and community, social and personal services were the most prominent. In comparison 7% of the women were in this income group among whom professional, technical workers were the most prominent followed by teachers in government schools.
The topmost urban monthly earners ( with monthly incomes ranging from Rs 28,000 to 50,000 among male migrants and Rs 20,000 to 25,000 among female migrants), accounted for 5% and 6% of men and women respectively. Among the men professional, technical workers and business employees were the most prominent in this income group followed by bank employees, while among the women there were call centre employees and bank employees.
7. Among the migrant workers who received payment at the end of the
contract period, 84% of the women and 75% of the men had rural destinations. Agricultural workers were obviously the largest group and accounted for 47% of all male migrants (rural + urban destinations) who received payment at the end of the contract period and 44% of the women. Bhatta workers constituted 34% of these women and 22% of the men. Construction accounted for 16% of the men and 8% of the women. Another occupation among the men were loaders (9%), while among the women being paid at the end of the contract period, manufacturing workers were more significant (8%). The occupations/sectors however, are of less relevance for these workers than the duration of the contract. Loaders were clearly all short contract workers of at best a few days. So too were some of the construction and manufacturing workers. Bhatta workers, on the other hand, generally work for longer duration periods ranging from 5-6 months to 8-10 months. Among agricultural workers, there is a wider spectrum of durations ranging from shorter spells from a few days to a month to a lengthy duration of six months to almost the whole year.
78
Among these longer duration workers, female bhatta workers located in rural areas received an average payment of around Rs 23,000, while those in urban (mostly peri-urban) destinations received Rs 15,357 at the end of the contract period. Male bhatta workers had an average of Rs 26,000 in rural destinations and Rs 19,600 in urban destinations. What is important for most of these workers – male or female, is the fact that all work on piece rates, and a substantial proportion of them are referring to the wages received not for individual units of labour, but for male female pairs or family units.
Of the longer duration workers in agriculture in this system of payment, among rural males the average wage received ranged from close to Rs 32,000 among seasonal agricultural workers to Rs 62,500 among tenant cultivators. For the former, one can assume that the maximum duration would be around six to seven months (as in the case of the sugarcane cutters), while for the latter, it is likely to be what is nowadays known as taking land on an annual contract. Among the women, the average wage at the end of the contract period for seasonal agricultural workers in rural destinations was a little over Rs 14,900, while for tenant cultivators it was Rs 1,06,000. In urban destinations it was Rs 11,300 for seasonal workers and Rs 40,000 for ‘share croppers’. The large amount for the rural women tenant cultivators, is however, deceptive. To illustrate its real content, a useful example is of one such tenant cultivator encountered during field work in Gujarat. She was a tribal woman head of a family that migrated annually from Dahod district to the Saurashtra region (we met her in Rajkot district). 8 members of her family worked on the land where she was nominally a tenant in a ‘partnership’ relationship with the landlord. Her family laboured for eleven months involved in all the operations for growing cotton from the preparatory work to the final harvesting (the family lived in a shack in the middle of the field referred to as wadi). Seed, fertilizer, pesticide, etc. were provided by the landlord and after the crop was harvested by her family and sold by the landlord, she received one fourth of the price, which was over a lakh. This amount paid for the labour of eight people for the full eleven months, which would work out to an annual wage of Rs 12,500 for each. Similar cases were observed in other states as well. In some areas workers had taken land on contract/mortgage, i.e., on payment of a certain amount for usufructuary rights, generally involving some kind of sharing of the price received for the final crop between landlord and tenant, or in some form of sharecropping arrangement. The general practice among the landlords is to bring in a new person/family each year for such purposes, probably to bypass protective legislations for the tenants. In substantive terms, many of these tenancy arrangements mask what is essentially a form of attachment of field labourers.
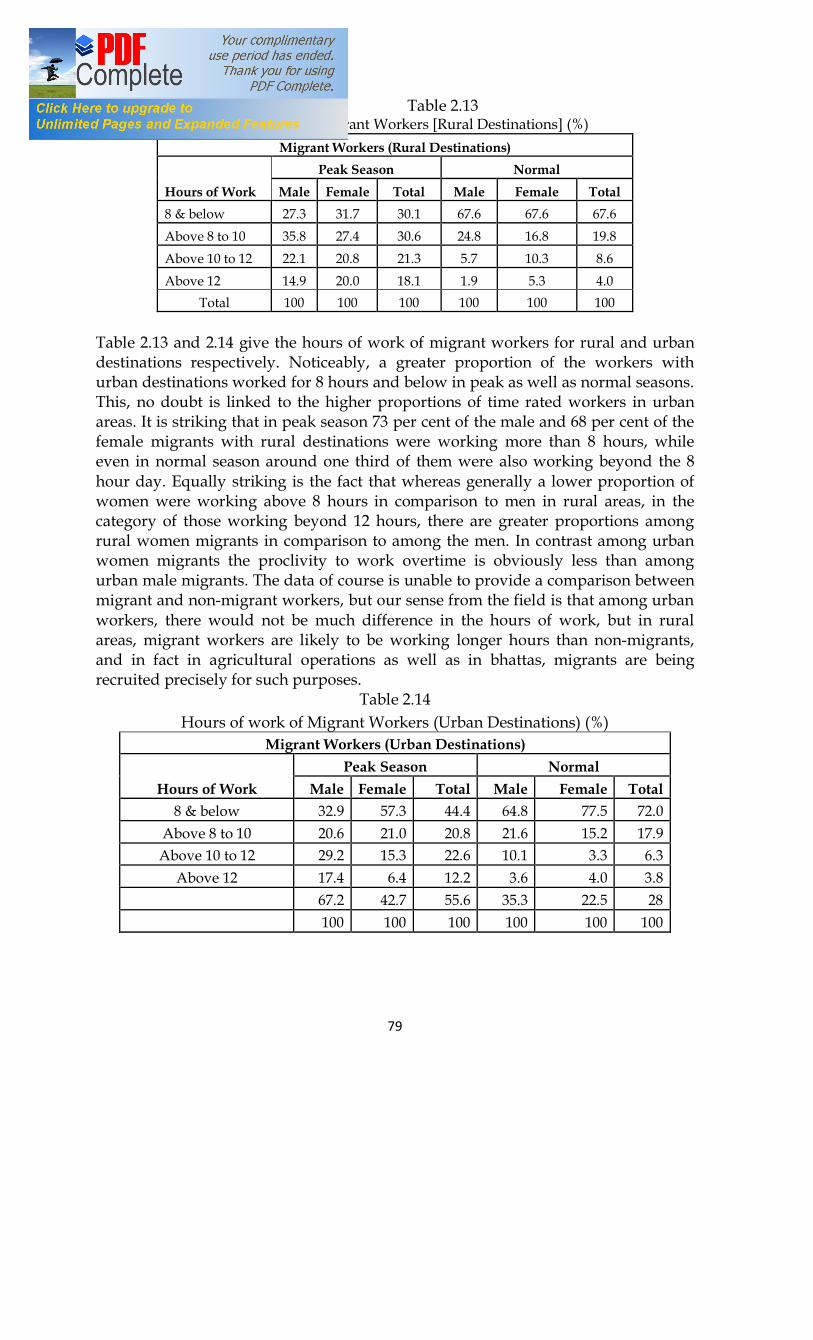
79
Table 2.13 Hours of work of Migrant Workers [Rural Destinations] (%)
Migrant Workers (Rural Destinations)
Hours of Work Peak Season Normal
Male Female Total Male Female Total 8 & below 27.3 31.7 30.1 67.6 67.6 67.6 Above 8 to 10 35.8 27.4 30.6 24.8 16.8 19.8 Above 10 to 12 22.1 20.8 21.3 5.7 10.3 8.6 Above 12 14.9 20.0 18.1 1.9 5.3 4.0
Total 100 100 100 100 100 100 Table 2.13 and 2.14 give the hours of work of migrant workers for rural and urban destinations respectively. Noticeably, a greater proportion of the workers with urban destinations worked for 8 hours and below in peak as well as normal seasons. This, no doubt is linked to the higher proportions of time rated workers in urban areas. It is striking that in peak season 73 per cent of the male and 68 per cent of the female migrants with rural destinations were working more than 8 hours, while even in normal season around one third of them were also working beyond the 8 hour day. Equally striking is the fact that whereas generally a lower proportion of women were working above 8 hours in comparison to men in rural areas, in the category of those working beyond 12 hours, there are greater proportions among rural women migrants in comparison to among the men. In contrast among urban women migrants the proclivity to work overtime is obviously less than among urban male migrants. The data of course is unable to provide a comparison between migrant and non-migrant workers, but our sense from the field is that among urban workers, there would not be much difference in the hours of work, but in rural areas, migrant workers are likely to be working longer hours than non-migrants, and in fact in agricultural operations as well as in bhattas, migrants are being recruited precisely for such purposes.
Table 2.14 Hours of work of Migrant Workers (Urban Destinations) (%)
Migrant Workers (Urban Destinations)
Hours of Work Peak Season Normal
Male Female Total Male Female Total 8 & below 32.9 57.3 44.4 64.8 77.5 72.0
Above 8 to 10 20.6 21.0 20.8 21.6 15.2 17.9 Above 10 to 12 29.2 15.3 22.6 10.1 3.3 6.3
Above 12 17.4 6.4 12.2 3.6 4.0 3.8 67.2 42.7 55.6 35.3 22.5 28
100 100 100 100 100 100
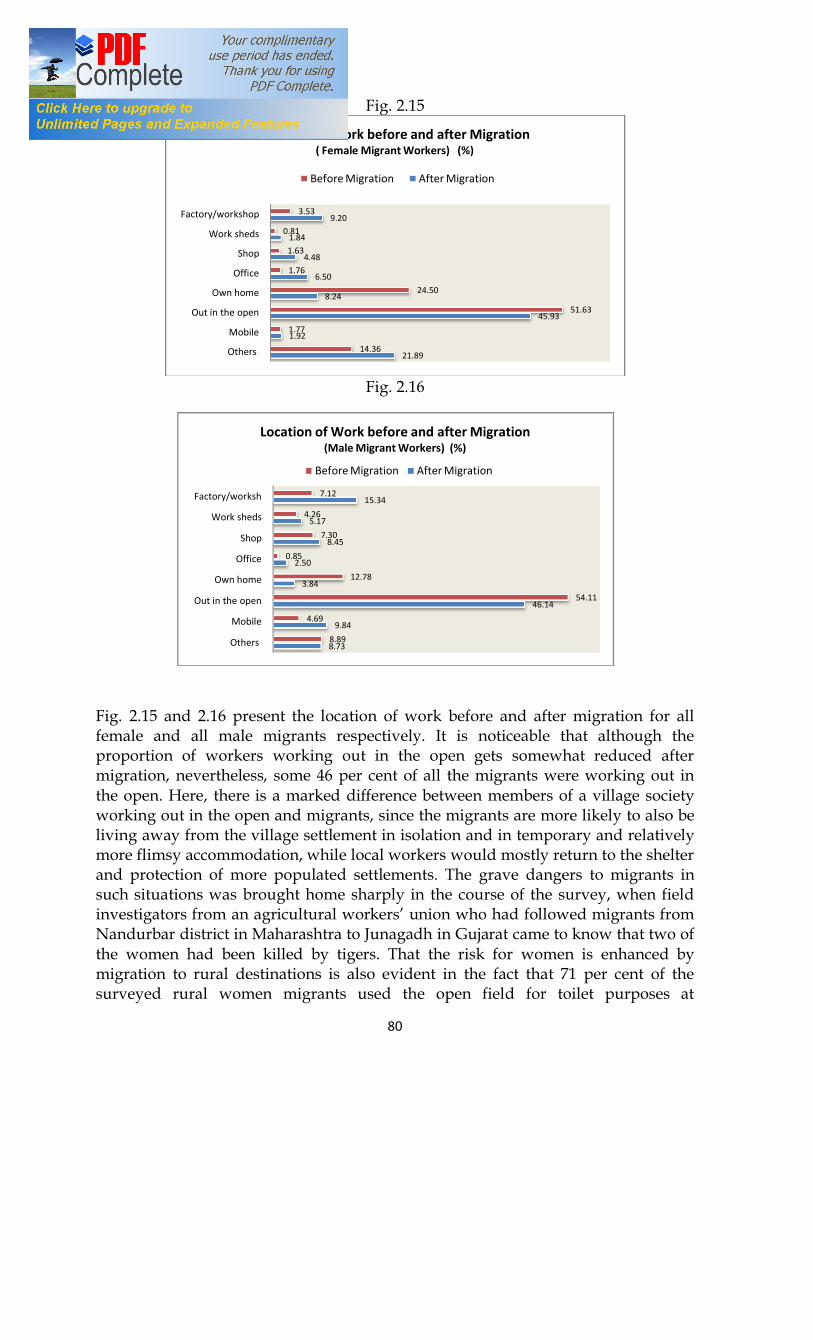
80
Fig. 2.15
Fig. 2.16
Fig. 2.15 and 2.16 present the location of work before and after migration for all female and all male migrants respectively. It is noticeable that although the proportion of workers working out in the open gets somewhat reduced after migration, nevertheless, some 46 per cent of all the migrants were working out in the open. Here, there is a marked difference between members of a village society working out in the open and migrants, since the migrants are more likely to also be living away from the village settlement in isolation and in temporary and relatively more flimsy accommodation, while local workers would mostly return to the shelter and protection of more populated settlements. The grave dangers to migrants in such situations was brought home sharply in the course of the survey, when field investigators from an agricultural workers’ union who had followed migrants from Nandurbar district in Maharashtra to Junagadh in Gujarat came to know that two of the women had been killed by tigers. That the risk for women is enhanced by migration to rural destinations is also evident in the fact that 71 per cent of the surveyed rural women migrants used the open field for toilet purposes at
21.89
1.92
45.93
8.24
6.50
4.48
1.84
9.20
14.36
1.77
51.63
24.50
1.76
1.63
0.81
3.53
Others
Mobile
Out in the open
Own home
Office
Shop
Work sheds
Factory/workshop
Location of Work before and after Migration ( Female Migrant Workers) (%)
Before Migration After Migration
8.73
9.84
46.14
3.84
2.50
8.45
5.17
15.34
8.89
4.69
54.11
12.78
0.85
7.30
4.26
7.12
Others
Mobile
Out in the open
Own home
Office
Shop
Work sheds
Factory/worksh…
Location of Work before and after Migration(Male Migrant Workers) (%)
Before Migration After Migration
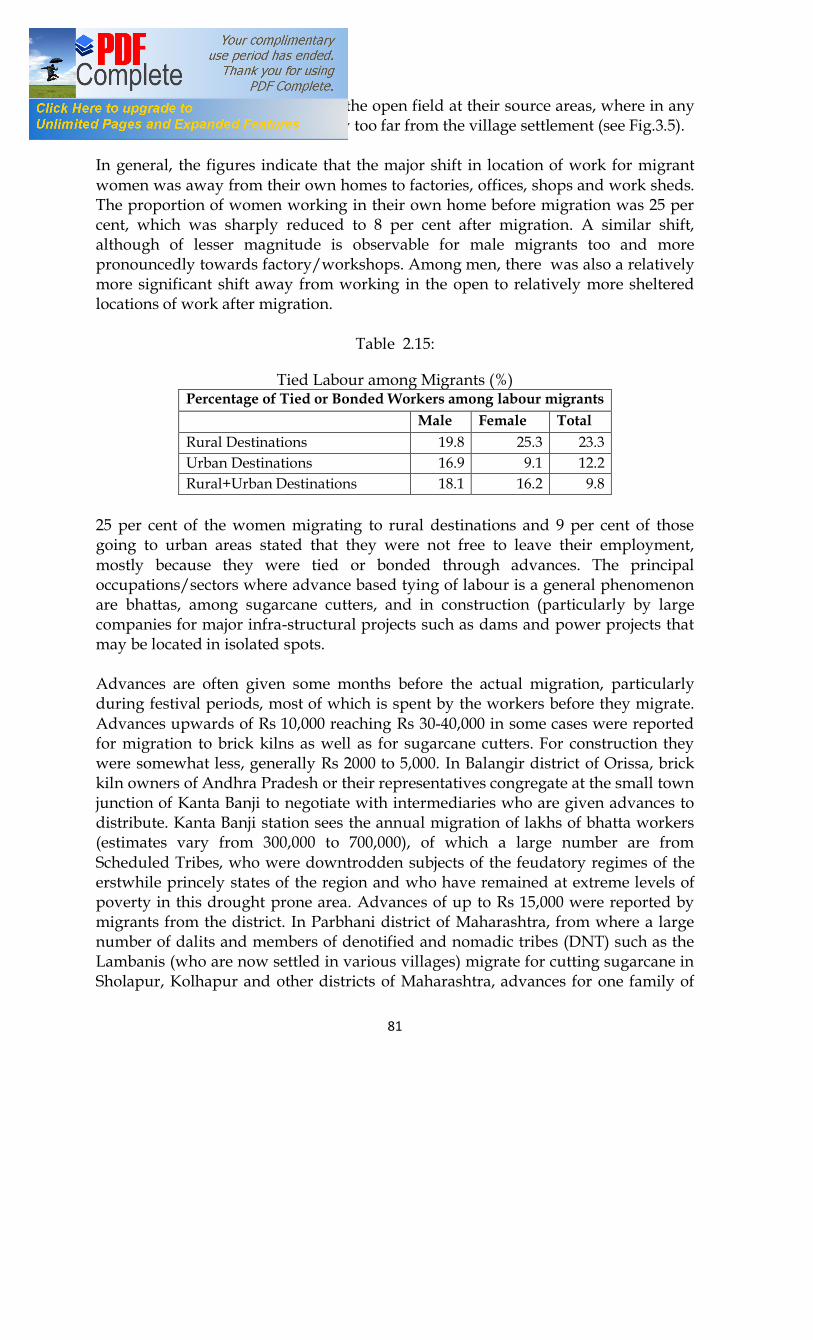
81
destination while 64 per cent used the open field at their source areas, where in any case they would be unlikely to stray too far from the village settlement (see Fig.3.5). In general, the figures indicate that the major shift in location of work for migrant women was away from their own homes to factories, offices, shops and work sheds. The proportion of women working in their own home before migration was 25 per cent, which was sharply reduced to 8 per cent after migration. A similar shift, although of lesser magnitude is observable for male migrants too and more pronouncedly towards factory/workshops. Among men, there was also a relatively more significant shift away from working in the open to relatively more sheltered locations of work after migration.
Table 2.15:
Tied Labour among Migrants (%) Percentage of Tied or Bonded Workers among labour migrants Male Female Total Rural Destinations 19.8 25.3 23.3 Urban Destinations 16.9 9.1 12.2 Rural+Urban Destinations 18.1 16.2 9.8
25 per cent of the women migrating to rural destinations and 9 per cent of those going to urban areas stated that they were not free to leave their employment, mostly because they were tied or bonded through advances. The principal occupations/sectors where advance based tying of labour is a general phenomenon are bhattas, among sugarcane cutters, and in construction (particularly by large companies for major infra-structural projects such as dams and power projects that may be located in isolated spots. Advances are often given some months before the actual migration, particularly during festival periods, most of which is spent by the workers before they migrate. Advances upwards of Rs 10,000 reaching Rs 30-40,000 in some cases were reported for migration to brick kilns as well as for sugarcane cutters. For construction they were somewhat less, generally Rs 2000 to 5,000. In Balangir district of Orissa, brick kiln owners of Andhra Pradesh or their representatives congregate at the small town junction of Kanta Banji to negotiate with intermediaries who are given advances to distribute. Kanta Banji station sees the annual migration of lakhs of bhatta workers (estimates vary from 300,000 to 700,000), of which a large number are from Scheduled Tribes, who were downtrodden subjects of the feudatory regimes of the erstwhile princely states of the region and who have remained at extreme levels of poverty in this drought prone area. Advances of up to Rs 15,000 were reported by migrants from the district. In Parbhani district of Maharashtra, from where a large number of dalits and members of denotified and nomadic tribes (DNT) such as the Lambanis (who are now settled in various villages) migrate for cutting sugarcane in Sholapur, Kolhapur and other districts of Maharashtra, advances for one family of

82
four (Mother father, son and daughter in law) was Rs 60,000. In Mahbubnagar of Andhra Pradesh, from where there has been a long tradition of recruitment of primarily OBC and dalit workers for construction of dams, bridges, railways and other major construction works in various parts of the country, advances reported were up to Rs 10,000. Tying of labour through advances and for these sectors/occupations, have of course become quite well known. There has been a long standing debate about the capitalist or feudal nature of ‘bonded labour’ as such in the agrarian order. However, due analytical attention has yet to be given to the linked process of recruitment of male female pairs or family units and the tying of labour in such forms of migration that is a common feature of all the above cases. It is for this reason that among the rural women migrants, the proportions of such tied labour is more prominent than among male migrants. While for both cane cutting and brick kilns, it is also linked to piece rates, among the construction workers it is not so. Although time rates are the norm of the construction workers, among the migrants from Mahbubnagar, the tying process incorporates the lower level contractor (maistry), who accompanies the workers, cooks and provides for food, beedies and some alcohol and who is expected to control and retrieve any workers who run away from the work site. To our minds, there is a distinctive semi-feudal component to this form of migrant labour, whether employers/recruiters are the fairly dispersed forms of owners of brick kilns, large construction companies or sugar mills. This is combined with the use of colonial style labour contractors and methods of primitive accumulation. And it is this that delineates the element of bondage that is the hallmark of such modes of migration, in which the male female pair or the family unit of labour – in other words, the gender component is the centerpiece. In urban destinations, where the labour market follows a different trajectory of formation on the other hand, such unfree labour appears as somewhat more prominent among male migrants than among women migrants. In comparison to 9 per cent of the women, 17 per cent of the male migrants from villages to urban areas were unfree labour, mostly in construction. Remittances Table 2.16 presents the proportions of migrants remitting income to source areas by destinations. As is clear, higher proportions of male migrants remit higher proportions of their income. Of course, this may be somewhat exaggerated because of the village bias of the survey among male migrants. Nevertheless, it is significant that some 37 per cent of the rural and 39 per cent of the urban male migrants remitted more than half their income of which 8% and 15% remitted or brought back their entire income. In comparison 23 per cent of the women migrating to rural areas and 20 per cent of the urban women migrants remitted more than half their incomes of which 9 per cent of the rural and 11 per
83
cent of the urban remitted all their income. While among the men who were after all selected from village based households, the strong links with the village are easily understandable, the fact that so many of the women migrants (68%), the majority of whom were not drawn from the village surveys, maintained remittance relationships suggests a strong and continuing link between the village and even urban based migrant workers that more often than not persists beyond expectation. It suggests that a significant degree of social control over the urban women migrants continues to emanate from village India.
Table 2.16
Share of Remittances in income earned by Migrants (%) Share of Migrant Worker’s Income remitted to source area
Rural Destinations Urban Destinations Male Female Male Female
None 17.1 31.8 7.7 32.5 Less than one tenth 8.0 13.6 7.6 12.0 Up to a quarter 10.9 11.9 8.0 14.5 Around one third 6.8 5.7 8.9 6.1 Up to half 19.8 13.7 29.1 15.4 More than half 29.7 14.5 24.0 8.6 All income 7.7 8.8 14.7 10.9 23.3 19.5 Total 100 100 100 100 Percentage of Migrants remitting some or all income to source area
82.9 68.2 92.3 67.5
Table 2.17 gives an idea of the mode of transfer of remittances. It is striking that the majority of migrants, male, female, rural or urban take or bring remittances themselves. This is no doubt linked to the general feature of a larger share of temporary including circular migration.
Table 2.17 Mode of Remittance Transfer (%)
Mode of Remittance transfer to Source Area
Rural Migrants Urban Migrants Male Female Total Male Female Total
Bring themselves 75.2 81.6 79.1 51.0 52.4 51.7 Send through
friends/neighbours/relatives 7.7 11.0 9.7 15.0 18.4 16.7
Money orders & Bank deposits
3.7 2.5 3.0 11.0 13.1 12.0
Others 13.4 4.8 8.2 23.0 16.2 19.7 100 99.9 100 100 100.1 100.1

84
Remittances have of course become a significant area of policy interest, bound to the assumption that it would enable higher levels of investment and in turn greater levels of development in receiving regions. There can be little doubt that migrant remittances have contributed to the asset base of many households in source areas, and our extensive field work indicates that the most prominent contribution has been in building of pucca houses and in children’s education (at least where children’s education is not disrupted because of migration). However, the contribution of remittances to other spheres of development is less palpable.73
73 For example, during field work in the districts of Saran division (Siwan and Chhapra
districts) in Bihar that has been sending a very high proportion of its population out of the district for over 150 years (Saran was referred to by a 19th century census commissioner as the greatest out-migrating district in British India), deindustrialization was observed as a marked feature. Local textile mills, a chocolate factory and some sugar mills had all closed down and the one time famous local metal handicraft industry in Parsa, Siwan had been decimated.
85
Part III
Migration and Citizenship Rights Under the Indian Constitution, citizens of India are not legally restricted from migrating internally within and across states in either rural or urban areas. Nevertheless, migrants face particular difficulties in accessing rights, in part due to the ubiquitous requirement of proof of residence for establishing eligibility for access individual or household entitlement. Difficulties in getting ration cards, gaining access to public employment or housing schemes, opening a bank account because of inability to provide proof of residence is a recurring problem for migrants whose work and residence is of an informal nature. Further, as evident from the preceding section, gender inequalities inherent in the patterns of labour migration, conditions of work, labour entitlements and protections, are less conditioned by constitutional guarantees of equality and law, and more by the path of development and its agents. The same is the case for other civic entitlements. This section focuses on the findings of the CWDS survey of individual migrant workers in relation to their experience of labour migration changes and status of some basic civic rights and conditions that draws on the combined universe of village and sector sites. Before outlining the findings in relation to civic rights and entitlements, we may briefly indicate the age and marital profile of the individual workers covered by the survey. Age and Marital Status of the Individual Migrant Workers Table 3.1 presents the age structure of the individual migrant worker respondents.
Table 3.1
Age Profile of the surveyed Individual Migrant Workers
Category of Migrant Age groups less than 15 15-25 26-35 36-45 46-59 Above 59 Total
Women with rural destinations 0.55 23.65 36.77 25.37 11.40 2.26 100 Women with urban destinations 0.90 34.46 36.74 18.76 7.82 1.32 100 Men with rural destinations 0.55 18.83 36.83 26.88 13.51 3.41 100 Men with urban destinations 0.37 21.84 40.67 26.05 9.28 1.78 100
As the table indicates, a larger proportion of women migrant workers were in the younger age group in comparison to male migrant workers. 72% of the female migrant workers with urban destinations were below 36 years of age in comparison to 63% of the male migrants to urban areas. Similarly 61% of the female migrant
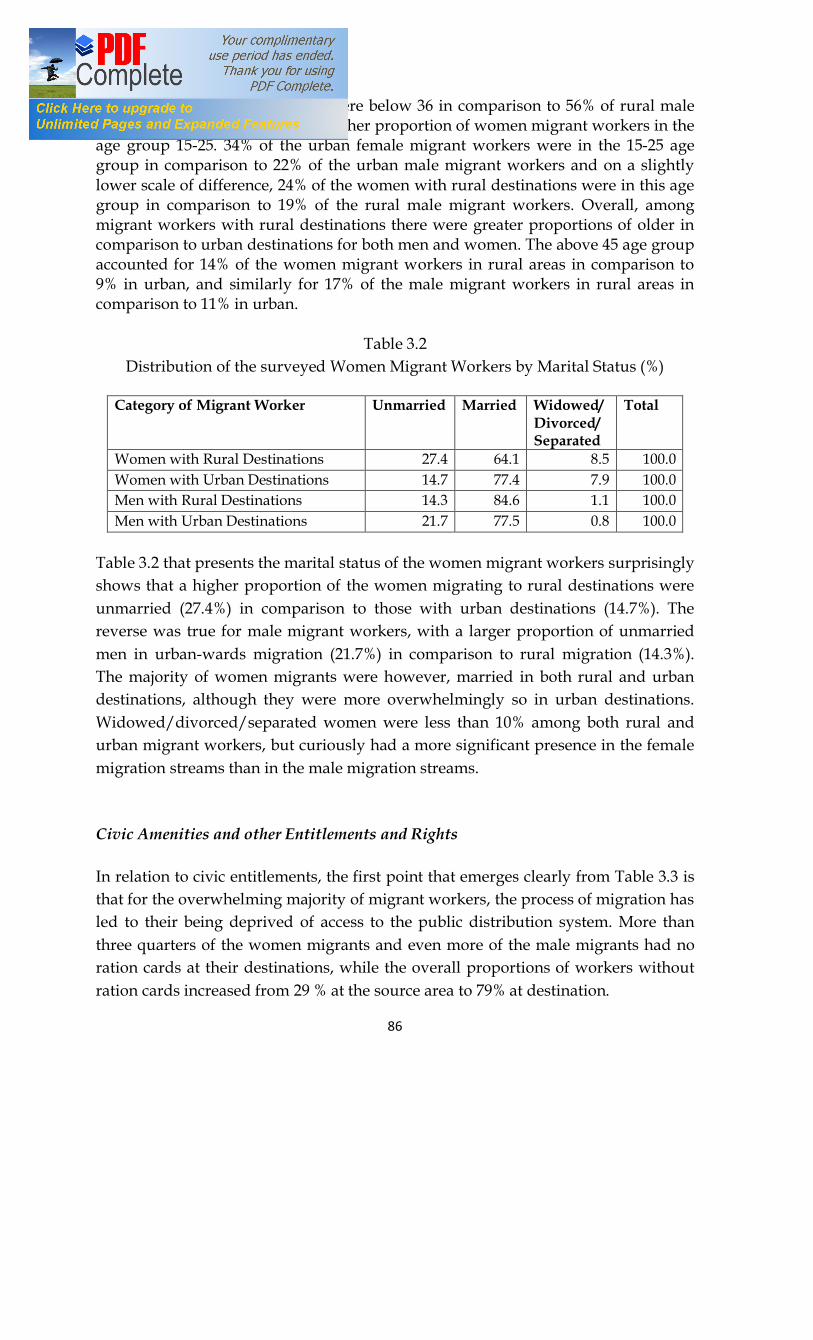
86
workers with rural destinations were below 36 in comparison to 56% of rural male migrants. Most striking was the higher proportion of women migrant workers in the age group 15-25. 34% of the urban female migrant workers were in the 15-25 age group in comparison to 22% of the urban male migrant workers and on a slightly lower scale of difference, 24% of the women with rural destinations were in this age group in comparison to 19% of the rural male migrant workers. Overall, among migrant workers with rural destinations there were greater proportions of older in comparison to urban destinations for both men and women. The above 45 age group accounted for 14% of the women migrant workers in rural areas in comparison to 9% in urban, and similarly for 17% of the male migrant workers in rural areas in comparison to 11% in urban.
Table 3.2
Distribution of the surveyed Women Migrant Workers by Marital Status (%)
Category of Migrant Worker Unmarried Married Widowed/ Divorced/ Separated
Total
Women with Rural Destinations 27.4 64.1 8.5 100.0 Women with Urban Destinations 14.7 77.4 7.9 100.0 Men with Rural Destinations 14.3 84.6 1.1 100.0 Men with Urban Destinations 21.7 77.5 0.8 100.0
Table 3.2 that presents the marital status of the women migrant workers surprisingly shows that a higher proportion of the women migrating to rural destinations were unmarried (27.4%) in comparison to those with urban destinations (14.7%). The reverse was true for male migrant workers, with a larger proportion of unmarried men in urban-wards migration (21.7%) in comparison to rural migration (14.3%). The majority of women migrants were however, married in both rural and urban destinations, although they were more overwhelmingly so in urban destinations. Widowed/divorced/separated women were less than 10% among both rural and urban migrant workers, but curiously had a more significant presence in the female migration streams than in the male migration streams. Civic Amenities and other Entitlements and Rights In relation to civic entitlements, the first point that emerges clearly from Table 3.3 is that for the overwhelming majority of migrant workers, the process of migration has led to their being deprived of access to the public distribution system. More than three quarters of the women migrants and even more of the male migrants had no ration cards at their destinations, while the overall proportions of workers without ration cards increased from 29 % at the source area to 79% at destination.
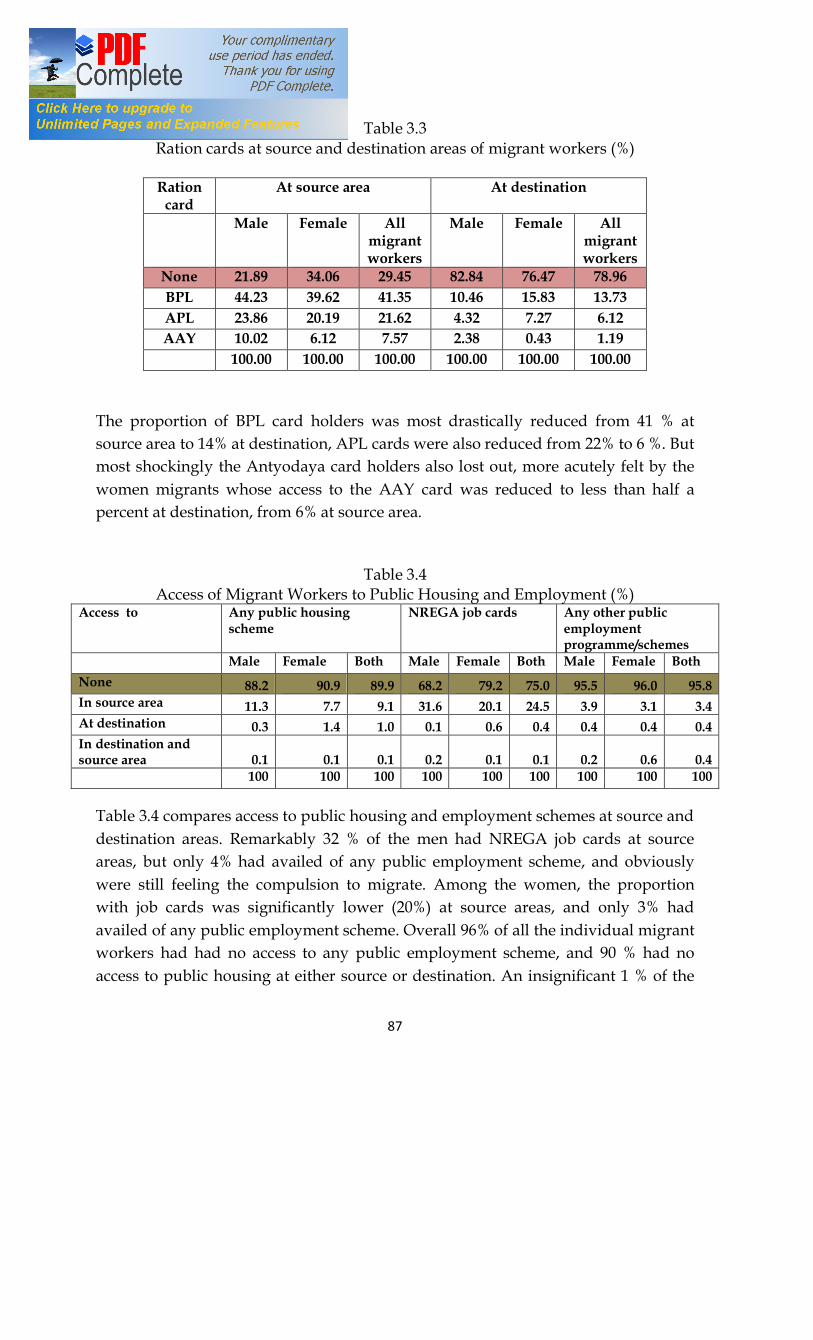
87
Table 3.3
Ration cards at source and destination areas of migrant workers (%)
Ration card
At source area At destination
Male Female All migrant workers
Male Female All migrant workers
None 21.89 34.06 29.45 82.84 76.47 78.96 BPL 44.23 39.62 41.35 10.46 15.83 13.73 APL 23.86 20.19 21.62 4.32 7.27 6.12 AAY 10.02 6.12 7.57 2.38 0.43 1.19
100.00 100.00 100.00 100.00 100.00 100.00 The proportion of BPL card holders was most drastically reduced from 41 % at source area to 14% at destination, APL cards were also reduced from 22% to 6 %. But most shockingly the Antyodaya card holders also lost out, more acutely felt by the women migrants whose access to the AAY card was reduced to less than half a percent at destination, from 6% at source area.
Table 3.4 Access of Migrant Workers to Public Housing and Employment (%)
Access to Any public housing scheme
NREGA job cards Any other public employment programme/schemes
Male Female Both Male Female Both Male Female Both None 88.2 90.9 89.9 68.2 79.2 75.0 95.5 96.0 95.8 In source area 11.3 7.7 9.1 31.6 20.1 24.5 3.9 3.1 3.4 At destination 0.3 1.4 1.0 0.1 0.6 0.4 0.4 0.4 0.4 In destination and source area 0.1 0.1 0.1 0.2 0.1 0.1 0.2 0.6 0.4 100 100 100 100 100 100 100 100 100
Table 3.4 compares access to public housing and employment schemes at source and destination areas. Remarkably 32 % of the men had NREGA job cards at source areas, but only 4% had availed of any public employment scheme, and obviously were still feeling the compulsion to migrate. Among the women, the proportion with job cards was significantly lower (20%) at source areas, and only 3% had availed of any public employment scheme. Overall 96% of all the individual migrant workers had had no access to any public employment scheme, and 90 % had no access to public housing at either source or destination. An insignificant 1 % of the
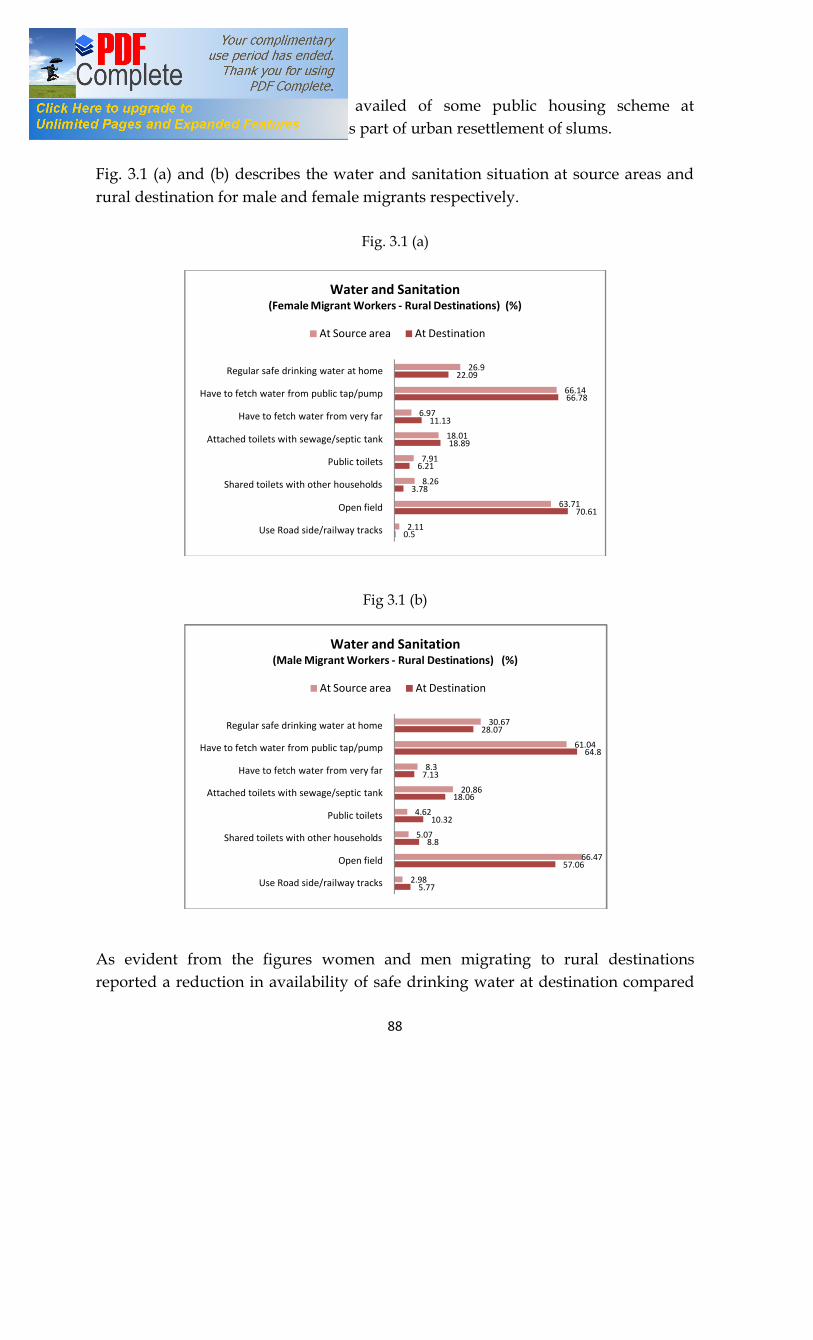
88
women migrants, however, had availed of some public housing scheme at destination, which was essentially as part of urban resettlement of slums. Fig. 3.1 (a) and (b) describes the water and sanitation situation at source areas and rural destination for male and female migrants respectively.
Fig. 3.1 (a)
Fig 3.1 (b)
As evident from the figures women and men migrating to rural destinations reported a reduction in availability of safe drinking water at destination compared
0.5
70.61
3.78
6.21
18.89
11.13
66.78
22.09
2.11
63.71
8.26
7.91
18.01
6.97
66.14
26.9
Use Road side/railway tracks
Open field
Shared toilets with other households
Public toilets
Attached toilets with sewage/septic tank
Have to fetch water from very far
Have to fetch water from public tap/pump …
Regular safe drinking water at home
Water and Sanitation (Female Migrant Workers - Rural Destinations) (%)
At Source area At Destination
5.77
57.06
8.8
10.32
18.06
7.13
64.8
28.07
2.98
66.47
5.07
4.62
20.86
8.3
61.04
30.67
Use Road side/railway tracks
Open field
Shared toilets with other households
Public toilets
Attached toilets with sewage/septic tank
Have to fetch water from very far
Have to fetch water from public tap/pump …
Regular safe drinking water at home
Water and Sanitation (Male Migrant Workers - Rural Destinations) (%)
At Source area At Destination

89
to their source areas. Strikingly, the close to two thirds of both men and women reported having to fetch water from public taps/pumps at both source and destination areas, but the proportion having to fetch water from very far increased significantly at destinations among the women, while among men it decreased slightly. Similarly, the proportion men using open fields as toilets decreased significantly, while among women it increased from 64 % at source areas to 71 % at destinations. The heightened vulnerability in such situations has already been discussed earlier.
Fig. 3.2 (a)
Fig. 3.2 (b)
Fig. 3.2 (a) and (b) describe the nature of access to electricity and cooking fuel for migrants with rural destinations. While among the women, the situation vis-a vis access to electricity in the home appears to slightly improve at destinations, overall
8.03
5.29
11.91
8.98
18.15
47.64
19.36
28.07
52.57
5.98
1.02
3.75
6.57
10.32
72.35
17.76
31.99
50.25
Mixed sources of Fuel
Coal
Gas
Kerosene
Buy firewood/dungcakes
Collect firewood/dung cakes
Electricity in the area but not in residence
No electricity in the area
Electricity at residence
Electricity and Cooking Fuel (Female Migrant Workers - Rural Destinations)
At Source area At Destination
9.79
4.22
17.21
9.09
20.94
41.4
23.48
21.15
55.37
8.16
1.34
6.08
1.63
14.09
69.73
25.85
17.87
56.28
Mixed sources of Fuel
Coal
Gas
Kerosene
Buy firewood/dungcakes
Collect firewood/dung cakes
Electricity in the area but not in residence
No electricity in the area
Electricity at residence
Electricity and Cooking Fuel (Male Migrant Workers - Rural Destinations)
At Source area At Destination

90
there is not much change effected through migration. However, in relation to fuel, access to gas, kerosene, coal seems to distinctly improve at the destinations sites, probably in order to ensure that migrant labour time is not diverted from the needs of employers into the search for firewood or making of dung cakes for fuel.
Fig. 3.3 (a)
Fig.3.3 (b)
Fig. 3.3 (a) and (b) compares the water and sanitation situation of migrant workers at source areas and urban destinations and Fig. 3.4 (a) and (b) do the same for access to electricity and cooking fuel.
2.38
22.72
13.01
13.41
48.48
5.02
41.55
53.43
0.98
50.65
7.56
5.02
35.79
12.8
50.81
36.39
Use Road side/railway tracks
Open field
Shared toilets with other households
Public toilets
Attached toilets with sewage/septic tank
Have to fetch water from very far
Have to fetch water from public tap/pump …
Regular safe drinking water at home
Water and Sanitation (Female Migrant Workers - Urban Destinations)
At Source area At Destination
3.66
22.16
19.62
17.65
36.9
5.32
41.45
53.82
0.37
62.05
2.86
2.95
31.76
4.88
47.84
47.29
Use Road side/railway tracks
Open field
Shared toilets with other households
Public toilets
Attached toilets with sewage/septic tank
Have to fetch water from very far
Have to fetch water from public tap/pump …
Regular safe drinking water at home
Water and Sanitation (Male Migrant Workers - Urban Destinations)
At Source area At Destination
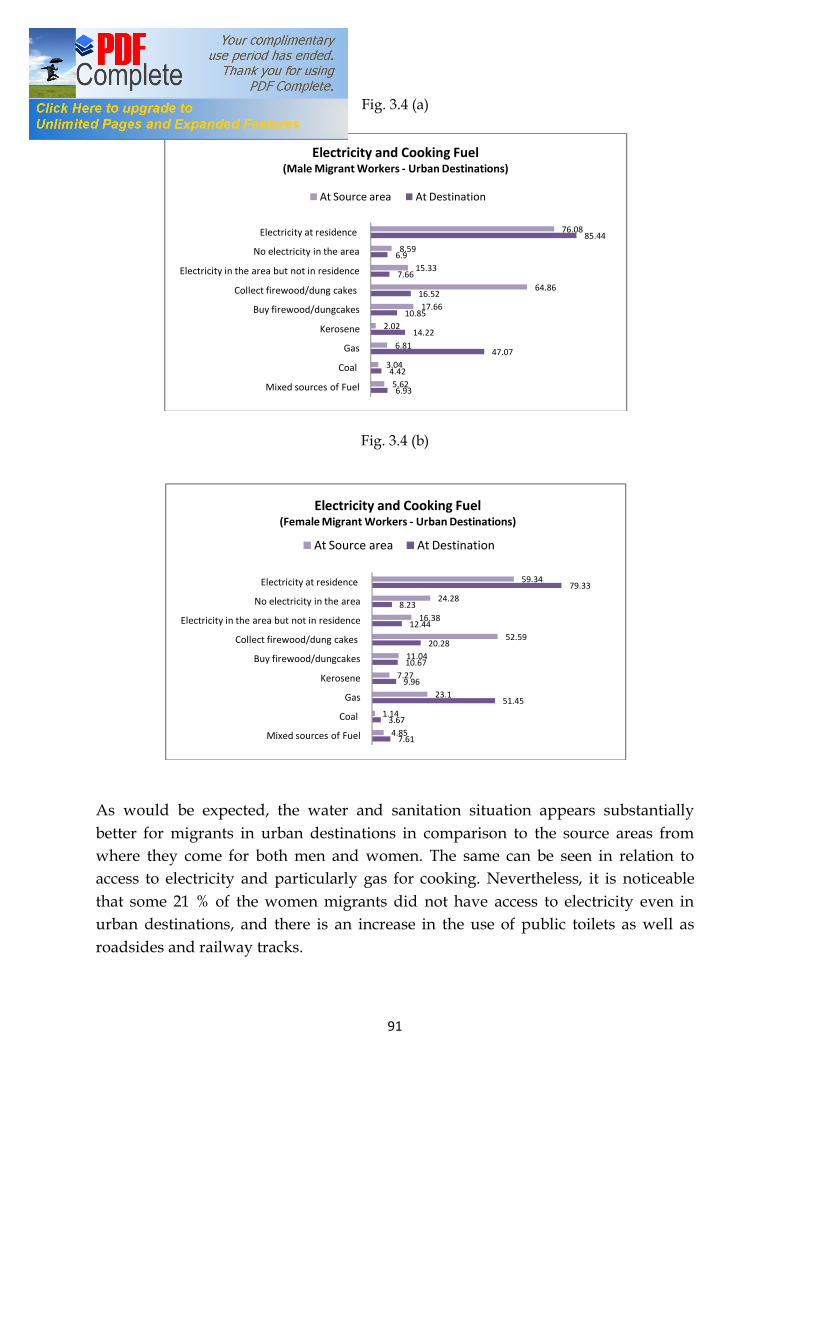
91
Fig. 3.4 (a)
Fig. 3.4 (b)
As would be expected, the water and sanitation situation appears substantially better for migrants in urban destinations in comparison to the source areas from where they come for both men and women. The same can be seen in relation to access to electricity and particularly gas for cooking. Nevertheless, it is noticeable that some 21 % of the women migrants did not have access to electricity even in urban destinations, and there is an increase in the use of public toilets as well as roadsides and railway tracks.
6.93
4.42
47.07
14.22
10.85
16.52
7.66
6.9
85.44
5.62
3.04
6.81
2.02
17.66
64.86
15.33
8.59
76.08
Mixed sources of Fuel
Coal
Gas
Kerosene
Buy firewood/dungcakes
Collect firewood/dung cakes
Electricity in the area but not in residence
No electricity in the area
Electricity at residence
Electricity and Cooking Fuel (Male Migrant Workers - Urban Destinations)
At Source area At Destination
7.61
3.67
51.45
9.96
10.67
20.28
12.44
8.23
79.33
4.85
1.14
23.1
7.27
11.04
52.59
16.38
24.28
59.34
Mixed sources of Fuel
Coal
Gas
Kerosene
Buy firewood/dungcakes
Collect firewood/dung cakes
Electricity in the area but not in residence
No electricity in the area
Electricity at residence
Electricity and Cooking Fuel (Female Migrant Workers - Urban Destinations)
At Source area At Destination
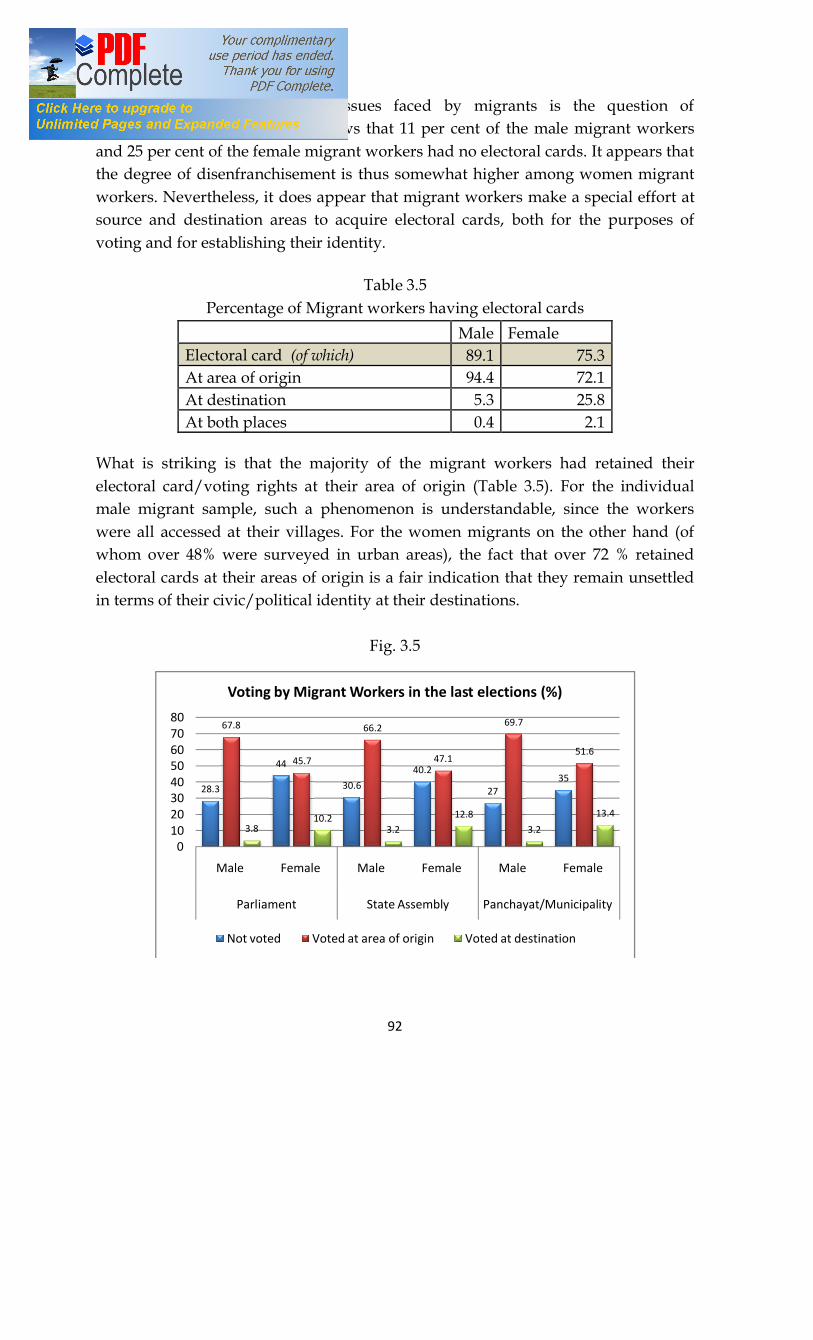
92
Finally, among the important issues faced by migrants is the question of disenfranchisement. Table 3.5 shows that 11 per cent of the male migrant workers and 25 per cent of the female migrant workers had no electoral cards. It appears that the degree of disenfranchisement is thus somewhat higher among women migrant workers. Nevertheless, it does appear that migrant workers make a special effort at source and destination areas to acquire electoral cards, both for the purposes of voting and for establishing their identity.
Table 3.5 Percentage of Migrant workers having electoral cards
Male Female Electoral card (of which) 89.1 75.3 At area of origin 94.4 72.1 At destination 5.3 25.8 At both places 0.4 2.1
What is striking is that the majority of the migrant workers had retained their electoral card/voting rights at their area of origin (Table 3.5). For the individual male migrant sample, such a phenomenon is understandable, since the workers were all accessed at their villages. For the women migrants on the other hand (of whom over 48% were surveyed in urban areas), the fact that over 72 % retained electoral cards at their areas of origin is a fair indication that they remain unsettled in terms of their civic/political identity at their destinations.
Fig. 3.5
28.3
44
30.6
40.2
2735
67.8
45.7
66.2
47.1
69.7
51.6
3.810.2
3.2
12.8
3.2
13.4
01020304050607080
Male Female Male Female Male Female
Parliament State Assembly Panchayat/Municipality
Voting by Migrant Workers in the last elections (%)
Not voted Voted at area of origin Voted at destination
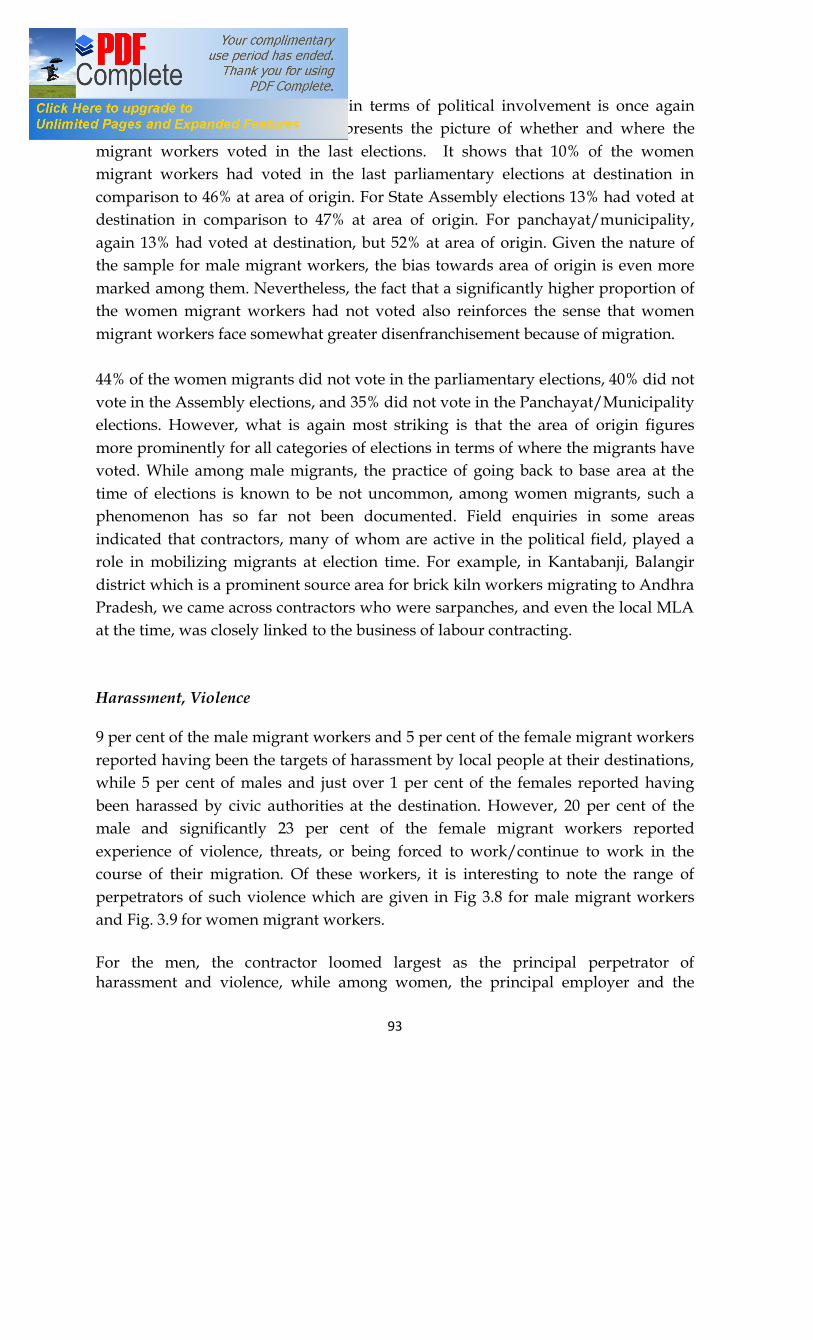
93
The bias towards the source area in terms of political involvement is once again underlined by Figure 3.5, which presents the picture of whether and where the migrant workers voted in the last elections. It shows that 10% of the women migrant workers had voted in the last parliamentary elections at destination in comparison to 46% at area of origin. For State Assembly elections 13% had voted at destination in comparison to 47% at area of origin. For panchayat/municipality, again 13% had voted at destination, but 52% at area of origin. Given the nature of the sample for male migrant workers, the bias towards area of origin is even more marked among them. Nevertheless, the fact that a significantly higher proportion of the women migrant workers had not voted also reinforces the sense that women migrant workers face somewhat greater disenfranchisement because of migration. 44% of the women migrants did not vote in the parliamentary elections, 40% did not vote in the Assembly elections, and 35% did not vote in the Panchayat/Municipality elections. However, what is again most striking is that the area of origin figures more prominently for all categories of elections in terms of where the migrants have voted. While among male migrants, the practice of going back to base area at the time of elections is known to be not uncommon, among women migrants, such a phenomenon has so far not been documented. Field enquiries in some areas indicated that contractors, many of whom are active in the political field, played a role in mobilizing migrants at election time. For example, in Kantabanji, Balangir district which is a prominent source area for brick kiln workers migrating to Andhra Pradesh, we came across contractors who were sarpanches, and even the local MLA at the time, was closely linked to the business of labour contracting. Harassment, Violence 9 per cent of the male migrant workers and 5 per cent of the female migrant workers reported having been the targets of harassment by local people at their destinations, while 5 per cent of males and just over 1 per cent of the females reported having been harassed by civic authorities at the destination. However, 20 per cent of the male and significantly 23 per cent of the female migrant workers reported experience of violence, threats, or being forced to work/continue to work in the course of their migration. Of these workers, it is interesting to note the range of perpetrators of such violence which are given in Fig 3.8 for male migrant workers and Fig. 3.9 for women migrant workers. For the men, the contractor loomed largest as the principal perpetrator of harassment and violence, while among women, the principal employer and the
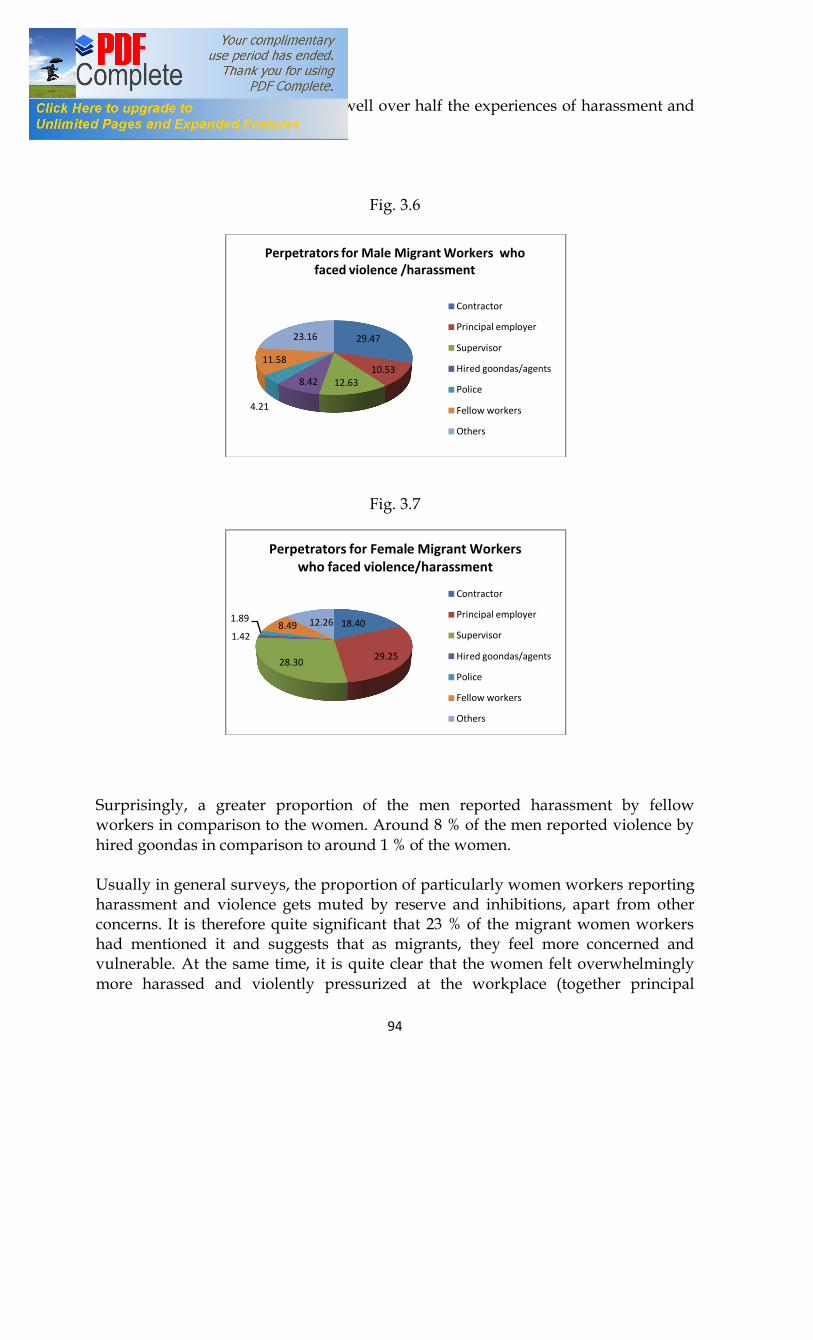
94
supervisor together accounted for well over half the experiences of harassment and violence.
Fig. 3.6
Fig. 3.7
Surprisingly, a greater proportion of the men reported harassment by fellow workers in comparison to the women. Around 8 % of the men reported violence by hired goondas in comparison to around 1 % of the women. Usually in general surveys, the proportion of particularly women workers reporting harassment and violence gets muted by reserve and inhibitions, apart from other concerns. It is therefore quite significant that 23 % of the migrant women workers had mentioned it and suggests that as migrants, they feel more concerned and vulnerable. At the same time, it is quite clear that the women felt overwhelmingly more harassed and violently pressurized at the workplace (together principal
29.47
10.5312.638.42
4.21
11.58
23.16
Perpetrators for Male Migrant Workers who faced violence /harassment
Contractor
Principal employer
Supervisor
Hired goondas/agents
Police
Fellow workers
Others
18.40
29.2528.30
1.42
1.898.49 12.26
Perpetrators for Female Migrant Workers who faced violence/harassment
Contractor
Principal employer
Supervisor
Hired goondas/agents
Police
Fellow workers
Others

95
employers, supervisors, contractors, and co-workers were the perpetrators of violent harassment for well over three fourths of the workers reporting harassment). It suggests that migrant women workers experience a significantly more adverse work environment.
Interestingly, while male migrants appeared to face higher levels of caste/community/religion based discrimination at their areas of origin, women migrants seemed to indicate the reverse. This was particularly marked for rural destinations, where 6.83 % of the women reported such harassment/discrimination in comparison to 5.49% at area of origin. Reports of such discrimination were proportionately less among women migrating to urban destinations, with 3.86% saying that they had faced it in area of origin and 3.94% at destination. No doubt this is a reflection of the greater presence of upper caste women in urban wards migration.
Table 3.6
Experience of harassment/discrimination because of caste/community/religion
Percentage of Migrant Workers who had faced harassment/discrimination because of their caste/community/religion
Place of Harassment/discrimination
Rural Destinations Urban Destinations Male Female Total Male Female Total
At area of origin 3.65 5.49 4.85 2.59 3.86 3.35 In transit 1.77 1.01 1.27 0.60 1.65 1.24 At Destination 1.88 6.83 5.11 1.60 3.94 3.03
Table 3.6 gives the proportions of workers who reported facing harassment ordiscrimination specifically because of their caste, community or religion. In general, less than 5% of the workers reported such harassment/discrimination. This is much lower than would be expected and probably refers to only extreme cases rather than normalised or routine discriminatory practice. Nevertheless, it is striking that among the male workers of caste/community/religion, the majority placed such experience at area of origin. In contrast, the majority of the women migrant workers who reported such experiences placed its location at their destinations – whether rural or urban.
Children of Migrant Workers
Around 66.52% of the individual migrant women workers reported that their minor children also migrated in comparison to just 26.09% of the male migrant workers (Table 3.7). Of those who left their children behind, the majority left them with spouses. Around 72% of the male migrants left their children with their wives while close to 27% of the women migrant workers left their children with their husbands. Yet clearly a higher proportion of
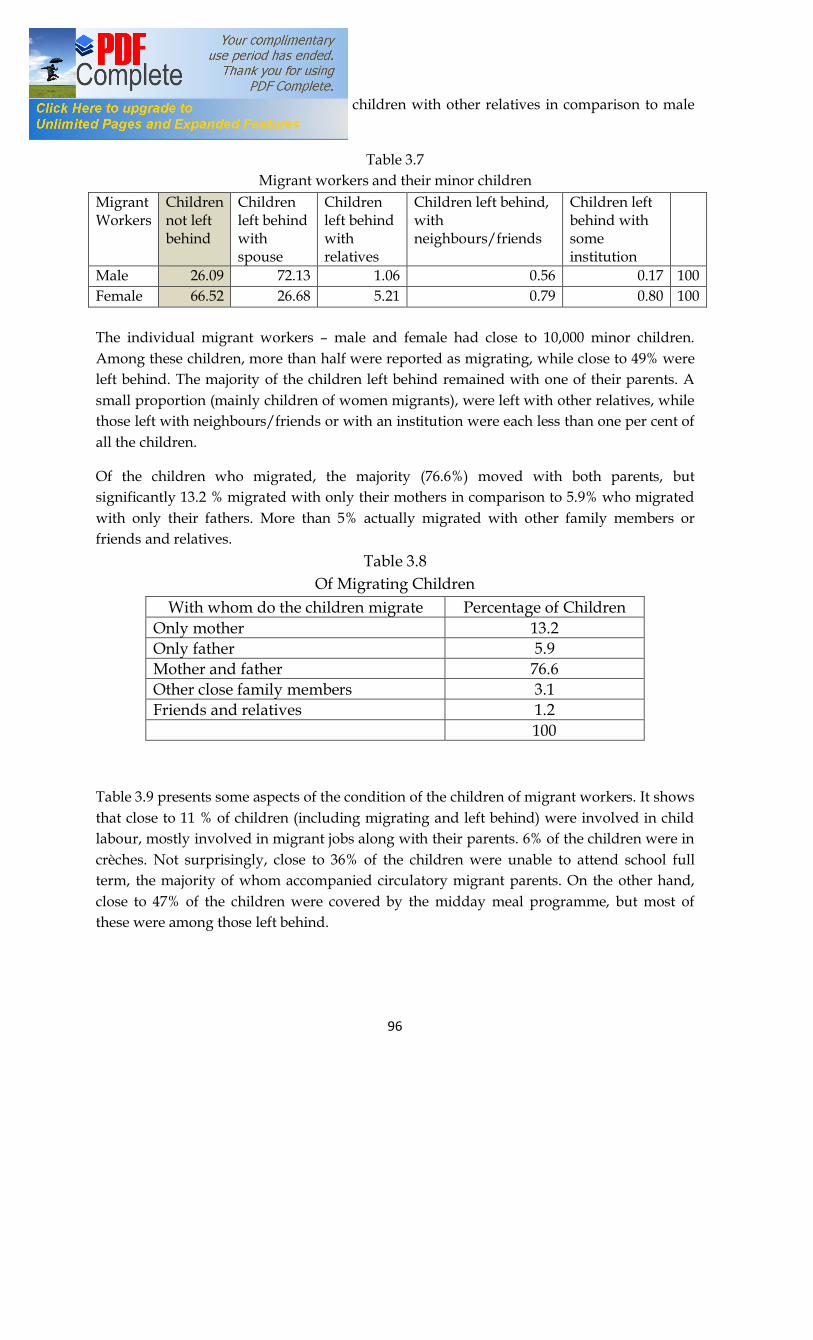
96
the women migrants (5.21%) left their children with other relatives in comparison to male migrant workers (1.06%).
Table 3.7 Migrant workers and their minor children
Migrant Workers
Children not left behind
Children left behind with spouse
Children left behind with relatives
Children left behind, with neighbours/friends
Children left behind with some institution
Male 26.09 72.13 1.06 0.56 0.17 100 Female 66.52 26.68 5.21 0.79 0.80 100 The individual migrant workers – male and female had close to 10,000 minor children. Among these children, more than half were reported as migrating, while close to 49% were left behind. The majority of the children left behind remained with one of their parents. A small proportion (mainly children of women migrants), were left with other relatives, while those left with neighbours/friends or with an institution were each less than one per cent of all the children.
Of the children who migrated, the majority (76.6%) moved with both parents, but significantly 13.2 % migrated with only their mothers in comparison to 5.9% who migrated with only their fathers. More than 5% actually migrated with other family members or friends and relatives.
Table 3.8 Of Migrating Children
Table 3.9 presents some aspects of the condition of the children of migrant workers. It shows that close to 11 % of children (including migrating and left behind) were involved in child labour, mostly involved in migrant jobs along with their parents. 6% of the children were in crèches. Not surprisingly, close to 36% of the children were unable to attend school full term, the majority of whom accompanied circulatory migrant parents. On the other hand, close to 47% of the children were covered by the midday meal programme, but most of these were among those left behind.
With whom do the children migrate Percentage of Children Only mother 13.2 Only father 5.9 Mother and father 76.6 Other close family members 3.1 Friends and relatives 1.2
100
97
Table 3.9 Some aspects of the condition of children of the surveyed Migrant Workers
The profile of the children of migrant workers given above covers all categories of migrant workers and types of migration. Field observations indicate that the worst conditions for children – whether in terms of their involvement in child labour or lack of access to school education and attendant facilities – may be found in families of circulatory migrants of longer duration. The children of Jodi based brick kiln workers and koyta based sugarcane cutters are perhaps among the most deprived – their poor conditions clearly related to their having to migrate with their parents for a major part of the year. For these workers, there is a particular need for institutions for care and education for children. Attempts to provide for such institutions are too few and far between as evident in the fact that less than 1% of the migrant workers left their children in institutions when migrating.
Conditions of children of migrant workers % Unable to attend school full term 35.5 Covered by Midday Meal Programme 46.5 With creche 6.01 Involved in child labour 10.6

98
Part IV
Of Migrant and Non-Migrant Households: Insights from the Village Surveys
The village site surveys provided an opportunity to compare households without migrants with those with migrants that yielded several interesting and some quite unexpected insights. Before these are taken up, we may present a consolidated view of the composition of the villages based on baseline censuses conducted in each village, and a description of nature of the sample households. Baseline Profile of the Village Sites Of the 16,104 households covered by the preliminary census in 43 villages, 44 per cent had no economic migrants and 56 per cent reported economic migration by household members.74 While the majority of the households with economic migrants had out-migrants, a little over 5 per cent of all the village households had economic in-migrants. The proportions of households with migrants is likely to be higher than the national average since the village sites themselves were selected on the basis of some idea of catchment areas for migrant workers. Nevertheless, since the census questionnaire included a range of short term migration within its ambit, it would appear that the significance of migration to rural household economies is considerably more than is suggested by the macro-data on household migration.
Table 4.1 Village Census Distribution of All Households in 43 villages (%)
Religion Percentage Relative
Economic Status
Percentage Caste Categories
Percentage
Hindu 78.23 Upper 6.60 Upper/General 19.87 Muslim 15.04 Middle 28.95 OBC 38.80 Christian 2.76 Poor 47.60 MBC 6.31 Sikhs, Buddhist and Others
3.97 Poorest 16.86
SC 22.15 100.00 100.00 ST 12.87
74 Households with migrants included those with members away from the village as well as
those present but who periodically migrated..

99
Table 4.2 Village Census Distribution of All Households in 43 villages
by Caste Category and Economic Status (%) Caste Categories
Upper Caste/General
OBC MBC SC ST Total
Relative Economic Status Upper 13.7 8.7 3.0 1.3 0.7 6.6 Middle 43.2 34.5 26.1 13.5 17.8 29.0 Poor 35.2 46.5 54.6 55.1 53.5 47.6 Poorest 7.9 10.3 16.3 30.2 28.0 16.8 Total 100 100 100 100 100 100.0
Table 4.3
Village Census - Proportions of Households with Economic Migrants in various categories of Households
Religion Proportions of
Households with
Economic Migrants
(%)
Relative Economic
Status
Proportions of
Households with
Economic Migrants
(%)
Caste Categories
Proportions of
Households with
Economic Migrants
(%) Hindu 54. 67 Upper 64.29 Upper
Caste/General 51.24
Muslim 63.08 Middle 55.36 OBC 51.11 Christian 79.82 Poor 57.45 MBC 70.07 Sikhs, Buddhist and Others
43.76 Poorest 52.83
SC 56.94 ST 71.11
Table 4.4 Village Census - Distribution of Households with Economic Migrants
by Caste Category and Economic Status (%) Upper
Caste/General OBC MBC SC ST All
Households with Economic Migrants
Upper 16.1 11.0 3.4 1.5 0.6 7.50 Middle 43.1 36.9 27.7 13.8 12.9 28.36 Poor 34.3 45.0 54.7 56.8 57.1 48.39 Poorest 6.5 7.0 14.1 27.9 29.5 15.75 Total 100 100 100 100 100 100
100
At a preliminary level the village censuses indicate that, higher proportions of Christian and Muslim households send migrants in comparison to Hindu households and surprisingly fewer proportions of Sikh, Buddhist and other religions households send/receive economic migrants. Going by economic status, higher proportions of households in the uppermost category send/receive economic migrants in comparison to other economic status groups, although the majority of households in all economic status groups send out migrants. Yet clearly larger proportions of ST, MBC and SC households send out migrants in comparison to upper caste/general and OBC households. The detailed questionnaires covered a sample of 3,237 households from the village sites, of which 673 were of households without any economic migrants. The nature of these sample households by caste category (which was the primary axis of selection) are given below along with religion (which was not a basis of selection, although no religion – represented in any given village - was allowed to be excluded).
Table 4.5
Nature of Village Households Sample (%)
Caste Category
Households with Migrants
Households without Migrants
All House-holds
Religion Households with Migrants
Households without Migrants
All House-holds
Upper Caste/General 16.66 14.40 16.05
Hindu 82.04 81.51 81.89
OBC 30.75 42.39 33.91 Muslim 11.93 7.88 10.83
MBC 6.80 3.75 5.97 Sikh 2.55 6.51 3.62
SC 25.90 28.57 26.63 Christian 3.44 3.77 3.53
ST 19.89 10.89 17.45 Others 0.04 0.34 0.12
Total 100 100 100 Total 100 100 100 Comparison of Households with and without Migrants at village sites Most studies have indicated that incomes of migrants is higher than of non-migrants and indeed Table 3.6 would indicate that if the remittance component of the households with migrants were not coming in, the annual incomes of the households with migrants would get reduced by more than one third.
Table 4.6 Average incomes by components for Households
with and without Migrants (Village Sites) ( `)
Components of Household Income (Annual) Households with Migrants (Rs)
Households without Migrants (Rs)
101
Income from cultivation 5,263 13,120 Casual labour 12,235 18,633 Business 2,321 6,344 Regular Wages/ Salaries 7,438 14,404 Rent 111 787 Remittance from migrants 16,001 0 Other 1,153 8,475 Total Annual income (sum of components) 44,522 61,763
Nevertheless, our survey indicates that the average annual income of households without migrants is considerably higher than the households with migrants, even after including remittances. The average incomes of households without migrants, exceeds that of households with migrants in every single source of income except remittances. Income from regular salaries in non-migrant households are twice that of households with migrants, business thrice, rents more than 7 times and similarly for other sources. On average, cultivation also provides a higher average income to households without migrants.
Table 4.7 Social organization of Households with and without Migrants (Village Sites) (%)
Nature of the Household of current residence
Households with Migrants
Households without Migrants
Independent Nuclear family 58.37 61.28 Nuclear family unit sharing common roof 3.66 6.27 Extended nuclear family 14.66 11.58 Joint family 15.23 13.87 Single woman and all female including with minor children
2.25 4.46
Single man and all male and male with minor children
2.74 0.72
Mixed male and female living away from family
1.50 0.00
Others 1.59 1.81 100 100 In investigating the social organization of households with and without migrants, unexpectedly, as Table 3.7 indicates, the proportions of nuclear family households were found to be slightly higher among non-migrant households, while extended nuclear families and joint families have a slightly higher share among households with migrants. Single women or all female households are also of lower proportions among households with migrants (almost half), suggesting that there are more severe constraints on autonomous migration by women from village India. Single man and all male households obviously have a larger proclivity to migrate. What is particularly striking is the overwhelming domination of independent nuclear families among both households with and without migrants, quite contrary to the

102
accepted wisdom about Indian families. Even if what we have termed as extended nuclear family, i.e, with one parent attached to the core nuclear unit is included in joint families as is the norm among sociologists, joint families would still be a minority – just 25 per cent among households without migrants and close to 30% among households with migrants. The larger share of joint families in households with migrants indicates that there is more than tradition involved in the organization and indeed reorganization of family units in contemporary India.
103
A Concluding Note: Summary of key findings This Report presents a sketch of the key findings Gender and Migration project at the CWDS.75 Some contextual issues, questions, and questioning that emerge from the macro-surveys by NSS have also been touched upon. The centerpiece of the report is the laying out of new primary level data that was generated by the meso-level survey conducted by the CWDS as part of the project. We believe that the key findings of the project will be a useful resource for bringing the neglected dimensions of gender into the debates on migration in India. Gendering Labour Migration in the Macro-data The report engages with several gender insensitive methodological issues and assumptions in the macro-data as well as development discourses that have together resulted in a collective inability to have an accurate view of the patterns of women’s employment and work based migration, let alone the developments influencing and shaping them. Such inability has led to the general practice of using only male migration as the indicator in development oriented analysis of migration and a complete evasion of gendered analysis. In this Report, an attempt has been made to concretely draw out the hitherto poorly delineated structure of female labour migration in India based on the macro-data provided by the latest NSS survey on Migration in India for 2007-08. While the NSSO’s introduction of a separate category of employment oriented short term migrants in this particular survey, has played a critical role in making this possible, our identification of labour migrants includes both short term migrants and others identified as labour migrants from among the more longstanding category of migrants defined as those who have changed their usual place of residence (UPR). In locating labour migrants in the UPR data, we have a) maintained a separate focus on paid workers in contrast to the general
practice of lumping paid and unpaid workers together in the employment/workforce statistics which has persistently given us a skewed picture of women’s employment and economic status, and
b) included all migrant workers (paid) who had given ‘family movement’, ‘education’ and ‘other reasons’ as their reason for migrating within the category of labour migrants along with those directly giving employment as their reason for migration.
75 The support of the IDRC that made this project possible is gratefully acknowledged.
104
Unfortunately the nature of the NSS data is such that labour migrants could not be separated out from within the overwhelmingly large category of women who had given marriage as their reason for migration, although we presume that some labour migration is indeed camouflaged as marriage migration. Still, among marriage migrants, the majority of those who are workers would be so largely in their immobile and local capacity as wives/daughters in law of the village they married into and their inclusion would give a greatly distorted picture of female labour mobility. As such marriage migrants had to be excluded from the construction of the picture of labour migration. The estimated total number of labour migrants so identified, were 66.6 million in 2007-08, of which 15% (9.6 million) were female, although it is clear that the figure for women still remains an underestimate. Nevertheless, on the basis of the above method, this Report presents for the first time, what we believe is an accurate macro-picture of the sectoral composition of female labour migration. It shows that in 2007-08, agriculture accounted for 34.3% of the female migrant workforce, industry for 30.8%, and services for 34.8%. The relatively higher share of agriculture differentiates the pattern of female labour migration from that of males, among whom services accounted for 43.6%, industry for 40.8% and agriculture for just 15.6%. Equally significant is the finding that labour migration is most heavily biased towards males in services and industry (less so in agriculture). In other words, the migration pattern is actually enhancing the overwhelming male bias in the labour market for industry and services. These findings have to be viewed within the most worrying context of a declining female work participation rate amidst volatility in employment, agrarian crisis, and an absolute fall in the numbers of women in the workforce by over 21 million between 2004-05 and 2009-10. Types of Migration
At a general level, the findings of these primary surveys indicate the predominance of the temporary in contemporary economic/labour migration, including medium term and circular migration. The use of a socially grounded typology of labour migration delineating sub-categories of temporary migration, showed the temporary to be far more significant in internal migration in India, than is indicated in the macro-data for both men and women. The typology included circulatory migration (longer durations exceeding four months and shorter durations of less than four months in each spell), short term seasonal migration (distinguished from circular both in terms of duration as well as in spending the major part of the working year in their village/place of origin), irregular short term migration (i.e., outside any established pattern or occupation and driven by abnormal
105
contingencies/desperation), medium term migration (i.e., for a broadly fixed period of up to a few years in any particular industry/occupation), long distance commuting (across distances outside the perimeter of normal movement for work around any village or within any town/city) and migration for family care (for unpaid care work separated from marriage migration with unspecified purposes), along with long term migration (i.e., for settlement at destination). This typology, when applied across 4,885 households with migrants netted types of migration for a total of 16,156 household members who were economic/labour migrants, of which 7,398 were female and 8,758 were male when both village sites and sector sites were combined. The findings in relation to types of migration were as follows:
• Strikingly, only 42% of the women migrants and 36% of the males were long term migrants or in other words, 58% of female labour migration and even more of male labour migration appears to be of a temporary nature.76 (In contrast, the picture that emerges from the NSS (2007-08) indicates temporary migration definitively for only one third of all labour migration in India, and perhaps a little more if return migrants are also added).77
• 20% of the migrating women and 23% of the migrating men were circular migrants, 9% were short term seasonal migrants for both males and females. 2% of the female and 3% of the male migrants were irregular short term migrants. Since all of the above are forms of short term migration, when taken together, the CWDS surveys suggest that the share of short term migration at around one third of labour migration is far greater than accounted for by the NSS.
• When only village sites constituted the universe, i.e., after excluding pre-selected female migrant intensive sectors, the share of short term migration was much higher at 41% among women migrants and 53% among male migrants, which highlights the reality of large scale migration from village
76 It may be borne in mind, that while for women labour migrants, the combination of sector and village sites gives us a better picture of migratory patterns, such a combination does not provide a full picture since in the sector sites the male members were only of households of women migrant workers. 77 In NSS’s 2007-08 survey, short term migrants constituted some 21 per cent of male labour migration and 22 per cent of female labour migration (see Table1 in this paper). Further, some 10 per cent of all UPR based female migrants and 7 per cent of male migrants reported that their migration was temporary. An acceleration in return migration is also observable between 1993 and 2007-08 from 12.2 to 16.1 per cent in the case of male migrants and from 4.4 to 10.6 per cent in the case of female migrants. Although the UPR figures here include workers and non-workers and paid and unpaid workers, the somewhat common trend between men and women in temporary and return migration does indicate a link to the employment pattern.
106
India beyond just the urbanization paradigm and indeed a degree of pullback that is rarely touched upon in migration theories.78
• 6% of the women and 7% of the men were long distance commuters, 4% of the women migrants and 2% of the men were migrants for family care.
• Medium term migration accounted for 16% of the women migrants and 18% among the men. It is interesting that when village sites alone constituted the universe, the proportions of medium term migrants dropped sharply to 9% for women, but increased to 21% for men. It appears then that the points of origin among women migrant workers of medium term, particularly in urban areas, are more thinly dispersed across both rural and urban areas, and/or they are drawn/recruited from particular catchment pockets, rather than the more generalized kind of medium term movement from village India that appears to be so significant in the pattern of male migration. Our sense from the field work was that the significance of medium term migration is increasing at the cost of long term migration for work, more so among male migrants, but also among female migrant workers in urban areas.
These findings arguably posit the need for re-orientation away from the present conceptual dominance of a permanent settlement paradigm in the official macro-surveys and greater recognition of different types of temporary migration in the concepts and definitions adopted. In our view, the macro-level underestimation of short term and circular labour migration is a significant factor in the longstanding failure to identify key macro-features of particularly women’s labour migration in India that has so restricted analysis of its developmental implications. Similarly, without distinctions between medium term and long term migration, the temporary nature of the employment regime that is driving much of migration in contemporary times and its developmental implications remain hidden from view in the macro-data.
Gendered patterns of Labour Migration
Extensive field work and the combined use of separate household and individual migrant questionnaires/schedules by the surveys facilitated the eliciting of facets of social background as well as individual experience that we believe went a long way in enabling identification of gendered patterns of female labour migration. Some broad observations based primarily on analysis of the consolidated data generated
78 We would contend that the CWDS village surveys present a more accurate picture for male migratory patterns than the combined village and sector sites (of course specifically in relation to migration from rural areas).
107
by the household and individual questionnaires supplemented by field observations are outlined below:
Ø Types of migration are closely correlated with sectors and occupations - generally differentiated however along the fault lines of entrenched social hierarchies based on caste and community.
Ø Greater levels of medium term and long term migration among women workers from upper caste communities have accompanied relatively greater levels of diversification of their employment into various types of services, particularly in urban areas. 75% of women migrants of upper caste origin were long term and medium term migrants.
Ø At the other extreme, migrant women workers from the historically and
socially disadvantaged communities of scheduled tribes and castes are more concentrated in short term and particularly circular migration – generally involving hard manual labour and more degraded working conditions. 59% of women migrants from ST backgrounds and 41% of SC background were short term and circulatory migrants in comparison to just 18% of migrant women workers of upper caste origin.
Ø 39% of women migrants from OBC backgrounds were also short term and
circulatory migrants, although the majority (65%) were long term and medium term migrants in comparison to 43% of SC and 32% of ST women in these latter categories.
Ø In contrast to such a general caste differentiated picture, a distinctive
movement towards concentration of women migrants in paid domestic work, particularly through rural-to-urban migration cut across all caste/tribe/community lines. The composition of women migrants in textile based factory production also appeared to have no caste specific bias. 79
In general, occupational shifts effected through migration showed a process of concentration of women in a relatively narrow band of occupations and less of diversification.80 After migration, 40% of the women workers were in more
79 The proportions for caste in types of migration given here are drawn from the universe of women migrants (numbering 7,398) drawn from the household questionnaire. 80The universe for tracking occupational shifts and concentrations is the set of individual migrant questionnaire (female respondents numbering 3,073).

108
diversified industry and services in comparison to 51% of the male migrant workers.81
Ø In rural areas, occupational shifts through migration by women appear to be concentrating in circular migration for brick-making (bhatta workers) across the length and breadth of the country, even though agriculture is the most prominent destination for rural women migrants. Bhatta workers who constituted 8.7% in the pre-migration profile of individual women migrants with rural destinations increased to 21.1% post migration, while agriculture, including seasonal agricultural labourers, plantation workers and cultivating peasants, which accounted for 33.4% of rural female migrant workers after migration, had a larger share of the pre-migration profile of these rural migrants (48.3%).
Ø Nevertheless, it is also true that agriculture has seen increases in demand for female migrants in some areas for crops such as BT cotton and BT cotton seed production and one of the most concentrated form of female labour migration in rural areas is for sugarcane cutting in western and southern India (but not in the sugarcane belt of UP in the north).82 However, it also appears that the conditions in local agriculture, pushes a section of the agricultural workforce to migrate for non-agricultural employment in rural areas.
Ø Significantly, both the two concentrated streams of rural female migration,
i.e., for cane cutting and brick manufacture both involve circular migration and onsite work/residence for a major part of the year. The laboring units in brick-making and cane cutting (where female labour is involved) largely comprises of male female pairs (jodis) or family units and generally a cycle of advances and debt-based tying of such labour. Jodi based wage labour combined with piece rated payment, leaves no scope for independent work/activity and income for women. Women’s individual entitlements in
81 Diversified employment here excludes agriculture, construction, paid domestic work and brick manufacture, where concentration in low quality work/employment rather than diversification into better forms of employment would be a more appropriate description. 82 Such migration for sugarcane cutting is of a more longstanding nature and has been well documented in several studies for Maharashtra and Gujarat (Teerink, Breman, etc.). Less well known is the operation of similar migration for sugarcane in Karnataka and Tamilnadu, drawing on catchment areas within these states as well that were covered by the CWDS surveys. Documentation of adolescent girls’ migration for BT cotton seed farms in Gujarat from the tribal communities in the Dungarpur/Udaipur regions of Rajasthan by CLRI helped us identify some areas for field surveys. A comprehensive set of studies of child migration for cotton seed production covering Andhra Pradesh, Karnataka and Gujarat have also focused on BT cottonseed. In addition, our own field work showed women migrating from Godhra and Dahod to the Saurashtra region of Gujarat for BT cotton farms as well as from Rajasthan to parts of Punjab.
109
such forms of labour have not even been conceptually recognized in the labour law regime. It was striking that 42% of the rural women migrant workers were involved in such pair, family or adhoc group based employment.
Ø The nature of annual circulation in both the above segments of migrant labour, its predominantly debt bonded nature, the degraded and harsh conditions of work, the disruption of children’s education and the semi-feudal and patriarchal jodi system – all predicate that while survival may be ensured by such a form of migration, possibilities of social advance are simultaneously limited. Brick-making, although no longer artisanal in nature, is distributed across unorganized manufactories with mainly unincorporated individual or partnership based owners/employers. On the other hand, Jodi based cane cutters are, recruited not by the individual farmers on whose fields they labour, but by modern organized sector sugar mills, often having corporate style management systems. Yet, typically in both segments, workers continue to be recruited through a variety of unregulated labour contractors. The Inter-state Migrant Workmen’s Act, 1979, (the only labour law that specifically addresses migrant workers), outlines some worker entitlements in precisely such contractor driven modes of migration (although only for those who cross state boundaries). It has remained the most ineffectual of all labour laws as has repeatedly been pointed out (2nd Labour Commission, 2002, NCEUS, 2007).
Ø In urban areas, close to one third of the migrant women workers (31%)
were either unemployed or engaged in only family domestic duties before migration (in comparison to 15% of rural women migrants). Apparently they were able to effect entry into employment through urban wards migration. Interestingly, only a small proportion of the urban women migrants had a pre-migration background in agricultural work (13%) and many were in service sector or other diverse jobs even before migration (20% were in paid domestic work and 30% in diversified services before migration). The relatively high proportions of both the non-employed and those in service sector employment before migration correlates with the majority of the urban migrant workers being from upper caste and OBC backgrounds (together 54%) in contrast to the rural migrants, where women from SC and ST backgrounds were the majority (together 62%). Thus, women’s urban-wards labour
110
migration is hardly a primary force leading the shift of women workers out of agriculture.83
Ø Some diversification and expansion of occupations was nonetheless
clearly visible among urban migrants. New occupations such as sales workers, beauticians, hair dressers, call centre workers that were targeted by the surveys, were singularly absent in the pre-migration profiles of these urban women workers, but not insignificant in their post migration profile.
Ø However, the process of concentration in paid domestic work (whose
proportions almost trebled from around 10% before migration to 28% post migration) was the most gender distinctive feature of urban wards labour migration by women.
Ø A little over half of the women migrant workers (rural and urban combined) identified poverty, debt, decline in income, lack of local employment or loss of such employment as their reason for migration. The majority however (62%), bore their migration costs out of household savings. Women migrated more with family members (43%) while men migrated more alone (43%). Nevertheless, it is significant that close to a quarter of the women (23%) reported having migrated alone and 7% in all female groups, although this is substantially less than the 43% of the men who migrated alone and the 19% who had gone in all male groups. Further, while 25% of the rural and 6% of the urban women migrants were dependent/mobilized by contractors, 81% of the urban and 63% of the rural women migrants said they migrated independently - whether with families or alone.
Ø In general, a larger proportion of women migrant workers tended to be young in comparison to male migrant workers, and older workers were found to be in greater proportions in migration to rural destinations in comparison to urban destinations for both men and women. 72% of the female migrant workers with urban destinations were below 36 years of age in comparison to 63% of the male migrants to urban areas. Similarly 61% of the female migrant workers with rural destinations were below 36 in comparison to 56% of rural male migrants. Most striking was the higher proportion of women migrant workers in the age group 15-25. 34% of the
83
111
urban female migrant workers were in the 15-25 age group in comparison to 22% of the urban male migrant workers and on a slightly lower scale of difference, 24% of the women with rural destinations were in this age group in comparison to 19% of the rural male migrant workers. The above 45 age group accounted for 14% of the women migrant workers in rural areas in comparison to 9% in urban, and similarly for 17% of the male migrant workers in rural areas in comparison to 11% in urban.
Ø While 5% of the female migrant workers and 9% of the male migrants
reported having been targets of harassment by local people at destinations, 23% of the women and 20 % of the men had experienced violence, threats and being forced to work in the course of migration. Interestingly, among male migrants, contractors were identified as the most common perpetrator, while more than half the women who had faced such harassment/violence identified the principal employer and the supervisor as the perpetrators.
Ø While most women migrant workers migrated with their minor children
(67%), only around a quarter of the male migrants ( 26%) of the male migrant workers took their minor children with them.
Nature and Conditions of Work s among Women Migrant Workers
78% of rural and 59% of urban women migrant workers were working as unskilled manual labour; 16% and 18% were in skilled manual work in rural and urban areas respectively. 6% of the rural and 23% of the urban women migrants were in a combination of clerical, supervisory, managerial jobs, or work requiring high professional/educational skills (highly skilled). 10% of the urban women migrants were in the last category of the highly skilled in comparison to just 1% of the rural women migrants. This being the composition of the 3,073 individual women migrant workers covered by the surveys, the changes effected by migration in their status of employment and the conditions of work and wages at destination were as follows:
Ø Casual labour in the private sector was the most prominent form of pre migration employment among rural women migrants (41%), whose share also increased post migration (44%); but it was the share of contract labour that showed the most significant increase from pre to post migration rising from 13% before migration to 26% after. Of rural female labour migration (i.e., after migration), 70% was for casual and contract work. Own account
112
self employment, home-based piece rated work and unpaid helpers in production/sales all declined with migration to rural destinations, as also casual and regular work in public sector and casual labour for hire at labour mandis.
Ø An even sharper decline in the share of own account self employment, home-workers and unpaid helpers appeared with women’s migration to urban areas, along with a small decline in casual and regular work in public sector. Among urban migrant women workers, the share of regular employment for private employers showed the most striking and maximum increase post migration (almost doubling from 21% before migration to reach 41% after), although the insecure nature of much of this ‘regular’ employment was evident with 85% of the surveyed urban women migrants reporting they had no maternity leave and 80% had no medical leave. The share of contract labour in public and private sectors and casual work for hire at labour mandis all increased post migration to urban areas.
Ø Across the board, the overwhelming majority of the workers – more than 93% in the case of rural women migrants and more than 84% in the case of urban had no provident fund and no health insurance. The worst situation was however, in relation to daycare/crèche facilities, to which only 3.4% of the rural women migrants and 4.4% of the urban had any access at all.
Ø In rural destinations, the majority of women workers (68%) worked for 8 hours and below per day, but in peak season the majority (68%) worked well over 8 hours with 41% working above 10 hours of which around half (20%) worked over 12 hours a day. In urban destinations, 78% worked 8 hours and below in normal periods, but this dropped to 57% in peak seasons, with 21% working up to 10 hours, 15% from 10 to 12 hours, and 6% above 12 hours.
Ø Own home as location or site of women’s work saw the maximum decline
after migration from 25% pre-migration to 8% post (rural + urban). The proportions of women workers working out in the open also declined but not substantially from 52% pre-migration to 46% post migration. The share of factories/workshops/work-sheds increased from 4% pre-migration to 11% post, and shops and offices from 3% to 11%, but mobile locations remained roughly the same before and after migration (2%).
Modes of Payment and Wages
113
Ø Around 20% of both rural and urban women migrants were on daily wages. The average daily wage/income for these women migrants in rural areas was Rs 136, and in urban areas, it was Rs 141. Prominent among women migrants with rural destinations who were daily wage/income earners were agricultural workers (47%), brick kiln workers (28%)84 and manufacturing workers (8%). In urban areas, construction accounted for 67% of daily wagers, vendors/petty traders for 9% and manufacturing for 7%.
Ø In rural areas, 22% of the women migrant workers had monthly payment of wages - of an average amount of Rs. 4,778. In urban areas, 64% of the women migrants received wages on a monthly basis - of an average amount of Rs 6,729. Of the women migrants in rural areas, 29% received payment at the end of contracted work periods (mostly brick kiln and agricultural workers).85 Only 4% of the urban women migrants were so paid.
Ø Time rated wage payment systems accounted for a little over half of the rural women migrants (52%), but more than three quarters (78%) of the urban. Piece rates were thus more prominent among rural migrants (48%) in comparison to urban (22%). 57% of the rural and 41% of the urban women migrant workers had no weekly off day.
Ø Cash payments dominated rural and urban areas, with 90% of the rural and 98% of the urban women migrants being paid only in cash, the remaining receiving wages in cash and kind combined. 32% of the rural and 45 % of the urban women migrants were paid at minimum wage rates, and only 5% of the rural and 11% of the urban received wages above the statutory minimum. 64% of the rural and 44% of the urban women migrants received either below the minimum wage or didn’t know about minimum wages.
Ø The individual migrant data revealed a gendered pattern of relatively greater proportions of migrant women daily wagers being located in the lowest wage categories in comparison to male migrant workers. Its reverse at the highest daily wage categories held true for rural migrants, but not
84 In brick kilns, while moulders (patheras) involved in family labour based output, generally received their payments at the end of the contract period, beldars and nikasis (those who carry bricks to and from the kiln), for both of whom output and wage calculations were individual based (even if recruited in pairs), were sometimes given daily wages. 85 Contract periods varied from a few weeks to six to eight months and for the longer periods, some interim maintenance was paid for some but not all, which was then deducted from the final payment. Of course workers also complained of instances of short-changing and non-payment of what they considered their full dues at the end of the contract period.

114
for urban migrants. Among daily wager rural migrants – 13% of the women earned less than Rs 100 in comparison to just 3% of the men, while 23% of the men earned Rs 250 and above in comparison to a mere 0.2% of the women. The same pattern was visible among weekly earners in both rural and urban areas. However, among urban daily wagers, while 17% of the women migrants were earning less than Rs 100 in comparison to just 2% of the men, only 2% of the urban daily wager migrants – men and women - received wages/incomes of Rs 250 and above. 28% of the rural women migrants were paid on a weekly basis in comparison to 13% of the urban.
Ø Among migrants with monthly payments, such a gendered pattern of concentration at the low end was not so marked in rural destinations. In urban areas, however, gender disparity at the lower end was very prominent with 60% of the migrant women workers having monthly earnings of less than Rs 5,000 in comparison to 7% of the migrant men with monthly payments. In urban destinations, 57 % of the male migrants with monthly payments earned between Rs 5,000 to below Rs 10,000 in comparison to just 13% of women migrants with monthly payment of wages. In the category of monthly earners of above Rs 15,000 there was little gender disparity, although in the sample, the highest urban male monthly wage was Rs 50,000 in comparison to the highest urban female monthly wage of Rs 25,000.
Of Remittances and Civic Amenities
The individual migrant worker questionnaires were particularly useful in eliciting information from respondents on remittances, civic amenities at source and destination areas, and exercise of voting rights that would have been impossible to gain from only a household questionnaire. On these questions, the findings were as follows:
Ø 32% of the women migrants with rural destinations, and 33% of those with urban destinations sent or brought no remittances to their source areas. At the other extreme 9% with rural destinations and 11% with urban destinations remitted their entire incomes. Overall around 68% of them sent/brought remittances to their source area from rural and urban destinations, the majority of whom carried the money/goods themselves.
115
Ø At their destinations, 76% of all the women migrant workers (rural + urban) did not have any ration card, 16% had BPL cards, less than half a percent had Antyodaya cards and 7% had APL cards. In comparison in their source areas, 34% of these migrants had no ration cards, 40% had BPL cards, 6% had antyodaya cards and 20% had APL cards. Loss of PDS entitlements through migration was thus quite widespread. 91% of the women migrant workers had never availed of any public housing scheme, 79% had no NREGA job cards, and 96% had never been employed under any public employment programme or scheme.
Ø However, 75% of all the women migrant workers did have electoral cards,
but again the majority of them (almost three quarters) had their voting rights at area of origin and only around 28% of those with electoral cards had voting rights at destination areas. 10% of the women migrants had voted in the last parliamentary elections at destination in comparison to 46% at area of origin. For State Assembly elections 13% had voted at destination in comparison to 47% at area of origin. For panchayat/municipality, again 13% had voted at destination, but 52% at area of origin.
Ø Among women migrant workers with rural destinations, access to regular
safe drinking water at residence declined from 27% at source area to 22% at destination. Those having to fetch water from ‘very far’ increased from 7% at source to 11% at destination. The majority (66-67%) had of course to fetch water from public taps/pumps in both source and destination areas. While access to public toilets declined marginally from 8% at source area to 6% at destination, and use of shared toilets (with other households) from 8% to 4%, the proportion of those who had to use the open field increased from 64% to 71%.86 Attached toilets with sewage/septic tank remained between 18-19% at both source and rural destination areas. Access to electricity at residence increased only marginally from 50% at source area to 53% at destination, although for cooking fuel the use of kerosene, gas, coal, etc increased from 11% to 26%. Nevertheless, at destination 48% of the rural women migrants were collecting firewood/dung cakes – much less than the 72% at source area - although some had shifted to buying firewood/dung cakes with migration. Those buying firewood/dung cakes increased from 10% at source area to 18% at rural destination.
86 The risks of using open fields by rural migrants, whose onsite residences are often far from populated settlements, was brought home during the survey, when it was found that two of the women who had migrated to Junagadh, Gujarat from Nandurbar, Maharashtra for cane cutting were killed by tigers.
116
Ø In contrast to rural destinations, among the women migrants with urban
destinations, access to regular safe drinking water at residence increased from 36% at source area to 53% at destination and having to fetch water from public taps/pumps dropped from 48% at source to 41% at destination. The share of those having to fetch water from very far remained virtually the same at both source and destination (4-5%). Use of public toilets increased substantially from 3% at source to 18% at destination as did the use of shared toilets (with other households) from 3% to 20%. The increase in access to attached toilets with sewage/septic tank from 32% at source to 37% at destination was however, of a lesser order. The above increases mirrored the sharp decline in the use of open fields from 62% at source areas to 22% at destination, although the use of road sides/railway tracks increased marginally from less than half a percent at source to 4% at destination. Access to electricity at residence increased from 76% at source areas to 85% at destinations, but it is notable that 15% of the urban workers remained without any such access. For cooking fuel, usage of gas saw the maximum increase through urban wards migration, increasing from 7% at source area to 47% at destination, use of kerosene increased from 2% to 14%, while use of coal and mixed fuel increased relatively marginally from 9% to 11%. All these increases mirrored the fall in collection of firewood/dung cakes from 65% at source area to 17% at urban destination and buying of the same from 18% to 11%.
Consolidated view of Village sites: Comparing households with and without economic migrants
In the village sites, a household census had been conducted from which a stratified sample of households and their migrant workers were drawn for the detailed questionnaires. While most of the households covered by the detailed questionnaires had economic migrants, some 30% of the households covered by the household questionnaire had no such migrants enabling some comparison between the characteristics of households with and households without migrants in villages. The household census generated baseline information for 16,104 households in 43 villages across 17 states, and showed that, 56% of the households had economic migrants indicative of the significance of migration in the micro-management of a very large proportion of village households. A contextual consolidated profile of the villages covered by the CWDS surveys - their composition in terms of caste/social
117
group, religion and perceived economic status is outlined below, along with a comparison between households with migrants and households without migrants:
Ø In the aggregated profile as per the consolidated village censuses of the 43 villages surveyed, - 64% of the village households reported themselves as poor (of which just over a quarter were further differentiated as poorest). 29% of the households were considered of middle level economic status and 7% were in the uppermost bracket. 78% of the households were Hindu, 15% Muslim, 3% Christian and 4% Sikh, Buddhist and other religions. 20% were from the upper caste/General category, 45% were OBC (including MBC), 22% were SC and 13% were ST.
Ø 57% of the upper caste/General households were considered of upper and middle level economic status (14% upper and 43% middle level), while the majority of the households of all other caste/tribe categories were considered poor. 85% of the SC, 64% of the ST, 58% of the OBC and 43% of the upper caste/General households were considered poor (including poorest). 30% of the SC, 28 % of the ST, 11% of the OBC and 8% of the upper caste/General households were in the poorest category.
Ø A slightly higher proportion of upper economic status households as well
as the poor (excluding poorest) had economic migrants relative to their share in the overall village communities. Nevertheless, 64% of the households with migrants were poor (including poorest), of which around a quarter were among the poorest, while 28% were middle level, and 8% were from the uppermost economic status. At the same time, while SC/ST households together constituted 38% of those with economic migrants, 71% of ST and 57% of SC households had migrants in comparison to 51% of the upper caste/general and 54% of OBC households. Overall, the caste composition of all households with economic migrants were around 18% from upper caste/General, 43% from OBC, 22% from SC and 16% from ST.
Ø Comparison of households with economic migrants with those without migrants at the village sites (from the detailed household questionnaires), surprisingly showed that the average annual income of households without migrants (Rs 61,763) was higher than the average income of households with migrants (Rs 44,522) even after including their remittance incomes (of an annual average of Rs 16,001). The separate components of incomes that were totaled to arrive at the annual income
118
of a household included from cultivation, casual labour, business, regular wages/salaries, rent, remittances, and any other.
Ø 59% of the households with economic migrants resided in kuccha houses
in the village in comparison to 40% of the households without such migrants.
Ø 66% of the households without migrants resided in ancestral homes in
the village in comparison to 77% of the households with migrants. Conversely 7% of the households with migrants resided in bought houses in comparison to 15% of the households without migrants.
Ø 31% of the members of households with migrants were illiterate in
comparison to 24% of the members of households without migrants (32% of the members of household with migrants had had no schooling in comparison to 22% of the households without migrants). Conversely, a little less than 4% of the members of households with migrants were graduates and above in comparison to over 6% in households without migrants.
Ø Unexpectedly, the proportions of independent nuclear families was slightly higher among households without migrants (61%) in comparison the households with migrants (58%). Conversely, full scale joint families were slightly more among households with migrants (15%) than households without (14%). Extended nuclear families (i.e., with the addition of a parent to the husband wife children nuclear unit) were again more prevalent among households with migrants (15%) in comparison to households without (12%). Again among households with migrants there was a lower proportion of single woman or all female (adults) households (2%) in comparison to households without any migrants among whom such all female households were 4%.
Ø A final point in relation to the gender composition of labour migration from village India. Women migrants constituted just short of 39% of the 7,288 labour migrants drawn from among members of households as per the detailed household questionnaires in the village surveys. Although some of these villages were located in known catchment areas for female labour migration, not all were so located. As such, although 39% indeed appears to be a figure on the higher side, the CWDS survey does suggest
119
that the numbers of women involved in labour migration are of a significantly higher order than the 10% as constructed from the NSS migration survey of 2007-08 in Table 1. Since the construction from the macro-data was based on exclusion of all marriage migrants, the findings of the CWDS survey also suggests that indeed a significant proportion of female labour migration remains camouflaged in official migration surveys - within the stated ‘reason’ of marriage.
Of Marriage, dowry and Migration: Macro-data puzzles and micro and meso-level clues
We would still however, not argue that all or even the majority of female marriage migrants are labour migrants. Thus when the NSS migration surveys from 1993 to 2007-08 show a sharp increase in female marriage migration rates (i.e., the ratio of migrants giving marriage as their reason for migration to population), its reasons merit some separate questioning. In fact, increase in female marriage migration rates is responsible for the general picture of increasing migration rates in India, since male migration rates (i.e., ratio of male migrants to total male population) actually fell in rural India between 1999-2000 and 2007-08 and increased by just 2% in urban areas and other reasons for female migration were relatively insignificant. Increased marriage related migration rates actually enhanced the share of women in migration to an all time high of 80% of all UPR migrants in 2007-08.
In rural India migration for marriage jumped from 24.7% of the rural female population in 1993 to 43.5% in 2007-08. Census figures for 1991 and 2001 also indicated that female marriage migration rates had indeed increased in rural India. For urban areas, a similar increase in female marriage migration rates in the NSS from 12.1% in 1993 to 27.7% in 2007-08 (of which the sharpest increase by 13% is shown between 1993 and 1999-2000) is however not supported by the Census which shows a decline in urban female marriage migration rates between 1991 and 2001. Thus while increasing rates of marriage migration in rural areas can be confidently asserted, the same is not yet possible for urban areas.
The puzzle of increasing marriage migration rates begins to unravel when it is placed side by side with female work participation rates. The rise in rural marriage migration rates has run parallel to the decline in rural female work participation rates (FWPR) from 33% in 1993 to 29% in 2007-08 (further dropping to 26% in 2009-10). In our view there are deep connections between women’s work, marriage and migration that call for further and more detailed sociological exploration. Our field
120
observations and case studies of cross regional marriages that were part of the CWDS project do however provide some preliminary clues.
Case studies of cross regional marriages between brides from Kerala and grooms from Mysore (popularly known in Kerala as Mysore marriages) indicated that escalating dowry in Kerala had compelled the search for grooms from Mysore who were ready to accept smaller dowries. 87 At the Mysore end grooms were prepared to accept less dowry from the Kerala brides (when compared to the dowry brought by brides from their own region/community) because it entailed less expenditure on the marriage and marriages could be quickly undertaken. Since village exogamy was neither a rigid rule, nor universal in southern states like Kerala, the search for marriage partners involving lesser marriage expenditures extending beyond village boundaries, may indeed be contributing some part of the increase in marriage migration.
Similarly, in the low sex ratio district of Badaun in western Uttar Pradesh, where brides are being brought from distant and culturally different regions of Bengal and eastern Bihar, it was found that ‘the compulsions driving long distance/cross regional marriage migration at the source area included poverty, landlessness or marginal landholdings and the inability to meet the dowry demands of local men whether Hindu or Muslim’ (Chaudhry & Mohan 2011). Compulsions of poverty and dowry were also found to be factors that had led to brides being sent from Bihar, Jharkhand and Bengal to the western Uttar Pradesh district of Baghpat for marriage, a district which is again defined by low sex ratios. However, here there were additional factors operating at the destination end. Some young male brick kiln (bhatta) workers for example felt that they had difficulty in finding brides because local families were reluctant to marry their daughters into a lifetime of the hard manual labour and migratory conditions of bhatta labour. In both Badaun and Baghpat, at least some of these cross-regional brides from the east come from regions where again village exogamy has not been a rigid rule. As such, the expansion of cross regional marriages may indeed be contributing to enhanced rates of marriage migration. We do not however, think that cross regional marriages alone can explain the phenomenal increase in rural marriage migration rates. Rather, we would approach the issues emerging from our investigation of cross regional marriages as symptomatic of a more general set of issues in relation to marriage arrangements - in which increases in village exogamous marriages and dowry are core questions requiring much more detailed investigation than was possible in the present study.
87 These ‘Mysore marriage’ were mostly among poor Muslim families in both Kerala as well as Mysore.
121
Nevertheless, the marriage details of 5,774 couples drawn from the household questionnaire of the CWDS survey are a useful resource in opening up such questions.
Ø Firstly, it was noticeable that village exogamous marriages were somewhat more prevalent for married women in younger age groups in comparison to older couples. 22% of the marriages of women above 50 years of age were within their villages (village endogamous). This dropped to below 19% among marriages of women aged 20 and below.
Ø More significant was the scale of expansion of dowry marriages. The marriage data from the CWDS household questionnaire showed that whereas 45% of the married women above 50 years of age had married without dowry, in the age group of 20 and below, the proportion of dowry less marriages had sharply reduced to 29%. The increases in dowry marriages were apparent among all caste groups.
Ø Interestingly, the majority (51%) of marriages for SC women above 50
years of age were without dowry. But among SC women aged 20 and below a far greater majority (72%) had dowry marriages. In OBC households also, the share of dowry marriages rose sharply from 55% for women above 50 years to 79% for women aged 20 and below, and in ST households too - from 52% to 69%.
Ø Among upper caste households, where the system of dowry has the most
longstanding roots, the proportion of dowry marriages was highest among older women in comparison to all other caste/social groups but the gradient of increase over the years appeared less sharp. In upper caste households, 65% of the marriages for the above 50 age group had dowry, increasing to 78% in the 20 and below age group, i.e. the latter being marginally less than among OBCs.
Taken together, the NSS and Census data showing rising shares of marriage migrants and falling shares of workers in the rural female population, sundry field observations, case studies of cross regional marriages, and primary survey data showing expansion of village exogamous marriages and dowry – indicate a complex crisscrossing of inter-linkages between individual motivations, cultural reflections of changes in the significance of women’s work in the agrarian economy, expansion of dowry/ marriage expenses and sex ratio imbalances, all feeding into an increase in rural marriage migration rates.

122
Concluding Remarks
The macro and meso level findings laid out in this paper challenge the common assumption of ‘feminization of labour’ and its presumed relationship with migration, and posit an alternate set of observations for approaching gender and migration in India. It is argued that the macro-picture of the composition of male and female migrant workers indicates that the pattern of labour migration is actually aggravating gender biases in the labour market, particularly for industry and services. The 2007-08 migration data of the NSS shows that within an overall multi-sectoral bias towards males in labour migration in India, female labour migration is particularly differentiated from male migration by the relatively greater weight of agriculture in the sector profile of female migrant workers, and a far greater weight of services and industry among male migrant workers. It is suggested that these features are linked to a highly gendered employment crisis reflected in the declining female work participation rates in rural India and stagnation at extremely low levels of female employment rates in urban areas. Such a crisis has been sharply foregrounded by the absolute fall – by over 21 million - in the numbers of women workers between 2004-05 and 2009-10, which, although concentrated in agriculture, is also evident in industry and services.
The meso-level empirical findings laid out in the paper posit the need to look at migration, labour, and labour laws in India not only in terms of categories and experiences derived from developed capitalism, but rather to also specifically examine how agrarian caste and patriarchy based social relations are being incorporated into migration based wage employment even in more modern industries. Failure to do so results in a disconnect between concepts, entitlement regimes, and empirical realities. A case in point is the present labour law regime’s conceptual effacement of women workers’ individual entitlements where Jodi based migratory laboring units are combined with piece rate wages - as in brick kilns across the country and sugarcane harvesting in western and southern India. The significance of this issue, though noted in description, has been largely ignored in the literature on migration. The findings show that a larger proportion of women of SC and ST backgrounds are concentrated in rural based circular migration marked by contractor driven debt/advance based tying of male female Jodi labour. This in turn has inter-locked semi-feudal bondage and semi-feudal patriarchal practices into recruitment and employment practices of a section of the developing modern industries, highlighting the primitive basis of their mode of accumulation. The findings further suggest that the relatively greater weight of agriculture in the overall structure of the country’s female workforce - despite the recent massive fall in their numbers - is also partly maintained because relatively smaller proportions of
123
the female agricultural workforce are migrating for urban style employment. Instead a greater proportion of urban women migrant workers, particularly from the higher castes, had made a transition from domestic confinement to employment.
The indications are that migration in the contemporary period has led to relatively limited diversification of female occupations. A more marked process has been of concentration of women labour migrants in brick kiln work in rural areas and paid domestic work in urban areas. In rural areas, although agriculture remains the single largest occupation of women migrant workers, the proportions involved in agricultural work prior to migrating was higher, while the numbers involved in brick kiln work almost trebled after migration. A more sharply delineated trebling of numbers involved in paid domestic work after migration in comparison to before was the most significant feature of urban-wards migration, even as employment in new and other diverse service jobs also increased after migration among urban women migrant workers. The process of concentration in paid domestic work thus emerged as the most distinctive trend of female labour migration to urban areas and cut across all caste and community lines.
Such findings raise several questions regarding the class, caste and gender differentials and inequalities that have fed into the patterns of female labour migration in India. The social outcome of much of female labour migration in contemporary India does not appear to be moving towards lessening of either such differentials or inequalities. Rather, even demand driven migration patterns appear to be reconfiguring and providing new foundations for such differentials and inequalities - with significantly higher proportions of women from historically oppressed caste groups being corralled and condemned to a cycle of advance/debt based circulation for hard manual labour and degraded working conditions at one end. Gender, on the other hand, emerges as the primary axis for expanded menialisation of women’s employment at the other end. Harsh methods of extraction of absolute surplus value from primary production, eternal circulation for survival premised to a great extent on family based units of labour - that simultaneously limits the possibilities of social advance - are the defining characteristics of the former. The latter, on the other hand, is arguably associated with a partial reconfiguration of status hierarchies in the sphere of social reproduction premised on feminization of paid menial services in the domestic sphere, albeit clearly outside the family units of their employers. The family thus seems to a major determinant in currents of female labour migration at both supply and demand ends. This is not to deny the existence and entry of women in individual/autonomous capacities into several occupations that are not so closely linked with the family structures of society, but rather to point out that such entry or

124
expansion has not been of a sufficient order to challenge the centrality of the family order in shaping the most significant currents in women’s work and migration.
On a less gender specific note, there can be little doubt that migration is playing an increasingly important role in management of household economies. Where the census of village sites showed that economic migrants are drawn from a majority of rural households, the more general finding of the predominantly temporary nature of labour migration among both men and women has several other implications. While it does draw attention to the unsettled and indeed disorganising features of the contemporary employment regime that is driving migration, in our view there is a need to further delve into the socio-historical and developmental implications in relation to class formations of what appears to be a permanent temporariness of transition from peasant/agricultural labour to industrial/service sector worker for a large section of migrant workers.
A striking finding was that when viewing migration from village sites, the average annual income of households with migrants was less than that of households without migrants; educational levels were also lower in the former, and even nuclear family units were of a slightly lesser proportion in comparison to village households without any economic migrants. This suggests that the standard assumptions of development and economic growth led transition of labour from agriculture to industry/services through migration and expectations of attendant restructuring of families towards nuclear units are inadequate for understanding the role of migration and gender in India’s development story. We would argue that despite the push towards migration from agrarian distress, a pullback also appears to be operating, linked to the predominantly temporary and unsettled nature of the developing employment regime.
Additionally, the findings that a very large proportion of male migrant workers and a not insignificant proportion of female migrant workers were leaving children behind in their villages suggests a widespread inability of the migrant workforce (male and female) circulating at the lower ends of the economy to sustain social reproduction without periodic retreat to the village, even as the village economy is not providing sufficient employment or income for survival. The findings related to wages confirm the view that a substantial section of migrant workers do not earn enough to support a family.
Further, the increasing rates of rural female marriage migration evident in the macro-data call for attention and explanation. Case studies of cross regional marriage migrants indicated that poverty, landlessness and inability to pay dowry were common factors in such marriages. The meso-level survey evidence showed

125
some expansion of village exogamous marriages and an accelerated spread of dowry that is particularly sharp among OBC, SC and ST communities. Such findings combined with the macro-evidence of declining rural female work participation rates suggest interlinkages between increased rates of marriage migration, falling female work participation rates and the expanding burden of dowry. They need to be explored further.
The fact that all the above findings are for a period of high growth in India, raises several additional questions. Obviously such growth, characterized by a rapidly declining share of agriculture in the country’s GDP, accelerated growth primarily in services and to a lesser extent also industry, has not generated commensurate demand in terms of employment, for which women have paid the main price of reduced employment. As such, the overall analysis, implicitly, draws attention to the need to bring into the debate questions related to structural limitations to the migration enterprise under the current growth path.
Nevertheless, the urge to change the conditions of their life and work for it is evident from the high proportion of women migrant workers declaring that they themselves decided to migrate, whether in families or independently. This, combined with a significant presence of autonomous migration by women, not all of which is contractor driven, does indeed indicate the makings of a wave of social assertion and aspirational motivation. Yet, the overall findings of the CWDS study show that constraints shaped by macro-processes under neo-liberal driven economic growth have narrowed the field of opportunity for women’s work based migration, sometimes reinforced entrenched patriarchies and indeed introduced new elements of concentrated inequality and degradation for many that are not compensated by the social advance of some. In the absence of a greater policy focus on redistributive growth, migration in India is less rather than more likely to offer a route towards social transformation of a more non-patriarchal and equalizing nature.
In this Report, only the Key Findings of the Project Survey have been laid out. The context and operation of the findings and their context, along with the modes, terms and legal regimes within which migration happens need more discussion with the purpose of evolving strategies to deal with them. Apart from the dislocation, deprivation, and dehumanization of men, women and children, there are social costs involved. It is important to recognize the links and interconnections between socio-economic processes, unfolding developments, political power and the politics of contemporary policy regimes.

126
Interrogation of extant social reality and its structural roots is critical if any real meaning has to emerge from the discourse on gender, migration and social mobility. Behind such issues and questions there are the faces of a multitude of migrant women workers that need to be brought into the picture. How does one, for instance, understand the story of Manju, a bhatta (brick kiln ) worker whom the project team met in Parsagarh, Bihar? Manju, was pregnant. The irony of her life was that she herself was born on the same bhatta where her mother used to come as a migrant worker. A third generation was due to come in …. the remaining script of the story was still to be written when the team met Manju. While Manju is the citizen of free India, in the statistical records of this country, she represents one more generation caught between being an associational migrant being a wife, a non-worker in her own right. The public wealth she creates through her active years shall continue to be hidden behind the garb of the labour that she performs at the ‘private’ level. Issues of gender and migration need to be disentangled from within the well known official story of the double digit growth of India’s economic success if rights and citizenship have to acquire a real meaning in the lives of the people who are at the centre of studies such as these.88
88 Bibliography is given separately.