EDITORIAL ILLEGAL MIGRATION AND HUMAN TRAFFICKING
110
ERJSSH 2(1), June 2015 1 EDITORIAL ILLEGAL MIGRATION AND HUMAN TRAFFICKING: ROUTES THAT TAKE ETHIOPIANS FROM FALSE PROMISES TO MISERY AND TRAGEDY Yemataw Wondie 1 Although migration is as old as time immemorial, human trafficking is the worst form of it that has shown a dramatic increment from time to time. The United Nations Trafficking Protocol (United Nations, 2000) defines the latter as: …the recruitment, transportation, transfer, harboring or receipt of persons, by means of threat or use of force or other forms of coercion, of abduction, of fraud, of deception, of the abuse of power or of a position of vulnerability or of the giving or receiving of payments or benefits to achieve the consent of a person having control over another person, for the purpose of exploitation. So far, a multitude of Ethiopians (women, men and children) have been trafficked to different parts of the world. According to a recent study by Meskerem Mulatu (Meskerem, 2011) the main destination of the migrants are the Gulf States through various routes such as Moyale, Bossasso, Afar, Djibouti, Metema and Bole International Airport. In another study by Khaled Ali Beydoun (2006), the influx of Ethiopian maids to the Gulf States through Bole, and the misery they endure is stated as follows: Almost daily a steady stream of young girls queue at the check in of Addis Ababa International Airport, destined for the Middle East. Smartly dressed, wearing makeup as they laugh and joke with each other, all long for a new life abroad with promises of high wages and a good job. Yet for most that dream becomes a nightmare as they are forced into prostitution or a slave-like existence as housemaids working 20 hours a day without pay. A number of push and pull factors are said to be responsible for the prevalence of human trafficking. Economic and other oppressing conditions and lack of opportunities locally are reported to be the main push factors for human trafficking. In addition, high demand for cheap and unskilled labor force and availability of hard currency in destination countries are considered to be some of the pull factors. The trafficking and the devastating degree of exploitation suffered by the trafficked Ethiopians appear to be a non-stop phenomenon. The Ethiopian Reporter on its September 29, 1999 release documented the ordeal of an Ethiopian migrant to Lebanon with the following terms: 1. Yemataw Wondie, Ph.D., is Associate Professor at the Department of Psychology, University of Gondar, Editor-in-Chief of ERJSSH and Director of Quality Assurance and Audit Directorate.
-
Upload
khangminh22 -
Category
Documents
-
view
1 -
download
0
Transcript of EDITORIAL ILLEGAL MIGRATION AND HUMAN TRAFFICKING

ERJSSH 2(1), June 2015
1
EDITORIAL
ILLEGAL MIGRATION AND HUMAN TRAFFICKING: ROUTES THAT TAKE ETHIOPIANS FROM FALSE PROMISES TO MISERY AND TRAGEDY
Yemataw Wondie1
Although migration is as old as time immemorial, human trafficking is the
worst form of it that has shown a dramatic increment from time to time. The
United Nations Trafficking Protocol (United Nations, 2000) defines the latter
as:
…the recruitment, transportation, transfer, harboring or receipt of
persons, by means of threat or use of force or other forms of coercion, of
abduction, of fraud, of deception, of the abuse of power or of a position of
vulnerability or of the giving or receiving of payments or benefits to achieve
the consent of a person having control over another person, for the
purpose of exploitation.
So far, a multitude of Ethiopians (women, men and children) have been
trafficked to different parts of the world. According to a recent study by
Meskerem Mulatu (Meskerem, 2011) the main destination of the migrants are
the Gulf States through various routes such as Moyale, Bossasso, Afar,
Djibouti, Metema and Bole International Airport. In another study by Khaled
Ali Beydoun (2006), the influx of Ethiopian maids to the Gulf States through
Bole, and the misery they endure is stated as follows:
Almost daily a steady stream of young girls queue at the check in of Addis
Ababa International Airport, destined for the Middle East. Smartly
dressed, wearing makeup as they laugh and joke with each other, all long
for a new life abroad with promises of high wages and a good job. Yet for
most that dream becomes a nightmare as they are forced into prostitution
or a slave-like existence as housemaids working 20 hours a day without
pay.
A number of push and pull factors are said to be responsible for the
prevalence of human trafficking. Economic and other oppressing conditions
and lack of opportunities locally are reported to be the main push factors for
human trafficking. In addition, high demand for cheap and unskilled labor
force and availability of hard currency in destination countries are considered
to be some of the pull factors.
The trafficking and the devastating degree of exploitation suffered by the
trafficked Ethiopians appear to be a non-stop phenomenon. The Ethiopian
Reporter on its September 29, 1999 release documented the ordeal of an
Ethiopian migrant to Lebanon with the following terms:
1. Yemataw Wondie, Ph.D., is Associate Professor at the Department of Psychology, University of Gondar, Editor-in-Chief of ERJSSH and Director of Quality Assurance
and Audit Directorate.

ERJSSH 2(1), June 2015
2
As far as Ethiopian migrants are concerned Beirut is not really the
dazzling capital of Lebanon; it is the city of untold misery and despair, of
endless stories of ignominious horror and injustice. For your Ethiopian
girls who end up there looking for a future, some future, Beirut is the
Embassy of hell on earth (The Ethiopian Reporter, 1999).
What should be done to curb this problem? Raising awareness among the
potential victims on the possibilities to work and live in their own country
and about all the range of dangers out there on their way to the destination
countries and afterwards? Making a cultural revolution, especially by
instilling and cultivating a work culture in the minds of the younger
generation? And what about the justice system to put the local and
international smugglers and dealers who take the lion’s share from the
human trafficking business under trial? Besides, do we have a system that
may enable us sustainably carry out all these goals? I leave the answer for
interested researchers, policy makers and entrepreneurs to contemplate and
bring in lasting solutions.
Journals like the Ethiopian Renaissance Journal of Social Sciences and the
Humanities could bring out answers and similar questions and thereby
create awareness among the people. We are proud to release the first issue of
the second volume of ERJSSH. The current issue comes in a new B5 format
with single columns. As it happened with the maiden issue published in
2014, it tackles different social problems from the country to which local and
foreign academics provide an analytical perspective and also answers for the
local populations and policy-makers. The Journal also inaugurates a section
on book reviews, which should serve to discuss on the most recent
publications having as a scope Ethiopia and beyond as well as to bring
academics to focus on new scholarly titles from the growing editorial market
of the country.
REFERENCES
Beydoun, K. A. (2006). The Trafficking of Ethiopian Domestic Workers into
Lebanon: Navigating through a Novel Passage of the International Maid Trade. Berkeley Journal of International Law, 24(3), 1-37. Retrieved from http://scholarship.law.berkeley.edu/bjil/vol24/iss3/7
Ethiopian Reporter, The (1999, September 29). Ethiopian Domestics in Beirut.
Meskerem Mulatu. (2011). Psychosocial and Economic Experiences of Gulf States Returnee: Ethiopian Women Domestic Workers. VDM Verlag Dr. Müller.
United Nations. (2000). United Nations Trafficking Protocol Protocol to Prevent, Suppress and Punish Trafficking in Persons, Especially Women and Children, supplementing the United Nations Convention against Transnational Organized Crime (G.A. Res. 55/25, U.N. Doc. A/55/383). Retrieved from http://www.ohchr.org/english/law/protocoltraffic.htm

ERJSSH 2(1), June 2015
3
INTRODUCTION
Oral literature or orature is the unwritten form of literature existing in the
form of stories, poems, proverbs, riddles, and sayings. With its moralizing or
didactic effect, it works as a corrective force among people. The pedagogic,
etiological, and controlling functions of oral literature helps to unify the
users. Over and above, it caters for the needs of moral up-lifting and
protection of tradition among the members of the society. As Walter Ong says,
“Oral cultures indeed produce powerful and beautiful verbal performances of
high artistic and human worth, which are no longer even possible once
writing has taken possession of the psyche” (Ong, 1982, p. 14). It is a matter
of pride that oral literature continues to dominate the literature of Ethiopia,
not because of the lack of writing or writers but because of the mesmerizing
quality of its face to face performance.
The term oral literature refers to the verbal art of traditional cultures usually
composed orally and transmitted from generation to generation. While
Finnegan (1970) defines it as unwritten literature that depends on the
performer who formulates it in words on a specific occasion, Dorson (1972, p.
661) defines it as oral composition imaginatively created or recreated by
ORIGINAL ARTICLE
A SURVEY OF ANYWAA (ANUAK) PROVERBS RELATED TO
ANIMALS
Varghese Alexander Raju1
ABSTRACT
Ethiopia, a nation of more than eighty ethnic groups and a similar number of languages, some of them having no written form, has a great heritage of orature. Reflections on historical events and legends as well as expressions on religious, political, social and cultural life of the people dominate this vast treasure of oral literature. Though the Anywaa (Anuak) people, living in the Gambella Region of Ethiopia, are a small ethnic group in the country, their oral literature is very vast. Their social gatherings like ‘Achonga’ and ‘Wimaach’ are occasions for oral performance. Even their conversations are packed with proverbs related to occupations, like farming, hunting and fishing. This study concentrates on some of their proverbs related to animals. These proverbs represent the culture of the concerned society and, most importantly, they influence the day-to-day life of the people. Moreover, the samples of oral sayings selected for the study are typical as they serve the pedagogic, etiological, and entertainment functions of
the genre.
Keywords: orature, oral literature, Anywaa, Anuak people, proverbs
1. Varghese Alexander Raju (Ph. D.) is currently Professor of English in the College of Social Sciences and Humanities, University of Gondar, Ethiopia. He is a Research
Guide under Mahatma Gandhi University, Kerala, India. Email: dr.alexanderraju @gmail.com.

ERJSSH 2(1), June 2015
4
individual oral invention. Explaining its didactic function, Okpewho (1992, p.
112) opines that teaching ideals and conduct is a function of oral literature
which helps society to justify its place in the universe. However, Barre
Toelken (1996, p. 147) points out that oral literature gets its essence from the
general context of its performance as it is continually renewed. He adds that
the survival, continuity, and success of oral literature depends on how
reasonably it satisfies intellectual interests as well as socio-political and
economic needs of the society. As a utilitarian art, oral literature helps the
society to maintain its history, culture, tradition, beliefs, and practices. The
pedagogic, etiological, and controlling functions of oral literature serve as a
unifying force. Though the subject matter in orature lacks reality, it continues
to entertain masses. As Propp states, “The lack of correspondence with
reality...offers special delight... Reality is intentionally turned out, and this is
why people find them fascinating” (Propp, 1985, p. 19).
Generally, there are three levels of orality we find in African orature. The first
is the level of ordinary communication with a purely denotative use of
language, as in simple factual statements and commands; the second is the
level of rhetorical uses of language, the use of proverbs and aphorisms which
regularly channel communication in African cultures, and the third is the
level of purely imaginative uses of language. The oral literature of Ethiopia
can also be classified under these three levels of orality. As Abiola Irela says,
“In reality these three levels exist along a continuum, for it is difficult to draw
a sharp line between denotive and connotive use of language in oral
communities” (2009, p. 9). As Hymens (1974, p. 32) states folklore study is
the study of a communicative behavior with an aesthetic, expressive, and
stylistic dimensions. Moreover, according to Ruth Finnegan (1992, p. 176)
literary devices like metaphor, symbolism and allusive language have always
attracted attention in the literary study of a style to which oral forms,
especially proverbs, are no exception.
CONTEXT AND METHODOLOGY OF THE STUDY
Ethiopia, a nation of more than eighty ethnic groups and more or less a
similar number of languages, has a great heritage of orature. Gambella in the
south-west of Ethiopia and one among the nine regions of Ethiopia, is
comparatively small but has many ethnic groups with varying cultures and
languages. The major five languages of the region, Anywaa (Anuak), Nuer,
Opwo, Majangir, and Komow are very rich in oral literature. Most of these
peoples crossed the border of the Sudan in search of better pastoral life in the
fertile banks of River Baro, which provided them with better living conditions.
As Robert O. Collins suggests, the frontier line drawn by the Anglo-Ethiopian
Treaty of May 15, 1902, has failed to bring peace in this area as “rivers do not
automatically make good boundaries, and almost never do when the same
people live on either bank” (1983, p. 366). Currently, the Anywaa, the Nuer,
and the Majangir are established in three zones of Gambella.
Gambella is progressing rapidly. The modernization of Ethiopia has
considerably affected its oral literature, and the orature of the Anywaa people

ERJSSH 2(1), June 2015
5
is no exception. Megbaru Esayias (2010, p. 14) suggests that “the rapid
growth of globalization and technological innovation seem to be the reasons
for low prevalence of oral literature”. He emphatically points out, “Folk
literature in Ethiopia seems overshadowed by western tradition in the name
of globalization and modernization” (Ibid, p. 5). He fears that changes in life-
style of the young generation, characterized by excessive movies and football
games may be harmful to the survival of orature.
Some of the Anywaa informants who helped the researcher in collecting the
proverbs also pointed out that the older generation could not transmit the
oral literature to the younger generation, as it used to do in the past, because
the youngsters have freed themselves from the direct grip of the community;
most of them have gone to other parts of the country either for higher studies
or for better jobs. In short, the younger generation has lost its enthusiasm for
orature or has little or no time to formally inherit this legacy. Therefore,
unless their orature is preserved for posterity through surveys like the
present one, Ethiopia might lose a great legacy.
Though with the advent of writing, oral literature is losing ground, it
continues to be produced as a natural outcome of inspired minds.
Enlightened persons express their surprises and fears, protests and
indignation, helplessness and victory, joys and griefs in such a way that their
audience is delightfully entertained and morally edified by oral literature.
While the modern progressive world is ignoring this great treasure of
literature, it is encouraging that the people of Africa, especially of Ethiopia,
still give great importance to their legacy.
This study is delimited to the orature of the Anywaa people, particularly to
selected proverbs and sayings related to animals. The study aims at
contributing to the understanding of the deep implications of such proverbs
on the ways of life of the people.
The methodology used for the present paper is translation and interpretation
without any deep theoretical underpinning. However, a self-reflective
approach, which focuses on what the Anywaa orature tells about the
concerned society and how ‘writing’ of oral data changes its performance, has
been adopted.
The paper is the result of a few years of research on Anywaa. A preliminary
discussion of the research was presented earlier in an article titled “The
Anywaa {Anuak) Proverbs and Their Social Implications: A Thematic
Study” (Raju, 2013). The research was conducted among Anywaa student
community. The study focused particularly on proverbs because unlike other
genres of oral literature, proverbs have little chance from time-to-time
changes made in accordance with the whims and fancies of the performers. In
other words, if a performer changes the structure of a particular proverb, it
will lead to the creation of another proverb so that the number doubles.
The data for the present study was collected with the help of Anywaa
students who were undergoing their undergraduate or postgraduate studies

ERJSSH 2(1), June 2015
6
at the University of Gondar. Due to time constraints, it was not possible to
visit Gambella Region to collect the data directly or to interpret them with the
help of the elders of the society. Instead, Anywaa students were, first,
interviewed individually and, later, group meetings of selected interviewed-
students were arranged in which the proverbs were discussed. The meanings
of the selected ones (proverbs related to animals) were explained and
interpreted, and the interpretations were unanimously approved.
In the paper, the proverb in its original Anywaa script is given first. There follows an orthographic transcription in English with a word-by-word
meaning which should help those who are not able to read the Anywaa script. It must be noted that the Anywaa language today is written in the Latin script with various diacritics to capture the phonology of the language. Then, the English translation of each proverb is given followed by its explanation and interpretation. The proverbs are arranged in alphabetical order of the names of the animals related to them.
THE ANYWAA PEOPLE: THEIR HISTORY AND ORATURE In the past there, was no border line between Sudan and Ethiopia and the people crossed and moved wherever they liked in search of water and other resources. According to tradition and legends, a tribe called Masango was the original inhabitant of the banks of the Rivers Baro and Gila. Then tribes like the Anywaa and the Nuer came from the present Sudan area and pushed the
Masango into the nearby forest. “The Masango meat and honey gave way to Anuak fish and corn, that is, hunting to fishing skills”, as Alan R. Tippet (1970, p. 60) points out. Gradually, together with fishing the Anywaa people learned hunting, cultivation, and domestication of animals. The total population of Anywaa in Ethiopia is approximately half-a-million, excluding those in the Sudan. As mentioned above, the major occupations of the Anywaa people are agriculture, fishing, and hunting. Various aspects of their economic and social life are reflected in their oral poems and sayings. Thus, a lion’s share of their orature is related to fishing and hunting, but this study concentrates only on those proverbs which are directly related to animals commonly found in their area. The Anywaa proverbs tell us about their society, occupation,
relationships, day-to-day life, and so on. They are historical evidences of community ethics, moral, and world views. In fact, they serve as corrective forces among the members of the society, by giving them time-to-time warnings against the impending social hazards.
The Anywaa inherit a great treasure of oral literature. They perform them
during gatherings called ‘Wimaach’, a sort of get-together around a bone-fire
before dinner. When guests or relatives visit a family house, all male members
lit a fire and sit around it, waiting for their food to be prepared by the female
members. Usually they spend about four hours, from 6 pm to 10 pm, and the
leader of the group, called Kora, recounts stories related to Anywaa history,
which tell of wars and tribal feuds or of ‘economic’ issues, such as cultivation,
hunting, and fishing.

ERJSSH 2(1), June 2015
7
A commonly performed story is that of the origin of kingship among the
Anywaa. Once a young and beautiful Anywaa maiden named Akango went to
a nearby fish-pond to fetch water. She saw a young, strange-looking person
sitting by the side of the pond. She informed her parents of this matter, and
they scolded her for not inviting him to their house. The next day, she noticed
the stranger again and invited him to her house where he was welcome.
When Korri, the mother of Akango, gave him food, he refused to eat it. Later
Akango herself gave him food and water and he accepted. The young man’s
name was Ochudho and he stayed with them for a few weeks. Their
relationship became stronger and Akango became pregnant. When Ochudho
came to know this, he gave her a garland of five turquoise-blue beads and
went back to the fish-pond. Nobody saw him later, for he might be the spirit
of the fish-pond. Akango delivered a boy-child who became the first king of
the Anywaa people. Even today, at the time of the coronation, the Anywaa
king is given the garland of those beads, as a token of his authority. Another occasion for using oral literature, especially proverbs, is a general meeting of the people, called ‘Achonga’. There orators use a number of proverbs in their speeches in order to make their arguments emphatic and powerful. It must also be recalled here that the Anywaa frequently use proverbs in their daily conversations. According to Mengistu Melakneh (2009), “The term oral literature refers to verbal art of traditional cultures usually composed orally and transmitted from generation to generation by word of mouth” (p. 9). This suggests that the ‘writing’ of oral literature changes its performance. However, unlike other
genres of oral literature, proverbs have little or no chance for time-to-time changes which occur in accordance with the whims and fancies of the performers. In other words, if a performer changes the structure of a particular proverb, it will lead to the creation of another proverb so that the proverb becomes two proverbs, instead of one. Therefore, the present paper concentrates particularly on proverbs in a manner that does not upset their authentic effect and flavour. It is also hoped that this study of proverbs will help in promoting their preservation for future generations.
PROVERBS RELATED TO ANIMALS
There are a number of proverbs and sayings related to animals, both
domesticated and wild, which are actively used among the Anywaa. They are
classified and presented below alphabetically in accordance with the names of
the animals.
Antelope
Tääng dee døø ii dwaar tøanga ba da nyää dëëre. Tääng (antelope) dee døø ii
(again) dwaar (hunting) tøanga (my spear) ba da nyää dëëre (wouldn’t bother)!
If the antelope went to the opposite direction of the hunting place, I wouldn’t
bother about my spear. The hunter regrets if the antelope goes away from the
hunting place. This saying is used to express one’s regret when people accuse
somebody. It is like saying: If I knew such bad things happened, I wouldn’t go
to that place. Sometimes, the elder of a village is severely criticized for his
decisions by others in your absence, and then you would say, “If I were he, I

ERJSSH 2(1), June 2015
8
wouldn’t become the elder!”. This proverb is an archaic expression of it.
Cat
Ngäc løw opäära adhuri ki yie. Ngäc (know) løw (which side) opäära (jump)
adhuri (cat) ki yie (place). Know which side the cat jumps. This means that
one should know the pros and cons of a matter before taking a decision on
anything; one should be aware of the consequences of the decision. Cow (and Calf) Dhir nywaak ba week dhöödhö. Dhir (cow) njuwaak (sharing) ba week (can’t
give) dhöödhö (milk)! To share the food, prevent the calf from drinking the cow’s milk! It means that if everyone co-operates in farming, the benefit is shared by all. It is the responsibility of every individual to protect public property for the benefit of the community. The Anywaa cultivate corn and keep domesticate animals. In their oral literature, references to pastoral life and farming are quite common. Another proverb related to cow is: Dhieng cwoba ri nyilaal. Dhieng (cow) choba (stab) ri ngilaal (through a child)! The cow struck the child. You do something pretending that it is for your child. For example, when you starve, you collect food in the name of your child, because
you are ashamed to say that your family is starving. In other words, when you are in dire need of money, you borrow it from somebody saying that it is for the child wounded by the cow! Another proverb on cow is: Dhira angany jaala wanni dëëri. Dhiira agany (Agany’s cow) jela (care) wanni deere (the owner to it)! The owner looks after Agany’s cow! It means that each one should care for his work. It the owner doesn’t look after his cow, who else will look after it? He who works for something is the owner of that thing. Another meaning is that if you do your work, others will come and help you. The owner of the cow should begin the construction of the cowshed or house; then, others will come and help them to complete the work.
Crocodile Nyaang ba buut wøk jaak. Nyaang (crocodile) ba buut (can’t sleep) wøk jaak (outside)! A crocodile sleeps only on the river-banks! It means don’t do anything without knowing the way to escape from its adverse result, or else, you will suffer the consequences. The Anywaa people use some of their proverbs even in their common conversation. Some of them have didactic effects and contribute to entertainment. Another saying related to crocodile is:
Nyaang caama dïpööy. Njyang (crocodile) chama (eat) dipooy (teacher)! Crocodile ate the teacher! A preacher of morality caught up in immoral traffics. Another saying indirectly related to crocodile is: Kar tier jwöthï japi. Kar tier (don’t) juothi (armpit) japi (open)! Don’t open your armpit. Let not your own deeds turn against you! To find its relation to animals, I asked one of my Anywaa students to explain it and he told me a tale. A crocodile was afraid of guur, a huge fish found in the Baro, until the guur revealed that it had no teeth, and the next day the crocodile swallowed the fish. So the proverb warns that it is dangerous to reveal your weaknesses to others.
Deer Luubö atimö ni cwiek tiedo. Luubö (speech) atimö (becomes) ni cwiek (soup) tiedo (deer)! The speech is Tiedu’s soup. When somebody makes a wonderful speech, you exclaim like this. The speech was as tasty as the soup made with

ERJSSH 2(1), June 2015
9
the meat of tiedu (a kind of small deer). The speaker’s words are very healthy and useful.
Dog
Gwök kwanynya ri wääth ki cöö. Gwök (dog) kwanynya (take) ri wääth (by
walking) ki cöö (bone)! Unless the dog searches, it won’t get the bone! The dog
can find its favorite bone if only it is ready to walk a long distance. Unless you
move from place to place, you won’t get any benefits. It advises you not to
expect benefits to come to you if you are not ready to try for them. The
hunters used to move from one place to another to find the game. Lazy people
will starve. Another saying related to dog is: Gwök ma mägö ki lääy ngic ki
tiete. Gwök (dog) ma mägö (which catch) ki lääy (animal) ngic (is identified by)
ki tiete (its legs)! A good hunting dog is identified by its legs! It means that one
can easily identify a capable man through observation. Another proverb says:
Gwök ba guuyi jaak. Gwök (dog) ba guuyi (can’t bark) jaak (nothing)! A dog
cannot bark at nothing! One cannot say something without any reason. In
other words, if somebody says something about someone, there will be a
reason behind it.
Elephant Liec thöra apøøte. Liec (elephant) thöra (is finished) apøøte (piece by piece)! An elephant can be finished by taking it piece by piece! Nobody can finish an elephant as such, its body must be cut into pieces. It means that the big work should be finished bit by bit. So, piecemeal work is recommended for difficult tasks. Goat Atea dhie jeeya koodhi. Atea (goat) dhie (mouth) jeeya (ignores warning)
koodhi (thorn)! The goat that ignores warnings gets the lesson from the thorns! If you do not listen to the advice given by elders, you will learn by suffering the consequences of your deeds, like the goat that eats thorny plants, gets its mouth injured by thorns. Hyena Odiek pëëte nøk. Odiek (hyena) pëëte (skins) nøk (few)! Scarce are the hyena’s skins! It means that fear will protect one from danger. Hyena runs away from human beings like a coward, but cowardice saves its life. One can’t find hyena’s skin at home because it is a coward. There is also an alternative explanation. Being afraid of hyena, nobody hunts it, and its skin is rarely
available. In hunting one must be courageous but that does not mean that you must be fearless! Too much courage and overconfidence is dangerous. Another proverb related to hyena is: Angwala ni toor baam odiek. Angwala (imitation) ni toor (which break) baam (hip-bone) odiek (heyana)! Hyena pretends as if its hip-bone is broken. When a hyena walks, the hind legs lean to a side as if imitating an animal that has a broken hip! The proverb warns against imitating another person’s doings because you will be caught in your action.
Leopard Kwac kit moe ba wiile. Kwac (leopard) kit (spots) moe (it) ba wiile (can’t change). A leopard can’t change its spots. This means that it is difficult for a hard hearted person to change the basic nature or his/her personality traits.

ERJSSH 2(1), June 2015
10
Monkey Ajwomi nø kwääka wï thuurë. Ajwomi nø (every monkey) kwääka (plays in) wï thuurë (its place)! Every monkey plays in its own place. It means that everybody feels free, relaxed, powerful and authoritative in his own place. When you are in a strange place, you cannot fight even against injustice. Another proverb related to monkey is: Ajwom ba buut bäät cwa. Ajwom (monkey) ba buut (won’t sleep) bäät cwa (on the tamarind tree). The monkey won’t sleep on the tamarind tree. The sour-tasting tamarind fruits are the favorite food of monkeys. The proverb means that one should not sleep in the barn. If you sleep in the room where the food is kept, you may continue eating and thus keep nothing for the next day. The proverb reminds of preserving things for future.
Mouse Ngat dhee ongiic acela thaac waange waange ni kweelø. Ngat (anyone) dhee ongiic (who is a customer) acela (to mouse-meat/bush meat) thaac waange waange (will burn) ni kweelø (a ball made of dry-grass—kept between the head and the head-load)! One has to burn even his grass-hat to taste the mouse-meat! To get benefit, use whatever measures you have. To smoke out a rat from its hole, don’t go away in search of dried grass, but use the grass
of your ‘support-hat’ which you made to keep in between your head and the load on your head. A number of Anywaa proverbs and sayings are related to hunting and cooking of bush-meat. This proverb teaches that in hunting, quick, timely action is crucial. Musk-cat Kwøro wïïr ki maar dëërë. Kwøro (musk-cat) wïïr (fragrance) ki maar dëërë (by its own oil/secretion)! A musk-cat makes itself sweet smelling by its musk. The saying means that one can become well-known or famous by his/her own abilities. One should utilize his/her talents or capital in a more beneficial way.
Tiger (and Wild Cat)
Pääri ki dum kwøro kanyo poode ni kwac poot naanga ree. Pääri (jump) ki
dum kwøro (with muscat’s skin) kanyo poode (before) ni kwac (a tiger) poot
(isn’t yet) naanga (licking) ree (itself)! Jump with the wild musk-cat’s skin
before the tiger licks its own skin! This proverb is a complicated one. Both
the big tiger and the small wild cat lick their own skins, as if to get courage
for the next jump. It would be better if the cat licked the larger skin of the
tiger. Then, the cat will get the courage of the tiger. It means that before you
plan to do a small thing, you must have greater preparations. Though your
forthcoming work might be small, prepare as if it is a big work, then you will
be able to complete it very easily. The proverb has another meaning too. Do
things according to your ability or don’t do bigger things until you have the
capacity to do them. The cat should lick its own skin and not that of the
tiger!
Tortoise
Ocirö cäädhi ka akwaane. Ocirö (tortoise) cäädhi (walk) ka (by its) akwaane
(shell)! A tortoise walks with its shell! Learn the lesson from the tortoise that
carries its own house (shell) wherever it goes. One must go for a journey with

ERJSSH 2(1), June 2015
11
all the necessary things. In other words, don’t expect to live with another’s
property.
Wild Boar
Obang ko Omøt gena apät cøøyø. Obang (name of a person) ko (and) Omøt
(another person) gena (are) apät cøøyø (spoons and fat of wild boar)! Obang
and Omot are intimate friends. The spoon and the fat of wild boar love each
other. When you cook the meat of wild boar, its fat will stuck on the ladle.
This proverb is used to point out the intimate friendship between two
persons. Their friendship is inseparable like the ladle and the fat on it.
Another proverb related to wild boar is: Aana purö ki puur kul. Aana (I) purö
(tilled/cultivated) ki (like) puur kul (wild boar’s cultivation)! I tilled like a wild
boar. Usually wild boars come to the field and upturn the soil or plough the
land with its tusks in search of some edible roots but in vain. This proverb is
used to express one’s own despair when facing a loss in cultivation. You have
invested your energies in cultivation but, as there was no rain, no benefit
came out of it and hence your work was like the useless tilling of the wild
boar.
CONCLUSION
It was man’s desire for self-expression, his interest in people and their doings
as well as his observation of the world in which he lives and the world of
imagination he hopes to bring that inspired him to produce literature. His
feelings, thoughts and experiences, his reactions towards the happenings
around him and his practical responses to problems he faces forced him
towards this creative activity. Moreover, man’s instinctive desire to tell others
about his unique experience stimulated him towards the production of
imaginative literature which, as Meyer points out, “is a source more of
pleasure than of information” (1994, p. 46). In the case of the Anywaa the
proverbs represent their culture. By analysing the Anywaa orature we can
find out how this literature influences the day-to-day life of the people. Until
recent days, when writing was slowly introduced into their society, the
Anywaa presented their ideas and thoughts through stories and songs, with
the accompaniment of impressive gestures and, later, of musical
instruments.
Ethiopia has a number of small ethnic groups, each one with a language and
culture of its own. Their oral literature, if brought into limelight, will turn into
an asset for the world literature. It is high-time that the government and
other social organizations take appropriate steps towards protecting and
saving their oral literature lest the age-long accumulation of this heritage
vanishes in the present surge of modernization. It is often argued that the
‘writing’ of oral data changes its performance. Yet, it is my contention that
such instances of orature as proverbs cannot be changed by a performer.
Therefore, the preservation of proverbs and other genres of orature in their
written form can be valuable for the future generations.

ERJSSH 2(1), June 2015
12
ACKNOWLEDGMENTS
I want to express my deep gratitude to my friends from the Anywaa student
community at the universities of Bahir Dar and Gondar who helped me in
gathering and interpreting these proverbs from their oral literature.
REFERENCES
Abiola Irele, A. (2001). The African Imagination: Literature in Africa and the Black Diaspora. New York, NY: Oxford University Press.
Collins, R. O. (1983). Shadows in the Grass: Britain in the Southern Sudan, 1918-1956. New Haven & London: Yale University Press.
Dorson, R. (1983). Handbook of American Folklore. Bloomington, IN: Indiana University Press.
Dundes, A. (1965). The Study of Folklore. NJ: Prentice-Hall Inc.
Finnegan, R. (1970). Oral Literature in Africa. Oxford: Clarendon Press. Foley, J. M. (1988). The Theory of Oral Composition: History and Methodology.
Bloomington IN: Indiana University Press. Gee, J. P. (1996). Social Linguistics and Literacies. London: Biddles Ltd. Hymens, D. H. (1974). Foundations in Sociolinguistics: An Ethnographic
Perspective. Philadelphia PE: University of Pennsylvania Press. Megbaru Esayias. (2010). Amharic Funeral Dirges in Ethiopia: A Thematic
Analysis of Funeral Dirges in West Gojjam. Berlin: VDM Verlag Dr. Muller.
Mengistu Melakneh. (2003). Fundamentals of Literature for Colleges. Addis Ababa: Branna P.E.
Meyer, M. (1994). Introduction to Literature: Reading, Thinking and Writing (3rd ed.). Boston: Bedford Books.
Okpewho, I. (1992). African Oral Literature: Backgrounds, Character, and Continuity. Bloomington, IN: Indiana University Press.
Ong, W. (1982). Orality and Literacy. New York: Routledge.
Propp, V. (1985). Theory and History of Folklore. Minnesota, IN: University of Minnesota Press.
Raju, V. A. (2013). The Anywaa (Anjuak) Orature and its Social Implications – A Thematic Study. The Voice, 10, 8-11.
Tippet, A. R. (1970). Peoples of Southwest Ethiopia. California: William Carey Library.
Toelken, B. (1996). The Dynamics of Folklore. Logan, UT: Utah State University Press.

ERJSSH 2(1), June 2015
13
INTRODUCTION
Juvenile delinquency is a recognized social problem across many societies
(Junger-Tas et al., 2010) and a popular issue of social research. Juvenile delinquency can be defined as illegal behaviors of a person under the age of 18 (The Cambridge Dictionary of Psychology, 2009). It encompasses a range of norm-breaking behaviors for which adolescents are criminally responsible such as, among other instances of delinquency, drug use, violent offenses against other persons and carrying weapon (Marte, 2008). It has been found that most of the criminals began to engage in criminal act at the age of thirteen years (Steve, Maurice, Veronica & Jane, 2005).
ORIGINAL ARTICLE
CORRELATES OF JUVENILE DELINQUENCY AMONG JAILED
DELINQUENTS IN GONDAR, ETHIOPIA
Daniel Sewasew1, Selamawit Kassa2, Gebeyehu Abate3,
Mengesha Shebabaw4, Hone Mandefero5 and Yemataw Wondie6
ABSTRACT
This study investigates the relationships among neighborhood condition, school problems,
parent adolescent communication, peer relation and religiosity on juvenile delinquency.
Self-reported questionnaires were collected from 107 juvenile delinquents aged 11-18
years. Six standardized instruments of Amharic versions were administered. The rate of
juvenile delinquency was significantly and positively correlated with the neighborhood
condition, school problems, poor family communication, and peer relation. Negative
significant relationships were also observed between juvenile delinquency and religiosity
and open family communication. All variables together accounted for 88.6 % of the
explained variance. More specifically, the strongest influence was from neighborhood
condition followed by open family communication and school problems. The paper
concludes that to tackle delinquent behavior proactive interventions are essential at family,
school and community levels.
Keywords: correlates, juvenile delinquency, jailed delinquents, Gondar Correction
Center.
1. Lecturer at the Department of Psychology, College of Social Sciences and the
Humanities, University of Gondar, Ethiopia. Corresponding author. Email:
danielsewasew @yahoo.com. 2. Lecturer at the Department of Psychology, College of Social Sciences and the
Humanities, University of Gondar, Ethiopia. 3. Assistant Professor at the Department of Psychology, College of Social Sciences and
the Humanities, University of Gondar, Ethiopia. 4. Lecturer at the Department of Psychology, College of Social Sciences and the
Humanities, University of Gondar, Ethiopia. 5. Lecturer at the Department of Social Work, College of Social Sciences and the
Humanities, University of Gondar, Ethiopia. 6. Associate Professor at the Department of Psychology, College of Social Sciences and
the Humanities, University of Gondar, Ethiopia.

ERJSSH 2(1), June 2015
14
There is no universally accepted definition of juvenile delinquency at least for
two reasons. First, the minimum age for criminal responsibility varies from
country to country (e.g. 7 in Sudan, 9 in Ethiopia or 18 in Belgium). Second,
some of the behaviors identified as juvenile delinquency such as use of alcohol
or not attending the school in some countries are not illegal in others.
Juvenile crimes slow down the development of a society and cause major
distress and damage to victims, perpetrators, and the society at large (Nas,
DeCastro & Koops, 2005; Shamim, Batool, Zafar & Hashmi, 2009). Adolescent
crime has been studied using many labels. The most common label that has
been used is delinquency. The study of delinquency literature highlights the
role of some prominent factors, the most important of which are family-related
and peers factors (Brendgen et al., 2000; Pearce & Haynie, 2004). Among
family process variables, parental monitoring has been identified in the
literature as one of the proximal determinants of early development and
maintenance of antisocial and delinquent behavior in children and
adolescents (Singer, Flannery & Guo, 2004). Others indicate socio-economic
conditions, especially poverty, are of the prime importance in a young person’s
life (Nisar, Ullah, Ali & Alam, 2015).
Psychologists, sociologists and criminologists the world over have long debated
on the various causes and determinants of delinquency (Nisar et al., 2015).
Research findings on causes and contributing factors of juvenile delinquency
are mixed, contradictory and inconclusive. Understanding the true cause of
crime remains a difficult problem (Seigel, 2003). Searching for a single cause
in crime studies often leads to wrong conclusions by attempting to deal with
only parts of the issue. Such attempts would eliminate the possible causal
explanation of a variety of phenomena. This view of causation is inappropriate
because of the existence of multiple causes or factors in human behavior
(Shoemaker, 1996). Indeed, it is quite difficult to identify a single factor that
independently determines the features of a crime. Only possible explanations
could be provided on the identifiable aspects of crimes (Nega Jibat & Berhanu
Nigussie, 2015).
Taken all together, at different setting and situations there are different
reasons for juvenile delinquency. This also holds true in the present study
site, where the possible factors have not been well investigated yet.
Consequently, there is a need to examine correlating variables of juvenile
delinquency in the Ethiopian context. Correlates of juvenile delinquency
The family is believed to be the most significant agent of socialization and to
have a positive impact on the behavior of its members through open
communication of values, beliefs, norms and other codes of conduct. The
reverse might be true for those families characterized by potential theft,
vandalism or robbery. Such families may at least indirectly instruct their
members to behave in their traditional way (Regoli & Hewitt, 2006).
Additionally, it is believed that families which are characterized by poor
communication among members may fail to teach their members what is

ERJSSH 2(1), June 2015
15
believed to be good conduct.
Scholars in psychology and sociology have demonstrated the impact of peers
on adolescent behavior. For instance, Regoli and Hewitt (2006) revealed that
having peers who are involved in delinquent behavior is the most significant
predictor of juvenile delinquency. Similarly, Regoli and Hewitt (2006),
summarized studies of religiosity which depict mixed results. Some revealed
that religiosity is negatively related to delinquency while some others claimed
that there is no link between religiosity and delinquency. However, a meta
analysis of 60 scientific studies conducted over the last 30 years showed that
religiosity can have significant deterrent effect on criminal behavior. Juvenile
delinquency is also assumed to be determined by the extent of juvenile bond
with their social settings such as schools. This assumption is held by social
bond theory. This can be seen in terms of the attachment of juveniles to their
school. Regoli and Hewitt (2006) have stated that children who like their
school conform to its rules and regulations and are less likely to commit
crime. Several other studies argue that neighborhood conditions such as
social structure, bond to school and control determine juvenile delinquency.
For instance, Sampson (1997) found that neighborhood control is significant
inhibitor of adolescent delinquency. Social disorganization (i.e. social
structure) is also strongly related to juvenile violence (Rhodes & Jason, 2005). To date, very limited effort has been made to characterize the situation of juvenile delinquency and its correlates in Ethiopia. This study aims at opening social science research in Ethiopia to this important area of study and therefore turning into the stepping stone to assess the correlates of juvenile delinquency in the Ethiopian context. In this study, correlates of juvenile delinquency refer to factors associated with criminality. They include only
juvenile family interaction, peer influence, neighborhood, bond to school, and religiosity.
Local studies on juvenile delinquency
The literature on criminality and related issues in Ethiopia is scant. Moreover,
the studies available mainly focus on adult criminality and disregard juvenile
delinquency, while using secondary data, and charactering profiles of
criminals (e.g. age, gender, occupation, educational level and marital status).
Hence, no detail of personal offender or victim is obtained which, in turn,
hampers statistical manipulation to determine relationship between crime and
its correlates (Nega Jibat & Berhanu Nigussie, 2015). Besides, most of these
studies are conducted in the Oromia region and in Addis Ababa (e.g.
Andargatchew, 1988, 2004; Daniel Wondimu, 2004; Nega Jibat & Berhanu
Nigussie, 2014, 2015).
For instance, Nega Jibat and Berhanu Nigussie (2014, 2015) analyzed
secondary data in the Oromia region. The total number of criminals reported
in their study was 96,300 (2011/2012), 85,100 male and 11,200 female
offenders. About 37% of those criminals committed violent crimes. The ratio of
male to female offenders was 7.6:1. The dominance of male over female both
in criminality and victimization is the extension of their social position with

ERJSSH 2(1), June 2015
16
the social structure and the result of gender role socialization. Age group 19 to
30 was found to be the most criminal population with the criminal rate of 828
per 100,000 people. Unfortunately, the relationship between educational
statuses, types of occupation/employment and marital status, on the one
hand, and criminality, on the other, were less than conclusive mainly because
of the lack of adequate information on such variables for individual criminals
and victims or the fact that police data consisted only on aggregates.
Victimization rate was higher for males and for the 31-50 age categories (Nega
Jibat & Berhanu Nigussie, 2015).
In the present study area there are many juvenile adolescent in the correction
center and the problem also exists in the youth population. Nevertheless, no
study on the correlating factors of adolescents’ criminal act has been
conducted or published. This has also hampered devising any intervention to
tackle this social problem. For this reason, it is a pressing need to investigate
empirically this issue and to suggest feasible interventions. The very purpose
of this study is to fill this gap and to address the following questions: What is
the relationship between juvenile delinquency and associating factors (juvenile
family communication, bond with school, peer relationship, neighborhood
condition, and religiosity)? Which one of the above proposed factors influences
juvenile delinquency at most?
METHODS The major purpose of this study was to assess associating factors of juvenile delinquency employing correlational study design. The study was conducted in Gondar, north western Ethiopia. Samples were taken from one of the largest correction centers in the city. Although, the correction centre mainly hosts adult offenders, a significant number of juvenile offenders who were less than 18 years old are jailed together with adults. Among the 2,060 inmates of this correction center, 110 of them were below the age of 18. About 110 juvenile were taken for this study. There were about 81 males (78.2 percent) and 26 females (21.8 percent) in the sample. The age range was from 11 to 18 years, with M = 14.25, SD = 3.04 for
males and M = 16.90, SD = 1.77 for females. More than half (57.94%, 62) of the respondents were second cycle students (grade 6, 7 and 8) while 37.38% (40) of the respondents were first cycle students (grade 4 and 5), and the remaining 4.67% (5) were illiterates. Except for five respondents (who were daily laborers), all respondents were (95.23%, 102) students.
Measures
Juvenile-family interaction
To measure juvenile-family interaction, the parent-adolescent communication
scale (PAC) of Barnes and Olson (1982) was adopted. The scale consists of two
subscales: 1) open family communication, which measures positive aspects of
parent adolescent communication and 2) problems in family communication,
focusing on the negative aspects of communication. The scale consists of 20
items, for example: "My mother/father is always a good listener" and "My

ERJSSH 2(1), June 2015
17
mother/father insults me when she/he is angry with me". The items are
arranged along a 5-point Likert-type scale and respondents rate themselves on
each item, from 1 = strongly disagree to 5 = strongly agree. In the present
study PAC scale has Cronbach α = .87 for open family communication,
Cronbach α = 0.78 for problems in family communication and Cronbach
α=0.82 for the global scale.
Peer relationship
To measure the level of pressure of peer relation, problem with friends’
subscale of the Multi Problem Screening Inventory MPSI (Hudson, 1990) was
adopted and used. Sample items were “I get along very well with my friends”
and “My friends act like they do not care about me”. The items are arranged
along 8-point Likert-type scale and respondents rate themselves on each item,
from 1 = none of the time to 7 = all of the time and X = does not apply to me.
Its reliability is Cronbach α=.80 for this subscale. The subscale produces a
score ranging from 0 to 100 where a low score indicates the relative absence of
the problem being measured, and higher scores indicate the presence of a
more severe problem.
Neighborhood condition
To measure this variable the neighborhood subscale of the multi problem
screening inventory (Hudson, 1990) was adopted and used. Sample items
were “I really feel that I am disliked by my neighbors” and “I wish I had a
different group of neighbors”. The items are arranged along 8-point Likert-type
scale and respondents rate themselves on each item, from 1 = none of the
time to 7 = all of the time and X = does not apply to me. Its reliability was
Cronbach α = .80 for this subscale. This subscale produces a score ranging
from 0 to 100 where a low score indicates the relative absence of the problem
being measured, and higher scores indicate the presence of a more severe
problem.
Problem with school
To measure this variable the problem with school subscale of multi-problem
screening inventory (Hudson, 1990) was adopted and used. Examples for
items include “I hate school” and “I enjoy my school work and studies”. The
items arranged along an 8-point Likert-type scale and respondents rate
themselves on each item, from 1 = none of the time to 7 = all of the time and X
= does not apply to me. Its reliability was Cronbach α = .80 for this subscale.
This subscale produces a score ranging from 0 to 100 where a low score
indicates the relative absence of the problem being measured and higher
scores indicate the presence of a more severe problem.
Religiosity
To measure religiosity, the spiritual assessment inventory (SIA) developed by
Hall and Edwards (1996) was adopted and used. The scale consists of
seventeen items. Examples for items include “I have a sense of how God is
working in my life” and “God’s presence feels real to me”. The items arranged
along 5-point Likert-type scale and respondents rate themselves on each item,
from 1 = Not at all to 5 = Very true. The reliability of each subscale was

ERJSSH 2(1), June 2015
18
estimated using Cronbach’s coefficient alpha measure of internal consistency.
Its reliability was Cronbach α = .89 for this subscale.
Juvenile delinquency
To measure this variable, frequency of delinquent behavior scoring
Iinstrument (FDBSI) developed by Centers for Disease Control and Prevention,
National Center for Injury Prevention and Control (2005) was used. The scale
consists of twenty five items. Examples for items include “Cheated in school
tests” and “Taken something from a store without paying for it”. The items
arranged along 5-point Likert-type scale and respondents rate themselves on
each item, from 0 = Never to 4 always. Its reliability was Cronbach α = .80 for
this subscale.
Procedures
This research was totally based on the consent of participants and willingness
of North Gondar Correction and Gondar University administrative bodies. At
the outset, the researcher gave brief orientation about the objectives of the
study, the instructions of the tool and assured confidentiality to the
respondents.
Data collection was done in collaboration with different people in the
correction centers such as, the administrator, the guards and lawyers. But,
before the administration of the questionnaire to the inmates, training was
given to the coworkers who helped in data collection processes. Respondents
were also told that they had the right to withdraw whenever they felt
discomfort at any time. They were also assured of the anonymity of the
responses and their responses would be only used for research purpose. The
questionnaire was translated and presented in an Amharic version. A pilot
test was conducted so that the questionnaire attains a desirable level of
validity and reliability.
Analysis
Pearson Product Moment Correlation was used to see the relationships among
the variables (family juvenile interaction, peer relation, neighborhood
condition, bond with school, religiosity) and juvenile delinquency). Regression
analysis was done to examine which factor was more decisive in influencing
Table 1: Correlation between juvenile delinquency and associating factors
RJD PWN PWS PWP RWG OFC
PWN .888**
PWS .749** .711**
PWP .761** .674** .709**
RWG -.357** -.325** -.207 -.245*
OFC -.818** -.764** -.574** -.637** .260*
PFC .812** .756** .583** .658** -.290** -.772**
Note: *p< .05; **p < .01 n=107.

ERJSSH 2(1), June 2015
19
juvenile delinquency.
RESULTS
Table 1 showed that a statistically significant positive correlation emerged
between rate of juvenile delinquency (RJD) and problem with neighborhood
(PWN) (r =.888, n = 107, p < 0.01), problem with school bond (PWS) (r = .749,
n = 107, p < 0.01), relationship with peers (PWP) (r = .761, n = 107, p < 0.01)
and poor family communication PFC) (r = .812, n = 107, p <0.01). However,
negative correlations are found between juvenile delinquency and religiosity
(RWG) (r = -.357, n = 107, p < 0.01), and open family communication (OFC) (r
= -.818, n = 107, p < 0.01).
Table 2 depicts how much of the variance in the dependent variable (TRJD =
total rate of juvenile delinquency) is explained by the model (which includes
the predictor variables of total of problem with neighbors TPWN, total of
problem with school TPWS, total of problem with peers TPWP, total of
relationship with God TRWG, total of open family communication TOFC and
total of poor family communication TPFC). So these factors explain 88.6
percent of the variance in total rate of juvenile delinquency TRJD.
The table also shows that problem with neighbors (β = 0.387, F=103.19, t =
5.276, p <0.01), open family communication (β = 0. -.203, F = 103.19, t = 0. -
3.047, p < 0.01) and problem with school (β = 0. 148, F = 103.19, t = 0. 2.358,
p < 0.01) significantly influence juvenile delinquency in the first three ranks
respectively. When we look at the beta column to find which beta value is the
largest (ignoring any negative signs out of the front), PWN made the strongest
unique contribution to explaining the dependent variable, when the variance
explained by all other variables in the model is controlled for. The beta value
for Total of RWG was lowest (β = 0.065), indicating that it made less
contribution.
DISCUSSION
In this study there was a strong and positive rate of delinquency associated with high levels of problem with neighbors. This result is congruent with that
Table 2: Regression results of study variables to predict rate of juvenile delinquency
Note: *p< .05; **p < .0, n=107.
Variables B SE β R R2 F t
Constant -8.922 3.612 .941 .886 103.19** -2.470**
TPWN .246 .047 .387 5.276**
TPWS .120 .049 .148 2.458**
TPWP .197 .083 .142 2.358**
TRWG -.028 .017 -.065 -1.626
TOFC -.109 .036 -.203 -3.047**
TPFC .093 .038 .164 2.455**

ERJSSH 2(1), June 2015
20
of other studies (Sampson & Byron, 1989; Sampson, 1997) that categorized the neighborhood effect as two dimensional, control and ties. These studies emphasize the importance of neighborhood ties as the main measure of neighborhood effect in addition to neighborhood control in explaining the impact of neighborhood context on crime.
Previous studies have established an association between neighborhood
ecology and delinquency (Johnson, Larson & Jang, 2000; Sampson, 1997).
Jang and Johnson (2001) found that perceived neighborhood disorder, which
is a sign of lack of social control, is significantly related to adolescent use of
illicit drugs, marijuana and hard drugs. Such similarity with other findings
could be attributed to the similarity in study subject (juveniles) and
neighborhood influence.
The present study found out a positive correlation between the rate of
delinquency and the problem with peers. The finding is supported by previous
studies like Wellman and Berkowitz (1988). Consistent with the premise of
differential association theory, a great number of empirical studies have
shown that there are strong associations between peer delinquency and
delinquent behavior (e.g. Agnew, 2001; Jensen, 1995). Empirical studies also
support that delinquent peers are related to both initiation and contribution of
adolescents’ delinquent behaviors (Matsueda & Heimer, 1987). Furthermore,
Gottfredson, and Hirschi (1990), who are major supporters of the importance
of social bonding in explaining delinquency, acknowledged the strong
influence of deviant peers on delinquency. The significant association
consistently evidenced in this research gives credence to the idea that
delinquency is best understood in the context of the peer group where
common norms and behaviors emerge from locations in structured patterns of
relationships.
This study showed that there was a strong, positive correlation with high
levels of rate of delinquency associated with high levels of problem with
school. Not surprisingly, the effect of the school social bond on delinquency
has generally been supported by previous studies (Hawkins, Catalano &
Miller, 1992; Joseph, 1996; Krohn & Massey, 1980; Lawrence, 1985;
Thornberry et al., 1991). One possible explanation in the present study is that
the lack of attachment to school, less social bond and greater deprivation of
rights may lead to more delinquency among participants.
The present study also showed the strong, negative correlation between
juvenile delinquency and open family communication, with high levels of rate
of delinquency associated with low levels of open family communication. In
addition it established a strong, positive correlation between juvenile
delinquency and poor family communication, with high levels of rate of
delinquency associated with high levels of poor family communication. Clark
and Shields (1997) stated that the importance of positive communication for
optimal family functioning has major implications for delinquent behavior. A
large body of theoretical and empirical research has supported these findings
(e.g. Cernkovich & Giordano, 1987; Hirschi, 1969; Rankin & Wells, 1990;
Stern & Smith, 1997). Even though there are various ways of conceptualizing

ERJSSH 2(1), June 2015
21
parental behavior in terms of types and dimensions, parental attachment
(affective ties that adolescents form with parents) is considered the key
construct of parenting (Hirschi, 1969). This strong relationship may be due to
the fact that parental attachment functions as a social support and control in
inhibiting delinquent behaviors. The bonding of the juveniles with their family
members strongly influences the rate of delinquency.
There was also a moderate, negative correlation with high levels of rate of
delinquency associated with low levels of religiosity. For example, Shield
(1984) found supportive evidence for religion’s deterrent effect on delinquency
even when controlling for parental support and educational commitment.
However, one previous study (Benda, 1995) revealed that the inclusion of six
major demographic variables and social control variables does not change the
impact of religious effect on property crimes and crimes against persons.
Furthermore, the same author reported that the effect of religiosity increases
for crimes against persons when demographic variables and elements of social
control theory are included in the model.
Johnson, Jang, Larson and Li (2001) found empirical evidence of an
independent effect of religious belief on delinquent behavior for a national
probability sample even when controlling for elements of social control and
social learning as well as socio-demographic variables. However, the impact of
religiosity was partly mediated by social control and social learning factors.
However, Elifson, Petersen and Hadaway (1983) found that the independent
effect of religiosity was not statistically significant. Burkett and Warren (1987)
also reported that the relationship between religiosity and delinquency
becomes statistically nonsignificant after controlling for family and peer
variables. They concluded that the impact of religiosity on adolescent drug use
was not direct but operated indirectly through peer associations.
Thus, it is worth discussing the possible causes of the difference in findings
between the present study and some previous ones. A plausible explanation is
that the impact of religion on delinquency may vary by religion or
denomination and the extent to which the religion disapproves of particular
behaviors. For instance, many religions do not teach against alcohol use (e.g.,
Catholicism, Judaism). Furthermore, even if adolescents have religion, it is
possible that they see religion as irrelevant to experimenting with smoking
and alcohol. In this case, religious sanctions may not have a strong effect on
delinquency.
To compare the contribution of each independent variable the beta values are
important. When we look at the beta column to find which beta value is the
largest (ignoring any negative signs out the front), the largest beta coefficient
is for total of PWN and the strongest unique contribution to explaining
juvenile delinquency, when the variance explained by all other variables in the
model is controlled for. The beta value for Total of RWG was slightly lowest,
indicating that it made less of a contribution. Most previous researches (Jang
& Johnson, 2001; Johnson, Larson, Li & Jang, 2000; Sampson, 1997;
Sampson & Grove, 1989) gave emphasis on associations rather than

ERJSSH 2(1), June 2015
22
predictors of juvenile delinquency. But in this study neighborhood situation is
a strong influence for the rate of juvenile delinquency.
CONCLUSION
Juvenile delinquency has direct and significant relationship with poor family
communication, peer relationship, school problems and neighbors. Religiosity
and open family communication has negative significant relationship with
juvenile delinquency. The strongest influence was from neighborhood
condition compared to other factors covered in this study.
Parent-adolescent communication, school problems, neighborhood conditions,
delinquent peer association and religiosity should be promoted through
various mechanisms as an important determinant of juvenile delinquency.
Involving the wider community in appreciating the significance of parent-
adolescent communication and identifying interventions to enhance
communication on delinquency should be considered.
This study was conducted based on the available sample of delinquents in
Gondar Correction Center. Their total number, but for those who volunteered
for the study, could not be established. As a result, the statistical
assumptions and procedures might not keep for analysis and the results
could not be extrapolated. Despite this methodological limitation, the results
of this study at least do represent a certain reality about correlates of
delinquency in north Gondar zone and the region. Future research should
address larger samples to identify the specific contribution of each variable to
juvenile delinquency and how different variables mediate and moderate it.
Besides, interview should be carried out in order to know what the
motivations are behind the delinquents engaging in criminal acts.
Declaration of conflicting interest
The authors declare no potential conflicts of interest with respect to the
authorship and/or publication of this article.
ACKNOWLEDGMENTS
The authors would like first to thank University of Gondar for funding this
research. Secondly, we express our gratitude to the respondents of this study,
counselors, social workers and officials of the Correction Center for their
cooperation and facilitation in the data collection process.
REFERENCES
Agnew, R. (2001). Building on the Foundation of General Strain Theory: Specifying the Types of Strain Most Likely to Lead to Crime and
Delinquency. Journal of Research in Crime and Delinquency, 38(4), 319-361.
Andargatchew Tesfaye. (1988). Crime problem and its correlation (Volume I). Addis Ababa: Addis Ababa University Press.

ERJSSH 2(1), June 2015
23
Andargatchew Tesfaye. (2004). Crime problem and its correlation (Volume II). Addis Ababa: Addis Ababa University Press.
Barnes, H., & Olson, D. (1982). Parent-adolescent communication and the
circumplex model. Child Development, 56, 438-447. Benda, B. (1995). The effect of religion on adolescent delinquency revisited.
Journal of Research in Crime and Delinquency, 32, 446-466. Brendgen, M., Vitaro, F., & Bukowski, W. (2000). Stability and variability of
adolescents’ affiliation with delinquent friends: predictors and consequences. Social development, 9(2), 205-25.
Burkett, S., & Warren, B. (1987). Religiosity, peer associations and adolescent
marijuana use: A panel study of underlying causal structure. Criminology, 25, 109-131.
Centers for Disease Control and Prevention. (2005). Youth Risk Behavior Surveillance United States. Morbidity and Mortality Weekly Report, 55(5), 1-108.
Cernkovich, S., & Giordano, P. (1987). Family relationship and delinquency. Criminology, 25, 295-319.
Clar, R., & Shields, G. (1997). Family Communication and Delinquency.
Adolescent, 32, 81-91. Daniel Wondimu. (2004). Crime Incidence in Addis Ababa with an Emphasis on
the Nature, Spatial Pattern, Causes, Consequences and Possible Remedies (doctoral dissertation, Addis Ababa University).
Di Clemente, R., Wingood, G. & Crosby, R. (2001). Parental monitoring: Association with adolescents’ risk behaviors. Pediatrics Journal, 107(6), 1363-68.
Elifson, K., Petersen, D., & Hadaway, C. (1983). Religiosity and delinquency.
Criminology, 19, 505-527. Gottfredson, M., & Hirschi, T. (1990). A general theory of crime. Stanford CA:
Stanford University Press. Hadaway, C., Elifson, K., & Petersen, D. (1984). Religious involvement and
drug use among urban adolescents. Journal for the Scientific Study of Religion, 23, 109-128.
Hall, T., & Edwards, K. (2002). The spiritual assessment inventory: a theistic model and measure for assessing spiritual development. Journal for the scientific study of religion, 41, 341-357.
Hawkins, J., Catalano, R., & Miller, J. (1992). Risk and protective factors for alcohol and other drug problems in adolescence and early adulthood: Implications for substance abuse prevention. Psychological Bulletin, 112, 64-105.
Hirschi, T. (1969). Causes of Delinquency. Berkeley, CA: University of California Press.
Hudson, W. (1990). Mutil-problem screening inventory (MPIS) (Friends’ national resources center for community based child abuse prevention). Retrieved from www.friendsnrc.org.
Jang, S., & Johnson, B. (2001). Neighborhood disorder, individual religiosity, and adolescent use illicit drugs: A test of multilevel hypotheses.
Criminology, 39, 109-143. Jensen, G. (1995). Salvaging Structure through Strain: A Theoretical and
Empirical Critique. In F. Adler & W. S. Laufer (Eds.), The Legacy of Anomie Theory. Advances in Criminological Theory (pp. 139-158). New Brunswick, NJ: Transaction.
Johnson, B., Jang, S., Larson, D., & Li, S. (2001). Does adolescent religious

ERJSSH 2(1), June 2015
24
commitment matter?: A reexamination of the effects of religiosity on delinquency. Journal of Research in Crime & Delinquency, 13, 22-44.
Johnson, B., Larson, D., Li, S., & Jang, S. (2000). Escaping from the crime of inner cities: Church attendance and religious salience among
disadvantaged youth. Justice Quarterly, 17, 377-391. Johnson, B., Li, S., & Larson, D. (2000). A systematic review of the religiosity
and delinquency literature: A research note. Journal of Contemporary Criminal Justice, 16, 32-52.
Joseph, J. (1996). School factors and delinquency: A study of African American youths. Journal of Black Studies, 26, 340-355.
Junger-Tas, J., Marshall, I. H, Enzmann, D, Killias., M, Steketee, M., &
Gruszczynska, B. (2010). Juvenile delinquency in Europe and beyond: Results from the second international self-report study. Dordrecht: Springer.
Krohn, M., & Massey, J. (1980). Social control and delinquent behavior: An examination of the elements of the social bond. Sociological Quarterly, 2, 529-543.
Lawrence, R. (1985). School performance, containment theory, and
delinquency behavior. Youth & Society, 17, 69-95. Marte, R. M. (2008). Adolescent Problem Behaviors: Delinquency, Aggression,
and Drug Use. New York, NY: LFB Scholarly Publishing. Matsueda, R., & Heimer, K. (1987). Race, family structure, and delinquency: A
test of differential association and social control theory. American Sociological Review, 52, 102-110.
Nas, C. N., De Castro, B. O., & Koops, W. (2005). Social information processing in delinquent adolescents. Psychology, Crime & Law, 11(4), 363-75.
National Research Council and Institute of Medicine (2001). Juvenile Crime, Juvenile. Panel on Juvenile Crime: Prevention, Treatment, and Control. Committee on Law and Justice and Board on Children, Youth, and Families. Washington, DC: National Academy Press.
Nega Jibat & Berhanu Nigussie (2014). Crime situations and reactions of criminal justice system in Oromia, Ethiopia. Global journal of human social sciences, 14(1), 73-79.
Nega Jibat & Berhanu Nigussie (2015). Criminality and Victization in Oromia, Ethiopia: Analysis of 2011/2012 Police Data. SAGE Open, 1-13. doi: 10.1177/2158244014565335
Nisa, M., Ullah S., Ali, M., & Alam, S. (2015). Juvenile Delinquency: The Influence of Family, Peer and Economic Factors on Juvenile Delinquents. Applied Science Reports, 9(1), 37-48. doi: 10.15192/PSCP.ASR.2015.9.1.3748
Pearce, L., & Haynie, D. (2004). Intergenerational religious dynamics and adolescent delinquency. Social Forces, 82(4), 1553-72.
Rankin, J., & Wells, E. (1990). The effect of parental attachments and direct
controls on delinquency. Journal of Research in Crime and Delinquency, 27, 140-165.
Regoli, R. M., & Hewitt, J. D. (2006). Delinquency in society (6th ed.). New York: McGraw Hill.
Rhodes, J., & Jason, L. (2005). A social stress model of substance abuse. Journal of Consulting and Clinical Psychology, 58, 359-401.
Sampson, R. (1997). Urban Black Violence: The Effect of Male-Joblessness
and Family Disruption. American Journal of Sociology, 93, 348-82.

ERJSSH 2(1), June 2015
25
Sampson, R., & Byron, G. (1989). Community Structure and Crime: Testing Social Disorganization Theory. American Journal of Justice Quarterly, 17, 377-391.
Sampson, R., & Groves, W. (1989). Community structure and crime: testing
social disorganization theory. American Journal of Sociology, 94, 774-802. Shamim, A., Batool, Z., Zafar, M. I., & Hashmi, N. (2009). A Study of Juvenile
Crimes in Borstal Jail, Faisalabad, Pakistan. Journal of Animal and Plant Sciences, 19(2), 101-103. Retrieved from http://www.thejaps.org.pk/docs/19-2-%202009/09-930.pdf
Shield, J. (1984). Religion and delinquent behavior: A study of adolescents (unpublished dissertation, The Catholic University of America).
Shoemaker, D. (1996). Theories of Delinquency: An Explanation of Delinquent Behavior. New York, NY: Oxford University Press, Ins.
Siegel, J. (2003). Criminology (8th ed.) Belmont, CA: Wadsworth/Thomson Learning.
Singer, M.I., Flannery, D.J., Guo, S., Miller, D., & Leibbrandr, S. (2004). Exposure to violence, parental monitoring, and television viewing as contributors to children’s psychological trauma. Journal of Community Psychology, 32(5), 489-504. doi: 10.1002/jcop.20015
Stern, S., & Smith, C. (1997). Reciprocal relationship between antisocial behavior and parenting: Implication for delinquency intervention. Families in Society. The Journal of Contemporary Human Services, 80(2), 169-181.
Steve, N., Maurice, J., Veronica, T., & Jane, S. (2005). Youth Violence, Juvenile Crime and Youth Gangs in Utica, NY. New York, NY: Utica Safe Schools/ Healthy Partnerships, Inc.
The Cambridge Dictionary of Psychology (2009). New York: Cambridge University Press.
Thornberry, T. P., Lizotte, A. J., Krohn, M. D., & Farnworth, M. (1991). Testing Interactional theory: An examination of reciprocal causal relationships among family, school, and delinquency. Journal of Criminal Law and Criminology, 82(1), 3-35. Retrieved from http://scholarlycommons.law.northwestern.edu/cgi/viewcontent.cgi?article=6689&context=jclc
Wellman, B., & Berkowitz, D. (1988). Social Structures: A Network Approach. Cambridge: Cambridge University Press.

ERJSSH 2(1), June 2015
26

ERJSSH 2(1), June 2015
27
INTRODUCTION
Recent assessments indicate that climate change is already having an
impact on crop yields across several regions of the world. Although positive
impacts are observed in some regions, negative consequences are more
common globally on aspects of food security, freshwater, health, nutritional
quality and safety of food, biodiversity, and ecosystems.
Ethiopia is one of the sub-Saharan Africa countries situated in the Horn of
Africa. Climate change and variability have posed critical implications for the
country’s agriculture, water, health and forestry. Indeed, Ethiopia is among
the most vulnerable entities to climate variability and extremes, given that
only a small proportion of its cultivated land used for food production is
through irrigation (Temesgen Deressa et al., 2006). The majority of the
population is engaged in rain-fed traditional farming systems and economic
development is heavily reliant on agriculture, and natural resources, which
are more sensitive to climate change. Thus, vulnerable livelihoods and
national economic growth are likely to be highly affected by climate
ORIGINAL ARTICLE
CROP SENSITIVITY TO INTER-ANNUAL CLIMATE VARIABILITY IN
LAY GAYINT WOREDA, NORTHWEST ETHIOPIA
Addisu Baye1 and Menberu Teshome2
ABSTRACT
Scientific evidence indicates that climate change has posed profound effects on the
wellbeing of citizens in countries throughout the world. Its impact is even stronger on the
poor having limited capacity to cope-up with it. In Ethiopia, climate change risks such as
droughts, floods and other extreme weather events have threatened the overall
sustainability of agricultural production and, in turn, the status of food security. The
objective of this study is to examine crop sensitivity to inter-annual climate variability in
Lay Gayint woreda, South Gondar Zone of Amhara Region. Simple regression and
drought susceptibility indices were used to analyze the data. The statistical analysis of
the climate data revealed an increase in temperature, and decrease and/or erratic
distribution in rainfall. Based on these findings the paper encourages strategies that
can enhance the ability of farmers and soil productivity. Additionally, water
conservation projects with the active participation of the rural communities are
considered as essential.
Keywords: climate variability, crop production, crop sensitivity, drought susceptibility
1. Lecturer at the Department of Development and Environmental Management Studies, University of Gondar, Ethiopia. Corresponding author. Email:
[email protected]. 2. Assistant Professor at the Department of Geography and Environmental Studies,
University of Gondar, Ethiopia.

ERJSSH 2(1), June 2015
28
variability and extreme weather events can be expected to have adverse
consequences on poverty reduction and development efforts (Girma Mamo &
Fekadu Getatchew, 2010).
According to Girma Mamo and Fekadu Getatchew (2010), a recent mapping
on vulnerability and poverty in Africa categorized Ethiopia in the group of
the most vulnerable countries to climate variability and change with heavy
dependence on agriculture (crops and livestock production). Climate
variability and the resultant deterioration of natural resource bases have
challenged Ethiopia’s entrance to the new millennium with high hopes of a
renaissance and a dream of better life for all citizens in the coming decades.
Climate variability and change will continue to affect the country’s
agriculture, water resources, biodiversity and ecosystems. Hence, it will
threaten the livelihood of the people; large sections of the populations
residing in the lowlands and highlands will probably face increasing
suffering in the coming decades (Seyoum Mengistu & De Stoop, 2007).
In Ethiopia, rain-fed dependent agriculture is very sensitive to fluctuation in
climatic conditions. Even if productivity grew, climate change would still
have a dramatic impact. The effects of climate variability on agricultural
productivity may reduce the Ethiopian average income by as much as 30
percent within the next 50 years (Mahmud Yesuf et al., 2008). Moreover, it
has led to shortage of food and increased human and livestock health risks,
rural-urban migration and dependency on external support (National
Meteorological Agency, 2007).
The Amhara region is known for its crop production in the country and is
characterized by high rainfall from mid June to early September. Over 85%
of the economically active population is engaged in the agricultural sector.
However, some parts of the region, especially the northeast, are exposed to
shortage of rainfall, which is less than 700 mm per year (Center for Disease
Control and Prevention, 2008) and shortage of food throughout the year.
Many woredas located in North and South Gondar zones, East Gojjam and
North Shewa administrative zones were surplus-producing areas before two
decades. But now they have already become food insecure and highly
vulnerable to climate variability (Melesse, 2007). Thus, out of the eleven
woredas of South Gondar administrative zone, five woredas, namely
Simada, Ibnat, Lay Gayint, Tach Gayint and Libokemkem, were considered
drought-affected (Marye, 2011). Lay Gayint woreda is one of the areas where
the localized temporal rainfall and temperature variation during cropping
season induces an important challenge to crop production. According to the
information obtained from the Lay Gayent woreda Agriculture and Rural
Development Office (2010), extreme weather events such as increased
flooding, droughts, insect outbreak, spreading of alien weeds, disease, and
pests are aggravating food insecurity; in consequence, all communities need
to enhance their adaptive capacity to combat the present and future
challenges of climate variability and extreme weather events (Adger et al.,
2003).

ERJSSH 2(1), June 2015
29
Several studies have shown that climate change has the potential to have a
severe negative impact on human welfare, natural resources and
development activities in the country (Alebachew Adem & Woldeamlak
Bewket, 2009; Mahmud Yesuf et al., 2008; Temesgen Deressa et al., 2006).
However, most of these studies were carried out at macro-levels. Unless the
effect of climate variability is understood by the local people at the micro-
level with the right perception, it would be difficult to convince and motivate
local communities to undertake adaptation actions. Although the climate-
change research community has identified different adaptation methods, the
specific climatic characteristics of a particular area dictates the need for a
specific adaptation method to climate variability and change. Moreover, the
previous studies greatly focused on technology development without due
consideration to climate variability.
Climate variability responsive research aimed at providing farmers with
technological recommendations for adaptation has been up to the present
typically very small. To minimize the impact and reduce vulnerability of the
agricultural sector to the predicted change research aimed at evaluating and
availing adaptation strategies at local and community level is an urgent
priority. There is a need to monitor climate variability and integrate it with
policies for research and development in order to prepare Ethiopia to the
projected changes. An understanding of the local effects of recent climate
trends on crop yields will help to anticipate effects of future climate
variability on food self-sufficiency of the study area. This study will examine
crop sensitivity to inter-annual climate variability in Lay Gayint woreda,
South Gondar Zone of Amhara Region.
STUDY AREA
The study was conducted in Lay Gayint woreda, which is located in South
Gondar Zone of Amhara Regional State. It is one of the ten woredas of South
Gondar zone covering an area of 1320.31 km2 and sub-divided into twenty
nine rural and two urban kebeles (the lowest administrative tier in Ethiopia).
The woreda is bordered by Mekiet woreda in the east, Ebinat and Bugina in
the north, Estie and Farta in the west and Simada and Tach Gayint in the
south. The woreda lies within the geographical grid coordinates of 11°32’-
12°16’ N latitude and 38°12’-38°19’ E longitude (Lay Gayint woreda
Agriculture and Rural Development Office, 2011).
The total area of the woreda is about 154,866 hectares with a crude
population density of 157 persons per km2. The area has very steep valley
and incised stream channels with slopes ranging from 30.5% to 50%. The
major land use patterns of the study area comprise cultivated land (44.32%),
grazing land (14.31%), forest/bush land (5.26%), water body (2.38%)
infrastructure and settlement (5.92%), and unproductive land (28.44%)
(Table 1).
The topography of the woreda is mostly characterized by a chain of
mountains, hills and valleys extending from Tekeze Gorge (1500) to the

ERJSSH 2(1), June 2015
30
summit of Guna Mountain (4230 meters above sea level). It is characterized
by flat (10%), 50% undulating (50%), mountainous (15%) and gorges and
valleys (5%). Agro-ecologically, the woreda is divided into four elevation and
temperature zones, namely: lowland (kolla) (12.5%), midland (woina-dega)
(39.42%), highland (dega) (45.39%), and wurch (very cold or alpine) (2.71%).
Figure 1: Location map of the study area Source: Computed based on Ethio-GIS database.
Table 1: Distribution of land use/cover of Lay Gayint woreda
Land use type Ha %
Cultivated land (annual crops) 68,649 44.32
Grazing land 22,160 14.31
Bush and shrubs 8,150 5.26
Water body 3,665 2.36
Uncultivated land 44,041 28.44
Infrastructure, settlement & others 8,201 5.29
Total 154,866 100.0
Source: Finance and economic development program of south Gondar, 2010.
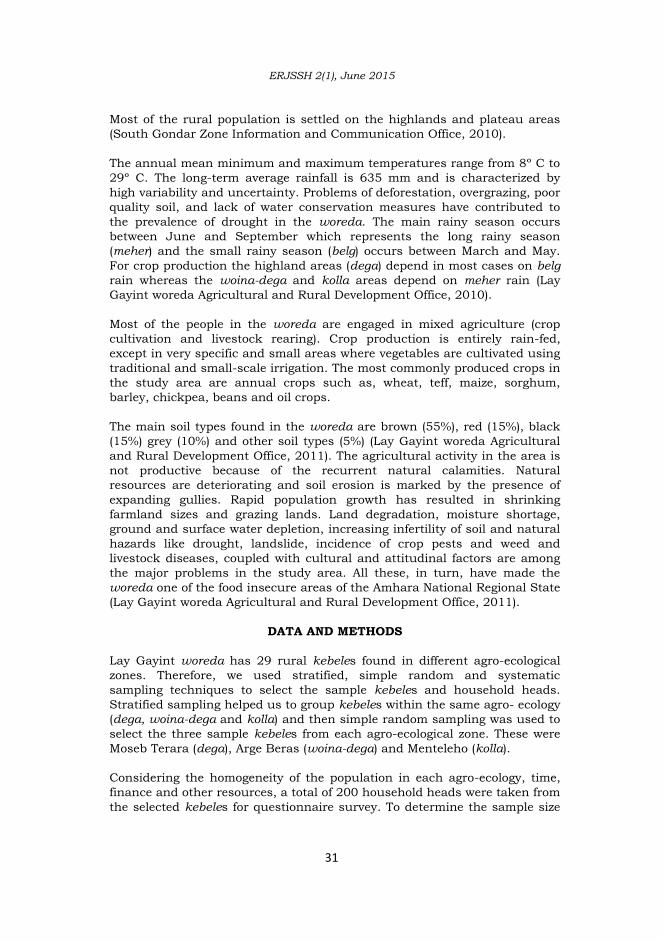
ERJSSH 2(1), June 2015
31
Most of the rural population is settled on the highlands and plateau areas
(South Gondar Zone Information and Communication Office, 2010).
The annual mean minimum and maximum temperatures range from 8º C to
29º C. The long-term average rainfall is 635 mm and is characterized by
high variability and uncertainty. Problems of deforestation, overgrazing, poor
quality soil, and lack of water conservation measures have contributed to
the prevalence of drought in the woreda. The main rainy season occurs
between June and September which represents the long rainy season
(meher) and the small rainy season (belg) occurs between March and May.
For crop production the highland areas (dega) depend in most cases on belg
rain whereas the woina-dega and kolla areas depend on meher rain (Lay
Gayint woreda Agricultural and Rural Development Office, 2010).
Most of the people in the woreda are engaged in mixed agriculture (crop
cultivation and livestock rearing). Crop production is entirely rain-fed,
except in very specific and small areas where vegetables are cultivated using
traditional and small-scale irrigation. The most commonly produced crops in
the study area are annual crops such as, wheat, teff, maize, sorghum,
barley, chickpea, beans and oil crops.
The main soil types found in the woreda are brown (55%), red (15%), black
(15%) grey (10%) and other soil types (5%) (Lay Gayint woreda Agricultural
and Rural Development Office, 2011). The agricultural activity in the area is
not productive because of the recurrent natural calamities. Natural
resources are deteriorating and soil erosion is marked by the presence of
expanding gullies. Rapid population growth has resulted in shrinking
farmland sizes and grazing lands. Land degradation, moisture shortage,
ground and surface water depletion, increasing infertility of soil and natural
hazards like drought, landslide, incidence of crop pests and weed and
livestock diseases, coupled with cultural and attitudinal factors are among
the major problems in the study area. All these, in turn, have made the
woreda one of the food insecure areas of the Amhara National Regional State
(Lay Gayint woreda Agricultural and Rural Development Office, 2011).
DATA AND METHODS
Lay Gayint woreda has 29 rural kebeles found in different agro-ecological
zones. Therefore, we used stratified, simple random and systematic
sampling techniques to select the sample kebeles and household heads.
Stratified sampling helped us to group kebeles within the same agro- ecology
(dega, woina-dega and kolla) and then simple random sampling was used to
select the three sample kebeles from each agro-ecological zone. These were
Moseb Terara (dega), Arge Beras (woina-dega) and Menteleho (kolla).
Considering the homogeneity of the population in each agro-ecology, time,
finance and other resources, a total of 200 household heads were taken from
the selected kebeles for questionnaire survey. To determine the sample size

ERJSSH 2(1), June 2015
32
for each kebele, the statistical formula of Tare Yamane referred in Israel
(1992) was used. The total sample size was allocated for the three kebeles
using probability proportional to size method by the following formula:
Where, ni= the total sample for ith stratum
Ni= represents total households of each kebele
S= refers total number of sampled household in the study area
∑N =refers to Summation of total number of households in the study area
The list of households registered was obtained from the representative
kebele administrations and local development agents. From these the
sample households were obtained using systematic random sampling
method.
Two research designs (cross-sectional and longitudinal designs) and two
data sources (primary and secondary sources) were employed to generate
data for this study. Cross-sectional designs were followed to gather
information from farming households using a questionnaire survey at a
point in time. Longitudinal designs were used to record monthly climatic
values from the Ethiopian National Meteorological Agency and other
governmental and non-governmental offices. The primary data were gathered
No Selected
kebeles in the
study areas
Agro-ecological
zone
Number of
population
Number of
household
heads
Sampled
household
heads
1 Moseb Terara Highland
(dega)
4410 682 84
2 Arge Beras Midlands
(woina-dega)
5835 767 94
3 Menteleho Lowlands 1092 182 22
Total 11,337 1631 200
Source: Lay Gayint woreda Agricultural and Rural Development office, 2011.
Table 2: Distribution of sample kebeles and household sample size

ERJSSH 2(1), June 2015
33
from January to February (2012) using structured questionnaire surveys of
200 rural households, field observations and key-informant interviews.
Secondary data used in the research were assembled from both published
and unpublished sources available at different government offices. The
major data in this case was a longitudinal time series monthly precipitation
record (1980-2010) based on daily data for gauged stations obtained from
the Ethiopian National Meteorological Agency (Bahir Dar Branch) and crop
production and land-use data from the woreda Agriculture Office.
The data gathered through different methods were analyzed using
descriptive statistics (mean, percentage) and drought susceptibility index.
Draught susceptibility index (DSI) was used to analyze the collected data to
predicted yield stability of different crops, resulting from the yield difference
between strain and non-strain situation. DSI was calculated on the bases of
differences between yields under non-stress condition to the stress
conditions based on Rashid et al. (2003).
DSI=(1−YdYn)/D
Where, DSI = Drought susceptibility index, Yd = average yield of each crop
under drought and Yn = average yield of each crop under non-drought/
normal conditions. While D = 1 – (Yd/Yn), whereas D is environmental
pressure/strain, Yd= average yield of all crops under drought and Yn=
average yield of all crops under non-drought/normal conditions. This index
provides a measure of relative drought tolerance based on minimization of
yield loss under drought. Values >1.0 indicate greater than average drought
susceptibility while values <1.0 indicate greater than average drought
resistance. This was analyzed with the Statistical Package for Social
Sciences (SPSS) and Microsoft Excel.
RESULTS AND DISCUSSION
Agricultural and farming practices
Like in many parts of Ethiopia, the farming system in the survey sites is still
very much traditional relying on plough and yoke (animal-drawn power). It
thus demands major means of labour production during land preparation,
planting and post-harvest processing. It is also evident that out of the total
sample households, 54.5% practice crop farming while 40.0% practice mixed
farming (Table 3). The remaining 4.0% of the respondents were involved in
other activities.
The agricultural sector in Ethiopia is the mainstay of the economy. It
provides the livelihood of large segments of the population. This sector is
mainly rain-fed, relying on relatively backward technologies. Hence,
production and productivity remain extremely low (Degefe Befekadu &
Berhanu Nega, 2000). Rain-fed agriculture is a common practice for many
farming households (81.5%), with only 12.5% using both rain-fed and
irrigated water to grow their crops (See Table 3).

ERJSSH 2(1), June 2015
34
Climate variability
Scholars worry about climate change. Different researchers have concluded
that Ethiopian climate is changing. Still the rate of change differs within
localities and it is difficult to conclude that the change is homogenous
throughout the country. In this section the trends of climate variability
(temperature and rainfall) of the woreda are briefly analyzed based on
historical meteorological data using line graphs. Moreover, farmers’
perception to climate change and variability in their locality is presented in
this section (Figures 2 and 3).
The two climate elements (temperature and rainfall) were considered for
analysis because of their importance for agriculture as well as data
availability. Monthly rainfall and temperature data from 1979 to 2010 for
Nefas Mewucha meteorological station were obtained from National
Meteorological Agency. However, rainfall data for some months of the year
were missing. Hence, the missing values for the rainfall and temperature
records at the station level were interpolated and replaced using SPSS
software.
Trend analysis and evaluation of the changes in major climate variables were
crucial. To establish a priori evidence for existence of climate variability in the
study area, temperature and rainfall were taken. According to meteorological
data, the trend line estimated for average annual maximum temperatures in
the study area was y = 0.0745x + 25.923. The trend line had a positive slope
indicating the maximum temperature increased by 2.31º C over the time
period of 1979 to 2010 (Figure 2). The analysis of temperature data obtained
from the National Meteorological Agency tends to support the perception of a
majority of respondents regarding increasing temperature trend.
Similarly, the estimated trend line for average annual minimum temperature
was y = 0.0277x + 9.3238 (Figure 2). The trend line has a positive slope
indicating that over the last three decades the minimum temperature rose by
0.86º C. This finding is consistent with studies by Tadege (2007), who states
that the average minimum and maximum temperatures has increased by
Table 3: Distribution of agricultural and farming practices of sample household
Variables Freq. %
Farming practice
Crop farming 109 54.5
Mixed farming 80 40.0
Others 8 4.0
Agricultural
practice
Rain-fed 163 81.5
Rain-fed and irrigated 25 12.5
Others 6 3.0
Source: Survey result, 2013.

ERJSSH 2(1), June 2015
35
0.25º C and 0.1º C respectively over the past decades, whereas the rainfall is
characterized by very high levels of variability over the past 50 years. The
range and duration of temperature is crucial to growth and productivity in
the agricultural sector. According to Intergovernmental Panel on Climate
Change (2001) an increase in average temperature will adversely affect
crops, where already heat is a limiting factor of production.
In terms of rainfall, analysis of data from National Meteorological Agency
(2007) indicated that the average annual rainfall for the period 1979-2010
was 635.7 mm with standard deviation of 145.37 mm. The highest annual
average precipitation (890.48 mm) was recorded in 1987, whereas the lowest
(482.6 mm) was recorded in 2002. As stated in Figure 3, the trend line
estimated for average annual rainfall in the study area was y = -8.4956x +
775.88 with a slope of -8.4956, the estimated trend line is negative and the
average annual rainfall decreased by -263.36 mm through the period 1979-
2010. The analysis showed that perceptions of farmers with respect to
decreasing trends of rainfall was in line with empirical analysis of rainfall
trends using the data obtained from the meteorological stations.
In Ethiopia changes in rainfall are likely to affect agricultural productivity,
food and water security, livelihoods and economic growth. Crop yield is
strongly correlated with rainfall variability. Thus, the amount and temporal
distribution of rainfall is the most important factor in determining national
crop production levels (Girma & Fekadu, 2010).
Figure 2: Trends of annual average maximum and minimum temperature in the study area Source: National Meteorological Agency, 2011.

ERJSSH 2(1), June 2015
36
According to the Intergovernmental Panel on Climate Change (2001), there
are no statistically significant trends in rainfall. However, more recent
research results suggest that rainfall during the ‘long-rains’ decreased.
Ethiopia’s climate, in particular, is highly variable and there is a need to
tackle existing climate risks effectively, as well as to plan for future changes.
In addition to variations across the country, the climate is characterized by a
history of climate extremes such as drought and flood as well as increasing
trends in temperature and decreasing trends in precipitation (Ministry of
Agriculture, 2000).
Crop production trend
Ethiopia’s crop agriculture is complex. It often involves substantial variation
in crops grown across the country’s different regions and ecologies. It
continues to be dominated by the country’s numerous small farms that
cultivate mainly cereals for both own-consumption and sales. Five major
cereals (teff, wheat, maize, sorghum and barley) are the chief source of food.
These account for about three-quarters of the total cultivated area (Central
Statistical Agency, 2012).
In Lay Gayint woreda, crop production is characterized by rain-fed,
traditional, small scale, subsistence orientated and labor intensive based on
family labor. Different types of crops such as cereals, pulses and oilseeds as
well as root crops like potatoes are cultivated in accordance with the
diversity of climatic and soil conditions. The woreda’s agricultural office has
given high priority to the agricultural sector and has taken major steps to
improve its efficiency. However, various problems are holding this back. One
major cause of underproduction is climatic extremes such as drought and
floods. Temperature and precipitation are two of the primary factors of the
Figure 3: Annual rainfall trend and variability of Lay Gayint woreda Source: National Meteorological Agency, 2011.

ERJSSH 2(1), June 2015
37
quality and quantity of crop yield in a given year. Variations in either
temperature or precipitation can significantly alter the outcome of crop
productivity (Intergovernmental Panel on Climate Change, 2001). Often crop
failure results in famine. Such climate-related disasters made the area remain
dependent on food aid for the past two years. According to the agricultural
office, at the present time even if productivity would grow, climate change
would still have a dramatic impact.
As can be seen from Figure 4, there is high variability in crop production
trend. The crop production declined in 2000/01, 2002/03, 2004/05 and
2009/10, which is mainly attributed to extreme weather events such as
drought, late onset, erratic rain and early offset of the rain. Alebachew Adem
and Woldeamlak Bewket (2011) noted that besides the very low levels of
productivity, Ethiopian agriculture is characterized by wide fluctuations in
total output from year to year. The year-to-year fluctuations are caused
mainly by the inter-annual rainfall variability. The highest crop productions
were recorded in 2010/11 and 2012/13. The report regarding crop production
trend from Lay Gayint woreda Agricultural and Rural Development office was
contrary to the view of farmer’s perception on trends of crop production in the
study area. That means gaps between official agricultural statistics and
households’ responses regarding crop yield were identified. The kebele
agricultural experts, reported 40 – 70 quintals of crop yield per hectare in the
fragile land of the study sites which is quite implausible and hence not useful
to substantiate the findings on crop yield.
Experts working in the field have a tendency to inflate production figures
because their work performance is mostly evaluated based on the reported
figures. Triangulation was done by taking this report to older household
heads. They absolutely rejected the experts’ reports. Information provided by
the households does justify that crop yields are gradually going down in their
locality though it seems somewhat deflated for outside observers and general
national observers. In addition, as they were born, grew up, and worked in the
farming households, crop yield is going down particularly in the fragile
landscapes of northern Ethiopia. Triangulation was also done through visiting
the households when they harvested and threshed their crops in the field,
which further justified the households’ responses.
The above results do not mean that there is no growth in total production of
the country. Indeed, growth in total agricultural production has been observed
in some households living in modest environmental conditions, thanks to new
technology packages, good land management practices and irrigation that
increased crop productivity over time. However, some scholars also related the
effectiveness of new technology packages (at least partially) in boosting crop
production with good weather conditions (Alemayehu Seyoum Taffesse et al.,
2011). They also argued that rather than technology adoption, the major
factor behind the growth of total production in Ethiopia has been the
expansion of cultivated land area. For example, grain production has
registered a growth of 74%, with yield growing by only 18% and area
cultivated by 51% between 1989/90 and 2003/04. From 1994 to 2002, 70%

ERJSSH 2(1), June 2015
38
of cereal production increases resulted from expansion of cultivated land
area (Alemayehu Seyoum Taffesse et al., 2011) and it is in an increasing
trend in recent years. However, cultivable lands are already exhausted in the
study area, so that there is no possibility of expanding agricultural land by
households. Hence, the results seem logical for the fragile landscapes of
northern Ethiopia where rain-fed crops are more sensitive to climatic
anomalies. Rainfall variability is important determinant contexts of
livelihoods of the community in Ethiopia. A favourable climate is needed in
order to keep a sustainable agricultural production that affords better
livelihoods to the households.
For rural communities, crop production constitutes one of the major sources
of livelihood. Farmers in the study area grow a diverse range of crops as it is
shown in Table 4. The data obtained from household survey indicates that
wheat, teff, barley, bean and pea are the major crops grown by the majority
of the respondents. However, the proportion of farmers that are growing
haricot bean and sunflower are few in number.
In the study area, drought, pests and disease, and soil erosion are recurring
problems affecting agricultural activities and human wellbeing. Significantly,
farmers pointed out that the yield of their fields is declining from year to
year.
Drought has been a recurring phenomenon in Ethiopia for millennia, being
recorded at least as early as 253 B.C. Modern rainfall records for Ethiopia
Figure 4: Crop production trend in Lay Gayint woreda Source: Lay Gayint woreda Agricultural and Rural Development office, 2012.

ERJSSH 2(1), June 2015
39
have demonstrated large differences from year to year as well as great local
variability (Fasil G. Kiros, 1993). The effects of drought in Ethiopia in the
last two decades have been drastic (10-100% yield loss). Prolonged drought
has lowered production of major food crops, resulting in an acute and
recurrent shortage of food. The farmer’s ability to adjust to drought depends
upon available technology and the production system in use (Habtamu
Gessesse, 1999).
Table 4: Average yield of major crops and land allocation for the 2011/2012 meher
season
Major crops Area coverage in ha Average productivity yield/ha
Wheat 58.97 10.67
Teff 30.42 15.83
Barley 26.88 8.39
Pea 24.99 13.33
Beans 15.38 13.51
Lentil 11.94 18.80
Sorghum 8.00 8.70
Chickpea 2.75 13.00
Haricot bean 2.00 11.15
Sunflower 1.38 14.05
Source: Survey result, 2013.
Table 5: Productivities of major crops under non drought conditions (Yn) and drought conditions (Yd) and corresponding DSI in 2011/12 growing year
Major crops Productivity/ha in non-drought condition (Yn)
Productivity/ha in drought condition (Yd)
Drought suscepti- bility Index (DSI)
Wheat 5.03 1.87 0.96
Teff 2.76 1.07 0.94
Barley 5.65 1.81 1.04
Pea 3.05 0.90 1.08
Beans 3.19 1.02 0.90
Lentil 2.64 1.10 0.90
Sorghum 5.70 2.56 0.85
Chickpea 3.80 1.40 0.97
Haricot bean 1.39 0.56 0.91
Sunflower 1.88 0.94 0.77
Mean yield 3.51 1.33
Source: Survey result, 2013.

ERJSSH 2(1), June 2015
40
A dimensionless slope termed drought susceptibility index (DSI) was
suggested by Fischer and Maurer (1978) as a useful way of comparing crop
yield performances between drought levels and non-drought condition and a
measure of yield stability. It expresses the separate effects of yield potential
and drought susceptibility on yields under drought. In these terms, lower
drought susceptibility is considered synonymous with higher drought
resistance.
Drought susceptibility index values ranged from 0.77 to 1.08 (Table 5). The
result indicates that barley and pea are relatively drought susceptible (DSI
>1.0), while wheat, teff, beans, lentils, sorghum, chickpea, haricot bean and
sunflower were relatively drought resistant (DSI <1.0). Crops with DSI values
<1.0 can be considered to be drought resistant, because they exhibited
smaller yield reductions under drought condition compared with non-
drought condition. This result is in accordance with Alebachew Adem and
Woldeamlak Bewket (2011), who state that drought is the major physical
challenge to agriculture in the Amhara National Regional State and the effect
of rainfall variability on crop production varies with the crops cultivated,
types and properties of soils and climatic conditions of a given area.
CONCLUSIONS
Like in most rural areas of Ethiopia the source of income for most of the
people in Lay Gayint woreda is agriculture, mainly crop production. It is
characterized by rain-fed, traditional, small scale, subsistence orientated
and labour intensive based on family labor. Due to the diversity of climatic
and soil conditions, different types of crops are grown, of which cereals,
pulses, oil seed and root crops like potatoes are the major ones. Drought is
the major constraint, which reduces the productivity of crop. However, there
is a greater variability for yield performance of different crops under drought
situation. Drought susceptibility index values ranged from 0.77 to 1.08
(Table 5). The result indicates that barley and pea are relatively drought
susceptible (DSI > 1.0), while wheat, teff, beans, lentils, sorghum, chickpea,
haricot bean and sunflower were relatively drought resistant (DSI < 1.0). The
study findings also indicated that all studied parameters have an important
role in drought tolerance and could be used effectively for selecting drought-
tolerant varieties particularly at reproductive stage.
ACKNOWLEDGMENTS
The authors wish to thank the farmers of Lay Gayint woreda for their
cooperation, the enumerators who patiently carried out the household
surveys, the experts at the Lay Gayint district office of agriculture, and
development agents at the specific study sites. We are also thankful to
Gondar Polytechnique College staff members for their indispensable moral
and material support. This study was supported financially by University of
Gondar. The paper has benefited substantially from anonymous reviewers.

ERJSSH 2(1), June 2015
41
REFERENCES
Adger, W. N., Huq, S., Brown, K., Conway, D., & Hulme, M. (2003).
Adaptation to climate change in developing world. Progress in
development studies, 3(3), 179-195.
Alebachew Adem & Woldeamlak Bewket. (2011). Mainstreaming climate
change adaptation into project planning and programme (paper
submitted to Norwegian Church Aid). Addis Ababa.
Alemayehu Seyoum Taffesse, Dorosh, P., & Sinafikeh Asrat. (2011). Crop
production in Ethiopia: Regional patterns and trends (ESSP II Working
Paper No. 0016). Addis Ababa & Washington DC. Retrieved from http://
www.ifpri.org/sites/default/files/publications/esspwp16.pdf
Center for Disease Control and Prevention. (2008). A report on inventory and
pre inventory at sixty four woradas in Amhara region. Bahir Dar.
Central Statstical Agency. (2012). The 2007 Population and Housing Census
of Ethiopia. Addis Ababa.
Degefe Befekadu & Berhanu Nega (2000). Annual report on the Ethiopian
economy (The Ethiopian economic association, vol.1. 1990-2000). Addis
Ababa.
Fasil G. Kiros. (1993). The subsistence crisis in Africa: The case of Ethiopia.
Root causes and challenges of the 1990s and the new century. [Addis
Ababa]: Organization for Social Science Research in Eastern Africa.
Finance and economic development programme of south Gondar. (2010).
2010/2011 budget year annual stastical bulletin (unpublished
document). Debre Tabor.
Fischer, R. A., & Maurer, R. (1978). Drought resistance in spring wheat
cultivars. I. Grain yield response. Australian Journal of Agricultural
Research, 29(5), 897-912. doi: 10.1071/AR9780897
Getatchew Abate, G. (2003). Early warning activities in Ethiopia (Early
warning department disaster prevention and preparedness
commission). Addis Ababa.
Girma Mamo & Fekadu Getachew. (2010, November). Climate change
projections for Ethiopia. In Policy Processes on climate change and
agriculture in Ethiopia: A Roundtable Discussion. Addis Ababa.
Habtamu Gessesse. (1999, December). Rainwater harvesting concepts and
issues. In Founding conference of the Ethiopian Rainwater Harvesting
Association. Addis Ababa.
Intergovernmental Panel on Climate Change (IPCC). (2001). IPCC Third
Assessment Report: Climate Change 2001 (TAR). Cambridge & New York.
Israel, G. G. (1992). Determining sample size (University of Florida/IFAS
Extension, PEOD6). Retrieved from https://edis.ifas.ufl.edu/pd006
Lay Gayint woreda Agricultural and Rural Development Office. (2010).
Annual report, 2010 (Unpublished document). Nefas Mewucha.
Lay Gayint woreda Agricultural and Rural Development office. (2011). Report
on agricultural activities in the woreda (Unpublished document). Debre
Tabor.

ERJSSH 2(1), June 2015
42
Mahmud Yesuf, Di Falco, S., Temesgen Deressa, Ringler, C., & Kohlin, G.
(2008). The Impact of Climate Change and Adaptation on Food Production
in Low-Income Countries: Evidence from the Nile Basin, Ethiopia (IFPRI
Research Brief 15-11). Retrieved from http://www.ifpri.org/sites/
default/files/publications/rb15_11.pdf
Marye, B. (2011). Local people’s perception on climate change, its impacts and
adaptation measures in Simada woreda of South Gondar (unpublished
master’s thesis, Addis Ababa University).
Melesse, Y. (2007). Challenges of livelihood and food security in Enebsie-Sar-
Midir Woreda of the Amhara Region, Ethiopia (unpublished master’s
thesis, Addis Ababa University).
Ministry of Agriculture. (2000). Agro ecological zonation of Ethiopia. Addis
Ababa.
National Meteorological Agency, Ministry of Water Resources. (2007). Climate
change national adaptation programme of action (NAPA) of Ethiopia.
Addis Ababa. Retrieved from http://unfccc.int/resource/docs/napa/
eth01.pdf
National Meteorological Agency (2011). Climate Change National Adaptation
Programme of Action for Ethiopia. Retrieved from http://unfccc.int/
resource/docs/napa/eth01.pdf
Rashid, A., Qadir, S., Ahmad, N., & Hussain Shah, K. (2003). Yield potential
and stability of nine wheat varieties under water stress conditions.
International journal of agriculture and biology, 5(1), 7-9. doi:1560-
8530/2003/05-1-7-9
Seyoum Mengistu & De Stoop, C. (Eds.). (2007). Environment for Survival:
Taking stock of Ethiopia's Environment. Proceedings: Green forum
conference nr. 1, Addis Ababa (Ethiopia), 2-4 October 2006. Addis Ababa:
Green Forum.
Tadege, A. (2007). Climate change national adaptation programme of action
(NAPA) of Ethiopia (FDRE, Ministry of Water Resources). Addis Ababa.
Temsgen Deressa, Hassan, R. M., & Ringler, C. (2006). Measuring Ethiopian
farmers’ vulnerability to climate change across regional states (IFPRI
discussion paper No. 806). Addis Ababa.

ERJSSH 2(1), June 2015
43
INTRODUCTION
Tourism can play a vital role in protecting the environment, conserving
biodiversity and maintaining sustainable development (UNEP & WTO, 2005).
Moreover, it has the power to enhance the environment, to provide fund for
conservation, to preserve culture and history, to set sustainable use limits
and to protect wildlife and add value to biodiversity (Mcintosh, Goeldner &
Richie, 1995). Ecotourism to biodiversity hotspots are estimated to be growing
at 100% a year and is considered as one of the most rapidly expanding
sectors of the travel industry (Environmental Grantmakers Association,
2008), and it is part of a growing niche market of the tourism industry. Its
contribution to the world economy has grown fast in recent years (United
Nations, 2001). community based tourism (CBT) emerged in the mid-1990s as
a generally small-scale initiative involving interactions between visitor and
host community particularly suited to rural and regional areas. CBT is
commonly understood to be managed and owned by the community, for the
ORIGINAL ARTICLE
COMMUNITY BASED ECOTOURISM AS A TOOL FOR BIODIVERSITY
CONSERVATION IN WUNANIA-KOSOYE NATURAL ATTRACTION SITE,
ETHIOPIA
Endalkachew Teshome1, Ascahalew Worku2 and Mulugeta Astery3
ABSTRACT
Tourism can play a vital role in protecting the environment, conserving biodiversity and
maintaining sustainable development. Furthermore, tourism has the power to enhance
the environment, to provide fund for conservation, to preserve culture and history, to set
sustainable use limits, to protect wildlife and to add value to biodiversity. In this paper, a
cross sectional study in Wunania, Kosoye, was used to describe the existing situations
and events in the area. For the study, both quantitative and qualitative methods were
employed. The study established that the local community’s awareness level of
biodiversity conservation and the economic significance of ecotourism in Wunania-Kosoye
natural attraction site was very high. Yet, this contrasted with a loss of biodiversity in the
last decades due to deforestation, uncontrolled grazing, and land degradation. The
research finding suggested that Community Based Ecotourism is becoming preferable
when it is compared with other alternative approaches for conserving biodiversity in
Wunania-Kosoye natural attraction site.
Keywords: community based ecotourism, Wunania-Kosoye, tourism, development
1. Associate Professor of Ecotourism in the Department of Tourism Management, College of Business and Economics, & Climate Change Research Center Coordinator,
University of Gondar. Corresponding author. Email: [email protected]. 2. Department Head for North Gondar Zone Environmental Protection and Land
Administration, Gondar. 3. Lecturer of Tourism studies in Department of Tourism Management, College of
Business and Economics, University of Gondar.

ERJSSH 2(1), June 2015
44
community, and is committed to making a low impact on the environment
and local culture, while helping to generate future employment for local
people (Timothy, 2002).
Community based ecotourism (CBET) serves as a means to conserve both
cultural & natural resources of the particular tourist attraction through
diversifying economic activities (Godfrey & Clarke, 2000). It contributes to
poverty reduction (Conservation International, 2003), to finance
infrastructure, and social amenities improvement (Denman, 2001). Moreover,
it is a source of employment opportunities for local communities (Aref, 2010;
Tisdell, 2003) and a means for creating educational opportunities (Bushell &
Eagles, 2007), while helping tourism to be viewed as a tool for community
development (Allen, Long & Perdue, 1993). CBET is managed and owned by
the community with the purpose of enabling visitors to increase their
awareness and to learn about the community as well as the local people’s
ways of life (Coward, 2001; Potjana, 2003).
Studies show that local community level of awareness, knowledge,
perception, participation and attitude are vital factors for successful CBET in
a particular destination (Ap & John, 1998; Teye, Sanmoz & Sirakaya, 2002;
Tosun, 2006; Wood, 2002). Increasing awareness of tourism interaction with
the environment should lead tourist destinations and tourism businesses to
behave environmentally responsibly (Richard & Hall 2000). As CBET is
exercised in a given area, local community members can organize themselves
and engage in the production and delivery of tourism services such as
cultural show, community lodge, local tour guiding, and producing and
selling of handicrafts (Strasdas & Zeppenfeld, 2008). However, the degree of
engagement of local people in such type of activities depends on their level of
awareness (Fenta & Mekonnen, 2009). According to Teye, Sanmoz and
Sirakaya (2002), miscommunication and wrong perceptions of local
community can be the major barriers to regional tourism development
projects. They argue that local community support is crucial for the
successful completion of CBET projects.
Although Wunania-Kosoye natural attraction has a huge potential for the
development and implementation of ecotourism, its contributions to the
tourism sector is low. As a result, the major sources of community livelihood
are subjected to only subsistence agriculture with traditional farming
practices (Negash et al., 2010). Studies show that even though only 20% of
the Wunania-Kosoye area is suitable for cultivation, more than 47% of the
total area has been cultivated (North Gondar Zone Culture Tourism
Department & Amhara National Regional State-CTPDB, 2010). So about 27 %
of the cultivated lands are either steep slope or degraded lands. To improve
the livelihood of the community and protect the natural attraction site from
further degradation a preferable economic activity of the area would be
CBET.Introducing and developing CBET in a natural attraction site like
Wunania–Kosoye has such important advantages as maintaining biodiversity
and promoting sustainable development; ecotourism is a travel that concerns
itself with the flora, fauna, geology, and the ecosystems of an area as well as

ERJSSH 2(1), June 2015
45
the people who live in and nearby the natural attraction (Fennel, 2002).
OBJECTIVES AND METHODS
The objective of this research was to describe the awareness and perception
of the local community in Wunania-Kosoye of CBET and biodiversity
conservation. Wunania-Kosoye is situated at 12°45’02.8” N latitude and 37°
32’26.4” E longitude in the northwestern highland with altitudes ranging
from 1500m to 3200m above sea level. It extends from Chirambezo kebele in
Lay Armachiho to Kosoye Ambaras kebele in Wegera woreda. It is found
along the historical tourist route from Gondar to the Simen Mountains
National Park.
National Park.
A cross-sectional analysis was made to describe the existing situations and
events. Both quantitative and qualitative methods were employed. When
research is conducted in natural settings, supplementing the quantitative
with qualitative methods helps to investigate, interpret, and measure real
Figure 1: Location of Wunania-Kosoye natural attraction/wildlife Reserve
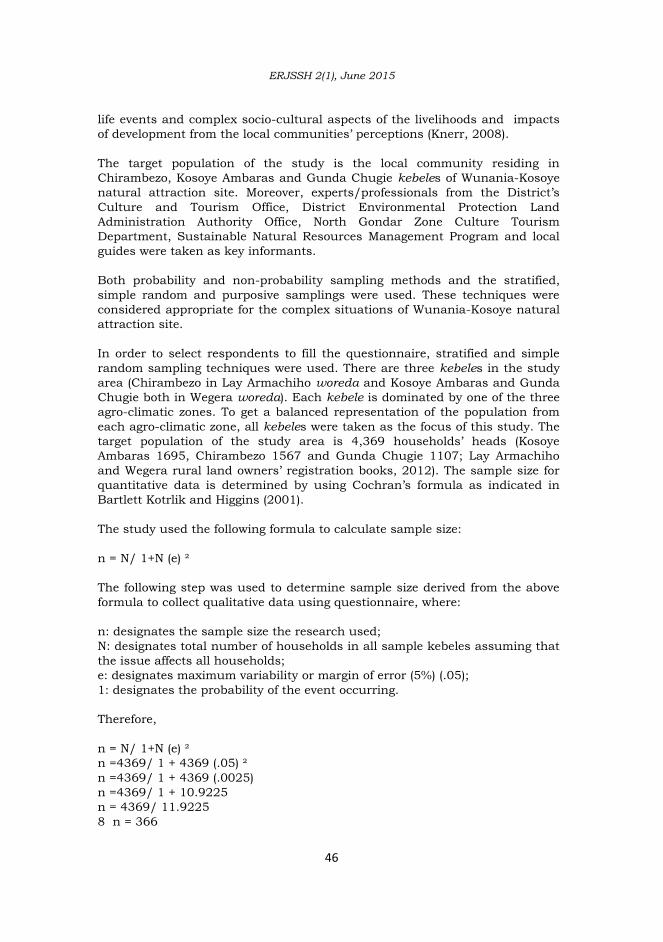
ERJSSH 2(1), June 2015
46
life events and complex socio-cultural aspects of the livelihoods and impacts
of development from the local communities’ perceptions (Knerr, 2008).
The target population of the study is the local community residing in
Chirambezo, Kosoye Ambaras and Gunda Chugie kebeles of Wunania-Kosoye
natural attraction site. Moreover, experts/professionals from the District’s
Culture and Tourism Office, District Environmental Protection Land
Administration Authority Office, North Gondar Zone Culture Tourism
Department, Sustainable Natural Resources Management Program and local
guides were taken as key informants.
Both probability and non-probability sampling methods and the stratified,
simple random and purposive samplings were used. These techniques were
considered appropriate for the complex situations of Wunania-Kosoye natural
attraction site.
In order to select respondents to fill the questionnaire, stratified and simple
random sampling techniques were used. There are three kebeles in the study
area (Chirambezo in Lay Armachiho woreda and Kosoye Ambaras and Gunda
Chugie both in Wegera woreda). Each kebele is dominated by one of the three
agro-climatic zones. To get a balanced representation of the population from
each agro-climatic zone, all kebeles were taken as the focus of this study. The
target population of the study area is 4,369 households’ heads (Kosoye
Ambaras 1695, Chirambezo 1567 and Gunda Chugie 1107; Lay Armachiho
and Wegera rural land owners’ registration books, 2012). The sample size for
quantitative data is determined by using Cochran’s formula as indicated in
Bartlett Kotrlik and Higgins (2001).
The study used the following formula to calculate sample size:
n = N/ 1+N (e) ²
The following step was used to determine sample size derived from the above
formula to collect qualitative data using questionnaire, where:
n: designates the sample size the research used;
N: designates total number of households in all sample kebeles assuming that
the issue affects all households;
e: designates maximum variability or margin of error (5%) (.05);
1: designates the probability of the event occurring.
Therefore,
n = N/ 1+N (e) ²
n =4369/ 1 + 4369 (.05) ²
n =4369/ 1 + 4369 (.0025)
n =4369/ 1 + 10.9225
n = 4369/ 11.9225
8 n = 366

ERJSSH 2(1), June 2015
47
Since the source population was less than 10,000, the correction formula
n = no/ 1+ no / N
was employed. Where:
no: initial sample
N: source population
n: required corrected sample.
Therefore n = 366/1+366/4369 = 338. The required sample size chosen to fill
the questionnaire was 338 household heads residing in all kebeles. However,
some factors, like rugged terrain, inaccessibility, and scattered settlements
obliged us to select only 200 samples. Hence 71, 78 and 51 respondents were
proportionally selected to fill the questionnaire from Chirambezo, Kosoye
Ambaras and Gunda Chugie, respectively. Of the total sample, 154 were men
and 46 women.
Sampling techniques and data analysis
For the qualitative method, non-probability sampling was chosen since it is useful to identify the relevance of the focus of the study rather than the representativeness of the population (Knerr, 2008). Purposive sampling technique worked well in selecting knowledgeable experts/professionals, stakeholders and local community leaders and elders as key informants. Moreover, key informant-interview was conducted with the selection of six community representatives/community leaders and elders. These
representatives of the local community are residents of the villages and the first group of the key informants was interviewed to evaluate the perception, level of local community participation, and knowledge of CBET. Based on the population size, the resources available to cover the three kebeles and the time it took to interview one village dictated the use of a sample of two community representatives from each kebele. All the three groups of key informants were selected purposely with respect to their roles in the land administration process, resource management
activities, conservation works, ecotourism development activities and their knowledge and experience on the subject of the study. The selection of sample size for the interview stressed the quality of the respondents and their potential know-how to answer the questions and to provide rich and relevant information for the analysis and interpretation of the data. The qualitative data were analyzed based on the procedures by Bith (2011). The interviews were transcribed (for audio recorded conversations) and summarized (for non-recorded conversations) into word processing files for analysis. Key contents and concepts were searched for within each file and in the secondary data documents. These contents and concepts were then categorized into three main themes i.e.,
local community level of awareness: about the relation of biodiversity
conservation and community based ecotourism;
community participation: association between community awareness on
biodiversity and their level of participation in community-based ecotourism
development;

ERJSSH 2(1), June 2015
48
economic effects of Wunania Kossoye CBET: the economic benefits
compared to the alternative income. The quantitative information was analyzed first using descriptive methods and then inferential techniques of data analysis. In the data analysis process, the completed questionnaire was coded and the data was analyzed by using the Statistical Package for the Social Sciences (SPSS) Version 16.0. Data was interpreted to show a detailed picture of the existing situation in the study area. In descriptive analysis, the frequency distribution, percentage, and average mean were used. From inferential statistics, Chi-square test was run to see the association between the awareness of the community on biodiversities and their knowledge on the significance of community participation. An independent t-test was used to compare the awareness level between male and female respondents, and a one way ANOVA was used to
see the difference in awareness level among respondents of the three kebeles and to analyze the difference in the concentration of natural attraction resources among the three kebeles.
RESULTS AND DISCUSSION
The local community awareness level on biodiversity conservation and the economic significance of ecotourism in Wunania-Kosoye natural attraction site was evaluated. The result, as can be seen from Table 1, showed that 91.4% of the respondents were well aware about the relation of biodiversity
conservation and CBET. Very few respondents (3.8%) did not know the value of biodiversities in their kebele. Table 1 also indicated that the majority of the respondents (78.5%) had adequate knowledge about biodiversity conservation in their kebele, and 11.8% of them were unable to respond. Only 9.7% of the respondents had no adequate knowledge about biodiversity conservation in their kebele. Based on these findings, it is possible to understand that lack of awareness is not the main problem of biodiversity conservation in this site.
Furthermore, the cumulative average agreement level of the respondents to apply the biodiversity conservation awareness given them by Government officials and professionals was about 4.12 mean average, verifying their agreement. The data collected on the interdependency between biodiversity and ecotourism showed that 76.9% of the respondents recognized the great dependency of ecotourism on the biodiversities of the area. Some respondents (15.6%) were not sure whether ecotourism was dependent on the biodiversities of the site or not, and only 7.5% could not recognize its relation with biodiversities. The triangulated qualitative information/data obtained from the interviews with key informants and field observation on the problems of biodiversity
conservation in Wunania-Kosoye area also revealed that low level of community awareness was the major problem for the last five years. However, after the introduction of CBET into the site, the problem was restricted to certain individuals who were directly benefited from the uncontrolled use of natural resources. Besides, these key informants observed the loss of biodiversity in the last decades due to deforestation of natural vegetation for

ERJSSH 2(1), June 2015
49
cultivation, constructions, furniture, fuel-wood, and charcoal in addition to uncontrolled grazing, seasonal migration of cattle, and land-sliding especially around Zagol Amba and Wunania areas. According to the key informants,
migration of wildlife due to deforestation, wildfire, and eucalyptus tree plantation were the other challenges in the study area. Information obtained from the key informants on measures taken so far to solve biodiversity conservation problems reflected that different physical and biological conservation work was done in some selected watershed areas, but the measures taken were not sufficient to mitigate the problems. According to these informants a variety of methods were used to protect the biodiversity of the study area. The most frequently mentioned methods were promoting integrated watershed management, introducing ecotourism and CBET as alternative livelihood activities to reduce dependence on agriculture only, developing bylaws to protect wildlife from illegal hunters, planting fast growing indigenous plants, properly implementing rural land use guidelines,
restricting seasonal migration of cattle, encouraging zero grazing, strengthening physical conservation works with biological conservations, and preserving highly fragile areas by prohibiting cultivation.
Table 1: Local community awareness about biodiversity conservation and significance of CBET at Wunania-Kosoye, North Gondar
Level of awareness on biodiversity conservation and CBET
Relative Agreement Mean
Average SDA DA N A SA
F % F % F % F % F %
Biodiversities 3 1.6 4 2.2 9 4.8 99 53.2 71 38.2 4.24
Biodiversity conservation 4 2.2 14 7.5 22 11.8 91 48.9 55 29.6 3.96
Implementation of biodiversity conservation based on professionals advices
3 1.6 7 3.8 12 6.5 107 57.5 57 30.6 4.12
Ecotourism depend on biodiversities.
9 4.8 5 2.7 29 15.6 97 52.2 46 24.7 3.89
Economic benefits of ecotourism
1 5 5 2.7 4 2.2 94 50.5 82 44.1 4.35
CBET promotes conservation of natural resources
4 2.2 2 1.1 8 4.3 95 1.1 77 41.4 4.28
CBET has more sustainable economic benefit than other livelihood alternative
1 .5 5 2.7 11 5.9 110 59.1 59 31.7 4.19
Importance of local community participation
5 2.7 1 .5 0 .0 88 47.3 92 49.5 4.40
Total (local community awareness about biodiversity conservation and significance of CBET) 4.801
Note: The Likert scale was used where, SDA=Strongly Disagree, DA=Disagree, N=
Neutral, A=Agree, SA= Strongly Agree.
Source: Primary data of field survey 2012.

ERJSSH 2(1), June 2015
50
During the interview conducted with the local community leaders, elders, local guides, and experts/professionals on local community participation in biodiversity conservation it was found out that local community participation in biodiversity conservation would be active since an alternative source of income would be created in the study area Community awareness on the benefits of CBET
According to Table 1, a significantly high number of respondents (94.6 %)
believed that ecotourism could provide economic benefits to the local community. Few respondents (7.7%) failed to believe in the economic benefits of ecotourism, while the rest (2.2%) could not tell whether it had benefits or not.
Out of the total respondents, 92.5% believed that CBET could have a huge contribution to promoting the conservation of natural resources in Wunania-Kosoye area, and only 3.3% disagreed with the significance of CBET for conservation. The remaining 4.3% of the respondents were unable to decide whether CBET was significant for biodiversity conservation or not. Table 1 also revealed that 90.8% of the survey respondents preferred CBET to other means of livelihood alternatives to maintain sustainable economic benefit, 5.9% of the respondents were neutral, and only 3.2% refused to prefer CBET to other means of livelihood alternatives. The cumulative mean average agreement level of the local community participation was 4.40, showing that the local community was well aware about the significance of
local community participation in any affairs of their kebele ecotourism development. The result of the key informant interview demonstrated that there was a higher rate of significance level for CBET than other alternative methods of biodiversity conservation. Moreover, key informants suggested that environmentally conscious eco-tourists were interested in visiting areas
Statistical model
Value df
A s y m p .
S i g . ( 2 -sided)
Monte Carlo Sig. (2-sided) Monte Carlo Sig. (1-sided)
Sig.
9 5 % C o n f i d e nce Interval
95% Con f ide nce Interval
L o w e r Bound
U p p e r Bound
L o w e r Bound
U p p e r Bound
P e a r s o n Chi-Square
18.278 12 .107 .140 .133 .147
Likelihood Ratio
19.259 12 .082 .028 .025 .031
F i s h e r ' s Exact Test
25.089
.016 .014 .019
Linear-by-L i n e a r
Association
.700 1 .403 .429 .419 .438 .207 .224
N of Valid Cases
186
Table 2: Association between community awareness on biodiversity and participation in its conservation
Source: Primary data of field survey 2012.

ERJSSH 2(1), June 2015
51
with rich biodiversity and natural beauty. Unlike other economic activities, the economic benefit obtained from CBET depends on the degree to which conservation of biodiversity is undertaken and on the extent to which natural beauty is maintained. Furthermore, this economic sector is not over consuming or depleting the natural resources of the area. Therefore, CBET can be taken as a more preferable livelihood alternative than other economic activities to maintain biodiversity and for a sustainable development of the
site.
There is no significant difference (Pearson Chi-Square =.140 = p > .05)
between awareness on biodiversity and knowledge about the importance of
community participation. This means that there is an association between
the awareness of the respondents about the biodiversities of the kebele and
the respondents’ knowledge about the significance of community
participation. It implies that effective implementation of biodiversity
conservation in the site can be achieved through increasing community
participation in natural resources conservation activities.
Table 3 reveals that the mean value of male respondents in terms of
awareness about biodiversity conservation and significance of CBET is 4.19,
which is slightly greater than the mean value of females (4.15). The reason for
Table 3: Differences in level of awareness about biodiversity conservation and
significance of CBET between male and female respondents
Group Statistics
Sex N Mean Std. Deviation Std. Error Mean
male 140 4.1893 .45738 .03866
female 46 4.1522 .56575 .08342
Source: Primary data of field survey 2012.
Independent Samples Test
Levene's Test
for Equality of Variances t-test for Equality of Means
F Sig. t df
Sig. (2-
tailed) Mean
Std.
Error
95% CI Difference
Lower Upper
Equal
variances assumed
5.473 .020 .449 184 .654 .0371 .0826 -.1259 .2001
Equal
variances not
assumed
.404 65.42 .688 .0371 .0919 -.1465 .2207
Table 4: Differences in level of awareness about biodiversity conservation and
significance of CBET between male and female respondents
Source: Primary data of field survey 2012.

ERJSSH 2(1), June 2015
52
this slight difference in mean (0.04) is that male respondents have more
exposure to participation in different community awareness raising programs
than female respondents. However, the t-test in Table 4, shows that there is
no significant difference (t-test = .688 = p > .05) between male and female
participants in terms of awareness about biodiversity conservation and
importance of CBET.
Finally, one way ANOVA was used to see whether there is a significant mean
difference in awareness level among respondents of the three kebeles or not.
Table 5 reveals that the highest mean value of agreement level of
respondents’ awareness on biodiversity conservation and significance of
CBET is observed in Chirambezo (4.3977), followed by Kosoye Ambaras
(4.1449), while the least is Gunda Chugie (3.9461). This may be due to the
fact that Gunda Chugie is found in a remoter area in comparison to the other
two kebeles.
There is a statistically significant difference among the respondents of the
three kebeles (f value for Chirambezo and Kosoye Ambaras (.001), for
Chirambezo and Gunda Chugie (.000) and for Kosoye Ambaras and Gunda
Chugie (.018) ) = P < .05. This is because of the fact that the local
communities living in Chirambezo and Kosoye Ambaras kebeles have got
opportunities to participate in different community awareness raising
Level of awareness on biodiversity
conservation and CBET N Mean
Std.
Deviation F Sig.
Chirambezo 66 4.3977 .36553
14.641 .000
Kosoye Ambaras 69 4.1449 .47725
Gunda Chugie 51 3.9461 .51675
Total 186 4.1801 .48507
Table 5: Difference in awareness level among respondents of the three kebeles
Source: Primary data of field survey 2012.
Table 6: Multiple comparisons of differences in awareness level among respondents of the three kebeles
Level of local community’s awareness on biodiversity and its conservation LSD
(I) Residence of
Respondent
(J) Residence of
Respondent
Mean difference
(I-J)
Std.
Error Sig.
95% Confidence
Interval
Lower Bound
Upper
Bound
Chirambezo Kosoye Ambaras .25280 .07797 .001 .0990 .4066
Gunda Chugie .45165 .08442 .000 .2851 .6182
Kosoye Ambaras Gunda Chugie .19885 .08362 .018 .0339 .3638
Source: Primary data of field survey 2012.

ERJSSH 2(1), June 2015
53
programs. Chirambezo community especially started to engage in CBET
activities, while the community of Gunda Chugie is the least favored, due to
the inaccessibility of the kebele.
CONCLUSION
Local communities’ awareness level on biodiversity conservation and the
economic significance of ecotourism in Wunania-Kosoye Natural Attraction
Site was relatively high, while there was loss of biodiversity in the last
decades due to deforestation, uncontrolled grazing, and land degradation. A
range of methods have been used to protect the biodiversity of the study area.
The most frequently mentioned methods are promoting integrated watershed
management, introducing ecotourism in the area, and CBET as an alternative
livelihood activity, developing bylaws to protect wildlife from illegal hunters,
and the plantation of fast growing indigenous plants, properly implementing
rural land use guidelines, and strengthening physical conservation work. On
the level of awareness about biodiversity conservation and CBET, there is a
statistically significant difference among respondents of the three kebeles (f
value for Chirambezo and Kosoye Ambaras (.001), for Chirambezo and Gunda
Chugie (.000) and for Kosoye Ambaras and Gunda Chugie (.018)) = P < 0.05).
Research findings suggest that CBET is becoming preferable to other
alternative approaches for conserving biodiversity in Wunania-Kosoye
Natural Attraction Site.
As a conclusion to the study the following recommendations are offered:
To assure the effective biodiversity conservation at the Wunania-Kosoye
Natural Attraction Site, active community participation in natural
resources conservation activities be implemented.
To enhance community awareness on the value of CBET development to
biodiversity conservation, awareness creation programs must be conducted
in all kebeles in the Wunania-Kosoye at Nural Attraction Site.
In order to conserve biodiversity at the Wunania-Kosoye Natural Attraction
Site, Amhara Regional State Culture and Tourism Bureau has to give
special attention to CBET development.
REFERENCES
Allen, A., Hafer, A., Long, T., & Perdue, A. (1993). Rural residents' attitudes
toward recreation and tourism development. Journal of Travel Research,
31, 27-35.
Amhara National Regional State-CTPDB (2009). Sustainable tourism network
master plan for tourist destination and potential sites of North Gondar
Administration Zone (zero draft).
Ap, J., & Crompton, J. L. (1998). Developing and testing a tourism impact
scale. Journal of Tourism Research, 37(2), 120–130. Retrieved from
http://jtr.sagepub.com/content/37/2/120.abstract
Aref, F, Gill, S. S., & Aref, F. (2010). Tourism Development in Local
Communities: As a Community Development Approach. Journal of
American Science, 6(2), 155-161. Retrieved from http://

ERJSSH 2(1), June 2015
54
w w w . j o f a m e r i c a n s c i e n c e . o r g / j o u r n a l s / a m - s c i /
am0602/26_1215_Communities_am0602.pdf
Aref, F. (2010). Residents’ Attitudes towards Tourism Impacts: A Case Study
of Shiraz, Iran. Tourism Analysis, 15(2), 253-261.
Bartlett, J. E., Kotrlik, J. W., & Higgins C. (2001). Organizational research:
Determining appropriate sample size for survey research. Information
technology. Learning, and Performance Journal, 19(1), 43-50.
Bith, B. (2011). Community-based Ecotourism and Empowerment of
Indigenous People: The Case of Yeak Laom Community Development,
Cambodia (Master’s thesis, Lincoln University). Retrieved from
Research Archive.
Bushell, R., & Eagles, P.F. (2007). Tourism and Protected Areas: Benefits
Beyond Boundaries. Cambridge, MA: CAB International.
Conservation International (2003). Sustainable tourism program overview.
Retrieved March 24, 2014, from http://www.evroparl.ev.int/stoa/
publi/pdf/stoa103_en.pdf
Coward, W. (2001) The Kulu Valleys in Motion. Himalaya, the Journal of the
Association for Nepal and Himalayan Studies, 21(2), 5-14. Retrieved from
http://digitalcommons.macalester.edu/himalaya/vol21/iss2/5
Denman, R. (2001). Guidelines for community-based ecotourism development
(World Wild Fund International July 2001). Retrieved March 25, 2014,
from http://www.panda.org
Drumm, A., Moore, A., Soles, A., Patterson, C., & Terborgh, J. E. (2004).
Ecotourism Development: A Manual for Conservation Planners and
Managers, Volume II: The Business of Ecotourism Management and
Development. Arlington, VI: The Nature Conservancy.
Environmental Grantmakers Association. (2008). Ecotourism as a
conservation Strategy for funders: A background briefing. Retrieved 1
M a y , 2 0 1 5 , f r o m h t t p : / / w w w . g w u . e d u / ~ i i t s /
S u s t a i n a b l e _ T o u r i s m _ O n l i n e _ L e a r n i n g / F a u l k n e r /
ecotourism_conservation_strategy_for_funders.pdf
Fennell, D. A. (2002). Ecotourism: An introduction. London & New York:
Routledge Taylor & Francis E Group.
Fenta Mandefro & Mekonnen Gebre Egziabher (2009). A baseline study to
identify potential for sustainable pro-poor tourism development in
Amhara National Regional State (Unpublished report).
Kevin, M. (2010). The sustainability of community based ecotourism in
Southern Africa. Retrieved February 2, 2012, from http://
eprints.port.ac.uk/
Knerr, B. (2008). Ecotourism as a tool for sustainable rural community
development and natural resource management. Retrieved January 31,
2012, from www.uni-kassel.de/ress/.../978-3-89958-465-
3.volltext.frei.pdf
McIntosh, R. W., Goeldner, C. R., & Ritchie, J. R. (1995). Tourism principles,
Practices, philosophies (7th ed.). New York, NY: Wiley.
Negash Atnafu, Gedefaw Amsalu, Shimelis Aklilu & Yohannes Mesgan
(2010). Detail study of tourism potential of Kosoye, Gorgora & their
vicinity (unpublished report).

ERJSSH 2(1), June 2015
55
North Gondar Zone Culture Tourism Department and Amhara National
Regional State-CTPDB (2010). Detailed bio-physical, socio-economic and
tourism development potential survey of Wonaniya and its vicinities
(unpublished report).
Potjana, S. 2003. Community based tourism handbook. Bangkok, Thailand:
Responsible Ecological Social Tour-REST.
Richard, G, & Hall, D. (2000). Tourism and Sustainable Community
Development. London & New York: Routledge.
Strasdas, W., & Zeppenfeld, R. (2008). Tourism in developing countries. In
International Student Conference July 7-8, 2008 in Eberswalde, Germany
Conference Reader. Retrieved January 31, 2014, from www.hnee.de/
app/so.asp?o=/_obj/ DBEECAB2...pdf
Teye, V., Sönmez, S., & Sirakaya, E. (2002). Resident Attitudes toward
Tourism Development. Annals of Tourism Research, 29(3), 668-688.
Timothy, D. J. (2002). Tourism and community development issues. In R.
Sharpley & D. J. Telfer (Eds.), Tourism and Development: Concepts and
Issues (pp. 149-164). Clevedon UK: Channel View.
Tisdell, C. (2003). Economic Aspects of Ecotourism: Wildlife-based Tourism
and Its Contribution to Nature. Sri Lankan Journal of Agricultural
Economics, 5(1), 83-95. doi:http://dx.doi.org/10.4038/sjae.v5i0.3478
Tosun, C. (2006). Expected nature of community participation in tourism
development. Tourism Management, 27, 493-504.
UNEP & WTO (2005). Making Tourism More Sustainable: A Guide for Policy
Makers. Retrieved September 15, 2011, from www.world-tourism.org
United Nations. (2001). UNDP Manual for the international year of ecotourism
(United Nations Environmental Program). Retrieved July 25, 2011, from
www.uneptie.org/tourism/home/html

ERJSSH 2(1), June 2015
56

ERJSSH 2(1), June 2015
57
INTRODUCTION
The question of what factors drive land use and land cover change has
remained largely unanswered. Recently, human activities and social factors
were recognized to have a paramount importance in land use and land cover
change (Lambin, Geist & Lepers, 2003). The conceptual understanding of the
proximate causes and underlying forces has a crucial importance in
identifying the causes of land use and land cover changes (Meyer & Turner,
1994). Proximate (direct) causes are immediate actions of local people in
order to fulfill their needs from the use of the land. These causes include
agricultural expansion, wood extraction, infrastructure expansion and others
that change the physical state of land cover. At the proximate level, land use
and land cover change may be explained by multiple factors rather than by a
single variable (Lambin, Geist & Lepers, 2003). Underlying (indirect or root)
driving forces are fundamental processes that push proximate causes into
immediate action on land use and land cover. Underlying driving forces such
ORIGINAL ARTICLE
LAND USE AND LAND COVER DYNAMICS: DRIVING FORCES AND
IMPACTS IN LAY GAYINT WOREDA OF AMHARA NATIONAL REGIONAL
STATE, ETHIOPIA
Girma Zewdie1 and Ebrahim Esa2
ABSTRACT
The objective of this study is to assess the pattern and to identify the major driving
forces of land use and land cover change as well as to analyze the consequences of
these changes in Lay Gayint woreda. The study used Landsat images of 1984 and 2004
to produce two layers of maps using Remote Sensing and GIS. The results showed that
cultivation land and settlement increased by 51.8 % followed by increment in bare land
by 19.1 % while communal grazing, forest cover, and shrub have reduced by 52.6 %;
79.6 % and 28.4 % respectively. Population growth, less hand holding related to
traditional farming practices, and high fuel energy demand were the major driving forces
for the observed changes. One of the major negative impacts of land use and land cover
change in the woreda is land degradation, mainly in the form of erosion and the resulting
loss of fertility. To curb this problem, the study recommends practising sustainable land
management utilizing alternative energy sources, implementing expansive family
planning, and creating awareness on the impacts of those changes.
Keywords: GIS, remote sensing, land use and land cover changes, land degradation,
soil fertility, soil erosion, sustainable land management practices.
1. University of Gondar, College of Social Sciences and the Humanities, Department of Geography and Environmental Studies. Corresponding author.
Email:[email protected]. 2. University of Gondar, College of Social Sciences and the Humanities, Department of
Geography and Environmental Studies.

ERJSSH 2(1), June 2015
58
as demographic pressure, economic status, and technological and
institutional factors, influence land use and land cover in combination rather
than as single causations (Meyer & Turner, 1994).
Land use and land cover change play an important role in global
environmental change. They are major factors affecting sustainable
development. The scientific community has now come to recognize the diverse
roles of land use and land cover change. Consequently, the need for
understanding of land use and land cover change has been increasingly
recognized in global environmental research (Lambin, Geist & Lepers, 2003).
The degree and rate of change in land-cover and some land-uses are known
to some extent. According to Turner et al. (1993), most of the earth’s surface
is already modified, except those areas that are peripheral in location or are
fairly inaccessible. Of the total land surface, about 40% has been changed in
the form of conversion into other uses. It is only about 25% of the land that
remains nearly unchanged. In the case of Ethiopia, studies on land use and
land cover change are few (Solomon, 1994). Those limited studies focused on
the Northern Ethiopian highlands, areas early settled and relatively
overpopulated (Belay Tegene, 2002).
One of the greatest historical challenges to the Ethiopian economy is linked
with the problems of rural environment in general and that of the rural
highlands in particular. Rural highland areas support about 88% of the
human population, 95% of the cropland, more than 75% of the livestock and
90% of economic activities in the country (Mc Cann, 1995). This role as an
economic powerhouse is related to the sufficient rainfall, moderate
temperature and well-developed soil, which are characteristics to these
highlands. Moreover, highlands in Ethiopia were historically the basis for the
early development of agriculture and have been prior targets of settlement for
the human population (Hürni, 1990).
More recently agriculture in the Ethiopian highlands has extended to more
difficult terrains and to traditionally unexploited parts of the environment.
The expansion of agricultural practices into terrains such as steeper slopes
and swampy plains in many parts of the northwestern highlands of Ethiopia
may indicate the presence of pressure on land, vegetation, and water
resources. These parts of the country are amongst the most degraded and
those with high rate of nutrient depletion in sub-Saharan Africa. As stated in
the Ethiopian Forestry Action Program (1994), cited in Muluneh (2003),
depletion of soils and plant biodiversity are recognized to be the two most
important forms of environmental degradation in rural Ethiopia.
Historically, population was regarded as the most important and the only
driving force behind global change. However, currently it is understood that
environmental change has many driving forces that are closely interrelated,
population being only one among them (Rindfuss & Adamo, 2004). In most
developing countries, population growth has been a dominant cause of land
use and land cover change (Kahsay Berhe, 2004). As a result, there is a
significant statistical correlation between population growth and land cover

ERJSSH 2(1), June 2015
59
conversion in most African, Asian, and Latin American countries (Sege,
1994). Similarly, in Ethiopia, population pressure has been found to have
negative effect on shrub land, communal grazing land and forests
(Woldeamlak Bewket, 1993).
In the case of Ethiopia, views with regard to the relationship between
population growth and land degradation are variable. For instance, the
highland parts of the country have been severely degraded due to population
growth coupled with early settlement, topographical features and geological
history. Contrary to this, case studies in Sebat-bet Guraghe have highlighted
a more positive impact of a high density of population. Similarly, in Konso,
where population is relatively high and located at the margin land,
degradation is less severe due to indigenous knowledge for soil conservation
(Kahsay Berhe, 2004).
According to Turner et al. (1995), land use change is a common phenomenon
associated with population growth, market development, institutional factors
and policy action. The entire ecological infrastructure such as vegetation
cover, soil characteristics, plant and animal population, and hydrological
cycle has been strongly influenced by the conversion of land and forest
resources. Understanding of the institutional causes (i.e. political, legal,
economic, and traditional) and their interaction with individual decision
making is important in explaining land use changes. Institutional causes
need to be considered at micro and macro levels because the implementation
of macro policies is practiced at the micro level. Land use and land cover
changes are influenced significantly when macro policies undermine local
policies in that the structure of local and national polices may determine
local people’s access to land, capital, technology and information (Lambin,
Geist & Lepers, 2003).
The absence of applicable forest policy is cited as a contributing factor for
deforestation in different parts of the world including Ethiopia. According to
FAO (1999) the country’s forest cover in 1989 was 12.9 percent. A decade
later, in 1997, the forest cover was estimated to be only 4.2 percent (FAO,
2001). In addition, the lack of appropriate land use and forest policies as well
as the absence of corresponding laws are responsible for the decline of forests
in southwestern Ethiopia. The promotion of industrial crops with high return
has encouraged the direct clearance of forests. The policy of food self-
sufficiency based on surplus crop production has also been realized at the
expense of forest degradation in southwestern Ethiopia (Million, 2002).
Likewise, rapid expansion of crop cultivation at the expense of forests
occurred due to the land reform policy changes of 1975 (Amare, 1994).
Another obvious consequence of land use and land cover change, particularly
of deforestation, is the shortage of fuel-wood to meet household energy
consumption posed by high population pressure (Girma et al., 2002). As a
result, land use change and resource degradation have been affected by land
tenure system and government policies in Ethiopia.

ERJSSH 2(1), June 2015
60
Land use and land cover change can impact the socio-economic status of the
rural population. Agricultural productivity, which may determine rural
income, wealth and education, can be affected by the consequences of land
use and land cover changes. Therefore, understanding of the complex
interaction of these changes in their temporal and spatial patterns and
processes is the baseline to formulate focused and targeted policy
interventions in rural development and environmental management (Lambin,
Geist & Lepers, 2003).
Land cover transformation in both tropical and temperate regions, by
provoking intensified deforestation, has important implications in the
dramatic loss of plant species in terms of density, diversity and community
composition. Ethiopia, with the fifth largest flora in tropical Africa and with
about 12% of its plant population being endemic, has been critically affected
by the loss of plant biodiversity (Tewolde Berhan, 1991). Despite housing a
large diversity of biological resources, biodiversity in Ethiopia is largely being
affected by human activities (Kahsay Berhe, 2004). Assessments of this
impact have indicated that forests have become depleted at a large scale as a
result of expansion of agriculture and settlement areas. For instance,
Ethiopia has about 60 million hectares of land for grazing. This figure has
been reduced to less than 55 million hectares due to grassland conversion
into other land uses and covers (Kebrom & Hedlund, 2000). On the other
hand, an expansion of cultivated land at the expense of bush lands, natural
pasture and forest, caused by increasing human population, has strongly
affected the number of livestock and the quality of their products. This in
turn induces overgrazing and soil erosion in different parts of the country.
These local-level changes play a pivotal role in affecting the health of the
ecosystem. Loss of biodiversity, soil degradation, and environmental
deterioration are largely results of land use/cover change. An example of the
negative effects of land use/cover change is that land productivity declines
under continuous cultivation, overgrazing and soil erosion (Muluneh, 2003).
In Ethiopia, only a few land use and land cover change studies have been
conducted in different parts of the country. As a result, land use and land
cover change, and its driving forces and impacts are hardly documented. This
study aims to contribute to the knowledge on land use and land cover
change, its driving forces and consequences with an empirical study in Lay
Gayint woreda. The target woreda is taken as a representative area for the
northwestern part of the country in terms of topography, climate, vegetation
and socioeconomic conditions. The pattern of land use and land cover is one
of the indicators of sustainability of resource utilization and management,
which provides a basis for conservation planning. Hence, this study is
significant to understand the rate of land-cover and land-use change, to
identify the causes and impacts of these changes and, finally, to find
solutions for sustainable use of land and other resources. The study analyzes
the rate of land use and land cover change over the past 20 years, identifying
the major driving forces and impacts in these processes.

ERJSSH 2(1), June 2015
61
STUDY AREA
Lay Gayint is one of the ten woredas of South Gondar zone in Amhara
regional state. It is bordered by the districts of Ebnat on the north, Tach
Gaint and Simada on the south, Misrak Estie on the southwest, Farta on the
west, and Meket on the east (North Wollo zone). The absolute location of the
woreda is 11°32’-12° 16’ N Latitude and 38° 12’- 38° 20’E Longitude. The
administrative center is Nefas Mewcha, located on the Woreta-Woldia
highway, which is 237 km (North Gondar Trade and Transportation
Department, 2011) away from Gondar city and 175 km away from the
regional capital Bahir Dar. Other towns in the same woreda include Gob
Gob, Sali and Checheho. The administrative town is located at 11°44’N
Latitude and 38° 28’E Longitude.
The physiographic of the woreda is very rugged and dissected. The elevation
ranges approximately from 1200 m above the sea level in the Tekeze lowland
to 4235 m above the sea level on the Guna Mountain. The topography of the
district is characterized by 11.97 % plain, 5% mountain, 8% valley, 75%
plateau and 0.03% covered with water. According to Lay Gayint Woreda
Office of Agriculture (2012), the woreda is covered by red soil (15%), brown
soil (55%), black soil (15%), grey soil (10%) and others (5%).
Figure 1: Location Map of Lay Gayint woreda

ERJSSH 2(1), June 2015
62
The maximum and minimum mean annual temperature of the woreda is 20°
C and 8°C respectively. The annual rainfall of the woreda is between 600 mm
and 1200 mm (Lay Gayint Woreda Office of Agriculture, 2012). The nature of
the rainfall is erratic, short in duration, late onset and early offset as well as
poorly distributed temporally and spatially. The livelihood of farmers is
endangered by seasonality of rainfall, recurrent drought and variability of
rainfall. The annual mean rainfall of the district for the last 27 years was
1053.61 mm. The small rainy season (belg), occurs between March and May
and the long rainy season (keremt), occurs between June and September.
Therefore, summer rainfall is the main rainy season for crop production.
According to Central Statistical Authority (2007) this woreda has a total
population of 206,499 (104,401 male and 102,098 female). Out of these,
22,825 (11.05%) are urban dwellers and 183,674 (88.95%) rural dwellers
with a total household (HHs) number of 39,638. Concerning the population
distribution, 41% live in dega, 31% live in woyna dega, and 28% live in kolla
agro ecology (Lay Gayint Woreda Office of Agriculture, 2012; Mesfin Wolde-
Mariam, 1991). About 88.95% of the population depend on agriculture and
the average land holding size of a household in the woreda is 0.75 hectare
(Lay Gayint Woreda Office of Agriculture, 2012). Small-scale mixed
agriculture is the dominant source of livelihood to the local people.
METHODS
Geo-referenced satellite images (Landsat TM) of 1984 and 2004 of Lay Gayint
woreda, was downloaded freely from Global land cover facility
(www.earthexplorer.usgs.gov). The woreda’s office have been doing land use
and land cover classification in six major classes, namely: cultivated land,
grazing land, forest cover, bush and shrubs land, infrastructure and
settlement and bare land. Due to the difficulty to identify cultivated land from
settlement and infrastructure, these two are merged and called cultivated
land and settlement. Therefore, the classification is reduced to five, i.e.
cultivated land and settlement, communal grazing land, forest cover, shrub
land and bare land. Finally, a supervised classification was made to establish
Land use type Area coverage (ha) %
Cultivated land (annual crops) 68,649 44.33
Communal grazing land 22,160 14.31
Forest cover 1,023 0.66
Shrub land 8,150 5.26
Infrastructure and settlement 2,344 1.51
Bare land 52,540 33.93
Total 154,866 100.0
Table 1: Lay Gayint woreda land use classification
Source: Lay Gayint Woreda Office of Agriculture, 2012.

ERJSSH 2(1), June 2015
63
the land use and land cover types of the two satellite images of 1984 and
2004, and was analyzed in percentages.
RESULTS AND DISCUSSION
As indicated in Table 2, the land use and land cover types in the study area
are defined into five types, namely: cultivated land and settlement, communal
grazing land, forest land, shrub land and bare land. The separation of
cultivated land and settlement was not possible due to their intermingled
pattern. For example, usually, rural settlements are encircled by farm plots.
Because of this it was difficult to define specific land cover type for each.
Therefore, cultivated land and settlement are classified as one class.
As indicated in Figures 3 and 4, the second greatest share of land use/land
cover next to bare land is communal grazing land, which covers an area of
42,643.60 hectares (28%). Cultivated land and shrub land covers an aerial of
Figure 2: Flow chart showing the general methodology of land use/land cover evaluation
Land use and land
cover class
Description
Cultivated land and
settlement
Areas allotted to rain fed crop cultivation including annuals and perennials, mostly of cereals in subsistence farming and
the scattered rural settlements included within the cultivated fields.
Forests cover Areas covered by trees forming closed or nearly closed canopies; forest; plantation forest.
Shrub land Land covered by small trees, bushes, and shrubs, in some cases mixed with grasses; less dense than forests.
Grazing land Areas of land where small grasses are the predominant natural vegetation. It also includes land with scattered or patches of
trees and it is used for grazing and browsing.
Bare land Parts of the land surface which are mainly covered by bare soil and exposed rocks.
Table 2: Types of land use and land cover in Lay Gayint woreda
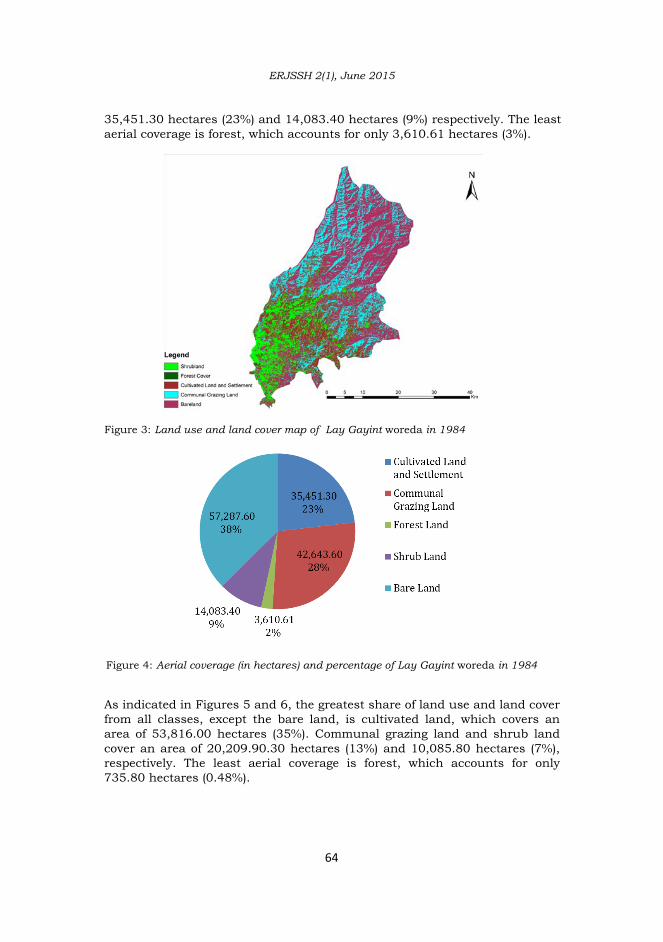
ERJSSH 2(1), June 2015
64
35,451.30 hectares (23%) and 14,083.40 hectares (9%) respectively. The least
aerial coverage is forest, which accounts for only 3,610.61 hectares (3%).
Figure 3: Land use and land cover map of Lay Gayint woreda in 1984
Figure 4: Aerial coverage (in hectares) and percentage of Lay Gayint woreda in 1984
As indicated in Figures 5 and 6, the greatest share of land use and land cover
from all classes, except the bare land, is cultivated land, which covers an
area of 53,816.00 hectares (35%). Communal grazing land and shrub land
cover an area of 20,209.90.30 hectares (13%) and 10,085.80 hectares (7%),
respectively. The least aerial coverage is forest, which accounts for only
735.80 hectares (0.48%).

ERJSSH 2(1), June 2015
65
An important aspect of change detection is to determine what is actually
changing to what category of land use and land cover type, i.e. which land
use class is changing to another type of land use class. This information will
also serve as a vital tool in management decisions. This process involves a
pixel-to-pixel comparison of the study year images through overlay analysis.
Figure 5: Land use and land cover map of Lay Gayint woreda in 2004
Figure 6: Aerial coverage (in hectares) and percentage of Lay Gayint woreda in 2004
LEGEND

ERJSSH 2(1), June 2015
66
Pattern and areal extent of land use and land cover change
The change for cultivated land and settlement showed very high increase
between 1984 and 2004. In 1984, the area under cultivated land and
settlement coverage was 35,451.30 hectares (23.16%), which was escalated to
53,816.00 hectares (35.15%) in 2004. An additional 18,364.70 hectares of
land was incorporated into this land use type. This is at the expense of
forestland, communal grazing land and shrub land. The original land use
increased by 51.80%.
The change for communal grazing land decreased highly between 1984 and
2004. In 1984, the area under communal grazing land coverage was
42,643.60 hectares (27.86%), which was reduced to 20,209.90 hectares
(13.20%) in 2004. Of the total communal grazing land cover in 1984, 52.61%
was converted into other forms of land use. Only 47.39% of the original area
remained in the same category. An attempt to plant forage for livestock to
reduce the pressure on communal grazing land and exercise zero grazing was
not working as expected.
The pattern of change for forest cover showed a decrease between 1984 and
2004. In 1984, the area under forest cover was 3,610.61 hectares (2.36%),
which declined to 735.80 hectares (0.48%) in 2004. Of the total forest cover
in 1984, 51.80% was converted into other forms of land use. Only 20.8% of
the original area remained in the same category. A large proportion of the
forest, i.e. 79.62% land was transformed into other land categories. An
attempt to recover the lost forest cover through afforestation program was
never successful in the area.
The pattern of change for shrub land also showed a decrease between 1984
and 2004. In 1984, the area covered by shrubs and bushes was 14,083.40
hectares (9.2%), which was reduced to 10,085.80 hectares (6.59%) in 2004.
Of the total shrub land in 1984, 28.39 % was converted into other forms of
land use. 71.62% of the original area remained in the same category. The
land cover/land use change in shrub is relatively less. This might be due to
planting of eucalyptus trees on the highland parts of the woreda, as a result
of which some of the forest covers in 1984 changed into shrub land.
Figure 7: Land use land cover types and trends in 1984 and 2004
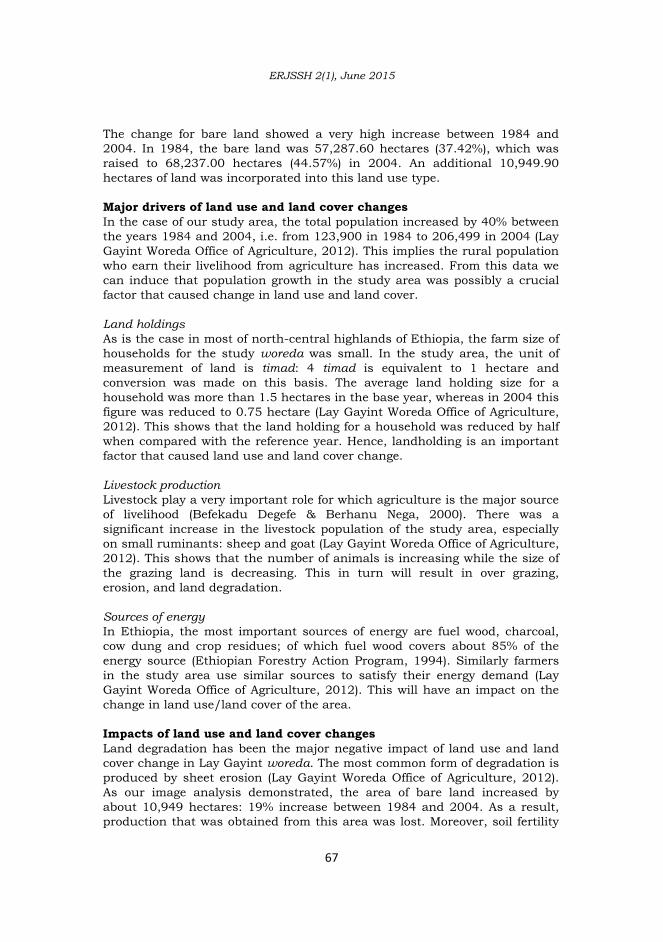
ERJSSH 2(1), June 2015
67
The change for bare land showed a very high increase between 1984 and
2004. In 1984, the bare land was 57,287.60 hectares (37.42%), which was
raised to 68,237.00 hectares (44.57%) in 2004. An additional 10,949.90
hectares of land was incorporated into this land use type.
Major drivers of land use and land cover changes
In the case of our study area, the total population increased by 40% between
the years 1984 and 2004, i.e. from 123,900 in 1984 to 206,499 in 2004 (Lay
Gayint Woreda Office of Agriculture, 2012). This implies the rural population
who earn their livelihood from agriculture has increased. From this data we
can induce that population growth in the study area was possibly a crucial
factor that caused change in land use and land cover.
Land holdings
As is the case in most of north-central highlands of Ethiopia, the farm size of
households for the study woreda was small. In the study area, the unit of
measurement of land is timad: 4 timad is equivalent to 1 hectare and
conversion was made on this basis. The average land holding size for a
household was more than 1.5 hectares in the base year, whereas in 2004 this
figure was reduced to 0.75 hectare (Lay Gayint Woreda Office of Agriculture,
2012). This shows that the land holding for a household was reduced by half
when compared with the reference year. Hence, landholding is an important
factor that caused land use and land cover change.
Livestock production
Livestock play a very important role for which agriculture is the major source
of livelihood (Befekadu Degefe & Berhanu Nega, 2000). There was a
significant increase in the livestock population of the study area, especially
on small ruminants: sheep and goat (Lay Gayint Woreda Office of Agriculture,
2012). This shows that the number of animals is increasing while the size of
the grazing land is decreasing. This in turn will result in over grazing,
erosion, and land degradation.
Sources of energy
In Ethiopia, the most important sources of energy are fuel wood, charcoal,
cow dung and crop residues; of which fuel wood covers about 85% of the
energy source (Ethiopian Forestry Action Program, 1994). Similarly farmers
in the study area use similar sources to satisfy their energy demand (Lay
Gayint Woreda Office of Agriculture, 2012). This will have an impact on the
change in land use/land cover of the area.
Impacts of land use and land cover changes
Land degradation has been the major negative impact of land use and land
cover change in Lay Gayint woreda. The most common form of degradation is
produced by sheet erosion (Lay Gayint Woreda Office of Agriculture, 2012).
As our image analysis demonstrated, the area of bare land increased by
about 10,949 hectares: 19% increase between 1984 and 2004. As a result,
production that was obtained from this area was lost. Moreover, soil fertility

ERJSSH 2(1), June 2015
68
is reduced due to over utilization and improper use of the soil (Lay Gayint
Woreda Office of Agriculture, 2012); this has critically increased the total use
of fertilizer to counteract this decline in production. Due to this and other
interrelated factors, a significant number of people in the woreda, about
80,000, have been facing food shortage and have been given food aid by the
NGOs and GO’s such as USAID (Lay Gayint Woreda Office of Agriculture,
2012) .
CONCLUSIONS
Finer-scale land use and land cover assessments generally involve the use of
higher resolution spatial and field data (such as, data on vegetation
structure, plant species type, etc), statistics or measures that relate to a
condition, change or quality, or change in state of environment and socio-
economic conditions. The analysis of this data allows knowing land use and
land cover changes that have occurred in Lay Gayint woreda during the last
20 years, from 1984 to 2004. The methods this study used were remote
sensing integrated into a Geographical Information Systems (GIS)
environment, which provided an ability to characterize large assessment
areas and establish reference conditions. Generally the situations of land use
and land cover dynamics have a depressing effect on the local scale and on
others because its consequences do not have clear boundaries. Therefore,
there is an urgent need for local land use planning and design with
conservation practices in the study area. In this area, forest land decreased
by 79.62% between 1984 and 2004. An increasing demand for farming land,
rural settlement and grazing land was the cause for change of forest land (Lay
Gayint Woreda Office of Agriculture, 2012). Shrub land also declined from
14,083.40 hectares (9%) to 10,085.80 hectares during the last 20 years in the
study area. This is due to high household energy demand of the peoples of
the woreda. The lesser reduction of shrub land might be due to the fact that
some forest lands are converted into this form of land cover.
The expansion of cultivated land at the expense of other land cover types
resulted a decrease in the amount of fodder and the number of cattle. This
has lead to shortage of animals required for plowing and other economical
purposes. Small numbers of livestock also have an impact on the use of cow
dung for manure. Moreover, the expansion of cultivated land into marginal
land leads to more severe land degradation.
There has been a change in land cover during the past twenty years of the
study period (1984 to 2004) in the woreda. For instance, forest land,
communal grazing land and shrub land cover types declined during the study
period, whereas cultivated land and bare land increased at the expense of
forest land and shrub land. These changes have not taken place without
negative consequences.
ERJSSH 2(1), June 2015
69
RECOMMENDATIONS
The study suggests a series of measures in order to improve the land use and
land cover status of the woreda and thus safeguard the livelihood of the local
communities.
Forest protection and recovery
Soil and water conservation measures through afforestation program are an
immediate requirement. The lack of national forest policies or guidelines on
utilization, protection and property right of forest land and an ever increasing
demand of farming land exacerbated the rate of deforestation. Moreover, the
lack of a single afforestation program to be used as a model and to be
organized by either the government or non-governmental organizations has
an influence in hindering actions of forest protection and recovery processes
in the study area. Therefore, an attempt should be made to show a model
afforestation practice on degraded lands.
Population policy
Changes in land use and land cover in the study areas are mainly caused by
increasing population. The current household family size and its annual crop
production are not proportional. Moreover, farmers were unable to improve
the amount of production with the existing conventional farming practice.
Therefore, enhancement of households’ knowledge regarding the impact of
population growth on their living situation, through family planning
programs and sex education, has a paramount importance.
Alternative energy sources
Fuel wood is the main source of energy in the study area. To this effect,
farmers should be encouraged to plant trees on their homesteads, hillsides
and degraded lands instead of cutting trees from the existing forest. Rural
electrification program, introduction of modern energy sources like kerosene,
and introduction of fuel saving stoves, instead of using fuel wood in
traditional three stone stoves has to be given priority consideration.
Improving literacy level of the community
In the study area, the level of illiteracy is high, despite the fact that the
contribution of educated manpower is unquestionable. Farmers, therefore,
should be encouraged to send their children to school. Moreover, school drop
-out rate should be reduced by changing the attitudes of family heads
through education. Under the present population pressure in the study area,
intensification of agriculture (increasing productivity per unit area) is
recommended. The contribution of literate farmers in the intensification of
agriculture will be greater than that of illiterate ones. Therefore, both the
government and the society should take an immediate action to increase the
number of students and their enrolment in schools.
ACKNOWLEDGEMENTS
We are grateful to University of Gondar, the staff members of the Department
ERJSSH 2(1), June 2015
70
of Geography and Environmental Studies, especially to ato Abel Markos, for
offering us moral and technical support relevant for this research.
REFERENCES
Amare B. (1994). Land Use Dynamic, Land Cover Change and Conflict in the
Semen Mountain National Parks and its Environs, North Gondar (Master’s
thesis, Addis Ababa University).
Befekadu Degefe & Berhanu Nega. (2000). Annual report on Ethiopian
economy, Volume 1. Addis Ababa: The Ethiopian Economic Association.
Belay Tegene. (2002). Land cover/Land Use changes in the Derekolli
Catchment of the South Welo zone of Amhara Region, Ethiopia. Eastern
African Social Science Research Review, 18(1), 1-20.
Central Statistical Authority. (2007). The Population and Housing Census of
Ethiopia: Results at a Country Level (2007). Addis Ababa: Office of
Population and Housing Census Commission, Central Statistical
Authority.
Ethiopian Forestry Action Program (EFAP). (1994). The Challenge for
Development (final report). Addis Ababa: Ministry of Natural Resources
Development and Environmental Protection.
Ethiopian Forestry Action Program (EFAP). (1993). The Challenge for
Development (final draft). Addis Ababa: Ministry of Natural Resources
Development and Environmental Protection.
FAO. (1999). FAO Production Year Book (UNFAO 53). Rome: FAO.
FAO. (2001). Global Forest Resources Assessment 2000: Main Report. Rome:
FAO. Retrieved May 1, 2015, from http://www.fao.org/docrep/004/
Y1997E/Y1997E00.HTM
Girma T., Saleem M., Abyie A., & Wagnew, A. (2002). Impact of Grazing on
Plant Species Richness, Plant Biomass, Plant Attribute and Soil Physical
and Hydrological Properties of Vertisol in East African a Highlands.
Environmental management, 29(2), 279-289.
Hurni, H. (1990). Degradation and conservation of soil resources in the
Ethiopian highlands. In: B. Messerli & H. Hurni (Eds.), African Mountains
and Highlands: Problems and Perspectives (pp. 51–63). Missouri:
Wadsworth Press.
Kahsay Berhe. (2004). Land Use and Land Cover Changes in the Central
Highlands of Ethiopia: The Case of Yerer Mountain and its Surroundings
(Master’s thesis, Addis Ababa University).
Kebrom Tekle & Hedlund, L. (2000). Land cover changes between 1958 and
1986 in Kalu District, Southern Wollo, Ethiopia. Mountain Research and
Development, 20(1), 42-51.
Lambin, E.F., Geist, H. J., & Lepers, E. (2003). Dynamics of Land Use and
Land Cover Change in Tropical Regions. Review of Environment and
Resources, 28, 205-241.
Lay Gayint Woreda Office of Agriculture. (2012). Annual Physical Report. Nifas
Mewcha.
Mc Cann, J. (1995). People of the Plow: An Agricultural History of Ethiopian.
Madison, WI: University of Wisconsin Press.

ERJSSH 2(1), June 2015
71
Mesfin Wolde-Mariam. (1991). Suffering under God's environment: A vertical
study of the predicament of peasants in North-Central Ethiopia. Bern:
African Mountains Association.
Meyer, W. B., & Turner-II, B. L. (1994). Change in Land use and Land Cover:
A Global perspective. Cambridge: Cambridge University Press.
Million, B. (2002). The Status of National Forest Areas in South-Western
Ethiopia (final draft) (Ministry of Agriculture). Addis Ababa.
Muluneh W. (2003). Impact of Population pressure of land use/land cover
change, agricultural system and income diversification in west Gurage
land, Ethiopia (Master’s thesis, Norwegian University of Science and
Technology, Trondheim).
North Gondar Trade and Transportation Department. (2011). Annual report.
Gondar.
Reid, R.S., Thornton, P.K., & Kruska, R.L. (2004). Loss and fragmentation of
habitat for pastoral people and wildlife in East Africa: concepts and
issues. African Journal of Range Land and Forest Science, 21, 171–184.
Rindfuss, R. R., & Adamo, S. B. (2004). Population Trends: Implications for
Global Environmental Change. IHDP Update: Newsletter of the
International Human Dimensions Programme on Global Environmental
Change, 1, 1-3.
Sege, C. (1994). Population and Income. In W. B. Meyer & B. L. Turner (Eds.),
Change in Land use and Land cover. A Global perspective (pp. 263-285).
Cambridge: Cambridge University Press.
Solomon A. (1994). Land use Dynamic, Soil Conservation and Potential for use
in Metu Area, Illubabor Region, Ethiopia (Africa Studies series A13).
Berne: Geographical Bernensiss.
Tewolde Berhan G/E. (1991). Diversity of the Ethiopian flora. In J. M. M.
Eagles et. al. (Eds.), Plant Genetic Resource of Ethiopian (pp. 75-81).
Cambridge: Cambridge University Press.
Turner-II, B. L, Moss, R. H., & Skole, D. L. (1993). Relating land use and
global land cover change: A proposal for an IGBP-HDP core project. Report
from the IGBP-HDP working group on land use/land cover change (Joint
Publication of the IGBP No. 24 and HDP No, 5). Stockholm: Swedish
Academy of Sciences.
Turner-II, B. L., Skole, D., Anderson, S., Fishcher, G., Fresco, L.O., &
Leemans, R. (1995). Land use and land cover change. Science/Research
Plan (IGBP report No, 35, HDP report No, 7). Stockholm & Geneva.
Woldeamlak Bewket. (1993). Land Cover Dynamics since the 1950s in
Chemoga Watershed, Blue Nile Basin, Ethiopia. Mountain Research and
Development, 22(3), 263-269. doi: 10.1659/0276-4741(2002)022
[0263:LCDSTI]2.0.CO;2

ERJSSH 2(1), June 2015
72

ERJSSH 2(1), June 2015
73
INTRODUCTION
Climate change is the greatest environmental challenge that current human
generations face (Ajibade, 2013; Vincent, 2004). It is differently defined in
almost every knowledge domain (IPCC, 2007; Kabote, et al., 2014). The most
cited definition of climate change is that of the IPCC (2007), which defines it
as a long-term change in rainfall, temperature and extreme weather episodes.
Temporal and/or spatial variations of the mean state climate beyond
individual weather events is also termed as climate variability (IPCC, 2007).
These phenomena have potential impacts on water, food and nutrition,
agriculture, human health, ecosystem, and infrastructure (IPCC, 2013;
Kabote, et al., 2014). The impacts are differentiated by location, gender and
wealth status. Fragile areas like the Abbay gorge are more vulnerable to
climatic risks mainly due to unfavourable environment and over dependency
on climate sensitive agricultural sector (Kabote, et al., 2014). In this regard,
the work of Vincent (2004) also highlighted that future climate change will
have potential spatial differentiation of impacts.
ORIGINAL ARTICLE
SOCIAL VULNERABILITY TO CLIMATE CHANGE IN THE ABBAY BASIN,
UPPER BLUE NILE OF ETHIOPIA
Menberu Teshome 1
ABSTRACT
This paper assesses the social vulnerability to climate change in the valley of the Abbay-
Beshilo, Upper Blue Nile Basin of Ethiopia. Data were collected using a survey of
households and focus group discussions as well as from the global weather data for soil
and water assessment tool, office documents and research reports. Climatic elements
were analyzed using simple regression and standardized precipitation index, while
social vulnerability index was used to calculate vulnerability scores for social capital
indicators. The study found different social vulnerability scores for different indicators.
Households were highly dissatisfied with the services given by local leaders. However,
households were less vulnerable to climate change by policy-related indicators though
discussants complain of the little or no benefits gained from the policy interventions. This
study is the first assessment of relative levels of social vulnerability to climate change in
the Abbay-Beshilo Valley of Ethiopia. Since social capital is so vital in reducing climate
change risks during and after every disaster, it is essential to consider it when designing
adaptation measures.
Keywords: Abbay Basin, climate change, Ethiopia, social vulnerability, standardized
precipitation index
1. Assistant Professor of Environment and Development Studies at Department of Geography and Environmental Studies, College of Social Sciences and the
Humanities, University of Gondar, Ethiopia. Email: [email protected].

ERJSSH 2(1), June 2015
74
Traditionally studies have concentrated on projections of climate change
using models based on past analogues of climate variability and then making
suggestions on how such changes affect human populations through
changing patterns of weather and coastal flooding. However, such top-down
approaches fail to take into account the vulnerabilities of human populations
in terms of social indicators (Hahn et al., 2009; Houghton, 2009; Vincent,
2004). Assessing the likely impact of climate change is interlinked with the
social dimension of vulnerability. Therefore, understanding how different
societies socially tied to adapt to climate change is a key element of research
(Hahn et al., 2009; Vincent, 2004). As a result, the field of vulnerability study
has emerged to see the way in which human populations mediate the adverse
impact of climate change through their social networks, relationships,
organizational affiliations and institutions. This area of research marks one of
the emerging research areas of society-nature relationships with key policy
and practical applications. The index of social vulnerability has many
applications in contributing to the growing field of vulnerability assessment;
enhancing the ongoing debates on the notions of vulnerability and helping to
interpret the conceptual framework of vulnerability assessment (Vincent,
2004).
Studies were conducted in Ethiopia on climate change and related issues.
Some studies tend to focus on the different shocks in relation to growth and/
or consumption (Dercon, 2004; Dercon et al., 2005). Others examine the
relationship between rainfall and crop production at the zonal, regional and
national levels (Segele & Lamb, 2005; Woldeamlak, 2009). Some others
analyze yield or monetary impact of climate change and adaptation measures
using climate models (NMA, 2001; Temesgen, 2007; Yosuf et al., 2008; You
and Ringler, 2010). A few other scholars also examine climate induced-
hazards, impacts, responses and local innovations to climate change
adaptation, restricted to the pastoral lowlands (Aklilu and Alebachew, 2009;
Yohannes and Mebratu, 2009). Additionally, studies were carried out on
perception and adaptation without integrating vulnerability (Conway &
Schipper, 2010; Temesgen et al., 2009). Only Temesgen (2010) analyzed the
vulnerability of agriculture dependent farmers using the integrated
vulnerability assessment framework aggregated at regional level covering a
wider geographical area having diverse biophysical and socio-economic
contexts.
Reviewing these previous studies, it is found that there are no research works
that treated social vulnerability to climate change in Ethiopia in any spatial
scale using social vulnerability index, except blaming the recurrent drought,
severe land degradation and misdeeds of the previous regimes. In this regard,
scholars of climate-change contend that without understanding social
vulnerability it is difficult to acquire a better knowledge of human adaptation
to climate change (Adger, 1999; Kelly & Adger, 2000; Vincent, 2004; Wisner
et al., 2004). This situation inspired the author to examine the local level
social vulnerability to climate change by integrating different indicators in the
Gorge of the Abbay-Beshilo, upper Blue Nile of Ethiopia. By developing an
index, this can add social vulnerability to the existing knowledge domains of
ERJSSH 2(1), June 2015
75
biophysical vulnerability to climate change at the local level.
VULNERABILITY ASSESSMENT
Concepts of vulnerability
The most contested term for various scholarly communities is ‘vulnerability’,
which refers to the degree to which a system is likely to experience harm due
to exposure to a hazard usually associated with floods, droughts and poverty
(Fusel & Klein, 2005; Turner II et al., 2003). Vulnerability has its origins in
the natural hazards and food security literature (Cutter, 1996). The term
vulnerability is now a central concept in the livelihood, food security,
sustainability science, land-use change, natural hazards, disaster risks
management, public health and global environment and it is increasingly
used in climate change research (Fussel, 2006; Schroter et al., 2004).
Vulnerability is commonly considered to be the ability to anticipate, resist,
cope with and respond to a hazard (Wisner et al., 2004). However,
vulnerability definitions reveal a distinction in the literature between the two
main epistemological approaches. The natural hazards school of thought
arises out of a positivist vein and, hence, focuses on the objective studying of
hazards. Under this approach, emphasis is placed on a particular
environmental stress and vulnerability refers to the risk of exposure of an
ecosystem to a natural hazard. In contrast, the human ecology and political
economy schools of thought have arisen out of interpretive social science
paradigms based on relativist and constructivist ontology In these cases,
vulnerability refers to a particular group or social unit of exposure and
especially to the structures and institutions–economic, political and social–
that govern human lives (Vincent, 2004).
One of the heavily relied upon definitions of vulnerability in the context of
climate change studies is from IPCC (2001, 2007). IPPC defines vulnerability
as the degree to which a system is susceptible to, or unable to cope with,
adverse effects of climate change, including climate variability and extremes.
The same institution provides two more definitions that are not specified as
natural, or social vulnerability, but fit into the separate climate research
streams. From the natural standpoint, the IPCC defines vulnerability as “a
function of the character, magnitude and rate of climate variation to which a
system is exposed, its sensitivity and its adaptive capacity” (IPCC, 2001, p.
995). From a social point of view, it describes vulnerability as the degree to
which a system is susceptible to injury, damage or harm. Along the same
line, Houghton and Khandker (2009) explain vulnerability as a risk of falling
into poverty in the future, even if the person is not necessarily poor in the
present; it is often associated with the effects of shocks such as drought and
floods with a drop in farm production. Thus, social vulnerability is typically
broken into three overlapping components: exposure, sensitivity and adaptive
capacity (Turner II et al., 2003).
Exposure is the magnitude, frequency, intensity, and duration of climate-
related hazards such as hurricanes, droughts, floods and storms, changing
ERJSSH 2(1), June 2015
76
distribution of temperature and rainfall, which expose farmers’ livelihood
assets (IPCC, 2007). Sensitivity is the degree to which the rural household is
adversely affected by the exposure to the changing climatic variables.
Sensitivity can be measured by the proportion of people who have been facing
food shortage, water scarcity, number of months in food shortage, and level of
access to different services. Adaptive capacity on the other hand refers to
people’s ability to adapt and recover from climate exposure by facilitating
access to livelihood resources for adaptation. Sensitivity and adaptive
capacity largely depend on the main livelihood activities practiced by a farmer
and the specific livelihood resources needed to carry out these activities
(IPCC, 2007; Luers et al., 2003; Turner II et al., 2003).
In this line of argument, Schroter et al. (2004) noted that agricultural
vulnerability to climate change in terms not only of exposure to higher
temperatures, but also crops yield sensitivity to high temperatures and
farmers' ability to adapt to the effects of that sensitivity by planting more heat
-resistant cultivars or different crops. Thus, one can conclude that exposure,
sensitivity and adaptive capacity are inherently intertwined (Gallopin, 2006).
For example, greater amounts of exposure will lead to greater sensitivity,
while adaptive capacity can reduce the system's sensitivity. In practice, these
steps do not happen chronologically, but instead play a continuous role in
enhancing or diminishing each other. Consequently, many studies combine
sensitivity with exposure or combine sensitivity with adaptive capacity
depending upon the indicator under consideration.
Theoretical frameworks of vulnerability assessment
There are three major theoretical frameworks used to explain vulnerability:
the biophysical vulnerability, the social/socio-economic vulnerability and the
integrated vulnerability. The biophysical vulnerability assessment framework
tries to assess the risks and levels of damage to certain exposed units that
arise from exposure to the hazards of a particular type and magnitude
(Fussel, 2006; Schroter et al., 2004). This approach uses quantitative models
to measure exposure and sensitivity of biophysical and socio-economic
systems to the given environmental risk based on forecasts or estimates of
climate prediction models, or by creating indicators of sensitivity for real or
potential hazards, including their frequency. A key aspect of the biophysical
approach is the clear distinction between two factors: one, the hazard
characterized by its site, intensity, frequency and probability (Benson &
Twigg, 2007) and, the other, the vulnerability of the degree of damage caused
by a hazard. Therefore, it is mostly considered as the outcomes’ endpoint of
vulnerability (Fussel, 2006).
This approach has invited criticism assuming that humans are passive
recipients of global environmental change and thus failing to capture their
dynamic ability to mediate such hazards, either through resisting an event or
coping with it. The reason is attributed to the fact that it has failed to
consider the role of social structures and institutions that shape differential
exposure and consequences (Turner II et al., 2003). The second limitation
raised by scholars is that studies relying on climate scenario projections from

ERJSSH 2(1), June 2015
77
general circulation models (GCMs) suffer from uncertainty. In addition,
methods relying on advanced climate projections and multiple international
and national databases may be impractical for development planners working
at the community level (Hahn et al., 2009). Therefore, this approach was not
applied in this study.
The second vulnerability assessment framework is social/socioeconomic
vulnerability, which is regarded as a priori condition of a household or a
community conditioned by socio-economic and political contexts (Adger &
Kelly, 1999; Fussel & Klein, 2005; Wisner et al., 2004). While some authors
termed this approach ‘socio-economic vulnerability’ (Adger et al., 2004;
Brooks, 2003), others chose the term ‘social vulnerability’ (Adger, 1999; Kelly
& Adger, 1999; Vincent, 2004), and still a few others explained it as
‘contextual vulnerability’ (O'Brien et al., 2007).
The second-generation vulnerability studies apply this approach focusing on
the local scale to enhance local capacity in the face of climate change. The
theoretical approach focuses exclusively on people, asking who is the most
vulnerable, how susceptible they are and why (Fussel, 2006). This approach
assesses vulnerability based on variations in socio-economic dynamics,
institutional characteristics, political status of people and social groups in
the community in order to measure adaptive capacity (Fussel & Klein, 2005).
There are many works that explain vulnerability in the socio-economic
vulnerability approach (Adger, 1999; Adger & Kelly, 1999; Vincent, 2004;
Wisner et al., 2004). Wisner et al. (2004) point-out various socio-economic
factors that can lead the system to vulnerability situations. These factors
include economic imbalances, power disparity among social groups,
knowledge dissemination, and discrimination in welfare and social
protection. However, it is contended that violent conflict and illness can lead
to a greater loss of life than the natural and human-induced hazards such as
earthquake, drought, flood and famine.
This approach has also attributed vulnerability of the society to socio-
economic and political factors. Studies argue that in reality environmental
factors are creating variation in society (Cutter et al., 2003; Temesgen, 2010).
For example, two or more groups found in similar social conditions, but
characterized by different environmental attributes can have different levels
of vulnerability to climatic stresses. Thus, Fogera, Dembia and Dera woredas
of the Amhara region of Ethiopia are more vulnerable to floods than Chilga
and other woredas because of geographic exposure keeping other social
factors equal. The second limitation of this approach is its failure to consider
variation in natural resource endowments to counteract the negative impact
of environmental shocks. Although resource-rich households experience
greater losses than the resource-poor, they can recover more quickly from a
climatic stress.
Various lines of investigation show the inadequacies of biophysical and
socioeconomic vulnerability frameworks. This recognition has led to the

ERJSSH 2(1), June 2015
78
emergence of integrated vulnerability assessment framework, which draws a
range of physical, biological and social science disciplines using a range of
methods (Fussel & Klein, 2005; Houghton, 2009). Integrated approach brings
together critical insights from political-economy perspectives with the
awareness of physical-human systems interaction (Adger et al., 2004; Brooks,
2003; Houghton, 2009). The two systems interconnect in all the ways.
Natural elements are not isolated from the social and economic environment.
Hence the latter cannot be interpreted in terms of their impact on people
without taking into account social and economic conditions (Luk, 2011).
Accordingly, this study used integrated vulnerability assessment approach
guided with the sustainable livelihood framework as it integrated social
capital indicators and climate variables.
STUDY AREA
The study was conducted in the Abbay Basin of Simada woreda (district),
which is located in South Gondar Zone of the Amhara Region, about 774 km
north of Addis Ababa and 209 km southeast of Bahir Dar city (Woreda Office
of Agriculture, 2011). Simada lies between latitudes 11.00º and 11.5º N
latitude and 38.10º and 38.40º E longitudes. Although the altitude of Simada
woreda ranges from 1196 to 3250 m above sea level (asl) the studied kebeles
are found in the kola climatic zone of Abbay-Beshilo Gorge with altitudes
ranging from 854 to 1500 m asl (See Fig. 1).
The woreda is bordered in the southeast by the Beshilo River, which bounds
it with South Wollo Administrative Zone, on the southwest by the Abbay
River, which separates it from East Gojjam Zone, in the northwest by the
Wanka River, a tributary of the Abbay, which bounds it with Estie woreda,
and in the north and northeast by Lay Gaynt and Tach Gaynt woredas
respectively. This indicates that the woreda is almost totally inclusive in the
Abbay River basin. Shrubs and thorny trees scattered or clustered in some
areas characterize the vegetation cover. Most parts of the woreda have bare
soils especially during dry seasons. Vegetation is mainly natural including
woodlands and grasslands.
The woreda has three climatic zones: kola (60%), woyna-dega (30%) and dega
(10%) (Tibebe, 2008). Meteorology data indicate that the mean annual
temperature is 23º C. For the period 1979 to 2010 the overall rainfall amount
and distribution varied throughout the time and was erratic (Refer to Section
4.1). Much lower total annual rainfall (554 to 847 mm) with the average
annual rainfall of 687 mm was detected in the Abbay-Beshilo Gorge. The
main rainy season extends from Mid-June to the beginning of September.
July and August are the wettest months, while December, January and
February are very dry months. This means that the area has high rainfall for
the two summer months in the year with less or no rainfall during the other
months of the year.
According to the Office of Agriculture, Simada has an estimated total
population of 228,271, which means an increase of 22% from the 1994
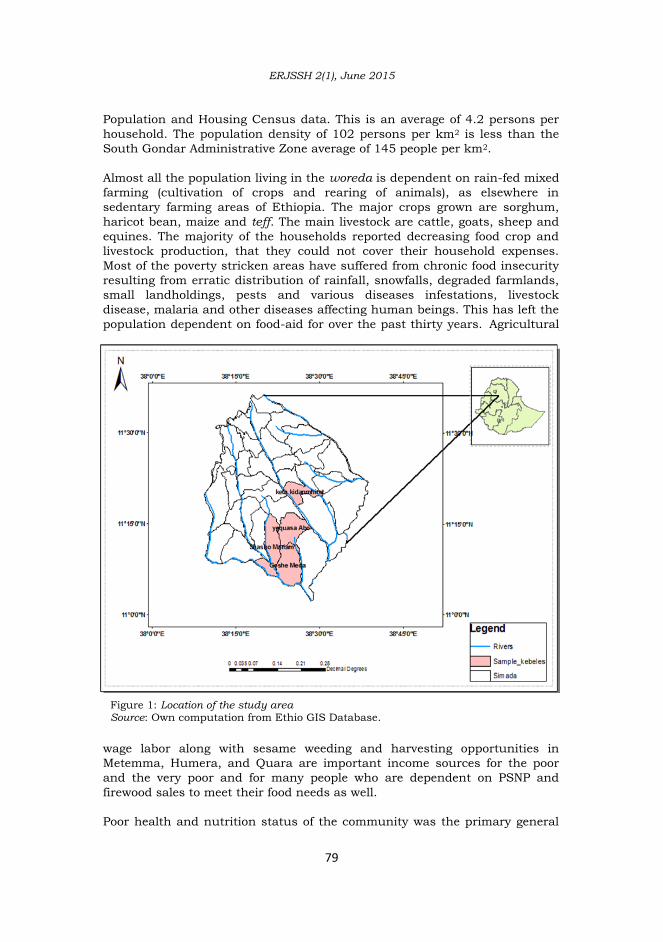
ERJSSH 2(1), June 2015
79
Population and Housing Census data. This is an average of 4.2 persons per
household. The population density of 102 persons per km2 is less than the
South Gondar Administrative Zone average of 145 people per km2.
Almost all the population living in the woreda is dependent on rain-fed mixed
farming (cultivation of crops and rearing of animals), as elsewhere in
sedentary farming areas of Ethiopia. The major crops grown are sorghum,
haricot bean, maize and teff. The main livestock are cattle, goats, sheep and
equines. The majority of the households reported decreasing food crop and
livestock production, that they could not cover their household expenses.
Most of the poverty stricken areas have suffered from chronic food insecurity
resulting from erratic distribution of rainfall, snowfalls, degraded farmlands,
small landholdings, pests and various diseases infestations, livestock
disease, malaria and other diseases affecting human beings. This has left the
population dependent on food-aid for over the past thirty years. Agricultural
wage labor along with sesame weeding and harvesting opportunities in
Metemma, Humera, and Quara are important income sources for the poor
and the very poor and for many people who are dependent on PSNP and
firewood sales to meet their food needs as well.
Poor health and nutrition status of the community was the primary general
Figure 1: Location of the study area Source: Own computation from Ethio GIS Database.
Source: Own computation from Ethio GIS Database

ERJSSH 2(1), June 2015
80
problem of the people in the woreda as identified during the focus group
discussion forums held with the local community. Low health service, which
is the result of the insufficiency of health institutions as compared to the
woreda population, inaccessibility to health services, limited supply of drugs,
malnutrition and weak immunization coverage are among the most prioritized
problems of the area. Different health indicators such as prevalence of
different diseases, child and maternal morbidity and mortality, low status of
personal and environmental sanitation, inadequate immunization coverage
and poor health facilitation are the signs that point out the existence of the
poor health status of the woreda communities.
The cultivated land-use dominates the study area. The human-occupied
areas can be divided into: (1) cultivated areas that can be categorized as
dominantly and moderately cultivated land use units with cereal crops, and
some open grassland; (2) shrubby grassland, bush, open shrubby grassland
and rock out crop; (3) nursery sites, plantation areas and open wooded land;
and (4) small towns and other settlements. The cultivated areas cover
generally the areas having from flat to gentle slopes, whereas moderately
cultivated areas cover the area with moderately steep slopes. Shrubby
grassland with scattered cultivation and open wooded land with bush cover
the southern part of the study area and it is not suitable for cultivation due
to the presence of deep river gorges (Tibebe, 2008).
METHODS
The study used integrated vulnerability framework approach, which assesses
vulnerability based on social dynamics, institutional characteristics, political
status of people and social groups in the community to measure adaptive
capacity (Fussel & Klein, 2005) and climatic elements to measure exposure
levels of the community to climate change risks. The proponents of this
framework consider social vulnerability as the ‘starting point’, which is linked
to the context and the human security. The assumption is that social factors
can worsen or reduce the impact of climatic shocks by increasing or
decreasing the sensitivity of the system comprising individuals, groups,
communities, countries, sectors, etc. From the biophysical factors rainfall
and temperature conditions were integrated with the socio-economic
indicators to measure the exposure of the community to climate change.
Two research designs (cross-sectional and longitudinal designs) and two data
sources (primary and secondary sources) were employed to generate data for
this study. Cross-sectional designs were followed to gather data from farming
households using a questionnaire survey at a point in time in order to
examine the current situations of rural households. Longitudinal designs
were used to record monthly climatic values from Global Weather data for soil
and water assessment tool (SWAT; http://globalweather.tamu.edu/) and
other government offices.
Data collection and analysis took place in two stages. Household survey
preceded focus group discussions (FGDs). Thus, the first stage informed the

ERJSSH 2(1), June 2015
81
second stage. The results from the two stages were integrated in order to
expand the scope and improve the quality of the results. This approach is
known as sequential cross-sectional research design. The study used a
household for the cross-sectional data as a unit of analysis during the survey
because of its responsibility in decision-making on resource use. For the time
-series climate data, the unit of analysis was the community because there
was no possibility of getting climate data at the household level.
Household survey
Four kebele administrations (KAs) were selected using simple random
sampling technique. Because of time and resource constraints only four kola
KAs from the Abbay Gorge were selected. Further stratification of households
in terms of annual income, household size and gender was not done because
it was assumed that systematic random sampling can accommodate
households having these different criteria in obtaining representative sample
population. Sample size determination was carried out to obtain reliable data
for the study. Yemane’s (1967) sample size determination formula referred by
Israel (1992) was checked within the determination of the sample household
size for a better representation of the study population.
The formula provided 263 sample populations. Then, the 263 households
were distributed to each kebele using probability proportional to size (PPS)
method in order to ensure equal representation of households as there are
different household sizes in each KA. The PPS method provided larger
number of household heads for Yequasa Abbo (96), distantly followed by
Shasho Mariam (69), Goshmeda (54) and Keta Kidanemihret (44) (See Table
1).
Sampling frames were obtained for each kebele by taking the list of all
household heads from the kebele administrative offices. The sample
households were drawn from each kebele using systematic random sampling
method from the list of names after a certain sampling interval (K) that was
determined by dividing the total number of households in the kebele by the
predetermined sample size of each kebele. Next, a number was selected
between one and the sampling interval (K) using lottery method, which is
called the random start and was used as the first number included in the
sample. Then, every Kth household head after that first random start was
Sample kebeles No. of households Sample size
Keta Kidanemihret 863 44
Goshmeda 1011 54
Yequsa Abbo 1857 96
Shasho Mariam 1302 69
Total 5033 263
Table 1: Determined sample size by kebele administration
Source: Woreda Administration Offices, 2012.
ERJSSH 2(1), June 2015
82
taken until reaching the desired sample size for each kebele. Systematic
sampling is to be applied only if the given population is logically
homogeneous within the respective strata (kebele administration in this case),
because systematic sample units are uniformly distributed over the
population (Feige & Marr, 2012). In this case, sampling units are rural
households who are uniformly distributed in the respective kebele
administrations.
A structured questionnaire was administered to 263 randomly selected
respondents drawn using systematic random sampling technique. Ten
respondents at Yequasa Abbo kebele participated during pre-testing of the
questionnaire to ensure validity and reliability of the data. Interviews to fill
the questionnaires were done at respondents’ homes and either the
household head or spouse was contacted depending on availability. The
questions asked were close-ended to capture social indicators, which
explained vulnerability levels of surveyed households reside in the Abbay
Basin.
Focus group discussions
Focus group discussions (FGDs) involved farming household heads. The
study involved four FGDs, encompassing forty participants. The plan was to
have six to fifteen members per FGD for effective participation and good
quality of data; hence participants ranged from eight to twelve across the four
kebeles. This aimed at enabling participants to take part in the analysis of
the issues of social assets and extreme weather events. It has also the
purpose of obtaining in-depth information on perceptions and ideas of the
groups on social vulnerability to climate change. That is, this method
addressed the cooperation culture of the society and the occurrence of
extreme weather events as compared to the past. This method helped to
triangulate the household survey and meteorological data. The uses of this
data gathering method is recognized by Creswell (2012) by stating that
qualitative inquirers triangulate among different data sources to enhance the
accuracy of a study. Triangulation is the process of corroborating evidence
from different individuals, types of data, or methods of data collection in
descriptions and themes in qualitative research. Discussions were recorded
in a notebook. Grass-root level extension officers, land administration experts
and kebele leaders were consulted for clarification on certain issues.
Data analysis
Analyses of climate change indicators demand various quantitative and
qualitative methods. The quantitative methods include simple regression (SR),
standardized precipitation index (SPI) and social vulnerability index (SVI)
complemented with descriptive statistics like mean, percentage, maximum
and minimum values. Illustrations such as line graphs, bar graphs and
spider diagrams made clear the results of the study on social vulnerability
and exposure trends.
SR was used for analyzing temperature and rainfall trends. When we examine
the relationship between quantitative outcome and single quantitative
ERJSSH 2(1), June 2015
83
explanatory variable, simple linear regression is the most commonly used
method in order to detect and characterize the long-term trend and variability
of temperature and rainfall values at annual time scale. The parametric test
considers the SR of the random variable Y on time X. The regression
coefficient is the interpolated regression line slope coefficient computed from
the data as used by Mongi et al. (2010) is:
where, Y = Physical factor (changes in rainfall and temperature) during the
period; β = slope of the regression equation; x = number of years from 1979
to 2010; c = regression constant.
The standardized precipitation index (SPI) was used to identify the duration,
magnitude and intensity of droughts during 1979 to 2010 using annual
rainfall data. The SPI is a statistical measure indicating how unusual an
event is, making it possible to determine how often droughts of certain
strength are likely to occur. The practical implication of SPI-defined drought,
the deviation from the normal amount of precipitation, would vary from one
year to another. It can be calculated as:
SPI refers to rainfall anomaly (rainfall variance, irregularity and deficit) on
multiple time scales; X represents annual rainfall in the year t; X is the long-
term mean rainfall; and σ represents the standard deviation over the period
of observation (McKee et al.,1993, cited in Woldeamlak, 2009). Hence, the
drought severity classes are:
Extreme drought (SPI<-1.65);
Moderate drought (-0.84 > S > -1.28),
Severe drought (-1.28 > S > -1.65);
No drought (S > -0.84).
Having quantified the SPI values, drought duration, magnitude, and intensity
were analyzed. Drought duration is the period between drought-starts and
drought-ends expressed in months or years. Drought magnitude (DM) is the
sum of the negative SPI values for all the months or years within the period of
drought (McKee et al., 1993). Mathematically it can be expressed as:
where, j starts with the first month/year of a drought and continues to
increase until the end of the drought (x) for any of the i time scales.
Drought intensity (DI) is the ratio of the drought magnitude of the duration
event, which can be expressed as Mi/Li, where Mi is drought magnitude and
Li is the drought duration calculated from the SPI. Although most drought
analysis used the monthly time scale, the yearly scale was selected for the

ERJSSH 2(1), June 2015
84
purpose of this study. If the monthly scale had been used, the presentation
would have been complicated and would have made the results and
discussion bulky.
Social vulnerability index
Assessment of the vulnerability levels of the farmers was done using the
social vulnerability index (SVI) based on the household survey data
considering functional relationships of indicators with vulnerability. As the
creation of social vulnerability index has several applications, it contributes
to the growing field of vulnerability assessment, adds to the ongoing debates
about notions of vulnerability and helps to define the conceptual framework
of vulnerability assessment (Vincent, 2004).
The SVI were constructed using equal weighting approach to measure
households’ access to a set of social assets and climate change exposures
(Hahn et al., 2009). On the basis of the conceptual framework, indicators
were selected for four components of social capital and climatic factors such
as temperature, rainfall distribution and extreme weather events using expert
judgment, observation and previous studies. The indicators were changed
into standardized index using the following equation (ICRISAT, 2006;
Sudarshan, 1981; Sullivan et al., 2002; UNDP, 2010):
This method of normalization takes the functional relationship between the
predictor variable and vulnerability levels of households. International Crops
Research Institute for the Semi-arid Tropics/ICRISAT (2006) identified a type
of relationship: vulnerability increases with the increase (decrease) in the
value of the indicator. In this type of relationship, the higher the value of the
indicators, the more is the vulnerability. For example, the larger the change
in temperature, rainfall, and distance indicators, the more will be the
vulnerability of the place or the community to climate change. In this case,
the variables have a positive functional relationship with vulnerability and
hence the normalization was done using equation 3. For these types of
variables, the average values are taken as observed values. For variables that
measure frequencies of events, the minimum value is set at 0 and the
maximum at 100. For indicators, which assumed to have an inverse
relationship (adaptive capacity indicators) with vulnerability, the inverse
scoring technique was used in the standardization of values for each social
indicator by equation 4 based on ICRISAT (2006) and NMA (2007).
In this case, let us consider the number of relatives in a village of households,
a high value of this variable implies better off households in the study site. So
the rural households will have more capacity to cope with the impact of
climate change. Put it differently, the vulnerability levels will be lower and the
ERJSSH 2(1), June 2015
85
number of relatives in a village has an inverse functional relationship with
vulnerability.
According to equation 4, an indicator with the least value will have the
highest standardized value. By taking the inverse of the value of the
indicator, one can create a number that assigns higher values to households
with a lower number of livelihood activities and vice-versa. Normalizing
vulnerability indices for each indicator on a scale of 0 to 1 allows calculating
mean scores for each major component using equation 5 (Hahn et al., 2009):
where, SVI is one of the four main components for social capital such as
networks and relationships (NR), organizational affiliations (OA), policy (P)
and leadership and service delivery (LSD); Index refers to the sub-
components, represented by i, which make up each principal component, and
n is the number of sub-components in each major component. For example,
the average index of the networks and relationship (NR) component can be
calculated as:
By applying the same procedure, composite indices were computed for other
sub-components and then for the overall vulnerability levels of households
residing in the Abbay Basin. Once the index values for each component were
calculated, the composite index was computed using the weighted average
with the following equation to obtain the social vulnerability level (SVI) (Hahn
et al., 2009):
where, SVI is social vulnerability index equals the weighted average of the
four important components; the weights of each main component, Ni is the
number of indicators in sub-components that make up each major
component (NCi).
The quantitative analysis was complemented with qualitative methods. The
collected qualitative text or word information through in-depth interview and
writing field notes during observations were analyzed. Before directly getting
into analysis, collected data were converted into word processing documents
and field notes were read to begin the process of analysis.

ERJSSH 2(1), June 2015
86
RESULTS AND DISCUSSION
Temperature and rainfall changes
The temperature is a critical determinant of plant growth and animal
survival. Therefore, the analysis of temperature can be important in many
situations where crops, livestock, stored products, pests and diseases are
affected by its variability. The meteorological data showed that annual
temperature in the study area had been in increasing trend for the last three
decades.
Figure 2 presents the maximum (Tmax), minimum (Tmin) and mean
temperature (Tmean) trends of the studied area over the period of 1979 to
2010. The estimated trend line for average annual temperature is y =
0.052+18.49. The trend line has a positive slope indicating that the average
temperature has increased by 1.61º C over the past 32 years. On decadal
time scales, it rose by 0.50º C. This indicates that there was faster rate of
temperature increase in the studied site. The rate of increase in the studied
site was also faster than the national level increase (0.23º C-25º C/decade),
which was observed over the past fifty five years.
The Abbay-Beshilo Gorge area is drought affected. Drought is a natural
hazard, which can be marked, by precipitation deficiency that threatens the
livelihood resources and overall development efforts of nations or specific
places by exacerbating water shortage. Therefore, analysis of drought
frequency (pattern), duration, magnitude and severity is highly demanded in
order to design appropriate actions.
Figure 3 shows the standardized precipitation index for the study site (1979 –
Figure 2: Temperature trends in the studied site Note: Tmax – maximum temperature Tmin – minimum temperature Tmean-mean
temperature. Source: Computed from NMA and Global Weather Data [http:// Globalweather.tamu.
edu/].

ERJSSH 2(1), June 2015
87
2010). It is clear from the figure that rainfall is characterized by periodic
fluctuation of wet and dry years. Out of thirty two years of observation, fifteen
years (46.88%) recorded below the long-term average annual rainfall and the
rest fifteen years recorded above the long-term average. Only one year
received nearly normal rainfall in the period. Before 1983, the rainfall was
above the long-term average whilst from 1983 to 1995, it was below the long-
term annual rainfall. Again, in 1986 positive SPI value was detected in spite
of its failure in 1987. Likewise, a positive trend was identified from 1988 to
1990, but drier conditions were experienced in 1991. Once more, a slight
recovery was observed from 1992 to 1993 with alternate rise and fall until
1998. Most of the negative anomalies occurred after 1998. The amount of
rainfall in the years 1984, 1987, 1997, 1999, 2002 and 2008 were the lowest
on record in the observation period, marking the worst drought years. Then,
the rainfall indicated a recovery in 2006 from the low values of 1999 to 2005,
but went down in the next three years, marking a large decline in 2008 and
2009. Again, the rainfall showed significant recovery in 2010. Five flood years
were identified with high SPI values in 1980, 1986, 1989, 1994 and 1998
with SPI values of 1.5, 1.95, 1.35, 2.26 and 1.56 respectively.
Having quantified drought-based SPI values, the drought duration,
magnitude, and intensity were analyzed. Although most drought analysis
used the monthly time scale, the yearly scale was selected for the purpose of
this study to reduce complications of the results. The result indicates that
13.53 drought magnitude and 1.04 intensity were computed in fifteen years
of duration.
Figure 3: Standardized precipitation index (SPI) for the study area Source: Computed from NMA and Global Weather Data [http://Globalweather.tamu.
edu/].

ERJSSH 2(1), June 2015
88
Social vulnerability to climate change
Vulnerability is associated with social capital, which can facilitate
coordination and cooperation in times of crisis for material gain or even
resolve disputes (Barungi & Maonga, 2011; Nyangena & Sterner, 2008). In
this study, the households’ social capital was assessed by using components
such as networks and relationships, organizational affiliations, policies and
strategies, as well as decision-making and service delivery. See results in
Table 3 for each indicator and Figure 5 for a summary of the sub-components
of social capital.
Networks and relationships
The forms of social networks and relationships examined in the study area
were the number of relatives in a village (kinship), degree of attachment with
relatives and neighbors (friendship), farmer-to-farmer extension, helps
received from relatives or neighbors, and borrowings from and lendings to
relatives. The survey results indicate that many of the respondents were
involved in several social activities and networking with relatives and non-
relatives involving resource, work and information sharing. However, the
surveyed households were not free from being vulnerable to these indicators.
By the number of relatives in a village, the households had a social
vulnerability score of 0.94, indicating very high degree of vulnerability to
climatic risks. The reason is that the average number of relatives in a got
(village) was 8.79. However, number of relatives in a village may not be
sufficient condition to measure the vulnerability levels of the households
without supporting it with degree of attachment, because a person having a
large number of relatives may be in conflict with them as opposed to a person
who has strong attachments to his/her limited number of relatives and non-
relatives. Thus, the latter may have better adaptive capacity than the former
who is with higher vulnerability level. The results on the degree of
attachments of households with relatives and neighbors provided 0.62 social
vulnerability score (Table 3). This means households having weak ties with
their relatives and neighbors were detected there, indicating limited capacity
against the impact of climate change. From this, we can infer that poor
attachment of households with their relatives and neighbors has strong
association with natural resource depletion and high poverty level.
Concerning the cooperative tradition of the society, households have very
limited capacity. Over 74% of the households reported that the cooperative
tradition of the society has been in a decreasing or worsening condition from
time to time. Although better access to livelihood assets and people’s good
attachment with relatives and neighbors have positive influences, inverse
relation is obtained in the more vulnerable sites. The results also showed that
by borrowing money from relatives and non-relatives, the households were
highly vulnerable by 0.81 score. Again, the households were more vulnerable
with regard to lending money to relatives and non-relatives having 0.85 score
(Table 2).

ERJSSH 2(1), June 2015
89
Social vulnerability indicators Measured values and indices
Unit Observed Maximum
Minimum
LVI
Networks and relationships indicators
Average number of relatives in a village No. 8.79 150 0 0.94
HHs who have loose ties to relatives/neighbors
% 62.4 100 0 0.62
Societies' cooperation/support culture % 73.7 100 0 0.74
HHs who do not get farmer-to-farmer extension/ month
% 42.4 100 0 0.42
HHs who do not get help from relatives/neighbors/6 month
% 35.0 100 0 0.35
HHs who do not get loan from relatives/neigh/6 months
% 81.4 100 0 0.81
HHs who do not lend money in the past 6 months
% 85.2 100 0 0.85
Average networks and relationships vulnerability
0.68
Organizational affiliation indicators
HHs who are not members of farmers' cooperatives
% 74.9 100 0 0.75
HHs who are not members of credit and saving group
% 90.9 100 0 0.91
HHs who are not members of religious groups
% 37.3 100 0 0.37
HHs who are not members of other organizations (Edir)
% 98.5 100 0 0.99
HHs who have no relative holding position in kebele administration
% 67.7 100 0 0.68
Average organizational affiliation vulnerability
0.74
HHs who feel unsecured on their farmland
% 21.3 100 0 0.21
HHs who are not encouraged by land certificate
% 13.3 100 0 0.13
HHs who have no information on government policies
% 36.1 100 0 0.36
HHs who are dissatisfied with government policy
% 33.8 100 0 0.34
HHs who are dissatisfied with NGOs role in development
% 33.8 100 0 0.34
Average policy related issues index 0.28
Leadership and service delivery
HHs who are unhappy by their local leaders’ decisions
% 75.3 100 0 0.75
HHs who are not participated in their local leaders election
% 21.7 100 0 0.22
Frequency of visits to HHs by DAs in a cropping season
Freq 1.0 10 0 0.91
HHs who are not visited by DAs in a cropping season
% 45.6 100 0 0.46
Average Leadership and service delivery index
0.58
Table 2: Normalized vulnerability indices for major components and indicators
Source: Household Survey, March to September, 2012.

ERJSSH 2(1), June 2015
90
Figure 4: Farmers cooperation in agricultural activities, November, 2012 Source: Own field Photo, November 2012.
Different forms of supports the households have gained, from relatives and
non-relatives, provided relatively little contribution for the households’ social
vulnerability index value in the study area with LVI score of 0.35. Although
the cooperative and support culture of the society was reported to be on a
decreasing situation, the respondents involved on some social and economic
activities especially in farming, harvesting, threshing, keeping livestock,
marketing, taking sick family members to health institutions, house
construction and sharing useful information, to mention a few (e.g. Figure 4).
Figure 4 illustrates rural people’s cooperation in harvesting teff during
untimely rain in November 2012. The results from group discussion that
those give-and-take types of co-operations are still working to some extent,
but sharing crops, some amount of money, and animals for different
agricultural and marketing purposes have been greatly decreasing with
negative implications on the adaptive capacity of the studied households.
In the aggregated social vulnerability indices, the households scored 0.68 by
the networks and relationships component of social capital (Table 3). By
almost all the indicators, the households had limited capacity in terms of
networks and relationships to undertake adaptation/coping with activities
against the impact of climate change. This may result from the very high level
of vulnerability of households in terms of other livelihood resources in the
study area. From this, one can infer that there is strong network and
relationship among people in the places where there is relatively better access
to different livelihood resources while the reverse is true in the areas where
there is limited or no access to such resources. As Temesgen (2010) argued,
in the vulnerability and adaptation studies as well as networks and
relationships can play a significant role in information exchange and in
facilitating help and support with the people during the climatic hazards and,
thereby, in reducing vulnerability to climate change impact. Other studies
noted that networks and relationships are assets, which exist in the
networked relationships to cope up with the impacts of climate change and
related issues (Adger, 2003; Luk, 2011). Wisner et al. (2004) also argue that
households that have access to social networks are less vulnerable to natural

ERJSSH 2(1), June 2015
91
hazards. These represent social safety nets and a form of informal grass-roots
insurance available to the household during climate-related crisis (Vincent,
2007).
Organizational affiliations
Farming household’s organizational affiliation in this study was examined
based on membership status of households in farmers’ cooperatives, saving
and credit groups, religious groups, traditional help associations (edir and
equib), and relatives holding positions in kebele administration. The survey
results indicated that the households had highly limited membership status
in different help associations because about 99% of them had no
membership status in traditional help associations. In terms of membership
status in saving and credit groups, 91% of the households were found to be
not attached to saving and credit associations. Similarly, 75% of the
households were found without membership status in farmers’ cooperatives,
both implying limited access in securing useful information, agricultural
inputs and financial resources necessary for adaptation to climate change.
Nearly, 68% of the respondent households had no relative holding position in
the kebele administration. About 63% of the households had no membership
status in religious groups indicating higher degree of vulnerability of the
households at the times of climate change induced risks (See Table 3).
Overall, households’ level of social vulnerability scored 0.74 by organizational
affiliations, indicating limited capacity and in turn greater vulnerability level
of households to climate change-induced risks (Table 2). Other studies argue
that as vulnerability and adaptation are dynamic social processes, the ability
of societies to adapt is determined, in part, by the ability to act collectively.
Being members of any association or group is crucial for reducing
vulnerability by enhancing adaptive capacity of farming households through
information exchange, experience sharing and material and financial support
in times of climatic disasters (Adger, 2003; Luk, 2011). In the light of this
argument, other scholars also argue that associations can build trust,
confidence and moral values, and provide information that will help the
households to adapt to climate change (Nyangena & Sterner, 2008).
Policy issues
Policy processes are important determinants of vulnerability and adaptation
to climate change. Accordingly, land tenure security, land certification, flow
of policy information, and the benefits the households acquire from the
current policies were examined under this issue. The results indicated that
households had an aggregated vulnerable score of 0.28 by policy issues.
When we see indicator wise, equal vulnerability score (0.34) was obtained by
policy deliverables and by the NGOs’ role in supporting local development
efforts for reducing socio-economic and environmental problems. Limited
numbers of NGOs have focused on relief provision and safety net programs in
the study area. The households reported that there is no significant
improvement in their living standard by both the government and NGOs’
interventions. The surveyed households had a social vulnerability score of
0.36 by access level to current policy information (Table 2). Due to its isolated
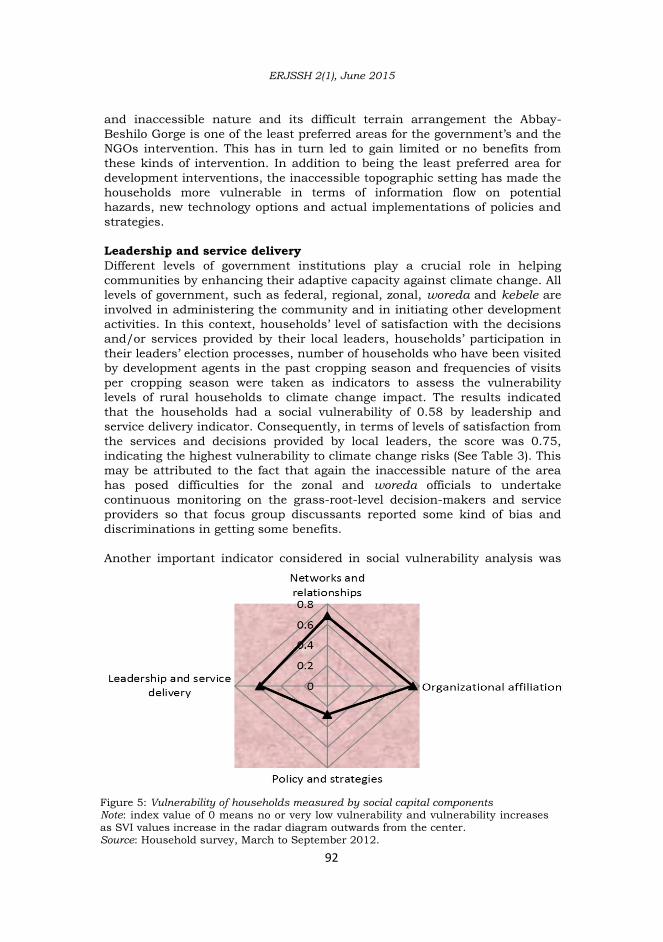
ERJSSH 2(1), June 2015
92
and inaccessible nature and its difficult terrain arrangement the Abbay-
Beshilo Gorge is one of the least preferred areas for the government’s and the
NGOs intervention. This has in turn led to gain limited or no benefits from
these kinds of intervention. In addition to being the least preferred area for
development interventions, the inaccessible topographic setting has made the
households more vulnerable in terms of information flow on potential
hazards, new technology options and actual implementations of policies and
strategies.
Leadership and service delivery
Different levels of government institutions play a crucial role in helping
communities by enhancing their adaptive capacity against climate change. All
levels of government, such as federal, regional, zonal, woreda and kebele are
involved in administering the community and in initiating other development
activities. In this context, households’ level of satisfaction with the decisions
and/or services provided by their local leaders, households’ participation in
their leaders’ election processes, number of households who have been visited
by development agents in the past cropping season and frequencies of visits
per cropping season were taken as indicators to assess the vulnerability
levels of rural households to climate change impact. The results indicated
that the households had a social vulnerability of 0.58 by leadership and
service delivery indicator. Consequently, in terms of levels of satisfaction from
the services and decisions provided by local leaders, the score was 0.75,
indicating the highest vulnerability to climate change risks (See Table 3). This
may be attributed to the fact that again the inaccessible nature of the area
has posed difficulties for the zonal and woreda officials to undertake
continuous monitoring on the grass-root-level decision-makers and service
providers so that focus group discussants reported some kind of bias and
discriminations in getting some benefits.
Another important indicator considered in social vulnerability analysis was
Figure 5: Vulnerability of households measured by social capital components Note: index value of 0 means no or very low vulnerability and vulnerability increases
as SVI values increase in the radar diagram outwards from the center. Source: Household survey, March to September 2012.

ERJSSH 2(1), June 2015
93
access to extension services (whether the households accessed extension
services or not and how often). The inverse scoring technique depicted in
Equations 4 indicated that by the development agents’ (DAs) frequency of
visits to households in the past cropping season, the households had 0.91
score, indicating very limited extension services provided to the rural
households. Even 46% of the surveyed households reported that they had
never received any visit from DAs in the season considered (Table 2). From
this, we can infer that neither extension visits nor visits and trainings have
brought significant capacity increment in terms of skill, knowledge and
attitudinal changes in adopting new adaptation technologies. In fact,
development agents remain at the edge, never reaching the farmer and
service packages may not fit the Abbay-Beshilo Gorge.
Figure 5 presented the average vulnerability score for the sub-components of
social capital. It is clear from the spider diagram that in terms of
organizational affiliations, households were found to be highly vulnerable
(0.74) implying very limited affiliations of households to different formal and
informal organizations. Again, in terms of networks and relationships, they
were more vulnerable by 0.68 score and in terms of leadership and service
delivery the scored was 0.58. Despite the challenges to identify the indicators
that reflect the local social assets, including them in climate vulnerability
assessment is essential as many adaptation behaviors rely on collective
insurance mechanisms such as religious groups, agricultural cooperatives,
credit groups, and traditional help associations. In terms of policy directions,
it seems that the households are less vulnerable to climate change impact.
However, the data gathered from the household surveys in the study area
does not show what farmers have experienced. Such a lack of congruence
between the survey data and what people actually experienced is
understandable. In the discussion sessions, people complained of little and/
or no benefits obtained from the policy interventions though the government
has declared double-digit economic growth over the last eleven years.
CONCLUSIONS
Climate change is a very real fact that will inevitably affect human
populations in the coming decades. In this paper, an empirical index was
created to assess the rural households’ relative social vulnerability to climate
change in the Abbay-Beshilo Gorge of Ethiopia. A theory-driven aggregate
index of social vulnerability was formed through the equal weighting
approach of four composite sub-indices: networks and relationships,
organizational affiliations, policy strength, and leadership/service delivery.
Vulnerability assessment provides a framework for identifying and measuring
these very important components of social capital, which may create
differential vulnerability situations of the studied community.
The outcome of the current vulnerability study in terms of social capital puts
the rural households of the study area in the most vulnerable position to
climate change impact. Whilst the studied households were found to be the
most vulnerable social groups to climate change by organizational affiliations

ERJSSH 2(1), June 2015
94
(0.74), networks and relationships (0.68) and leadership and service delivery
(0.58), they were the least vulnerable in terms of policy deliverables (0.28). It
is important to remember, however, that this is a relative scale and it should
not imply that the latter social vulnerability component is entirely resilient.
Despite the fact that better access to livelihood assets and people’s good
attachment with relatives and neighbors have positive influences, inverse
relation is obtained in the studied area. The indices are grounded in existing
literature on vulnerability and use the most important local level data sets.
Thus, this study marks the first robust assessment of relative levels of social
vulnerability of rural households to climate change in the Abbay-Beshilo
Gorge. Since social capital is so vital in reducing climate change risks during
and after disaster, it is required to consider the same when adopting
adaptation and mitigation policy measures. Thus, the government should try
to maintain intact the social networks and make the best use of the existing
social networks in the development processes.
ACKNOWLEDGMENTS
The author wishes to thank the farmers of the study area for their
cooperation throughout the research. Thanks are also extended to the
enumerators who patiently carried out the household surveys, the experts at
Simada woreda Office of Agriculture, and the development agents at the
specific study sites. This study was supported financially by the University of
Gondar. The paper has benefited substantially from anonymous reviewers.
REFERENCES
Adger, W. N. (1999). Social Vulnerability to Climate Change and Extremes in
Coastal Vietnam. World Development, 27(2), 249-269.
Adger, W. N. (2003). Social Capital, Collective Action, and Adaptation to
Climate Change. Economic Geography, 79(4), 387-404.
Adger, W. N., Huq, S., Brown, K., Conway, D., & Hulme, M. (2003).
Adaptation to Climate Chnage in the Developing World. Progress in
Development Studies 3(3), 179-195.
Adger, W. N., Brooks, N., Bentham, G., Angew, M., & Eriksen, S. (2004). New
Indicators of Vulnerability and Adaptive Capacity. Norwich, East Anglia:
Tyndall Center for Climate Change Research.
Ajibade, I. (2013). Climate change and human rights: A case study of
vulnerability and adaptation in coastal communities in Legos, Nigeria
(doctoral dissertation, Universty of Westtern Ontario London, Canada).
Benson, C., & Twigg, J. (2007). Tools for Mainstreaming Disaster Risk
Reduction: A Sustainable Livelihoods Approaches. Guidance Notes for
Development Organizations. Geneva, Switzerland: International
Federation of Red Cross and Red Crescent Societies/ProVention
Consortium.
Brooks, N. (2003). Vulnerability, Risk and Adaptation: A Conceptual
Framework (Tyndall Centre Working Paper 38). Retrieved from http://
tyndall.ac.uk

ERJSSH 2(1), June 2015
95
Creswell, J. W. (2012). Educational Ressearch: Planning, Conduction and
Evaluating Quantitative and Qualitative Research. New York, NY:
Pearsons Educational Inc.
Cutter, S. L. (1996). Vulnerability to Environmental Hazards. Progress in
Human Geography, 20(4), 529-539.
Cutter, S. L., Boruff, B. J., & Shirley, W. L. (2003). Social Vulnerability to
Environmental Hazards. Social Science Quarterly, 84(2), 242-262.
Dercon, S. (2004). Growth and shocks: evidence from rural Ethiopia. Journal
of Development Economics, 74, 309– 329.
Dercon, S., Hoddinott, J., & Woldehanna, T. (2005). Shocks and consumption
in 15 Ethiopian Villages, 1999-2004. Washington DC.: International Food
Policy Research Institute.
Feige, S., & Marr, M. A. (2012). Sampling Manual: A Guide to Sampling under
the CDM with Special Focus to POAs (1st ed.). Frankfurt: KfW.
Fussel, H. M. (2006). Vulnerability: A Generally Applicable Conceptual
Framework for Climate Change Research. Stanford, CA: Global
Environmental Change.
Fussel, H. M., & Klein, R. J. T. (2006). Climate Change Vulnerability
Assessments: An Evolution of Conceptual Thinking. Climatic Change, 75
(3), 301-329. Retrieved from http://link.springer.com/article/10.1007%
2Fs10584-006-0329-3
Gallopin, G. C. (2006). Linkages between Vulnerability, Resilience, and
Adaptive Capacity. Global Environmental Change, 16, 293–303.
Hahn, M. B., Riederer, A. M., & Foster, S. O. (2009). The Livelihood
Vulnerability Index: A pragmatic approach to assessing risks from
climate variability and change–A case study in Mozambique. Global
Environmental Change, 19(1), 74-88. doi: 10.1016/j.gloenvcha.
2008.11.002
Houghton, J. (2009). Global Warming: The Complete Briefing (4th ed.).
Cambridge: Cambridge University Press.
ICRISAT/International Crops Research Institute for the Semi-Arid Tropics.
(2006, March). Retrieved January 12, 2013, from www.icrisat.org/what-
we-do/
IPCC/Intergovernmental Panel on Climate Change. (2001). Impacts,
Adaptation and Vulnerability. Cambridge: Cambridge University Press.
IPPC/Intergovernmental Panel on Climate Change. (2007). Adaptation to
Climate Change in the Context of Sustainable Development, Background
Paper. Bonn: UNFCCC Secretariat. Retrieved from http://
www.teriin.org/events/docs/adapt.pdf
IPCC/International Panel on Climate Change. (2013). Climate Change 2013:
The Physical Science Basis. Retrieved from http://www.ipcc.ch/report/
ar5/wg1/
Israel, G. G. (1992). Determing sample size (University of Florida/IFAS
Extension, PEOD6). Retrieved from https://edis.ifas.ufl.edu/pd006
Iyengar, N. S, & Sudarshan, P. (1982). A Method of Classifying Regions from
Multivariate Data. Economic and Political Weekly, 17(51), 2047+2049-
2052. Retrieved from http:// www.jstor.org/stable/4371674
Kabote, S. J., Mamiro, D. P., Synnevag, G., Urassa, J. K., Mattee, A. Z.,
Chingonikaya, E. E., … Masolwa, L. M. (2014). Rain-Fed Farming System

ERJSSH 2(1), June 2015
96
at a Crossroads in Semi-Arid Areas of Tanzania: What Roles do Climate
Variability and Change Play?. Journal of Environment and Earth Science,
4(16), 85-101. Retrieved from http://www.iiste.org/Journals/index.php/
JEES/article/view/15154/15731
Kelly, P. M., & Adger, W. N. (2000). Theory and Practices in Assessing
Vulnerability to Climate Change and Facilitating Adaptation. Climatic
Change, 47, 325–352.
Luers, A. L., Lobella, D. B., Sklard, L. S., Addams, C. L., & Matson, P. A.
(2003). A Method for quantifying vulnerability, applied to the agricultural
system of the Yaqui Valley, Mexico. Global Environmental Change, 13(4),
255–267. doi:10.1016/S0959-3780(03)00054-2
Luk, K. Y. (2011). Vulnerability Assessment of Rural Communities in Southern
Saskatchewan (Master's thesis, University of Waterloo, Ontario).
Retrieved from https://uwspace.uwaterloo.ca/bitstream/
handle/10012/6305/Luk_Ka_Yan.pdf?sequence=1
McKee, T. B., Doesken, N. J., & Kleist, J. 1993. The Relationship of Drought
Frequency and Duration to Time Scales. In Eighth Conference on Applied
Climatology (Jan 17-23, 1993, Anaheim California). Conference
Proceedings (pp. 179-184). Anaheim, CA: Colorado State University.
R e t r i e v e d f r o m h t t p : / / c c c . a t m o s . c o l o s t a t e . e d u /
relationshipofdroughtfrequency. pdf
Mongi, H., Majule, A. E., & Lyimo, J. (2010). Vulnerability and adaptation of
rain fed agriculture to climate change and variability in semi-arid
Tanzania. African Journal of Environmental Science and Technology, 4,
371-381.
Moss, R. H., Brenkert, A. L., & Malone, E. L. (2001). Vulnerability to Climate
Chnage: A Quantitative Approach. Washington DC.: The U.S. Department
of Energy.
National Centers for Environmental Prediction. (2010). Global weather data
for SWAT (1979-2010, January). Retrieved March 6, 2013, from http://
globalweather.tamu.edu/
NMA/National Meteorological Agency. (2001). Initial National Communication
of Ethiopia to the United Nations Framework Convention on Climate
Change (UNFCCC). Addis Ababa, Ethiopia: National Meteorological
Services Agency under the GEF supported.
NMA/National Meteorological Agency. (2007). Climate Change National
Adaptation Program of Action (NAPA) of Ethiopia. Addis Ababa: NMA.
Nyangena, W., & Sterner, T. (2008). Social Capital and Institutions in Rural
Kenya: Is Machakos Unique? (Resources for the Future Discussion
Papers).
O'Bbrien, K., Eriksen, S., Nygaard, L. P., & Schjolden, A. (2007). Why
different interpretations of vulnerability matter in climate change
d i s c o u r s e s . C l i m a t e P o l i c y , 7 ( 1 ) , 7 3 – 8 8 . d o i :
10.1080/14693062.2007.9685639
Schröter, D., Polsky, C., & Patt, A. G. (2004). Assessing Vulnerabilities to the
Effects of Global Change: an eight step approach. Journal of Mitigation
Strategies for Global Change, 10, 573–596. Retrieved from http://
download.springer.com/s

ERJSSH 2(1), June 2015
97
Segele, Z. T., & Lamb, P. J. (2005). Characterization and variability of Kiremt
rainy season over Ethiopia. Meteorology and Atmospheric Physics, 89,
153-180. doi: 10.1007/s00703-005-0127-x
Sullivan, C. A., Meigh, D. J., & Fediw, M. T. (2002). Derivation and Testing of
the Water Poverty Index Phase 1. Final Report May 2002 Vol.1 Overview.
Wallingford and London: Center for Ecology and Hydroology, Natural
Environment Research Council.
Temesgen Tadesse Deressa. (2007). Measuring the Economic Impact of Climate
Change on Ethiopian Agriculture: Ricardian Approach (Policy Research
Working Papers 4342). Washington DC: World Bank. Retrieved from
https://openknowledge.worldbank.org/bitstream/handle/10986/7290/
wps4342.pdf?sequence=1
Temesgen Tadesse Deressa. (2010). Assessment of the Vulnerability of
Ethiopian Agriculture to Climate Change and Farmers Adaptation
Strategies (doctoral dissertation, University of Pretoria). Retrieved from
http://repository.up.ac.za/bitstream/handle/2263/28969/ thesis.pdf?
sequence=1
Temesgen Tadesse Deressa, Hassan, R. M., Tekie Alemu, Mahmud Yesuf &
Ringler, C. (2008). Analyzing the Determinants of Farmers’ Choice of
Adaptation Methods and Perceptions of Climate Change in the Nile Basin
of Ethiopia (IFPRI Discussion Paper 00798). Washington DC.:
Environment and Production Technology Division. Retrieved from
http:// www.ifpri.org/sites/default/files/publications/ifpridp00798.pdf Temesgen Tadesse Deressa, Hassan, R. M., Ringler, C., Tekie Alemu &
Mahmud Yesuf (2009). Determinants of farmers’ choice of adaptation methods to climate change in the Nile Basin of Ethiopia. Global Environmental Change, 19(2), 248–255. doi: 10.1016/j. gloenvcha.2009.01.002
Tibebe, B. (2008). Water Resources Potential Assessment of Simada Woreda with Particular Reference to Groundwater: A Case Study of Bijena-Muge River Catchments, South Gondar Ethiopia (Master's thesis, Arbaminch University).
Turner II, B. L., Kasperson, R. E., Matsone, P. A., McCarthy, J. J., Corellg, R. W., Christensene, L. … Schillerb, A. (2003). A framework for Vulnerability Analysis in Sustainability Science. Proceedings of the National Academy of Sciences of the United States of America, 100(14), 8074–8079. doi: 10.1073/pnas.1231335100
UNDP/United Nations Development Program. (2010). Human Development Index Trends, 1980-2010, Table 2, Statistical Annex 151. New York: UNDP. Retrieved from http://hdr. undp.org/en/countries
Vincent, C. (2004). Creating an Index of Social Vulnerability to Climate Change for Africa (Tyndall Center for Climate Change Research, Working Paper 56). Norwich, East Anglia
Wisner, B., Blaikie, P., Cannon, T., & Davis, I. (2004). At Risk: Natural Hazards, People's Vulnerability and Disasters. London: Routledge, Francis Group.
Woldeamlak Bewket. (2009). Rainfall variability and crop production in Ethiopia: Case study in Amhara Region. In S. Ege, H. Aspen, Birhanu Teferra & Shiferaw Bekele (Eds.), Proceedings of the 16th International Conference of Ethiopian Studies (pp. 823-836). Trondheim: Harrassowitz.

ERJSSH 2(1), June 2015
98
Retrieved from http://hpccc.gov.in/PDF/Agriculture/ Rainfall%20Variability%20and%20Crop%20production%20in%20Ethiopia%20Case%20study%20in%20the%20Amhara%20Region.pdf
Yohannes Aberra. (2012). Perceptions of climate change among members of
the House of Peoples' Representatives, Ethiopia. Journal of Risk Research, 15(7), 771-785. doi:10.1080/13669877.2012.657219
You, G. J.-Y., & Ringler, C. (2010). Hydro-Economic Modeling of Climate Change Impacts in Ethiopia (IFPRI Discussion Paper 00 960). Washington DC., Addis Ababa, New Delhi: IFPRI. Retrieved from http://www.ifpri.org/sites/default/files/publications/ifpridp00960.pdf

ERJSSH 2(1), June 2015
99
Based in Addis Ababa, Shama Books is an important Ethiopian publisher of
scholarly literature. Since the year 2000 its production has expanded with a
series of finely edited books written by prominent authors and encompassing
fields from literature to social sciences and the humanities. Archaeology:
English-Amharic Dictionary is a new contribution to the rich catalogue of the
Addis Ababa publisher. Its authors, Hasen Said and Asamrew Dessie, are
professionals in the fields of archaeology and heritage management in
Ethiopia. Dr. Hasen Said is a trained prehistorian with a large career as a
museum custodian; for many years he has been the head of the Museum of
the Institute of Ethiopian Studies in Addis Ababa. Asamrew Dessie is a
trained archaeologist who has taken part in several excavation campaigns.
Archaeology: English-Amharic Dictionary joins a trend within the different
scholarly fields to publish thematically oriented dictionaries to help coin a
standard Amharic vocabulary for literary and scholarly writing. Thus, in the
humanities and social sciences dictionaries and glossaries on oral poetry,
linguistics, theatre, theory of literature and law have appeared within the last
years. In the ‘harder’ sciences the work የሳይንስና ቴክኖሎጂ መዝገበ ቃላት. The Science
and Technology Dictionary (English-Amharic) published by the Academy of
Ethiopian Languages (1996) stands out. As the authors themselves
emphasize in their introduction to Archaeology: English-Amharic Dictionary,
the book emerges within a context of growing research as well as public
awareness about archaeology in Ethiopia. This, however, has created its own
problems. The fact that most research has been conducted by foreigners or it
has been written about in foreign languages has created a situation in which
the terminology employed by local authors largely relies on loanwords from
English and a proper standardization of terms is missing. Additionally, when
Amharic is used the trend is towards increasing confusion. So it has often
been the case that authors have employed different terms to express the
same meaning (the examples given by the authors are illustrative and include
such terms as chopper/chopping tools, rendered as ቆራጭ and መጨፍጨፊያ;
hominid, as የሰው ልጅ, ቅድመ ሰብ and ሰው አውራሽ; flakes, as ቆንጨራዎች, ጦር መሰል, ፍላፃ and
ጦሮች; and cleaver, as ፋስ and የቆዩ የእጅ መጥረቢያዎች). Inversely, authors have also
tended to employ the same term but with different meanings or even to
change the original English meaning. The Dictionary is intended as a tool to
help fix such kind of problems. In the introduction the authors summarize
the book’s goals: to serve as a handy tool for students, scholars and
professionals in helping them conduct their study and research and
publishing in Amharic; and to have other professionals–from teachers, to
journalists, to curriculum developers–and the larger public benefit from
archaeological science.
The effort made by the authors deserves recognition. On the one hand, they
BOOK REVIEW
Archaeology: English-Amharic Dictionary. የአርኪዎሎጂ እንግሊዝኛ-አማርኛ መዝገበ ቃላት. By
Hasen Said and Asamrew Dessie. Addis Abäba: Shama Books, 2010-2011.
Pp. 80; illustrations. ISBN: 978-99944-0-050-8. Price: 95.00 ETB.

ERJSSH 2(1), June 2015
100
have been assisted by renowned scholars, such as the late Amsalu Aklilu, the
leading author of the Amharic-English Dictionary (1973). On the other hand,
as they themselves indicate in the introduction, their emphasis has been on
consistency and clarity. Thus, while the dictionary is not exhaustive, the
authors have focused on the frequency of use (though without mentioning
their method of establishing it) of the terms in order to choose the English
terms to be included in the dictionary. Moreover, effort has been put into
harmonizing the Amharic terms with the English terms, and when this was
not possible (e.g. with such terms as Homo erectus, Homo sapiens) a
definition was provided. The Dictionary also gives a transliteration of the
English term in the Ethiopian script and some difficult terms (chiefly those
related to lithic industries) are also accompanied by an illustration.
Yet, the merits of the work must not prevent us from noticing its
shortcomings. On the one hand, while the contribution of Prof. Amsalu Aklilu
has been certainly helpful for the project, it is regrettable that other
important reference works were not consulted. Such standard titles as
Leslau’s English-Amharic Context Dictionary (1973) and Kane’s monumental
Amharic–English Dictionary (1990), which sometimes provide terms different
from those given in Archaeology: English-Amharic Dictionary, come to mind.
On the other hand, the Dictionary presents a number of flaws that the scholar
cannot fail to notice. For the sake of analysis they can be divided into seven
categories: spelling errors; wrong filing; inconsistency; muddled classification;
odd choices; wrong description or translation; and omissions. Evidently the
examples given below are samples only and not exhaustive.
As to the spelling errors, some of them are not to be expected in a work of
this kind. Thus, a few entries feature mistakes such as “covex sidescraper”,
“field archieves”, and “strategraphy”. Next, the alphabetical filing is far too
often wrong (e.g. “alternate flaking” p. 8, “characteristic waste product” and
“chipped stone artifacts” p. 21, “compression rings” and “concave edge
removal” p. 23, “convergent sidescraper” p. 24, “denticulate scraper” and
“digital records” p. 30). This problem could have been partially averted had
the authors chosen a more analytical and ‘hierarchical’ organization of the
concepts, such as grouping thematically related terms (e.g. the big
“archaeological” cluster in pp. 10-11) under the same heading. The third flaw
category concerns inconsistencies, and it is extensive, too. Thus, the criteria
by which some terms (e.g. “Cultural resources”, “Field Work”, “Camp site”)
have an initial capital letter and others do not, are unclear. Perhaps more
seriously, more often than not there is no agreement between the
grammatical value of English and Amharic terms; thus, English verbs are
sometimes translated with Amharic nouns or adjectives and inversely (e.g.
ስእላዊ ትእይንት for “to depict” on p. 30). In the category of muddled classification,
the authors are often wrong when describing the parts of speech of the
entries, in particular by mistaking nouns for verbs, adjectives for nouns,
nouns for adjectives and so on (so, for instance, “to amputate”, “to preserve”
and “to attenuate” feature as nouns on pp. 8, 62 and 12, respectively; “data
capture” is described as a verb on p. 28, but two lines below “data cleaning”
features as a noun; “backed” and “coated” appear as nouns on pp. 13 and 22,

ERJSSH 2(1), June 2015
101
respectively). Next, and even though some may regard it as a matter of
opinion, some choices made by the authors strike as odd. As mentioned
above, why not group ‘cluster’ terms within the same heading, which would
have prevented unnecessary repetitions and significantly improved the text’s
clarity? Additionally, it is difficult to understand the need for an Amharic
transcription of the English terms, when the potential readership of the
Dictionary will be competent in English. The most important aspect of the
Dictionary is the Amharic translation or explanation of the English terms; but
even here the authors score unevenly. On occasions they provide simply a
wrong description (e.g. on p. 8 where “alienation” is described as ያልተለመደ ነገር;
on p. 10 “archaeological ceramic” and “archaeological discoveries” appear
with the same definitions, የአርኪዎሎጂ ግኝት and የአርኪዎሎጂ ግኝቶች, respectively; on p.
11 “architectural construction” is described as የአርኪዎሎጂ ንድፈ ግንባታ). Elsewhere,
they provide a new Amharic term when better terms were already available
(thus, on p. 9 ቅርስ translates “antiquity” instead of the widely accepted
ጥንታዊነት) Yet, perhaps the most deplorable aspect of the book, which is
explicitly conceived for practical uses such as field work and academic
writing, is the omission of terms that no scholarly encyclopaedia or dictionary
in the fields of archaeology and heritage management should fail to include.
The list of those missing terms is disquietingly long. A few illustrative and
important examples are the following: antiquarianism (but “antiquarians” is
given), cistern, civilization, dating (but “relative dating”), dendrochronology,
ditch, dowsing, enclosure, Enlightenment, exspoliation, foundations, layer,
metal detector, nationalism, pit, Radiocarbon, resistivity surveying, rock art
(but “rock art site”), Romanticism, taphonomy, varves and wall.
Archaeology: English-Amharic Dictionary is an ambitious book. Considering
the expanding sector of higher education in Ethiopia and the growing need
for reference works, titles such as the one under review are urgently needed;
they are indispensable tools for the formation of new generations of
academics and professionals and also to cater to a body of non-specialized
readership. Moreover, professionals working with the Amharic language
(authors, translators, editors) will benefit enormously from sound reference
works, particularly in the fields of the humanities and social sciences. Yet,
the Dictionary falls short of its objectives. Indeed, the work’s ambitious goals
are not matched by a corresponding level of care in preparing, editing and
correcting the contents. On the one hand, the choices made by the authors
appear as not ideal; this can be argued, for instance, with the loose
alphabetical listing of concepts, which is oblivious of their intrinsic relations
and make the consultation cumbersome and tedious. On the other hand, the
Dictionary has far too many errors of all sorts (conceptual, orthographic,
semantic); such flaws are not acceptable in a reference work that aspires to
guide scholarship and the interested public. Apparently the authors cut short
the necessary editing and correction stages in order to reach the market as
quickly as possible. This seems to be further indicated by the lack of page
numbers on several pages, such as pp. 4-7, 33, 40, 46, 50, 55, 65, 78 and
80. The hope remains that in a second edition the authors will address these
indicated shortcomings and mishaps and thereby the Archaeology: English-
Amharic Dictionary will turn into a true reference work for Amharophones

ERJSSH 2(1), June 2015
102
inside and outside Ethiopia in the important fields of archaeology and
heritage issues.
REFERENCES
Academy of Ethiopian Languages. (1996). የሳይንስና ቴክኖሎጂ መዝገበ ቃላት The Science and Technology Dictionary (English-Amharic). Addis Ababa: Artistic Printing Press.
Amsalu Aklilu. (1973). Amharic-English Dictionary. Addis Ababa, London, & New York: Oxford University Press.
Kane, T. L. (1990). Amharic–English Dictionary. Wiesbaden: Harrassowitz. Leslau, W. (1973). English-Amharic Context Dictionary. Wiesbaden:
Harrassowitz.
ACKNOWLEDGEMENTS
I want to thank Magdalena Krzyżanowska for her help in writing this review.
Andreu Martínez d’Alòs-Moner University of Gondar, Ethiopia

ERJSSH 2(1), June 2015
103
ACADEMIC NEWS
ON THE RELEASE OF THE FIRST ISSUE OF THE RENAISSANCE
JOURNAL OF SOCIAL SCIENCES AND THE HUMANITIES
The maiden issue of Ethiopian Renaissance Journal of Social Sciences and
Humanities (ERJSSH) appeared first in electronic version and later in print.
The print edition was issued in November 2014 and it was the successful end
point of yearlong academic and logistic challenges, institutional efforts and,
above all, intensive teamwork. The moment called for a celebration, which
was solemnly held on December 18, 2014 at Lamergeyer Hotel, Gondar. The
celebration turned into one of the highlights in the academic year of our
University. The participants included the President of the University, the
deans, the directors, the department heads and research center coordinators
as well as guests from various international institutions, university
communities and other stakeholders. Besides celebrating the release of the
first issue of ERJSSH, further objectives of the ceremony included
disseminating the Journal among colleagues and different stakeholders and
promoting its upcoming issues. The inaugural ceremony also helped the
participants to share their experiences and to boost the quality of academic
output within the university, which is called to contribute to good policy
making and problem solving in the country.
Dr Andreu Martínez, recently appointed managing editor of ERJSSH, acted as
the host for the meeting and opened the celebration with a short speech. He
then gave the turn to Dr Yemataw Wondie, ERJSSH editor-in-Chief. Dr
Yemataw delivered a welcome speech addressed to professor Mengesha
Admasu, President of the University of Gondar, the deans of the different
colleges and faculties, directors, heads of schools and departments and all
other guests. Dr Yemataw stressed the importance of the maiden issue of
ERJSSH, the online version of which appeared at a momentous time, when
the University was celebrating its Diamond Jubilee. The journal is also the
second of its kind to be published by the University after the Biomedical
Science Journal. Dr Yemataw expressed his sincere thanks to the ERJSSH
editorial members, who worked indefatigably to accomplish the goals set, and
also to the initial committee, who took the initiative to conduct an
assessment and to share experience from different universities to establish
the Journal. He further appreciated the efforts of manuscript contributors,
language editors and article reviewers, who sacrificed their precious time in
critically reading, evaluating and commenting on the manuscripts.
Furthermore, he emphasized that the release of the first issue of ERJSSH
could not have been possible without the full support received from the
College of Social Sciences and Humanities and the university’s top
management, particularly the Office of the Vice President for Research and
Community Services. Miss Abebech Molla was also thanked for her important
contribution in formatting and doing the layout of the Journal.

ERJSSH 2(1), June 2015
104
Dr Yemataw in his speech also dwelt on the history and organization of the
Journal. He explained that before the senate of the University approved the
present name, other names such as Journal of Maraki and Journal of Blue
Nile were considered. The present name was chosen because it embodied the
wish of the Ethiopian nation to regain the glory of the past with present
achievements and efforts. He also provided a few hints concerning the
ERJSSH’s organization. The Journal is structured through two chief bodies:
the first one is the main executive body, consisting of an editor-in-chief, a
managing editor and three associate editors; the second body consists of an
editorial board formed by senior academics and scholars from Ethiopia and
abroad who provide consultation and guidance. Furthermore, a third external
body is formed by the peer reviewers, which consists of a pool of more than
eighty high-ranking national and international scholars from different fields
within the area of social sciences and the humanities.
In his speech Dr Yeamataw also spoke of the specific story of the Journal’s
maiden issue. In the preliminary stages, dissemination of information–
through social media, Email lists, and workshops–on the prospected Journal
was done in order to receive contributions. A total of fifteen manuscripts were
submitted to the editorial office. After going through the different steps,
including plagiarism check, internal review, peer review, of the fifteen
manuscripts, seven were chosen for publication. Out of these, six were
original research articles and a seventh text was a review article. The articles
published reflected the multidisciplinary nature of ERJSSH, encompassing
different fields within the social sciences and the humanities, such as
linguistics, geography, development studies, psychology, politics, and history.
The next speaker was Dr Menberu Teshome, acting Dean of the College of
Social Sciences and the Humanities and member of the editorial team of
ERJSSH. Dr Menberu said that the College has started the ERJSSH with the
objective of publishing scientific research that would help to solve societal
problems and support teaching learning process by disseminating the
knowledge and publishing the original works of the staff of the College and
the University so that can reach the wider public.
Dr Tadessse, acting Vice President for Research and Community Services,
addressed the audience. Dr Tadessse congratulated the editorial team for
their commitment in bringing out the second journal in the history of the
University of Gondar into completion. He emphasized the importance of the
arrival of the new journal, which coincides with an expansion in the activities
of the Research and Community Services Office as well as with the return of
the newly graduated PhD staff of the University. Therefore, the ERJSSH is
called to play a crucial role in disseminating ongoing research to the wider
community.
Prof Mengesha Admasu, President of the University of Gondar, gave the
concluding speech. Prof. Mengesha congratulated the College of Social
Sciences and the Humanities for realizing the vision of the University to have
at least two journals running during the diamond jubilee year. He also

ERJSSH 2(1), June 2015
105
stressed that the University expected the College of Economics and Business
Management to join soon with the release of its own journals. Moreover, Prof.
Mengesha pointed out the importance of the goals of the Journal, including
maintaining the quality throughout its issues, targeting an international
audience and serving as a platform for the College’s staff. Furthermore, the
publication should serve to tackle problems at the local, national and
international levels. Prof. Mengesha appreciated the support of the
expatriates in sharing their skills and experiences and their contribution to
the success of the Journal.
During the discussion session that followed, Dr Getahun, editor-in-chief of
the Biomedical Science Journal, shared his six-years’ experience of running
the journal. Dr Getahun expressed his concern over the different challenges
his journal faced. Among these were the problem of budget and human
resources, the falling submission rate of articles, the struggle to keep up
quality and peer reviewers’ failing in their commitments. He finally
underscored the need to focus on the sustainability of the Journal.
Following this, Dr Kassahun Tegegne, member of the editorial team of
ERJSSH, raised issues related to the problem of plagiarism checker. So far
the Journal work has been relying on free on-line versions of plagiarism
checkers, which renders this task cumbersome. Hence, he requested the
University to purchase licensed software to help in this task. He further
stressed the importance of having access to online journals and databases for
the academic community. For that reason he urged the university to
subscribe to different publishers in order to have access to journals for
teaching, learning and for research activities. In addition, the ICT Centre of
the University should focus on supporting the webpage and online article
submission system of ERJSSH and in assuring that the server is active on
permanent basis.
On his part Mr Kelali Kiros, Dean of the Law School, appreciated the College
of Social Sciences and the Humanities for successfully publishing its Journal
and announced that the journal from the Law School would be soon
launched.
Andreu Martínez
Kassahun Tegegne
Satyanarayana Kurma
University of Gondar

ERJSSH 2(1), June 2015
106

ERJSSH 2(1), June 2015
107
ABOUT THE JOURNAL
POLICY OF THE JOURNAL
The Ethiopian Renaissance Journal of Social Sciences and the Humanities (ERJSSH) is an official biannual publication of the College of Social Sciences and the Humanities, University of Gondar. The ERJSSH publishes original scholarly articles, reviews, discussions, synopses of major research, technical notes, and case reports within the Social and Behavioural Sciences, the Humanities and other related fields. Manuscripts to be published in ERJSSH are required to meet the standards of international academic journals, be original and not published or submitted for publication elsewhere.
Copyright Statement
College of Social Sciences and the Humanities (CSSH), University of Gondar. All rights reserved. This Journal, or any parts thereof, may not be reproduced in any manner without written permission. It is a condition of publication that authors transfer copyright of their contributions to CSSH. Authors may use their contributions elsewhere after publication provided that proper acknowledgement is given to the ERJSSH as the original source of publication.
Opinions and views stated by the authors in any of the contributions
published in the Journal remain in the responsibility of the authors

ERJSSH 2(1), June 2015
108
GUIDELINES FOR CONTRIBUTORS
SUBMISSIONS
Please, submit your manuscript online to [email protected] or alternatively
use the electronic submission process enabled by the ERJSSH website
http://uog.edu.et/journals/index.php/erjssh/index. All correspondence is
done via internet.
If the manuscript does not meet the requirements and/or the thematic scope
of the Journal the editors reserve the right to reject it.
Your submission will include:
- Two versions of the manuscript, one anonymous and one provided with the
full names of the author(s) as well as contact information.
- The filled and signed submission form to be requested from the editors
before manuscript submission. The submission form includes a statement
that the manuscript has not been published elsewhere and that it has not
been submitted simultaneously for publication elsewhere.
Submission of a manuscript for ERJSSH will be taken to imply that it is
unpublished and is not being considered for publication elsewhere. Evidence
of plagiarism will lead to the rejection of the manuscript and to a future ban
of the author from submitting further texts.
MANUSCRIPT PREPARATION
Articles are to be written either in English or, in cases when the thematic
requires it, in Amharic. The file format should be supported by Open Office
and Microsoft Word and files should be submitted in .doc/.docx (alternatively
also in opd, rtf or pdf) formats. Contributions may not exceed 20 typed pages,
or 8,000 words, including footnotes and references.
FORMAT AND STYLE
Texts should include the following specifications: Times New Roman or
Bookman Old Style, 1.5-spaced throughout, 12-point font size and margins of
2.5 cm on the left and right. All notes are to be set as footnotes.
Contributors should seek clarity, brevity, and simplicity of expression and
avoid long sentences and unduly lengthy or short paragraphs. Authors,
particularly those whose first language is not English, may wish to have their
English-language manuscripts checked by a native speaker before
submission. This is optional, but may help to ensure that the academic
content of the paper is fully understood by the editor and any reviewers.
Only standard abbreviations and acronyms should be used and explained in
the footnotes at the first appearance.

ERJSSH 2(1), June 2015
109
Spelling (in English) may follow either British or American convention but
must be consistent. In some cases, e.g. for philological articles, the use of
diacritical marks will be accepted. Diacritical marks should be those
supported by the Unicode system (see: www.unicode.org).
For further information on how to prepare your manuscript see:
http://www.apastyle.org/manual/related/sample-experiment-paper-1.pdf
ABSTRACTS AND BLURB
The author is required to submit the article with an abstract of 130 to 200
words as well as 4 to 8 keywords.
The author is asked to attach a blurb including his academic career,
affiliation, highest degree, mailing and e-mail addresses as well as any
desired acknowledgement of research support or other credit.
TABLES AND FIGURES
All tabular materials, flow charts, etc. should be typed on separate pages of
the same size and fonts as the text and should be intelligible without
reference to the text. All tables and figures must include an accompanying
figure legend.
Tables and figures should be numbered with Arabic numbers in the order of
appearance in the text. They should be cited in the manuscript, for example,
Table 3 or Figure 3. The author should indicate where in the text the tables
and figures should be placed, e.g.: <Table 1 here>. Legends for tables and
figures should be placed just above and below the image, respectively.
Graphs, diagrams, drawings and photographs are considered as figures. The
original drawings should be no larger than 16×12 cm. All drawings must be
made with black drawing ink on tracing paper suitable for direct photocopy.
Either the original or glossy prints are acceptable. Avoid any unnecessary use
of colors. Photographs should be saved at 300dpi and ideally sent as png, tiff
or jpg files.
In tables and figures the author(s) and year should be indicated.
Contributors are responsible for obtaining permission to reproduce any
material in which they do not hold copyright and for ensuring that the
appropriate acknowledgements are included in their manuscript.
ACKNOWLEDGEMENTS
At the end of the manuscript the author should acknowledge briefly: (a)
contributions that need acknowledging but do not justify authorship; (b)
acknowledgements of technical help received by the author; (c)
acknowledgements of financial and material support received by the author,
specifying the nature of support; and (d) study subjects and others who

ERJSSH 2(1), June 2015
110
contributed in the design, data collection, and analysis of the study.
REFERENCES
References, citations, and the general style of manuscripts is to be prepared
in accordance with the APA Publication Manual (with a modification
concerning names, see below). Citations and references in the text should be
done by (author, year, p. and page number), e.g. (John, 1983, p. 13). In the
case of Ethiopian or Eritrean names, both the personal name and father’s
name should be given and quoted in that order.
A complete list of references is to be provided at the end of the article as
shown in the following examples:
Journal
Firestone, W. A. (1987). Meaning and Method: the Rhetoric of Quantitative
and Qualitative Research. Educational Researcher, 16(7), 16-21.
Book
Rapport, N., & Overing, J. (2000). Social and Cultural Anthropology: the Key
Concepts. London: Routledge (Special Indian Edition).
Edited Book
Gibbs, J. T., & Huang, L. N. (Eds.). (2001). Children of color: Psychological
interventions with culturally diverse youth. San Francisco, CA: Jossey-Bass.
Essay or chapter in edited books
Ospina, S. (2002). Qualitative Research. In G. Goethals, G. Sorensen & J.
MacGregor (Eds.), Encyclopedia of Leadership (pp. 239–252). London: SAGE
Publications.
Internet source
Marshall, E. (2007). Chidi Amuta’s A Dialectical Theory of African Literature:
Categories and Stringboards. Retrieved June 3, 2014, from http://
w w w . r l w c l a r k e . n e t / c o u r s e s / L I T S 3 3 0 3 / 2 0 0 9 - 2 0 1 0 /
04DAmuta,ADialecticalTheoryofAfricanLiterature.pdf
For further information on APA style visit the following websites:
http://www.apastyle.org/
http://wiki.ubc.ca/images/6/6f/Apastyle.pdf
http://web.calstatela.edu/library/guides/3apa.pdf
https://owl.english.purdue.edu/owl/resource/560/01/