Microwave inactivation of Bacillus atrophaeus spores in healthcare waste
10
This article appeared in a journal published by Elsevier. The attached copy is furnished to the author for internal non-commercial research and education use, including for instruction at the authors institution and sharing with colleagues. Other uses, including reproduction and distribution, or selling or licensing copies, or posting to personal, institutional or third party websites are prohibited. In most cases authors are permitted to post their version of the article (e.g. in Word or Tex form) to their personal website or institutional repository. Authors requiring further information regarding Elsevier’s archiving and manuscript policies are encouraged to visit: http://www.elsevier.com/copyright
-
Upload
independent -
Category
Documents
-
view
7 -
download
0
Transcript of Microwave inactivation of Bacillus atrophaeus spores in healthcare waste

This article appeared in a journal published by Elsevier. The attachedcopy is furnished to the author for internal non-commercial researchand education use, including for instruction at the authors institution
and sharing with colleagues.
Other uses, including reproduction and distribution, or selling orlicensing copies, or posting to personal, institutional or third party
websites are prohibited.
In most cases authors are permitted to post their version of thearticle (e.g. in Word or Tex form) to their personal website orinstitutional repository. Authors requiring further information
regarding Elsevier’s archiving and manuscript policies areencouraged to visit:
http://www.elsevier.com/copyright

Author's personal copy
Microwave inactivation of Bacillus atrophaeus spores in healthcare waste
E.A. Oliveira a, N.G.P. Nogueira b, M.D.M. Innocentini a, R. Pisani Jr. a,*
a Postgraduate Program in Environmental Technology, University of Ribeirão Preto, Rua José Bonifácio, 799 13560-610, São Carlos, SP, Brazilb Undergraduate Course in Pharmacy, University of Ribeirão Preto, Rua José Bonifácio, 799 13560-610, São Carlos, SP, Brazil
a r t i c l e i n f o
Article history:Received 29 October 2009Accepted 4 May 2010Available online 31 May 2010
a b s t r a c t
Public healthcare wastes from the region of Ribeirão Preto, Brazil, pre-sterilized in an autoclave, wereinoculated with spores of Bacillus atrophaeus for microwave processing on a laboratory scale. The influ-ence of waste moisture (40%, 50% and 60% wet basis), presence of surfactant, power per unit mass ofwaste (100, 150 and 200 W/kg) and radiation exposure time (from 5 to 40 min) on the heating curveswas investigated. The most favorable conditions for waste heating with respect to moisture and use ofsurfactant were then applied in an experimental analysis of the degree of inactivation of B. atrophaeusspores as a function of time and power per unit mass of waste. Based on Chick’s and Arrhenius laws,the experimental results were adjusted by the least squares method to determine the activation energies(9203–5782 J/mol) and the Arrhenius pre-exponential factor (0.23 min�1). The kinetic parameters thusobtained enabled us to predict the degree of inactivation achieved for B. atrophaeus spores in typicalhealthcare waste. The activation energy was found to decrease as the power per waste mass increased,leading to the conclusion that, in addition to the thermal effect on the inactivation of B. atrophaeus spores,there was an effect inherent to radiation.
� 2010 Elsevier Ltd. All rights reserved.
1. Introduction
Since the 20th century, environmental degradation and thesearch for solutions for the ever increasing generation of wasteshave become constant concerns for both the public and privatesector. In this context, healthcare wastes are very important inview of their potential risk of accidental contamination throughphysical, chemical and biological agents, as well as their epidemi-ological aspects.
The main types of healthcare waste treatment involve thermalprocesses (moist and dry heating, microwaving, macrowaving,infrared, laser, plasma, pyrolysis, gasification and incineration),chemical processes (chlorine, chlorine derivatives, ozone, enzymes,sodium hydroxide), and irradiation processes (Ultra-violet, Cobalt60, electron beam) (Cole et al., 1993; Pellerin, 1994; STAATT,1998; Prüss et al., 1999; Lee et al., 2004).
Microwave processing of healthcare wastes has been widelyused, with several units installed in Brazil, Canada, Japan, Korea,Philippines, Saudi Arabia, UK and US (Hoffman and Hanley, 1994;Edlich et al., 2006).
The overall energy consumed in microwave treatment includesnot only the energy dissipated by the magnetrons but also thepower consumed by the waste hopper, the knife mill, the injectionof saturated steam to increase moisture and inlet waste tempera-ture, transport of waste through the irradiation chamber and the
discharge of treated waste by worm screw. The total consumptionof energy is approximately 270 kWh per ton of processed waste(EPRI, 2003).
The inactivation efficiency of alternative treatment technologiesis tested by inoculating waste with a known amount of Bacillusspores as biological indicators, and retrieving the viable spores atthe end of the test. In general, B. stearothermophilus is used to indi-cate the efficacy of thermal inactivation, B. subtilis is used forchemical inactivation, and B. pumilus is used for irradiation inacti-vation. Alternative technologies for medical waste treatment mustbe tested to ensure that they meet environmental and occupationalsafety requirements; all treatment technologies must meet Level IIIefficacy criteria. Proof that these criteria are met is the responsibil-ity of the equipment manufacturer. To meet these requirements,the manufacturer must demonstrate that all required pathogensurrogates and resistant bacterial endospores (B. stearothermophi-lus or B. subtilis) are inactivated to Level III (reduction of 6.Log10for vegetative cells or 4.Log10 for spores) (STAATT, 1998).
In the specific case of evaluating microwave powered waste dis-infection equipment, Cole et al. (1993) recommended that strips orpouches made of permeable materials and inoculated with 104–108 of Bacillus subtilis spores be placed in the waste and groundand processed in the same way as the waste. The test pouchesare moved with the moistened ground waste by a screw conveyorthrough the microwave treatment chamber over a two-hour treat-ment period. The internal temperature of the treated waste shouldbe maintained at no less than 90 �C throughout the cycle to ensurea reduction of 4.Log10.
0956-053X/$ - see front matter � 2010 Elsevier Ltd. All rights reserved.doi:10.1016/j.wasman.2010.05.002
* Corresponding author. Tel.: +55 16 9111 0776; fax: +55 16 3603 6784.E-mail address: [email protected] (R. Pisani).
Waste Management 30 (2010) 2327–2335
Contents lists available at ScienceDirect
Waste Management
journal homepage: www.elsevier .com/locate /wasman

Author's personal copy
A typical microwave disinfection system consists of 4 or 6microwave generators (magnetrons), each operating at a frequencyof 2450 MHz with 1400 W power. Therefore, the total power dissi-pated in the system varies from 5600 W to 8400 W. The system canprocess up to 250 kg/h of waste in 177 kg batches every 42.5 min.The radiation exposure time is typically 30 min and the moisturecontent of the incoming wastes is 50% in mass (wet basis). How-ever, the equipment normally operates with a load of 180 kg/h ofwaste, i.e., 127 kg in 42.5 min batches, 30 min of which under radi-ation exposure. Thus, the real unit operates with a P/M ratio in theinterval of 62 W/kg to 93 W/kg (Tonuci et al., 2008; Pisani Jr. et al.,2008).
Several studies in the 1960s investigated the microorganisminactivation process in microwave systems compared to conven-tional heating. In general, the results of those studies did not findsignificant differences between the two types of processes. How-ever, it is worth noting that the experimental conditions (powerper unit mass, physical state of the environment and irradiationtime) were very different from the operating conditions of micro-wave systems employed in healthcare waste disinfection (Goldb-lith and Wang, 1967; Lechowich et al., 1969; Latimer andMatsen, 1977; Vela and Wu, 1979; Jeng et al., 1987; Fujikawaet al., 1992; Welt et al., 1994; Yeo et al., 1999; Koutchmaet al., 2001). However, more recently, the effect of microwaveradiation has been established on the cell structure and on theactivation energy of microbial inactivation (Vaid and Bishop,1998; Woo et al., 2000; Celandroni et al., 2004; Yaghmaee andDurance, 2005; Wu, 2008; Kim et al., 2008; Kim et al., 2009). Set-low (2005) made a review of the mechanisms of damage andresistance to Bacillus subtilis inactivation by heat, radiation andchemicals. He concluded that not all aspects are known, but ingeneral, the killing mechanisms cause DNA or inner membranedamage.
Tonuci et al. (2008) determined the kinetic parameters for theinactivation of Escherichia coli in a typical healthcare waste. Incom-ing waste moisture was kept at 50% (wet basis). The pre-exponen-tial factor (k0) was equal to 2.31 min�1. The activation energy (Ea)decreased with the power per unit mass of waste and the followingvalues were found: 10071 J/mol, 8892 J/mol, and 7594 J/mol,respectively, for 60 W/kg, 80 W/kg and 100 W/kg. Thus, the irradi-ation time required to reach Level III inactivation (6.Log10 for veg-etative cells) of this biological indicator using microwaves at 80 W/kg and 100 �C would be 105 min, which is much longer than thetime required by a real-scale system (30 min).
Pisani Jr. et al. (2008) employed the same conditions as thosereported by Tonuci et al. (2008), obtaining a k0 of 10.7 min�1 andan almost constant Ea as a function of P/M in the range of 60–100 W/kg, with an average value of 13990 J/mol, using Pseudomo-nas aeruginosa (vegetative cells) as the biological indicator. Thus,the irradiation time to attain the inactivation level of 6.Log10would be approximately 80 min at 100 �C, which is also higherthan the irradiation time in typical microwave systems.
The purpose of this study was to make a technical analysis ofthe inactivation efficiency of Bacillus atrophaeus spores, previouslyknown as B. subtilis DSM 675, B. subtilis DSM 675, or B. subtilis var.niger (Fritze and Pukall, 2001), in public healthcare wastes whenprocessed by microwave under conditions similar to those of afull-scale apparatus (spores on the waste surface). The aspect thispaper addresses is the fact that the operational conditions appliedfor inactivation and reported in the literature (P/M and supportingmedium for the microorganisms, i.e., soil, water suspensions invials, etc.) differ significantly from the actual conditions employedin a full-scale process. Therefore, the present investigation aimedto ascertain how exposure time and power of radiation on health-care waste affect the microorganism’s spore inactivation rate.Based on these findings, the first-order kinetic model was applied
to determine the kinetic parameters for microwave disinfection ofsolid wastes.
2. Materials and methods
It has been shown in the literature that a power per unit mass ofwaste in the range of 60 W/kg to 100 W/kg may be insufficient toachieve a level of inactivation of 6.Log10 for vegetative bacteriain less than 40 min (Tonuci et al., 2008; Pisani Jr. et al., 2008).Therefore, in this work, the experiments were performed with P/M ratios in the range of 100 W/kg to 200 W/kg for the same timeframe (40 min).
The study involved the waste processing steps, calibration ofthe power dissipated by the microwave furnace, evaluation ofthe influence of moisture on waste heated with and without sur-factant, sporulation of Bacillus atrophaeus, recovery of microorgan-isms from the waste by immersion in 0.9% saline solution, anddetermination of the influence of temperature and irradiation timeon the inactivated fraction of microorganisms in waste.
2.1. Collection and characterization of waste
The waste used in this study came from a specialized healthcarewaste management service operating in several municipalities inthe region of Ribeirão Preto, SP, Brazil, which periodically collectsinfectious waste, pathological waste and sharps, according to theclassification of the World Health Organization (Prüss et al.,1999). Samples were taken from the microwave unit that servesthe region and a daily sample of approximately 200 L was also col-lected on seven consecutive days. Although this material had al-ready been processed by the microwave system, it was sterilizedagain by autoclaving in the laboratory to avoid possible risk of con-tamination. After autoclaving, the waste was spread on a plasticsailcloth to dry in air at room temperature (�25 �C) until the finalmoisture was reduced to about 5% (w.b.).
The waste was then characterized using a quartering method tosort the material and obtain a representative mass of 2 kg of waste.The gravimetric composition of this sample was determined bymanual separation, while its bulk density was determined by thebeaker method (Table 1) and its size distribution by sieving (Table2).
2.2. Calibration of the microwave oven
The experiments were conducted in a SHARP Micro BrownerR4B82 domestic microwave oven with a capacity of about 20 L
Table 1Gravimetric composition and bulk density of the public healthcare wastes used in thisstudy.
Material % in mass (drybasis)
Paper/Fabric 39.3Hard plastic 24.7Plastic film 13.2Rubber 10.5Metals 4.4Glass 2.1Bone 1.6Wood 1.1Polystyrene foam 0.6Others: sawdust, powder material, cardboard, and other
difficult separation materials2.6
Total 100.0
Bulk density for 50% moisture content (wet basis) 128 kg/m3
2328 E.A. Oliveira et al. / Waste Management 30 (2010) 2327–2335

Author's personal copy
(Fig. 1), operating at a frequency of 2450 MHz. The microwaveoven was set to operate at 10%, 20% and 30% of its nominal power,according to the manufacturer’s instructions. Initially, 700 g ofdeionized water was placed in a 1000 mL beaker. The water’s ini-tial temperature was measured and the beaker placed in the centerof the oven, which was then set to operate for 120 s at the desiredpower; the water temperature was measured to ensure no waterevaporated.
The experiment was carried out in triplicate to identify the realdissipated power, which was calculated by the principle of conser-vation of energy, using Eq. (1):
P ¼ MA � CPA � DTt
þMV � CPV � DTt
ð1Þ
where P is the real power absorbed by the sample (W), MA is themass of the water sample (kg), MV is the mass of the beaker (kg),CPA is the calorific capacity or the specific heat of the water (J/kg K), CPV is the calorific capacity or the specific heat of the glass(J/kg K), t is time (s) and DT is the temperature difference (K). Thetemperature of the glass was hypothetically assumed to be thesame as that of the water in each calibration test.
The optimal mass of waste for each test (762 g, 508 g and 381 g,respectively) was determined based on the actual power dissipatedat 10% of nominal power (76.2 W) and for a power per mass ofwaste of 100 W/kg, 150 W/kg and 200 W/kg.
2.3. Determination of heating curves
In microwave disinfection of healthcare waste, an elevation intemperature causes an increase in the microorganism inactivationrate. Thus, the core temperature of the waste was measured as afunction of moisture (40, 50 and 60% wet basis), power per unitmass of waste (100, 150 and 200 W/kg) and time. A thermocouplewith ±0.1 �C precision was installed inside the microwave oven tomeasure the temperature.
Since the waste was composed mostly of hydrophobic materials(Table 1), the experiments were repeated, this time adjusting themoisture content of the waste with deionized water containing asurfactant (commercial detergent in a proportion of 4 drops per li-ter of water), to improve the wettability of the waste and deter-mine the most favorable moisture content for heating the waste.
2.4. Spore preparation and count
A suspension of Bacillus atrophaeus ATCC� 9372 (Cefar, SP, Bra-zil) spores was prepared, including hydration, growth and sporula-tion of the microorganism for the experiment.
In the hydration and growth phases, the lyophilized microor-ganism was hydrated with 1 mL of 0.9% saline solution and stirreduntil complete dissolution of all contents. After hydration, 5 mL ofbrain heart infusion (BHI) broth was mixed with 200 lL of the B.atrophaeus suspension, placed in a Falcon tube and incubated at35 �C for 24 h. Possible contamination of the culture mediumwas also checked.
In the sporulation phase, the Falcon tube containing the suspen-sion of vegetative cells in BHI was shaken in water bath at 80 �C for20 min and then cooled in an ice bath for 10 min. The suspensionwas then diluted to 1/10, 1/100, and 1/1000 to count the resultingspores.
For the growth and counting of the colonies, samples of 10 lL ofsporulated material were sown on Petri dishes containing Mueller–Hinton agar and spread in 8 directions to distribute the material,using a sterile Drigalski spatula. The dishes with the culture med-ium were labeled and incubated at 35 �C for 48 h prior to counting.This procedure was carried out in duplicate to determine the aver-age spore concentration in suspension.
The percentage of sporulated microorganisms was determinedfrom slides prepared by the Gram staining method and by the Wir-tz–Conklin method (Hamouda et al., 2002; Demidova and Hamblin,2005; Golveia et al., 2009). The number of spores was determinedin duplicate by manually counting 1000 spores and vegetative cellsobserved on the slides. An optical microscope equipped with a ret-icle eyepiece was used for observation and counting.
2.5. Inoculation and recovery of the microorganisms
A quantitative approach to the disinfection process impliesdetermining the number of microorganisms at the beginning andend of each experiment. It should be noted that any microorgan-isms possibly not collected from the waste sample at the end ofthe tests would lead to an overestimation of the degree ofinactivation.
To contaminate the sterile waste sample, a volume of 1 mL ofthe suspension containing a known number of spores (106–107)was spiked onto the waste (762, 508 and 381 g for the P/M ratiosof 100, 150 and 200 W/kg, respectively), and the moisture levelwas corrected to 50%. The waste was then vigorously mixed witha glass rod to distribute the spores uniformly.
The contaminated waste was then immersed in 4 L of 0.9% ster-ile saline solution and the mixture homogenized for ten minutes.Then, 2 samples of 1 mL of liquid content were collected and10 lL from each sample were sown on a Petri dish containing
Table 2Particle size distribution of healthcare waste.
Sieve mesh Opening (mm) % in mass
>1.5 in. 38.100 21.31.5–1.25 in. 31.700 0.71.25–1 in. 25.400 3.41–0.75 in. 19.100 11.90.75–0.5 in. 12.700 16.20.5–0.375 in. 9.520 12.20.375–0.25 in. 6.350 13.60.25 in. – 6 mesh 3.350 12.26–8 mesh 2.360 3.38–16 mesh 1.000 4.116–28 mesh 0.600 0.628–32 mesh 0.500 0.232–45 mesh 0.350 0.145–80 mesh 0.177 0.280–100 mesh 0.150 0.2<100 mesh 0.130 0.0
Fig. 1. Thermocouple and the healthcare waste inside the microwave oven.
E.A. Oliveira et al. / Waste Management 30 (2010) 2327–2335 2329

Author's personal copy
Mueller–Hinton culture medium. The colony-forming units werecounted after incubation for 48 h at a controlled temperature of35 �C. Lastly, the number of spores originally inoculated in thewaste (N0i) was compared with the number of spores recoveredfrom it (N0r). The recovery test was performed six times.
2.6. Inactivation tests
The inactivation tests were performed in the microwave systemdescribed in Section 2.1. The influence of radiation time (20, 25, 30,35 and 40 min) on inactivation was evaluated for the three P/M ra-tios (100, 150 and 200 W/kg). A new sample was used for each P/Mratio and exposure time, thus making a total of 6 contaminatedsamples, i.e., one control sample (zero exposure time) and 5 sam-ples for each exposure time. Tests were run in replicates.
The inactivation fraction (X) was calculated from Eq. (2):
Xð%Þ ¼ N0r � NN0r
� �� 100 ð2Þ
where N0r is the number of microorganisms obtained from the con-trol sample (zero exposure time) and N is the number of microor-ganisms obtained at each time.
It should be noted that, in the calculation of the inactivationfraction, N0r does not represent the number of microorganismsinoculated in the waste samples but the number of microorgan-isms recovered from each control test at the three P/M ratiostested.
Table 3 summarizes the experimental conditions employed inthis study.
2.7. Kinetic model
The first-order kinetic model (Chick’s Law) establishes that (Eq.(3)) (Geankoplis, 2003):
� dNdt¼ k � N ð3Þ
where N is the number of microorganisms (CFU), k is the first-orderkinetic constant (s�1, min�1, h�1) and t is time (s, min, h).
The first-order kinetic model assumes a homogeneous popula-tion of microorganisms (pure culture), plug-flow or completelymixed batch reactor, homogeneous distribution of radiationthrough the waste, and uniform temperature throughout thewaste.
The kinetic constant is temperature-dependent, according tothe Arrhenius law (Eq. (4)):
k ¼ k0 � e�EaR:Tð Þ ð4Þ
where k0 is the pre-exponential factor (s�1, min�1 or h�1), Ea is theactivation energy (J/mol), R is the universal constant of the idealgases, and T is the temperature (K).
The integration of Eq. (3) with Eqs. (2) and (4) results in Eq. (5),which relates the fraction of inactivation with kinetic parameters(k0 and Ea), temperature and irradiation time:
X ¼ 1� exp �Z t
0k0 � e
�EaR:Tð Þ � dt
� �ð5Þ
Since batch disinfection experiments are performed in a non-isothermal condition as a function of processing time, the variationof k throughout each trial must be taken into account. The depen-dence of temperature on time was determined experimentally ineach test. The fit of a polynomial to represent temperature versustime allows for the numerical integration and the determination ofthe values of k0 and Ea for the conditions studied. The pre-exponen-tial factor (k0) of the Arrhenius Law is only slightly dependent ontemperature and was assumed to be constant in this study. Theactivation energy (Ea) is dependent on the transformation ofthe elements involved (active microorganisms in inactive) andthe presence of facilitating agents in the process in question (radi-ation intensity, by analogy to the effect of catalysts in chemicalreactions), so Ea was assumed, in principle, to be dependent on P/M (Levenspiel, 1999).
The experimental results were adjusted by the least squaresmethod based on first-order kinetics, using numerical integrationby Simpson’s rule and the Arrhenius law, in order to determinethe activation energies and pre-exponential factor for each exper-imental condition (Billo, 2001).
3. Results and discussion
The design of reactors for the disinfection of healthcare wastesmust include estimates of the time required to achieve the desiredpercentage of inactivation for the microorganism in question.Batch disinfection tests or the existence of thermal profiles in con-tinuous equipment leads to a dependence of the waste tempera-ture on time or on position. Therefore, it is necessary to specifythe temperature as a function of time for each level of microwavepower in order to determine the k0 and Ea parameters by the leastsquares method.
3.1. Influence of P/M ratio and presence of surfactant on the heatingcurves
Figs. 2–4 show the temperature in the waste core as a functionof time for the P/M ratios of 100, 150, and 200 W/kg, with andwithout surfactant, and a moisture content of 40, 50 and 60%(wet basis).
The curves in Figs. 2–4 clearly indicate that the presence of sur-factant resulted in higher final waste temperatures than those ofwastes without surfactant, regardless of the P/M ratio. However,the effect was less marked with the increase in moisture content(an increase of 27 �C for 40% moisture, 8 �C for 50% moisture and7 �C for 60% moisture). This differentiated increase in temperaturein response to the presence of surfactant probably occurred be-cause approximately half of the waste is composed of materialshaving low wettability (hydrophobic material, plastic, rubber andpolystyrene, as shown in Table 1). Therefore, if no surfactant isadded, some of the water may be poorly spread on the waste inthe form of drops or may even flow down to the bottom of thewaste vessel. As a result, heating of the waste bulk is not favoredand the actual temperature is not reliably measured by the ther-mocouple located at the center of the waste mass. The presenceof surfactant helps homogenize the moisture content on the wastesurface and favors a more effective evaluation of the heating gradi-ent. The increase in moisture content allows for a better coating ofwater on the waste bulk and diminishes the influence of the surfac-
Table 3Experimental conditions covered in the study.
Test P/M(W/kg)
Waste moisture(% w.b.)
Wastemass (g)
Time(min)
Heating without surfactant 100 40 762 0–40150 50 508200 60 381
Heating with surfactant 100 40 762 0–40150 50 508200 60 381
Spore inactivation 100 50 762 0–40150 508200 381
2330 E.A. Oliveira et al. / Waste Management 30 (2010) 2327–2335

Author's personal copy
tant. If the solid bulk were saturated with water, there would be nopractical difference between the measured temperatures. This
would explain the higher difference in curves with and withoutsurfactant at 40% of moisture content.
0
10
20
30
40
50
60
70
80
90
100
0 5 10 15 20 25 30 35 40 45
time - t (min)
Was
te te
mpe
ratu
re -
T (
o C)
100 W/kg without surfactant 100 W/kg with surfactant 150 W/kg without surfactant 150 W/kg with surfactant 200 W/kg without surfactant 200 W/kg with surfactant
Fig. 2. Waste temperature profile for a moisture content of 40% (wet basis).
0
10
20
30
40
50
60
70
80
90
100
0 5 10 15 20 25 30 35 40 45time - t (min)
Was
te te
mpe
ratu
re -
T (
ºC)
100 W/kg without surfactant 100 W/kg with surfactant150 W/kg without surfactant 150 W/kg with surfactant200 W/kg without surfactant 200 W/kg with surfactant
Fig. 3. Waste temperature profile for a moisture content of 50% (wet basis).
0
10
20
30
40
50
60
70
80
90
100
0 5 10 15 20 25 30 35 40 45time - t (min)
Was
te te
mpe
ratu
re -
T (
ºC)
100 W/kg without surfactant 100 W/kg with surfactant150 W/kg without surfactant 150 W/kg with surfactant200 W/kg without surfactant 200 W/kg with surfactant
Fig. 4. Waste temperature profile for a moisture content of 60% (wet basis).
E.A. Oliveira et al. / Waste Management 30 (2010) 2327–2335 2331
Author's personal copy
The increase in moisture content from 40% to 50% implied thatthe effect of P/M could not give rise to significant differences intemperature. Moreover, the final temperatures attained for 50%moisture (81–83 �C for 100–200 W/kg without surfactant and89–91 �C for 100–200 W/kg with surfactant) and 60% moisture(83–86 �C for 100–200 W/kg without surfactant and 90–93 �C for100–200 W/kg with surfactant) were very similar. Therefore, thecondition of moisture of 50% with surfactant was chosen for theinactivation tests, since it involves lower costs and dosage of sur-factant, as well as lower water consumption.
3.2. Recovery and inactivation tests
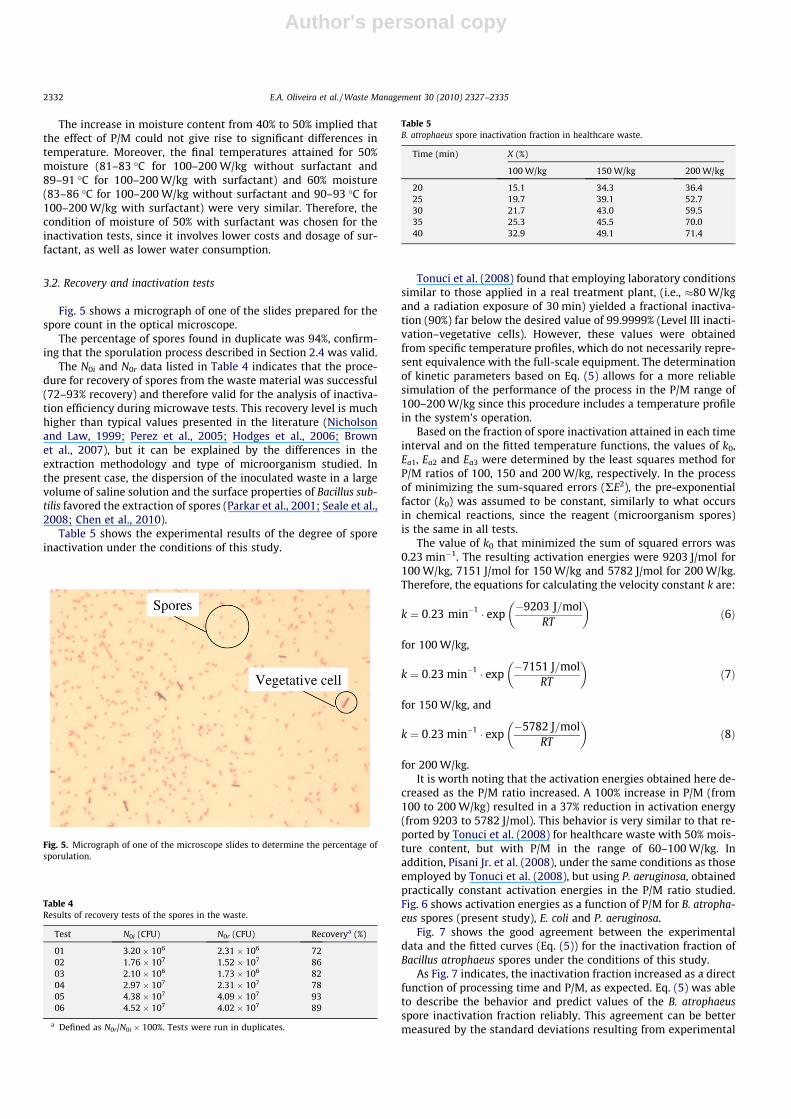
Fig. 5 shows a micrograph of one of the slides prepared for thespore count in the optical microscope.
The percentage of spores found in duplicate was 94%, confirm-ing that the sporulation process described in Section 2.4 was valid.
The N0i and N0r data listed in Table 4 indicates that the proce-dure for recovery of spores from the waste material was successful(72–93% recovery) and therefore valid for the analysis of inactiva-tion efficiency during microwave tests. This recovery level is muchhigher than typical values presented in the literature (Nicholsonand Law, 1999; Perez et al., 2005; Hodges et al., 2006; Brownet al., 2007), but it can be explained by the differences in theextraction methodology and type of microorganism studied. Inthe present case, the dispersion of the inoculated waste in a largevolume of saline solution and the surface properties of Bacillus sub-tilis favored the extraction of spores (Parkar et al., 2001; Seale et al.,2008; Chen et al., 2010).
Table 5 shows the experimental results of the degree of sporeinactivation under the conditions of this study.
Tonuci et al. (2008) found that employing laboratory conditionssimilar to those applied in a real treatment plant, (i.e., �80 W/kgand a radiation exposure of 30 min) yielded a fractional inactiva-tion (90%) far below the desired value of 99.9999% (Level III inacti-vation–vegetative cells). However, these values were obtainedfrom specific temperature profiles, which do not necessarily repre-sent equivalence with the full-scale equipment. The determinationof kinetic parameters based on Eq. (5) allows for a more reliablesimulation of the performance of the process in the P/M range of100–200 W/kg since this procedure includes a temperature profilein the system’s operation.
Based on the fraction of spore inactivation attained in each timeinterval and on the fitted temperature functions, the values of k0,Ea1, Ea2 and Ea3 were determined by the least squares method forP/M ratios of 100, 150 and 200 W/kg, respectively. In the processof minimizing the sum-squared errors (RE2), the pre-exponentialfactor (k0) was assumed to be constant, similarly to what occursin chemical reactions, since the reagent (microorganism spores)is the same in all tests.
The value of k0 that minimized the sum of squared errors was0.23 min�1. The resulting activation energies were 9203 J/mol for100 W/kg, 7151 J/mol for 150 W/kg and 5782 J/mol for 200 W/kg.Therefore, the equations for calculating the velocity constant k are:
k ¼ 0:23 min�1 � exp�9203 J=mol
RT
� �ð6Þ
for 100 W/kg,
k ¼ 0:23 min�1 � exp�7151 J=mol
RT
� �ð7Þ
for 150 W/kg, and
k ¼ 0:23 min�1 � exp�5782 J=mol
RT
� �ð8Þ
for 200 W/kg.It is worth noting that the activation energies obtained here de-
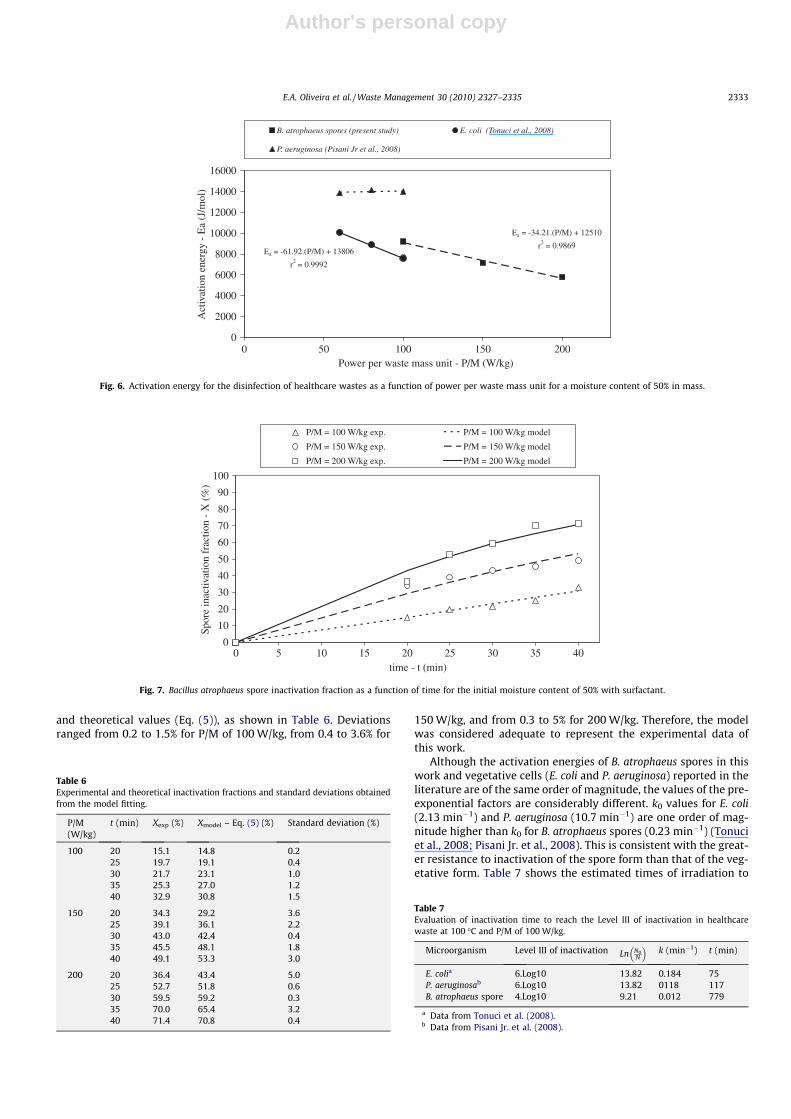
creased as the P/M ratio increased. A 100% increase in P/M (from100 to 200 W/kg) resulted in a 37% reduction in activation energy(from 9203 to 5782 J/mol). This behavior is very similar to that re-ported by Tonuci et al. (2008) for healthcare waste with 50% mois-ture content, but with P/M in the range of 60–100 W/kg. Inaddition, Pisani Jr. et al. (2008), under the same conditions as thoseemployed by Tonuci et al. (2008), but using P. aeruginosa, obtainedpractically constant activation energies in the P/M ratio studied.Fig. 6 shows activation energies as a function of P/M for B. atropha-eus spores (present study), E. coli and P. aeruginosa.
Fig. 7 shows the good agreement between the experimentaldata and the fitted curves (Eq. (5)) for the inactivation fraction ofBacillus atrophaeus spores under the conditions of this study.
As Fig. 7 indicates, the inactivation fraction increased as a directfunction of processing time and P/M, as expected. Eq. (5) was ableto describe the behavior and predict values of the B. atrophaeusspore inactivation fraction reliably. This agreement can be bettermeasured by the standard deviations resulting from experimental
Fig. 5. Micrograph of one of the microscope slides to determine the percentage ofsporulation.
Table 4Results of recovery tests of the spores in the waste.
Test N0i (CFU) N0r (CFU) Recoverya (%)
01 3.20 � 106 2.31 � 106 7202 1.76 � 107 1.52 � 107 8603 2.10 � 106 1.73 � 106 8204 2.97 � 107 2.31 � 107 7805 4.38 � 107 4.09 � 107 9306 4.52 � 107 4.02 � 107 89
a Defined as N0r/N0i � 100%. Tests were run in duplicates.
Table 5B. atrophaeus spore inactivation fraction in healthcare waste.
Time (min) X (%)
100 W/kg 150 W/kg 200 W/kg
20 15.1 34.3 36.425 19.7 39.1 52.730 21.7 43.0 59.535 25.3 45.5 70.040 32.9 49.1 71.4
2332 E.A. Oliveira et al. / Waste Management 30 (2010) 2327–2335
Author's personal copy
and theoretical values (Eq. (5)), as shown in Table 6. Deviationsranged from 0.2 to 1.5% for P/M of 100 W/kg, from 0.4 to 3.6% for
150 W/kg, and from 0.3 to 5% for 200 W/kg. Therefore, the modelwas considered adequate to represent the experimental data ofthis work.
Although the activation energies of B. atrophaeus spores in thiswork and vegetative cells (E. coli and P. aeruginosa) reported in theliterature are of the same order of magnitude, the values of the pre-exponential factors are considerably different. k0 values for E. coli(2.13 min�1) and P. aeruginosa (10.7 min�1) are one order of mag-nitude higher than k0 for B. atrophaeus spores (0.23 min�1) (Tonuciet al., 2008; Pisani Jr. et al., 2008). This is consistent with the great-er resistance to inactivation of the spore form than that of the veg-etative form. Table 7 shows the estimated times of irradiation to
Ea = -34.21.(P/M) + 12510
r2 = 0.9869Ea = -61.92.(P/M) + 13806
r2 = 0.9992
0
2000
4000
6000
8000
10000
12000
14000
16000
0 50 100 150 200Power per waste mass unit - P/M (W/kg)
Act
ivat
ion
ener
gy -
Ea
(J/m
ol)
B. atrophaeus spores (present study) E. coli (Tonuci et al., 2008)
P. aeruginosa (Pisani Jr et al., 2008)
Fig. 6. Activation energy for the disinfection of healthcare wastes as a function of power per waste mass unit for a moisture content of 50% in mass.
0
10
20
30
40
50
60
70
80
90
100
0 5 10 15 20 25 30 35 40time - t (min)
Spor
e in
activ
atio
n fr
actio
n -
X (
%)
P/M = 100 W/kg exp. P/M = 100 W/kg model
P/M = 150 W/kg exp. P/M = 150 W/kg model
P/M = 200 W/kg exp. P/M = 200 W/kg model
Fig. 7. Bacillus atrophaeus spore inactivation fraction as a function of time for the initial moisture content of 50% with surfactant.
Table 6Experimental and theoretical inactivation fractions and standard deviations obtainedfrom the model fitting.
P/M(W/kg)
t (min) Xexp (%) Xmodel – Eq. (5) (%) Standard deviation (%)
100 20 15.1 14.8 0.225 19.7 19.1 0.430 21.7 23.1 1.035 25.3 27.0 1.240 32.9 30.8 1.5
150 20 34.3 29.2 3.625 39.1 36.1 2.230 43.0 42.4 0.435 45.5 48.1 1.840 49.1 53.3 3.0
200 20 36.4 43.4 5.025 52.7 51.8 0.630 59.5 59.2 0.335 70.0 65.4 3.240 71.4 70.8 0.4
Table 7Evaluation of inactivation time to reach the Level III of inactivation in healthcarewaste at 100 �C and P/M of 100 W/kg.
Microorganism Level III of inactivation Ln N0N
� �k (min�1) t (min)
E. colia 6.Log10 13.82 0.184 75P. aeruginosab 6.Log10 13.82 0118 117B. atrophaeus spore 4.Log10 9.21 0.012 779
a Data from Tonuci et al. (2008).b Data from Pisani Jr. et al. (2008).
E.A. Oliveira et al. / Waste Management 30 (2010) 2327–2335 2333

Author's personal copy
achieve level III inactivation, i.e., 4.Log10 for spores of B. atrophaeusand 6.Log10 for E. coli and P. aeruginosa vegetative cells, in health-care waste with 50% moisture at microwave processing with P/Mof 100 W/kg. In this simulation, the temperature was assumed tobe constant at 100 �C. The first-order kinetic model then resultsin (Eq. (9)):
LnN0
N
� �¼ k � t ð9Þ
The time shown in Table 6 for the inactivation of B. atrophaeusspores (779 min � 13 h) was much longer than that required forother microorganisms (less than 2 h) for P/M of 100 W/kg and100 �C. The same was true for the simulation with P/M of 200 W/kg at 100 �C. In this case, the required time would be 258 min(�4.3 h). Inactivation times of this order indicate that the micro-wave inactivation process is not effective in operating conditionssuch as those proposed in the literature and employed in real-scalepractice. The temperature of 100 �C was chosen for the simulationsbecause it corresponds to the upper limit temperature achievablein the oven for moistened waste heated under atmospheric pres-sure (101.35 kPa) and to the hypothesis of insignificant waterevaporation. If considerable waste drying occurs below the waterboiling point, then the waste temperature tends to be lower, i.e.,close to the wet bulb temperature of the oven’s internalenvironment.
An important point that the results of this work reveal is that ifthe inactivation process is based only on the temperature effect,then the activation energy should be constant, since the Arrheniuslaw accounts separately for the effects of T and Ea. Therefore, thedecrease observed in activation energy due to the increase of P/M can be attributed to the effects of radiation on spore inactivationdue to a change in the spore’s structure (Woo et al., 2000; Celand-roni et al., 2004; Yaghmaee and Durance, 2005; Wu, 2008).
4. Conclusions
This study involved simulated healthcare waste artificially con-taminated with Bacillus atrophaeus spores and treated by micro-wave processing at 2450 MHz. The inactivation fraction of thespores proved to be highly dependent on the time and power perunit of waste mass. The maximum experimental inactivation frac-tion of 71% was achieved with a power of 200 W/kg and 40 min ofprocessing.
The method proposed for the quantitative analysis of the resultsyielded consistent values of activation energy (from 9.2 kJ/mol to5.8 kJ/mol) and of the pre-exponential factor of Arrhenius’s law(0.23 min�1), since the standard deviations between the experi-mental values and the values calculated by the first-order kineticmodel were acceptable.
It was found that the activation energy decreased with the in-crease of power per waste mass, leading to the conclusion that, be-sides the thermal effect on the spore inactivation of B. atrophaeus,there was an effect inherent to radiation.
The kinetic parameters obtained here allow one to predict thedegree of inactivation of B. atrophaeus spores in typical healthcarewaste, based on radiation exposure time and temperature. Forexample, the waste disinfection time required for the inactivationlevel equivalent to 4Log10 was estimated to range from 13 h to4.3 h for wastes processed at 100 W/kg and 200 W/kg, respectively,at a temperature of 100 �C. Thus, the microwave process of sporeinactivation in real scale equipment is probably ineffective, sinceradiation exposure time is usually only 30 min at the averagepower of approximately 80 W/kg. This finding suggests that it isnecessary to use another method of disinfection concomitant tothis one or that the current process must be optimized.
References
Billo, E.J., 2001. Excel for Chemists: A Comprehensive Guide, second ed. John Wileyand Sons, New York, NY, USA.
Brown, G.S., Betty, R.G., Brockmann, J.E., Lucero, D.A., Souza, C.A., Walsh, K.S.,Boucher, R.M., Tezak, M.S., Wilson, M.C., 2007. Evaluation of vacuum filter socksurface sample collection method for Bacillus spores from porous and non-porous surfaces. Journal of Environmental Monitoring 9, 666–671.
Celandroni, F., Longo, I., Tosoratti, N., Giannessi, F., Ghelardi, E., Salvetti, S., Baggiani,A., Senesi, S., 2004. Effect of microwave radiation on Bacillus subtilis spores.Journal of Applied Microbiology 97, 1220–1227.
Chen, G., Driks, A., Tawfiq, K., Mallozzi, M., Patil, S., 2010. Bacillus anthracis andBacillus subtilis spore surface properties and transport. Colloids and Surfaces B76, 512–518.
Cole, E.C., Pierson, T.K., Greenwood, D.R., Leese, K.E., Foarde, K.K., 1993. Guidance forEvaluating Medical Waste Treatment Technologies. EPA-68-WO-0032. USEnvironmental Protection Agency, Office of Solid Waste, Washington DC, USA.
Demidova, T.N., Hamblin, M.R., 2005. Photodynamic inactivation of Bacillus Spores,mediated by phenothiazinium dyes. Applied and Environmental Microbiology71, 6918–6925.
Edlich, R.F., Borel, L., Jensen, G., Winters, K.L., Long III, W.B., Dean Gubler, K.,Buschbacher, R.M., Becker, D.G., Chang, D.E., Korngold, J., Chitwood Jr., W.R., Lin,K.Y., Nichter, L.S., Berenson, S., Britt, L.D., Tafel, J.A., 2006. Revolutionaryadvances in medical waste management the Sanitec� system. Journal of Long-Term Effects of Medical Implants 16, 1–10.
Electric Power Research Institute, 2003. Emerging Environmental Technologies: AnAnalysis of New Treatment Technologies for the California Energy Commission.California Energy Commission, Palo Alto, CA, USA.
Fritze, D., Pukall, R., 2001. Reclassification of bioindicator strains Bacillus subtilisDSM 675 and Bacillus subtilis DSM 2277 as Bacillus atrophaeus. InternationalJournal of Systematic and Evolutionary Microbiology 51, 35–37.
Fujikawa, H., Ushioda, H., Kudo, Y., 1992. Kinetics of Escherchia coli destruction bymicrowave irradiation. Applied and Environmental Microbiology 58, 920–924.
Geankoplis, C.J., 2003. Transport Processes and Separation Process Principle, fourthed. Prentice Hall, Englewood Cliffs, NJ, USA.
Goldblith, S.A., Wang, D.I.C., 1967. Effect of microwaves on Escherichia coli andBacillus subtilis. Applied Microbiology 15, 1371–1375.
Golveia, V.R., Pinto, F.M.G., Machoshvili, I.A., Penna, T.C.V., Graziano, K.U., 2009.Evaluation of the sterilization efficacy of domestic electric drills used inorthopaedic surgeries. Brazilian Journal of Microbiology 40, 541–546.
Hamouda, T., Shih, A.Y., Baker Jr, J.R., 2002. A rapid staining technique for thedetection of the initiation of germination of bacterial spores. Letters in AppliedMicrobiology 34, 86–90.
Hodges, L.R., Rose, L.J., Peterson, A., Noble-Wang, J., Arduino, M.J., 2006. Evaluationof a macrofoam swab protocol for the recovery of Bacillus anthracis spores froma steel surface. Applied and Environmental Microbiology 72, 4429–4430.
Hoffman, P.N., Hanley, M.J., 1994. Assessment of a microwave-based clinical wastedecontamination unit. Journal of Applied Bacteriology 77, 607–612.
Jeng, D.K.H., Kaczmarek, K.A., Woodworth, A.G., Balasky, G., 1987. Mechanism ofmicrowave sterilization in the dry state. Applied and EnvironmentalMicrobiology 53, 2133–2137.
Kim, S.Y., Jo, E.K., Kim, H.J., Bai, K., Park, J.K., 2008. The effects of high-powermicrowaves on the ultrastructure of Bacillus subtilis. Letters in AppliedMicrobiology 47, 35–40.
Kim, S.Y., Shin, S.J., Song, C.H., Jo, E.K., Kim, H.J., Park, J.K., 2009. The effects of high-power microwaves on the ultrastructure of Bacillus subtilis. Letters in AppliedMicrobiology 106, 877–885.
Koutchma, T., Le Bail, A., Ramaswamy, H.S., 2001. Comparative experimentalevaluation of microbial destruction in continuous-flow microwave andconventional heating systems. Canadian Biosystems Engineering 43, 3.1–3.8.
Latimer, J.M., Matsen, J.M., 1977. Microwave oven irradiation as a method forbacterial decontamination in a clinical microbiology laboratory. Journal ofClinical Microbiology 6, 340–342.
Lechowich, R.V., Beuchat, L.R., Fox, K.I., Webster, F.H., 1969. A procedure forevaluating the effects of 2, 450-Megahertz microwaves upon Streptococcusfaecalis and Saccharomyces cerevisiae. Applied Microbiology 17, 106–110.
Lee, B., Ellenbecker, M.J., Moure-Ersaso, R., 2004. Alternatives for treatment anddisposal cost reduction of regulated medical wastes. Waste Management 24,143–151.
Levenspiel, O., 1999. Chemical Reactor Engineering, third ed. John Wiley and Sons,New York, NY, USA.
Nicholson, W.L., Law, J.F., 1999. Method for purification of bacterial endosporesfrom soils: UV resistance of natural Sonoran desert soil populations of Bacillusspp. with reference to B. subtilis strain 168. Journal of Microbiological Methods35, 13–21.
Parkar, S.G., Flint, S.H., Palmer, J.S., Brooks, J.D., 2001. Factors influencingattachment of thermophilic bacilli to stainless steel. Journal of AppliedMicrobiology 90, 901–908.
Pellerin, C., 1994. Alternatives to incineration: there’s more than one way toremediate. Environmental Health Perspectives 12, 840–845.
Perez, A., Hohn, C., Higgins, J., 2005. Filtration methods for recovery of Bacillus anthracisspores spiked into source and finished water. Water Research 39, 5199–5211.
Pisani Jr., R., Tonuci, L.R.S., Innocentini, M.D.M., 2008. Microwave inactivation ofPseudomonas aeruginosa in healthcare waste. Engenharia Sanitária e Ambiental13, 222–228 (in Portuguese).
2334 E.A. Oliveira et al. / Waste Management 30 (2010) 2327–2335
Author's personal copy
Prüss, A., Giroult, E., Rushbrook, P., 1999. Safe Management of Wastes from Health-Care Activities. World Health Organization, Geneva, Switzerland.
Seale, R.B., Flint, S.H., McQuillan, A.J., Bremer, P.J., 2008. Recovery of spores fromthermophilic dairy bacilli and effects of their surface characteristics onattachment to different surfaces. Applied and Environmental Microbiology 74,731–737.
Setlow, P., 2005. Spores of Bacillus subtilis: their resistance to and killing byradiation, heat and chemicals. Journal of Applied Microbiology 101, 514–525.
State and Territorial Association on Alternative Treatment Technologies, 1998.Technical Assistance Manual: State Regulatory Oversight of Medical WasteTreatment Technologies Edited by Electric Power Research Institute (EPRI), PaloAlto, CA, USA.
Tonuci, L.R.S., Paschoalato, C.F.P.R., Pisani Jr., R., 2008. Microwave inactivation ofEscherichia coli in healthcare waste. Waste Management 28, 840–848.
Vaid, A., Bishop, A.H., 1998. The destruction by microwave radiation of bacterialendospores and amplification of the released DNA. Journal of AppliedMicrobiology 85, 115–122.
Vela, G.R., Wu, J.F., 1979. Mechanism of lethal action of 2, 450-MHz radiation onmicroorganisms. Applied and Environmental Microbiology 37, 550–553.
Welt, B.A., Tong, C.H., Rossen, J.L., Lund, D.B., 1994. Effect of microwave radiation oninactivation of Clostridium sporogenes (PA 3679) spores. Applied andEnvironmental Microbiology 60, 482–488.
Woo, I., Rhee, I., Park, H., 2000. Differential damage in bacterial cells by microwaveradiation on the basis of cell wall structure. Applied and EnvironmentalMicrobiology 66, 2243–2247.
Wu, T., 2008. Environmental perspectives of microwave applications as remedialalternatives: review. Practice Periodical of Hazardous, Toxic, and RadioactiveWaste Management 12, 102–115.
Yaghmaee, P., Durance, T.D., 2005. Destruction and injury of Escherichia coli duringmicrowave heating under vacuum. Journal of Applied Microbiology 98, 498–506.
Yeo, C.B.A., Watson, I.A., Stewart-Tull, D.E.S., Koh, V.H.H., 1999. Heat transferanalysis of Staphylococcus aureus on stainless steel with microwave radiation.Journal of Applied Microbiology 87, 396–401.
E.A. Oliveira et al. / Waste Management 30 (2010) 2327–2335 2335