Microtrap modulated flame ionization detector for on-line monitoring of methane
6
Journal of Chromatography A, 1072 (2005) 243–248 Microtrap modulated flame ionization detector for on-line monitoring of methane Chongdee Thammakhet a , Panote Thavarungkul b , Roman Brukh c , Somenath Mitra c , Proespichaya Kanatharana a,∗ a Analytical and Environmental/Trace Analysis Research Unit, Department of Chemistry, Faculty of Science, Prince of Songkla University, Hat Yai, Songkhla 90112, Thailand b Biophysics Research Unit: Biosensors and Biocurrents, Department of Physics, Faculty of Science, Prince of Songkla University, Hat Yai, Songkhla 90112, Thailand c Department of Chemistry and Environmental Science, New Jersey Institute of Technology, Newark, NJ 07102, USA Received 17 December 2004; received in revised form 25 February 2005; accepted 10 March 2005 Abstract A microtrap for on-line analysis of trace methane was developed. Silicosteel tubing, 15 cm long, 1.02 mm i.d. and 1.59 mm o.d. was packed with Carbosphere 80/100 mesh and placed between the standard gas source and the flame ionization detector (FID) to be used as a preconcentrator and an injector. The sample stream was passed continuously through the microtrap that was heated at a fixed interval by an electric pulse. To achieve the highest adsorption and desorption efficiency, parameters affecting the response of the system were optimized, and adsorption temperature in the range of 25 to −50 ◦ C was studied. The response from the microtrap as compared to that from direct-flame ionization detector was enhanced by as much as 260 times. The on-line microtrap system showed good linearity (r 2 > 0.99), low detection limit (28.3ppbv) and good long term stability (relative standard deviation, RSD of less than 5.0%). Therefore, this simple device is suitable for on-line analysis of trace methane and similar small molecules in the environment as in high purity gases. © 2005 Elsevier B.V. All rights reserved. Keywords: Methane; Microtrap; Carbosphere; High purity gases 1. Introduction Methane, due to its abundance, can occur even in high purity gases which are crucial for research and development applications and this contamination can have a negative im- pact on the process [1]. Therefore, measurements and control of the impurities play an important role in high purity gases research applications. To determine methane concentration, samples are gener- ally collected before injected into a gas chromatograph [2].A small injection volume is preferred but this will limit the sen- sitivity of the detector and a preconcentration step is generally needed. Even when the sensitivity is increased by a precon- ∗ Corresponding author. Tel.: +66 7428 8420; fax: +66 7421 2918. E-mail address: [email protected] (P. Kanatharana). centration step, there is always the delay between sampling and analysis [3–5]. This is clearly not acceptable for contin- uous, on-line monitoring, but also adds error to the measure- ment process. One approach is using an on-line cryogenic trap to focus the sample in a narrow band at the head of the column. The trap rapid cooling and re-heating, ensuring the reproducibility and optimum peak shape. However, if the source has a lot of water, it freezes and plugs the sorbent trap [6]. It is also quite complicated to apply, therefore, a microtrap was introduced as an alternative. A microtrap is a small capillary tubing packed with a small amount of adsorbent. Sample containing the analytes contin- uously flow into the microtrap, and the organics are trapped by the sorbent while the gas flows through. The retained or- ganics are rapidly desorbed by resistive heating with pulse of electric current which make an injection for GC separation. 0021-9673/$ – see front matter © 2005 Elsevier B.V. All rights reserved. doi:10.1016/j.chroma.2005.03.041
-
Upload
independent -
Category
Documents
-
view
1 -
download
0
Transcript of Microtrap modulated flame ionization detector for on-line monitoring of methane
Journal of Chromatography A, 1072 (2005) 243–248
Microtrap modulated flame ionization detector for on-linemonitoring of methane
Chongdee Thammakheta, Panote Thavarungkulb, Roman Brukhc,Somenath Mitrac, Proespichaya Kanatharanaa,∗
a Analytical and Environmental/Trace Analysis Research Unit, Department of Chemistry, Faculty of Science, Prince of Songkla University,Hat Yai, Songkhla 90112, Thailand
b Biophysics Research Unit: Biosensors and Biocurrents, Department of Physics, Faculty of Science, Prince of Songkla University,Hat Yai, Songkhla 90112, Thailand
c Department of Chemistry and Environmental Science, New Jersey Institute of Technology, Newark, NJ 07102, USA
Received 17 December 2004; received in revised form 25 February 2005; accepted 10 March 2005
Abstract
o.d. wasp be used as ap nterval by ane e optimized,a t-flamei nl s suitablef©
K
1
papor
assn
plingin-sure-genicd ofring
f therbent, a
allntin-ped
d or-se oftion.
0d
A microtrap for on-line analysis of trace methane was developed. Silicosteel tubing, 15 cm long, 1.02 mm i.d. and 1.59 mmacked with Carbosphere 80/100 mesh and placed between the standard gas source and the flame ionization detector (FID) toreconcentrator and an injector. The sample stream was passed continuously through the microtrap that was heated at a fixed ilectric pulse. To achieve the highest adsorption and desorption efficiency, parameters affecting the response of the system wernd adsorption temperature in the range of 25 to−50◦C was studied. The response from the microtrap as compared to that from direc
onization detector was enhanced by as much as 260 times. The on-line microtrap system showed good linearity (r2 > 0.99), low detectioimit (28.3 ppbv) and good long term stability (relative standard deviation, RSD of less than 5.0%). Therefore, this simple device ior on-line analysis of trace methane and similar small molecules in the environment as in high purity gases.
2005 Elsevier B.V. All rights reserved.
eywords:Methane; Microtrap; Carbosphere; High purity gases
. Introduction
Methane, due to its abundance, can occur even in highurity gases which are crucial for research and developmentpplications and this contamination can have a negative im-act on the process[1]. Therefore, measurements and controlf the impurities play an important role in high purity gasesesearch applications.
To determine methane concentration, samples are gener-lly collected before injected into a gas chromatograph[2]. Amall injection volume is preferred but this will limit the sen-itivity of the detector and a preconcentration step is generallyeeded. Even when the sensitivity is increased by a precon-
∗ Corresponding author. Tel.: +66 7428 8420; fax: +66 7421 2918.E-mail address:[email protected] (P. Kanatharana).
centration step, there is always the delay between samand analysis[3–5]. This is clearly not acceptable for contuous, on-line monitoring, but also adds error to the meament process. One approach is using an on-line cryotrap to focus the sample in a narrow band at the heathe column. The trap rapid cooling and re-heating, ensuthe reproducibility and optimum peak shape. However, isource has a lot of water, it freezes and plugs the sotrap [6]. It is also quite complicated to apply, thereforemicrotrap was introduced as an alternative.
A microtrap is a small capillary tubing packed with a smamount of adsorbent. Sample containing the analytes couously flow into the microtrap, and the organics are trapby the sorbent while the gas flows through. The retaineganics are rapidly desorbed by resistive heating with pulelectric current which make an injection for GC separa
021-9673/$ – see front matter © 2005 Elsevier B.V. All rights reserved.oi:10.1016/j.chroma.2005.03.041

244 C. Thammakhet et al. / J. Chromatogr. A 1072 (2005) 243–248
The main advantage of microtrap as an injection device overa sample valve is, it also serves as a sample preconcentrator,which allows the larger sample volume to be analyzed fortrace components[7–10].
In this paper, the development of an on-line microtrap thatis interfaced directly to the flame ionization detector (FID)for the determination of methane is reported.
2. Experiment
2.1. Instrumentation
Fig. 1a shows the schematic diagram of the on-line systemused for methane monitoring. All experiments were carriedout by a gas chromatograph equipped with a conventionalFID and the results were integrated by CR-4A Integrator (GC-14A and CR-4A Integrator, Shimadzu, Japan). Methane stan-dard concentration of 11.6 part per million by volume (ppmv)(TIG, Thailand) was used to study the characteristics of themicrotrap packed with a suitable adsorbent.
2.2. Microtrap
By considering the suitability of pore size and surface area,Carbosphere 80/100 mesh (Alltech, IL, USA) was selecteda mmi rades Them d gasa well
F ap in-t ane.( ea
as an injector (Fig. 1a). The microtrap was rapidly heated byapplying a current pulse from a lab-built heating system and atemperature as high as 250–300◦C was reached within a fewmilliseconds. This was to desorb and to inject the analyte intothe FID. The effect of heating was similar to using an injectionport in term of retention time, peak height, band durationand terminal band length[7]. A microprocessor-based timerwas used to control the interval between the adsorption anddesorption times and the duration for which the current wasapplied.
2.3. Breakthrough characteristics
To determine breakthrough in a microtrap, the methodusing the variation in microtrap response as a function ofinjection interval [4] was implemented. The capacity, interm of breakthrough, was studied by passing a stream ofstandard methane gas (11.6 ppmv) through the microtrap.Methane molecules were adsorbed while the backgroundstream served as a carrier gas. The system was first inves-tigated at room temperature (25◦C). Desorption voltage andtime were varied in the range of 10–50 V and 1–4 s. The opti-mum desorption voltage and time were then used to determinethe breakthrough by varying the adsorption time until stableresponse peaks were obtained.
2
s ise actorc ture.T box,s from2 to izedd them orp-t minet culatee
2
sys-t , 3.9,1 thod[ tor.E ssedt n in-t onsa rve.
k. Itw orp-t inedd d onI
s the adsorbent. It was packed in a 15 cm long, 1.02.d., and 1.59 mm o.d., silicosteel welded/drawn 304 gtainless steel tubing (Restek Co., Bellefonte, PA, USA).icrotrap was placed in-line of the stream of the standarnd in front of the detector to act as a trap/concentrator as
ig. 1. Schematic diagram showing the analysis system. (a) microtrerfaced to flame ionization detector for on-line determination of methb) Diffusion cell was used to introduce organic in the N2 stream to test thbility of the contaminants trap to remove the organic.
.4. Enhancement of microtrap capacity
The most important factor for trace quantity analysinhancement. A higher enhancement (or enrichment) fan be obtained by decreasing the microtrap temperahe microtrap was placed inside an insulating foamurrounded by dry ice. The temperatures were varied5◦C (room temperature) to−50◦C by varying the amounf dry ice. At each adsorption temperature, the optimesorption voltage and time were investigated to obtainaximum desorbed analyte from the microtrap. The ads
ion time at each temperature was then varied to deterhe breakthrough time. The responses were used to calnhancement.
.5. Performance of the microtrap
To study the linear response of the on-line microtrapem, a series of standard gas concentrations, 11.6, 5.8.1 and 0.2 ppmv, was prepared by dynamic dilution me
11] using nitrogen gas (99.99% TIG, Thailand) as the diluach concentrations of methane were continuously pa
hrough the microtrap. The injections were made at 6 mierval using a pulse time of 3.5 s at 40 V for five replicatit−50◦C. The signals were used to plot the standard cu
High purity nitrogen gas (99.99%) was used as blanas continuously applied through the microtrap. The des
ions, i.e., injections were done every 6 min and the obtaata were used to calculate the limit of detection base
UPAC method[12].
C. Thammakhet et al. / J. Chromatogr. A 1072 (2005) 243–248 245
2.6. Contaminants trap
A contaminants trap was placed in front of the micro-trap to remove the contaminants that might interfere with theon-line trace methane analysis system (Fig. 1b). A suitableadsorbent was evaluated. These included activated charcoal(Palm Shell), coated Carbopack B, and Carbopack C, se-lected by considering their surface area, and pore size. Eachof these adsorbents was packed in a stainless steel tube (1/4′′o.d.× 4 mm i.d.× 16 cm).
The experiments consisted of two parts. First was to testthe trapping efficiency of the contaminants trap. It was placedbetween the standard hexane gas (from diffusion cell) andthe microtrap packed with coated Carbopack B (Fig. 1b).This microrap was used to monitor hexane that could not beadsorbed by the contaminants trap. The second part was to testthe effect of contaminants trap on the response of methane.The diffusion cell was removed and standard methane gas wasflowed through the contaminants trap before passing throughthe microtrap packed with Carbosphere. The signals obtainedwith and without the contaminants trap were compared.
3. Results and discussion
3
indi-c r thet oos-i riedf rrentt omt tiont andt useda .
F break-tw
Optimum conditions at room temperature provided chro-matograms with an average peak height of 90�V for11.6 ppmv of methane. With this response, the on-line systemcould not be used to detect trace methane in high purity gaswhich are in the range of 0.1–5.0 ppmv[13]. Therefore, thesensitivity of the on-line microtrap must be increased.
3.2. Relationship between breakthrough volume andtemperature
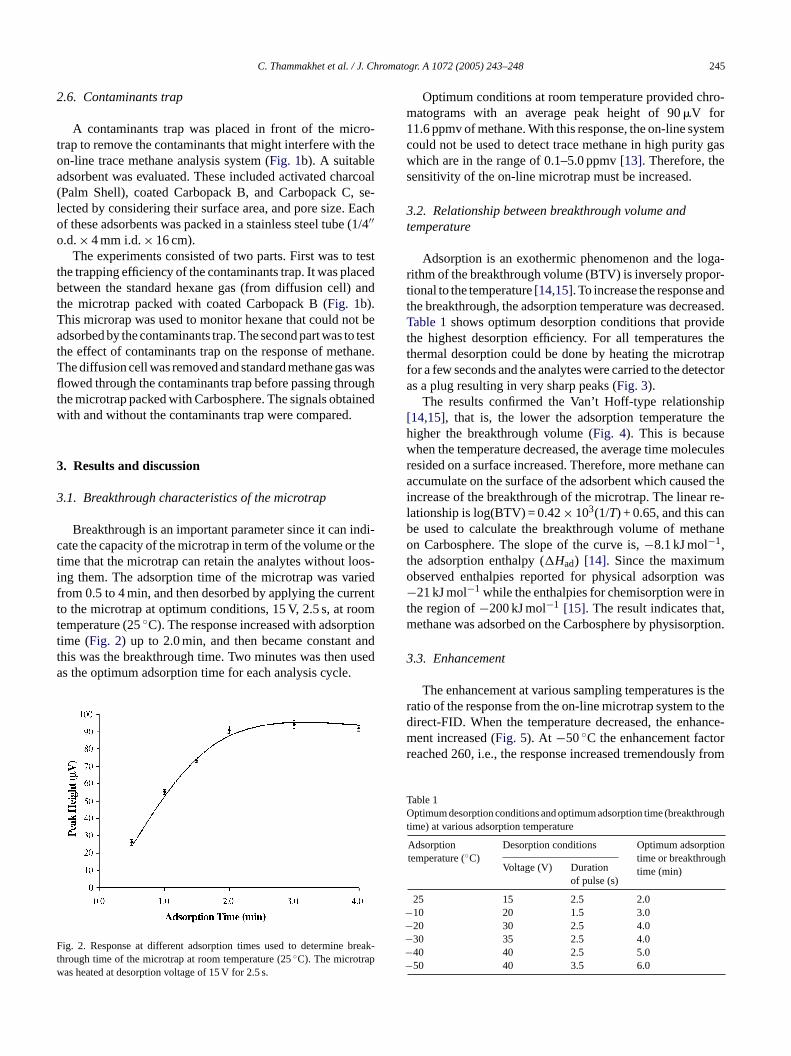
Adsorption is an exothermic phenomenon and the loga-rithm of the breakthrough volume (BTV) is inversely propor-tional to the temperature[14,15]. To increase the response andthe breakthrough, the adsorption temperature was decreased.Table 1shows optimum desorption conditions that providethe highest desorption efficiency. For all temperatures thethermal desorption could be done by heating the microtrapfor a few seconds and the analytes were carried to the detectoras a plug resulting in very sharp peaks (Fig. 3).
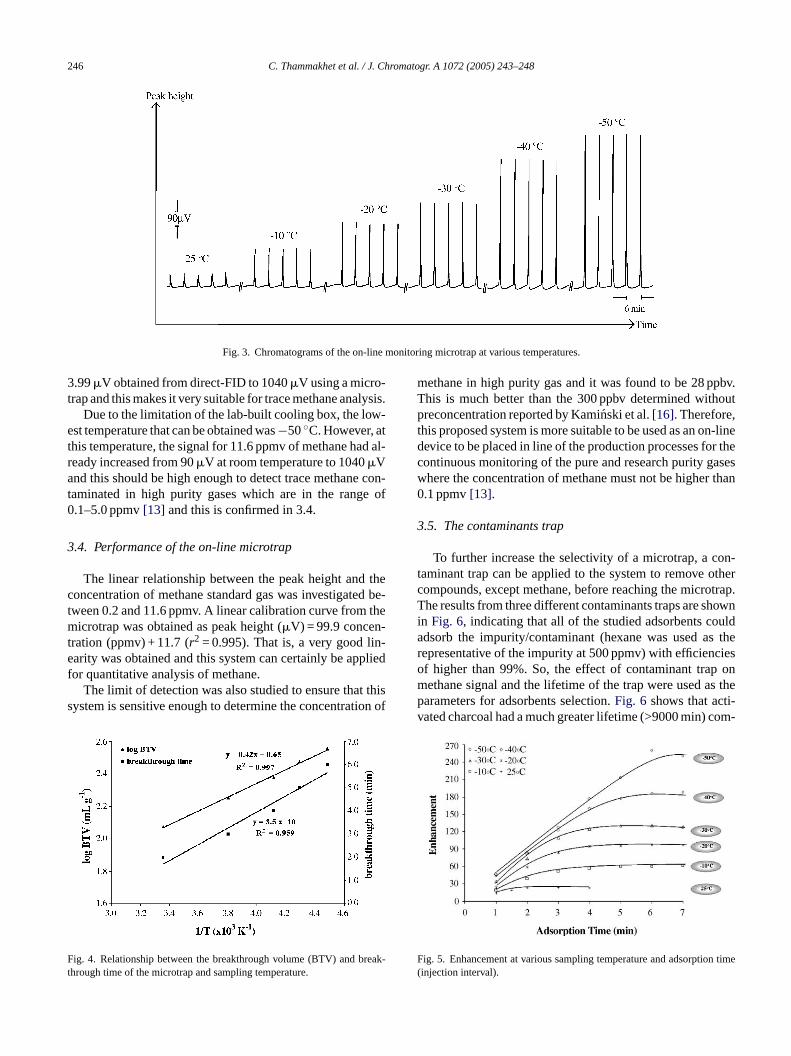
The results confirmed the Van’t Hoff-type relationship[14,15], that is, the lower the adsorption temperature thehigher the breakthrough volume (Fig. 4). This is becausewhen the temperature decreased, the average time moleculesresided on a surface increased. Therefore, more methane canaccumulate on the surface of the adsorbent which caused thei r re-l nb haneoto was− int t,m rption.
3
is ther o thed ance-m orr y from
TO ought
ionh
−−−−−
.1. Breakthrough characteristics of the microtrap
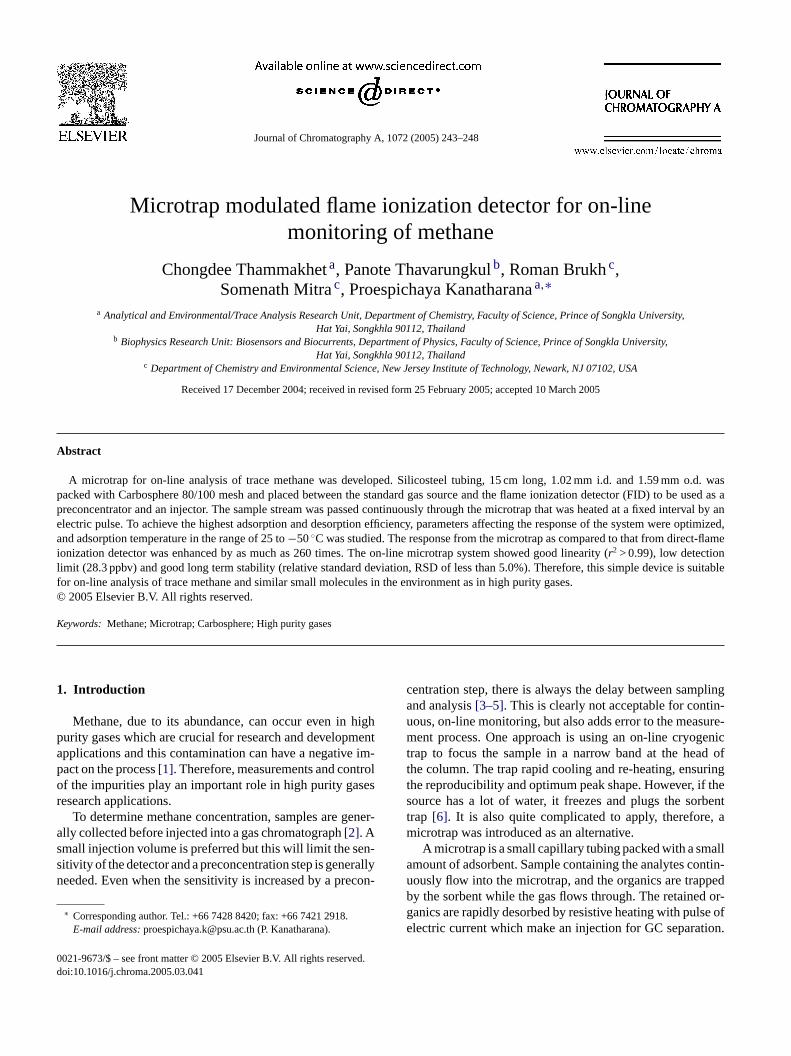
Breakthrough is an important parameter since it canate the capacity of the microtrap in term of the volume oime that the microtrap can retain the analytes without lng them. The adsorption time of the microtrap was varom 0.5 to 4 min, and then desorbed by applying the cuo the microtrap at optimum conditions, 15 V, 2.5 s, at roemperature (25◦C). The response increased with adsorpime (Fig. 2) up to 2.0 min, and then became constanthis was the breakthrough time. Two minutes was thens the optimum adsorption time for each analysis cycle
ig. 2. Response at different adsorption times used to determinehrough time of the microtrap at room temperature (25◦C). The microtrapas heated at desorption voltage of 15 V for 2.5 s.
ncrease of the breakthrough of the microtrap. The lineaationship is log(BTV) = 0.42× 10³(1/T) + 0.65, and this cae used to calculate the breakthrough volume of metn Carbosphere. The slope of the curve is,−8.1 kJ mol−1,
he adsorption enthalpy (�Had) [14]. Since the maximumbserved enthalpies reported for physical adsorption21 kJ mol−1 while the enthalpies for chemisorption were
he region of−200 kJ mol−1 [15]. The result indicates thaethane was adsorbed on the Carbosphere by physiso
.3. Enhancement
The enhancement at various sampling temperaturesatio of the response from the on-line microtrap system tirect-FID. When the temperature decreased, the enhent increased (Fig. 5). At −50◦C the enhancement fact
eached 260, i.e., the response increased tremendousl
able 1ptimum desorption conditions and optimum adsorption time (breakthr
ime) at various adsorption temperature
Adsorptiontemperature (◦C)
Desorption conditions Optimum adsorpttime or breakthrougtime (min)Voltage (V) Duration
of pulse (s)
25 15 2.5 2.010 20 1.5 3.020 30 2.5 4.030 35 2.5 4.040 40 2.5 5.050 40 3.5 6.0
246 C. Thammakhet et al. / J. Chromatogr. A 1072 (2005) 243–248
Fig. 3. Chromatograms of the on-line monitoring microtrap at various temperatures.
3.99�V obtained from direct-FID to 1040�V using a micro-trap and this makes it very suitable for trace methane analysis.
Due to the limitation of the lab-built cooling box, the low-est temperature that can be obtained was−50◦C. However, atthis temperature, the signal for 11.6 ppmv of methane had al-ready increased from 90�V at room temperature to 1040�Vand this should be high enough to detect trace methane con-taminated in high purity gases which are in the range of0.1–5.0 ppmv[13] and this is confirmed in 3.4.
3.4. Performance of the on-line microtrap
The linear relationship between the peak height and theconcentration of methane standard gas was investigated be-tween 0.2 and 11.6 ppmv. A linear calibration curve from themicrotrap was obtained as peak height (�V) = 99.9 concen-tration (ppmv) + 11.7 (r2 = 0.995). That is, a very good lin-earity was obtained and this system can certainly be appliedfor quantitative analysis of methane.
The limit of detection was also studied to ensure that thissystem is sensitive enough to determine the concentration of
F reak-t
methane in high purity gas and it was found to be 28 ppbv.This is much better than the 300 ppbv determined withoutpreconcentration reported by Kaminski et al.[16]. Therefore,this proposed system is more suitable to be used as an on-linedevice to be placed in line of the production processes for thecontinuous monitoring of the pure and research purity gaseswhere the concentration of methane must not be higher than0.1 ppmv[13].
3.5. The contaminants trap
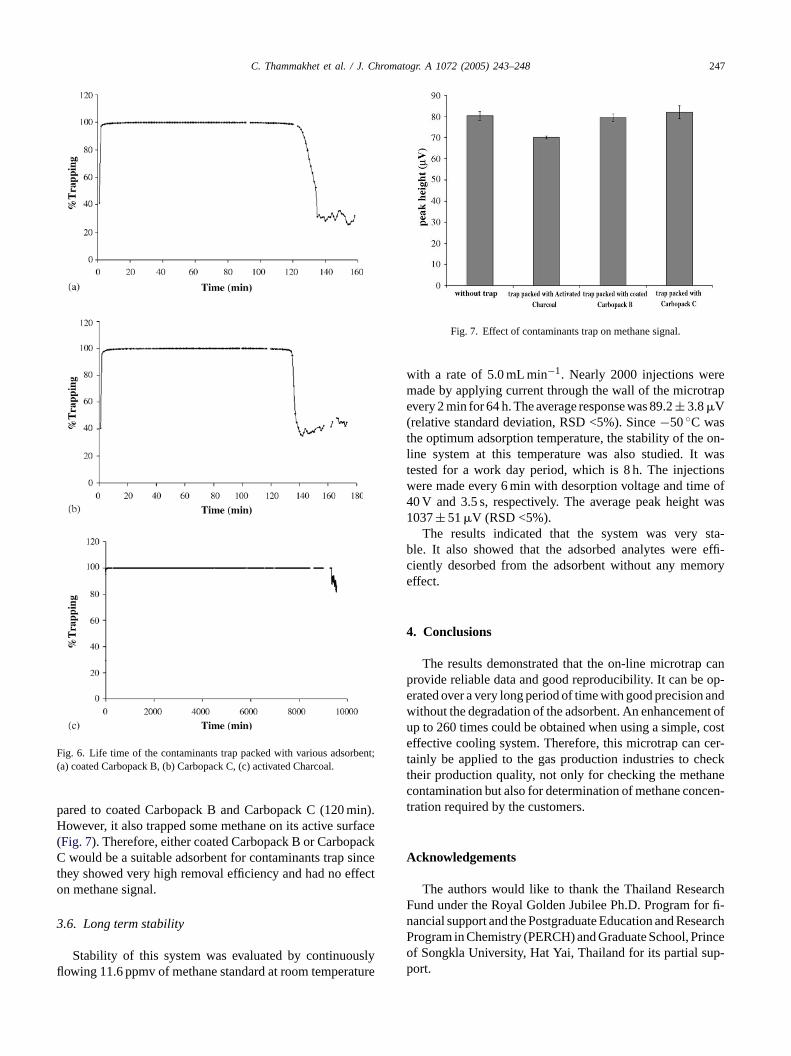
To further increase the selectivity of a microtrap, a con-taminant trap can be applied to the system to remove othercompounds, except methane, before reaching the microtrap.The results from three different contaminants traps are shownin Fig. 6, indicating that all of the studied adsorbents couldadsorb the impurity/contaminant (hexane was used as therepresentative of the impurity at 500 ppmv) with efficienciesof higher than 99%. So, the effect of contaminant trap onmethane signal and the lifetime of the trap were used as theparameters for adsorbents selection.Fig. 6 shows that acti-vated charcoal had a much greater lifetime (>9000 min) com-
F n time(
ig. 4. Relationship between the breakthrough volume (BTV) and bhrough time of the microtrap and sampling temperature.
ig. 5. Enhancement at various sampling temperature and adsorptioinjection interval).
C. Thammakhet et al. / J. Chromatogr. A 1072 (2005) 243–248 247
Fig. 6. Life time of the contaminants trap packed with various adsorbent;(a) coated Carbopack B, (b) Carbopack C, (c) activated Charcoal.
pared to coated Carbopack B and Carbopack C (120 min).However, it also trapped some methane on its active surface(Fig. 7). Therefore, either coated Carbopack B or CarbopackC would be a suitable adsorbent for contaminants trap sincethey showed very high removal efficiency and had no effecton methane signal.
3.6. Long term stability
Stability of this system was evaluated by continuouslyflowing 11.6 ppmv of methane standard at room temperature
Fig. 7. Effect of contaminants trap on methane signal.
with a rate of 5.0 mL min−1. Nearly 2000 injections weremade by applying current through the wall of the microtrapevery 2 min for 64 h. The average response was 89.2± 3.8�V(relative standard deviation, RSD <5%). Since−50◦C wasthe optimum adsorption temperature, the stability of the on-line system at this temperature was also studied. It wastested for a work day period, which is 8 h. The injectionswere made every 6 min with desorption voltage and time of40 V and 3.5 s, respectively. The average peak height was1037± 51�V (RSD <5%).
The results indicated that the system was very sta-ble. It also showed that the adsorbed analytes were effi-ciently desorbed from the adsorbent without any memoryeffect.
4. Conclusions
The results demonstrated that the on-line microtrap canprovide reliable data and good reproducibility. It can be op-erated over a very long period of time with good precision andwithout the degradation of the adsorbent. An enhancement ofup to 260 times could be obtained when using a simple, costeffective cooling system. Therefore, this microtrap can cer-tainly be applied to the gas production industries to checkt anec cen-t
A
archF r fi-n earchP rinceo p-p
heir production quality, not only for checking the methontamination but also for determination of methane conration required by the customers.
cknowledgements
The authors would like to thank the Thailand Reseund under the Royal Golden Jubilee Ph.D. Program foancial support and the Postgraduate Education and Resrogram in Chemistry (PERCH) and Graduate School, Pf Songkla University, Hat Yai, Thailand for its partial suort.

248 C. Thammakhet et al. / J. Chromatogr. A 1072 (2005) 243–248
References
[1] Tigeroptics, Trace methane analyzer for inert, passive, toxic, andcorrosive gases, 2003http://www.tigeroptics.com/pdf/MTO-1000-CH4.pdf.
[2] S. Panda, Q. Bu, K.S. Yun, J.F. Parcher, J. Chromatogr. A 715 (1995)279.
[3] S. Mitra, N. Zhu, X. Zhang, B. Kebbekus, J. Chromatog. A 736(1998) 165.
[4] C. Feng, S. Mitra, J. Chromatog. A 805 (1998) 169.[5] S. Mitra, C. Feng, L. Zhang, W. Ho, G. McAllister, J. Mass. Spec-
trom. 34 (1999) 478.[6] H.J. Rafson, Odor and VOC Control Handbook, McGraw-Hill, New
York, 1998.[7] S. Mitra, C. Yun, J. Chromatogr. 648 (1993) 415.
[8] S. Mitra, Y.H. Xu, W. Chen, A. Lai, J. Chromatogr. A 727 (1996)111.
[9] X. Guo, S. Mitra, Anal. Chem. 71 (1999) 4587.[10] T.-Y. Chen, M.-J. Li, J.-L. Wang, J. Chromatogr. A 976 (2002) 39.[11] R.L. Grob, Modern Practice of Gas Chromatography, second ed.,
Wiley, Toronto, 1985.[12] G.L. Long, J.D. Winefordner, Anal. Chem. 55 (1983) 712A.[13] Matheson Tri Gas, retrieved on January 4, 2004,
http://www.matheson-trigas.com/mathportal/.[14] V. Simon, M.-L. Riba, A. Waldhart, L. Torres, J. Chromatogr. A 704
(1995) 465.[15] P.W. Atkin, Physical Chemistry, fifth ed., Oxford University Press,
Oxford, 1994.[16] M. Kaminski, R. Kartanowicz, D. Jastrzebski, M.M. Kaminski, J.
Chromatogr. A 989 (2003) 277.