EBSD: a powerful microstructure analysis technique in the field of solidification
Upload
southerndenmarkCategory
view
1download
0
Title of Publication Edited byTMS (The Minerals, Metals & Materials Society), Year
Microstructure of Individual Grains in Cold-Rolled Aluminumfrom Orientation Inhomogeneities Resolved by EBSD
Wei He, Weitao Ma, Wolfgang Pantleon
Center for Fundamental Research: Metal Structures in Four Dimensions, Risoe NationalLaboratory; Frederiksborgvej 399; 4000 Roskilde, Denmark
Keywords: deformation structure, EBSD, orientation map, orientation spread,disorientation, dislocation density
Abstract
A recently developed scheme for evaluation of orientation data gathered by electron back-scattering diffraction is employed on individual grains in a deformed state. The potentialof the method is illustrated on cold-rolled aluminum. The orientation distribution in eachgrain is characterized by its anisotropy and the averaged orientation spread; the dependenceof both parameters on grain size is discussed. The preferred rotation axis in each grain isdetermined and compared with macroscopic directions. From the disorientation angles withrespect to the preferred rotation axes, characteristic features of the deformation structureas alternating orientation differences or orientation gradients can be resolved. From thecurvatures within the grain five components of the dislocation density tensor are inferred— corresponding to part of the geometrically necessary dislocation content. The spatiallyinhomogeneous distribution of the dislocation density offers an alternative possibility foridentification of dislocation boundaries.
Introduction
Electron backscattering diffraction (EBSD) [1] has become a convenient tool for characteriz-ing the microstructure of crystalline material as metals or rocks. Common for all conventionalapplications is that orientation data are gathered for numerous points in a regular grid onthe surface of a specimen. Elaborate post-processing [2, 3] must be used for extracting rel-evant information on the microstructure from the orientation data. The microstructure ofa crystalline material is usually characterized by regions of homogeneous orientation. Theslightest, discontinuous orientation difference indicates a border between two regions and theexistence of a boundary. Individual regions separated by such boundaries are termed grains— at least in the as-grown, as-deposited or recrystallized state.
Plastic deformation introduces orientation differences in originally homogeneously ori-ented grains. Any local excess of dislocations of one sign of the Burgers vector causesan orientation difference. As dislocations gather in deformation-induced boundaries, thegrains become subdivided into smaller regions of different, but similar orientations. Withinindividual grains, different types of deformation-induced boundaries can be distinguished:randomly oriented and curved dislocation walls separating nearly dislocation free cells andstraight dense dislocation walls running parallel to each other along preferred directions.After moderate cold-rolling, for instance, the second type of boundaries are inclined about40◦ towards the rolling direction [4]. The disorientations across adjacent parallel boundariesare often of opposite sign [4].

The goal of the present investigation is the characterization of the orientation differenceswithin individual grains in different manners. Firstly, the total orientation spread of a grainand its anisotropy in orientation space is considered. Secondly, the spatial distribution of theorientation variation is characterized to distinguish overall curvatures of the grains from localvariations, in particular alternating orientation changes. Finally, from the local curvaturesthe geometrically necessary dislocation content is derived which gives a lower estimate forthe local dislocation density.
Experimental Example
The method of obtaining information on the microstructure within individual grains is il-lustrated for commercial pure aluminium AA1050 (99.5 %) cold-rolled to 38 % reductionin a single pass with an intermediate draught [5]. On a surface along rolling and normaldirection, orientations are determined by EBSD at points on a regular square grid with amutual spacing of 1 µm. In an orientation map grains are identified as contiguous areassurrounded by boundaries with disorientation angles larger than a selected threshold angleof 8◦. Grains with less than 250 points or grains reaching the borders of the measurementgrid are excluded from the analysis. From the orientation data on a 600×240 grid, 45 grainsare identified in this manner [6].
Characterization of Orientation Spread
Description of Orientations
The orientation of a crystalline lattice is described by the rotation required to achieve theorientation from a chosen reference orientation. This rotation (or more precisely the corre-sponding coordinate transformation) is characterized by a rotation angle ω and a rotationaxis ~r which can be combined into a unit quaternion [7]
q =
(q0
~q
)=
(cos(ω/2)sin(ω/2)~r
). (1)
The components of the unit quaternion are linked to Bunge’s orientation matrix G [9]
q0 =1
2
√Gii + 1 qi = −εijkGjk
4q0
(2)
or the commonly used Euler angles (φ1, Φ, φ2)
q0 = | cos(Φ/2)|| cos((φ1 + φ2)/2)| (3)
q1 = −q−10 sin(Φ/2) cos(Φ/2) cos((φ1 + φ2)/2) cos((φ1 − φ2)/2) (4)
q2 = −q−10 sin(Φ/2) cos(Φ/2) cos((φ1 + φ2)/2) sin((φ1 − φ2)/2) (5)
q3 = −q−10 cos2(Φ/2) sin((φ1 + φ2)/2) cos((φ1 + φ2)/2) . (6)
An orientation difference between two orientations (in the coordinate system of the firstorientation) is characterized by the rotation from one orientation (A) to the other (B) andgiven by the quaternion product [7]
∆q = qBq−1A =
(qB0 qA
0 + ~qB · ~qA
−qB0 ~qA + ~qBqA
0 − ~qB × ~qA
)(7)
with a misorientation angle θ = 2 arccos(∆q0). Orientations can be described in severalequivalent manners, because of the symmetry of the crystalline lattice. The symmetricalequivalent description with the lowest of all possible misorientation angles is selected andthe corresponding orientation difference termed disorientation.

Ensemble of Orientations
For an ensemble of m discrete orientations described by quaternions qi, its mean orientation
q =1
N
m∑i=1
qi with norm N =
∥∥∥∥∥m∑
i=1
qi
∥∥∥∥∥ (8)
can be defined [8]. For all individual orientations qi their disorientations, i.e. the orientationdifferences from the mean q,
δqi = qiq−1 (9)
are found under the condition of always selecting the symmetrical equivalent representationclosest to the mean.
The orientation spread of an ensemble of orientations is characterized by a symmetrictensor [3]
Q =1
m
m∑i=1
δ~qi ⊗ δ~qi (10)
of rank 2 spanned by the disorientation vectors δ~qi. As the average vector part of thedisorientations vanishes — as a consequence of defining the mean orientation by equation(8) [3] — the tensor Q is the tensor of second order central moments and independent of theaverage orientation q.
The tensor of second order central moments of the disorientation distribution is advan-tageous for a concise characterization of an orientation spread [6]: not only the width ofthe orientation distribution is determined, but also the anisotropy in orientation space; forinstance, an existing preferred rotation axis is identified. With this preferred rotation axis,a sign can be attributed to the disorientation angles. This allows differentiating betweenalternating orientation differences and long-range orientation gradients.
From its definition follows, that Q is a positive (semi-) definite 3 × 3 matrix. Its threenon-negative eigenvalues λα are found by diagonalization. They are determined by the threestandard deviations σα =
√λα of the disorientation distribution along the three eigenvectors
δ~qα. The latter determine the three principal axes of the orientation spread in the crys-tallographic system of the mean orientation. The particular eigenvector δ~q correspondingto the largest eigenvalue λ = σ2 characterizes the dominant rotation axis ~r∗ = δ~q of thedisorientations in the ensemble. This definition of a preferred rotation axis is unambiguousand free of any arbitrary assumptions on preferred macroscopic axes. The direction ~r∗ of thepreferred rotation axis in the reference system is easily derived from(
0
~r∗
)= q−1
(0~r∗
)q . (11)
Orientation Spread within Individual Grains
For each of the 45 grains identified in the orientation map the average orientation q iscalculated from all m orientations qi within the grain as well as all disorientations δqi =qiq
−1 with respect to this average. All grains are classified according to the disorientationangle between their mean orientation and certain ideal orientations defining specific texturecomponents listed in Table 1. A grain belongs to the texture component with the smallestdisorientation angle. If the later exceeds 15◦, the grain is classified as randomly oriented. Asobvious from Table 1 most of the grains are of random orientation and the specified texturecomponents constitute only smaller volume fractions.

Table 1: Ideal texture components
texture ideal symbol number of volumecomponent orientation grains fraction
cube {001}〈100〉 2 - -TD rotated cube / shear {001}〈110〉 3 - -
Goss {011}〈100〉 4 1 2%copper {112}〈111〉 5 2 2%brass {011}〈211〉 � 1 1%
S {123}〈634〉 � 9 14%random ◦ 32 81%
For characterizing the orientation spread of each grain, the standard deviations σα alongthe three principal axes are calculated from the tensor Q of the second order central momentsfor the individual grains. The magnitude of the orientation spread is characterized as theequivalent isotropic spread by the geometrical mean σ = 3
√σ1σ2σ3 of the standard deviations
of each grain. The anisotropy is characterized by the ratio between the largest standarddeviation σ and σ. In Fig. 1, both parameters are shown as function of the grain area forall 45 grains. Small average orientation spreads are found for small grains only, larger grainsshow a larger equivalent isotropic spread, but some of the small grains have a large equivalentisotropic spread comparable with the largest grains. The anisotropy ratio has largest valuesfor smaller grains. Similarly, the largest anisotropy ratio is found for grains with smallestaverage orientation spread. No dependence on the texture component is recognized.
0 2000 4000 6000 80000.01
0.015
0.02
0.025
0.03
0.035
0.04
0.045
grain area in µm2
equi
vale
nt is
otro
pic
spre
ad
0 2000 4000 6000 80001
1.5
2
2.5
3
grain area in µm2
anis
otro
py o
f spr
ead
(a) (b)
Figure 1: Characterization of the orientation spread in 45 individual grains: (a) averageorientation spread σ and (b) anisotropy ratio σ/σ as function of grain area in the orientationmap. Symbols characterize the texture component defined in Table 1.
The preferred rotation axis ~r∗ in each grain is found from Q as the eigenvector corre-sponding to the largest eigenvalue. The directions of the preferred rotation axes (with respectto the reference system) from all 45 grains are displayed in Fig. 2a. Obviously, the distri-bution of the preferred rotation axes is not random. The dominant rotation rarely occursaround normal or rolling direction and the orientation spreads mainly around the transversaldirection.
With respect to the preferred rotation axis ~r∗, a proper sign can be assigned to the

ND
TD RD
0 2000 4000 6000 80000
0.2
0.4
0.6
0.8
1
1.2
1.4
grain area in µm2
Ove
rall
curv
atur
e in
deg
ree/
µm
(a) (b)
Figure 2: (a) Direction of preferred rotation axis in 45 individual grains shown as pole figurealong transversal direction. (b) Overall curvature in individual grains as function of grainarea in orientation map. Symbols characterize the texture component defined in Table 1.
disorientation angles in a grain. The sign-carrying disorientation angle
θ∗i =2 arccos qi,0√
1− q2i,0
(δ~qi · ~r∗) (12)
highlights the orientation variations within two particular grains in Fig. 3. The grains ofsimilar size but different orientation (a: S-component, b: random component) are selectedto illustrate the spatial arrangement of orientations within the grains. Despite their com-parable orientation spread (average as well as anisotropy), the appearance of both grainsis rather different and resembles different characteristic features of deformation structures.For the grain in Fig. 3a, the disorientations alternate on short distances between positiveand negative values and resemble the alternating disorientations across parallel dislocationboundaries observed by TEM [4]. The image also reveals a directionality of the alternat-ing orientation changes and an existence of boundaries with an inclination angle of about40◦ towards the rolling direction as experimentally observed. The grain in Fig. 3b showscorresponding features, but not as pronounced as for the first grain. This is due to contin-uous change of the sign-carrying disorientation angle from positive to negative values andan orientation gradient over the whole grain. The entire grain is bent and the curvature of0.09◦/µm must be subtracted for resolving the underlying dislocation boundary structurein more detail [3]. Such an overall bending of grains is observed frequently: The 45 grainsexhibit in average a curvature of 0.27◦/µm with a standard deviation of the same amountand smaller grains having an increased tendency for larger curvatures (see Fig. 2b).
30 µm −6.6° 6.6° 30 µm −7.3° 7.3°
(a) (b)
Figure 3: Disorientations around preferred rotation axes for two grains (defined by a thresh-old disorientation angle of 8◦) in a 38 % cold-rolled aluminium polycrystal. Rolling directionis horizontal and normal direction vertical. Ranges are maximum values divided by 3.

Dislocation Density
Dislocation Density Tensor
Dislocations are line defects causing a relative displacement of the crystalline lattice. Theyare described by a line vector t indicating their direction, their Burgers vector b character-izing the displacement and their position vector r0. This information is combined in Nye’sdislocation density tensor [10]
αij = bitjδ(r − r0) . (13)
Assuming compatibility, Kroner [11, 12] has shown the direct relation between the dislocationdensity tensor and the geometry of the distorted lattice
αT ≡ curlβpl = −curlβel (14)
where βpl and βel are the plastic and elastic distortion tensors. The later is the sum of theelastic strain tensor εel and the tensor describing local lattice rotations ω. The componentsof the dislocation density tensor
αij = −εjklβelil,k = −εjkl(ε
elil,k + ωil,k) (15)
simplify in the absence of elastic stresses (εel ≡ 0) and expressing the lattice rotationsωil = −εilmωm by the rotation vector ωm = −εmilωil/2
αij = −εjklωil,k = εjklεilmωm,k = ωj,i − δijωk,k . (16)
Introducing the lattice curvature tensor κji = ωj,i, Nye’s original relation between the dislo-cation density tensor
αij = κji − δijκk,k (17)
and the curvature tensor κ is finally obtained (with a different sign convention as in [13, 14]).
Dislocation Density Tensor and EBSD
As lattice curvatures can be derived from local lattice orientations, the dislocation densitytensor can be determined from spatially resolved orientation measurements. With conven-tional EBSD, orientations on a planar surface along two directions (e.g. x1 and x2) can beobtained. The difference in the local lattice rotations between neighboring points
∆~ω = θ~r =2arccos∆q0√
1− q20
δ~q ≈ 2δ~q for θ << 1 (18)
is given by the disorientation ∆q between them and the components of the curvature tensor
κkl =∂ωk
∂xl
≈ 2∆qk
∆xl
(19)
can be found from the disorientation vectors ∆~q. As spatial information is available onlyalong two directions x1 and x2, solely the six components κi1 and κi2 of the curvature tensorcan be obtained, but not the components κi3. From the six accessible curvature components,five components of the dislocation density tensor can be found [15]
α12 = κ21 ; α13 = κ31 (20)
α21 = κ12 ; α23 = κ32 (21)
α33 = −κ11 − κ22 . (22)
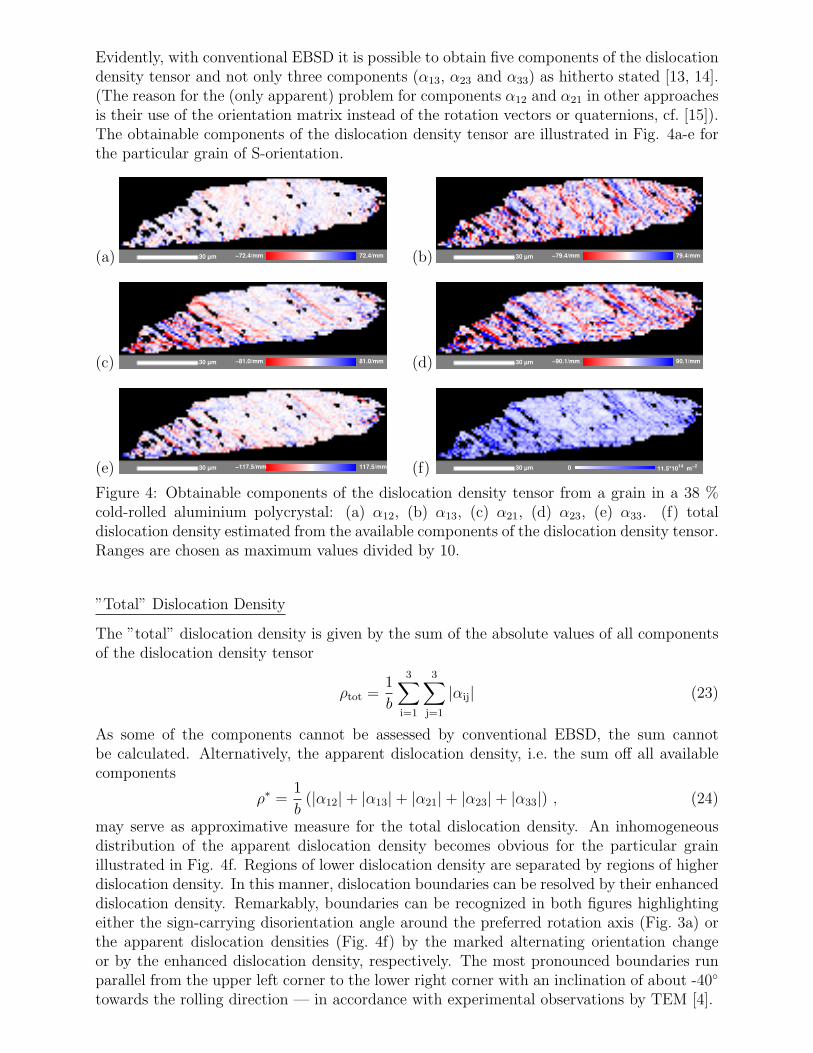
Evidently, with conventional EBSD it is possible to obtain five components of the dislocationdensity tensor and not only three components (α13, α23 and α33) as hitherto stated [13, 14].(The reason for the (only apparent) problem for components α12 and α21 in other approachesis their use of the orientation matrix instead of the rotation vectors or quaternions, cf. [15]).The obtainable components of the dislocation density tensor are illustrated in Fig. 4a-e forthe particular grain of S-orientation.
−72.4/mm 72.4/mm30 µm −79.4/mm 79.4/mm30 µm(a) (b)
−81.0/mm 81.0/mm30 µm −90.1/mm 90.1/mm30 µm(c) (d)
−117.5/mm 117.5/mm30 µm 30 µm 0 11.5*1014 m−2(e) (f)
Figure 4: Obtainable components of the dislocation density tensor from a grain in a 38 %cold-rolled aluminium polycrystal: (a) α12, (b) α13, (c) α21, (d) α23, (e) α33. (f) totaldislocation density estimated from the available components of the dislocation density tensor.Ranges are chosen as maximum values divided by 10.
”Total” Dislocation Density
The ”total” dislocation density is given by the sum of the absolute values of all componentsof the dislocation density tensor
ρtot =1
b
3∑i=1
3∑j=1
|αij| (23)
As some of the components cannot be assessed by conventional EBSD, the sum cannotbe calculated. Alternatively, the apparent dislocation density, i.e. the sum off all availablecomponents
ρ∗ =1
b(|α12|+ |α13|+ |α21|+ |α23|+ |α33|) , (24)
may serve as approximative measure for the total dislocation density. An inhomogeneousdistribution of the apparent dislocation density becomes obvious for the particular grainillustrated in Fig. 4f. Regions of lower dislocation density are separated by regions of higherdislocation density. In this manner, dislocation boundaries can be resolved by their enhanceddislocation density. Remarkably, boundaries can be recognized in both figures highlightingeither the sign-carrying disorientation angle around the preferred rotation axis (Fig. 3a) orthe apparent dislocation densities (Fig. 4f) by the marked alternating orientation changeor by the enhanced dislocation density, respectively. The most pronounced boundaries runparallel from the upper left corner to the lower right corner with an inclination of about -40◦
towards the rolling direction — in accordance with experimental observations by TEM [4].

Comments on the Dislocation Density
The calculated local curvatures and, hence, the derived dislocation densities depend stronglyon the step size of the measurement grid, because variations in the lattice rotations on smallerdistances than the step size become ignored. Consequently, dislocations causing orientationdifferences on a length scale less the step size cannot be traced by the method. Only thedislocation content geometrically required by the orientation measurements is obtained anda large amount of dislocations may remain unresolved. Reducing the steps size resolvescurvatures on a smaller length scale and allows determination of a larger fraction of thedislocations. As all dislocations are defined by the local geometry of the lattice [11, 12], aconcise determination of all dislocations would require determination of the local orientationson a scale below the dislocation distances. Even with the best available spatial resolution of10 nm, this is not achievable and, for instance, narrow dipoles cannot be resolved.
More importantly, the registered dislocation content is strongly impaired by the limitedangular resolution of the technique. Orientation differences can be accurately resolved onlyfor disorientation angles above a critical value θcr which is typically between 0.5◦ and 1.5◦.Disorientation angles below that value cannot be resolved accurately due to a lack in accuracyof the band detection etc. The limited accuracy causes noise in the orientation data, spuriouslocal curvatures of the order of κcr = θcr/∆x and, hence, an artificial dislocation density
ρcr =θcr
∆xb(25)
If a minimum angle of 1◦ and the Burgers vector for Al (0.286 nm) is assumed, a typicalstep size of 1 µm (as used in the present investigation) will result in an acceptable noisein the dislocation density of 6.1 · 1013m−2 corresponding to slightly deformed material (e.g.,aluminium cold-rolled to about 5% [16]). On the other hand, a step size of 20 nm wouldresult in an enormous artificial dislocation density of 3 · 1015m−2 corresponding to heavilydeformed material, e.g. aluminium cold rolled to 98.2% [17]. The step size can thereforenot be reduced below a certain length without creating artifacts and a certain amount ofdislocations will always remain unresolved.
Full Dislocation Density Tensor
Determination of the four missing components of the dislocation density tensor
α11 = −κ22 − κ33 ; α31 = κ13 (26)
α22 = −κ11 − κ33 ; α32 = κ23 (27)
would require determination of the lacking curvature components κi3 and hence orientationmeasurements along the third direction. This can be accomplished by serial sectioning andconventional EBSD on the new surfaces. The removal of individual layers can either beachieved by mechanical and electrochemical polishing outside the microscope or in-situ inthe SEM by a focussed ion beam. Layer thicknesses of the order of 2 µm are attainableby polishing [18], whereas the in-situ technique allows removal of layers down to 50 nm[19]. If one aims for calculating the dislocation density tensor, the chosen step size in the2D orientation determination must in each case correspond to the thickness of the removedlayers, as the two components α11 and α22 depend on derivatives along different directionsand the accuracy of the curvature determination (θcr/∆x) is strongly affected by the step size.If the layer thickness is chosen differently, the accuracy of the different curvature componentsbecomes different and their addition meaningless.

Average Apparent Dislocation Density within Individual Grains
The average apparent dislocation density as defined in Eq. (24) has been analyzed for eachof the 45 grains individually. It varies between 2.6 · 1014m−2 and 6.8 · 1014m−2, in all caseswell above the mentioned accuracy limit of 6.1 · 1013m−2. No correlation with the grainarea is observed in Fig. 5a: some of the smallest grains have the highest average dislocationcontent, other the smallest average dislocation content. In larger grains locally enhanceddislocation densities average out. In Fig. 5b the average apparent dislocation density ofeach grain is shown as function of the overall curvature (around the preferred rotation axisand along the direction of largest orientation spread) derived in the previous section. Anincrease of the average dislocation density with the overall curvature is indicated. For theoverall curvatures, the minimum dislocation density ρmin = κ∗/b required for creating theoverall bending is calculated and included in Fig. 5b. Obviously, the measured averageapparent dislocation density is well above the dislocation density required from the overallbending — indicating that the bending is of minor relevance for the total dislocation content.
0 2000 4000 6000 80000
100
200
300
400
500
600
700
grain area in µm2
Ave
rage
dis
loca
tion
dens
ity /
µm2
0 0.5 1 1.50
100
200
300
400
500
600
700
Overall curvature in degree/ µm
Ave
rage
dis
loca
tion
dens
ity /
µm2
(a) (b)
Figure 5: Average apparent dislocation density in 45 individual grains as function of (a) grainarea in the orientation map and (b) overall curvature of the grain. Lines indicate (a) theaccuracy limit and (b) the minimum dislocation density required from the overall bending.Symbols characterize the texture component defined in Table 1.
Conclusion
An elaborate evaluation scheme for orientation maps obtained from EBSD is utilized forthe investigation of the microstructure within individual grains of cold-rolled aluminium.Based on local orientation measurements the orientation distributions is analyzed terms ofthe orientation spread in orientation space and in terms of local inhomogeneities within thegrain. The orientation spread is characterized by means of the second order central momentsof the disorientation distribution in orientation space. It is found that only some of thesmaller grains in the investigated sample show a small average spread and a large anisotropyof the orientation distributions. The preferred rotation axes of the individual grains areless likely oriented along the normal or rolling direction than along the transversal direction.Two distinct spatial patterns of orientations (long range orientation gradients and alternatingdisorientations) can be distinguished by means of a sign-carrying disorientation angle withrespect to the preferred rotation axis. From the local inhomogeneities, five components of thedislocation density tensor can be resolved. Determination of the apparent dislocation densityallows resolving deformation-induced boundaries as regions of high dislocation density.

Acknowledgements
The authors gratefully acknowledge the Danish National Research Foundation for supportingthe Center of Fundamental Research: Metal Structures in Four Dimensions, within whichthis work was performed. Support from U. Bennov, C. Gundlach, T.P. Johansson, P. Olesen,P.K. Pedersen and S. Van Boxel is gratefully acknowledged.
References
[1] V. Randle, Microtexture Determination and Its Application (London: The Institute ofMaterials 1992).
[2] W. Pantleon, ”Resolving orientation correlations in deformation structures by EBSD,”Materials Research Society Symposium Proceedings 819 (2004), N.1.5.1-9.
[3] W. Pantleon, ”Retrieving orientation correlations in deformation structures from orien-tation maps,” Materials Science and Technology 21 (2005), 1392-1396.
[4] Q. Liu, D. Juul Jensen, N. Hansen, ”Effect of grain orientation on deformation structurein cold-rolled polycrystalline aluminium,” Acta Materialia 46 (1998), 5819-5838.
[5] O. Mishin, B. Bay, and D. Juul Jensen, ”Through-thickness texture gradients in cold-rolled aluminum,” Metallallurgical and Materials Transactions A 31 (2000), 1653-1662.
[6] W. Pantleon, W. He, T.P. Johannsson, and C. Gundlach, ”Orientation inhomogeneitieswithin individual grains in cold-rolled aluminium resolved by EBSD,” Materials ScienceEngineering A to be published (2007).
[7] A. Morawiec, Orientations and rotations (Berlin: Springer-Verlag 2004), 1-35.[8] N.C. Krieger Lassen, D. Juul Jensen, and K. Conradsen, ”On the statistical analysis of
orientation data,” Acta Crystallographica A 50 (1994), 741-748.[9] H.-J. Bunge, Texture Analysis in Materials Science: Mathematical Methods (Gottingen:
Cuvillier Verlag 1993), 1-19.[10] J.F. Nye, ”Some geometrical relations in dislocated crystals,” Acta Metallurgica 1
(1953), 153-162.[11] E. Kroner, ”Der fundamentale Zusammenhang zwischen Versetzungsdichte und Span-
nungsfunktionen,” Zeitschrift fur Physik 142 (1955) 463-475.[12] E. Kroner, ”Continuum theory of defects,” Physics of Defects, ed. R. Balian, M. Kleman,
and J.-P. Porier (Amsterdam: North-Holland Publishing Company 1980), 219-315.[13] S. Sun, B.L. Adams, C. Shet, S. Saigal, and W.E. King, ”Mesoscale investigation of the
deformation field of an aluminium bicrystal,” Scripta Materialia 39 (1998), 501-508.[14] B.S. El-Dasher, B.L. Adams, A.D. Rollett, ”Experimental recovery of geometrically
necessary dislocation density in polycrystals,” Scripta Materialia 48 (2003), 141-145.[15] W. Pantleon, ”The geometrically necessary dislocation content and its role for work-
hardening,” submitted to Materials Science and Technology (2007).[16] N. Hansen, and X. Huang, ”Microstructure and flow stress of polycrystals and single
crystals,”, Acta Materialia 46 (1998), 1827-1836.[17] Q. Liu, X. Huang, D.J. Lloyd, and N. Hansen, ”Microstructure and strength of commer-
cial purity aluminium (AA1200) cold-rolled to large strains,” Acta Materialia 50 (2002),3789-3802.
[18] J.E. Spowart, ”Automated serial sectioning for 3-D analysis of microstructures,” ScriptaMaterialia 55 (2006), 5-10.
[19] J. Konrad, S. Zaefferer, and D. Raabe, ”Investigation of orientation gradients arounda hard Laves particle in a warm-rolled Fe3Al-based alloy using a 3D EBSD-FIB tech-nique,” Acta Materialia 54 (2006), 1369-1380.
Copyright © 2022 FDOKUMEN