Evaluating quartz crystallographic preferred orientations and the role of deformation partitioning...
15
Author's personal copy Evaluating quartz crystallographic preferred orientations and the role of deformation partitioning using EBSD and fabric analyser techniques Mark Peternell a, * , Pavlína Hasalová b , Christopher J.L. Wilson a , Sandra Piazolo c, 1 , Karel Schulmann d a School of Earth Sciences, The University of Melbourne, Victoria 3010, Australia b School of Geosciences, Monash University, Clayton, Victoria 3800, Australia c Department of Geological Sciences, Stockholm University, Stockholm 10691, Sweden d L’Université de Strasbourg, l’Institut de Physique du Globe de Strasbourg, UMR 7517,1 Rue Blessig, Strasbourg 67084, France article info Article history: Received 31 October 2009 Received in revised form 5 May 2010 Accepted 13 May 2010 Available online 21 May 2010 Keywords: Crystallographic preferred orientation Deformation partitioning Electron back-scattered diffraction Fabric analyser Quartz Thaya dome abstract Quartz crystallographic preferred orientations (CPO) from three distinct orthogneisses using both the Electron Back Scatter Diffraction (EBSD) and Fabric Analyser (FA) techniques reveal a clear trend from basal <a> and rhomb <a þ c> slip for high PeT conditions (670 20 C/9 kbar), rhomb <a þ c> and basal <a> slip for medium PeT (590 15 C/6 kbar) and a dominance of prism <a> slip for lower PeT conditions (<570 C/4e5 kbar). The textural variations are interpreted in terms of a temperature field gradient and microscale strain partitioning controlled by a weak feldspar matrix that can locally invert the expected slip system sequences. Locally quartz CPOs are different within one thin section, and in comparison to bulk orientation measurements both, EBSD and the Fabric Analyser techniques are ideal to determine such textural heterogeneities. While the EBSD is a powerful technique to determine the full CPO, measurements from similar locations inside several quartz grains from the orthogneisses and an annealed and undeformed quartzite show that the FA is an accurate tool to determine CPOs of c-axis orientations in uniaxial materials. In a CPO focussed study the FA is a cheap alternative to EBSD as the analysis of whole thin section can be accomplished in a very short time, with minimal sample prepa- ration. With the FA it is possible to evaluate the CPOs of several samples quickly with an accuracy that allows identification of the main slip systems and their homogeneity. Ó 2010 Elsevier Ltd. All rights reserved. 1. Introduction Crystallographic Preferred Orientation (CPO) measurement in deformed rocks is a common procedure introduced into classical structural analysis (e.g. Sander, 1930; Fairbairn, 1949; Turner and Weiss, 1963). A CPO analysis is crucial in order to decipher observed microstructures and/or deformation mechanisms (e.g. Prior and Wheeler, 1999), model other physical anisotropies of rocks (e.g. Ji and Mainprice, 1988; Bascou et al., 2001) and to understand and quantify sedimentary, metamorphic and magmatic processes (e.g. Mørk and Moen, 2007; Romeo et al., 2007; Hasalová et al., 2008). Quartz is one of the most common minerals in the Earth’s crust and therefore understanding its deformational behaviour is important. There are many studies of experimentally and naturally deformed quartz-rich rocks that provide some insight in under- standing of quartz deformational behaviour and development of its CPO (Hobbs, 1968; Tullis, 1977; Blumenfeld et al., 1986; Schmid and Casey, 1986; Dell’Angelo and Tullis, 1989; Gleason et al., 1993; Stipp et al., 2002; Vernooij et al., 2006; Menegon et al., 2008; Stipp and Kunze, 2008). Quartz CPO is controlled by temperature, strain rate, differential stress and fluid content (e.g. Stipp et al., 2002; Menegon et al., 2008). Therefore deformed quartz has distinctive CPOs that can be related to specific conditions of formation (e.g. Tullis, 1977; Schmid and Casey, 1986; Stipp et al., 2002). A CPO can be obtained either by single grain measurements or by statistical diffraction experiments (volume texture measure- ments). The latter includes methods such as X-ray diffraction or neutron diffraction (Wenk et al., 1984, 1986). Single grain measurements are based on the determination of the orientation of selected lattice directions, or the complete orientation of individual crystals in a sample (Ullemeyer et al., 2000). The Electron Back Scatter Diffraction (EBSD) method adapted to a Scanning Electron Microscope (e.g. Lloyd et al., 1991; Adams et al., 1993; Prior et al., 1999) is a commonly used method. Other methods are based on optical microscopy using the universal stage (Berek, 1924; * Corresponding author. Tel.: þ61 3 8344 6910; fax: þ61 3 8344 7761. E-mail address: [email protected] (M. Peternell). 1 Present address: Department of Earth and Planetary Sciences, Macquarie University, Australia. Contents lists available at ScienceDirect Journal of Structural Geology journal homepage: www.elsevier.com/locate/jsg 0191-8141/$ e see front matter Ó 2010 Elsevier Ltd. All rights reserved. doi:10.1016/j.jsg.2010.05.007 Journal of Structural Geology 32 (2010) 803e817
-
Upload
independent -
Category
Documents
-
view
1 -
download
0
Transcript of Evaluating quartz crystallographic preferred orientations and the role of deformation partitioning...
Author's personal copy
Evaluating quartz crystallographic preferred orientations and the roleof deformation partitioning using EBSD and fabric analyser techniques
Mark Peternell a,*, Pavlína Hasalová b, Christopher J.L. Wilson a, Sandra Piazolo c,1, Karel Schulmann d
a School of Earth Sciences, The University of Melbourne, Victoria 3010, Australiab School of Geosciences, Monash University, Clayton, Victoria 3800, AustraliacDepartment of Geological Sciences, Stockholm University, Stockholm 10691, Swedend L’Université de Strasbourg, l’Institut de Physique du Globe de Strasbourg, UMR 7517, 1 Rue Blessig, Strasbourg 67084, France
a r t i c l e i n f o
Article history:Received 31 October 2009Received in revised form5 May 2010Accepted 13 May 2010Available online 21 May 2010
Keywords:Crystallographic preferred orientationDeformation partitioningElectron back-scattered diffractionFabric analyserQuartzThaya dome
a b s t r a c t
Quartz crystallographic preferred orientations (CPO) from three distinct orthogneisses using both theElectron Back Scatter Diffraction (EBSD) and Fabric Analyser (FA) techniques reveal a clear trend frombasal <a> and rhomb <a þ c> slip for high PeT conditions (670 � 20 �C/9 kbar), rhomb <a þ c> andbasal <a> slip for medium PeT (590 � 15 �C/6 kbar) and a dominance of prism <a> slip for lower PeTconditions (<570 �C/4e5 kbar). The textural variations are interpreted in terms of a temperature fieldgradient and microscale strain partitioning controlled by a weak feldspar matrix that can locally invertthe expected slip system sequences. Locally quartz CPOs are different within one thin section, and incomparison to bulk orientation measurements both, EBSD and the Fabric Analyser techniques are ideal todetermine such textural heterogeneities. While the EBSD is a powerful technique to determine the fullCPO, measurements from similar locations inside several quartz grains from the orthogneisses and anannealed and undeformed quartzite show that the FA is an accurate tool to determine CPOs of c-axisorientations in uniaxial materials. In a CPO focussed study the FA is a cheap alternative to EBSD as theanalysis of whole thin section can be accomplished in a very short time, with minimal sample prepa-ration. With the FA it is possible to evaluate the CPOs of several samples quickly with an accuracy thatallows identification of the main slip systems and their homogeneity.
� 2010 Elsevier Ltd. All rights reserved.
1. Introduction
Crystallographic Preferred Orientation (CPO) measurement indeformed rocks is a common procedure introduced into classicalstructural analysis (e.g. Sander, 1930; Fairbairn, 1949; Turner andWeiss, 1963). A CPO analysis is crucial in order to decipherobserved microstructures and/or deformation mechanisms (e.g.Prior and Wheeler, 1999), model other physical anisotropies ofrocks (e.g. Ji and Mainprice, 1988; Bascou et al., 2001) and tounderstand and quantify sedimentary, metamorphic andmagmaticprocesses (e.g. Mørk and Moen, 2007; Romeo et al., 2007; Hasalováet al., 2008).
Quartz is one of the most common minerals in the Earth’s crustand therefore understanding its deformational behaviour isimportant. There are many studies of experimentally and naturally
deformed quartz-rich rocks that provide some insight in under-standing of quartz deformational behaviour and development of itsCPO (Hobbs, 1968; Tullis, 1977; Blumenfeld et al., 1986; Schmid andCasey, 1986; Dell’Angelo and Tullis, 1989; Gleason et al., 1993; Stippet al., 2002; Vernooij et al., 2006; Menegon et al., 2008; Stipp andKunze, 2008). Quartz CPO is controlled by temperature, strainrate, differential stress and fluid content (e.g. Stipp et al., 2002;Menegon et al., 2008). Therefore deformed quartz has distinctiveCPOs that can be related to specific conditions of formation (e.g.Tullis, 1977; Schmid and Casey, 1986; Stipp et al., 2002).
A CPO can be obtained either by single grain measurements orby statistical diffraction experiments (volume texture measure-ments). The latter includes methods such as X-ray diffraction orneutron diffraction (Wenk et al., 1984, 1986). Single grainmeasurements are based on the determination of the orientation ofselected lattice directions, or the complete orientation of individualcrystals in a sample (Ullemeyer et al., 2000). The Electron BackScatter Diffraction (EBSD) method adapted to a Scanning ElectronMicroscope (e.g. Lloyd et al., 1991; Adams et al., 1993; Prior et al.,1999) is a commonly used method. Other methods are based onoptical microscopy using the universal stage (Berek, 1924;
* Corresponding author. Tel.: þ61 3 8344 6910; fax: þ61 3 8344 7761.E-mail address: [email protected] (M. Peternell).
1 Present address: Department of Earth and Planetary Sciences, MacquarieUniversity, Australia.
Contents lists available at ScienceDirect
Journal of Structural Geology
journal homepage: www.elsevier .com/locate/ jsg
0191-8141/$ e see front matter � 2010 Elsevier Ltd. All rights reserved.doi:10.1016/j.jsg.2010.05.007
Journal of Structural Geology 32 (2010) 803e817
Author's personal copy
Reinhard, 1931; Turner and Weiss, 1963) or computer assistedmicroscope stages (Heilbronner and Pauli, 1993; Fueten, 1997;Fueten and Goodchild, 2001; Wilson et al., 2003, 2007). All ofthese methods have specific advantages and restrictions. Thechoice of technique depends on the problem being investigated,e.g. whichminerals aremeasured, grain size, whether a thin sectionor hand specimen is analysed, if the rock is mono- or polymineralicand if it is important to link crystallographic orientations to theexact microstructural position.
The EBSD method provides the easiest way of acquiring largenumbers of complete CPO data from individual rock formingminerals with a spatial resolution of <1 mm with a simultaneousknowledge of the microstructure. As in a Scanning ElectronMicroscope the electron beam creates a source of scattered elec-trons within a specimen, diffraction of these electrons will occursimultaneously on all lattice planes in a polygrained sample and theback-scattered electrons will form a diffraction pattern and providethe orientation of individual grains (for details see Prior et al., 1999).The newest ‘High-speed EBSD’ technique can acquire more than1000 images per second, while the mineral indexing is performedoffline (Schwarzer and Hjelen, 2010). Nevertheless, ‘High-speedEBSD’ can only be applied on suitable materials such as aluminiumor nickel and therefore, is not usable for rock and mineral samples(Schwarzer and Hjelen, 2010). The speed of automatic EBSD datacollection for minerals including quartz is less than 20 points persecond (Prior, 2009).
In summary, advantages of the EBSD method are its high spatialand angular resolution, automatic recognition of mineral phasesand that the complete crystallographic orientation including allcrystallographic axes, i.e. including Dauphiné twins, can be deter-mined. On the other hand, some extra sample preparation isneeded and evenwith directed automatic EBSD data acquisition theanalysis of larger areas, i.e. whole thin section will in general takelonger and therefore makes this technique in comparison to thefabric analysis technique described in this paper more expensive.
As an alternative, the optical technique such as the FA (Wilsonet al., 2003, 2007) is a fast and a sufficiently accurate tool todetermine individual c-axis orientation of uniaxial minerals sucha quartz, calcite or apatite. Samples can be analysed with a resolu-tion of w2.8mm/pixel and no special sample preparation is needed.Covered, uncovered, polished, coated or stained thin sections aswell as mounts for fission track analysis can be analysed (Peternellet al., 2009). The biggest advantages of the FA are its ability tomeasure up to 10 � 10 cm sized samples and its speed and ease ofoperation. With the standard setting used in this study approxi-mately 90 000 pixels per second can be acquired. Nevertheless,because of the used 2 Ghz desktop computer for image processing,the real-time analysis for a whole thin section (w4 � 2.5 cm) isslowed down to <45 min with 50 mm/pixel, <2 h with 5 mm/pixeland <8 h with 2.8 mm/pixel resolution. The result of the analysis ispresented as an axial-distribution (AVA) image of the c-axisorientation for each pixel (Heilbronner and Pauli, 1993; Fueten,1997; Fueten and Goodchild, 2001; Wilson et al., 2003, 2007,2009). Disadvantages of the method are its limitation to analysenot the full crystallographic orientation, its current restriction tohexagonal and trigonal minerals, and lower spatial and angularresolution in comparison to the EBSD. In summary, FA and EBSD arevery valuable alternatives for specific questions as the type of dataand sample preparations are different.
The aim of this work is (i) to evaluate the accuracy of quartz CPOdata obtained from the FA by comparing results to EBSD analysis(using both the HKL and the TSL systems) and (ii) to discuss the roleof deformation partitioning in the development of quartz CPOs.
Wilson et al. (2007) conducted on one sample a first comparisonbetween CPO data obtained by EBSD and FA. However, this was
done using an earlier version of the FA and no single pointcomparison, crystal mapping or c-axis distribution within a singlethin section was performed. In this study we perform a morerigorous evaluation of the accuracy of FA data by analysing anundeformed Appin Quartzite from the Ballachulish contact aureole,Scotland and a deformed medium-high grade orthogneisses fromthe Thaya dome in the Bohemian Massif (Czech Republic). Thequartz CPOs weremeasured in four different ways: (i) Single crystalorientation maps, (ii) point orientations within individual quartzcrystals, (iii) bulk c-axis orientations and (iv) distribution of c-axesorientations on the thin section scale. Advantages and disadvan-tages of both techniques will be discussed in detail, as well as theproblem of texture heterogeneity determination on a thin sectionscale.
Results show that Thaya samples show different quartz CPOs asa result of different deformation and metamorphic conditions. Thepeak PeT conditions change from c. 670 � 20 �C/9 kbar to 570 �C/4e5 kbar. Quartz c-axis orientations in the distinct orthogneisssamples will be discussed in relation to deformation and meta-morphic conditions they underwent. Finally, results will be linkedto their implication for microstructural development on theregional scale.
2. Geological setting of the Thaya Dome
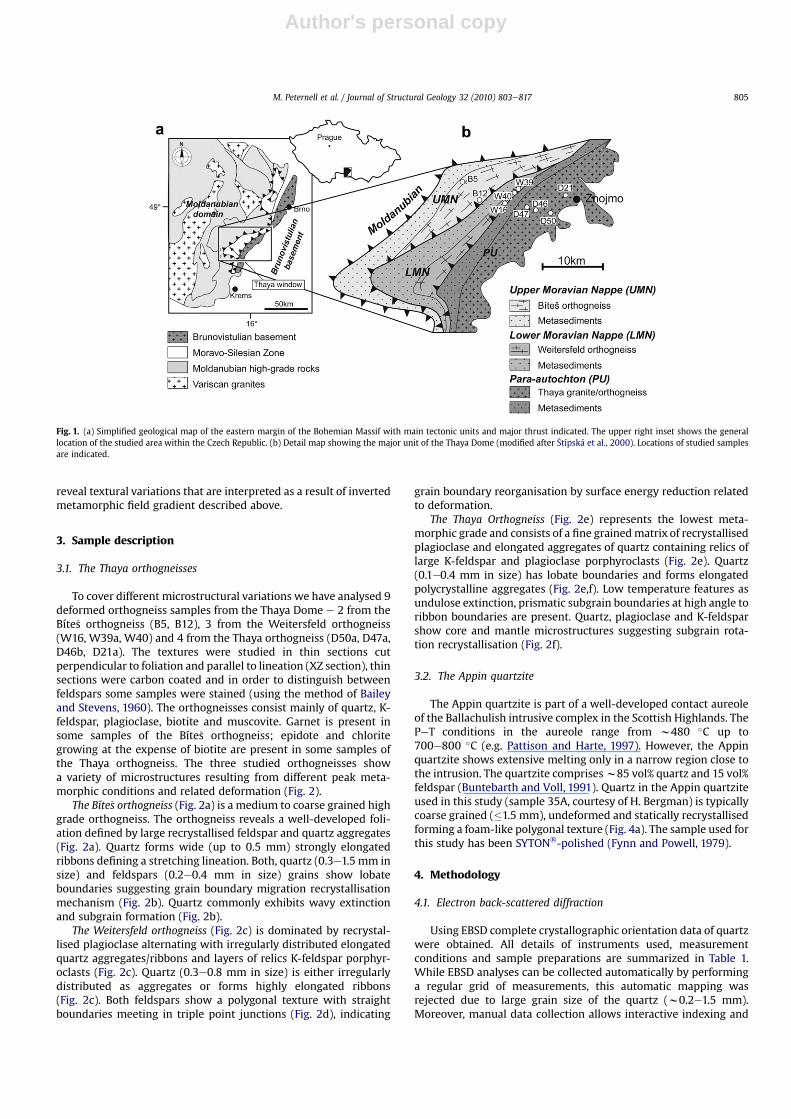
The Thaya Dome (or so-called Thaya tectonic window) issituated at the southeast margin of the Bohemian Massif (Fig. 1a)and consists of par-autochtonous Brunia basement (Dudek, 1980)and two basement derived nappese Lower Moravian Nappe (LMN)and Upper Moravian Nappe (UMN; Fig.1b) (Schulmann et al., 1995).The basement consists of the Cadomian Thaya granite/orthogneissoverlain by a Proterozoic metapelitic and metapsamitic sequence.The lower Moravian Nappe consists of the strongly sheared Wei-tersfeld orthogneiss at the base that is overlain by metapelites,marbles and calc-silicate rocks. The Upper Moravian Nappe iscomposed of the Bíte�s orthogneiss body at the base and a meta-volcano-sedimentary cover in the upper part of the section (Fig. 1b)(Schulmann, 1990; Schulmann et al., 1994).
The Thaya Dome reveals inverted Barrovian metamorphisminterpreted as a result of continental underthrusting and laterimbrications of crustal nappes (�Stípská and Schulmann, 1995). Thestructurally highest unit in the western part (Upper MoravianNappe) exhibits the highest grade of metamorphism (Suess, 1912).Peak metamorphic conditions for these three orthogneiss unitswere estimated from interlayered metapelites by average PeTmethod and standard GrteBt, SteGrt and GrtePlg thermobarom-etry and are ranging from w650 �C/10 kbar to w500 �C/4 kbar(�Stípská and Schulmann, 1995; �Stípská et al., 2000). The kyanite-sillimanite bearing metapelites adjacent and interlayered with theBíte�s orthogneiss reveal metamorphic peak conditions ofw670 � 20 �C at 9 kbar. Staurolite bearing metapelites spatiallyconnected with the Weitersfeld orthogneiss show peak meta-morphic conditions w590 � 15 �C at 6 kbar and the garnet bearingmetasediments overlying the Thaya orthogneiss at the westernborder of the Brunia basement exhibit the lowest peak meta-morphic conditions below 570 �C at 4e5 kbar (�Stípská andSchulmann, 1995). Consequently, the peak metamorphic condi-tions of these three orthogneisses and associated metasedimentsmatch different crustal levels from where they were exhumed andtherefore influence the mineral textures and microstructures ofthese rocks (Ulrich et al., 2002). In conclusion, the Upper MoravianNappe was hotter than the Lower Moravian Nappe and the Bruniabasement and these differences have led to temperature dependentvariations in active slip systems of quartz and therefore also inanalysed textures. The Bíte�s, Weitersfeld and Thaya orthogneisses
M. Peternell et al. / Journal of Structural Geology 32 (2010) 803e817804
Author's personal copy
reveal textural variations that are interpreted as a result of invertedmetamorphic field gradient described above.
3. Sample description
3.1. The Thaya orthogneisses
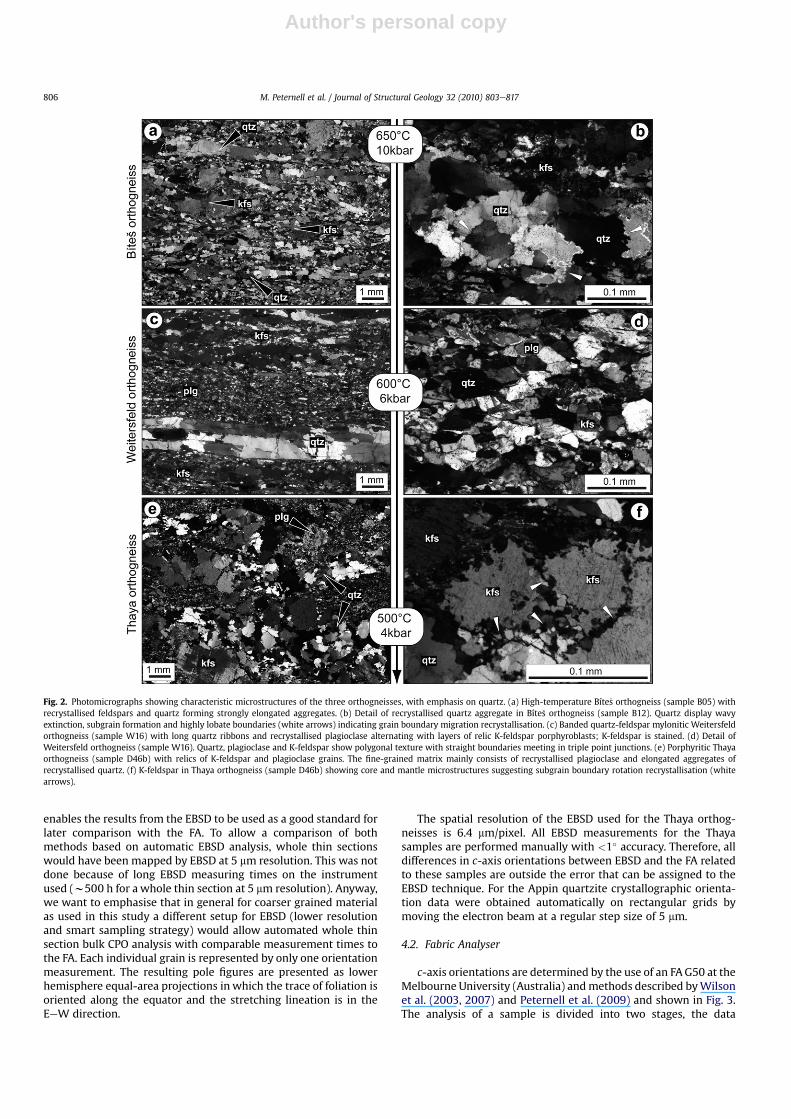
To cover different microstructural variations we have analysed 9deformed orthogneiss samples from the Thaya Dome e 2 from theBíte�s orthogneiss (B5, B12), 3 from the Weitersfeld orthogneiss(W16, W39a, W40) and 4 from the Thaya orthogneiss (D50a, D47a,D46b, D21a). The textures were studied in thin sections cutperpendicular to foliation and parallel to lineation (XZ section), thinsections were carbon coated and in order to distinguish betweenfeldspars some samples were stained (using the method of Baileyand Stevens, 1960). The orthogneisses consist mainly of quartz, K-feldspar, plagioclase, biotite and muscovite. Garnet is present insome samples of the Bíte�s orthogneiss; epidote and chloritegrowing at the expense of biotite are present in some samples ofthe Thaya orthogneiss. The three studied orthogneisses showa variety of microstructures resulting from different peak meta-morphic conditions and related deformation (Fig. 2).
The Bíte�s orthogneiss (Fig. 2a) is a medium to coarse grained highgrade orthogneiss. The orthogneiss reveals a well-developed foli-ation defined by large recrystallised feldspar and quartz aggregates(Fig. 2a). Quartz forms wide (up to 0.5 mm) strongly elongatedribbons defining a stretching lineation. Both, quartz (0.3e1.5 mm insize) and feldspars (0.2e0.4 mm in size) grains show lobateboundaries suggesting grain boundary migration recrystallisationmechanism (Fig. 2b). Quartz commonly exhibits wavy extinctionand subgrain formation (Fig. 2b).
The Weitersfeld orthogneiss (Fig. 2c) is dominated by recrystal-lised plagioclase alternating with irregularly distributed elongatedquartz aggregates/ribbons and layers of relics K-feldspar porphyr-oclasts (Fig. 2c). Quartz (0.3e0.8 mm in size) is either irregularlydistributed as aggregates or forms highly elongated ribbons(Fig. 2c). Both feldspars show a polygonal texture with straightboundaries meeting in triple point junctions (Fig. 2d), indicating
grain boundary reorganisation by surface energy reduction relatedto deformation.
The Thaya Orthogneiss (Fig. 2e) represents the lowest meta-morphic grade and consists of a fine grainedmatrix of recrystallisedplagioclase and elongated aggregates of quartz containing relics oflarge K-feldspar and plagioclase porphyroclasts (Fig. 2e). Quartz(0.1e0.4 mm in size) has lobate boundaries and forms elongatedpolycrystalline aggregates (Fig. 2e,f). Low temperature features asundulose extinction, prismatic subgrain boundaries at high angle toribbon boundaries are present. Quartz, plagioclase and K-feldsparshow core and mantle microstructures suggesting subgrain rota-tion recrystallisation (Fig. 2f).
3.2. The Appin quartzite
The Appin quartzite is part of a well-developed contact aureoleof the Ballachulish intrusive complex in the Scottish Highlands. ThePeT conditions in the aureole range from w480 �C up to700e800 �C (e.g. Pattison and Harte, 1997). However, the Appinquartzite shows extensive melting only in a narrow region close tothe intrusion. The quartzite comprisesw85 vol% quartz and 15 vol%feldspar (Buntebarth and Voll, 1991). Quartz in the Appin quartziteused in this study (sample 35A, courtesy of H. Bergman) is typicallycoarse grained (�1.5 mm), undeformed and statically recrystallisedforming a foam-like polygonal texture (Fig. 4a). The sample used forthis study has been SYTON�-polished (Fynn and Powell, 1979).
4. Methodology
4.1. Electron back-scattered diffraction
Using EBSD complete crystallographic orientation data of quartzwere obtained. All details of instruments used, measurementconditions and sample preparations are summarized in Table 1.While EBSD analyses can be collected automatically by performinga regular grid of measurements, this automatic mapping wasrejected due to large grain size of the quartz (w0.2e1.5 mm).Moreover, manual data collection allows interactive indexing and
Fig. 1. (a) Simplified geological map of the eastern margin of the Bohemian Massif with main tectonic units and major thrust indicated. The upper right inset shows the generallocation of the studied area within the Czech Republic. (b) Detail map showing the major unit of the Thaya Dome (modified after �Stípská et al., 2000). Locations of studied samplesare indicated.
M. Peternell et al. / Journal of Structural Geology 32 (2010) 803e817 805
Author's personal copy
enables the results from the EBSD to be used as a good standard forlater comparison with the FA. To allow a comparison of bothmethods based on automatic EBSD analysis, whole thin sectionswould have been mapped by EBSD at 5 mm resolution. This was notdone because of long EBSD measuring times on the instrumentused (w500 h for a whole thin section at 5 mm resolution). Anyway,we want to emphasise that in general for coarser grained materialas used in this study a different setup for EBSD (lower resolutionand smart sampling strategy) would allow automated whole thinsection bulk CPO analysis with comparable measurement times tothe FA. Each individual grain is represented by only one orientationmeasurement. The resulting pole figures are presented as lowerhemisphere equal-area projections in which the trace of foliation isoriented along the equator and the stretching lineation is in theEeW direction.
The spatial resolution of the EBSD used for the Thaya orthog-neisses is 6.4 mm/pixel. All EBSD measurements for the Thayasamples are performed manually with <1� accuracy. Therefore, alldifferences in c-axis orientations between EBSD and the FA relatedto these samples are outside the error that can be assigned to theEBSD technique. For the Appin quartzite crystallographic orienta-tion data were obtained automatically on rectangular grids bymoving the electron beam at a regular step size of 5 mm.
4.2. Fabric Analyser
c-axis orientations are determined by the use of an FAG50 at theMelbourne University (Australia) andmethods described byWilsonet al. (2003, 2007) and Peternell et al. (2009) and shown in Fig. 3.The analysis of a sample is divided into two stages, the data
Fig. 2. Photomicrographs showing characteristic microstructures of the three orthogneisses, with emphasis on quartz. (a) High-temperature Bíte�s orthogneiss (sample B05) withrecrystallised feldspars and quartz forming strongly elongated aggregates. (b) Detail of recrystallised quartz aggregate in Bíte�s orthogneiss (sample B12). Quartz display wavyextinction, subgrain formation and highly lobate boundaries (white arrows) indicating grain boundary migration recrystallisation. (c) Banded quartz-feldspar mylonitic Weitersfeldorthogneiss (sample W16) with long quartz ribbons and recrystallised plagioclase alternating with layers of relic K-feldspar porphyroblasts; K-feldspar is stained. (d) Detail ofWeitersfeld orthogneiss (sample W16). Quartz, plagioclase and K-feldspar show polygonal texture with straight boundaries meeting in triple point junctions. (e) Porphyritic Thayaorthogneiss (sample D46b) with relics of K-feldspar and plagioclase grains. The fine-grained matrix mainly consists of recrystallised plagioclase and elongated aggregates ofrecrystallised quartz. (f) K-feldspar in Thaya orthogneiss (sample D46b) showing core and mantle microstructures suggesting subgrain boundary rotation recrystallisation (whitearrows).
M. Peternell et al. / Journal of Structural Geology 32 (2010) 803e817806
Author's personal copy
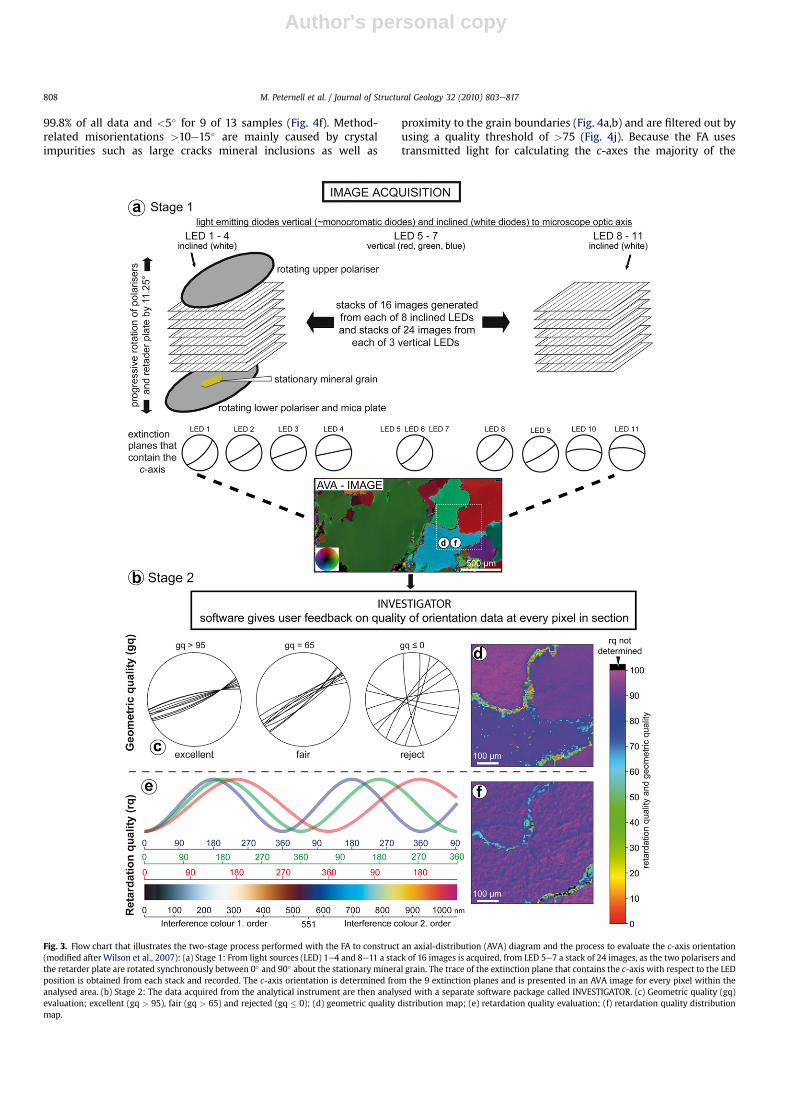
acquisition (Fig. 3a) and the data investigation (Fig. 3b). Based ona stack of microphotographs the axial distribution AVA image(Sander, 1950) is generated with a spatial resolution of 5 mm/pixel(Fig. 3a) for the Thaya samples and 2.8 mm/pixel for the annealedAppin quartzite. The c-axis orientations of each pixel inside the AVAimage are then evaluated using the INVESTIGATOR software(http://www.earthsci.unimelb.edu.au/facilities/analyser/downloads.html; Fig. 3b).
The accuracy of the c-axis orientation measurements is influ-enced by (i) mechanical and optical components of the FA and, (ii)the non-uniform material, i.e. boundaries, cracks or other impuri-ties in the quartz. To check the quality of the measured c-axisorientations, two empirically determined values are given by thesoftware as geometric quality and retardation quality values(Peternell et al., 2009; Fig. 3c,e)
The geometric quality (Fig. 3c) is a measure of how tightly theextinction planes (Fig. 3a) from each light direction intersect andconsequently, determines the usefulness of the c-axis colatitudevalues. The geometric quality is dimensionless and ranges from 100(excellent) to 0 (poor) (Fig. 3c). Determination of geometric qualityvalues for each pixel of a section inside the AVA image (Fig. 3a) arepresented in Fig. 3d and indicate that the c-axis orientationmeasurements inside single quartz grains are mostly reliable butbecome unstable towards the grain boundaries.
To evaluate the usefulness of the c-axis azimuths the retardationquality (Fig. 3e) is used in this study. The retardation quality isa measure of howwell the phase values of the near monochromaticred, green, and blue light, from the vertical light sources (Fig. 3a),match the theoretical interference sinusoid curves of Newton’scolours (Fig. 3e; Peternell et al., 2009). A value of 100 (excellent)corresponds to a perfect match of red, blue and green retardations,whereas a value of 0 (poor) corresponds to a non-reliable c-axisazimuth. Especially along grain boundaries the retardation qualitydrops down and cannot be determined locally (Fig. 3f). In this studyall 10 polished and carbon coated samples were fully automatedscanned with the FA. In addition, samples D47a andW39a from theThaya dome were first uncoated and afterwards measured again.The complete measurement of one samplewas performed in<1.5 hand thus the total measuring time for all 10 samples was <15 h.
5. Accuracy of the Fabric Analyser data
In a first step the accuracy of the FA was tested on theundeformed annealed Appin quartzite (Fig. 4a). Beside the accu-racy this analysis was also undertaken to evaluate whethercrystal impurities such as cracks or fluid and mineral inclusionsinfluence the accuracy (Peternell et al., 2009). Automatic EBSDmeasurements within 13 quartz crystals show a small crystalmisorientation <1.5� and for each crystal the mean c-axisorientation is taken as the standard orientation. The same areameasured with EBSD was analysed by the FA with 2.8 mm spatialresolution (Fig. 4). To avoid misinterpretation we will use the
term misorientation for differences in c-axis orientation withina single crystal and between different crystals and, method-related misorientation to describe the difference in c-axis orien-tation from EBSD vs. FA measurements.
5.1. Results
The coarse grained quartzite shows a well developed polygonaltexture with a few fluid (FI) and mineral inclusions (I) and smaller(SC) and larger cracks (LC, Fig. 4a). The c-axis orientations arehomogenous within each crystal (Fig. 4b), and misorientations arerelated to crystal impurities such as mineral inclusions and largercracks and grain boundaries (Fig. 4a,b). Smaller cracks and fluidinclusions have no recognisable influence on the misorientations(Fig. 4a,b). The retardation and geometric quality values (Fig. 4c,d)are generally high (>80) but decrease at the impurities and towardsthe grain boundaries (Fig. 4a,c,d).
Between w1000 and w80 000 single measurements for eachcrystalwereundertakenwith theFA (Fig. 4e). It is shownthat the totalnumber of measurements suddenly decreases at combined retarda-tion quality and geometric quality values >80 (Fig. 4e). Moreover,a cumulative c-axis frequency distribution in relation to EBSD vs. FAmethod-related misorientations reveal that less than 0.2% of allmethod-related misorientations are >7� and for 9 of the 13 samplesmore than97%of allmethod-relatedmisorientationsare<5� (Fig. 4f).The FA measurement precision inside each crystal is given by therange of c-axis misorientations and indicated by the slope of thefrequency distribution line (Fig. 4f). A precision <2� occurs for83e99% of all c-axis method-related misorientation measurements(Fig. 4f). The minimum c-axis method-related misorientation valuefor each crystal is constant for retardation and geometric qualitythresholds <80 (Fig. 4g) and the mean method-related misorienta-tion remains constant for the whole threshold range (Fig. 4h). Thestandard deviation (s) for the mean method-related misorientationand the maximum c-axis method-related misorientation for eachsample showa significantdecrease forquality thresholdsbetween70and 80 (Fig. 4i, j). Above a threshold of w75 method-relatedmisorientation maxima are generally below 10e15�.
5.2. Discussion
Peternell et al. (2009, 2010) suggested a combined geometricand retardation quality threshold of >75 to filter out larger c-axismisorientations. Within this study we are using the same thresholdbecause it doesn’t reduce the dataset (Fig. 4e) or the minimummethod-related misorientation (Fig. 4g). On the other hand,a combined geometric quality and retardation quality threshold>75 minimises the standard deviation of the mean c-axis method-related misorientation (Fig. 4h,i) and filters out the high method-related misorientations >10e15� (Fig. 4j).
The accuracy of the FA in comparison to EBSD is sufficiently goodfor CPO focused studies as method-related misorientations <7� for
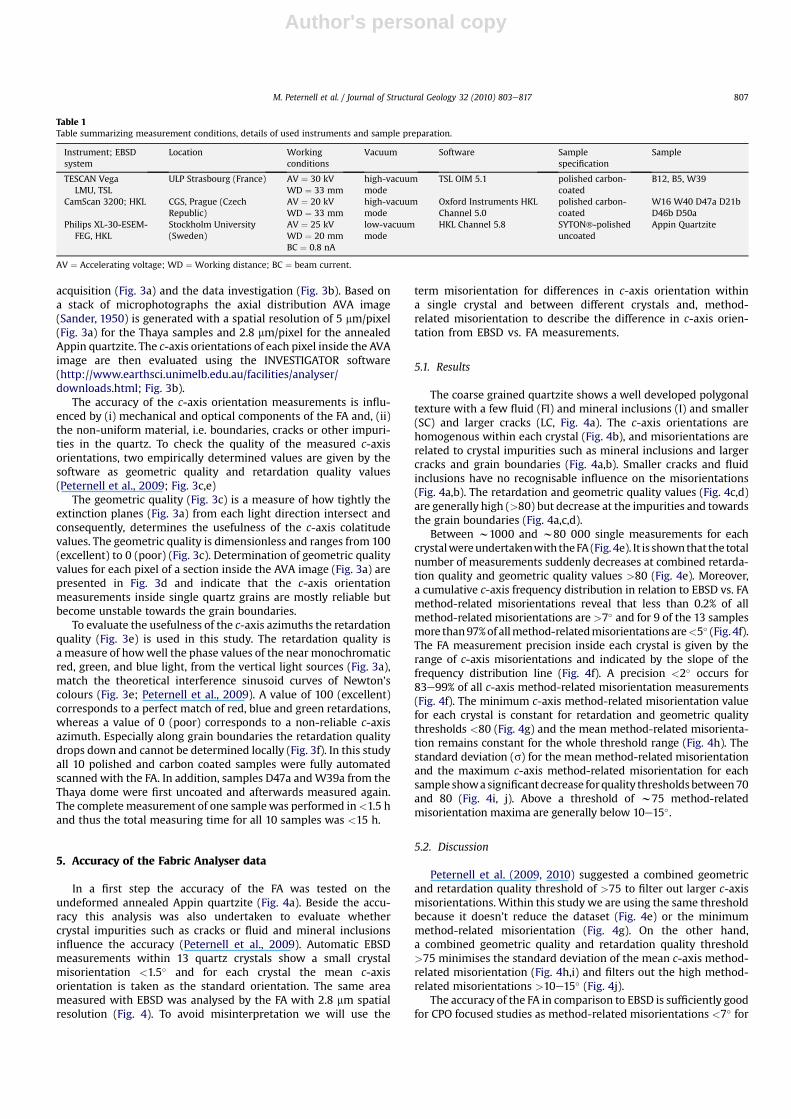
Table 1Table summarizing measurement conditions, details of used instruments and sample preparation.
Instrument; EBSDsystem
Location Workingconditions
Vacuum Software Samplespecification
Sample
TESCAN VegaLMU, TSL
ULP Strasbourg (France) AV ¼ 30 kVWD ¼ 33 mm
high-vacuummode
TSL OIM 5.1 polished carbon-coated
B12, B5, W39
CamScan 3200; HKL CGS, Prague (CzechRepublic)
AV ¼ 20 kVWD ¼ 33 mm
high-vacuummode
Oxford Instruments HKLChannel 5.0
polished carbon-coated
W16 W40 D47a D21bD46b D50a
Philips XL-30-ESEM-FEG, HKL
Stockholm University(Sweden)
AV ¼ 25 kVWD ¼ 20 mmBC ¼ 0.8 nA
low-vacuummode
HKL Channel 5.8 SYTON�-polisheduncoated
Appin Quartzite
AV ¼ Accelerating voltage; WD ¼ Working distance; BC ¼ beam current.
M. Peternell et al. / Journal of Structural Geology 32 (2010) 803e817 807
Author's personal copy
99.8% of all data and <5� for 9 of 13 samples (Fig. 4f). Method-related misorientations >10e15� are mainly caused by crystalimpurities such as large cracks mineral inclusions as well as
proximity to the grain boundaries (Fig. 4a,b) and are filtered out byusing a quality threshold of >75 (Fig. 4j). Because the FA usestransmitted light for calculating the c-axes the majority of the
Fig. 3. Flow chart that illustrates the two-stage process performed with the FA to construct an axial-distribution (AVA) diagram and the process to evaluate the c-axis orientation(modified after Wilson et al., 2007): (a) Stage 1: From light sources (LED) 1e4 and 8e11 a stack of 16 images is acquired, from LED 5e7 a stack of 24 images, as the two polarisers andthe retarder plate are rotated synchronously between 0� and 90� about the stationary mineral grain. The trace of the extinction plane that contains the c-axis with respect to the LEDposition is obtained from each stack and recorded. The c-axis orientation is determined from the 9 extinction planes and is presented in an AVA image for every pixel within theanalysed area. (b) Stage 2: The data acquired from the analytical instrument are then analysed with a separate software package called INVESTIGATOR. (c) Geometric quality (gq)evaluation; excellent (gq > 95), fair (gq > 65) and rejected (gq � 0); (d) geometric quality distribution map; (e) retardation quality evaluation; (f) retardation quality distributionmap.
M. Peternell et al. / Journal of Structural Geology 32 (2010) 803e817808

Author's personal copy
Fig. 4. Accuracy comparison between FA and EBSD c-axis orientation measurements undertaken on an undeformed quartz sample from the Appin quartzite (sample 35A, courtesyof H. Bergman). (a) Typical microstructure of the studied Appin Quartzite. Quartz grains are statistically recrystallised with polygonal shapes and straight boundaries meeting intriple point junctions (1000 � 1000 px large crossed polariser microphotograph), Analysed quartz crystals are outlined (white line); X marks a crystal that was not analysed. Whitearrows are pointing to internal impurities in the quartz crystals, FI ¼ fluid inclusion, I ¼mineral inclusion, SC ¼ small crack and LC ¼ large crack. (b) Axial distribution analysis (AVA)image from (a); c-axes are colour labelled regarding to the lockup table. (c) Geometric quality distribution map; (d) retardation quality distribution map. Note decrease of themeasurement quality at crystal impurities and towards grain boundaries. (eej) Statistical evaluation of EBSD vs. FA c-axis method-related misorientation measurements in form ofline plots showing the relation between quality results quality (retardation and geometric quality) and (e) number of measure points; (g) minimum, (h) mean, (i) standard deviation,(j) maximum difference between c-axis orientations using both methods.
M. Peternell et al. / Journal of Structural Geology 32 (2010) 803e817 809
Author's personal copy
higher method-related misorientations (w5e7�) might be relatedto small crystal impurities also located inside the crystal. Suchinternal impurities do not influence the EBSD measurements.Misorientations related to these small internal crystal impuritiescannot be filtered automatically with the currently used FA.
In the case of the Appin quartzite the misorientation withina single crystal is <2� and <1.5� measured with the FA (Fig. 4f) andEBSD respectively. This reveals the high precision of the FA. Theapplicability of the FA to measure very small crystal-internal c-axismisorientations (<1�) was not investigated within this study.Therefore, EBSD is seen as the favourable method for such highlyaccurate analysis. However, these very high accuracies are onlyrequired in very specific cases, e.g. analysing subgrain relationships.For standard quartz texture analysis, i.e. analysing the bulk textureof quartz domains the FA accuracy is sufficiently high.
6. EBSD and Fabric Analyser point to point comparison
Welleequilibratedmonomineralic rocks (as the Appin quartzite)are very useful to test the FA accuracy, but most rocks are
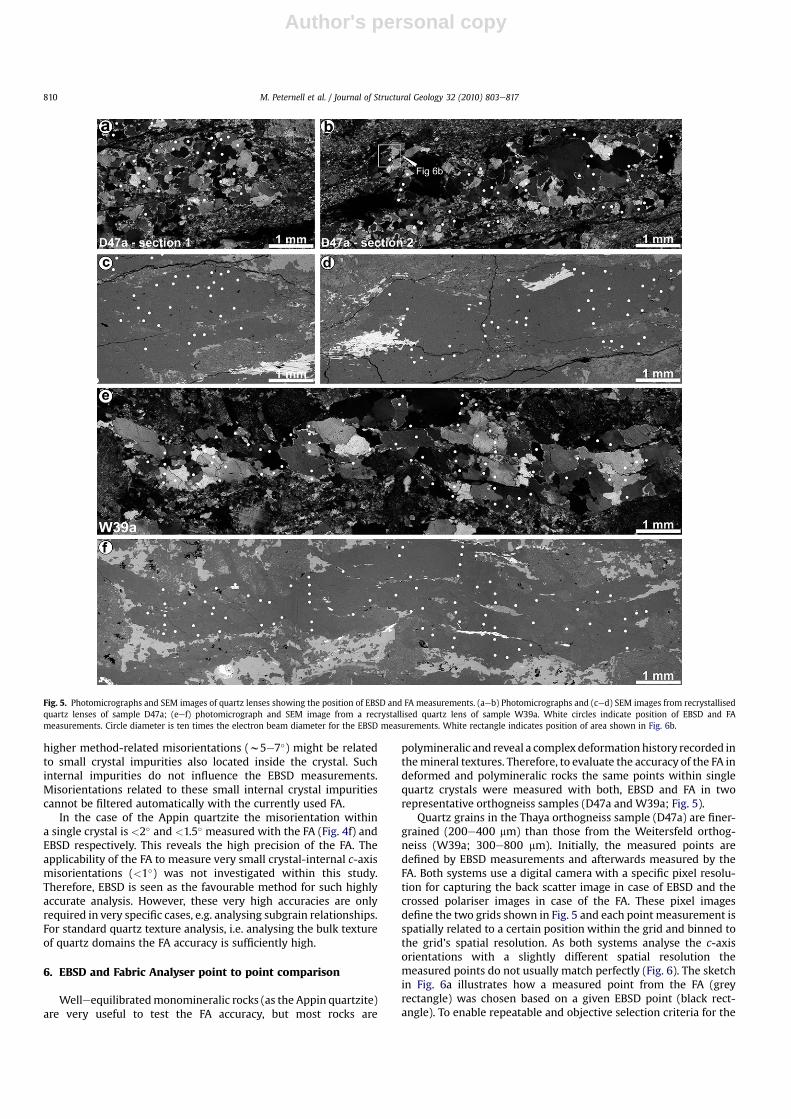
polymineralic and reveal a complex deformationhistory recorded inthemineral textures. Therefore, to evaluate the accuracy of the FA indeformed and polymineralic rocks the same points within singlequartz crystals were measured with both, EBSD and FA in tworepresentative orthogneiss samples (D47a and W39a; Fig. 5).
Quartz grains in the Thaya orthogneiss sample (D47a) are finer-grained (200e400 mm) than those from the Weitersfeld orthog-neiss (W39a; 300e800 mm). Initially, the measured points aredefined by EBSD measurements and afterwards measured by theFA. Both systems use a digital camera with a specific pixel resolu-tion for capturing the back scatter image in case of EBSD and thecrossed polariser images in case of the FA. These pixel imagesdefine the two grids shown in Fig. 5 and each point measurement isspatially related to a certain position within the grid and binned tothe grid’s spatial resolution. As both systems analyse the c-axisorientations with a slightly different spatial resolution themeasured points do not usually match perfectly (Fig. 6). The sketchin Fig. 6a illustrates how a measured point from the FA (greyrectangle) was chosen based on a given EBSD point (black rect-angle). To enable repeatable and objective selection criteria for the
Fig. 5. Photomicrographs and SEM images of quartz lenses showing the position of EBSD and FA measurements. (aeb) Photomicrographs and (ced) SEM images from recrystallisedquartz lenses of sample D47a; (eef) photomicrograph and SEM image from a recrystallised quartz lens of sample W39a. White circles indicate position of EBSD and FAmeasurements. Circle diameter is ten times the electron beam diameter for the EBSD measurements. White rectangle indicates position of area shown in Fig. 6b.
M. Peternell et al. / Journal of Structural Geology 32 (2010) 803e817810
Author's personal copy
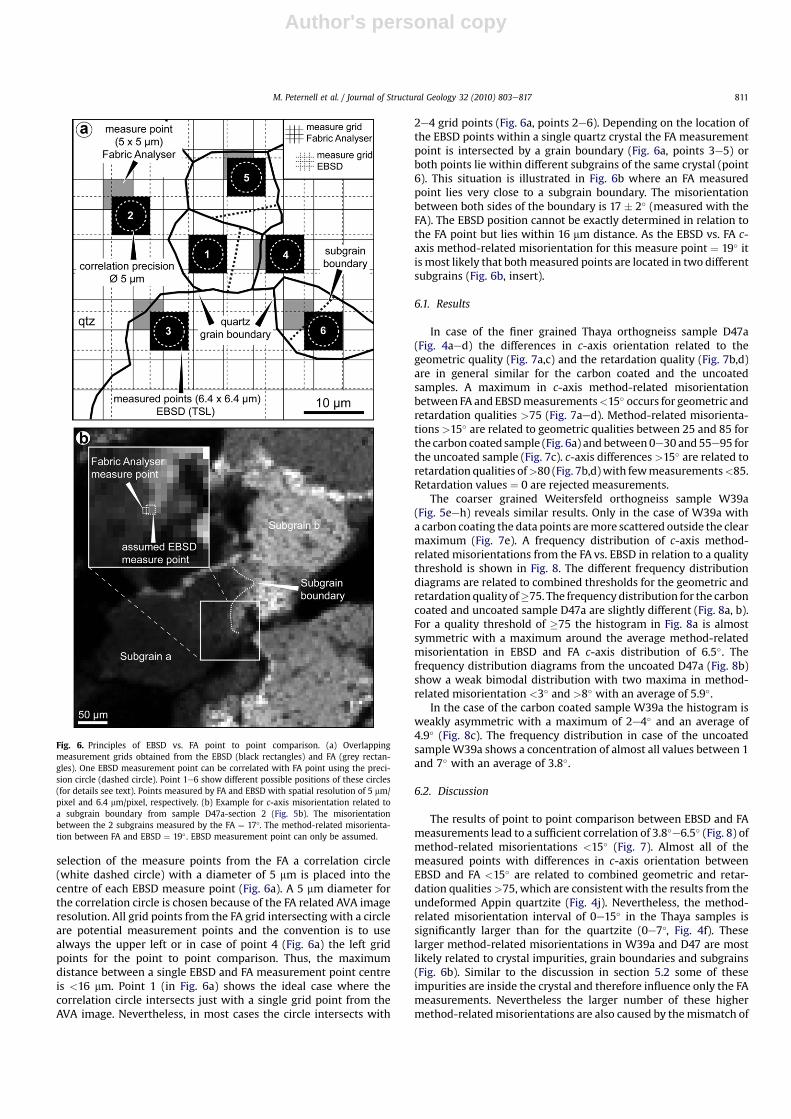
selection of the measure points from the FA a correlation circle(white dashed circle) with a diameter of 5 mm is placed into thecentre of each EBSD measure point (Fig. 6a). A 5 mm diameter forthe correlation circle is chosen because of the FA related AVA imageresolution. All grid points from the FA grid intersecting with a circleare potential measurement points and the convention is to usealways the upper left or in case of point 4 (Fig. 6a) the left gridpoints for the point to point comparison. Thus, the maximumdistance between a single EBSD and FA measurement point centreis <16 mm. Point 1 (in Fig. 6a) shows the ideal case where thecorrelation circle intersects just with a single grid point from theAVA image. Nevertheless, in most cases the circle intersects with
2e4 grid points (Fig. 6a, points 2e6). Depending on the location ofthe EBSD points within a single quartz crystal the FA measurementpoint is intersected by a grain boundary (Fig. 6a, points 3e5) orboth points lie within different subgrains of the same crystal (point6). This situation is illustrated in Fig. 6b where an FA measuredpoint lies very close to a subgrain boundary. The misorientationbetween both sides of the boundary is 17 � 2� (measured with theFA). The EBSD position cannot be exactly determined in relation tothe FA point but lies within 16 mm distance. As the EBSD vs. FA c-axis method-related misorientation for this measure point ¼ 19� itis most likely that bothmeasured points are located in two differentsubgrains (Fig. 6b, insert).
6.1. Results
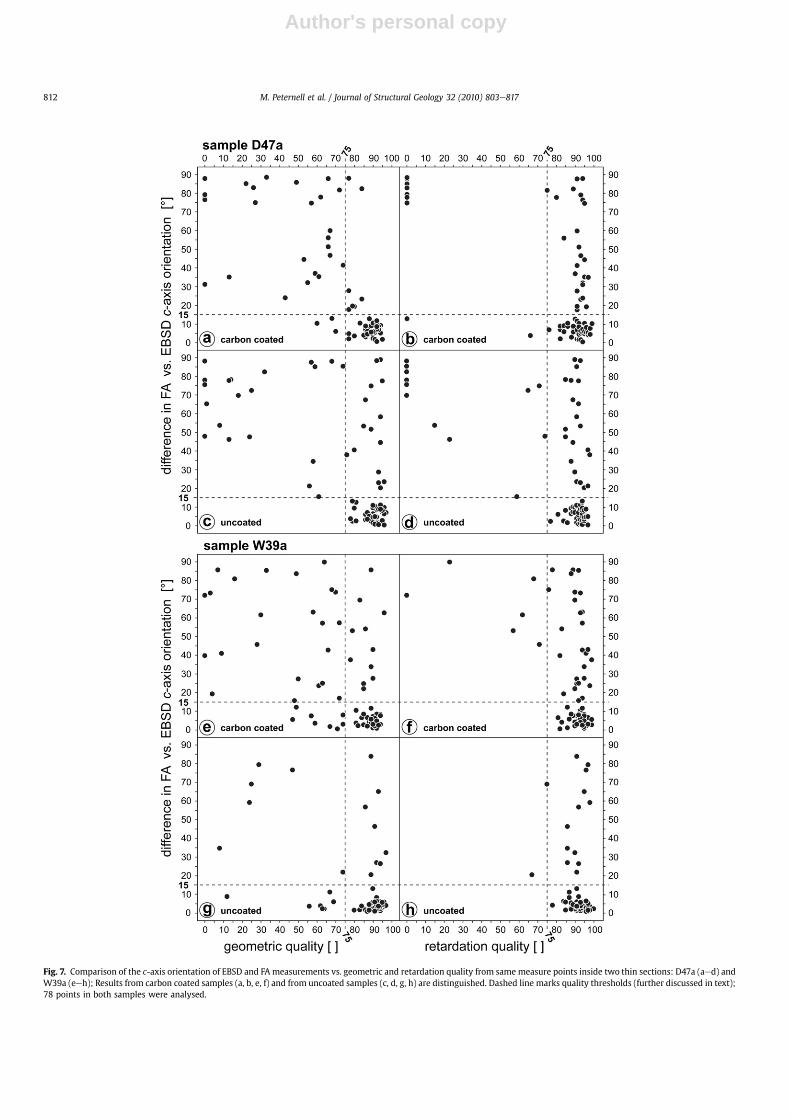
In case of the finer grained Thaya orthogneiss sample D47a(Fig. 4aed) the differences in c-axis orientation related to thegeometric quality (Fig. 7a,c) and the retardation quality (Fig. 7b,d)are in general similar for the carbon coated and the uncoatedsamples. A maximum in c-axis method-related misorientationbetween FA and EBSDmeasurements<15� occurs for geometric andretardation qualities >75 (Fig. 7aed). Method-related misorienta-tions >15� are related to geometric qualities between 25 and 85 forthe carbon coated sample (Fig. 6a) and between0e30 and55e95 forthe uncoated sample (Fig. 7c). c-axis differences >15� are related toretardation qualities of>80 (Fig. 7b,d)with fewmeasurements<85.Retardation values ¼ 0 are rejected measurements.
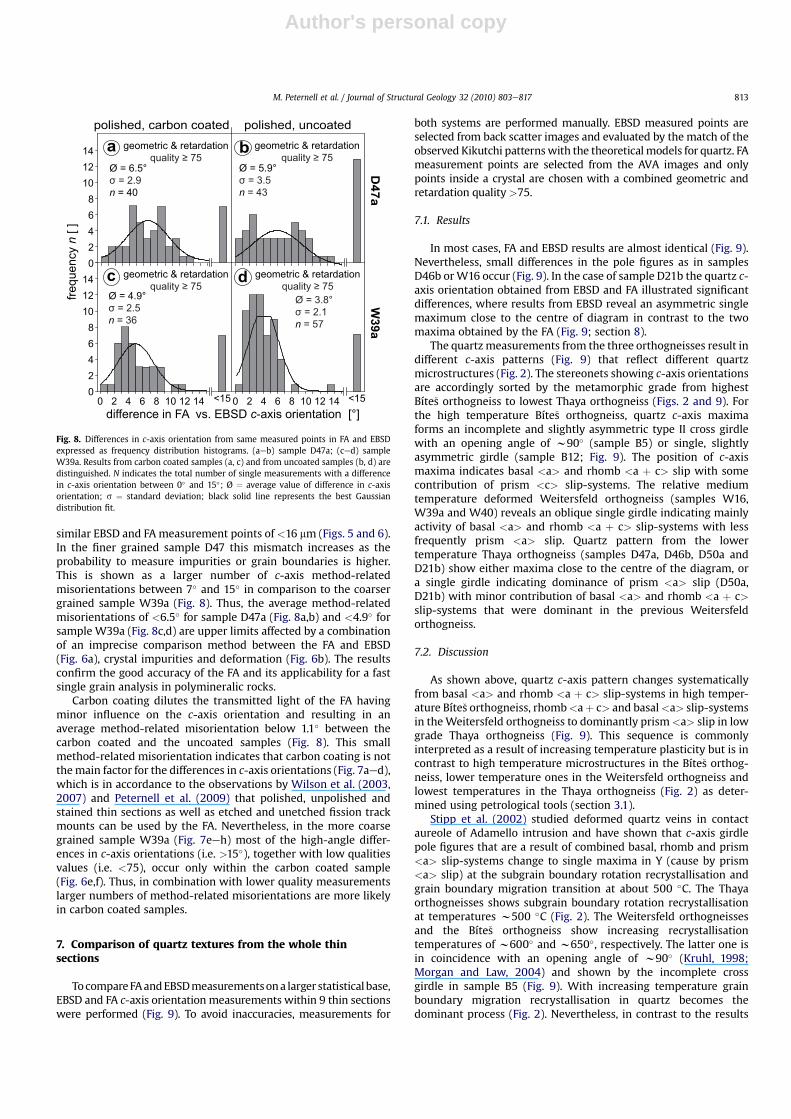
The coarser grained Weitersfeld orthogneiss sample W39a(Fig. 5eeh) reveals similar results. Only in the case of W39a witha carbon coating the data points aremore scattered outside the clearmaximum (Fig. 7e). A frequency distribution of c-axis method-related misorientations from the FA vs. EBSD in relation to a qualitythreshold is shown in Fig. 8. The different frequency distributiondiagrams are related to combined thresholds for the geometric andretardation quality of�75. The frequency distribution for the carboncoated and uncoated sample D47a are slightly different (Fig. 8a, b).For a quality threshold of �75 the histogram in Fig. 8a is almostsymmetric with a maximum around the average method-relatedmisorientation in EBSD and FA c-axis distribution of 6.5�. Thefrequency distribution diagrams from the uncoated D47a (Fig. 8b)show a weak bimodal distribution with two maxima in method-related misorientation <3� and >8� with an average of 5.9�.
In the case of the carbon coated sample W39a the histogram isweakly asymmetric with a maximum of 2e4� and an average of4.9� (Fig. 8c). The frequency distribution in case of the uncoatedsampleW39a shows a concentration of almost all values between 1and 7� with an average of 3.8�.
6.2. Discussion
The results of point to point comparison between EBSD and FAmeasurements lead to a sufficient correlation of 3.8�e6.5� (Fig. 8) ofmethod-related misorientations <15� (Fig. 7). Almost all of themeasured points with differences in c-axis orientation betweenEBSD and FA <15� are related to combined geometric and retar-dation qualities>75, which are consistent with the results from theundeformed Appin quartzite (Fig. 4j). Nevertheless, the method-related misorientation interval of 0e15� in the Thaya samples issignificantly larger than for the quartzite (0e7�, Fig. 4f). Theselarger method-related misorientations in W39a and D47 are mostlikely related to crystal impurities, grain boundaries and subgrains(Fig. 6b). Similar to the discussion in section 5.2 some of theseimpurities are inside the crystal and therefore influence only the FAmeasurements. Nevertheless the larger number of these highermethod-relatedmisorientations are also caused by themismatch of
Fig. 6. Principles of EBSD vs. FA point to point comparison. (a) Overlappingmeasurement grids obtained from the EBSD (black rectangles) and FA (grey rectan-gles). One EBSD measurement point can be correlated with FA point using the preci-sion circle (dashed circle). Point 1e6 show different possible positions of these circles(for details see text). Points measured by FA and EBSD with spatial resolution of 5 mm/pixel and 6.4 mm/pixel, respectively. (b) Example for c-axis misorientation related toa subgrain boundary from sample D47a-section 2 (Fig. 5b). The misorientationbetween the 2 subgrains measured by the FA ¼ 17�. The method-related misorienta-tion between FA and EBSD ¼ 19� . EBSD measurement point can only be assumed.
M. Peternell et al. / Journal of Structural Geology 32 (2010) 803e817 811
Author's personal copy
Fig. 7. Comparison of the c-axis orientation of EBSD and FA measurements vs. geometric and retardation quality from same measure points inside two thin sections: D47a (aed) andW39a (eeh); Results from carbon coated samples (a, b, e, f) and from uncoated samples (c, d, g, h) are distinguished. Dashed line marks quality thresholds (further discussed in text);78 points in both samples were analysed.
M. Peternell et al. / Journal of Structural Geology 32 (2010) 803e817812
Author's personal copy
similar EBSD and FAmeasurement points of<16 mm (Figs. 5 and 6).In the finer grained sample D47 this mismatch increases as theprobability to measure impurities or grain boundaries is higher.This is shown as a larger number of c-axis method-relatedmisorientations between 7� and 15� in comparison to the coarsergrained sample W39a (Fig. 8). Thus, the average method-relatedmisorientations of <6.5� for sample D47a (Fig. 8a,b) and <4.9� forsample W39a (Fig. 8c,d) are upper limits affected by a combinationof an imprecise comparison method between the FA and EBSD(Fig. 6a), crystal impurities and deformation (Fig. 6b). The resultsconfirm the good accuracy of the FA and its applicability for a fastsingle grain analysis in polymineralic rocks.
Carbon coating dilutes the transmitted light of the FA havingminor influence on the c-axis orientation and resulting in anaverage method-related misorientation below 1.1� between thecarbon coated and the uncoated samples (Fig. 8). This smallmethod-related misorientation indicates that carbon coating is notthemain factor for the differences in c-axis orientations (Fig. 7aed),which is in accordance to the observations by Wilson et al. (2003,2007) and Peternell et al. (2009) that polished, unpolished andstained thin sections as well as etched and unetched fission trackmounts can be used by the FA. Nevertheless, in the more coarsegrained sample W39a (Fig. 7eeh) most of the high-angle differ-ences in c-axis orientations (i.e. >15�), together with low qualitiesvalues (i.e. <75), occur only within the carbon coated sample(Fig. 6e,f). Thus, in combination with lower quality measurementslarger numbers of method-related misorientations are more likelyin carbon coated samples.
7. Comparison of quartz textures from the whole thinsections
TocompareFAandEBSDmeasurementsona larger statisticalbase,EBSD and FA c-axis orientation measurements within 9 thin sectionswere performed (Fig. 9). To avoid inaccuracies, measurements for
both systems are performed manually. EBSD measured points areselected from back scatter images and evaluated by the match of theobserved Kikutchi patternswith the theoretical models for quartz. FAmeasurement points are selected from the AVA images and onlypoints inside a crystal are chosen with a combined geometric andretardation quality>75.
7.1. Results
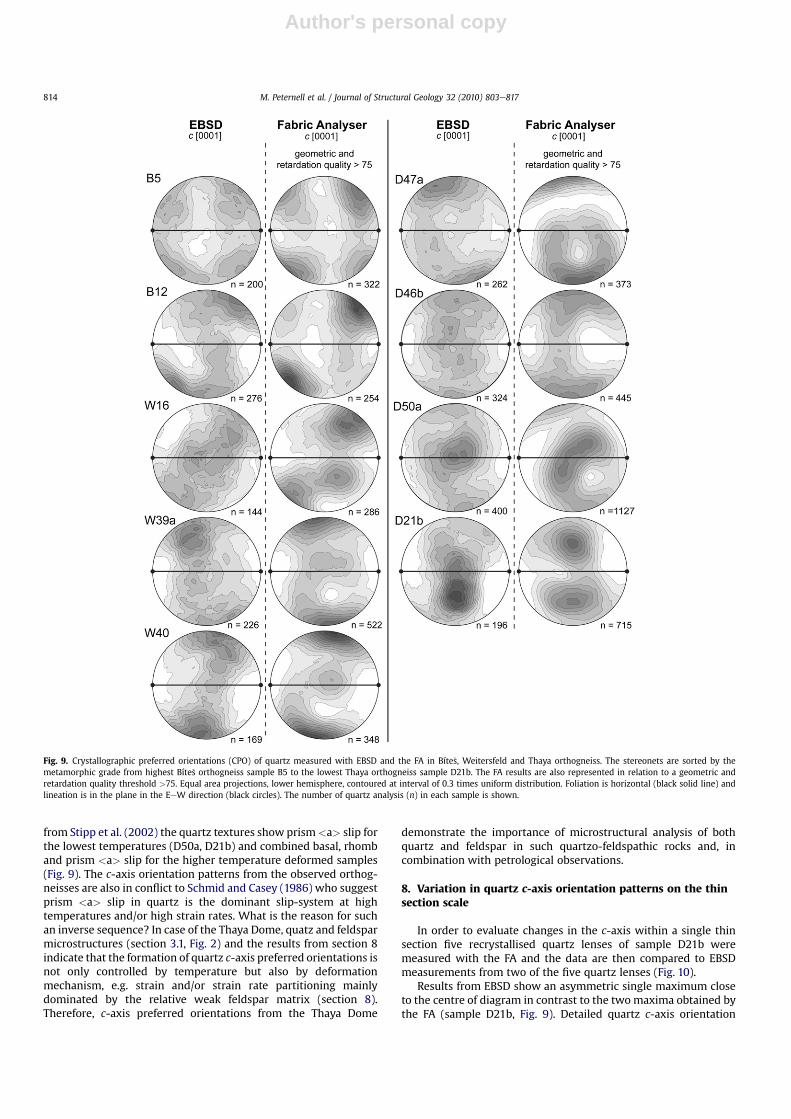
In most cases, FA and EBSD results are almost identical (Fig. 9).Nevertheless, small differences in the pole figures as in samplesD46b orW16 occur (Fig. 9). In the case of sample D21b the quartz c-axis orientation obtained from EBSD and FA illustrated significantdifferences, where results from EBSD reveal an asymmetric singlemaximum close to the centre of diagram in contrast to the twomaxima obtained by the FA (Fig. 9; section 8).
The quartzmeasurements from the three orthogneisses result indifferent c-axis patterns (Fig. 9) that reflect different quartzmicrostructures (Fig. 2). The stereonets showing c-axis orientationsare accordingly sorted by the metamorphic grade from highestBíte�s orthogneiss to lowest Thaya orthogneiss (Figs. 2 and 9). Forthe high temperature Bíte�s orthogneiss, quartz c-axis maximaforms an incomplete and slightly asymmetric type II cross girdlewith an opening angle of w90� (sample B5) or single, slightlyasymmetric girdle (sample B12; Fig. 9). The position of c-axismaxima indicates basal <a> and rhomb <a þ c> slip with somecontribution of prism <c> slip-systems. The relative mediumtemperature deformed Weitersfeld orthogneiss (samples W16,W39a and W40) reveals an oblique single girdle indicating mainlyactivity of basal <a> and rhomb <a þ c> slip-systems with lessfrequently prism <a> slip. Quartz pattern from the lowertemperature Thaya orthogneiss (samples D47a, D46b, D50a andD21b) show either maxima close to the centre of the diagram, ora single girdle indicating dominance of prism <a> slip (D50a,D21b) with minor contribution of basal <a> and rhomb <a þ c>slip-systems that were dominant in the previous Weitersfeldorthogneiss.
7.2. Discussion
As shown above, quartz c-axis pattern changes systematicallyfrom basal <a> and rhomb <a þ c> slip-systems in high temper-ature Bíte�s orthogneiss, rhomb<aþ c> and basal<a> slip-systemsin theWeitersfeld orthogneiss to dominantly prism<a> slip in lowgrade Thaya orthogneiss (Fig. 9). This sequence is commonlyinterpreted as a result of increasing temperature plasticity but is incontrast to high temperature microstructures in the Bíte�s orthog-neiss, lower temperature ones in the Weitersfeld orthogneiss andlowest temperatures in the Thaya orthogneiss (Fig. 2) as deter-mined using petrological tools (section 3.1).
Stipp et al. (2002) studied deformed quartz veins in contactaureole of Adamello intrusion and have shown that c-axis girdlepole figures that are a result of combined basal, rhomb and prism<a> slip-systems change to single maxima in Y (cause by prism<a> slip) at the subgrain boundary rotation recrystallisation andgrain boundary migration transition at about 500 �C. The Thayaorthogneisses shows subgrain boundary rotation recrystallisationat temperatures w500 �C (Fig. 2). The Weitersfeld orthogneissesand the Bíte�s orthogneiss show increasing recrystallisationtemperatures of w600� and w650�, respectively. The latter one isin coincidence with an opening angle of w90� (Kruhl, 1998;Morgan and Law, 2004) and shown by the incomplete crossgirdle in sample B5 (Fig. 9). With increasing temperature grainboundary migration recrystallisation in quartz becomes thedominant process (Fig. 2). Nevertheless, in contrast to the results
polished, uncoatedpolished, carbon coated
02468
101214
02468
101214
frequ
encyn
[ ]
D47a
<15 <152 4 6 8 1210 140 2 4 6 8 1210 140W39a
difference in FA vs. EBSD c-axis orientation [°]
a b
c d
geometric & retardation
Ø = 5.9°
n
geometric & retardation
Ø = 6.5°
n = 40
geometric & retardation
Ø = 4.9°
n
geometric & retardation
n
Fig. 8. Differences in c-axis orientation from same measured points in FA and EBSDexpressed as frequency distribution histograms. (aeb) sample D47a; (ced) sampleW39a. Results from carbon coated samples (a, c) and from uncoated samples (b, d) aredistinguished. N indicates the total number of single measurements with a differencein c-axis orientation between 0� and 15�; Ø ¼ average value of difference in c-axisorientation; s ¼ standard deviation; black solid line represents the best Gaussiandistribution fit.
M. Peternell et al. / Journal of Structural Geology 32 (2010) 803e817 813
Author's personal copy
from Stipp et al. (2002) the quartz textures show prism<a> slip forthe lowest temperatures (D50a, D21b) and combined basal, rhomband prism <a> slip for the higher temperature deformed samples(Fig. 9). The c-axis orientation patterns from the observed orthog-neisses are also in conflict to Schmid and Casey (1986) who suggestprism <a> slip in quartz is the dominant slip-system at hightemperatures and/or high strain rates. What is the reason for suchan inverse sequence? In case of the Thaya Dome, quatz and feldsparmicrostructures (section 3.1, Fig. 2) and the results from section 8indicate that the formation of quartz c-axis preferred orientations isnot only controlled by temperature but also by deformationmechanism, e.g. strain and/or strain rate partitioning mainlydominated by the relative weak feldspar matrix (section 8).Therefore, c-axis preferred orientations from the Thaya Dome
demonstrate the importance of microstructural analysis of bothquartz and feldspar in such quartzo-feldspathic rocks and, incombination with petrological observations.
8. Variation in quartz c-axis orientation patterns on the thinsection scale
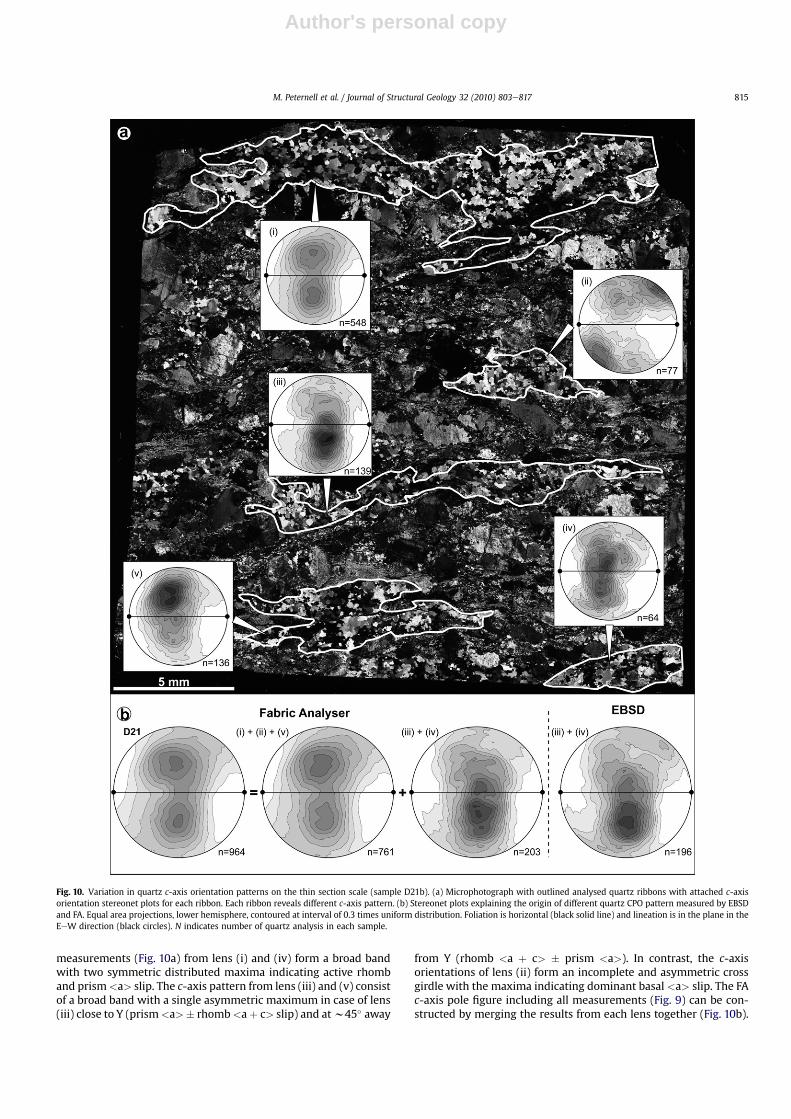
In order to evaluate changes in the c-axis within a single thinsection five recrystallised quartz lenses of sample D21b weremeasured with the FA and the data are then compared to EBSDmeasurements from two of the five quartz lenses (Fig. 10).
Results from EBSD show an asymmetric single maximum closeto the centre of diagram in contrast to the twomaxima obtained bythe FA (sample D21b, Fig. 9). Detailed quartz c-axis orientation
Fig. 9. Crystallographic preferred orientations (CPO) of quartz measured with EBSD and the FA in Bíte�s, Weitersfeld and Thaya orthogneiss. The stereonets are sorted by themetamorphic grade from highest Bíte�s orthogneiss sample B5 to the lowest Thaya orthogneiss sample D21b. The FA results are also represented in relation to a geometric andretardation quality threshold >75. Equal area projections, lower hemisphere, contoured at interval of 0.3 times uniform distribution. Foliation is horizontal (black solid line) andlineation is in the plane in the EeW direction (black circles). The number of quartz analysis (n) in each sample is shown.
M. Peternell et al. / Journal of Structural Geology 32 (2010) 803e817814
Author's personal copy
measurements (Fig. 10a) from lens (i) and (iv) form a broad bandwith two symmetric distributed maxima indicating active rhomband prism<a> slip. The c-axis pattern from lens (iii) and (v) consistof a broad band with a single asymmetric maximum in case of lens(iii) close to Y (prism<a>� rhomb<aþ c> slip) and atw45� away
from Y (rhomb <a þ c> � prism <a>). In contrast, the c-axisorientations of lens (ii) form an incomplete and asymmetric crossgirdle with the maxima indicating dominant basal <a> slip. The FAc-axis pole figure including all measurements (Fig. 9) can be con-structed by merging the results from each lens together (Fig. 10b).
Fig. 10. Variation in quartz c-axis orientation patterns on the thin section scale (sample D21b). (a) Microphotograph with outlined analysed quartz ribbons with attached c-axisorientation stereonet plots for each ribbon. Each ribbon reveals different c-axis pattern. (b) Stereonet plots explaining the origin of different quartz CPO pattern measured by EBSDand FA. Equal area projections, lower hemisphere, contoured at interval of 0.3 times uniform distribution. Foliation is horizontal (black solid line) and lineation is in the plane in theEeW direction (black circles). N indicates number of quartz analysis in each sample.
M. Peternell et al. / Journal of Structural Geology 32 (2010) 803e817 815
Author's personal copy
The merged c-axis texture from merging pole figure (iii) and (iv) isidentical to the results from the EBSD performed on the samequartz lenses (Fig. 10b).
The Thaya orthogneiss sample D21b is naturally deformed atw500 �C and quartz recrystallisation is controlled by subgrainboundary recrystallisation (Fig. 2). Deformation partitioning seemsto be the controlling factor for the heterogeneity in quartz c-axispreferred orientations within the sample. Importance of deforma-tion partitioning for interpretations of deformationmechanism andkinetics was already discussed by many authors (e.g. Knipe andLaw, 1987; Pauli et al., 1996; Schulmann et al., 1996). The Thayaorthogneiss samples emphasise that not only bulk microstructuresshould be taken in account, but also individual domains should beassessed separately, because of their different fabrics. Severalauthors emphasized the role of finite strain intensity on the tran-sient character of mineral textures in monomineralic mylonites(Herwegh et al., 1997; Heilbronner and Tullis, 2006). The latterauthors show that the basal <a> slip is characteristic for low strainintensities while the prism <a> reflects high strain component.Our study reflects similar evolution but related to various degree ofstrain partitioning related to the weak feldspar matrix activity (e.g.mentioned by Je�rábek et al., 2007). Because of its fast performanceand its ability to measure quartz c-axes direct on microphoto-graphs, the FA is an ideal tool to determine such heterogeneities instrain on the thin section scale.
9. Conclusions
Comparison between EBSD and FA bulk quartz c-axis orienta-tions using different methods lead to almost identical results.Moreover, single point c-axis orientationmeasurements showgoodangular accuracy of the FA. The average method-related misorien-tations between the two methods are in the range of 2.9�e5.5� incase of the Appin quartzite and 3.8�e6.5� for the Thaya orthog-neisses. Using the FA in the Appin quartzite the measured misori-entation across a single grain is<2� similar to the results from EBSDanalysis on the same grains. Larger spread in measured misorien-tations and method-related misorientations is related to crystalimpurities, subgrains boundaries and the spatial inaccuracy of thepoint to point comparison method. No special sample preparationis needed in the case of the FA, up to 10 � 10 cm sized uncoveredpolished or carbon coated samples can be used with the samequality results. However, only uniaxial minerals can be measured.FA geometric and retardation quality values are used to evaluateeach c-axis orientation. A combined threshold for these values >75lead to highest accuracy of the orientation data.
The FA can determine quartz CPOs of awhole thin sectionwithin<45 min (50 mm/pixel resolution),<1.5 h (5 mm/pixel resolution) or<8 h (2.8 mm/pixel resolution) and therefore, offers the onlypossibility to analyse whole thin sections with such a spatialresolution of 2.8e50 mm and sufficient accuracy for CPO basedstudies in a reasonable short time. Therefore, large datasets andtexture heterogeneities within the thin section scale can be easilyanalysed. Consequently, the FA offers a relatively inexpensive butstill accurate alternative to classical EBSD c-axis measurements inquartz.
Quartz CPOs from the Thaya orthogneisses reveal a clear trendfrom basal <a> and rhomb <a þ c> slip for high temperature,rhomb<a> and basal <a> slip for medium temperature and prism<a> slip for low temperature orthogneisses. This is a reversal of thesequence normally attributed to temperature and indicates thatquartz texture forming process is controlled by deformation ratherthan by temperature. Furthermore, this reverse textural evolutionon a regional scale has an important impact for textural interpre-tation in polymineralic rocks, i.e. as feldspar seems to be the
controlling factor for deformation partitioning. The results from theThaya orthogneisses suggest that in rocks which have undergonea complicated tectonometamorphic history, a robust interpretationof quartz c-axis orientations is necessary to enable an estimation ofdeformation temperatures and/or to determine deformation par-titioning in polymineralic rocks. In particular in quartzo-feldspaticrocks deformation partitioning causing heterogeneities in activateddeformation mechanisms and slip systems of quartz seems to bemore widespread than previously thought.
Acknowledgments
This work was financially supported by the grant from FrenchNational Agency (No. 06e1148784 to KS), Australian ResearchGrant (No. Dl 0773097 to MP and CW), the European ScienceFoundation (EUROCORES Programme, EuroMinSci, MinSubStrDyn,No. ERAS-CT-2003-980409 of the European Commission, FP6 toSP). We also thank the Knut och Alice Wallenberg stiftelse forfunding of the experimental setup. We would like to thank PatricieTýcová from Czech Geological Survey for careful preparation of thesamples for EBSD measurements. Helena Bergman from StockholmUniversity is thanked for the provision of the Appin Quartzitesample. We also thank Steve Reedy for his valuable review withmany constructive comments and suggestions for improving thispaper, and the Journal editor C. Passchier for his careful handling ofthe manuscript.
References
Adams, B.L., Wright, S.I., Kunze, K., 1993. Orientation imaging: the emergence ofa new microscopy. Metallurgical and Materials Transactions A 24, 819e831.
Bailey, E.H., Stevens, R.H., 1960. Selecting straining of K-feldspar and plagioclase onrock lobes and thin sections. American Mineralogist 45, 1020e1025.
Bascou, J., Barruol, G., Vauchez, A., Mainprice, D., Egydio-Silva, M., 2001. EBSD-measured lattice-preferred orientations and seismic properties of eclogites.Tectonophysics 342, 61e80.
Berek, M., 1924. Mikroskopische Mineralbestimmung mit Hilfe der Universal-drehtischmethode. Gebrüder Borntraeger, Berlin.
Blumenfeld, P., Mainprice, D., Bouchez, J.L., 1986. C-slip in quartz from subsolidusdeformed granite. Tectonophysics 127, 97e115.
Buntebarth, G., Voll, G., 1991. Quartz grain coarsening by collective crystallization incontact quartzites. In: Voll, G., Topel, J., Pattison, D.R.M., Seifert, F. (Eds.),Equilibrium and Kinetics in Contact Metamorphism: The Ballachulish IgneousComplex and its Aureole. Springer Verlag, Heidelberg, pp. 251e266.
Dell’Angelo, L.N., Tullis, J., 1989. Fabric development in experimentally shearedquartzites. Tectonophysics 169, 1e21.
Dudek, A., 1980. The crystalline basement block of the outer Carpathians inMoravia; Bruno-Vistulicum. Rozpravy �Ceskoslovenské Akademie 90, 85.
Fairbairn, H.W., 1949. Structural Petrology of Deformed Rocks. Addison-WesleyPress Inc., Cambridge.
Fueten, F., 1997. A computer-controlled rotating polarizer stage for the petrographicmicroscope. Computers & Geosciences 23, 203e208.
Fueten, F., Goodchild, J.S., 2001. Quartz c-axis orientation determination using therotating polarizer microscope. Journal of Structural Geology 23, 895e902.
Fynn, G.W., Powell, W.J.A., 1979. The Cutting and Polishing of Electro-Optic Mate-rials. Institute of Physics Publishing, Bristol.
Gleason, G.C., Tullis, J., Heidelbach, F., 1993. The role of dynamic recrystallization inthe development of lattice preferred orientations in experimentally deformedquartz aggregates. Journal of Structural Geology 15, 1145e1168.
Hasalová, P., Schulmann, K., Lexa, O., �Stípská, P., Hrouda, F., Ulrich, S., Haloda, J.,Týcová, P., 2008. Origin of migmatites by deformation-enhanced melt infiltra-tion of orthogneiss: a new model based on quantitative microstructural anal-ysis. Journal of Metamorphic Geology 26, 29e53.
Heilbronner, R.P., Pauli, C., 1993. Integrated spatial and orientation analysis of quartzc-axis by computer-aided microscopy. Journal of Structural Geology 15,369e382.
Heilbronner, R., Tullis, J., 2006. Evolution of c-axis pole figures and grain size duringdynamic recrystallization; results from experimentally sheared quartzite.Journal of Geophysical Research 111, B10202.
Herwegh, M., Handy, M.R., Heilbronner, R., 1997. Temperature- and strain-rate-dependent microfabric evolution in monomineralic mylonite: evidence from insitu deformation of norcamphor. Tectonophysics 280, 83e106.
Hobbs, B.E., 1968. Recrystallization of single crystals of quartz. Tectonophysics 6,353e401.
Je�rábek, P., Stünitz, H., Heilbronner, R., Lexa, O., Schulmann, K., 2007. Microstruc-tural deformation record of an orogen-parallel extension in the Vepor Unit,West Carpathians. Journal of Structural Geology 29, 1722e1743.
M. Peternell et al. / Journal of Structural Geology 32 (2010) 803e817816
Author's personal copy
Ji, S., Mainprice, D., 1988. Natural deformation fabrics of plagioclase: implicationsfor slip systems and seismic anisotropy. Tectonophysics 147, 145e163.
Knipe, R.J., Law, R.D., 1987. The influence of crystallographic orientation and grainboundary migration on microstructural and textural evolution in an SeCmylonite. Tectonophysics 135, 155e169.
Kruhl, J.H., 1998. Reply: prism- and basal-plane parallel subgrain boundaries inquartz a microstructural geothermobarometer. Journal of MetamorphicGeology 16, 142e146.
Lloyd, G.E., Schmidt, N.H., Mainprice, D., Prior, D.J., 1991. Crystallographic textures.Mineralogical Magazine 55, 331e345.
Menegon, L., Pennacchioni, G., Heilbronner, R., Pittarello, L., 2008. Evolution ofquartz microstructure and c-axis crystallographic preferred orientation withinductilely deformed granitoids (Arolla unit, Western Alps). Journal of StructuralGeology 30, 1332e1347.
Morgan, S.S., Law, R.D., 2004. Unusual transition in quartzite dislocation creepregimes and crystal slip systems in the aureole of the Eureka Valley-Joshua Flat-Beer Creek pluton, California: a case for anhydrous conditions created bydecarbonation reactions. Tectonophysics 384, 209e231.
Mørk, M.B.E., Moen, K., 2007. Compaction microstructures in quartz grains andquartz cement in deeply buried reservoir sandstones using combined petrog-raphy and EBSD analysis. Journal of Structural Geology 29, 1843e1854.
Pattison, D.R.M., Harte, B., 1997. The geology and evolution of the Ballachulishigneous complex and aureole. Scottish Journal of Geology 33, 1e29.
Pauli, C., Schmid, S.M., Heilbronner, R., 1996. Fabric domains in quartz mylonites:localized three dimensional analysis of microstructure and texture. Journal ofStructural Geology 18, 1183e1203.
Peternell, M., Bitencourt, M.F., Kruhl, J.H., Stäb, C., 2010. Macro and microstructuresas indicators of the development of syntectonic granitoids and host rocks in theCamboriú region, Santa Catarina, Brazil. Journal of South American EarthSciences 29, 738e750.
Peternell, M., Kohlmann, F., Wilson, C.J.L., Seiler, C., Gleadow, A.J.W., 2009. A newapproach to crystallographic orientation measurement for apatite fission trackanalysis: Effects of crystal morphology and implications for automation.Chemical Geology 265, 527e539.
Prior, D.J., 2009. EBSD in the earth sciences: application, common practice andchallenges. In: Schwartz, A.J., Kumar, M., Adams, B.L., Field, D.P. (Eds.), ElectronBackscatter Diffraction in Materials Science. Springer Science and BusinessMedia, New York, pp. 345e360.
Prior, D.J., Boyle, A.P., Brenker, F., Cheadle, M., Day, A., Lopez, G., Peruzzo, L., Potts, G.J.,Reddy, S., Spiess, R., Timms, N.E., Trimby, P., Wheeler, J., Zetterström, L., 1999. Theapplicationof electronbackscatterdiffractionandorientation contrast imaging inthe SEM to textural problems in rocks. American Mineralogist 84, 1741e1759.
Prior, D.J., Wheeler, J., 1999. Feldspar fabrics in a greenschist facies albite-richmylonite from electron backscatter diffraction. Tectonophysics 303, 29e49.
Reinhard, M., 1931. Universal-Drehtischmethode. B.Wedf & Cie, Basel.Romeo, I., Capote, R., Lunar, R., Cayzer, N., 2007. Polymineralic orientation analysis
of magmatic rocks using electron back-scatter diffraction: implications forigneous fabric origin and evolution. Tectonophysics 444, 45e62.
Sander, B., 1930. Gefügekunde der Gesteine. Springer-Verlag, Wien.Sander, B., 1950. Einfuehrung in die Gefuegekunde der Geologischen Koerper;
Zweiter Teil, Die Korngefuege. Springer-Verlag, Wien-Innsbruck.Schmid, S.M., Casey, M., 1986. Complete fabric analysis of some commonly
observed quartz [c]-axis patterns. In: Hobbs, B.E., Heard, H.C. (Eds.), Mineraland Rock Deformation: Laboratory Studies. Geophysical Monographs 36, pp.263e288.
Schulmann, K., 1990. Fabric and kinematics study of the Bites orthogneiss (south-west Moravia): result of large-scale northeastward shearing parallel to theMoldanubian/Moravian boundary. Tectonophysics 177, 229e244.
Schulmann, K., Ml�coch, B., Melka, R., 1996. High-temperature microstructures andrheology of deformed granite, Erzgebirge, Bohemian Massif. Journal of Struc-tural Geology 18, 719e733.
Schulmann, K., Lobkowicz, M., Melka, R., Fritz, H., 1995. Moravo-Silesian zone;Allochthonous units; structure. In: Dallmeyer, R.D., Franke, W., Weber, K. (Eds.),Pre-permian Geology of Central and Eastern Europe, pp. 530e540. IGCP 233international conference, Goettingen.
Schulmann, K., Melka, R., Lobkowicz, M., Ledru, P., Lardeaux, J.M., Autran, A., 1994.Contrasting styles of deformation during progressive nappe stacking at thesouth-eastern margin of the Bohemian Massif (Thaya Dome). Journal ofStructural Geology 16, 355e370.
Schwarzer, R.A., Hjelen, J., 2010. High-speed orientation microscopy with offlinesolving sequences of EBSD patterns. In: Klein, H., Schwarzer, R.A. (Eds.), Textureand Anisotropy of Polycrystals III. Trans Tech Publications, Switzerland, pp.295e300.
Stipp, M., Kunze, K., 2008. Dynamic recrystallization near the brittle-plastic tran-sition in naturally and experimentally deformed quartz aggregates. Tectono-physics 448, 77e97.
Stipp, M., Stünitz, H., Heilbronner, R., Schmid, S.M., 2002. The eastern Tonale faultzone: a ‘natural laboratory’ for crystal plastic deformation of quartz overa temperature range from 250 to 700 �C. Journal of Structural Geology 24,1861e1884.
�Stípská, P., Schulmann, K., 1995. Inverted metamorphic zonation in a basement-derived nappe sequence, eastern margin of the Bohemian Massif. GeologicalJournal 30, 385e413.
�Stípská, P., Schulmann, K., Höck, V., 2000. Complex metamorphic zonation of theThaya Dome; result of buckling and gravitational collapse of an imbricatednappe sequence. In: Cosgrove, J.W., Ameen, M.S. (Eds.), Forced Folds and Frac-tures. Geological Society Special Publication 169, pp. 197e211. London.
Suess, F.E., 1912. Die moravische fenster und ihre beziehung zum grundgebirge deshohen gesenkes. Akademie der Wissenschaften, Denkschrift Matematisch-Naturwissenschaftliche Klasse 88, 541e631.
Tullis, J., 1977. Preferred orientation of quartz produced by slip during plane strain.Tectonophysics 39, 87e102.
Turner, F.J., Weiss, L.E., 1963. Structural Analysis of Metamorphic Tectonites.McGraw-Hill Book Company, New York.
Ulrich, S., Schulmann, K., Casey, M., 2002. Microstructural evolution and rheologicalbehaviour of marbles deformed at different crustal levels. Journal of StructuralGeology 24, 979e995.
Ullemeyer, K., Braun, G., Dahms, M., Kruhl, J.H., Olesen, N.Ø., Siegesmund, S., 2000.Texture analysis of a muscovite-bearing quartzite: a comparison of somecurrently used techniques. Journal of Structural Geology 22, 1541e1557.
Vernooij, M.G.C., den Brok, B., Kunze, K., 2006. Development of crystallographicpreferred orientations by nucleation and growth of new grains in experimen-tally deformed quartz single crystals. Tectonophysics 427, 35e53.
Wenk, H.R., Bunge, H.J., Jansen, E., Pannetier, J., 1986. Preferred orientation of pla-gioclaseeneutron diffraction and U-stage data. Tectonophysics 126, 271e284.
Wenk, H.R., Kern, H., Schaefer, W., Will, G., 1984. Comparison of neutron and X-raydiffraction in texture analysis of deformed carbonate rocks. Journal of StructuralGeology 6, 687e692.
Wilson,C.J.L., Russell-Head,D.S., Kunze,K., Viola,G., 2007. Theanalysis of quartz c-axisfabrics using a modified optical microscope. Journal of Microscopy 227, 30e41.
Wilson, C.J.L., Russell-Head, D.S., Sim, H.M., 2003. The application of an automatedFA system to the textural evolution of folded ice layers in shear zones. Annals ofGlaciology 37, 7e17.
Wilson, C.J.L., Robinson, J.A., Dugdale, A.L., 2009. Quartz vein fabrics coupled toelevated fluid pressures in the Stawell gold deposit, South-Eastern Australia.Mineral Deposita 44, 245e263.
M. Peternell et al. / Journal of Structural Geology 32 (2010) 803e817 817