SC420 - Sound Level Meter Spectrum Analyser
176
SC420 Sound Level Meter Spectrum Analyser USER MANUAL M_SC420_v0014_20150522_ENG
-
Upload
khangminh22 -
Category
Documents
-
view
0 -
download
0
Transcript of SC420 - Sound Level Meter Spectrum Analyser

SC420 Sound Level Meter
Spectrum Analyser
USER MANUAL M_SC420_v0014_20150522_ENG


1
Since its beginnings in Barcelona in 1969, has been devoted to manufacturing sound equipment and instrumentation through research, development and innovation, and by registering its own patents.
We belong to national and international committees for the establishment and revision of standards and regulations.
has a fast and efficient distribution network in over 40 countries around the world.
We offer our customers an after-sales service to ensure the long life of our instruments. Periodic tests and calibration services are also available.
Our website is the focal point for finding information on our products, requesting no-obligation quotes, downloading software, contacting us and being kept updated about all the training events and exhibitions we are present at on a regular basis.
Taking care of our customers and listening to what they tell us means we are closer to them and are able to offer the measurement solution that fully meets their needs.
The Bluetooth trademark is the property of Bluetooth SIG, Inc.

2 Contents
1. What does this manual cover? 8
2. Equipment and literature 9
3. General device description 10
3.1 SC420 sound level meter spectrum analyser 10
3.2 Main features of the SC420 11
3.3 Device components 14
4. Inputs and outputs 16
4.1 SC420 inputs and outputs 16
4.2 Communications inputs and outputs 17
4.3 AC Output 17
4.4 Digital inputs and outputs 17
5. Keypad 19
6. Screen 21
6.1 Indicator area 21
6.2 Work area 23
6.3 Timing area 23
6.4 Memory area 24
6.5 Contextual area 24
7. Power 25
7.1 Power sources 25
7.1.1 Battery power 25
7.1.2 Power via USB 26
7.1.3 Mains feeder 26
7.2 Energy saving 26
7.3 Power for environmental monitoring 26
8. Assembling and dismantling the device 28
8.1 Windscreen 28
8.2 Extension cable 29
8.2.1 Removing and connecting the preamplifier 29
8.2.2 Connecting the extension cable 30
8.3 Outdoor kit 31
Contents

Contents 3
9. Switching the device on and off 32
9.1 Switching the device on 32
9.1.1 Initial SC420 self-check 33
9.2 Turning the device off 34
9.3 Switching the light on and off 34
10. Checking the device 35
10.1 Checking the SC420 35
11. Measuring and recording 37
11.1 Prior steps 37
11.2 Taking a measurement 38
11.3 Making a recording 38
11.4 Overload indicator 39
11.5 Under-range indicator 40
12. Menu 41
12.1 Accessing the menu 41
12.2 Menu areas 42
12.3 Navigating through the menu 42
13. Measurement modes 43
13.1 Selecting the measurement mode 43
13.2 Sound level meter mode 44
13.2.1 Sound level meter mode functions 44
13.2.2 Sound level meter mode prior adjustments 45
13.2.3 Sound level meter mode screens 45
13.3 1/1 spectrum analyser mode (OPTIONAL) 48
13.3.1 1/1 spectrum analyser mode functions 48
13.3.2 1/1 spectrum analyser mode prior adjustments 49
13.3.3 1/1 spectrum analyser mode screens 49
13.4 1/3 spectrum analyser mode (OPTIONAL) 52
13.4.1 Spectrum analyser mode 1/3 functions 53
13.4.2 1/3 spectrum analyser mode prior adjustments 53
13.4.3 1/3 spectrum analyser mode screens 53
13.5 Octave (1/1) and third octave (1/3) band reverberation time (interrupted noise method) modes (OPTIONAL) 57
13.5.1 Octave (1/1) and third octave (1/3) band reverberation time (interrupted noise method) mode functions 57
13.5.2 Taking a measurement in octave (1/1) and third octave (1/3) band reverberation time (interrupted noise method) modes 58
13.5.3 Screens in the octave (1/1) and third octave (1/3) band reverberation time (interrupted noise method) modes 59
13.6 Octave (1/1) and third octave (1/3) band reverberation time (integrated impulse response method) modes (OPTIONAL) 62

4 Contents
13.6.1 Octave (1/1) and third octave (1/3) band reverberation time (integrated impulse response method) mode functions 63
13.6.2 Taking a measurement in octave (1/1) and third octave (1/3) band reverberation time (integrated impulse response method) modes 63
13.6.3 Octave (1/1) and third octave (1/3) band reverberation time (integrated impulse response method) mode screens 65
13.7 Occupational noise mode (OPTIONAL) 68
13.7.1 Occupational noise mode functions 68
13.7.2 Occupational noise mode prior adjustments 68
13.7.3 Occupational noise mode screens 69
13.8 FFT frequency analyser mode (OPTIONAL) 71
13.8.1 Taking an FFT measurement 71
13.8.2 FFT frequency analysis mode screen 72
13.9 Audio recording mode (analysis quality) (OPTIONAL) 73
13.9.1 Making an audio recording (analysis quality) 73
14. Advanced options 75
14.1 Zoom 75
14.2 Backerase 76
14.3 Marking 77
14.4 Voice comments 78
14.5 Audio recording (listening quality) 79
14.6 Automatic settings: Timers and triggers 80
14.6.1 Start measurement/recording automatically 80
14.6.2 Automatically stop measuring/recording 81
14.6.3 Automatic audio recording 83
14.6.4 DEN intervals 84
14.6.5 Examples of automatic measurement settings 85
15. Settings and adjustments 90
15.1 Accessing the settings sub-menu 90
15.2 Navigating through the settings sub-menu 90
15.3 Settings sub-menu 91
15.3.1 MEASUREMENT option 91
15.3.2 RECORDING option 93
15.3.3 AUTOMATISMS option 95
15.3.4 DATE AND TIME option 98
15.3.5 MICROPHONE SETTING option 98
15.3.6 CONTRAST option 100
15.3.7 AC OUTPUT option 100
15.3.8 BLUETOOTH® wireless communication/PRINTER
option 101
16. Registers and memory management 102

Contents 5
16.1 Saving a final result 102
16.2 Making a recording 105
16.2.1 Types of recording 105
16.3 Structure of a register 111
16.4 Viewing and deleting registers 112
16.4.1 Viewing registers 113
16.4.2 Deleting registers 114
16.5 Deleting the card memory 114
17. Using the inputs and outputs 115
17.1 Digital inputs and outputs and AC output 115
17.1.1 AC Output 115
17.1.2 Digital input 116
17.1.3 Digital output 116
17.2 Communicating with a PC, downloading data and communicating with a printer 117
17.2.1 Memory card 117
17.2.2 RS-232 communications 118
17.2.3 USB communications 119
17.2.4 Bluetooth® wireless communication 119
17.3 PC software 120
18. Accessories 121
18.1 Accessories supplied 121
18.2 Optional accessories 121
19. Technical specifications 123
19.1 REFERENCE CONDITIONS 123
19.2 MICROPHONES AND PREAMPLIFIERS 124
19.2.1 Microphone models and their main features 124
19.2.2 Sound field correction for periodic tests 124
19.2.3 Frequency response 129
19.2.4 Directional response 135
19.2.5 Effect of the optional accessories on the microphone136
19.2.6 Preamplifier connector 137
19.3 MEASUREMENT 137
19.3.1 Warm-up time 137
19.3.2 Measurement range 138
19.3.3 Linearity range 138
19.3.4 Noise 139
19.3.5 Information for testing compliance withdrawn standards IEC 60651 and IEC 60804 140
19.3.6 Time and clock features 141
19.3.7 Frequency weighting 141
19.4 CALIBRATION 142
19.5 OCTAVE AND THIRD OCTAVE BAND FILTERS 143
19.5.1 Octave and third octave band filters 143
6 Contents
19.5.2 Measurement range (octave band spectrum analyser)144
19.5.3 Measurement range (third octave spectrum analyser)145
19.6 REVERBERATION TIME 146
19.6.1 Measuring the decay curve and impulse response 146
19.6.2 Calculating the decay curve from the impulse response 146
19.6.3 Estimating the slope of the decay curve 146
19.6.4 Reverberation time measurement lower limit 146
19.6.5 Quality indicators 146
19.6.6 Lower limit for reliable results obtained through a filter and a detector 146
19.7 FFT 147
19.8 AUDIO RECORDING 147
19.9 ENVIRONMENTAL, ELECTROSTATIC AND RADIO FREQUENCY CRITERIA 148
19.9.1 Stabilisation time 148
19.9.2 Environmental criteria 148
19.9.3 Electrostatic criteria 148
19.9.4 Criteria for fields at the frequency of the mains supply and radio frequency fields 148
19.9.5 Influence of vibrations 149
19.10 INPUTS AND OUTPUTS 150
19.10.1 AC Output 150
19.10.2 Digital output 151
19.10.3 Digital input 151
19.10.4 MicroSD memory card slot 152
19.10.5 USB communication 152
19.10.6 RS-232 serial communication 152
19.10.7 Wireless communication 152
19.11 SCREEN 152
19.12 POWER 153
19.12.1 Batteries 153
19.12.2 External Supply 153
19.13 DIMENSIONS AND WEIGHT 153
19.14 STANDARDS 153
19.14.1 Standards 153
19.14.2 Standards of measurement and calculation 154
19.14.3 Certificates 154
19.14.4 Notes 154
20. Maintenance and precautions 155
21. Guidance on taking measurements 157
22. Activating optional modes 158
23. Functions 159
23.1 Function nomenclature 159

Contents 7
23.1.1 Sound level meter mode functions 159
23.1.2 1/1 spectrum analyser mode functions 161
23.1.3 1/3 Spectrum analyser mode functions 162
23.1.4 Octave (1/1) and third octave (1/3) band reverberation time mode functions 164
23.1.5 Occupational noise mode functions 165
23.1.6 FFT analyser mode functions 165
23.2 Function description 166
23.2.1 Sound pressure level with Fast and Slow time weightings 166
23.2.2 Sound pressure level with Impulse time weighting 167
23.2.3 Peak sound pressure level 167
23.2.4 Equivalent continuous sound pressure level 167
23.2.5 Taktmaximal-Mittelungspegel 168
23.2.6 Sound exposure level (SEL) 168
23.2.7 Percentile levels 169
23.2.8 Decay curve 169
23.2.9 Impulse response 169
23.2.10 Integrated impulse response method 169
23.2.11 Reverberation Time 169
23.2.12 Quality parameters (ξ , C and B·T values) 170
23.2.13 Equivalent daily noise exposure level 171
23.2.14 Sound exposure 171
23.2.15 Dose 171

8 Chapter 1 What does this manual cover?
This manual contains all the information you will need to get the most out of the device you have just purchased.
This information is divided into 7 sections:
The first section has chapters on the main features of the device and its physical components (chapters 3, 4, 5, 6, 7 and 8).
The second presents how the device can be used to take measurements, whether in sound level meter mode, spectrum analyser mode, reverberation time mode, etc. (chapters 9, 10, 11, 12 and 13).
The third section presents the device's range of advanced options, which make this a versatile tool that closely adapts to the needs of each user (chapter 14).
The fourth section focuses on configuring the device: menu structure and directions for carrying out the various adjustments (chapters 15 and 16).
In the fifth section, other important topics are covered, such as connecting to a PC, accessories (chapters 17 and 18).
The sixth section contains the technical specifications that explain the equipment you are working with in detail (chapter 19).
Finally, the seventh section encompasses several chapters that provide information such as: Maintenance and precautions, guidance on taking measurements, function nomenclature and descriptions, etc. (chapters 20, 21, 22 and 23).
What does this manual cover?
1. What does this manual cover?
1
NOTE: If you are already familiar with the device and only wish to consult the information on taking measurements, please see chapters 9, 10, 11, 12 and 13.

Chapter 2 Equipment and literature 9
The first step is to check that all the equipment and literature supplied with the device is there:
Material:
SC420 sound level meter
PV009 windscreen
Two AA size 1.5 V alkaline batteries (LR6)
CN400 USB-to-micro-USB cable for communication with a PC
MicroSD memory card
PC communication software to download, display and edit data: Lab
Literature included:
Sound level meter user's manual
Warranty
Should any of these elements be missing, please contact your official distributor.
Equipment and literature
2. Equipment and literature
2

10 Chapter 3 General description of the device
This chapter provides a general description of the SC420 sound level meter. This description will introduce you to all the possibilities offered by the SC420 and its main features. It will also help you to identify the various components of the device.
3.1 SC420 sound level meter spectrum analyser
The SC420 is more than a sound measuring instrument — it is the ideal tool for the noise professional thanks to its high capacity, versatility and ease of use.
The SC420 is a sound level meter that meets the specifications of IEC 61672 international standard for class 1 (see table) for both response to sound waves incident on the microphone in the reference direction in a free field and for response to randomly incident waves in a diffuse field (sound field correction configured for diffuse field).
The SC420 also meets American standards ANSI S1.4 and ANSI S1.43, as class 1 (see table), for sounds from several angles (sound field correction configured for diffuse field):
MICROPHONE ASSOCIATED PREAMPLIFIER CLASS according to IEC 61672-1 and ANSI
C-130 PA020 1
C140 PA020 1
C240 PA040 1
The basic version of the SC420 disposes the SOUND LEVEL METER measurement mode. It also offers the possibility of extension with different modules:
Real time spectrum analyser module in octave bands (1/1) with class 1 filters as per standard IEC 61260
Real time spectrum analyser module in third octave bands (1/3) with class 1 filters as per standard IEC 61260
Reverberation time measurement (interrupted noise method) module (in 1/1 octave and third octave 1/3 bands)
Reverberation time measurement (integrated impulse response method) module (in 1/1 octave and third octave 1/3 bands)
General device description
3. General device description
3

Chapter 3 General description of the device 11
Occupational Noise functions evaluation module
FFT narrow band frequency analysis module
Analysis quality audio recording module
When used with the appropriate modules, the SC420 is a sound level meter that you can use to take any kind of measurement: measurements of acoustic insulation and reverberation time in buildings, measurement of environmental parameters (tonal, impulsive and low frequency components), analysis of industrial noise produced by machinery, exposure noise evaluations, etc.
Its ergonomic form means it can be used as both a hand-held instrument for in-situ measurements and as a device for carrying out continuous noise monitoring.
The SC420 has advanced features such as: audio recording for recognition and reanalysis, automatic start and stop functions for measuring and audio recording by timers and threshold, extendible memory through cards, Backerase, USB connectivity, Bluetooth® wireless communication and 3G, ADSL, Wi-Fi communication capabilities, etc.
3.2 Main features of the SC420
The SC420 it is a high performance sound level meter with the following main features:
THE PHILOSOPHY:
The SC420 keeps the philosophy of producing instruments that are powerful, simple and easy to use.
Single range: no need for prior configuration of the SC420 measurement range to match the dynamic range of the sound event to be measured.
In each of its modes, the SC420 measures all functions simultaneously. There is no need to configure time weighting or frequency weightings (A, C or Z).
The SC420 measures on three different time bases simultaneously: global values corresponding to the total measurement time (t), time history of consecutive partial values (T) configurable to between 1 second and 1 hour, and "Short Leq" time history every 125 ms. When measuring decay curves for reverberation time evaluation, a basis of 10 ms is used.
This is all you need to do measurements: Switch on and measure. At the touch of just two buttons, the SC420 measures all the required parameters.
BACKERASE:
With the Backerase option, the SC420 can delete the last 10 seconds of the measurement in progress. This option is ideal when unwanted noise events occur during measurement (see 14.2).
The Bluetooth trademark is the property of Bluetooth SIG, Inc.

12 Chapter 3 General description of the device
MARKS:
This option allows the user to identify different stretches during measurement; this is a great help during post-processing since it means you can go directly to the stretches marked during the measurement (see 14.3).
microSD CARDS and DOWNLOADING DATA:
Data measured by the SC420 can be saved on removable microSD cards (see 20), thus creating greater flexibility in data storage. The functions stored are configurable and the recording mode can be adapted to the type of measurement to be taken (see 15.3.2).
The SC420 has Lab software that allows you to download any data recorded to a PC, in order to have them available in electronic format and export them to other programmes to create your own reports (see 17.3).
Downloading data using Lab can be done simultaneously with the measurement or recording processes. This feature, together with the option to erase measurement periods as they are downloaded, makes the SC420 the perfect platform for permanent acoustic monitoring (see 17.2).
You can also remove the microSD card, insert it into a PC and import data using the Lab software. While the full card downloads, the SC420 can continue saving results on a new card. This is an alternative way to take long measurements without loss of data (see 17.2.1).
The file system used by the SC420 is optimised for downloading large amounts of data, optimising the download time and facilitating the resumption in case of failure of the communication channel.
INNOVATIVE DESIGN:
The ergonomic shape of the SC420 has been designed to minimise the effects of any reflections or diffractions and provide a comfortable and firm grip.
The 3.2" graphic display allows data to be shown both numerically and graphically. The graphic display is highly practical when it comes to studying a sound event, evaluating its time history or analysing its spectral content. It also has an automatic zoom option for looking at highly stable noise events in more detail (see 14.1). The SC420's screen can be read clearly and precisely in full daylight; it can also be illuminated at the touch of a button, allowing the user to work in low-light conditions as well.
The SC420 has an intuitive keypad with four keys dedicated to the main functions, four contextual keys (softkeys) that adapt to the information displayed on the screen and four selector keys (joystick) to facilitate navigation through its menu structure (see 5).
The SC420 supports both prepolarised and polarised 200 V microphones. Each type of microphone needs its corresponding preamplifier. These can be removed in order to attach CN003, CN010 or CN030 extension cables or TK200 outdoor kit for measurements taken outside (see 8).
ICON MENU:
The device is configured using menus composed entirely of easily identifiable and recognisable icons, with no need to set languages.
Chapter 3 General description of the device 13
AUDIO RECORDING, TIMERS AND TRIGGERS:
While it is taking measurements, the SC420 can also record audio files for recognition of sound sources (listening quality) (see 14.5), for voice comments (see 14.4) and for post-processing (quality analysis) (see 13.9).
The SC420 has a complete system of automatic settings for starting and stopping measurement and audio recording using automatic timers and triggers activated by exceeding the threshold by time intervals. This extends even further more the possibilities of the SC420 as a stand-alone unit for continuous noise monitoring (see 14.6).
The power for environmental monitoring option allows the SC420 to resume recording after recovering from a power cut (see 7.3).
COMMUNICATIONS:
The SC420 can communicate with a PC via a USB port, Bluetooth® wireless communication or RS-232 serial port for downloading data, programming or control and visualisation in real time. Communication is also possible via 3G, ADSL and Wi-Fi (see 17.2).
The RS232 port of the SC420 can be configurated to connect a serial printer. In SLM mode and octave 1/1 band spectrum analyzer mode, the SC420 sends in real-time the values of the measured functions (see 17.2.2).
The SC420 has a multi-contact connector which makes available: the AC signal from the microphone, the digital inputs and outputs for control and the RS-232 serial communication port (see 17).
LOG OF CHANGES:
Saved in its memory, the SC420 has a log of the last five modifications of changes to date and time and adjustment of sensitivity, with the date and time when they were carried out.
14 Chapter 3 General description of the device
3.3 Device components
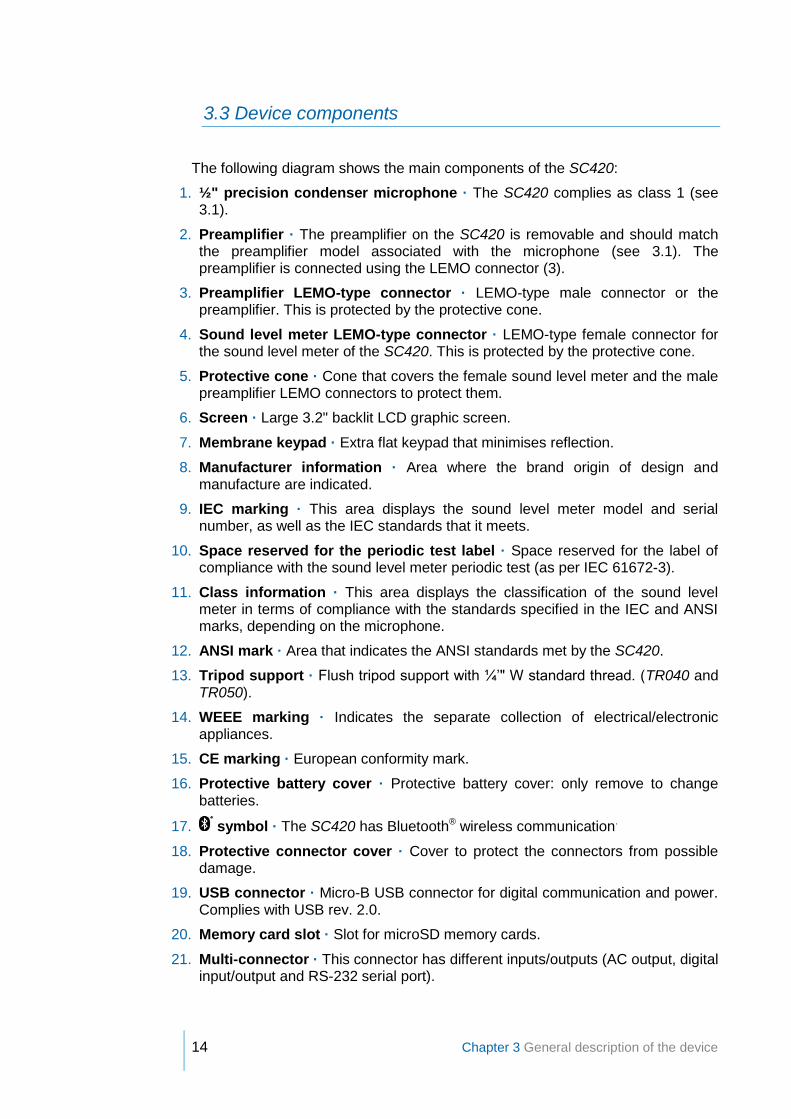
The following diagram shows the main components of the SC420:
1. ½" precision condenser microphone · The SC420 complies as class 1 (see 3.1).
2. Preamplifier · The preamplifier on the SC420 is removable and should match the preamplifier model associated with the microphone (see 3.1). The preamplifier is connected using the LEMO connector (3).
3. Preamplifier LEMO-type connector · LEMO-type male connector or the preamplifier. This is protected by the protective cone.
4. Sound level meter LEMO-type connector · LEMO-type female connector for the sound level meter of the SC420. This is protected by the protective cone.
5. Protective cone · Cone that covers the female sound level meter and the male preamplifier LEMO connectors to protect them.
6. Screen · Large 3.2" backlit LCD graphic screen.
7. Membrane keypad · Extra flat keypad that minimises reflection.
8. Manufacturer information · Area where the brand origin of design and manufacture are indicated.
9. IEC marking · This area displays the sound level meter model and serial number, as well as the IEC standards that it meets.
10. Space reserved for the periodic test label · Space reserved for the label of compliance with the sound level meter periodic test (as per IEC 61672-3).
11. Class information · This area displays the classification of the sound level meter in terms of compliance with the standards specified in the IEC and ANSI marks, depending on the microphone.
12. ANSI mark · Area that indicates the ANSI standards met by the SC420.
13. Tripod support · Flush tripod support with ¼’" W standard thread. (TR040 and TR050).
14. WEEE marking · Indicates the separate collection of electrical/electronic appliances.
15. CE marking · European conformity mark.
16. Protective battery cover · Protective battery cover: only remove to change batteries.
17. symbol · The SC420 has Bluetooth® wireless communication.
18. Protective connector cover · Cover to protect the connectors from possible damage.
19. USB connector · Micro-B USB connector for digital communication and power. Complies with USB rev. 2.0.
20. Memory card slot · Slot for microSD memory cards.
21. Multi-connector · This connector has different inputs/outputs (AC output, digital input/output and RS-232 serial port).

Chapter 3 General description of the device 15
1
23
5
6
7
4
8
9
10
11
12
13
14
15
16 17
18
19 20 21

16 Chapter 4 Inputs and outputs
This chapter describes the digital and analogue inputs and outputs of the SC420. It describes how to identify and configure them, and how to extract data and signals from them.
The SC420's inputs and outputs are on the bottom of the device, protected by a removable protective cover. To access them, lift the cover, remembering to put it back once you have finished.
4.1 SC420 inputs and outputs
The SC420 has the following inputs and outputs:
19 20 21
1. USB [19]: Input/output for two-way digital USB communication with a PC and for powering the device. Complies with USB rev. 2.0. To connect the SC420 to a PC through this input, use cable CN400.
2. Memory card slot [20]: Slot for a microSD memory card. The data recorded by the sound level meter, functions and audio are stored on this card. Larger capacity cards can cause permanent damage to the device (see 20).
3. Multi-connector [21]: (Twenty-contact connector with various inputs and outputs. To access these inputs and outputs, use CN420 cable:
RS-232 serial port. Input/output serial port for two-way digital communication with a PC (see 4.2).
AC output. Analogical output directly proportional to the preamplifier output, without frequency weighting (see 4.3).
Digital output. Digital output that takes values depending on whether the automatic audio recording threshold is exceeded (see 4.4).
Inputs and outputs
4. Inputs and outputs
4
NOTE: For the device to function correctly, you should use at least a class 4 card. The card class determines the write speed; therefore, the higher the card class is, the faster the SC420 will work.

Chapter 4 Inputs and outputs 17
Digital input. Digital input that enables a measurement to be started or stopped and marks to be inserted, depending on its state (see 4.4).
4. Bluetooth® wireless communication. Wireless input/output for two-way digital communication with a PC via radiofrequency (see 4.2)
4.2 Communications inputs and outputs
The SC420 can communicate with a PC via the Lab, USB, Bluetooth® wireless communication or the RS-232 serial port. The SC420 allows the connection to a serial printer too (see 17.2).
To use the RS-232 serial input/output, use the CN420 cable, inserting the cable's male multi-connector into the female SC420 multi-connector. On the RS-232 SERIAL connector, at the opposite end of the cable, you will find this input/output.
It is also possible to communicate via 3G, ADSL and Wi-Fi: for more information, please consult your official distributor.
4.3 AC Output
The AC output contains an alternating current signal proportional to the output of the preamplifier. This makes it possible to:
Listen to the sound event being measured and determine whether it is influenced by noises other than those that you wish to measure.
Physically record said signal for recognition of the sound event being measured or for reanalysis of the signal received by the microphone. This option is possible using the SC420 itself (see 17.1.1).
To extract the aforementioned signal, use the CN420 cable, inserting the cable's male multi-connector into the female SC420 multi-connector. The AC OUTPUT connector has the AC output at the opposite end of the CN420 cable.
In order to adapt the dynamic range of the AC output to the hearing or recording
range, use the option in the CONFIGURATION menu (see 15.3.7).
4.4 Digital inputs and outputs
The SC420 has a digital input and a digital output. To work with them, use the CN420 cable, inserting the cable's male multi-connector into the female SC420 multi-connector. You will find them on connectors DIGITAL I and DIGITAL O respectively, at the opposite end of the CN420 cable.
The digital output takes values depending on whether the automatic audio recording threshold is exceeded in each of the time zones. If the threshold is exceeded, the signal in the digital output takes value 0; if it is not exceeded, the value is 1 (see 17.1.3).

18 Chapter 4 Inputs and outputs
The digital input can start and stop a data recording depending on its state. The START AUTOMATIC MEASUREMENT and STOP AUTOMATIC MEASUREMENT options should be activated and configured with the DIGITAL INPUT option (see 17.1.2). This input can also be used to insert markers while recording data (see 14.3).
Chapter 5 Keypad 19
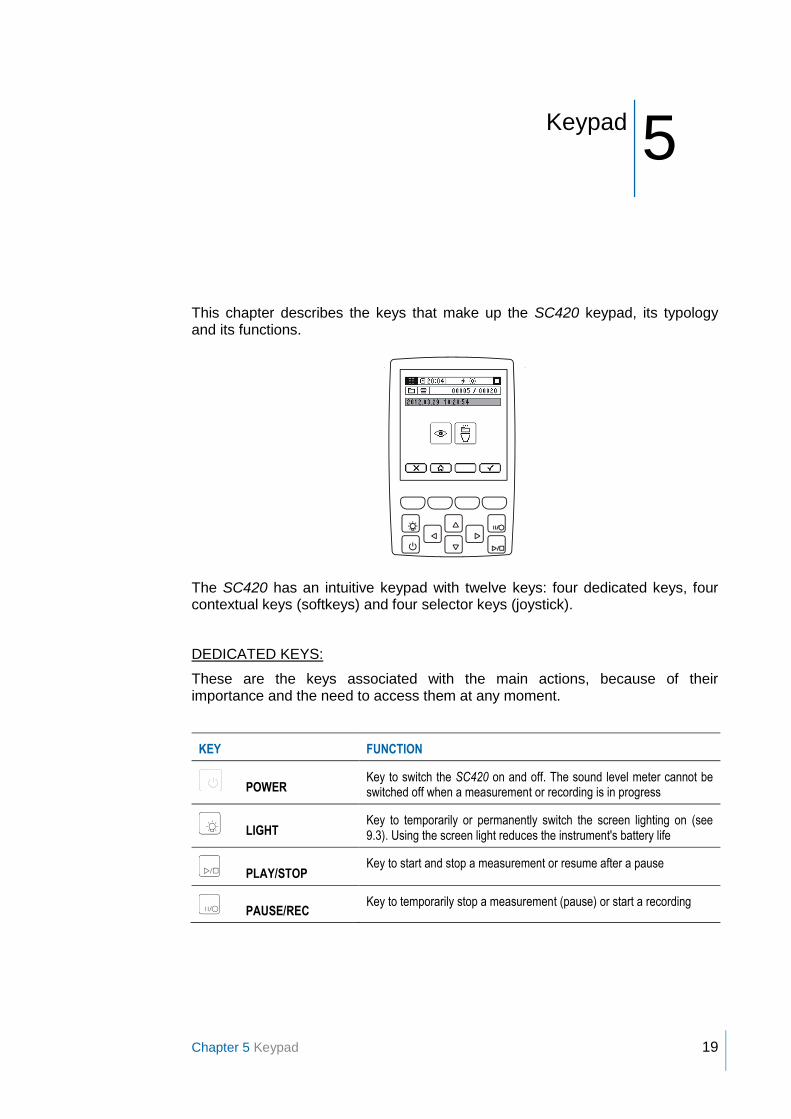
This chapter describes the keys that make up the SC420 keypad, its typology and its functions.
The SC420 has an intuitive keypad with twelve keys: four dedicated keys, four contextual keys (softkeys) and four selector keys (joystick).
DEDICATED KEYS:
These are the keys associated with the main actions, because of their importance and the need to access them at any moment.
KEY FUNCTION
POWER Key to switch the SC420 on and off. The sound level meter cannot be switched off when a measurement or recording is in progress
LIGHT Key to temporarily or permanently switch the screen lighting on (see 9.3). Using the screen light reduces the instrument's battery life
PLAY/STOP Key to start and stop a measurement or resume after a pause
PAUSE/REC Key to temporarily stop a measurement (pause) or start a recording
Keypad
5. Keypad
5

20 Chapter 5 Keypad
CONTEXTUAL KEYS (SOFTKEYS):
Most actions on the SC420 are performed using the 4 contextual keys (softfkeys). The functions of these keys vary according to the indication that appears in the lower part of the screen, just above each key.
The contextual keys (softkeys) adapt to each measuring mode and display screen, as well as to the kind of information displayed. Therefore, in this area, only the actions specific to each screen will be accessible.
SELECTOR KEYS (JOYSTICK):
The selector keys (joystick) enable navigation through the menu structure of the SC420 and speed up configuration of parameters and options as well as the change between the different measurement modes.
KEY FUNCTION
UP Key to move upwards
RIGHT Key to move towards the right
LEFT Key to move towards the left
DOWN Key to move downwards
The selector keys can also be used for specific actions during the measurement process (see 11).

Chapter 6 Screen 21
This chapter describes the features of the screen and the information it displays.
The SC420 has a 3.2" backlit screen that can display both graphic and numerical data.
The SC420's screen is divided into 5 areas; the information that appears on each of these is presented below.
6.1 Indicator area
This area is the most important, since it provides essential information for the user. It is always visible, although the information that appears on it may vary depending on the measurement in use, the configuration of the SC420 and the state of measurement.
Screen
6. Screen
6
MODE
UNITS
STATUS
INDICATORS
TIME
INDICATOR AREA
WORK AREA
TIMING AREA
MEMORY AREA
CONTEXTUAL AREA

22 Chapter 6 Screen
MODE:
The mode indicator is the most important as it tells us if we are on the configuration menu or indicates the current measuring mode.
INDICATOR SITUATION
Menu
Sound level meter mode
1/1 octave band spectrum analyser mode
1/3 octave band spectrum analyser mode
1/1 octave band reverberation time measurement mode (interrupted noise method)
1/3 octave band reverberation time measurement mode (interrupted noise method)
1/1 octave band reverberation time measurement mode (integrated impulse response method)
1/3 octave band reverberation time measurement mode (integrated impulse response method)
Occupational noise functions mode
FFT frequency analysis mode
Audio recording mode for reanalysis
To change mode (see 13.1)
TIME:
Shows the SC420's current time (hh:mm:ss).
UNITS:
When measuring or displaying records, this indicates the units of the functions shown in the work area.
INDICATORS:
The indicators provide continuous information on various aspects of the SC420.
INDICATOR INFORMATION
Battery power and status (see 7.1)
USB or A300 feeder power (see 7.1)
Screen light permanently light (see 9.3)
Bluetooth® wireless communication activated (see 15.3.8)
Chapter 6 Screen 23
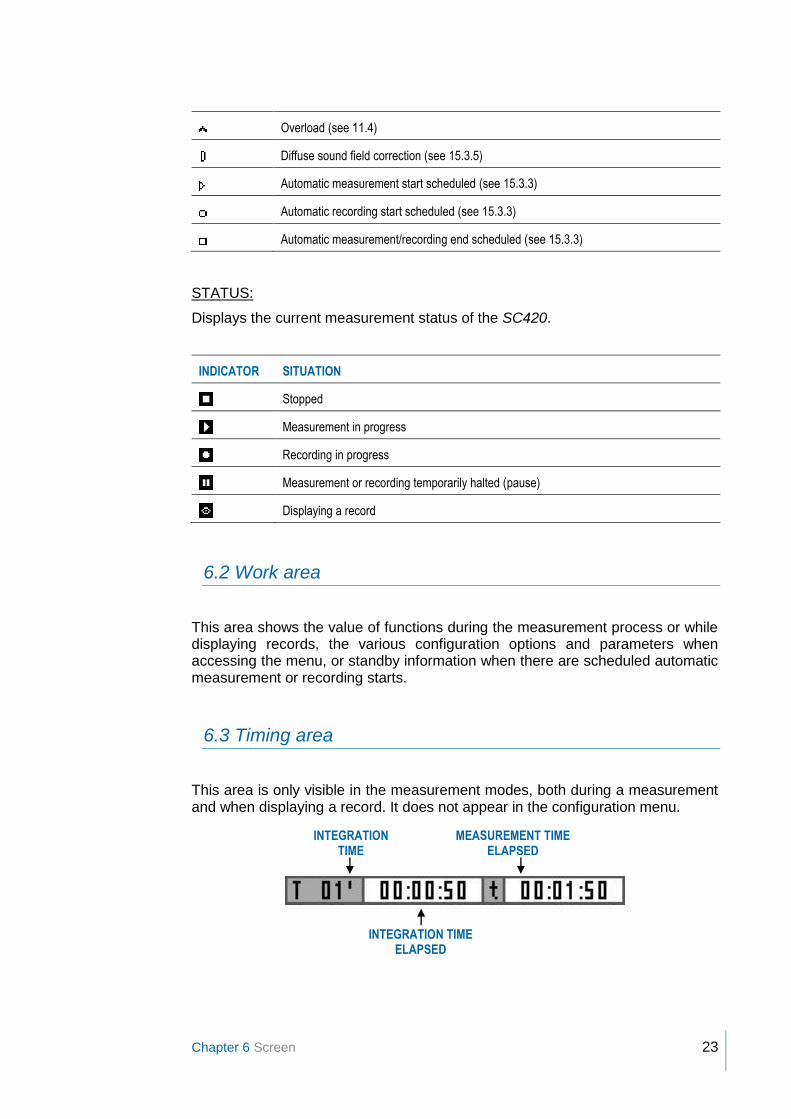
Overload (see 11.4)
Diffuse sound field correction (see 15.3.5)
Automatic measurement start scheduled (see 15.3.3)
Automatic recording start scheduled (see 15.3.3)
Automatic measurement/recording end scheduled (see 15.3.3)
STATUS:
Displays the current measurement status of the SC420.
INDICATOR SITUATION
Stopped
Measurement in progress
Recording in progress
Measurement or recording temporarily halted (pause)
Displaying a record
6.2 Work area
This area shows the value of functions during the measurement process or while displaying records, the various configuration options and parameters when accessing the menu, or standby information when there are scheduled automatic measurement or recording starts.
6.3 Timing area
This area is only visible in the measurement modes, both during a measurement and when displaying a record. It does not appear in the configuration menu.
INTEGRATION TIME
INTEGRATION TIME ELAPSED
MEASUREMENT TIME ELAPSED

24 Chapter 6 Screen
The timing area shows the following information:
The integration time scheduled for the current mode (T)
The integration time elapsed
The measurement time elapsed (t)
6.4 Memory area
This area is only visible if there is a memory card inserted in the slot and if it is in a measurement mode, both during a measurement and when displaying a record. It does not appear in the configuration menu.
The memory area shows the following information:
Memory card inserted indicator.
Space used on memory card. 0%: card empty. 100%: card full.
During a recording: the record number under which the information measured is being saved. When displaying a record: the number of that record.
During a recording: The audio file number that is being stored associated with the current register (in the above image, audio file number 12 is being saved in register number 004 of the memory card).
During a recording: if any mark is being used at that moment. There are up to three marks and each is indicated differently (see 14.3).
6.5 Contextual area
The actions associated with the four contextual keys can be accessed from this area.
CARD INSERTED AND SPACE USED
REGISTER NUMBER
AUDIO FILE NUMBER
MARKS

Chapter 7 Power 25
Before turning the SC420 on, the first thing to do is connect it to a power supply. This chapter describes the different ways of powering your device, as well as the configuration options that affect the power supply.
7.1 Power sources
The SC420 can run on alkaline batteries, through a USB connection or using the AM300 mains feeder.
7.1.1 Battery power
The SC420 sound level meter is fed by two 1.5 V alkaline or lithium batteries sized AA (LR6) or through the USB port. If both systems are used at the same time (batteries + USB port), the SC420 selects the one offering the higher voltage
(only valid for option, see 7.3).
To fit the batteries, lift the battery compartment lid at the rear of the SC420. Insert the two batteries as indicated in the diagram shown in the compartment.
When the batteries are fully charged, the symbol is displayed on screen. As the batteries run down, the symbol becomes empty: . When the batteries are not sufficiently charged for the SC420 to function correctly, the empty battery
symbol with a cross through it is displayed in the centre of the screen for two seconds; if there is a measurement or recording in progress, it will stop and the device will then shut down. The batteries should be replaced.
To replace the batteries, the device must be switched off. To remove the SC420's batteries, open the battery compartment, press the battery against the spring and pull it upwards, holding the battery by its positive pole.
Power
7. Power
7
1
1
1
2
1
2

26 Chapter 7 Power
7.1.2 Power via USB
The SC420 can also be powered through the USB port.
One option is to use a PC as a power source. Use cable CN400 to connect the SC420 USB port with a PC USB port. As you connect it, the symbol will appear where the battery symbol was previously.
7.1.3 Mains feeder
Another option is to use the AM300 mains feeder.
This feeder is connected to the mains supply and has a USB output for connecting the CN400 cable and powering the SC420. The AM300 mains feeder is an optional accessory.
7.2 Energy saving
Using Bluetooth® wireless communication and the screen light considerably reduce battery life. If running the sound level meter exclusively on batteries, it is recommended that you:
Use the screen lighting as little as possible (see 9.3).
Disable Bluetooth® wireless communication when this not in use (see 15.3.8).
7.3 Power for environmental monitoring
This option is designed for using the SC420 during particularly long recordings,
for continuous monitoring. Activating this option ( ) is recommended for such recordings, is recommended for this type of recording, so that when there is an external power supply failure during a recording, the SC420 switches to battery power, halts the recording in progress and switches off automatically. When the external power supply recovers, the SC420 will switch back on automatically and begin a new recording (with the same conditions as for the previous measurement process).
RECOMMENDATIONS:
When using an external power supply (USB or mains feeder) it is advisable to fit new batteries (see 7.3).
If the SC420 is not be used for some time, remove the batteries from the SC420 to prevent damage caused by battery leakage.
It is advisable to always carry spare batteries.
2

Chapter 7 Power 27
However, it is advisable to disable this option ( ) for all other cases. Therefore, when an external power supply failure occurs during a recording, the device switches to battery power and continues with the measurement until it is manually stopped, the batteries run out or the mains power returns.
To activate and deactivate this option, please see 15.3.2.
NOTE: To ensure the device behaves as indicated above, it is essential that batteries are inserted.

28 Chapter 8 Assembling and dismantling the device
This chapter explains how to fit the microphone and the preamplifier to the SC420, as well as all the accessories that can be used for the microphone: the windscreen, extension cable and outdoor kit.
8.1 Windscreen
In order to minimise noise effects produced by the wind, you can attach the PV009 model windscreen to the microphone, as shown in the figure
below.
Assembling and dismantling the device
8. Assembling and dismantling the device
8

Chapter 8 Assembling and dismantling the device 29
8.2 Extension cable
The SC420 microphone and preamplifier are removable. This allows the microphone to be moved away from the sound level meter and user. Therefore, the SC420 can be operated far from the point of measurement to avoid possible interference. To do this, you need to use one of the following extension cables: CN003 (3 metres), CN010 (10 metres) or CN030 (30 metres).
The preamplifier and the microphone are an indivisible set, as the microphone is screwed into the preamplifier. Do not unscrew the microphone from the preamplifier unless it is strictly necessary; the microphone could be damaged during handling.
8.2.1 Removing and connecting the preamplifier
To remove the preamplifier from the sound level meter, unscrew the protective cone, find the preamplifier LEMO connector and pull out the preamplifier connector as shown in the diagram. Do not pull on the preamplifier itself.
To reconnect the preamplifier to the sound level meter, firstly ensure you have inserted the preamplifier through the protective cone (pass the end of the preamplifier's LEMO connector through the narrower end of the protective cone). Next, using your fingers, insert the preamplifier's male LEMO connector into the sound level meter's female LEMO connector, ensuring the red dot on the preamplifier lines up with the red dot on the sound level meter connector, until you hear them click perfectly into place. Finally, screw on the protective cone.
NOTE: accepts no responsibility for unauthorised modification, alteration or repairs carried out by unlicensed personnel; any such actions will invalidate the device warranty.
WARNING! When connecting or disconnecting the preamplifier or microphone, the sound level meter must be switched off.
WARNING! Do not attempt to attach or detach the preamplifier by screwing on or unscrewing the connector, as the sound level meter could be damaged.

30 Chapter 8 Assembling and dismantling the device
8.2.2 Connecting the extension cable
First, remove the preamplifier from the sound level meter. Pass the protective cone through the extension cable's male LEMO connector (the narrow part first). Insert the extension cable's male LEMO connector into the sound level meter's female LEMO connector until you hear them click perfectly into place. The red dots should line up. Then screw on the protective cone.
To attach the preamplifier + microphone to a tripod, use adaptor TR001. To do this, follow the steps detailed below:
1. Insert the extension cable's female LEMO connector through adapter TR001.
2. Insert the screwdriver through the bottom of adapter TR001 and tighten the internal screw of the TR001 so that the LEMO connector is fixed to the adapter.
3. Screw the adaptor onto the tripod.
4. Connect the preamplifier by inserting the preamplifier's male LEMO connector into the female extension cable connector until you hear them click perfectly into place. The red dots should line up.

Chapter 8 Assembling and dismantling the device 31
8.3 Outdoor kit
You can complete your measuring instrument with the TK200 model outdoor kit, designed to protect the preamplifier + microphone set from moderate wind and rain, birds, insects, humidity, etc. The outdoor kit includes a windscreen, rain protection, bird protection and dehumidifier.
The TK200 requires maintenance: please consult the instruction manual.
NOTE: The TK200 outdoor kit is an optional accessory and is not included in the normal operating mode.
NOTE: The cables do not have any effect inside the measuring frequency band. A recalibration is not necessary when using the extension cables. The extension cables are an optional accessory and are not included in the normal operating mode.

32 Chapter 9 Switching the device on and off
This chapter explains how to switch the SC420 and the screen light on and off.
9.1 Switching the device on
To switch on the SC420, press the key; the device performs a self-check and then the logo appears on the screen together with the SC420 model and the firmware version.
After a few seconds, the screen of the last measurement mode used will appear. If it is the first time you have used the SC420 or the last time you used it was not
in a measurement mode, the main menu will appear.
At the same time, the egg timer symbol will appear, indicating that the sound level meter is not yet ready to take measurements. Therefore, it is not possible to begin taking measurements until this symbol disappears (approximately 15 seconds). It is, however, possible to access or navigate through the menu during this time.
The SC420 can be switched on in two different ways:
1. By pressing , it will switch on normally.
2. By powering the SC420 through the USB input, the sound level meter will switch
on automatically without having to press .
Switching the device on and off
9. Switching the device on and off
9
NOTE: If the SC420 does not switch on, check that it is correctly connected to a power supply.

Chapter 9 Switching the device on and off 33
9.1.1 Initial SC420 self-check
Should any error be detected during the SC420 initial self-check, an alert screen will be displayed. A description of each alert screen is given below, along with instructions for how to proceed should it appear:
SCREEN REASON AND HOW TO PROCEED
A serious fault has occurred in the device and it is impossible to continue working with it.
Switch the device off and contact your official distributor.
There is a fault in one of the device's programming parameters.
Press any key. SC420 will automatically assign the start-up value to this parameter and you will be able to continue working as normal. Review the programming.
The date/time is incorrect.
Press any key. SC420 will automatically assign a default date and you will be able to continue working. Review the date/time.

34 Chapter 9 Switching the device on and off
9.2 Turning the device off
To turn off the SC420, check that no measurement is in progress and press
.
9.3 Switching the light on and off
If the key is pressed, the screen light comes on; it will go off automatically after 10 seconds have passed since the last key was pressed. If the key is pressed for more than 2 seconds, the light stays on, the symbol will appear in the indicators area (top right corner of the screen) and will only go off if the light on/off key is pressed again.
NOTE: Using the screen light reduces the instrument's battery life.
NOTE: Turning off the SC420 may take a few seconds. During this time, the
hourglass symbol will appear on the screen to indicate that all the data is being saved. This ensures a quick start up the next time the device is switched on.

Chapter 10 Checking the device 35
Before and after a measurement, is advisable to check of the sound level meter with an acoustic calibrator. A measurement is considered valid if it takes place between two successful checks.
10.1 Checking the SC420
To check the SC420, use class 1 acoustic calibrator CB006 model and follow these steps:
Insert the SC420 into the calibrator introducing the microphone into the cavity of the calibrator. Make sure the microphone reaches the bottom of the cavity and is parallel to the calibrator axis (see figure). This may require a little effort since the sound level meter must fit exactly into the calibrator. Insert the SC420 gently; otherwise the microphone may be damaged.
Checking the device
10. Checking the device
10

36 Chapter 10 Checking the device
Turn the calibrator on and check the battery status. The indicator light must remain on throughout the calibration process (please see the calibrator manual). The calibrator generates a tone of 94 dB at 1 kHz.
Apply the free field pressure corrections of the microphone at 1 kHz. The free field pressure correction at 1 kHz of microphones C-130, C140 and C240 is -0,1 dB. That is, the SC420 should read 93.9 dB.
Switch the SC420 in numerical sound level meter mode (see 13.1).
Set the function to measure to sound pressure level with fast impulse time weighting (FAST) LAF. The frequency weighting A makes no difference since calibration takes place at 1 kHz.
Start measuring with the SC420 in numerical sound level meter mode (see 11.2)
Check that the function value on the screen (LAF, LCF or LZF) coincides with the value of 94.0 dB corrected with the corresponding corrections (normally 93.9 dB).
If the value of the reading is within the range of 0.3 dB, the check has been successful. If that is not the case, the sensitivity of the sound level meter needs to be adjusted by authorised personnel.
NOTE: Acoustic calibrator CB006 has internal static pressure compensation to maintain the level generated within tolerance limits between 65 kPa and 108 kPa of static pressure. Thus there is no need to make any additional correction.
NOTE: The sensitivity of the sound level meter must only be adjusted by authorised, technically qualified personnel. Readjustment of the sensitivity entails the loss of traceability in the calibration of the instrument.
assumes no responsibility for sensitivity adjustments performed by unauthorised personnel.
To adjust the sensitivity, please see 15.3.5

Chapter 11 Measuring and recording 37
The SC420 can be used to take measurements and make recordings(1) of acoustic functions:
Manually: using the keypad.
Automatically: Using the configuration option AUTOMATISMS/START RECORDING and AUTOMATISMS/END RECORDING, programming the levels and schedules to start and/or end recording.
(1) This chapter does not refer to the reverberation time, audio recording or FFT narrow band frequency analysis modes. For information on taking measurements in one of these modes, please see 13. Please note that automatic measurements are not possible in these modes.
This chapter describes the basic steps to take a measurement and make a recording manually. For automatic measurements/recordings, please see 15.3.3.
11.1 Prior steps
Once the SC420 is switched on and the device has been checked (see 10.1),
ensure that there are no measurements in progress . To continue, select the mode in which you wish to carry out the measurement and make the prior adjustments (see 13).
Measuring and recording
11. Measuring and recording
11
IMPORTANT: The difference between a MEASUREMENT and a RECORDING is that with a measurement the parameters being measured are displayed on the screen and once the device is turned off, the data are lost. However, with a recording, as the parameters are being measured, the data are also saved in the memory of the SC420. Thus, if the device is turned off, the data are preserved.
At the end of a RECORDING, the time history of the functions measured and the final results will be saved in a register. At the end of a MEASUREMENT, nothing will have been saved and it will only be possible to save the final results of the measurement by using the option SAVE RESULTS; the time history can never be saved.

38 Chapter 11 Measuring and recording
11.2 Taking a measurement
Once in the desired measurement mode, press the key to start a measurement.
During the measurement, the following information will appear on the screen:
INDICATOR AREA: ongoing measurement indicator ; indication of the units of the functions that appear in the work area; indication whether an overload has occurred during measurement .
WORK AREA: Functions corresponding to the screens of the chosen measurement mode.
TIMING AREA: The scheduled integration time (T), the integration time elapsed and the measurement time elapsed (t).
Once the measurement has started, you can:
Momentarily stop the measurement with the button. The status indicator will
change to measurement temporarily paused .
End the measurement by pressing . The status indicator will change to
measurement ended .
Use the graphic screens for an automatic zoom of the data displayed on the
screen by pressing or return to the display of the full range by pressing
(see 14.1).
If the measurement has been stopped momentarily , the device enables you to:
Perform a Backerase of the last 10 seconds by pressing (see 14.2).
Resume the measurement, by pressing . While a measurement is stopped, the measurement time elapsed is paused.
11.3 Making a recording
Once in the desired measurement mode, start recording by pressing .
NOTE: If it is a recording in sound level meter mode, spectrum analyser in octave bands mode or spectrum analyser in third octave bands mode, the frequency and the functions that the SC420 will store the while recording will appear on screen for 3 seconds, before recording starts.
IMPORTANT: Ensure a microSD memory card is inserted in the slot. You can check this by ensuring the memory card symbol is displayed in the memory area of the screen. If there is no card, it will be impossible to start a recording.
NOTE: The function values are refreshed on the screen every second.
Chapter 11 Measuring and recording 39
During the recording, the screen will display the following information, in addition to the measuring information:
INDICATOR AREA: recording in progress indicator .
MEMORY AREA: Memory space used; current register number.
Once the recording has started, you can:
Momentarily stop the recording with the button. The status indicator will
change to recording temporarily paused .
End the recording by pressing .The status indicator will change to recording
ended .
Use the graphic screens for an automatic zoom of the data displayed on the
screen by pressing or return to the display of the full range by pressing
(see 14.1).
Initiate an audio recording of 15 s (5 s prerecording and 10 s recording) by
pressing (see 14.5). During a recording, the screen will display the audio file number being saved associated with the current record.
If the recording has been stopped momentarily , the device enables you to:
Perform a Backerase of the last 10 seconds by pressing (see 14.2).
Resume the recording, by pressing . While a recording is stopped, the measurement time elapsed is paused.
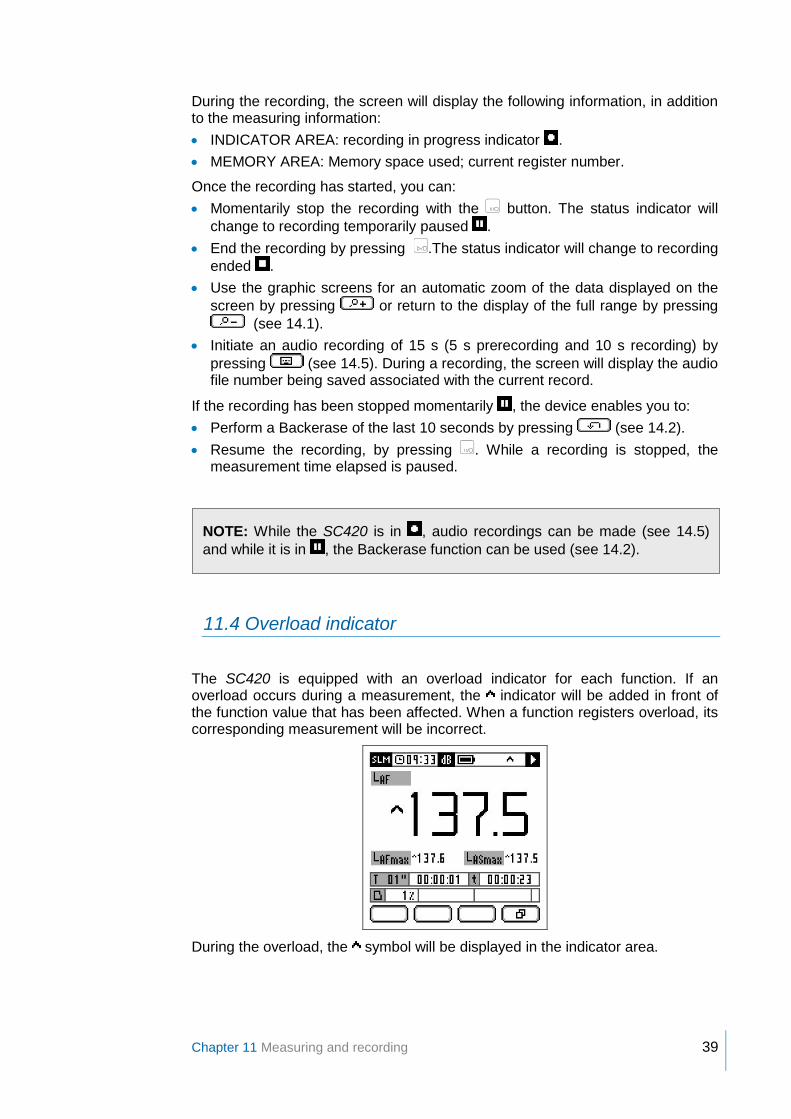
11.4 Overload indicator
The SC420 is equipped with an overload indicator for each function. If an overload occurs during a measurement, the indicator will be added in front of the function value that has been affected. When a function registers overload, its corresponding measurement will be incorrect.
During the overload, the symbol will be displayed in the indicator area.
NOTE: While the SC420 is in , audio recordings can be made (see 14.5)
and while it is in , the Backerase function can be used (see 14.2).

40 Chapter 11 Measuring and recording
11.5 Under-range indicator
The SC420 is equipped with an under-range indicator for each function. If the value displayed on-screen is under the lower limit of the range of linearity, the indicator will appear in front of the value of the function affected. This indicator only appears while this condition remains.
When a function has recorded under-range, this indicates that it is a limit of the measurement.
NOTE: If overloading occurs while the SC420 is conducting a quality analysis audio recording (optional), the indication will be displayed in the indicator
area while overload occurs and the indication will be shown beside the progress bar when the recording ends.

Chapter 12 Menu 41
The SC420 menu allows you:
Save final results and manage the memory and the saved registers
Configure SC420 adjustments
Select the measurement mode
Record voice comments (see 14.4)
12.1 Accessing the menu
Once the SC420 is switched on, ensure there is no measurement in progress
and press . The main menu screen is displayed automatically.
The cursor (highlighted option) will be at the first option in the menu area. Press to select any option in the menu area.
Press to access the current mode in the mode area.
Menu
12. Menu
12
INDICATOR AREA
MENU AREA
MODE AREA
MAP AREA
CONTEXTUAL AREA

42 Chapter 12 Menu
12.2 Menu areas
The SC420 menu screen features the following areas:
INDICATOR AREA: Shows essential information for the user (see 6.1).
MAP AREA: Indicates, with icons, the current location within the different menu screens of the SC420.
MENU AREA: Shows the options available on the current menu screen (indicated in the map area) of the SC420.
MODE AREA: Shows the measurement modes available on the SC420 and identifies the current mode with a dot. Only available on the main menu screen of the SC420.
CONTEXTUAL AREA: Shows the actions available on the four contextual keys.
12.3 Navigating through the menu
To select an option from the menu area, to select a measurement mode or to
change between the menu and mode areas, use the selector keys .
Pressing accepts the option or the mode selected.
Pressing takes you to the previous menu screen.
Pressing takes you directly to the current measurement mode, without accepting the selected action.

Chapter 13 Measurement modes 43
The basic version of the SC420 disposes the SOUND LEVEL METER measurement mode. It is also possible to purchase optional modules to activate other more specific measurement modes and thus increase the SC420 applications. These modules can be purchased when the user needs them, so that you are only working with the modes that you really need.
This chapter describes all the features (parameters measured, display screens, options available, etc.) of each of the SC420 measurement modes.
13.1 Selecting the measurement mode
When you switch the sound level meter on, the screen of the last measurement mode that was used is displayed. This could be any of the modes available on the SC420.
The measurement modes are as follows:
Sound level meter mode
OPTIONAL octave band spectrum analyser mode
OPTIONAL third octave band spectrum analyser mode
OPTIONAL octave band (1/1) reverberation time mode (interrupted noise method)
OPTIONAL third octave band (1/3) reverberation time mode (interrupted noise method)
OPTIONAL octave band (1/1) reverberation time mode (integrated impulse response method)
OPTIONAL third octave band (1/3) reverberation time mode (integrated impulse response method)
OPTIONAL occupational noise mode functions
OPTIONAL FFT frequency analyser mode
OPTIONAL audio recording mode for reanalysis
To identify which mode the SC420 is in at any moment, simply look at the indicator in the top left-hand corner of the screen, in the indicator area.
To select the mode to be worked in, proceed as follows:
Press
The main menu screen is displayed automatically (see 12.1).
Measurement modes
13. Measurement modes
13

44 Chapter 13 Measurement modes
The cursor (highlighted option) will be at the first option in the menu area.
Press to access the mode area.
Next, using the selector keys select the desired measurement mode.
Finally, press
13.2 Sound level meter mode
The sound level meter mode is suitable for measuring overall sound pressure levels, both instantaneous and averaged based on integration (equivalent level). The SC420 measures all functions simultaneously with all frequency weightings (A, C and Z) and calculates statistical data, such as maximum and minimum values and percentiles. It also measures "short" functions: measurement of certain functions every 125 ms, ideal for analysing sound events that are particularly short in duration, recognition of sources, transient signal detection, etc.
One of the most notable applications of the SC420 is the measurement of noise levels belonging to noisy activities, urban and road traffic, machinery such as compressors, pumps, etc. Other important applications are the exposure noise measurement for workers and the measurement of acoustic parameters for the assessment of environmental pollution levels, including impulsiveness and low frequency indices, etc.
13.2.1 Sound level meter mode functions
As a sound level meter , the SC420 measures in the complete dynamic range (one single scale) and, simultaneously, all the functions indicated below:
TIMEBASE FUNCTIONS
t
Measurement time
LXt, LXE, LXpeak, LXIt, (LXIt-LXt), (LCt-LAt), Lnt
LXFmax, LXSmax, LXImax, LXFmin, LXSmin, LXImin
LAF5t, LAF5t-LAt
T
Programmed integration time
LXT, LXIT, (LXIT-LXT), (LCT-LAT), LnT
LXTmax, LXTmin
LAF5T, LAF5T-LAT
1 s LXF, LXS, LXI,
LX1s*, LXpeak1s*, LXFmax1s*, LXSmax1s*, LXImax1s*, LXFmin1s*, LXSmin1s*, LXImin1s*
125 ms LXF125ms*, LXS125ms*, LXI125ms*, LX125ms*, LXpeak125ms*
NOTE: While the SC420 is in , you can return to the main menu screen by
pressing , whatever the mode the device is currently in.

Chapter 13 Measurement modes 45
X: indicates the frequency weighting A, C and Z. All functions are measured simultaneously with the three frequency weightings.
n: 1%, 5%, 10%, 50%, 90%, 95% and 99%
*: These functions are measured by the SC420 but are not displayed on screen. The results of these functions can be obtained by making a recording and then downloading it to a PC with
Lab (see 17.2)
Percentiles are calculated through the LAF function sampled every 125 ms and class of 0.1 dB.
For the name and definition of each of the functions measured, please see chapter 23.
13.2.2 Sound level meter mode prior adjustments
Configure the three acoustic functions (F1, F2 and F3) displayed on the preference screen, as well as the integration time (T) (see 15.3.1).
13.2.3 Sound level meter mode screens
The sound level meter mode of the SC420 has the following screens:
Preference
Numeric
Time history graphic
Statistical
Advanced
The different screens let you view the functions measured (all are measured at the same time). To change screen, you do not need to stop the measurement. All
the screens are available for any sound level meter status: .
In the and menus, the F1, F2 and F3 functions and the integration time (T) can be configured (see 15.3.1).
PREFERENCE SCREEN:
Shows, on the same screen, the F1, F2 and F3 functions defined in the menu.
Pressing takes you to the numeric screen.
46 Chapter 13 Measurement modes
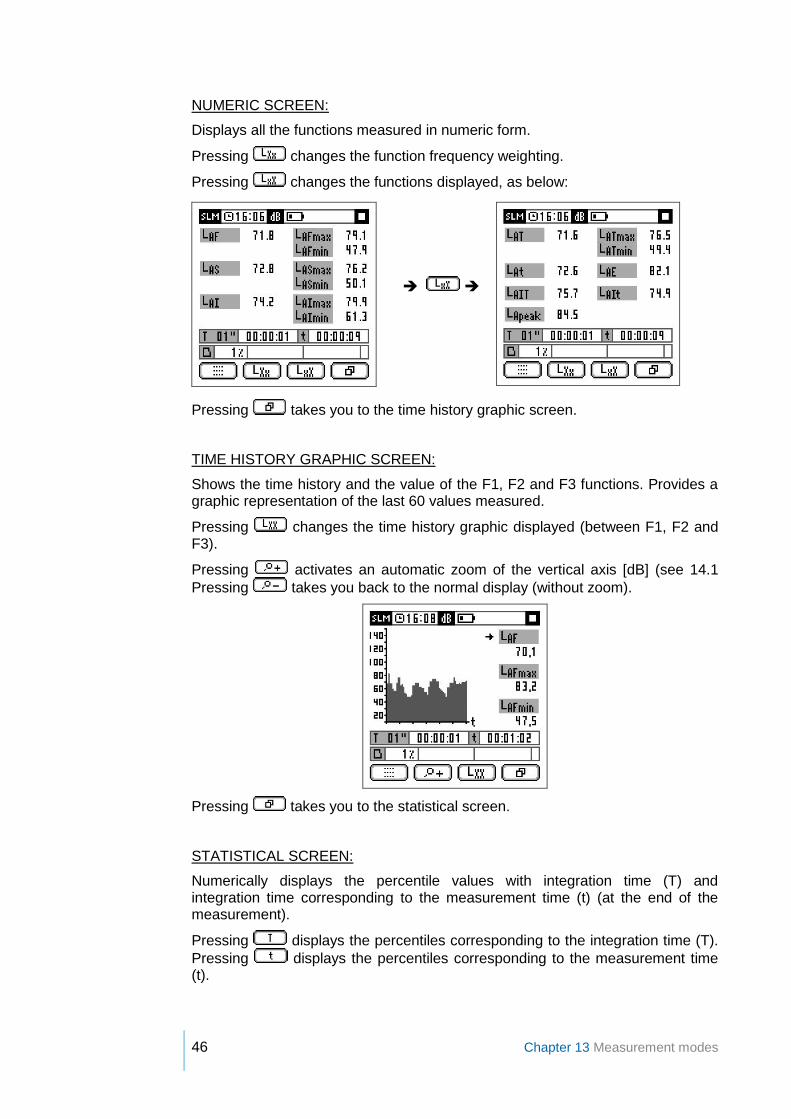
NUMERIC SCREEN:
Displays all the functions measured in numeric form.
Pressing changes the function frequency weighting.
Pressing changes the functions displayed, as below:
Pressing takes you to the time history graphic screen.
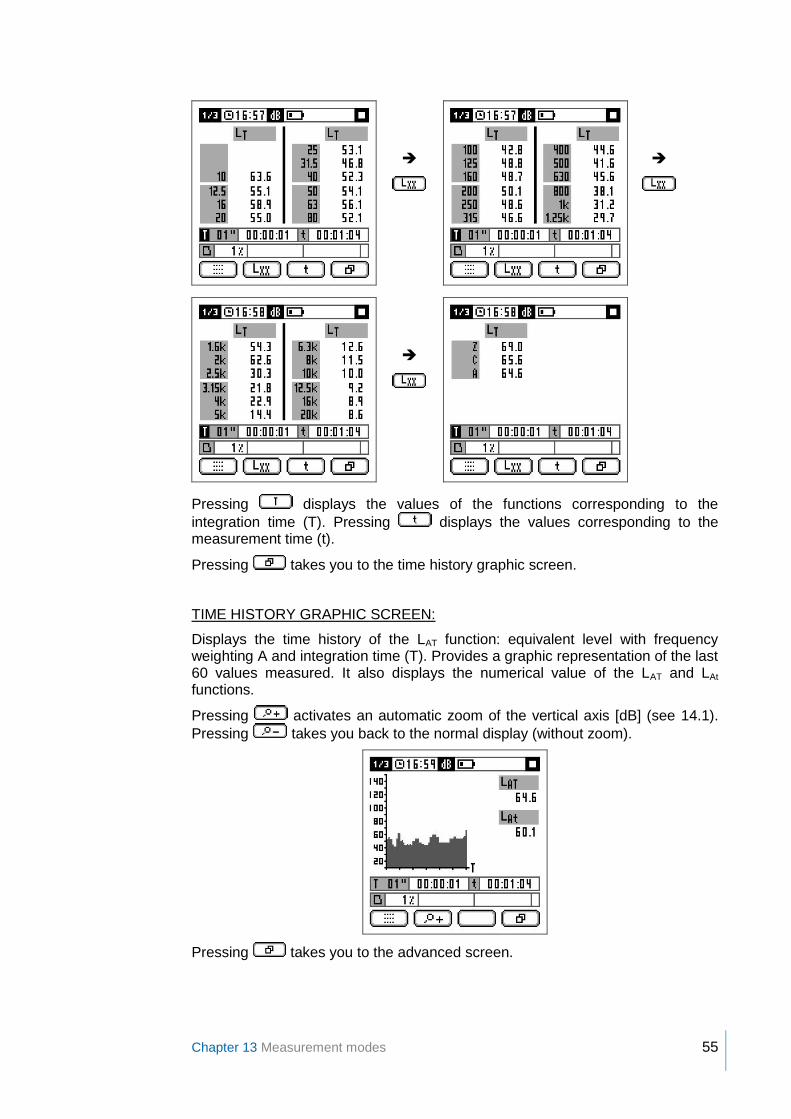
TIME HISTORY GRAPHIC SCREEN:
Shows the time history and the value of the F1, F2 and F3 functions. Provides a graphic representation of the last 60 values measured.
Pressing changes the time history graphic displayed (between F1, F2 and F3).
Pressing activates an automatic zoom of the vertical axis [dB] (see 14.1
Pressing takes you back to the normal display (without zoom).
Pressing takes you to the statistical screen.
STATISTICAL SCREEN:
Numerically displays the percentile values with integration time (T) and integration time corresponding to the measurement time (t) (at the end of the measurement).
Pressing displays the percentiles corresponding to the integration time (T).
Pressing displays the percentiles corresponding to the measurement time (t).

Chapter 13 Measurement modes 47
Pressing takes you to the advanced screen.
ADVANCED SCREEN:
Displays special acoustic functions: impulsiveness indicators, indicators of low-frequency spectral content and functions specific to local, national and international standards.
Pressing changes the function frequency weighting.
Pressing changes the functions displayed, as below:
Pressing takes you to the preference screen.

48 Chapter 13 Measurement modes
13.3 1/1 spectrum analyser mode (OPTIONAL)
The 1/1 spectrum analyser is ideal for real-time spectral measurements of the equivalent continuous sound pressure level, octave bands centred on frequencies of 16, 31.5, 63, 125, 250, 500, 1000, 2000, 4000, 8000 and 16000 Hz (without frequency weighting), and simultaneously with global values, equivalent level and peak level, with the frequency weightings (A, C and Z). The SC420 measures these functions for measurement time (t), the consecutive integration time (T) and every 125 ms ("short" functions). It also measures both global and spectral percentiles. The SC420 has a room background noise evaluation screen: NC (Noise Criterion) and NR (Noise Reduction) curves.
Major applications include insulation measurement, frequency analysis of industrial, environmental and workplace noise, and analysis of noise generated by air-conditioning systems and room background noise.
13.3.1 1/1 spectrum analyser mode functions
The SC420, as a octave band spectrum analyser, measures in the complete dynamic range (one single scale) and, simultaneously, all the functions indicated below:
TIME BASIS FUNCTIONS
t: Measurement time
LXt, LXpeakt, LAnt
Lft, Lfnt
Evaluation of the NC (63 Hz – 8 kHz) and NR (31,5 Hz – 8 kHz) curves
T: Programmed integration time
LXT, LXpeakT, LAnT
LfT, LfnT
Evaluation of the NC (63 Hz – 8 kHz) and NR (31,5 Hz – 8 kHz) curves
125 ms LX125ms*, LXpeak125ms*
Lf125ms*
X: indicates the frequency weighting A, C and Z. All functions are measured simultaneously with the three frequency weightings.
n: 1%, 5%, 10%, 50%, 90%, 95% and 99%
f: indicates the octave band filter with central frequency of 16, 31.5, 63, 125, 250, 500, 1000 (1k), 2000 (2k), 4000 (4k), 8000 (8k) and 16000 (16k) Hz. All functions are measured simultaneously with all octave band filters and without frequency weighting.
NOTE: This is an optional mode that can be purchased when you buy the SC420 or later on. See chapter 22.

Chapter 13 Measurement modes 49
*: These functions are measured by the SC420 but are not displayed on screen. The results of these functions can be obtained by making a recording and then downloading it to a PC with
Lab (see 17.2).
Percentiles are calculated through the LA125ms and Lf125ms functions with class of 0.5 dB.
For the name and definition of each of the functions measured, please see chapter 23.
13.3.2 1/1 spectrum analyser mode prior adjustments
Configure the integration time (T) used in the evaluation of spectral and global levels (see 15.3.1).
13.3.3 1/1 spectrum analyser mode screens
The 1/1 octave band spectrum analyser mode of the SC420 has the following screens:
Graphic
Numeric
Statistical
Time history graphic
Curves
The different screens let you view the functions measured (all are measured at the same time). To change screen, you do not need to stop the measurement. All
the screens are available for any sound level meter status: .
In the and menus, you can configure the integration time (T) (see 15.3.1).
GRAPHIC SCREEN
Displays the real-time spectral graph of the octave band equivalent levels from 16 Hz – 16 kHz (without frequency weighting) for the consecutive integration time (T) and for the measurement time (t).
It also displays the numerical value of the global equivalent level with the frequency weightings A, C and Z and that corresponding to the octave band selected in the graph (vertical cursor) for T and t.
Pressing displays the values of the functions corresponding to the
integration time (T). Pressing displays the values corresponding to the measurement time (t).
Pressing activates an automatic zoom of the vertical axis [dB] (see 14.1)
Pressing takes you back to the normal display (without zoom).
To change the band selected, use the and selector keys. If you want to go more quickly, hold down the selector key being used.

50 Chapter 13 Measurement modes
Pressing takes you to the numeric screen.
NUMERIC SCREEN:
Displays the functions measured in numeric form.
Pressing changes the functions displayed, as below:
Pressing displays the values of the functions corresponding to the
integration time (T). Pressing displays the values corresponding to the measurement time (t).
Pressing takes you to the statistical screen.
STATISTICAL SCREEN:
Numerically displays the percentile values with integration time (T) and integration time corresponding to the measurement time (t) (at the end of the measurement).
Pressing displays the percentiles corresponding to the integration time (T).
Pressing displays the percentiles corresponding to the measurement time (t).
Pressing changes the percentile displayed. The available percentiles are L1, L5, L10, L50, L90, L95 and L99.

Chapter 13 Measurement modes 51
Pressing takes you to the time history graphic screen.
TIME HISTORY GRAPHIC SCREEN:
Displays the time history of the LAT function: equivalent level with frequency weighting A and integration time (T). Provides a graphic representation of the last 60 values measured .It also displays the numerical value of the LAT and LAt functions.
Pressing activates an automatic zoom of the vertical axis [dB] (see 14.1).
Pressing takes you back to the normal display (without zoom).
Pressing takes you to the curves screen.
CURVES SCREEN:
Evaluates the spectrum measured according to the NC (Noise Criterion) and NR (Noise Reduction) curves. Displays the numerical value of the curve that does not exceed the spectrum measured (bottom right of the work area). That is, the value of the curve that defines this spectrum and the value of the curve that has not been exceeded in each octave band. This information serves to ascertain which octave band fixes the value of the curve of the total spectrum. That is, at least one spectral value must be equal to the value of the curve that defines the total spectrum.
Pressing evaluates the spectrum according to the NC (Noise Criterion)
curves. Pressing evaluates according to the NR (Noise Reduction) curves, as below:
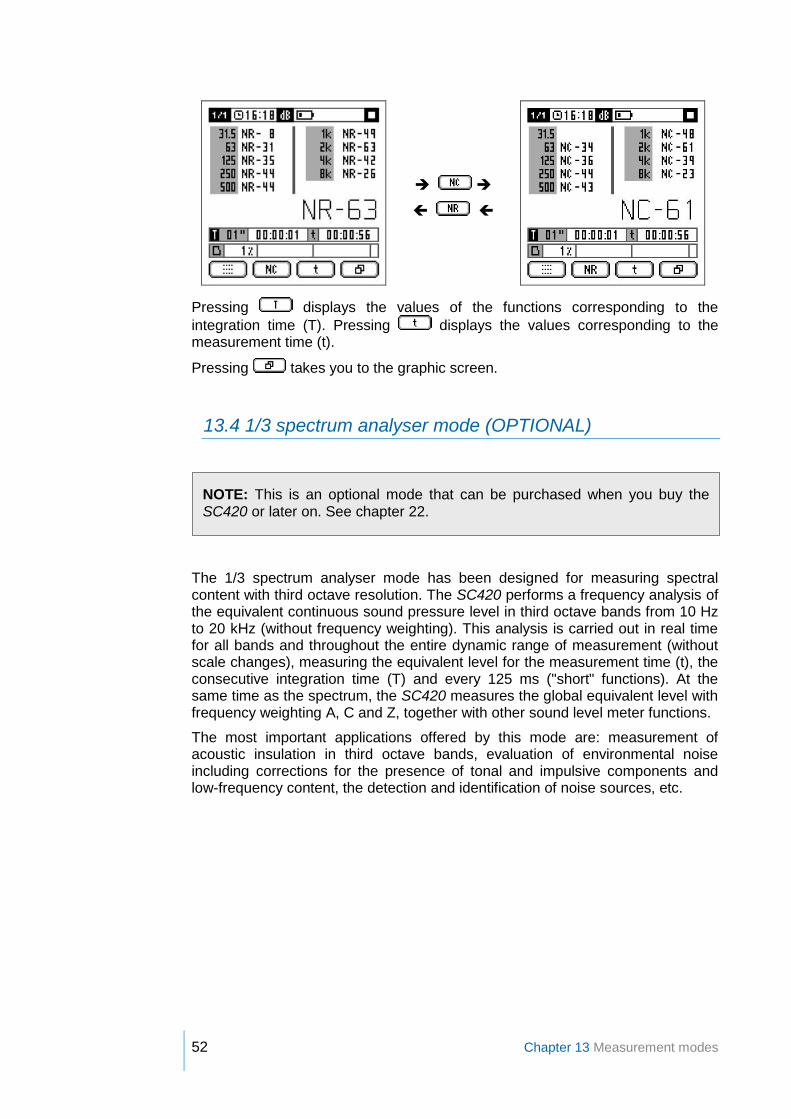
52 Chapter 13 Measurement modes
Pressing displays the values of the functions corresponding to the
integration time (T). Pressing displays the values corresponding to the measurement time (t).
Pressing takes you to the graphic screen.
13.4 1/3 spectrum analyser mode (OPTIONAL)
The 1/3 spectrum analyser mode has been designed for measuring spectral content with third octave resolution. The SC420 performs a frequency analysis of the equivalent continuous sound pressure level in third octave bands from 10 Hz to 20 kHz (without frequency weighting). This analysis is carried out in real time for all bands and throughout the entire dynamic range of measurement (without scale changes), measuring the equivalent level for the measurement time (t), the consecutive integration time (T) and every 125 ms ("short" functions). At the same time as the spectrum, the SC420 measures the global equivalent level with frequency weighting A, C and Z, together with other sound level meter functions.
The most important applications offered by this mode are: measurement of acoustic insulation in third octave bands, evaluation of environmental noise including corrections for the presence of tonal and impulsive components and low-frequency content, the detection and identification of noise sources, etc.
NOTE: This is an optional mode that can be purchased when you buy the SC420 or later on. See chapter 22.

Chapter 13 Measurement modes 53
13.4.1 Spectrum analyser mode 1/3 functions
The SC420, as a third octave band spectrum analyser, measures in the complete dynamic range (one single scale) and, simultaneously, all the functions indicated below:
TIMEBASE FUNCTIONS
t: Measurement time
LXt, LAIt, LAFmaxt, LASmaxt, LAImaxt, (LAIt-LAt), (LAFmaxt-LAt), (LAImaxt-LAFmaxt), (LAImaxt-LASmaxt), (LCt-LAt), LAnt
Lft
T: Programmed integration time
LXT, LAIT, LAFmaxT, LASmaxT, LAImaxT, (LAIT-LAT), (LAFmaxT-LAT), (LAImaxT-LAFmaxT), (LAImaxT-LASmaxT), (LCT-LAT), LAnt
LfT
125 ms LX125ms*, LAI125ms*, LAFmax125ms*, LASmax125ms*, LAImax125ms*
Lf125ms*
X: indicates the frequency weighting A, C and Z. All functions are measured simultaneously with the three frequency weightings.
n: 1%, 5%, 10%, 50%, 90%, 95% and 99%
f: indicates the third octave band filter with central frequencies of 10, 12.5, 16, 20, 25, 31.5, 40, 50, 63, 80, 100, 125, 160, 200, 250, 315, 400, 500, 630, 800, 1000 (1k), 1250 (1.25k), 1600 (1.6k), 2000 (2k), 2500 (2.5k), 3150 (3.15k), 4000 (4k), 5000 (5k), 6300 (6.3k), 8000 (8k), 10000 (10k), 12500 (12.5k), 16000 (16k) and 20000 (20k) Hz. All functions are measured simultaneously with all third octave band filters and without frequency weighting.
*: These functions are measured by the SC420 but are not displayed on screen. The results of these functions can be obtained by making a recording and then downloading it to a PC with
Memory Download (see 17.2)
Percentiles are calculated through the LA125ms functions with class of 0.5 dB.
For the name and definition of each of the functions measured, please see chapter 23.
13.4.2 1/3 spectrum analyser mode prior adjustments
Configure the integration time (T) used in the evaluation of spectral and global levels (see 15.3.1).
13.4.3 1/3 spectrum analyser mode screens
The 1/3 octave band spectrum analyser mode of the SC420 has the following screens:
Graphic
Numeric
Time history graphic
Advanced
Statistical
54 Chapter 13 Measurement modes
The different screens let you view the functions measured (all are measured at the same time). To change screen, you do not need to stop the measurement. All
the screens are available for any sound level meter status: .
In the and menus you can configure the integration time (T) (see 15.3.1).
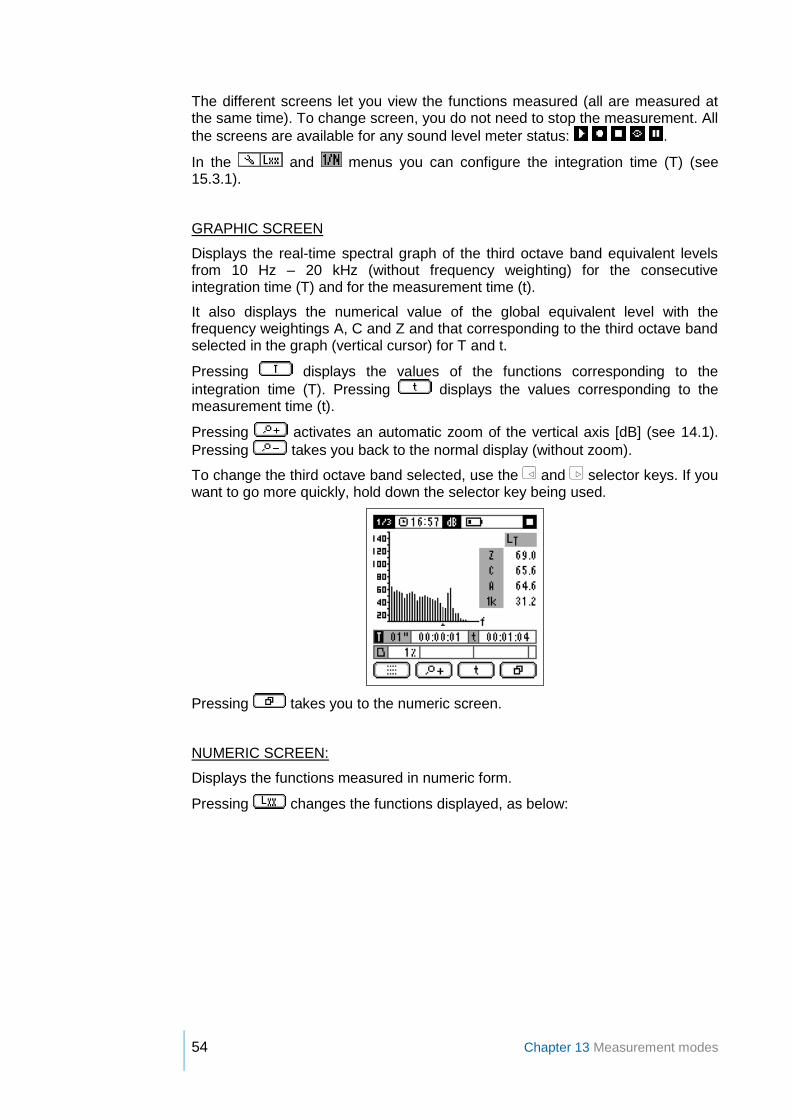
GRAPHIC SCREEN
Displays the real-time spectral graph of the third octave band equivalent levels from 10 Hz – 20 kHz (without frequency weighting) for the consecutive integration time (T) and for the measurement time (t).
It also displays the numerical value of the global equivalent level with the frequency weightings A, C and Z and that corresponding to the third octave band selected in the graph (vertical cursor) for T and t.
Pressing displays the values of the functions corresponding to the
integration time (T). Pressing displays the values corresponding to the measurement time (t).
Pressing activates an automatic zoom of the vertical axis [dB] (see 14.1).
Pressing takes you back to the normal display (without zoom).
To change the third octave band selected, use the and selector keys. If you want to go more quickly, hold down the selector key being used.
Pressing takes you to the numeric screen.
NUMERIC SCREEN:
Displays the functions measured in numeric form.
Pressing changes the functions displayed, as below:
Chapter 13 Measurement modes 55
Pressing displays the values of the functions corresponding to the
integration time (T). Pressing displays the values corresponding to the measurement time (t).
Pressing takes you to the time history graphic screen.
TIME HISTORY GRAPHIC SCREEN:
Displays the time history of the LAT function: equivalent level with frequency weighting A and integration time (T). Provides a graphic representation of the last 60 values measured. It also displays the numerical value of the LAT and LAt functions.
Pressing activates an automatic zoom of the vertical axis [dB] (see 14.1).
Pressing takes you back to the normal display (without zoom).
Pressing takes you to the advanced screen.

56 Chapter 13 Measurement modes
ADVANCED SCREEN:
Displays special acoustic functions: impulsiveness indicators, indicators of low-frequency spectral content and functions specific to local, national and international standards.
Pressing changes the functions displayed.
Pressing displays the values of the functions corresponding to the
integration time (T). Pressing displays the values corresponding to the measurement time (t).
Pressing takes you to the statistical screen.
STATISTICAL SCREEN:
Numerically displays the global percentile values with frequency weighting A, with integration time (T) and integration time corresponding to the measurement time (t) (at the end of the measurement).
Pressing displays the percentiles corresponding to the integration time (T).
Pressing displays the percentiles corresponding to the measurement time (t).
Pressing takes you to the graphic screen.

Chapter 13 Measurement modes 57
13.5 Octave (1/1) and third octave (1/3) band reverberation time (interrupted noise method) modes (OPTIONAL)
The octave band reverberation time (interrupted noise method) mode and the third octave band reverberation time (interrupted noise method) mode behave
similarly; the mode measures the reverberation time for octave bands from
63 Hz to 8 kHz and the mode measures it for third octave bands from 50 Hz to 10 kHz. The interrupted noise consists of obtaining the sound pressure level decay as a function of time inside the room that is being studied. This decay is obtained exciting the room with random noise of broadband or of limited bandwidth and recording the decay level of the sound pressure when the noise emission is cut abruptly. The reverberation times T20 and T30 are obtained automatically by evaluating the decay curve, using a linear regression analysis by the method of least square approximation.
To take this measurement, you will need an omni-directional pressure source (FP122) that emits a broadband noise (pink or white noise).
With these modes, the SC420 simultaneously measures the value of T20, T30 and the decay curves, together with parameters for the evaluation of quality (C, ξ and B·T).
The applications of these modes include the measurement of reverberation time in rooms, the measurement of the absorption coefficients in reverberation rooms, and the measurement of insulation in buildings and of building elements.
13.5.1 Octave (1/1) and third octave (1/3) band reverberation time (interrupted noise method) mode functions
The SC420, in the octave and third octave band reverberation time (interrupted noise method) modes, measures the functions indicated below in the complete dynamic range (one single scale):
MODE FUNCTIONS FREQUENCIES
1/1 octave band reverberation time mode (interrupted noise method)
T20, T30, LN, Δ, C, ξ20, B·T20, ξ30 , B·T30 and the decay curve
For octave band filters with central frequencies of 63, 125, 250, 500, 1000 (1k), 2000 (2k), 4000 (4k), 8000 (8k) Hz
One-third (1/3) octave band reverberation time mode (interrupted noise method)
T20, T30, LN, Δ, C, ξ20, B·T20, ξ30 , B·T30 and the decay curve
For third octave band filters with central frequencies of 50, 63, 80, 100, 125, 160, 200, 250, 315, 400, 500, 630, 800, 1000 (1k), 1250 (1.25k), 1600 (1.6k), 2000 (2k), 2500 (2.5k), 3150 (3.15k), 4000 (4k), 5000 (5k), 6300 (6.3k), 8000 (8k), 10000 (10k) Hz.
NOTE: These modes are optional and can be purchased at the same time as the SC420 or later on. See chapter 22.

58 Chapter 13 Measurement modes
All functions are measured with all octave band ( mode) and third octave band ( mode) filters, and without frequency weighting.
For the name and definition of each of the functions measured, please see chapter 23.
13.5.2 Taking a measurement in octave (1/1) and third octave (1/3) band reverberation time (interrupted noise method) modes
To measure the reverberation time (interrupted noise method), you should follow these three steps:
STEP 1: Measuring the background noise (LN)
Make sure that the sound emission from the pressure source is stopped.
Press to start measuring the sound pressure level (LN) corresponding to the background noise. This level will appear on screen (equivalent level of 1 second
in dB) for each octave or third octave band (depending on the mode: or ).
Press to validate this measurement. These values will stop oscillating and will become fixed.
STEP 2: Measuring the increase in sound pressure level, in relation to background noise (Δ)
The screen will display a new column of values corresponding to the increase in sound pressure level in relation to background noise, Δ (in dB), for each octave
or third octave band (depending on the mode: or ). Alongside these values, two indicators will appear ( and ) warning that the increase in sound pressure level in relation to background noise, for the calculation of the T20 and T30 in the bands of interest, is not enough. The value of Δ must be at least 35 dB and 45 dB to calculate T20 and T30 respectively.
Gradually increase the level of the sound pressure source until the indicators and disappears. Once the source is emitting the necessary sound pressure level, wait a few seconds to allow the acoustic field to reach a stable state.
Press to validate this level. These values will stop oscillating and will become fixed.
STEP 3: Measuring the decay curve
From this point, the SC420 will wait for you to interrupt the noise emission.
Stop the noise emission. From this moment, the device measures the decay in the sound pressure level. During this time, it is essential to keep silent so as not to interfere with the measurement.
Indicates that the value of Δ is not enough to calculate T20 and T30.
Indicates that the value of Δ is not enough to calculate T30.

Chapter 13 Measurement modes 59
After a few seconds, after the noise emission ceases, the screen will display the values of T20 and T30 for each octave or third octave band (depending on the
mode: or ) and the measurement will end automatically.
If next to the value of T20 or T30 the indicator appears, this is an alert to an incident in the quality parameters (C, ξ and/or B·T) as the decay curve from which they are calculated is far from regular line or is influenced by the filters (see the Quality Numeric Screen in subsection 13.5.3).
For the device to display the T20 and T30 results on screen, these must be at least 0.12 seconds, in addition to complying with the minimum level of Δ (35 dB and 45 dB). If these conditions are not fulfilled, the screen will display - - -.
During the measurement, the following information will appear on the screen:
INDICATOR AREA: ongoing measurement indicator . The units of the functions that appear in the work area will also be displayed (only for the Graphic Screens).
WORK AREA: the functions measured and indicators (if applicable).
The functions calculated do not appear until the measurement has ended ( ) together with the indicators, if applicable.
Once the measurement has started, it can be interrupted by pressing . The
measurement status indicator will change from to .
13.5.3 Screens in the octave (1/1) and third octave (1/3) band reverberation time (interrupted noise method) modes
The octave and third octave band reverberation time (interrupted noise method) modes of the SC420 have the following screens:
Numeric
Graphic Noise Level
Graphic Reverberation Time
Numeric Quality
Graphic Decay Curves
The different screens display the functions measured and calculated. While
measuring , the device allows you to change from the Numeric Screen to the
Graphic Noise Level Screen. Once the measurement is completed or , all screens are available.
NUMERIC SCREEN:
Displays the values of the background noise (LN), the increase in noise level in relation to the background noise (Δ) together with its indicators, if applicable (see 13.5.2), and the T30 and T20 octave or third octave band reverberation time,
depending on the or mode, together with its indicator, if applicable (see 13.5.2).
The mode displays the values for the 24 bands of third octave bands: to
display all of them, use the contextual key .

60 Chapter 13 Measurement modes
Pressing takes you to the Noise Level Graphic Screen.
NOISE LEVEL (LN and Δ) GRAPHIC SCREEN:
Displays the spectral graph for the background noise levels (LN) and for the increase in level in relation to the background noise (Δ) in octave or third octave
bands, depending on the or mode. It also displays the numerical value for the background noise level (LN) and for the increase in noise level in relation to the background noise (Δ), corresponding to the band selected in the graph (vertical cursor) together with its indicators, if applicable (see 13.5.2).
Pressing activates an automatic zoom of the vertical axis [dB] (see 14.1).
Pressing takes you back to the normal display (without zoom).
To change the band selected, use the and selector keys.
Pressing takes you to the Reverberation Time Graphic Screen.
REVERBERATION TIME (T20 and T30) GRAPHIC SCREEN:
Displays the spectral graph for T20 and T30 in octave or third octave bands,
depending on the or mode. It also displays the numeric value for T20 and T30, corresponding to the band selected in the graph (vertical cursor) together with its indicator, if applicable (see 13.5.2).
Pressing activates an automatic zoom of the vertical axis [s] (see 14.1).
Pressing takes you back to the normal display (without zoom).
To change the band selected, use the and selector keys.

Chapter 13 Measurement modes 61
Pressing displays the graph corresponding to the T30 reverberation time.
Pressing displays the graph corresponding to the T20 reverberation time.
Pressing takes you to the Quality Numeric Screen.
QUALITY (C, ξ and B·T) NUMERIC SCREEN:
Displays the values for the curvature parameter (C), the non-linearity parameter (ξ) and the multiplication of the filter bandwidth and the calculated reverberation
time (B·T), in octave or third octave bands, depending on the or mode.
Next to the previous values appears the indicator , warning that the result should be identified as less reliable. This indicator appears:
If ξ is greater than the value currently programmable (see 15.3.1), as the decay curve is considered to be far from a regular line.
If C is negative or greater than 10%, as the decay curve is considered to be far from a regular line.
If B·T is less than or equal to 16, as the decay curve is considered to be influenced by the filter.
Where the value of B·T is greater than 999, this is represented as: >999.
Without the value of T20 and T30, you cannot obtain the results for C, ξ20, ξ30, B·T20 or B·T30 , and the screen indicates this by displaying: - - -.
The mode displays the values for the 24 bands of third octave bands: to
display all of them, use the contextual key.
Pressing displays the values ξ30 and B·T30 (ξ and B·T calculated for the T30
reverberation time). Pressing displays the values ξ20 and B·T20 (ξ and B·T calculated for the T20 reverberation time).
Pressing takes you to the Decay Curves Graphic Screen.

62 Chapter 13 Measurement modes
DECAY CURVES GRAPHIC SCREEN:
The graph shows the time history of the decay curve, corresponding to the band selected.
It also numerically displays the value for the background noise level (LN), the value for the increase in level in relation to the background noise (Δ) and the values for the T20 and T30 reverberation times together with their indicators, if applicable (see 13.5.2), corresponding to the band selected.
The mode displays the values for the 24 bands of third octave bands.
Pressing activates an automatic zoom of the vertical axis [dB] (see 14.1).
Pressing takes you back to the normal display (without zoom).
To change the band selected, use the and selector keys.
Pressing takes you to the Numeric Screen.
13.6 Octave (1/1) and third octave (1/3) band reverberation time (integrated impulse response method) modes (OPTIONAL)
The octave band reverberation time (integrated impulse response method) mode and the third octave band reverberation time (integrated impulse response
method) mode behave similarly; the mode measures the reverberation time
for octave bands from 63 Hz to 8 kHz and the mode measures it for third octave bands from 50 Hz to 10 kHz. The integrated impulse response method involves obtaining the decay curve for the sound pressure level from the impulse response of the room under study using Schroeder's method.
First of all the response of the room to a Dirac impulse is measured, obtaining the impulse response. Next, the decay curve is obtained by performing the backward integration of the impulse response according to Schroeder's method. The reverberation times T20 and T30 are obtained automatically by evaluating the
NOTE: These modes are optional and can be purchased at the same time as the SC420 or later on. See chapter 22.

Chapter 13 Measurement modes 63
decay curve, using a linear regression analysis by the method of least square approximation.
As, in practice, it is impossible to emit a Dirac delta, you can emit short transient sounds similar enough to take the measurements.
With these modes, the SC420 simultaneously measures the value of T20, T30 and the decay curves, together with the parameters for the evaluation of quality (C, ξ and B·T).
The applications of these modes include the measurement of reverberation time in rooms, the measurement of the absorption coefficients in reverberation rooms, and the measurement of insulation in buildings and of building elements.
13.6.1 Octave (1/1) and third octave (1/3) band reverberation time (integrated impulse response method) mode functions
The SC420, in the octave and third octave reverberation time (integrated impulse response method) modes, measures the functions indicated below in the complete dynamic range (one single scale):
MODE FUNCTIONS FREQUENCIES
Reverberation time (integrated impulse response method) in 1/1 octave bands
T20, T30, LN, Δ, C, ξ20, B·T20, ξ30, B·T30, the impulse response and the decay curve
For octave band filters with central frequencies of 63, 125, 250, 500, 1000 (1k), 2000 (2k), 4000 (4k), 8000 (8k) Hz.
Reverberation time (integrated impulse response method) in one-third (1/3) octave bands
T20, T30, LN, Δ, C, ξ20, B·T20, ξ30, B·T30, the impulse response and the decay curve
For third octave band filters with central frequencies of 50, 63, 80, 100, 125, 160, 200, 250, 315, 400, 500, 630, 800, 1000 (1k), 1250 (1.25k), 1600 (1.6k), 2000 (2k), 2500 (2.5k), 3150 (3.15), 4000 (4k), 5000 (5k), 6300 (6.3k), 8000 (8k), 10000 (10k) Hz.
All functions are measured with all octave band ( mode) and third octave band ( mode) filters, and without frequency weighting.
For the name and definition of each of the functions measured, please see chapter 23.
13.6.2 Taking a measurement in octave (1/1) and third octave (1/3) band reverberation time (integrated impulse response method) modes
To measure the reverberation time (integrated impulse response method), the three steps below should be followed:
STEP 1: Measuring the background noise (LN)
Press to start measuring the sound pressure level (LN) corresponding to the background noise. This level will appear on screen (equivalent level of 1 second
in dB) for each octave or third octave band (depending on the mode: or ).

64 Chapter 13 Measurement modes
Press to validate this measurement. The values will stop oscillating and will become fixed.
STEP 2: Generating the impulsive noise
Generate an impulsive noise such as an alarm (or any other non-reverberant source, but that its spectrum is broad enough) to measure the impulse response of the room. From this moment, it is essential to remain silent, so as not to interfere with the measurement.
STEP 3: Measuring the decay curve
A few seconds later, after generating the impulsive noise, the screen will display the values corresponding to the increase in sound pressure level, in relation to the background noise Δ (in dB) for each octave or third octave band (depending
on the mode: or ). Alongside these values, two indicators will appear ( and ) warning that the increase in sound pressure level in relation to background noise, for the calculation of the T20 and T30 in the bands of interest, is not enough. The value of Δ must be at least 35 dB and 45 dB to calculate T20 and T30 respectively.
The screen will also display the values of T20 and T30 for each octave or third
octave band (depending on the mode: or ) and the measurement will end automatically.
If next to the value of T20 or T30 the indicator appears, this is an alert to an incident in the quality parameters (C, ξ and/or B·T) as the decay curve from which they are calculated is far from regular line or is influenced by the filters (see the Quality Numeric Screen in subsection 13.5.3).
For the device to display the T20 and T30 results on screen, these must be at least 0.12 seconds, in addition to complying with the minimum level of Δ (35 dB and 45 dB). If these conditions are not fulfilled, the screen will display - - -.
During the measurement, the following information will appear on the screen:
INDICATOR AREA: ongoing measurement indicator . The units of the functions that appear in the work area will also be displayed (only for the graphic screens).
WORK AREA: the background noise function.
The other functions appear when the measurement ends ( ) together with the indicators, if applicable.
Once the measurement has started, it can be interrupted by pressing . The
measurement status indicator will change from to .
Indicates that the value of Δ is not enough to calculate T20 and T30.
Indicates that the value of Δ is not enough to calculate T30.
If one of these indicators appears in the frequency of interest it is recommended to repeat the measurement.

Chapter 13 Measurement modes 65
13.6.3 Octave (1/1) and third octave (1/3) band reverberation time (integrated impulse response method) mode screens
The octave and third octave band reverberation time (integrated impulse response method) modes of the SC420 have the following screens:
Numeric
Graphic Noise Level
Graphic Reverberation Time
Numeric Quality
Graphic Curve
The different screens display the functions measured and calculated. While
measuring , the device allows you to change from the numeric screen to the
graphic noise level screen. Once the measurement is completed or , all screens are available.
NUMERIC SCREEN:
Displays the values of the background noise (LN), the increase in noise level in relation to the background noise (Δ) together with its indicators, if applicable (see 13.6.2), and the T30 and T20 octave or third octave band reverberation time,
depending on the or mode together with its indicator, if applicable (see 13.6.2).
The mode displays the values for the 24 bands of third octave bands: to
display all of them, use the contextual key.
Pressing takes you to the graphic noise level screen.
NOISE LEVEL GRAPHIC SCREEN (LN and Δ):
Displays the spectral graph for the background noise levels (LN) and for the increase in level in relation to the background noise (Δ) in octave or third octave
bands, depending on the or mode. It also displays the numerical value for the background noise level (LN) and for the increase in noise level in relation to the background noise (Δ), corresponding to the band selected in the graph (vertical cursor) together with its indicators, if applicable (see 13.6.2).
Pressing activates an automatic zoom of the vertical axis [dB] (see 14.1).
Pressing takes you back to the normal display (without zoom).
To change the band selected, use the and selector keys.
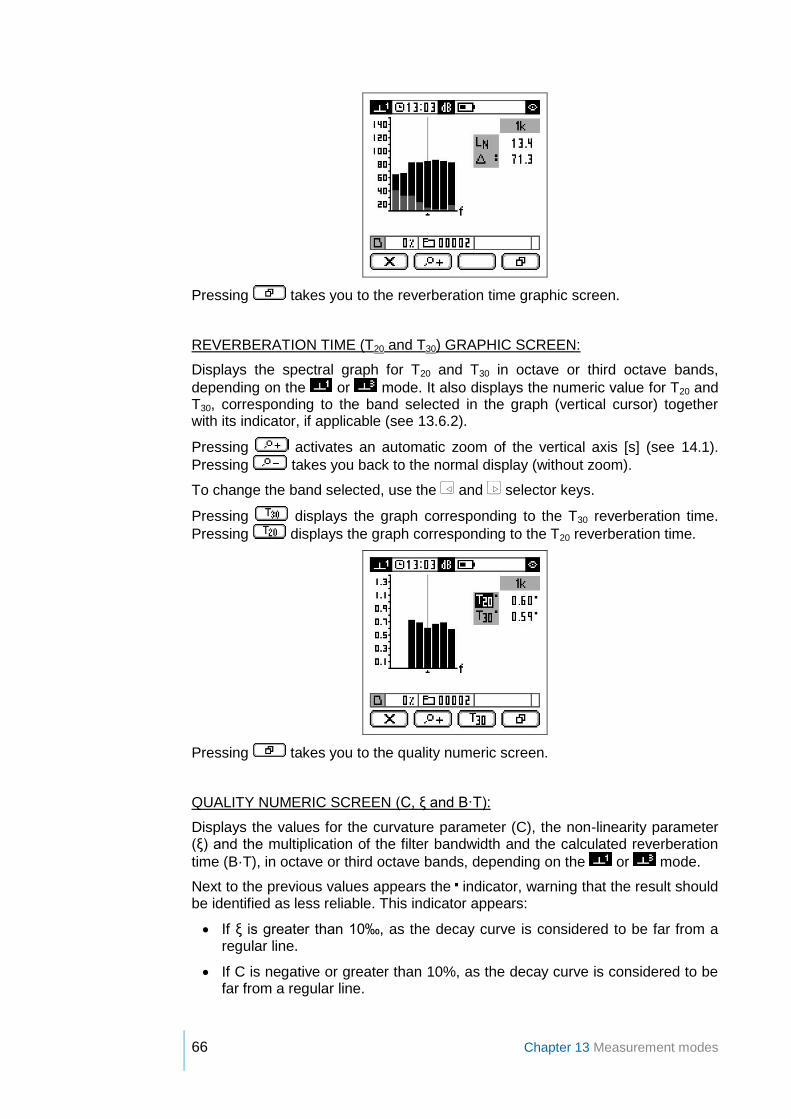
66 Chapter 13 Measurement modes
Pressing takes you to the reverberation time graphic screen.
REVERBERATION TIME (T20 and T30) GRAPHIC SCREEN:
Displays the spectral graph for T20 and T30 in octave or third octave bands,
depending on the or mode. It also displays the numeric value for T20 and T30, corresponding to the band selected in the graph (vertical cursor) together with its indicator, if applicable (see 13.6.2).
Pressing activates an automatic zoom of the vertical axis [s] (see 14.1).
Pressing takes you back to the normal display (without zoom).
To change the band selected, use the and selector keys.
Pressing displays the graph corresponding to the T30 reverberation time.
Pressing displays the graph corresponding to the T20 reverberation time.
Pressing takes you to the quality numeric screen.
QUALITY NUMERIC SCREEN (C, ξ and B·T):
Displays the values for the curvature parameter (C), the non-linearity parameter (ξ) and the multiplication of the filter bandwidth and the calculated reverberation
time (B·T), in octave or third octave bands, depending on the or mode.
Next to the previous values appears the indicator, warning that the result should be identified as less reliable. This indicator appears:
If ξ is greater than 10‰, as the decay curve is considered to be far from a regular line.
If C is negative or greater than 10%, as the decay curve is considered to be far from a regular line.

Chapter 13 Measurement modes 67
If B·T is less than or equal to 16, as the decay curve is considered to be influenced by the filter.
Where the value of B·T is greater than 999, this is represented as: >999.
The mode displays the values for the 24 third octave bands: to display all of
them, use the contextual key.
Pressing displays the values ξ30 and B·T30 (ξ and B·T calculated for the T30
reverberation time). Pressing displays the values ξ20 and B·T20 (ξ and B·T calculated for the T20 reverberation time).
Pressing takes you to the graphic curves screen.
GRAPHIC CURVES SCREEN:
Displays the graph of the time history for the impulse response and for the decay curve from which T20 and T30 are calculated, corresponding to the band selected.
It also numerically displays the value for the background noise level (LN), the value for the increase in level in relation to the background noise (Δ) and the values for the T20 and T30 reverberation times together with their indicators, if applicable (see 13.6.2), corresponding to the band selected.
Pressing displays the graph corresponding to the time history for the
impulse response. Pressing displays the decay curve obtained through the backward integration method. The decay curve is standardised so that the maximum level is 140 dB.
Pressing activates an automatic zoom of the vertical axis [dB] (see 14.1).
Pressing takes you back to the normal display (without zoom).
To change the band selected, use the and selector keys.
Pressing takes you to the numeric screen.

68 Chapter 13 Measurement modes
13.7 Occupational noise mode (OPTIONAL)
The occupational noise mode of the SC420 is designed for the implementation of ISO 9612:2009 on the determination of exposure to noise at work.
The occupational noise mode simultaneously measures all the parameters required to assess the levels of noise to which workers are exposed with or without hearing protectors (SNR, HML and Octaves). To do this, in addition to measuring the equivalent level with weighting A and C (SNR and HML methods), the SC420 simultaneously performs a real-time frequency analysis by octave bands from 63 Hz to 8 kHz (Octave method).
The device also lets you take measurements that are shorter in duration than the exposition time, as the screen displays the parameters projected to the expected exposure time [programmable time of projection (tp)].
13.7.1 Occupational noise mode functions
The SC420, as an occupational noise mode, measures in the complete dynamic range (one single scale) and, simultaneously, all the functions indicated below:
TIME BASIS FUNCTIONS
t: Measurement time
LAt, LCt, LCpeakt
LfXt
LEX,8h*, E*, DOSE*, LEX,8hp*, Ep*, DOSEp*
T: Programmed integration time
LAT, LCt, LCpeakt
LfXt
f: indicates the octave band filter with central frequencies of 63, 125, 250, 500, 1000 (1k), 2000 (2k), 4000 (4k) and 8000 (8k) Hz. All functions are measured simultaneously with all octave band filters and with or without frequency weighting A (see 15.3.1)
X: frequency weighting (A or without weighting)
*: The functions LEX,8h, LEX,8hp, E, Ep, DOSE and DOSEp are not saved but they are evaluated according to the LC and tp values each time they are recovered.
13.7.2 Occupational noise mode prior adjustments
Configure the criterion level (LC), the time of projection (tp), the integration time (T) and, if applicable, the frequency weighting (A) in the spectral analysis in octave bands (A+1/1) (see 15.3.1).
NOTE: This is an optional mode that can be purchased when you buy the SC420 or later on. See chapter 22.

Chapter 13 Measurement modes 69
13.7.3 Occupational noise mode screens
The occupational noise mode of the SC420 has the following screens:
Numeric
Spectral
Graphic Time
The different screens let you view the functions measured (all are measured at the same time). To change screen, you do not need to stop the measurement. All
the screens are available for any device status: .
In the menu, you can configure the criterion level (LC), the time of projection (tp) and whether the frequency weighting (A) is included in the spectral
analysis in octave bands or not .
NUMERIC SCREEN:
Displays in real time the numerical value for the equivalent daily exposure level (LEX,8h), together with the equivalent levels (LAt), LCt) and the peak level (LCpeak). It also shows the sound exposure (E) and the noise dose (DOSE) in relation to the criterion level (LC).
Pressing changes the functions displayed, as below:
Pressing displays the values of the projected noise exposure functions
(LEX,8hp, Ep and DOSEp) in relation to the time of projection (tp). Pressing displays the values (LEX,8h, E and DOSE) corresponding to the measurement time (t).
The projected functions determine the expected noise exposure for an exposure time equal to the programmed time of projection (tp).
Pressing takes you to the spectral screen.
SPECTRAL SCREEN:
Displays the real-time spectral graph of the octave band equivalent levels from 63 Hz to 8 kHz (with or without frequency weighting A) for the consecutive integration time (T) and for the measurement time (t).
It also displays the numerical value of the global equivalent level with the frequency weightings A and C, that corresponding to the octave band selected in

70 Chapter 13 Measurement modes
the graph (vertical cursor) and the peak level with frequency weighting C for T and t.
Pressing displays the values of the functions corresponding to the
integration time (T). Pressing displays the values corresponding to the measurement time (t).
Pressing activates an automatic zoom of the vertical axis [dB] (see 14.1).
Pressing takes you back to the normal display (without zoom).
To change the octave band selected, use the and selector keys.
Pressing takes you to the Graphic time history screen.
TIME HISTORY GRAPHIC SCREEN:
Displays the time history of the LAT function: equivalent level with frequency weighting A and integration time (T). It provides a graphic representation of the last 60 values measured. It also displays the numerical value of the LAT and LAt functions.
Pressing activates an automatic zoom of the vertical axis [dB] (see 14.1).
Pressing takes you back to the normal display (without zoom).
Pressing takes you to the numeric screen.
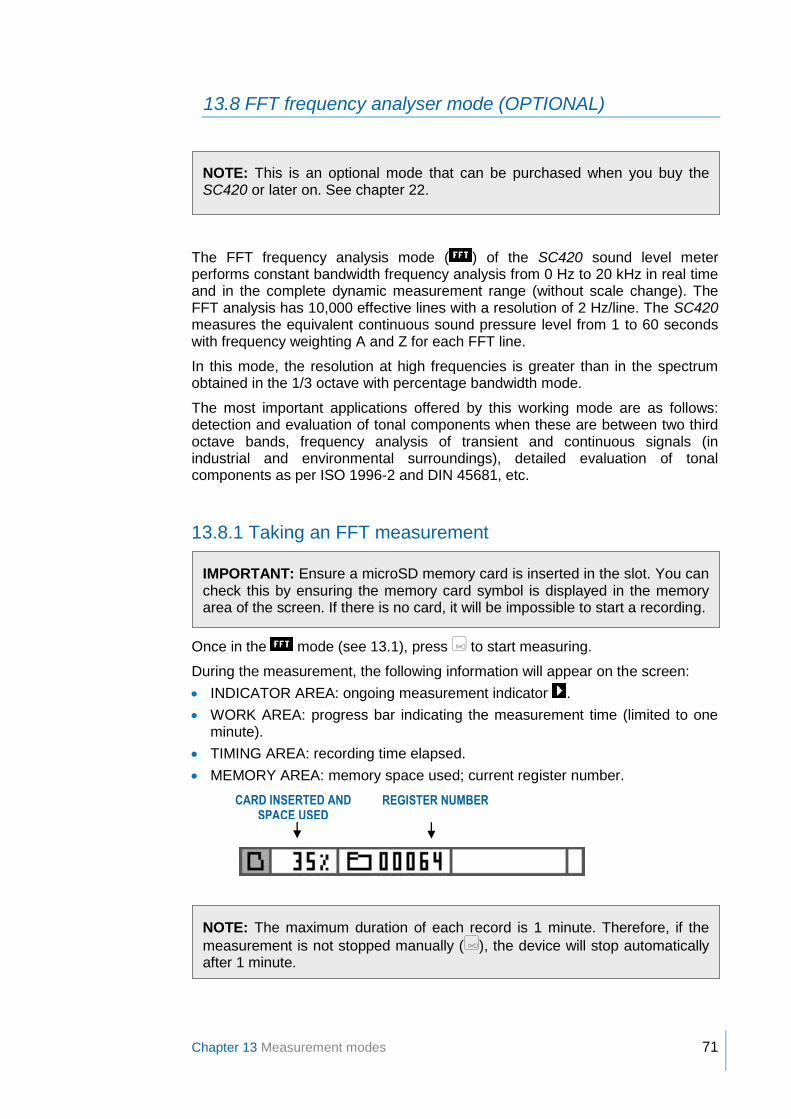
Chapter 13 Measurement modes 71
13.8 FFT frequency analyser mode (OPTIONAL)
The FFT frequency analysis mode ( ) of the SC420 sound level meter performs constant bandwidth frequency analysis from 0 Hz to 20 kHz in real time and in the complete dynamic measurement range (without scale change). The FFT analysis has 10,000 effective lines with a resolution of 2 Hz/line. The SC420 measures the equivalent continuous sound pressure level from 1 to 60 seconds with frequency weighting A and Z for each FFT line.
In this mode, the resolution at high frequencies is greater than in the spectrum obtained in the 1/3 octave with percentage bandwidth mode.
The most important applications offered by this working mode are as follows: detection and evaluation of tonal components when these are between two third octave bands, frequency analysis of transient and continuous signals (in industrial and environmental surroundings), detailed evaluation of tonal components as per ISO 1996-2 and DIN 45681, etc.
13.8.1 Taking an FFT measurement
Once in the mode (see 13.1), press to start measuring.
During the measurement, the following information will appear on the screen:
INDICATOR AREA: ongoing measurement indicator .
WORK AREA: progress bar indicating the measurement time (limited to one minute).
TIMING AREA: recording time elapsed.
MEMORY AREA: memory space used; current register number.
CARD INSERTED AND SPACE USED
NOTE: The maximum duration of each record is 1 minute. Therefore, if the
measurement is not stopped manually ( ), the device will stop automatically after 1 minute.
IMPORTANT: Ensure a microSD memory card is inserted in the slot. You can check this by ensuring the memory card symbol is displayed in the memory area of the screen. If there is no card, it will be impossible to start a recording.
NOTE: This is an optional mode that can be purchased when you buy the SC420 or later on. See chapter 22.
REGISTER NUMBER

72 Chapter 13 Measurement modes
Once the measurement has started, it can be stopped by pressing .
After completing the measurement, the sound level meter processes the data measured to obtain the FFT narrow band frequency analysis. This step can take several minutes. During this time, a clock appears in the work area, together with
the percentage indicating the progress of this process. Finally, the status indicator appears.
To save the measurement to memory, please see 16.1.
13.8.2 FFT frequency analysis mode screen
After finishing the measurement, the SC420 presents all the information on a single screen:
FFT GRAPHIC SCREEN:
Displays the graph of the equivalent continuous sound pressure level for each FFT line with frequency weighting A and Z. At the top right of this work area appears the indicator for the frequency weighting displayed.
In the timings area the indicator of the frequency interval displayed appears, together with the numerical value of the frequency and of the equivalent continuous sound pressure level for the FFT line selected by the cursor, and the integration time.
The equivalent continuous sound pressure level for each line corresponds to the energy average of the equivalent continuous sound pressure levels of the frequencies contained in the line.
The memory area displays the used memory space.
Pressing displays the data with frequency weighting A. Pressing displays the data with frequency weighting Z.
To change the band selected, use the and selector keys. If you want to go more quickly, hold down the selector key being used.
This screen allows you to select the number of lines displayed (1x, 2x, 5x, 10x, 20x, 50x and 100x). Only the display will change, because the resolution of the evaluation will always remain the same.
Frequency interval
Display resolution (Hz/line)
No. of lines displayed
1x 200 100
2x 100 200
5x 40 500
10x 20 1,000
20x 10 2,000
50x 4 5,000
100x 2 10,000
To change the frequency interval displayed, use the and keys.

Chapter 13 Measurement modes 73
13.9 Audio recording mode (analysis quality) (OPTIONAL)
The audio recording mode (analysis quality) enables you to save the audio signal received by the microphone on the memory card.
This signal is saved without compressing; it is therefore suitable for professional use. As there is no loss of quality, it can provide all the information required to carry out post-processing in much greater detail, if you have the right software.
This mode may be advantageous whatever application you are working in, since it can provide you, after the fact, with much more information on the situation under study.
13.9.1 Making an audio recording (analysis quality)
Once in the mode (see 13.1), press or to begin the audio recording process.
During the recording, the following information will appear on the screen:
INDICATOR AREA: recording in progress indicator .
WORK AREA: progress bar indicating the measurement time. Limited to 1 minute.
TIMING AREA: recording time elapsed.
MEMORY AREA: memory space used, number of the current record and number of the audio file associated with the recording in progress (record number).
IMPORTANT: Ensure a microSD memory card is inserted in the slot. You can check this by ensuring the memory card symbol is displayed in the memory area of the screen. If there is no card, it will be impossible to start a recording.
NOTE: This is an optional mode that can be purchased when you buy the SC420 or later on. See chapter 22.

74 Chapter 13 Measurement modes
Once the recording has started, it can be stopped by pressing .
After the recording ends, the sound level meter saves the audio file to memory (see 16.2.1). This step can take several minutes. During this time, a clock appears in the work area, together with the percentage indicating the progress of
this process. Finally, the indicator area displays the status indicator .
The characteristics of the audio file (analysis quality) are:
Format: WAV
Resolution: 24 bits
Sampling frequency: 48 kHz
Depending on the dynamic range of the recorded signal, the SC420 can apply a constant gain of 36 dB throughout the recording. This is indicated in the file name:
record no.-036dB yyyy-mm-dd hh-mm-ss (file with gain)
record no.-000dB yyyy-mm-dd hh-mm-ss (file without gain)
CARD INSERTED AND SPACE USED
REGISTER NUMBER
AUDIO FILE NUMBER
NOTE: The maximum duration of each audio record is 1 minute. Therefore, if
the recording is not stopped manually ( ), the device will stop automatically after 1 minute.

Chapter 14 Advanced options 75
The SC420 includes advanced options to help the user while measuring and to make continuous noise monitoring possible without the user having to be present.
To help the user while measuring, the SC420 incorporates automatic zoom on graphic displays, Backerase, different marks and voice comments recording. For continuous monitoring with or without the user, the SC420 incorporates audio recording and time- and level-controlled automatic start/stop measurement/audio recording automatisms.
14.1 Zoom
The graphic representation of the wide dynamic measurement range of the SC420 does not allow the correct appraisal of very stable noise events on the graphic screens for time evaluation and spectral content.
A sound event with time variations of just a few decibels will appear represented as a virtually constant event. Likewise, a spectrum with small differences in level between bands will be represented practically as a pink noise.
The graphic display screens of the SC420 are equipped with the zoom option, which adapts the scale of the vertical axis to the dynamic range of the interval or spectrum of the sound event represented.
Pressing activates an automatic zoom of the vertical axis (or abscissas for the FFT mode). At any given moment, the scale of the axis could vary to obtain the best possible display of the range or spectrum represented. It is therefore possible to see variations that would otherwise be invisible.
Advanced options
14. Advanced options
14

76 Chapter 14 Advanced options
Pressing takes you back to the normal display (without zoom).
14.2 Backerase
While measuring a sound event, especially while measuring background noise, unexpected sounds can appear that do not correspond to the sound event you want to evaluate, and the sound level meter may end up measuring these. In these situations, you might like to use the Backerase option.
While the measurement is temporarily paused , this option lets you erase the last 10 seconds of the measurement or recording. It is essentially as if you had pressed the button 10 seconds sooner than you actually did.
To use the Backerase option:
Once you detect the appearance of an unwanted sound event during a measurement or recording and it has affected that process, stop it for a moment by pressing . The status indicator will change to measurement temporarily
paused .
Press and the last 10 seconds of the measurement or recording will be erased.
The Backerase option is available on any display screen while measurement or
recording is temporarily paused .
The Backerase option is not available for the following modes: time reverberation measurement; FFT frequency analysis; or analysis quality audio recording.
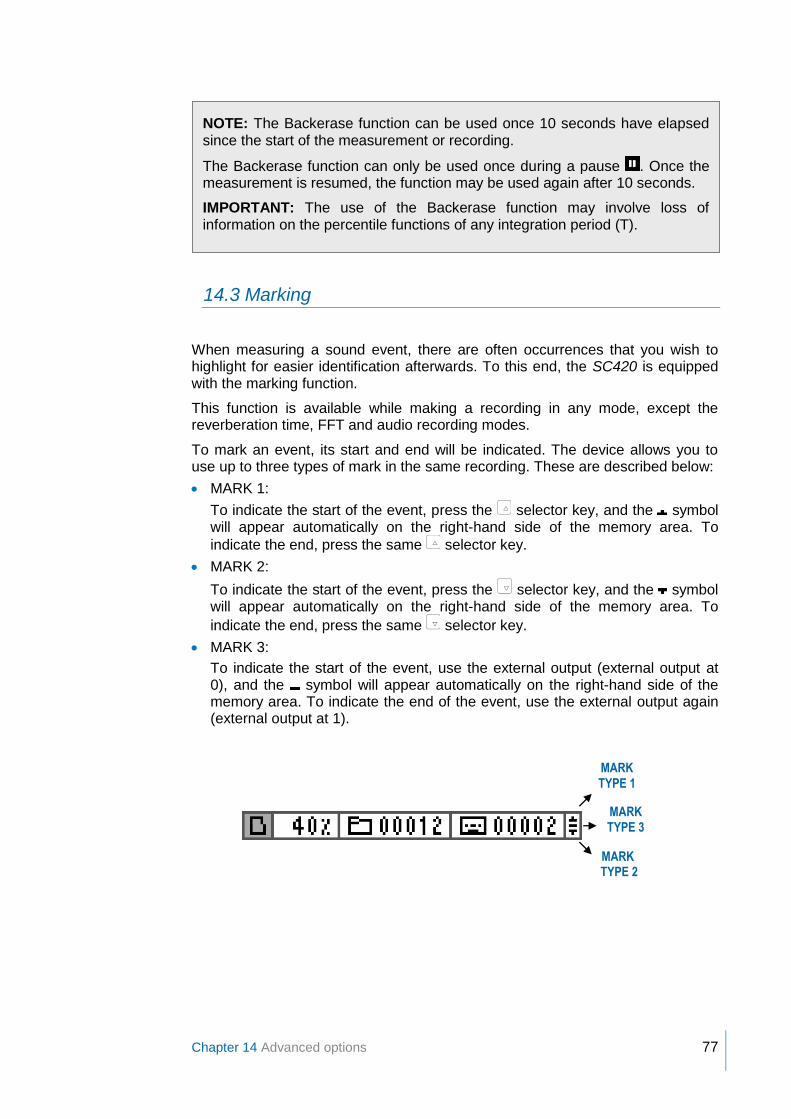
Chapter 14 Advanced options 77
14.3 Marking
When measuring a sound event, there are often occurrences that you wish to highlight for easier identification afterwards. To this end, the SC420 is equipped with the marking function.
This function is available while making a recording in any mode, except the reverberation time, FFT and audio recording modes.
To mark an event, its start and end will be indicated. The device allows you to use up to three types of mark in the same recording. These are described below:
MARK 1:
To indicate the start of the event, press the selector key, and the symbol will appear automatically on the right-hand side of the memory area. To
indicate the end, press the same selector key.
MARK 2:
To indicate the start of the event, press the selector key, and the symbol will appear automatically on the right-hand side of the memory area. To
indicate the end, press the same selector key.
MARK 3:
To indicate the start of the event, use the external output (external output at 0), and the symbol will appear automatically on the right-hand side of the memory area. To indicate the end of the event, use the external output again (external output at 1).
MARK TYPE 3
MARK TYPE 1
MARK TYPE 2
NOTE: The Backerase function can be used once 10 seconds have elapsed since the start of the measurement or recording.
The Backerase function can only be used once during a pause . Once the measurement is resumed, the function may be used again after 10 seconds.
IMPORTANT: The use of the Backerase function may involve loss of information on the percentile functions of any integration period (T).

78 Chapter 14 Advanced options
14.4 Voice comments
It is often necessary to make notes, comments and indications regarding the measurements, environment, etc. For example: comments on measuring points, decisions made on site or spontaneous ideas. To meet this need, the SC420 allows users to record voice comments quickly and easily.
This option uses the device's memory to store audio records with the comments made (see 16.3).These can be used to classify measurements, indicate their validity, etc.
To record a voice comments, accede to the main menu (see 12.1):
Press and the audio recording will start automatically.
The maximum duration of each voice comment is 15 seconds. Therefore, if it is
not interrupted manually , the device will stop the voice recording automatically after 15 seconds.
After recording, the sound level meter saves the audio file in memory (see 16.3). This step can take several seconds. During this time, a clock appears in the work area, together with the percentage indicating the progress of this process.
The characteristics of the audio files for "voice comments" are:
Format: WAV
Resolution: 16 bits
Sampling frequency: 24 kHz
Gain: automatic to optimise listening
The file-saving process can take several seconds (30s).
NOTE: You cannot record a voice comment if there is no microSD memory card inserted in the SC420 or if the card is full (see 16.2).

Chapter 14 Advanced options 79
14.5 Audio recording (listening quality)
The SC420 allows you to record audio files at the same time as recording
acoustic functions , for recognition and subjective evaluation of sound sources (listening quality).
Having the audio belonging to the sound pressure levels measured provides additional information that facilitates the evaluation of those levels and decision making.
Audio recording (listening quality) can be carried out either manually or by using configurable automatisms (timers and level triggers). For this last option, please see 14.6.3.
The audio recording option is available during any recording, regardless of the measurement mode.
Pressing initiates a 15-second audio recording (5 s prerecording, before pressing the key, plus 10 seconds of recording).The memory area displays the number of the audio file associated with the recording in progress (register number).
The maximum duration of each audio record is 15 seconds. Therefore, if the
recording is not interrupted manually ( ), the device will stop the audio recording automatically after 10 seconds.
After finishing the audio recording, the sound level meter saves an audio file to memory. The characteristics of the audio files for "listening quality" are:
Format: WAV
Resolution: 16 bits
Sampling frequency: 24 kHz
Gain: automatic to optimise listening
The process for saving audio files can take several seconds (30s) and does not affect the recording of acoustic functions. During this time, the audio recording key will not be available; it will reappear once the file-saving process has been completed.
CARD INSERTED AND SPACE USED
REGISTER NUMBER
AUDIO FILE NUMBER
NOTE: It is also possible to record audio fragments with analysis quality for subsequent reanalysis. To do so, use the analysis quality audio recording mode (see 13.9.1).

80 Chapter 14 Advanced options
14.6 Automatic settings: Timers and triggers
The SC420 has a complete system of automatic settings for starting and stopping measurement and audio recording using automatic timers and triggers activated by exceeding the threshold by time intervals. This extends even further the possibilities for using the SC420 as a stand-alone unit for continuous monitoring of noise, without having to be present to carry out a measurement.
14.6.1 Start measurement/recording automatically
This option enables measurements or recordings to be started automatically. In
the settings menu, you can set one of the following types of automatic start:
Without setting
Start set for specific time
Start set by waiting time
Start set by DEN level
Start set by external digital input
START SET FOR SPECIFIC TIME :
The SC420 waits for the clock to reach the programmed time hh:mm
before starting the measurement/recording.
START SET BY WAITING TIME :
The SC420 waits for the programmed waiting time to elapse hh:mm:ss
before starting the measurement/recording.
NOTE: You can only make audio recording during recording process. You
can never make an audio recording during a measurement , nor you can make an audio recording if there is no microSD memory card inserted in the SC420 or if the card is full (see 16.2).

Chapter 14 Advanced options 81
START SET BY DEN LEVEL :
The SC420 waits for the sound pressure level (LAeq1") to exceed the threshold of the current DEN time interval for more than t seconds before starting the measurement/recording.
START SET BY EXTERNAL DIGITAL INPUT :
The SC420 waits for the external digital input to read 0 before starting the measurement/recording.
Once the type of automatic start and its characteristics are set (see 15.3.3), access to the desired measurement mode and start a measurement or a
recording by pressing or . Then the or symbol in the indicator area shows that there is an automatic start of measurement or recording programmed, along with one of the following standby screens with the corresponding information.
Programmed start time
Time until start
Threshold level for start
Current LAeq1" level
Logical level for start
To exit the standby screen, stop the measurement/recording by pressing .
To configure that start of automatic recording/measurement, please see 15.3.3.
14.6.2 Automatically stop measuring/recording
This option enables a measurement or recording to be stopped automatically. In
the settings menu, you can set one of the following types of automatic stop:
Without setting
Stop set for a specific time
Stop set by waiting time
Stop set by DEN level
Stop set by external digital input

82 Chapter 14 Advanced options
STOP SET FOR A SPECIFIC TIME :
The SC420 waits for the clock to reach the programmed time hh:mm
before stopping the measurement/recording.
STOP SET BY WAITING TIME :
The SC420 waits for the programmed waiting time to elapse hh:mm:ss
before stopping the measurement/recording. The measurement/recording will last for the programmed duration.
STOP SET BY DEN LEVEL :
The SC420 waits for the sound pressure level (LAeq1") to fall below the threshold of the current DEN time interval for more than t seconds before stopping the measurement/recording.
STOP SET BY EXTERNAL DIGITAL INPUT :
The SC420 waits for the external digital input to read 1 before stopping the measurement/recording.
REPEAT OPTION:
If you have set an automatic start and stop measurement and have activated the repeat option , you can create a permanent measuring loop (see 15.3.3).
Once the type of automatic stop and its characteristics are set (see 15.3.3).
Access the desired measurement mode, press or to start a measurement or recording and wait for it to start (if there is any start programmed). Once it has started, the symbol will appear in the indicator area to show that the 'stop measurement or recording automatically' setting is programmed.
To configure the 'stop recording/measurement automatically' setting, please see 15.3.3.

Chapter 14 Advanced options 83
14.6.3 Automatic audio recording
This option enables you to make automatic audio recordings. To make an audio recording, whether automatic or manual, there must be a recording in progress (whether automatic or non-automatic).
Audio recordings are always 15 seconds in duration (5 seconds of prerecording and 10 seconds of recording after it starts). After 10 seconds, the audio file is saved (this takes approx. 30 seconds) and then the device waits for a new audio
recording while the recording is under way .
In the settings menu, you can set one of the following types of automatic audio recording:
Without setting
Audio recording set by time between recordings
Audio recording set by DEN level
Audio recording by external digital input
AUDIO RECORDING BY TIME BETWEEN RECORDINGS :
Firstly, the SC420 starts an audio recording. The SC420 then waits for the programmed waiting time between the start of recordings (hh:mm:ss)
to elapse and subsequently starts a new audio recording. This continues until the end of the recording .
AUDIO RECORDING BY DEN LEVEL :
Firstly, the SC420 waits for the sound pressure level (LAeq1") to exceed the threshold of the current DEN time interval for more than t seconds before starting the audio recording.
If the option NEW EVENT is deactivated , once the audio recording (5+10 seconds) ends and the file is saved, the SC420 waits for the sound pressure level (LAeq1") to exceed the threshold of the current DEN time interval for more than t seconds again before making a new audio recording. This
continues until the end of the recording .

84 Chapter 14 Advanced options
If the NEW EVENT option is activated , once the audio recording ends (5+10 seconds) and the file is saved, the SC420 waits for a new event before making a new audio recording. In other words the sound pressure level (LAeq1") needs to be lower than the threshold of the current DEN time interval for more than t seconds, subsequently exceeding it for more than t seconds. This
continues until the end of the recording .
While the SC420 is waiting for the conditions required to make an automatic audio recording, the symbol will appear in the memory area of the screen.
To configure automatic audio recording, see 15.3.3.
14.6.4 DEN intervals
The trigger thresholds for both recording/measurement and audio recording are closely linked to the limits indicated in environmental regulations and laws which typically set them for three evaluating time periods that split the day into: day, evening and night.
The automatic stop and start for measuring/recording and audio recording by
DEN level settings let you set trigger thresholds for three time intervals: ,
and .
In the settings menu, you can set the beginning and end of the three time intervals into which the day is divided:
DAY
EVENING
NIGHT
To configure the DEN intervals, please see 15.3.3.
NOTE: With this option, an audio file (15s) will only be recorded at the beginning of each sound event that exceeds the threshold, rather than record consecutively files throughout all events.

Chapter 14 Advanced options 85
14.6.5 Examples of automatic measurement settings
The following sections explain different settings for automatic stopping/starting of measurement/recording and automatic audio recording designed for a range of everyday situations:
Measurement of background noise in a home in a rural area
Assessment of exposure to noise at a factory
Monitoring the immission of an activity in a home
Monitoring the emissions produced by public highway cleaning and maintenance machinery
Continuous monitoring of a port infrastructure
Monitoring the noise generated by the loading and unloading of a transport fleet
MEASUREMENT OF BACKGROUND NOISE IN A HOME IN A RURAL AREA
SITUATION: Measuring the levels of background noise in a bedroom of a home in a rural area, with expected levels close to 25 dBA. It is necessary to carry out the measurement within the bedroom without the operator or observers being present.
PROGRAMMING:
= 00:01:00 s = 00:06:00 s
RESULT: When pressing , the SC420 waits 1 minute and then starts to
measure for 6 minutes. This gives the operator time to press , leave the bedroom (together with the observers) and close the door. They wait 6 minutes and re-enter after the measurement is completed.

86 Chapter 14 Advanced options
ASSESSMENT OF EXPOSURE TO NOISE AT A FACTORY
SITUATION: Assessment of the exposure to noise of a worker on a 20:00 to 06:00 nightshift. It is possible to precisely measure the exact shift without the operator being present.
PROGRAMMING:
= 20:00:00 = 10:00:00 s
RESULT: When pressing , the SC420 waits until the clock reaches 20h00m00s and starts to measure for 10 hours. The operator can press long before 20h00m00s and return the following morning to collect the SC420.
MONITORING THE IMMISSION OF AN ACTIVITY IN A HOME
SITUATION: Monitoring the musical immission of a night club into the interior environment of a dwelling located just above it. The opening hours of the night club are from 00:00 to 05:30. It is necessary to carry out periodic audio recordings to ensure that the noise levels measured during the opening hours belong to the night club.
PROGRAMMING:
= 23:30:00 = 06:00:00 = 00:30:00
RESULT: When pressing , the SC420 waits until 23:30 and then starts recording the noise levels; in parallel, it carries out periodic audio recordings every 30 minutes to subjectively assess the origin of the measured levels. Finally, the SC420 stops the recording at 06:00. Should you wish to carry out the same operation the following day, you would only have to programme the REPEAT option .
40
50
60
70
80
90
19
:00
:00
19
:30
:00
20
:00
:00
20
:30
:00
21
:00
:00
21
:30
:00
22
:00
:00
22
:30
:00
23
:00
:00
23
:30
:00
0:0
0:0
0
0:3
0:0
0
1:0
0:0
0
1:3
0:0
0
2:0
0:0
0
2:3
0:0
0
3:0
0:0
0
3:3
0:0
0
4:0
0:0
0
4:3
0:0
0
5:0
0:0
0
5:3
0:0
0
6:0
0:0
0
6:3
0:0
0
7:0
0:0
0

Chapter 14 Advanced options 87
MONITORING THE EMISSIONS PRODUCED BY PUBLIC HIGHWAY CLEANING AND MAINTENANCE MACHINERY
SITUATION: Monitoring the noise generated by the various recycling collection vehicles (for paper, plastic, glass and organic matter) during the night; checking that the 50 dBA immission limit is not exceeded during the night: some vehicles can generate up to 60 dBA. Audio is required to identify the sound events that exceed 60 dBA.
PROGRAMMING:
140.0 dB 140.0 dB 140.0 dB
140.0 dB 140.0 dB 140.0 dB
50.0 dB 50.0 dB 60.0 dB
5 s 20 s 5 s
08:00:00
18:00:00
22:00:00
The D and E interval thresholds are programmed to 140 dB in order to prevent triggering any recording during the morning and afternoon.
RESULT: When pressing , the SC420 waits for night-time hours (22:00 to 08:00) to begin before carrying out recordings of the events in excess of 50 dBA for more than 5 seconds. The recording ends when the sound level falls below 50 dB for more than 20 seconds. This ensures that even if the noise generated by the vehicles is intermittent, it is collected in a single recording per vehicle. If the level generated exceeds 60 dBA, audio is recorded to identify the vehicles and

88 Chapter 14 Advanced options
thus be able to correct the defects in these vehicles. A policy will be developed to renew the oldest and noisiest vehicles.
CONTINUOUS MONITORING OF A PORT INFRASTRUCTURE
SITUATION: monitoring the environmental impact of land-based port services: mechanical operations for loading and unloading bulk commodities such as cereals, minerals or industrial salts, or in containers with elevators and conveyors, and maintenance and repair work. You need to identify the activities that infringe the current noise pollution regulations in the port zone.
PROGRAMMING:
70.0 dB 70.0 dB 75.0 dB
70.0 dB 70.0 dB 75.0 dB
60.0 dB 60.0 dB 65.0 dB
5 s 5 s 5 s
07:00:00
19:00:00
23:00:00
RESULT: When pressing , the SC420 makes recordings of the sound events that exceed the limits set down in the environmental regulations (Day and Evening: 70 dBA; and Night: 60 dBA); it also makes a brief audio recording when these exceed the limit by 5 dBA. This saves memory by not recording audio throughout the sound event, but only doing so at the start to identify its origin.
30
40
50
60
70
80
90
20:0
0:0
0
21:0
0:0
0
22:0
0:0
0
23:0
0:0
0
0:0
0:0
0
1:0
0:0
0
2:0
0:0
0
3:0
0:0
0
4:0
0:0
0
5:0
0:0
0
6:0
0:0
0
7:0
0:0
0
8:0
0:0
0
9:0
0:0
0

Chapter 14 Advanced options 89
MONITORING THE NOISE GENERATED BY THE LOADING AND UNLOADING OF A TRANSPORT FLEET
SITUATION: Monitoring the noise generated by the tasks of loading and unloading goods onto/from a transport fleet. You need to record noise levels while vehicles are present. To this end, we have installed a presence-detecting sensor that connects to the SC420 [1 No vehicles present; 0 Vehicles present].
PROGRAMMING:
RESULT: When pressing , the SC420 waits for the sensor to detect the presence of vehicles before starting a recording of the time the vehicles are present.
30
40
50
60
70
80
90
7:0
0:0
0
8:0
0:0
0
9:0
0:0
0
10:0
0:0
0
11:0
0:0
0
12:0
0:0
0
13:0
0:0
0
14:0
0:0
0
15:0
0:0
0
16:0
0:0
0
17:0
0:0
0
18:0
0:0
0
19:0
0:0
0
20:0
0:0
0
21:0
0:0
0
22:0
0:0
0
23:0
0:0
0
0:0
0:0
0
1:0
0:0
0
2:0
0:0
0
3:0
0:0
0
4:0
0:0
0
5:0
0:0
0
6:0
0:0
0
7:0
0:0
0

90 Chapter 15 Settings and adjustments
From the settings sub-menu you can configure all the services provided by the SC420: functions displayed, functions saved in memory, automatisms settings, date and time, sensitivity, Bluetooth® wireless communication, etc.
15.1 Accessing the settings sub-menu
Once the SC420 is switched on, ensure there is no measurement in progress
and press . The menu screen will be displayed automatically.
The cursor (highlighted option) will be at the first option in the menu area. Press
and to select the SETTINGS option and press .
15.2 Navigating through the settings sub-menu
To select an option from the settings sub-menu, use the selector keys .
Pressing accepts the selected option or the changes made.
Pressing takes you to the previous menu screen, without accepting the changes.
Pressing takes you directly to the current measurement mode, without accepting the selected option or the changes made.
In the map area icons indicate the current location within the different menu screens of the SC420.
Settings and adjustments
15. Settings and adjustments
15

Chapter 15 Settings and adjustments 91
15.3 Settings sub-menu
The settings sub-menu features the following options:
OPTION FUNCTION
MEASUREMENT
Allows you set the measurement parameters for the different modes.
RECORDING
Allows you set the functions saved in recordings, for different measurement modes.
AUTOMATISMS
Allows you set the automatic start/stop measurement/recording and automatic audio recording functions.
DATE AND TIME
Allows you adjust the date and time displayed on the SC420 as well as consult the date/time change log.
SENSITIVITY ADJUSTMENT
Allows you adjust the sensitivity of the SC420 as well as consult the sensitivity adjustment log.
CONTRAST
Allows you adjust the screen contrast.
AC OUTPUT
Allows you configure the SC420's AC output.
BLUETOOTH® WIRELESS/PRINTER COMMUNICATION
Allows you enable and disable Bluetooth® wireless and serial printer communication.
15.3.1 MEASUREMENT option
This option lets you set various parameters related to the functions measured in each mode. When selecting it, the following screens will appear:
Sound level meter mode
Analyser mode 1/1 and 1/3
Occupational noise mode
Reverberation time mode
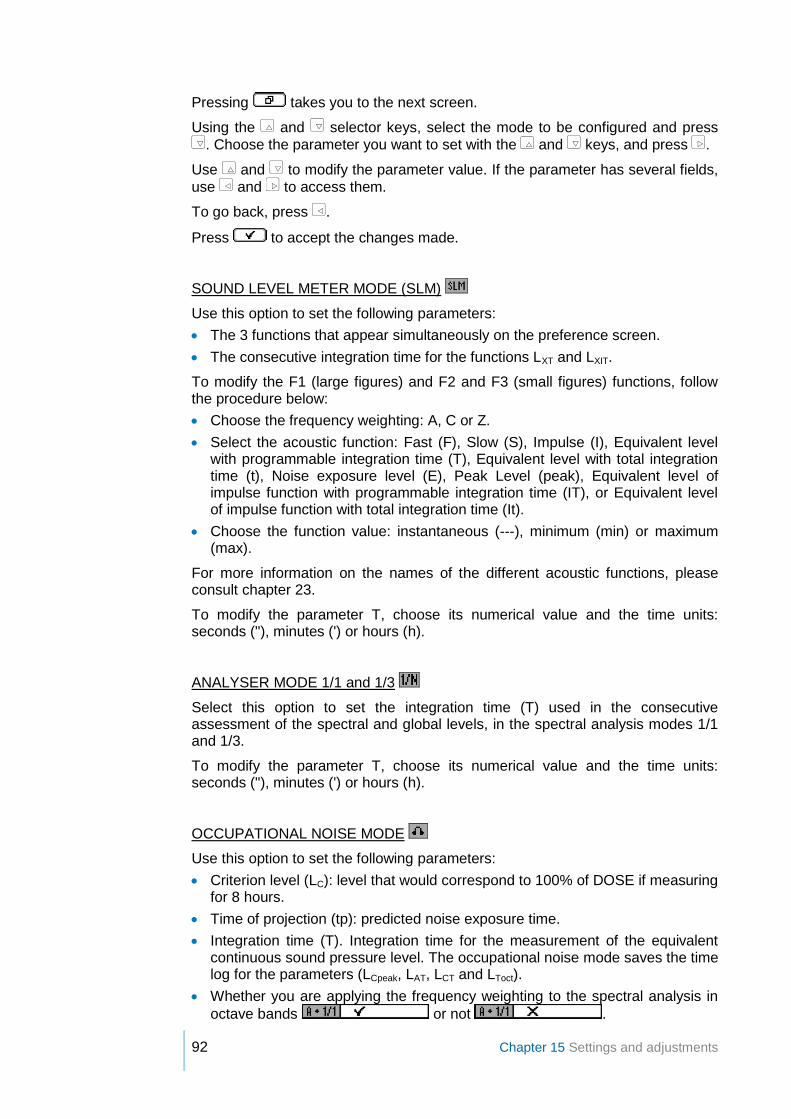
92 Chapter 15 Settings and adjustments
Pressing takes you to the next screen.
Using the and selector keys, select the mode to be configured and press
. Choose the parameter you want to set with the and keys, and press .
Use and to modify the parameter value. If the parameter has several fields,
use and to access them.
To go back, press .
Press to accept the changes made.
SOUND LEVEL METER MODE (SLM)
Use this option to set the following parameters:
The 3 functions that appear simultaneously on the preference screen.
The consecutive integration time for the functions LXT and LXIT.
To modify the F1 (large figures) and F2 and F3 (small figures) functions, follow the procedure below:
Choose the frequency weighting: A, C or Z.
Select the acoustic function: Fast (F), Slow (S), Impulse (I), Equivalent level with programmable integration time (T), Equivalent level with total integration time (t), Noise exposure level (E), Peak Level (peak), Equivalent level of impulse function with programmable integration time (IT), or Equivalent level of impulse function with total integration time (It).
Choose the function value: instantaneous (---), minimum (min) or maximum (max).
For more information on the names of the different acoustic functions, please consult chapter 23.
To modify the parameter T, choose its numerical value and the time units: seconds ("), minutes (') or hours (h).
ANALYSER MODE 1/1 and 1/3
Select this option to set the integration time (T) used in the consecutive assessment of the spectral and global levels, in the spectral analysis modes 1/1 and 1/3.
To modify the parameter T, choose its numerical value and the time units: seconds ("), minutes (') or hours (h).
OCCUPATIONAL NOISE MODE
Use this option to set the following parameters:
Criterion level (LC): level that would correspond to 100% of DOSE if measuring for 8 hours.
Time of projection (tp): predicted noise exposure time.
Integration time (T). Integration time for the measurement of the equivalent continuous sound pressure level. The occupational noise mode saves the time log for the parameters (LCpeak, LAT, LCT and LToct).
Whether you are applying the frequency weighting to the spectral analysis in
octave bands or not .

Chapter 15 Settings and adjustments 93
To modify the parameter LC, enter its numerical value in dB.
To modify the parameter tp, enter its numerical value in hh:mm:00.
To modify the parameter T, choose its numerical value and the time units: seconds ("), minutes (') or hours (h).
To modify the parameter (A+1/1), choose if you wish to measure using frequency weighting A simultaneously with the octave filters, or if you do not wish to use it. Place the cursor in the corresponding box and use and to select the desired option.
REVERBERATION TIME MODE
Use this option to set the limit value for the parameter, which the device uses to decide whether the decay curve is far from being regular line. This value only applies to the measurement of reverberation time using the interrupted noise method.
15.3.2 RECORDING option
This option sets the periodicity and functions to be stored by the SC420 when making a recording. It also sets how the device behaves when running on USB power and that power source is interrupted. When selecting the recording option, the following screen appears:
Use and to choose one of the following options and press .
SOUND LEVEL METER RECORDING OPTION
This option sets the periodicity and data the SC420 will store when making a recording in sound level meter mode (see 16.2).
Selecting it will display the following screen:

94 Chapter 15 Settings and adjustments
Highlighted and marked as , the option that is currently configured will appear.
Use and to select the desired option and press to select the
highlighted option. This will appear marked as . Press to accept the changes made.
SPECTRUM ANALYSER RECORDING OPTION
This option sets the periodicity and data the SC420 will store when making a recording in analyser modes 1/1 and 1/3 (see 16.2).
Selecting it will display the following screen:
Highlighted and marked as , the option that is currently configured will appear.
Use and to select the desired option and press to select the
highlighted option. This will appear marked as . Press to accept the changes made.
POWER FOR ENVIRONMENTAL MONITORING RECORDING OPTION
When selecting this option, the current status (option highlighted) of environmental monitoring will appear: OFF or ON.
To change it, use and press .
For more information on the 'Power for environmental monitoring' option, please see 7.3.
When the SC420 is switched off, this option is left in the status set. This means that if it is set to ON, when the SC420 is next switched on, the 'power for environmental monitoring' option will be activated.

Chapter 15 Settings and adjustments 95
15.3.3 AUTOMATISMS option
Use this option to set the parameters for automatic start/stop measurement/recording or automatic audio recordings. Selecting it will display the following screen:
Use and to choose one of the following options and press .
DEN TIME INTERVALS
Use this option to set the beginning and end for the three time intervals into which the day is divided: , and . Selecting it will display the following screen:
Use and to select the period you wish to set the start for HH:mm and press
. Set the hour using and , press and with and set the minutes.
The end of one period coincides with the beginning of the following period.
Press to accept the changes made.
AUTOMATIC START MEASUREMENT/RECORDING OPTION
Use this option to set the type of automatic start: without setting ( ), for a specific time ( ), by waiting time ( ), by DEN level ( ) or by external digital input ( ) (see 14.6.1). Selecting it will display the following screen:

96 Chapter 15 Settings and adjustments
Highlighted and marked as , the option that is currently configured will appear.
Use and to select the desired option and press to select the highlighted option. This will appear marked as .
Press to set the parameters for each option. Use and to adjust the
parameter value. If the parameter has several fields, use and to access them.
For a specific time : enter the value of the start time in hh:mm:00.
For waiting time : enter the value of the time in hh:mm:00. (If you enter 00:00:00, the device will not recognise this configuration and will maintain the previous values).
For DEN level : Use and to select the DEN period or start time (t).
Press to proceed and use and to set the threshold level in decibels for each time interval and the trigger time between 1 and 10 seconds.
Press to accept the changes made.
AUTOMATIC STOP MEASUREMENT/RECORDING OPTION
Use this option to set the type of automatic stop: without setting ( ), for a specific time ( ), by waiting time ( ), by DEN level ( ) or by external digital input ( ). Here you can also set the repeat option (see 14.6.2). Selecting it will display the following screen:
Highlighted and marked as , the option that is currently configured will appear.
Use and to select the desired option and press to select the highlighted option. This will appear marked as .
Press to set the parameters for each option. Use and to adjust the parameter value. If the parameter has several fields, use and to access them.

Chapter 15 Settings and adjustments 97
For a specific time : enter the value of the stop time in hh:mm:00.
For a waiting time : enter the value of the time in hh:mm:00. (If you enter 00:00:00, the device will not recognise this configuration and will maintain the previous values).
For DEN level : Use and to select the DEN period or start time (t). Press to proceed and use and to set the threshold level in decibels for each time interval and the trigger time between 1 and 10 seconds.
The repeat option can be activated on this screen.
To modify the status of the repeat option, access it using and and press
to select it (on) or deselect it (off).
Press to accept the changes made.
AUTOMATIC AUDIO RECORDING OPTION
Use this option to set the automatic audio recording: without setting ( ), by time between recordings ( ), by DEN level ( ) or by external digital input ( ) (see 14.6.3). Selecting it will display the following screen:
Highlighted and marked as , the option that is currently configured will appear.
Use and to select the desired option and press to select the highlighted option. This will appear marked as .
Press to set the parameters for each option. Use and to adjust the
parameter value. If the parameter has several fields, use and to access them.
For time between recordings : enter the value of the time in hh:mm:00.
For DEN level : use and to select the DEN period, the start time (t) or
the new event option. Press to proceed and use and to set the threshold level in decibels for each time interval, the trigger time between 1 and 10 seconds and the new event option (see 14.6.4).
Press to accept the changes made.

98 Chapter 15 Settings and adjustments
15.3.4 DATE AND TIME option
This option lets you adjust the date and time of the SC420, which the SC420 uses to reference measurements, recordings and audio recordings.
To change the current setting, choose between DATE and TIME and press . You can make the adjustment using and (to modify a value) and and
(to change parameter).
Finally, to validate the changes press . A new record will be added to the date change history.
Pressing takes you to the date change log, where the last 4 changes made can be consulted.
For each change, the number of the change (increasing in consecutive order), the date and time before change and the new date and time after the change are given.
15.3.5 MICROPHONE SETTING option
This option lets you select the sound level correction, indicate the microphone model to be used in the measurement, and adjust the sensitivity of the SC420.
NOTE: The sensitivity of the SLM must only be adjusted by authorised, technically qualified personnel. Readjustment of the sensitivity entails the loss of traceability in the calibration of the instrument.
It is recommended that pre- and post-measurement checking using a calibrator is performed as described in 10.1.

Chapter 15 Settings and adjustments 99
When selecting this option, the screen will display the sound pressure level measured by the SC420, along with the following parameters: the sound field correction, microphone model and sensitivity setting level currently configured.
Using and , select the parameter to be set. The available options are:
Sound field correction Microphone model Sensitivity setting
Sound field correction. You can choose between FF - free field (without correction) and DF - diffuse field. Use and to select the desired option.
Microphone model. You can choose one of the 3 models of microphone available (C-130, C140 and C240). Use and to select the desired option.
Sensitivity setting. To adjust the sensitivity, you will need to use an acoustic calibrator. Before making the adjustment, carefully read subsection 10.1 and find the value to which the SC420 should be adjusted.
Ensure the calibrator is correctly fitted and switched on. To adjust the sound level meter reading to the value calculated with the pressure-free field correction (see 10), use and .
Finally, to validate the changes press .
If it the sensitivity setting has been modified, a new record will be added to the sensitivity change log.
Pressing takes you to the sensitivity change log, where the last 4 changes made can be consulted.

100 Chapter 15 Settings and adjustments
For each change, the number of the change (increasing in consecutive order), the date and time of the change and the value of the sensitivity setting level are given.
15.3.6 CONTRAST option
When selecting this option, the screen displays the level of contrast in numerical form and a sample of 4 colours, to serve as a reference while choosing the appropriate level of contrast.
To change the setting, use and and press .
15.3.7 AC OUTPUT option
The AC output of the SC420 is directly proportional to the signal obtained at the preamplifier output. This option lets you set the gain for this output: 0 dB or 40 dB.
The setting highlighted is the current one; if you wish to change it, use and
and press .

Chapter 15 Settings and adjustments 101
15.3.8 BLUETOOTH® wireless communication/PRINTER option
When selecting this option, the current status for the RS-232 communication will
appear: Bluetooth® wireless communication ON, serial communication with a printer ON, or OFF if both of communications switched off (RS-232 communication is free).
To change it, use and and press .
When Bluetooth® wireless communication is enabled, the symbol will be displayed in the indicator area. When the serial communication with a printer is
enabled, the symbol will be displayed in the indicator area.
For more information on Bluetooth® wireless communication, see 17.2.4.
For more information on serial communication with a printer, see 17.2.2.
When the SC420 switches on, the RS-232 communication is in the state programmed.
The Bluetooth® trademark is the property of Bluetooth SIG, Inc.
NOTE: To preserve the batteries, disable Bluetooth when it is not needed.

102 Chapter 16 Records and memory management
The SC420 can store the values of the functions measured on the memory card. When the device is switched off, the data saved are not lost and can be recovered, viewed and deleted directly on the SC420 itself, or they can be transferred to a computer or imported from the memory card to a computer.
Two kinds of records can be saved in the memory:
The final results of a measurement.
Continuous recordings of the functions measured together with the associated audio files.
If making a recording, the time history of the functions set and, at the end of the measurement, the final results are automatically saved to memory.
Another option is to take a measurement and then save the results. This record will not contain the time history of the functions, only the final results.
16.1 Saving a final result
To save a final result to memory (not saving the time log of the measurement),
after measuring , press . The menu screen will be displayed automatically. The cursor (highlighted option) will already be at the SAVE
RESULT option in the menu area; press .
The SC420 will save in memory the final result of all the functions measured and will return to the measurement screen. In the memory area, the number of the register where the final result has been saved will appear.
The SC420 can save a maximum of 64000 final results, regardless of the measurement mode.
Registers and memory management
16. Registers and memory management
16
NOTE: It is only possible to save final results if there is a memory card inserted in the slot, with available space.

Chapter 16 Records and memory management 103
Below is the breakdown of the functions saved for each measurement mode:
TIME BASE SOUND LEVEL METER FINAL RESULT FUNCTIONS
t : Measurement time LXt, LXE, LXpeak, LXIt, Lnt, LAF5t
LXFmax, LXSmax, LXImax, LXFmin, LXSmin, LXImin, LXTmax, LXTmin,
T: Last complete integration interval
LXT, LXIT, LnT, LAF5T
1s: Last second LXF, LXS, LXI, LX1s, LXFmax1s, LXSmax1s, LXImax1s, LXFmin1s, LXSmin1s, LXImin1s, LXpeak1s
Date and time of start of measurement, measurement and integration time
X: indicates the frequency weighting (A, C and Z).
n: 1%, 5%, 10%, 50%, 90%, 95% and 99%
TIME BASE ANALYSER 1/1 FINAL RESULT FUNCTIONS
t : Measurement time LXt, LXpeakt, LAnt
Lft, Lfnt
T: Last complete integration interval
LXT, LXpeakT, LAnT
LfT, LfnT
Date and time of start of measurement, measurement and integration time
X: indicates the frequency weighting (A, C and Z).
f: indicates the octave band filter with central frequency of 31.5, 63, 125, 250, 500, 1000 (1k), 2000 (2k), 4000 (4k), 8000 (8k) and 16000 (16k) Hz.
n: 1%, 5%, 10%, 50%, 90%, 95% and 99%
TIME BASE ANALYSER 1/3 FINAL RESULT FUNCTIONS
t : Measurement time LXt, Lft, LAFmaxt, LASmaxt, LAImaxt, LAIt, LAnt
T: Last complete integration interval
LXT, LfT, LAFmaxT, LASmaxT, LAImaxT, LAIT, LAnT
Date and time of start of measurement, measurement and integration time
X: indicates the frequency weighting (A, C and Z).
f: indicates the octave band filter with central frequencies of 10, 12.5, 16, 20, 25, 31.5, 40, 50, 63, 80, 100, 125, 160, 200, 250, 315, 400, 500, 630, 800, 1000 (1k), 1250 (1.25k), 1600 (1.6k), 2000 (2k), 2500 (2.5k), 3150 (3.15k), 4000 (4k), 5000 (5k), 6300 (6.3k), 8000 (8k), 10000 (10k), 12500 (12.5k), 16000 (16k) and 20000 (20k) Hz.
n: 1%, 5%, 10%, 50%, 90%, 95% and 99%
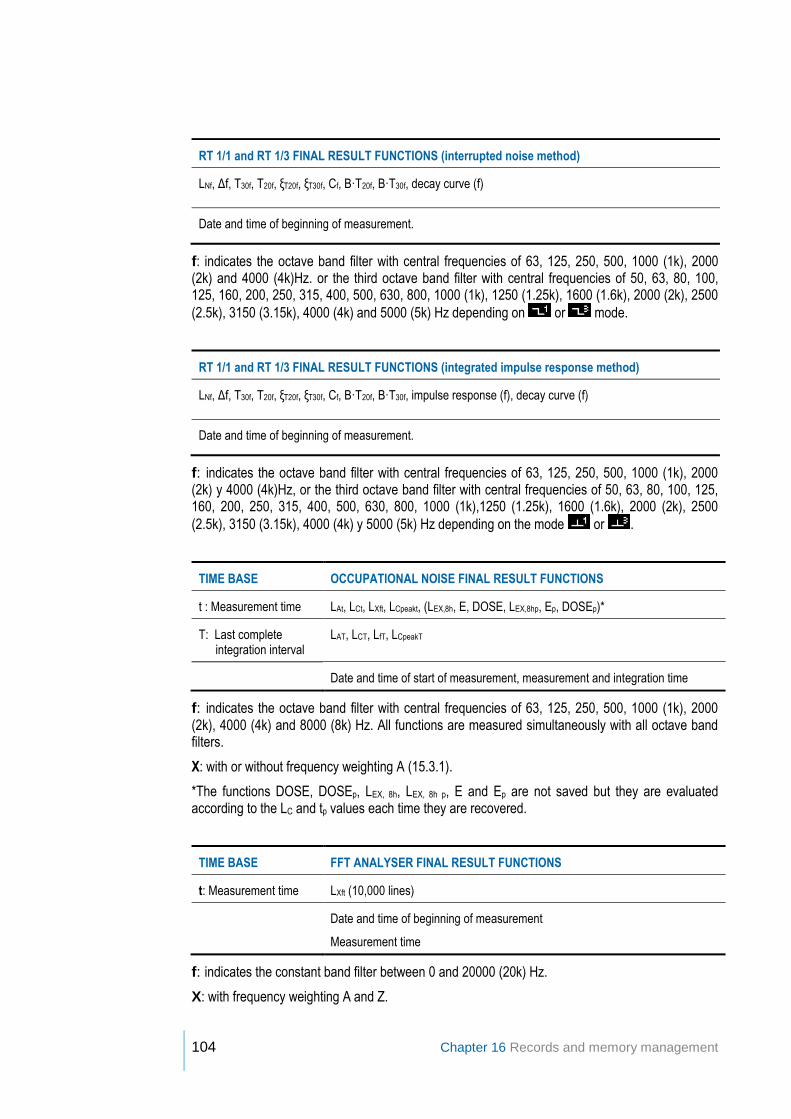
104 Chapter 16 Records and memory management
RT 1/1 and RT 1/3 FINAL RESULT FUNCTIONS (interrupted noise method)
LNf, Δf, T30f, T20f, ξT20f, ξT30f, Cf, B·T20f, B·T30f, decay curve (f)
Date and time of beginning of measurement.
f: indicates the octave band filter with central frequencies of 63, 125, 250, 500, 1000 (1k), 2000 (2k) and 4000 (4k)Hz. or the third octave band filter with central frequencies of 50, 63, 80, 100, 125, 160, 200, 250, 315, 400, 500, 630, 800, 1000 (1k), 1250 (1.25k), 1600 (1.6k), 2000 (2k), 2500
(2.5k), 3150 (3.15k), 4000 (4k) and 5000 (5k) Hz depending on or mode.
RT 1/1 and RT 1/3 FINAL RESULT FUNCTIONS (integrated impulse response method)
LNf, Δf, T30f, T20f, ξT20f, ξT30f, Cf, B·T20f, B·T30f, impulse response (f), decay curve (f)
Date and time of beginning of measurement.
f: indicates the octave band filter with central frequencies of 63, 125, 250, 500, 1000 (1k), 2000 (2k) y 4000 (4k)Hz, or the third octave band filter with central frequencies of 50, 63, 80, 100, 125, 160, 200, 250, 315, 400, 500, 630, 800, 1000 (1k),1250 (1.25k), 1600 (1.6k), 2000 (2k), 2500
(2.5k), 3150 (3.15k), 4000 (4k) y 5000 (5k) Hz depending on the mode or .
TIME BASE OCCUPATIONAL NOISE FINAL RESULT FUNCTIONS
t : Measurement time LAt, LCt, LXft, LCpeakt, (LEX,8h, E, DOSE, LEX,8hp, Ep, DOSEp)*
T: Last complete integration interval
LAT, LCT, LfT, LCpeakT
Date and time of start of measurement, measurement and integration time
f: indicates the octave band filter with central frequencies of 63, 125, 250, 500, 1000 (1k), 2000 (2k), 4000 (4k) and 8000 (8k) Hz. All functions are measured simultaneously with all octave band filters.
X: with or without frequency weighting A (15.3.1).
*The functions DOSE, DOSEp, LEX, 8h, LEX, 8h p, E and Ep are not saved but they are evaluated according to the LC and tp values each time they are recovered.
TIME BASE FFT ANALYSER FINAL RESULT FUNCTIONS
t: Measurement time LXft (10,000 lines)
Date and time of beginning of measurement
Measurement time
f: indicates the constant band filter between 0 and 20000 (20k) Hz.
X: with frequency weighting A and Z.

Chapter 16 Records and memory management 105
10,000 lines (2 Hz/line).
The total FFT time that can be recorded on 1 GB of memory is 16 days and 13 hours in FFT mode.
For the name and definition of each of the functions measured, please see chapter 23.
16.2 Making a recording
A recording consists of making a measurement and storing a series of functions in the memory with a defined periodicity. At the end of the recording, the final results are also saved.
To make a recording: in AUDIO mode (analysis quality), please see 13.9.1 and 14.5, for the VOICE COMMENTS mode please see 14.4, for other modes please see 11.3
16.2.1 Types of recording
These functions and the periodicity are specified, for each mode, in the recording setting. The main difference between the various types of recording lies in the compromise "quantity of functions/storage time”.
RECORDING IN SOUND LEVEL METER MODE
Use the SOUND LEVEL METER RECORDING option (see 15.3.2) to set the periodicity and data of the time log that the SC420 will save when making a recording in sound level meter mode, in addition to the final results. Seven possibilities are available:
These 3 types of recording are conceived for short-duration measurements.
LXX (1s): saves all the functions measured every second:
TIME BASE LXX (1s) SOUND LEVEL METER RECORDING FUNCTIONS:
t : Measurement time LXt, LXE, LXpeak, LXIt, Lnt, LAF5t
LXFmax, LXSmax, LXImax, LXFmin, LXSmin, LXImin
T: Programmed integration time
LXT, LXTmax, LXTmin, LXIT, LnT, LAF5T
1s LXF, LXS, LXI, LX1s, LXFmax1s, LXSmax1s, LXImax1s, LXFmin1s, LXSmin1s, LXImin1s, LXpeak1s
NOTE: When making a recording, as well as the time log (of the parameters set out below), the device also saves the final results to memory (see 16.1).
NOTE: It is only possible to make a recording for the following modes: SOUND LEVEL METER, ANALYSER 1/1, ANALYSER 1/3, OCCUPATIONAL NOISE, AUDIO (analysis quality and listening quality), and VOICE COMMENTS.
A memory card with available space must also be inserted in the slot.

106 Chapter 16 Records and memory management
LXX (125ms): saves all the functions measured every 125 ms:
TIME BASE LXX (125ms) SOUND LEVEL METER RECORDING FUNCTIONS:
125ms LX125ms, LXpeak125ms, LXF125ms, LXS125ms, LXI125ms
LXX (1s) + LXX (125ms): saves all the 1s functions and all the 125 ms "short" functions:
TIME BASE LXX (1s) + LXX (125ms) SOUND LEVEL METER RECORDING FUNCTIONS:
t : Measurement time LXt, LXE, LXpeak, LXIt, Lnt, LAF5t
LXFmax, LXSmax, LXImax, LXFmin, LXSmin, LXImin
T: Programmed integration time
LXT, LXTmax, LXTmin, LXIT, LnT, LAF5T
1s LXF, LXS, LXI, LX1s, LXFmax1s, LXSmax1s, LXImax1s, LXFmin1s, LXSmin1s, LXImin1s, LXpeak1s
125ms LX125ms, LXpeak125ms, LXF125ms, LXS125ms, LXI125ms
These types of recording are conceived for long-duration measurements, such as studies of environmental noise, traffic noise, etc.
F1 (1s): saves the main function programmed on the preferential screen second by second:
TIME BASE F1 (1s) SOUND LEVEL METER RECORDING FUNCTIONS:
1s F1
F1 + F2 + F3 (1s): saves the 3 functions programmed on the preference screen second by second:
TIME BASE F1 + F2 + F3 (1s) SOUND LEVEL METER RECORDING FUNCTIONS:
1s F1, F2, F3
This type of recording is very practical in that it saves the basic sound-measurement functions: Short Leq, Fast every 125 ms (statistical information may be calculated from here), the peak level and three set sound-measurement functions.
F1 + F2 + F3 + [+] (1s): saves the following functions every second:
TIME BASE F1 + F2 + F3 + [+] (1s) SOUND LEVEL METER RECORDING FUNCTIONS:
1s LCpeak1s, F1, F2, F3
125ms LAF125ms, LA125ms

Chapter 16 Records and memory management 107
LT + LIT + Ln% (T): saves the following functions every T (integration time):
TIME BASE LT + LIT + Ln% (T) SOUND LEVEL METER FUNCTIONS:
T: Programmed integration time
LXT, LXIT, LnT
X: indicates the frequency weighting (A, C and Z).
n: 1%, 5%, 10%, 50%, 90%, 95% and 99%
The following table shows the storage capacity per 1 GB of memory for the different types of recording in sound level meter mode:
RECORDING IN 1/1 ANALYSER MODE
Use the SPECTRUM ANALYSER RECORDING option (see 15.3.2) to set the periodicity and data of the time log that the SC420 will save when making a recording in 1/1 analyser mode, in addition to the final results. There are 4 possibilities:
This type of recording is conceived for long-duration measurements, such as studies of environmental noise and traffic noise, for which spectral information on the measured noise is needed.
LXX (T): once each integration period (T) has come to an end, the following values are stored in the memory:
TIME BASE 1/1 LXX (T) ANALYSER RECORDING FUNCTIONS:
T: Programmed integration time
LXT, LXpeakT, LAnT
LfT, LfnT
TYPE OF RECORDING STORAGE CAPACITY per 1 GB
LXX (1s): 2 months 12 days
LXX (125ms): 1 month 21 days
LXX (1s) + LXX (125ms): 1 month
F1 (1s): 6 years 8 months
F1 + F2 + F3 (1s): 3 years 9 months
F1 + F2 + F3 + [+] (1s): 9 months 17 days
LT + LIT + Ln% (T): 1 year 2 months
NOTE: These capacities will be reduced if associated audio files (listening quality) are recorded during the measurement recording.

108 Chapter 16 Records and memory management
These two types of recordings are especially designed to obtain spectral information that is highly detailed in terms of time. These types are perfect for detecting and monitoring noise sources such as vehicle traffic on roads and air traffic at airports.
LXX (125ms): saves the following functions every 125 ms:
TIME BASE LXX (125ms) ANALYSER 1/1 RECORDING FUNCTIONS:
125 ms LX125ms, LXpeak125ms, Lf125ms
LXX (T) + LXX (125ms): saves the '125 ms functions' every 125 ms and the 'T functions' every T:
TIME BASE LXX (T) + LXX (125ms) ANALYSER 1/1 RECORDING FUNCTIONS:
T: Programmed integration time
LXT, LXpeakT, LAnT
LfT, LfnT
125 ms LX125ms, LXpeak125ms, Lf125ms
LT (T): once each integration period (T) has come to an end, the following values are stored in the memory:
TIME BASE LT(T) ANALYSER 1/1 RECORDING FUNCTIONS:
T: Programmed integration time
LXT, LfT
X: indicates the frequency weighting (A, C and Z).
f: indicates the octave band filter with central frequency of 31.5, 63, 125, 250, 500, 1000 (1k), 2000 (2k), 4000 (4k), 8000 (8k) and 16000 (16k) Hz.
n: 1%, 5%, 10%, 50%, 90%, 95% and 99%
The following table shows the storage capacity per 1 GB of memory for the different types of recording in 1/1 analyser mode.
TYPE OF RECORDING STORAGE CAPACITY per 1 GB
LXX (T): T=1s 26 days
LXX (125ms): T=125ms 1 month 15 days
LXX (T) + LXX (125ms): T=1s 26 days
LT (T): T=1s 1 year 1 month
NOTE: These capacities will be reduced if associated audio files (listening quality) are recorded during the measurement recording.

Chapter 16 Records and memory management 109
RECORDING IN 1/3 ANALYSER MODE
Use the SPECTRUM ANALYSER RECORDING option (see 15.3.2) to set the periodicity and data of the time log that the SC420 will save when making a recording in 1/3 analyser mode, in addition to the final results. There are 3 possibilities:
This type of recording is conceived for long-duration measurements, such as studies of environmental noise and traffic noise, which require detailed spectral information of the measured noise together with global functions.
LXX (T): once each integration period (T) has come to an end, the following values are stored in the memory:
TIME BASE LXX (T) ANALYSER 1/3 RECORDING FUNCTIONS:
T: Programmed integration time
LXT, LAIT, LAFmaxT, LASmaxT, LAImaxT, LfT
These two types of recording are specially designed to obtain highly detailed time and spectrum information. They are also ideal for the detection of tonal components.
LXX (125ms): saves the following functions every 125 ms:
TIME BASE LXX (125ms) ANALYSER 1/3 RECORDING FUNCTIONS:
125 ms LX125ms, LAI125ms, LAFmax125ms, LASmax125ms, LAImax125ms, Lf125ms
LXX (T) + LXX (125ms): saves the '125 ms functions' every 125 ms and the 'T functions' every T:
TIME BASE LXX (T) + LXX (125ms) ANALYSER 1/3 RECORDING FUNCTIONS:
T: Programmed integration time
LXT, LAIT, LAFmaxT, LASmaxT, LAImaxT, LfT, LAnT
125 ms LX125ms, LAI125ms, LAFmax125ms, LASmax125ms, LAImax125ms, Lf125ms
LT (T): once each integration period (T) has come to an end, the following values are stored in the memory:
TIME BASE LT(T) ANALYSER 1/3 RECORDING FUNCTIONS:
T: Programmed integration time
LXT, LfT
X: indicates the frequency weighting (A, C and Z).
n: 1%, 5%, 10%, 50%, 90%, 95% and 99%

110 Chapter 16 Records and memory management
f: indicates the third octave band filter with central frequencies of 10, 12.5, 16, 20, 25, 31.5, 40, 50, 63, 80, 100, 125, 160, 200, 250, 315, 400, 500, 630, 800, 1000 (1k), 1250 (1.25k), 1600 (1.6k), 2000 (2k), 2500 (2.5k), 3150 (3.15k), 4000 (4k), 5000 (5k), 6300 (6.3k), 8000 (8k), 10000 (10k), 12500 (12.5k), 16000 (16k) and 20000 (20k) Hz.
The following table shows the storage capacity per 1 GB of memory for the different types of recording in 1/3 analyser mode.
TYPE OF RECORDING STORAGE CAPACITY per 1 GB
LXX (T) T=1s 4 months 5 days
LXX (125ms): T=125ms 18 days 22 hours
LXX (T) + LXX (125ms): T=1s 16 days 12 hours
LT (T): T=1s 5 months 11 days
RECORDING IN OCCUPATIONAL NOISE MODE
Upon completion of each integration period (T), the occupational noise mode saves the following values in memory, in addition to the final results:
TIME BASE OCCUPATIONAL NOISE RECORDING FUNCTIONS:
T: Programmed integration time
LAT, LCT, LCpeakT, LXfT,
(LEX,8h, E, DOSE, LEX,8hp, Ep, DOSEp)*
f: indicates the octave band filter with central frequencies of 63, 125, 250, 500, 1000 (1k), 2000 (2k), 4000 (4k) and 8000 (8k) Hz. All functions are measured simultaneously with all octave band filters.
X: With or without frequency weighting A (see 15.3.1).
*The functions DOSE, DOSEp, LEX8h, LEX8hp, E and Ep are not saved but they are evaluated according to the LC and tp values each time they are recovered.
The following table shows the storage capacity per 1 GB of memory in occupational noise mode:
STORAGE CAPACITY per 1 GB
T= 1 s 16 days 16 hours
NOTE: These capacities will be reduced if associated audio files are recorded
during the measurement recording (listening quality).
NOTE: These capacities will be reduced if associated audio (listening quality)
files are recorded during the measurement recording.

Chapter 16 Records and memory management 111
RECORDING IN AUDIO MODE (analysis quality)
STORAGE CAPACITY per 1 GB
2 hours of audio (analysis quality)
AUDIO RECORDING (listening quality)
STORAGE CAPACITY
64000 records
RECORDING VOICE COMMENTS
STORAGE CAPACITY
64000 records
16.3 Structure of a register
Each time you save a final result or make a recording, the SC420 saves a register in memory.
For each register, the register number, the date and time it was recorded and the type of register are displayed.
NOTE: The storage times for each type of recording correspond to one single recording, until the memory is completely full.
The SC420 has capacity for up to 64000 records (final results or recordings) of any type.
If you try to save data to the memory without the microSD card inserted, appears on the screen, informing you that it is not possible to save the recording.
When the memory is full, no more recordings can be made, nor any final results saved. If this is attempted, the 'MEMORY FULL' message will appear on screen. If the memory reaches its maximum capacity before a recording has finished, data recording will stop, although the measurement will continue. When the measurement is complete, the final result will be stored in the memory.
The Lab application lets you download and delete memory records while the device is measuring.

112 Chapter 16 Records and memory management
INDICATOR TYPE OF REGISTER
S Sound level meter
O 1/1 Analyser
T 1/3 Analyser
C 1/1 Reverberation time by interrupted noise method
c 1/3 Reverberation time by interrupted noise method
I 1/1 Reverberation time by integrated impulse response method
i 1/3 Reverberation time by integrated impulse response method
D Occupational noise
F FFT
A Audio (display unavailable)
N Voice comments (display unavailable)
Each register corresponds to a folder. This contains the files belonging to the measurement taken and a sub-folder with the audio files associated with that measurement.
If no audio has been recorded during the measurement, the record file will contain the measurement files, but the audio file sub-folder will remain empty. However, if you make a recording in audio mode or record a voice comment, the register file will only contain the sub-folder with the audio file concerned.
16.4 Viewing and deleting registers
To view or delete a record saved on a microSD card, whether a recording or a
final result, ensure there is no measurement in progress and press . The
menu screen will be displayed automatically.
The cursor (highlighted option) will be at the first option in the menu area. Press
and to select the RECORDS option and press .
The following screen will then be displayed with a list of the registers saved to memory.
START DATE
START TIME
REGISTRER NO. TYPE OF REGISTRER

Chapter 16 Records and memory management 113
.
The upper part of the screen will display information on the total number of registers saved to memory and the position of the register currently selected.
Select the register to be deleted or viewed using and and press . (If you hold down or , the cursor will jump to every 7th register). Next, use
and to select whether you wish to view or delete the register indicated,
and press to validate the action.
Pressing takes you to the initial list.
Pressing takes you directly to the current measurement mode.
16.4.1 Viewing registers
If you have chosen the "view a register" option, the final results of this register will be displayed.
On the right-hand side of the indicator area, the indicator will appear, showing that a register is being viewed. On the left-hand side, you will see the measurement mode of the register being viewed.
Pressing takes you to the initial list containing all the registers in the SC420 memory.
NOTE: Audio registers cannot be viewed. If you try to view them, the screen
will display indicating that the option is not available.

114 Chapter 16 Records and memory management
16.4.2 Deleting registers
If you have chosen the "delete a register" option, you will be asked to confirm
whether you wish to delete that register. Press to delete it, or press to go back to the previous menu without deleting the register.
16.5 Deleting the card memory
To completely erase the card memory of the SC420, ensure there is no
measurement in progress and press . The menu screen will be displayed automatically.
The cursor (highlighted option) will be at the first option in the menu area. Press
and to select the MEMORY CARD option and press . The following screen will appear:
.
At the top of the screen, the space used and the total size of the memory card will be displayed.
Next, press and accept the DELETE option. This action will erase all registers (final results and recordings) and audio files on the memory card.
Next, you will be asked to confirm whether you wish to delete the memory card.
Press to confirm, or press to go back to the previous menu without deleting the card. Deleting the memory card will cause the data to be lost permanently. It is therefore recommended to download the data with the CMD software before deleting the card.

Chapter 17 Using the inputs and outputs 115
17.1 Digital inputs and outputs and AC output
The following section describes the digital inputs and outputs and the AC output of the SC420.
17.1.1 AC Output
The AC (alternating current) output is an analogue output directly proportional to the output of the preamplifier without frequency weighting and is available through the AC OUTPUT connector of the CN420 cable, when this is connected to the SC420 multi-connector.
The AC OUTPUT connector is of the mono female mini jack type. To connect it to any audio device (PC sound card, DAT, digital recorder, headphones, etc.), use a standard audio cable (one end must have a mono male mini jack connector and the other end the connector for the audio device).
In order to adapt the dynamic range of the AC output to that of the audio device, you can adjust the gain of the AC output (0 dB for high sound levels or 40 dB for low levels) in the AC OUTPUT option of the SETTINGS menu. Please see 15.3.7.
Using the inputs and outputs
17. Using the inputs and outputs
17
Digital Input
Digital Output
RS-232
AC Output
Multi-connector
USB Memory Card
Multi-connector

116 Chapter 17 Using the inputs and outputs
The AC output lets you listen to the signal being measured by simply connecting your headphones and thus determining whether it is influenced by noises other than those you wanted to measure.
It is also possible to record this signal with an audio recording device for recognition of the sound event measured, or for later analysis by making a calibrated recording using a lossless recording system with enough linear dynamic range for recording. SC420 already incorporates these two options through its listening quality audio recordings and analysis quality audio recording measuring mode.
A calibrated recording involves recording a calibration signal before and after recording the measurement and without altering recording gains. The 1 kHz and 94 dB tone generated by the CB006 acoustic calibrator is normally used. Subsequently, the measuring instrument's input gain is adjusted to ensure it correctly measures the calibration signal recorded.
17.1.2 Digital input
The digital input of SC420 is an input that lets you start and stop a data recording according to its status. This input can also be used to insert markers while recording data (see 14.3). It is available through the DIGITAL INPUT on the CN420 cable (red RCA-type connector), when this is connected to the SC420 multi-connector.
The SC420 waits for a change in logical level (from 1 to 0) to start measuring (or recording). And it then waits for another change (from 0 to 1) to stop.
To enable this start and/or end measurement/recording mode, please see 15.3.3. The digital input value is updated every second.
17.1.3 Digital output
The SC420 digital output is an open collector output that takes logical values when the automatic audio recording threshold is exceeded (see 15.3.3). It is available through the DIGITAL OUTPUT on the CN420 cable (white RCA-type connector), when this is connected to the SC420 multi-connector.
The open collector digital output lets you choose the polarisation resistance of the collector and thus fix the output voltage of the high logical level 1. If the threshold is not exceeded, the signal in the digital output keeps the value at 1; if it is exceeded, the value changes to 0.
The thresholds for automatic audio recording are set for each DEN time interval. Please see 15.3.3. The digital output value is updated every second.

Chapter 17 Using the inputs and outputs 117
17.2 Communicating with a PC, downloading data and communicating with a printer
The SC420 features the following types of communication:
Memory card slot: for inserting a memory card, from which data is downloaded to a PC.
Communications inputs/outputs: for real-time communication, programming and sending the measured functions to a printer.
o USB: Digital communication. Complies with USB rev. 2.0.
o RS-232: Two-way serial digital communication for communication with a personal computer and with a serial printer.
o Bluetooth® wireless communication: Class 1 wireless digital communication.
17.2.1 Memory card
When you make a recording, save final results, record audio or make a recording in analysis quality, this information is saved on the microSD memory card inserted in the slot in the bottom of the SC420.
To download data from the memory card to a PC, you need the Lab software application. There are two ways of performing this process:
Using the communication inputs/outputs of the SC420: USB, RS-232 serial or Bluetooth® wireless communication (see 4.2).
By importing the data directly from the card
The latter option requires a computer with a micro SD card reader. There are computers with SD card readers, for which there are micro SD card to SD card adaptors.
The SC420 must be switched off*. Remove the memory card from the SC420 and insert it into the PC's card reader. Using the Lab software, you can now access the SC420 memory card data (see 17.3).
NOTE: This is the quickest way to transfer large quantities of data from an SC420 to a computer.
*If the sound level meter is not switched off when the memory card is removed, data could be lost and the card could even be damaged.
accepts no responsibility for the loss of card data.
Please see precautions and warnings to take into account regarding microSD cards.
NOTE: For the device to function correctly, you should use at least a class 4 card.
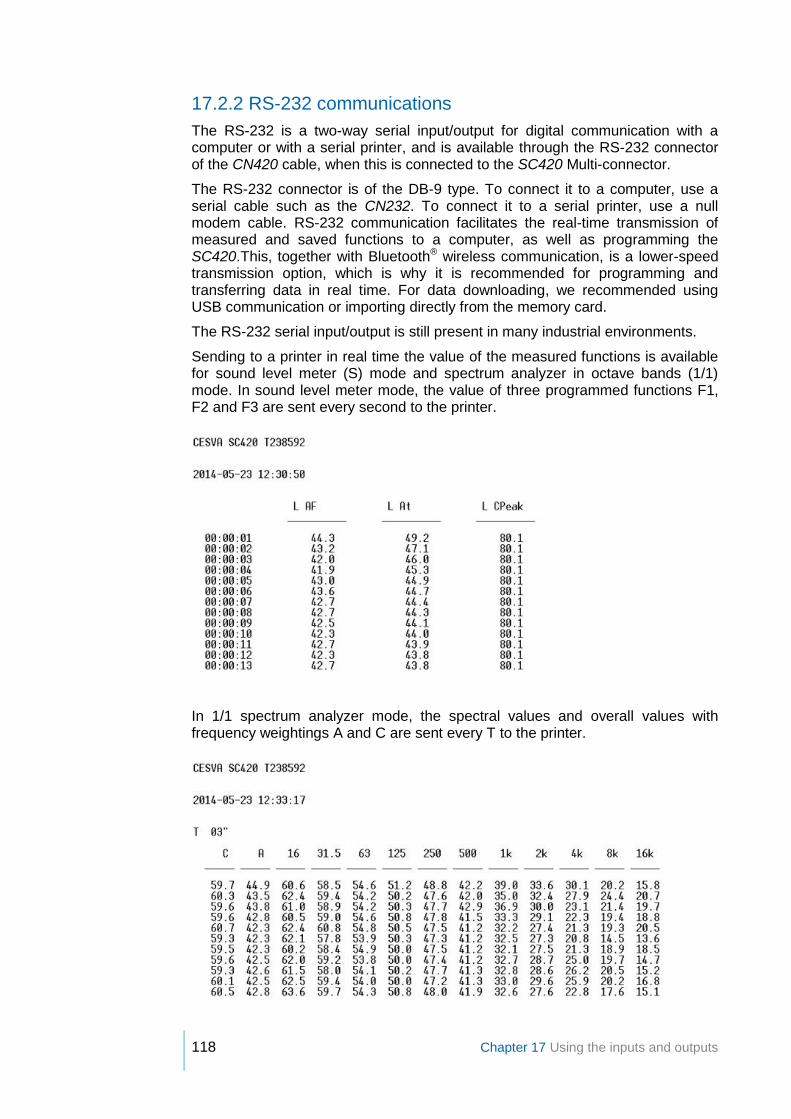
118 Chapter 17 Using the inputs and outputs
17.2.2 RS-232 communications
The RS-232 is a two-way serial input/output for digital communication with a computer or with a serial printer, and is available through the RS-232 connector of the CN420 cable, when this is connected to the SC420 Multi-connector.
The RS-232 connector is of the DB-9 type. To connect it to a computer, use a serial cable such as the CN232. To connect it to a serial printer, use a null modem cable. RS-232 communication facilitates the real-time transmission of measured and saved functions to a computer, as well as programming the SC420.This, together with Bluetooth® wireless communication, is a lower-speed transmission option, which is why it is recommended for programming and transferring data in real time. For data downloading, we recommended using USB communication or importing directly from the memory card.
The RS-232 serial input/output is still present in many industrial environments.
Sending to a printer in real time the value of the measured functions is available for sound level meter (S) mode and spectrum analyzer in octave bands (1/1) mode. In sound level meter mode, the value of three programmed functions F1, F2 and F3 are sent every second to the printer.
In 1/1 spectrum analyzer mode, the spectral values and overall values with frequency weightings A and C are sent every T to the printer.

Chapter 17 Using the inputs and outputs 119
The serial printer must have 80 columns.
The serial communication format is as follows:
• Speed: 9600 Baud
• Data Bits: 8
• Parity: No
• Stop Bits: 1
To send the value of the measured functions to a printer, the serial communication with the printer must be enabled in BLUETOOTH®/PRINTER
wireless communication option of SC420 menu. The symbol appears in the indicator area.
While this option is enabled, the serial communication or Bluetooth® wireless communication with a computer is not possible.
When the SC420 is turned on, the RS-232 communication is set to the programmed state: Bluetooth® wireless communication, serial communication with printer or OFF.
17.2.3 USB communications
The USB is a digital communication input/output that complies with USB rev. 2.0. and is available on the underside of the SC420.
The USB connector is of the micro-B USB type. To connect it to a computer, use the CN400 cable.
USB communication offers high-speed transfer, ideal for downloading the large quantities of data that the SC420 can store. It can also be used to programme the SC420 and send data in real time.
To download records containing audio files, we recommend directly importing them from the memory card.
17.2.4 Bluetooth® wireless communication
The SC420 is equipped with class 1 internal Bluetooth® wireless communication for communication with a computer.
From the BLUETOOTH® WIRELESS COMMUNICATION option in the SETTINGS menu you can enable or disable this input/output (see 15.3.8).
To use Bluetooth® wireless communication via radio frequency link with a computer, the computer must have a Bluetooth® wireless communication device*, or you can purchase the BT002 Bluetooth® wireless communication device for PC .
Bluetooth® wireless technology is used for measuring acoustic insulation between rooms, as the communication can be established through walls, and also in continuous noise monitoring terminals, as these tend to be situated at a height of 4.0 m, which means data can be downloaded and the terminals programmed from street level, without having to physically access them.

120 Chapter 17 Using the inputs and outputs
17.3 PC software
The communications software supplied with the SC420 Lab lets you:
Download registers stored on the SC420.
Import registers saved on the SC420 memory card.
Manage registers (total or selective deletion).
The SC420 lets you download data as it is being recorded. That is, while data are being recorded, they can be downloaded at the same time. It also offers the possibility of deleting some of the registers stored on the card after they have been downloaded.
For all these functions, you need to choose the type of communication between the SC420 and the computer. This may be RS-232, USB or wireless Bluetooth®.
In addition, the Cesva Lab Software allows the following actions:
Numerical and graphical display and reporting of records downloaded from the SC420,
Editing and recalculating the registers downloaded from the SC420
Further information on how the software application works is available in its 'help' section.
NOTE: To save battery power, disable Bluetooth® wireless communication when it is not needed.
* accepts no responsibility for problems caused by using any Bluetooth® wireless communication device other than the BT002.

Chapter 18 Accessories 121
The following section describes the accessories supplied with the SC420 and the optional accessories that can be purchased separately.
18.1 Accessories supplied
The accessories supplied with the SC420 are the following:
MODEL DESCRIPTION
CESVALab
CN400
PV009
CESVA Memory Download computer communication software
MicroUSB-USB PC connection cable
Windscreen
MicroSD memory card
2 units of 1.5 V batteries
18.2 Optional accessories
The optional accessories for the SC420 are the following:
MODEL DESCRIPTION
CB006
TR040
TR050
ML043
ML013
ML063
AM300
FN004
TK200
CN003
CN010
CN030
CN420
Class 1 acoustic calibrator
Tripod (height 1.10 m)
Tripod (height 1.50 m)
Transport briefcase (48x37x16 cm)
Transport briefcase (39x32x12 cm)
Special outdoors transport briefcase (51x38x15 cm)
Mains feeder (V= 100/240 V, 50/60 Hz)
Protective case
Outdoor kit
Microphone extension cable (3 m)
Microphone extension cable (10 m)
Microphone extension cable (30 m)
Multi-connector cable
Accessories
18. Accessories
18

122 Chapter 18 Accessories
TR001
PR003
Tripod adaptor
Extendible rod (3 m)
NOTE: only guarantees the correct functioning of the device when original accessories are used Any damage caused to the device owing to the use of non-original accessories will not be covered by the warranty.

Chapter 19 Technical specifications 123
This section contains the technical specifications of the SC420 sound level meter, which is designed to comply with, among others, with the following standards:
IEC 61672–1 (2002–05), Class 1, Group Z
IEC 61260:1995/A1:2001, Class 1
In accordance with standard IEC 61672-1, the class of the SC420 for response to sound waves incident on the microphone in the reference direction in a free field depends on the microphone used.
CLASS MICROPHONE PREAMPLIFIER
1 C-130 PA020
1 C140 PA020
1 C240 PA040
When the field correction is set to diffuse field, the SC420 complies with the class indicated above according to standard IEC 61672-1 for response with random incidence in a diffuse field; it also complies with standards ANSI S1.4:83(R2001) and ANSI S1.43:97(R2002).
NOTE: The specifications in bold include (in brackets) the sub-section of Chapter 9.3 of standard IEC 61672-1 concerning information for testing sound level meters.
19.1 REFERENCE CONDITIONS
REFERENCE DIRECTION Perpendicular to the microphone diaphragm
MICROPHONE REFERENCE POINT (c)
C-130, C140 and C240
Central point of the microphone diaphragm
RANGE OF REFERENCE LEVELS (b) There is only one range of levels and this is the reference range
REFERENCE SOUND PRESSURE LEVEL (a) 94 dB
(referred to 20 Pa)
REFERENCE FREQUENCY 1 kHz
REFERENCE TEMPERATURE
REFERENCE RELATIVE HUMIDITY
REFERENCE ATMOSPHERIC PRESSURE
23 °C
50 %
101.325 kPa
Technical specifications
19. Technical specifications
19

124 Chapter 19 Technical specifications
19.2 MICROPHONES AND PREAMPLIFIERS
The table below shows the technical features of the microphones and the accessories that attach to them.
19.2.1 Microphone models and their main features
As a class 1 device, the SC420 can be used in conjunction with the following brand microphone models: C-130, C140 and C240.
MICROPHONE MICROPHONE C-130 MICROPHONE C140 MICROPHONE C240
TYPE, SIZE and FIELD condenser, ½" and free field
REFERENCE DIRECTION Perpendicular to the microphone diaphragm
POLARISATION 200 V 200 V 0 V
NOMINAL CAPACITANCE 22.5 pF 20.0 pF 20.0 pF
NOMINAL SENSITIVITY in reference conditions
17.5 mV/Pa 43.5 mV/Pa 49.0 mV/Pa
MAXIMUM SPL (i)
that the microphone can measure without harming the device
156 dB 150 dB 150 dB
ELECTRICAL CHECKING ADAPTOR (g)
ADM0C130 adaptor ADM0C130 adaptor ADM0C130 adaptor
MAXIMUM VOLTAGE APPLICABLE WITH THE ADAPTOR (i)
26 Vpp 26 Vpp 26 Vpp
ADAPTOR FOR ELECTRICAL NOISE TESTS (h)
ADM0C130 adaptor + TP001 clasp
ADM0C130 adaptor + TP001 clasp
ADM0C130 adaptor + TP001 clasp
19.2.2 Sound field correction for periodic tests
To carry out periodic tests, it is recommended to use the B&K Multifunction Acoustic Calibrator Model 4226, the B&K Electrostatic Actuator Model UA035 or the Electrostatic Actuator Model IC150 (d)
SOUND FIELD CORRECTION GENERATED BY B&K MULTIFUNCTION ACOUSTIC CALIBRATOR MODEL 4226 IN A FREE FIELD
MICROPHONE C-130 C140 C240
FREQUENCY (Hz) Correction (dB) Correction (dB) Correction (dB)
31.5 -0.1 -0.1 -0.1
63 -0.1 0.0 0.0
125 0.0 0.0 0.0
250 0.0 0.0 0.0
500 0.0 0.1 0.1
1000 0.1 0.1 0.1
2000 0.3 0.3 0.2

Chapter 19 Technical specifications 125
4000 1.2 1.1 0.9
8000 3.2 3.1 3.0
12500 6.3 6.3 6.2
16000 8.8 7.9 7.6
CORRECTION OF THE RESPONSE OBTAINED WITH THE B&K ELECTROSTATIC ACTUATOR MODEL UA035 IN A FREE FIELD
MICROPHONE C-130 C140 C240
FREQUENCY (Hz) Correction Correction Correction
Exact base 10 frequency [dB] [dB] [dB]
63 63.0957 0.00 0.00 0.00
80 79.4328 0.00 0.00 0.00
100 100 0.00 0.00 0.00
125 125.893 0.00 0.00 0.00
160 158.489 0.00 0.00 0.00
200 199.526 0.00 0.00 0.00
250 251.189 0.00 0.00 0.00
315 316.228 -0.03 0.01 -0.02
400 398.107 -0.02 0.02 0.00
500 501.187 0.02 0.02 0.00
630 630.957 0.01 0.03 0.01
800 794.328 0.04 0.05 0.03
1000 1000 0.04 0.07 0.06
1059.25 0.11 0.08 0.07
1122.02 0.11 0.10 0.07
1188.50 0.14 0.12 0.09
1250 1258.93 0.15 0.13 0.10
1333.52 0.13 0.14 0.11
1412.54 0.17 0.15 0.13
1496.24 0.20 0.17 0.15
1600 1584.89 0.22 0.20 0.18
1678.80 0.25 0.22 0.21
1778.28 0.26 0.25 0.23
1883.65 0.30 0.28 0.26
2000 1995.26 0.33 0.31 0.30
2113.49 0.36 0.35 0.33
2238.72 0.43 0.39 0.37
2371.37 0.47 0.44 0.42

126 Chapter 19 Technical specifications
2500 2511.89 0.52 0.49 0.47
2660.73 0.56 0.54 0.52
2818.38 0.63 0.60 0.58
2985.38 0.70 0.67 0.65
3150 3162.28 0.78 0.74 0.71
3349.65 0.86 0.81 0.79
3548.13 0.96 0.89 0.87
3758.37 1.06 0.99 0.97
4000 3981.07 1.19 1.09 1.07
4216.97 1.32 1.21 1.20
4466.84 1.45 1.35 1.34
4731.51 1.61 1.48 1.47
5000 5011.87 1.78 1.65 1.64
5308.84 1.97 1.81 1.81
5623.41 2.15 1.97 1.97
5956.62 2.38 2.16 2.16
6300 6309.57 2.61 2.37 2.40
6683.44 2.86 2.60 2.64
7079.46 3.09 2.85 2.88
7498.94 3.35 3.12 3.14
8000 7943.28 3.74 3.37 3.38
8413.95 4.04 3.61 3.59
8912.51 4.34 3.90 3.83
9440.61 4.62 4.23 4.17
10000 10000 5.00 4.58 4.57
10592.5 5.25 5.00 5.09
11220.2 5.72 5.65 5.71
11885.0 6.16 6.18 6.26
12500 12589.3 6.51 6.67 6.85
13335.2 6.90 7.02 7.22
14125.4 7.40 7.44 7.58
14962.4 7.77 7.88 7.99
16000 15848.9 8.32 8.11 8.28
16788.0 8.52 8.40 8.64
17783.8 8.86 8.73 8.91
18836.5 9.23 8.91 8.98
20000 19952.6 9.41 9.10 9.16

Chapter 19 Technical specifications 127
CORRECTION OF THE RESPONSE OBTAINED WITH THE ELECTROSTATIC ACTUATOR IC150 IN A FREE FIELD
MICROPHONE C-130 C140 C240
FREQUENCY (Hz) Correction Correction Correction
Exact base 10 freq. [dB] [dB] [dB]
63 63.0957 0.00 0.00 0.00
80 79.4328 0.00 0.00 0.00
100 100 0.00 0.00 0.00
125 125.893 0.00 0.00 0.00
160 158.489 0.00 0.00 0.00
200 199.526 0.00 0.00 0.00
250 251.189 0.00 0.00 0.00
315 316.228 -0.03 0.01 -0.01
400 398.107 -0.03 0.02 0.00
500 501.187 0.02 0.02 0.01
630 630.957 0.01 0.03 0.02
800 794.328 0.04 0.05 0.02
1000 1000 0.05 0.07 0.06
1059.25 0.11 0.07 0.06
1122.02 0.12 0.09 0.07
1188.50 0.14 0.11 0.09
1250 1258.93 0.16 0.12 0.09
1333.52 0.15 0.13 0.11
1412.54 0.19 0.14 0.13
1496.24 0.22 0.16 0.14
1600 1584.89 0.24 0.18 0.17
1678.80 0.27 0.20 0.19
1778.28 0.28 0.23 0.22
1883.65 0.31 0.27 0.24
2000 1995.26 0.34 0.30 0.29
2113.49 0.38 0.33 0.32
2238.72 0.44 0.38 0.35
2371.37 0.49 0.42 0.40
2500 2511.89 0.54 0.48 0.46
2660.73 0.60 0.52 0.50
2818.38 0.66 0.58 0.56
2985.38 0.74 0.64 0.62

128 Chapter 19 Technical specifications
3150 3162.28 0.83 0.71 0.68
3349.65 0.92 0.79 0.76
3548.13 1.02 0.85 0.83
3758.37 1.13 0.95 0.94
4000 3981.07 1.25 1.04 1.04
4216.97 1.38 1.17 1.16
4466.84 1.53 1.30 1.29
4731.51 1.71 1.43 1.42
5000 5011.87 1.89 1.60 1.59
5308.84 2.07 1.77 1.76
5623.41 2.27 1.95 1.93
5956.62 2.50 2.17 2.15
6300 6309.57 2.75 2.43 2.44
6683.44 3.02 2.70 2.70
7079.46 3.25 2.96 2.98
7498.94 3.55 3.23 3.24
8000 7943.28 3.90 3.48 3.48
8413.95 4.22 3.70 3.68
8912.51 4.54 3.90 3.88
9440.61 4.86 4.16 4.13
10000 10000 5.27 4.41 4.43
10592.5 5.53 4.65 4.77
11220.2 6.01 5.09 5.23
11885.0 6.43 5.59 5.71
12500 12589.3 6.77 6.15 6.23
13335.2 7.18 6.67 6.74
14125.4 7.72 7.19 7.24
14962.4 8.17 7.85 7.89
16000 15848.9 8.77 8.29 8.42
16788.0 8.97 8.60 8.73
17783.8 9.22 8.80 8.96
18836.5 9.55 8.83 8.98
20000 19952.6 9.86 9.00 9.07

Chapter 19 Technical specifications 129
19.2.3 Frequency response
RESPONSE TO PLANE PROGRESSIVE SOUND WAVES INCIDENT IN THE REFERENCE DIRECTION
Correction for the average frequency microphone response for plane progressive sound waves incident in the reference direction.
MICROPHONE C-130 C140 C240
FREQUENCY (Hz) Correction Correction Correction Uncertainty
Exact base 10 freq. [dB] [dB] [dB] [dB]
63 63.0957 0.00 0.00 0.00 0.06
80 79.4328 0.00 0.00 0.00 0.06
100 100 0.00 0.00 0.00 0.06
125 125.893 0.00 0.00 0.00 0.06
160 158.489 0.00 0.00 0.00 0.06
200 199.526 0.00 0.00 0.00 0.06
250 251.189 0.00 0.00 0.00 0.06
315 316.228 -0.05 0.00 -0.02 0.06
400 398.107 -0.07 0.00 -0.02 0.06
500 501.187 -0.05 0.00 -0.02 0.06
630 630.957 -0.08 0.00 -0.02 0.06
800 794.328 -0.08 0.00 -0.03 0.06
1000 1000 -0.09 -0.01 -0.03 0.06
1059.25 -0.07 -0.01 -0.03 0.06
1122.02 -0.08 0.00 -0.03 0.06
1188.50 -0.07 0.01 -0.03 0.06
1250 1258.93 -0.08 0.00 -0.03 0.06
1333.52 -0.10 0.00 -0.03 0.06
1412.54 -0.09 0.00 -0.03 0.06
1496.24 -0.08 0.01 -0.03 0.06
1600 1584.89 -0.08 0.01 -0.02 0.06
1678.80 -0.08 0.01 -0.02 0.06
1778.28 -0.10 0.01 -0.02 0.06
1883.65 -0.10 0.02 -0.02 0.06
2000 1995.26 -0.10 0.02 -0.01 0.06
2113.49 -0.10 0.02 -0.01 0.06
2238.72 -0.09 0.03 -0.02 0.06
2371.37 -0.08 0.03 -0.02 0.06

130 Chapter 19 Technical specifications
2500 2511.89 -0.08 0.04 -0.02 0.06
2660.73 -0.08 0.03 -0.03 0.06
2818.38 -0.09 0.03 -0.02 0.06
2985.38 -0.08 0.03 -0.03 0.06
3150 3162.28 -0.07 0.02 -0.04 0.06
3349.65 -0.06 0.03 -0.04 0.06
3548.13 -0.05 0.01 -0.06 0.06
3758.37 -0.05 0.01 -0.05 0.06
4000 3981.07 -0.03 -0.01 -0.07 0.06
4216.97 -0.02 -0.01 -0.06 0.06
4466.84 -0.01 -0.01 -0.06 0.06
4731.51 0.00 -0.03 -0.07 0.06
5000 5011.87 0.01 -0.02 -0.05 0.06
5308.84 0.01 -0.05 -0.06 0.06
5623.41 0.02 -0.09 -0.08 0.06
5956.62 0.03 -0.12 -0.09 0.06
6300 6309.57 0.04 -0.15 -0.08 0.06
6683.44 0.05 -0.18 -0.07 0.06
7079.46 0.01 -0.22 -0.07 0.06
7498.94 0.03 -0.26 -0.08 0.06
8000 7943.28 0.08 -0.35 -0.13 0.06
8413.95 0.07 -0.49 -0.24 0.06
8912.51 0.05 -0.66 -0.37 0.06
9440.61 0.00 -0.79 -0.46 0.06
10000 10000 0.02 -0.94 -0.49 0.06
10592.5 -0.11 -1.10 -0.49 0.08
11220.2 -0.04 -1.08 -0.36 0.08
11885.0 -0.03 -0.99 -0.21 0.08
12500 12589.3 -0.14 -0.87 -0.05 0.08
13335.2 -0.19 -0.86 0.03 0.08
14125.4 -0.12 -0.86 0.09 0.08
14962.4 -0.22 -0.82 0.23 0.08
16000 15848.9 -0.12 -0.88 0.23 0.08

Chapter 19 Technical specifications 131
Correction for the average effects of the reflections of the sound level meter case and the diffraction around the microphone for plane progressive sound waves incident in the reference direction
FREQUENCY (Hz) Correction Uncertainty
Exact base 10 freq. [dB] [dB]
63 63.0957 0.00 0.11
80 79.4328 0.00 0.11
100 100 0.00 0.11
125 125.893 0.00 0.11
160 158.489 0.00 0.11
200 199.526 0.00 0.11
250 251.189 0.00 0.11
315 316.228 -0.05 0.11
400 398.107 0.02 0.11
500 501.187 0.03 0.11
630 630.957 0.04 0.11
800 794.328 -0.07 0.11
1000 1000 -0.09 0.11
1059.25 -0.13 0.14
1122.02 -0.12 0.14
1188.50 -0.16 0.14
1250 1258.93 -0.19 0.14
1333.52 -0.15 0.14
1412.54 -0.11 0.14
1496.24 0.00 0.14
1600 1584.89 0.04 0.14
1678.80 -0.07 0.14
1778.28 0.02 0.14
1883.65 -0.08 0.14
2000 1995.26 0.03 0.14
2113.49 0.09 0.14
2238.72 -0.09 0.14
2371.37 -0.14 0.14
2500 2511.89 -0.11 0.14
2660.73 -0.03 0.14
2818.38 0.00 0.14
2985.38 -0.15 0.14
3150 3162.28 -0.07 0.14
3349.65 0.03 0.14

132 Chapter 19 Technical specifications
3548.13 -0.13 0.14
3758.37 -0.02 0.14
4000 3981.07 0.00 0.14
4216.97 -0.13 0.14
4466.84 -0.14 0.14
4731.51 -0.25 0.14
5000 5011.87 -0.08 0.14
5308.84 -0.11 0.14
5623.41 0.02 0.14
5956.62 -0.09 0.14
6300 6309.57 -0.14 0.14
6683.44 -0.10 0.14
7079.46 -0.26 0.14
7498.94 -0.11 0.14
8000 7943.28 -0.16 0.14
8413.95 -0.04 0.14
8912.51 0.02 0.14
9440.61 -0.12 0.14
10000 10000 -0.12 0.14
10592.5 -0.02 0.42
11220.2 -0.02 0.42
11885.0 0.01 0.42
12500 12589.3 -0.19 0.42
13335.2 -0.03 0.42
14125.4 0.02 0.42
14962.4 -0.21 0.62
16000 15848.9 -0.09 0.62

Chapter 19 Technical specifications 133
Correction for the average effects of the PV009 windscreen on the sound level meter frequency response in the absence of wind.
FREQUENCY (Hz) PV009 WINDSCREEN
Exact base 10 freq. Correction (dB) Uncertainty [dB]
1000 1000 0.35 0.00
1250 1258.93 0.45 0.11
1600 1584.89 0.61 0.11
2000 1995.26 0.57 0.11
2500 2511.89 0.35 0.11
3150 3162.28 0.12 0.11
4000 3981.07 0.30 0.11
5000 5011.87 0.24 0.11
6300 6309.57 0.09 0.11
8000 7943.28 -0.05 0.11
10000 10000 -0.23 0.11
12500 12589.3 -0.14 0.57
16000 15848.9 -0.54 0.85
The discrepancies between the measured frequency response effects of the different microphones, reflection, diffraction and the windscreen, extended with the uncertainty, do not exceed two thirds of the tolerance limits specified in section 19.3.7.
Level [d
B]
Frequency (Hz)
2.00
1.50
1.00
0.50
0.00
0.50
1.00
1.50
2.00
100.00 1000.00 10,000.00

134 Chapter 19 Technical specifications
RESPONSE WITH RANDOM INCIDENCE IN A DIFFUSE FIELD
Correction for the average frequency response of theSC420 sound level meter, with the sound field correction set to diffuse field, for response with random incidence in a diffuse field.
MICROPHONE C-130 C140 C240
FREQUENCY (Hz) Correction Correction Correction
Exact base 10 freq. [dB] [dB] [dB]
250 251.189 -0.26 -0.26 -0.23
315 316.228 -0.28 -0.23 -0.24
400 398.107 -0.27 -0.20 -0.21
500 501.187 -0.19 -0.14 -0.16
630 630.957 -0.06 0.02 0.00
800 794.328 -0.02 0.06 0.03
1000 1000 -0.03 0.05 0.03
1250 1258.93 -0.11 -0.03 -0.05
1600 1584.89 -0.19 -0.10 -0.11
2000 1995.26 -0.33 -0.21 -0.23
2500 2511.89 -0.17 -0.05 -0.11
3150 3162.28 -0.29 -0.20 -0.23
4000 3981.07 -0.36 -0.34 -0.38
5000 5011.87 -0.25 -0.28 -0.30
6300 6309.57 -0.13 -0.32 -0.24
8000 7943.28 0.01 -0.42 -0.17
10000 10000 0.11 -0.85 -0.59
12500 12589.3 -0.08 -0.81 0.08
16000 15848.9 -0.11 -0.87 0.28
20000 19952.6 -0.66 -1.87 -0.54

Chapter 19 Technical specifications 135
19.2.4 Directional response
Sound level meter directional response to plane progressive waves with angles of incidence 30°, 90° and 150º, including the reference direction.
Maximum variation in sensitivity at 30°, 90° and 150º in relation to the reference direction extended with the expanded measurement uncertainty
Vertical and Horizontal Planes SC420
FREQUENCY [kHz] Variation at 30º [dB] Variation at 90º [dB] Variation at 150º [dB]
Vertical Horizontal Vertical Horizontal Vertical Horizontal
0.25 to 1 0.5 0.4 1.1 0.9 1.2 1.0
>1 to 2 0.5 0.4 1.2 1.0 1.5 1.3
>2 to 4 1.0 0.8 2.1 1.9 2.8 2.4
>4 to 8 1.9 1.7 4.7 4.2 5.7 5.9
>8 to 12.5 2.6 2.4 7.8 7.4 9.8 9.9
VERTICAL PLANE DIRECTIVITY DIAGRAMS

136 Chapter 19 Technical specifications
HORIZONTAL PLANE DIRECTIVITY DIAGRAMS
19.2.5 Effect of the optional accessories on the microphone
The SC420 complies with the specifications of this standard for the same operating class when the following accessories are installed: the TK200 outdoor kit, the extension cables and the TR001 tripod support.
OUTDOOR KIT
Correction owing to the average effect of the outdoor kit on the microphone frequency response.
FREQUENCY (Hz) OUTDOOR KIT
Exact base 10 freq. Correction (dB)
1000 1000 0.10
1250 1258.93 0.10
1600 1584.89 0.40
2000 1995.26 0.70
2500 2511.89 1.20

Chapter 19 Technical specifications 137
3150 3162.28 1.40
4000 3981.07 1.30
5000 5011.87 0.60
6300 6309.57 0.30
8000 7943.28 1.40
10000 10000 -0.70
12500 12589.3 -4.00
16000 15848.9 -6.20
With the protective cover and the TK200 Outdoor Kit, the SC420 has an IP65 level of protection.
CABLES
The cables do not have any effect inside the measuring frequency band. A recalibration is not necessary when using the extension cables.
TRIPOD ADAPTOR
The influence of the TR001 tripod adaptor on the frequency response and directivity is negligible.
19.2.6 Preamplifier connector
Connect the PA020 and PA040 to the SC420 using LEMO-type connectors: with a female LEMO connector on the sound level meter and a male LEMO connector on the preamplifier. The pin-out of the connector appears as follows (exterior view):
1 No connection
2 Signal ground
3 200 V polarisation voltage
4 Signal
5 + 28 V
6 + 28 V
7 Power ground
19.3 MEASUREMENT
19.3.1 Warm-up time
The warm-up time is 15 seconds.
sound level meter
FEMALE
CONNECTOR
SC310
1
2
3
5
4
6 7

138 Chapter 19 Technical specifications
19.3.2 Measurement range
Measurement range at 1 kHz for the SC420 sound level meter with the C-130+PA020, C140+PA020 and C240+PA040 microphone and preamplifier sets:
FUNCTIONS: LF, LS, LI, Lt and LT: including LAeqT
Microphone and preamplifier Weighting A [dB] Weighting C [dB] Weighting Z [dB]
C-130+PA020 24.8 to 137.0 26.3 to 137.0 31.0 to 137.0
C140+PA020 23.4 to 137.0 23.4 to 137.0 27.2 to 137.0
C240+PA040 23.4 to 137.0 23.8 to 137.0 27.8 to 137.0
FUNCTION: LCpeak:
Microphone and preamplifier Weighting C [dB]
C-130+PA020, C140+PA020 and C240+PA040 55.0 to 140.1
19.3.3 Linearity range
The starting point for linearity testing is 94.0 dB (f)
FUNCTIONS: LF, LS, LI, Lt and LT: including LAeqT
Tables of the nominal sound levels with weighting A in the upper and lower limits of the linear functioning ranges in each level range (e).
Typical linearity range for the SC420 sound level meter with the C130 microphone and the PA020 preamplifier:
Frequency (Hz) Weighting A [dB] Weighting C [dB] Weighting Z [dB]
31.5 24.8 to 97.5 26.3 to 133.9 31.0 to 136.8
1000 24.8 to 137.0 26.3 to 137.0 31.0 to 137.0
4000 24.8 to 138.2 26.3 to 136.5 31.0 to 137.1
8000 24.8 to 136.1 26.3 to 134.1 31.0 to 137.2
12500 24.8 to 130.9 26.3 to 128.9 31.0 to 136.9
Typical linearity range for the SC420 sound level meter with the C140 microphone and the PA020 preamplifier:
Frequency (Hz) Weighting A [dB] Weighting C [dB] Weighting Z [dB]
31.5 23.4 to 97.5 23.4 to 133.9 27.2 to 136.8
1000 23.4 to 137.0 23.4 to 137.0 27.2 to 137.0
4000 23.4 to 138.2 23.4 to 136.5 27.2 to 137.1
8000 23.4 to 136.1 23.4 to 134.1 27.2 to 137.2
12500 23.4 to 130.9 23.4 to 128.9 27.2 to 136.9

Chapter 19 Technical specifications 139
Typical linearity range for the SC420 sound level meter with the C240 microphone and the PA040 preamplifier:
Frequency (Hz) Weighting A [dB] Weighting C [dB] Weighting Z [dB]
31.5 23.4 to 97.5 23.8 to 133.9 27.8 to 136.8
1000 23.4 to 137.0 23.8 to 137.0 27.8 to 137.0
4000 23.4 to 138.2 23.8 to 136.5 27.8 to 137.1
8000 23.4 to 136.1 23.8 to 134.1 27.8 to 137.2
12500 23.4 to 130.9 23.8 to 128.9 27.8 to 136.9
19.3.4 Noise
Highest expected intrinsic noise level produced when the sound level meter is placed in a lower level acoustic field, and when a specified electrical input device is installed in place of the microphone and stops suddenly (h).
Intrinsic noise of the SC420 sound level meter with the C-130 microphone and the PA020 preamplifier:
Weighting A [dB] Weighting C [dB] Weighting Z [dB]
ELECTRICAL NOISE
(replacing the microphone with its corresponding adapter and cap)
TYPICAL
MAXIMUM
11.5
12.1
13.4
14.3
18.9
19.9
TOTAL NOISE at 20 °C
(electrical + thermal microphone noise):
TYPICAL
MAXIMUM
17.3
20.4
18.8
21.5
23.5
26.2
Intrinsic noise of the SC420 sound level meter with the C140 microphone and the PA020 preamplifier:
Weighting A [dB] Weighting C [dB] Weighting Z [dB]
ELECTRICAL NOISE
(replacing the microphone with its corresponding adapter and cap)
TYPICAL
MAXIMUM
7.7
8.2
8.0
8.5
14.2
14.7
TOTAL NOISE at 20 °C
(electrical + thermal microphone noise):
TYPICAL
MAXIMUM
15.9
16.2
15.9
16.3
19.7
22.1
Intrinsic noise of the SC420 sound level meter with the C240 microphone and the PA040 preamplifier:
Weighting A [dB] Weighting C [dB] Weighting Z [dB]
ELECTRICAL NOISE
(replacing the microphone with its corresponding adapter and cap)
TYPICAL
MAXIMUM
5.2
5.9
6.3
7.0
12.8
13.3
TOTAL NOISE at 20 °C
(electrical + thermal microphone noise):
TYPICAL
MAXIMUM
15.9
17.3
16.3
18.1
20.3
26.5
NOTE: For electrical noise tests, the adaptor and cap appropriate to each microphone should be used.
NOTE: Intrinsic noise is measured with equivalent levels with integration time greater than 30 seconds.

140 Chapter 19 Technical specifications
19.3.5 Information for testing compliance withdrawn standards IEC 60651 and IEC 60804
PRIMARY INDICATOR RANGE (Functions LF, LS, LI, LE, Lt and LT)
Microphone and preamplifier Weighting A [dB] Weighting C [dB] Weighting Z [dB]
C-130+PA020 30.0 to 120.0 32.0 to 120.0 38.0 to 120.0
C140+PA020 30.0 to 120.0 32.0 to 120.0 38.0 to 120.0
C240+PA040 28.2 to 120.0 28.6 to 120.0 34.0 to 120.0
AVERAGING (Functions LT, Lt and LE)
Linearity range 110 dB
Pulse range 65 dB
Response time to a steady input signal 2 s
DETECTOR (Functions LF, LS and LI)
Function Pulse duration [dB] Maximum error (dB)
LF 200 1.0
LS 500 1.0
LI 20
5
2
1.5
2.0
2.0
Maximum error for signals with crest factor 3: 0.5 dB
Maximum error for signals with crest factor 5: 1.0 dB
Maximum error for signals with crest factor 10: 1.5 dB
Maximum overshoot: LF:
LS
1.1 dB
1.6 dB
Maximum error of level linearity (31.5 to 12,500 Hz): 0.7 dB
Maximum error of differential level linearity (31.5 to 12,500 Hz): 0.2 dB
LI function peak detector: Decay rate:
Onset time constant:
2.9 dB/s 0.5 dB/s
< 3.5 ms
PEAK DETECTOR Lpeak function
Onset time <75 s

Chapter 19 Technical specifications 141
19.3.6 Time and clock features
TIME
The screen refresh time is 1s.
When a measurement starts, the value of the functions that depend on the integration time (T) will appear when the time (T) is finished. This value will be updated every second but the changes on the display will not show until the time (T) is finished.
The clean-up of the maintenance device for conducting measurements of the maximum and minimum time weighted sound level and the peak sound level is automatic and is carried out at the end of each time base period: 125 ms, 1s, T or t; thus, its functioning is intrinsic to the definition of the functions themselves.
The minimum integration time is 125 ms; the programmable integration time (T) can take values from 1 second to 99 hours (1 to 99 seconds, minutes or hours).
When measuring decay curves for reverberation time evaluation, integration times of 10 ms are used. For FFT analysis, the maximum integration time is 1 minute.
CLOCK
The clock has a lower deflection than 10 seconds over a period of 24 hours.
19.3.7 Frequency weighting
The following table lists the frequency weightings available for each function
FUNCTION WEIGHTING
Lpeak A, C or Z
LF A, C or Z
LS A, C or Z
LI A, C or Z
LE A, C or Z
LT A, C or Z
Lt A, C or Z
Ln (percentiles) A
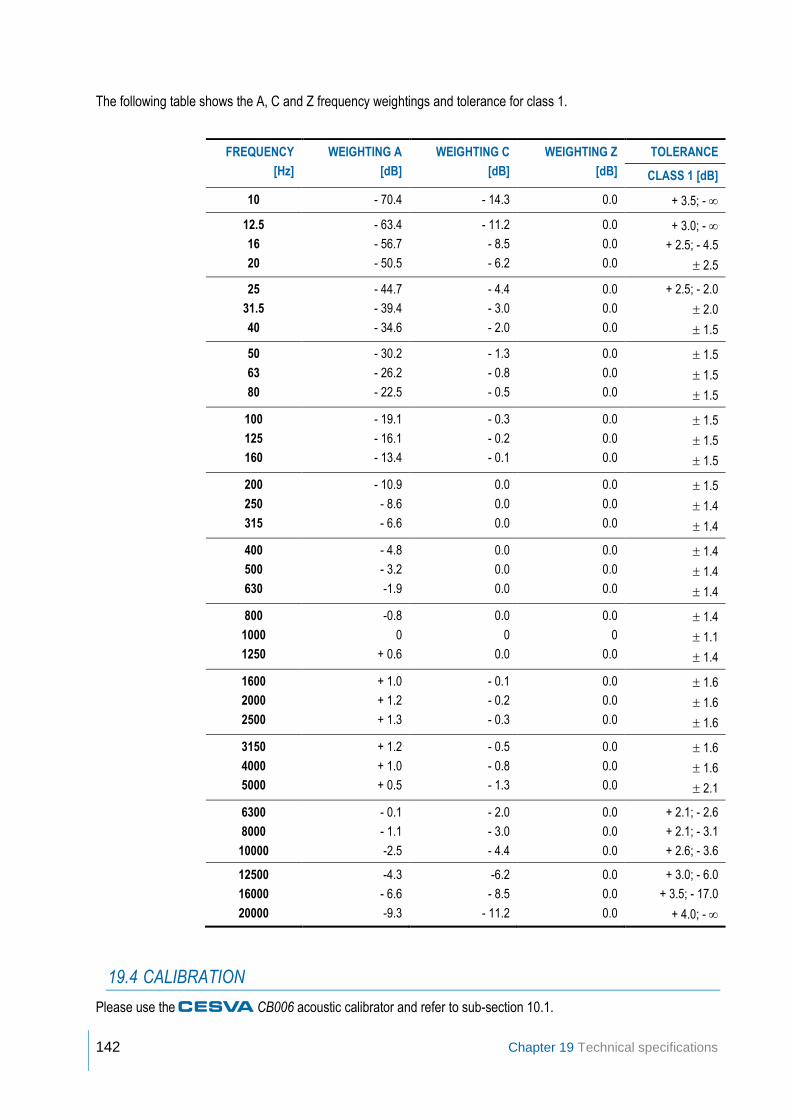
142 Chapter 19 Technical specifications
The following table shows the A, C and Z frequency weightings and tolerance for class 1.
FREQUENCY
[Hz]
WEIGHTING A
[dB]
WEIGHTING C
[dB]
WEIGHTING Z
[dB]
TOLERANCE
CLASS 1 [dB]
10 - 70.4 - 14.3 0.0 + 3.5; -
12.5
16
20
- 63.4
- 56.7
- 50.5
- 11.2
- 8.5
- 6.2
0.0
0.0
0.0
+ 3.0; -
+ 2.5; - 4.5
2.5
25
31.5
40
- 44.7
- 39.4
- 34.6
- 4.4
- 3.0
- 2.0
0.0
0.0
0.0
+ 2.5; - 2.0
2.0
1.5
50
63
80
- 30.2
- 26.2
- 22.5
- 1.3
- 0.8
- 0.5
0.0
0.0
0.0
1.5
1.5
1.5
100
125
160
- 19.1
- 16.1
- 13.4
- 0.3
- 0.2
- 0.1
0.0
0.0
0.0
1.5
1.5
1.5
200
250
315
- 10.9
- 8.6
- 6.6
0.0
0.0
0.0
0.0
0.0
0.0
1.5
1.4
1.4
400
500
630
- 4.8
- 3.2
-1.9
0.0
0.0
0.0
0.0
0.0
0.0
1.4
1.4
1.4
800
1000
1250
-0.8
0
+ 0.6
0.0
0
0.0
0.0
0
0.0
1.4
1.1
1.4
1600
2000
2500
+ 1.0
+ 1.2
+ 1.3
- 0.1
- 0.2
- 0.3
0.0
0.0
0.0
1.6
1.6
1.6
3150
4000
5000
+ 1.2
+ 1.0
+ 0.5
- 0.5
- 0.8
- 1.3
0.0
0.0
0.0
1.6
1.6
2.1
6300
8000
10000
- 0.1
- 1.1
-2.5
- 2.0
- 3.0
- 4.4
0.0
0.0
0.0
+ 2.1; - 2.6
+ 2.1; - 3.1
+ 2.6; - 3.6
12500
16000
20000
-4.3
- 6.6
-9.3
-6.2
- 8.5
- 11.2
0.0
0.0
0.0
+ 3.0; - 6.0
+ 3.5; - 17.0
+ 4.0; -
19.4 CALIBRATION
Please use the CB006 acoustic calibrator and refer to sub-section 10.1.

Chapter 19 Technical specifications 143
19.5 OCTAVE AND THIRD OCTAVE BAND FILTERS
The SC420 is equipped with class 1 octave and third octave band filters that comply with IEC 61260:1995/A1:2001
19.5.1 Octave and third octave band filters
FREQUENCY EVALUATION SYSTEM Base 10
REFERENCE ATTENUATION 0 dB
LINEARITY OPERATING RANGE Same as the measurement range
ANALYTICAL FILTER DESIGN METHOD Optimised Z-transform for Butterworth analogue filters
SAMPLING FREQUENCY:
Octave band filters
Third octave band filters
48 kHz
Decimation from 48 kHz
REAL TIME OPERATING FREQUENCY RANGE:
Octave band filters
Third octave band filters
Central frequencies
16 to 16000 Hz
10 to 20000 Hz
OCTAVE BAND FILTERS THIRD OCTAVE BAND FILTERS
NOMINAL CENTRAL FREQUENCY
[Hz]
EXACT BASE 10 FREQUENCY
[Hz]
NOMINAL CENTRAL FREQUENCY
[Hz]
EXACT BASE 10 FREQUENCY
[Hz]
10 10.000
16
15.849
12.5
16
20
12.589
15.849
19.953
31.5
31.623
25
31.5
40
25.119
31.623
39.811
63
63.096
50
63
80
50.119
63.096
79.433
125
125.89
100
125
160
100.00
125.89
158.49
250
251.19
200
250
315
199.53
251.19
316.23
500
501.19
400
500
630
398.11
501.19
630.96

144 Chapter 19 Technical specifications
1000
1000
800
1000
1250
794.33
1000.0
1258.9
2000
1995.30
1600
2000
2500
1584.9
1995.3
2511.9
4000
3981.10
3150
4000
5000
3162.3
3981.1
5011.9
8000
7943.30
6300
8000
10000
6309.6
7943.3
10000
16000
15849
12500
16000
20000
12589
15849
19953
19.5.2 Measurement range (octave band spectrum analyser)
Measurement range (with linearity error lower than 0.4 dB):
MICROPHONE C-130 C140 C240
PREAMPLIFIER PA020 PA020 PA040
FREQUENCY (Hz) Margin [dB] Margin [dB] Margin [dB]
16 26.1 to 137 18.8 to 137 19.7 to 137
31.5 23.3 to 137 15.8 to 137 15.8 to 137
63 20.3 to 137 10.0 to 137 13.6 to 137
125 17.7 to 137 10.0 to 137 10.0 to 137
250 16.1 to 137 10.0 to 137 10.0 to 137
500 15.7 to 137 10.0 to 137 10.0 to 137
1000 17.0 to 137 14.0 to 137 14.0 to 137
2000 19.4 to 137 18.0 to 137 17.0 to 137
4000 21.4 to 137 20.0 to 137 20.3 to 137
8000 22.3 to 137 21.0 to 137 21.6 to 137
16000 22.3 to 137 21.0 to 137 21.0 to 137
The noise (electrical + thermal microphone noise) is, as a minimum, 10 dB lower than the lower limit of the measurement range.

Chapter 19 Technical specifications 145
19.5.3 Measurement range (third octave spectrum analyser)
Measurement range (with linearity error lower than 0.4 dB):
MICROPHONE C-130 C140 C240
PREAMPLIFIER PA020 PA020 PA040
FREQUENCY (Hz) Margin [dB] Margin [dB] Margin [dB]
10 22.5 to 137 15.9 to 137 16.9 to 137
12.5
16
20
21.6 to 137
20.8 to 137
19.8 to 137
13.6 to 137
10.0 to 137
10.0 to 137
15.6 to 137
14.1 to 137
12.7 to 137
25
31.5
40
18.8 to 137
17.7 to 137
16.7 to 137
10.0 to 137
10.0 to 137
10.0 to 137
10.1 to 137
10.0 to 137
10.0 to 137
50
63
80
15.7 to 137
14.6 to 137
13.7 to 137
10.0 to 137
10.0 to 137
10.0 to 137
10.0 to 137
10.0 to 137
10.0 to 137
100
125
160
12.3 to 137
11.7 to 137
10.2 to 137
10.0 to 137
10.0 to 137
10.0 to 137
10.0 to 137
10.0 to 137
10.0 to 137
200
250
315
10.0 to 137
10.0 to 137
10.0 to 137
10.0 to 137
10.0 to 137
10.0 to 137
10.0 to 137
10.0 to 137
10.0 to 137
400
500
630
10.0 to 137
10.0 to 137
10.0 to 137
10.0 to 137
10.0 to 137
10.0 to 137
10.0 to 137
10.0 to 137
10.0 to 137
800
1000
1250
10.0 to 137
11.7 to 137
11.7 to 137
10.0 to 137
10.0 to 137
10.0 to 137
10.0 to 137
10.0 to 137
10.0 to 137
1600
2000
2500
12.9 to 137
13.9 to 137
14.7 to 137
10.0 to 137
10.0 to 137
10.0 to 137
10.0 to 137
10.0 to 137
10.0 to 137
3150
4000
5000
15.6 to 137
16.4 to 137
16.9 to 137
10.0 to 137
14.0 to 137
14.0 to 137
10.0 to 137
14.0 to 137
14.1 to 137
6300
8000
10000
17.3 to 137
17.7 to 137
17.7 to 137
14.0 to 137
14.1 to 137
14.0 to 137
15.8 to 137
15.8 to 137
15.8 to 137
12500
16000
20000
17.3 to 137
17.3 to 137
17.3 to 137
14.0 to 137
14.0 to 137
15.6 to 137
15.8 to 137
15.2 to 137
15.8 to 137
The noise (electrical + thermal microphone noise) is, as a minimum, 10 dB lower than the lower limit of the measurement range.

146 Chapter 19 Technical specifications
19.6 REVERBERATION TIME
19.6.1 Measuring the decay curve and impulse response
The decay curve for the and modes and the impulse response for the and modes are measured from equivalent levels (linear average) with a consecutive integration time of 10 ms over 6 s.
19.6.2 Calculating the decay curve from the impulse response
In the and modes, the decay curve is calculated from the impulse response using Schroeder's backward integration method.
19.6.3 Estimating the slope of the decay curve
The estimation of the slope of the decay curve is automatically achieved from the linear regression by least square approximation of itself.
19.6.4 Reverberation time measurement lower limit
The minimum reverberation time is 0.12s and is established by the averaging time of the linear averager.
19.6.5 Quality indicators
Non-linearity parameter , C curvature and B·T product for each frequency band.
19.6.6 Lower limit for reliable results obtained through a filter and a detector
To obtain reliable reverberation time (T) results, the following conditions must be met: B·T > 16 and T > Tdet.
AVERAGER DETECTOR REVERBERATION TIME (Tdet)
FREQUENCY
[Hz]
Tdet
1/3 octave band
[s]
Tdet
1/1 octave band
[s]
50
63
80
0.42
0.33
0.26
0.13
100
125
160
0.20
0.17
0.14
0.07
200
250
315
0.10
0.08
0.07
0.04

Chapter 19 Technical specifications 147
400
500
630
0.06
0.04
0.03
0.02
800
1000
1250
0.02
0.01
- - -
0.01
1600
2000
2500
- - -
- - -
- - -
- - -
- - -
- - -
3150
4000
5000
- - -
- - -
- - -
- - -
- - -
- - -
6300
8000
10000
- - -
- - -
- - -
- - -
- - -
- - -
19.7 FFT
TIME WINDOW Hanning
NO. OF LINES
ANALYSIS RESOLUTION
10000
2 Hz
DYNAMIC MEASUREMENT RANGE > 80 dB
DETECTOR Equivalent level
FREQUENCY WEIGHTING A or Z
19.8 AUDIO RECORDING
FORMAT WAV file
RESOLUTION: Analysis quality:
Listening quality:
24 bits
16 bits
SAMPLING FREQUENCY: Analysis quality:
Listening quality:
48 kHz
24 kHz
GAIN: Analysis quality:
Listening quality:
Optimum and constant throughout the recording
Automatic

148 Chapter 19 Technical specifications
19.9 ENVIRONMENTAL, ELECTROSTATIC AND RADIO FREQUENCY CRITERIA
19.9.1 Stabilisation time
The stabilisation time after changes in the environmental conditions (l) is 5 minutes.
19.9.2 Environmental criteria
INFLUENCE OF STATIC PRESSURE
OPERATING RANGE 65 to less than 85 kPa 85 to 108 kPa
MAXIMUM ERROR (at 1 kHz and 94 dB or 104 dB) Class 1 0.9 dB Class 1 0.4 dB
INFLUENCE OF TEMPERATURE
OPERATING RANGE Class 1 -10 to +50 °C
MAXIMUM ERROR (-10 to +50°C) Class 1 0.5 dB
STORAGE WITHOUT BATTERIES -20 to +60 °C
INFLUENCE OF HUMIDITY
OPERATING RANGE (IN ABSENCE OF CONDENSATION)
25 to 90 %
MAXIMUM ERROR
(25% < R.H. < 90% at 40°C and 1 kHz)
Class 1 0.5 dB
STORAGE WITHOUT BATTERIES < 93 %
19.9.3 Electrostatic criteria
EFFECTS OF STATIC ELECTRICITY DISCHARGES
The equipment shows no degradation or loss of function after being exposed to static electricity discharges. The measured value may be temporarily affected during the
application of discharges.
19.9.4 Criteria for fields at the frequency of the mains supply and radio frequency fields
CLASSIFICATION FOR SUSCEPTIBILITY TO RADIO FREQUENCY FIELDS
Group Z
NORMAL OPERATING MODE Configure with CN010 microphone extension cable and SC420 in Sound level meter mode, LAF function
REFERENCE ORIENTATION
SC420 in vertical position, with the SC420 main shaft (preamplifier) perpendicular to the field propagation direction with
horizontal polarization. With all cables connected, and with the AM300 feeder

Chapter 19 Technical specifications 149
RANGE OF ACCESSORIES TESTED IN THE VERIFICATION OF THE ELECTROMAGNETIC COMPATIBILITY REQUIREMENTS
AM300 Feeder, CN400 USB-microUSB Connecting Cable for communication with PC, CN010 10m Extension Cable, CN420
Multi-connector Cable
SOUND LEVEL AT WHICH THE SC420 MEETS THE REQUIREMENTS FOR RADIATED ELECTROMAGNETIC FIELD AND FIELD AT THE FREQUENCY OF THE MAINS SUPPLY
74 dBA
INFLUENCE OF MAGNETIC FIELDS In an 80 A/m magnetic field (1 oersted) at 50 Hz or 60 Hz, the
reading variation will be under 1 dB
CONFIGURATION FOR THE NORMAL OPERATING MODE AND POSITION THAT PRODUCES THE GREATEST RADIO FREQUENCY EMISSION
Sound level meter mode, LAF function. SC420 in vertical position, with the SC420 main shaft perpendicular to the field
propagation direction with vertical polarisation. With all cables connected, and with the AM300 feeder
CONFIGURATION FOR THE NORMAL OPERATING MODE AND POSITION THAT PRODUCES THE GREATEST SUSCEPTIBILITY (LEAST IMMUNITY) TO RADIATED FIELDS AND FIELDS CONDUCTED THROUGH THE MAINS SUPPLY
Sound level meter mode, LAF function. SC420 in vertical position, with the SC420 main shaft perpendicular to the field
propagation direction with horizontal polarisation. With all cables connected, and with the AM300 feeder
The sound level meter complies with the basic specifications in standard 61672-1 for the required immunity to mains supply frequency and radio frequency fields.
No difference in emission in relation to the normal operating mode is observed with the equipment vertical, with all cables connected and with the AM300 mains feeder.
19.9.5 Influence of vibrations
FOR FREQUENCIES from 20 to 1000 Hz and 1 m/s²: < 75 dBA

150 Chapter 19 Technical specifications
19.10 INPUTS AND OUTPUTS
19.10.1 AC Output
TYPE OF OUTPUT analogical output directly proportional to the preamplifier output
FREQUENCY WEIGHTING: Without weighting
TYPICAL VOLTAGE AT 94 dB and 1 kHz:
GAIN: 0\tab dB
GAIN: 40 dB
46 mVrms
4.6 Vrms
MAXIMUM VOLTAGE: 24 Vpp (typical)
OUTPUT IMPEDANCE: 100
RECOMMENDED RANGE OF OUTPUT LOAD IMPEDANCE
RL 10 k
GAIN 0 or 40 dB 0.2 dB
OUTPUT CONNECTOR female mini jack type
INTERCONNECTION CABLE Standard audio cable of maximum length 1.5 m and with
mono male mini jack connector ( 3.5mm)
1 Signal 2 Ground
Digital Input
Digital Output
RS-232
AC Output
Multi-connector
USB Memory Card
Multi-connector

Chapter 19 Technical specifications 151
19.10.2 Digital output
TYPE OF OUTPUT open collector output that takes logical values depending on whether the automatic audio recording threshold is
exceeded. If the threshold is exceeded, the signal takes the logical value 0; if it is not exceeded, it maintains the logical
value 1.
HIGH LOGICAL VALUE VOLTAGE: the output voltage of high logical level 1 is fixed through an external resistance of polarisation (pull up)
MAXIMUM VOLTAGE APPLICABLE AT THE OUTPUT: 20 V
MAXIMUM CURRENT APPLICABLE AT THE OUTPUT: 50 mA
OUTPUT IMPEDANCE: < 10
OUTPUT CONNECTOR white female RCA type
INTERCONNECTION CABLE Standard audio cable of maximum length 1.5 m and with male RCA connector
19.10.3 Digital input
TYPE OF INPUT Digital, the open input is INACTIVE (status 1) with the options START AUTOMATIC MEASUREMENT and STOP
AUTOMATIC MEASUREMENT activated and configured with the option DIGITAL INPUT. The SC420 waits for the
digital input to take the value 0 before starting the recording and the take the value 1 to stop it.
LOGICAL VALUE VOLTAGES: INACTIVE (1) > 1.5 V
ACTIVE (0) < 0.5 V
MAXIMUM VOLTAGE APPLICABLE AT THE INPUT: 10 V
MAXIMUM IMPEDANCE: < 100
INPUT CONNECTOR red female RCA type
INTERCONNECTION CABLE Standard audio cable of maximum length 1.5 m and with male RCA connector
1 Signal
2 Ground
1 Signal
2 Ground

152 Chapter 19 Technical specifications
19.10.4 MicroSD memory card slot
CARD TYPE MicroSD with FAT32 or FAT16 format
RECOMMENDED CAPACITY 4 GB
MINIMUM CLASS 4
19.10.5 USB communication
TYPE Digital: complies with USB rev. 2.0.
FEMALE USB Micro-B
CONNECTING CABLE CN400 of 0.5 m in length
19.10.6 RS-232 serial communication
TYPE Two-way serial digital
TRANSMISSION FORMAT:
SPEED
BITS OF DATA
PARITY
STOP BITS
115200 bauds
8
None
1
FEMALE DB-9
CONNECTING CABLE Standard serial cable of maximum length 1.5 m
19.10.7 Wireless communication
TYPE Bluetooth®
class 1
TRANSMISSION FREQUENCY 2402 to 2480 GHz
RANGE 50 m
19.11 SCREEN
The table below shows the technical characteristics of the SC420 screen:
TYPE Monochrome LED 128 x 128
SIZE 66.0 x 62.5 mm
RESOLUTION IN THE PRESENTATION OF NOISE LEVELS 0.1 dB

Chapter 19 Technical specifications 153
19.12 POWER
19.12.1 Batteries
TYPE Two AA sized (LR6) 1.5 V alkaline batteries
TYPICAL BATTERY LIFE WITH CONTINUOUS USE: Having the screen light on can reduce the typical battery life value by 50%.
8 hours 45 minutes
19.12.2 External Supply
VOLTAGE INPUT RANGE (j) 4.25 to 5.25 V DC
MINIMUM CURRENT 250 mA
To run the SC420 from a mains supply, is recommended to use the AM300 mains feeder and the CN400 cable
accepts no responsibility for the use of feeders other than the recommended one.
AM300 FEEDER:
SUPPLY VOLTAGE
SUPPLY FREQUENCY
100 to 240 VAC
50 – 60 Hz
19.13 DIMENSIONS AND WEIGHT
DIMENSIONS 292 x 85 x 25 mm
WEIGHT with batteries 330 g
without batteries 280 g
19.14 STANDARDS
19.14.1 Standards
The SC420 complies with the following national and international standards:
IEC 61672-1:02 class 1. EN 61672-1:03 class 1.
IEC 61260:95 (A1:01) class 1, EN 61260:95 (A1:01) class 1
IEC 60804:00 type 1, EN 60804:00 type 1
IEC 60651:01 class 1, EN 60651:94 (A1:94) (A2:01) class 1
ANSI S1.4:83/A: 85 type 1, ANSI S1.43:97 type 1, ANSI S1.11:04 class 1
DIN 45657:2005 in reference to the Taktmaximalpegel function
Mark. Complies with 73/23/EEC and EMC 89/336/EEC low-tension regulations, the latter amended by 93/68/EEC.

154 Chapter 19 Technical specifications
as a manufacturer of electrical or electronic equipment would like to inform you that the product that you have purchased complies with directive 2012/19/EU on waste electrical and electronic equipment (WEEE).Furthermore, the product incorporates the following symbol, which indicates that it is subject to selective collection:
19.14.2 Standards of measurement and calculation
Using the SC420, measurements and calculations can be performed in accordance with the following national and international standards:
ISO 3382-1 Measurement of the reverberation time in performance spaces
ISO 3382-2 Measurement of the reverberation time in ordinary rooms
ISO 354 Measurement of the absorption coefficient in a reverberation room
ISO 140 Measurement of sound insulation in buildings and of building elements
DIRECTIVE 2003/10/EC OF THE EUROPEAN PARLIAMENT AND THE COUNCIL, of 6 February 2003, on the minimum health and safety requirements concerning the exposure of workers to risks arising from physical agents (noise)
ISO 9612:2009 Determination of exposure to noise in the workplace
19.14.3 Certificates
Type approval Certificate for Spain
19.14.4 Notes
If your SC420 ceases to comply with any of these specifications, please consult your closest official dealer for checking, adjustment or repair.

Chapter 20 Maintenance and precautions 155
Below are the precautions and warnings to bear in mind regarding the SC420:
Only attach or detach the microphone using your hands, never use tools. Never do this when the SC420 is operating. If a 200 V polarised microphone is used, and the sound level meter is switched on, there will be 200 volts at the central preamplifier contact. This is not dangerous, though it might cause the microphone to be dropped.
Never dismantle the microphone, as this may cause permanent damage.
Keep the microphone dust free and away from sharp-pointed objects.
Avoid excessive humidity and sudden temperature changes, since this may cause condensation on the microphone.
Never remove the protective grid from the microphone unless is absolutely necessary. Never touch the diaphragm. If it is very dirty, then very carefully remove the dust using a very fine camel hair brush.
To manipulate the device (remove the preamplifier, microphone, etc.), first it must be turned off and disconnected from the power supplies.
Do not attempt to attach or detach the preamplifier by screwing or unscrewing the LEMO connector, as the sound level meter could be damaged.
Remove the batteries if the SC420 is not going to be used for a long period of time.
The SC420 sound level meter is built to work reliably for a long time. Should any anomaly occur that cannot be solved either by changing the batteries or consulting the manual, take your SC420 to an official dealer. Under no circumstances allow non-authorised personnel to attempt to repair the unit.
The SC420 has an internal clock with a cell battery that lets it keep the time and programming. The average lifespan of the cell battery is 10 years. When the battery runs out, the internal calendar/clock of the SC420 returns to 00:00 hours on 01/01/2000. Enter the settings menu on the SC420 to consult the
Maintenance and precautions
20. Maintenance and precautions
20

156 Chapter 20 Maintenance and precautions
calendar. The battery must be replaced immediately. Contact your official technical service.
accepts no responsibility for unauthorised modification, alteration or repairs carried out by unauthorised personnel; any such actions will invalidate the device warranty.
This device can only work with the accessories described in the Accessories section. Should a different accessory be used, and this leads to a fault in the device, accepts no responsibility for said fault, as the device is no longer covered by its warranty.
Below are the precautions and warnings to regarding the microSD memory card:
For the SC420 to recognise the card, it should always be inserted with the SC420 switched off.
Insert the card into the right slot with the label side upwards until you hear a click.
Use cards of at least Class 4 .
Do not touch the contact points on the microSD card.
Do not remove the memory card while the SC420 is switched on. Nor should you remove the card while accessing it through a PC.
To take the card out, use only your fingers, never tools.
For the SC420 to function correctly, ensure any SD card is formatted before working with it for the first time.
Erase the card memory to optimise its effectiveness. It is very important to periodically format the memory card. The card manufacturer recommends using the SD Formatter application to format the cards rather than relying on the formatting tools provided in operating systems, as these are generic and may diminish memory card performance.
It is recommended to start measurements with the card capacity at more than 50% available.
NOTE: MicroSD cards of up to 4 GB have been successfully tested on the SC420. However, we cannot guarantee that all microSD cards will work with it.

Chapter 21 Guidance on taking measurements 157
Please bear the following advice in mind when taking measurements:
It is advisable to check the SC420 before and after each measurement. Use the CB006 acoustic calibrator (see 10.1).
When taking measurements holding the SC420 in your hand, you must do this with your arm extended (so that it can be read) to avoid influencing the measurements (screen effect).
To prevent interference, we recommend using the TR050 tripod and the CN003, CN010 or CN030 microphone extension cables. Remember you can only remove the preamplifier + microphone set with the SC420 switched off.
The microphone’s axis must point to the sound source.
For indoor measurements it is also advisable to keep the sound level meter away from reflective surfaces: walls, objects, floors, etc.
For acoustic measurements outside, the sound level meter microphone must be protected by the windscreen provided so that wind noise does not interfere with the measurement result. It is advisable to check the environmental conditions (temperature, humidity, atmospheric pressure).
For long outdoor measurements, the TK200 outdoor kit is recommended to protect the device from environmental agents (wind, rain, humidity, etc.)
The measurement range specifications should be taken into account for the measurement of low-level sound fields. In order to measure sound levels lower than those specified by the lower limit range, the characteristics of the noise from the device itself should be taken into account.
If anything knocks the SC420, this is picked up by the microphone and may alter the value of the measurement; it may also permanently damage the device.
It is advisable to isolate the SC420 from vibrations. Pads of foam rubber or similar materials are usually enough for this purpose.
Guidance on taking measurements
21. Guidance on taking measurements
21
158 Chapter 22 Activating optional modes
The SC420 can be extended using a range of modules:
OF420: Real time spectrum analyser module in octave bands (1/1) with class 1 filters as per standard IEC 61260
TF420: Real time spectrum analyser module in third octave bands (1/3) with class 1 filters as per standard IEC 61260
RT420: Octave band (1/1) and third octave band (1/3) reverberation time measurement module (interrupted noise and integrated impulse method)
DS420: Occupational noise functions evaluation module
FF420: FFT narrow band frequency analysis module
HI420: Analysis quality audio recording module
These optional measurement modules can be purchased at the same time as the SC420 or later on. To incorporate them, simply contact your official distributor, provide them with the serial number of your sound level meter and go through the module purchase process. Within a few days, your activation programme will arrive.
Activating optional modes
22. Activating optional modes
22

Chapter 23 Functions 159
23.1 Function nomenclature
The below list specifies the functions measured by the SC420 for the various measurement modes, their names and a brief definition.
23.1.1 Sound level meter mode functions
FUNCTION DESCRIPTION
LXF Sound pressure level with X frequency weighting and fast time weighting (Fast)
LXFmax Maximum sound pressure level with X frequency weighting and fast time weighting (Fast) during measurement time
LXFmin Minimum sound pressure level with X frequency weighting and fast time weighting (Fast) during measurement time
LXS Sound pressure level with X frequency weighting and slow time weighting (Slow)
LXSmax Maximum sound pressure level with X frequency weighting and slow time weighting (Slow) during measurement time
LXSmin Minimum sound pressure level with X frequency weighting and slow time weighting (Slow) during measurement time
LXI Sound pressure level with X frequency weighting and impulse time weighting (Impulse)
LXImax Maximum sound pressure level with X frequency weighting and impulse time weighting (Impulse) during measurement time
LXImin Minimum sound pressure level with X frequency weighting and impulse time weighting (Impulse) during measurement time
X: A, C or Z
LXYmax1s* Maximum sound pressure level with X frequency weighting and time weighting Y for 1 second
LXYmin1s* Minimum sound pressure level with X frequency weighting and time weighting Y for 1 second
X: A, C or Z; Y: F, S or I
Functions
23. Functions
23

160 Chapter 23 Functions
LXpeak Peak sound pressure level of measurement time with X frequency weighting
LXpeak1s* Peak sound pressure level of 1 second with X frequency weighting
X: A, C or Z
Lnt Total percentiles
LnT Partial percentiles of T integration time
n: 1%, 5%, 10%, 50%, 90%, 95%, 99%. Percentiles are calculated through the LAF function sampled every 125ms and with classes of 0.1 dB
LXt Equivalent continuous sound pressure level with integration time equal to the measurement time with X frequency weighting
LXT Equivalent continuous sound pressure level with T integration time with X frequency weighting
LXTmax Maximum equivalent continuous sound pressure level with T integration time with X frequency weighting
LXTmin Minimum equivalent continuous sound pressure level with T integration time with X frequency weighting
LX1s* Equivalent continuous sound pressure level with 1 second integration time with X frequency weighting
LXIt Equivalent continuous sound pressure level with impulse time weighting (Impulse) with integration time equal to the measurement time with X frequency weighting
LXIT Equivalent continuous sound pressure level with impulse time weighting (Impulse) and with T integration time with X frequency weighting
LXE Sound exposure level S.E.L.
X: A, C or Z
(LXIt-LXt) Dynamic subtraction of the equivalent continuous sound pressure level with time weighting 'I' and the equivalent continuous sound pressure level, corresponding to the measurement time
(LCt-LAt) . Dynamic subtraction of the equivalent continuous sound pressure level with frequency weighting C and the equivalent continuous sound pressure level with frequency weighting A, corresponding to the measurement time
(LXIT-LXT) Dynamic subtraction of the equivalent continuous sound pressure level with time averaging 'I' and the equivalent continuous sound pressure level, corresponding to the programmable T integration time
(LCT-LAT) Dynamic subtraction of the equivalent continuous sound pressure level with frequency weighting C and the equivalent continuous sound pressure level with frequency weighting A, corresponding to a programmable T integration time
X: A, C or Z
LAF5t Taktmaximal-Mittelungspegel, corresponding to the measurement time, in compliance with standard DIN 45641
LAF5T Taktmaximal-Mittelungspegel, corresponding a programmable T integration time, in compliance with standard DIN 45641
LAF5t-LAt Dynamic subtraction of the Taktmaximal-Mittelungspegel and the equivalent continuous sound pressure level with frequency weighting A, corresponding to the measurement time
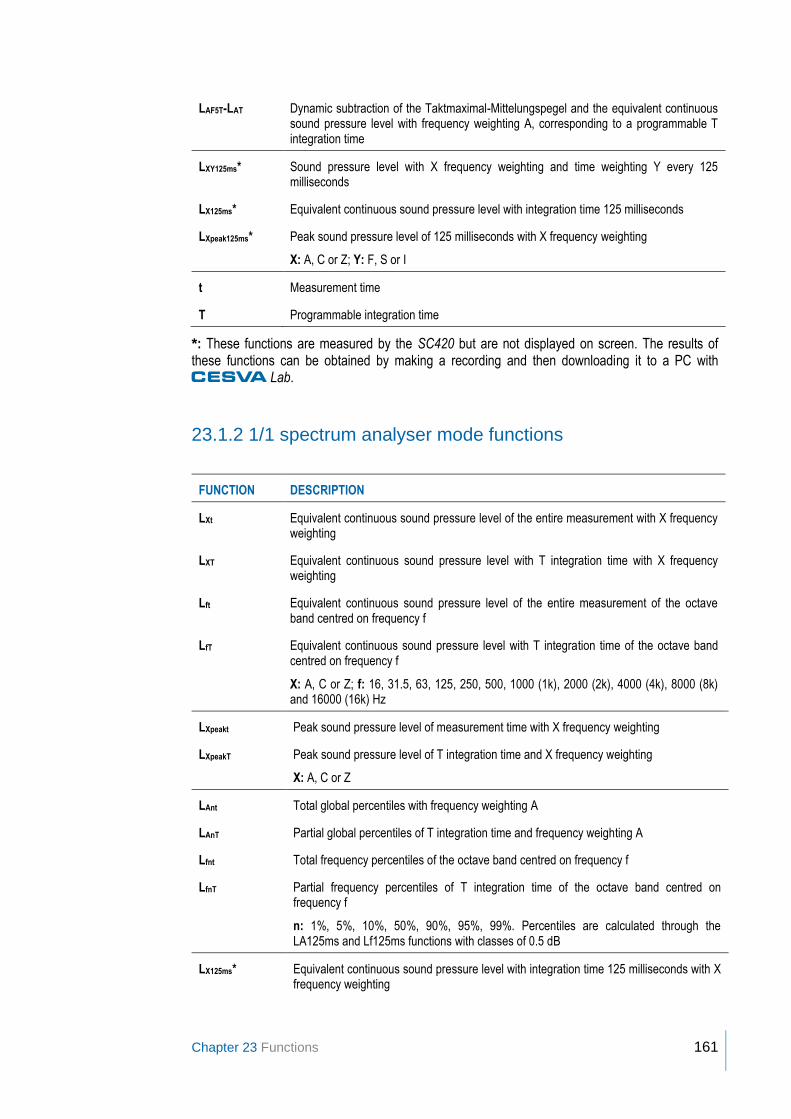
Chapter 23 Functions 161
LAF5T-LAT Dynamic subtraction of the Taktmaximal-Mittelungspegel and the equivalent continuous sound pressure level with frequency weighting A, corresponding to a programmable T integration time
LXY125ms* Sound pressure level with X frequency weighting and time weighting Y every 125 milliseconds
LX125ms* Equivalent continuous sound pressure level with integration time 125 milliseconds
LXpeak125ms* Peak sound pressure level of 125 milliseconds with X frequency weighting
X: A, C or Z; Y: F, S or I
t Measurement time
T Programmable integration time
*: These functions are measured by the SC420 but are not displayed on screen. The results of these functions can be obtained by making a recording and then downloading it to a PC with
Lab.
23.1.2 1/1 spectrum analyser mode functions
FUNCTION DESCRIPTION
LXt Equivalent continuous sound pressure level of the entire measurement with X frequency weighting
LXT Equivalent continuous sound pressure level with T integration time with X frequency weighting
Lft Equivalent continuous sound pressure level of the entire measurement of the octave band centred on frequency f
LfT .
Equivalent continuous sound pressure level with T integration time of the octave band centred on frequency f
X: A, C or Z; f: 16, 31.5, 63, 125, 250, 500, 1000 (1k), 2000 (2k), 4000 (4k), 8000 (8k) and 16000 (16k) Hz
LXpeakt Peak sound pressure level of measurement time with X frequency weighting
LXpeakT Peak sound pressure level of T integration time and X frequency weighting
X: A, C or Z
LAnt Total global percentiles with frequency weighting A
LAnT Partial global percentiles of T integration time and frequency weighting A
Lfnt Total frequency percentiles of the octave band centred on frequency f
LfnT Partial frequency percentiles of T integration time of the octave band centred on frequency f
n: 1%, 5%, 10%, 50%, 90%, 95%, 99%. Percentiles are calculated through the LA125ms and Lf125ms functions with classes of 0.5 dB
LX125ms* Equivalent continuous sound pressure level with integration time 125 milliseconds with X frequency weighting

162 Chapter 23 Functions
Lf125ms* Equivalent continuous sound pressure level with integration time 125 milliseconds with measurement of the octave band centred on frequency f
LXpeak125ms* Peak sound pressure level of 125 milliseconds with X frequency weighting
X: A, C or Z; f: 16, 31.5, 63, 125, 250, 500, 1000 (1k), 2000 (2k), 4000 (4k), 8000 (8k) and 16000 (16k) Hz
NC Value of the NC (Noise Criterion) curve corresponding to the measured spectrum
NCf Value of the NC curve that has not been exceeded in the octave band centred on frequency f
NR Value of the NR (Noise Rating) curve corresponding to the measured spectrum
NRf Value on the NR curve that has not been exceeded in the octave band centred on frequency f
t Measurement time
T Programmable integration time
*: These functions are measured by the SC420 but are not displayed on screen. The results of these functions can be obtained by making a recording and then downloading it to a PC with
Lab.
The global sound pressure level values with frequency weighting A, C and Z are values measured by the sound level meter and are in no case calculated by applying the discrete coefficients that define said filters to the values measured by octave band. Indeed, if they were thus calculated, appreciable differences would be observed. Frequency weighting filters are filters continuous in frequency, while the use of coefficients by bands is merely an approximation to them.
The Z filter has a zero value from 10 Hz up to 20 kHz; when measuring spectra with a high spectral content in the low frequencies (between 10 and 20 Hz), it is possible that the energetic sum of the values measured by octave bands may differ from the global value measured with frequency weighting Z.
23.1.3 1/3 Spectrum analyser mode functions
FUNCTION DESCRIPTION
LXt Equivalent continuous sound pressure level of the entire measurement with X frequency weighting
LXT Equivalent continuous sound pressure level with T integration time with X frequency weighting
LAIt Equivalent continuous sound pressure level with impulse time weighting (Impulse) of the entire measurement with frequency weighting A
LAIT Equivalent continuous sound pressure level with impulse time weighting (Impulse) and with T integration time and with frequency weighting A
LAYmaxt Maximum sound pressure level with frequency weighting A and time weighting Y during measurement time
LAYmaxT Maximum sound pressure level with frequency weighting A and time weighting Y during T integration time
Lft Equivalent continuous sound pressure level of the entire measurement of the third octave band centred on frequency f

Chapter 23 Functions 163
LfT .
Equivalent continuous sound pressure level with T integration time of the third octave band centred on frequency f
X: A, C or Z; Y: F, S or I; f: 10, 12.5, 16, 20, 25, 31.5, 40, 50, 63, 80, 100, 125, 160, 200, 250, 315, 400, 500, 630, 800, 1000 (1k), 1250 (1.25k), 1600 (1.6k), 2000 (2k), 2500 (2.5k), 3150 (3.15k), 4000 (4k), 5000 (5k), 6300 (6.3k), 8000 (8k), 10000 (10k), 12500 (12.5k), 16000 (16k) and 20000 (20k) Hz
LAnt Total global percentiles with frequency weighting A
LAnT Partial global percentiles of T integration time and frequency weighting A
n: 1%, 5%, 10%, 50%, 90%, 95%, 99%. Percentiles are calculated through the LA125ms and Lf125ms functions with classes of 0.5 dB
(LAIt-LAt) Dynamic subtraction of the equivalent continuous sound pressure level with time weighting 'I' and the equivalent continuous sound pressure level, corresponding to measurement time t (with frequency weighting A)
(LAFmaxt-LAt) Dynamic subtraction of the maximum equivalent continuous sound pressure level with time weighting 'F' and the equivalent continuous sound pressure level, corresponding to measurement time t (with frequency weighting A)
(LAImaxt-LAFmaxt) Dynamic subtraction of the maximum equivalent continuous sound pressure level with time weighting 'I' and the maximum equivalent continuous sound pressure level with frequency weighting 'F', corresponding to measurement time t (with frequency weighting A)
(LAImaxt-LASmaxt) Dynamic subtraction of the maximum equivalent continuous sound pressure level with time weighting 'I' and the maximum equivalent continuous sound pressure level with frequency weighting 'S', corresponding to measurement time t (with frequency weighting A)
(LCt-LAt) Dynamic subtraction of the equivalent continuous sound pressure level with frequency weighting C and the equivalent continuous sound pressure level with frequency weighting A, corresponding to the measurement time t
(LAIT-LAT) Dynamic subtraction of the equivalent continuous sound pressure level with time weighting 'I' and the equivalent continuous sound pressure level corresponding to T integration time (with frequency weighting A)
(LAFmaxT-LAT) Dynamic subtraction of the maximum sound pressure level with time weighting 'F' and the equivalent continuous sound pressure level, corresponding to T integration time (with frequency weighting A)
(LAImaxT-LAFmaxT) Dynamic subtraction of the maximum sound pressure level with time weighting 'I' and the maximum sound pressure level with frequency weighting 'F', corresponding to an T integration time(with frequency weighting A)
(LAImaxT-LASmaxT) Dynamic subtraction of the maximum sound pressure level with time weighting 'I' and the maximum sound pressure level with frequency weighting 'S', corresponding to an T integration time (with frequency weighting A)
. (LCT-LAT)
.
.
Dynamic subtraction of the equivalent continuous sound pressure level with frequency weighting C and the equivalent continuous sound pressure level with frequency weighting A, corresponding to T integration time
LX125ms* Equivalent continuous sound pressure level with integration time 125 milliseconds with X frequency weighting
LAI125ms* Equivalent continuous sound pressure level with impulse time weighting (Impulse), integration time 125 milliseconds and frequency weighting A

164 Chapter 23 Functions
LAYmax125ms* Maximum sound pressure level with frequency weighting A and time weighting Y during integration time 125 milliseconds
Lf125ms* .
Equivalent continuous sound pressure level with integration time 125 milliseconds of the third octave band centred on frequency f
X: A, C or Z; Y: F, S or I; f: 10, 12.5, 16, 20, 25, 31.5, 40, 50, 63, 80, 100, 125, 160, 200, 250, 315, 400, 500, 630, 800, 1000 (1k), 1250 (1.25k), 1600 (1.6k), 2000 (2k), 2500 (2.5k), 3150 (3.15k), 4000 (4k), 5000 (5k), 6300 (6.3k), 8000 (8k), 10000 (10k), 12500 (12.5k), 16000 (16k) and 20000 (20k) Hz
t, T Measurement time and programmable integration time
*: These functions are measured by the SC420 but are not displayed on screen. The results of these functions can be obtained by making a recording and then downloading it to a PC with
Lab.
The global sound pressure level values with frequency weighting A, C and Z are values measured by the sound level meter and are in no case calculated by applying the discrete coefficients that define said filters to the values measured by octave band. Indeed, if they were thus calculated, appreciable differences would be observed. Frequency weighting filters are filters continuous in frequency, while the use of coefficients by bands is merely an approximation to them.
The Z filter has a zero value from 10 Hz up to 20 kHz; when measuring spectra with a high spectral content in the low frequencies (between 10 and 20 Hz), it is possible that the energetic sum of the values measured by octave bands may differ from the global value measured with frequency weighting Z.
23.1.4 Octave (1/1) and third octave (1/3) band reverberation time mode functions
FUNCTION DESCRIPTION
LNf Sound pressure level of the background noise measurement of the octave (or third octave) band centred on frequency f
Δf Increase in sound pressure level of the octave (or third octave) band centred on frequency f
T20f Reverberation time T20 of the octave (or third octave) band centred on frequency f
T30f Reverberation time T30 of the octave (or third octave) band centred on frequency f
ξT20f Non-linearity parameter for T20 of the octave (or third octave) band centred on frequency f
ξT30f Non-linearity parameter for T30 of the octave (or third octave) band centred on frequency f
Cf Curvature parameter of the octave (or third octave) band centred on frequency f
B*T20f Product B*T20 of the octave (or third octave) band centred on frequency f
B*T30f Product B*T30 of the octave (or third octave) band centred on frequency f
f: 16, 31.5, 63, 125, 250, 500, 1000 (1k), 2000 (2k), 4000 (4k), 8000 (8k) and 16000 (16k) Hz for octave bands and 10, 12.5, 16, 20, 25, 31.5, 40, 50, 63, 80, 100, 125, 160, 200, 250, 315, 400, 500, 630, 800, 1000 (1k), 1250 (1.25k), 1600 (1.6k), 2000 (2k), 2500 (2.5k), 3150 (3.15k), 4000 (4k), 5000 (5k), 6300 (6.3k), 8000 (8k), 10000 (10k), 12500 (12.5k), 16000 (16k) and 20000 (20k) Hz for third octave bands

Chapter 23 Functions 165
23.1.5 Occupational noise mode functions
FUNCTION DESCRIPTION
LAt Equivalent continuous sound pressure level of the entire measurement with frequency weighting A
LCt Equivalent continuous sound pressure level of the entire measurement with frequency weighting C
LAT Equivalent continuous sound pressure level with T integration time with frequency weighting A
LCT Equivalent continuous sound pressure level with T integration time with frequency weighting C
Lft Equivalent continuous sound pressure level of the entire measurement of the octave band centred on frequency f
LfT .
Equivalent continuous sound pressure level with T integration time of the octave band centred on frequency f
f: 63, 125, 250, 500, 1000 (1k), 2000 (2k), 4000 (4k) and 8000 (8k) Hz
LCpeakt Peak sound pressure level of measurement time with frequency weighting C
LCpeakT Peak sound pressure level of T integration time with frequency weighting C
LEX,8h Daily noise exposure level normalised to 8 hours, with frequency weighting A
LEX,8hp Daily noise exposure level normalised to 8 hours projected at time tp, with frequency weighting A
E Measurement time noise exposure
Ep Noise exposure projected at time tp
DOSE Measurement time dose
DOSEp Dose projected at time tp
t Measurement time
T Programmable integration time
tp Programmable time of projection
23.1.6 FFT analyser mode functions
FUNCTION DESCRIPTION
LXft Continuous sound pressure level equivalent with X frequency weighting of the entire measurement of the line centred on frequency f
X: A or Z; f: 10000 lines of constant bandwidth between 0 and 20000 Hz. 2Hz/line
t Measurement time

166 Chapter 23 Functions
23.2 Function description
This section briefly describes the functions measured by the SC420 for the various measurement modes.
23.2.1 Sound pressure level with Fast and Slow time weightings
LF (Fast)
RMS value with 125 ms fast exponential averaging, in decibels.
LS (Slow)
RMS value with 1 s slow exponential averaging, in decibels.
p(t): instantaneous sound pressure
To obtain a stable reading, sound level meters feature two kinds of responses, known as fast and slow. The fast response has an exponential averaging circuit
time constant of = 125 ms and the slow response has one of = 1 s.
The "fast" response is indicated in the measurement of noise levels that fluctuate relatively little. Meanwhile, the "slow" response is recommended for noises of greater variation.
o
21
T
-
)/-(t-2
FS,p
de)(p1
log02L
p(t): instantaneous sound pressure
p0: reference sound pressure (20 Pa)
( )2 EXPONENTIAL AVERAGING
LF ... = 125ms
LS ... = 1s
20p
log10
p0 = 20Pa
LF
LS p(t)

Chapter 23 Functions 167
23.2.2 Sound pressure level with Impulse time weighting
LI (Impulse)
Maximum short-term RMS value with exponential averaging of 35 ms, in decibels.
p(t): instantaneous sound pressure
The Impulse feature is designed to detect impulse noise, like shots or blows. The
impulse function has a very fast exponential averaging circuit time constant of = 35ms and a peak detector that retains the measured value for long enough to be viewed.
23.2.3 Peak sound pressure level
Lpeak (Peak)
The highest absolute instantaneous sound pressure value from the beginning of the measurement, in decibels.
23.2.4 Equivalent continuous sound pressure level
LT and Lt
The linear averaged of the square of the instantaneous sound-pressure from the very start, t1, until the end, t2. The duration of the averaged is therefore T= t2 - t1
2
1
t
t
20
2
T dtp
(t)p
T
1log10L
p(t): instantaneous sound pressure
p0: reference sound pressure (20 Pa)
T: duration of the averaged
The equivalent sound pressure level is the pressure level that, kept constant throughout the entire measurement interval, has the same sound energy as the sound event measured.
The equivalent continuous sound pressure level function is ideal for measuring variable sound events such as road traffic or sound events that due to their long
( )2 EXPONENTIAL AVERAGING
LI ... = 35 ms
20p
log10
p0 = 20Pa
LI p(t) PEAK DETECTOR
= 1.5 s

168 Chapter 23 Functions
duration cover a wide range of sound pressure levels, such as environmental measurements.
Percentile levels are the perfect complement to the equivalent continuous sound pressure level function.
The SC420 measures the equivalent continuous sound pressure level Lt and LT.
The equivalent level Lt is the equivalent level of the interval measured, that is, for each instant it gives us the value of the equivalent level from the beginning of the measurement to that instant. When measurement has been completed, the Lt value corresponds to the equivalent level of the entire measurement from beginning to end.
The equivalent level LT is the equivalent level corresponding to T integration time (a programmable parameter). Every time T interval is presented. That is, every T interval, the SC420 shows the equivalent level of the last T interval.
23.2.5 Taktmaximal-Mittelungspegel
LAF5T(t) (Taktmaximal pegel)
The maximum value of the Fast level LF(t) measured for a time interval of 5 seconds, with frequency weighting A.
LAF5t and LAF5T (Taktmaximal-Mittelunspegel)
LAF5t
The equivalent continuous sound pressure level of the measured values of LAF5T (t), corresponding to the measurement time.
LAF5T
The equivalent continuous sound pressure level of the measured values of LAF5T(t), corresponding to T integration time (programmable parameter).
23.2.6 Sound exposure level (SEL)
LE (SEL Sound Exposure Level)
Sound exposure level. This is the sound level that, kept constant for 1 second, presents energy equivalent to the energy accumulated throughout the entire measurement, in decibels.
t
0
20
2
0
E dtp
(t)p
T
1log10L
p(t): instantaneous sound pressure
p0: reference sound pressure (20 Pa)
t: duration of the measurement
T0: 1 second

Chapter 23 Functions 169
Its relation with the equivalent continuous sound pressure level is as follows:
0
EtT
tlog10LL
23.2.7 Percentile levels
L99, L95, L90, L50, L10, L5 and L1
The levels that have been exceeded during 99%, 95%, 90%, 50%, 10%, 5% and 1% of the measurement time, in decibels.
In Sound Level Meter mode, they are calculated with classes of 0.1 dB using the function LAF. In the 1/1 and 1/3 spectrum analyser modes, they are calculated with classes of 0.5 dB from the LAT function.
23.2.8 Decay curve
Decay curve
Decay of the sound pressure level according to time at a point in the room after the source is stopped. This decay can be measured after the real cut of a continuous sound source in the room being studied.
23.2.9 Impulse response
Impulse response
Time history of the sound pressure observed at a point in the room as a result of the emission of a Dirac impulse at another point in the room.
23.2.10 Integrated impulse response method
Integrated impulse response method
Method for obtaining decay curves through the inverse integration of the impulse response time to the square according to the Schroeder method.
23.2.11 Reverberation Time
T30
The time, in seconds, that is required for the sound pressure level to decrease by 60 dB, calculated on a line from a lineal regression by least squares approximation of a decay curve measured from a level 5 dB below the initial level, to a level 35 dB lower than that initial level.
T20
The time, in seconds, that is required for the sound pressure level to decrease by 60 dB, calculated on a line from a lineal regression by least squares
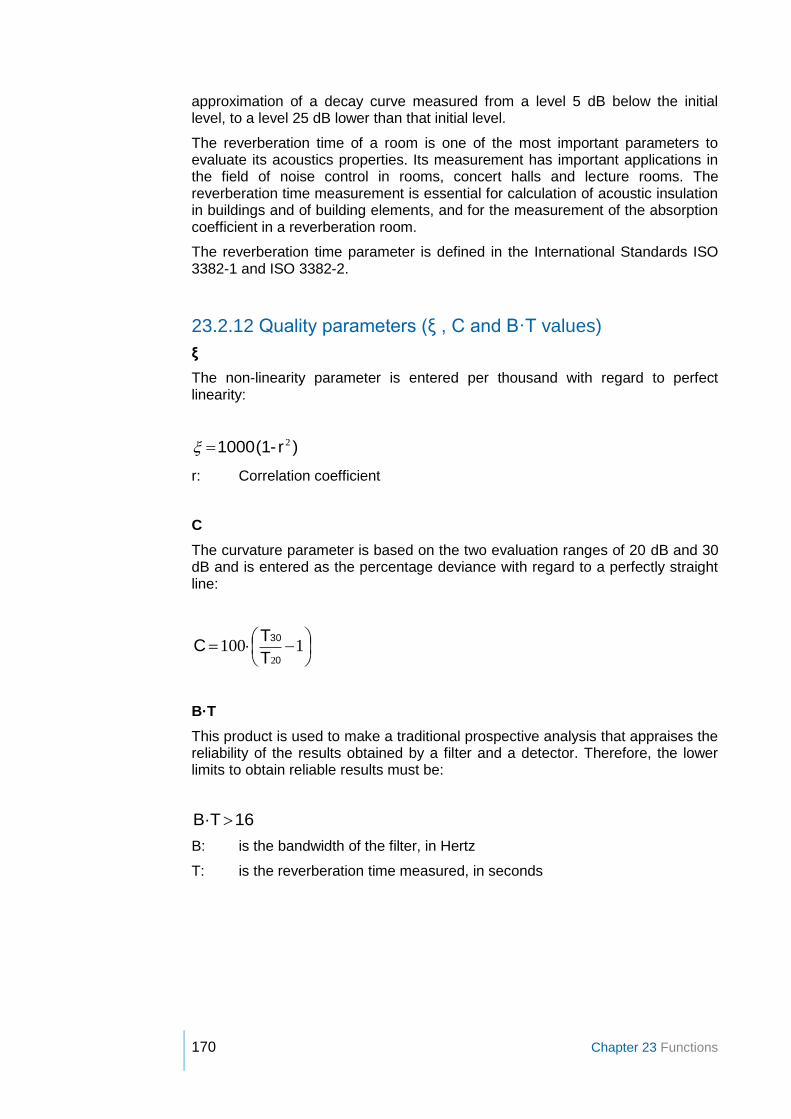
170 Chapter 23 Functions
approximation of a decay curve measured from a level 5 dB below the initial level, to a level 25 dB lower than that initial level.
The reverberation time of a room is one of the most important parameters to evaluate its acoustics properties. Its measurement has important applications in the field of noise control in rooms, concert halls and lecture rooms. The reverberation time measurement is essential for calculation of acoustic insulation in buildings and of building elements, and for the measurement of the absorption coefficient in a reverberation room.
The reverberation time parameter is defined in the International Standards ISO 3382-1 and ISO 3382-2.
23.2.12 Quality parameters (ξ , C and B·T values)
ξ
The non-linearity parameter is entered per thousand with regard to perfect linearity:
)r-(1 1000 2
r: Correlation coefficient
C
The curvature parameter is based on the two evaluation ranges of 20 dB and 30 dB and is entered as the percentage deviance with regard to a perfectly straight line:
1100
20
30
T
TC
B·T
This product is used to make a traditional prospective analysis that appraises the reliability of the results obtained by a filter and a detector. Therefore, the lower limits to obtain reliable results must be:
16B·T
B: is the bandwidth of the filter, in Hertz
T: is the reverberation time measured, in seconds
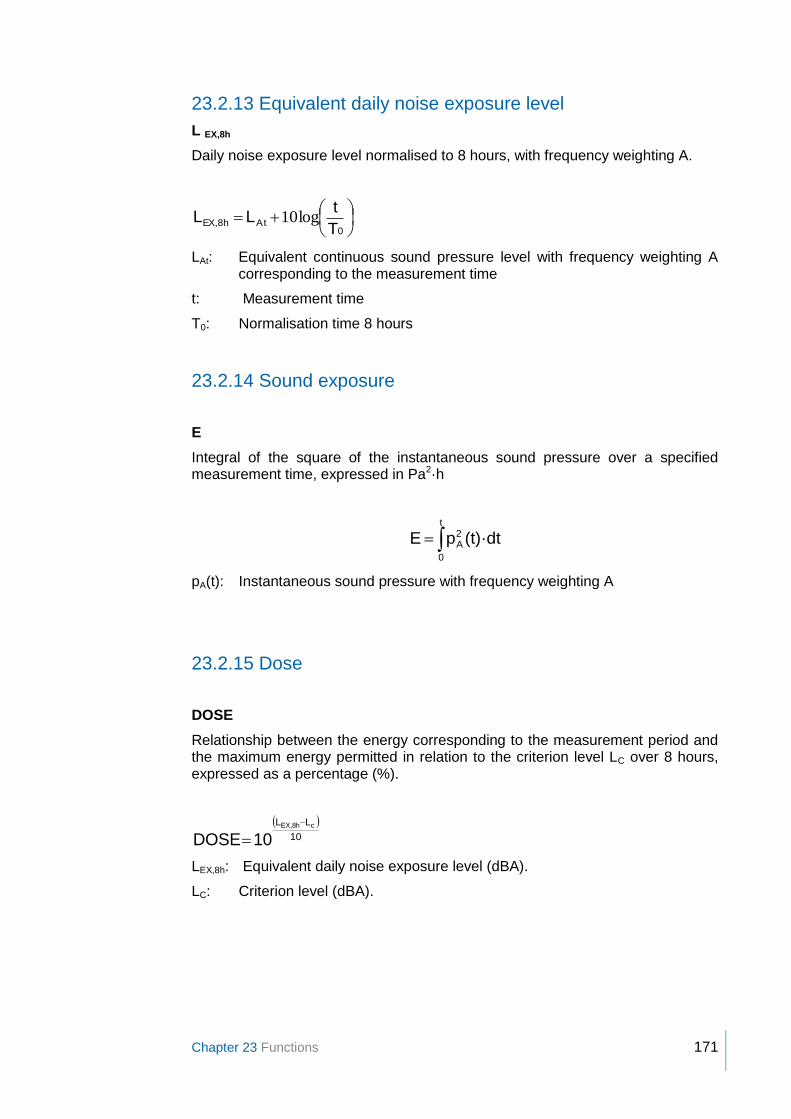
Chapter 23 Functions 171
23.2.13 Equivalent daily noise exposure level
L EX,8h
Daily noise exposure level normalised to 8 hours, with frequency weighting A.
0AtEX,8h
T
tLL log10
LAt: Equivalent continuous sound pressure level with frequency weighting A corresponding to the measurement time
t: Measurement time
T0: Normalisation time 8 hours
23.2.14 Sound exposure
E
Integral of the square of the instantaneous sound pressure over a specified measurement time, expressed in Pa2·h
t
0
2A (t)·dtpE
pA(t): Instantaneous sound pressure with frequency weighting A
23.2.15 Dose
DOSE
Relationship between the energy corresponding to the measurement period and the maximum energy permitted in relation to the criterion level LC over 8 hours, expressed as a percentage (%).
10
LL cEX,8h
10DOSE
LEX,8h: Equivalent daily noise exposure level (dBA).
LC: Criterion level (dBA).

172 Chapter 23 Functions

rese
rves
the
right
to a
men
d th
e ch
arac
teris
tics
and
acce
ssor
ies
in th
is m
anua
l with
out p
rior
notic
e.
Maracaibo, 6 08030 BARCELONA, SPAIN
Tel. (+34) 934 335 240 FAX (+34) 933 479 310
[email protected] www.cesva.com