smart pulmonary function analyser - Karnataka State Council ...
51
VISVESVARAYA TECHNOLOGICAL UNIVERSITY JNANA SANGAMA, BELAGAVI-590018 A Project Report On “SMART PULMONARY FUNCTION ANALYSER” Submitted in partial fulfilment of the requirement for the award of the degree of BACHELOR OF ENGINEERING IN ELECTRONICS AND COMMUNICATION ENGINEERING Submitted by NAME USN ARMUTHAVARSHINI P 4VM13EC004 ARUN SINGH R 4VM13EC011 DIVITHA B P 4VM13EC016 SHREYAS K 4VM13EC069 Under the Guidance of Dr. BINDU A. THOMAS Professor and Head Department of Electronics and Communication Engineering DEPARTMENT OF ELECTRONICS AND COMMUNICATION ENGINEERING VIDYA VIKAS INSTITUTE OF ENGINEERING AND TECHNOLOGY MYSURU – 570 028 2016-2017
-
Upload
khangminh22 -
Category
Documents
-
view
3 -
download
0
Transcript of smart pulmonary function analyser - Karnataka State Council ...

VISVESVARAYA TECHNOLOGICAL UNIVERSITY
JNANA SANGAMA, BELAGAVI-590018
A Project Report
On
“SMART PULMONARY FUNCTION ANALYSER” Submitted in partial fulfilment of the requirement for the award of the degree of
BACHELOR OF ENGINEERING
IN
ELECTRONICS AND COMMUNICATION ENGINEERING
Submitted by
NAME USN
ARMUTHAVARSHINI P 4VM13EC004
ARUN SINGH R 4VM13EC011
DIVITHA B P 4VM13EC016
SHREYAS K 4VM13EC069
Under the Guidance of
Dr. BINDU A. THOMAS
Professor and Head
Department of Electronics and Communication Engineering
DEPARTMENT OF ELECTRONICS AND COMMUNICATION ENGINEERING
VIDYA VIKAS INSTITUTE OF ENGINEERING AND TECHNOLOGY
MYSURU – 570 028
2016-2017
VIDYA VIKAS INSTITUTE OF ENGINEERING AND TECHNOLOGY
MYSURU-570028 Affiliated to Visvesvaraya Technological University, Belagavi
Department of Electronics and Communication Engineering
CERTIFICATE
Certified that the project work entitled “Smart Pulmonary Function Analyser” is a
bonafidework carried out by Ms.AMRUTHAVARSHINI P(4VM13EC004), Mr. ARUN
SINGH R(4VM13EC011), Ms.DIVITHA B P(4VM13EC016), Mr. SHREYAS
K(4VM13EC069)in the Department of Electronics and Communication Engineering
from VIDYA VIKAS INSTITUTE OF ENGINEERING AND TECHNOLOGY
submitted in partial fulfilment for the award ofBachelor of Engineering inElectronics
and Communication Engineering prescribed by the Visvesvaraya Technological
University, Belagavi during the year 2016-17. It is certified that all suggestions
recommended for Internal Evaluation have been incorporated in the report deposited in the
Departmental library. The project report has been approved as it satisfies the academic
requirements with respect to project work prescribed for the said Degree.
EXTRERNAL VIVA
Name of the Examiners Signature with date
1)
2)
Signature of Guide
Dr. Bindu A Thomas
Professor & Head
ECE, VVIET, Mysuru
Signature of H0D
Dr. Bindu A Thomas
Professor & Head
ECE, VVIET, Mysuru
Signature of Principal
Dr. M.Ravishankar
Principal
VVIET, Mysuru
i
ABSTRACT
The prevalence of respiratory illness such as Asthma and COPD(Chronic Obstructive
Pulmonary Disease) has been growing rapidly across the world. The spirometry equipment
used in hospitals forpulmonary function testing costs thousands of dollars, which is
beyond the means of health care facilities in many countries. In this project, the objective
is to design a low-cost smartphone-based pulmonary function analyser that can be used to
measure lung function and diagnose various respiratory illness. Asthma and Chronic
obstructive pulmonary disease(COPD) are both respiratory conditions that are chronic and
affect a person's breathing. If asthma is not treated, it could lead to severe attacks. The
proposed prototype is small in size this can be carried with the person who is suffering
from COPD for routine check-ups. The system consists of three parts: (i) the Spirometer
shell, (ii) the pressure sensor and electronics, and (iii) the android application. The
mechanical part of the system consists of a 3D-printed Spirometer shell , it measures the
air flow rate in litres/second by making the expelled air pass through a constriction which
results in a change in its pressure. The instantaneous flow rate during breathing is
measured by a pressure sensor as air passes through a fine stainless steel wire mess in the
shell.
The pressure sensor output is monitored by a microcontroller, which transmits the
information over a Bluetooth HC-05 Link. Data is received by an android app running on
a smartphone or tablet, which analyses the data and displays the sensor values. The
Spirometer is placed in the device and controlled the breathing patterns through the
software application. The data received from the module is displayed in the form of sensor
values on a smart device with the help of a self-assessment application.The self-
assessment app mainly considers the age, height in inches, smoked years and if there is
significant pollution in that area or not for the COPD prediction.The expected values of
FEV1(Forced Expiratory Volume in one second) and FVC(Forced Vital Capacity) are
compared with actual values and COPD prediction is done. The Smart pulmonary function
analyser has the potential to revolutionize healthcare, especially in poor countries. With
the increasing proliferation of Internet-Connected Smartphone's across the world, low-cost
smartphone-based medical devices are now attractive alternate to traditional custom-made
medical equipment, especially in developing countries. So this project encourages easy
and reassuring use and is of low-cost and used for routine respiratory health checks at
home.

ii
ACKNOWLEDGEMENT
The satisfaction and euphoria that accompany successful completion of any task would be
incomplete without mentioning the people who made it possible, whose constant guidance
and encouragement crowned the efforts with success.
We would like to profoundly thank Management of Vidya Vikas Institute of Engineering
and Technology, Mysuru for providing such a healthy environment for the successful
completion of Project work.
We owe our gratitude to our beloved Chairman, Mr. Vasu and Secretary, Mr. Kaveesh V
Gowda for their encouragement and support in all ourendeavor.
We are thankful toPrincipal,Dr. M. Ravishankar, VVIET, Mysuru, for extending his
support in successful completion of the project work.
We would like to express our deep indebtedness to Dr. Bindu A. Thomas, Professor and
Head, Department of Electronics and Communication, VVIET, Mysuru for her valuable
suggestions and support throughout the course.
We express our deep sense of gratitude to our guide Dr.Bindu A. Thomas, Professor and
Head,Department of Electronics and Communication Engineering, for her inspirational
and dedicated guidance, valuable suggestions, sportive encouragement and much needed
support in every needed sphere. The environment of interactive study created by her
helped us to learn better and ask doubts unhesitant, none of which went unanswered.
Last but not the least, Wewould hereby acknowledge and thank our parents who have a
source of inspiration and instrumental in the successful completion of the project work.
We are also intended to thank all the members and staff both teaching and non-teaching
staff of EC Department, VVIET, Mysuru. We take this opportunity to extend our full-
hearted thanks, gratitude and respect to our parents, all our friends and well-wishers,
without whom it would not have been possible to successfully complete our project.
AMRUTHAVARSHINI P
ARUN SINGH R
DIVITHA B P
SHREYAS K
`
iii
TABLE OF CONTENTS
Page No.
List of Figures iv
List of Tables v
List of Acronyms vi
1. INTRODUCTION 1
1.1 Chronic Obstructive Pulmonary Disease 2
1.2 Motivation 3
1.3 Objective of the Project 3
1.4Problem Description 4
1.5Report Organization 4
2.LITERATURE SURVEY 5
2.1Types of Spirometers 6
2.2 Current Scenario 8
3.HARDWARE COMPONENT DESCRIPTION 12
3.1Block Diagram of the system 12
3.2 Spirometer Shell 13
3.3 Pressure Sensor 14
3.4 Bluetooth Module 16
3.5 Arduino Microcontroller 17
4. METHODOLOGY 20
4.1Hardware schematic 20
4.2Software tool 21
4.3System Flow 23
5. RESULTS ANALYSIS AND CONCLUSION 24
5.1 Execution of Android Application 24
5.2COPD Test Analysis 27
5.3 Conclusion 30
REFERENCE 32
APPENDIX 33-40

iv
LIST OF FIGURES Page No.
Figure 1.1 Chronic Obstructive Pulmonary Disease 2
Figure 2.1 The Spirometer tests done in Hospitals 6
Figure 2.2 Spirometry Details 7
Figure 2.3 Body Plethysmograpgh 8
Figure 2.4 Pnuemotachometer 9
Figure 2.5 Incentive Spirometer 10
Figure 2.6 Peak Expiratory Flow 11
Figure 2.7 Wind Mill Type Spirometer 11
Figure 3.1 Block Diagram of System 12
Figure 3.2 Hardware Description 13
Figure 3.3 Spirometer Shell 14
Figure 3.4 Pressure Sensor(GY-65) 14
Figure 3.5 GY-65 breakout board-Pin out 15
Figure 3.6 Bluetooth Module HC-05 16
Figure 3.7 Pin Diagram of Arduino Microcontroller 18
Figure 3.8 Hardware Assembly 19
Figure 4.1 Hardware Schematic 20
Figure 4.2 Flow Chart of the System 23
Figure 5.1 Android Application 24
Figure 5.2 Input to the Application 25
Figure 5.3 Assessment Results 25
Figure 5.4 COPD prediction 26
Figure 5.5 COPD prediction For Men 29
Figure 5.6 COPD prediction for Women 30
`
v
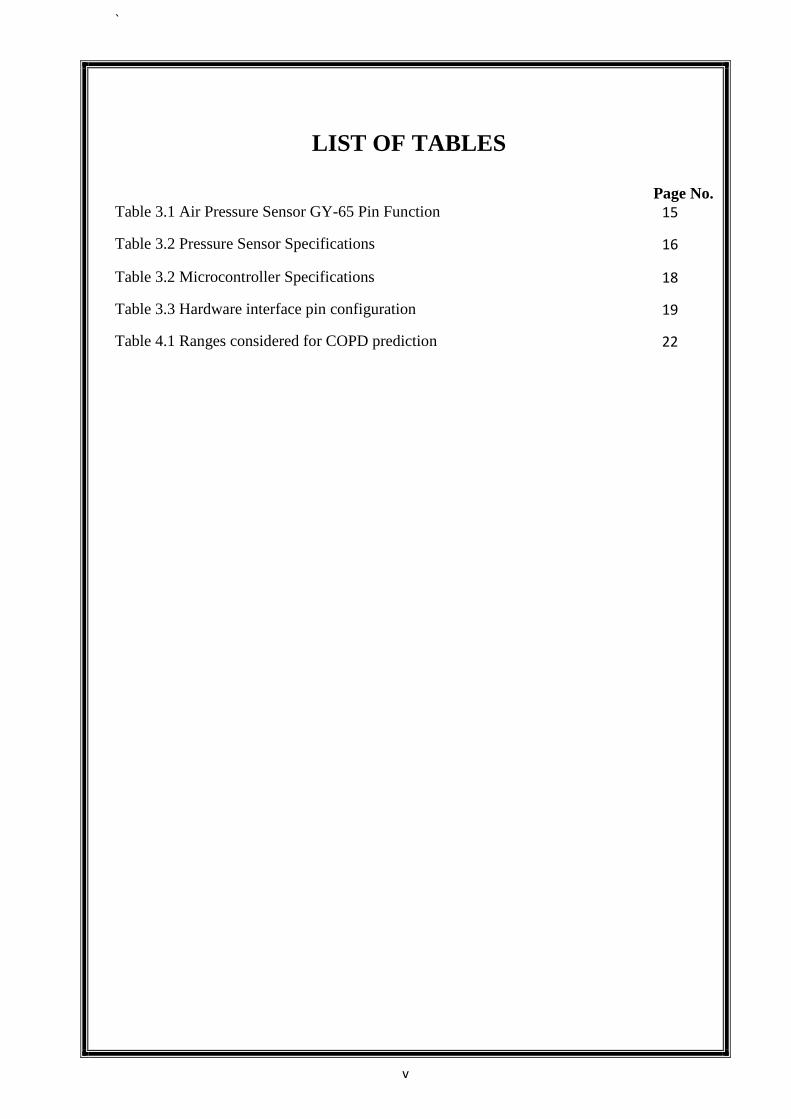
LIST OF TABLES
Page No.
Table 3.1 Air Pressure Sensor GY-65 Pin Function 15
Table 3.2 Pressure Sensor Specifications 16
Table 3.2 Microcontroller Specifications 18
Table 3.3 Hardware interface pin configuration 19
Table 4.1 Ranges considered for COPD prediction 22
vi
LIST OF ACRONYMS
COPD Chronic Obstructive Pulmonary Disease
IC Integrated Circuit
VCC Collector Supply Voltage
SDA Serial Data I/O
SCL Serial Clock I/O
EOC End of Conversion Output
GND Ground
NHS National Health Service
FEV1 Forced Expiratory Volume during the first second
FVC Forced Vital Capacity
PEF Peak Expiratory Flow
ADC Analog to Digital Converter
GPS Global Positioning System
BMP-085 Barometric Pressure Sensor
IDE Integrated Development Environment
TXD/RXD Transmit Data/ Receive Data
PWM Pulse Width Modulation
FTDI Future Technology Devices International
UART Universal Asynchronous Receiver/Transmitter
XCLR Master Clear
SMART PULMONARY FUNCTION ANALYSER 2016-17
Dept. ECE, VVIET,Mysuru Page1
CHAPTER 1
INTRODUCTION
This chapter will provide a brief introduction about the project that is Smart Pulmonary
Function Analyser, also deals with the motivation behind the project, which is to give the
fast detection of possibility of pulmonary restrictions and obstruction, for the routine
respiratory health checks at home.
Asthma and Chronic obstructive pulmonary disease(COPD) are both respiratory
conditions that are chronic and affect a person's breathing. Asthma and Chronic
obstructive pulmonary disease(COPD) are both respiratory conditions that are chronic and
affect a person's breathing. With many shared similarities, the two can easily be
misdiagnosed for one another and that is why testing is so important to determine the
exact diagnosis. Chronic Obstructive Pulmonary Disease(COPD) is the third leading
cause of death globally and presents a significant burden to patients, carers and health
services worldwide. More than 1.5 million adults are known to be diagnosed with COPD
in England and Wales, and further 3 million adults are estimated to be living with
undiagnosed COPD. Improving the care and outcomes for people with COPD is a priority
for the National Health Services(NHS) in England, which aims to reduce premature
mortality from respiratory disease, avoid unnecessary hospital admissions and improve
the quality of life and support for patients with long-term conditions and their carers.
However, several current issues remain in the diagnoses and monitoring of COPD, some
of which could be resolved by technological developments or novel disease biomarkers. If
asthma is not treated, it could lead to severe attacks. Many people die from asthma attacks
every day in India and Worldwide. Untreated or poorly managed asthma can also cause
scarring in the lungs, which can lead to COPD. Once the lungs are scarred, asthma
medicines won't work as well. Pulmonary function analysers measure the performance of
a patient's respiratory system, especially for outpatient or pre-surgical screening. These
systems measure the ventilation, diffusion, and distribution of gases. They are used to
help access patients with conditions like chronic obstructive pulmonary disorder(COPD).
Spirometry helps diagnose and manage asthma. A Spirometry test can confirm whether
you have asthma or another disease. And it helps your health care provider decide on your
treatment. If follow-up spirometry tests shows that your asthma is well under control,
SMART PULMONARY FUNCTION ANALYSER 2016-17
Dept. ECE, VVIET,Mysuru Page2
your doctor may need to change your medicine or give you more medicine. Primary care
spirometry services can be provided by trained primary care staff, peripatetic specialist
services, or through referral to hospital-based or laboratory spirometry and is quite
expensive and time consuming. With the increasing proliferation of Internet-Connected
Smartphone's across the world, low-cost smartphone-based medical devices are now
attractive alternate to traditional custom-made medical equipment, especially in
developing countries. So this project encourages easy and reassuring use and is of low-
cost and used for routine respiratory health checks at home. The spirometry equipment
used in hospitals for pulmonary function testing costs thousands of dollars, which is
beyond the means of health care facilities in many countries.
1.1 Chronic Obstructive Pulmonary Disease(COPD)
COPD is an umbrella term used to describe progressive lung diseases including
emphysema, chronic bronchitis, refractory(non-reversible) asthma, and some forms of
bronchiectasis. This disease is characterized by increasing breathlessness. Many people
mistake their increased breathlessness and coughing as a normal part of aging. In the early
stages of the disease, you may not notice the symptoms. COPD can develop for years
without noticeable shortness of breath. You begin to see the symptoms in the more
developed stages of the disease. Thus there is a necessity of consulting the doctor as soon
as possible when you notice any of these symptoms and ask your doctor about taking a
spirometry test. COPD affects an estimated 30 million individuals in the U.S., and over
half of them have symptoms of COPD and do not know it. Early screening can identify
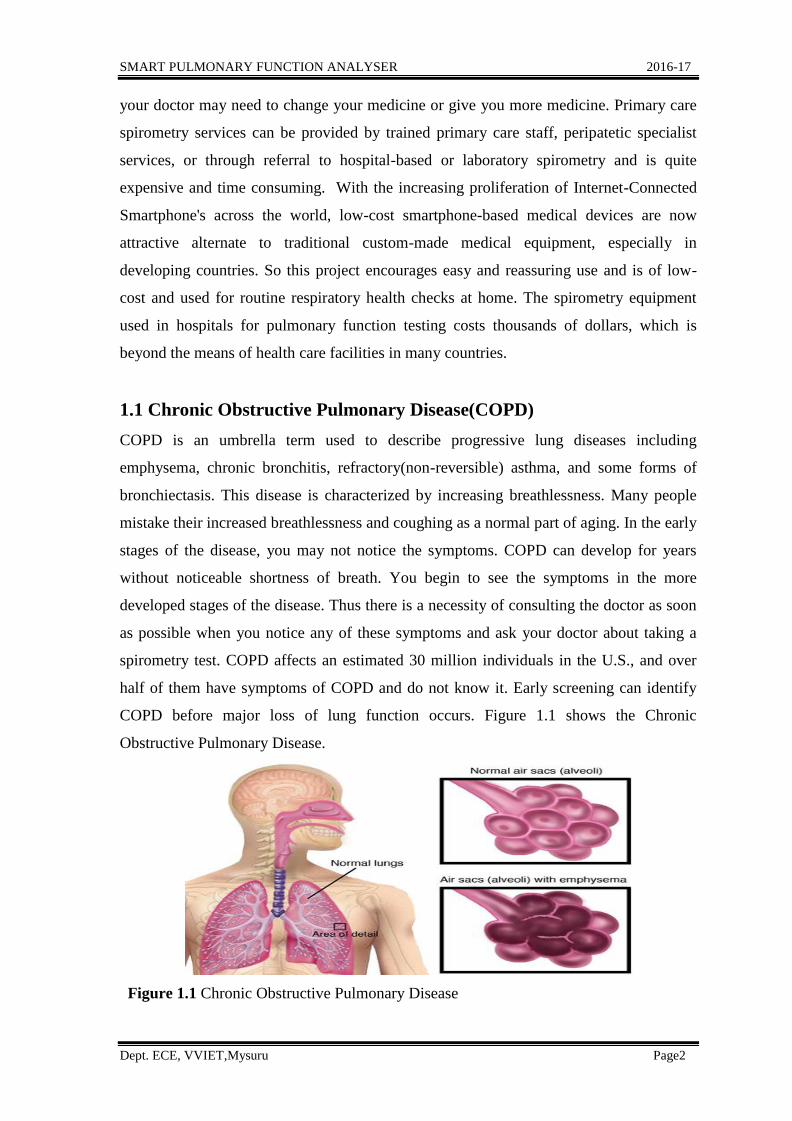
COPD before major loss of lung function occurs. Figure 1.1 shows the Chronic
Obstructive Pulmonary Disease.
Figure 1.1 Chronic Obstructive Pulmonary Disease
SMART PULMONARY FUNCTION ANALYSER 2016-17
Dept. ECE, VVIET,Mysuru Page3
The signs and symptoms of COPD includes increased breathlessness, frequent
coughing(with and without sputum), wheezing and tightness in the chest. Tobacco
smoking is the most common cause of COPD, with factors such as air pollution and
genetics playing a smaller role. COPD most often occurs in people 40 years of age and
older who have a history of smoking. These may be individuals who have a history of
smoking. These may be individuals who are current or former smokers. While not
everybody who smokes gets COPD, most of the individuals who have COPD(about 90%
of them)have smoked. Most cases of COPD are caused by inhaling pollutants; that
includes smoking(cigarettes, pipes, cigars, etc), and second-hand smoke. Fumes,
chemicals and dust found in many work environments are contributing factors for many
individuals who develop COPD. Genetics can also play a role in an individual's
development of COPD- even if the person has never smoked or has ever been exposed to
strong lung irritants in the workplace. COPD treatments include stopping smoking,
vaccinations, respiratory rehabilitation, and often inhaled bronchodilators and steroids.
1.2 Motivation
When a person has asthma, the lining of the airways in the lungs swells and the muscles
around the airways get tight. Then the airways get narrow. When a person breathe, they
have trouble moving air out of lungs. As a result, they may cough, wheeze, feel short of
breath, or have tightness in their chest. Exercise or cold air may make symptoms worse.
However, those symptoms can also be a sign of other lung problems, such as a common
cold, bronchitis, or pneumonia. They can even be symptoms of heart disease and other
diseases. It is important to know the cause of the symptoms to make sure people get the
right treatment. The treatment for asthma is very different from pneumonia or heart
disease. Respiratory disorders are responsible for considerable morbidity and mortality in
children. Spirometry helps diagnose and manage asthma. Children age five or older, and
adults of any age, who have asthma-like symptoms should have a spirometry test. A
health care provider should also do physical exam and full medical history. If the test
shows that they have asthma, their doctor should prescribe asthma medicine. Large
electronic spirometers used in the hospitals are massive ,quite expensive, complex and
therefore not installed in many locations mainly rural areas where the hospitals lack
sophisticated equipment like Spirometer, thereby requiring for the patients to travel
substantial distances to undergo the testing. So the proposed project would be very
SMART PULMONARY FUNCTION ANALYSER 2016-17
Dept. ECE, VVIET,Mysuru Page4
beneficial to enable fast detection in the form of graphical outputs regardless of time and
place and the main reason for the selection of this idea and implement in real life.
1.3 Objective
The prevalence of respiratory illnesses such as Asthma and COPD has been growing
rapidly across the world, with more than 900 million currently afflicted.
The main objective is to bring out the indigenous model for the Lung Function
Evaluation.
Aims at one-to-many communication and is platform adaptable.
Device can be used in patient's home for routine respiratory health checks.
Provides real-on-time analysis, and tale medicine opportunities in remote areas.
1.4 Problem Description
Newer Computerised Spirometry equipment used in the hospitals to diagnose asthma
include training requirements and quality assurance. Steps for interpreting spirometry
results include identification of common errors during the test by applying acceptability
and repeatability criteria and then comparing test parameters with reference standards.
Spirometry services can be provided by trained primary care staff, peripatetic specialist
services, or through referral to hospital-based or laboratory spirometry and is quite
expensive and time consuming. Mainly people in the rural areas will be affected. So The
Smart Pulmonary Function Analyser can be used to monitor the disease progression in
patient's own home which enables the routine respiratory health checks and alert a doctor
when a record is obtained. It has the potential to revolutionize respiratory disease
detection and treatment on global scale. It is of low-cost and platform adaptable.
1.5Report Organization The project report consists of five chapters. Description of this organization is as
follows
Chapter 1: This Chapter will provide a brief introduction of the work, details about
Chronic Obstructive Pulmonary Disease(COPD), motivation, objective,
problem description of the project.
Chapter 2: gives brief review on the current scenario, spirometry tests done in
hospitals and its details.

SMART PULMONARY FUNCTION ANALYSER 2016-17
Dept. ECE, VVIET,Mysuru Page5
Chapter 3:explains the block diagram of the work and gives brief narration on main
hardware components involved in the project.
Chapter 4: provides implementation logic, software configuration.
Chapter 5: presents results and analysis of the work. It includes experimental set-up
screenshots of theapplication. It also gives conclusion and future scope of
the work.
SMART PULMONARY FUNCTION ANALYSER 2016-17
Dept. ECE, VVIET,Mysuru Page6
CHAPTER 2
LITERATURE SURVEY
This chapter provides knowledge of existing system with a survey of technology,
components used. It provides information related to recent research views, pros and cons
of previously done work. On doing survey of recent and past work gives familiarity of
work and gets an opportunity to identify loopholes. This leads in gaining chance of
improvising system.
Smartphone users around the globe are expanding every year. For most of all
purpose people are relying on smart devices. As it is handy now researches are linking
module with smart application. For the benefits patients many applications have been
developed in healthcare domain but here concentrating only on the spirometry
monitoring. This section depicts an outline of the past work that has been done and
researches included in the spirometry monitoring. In case of embedded system
microcontroller and Bluetooth technology is utilized for communication depending on the
requirement.
2.1Current Scenario
Spirometer is a form of Spiro analyzer or Ventilometer and is generally defined as an
instrument for measuring the breathing capacity and other bronchial activity of the lungs.
Pulmonary illness is an umbrella term that encompasses a range of conditions affecting
the human respiratory system. The severity and prevalence of these illnesses continues to
rise, affecting over 900 million people worldwide. Most of these pulmonary illnesses
cannot be cured, but early detection can instrumental in slowing disease progression.
Almost 90% of deaths from pulmonary illnesses occur in developing nations, where there
is limited access to expensive diagnostic equipment. Spirometers find wide utilization in
the diagnosis of lung and breathing difficulties such as asthma, Chronic Obstructive
Pulmonary Disease (COPD) and emphysema. More particularly, they have found use in
monitoring the progress of recipients of lung transplants. Ordinarily, spirometers involve
large equipment located in laboratories or doctors' offices. The testing requires the patient
to breath into the equipment with a forced expiration.
The parameters obtained through the use of spirometers are reported in well-
accepted formats such as "forced vital capacity" (FVC) which is the volume of air that is
exhaled following a maximum single breath regardless of the time taken; "peak expiratory
SMART PULMONARY FUNCTION ANALYSER 2016-17
Dept. ECE, VVIET,Mysuru Page7
flow" (PEF) which is a measure of the highest flow rate of air from the lungs during a
single forced expiration; "forced expired volume during the first second" (FEV1) which
represents the volume of air that can be exhaled forcibly in one second; "FEF25/75 " which
is the average expiratory flow for the middle 50% of the expiration; and, other
combinations of these values such as FEV1 expressed as a percentage of the FVC.
Depending upon the particular malady involving the lungs, the physician or
physiotherapist may choose to look at one, some, all of these parameters, or other ones.
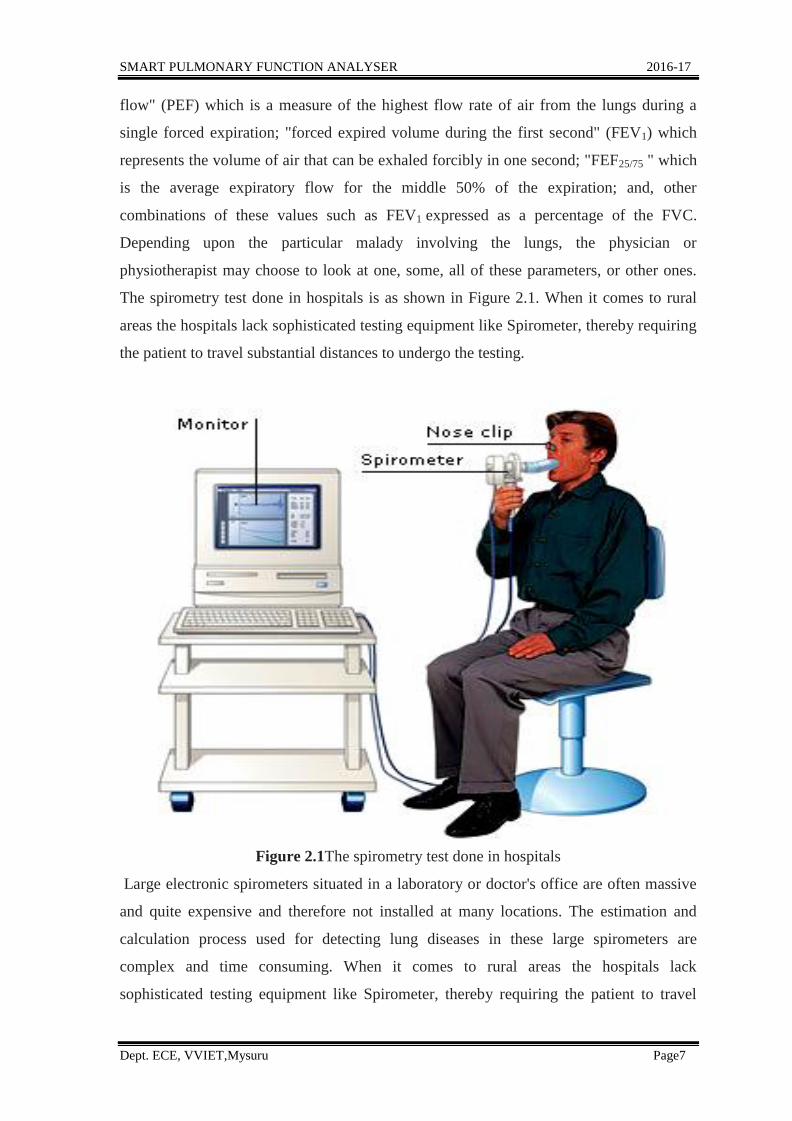
The spirometry test done in hospitals is as shown in Figure 2.1. When it comes to rural
areas the hospitals lack sophisticated testing equipment like Spirometer, thereby requiring
the patient to travel substantial distances to undergo the testing.
Figure 2.1The spirometry test done in hospitals
Large electronic spirometers situated in a laboratory or doctor's office are often massive
and quite expensive and therefore not installed at many locations. The estimation and
calculation process used for detecting lung diseases in these large spirometers are
complex and time consuming. When it comes to rural areas the hospitals lack
sophisticated testing equipment like Spirometer, thereby requiring the patient to travel
SMART PULMONARY FUNCTION ANALYSER 2016-17
Dept. ECE, VVIET,Mysuru Page8
substantial distances to undergo the testing. If a patient is found to have lung diseases
such as asthma and Chronic Obstructive Pulmonary Disease (COPD), then should
regularly go through Spirometer tests in -order to get his disease diagnosed.
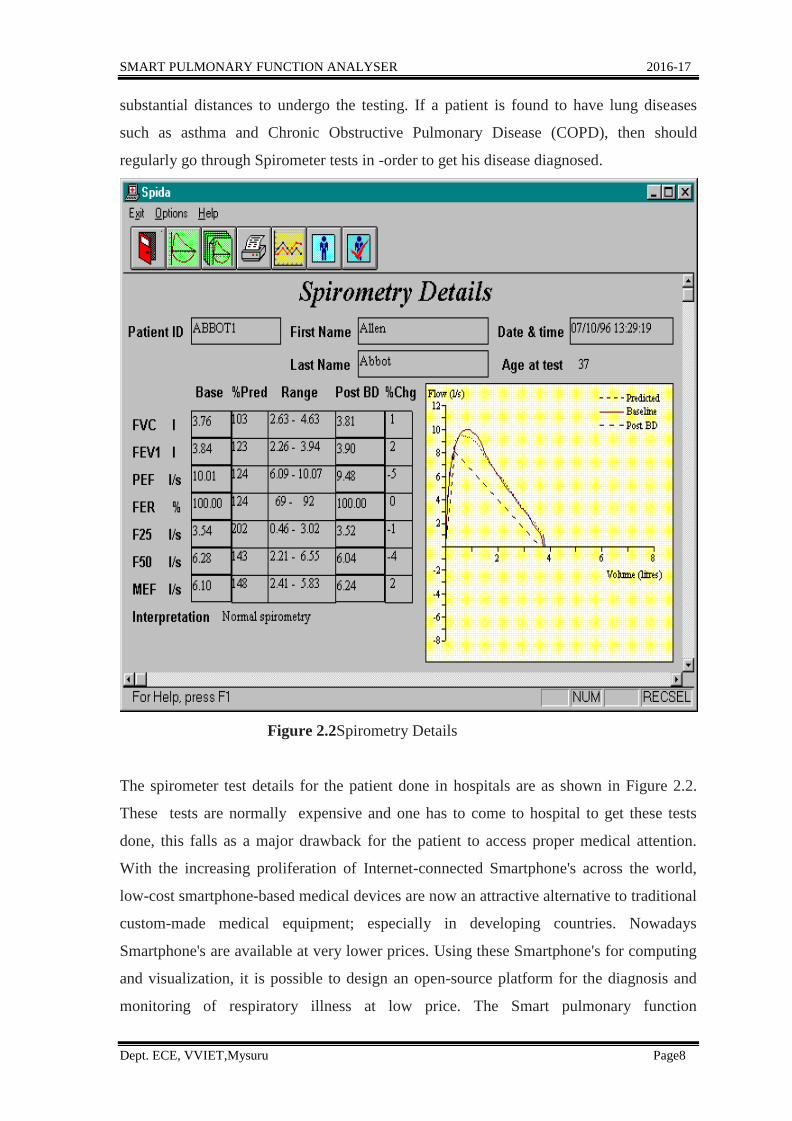
Figure 2.2Spirometry Details
The spirometer test details for the patient done in hospitals are as shown in Figure 2.2.
These tests are normally expensive and one has to come to hospital to get these tests
done, this falls as a major drawback for the patient to access proper medical attention.
With the increasing proliferation of Internet-connected Smartphone's across the world,
low-cost smartphone-based medical devices are now an attractive alternative to traditional
custom-made medical equipment; especially in developing countries. Nowadays
Smartphone's are available at very lower prices. Using these Smartphone's for computing
and visualization, it is possible to design an open-source platform for the diagnosis and
monitoring of respiratory illness at low price. The Smart pulmonary function
SMART PULMONARY FUNCTION ANALYSER 2016-17
Dept. ECE, VVIET,Mysuru Page9
analyserdesigned in this project will be of low cost and encourages easy and reassuring
use. It gives a fast detection of possibility of pulmonary restrictions and obstructions. It
can be operated regardless of time and place. It can also be used to provide real-on-time
analysis and tale medicine opportunities in remote areas. The device can be used in
patient’s own home for routine respiratory health check.
2.2 Types of Spirometer
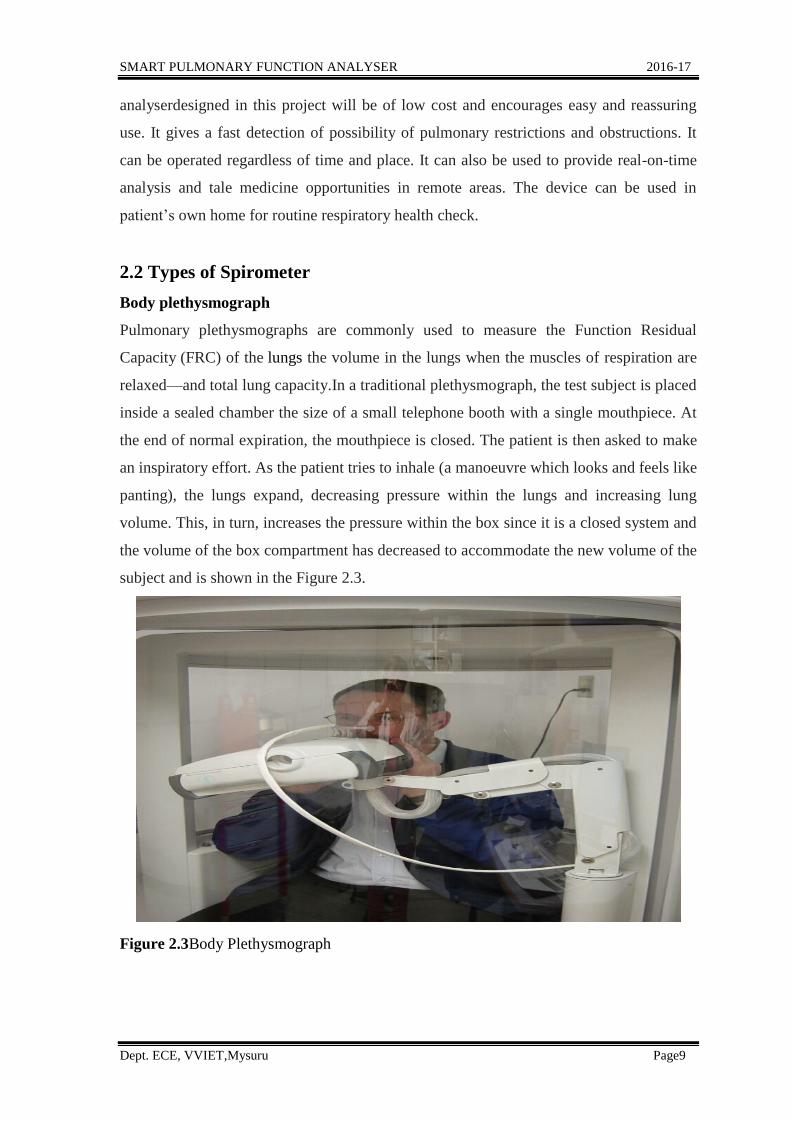
Body plethysmograph
Pulmonary plethysmographs are commonly used to measure the Function Residual
Capacity (FRC) of the lungs the volume in the lungs when the muscles of respiration are
relaxed—and total lung capacity.In a traditional plethysmograph, the test subject is placed
inside a sealed chamber the size of a small telephone booth with a single mouthpiece. At
the end of normal expiration, the mouthpiece is closed. The patient is then asked to make
an inspiratory effort. As the patient tries to inhale (a manoeuvre which looks and feels like
panting), the lungs expand, decreasing pressure within the lungs and increasing lung
volume. This, in turn, increases the pressure within the box since it is a closed system and
the volume of the box compartment has decreased to accommodate the new volume of the
subject and is shown in the Figure 2.3.
Figure 2.3Body Plethysmograph
SMART PULMONARY FUNCTION ANALYSER 2016-17
Dept. ECE, VVIET,Mysuru Page10
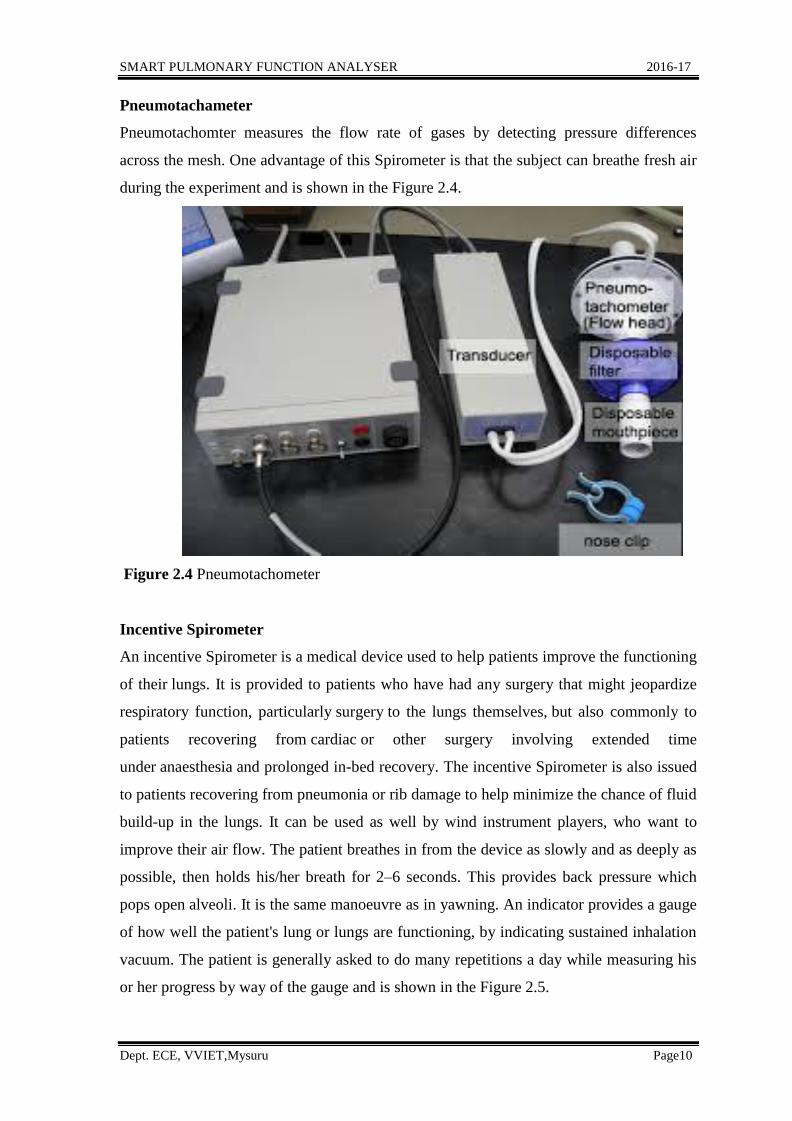
Pneumotachameter
Pneumotachomter measures the flow rate of gases by detecting pressure differences
across the mesh. One advantage of this Spirometer is that the subject can breathe fresh air
during the experiment and is shown in the Figure 2.4.
Figure 2.4 Pneumotachometer
Incentive Spirometer
An incentive Spirometer is a medical device used to help patients improve the functioning
of their lungs. It is provided to patients who have had any surgery that might jeopardize
respiratory function, particularly surgery to the lungs themselves, but also commonly to
patients recovering from cardiac or other surgery involving extended time
under anaesthesia and prolonged in-bed recovery. The incentive Spirometer is also issued
to patients recovering from pneumonia or rib damage to help minimize the chance of fluid
build-up in the lungs. It can be used as well by wind instrument players, who want to
improve their air flow. The patient breathes in from the device as slowly and as deeply as
possible, then holds his/her breath for 2–6 seconds. This provides back pressure which
pops open alveoli. It is the same manoeuvre as in yawning. An indicator provides a gauge
of how well the patient's lung or lungs are functioning, by indicating sustained inhalation
vacuum. The patient is generally asked to do many repetitions a day while measuring his
or her progress by way of the gauge and is shown in the Figure 2.5.
SMART PULMONARY FUNCTION ANALYSER 2016-17
Dept. ECE, VVIET,Mysuru Page11
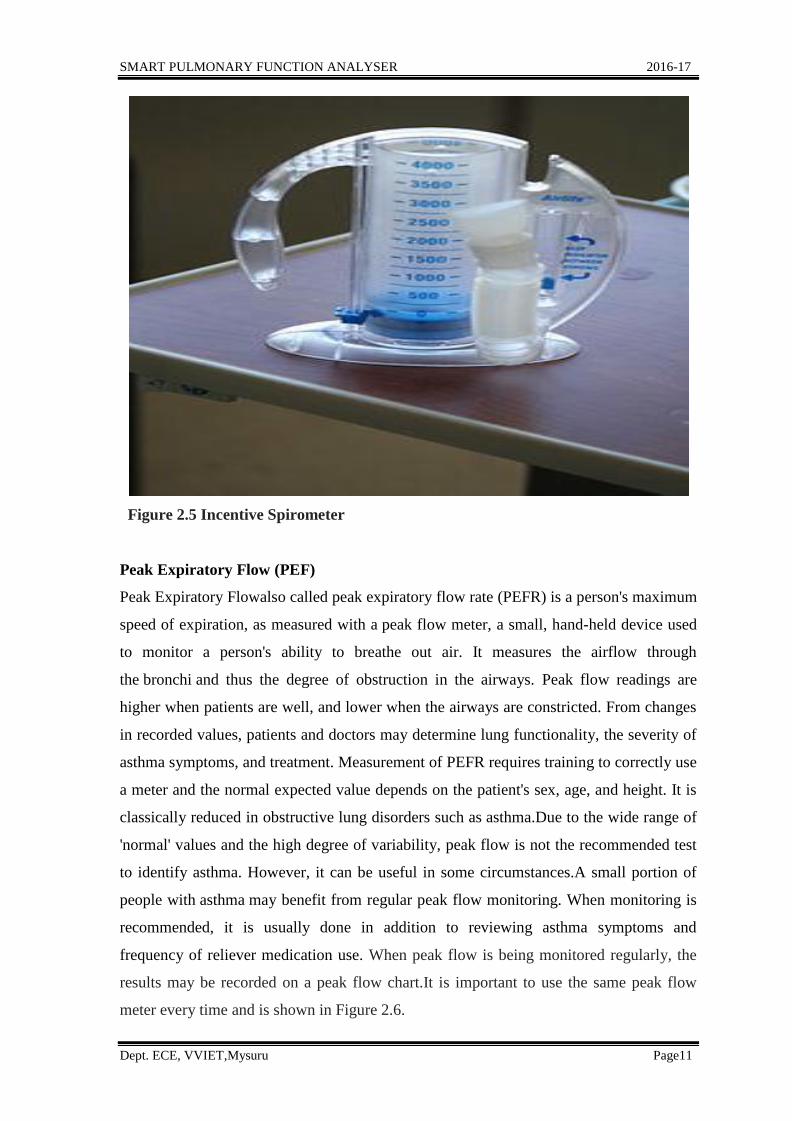
Figure 2.5 Incentive Spirometer
Peak Expiratory Flow (PEF)
Peak Expiratory Flowalso called peak expiratory flow rate (PEFR) is a person's maximum
speed of expiration, as measured with a peak flow meter, a small, hand-held device used
to monitor a person's ability to breathe out air. It measures the airflow through
the bronchi and thus the degree of obstruction in the airways. Peak flow readings are
higher when patients are well, and lower when the airways are constricted. From changes
in recorded values, patients and doctors may determine lung functionality, the severity of
asthma symptoms, and treatment. Measurement of PEFR requires training to correctly use
a meter and the normal expected value depends on the patient's sex, age, and height. It is
classically reduced in obstructive lung disorders such as asthma.Due to the wide range of
'normal' values and the high degree of variability, peak flow is not the recommended test
to identify asthma. However, it can be useful in some circumstances.A small portion of
people with asthma may benefit from regular peak flow monitoring. When monitoring is
recommended, it is usually done in addition to reviewing asthma symptoms and
frequency of reliever medication use. When peak flow is being monitored regularly, the
results may be recorded on a peak flow chart.It is important to use the same peak flow
meter every time and is shown in Figure 2.6.
SMART PULMONARY FUNCTION ANALYSER 2016-17
Dept. ECE, VVIET,Mysuru Page12
Figure 2.6 Peak Expiratory Flow
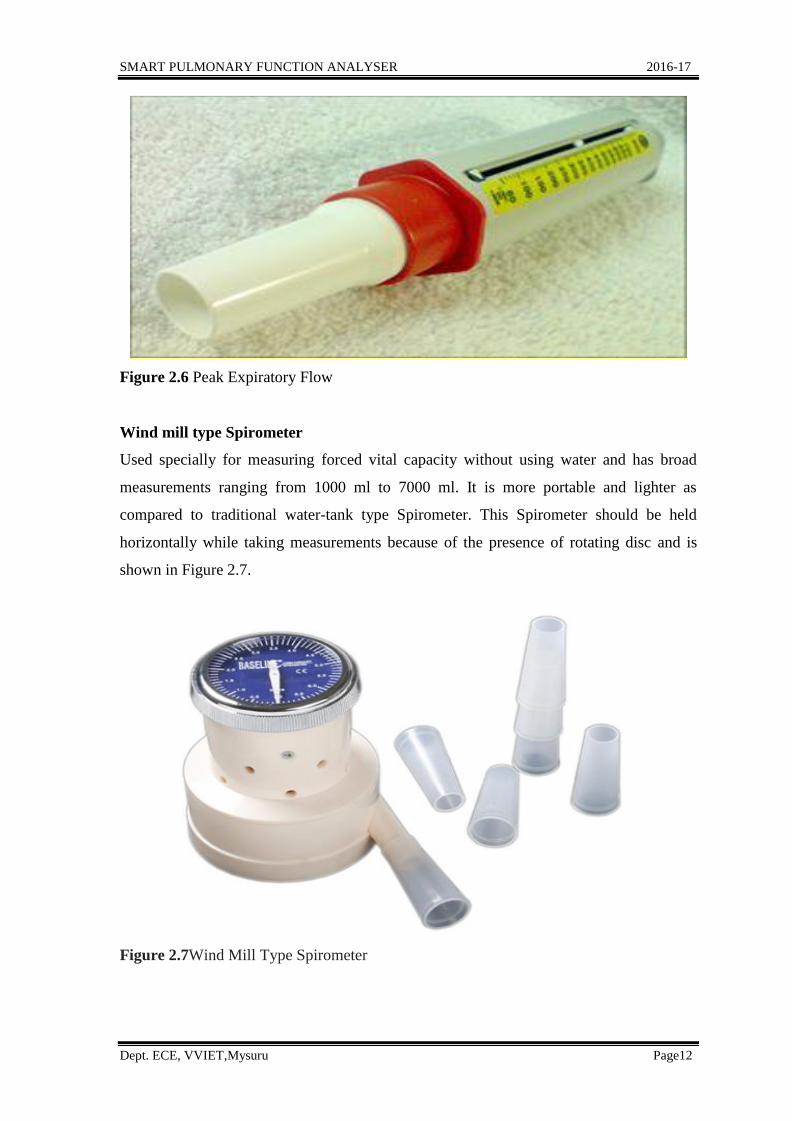
Wind mill type Spirometer
Used specially for measuring forced vital capacity without using water and has broad
measurements ranging from 1000 ml to 7000 ml. It is more portable and lighter as
compared to traditional water-tank type Spirometer. This Spirometer should be held
horizontally while taking measurements because of the presence of rotating disc and is
shown in Figure 2.7.
Figure 2.7Wind Mill Type Spirometer
SMART PULMONARY FUNCTION ANALYSER 2016-17
Dept. ECE, VVIET,Mysuru Page13
CHAPTER 3
HARDWARE COMPONENTS DESCRIPTION
This chapter provides detailed picture of the hardware components being utilized. It
provides details of features of important hardware components like AT-mega
microcontroller, HC-05 Bluetooth module, GY-65 Pressure Sensor and Spirometry Shell.
Detailed explanation of interface configuration and procedure adopted is described.
Chapter includes block diagram expiation and equipment parts study.
Design of a system incorporates visualization of the final output with having
knowledge of input to the framework. Modules that are necessary for the development of
the device are to be designed. Most efficient components information of various
manufactures accessible in market is to be gathered. Comparison and verification of parts
or modules are to be done carefully. Operating Temperature, altitude and pressure must
be taken into contemplations. Choosing of the components/ ready modules are to be done
cleverly.
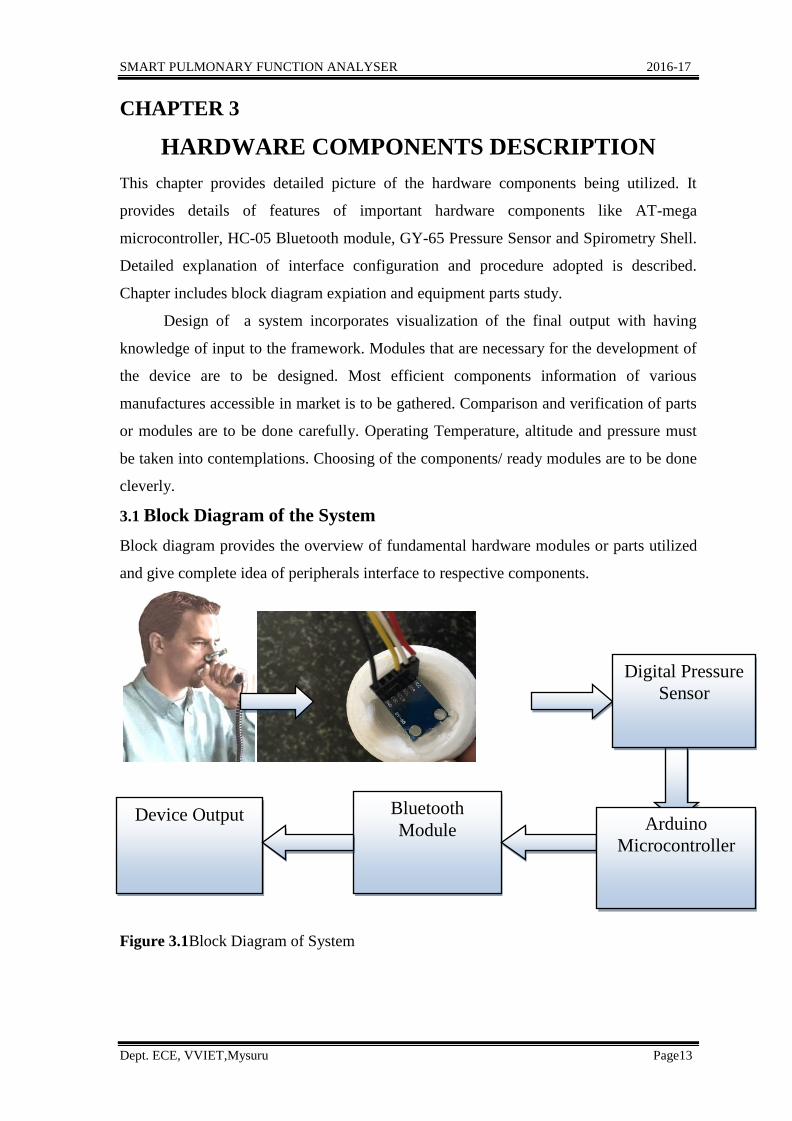
3.1 Block Diagram of the System
Block diagram provides the overview of fundamental hardware modules or parts utilized
and give complete idea of peripherals interface to respective components.
Figure 3.1Block Diagram of System
Digital Pressure
Sensor
Device Output Bluetooth
Module Arduino
Microcontroller
SMART PULMONARY FUNCTION ANALYSER 2016-17
Dept. ECE, VVIET,Mysuru Page14
Block Diagram of the system is appeared in Figure 3.1. The indigenous model for the
lung function evaluation consists of three main parts: (i) the Spirometer shell, (ii) the
pressure sensor and electronics, and (iii) the software application. The mechanical part of
the system consists of a 3D-printed Spirometer shell. The instantaneous flow rate during
breathing is measured by a pressure sensor as air passes through a fine stainless steel wire
mesh in the shell. The pressure sensor output is monitored by a microcontroller, which
transmits the information over a BluetoothHC-05 link. The measurement data is received
by an Android app running on a smartphone or tablet, which analyses the data and
displays it in d form of sensor values.The app computes the various quantitative metrics
on the lung performance and compares them to their predicted values based on the user's
age, gender, etc. Based on these comparisons, the app determines the probabilities of the
results matching the characteristics of the respiratory disease: COPD(Chronic Obstructive
Pulmonary Disease)The Smart pulmonary function analyzer can be used irrespective of
time and place. It is one of the simple way to make a test towards the respiratory illnesses
such as asthma and chronic obstructive pulmonary disease (COPD). Whenever a person
needs to check his conditions this device can be used. Since the proposed prototype is
small in size this can be carried with the person who is suffering from those kind of
diseases for routine check-ups. The device supports the person who needs a routine
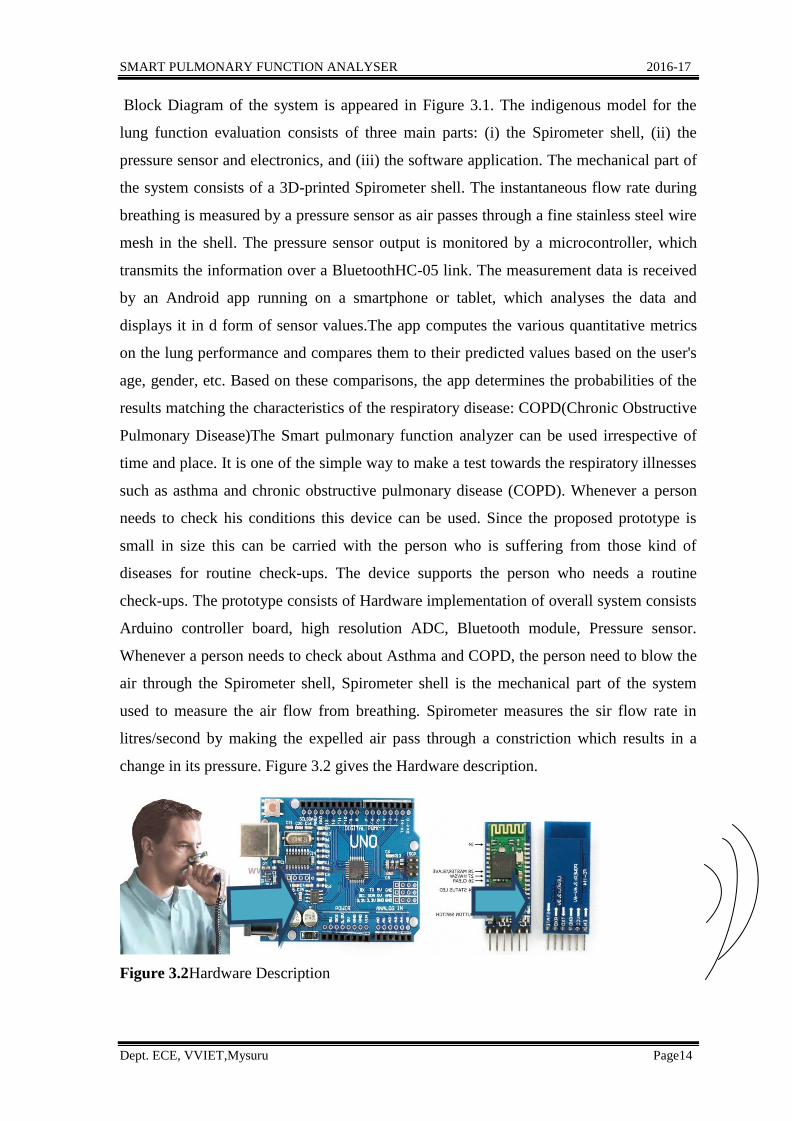
check-ups. The prototype consists of Hardware implementation of overall system consists
Arduino controller board, high resolution ADC, Bluetooth module, Pressure sensor.
Whenever a person needs to check about Asthma and COPD, the person need to blow the
air through the Spirometer shell, Spirometer shell is the mechanical part of the system
used to measure the air flow from breathing. Spirometer measures the sir flow rate in
litres/second by making the expelled air pass through a constriction which results in a
change in its pressure. Figure 3.2 gives the Hardware description.
Figure 3.2Hardware Description
SMART PULMONARY FUNCTION ANALYSER 2016-17
Dept. ECE, VVIET,Mysuru Page15
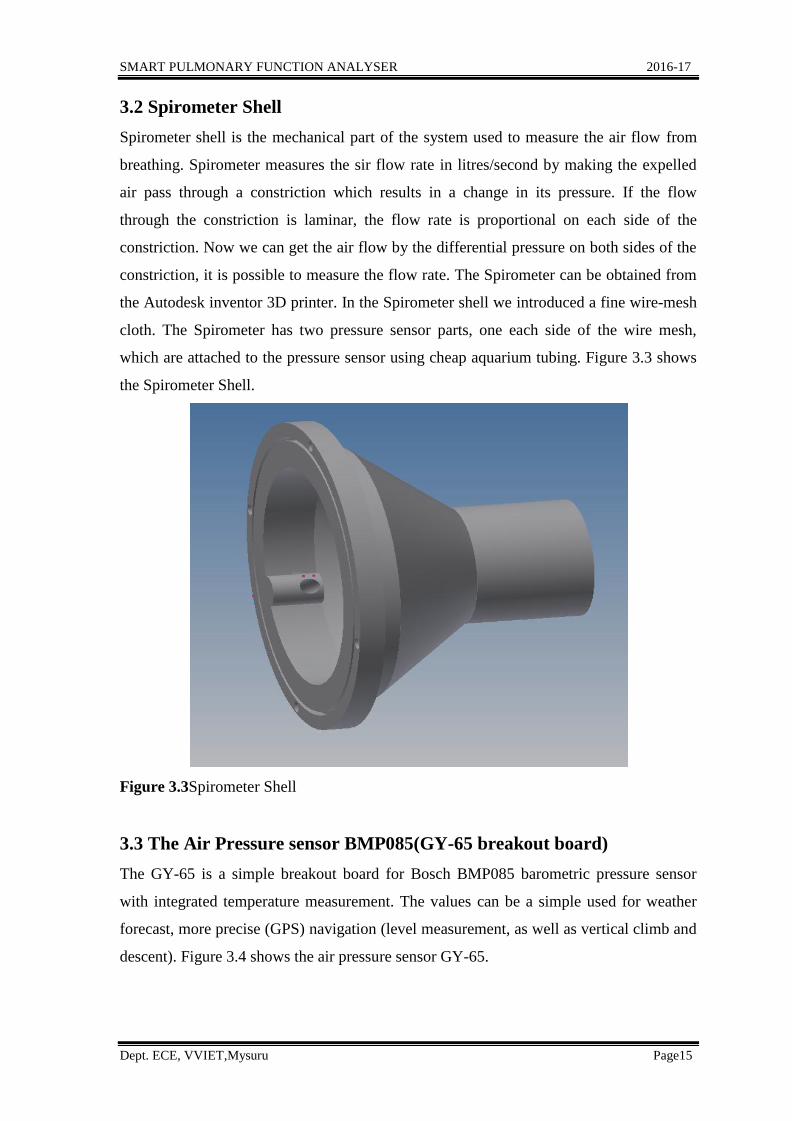
3.2 Spirometer Shell
Spirometer shell is the mechanical part of the system used to measure the air flow from
breathing. Spirometer measures the sir flow rate in litres/second by making the expelled
air pass through a constriction which results in a change in its pressure. If the flow
through the constriction is laminar, the flow rate is proportional on each side of the
constriction. Now we can get the air flow by the differential pressure on both sides of the
constriction, it is possible to measure the flow rate. The Spirometer can be obtained from
the Autodesk inventor 3D printer. In the Spirometer shell we introduced a fine wire-mesh
cloth. The Spirometer has two pressure sensor parts, one each side of the wire mesh,
which are attached to the pressure sensor using cheap aquarium tubing. Figure 3.3 shows
the Spirometer Shell.
Figure 3.3Spirometer Shell
3.3 The Air Pressure sensor BMP085(GY-65 breakout board)
The GY-65 is a simple breakout board for Bosch BMP085 barometric pressure sensor
with integrated temperature measurement. The values can be a simple used for weather
forecast, more precise (GPS) navigation (level measurement, as well as vertical climb and
descent). Figure 3.4 shows the air pressure sensor GY-65.
SMART PULMONARY FUNCTION ANALYSER 2016-17
Dept. ECE, VVIET,Mysuru Page16
Figure 3.4Pressure Sensor(GY-65)
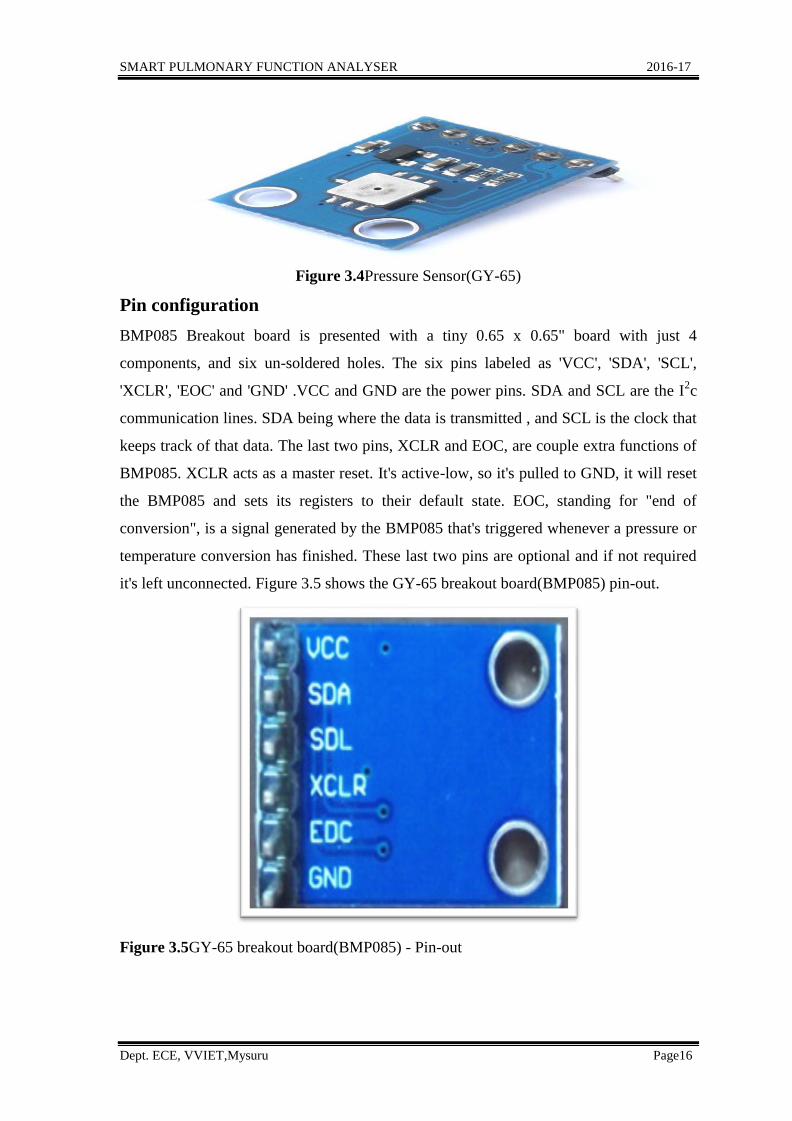
Pin configuration
BMP085 Breakout board is presented with a tiny 0.65 x 0.65" board with just 4
components, and six un-soldered holes. The six pins labeled as 'VCC', 'SDA', 'SCL',
'XCLR', 'EOC' and 'GND' .VCC and GND are the power pins. SDA and SCL are the I2c
communication lines. SDA being where the data is transmitted , and SCL is the clock that
keeps track of that data. The last two pins, XCLR and EOC, are couple extra functions of
BMP085. XCLR acts as a master reset. It's active-low, so it's pulled to GND, it will reset
the BMP085 and sets its registers to their default state. EOC, standing for "end of
conversion", is a signal generated by the BMP085 that's triggered whenever a pressure or
temperature conversion has finished. These last two pins are optional and if not required
it's left unconnected. Figure 3.5 shows the GY-65 breakout board(BMP085) pin-out.
Figure 3.5GY-65 breakout board(BMP085) - Pin-out
SMART PULMONARY FUNCTION ANALYSER 2016-17
Dept. ECE, VVIET,Mysuru Page17
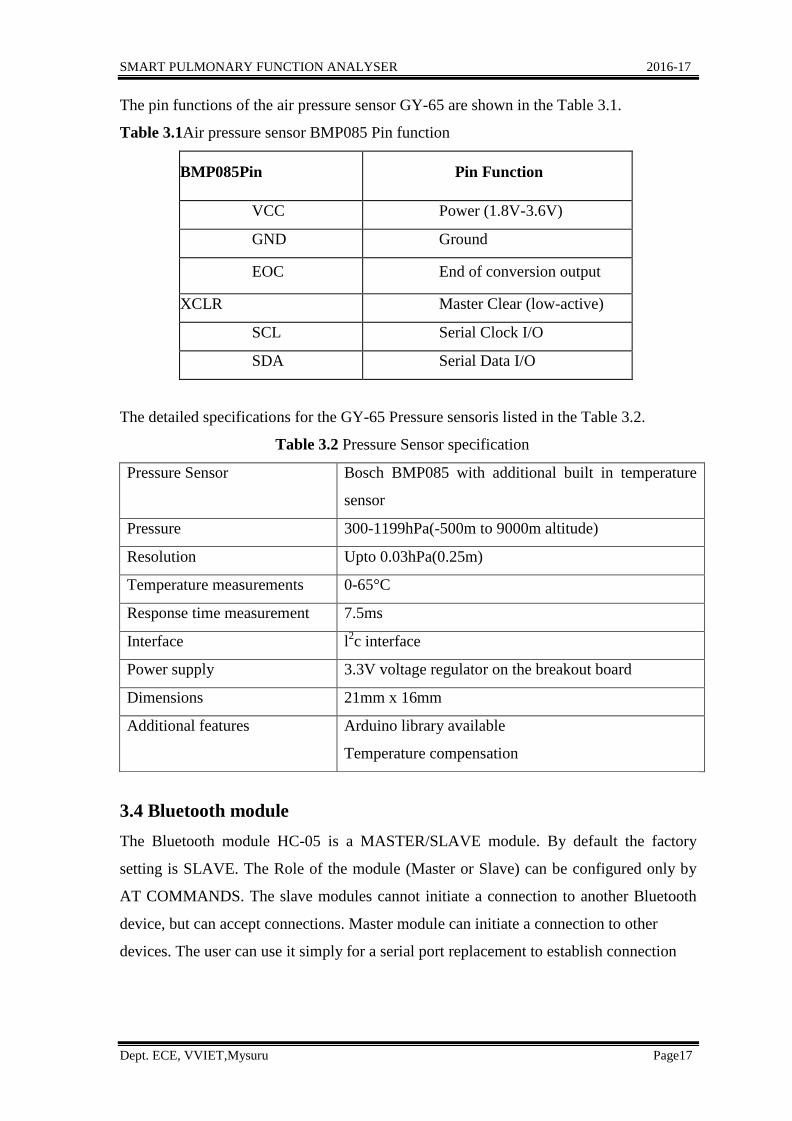
The pin functions of the air pressure sensor GY-65 are shown in the Table 3.1.
Table 3.1Air pressure sensor BMP085 Pin function
BMP085Pin Pin Function
VCC Power (1.8V-3.6V)
GND Ground
EOC End of conversion output
XCLR Master Clear (low-active)
SCL Serial Clock I/O
SDA Serial Data I/O
The detailed specifications for the GY-65 Pressure sensoris listed in the Table 3.2.
Table 3.2 Pressure Sensor specification
Pressure Sensor Bosch BMP085 with additional built in temperature
sensor
Pressure 300-1199hPa(-500m to 9000m altitude)
Resolution Upto 0.03hPa(0.25m)
Temperature measurements 0-65°C
Response time measurement 7.5ms
Interface l2c interface
Power supply 3.3V voltage regulator on the breakout board
Dimensions 21mm x 16mm
Additional features Arduino library available
Temperature compensation
3.4 Bluetooth module
The Bluetooth module HC-05 is a MASTER/SLAVE module. By default the factory
setting is SLAVE. The Role of the module (Master or Slave) can be configured only by
AT COMMANDS. The slave modules cannot initiate a connection to another Bluetooth
device, but can accept connections. Master module can initiate a connection to other
devices. The user can use it simply for a serial port replacement to establish connection
SMART PULMONARY FUNCTION ANALYSER 2016-17
Dept. ECE, VVIET,Mysuru Page18
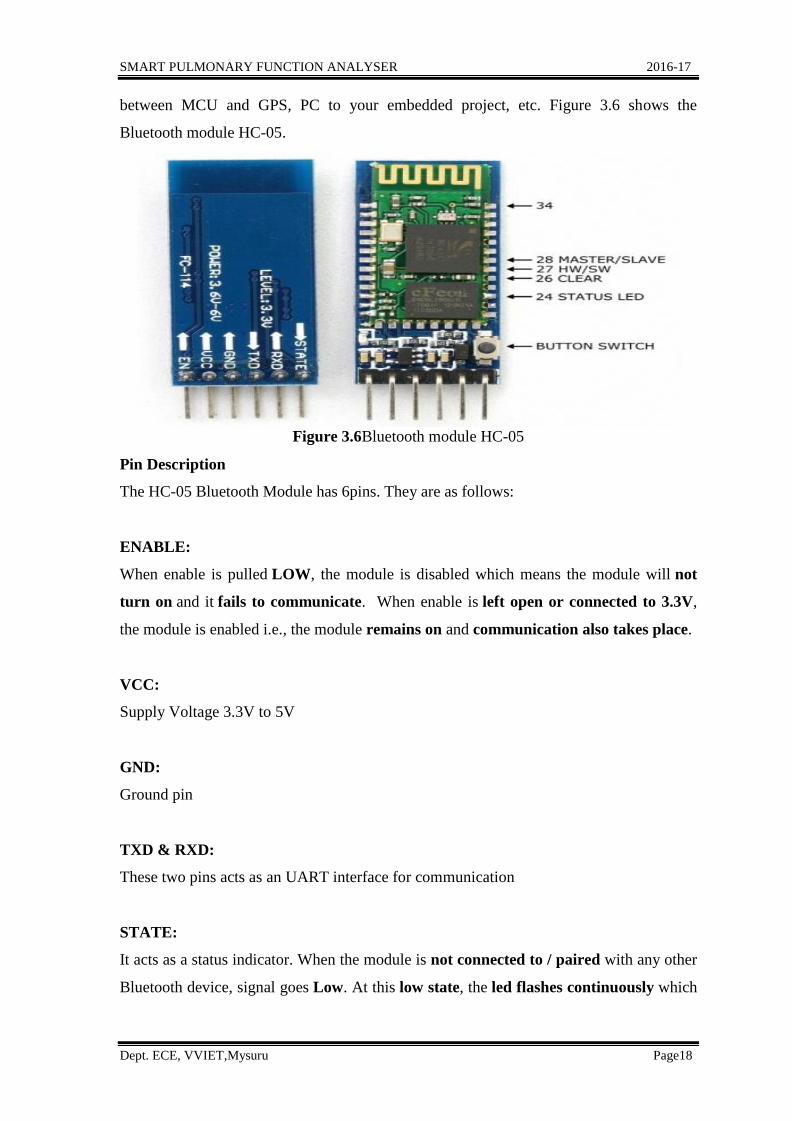
between MCU and GPS, PC to your embedded project, etc. Figure 3.6 shows the
Bluetooth module HC-05.
Figure 3.6Bluetooth module HC-05
Pin Description
The HC-05 Bluetooth Module has 6pins. They are as follows:
ENABLE:
When enable is pulled LOW, the module is disabled which means the module will not
turn on and it fails to communicate. When enable is left open or connected to 3.3V,
the module is enabled i.e., the module remains on and communication also takes place.
VCC:
Supply Voltage 3.3V to 5V
GND:
Ground pin
TXD & RXD:
These two pins acts as an UART interface for communication
STATE:
It acts as a status indicator. When the module is not connected to / paired with any other
Bluetooth device, signal goes Low. At this low state, the led flashes continuously which
SMART PULMONARY FUNCTION ANALYSER 2016-17
Dept. ECE, VVIET,Mysuru Page19
denotes that the module is not paired with other device. When this module is connected
to/paired with any other Bluetooth device, the signal goes High. At this high state,
the led blinks with a constant delay say for example 2s delay which indicates that the
module is paired.
BUTTON SWITCH: This is used to switch the module into AT command mode. To
enable AT command mode, press the button switch for a second. With the help of AT
commands, the user can change the parameters of this module but only when the module
is not paired with any other BT device. If the module is connected to any other Bluetooth
device, it starts to communicate with that device and fails to work in AT command mode.
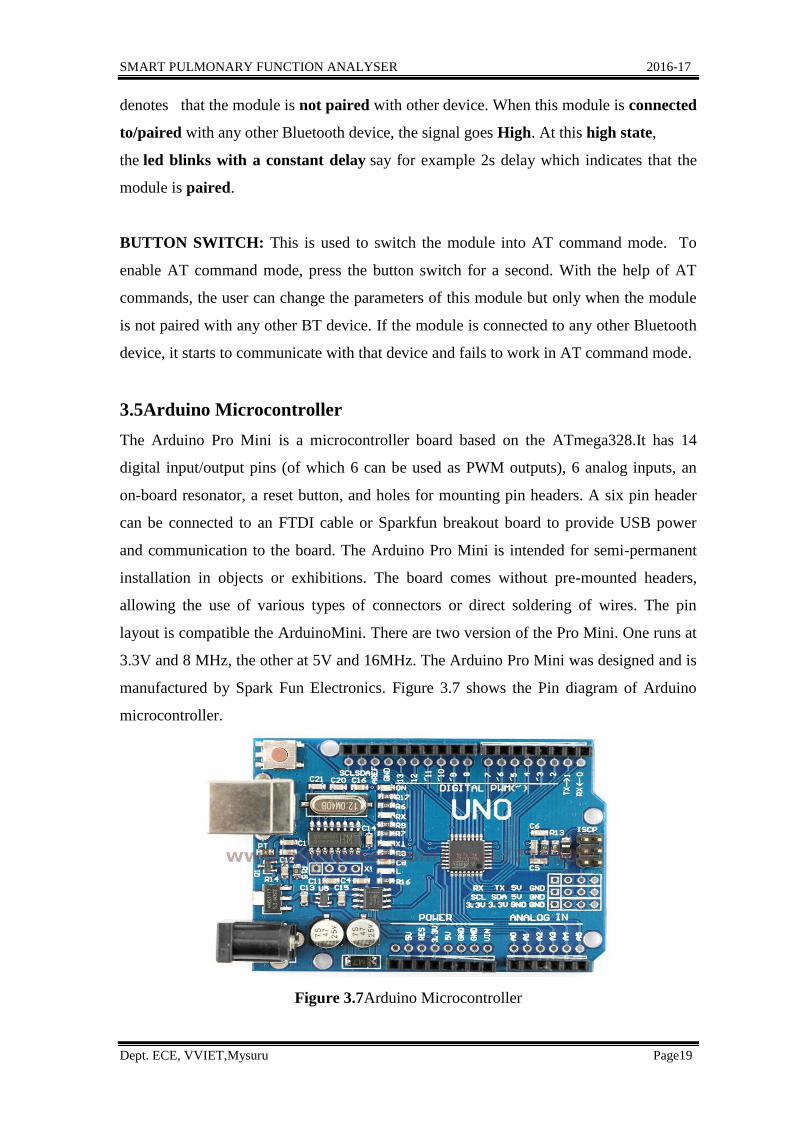
3.5Arduino Microcontroller
The Arduino Pro Mini is a microcontroller board based on the ATmega328.It has 14
digital input/output pins (of which 6 can be used as PWM outputs), 6 analog inputs, an
on-board resonator, a reset button, and holes for mounting pin headers. A six pin header
can be connected to an FTDI cable or Sparkfun breakout board to provide USB power
and communication to the board. The Arduino Pro Mini is intended for semi-permanent
installation in objects or exhibitions. The board comes without pre-mounted headers,
allowing the use of various types of connectors or direct soldering of wires. The pin
layout is compatible the ArduinoMini. There are two version of the Pro Mini. One runs at
3.3V and 8 MHz, the other at 5V and 16MHz. The Arduino Pro Mini was designed and is
manufactured by Spark Fun Electronics. Figure 3.7 shows the Pin diagram of Arduino
microcontroller.
Figure 3.7Arduino Microcontroller
SMART PULMONARY FUNCTION ANALYSER 2016-17
Dept. ECE, VVIET,Mysuru Page20
Detailed specification of the microcontroller in listed in the Table 3.3 as shown.
Table 3.3Microcontroller Specifications
Microcontroller ATmega328
Operating Voltage 5V
Input
Voltage(recommended)
7-12V
Input Voltage(limits) 6-20V
Digital I/O Pins 14(of which 6 provide PWM output)
Analog Input Pins 6
DC current per I/O Pin 40mA
DC current for 3.3V Pin 50mA
Flash Memory 32KB of which 0.5KB used by boot-loader
SRAM 2KB
EEPROM 1KB
Clock Speed 16MHz
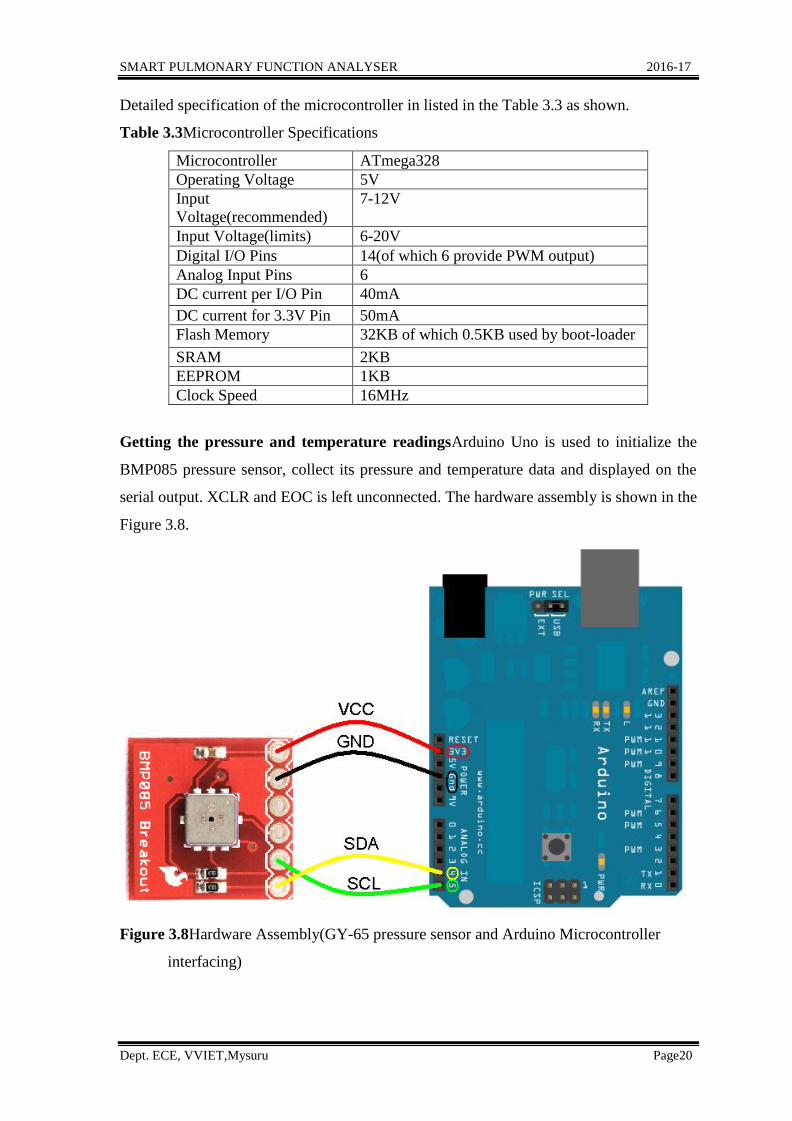
Getting the pressure and temperature readingsArduino Uno is used to initialize the
BMP085 pressure sensor, collect its pressure and temperature data and displayed on the
serial output. XCLR and EOC is left unconnected. The hardware assembly is shown in the
Figure 3.8.
Figure 3.8Hardware Assembly(GY-65 pressure sensor and Arduino Microcontroller
interfacing)

SMART PULMONARY FUNCTION ANALYSER 2016-17
Dept. ECE, VVIET,Mysuru Page21
Table 3.4 gives the pin configuration of the hardware assembly of the GY-65 pressure
sensor and the Arduino Microcontroller.
Table 3.4Pin Configuration
BMP085 Pin Arduino Pin VCC 3.3V
GND GND
SCL A5
SDA A4
SMART PULMONARY FUNCTION ANALYSER 2016-17
Dept. ECE, VVIET,Mysuru Page22
CHAPTER 4
METHODOLOGY
This chapter portray firmware implementation of the undertaking. It describes the
hardware component interface schematic, entire system workflow, application part of the
system.
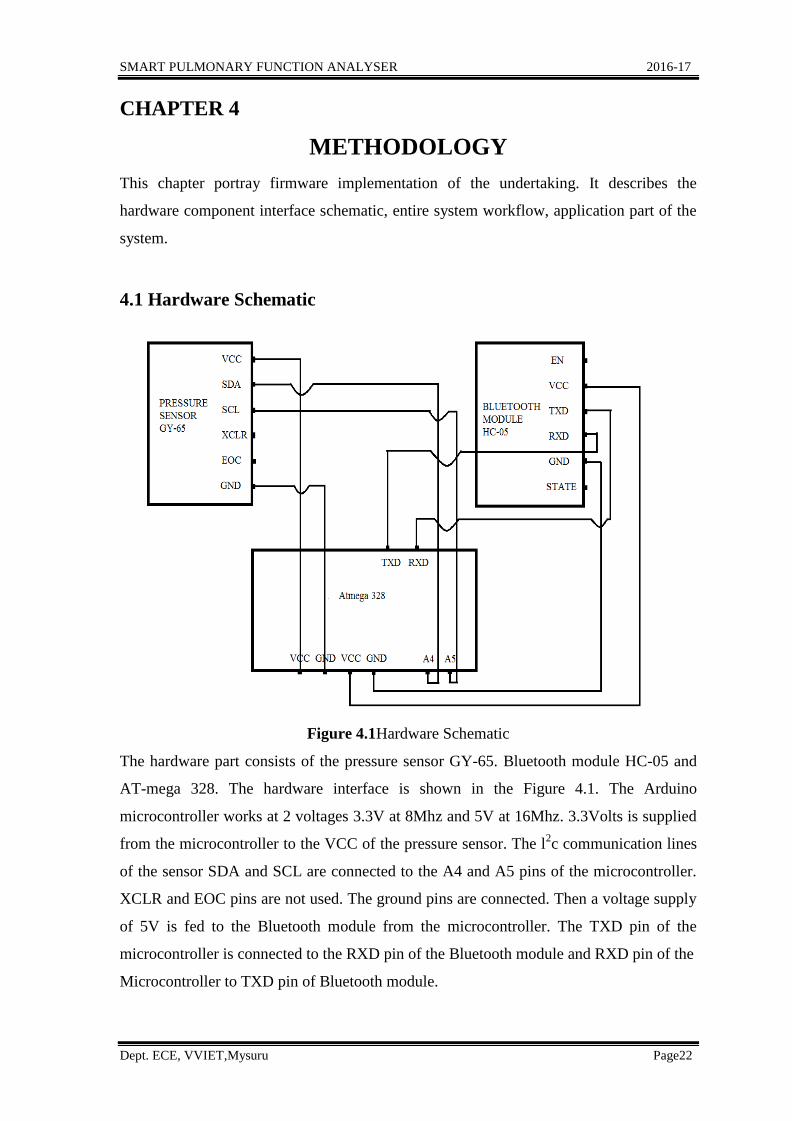
4.1 Hardware Schematic
Figure 4.1Hardware Schematic
The hardware part consists of the pressure sensor GY-65. Bluetooth module HC-05 and
AT-mega 328. The hardware interface is shown in the Figure 4.1. The Arduino
microcontroller works at 2 voltages 3.3V at 8Mhz and 5V at 16Mhz. 3.3Volts is supplied
from the microcontroller to the VCC of the pressure sensor. The l2c communication lines
of the sensor SDA and SCL are connected to the A4 and A5 pins of the microcontroller.
XCLR and EOC pins are not used. The ground pins are connected. Then a voltage supply
of 5V is fed to the Bluetooth module from the microcontroller. The TXD pin of the
microcontroller is connected to the RXD pin of the Bluetooth module and RXD pin of the
Microcontroller to TXD pin of Bluetooth module.
SMART PULMONARY FUNCTION ANALYSER 2016-17
Dept. ECE, VVIET,Mysuru Page23
4.2 Software Tool
Arduino integrated development environment is a cross platform application written in
java, and it derives from the IDE for the processing programming language and the wiring
projects. It is designed to introduce programming to artists and other new comers
unfamiliar with software development. It includes code editor with features such as
syntax highlighting, brace matching and automatic indication and is also capable of
compiling and uploading programs to the board with single click. A program or code
written for Arduino is called ―sketch‖. We use Web development tools for creating the
domain. Also we use the java integrated development environment (IDE) for Application.
Here the lung function evaluation.
Android is a mobile operating system developed by Google, based on the Linux
kernel and designed primarily for touch-screen mobile devices such as smartphone and
tablets. Android's user interface is mainly based on direct manipulation, using touch
gesture that closely correspond to real-world actions, such as swiping, tapping and
pinching, to manipulate on-screen objects, along with a virtual keyboard or text input. In
addition to touch-screen devices, Google has further developed Android TV for
televisions, Android Auto for cars and Android Wear for wrist watches each with a
specialized user interface. Variants of Android are also used on notebooks, game
consoles, digital cameras and other electronics. Initially developed by Android Inc.,
which Google bought in 2005, Android was unveiled in 2007, along with the founding of
the open Handset Alliance - a consortium of hardware, software and telecommunication
companies devoted advancing open standards for mobile devices. Beginning with the first
commercial Android device in September 2008, the operating system has gone through
multiple major releases, with the current version being 7.0 "Nougat", released in August
2016. Android applications ("apps") can be downloaded from the Google Play store,
which features over 2.7 million apps as of February 2017.
Android source code is released by Google under an open source license,
although most android devices ultimately ship with a combination of free and open source
and proprietary software, including proprietary software required for accessing Google
Services. Android is popular with technology companies that require a ready-made, low-
cost and customizable operating system for high-tech devices. Its open nature has
encouraged a large community of developers and enthusiasts to use the open-source code
as a foundation for community-driven projects, which deliver updates to older devices,
SMART PULMONARY FUNCTION ANALYSER 2016-17
Dept. ECE, VVIET,Mysuru Page24
add new features for advanced users orbring Android to devices originally shipped with
other operating systems. The extensive variation of hardware in Android devices causes
significant delays for software upgrades, with new versions of the operating system and
security patches typically taking months before reachingconsumers, or sometimes not at
all. The success of Android has made it a target for patient and copyright litigation as part
of the so-called ''smartphone wars" between technology companies.
Android application is developed to receive the data and displays the results in
terms of sensor values. The aspect of the android application involves wirelessly
receiving data from the Spirometer system. The Bluetooth transmitter module was
programmed to transmit packets of data. The primary metrics used for diagnosing
pulmonary illnesses are FVC(Forced Vital Capacity), representing the total volume of air
exhaled, and FEV1(Forced Expiratory Volume in 1 second), representing the amount of
air that can be exhaled in the first second. The ratio FEV1/FVC is used to measure the
obstruction in the airway. Based on regression equations stated in Hankinson et. al, 1999,
the expected EVC and FEV1 values are calculated and compared to the actual values to
distinguish between the illnesses.
The Lung function Evaluation done using the Smartphone Application includes the
parameters such as
Name
Age
Gender
Height in inches
Smoked Years
Significant Air Pollution
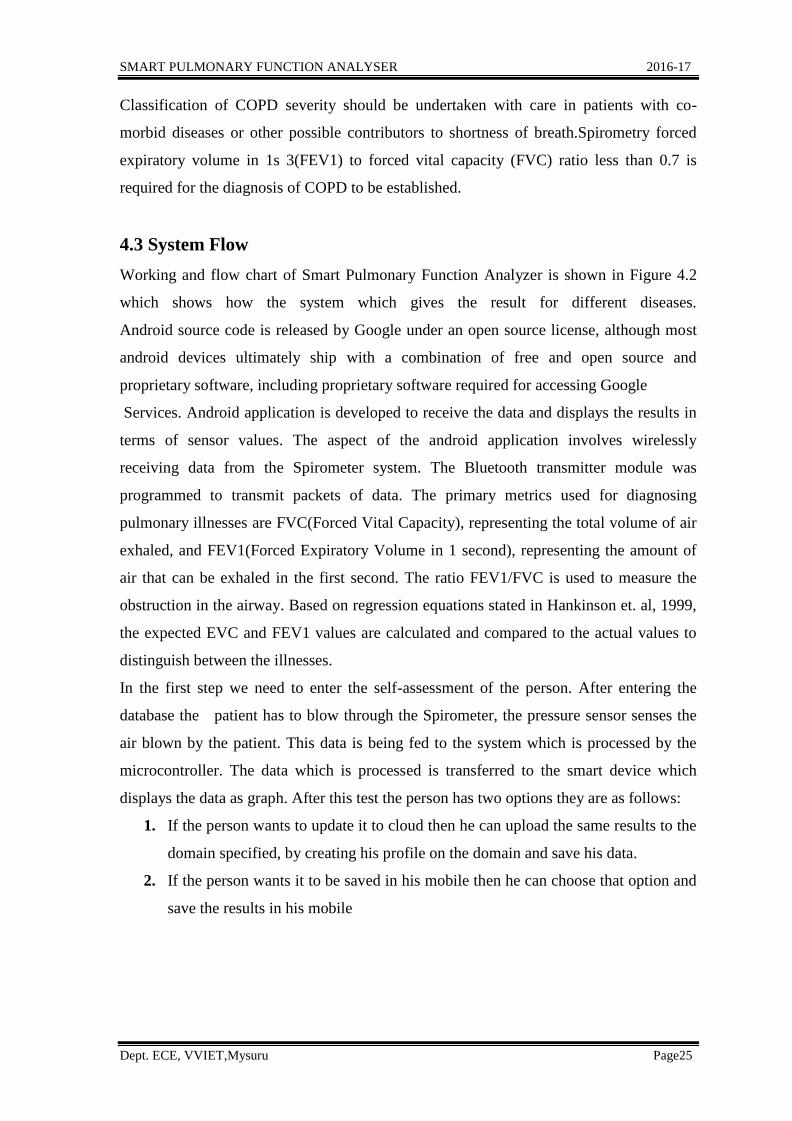
The Chronic Obstructive Pulmonary Disease can be predicted based on the ranges
considered in the Table 4.1.
Table 4.1Ranges considered for COPD prediction
COPD stage Spirometry
Normal FEV1 ≥ 80% predicted FEV1/FVC <0.7
Moderate 50% ≤ FEV1 < 80% predicted FEV1/FVC < 0.7
Severe 30% ≤ FEV1 <50% predicted FEV1/FVC < 0.7
SMART PULMONARY FUNCTION ANALYSER 2016-17
Dept. ECE, VVIET,Mysuru Page25
Classification of COPD severity should be undertaken with care in patients with co-
morbid diseases or other possible contributors to shortness of breath.Spirometry forced
expiratory volume in 1s 3(FEV1) to forced vital capacity (FVC) ratio less than 0.7 is
required for the diagnosis of COPD to be established.
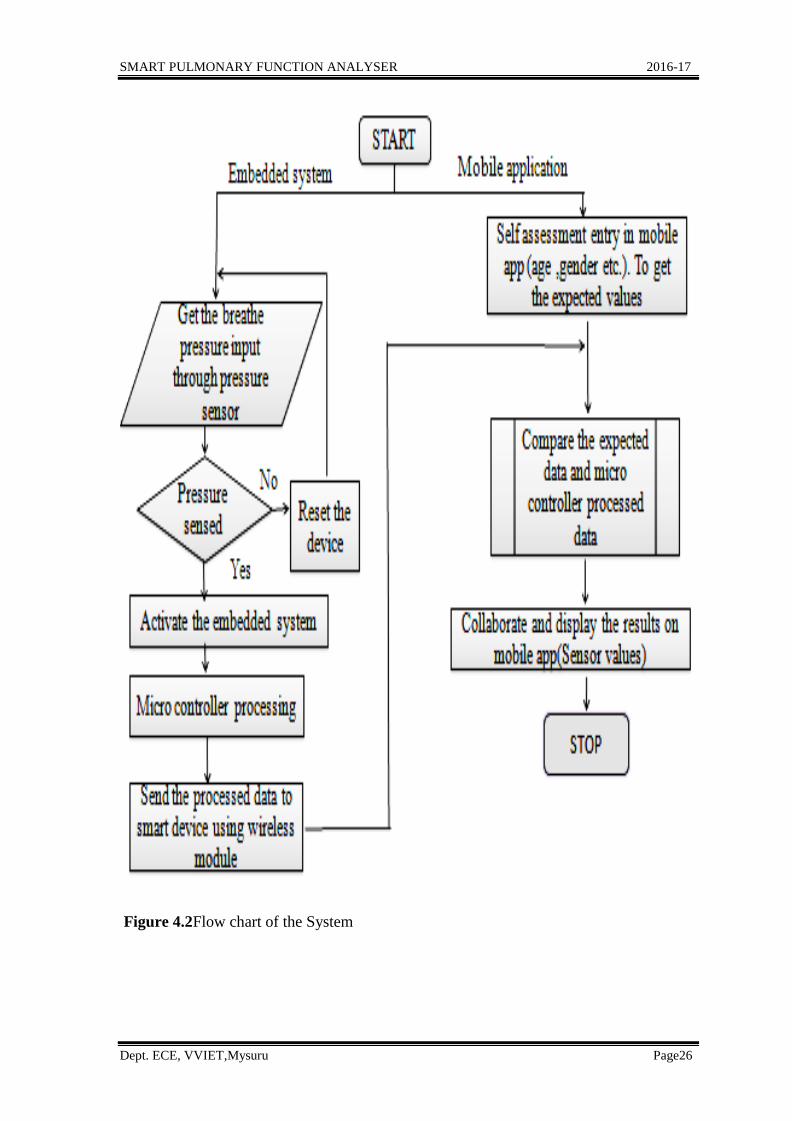
4.3 System Flow
Working and flow chart of Smart Pulmonary Function Analyzer is shown in Figure 4.2
which shows how the system which gives the result for different diseases.
Android source code is released by Google under an open source license, although most
android devices ultimately ship with a combination of free and open source and
proprietary software, including proprietary software required for accessing Google
Services. Android application is developed to receive the data and displays the results in
terms of sensor values. The aspect of the android application involves wirelessly
receiving data from the Spirometer system. The Bluetooth transmitter module was
programmed to transmit packets of data. The primary metrics used for diagnosing
pulmonary illnesses are FVC(Forced Vital Capacity), representing the total volume of air
exhaled, and FEV1(Forced Expiratory Volume in 1 second), representing the amount of
air that can be exhaled in the first second. The ratio FEV1/FVC is used to measure the
obstruction in the airway. Based on regression equations stated in Hankinson et. al, 1999,
the expected EVC and FEV1 values are calculated and compared to the actual values to
distinguish between the illnesses.
In the first step we need to enter the self-assessment of the person. After entering the
database the patient has to blow through the Spirometer, the pressure sensor senses the
air blown by the patient. This data is being fed to the system which is processed by the
microcontroller. The data which is processed is transferred to the smart device which
displays the data as graph. After this test the person has two options they are as follows:
1. If the person wants to update it to cloud then he can upload the same results to the
domain specified, by creating his profile on the domain and save his data.
2. If the person wants it to be saved in his mobile then he can choose that option and
save the results in his mobile
SMART PULMONARY FUNCTION ANALYSER 2016-17
Dept. ECE, VVIET,Mysuru Page26
Figure 4.2Flow chart of the System
SMART PULMONARY FUNCTION ANALYSER 2016-17
Dept. ECE, VVIET,Mysuru Page27
CHAPTER 5
RESULT ANALYSIS AND CONCLUSION
This chapter depicts the technical outcome of the work. The implementation of the
proposed system is discussed in chapter 4. After design and implementation of proposed
methodology, the implemented design has to be tested and verified. Hence, this chapter
contains the results collected in response to the objectives. Also, this chapter provides a
brief introduction about the advantages and disadvantages related to the project and focus
on shortcomings of the project and how project can be enhanced in future to overcome the
shortcomings.
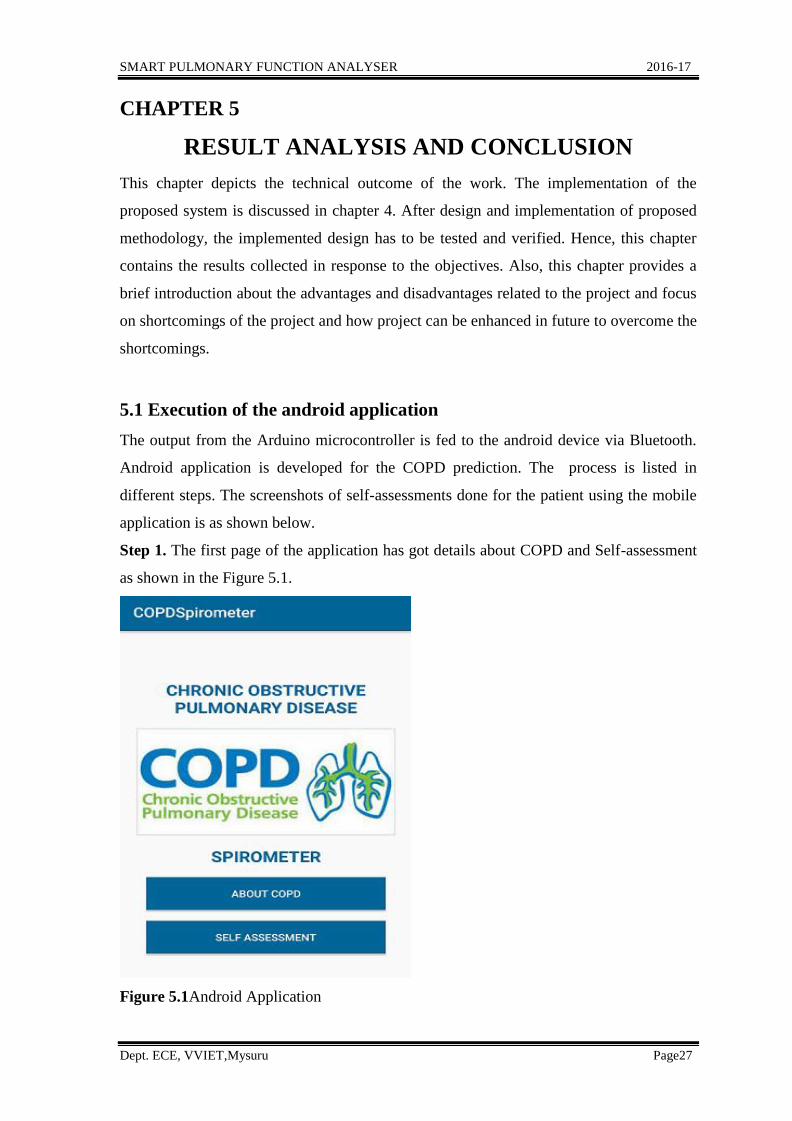
5.1 Execution of the android application
The output from the Arduino microcontroller is fed to the android device via Bluetooth.
Android application is developed for the COPD prediction. The process is listed in
different steps. The screenshots of self-assessments done for the patient using the mobile
application is as shown below.
Step 1. The first page of the application has got details about COPD and Self-assessment
as shown in the Figure 5.1.
Figure 5.1Android Application
SMART PULMONARY FUNCTION ANALYSER 2016-17
Dept. ECE, VVIET,Mysuru Page28
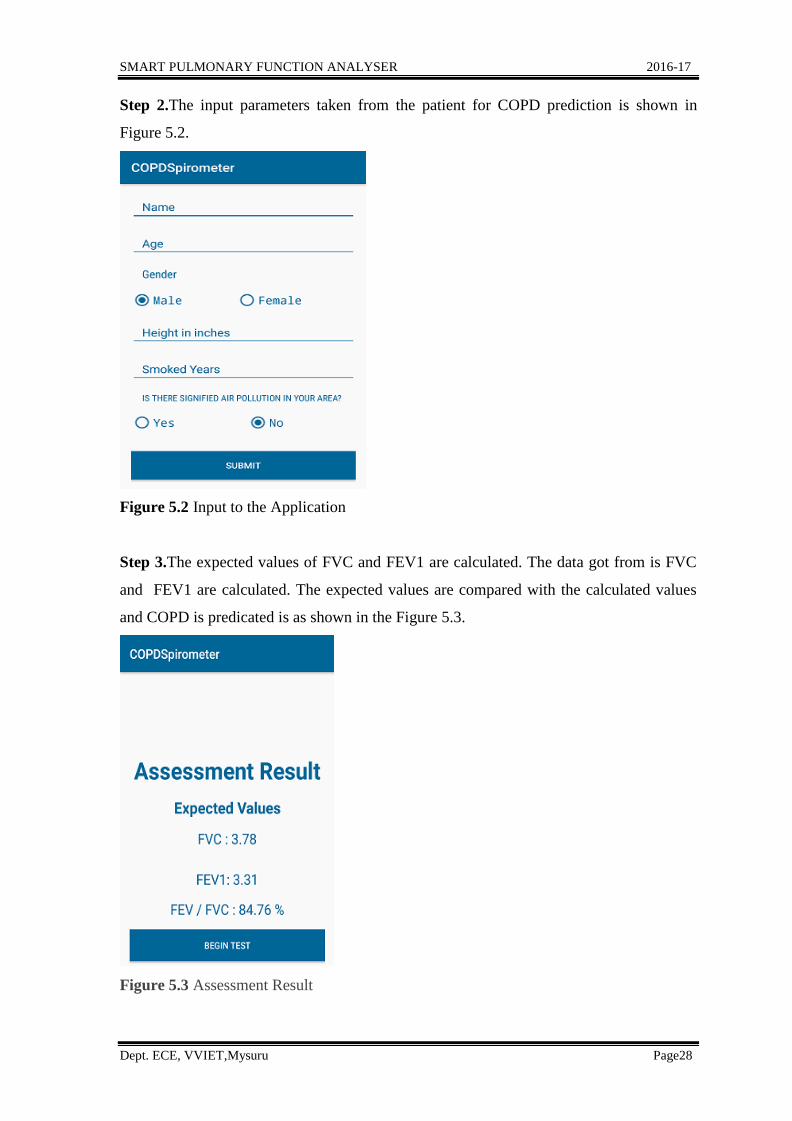
Step 2.The input parameters taken from the patient for COPD prediction is shown in
Figure 5.2.
Figure 5.2 Input to the Application
Step 3.The expected values of FVC and FEV1 are calculated. The data got from is FVC
and FEV1 are calculated. The expected values are compared with the calculated values
and COPD is predicated is as shown in the Figure 5.3.
Figure 5.3 Assessment Result
SMART PULMONARY FUNCTION ANALYSER 2016-17
Dept. ECE, VVIET,Mysuru Page29
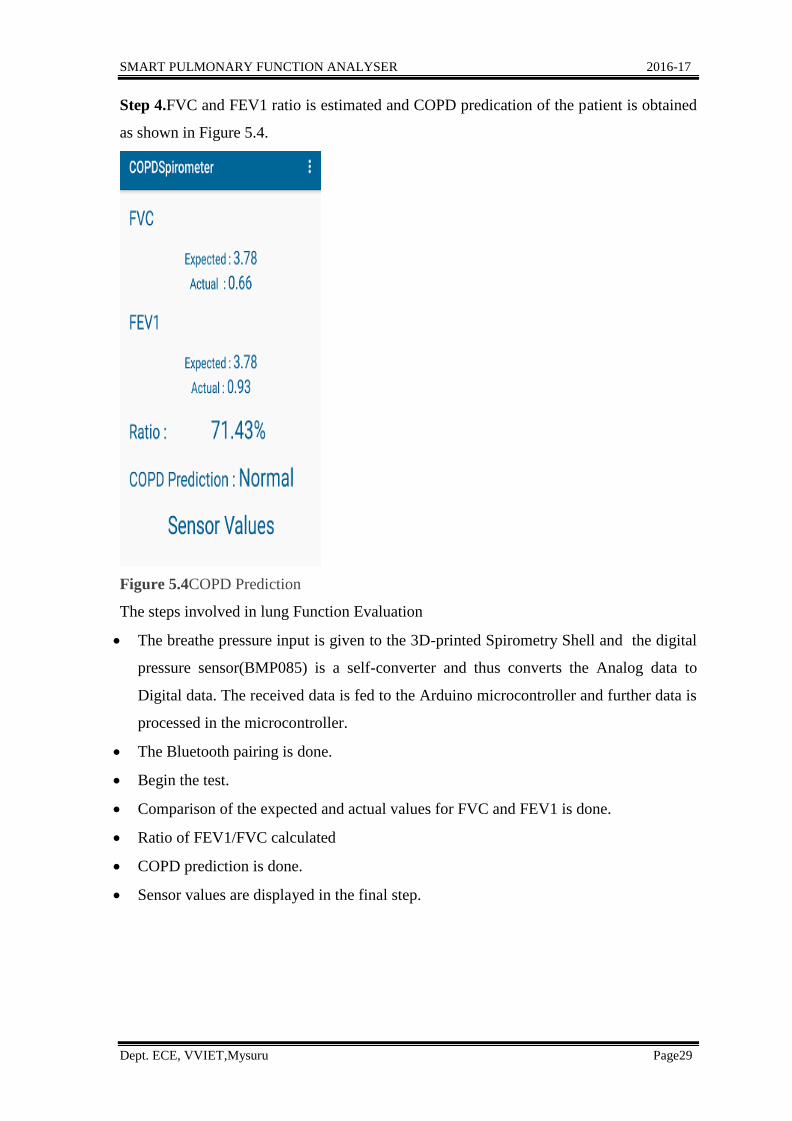
Step 4.FVC and FEV1 ratio is estimated and COPD predication of the patient is obtained
as shown in Figure 5.4.
Figure 5.4COPD Prediction
The steps involved in lung Function Evaluation
The breathe pressure input is given to the 3D-printed Spirometry Shell and the digital
pressure sensor(BMP085) is a self-converter and thus converts the Analog data to
Digital data. The received data is fed to the Arduino microcontroller and further data is
processed in the microcontroller.
The Bluetooth pairing is done.
Begin the test.
Comparison of the expected and actual values for FVC and FEV1 is done.
Ratio of FEV1/FVC calculated
COPD prediction is done.
Sensor values are displayed in the final step.
SMART PULMONARY FUNCTION ANALYSER 2016-17
Dept. ECE, VVIET,Mysuru Page30
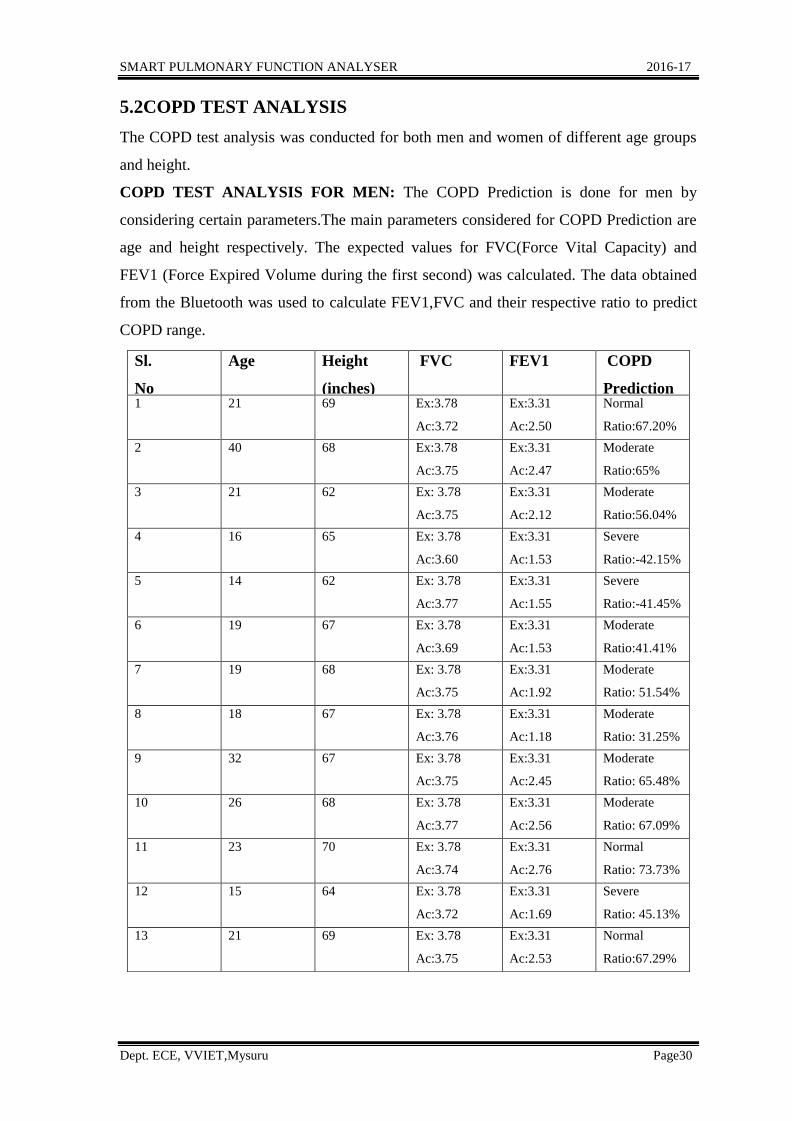
5.2COPD TEST ANALYSIS
The COPD test analysis was conducted for both men and women of different age groups
and height.
COPD TEST ANALYSIS FOR MEN: The COPD Prediction is done for men by
considering certain parameters.The main parameters considered for COPD Prediction are
age and height respectively. The expected values for FVC(Force Vital Capacity) and
FEV1 (Force Expired Volume during the first second) was calculated. The data obtained
from the Bluetooth was used to calculate FEV1,FVC and their respective ratio to predict
COPD range.
Sl.
No
Age Height
(inches)
FVC FEV1 COPD
Prediction 1 21 69 Ex:3.78
Ac:3.72
Ex:3.31
Ac:2.50
Normal
Ratio:67.20%
2 40 68 Ex:3.78
Ac:3.75
Ex:3.31
Ac:2.47
Moderate
Ratio:65%
3 21 62 Ex: 3.78
Ac:3.75
Ex:3.31
Ac:2.12
Moderate
Ratio:56.04%
4 16 65 Ex: 3.78
Ac:3.60
Ex:3.31
Ac:1.53
Severe
Ratio:-42.15%
5 14 62 Ex: 3.78
Ac:3.77
Ex:3.31
Ac:1.55
Severe
Ratio:-41.45%
6 19 67 Ex: 3.78
Ac:3.69
Ex:3.31
Ac:1.53
Moderate
Ratio:41.41%
7 19 68 Ex: 3.78
Ac:3.75
Ex:3.31
Ac:1.92
Moderate
Ratio: 51.54%
8 18 67 Ex: 3.78
Ac:3.76
Ex:3.31
Ac:1.18
Moderate
Ratio: 31.25%
9 32 67 Ex: 3.78
Ac:3.75
Ex:3.31
Ac:2.45
Moderate
Ratio: 65.48%
10 26 68 Ex: 3.78
Ac:3.77
Ex:3.31
Ac:2.56
Moderate
Ratio: 67.09%
11 23 70 Ex: 3.78
Ac:3.74
Ex:3.31
Ac:2.76
Normal
Ratio: 73.73%
12 15 64 Ex: 3.78
Ac:3.72
Ex:3.31
Ac:1.69
Severe
Ratio: 45.13%
13 21 69 Ex: 3.78
Ac:3.75
Ex:3.31
Ac:2.53
Normal
Ratio:67.29%
SMART PULMONARY FUNCTION ANALYSER 2016-17
Dept. ECE, VVIET,Mysuru Page31
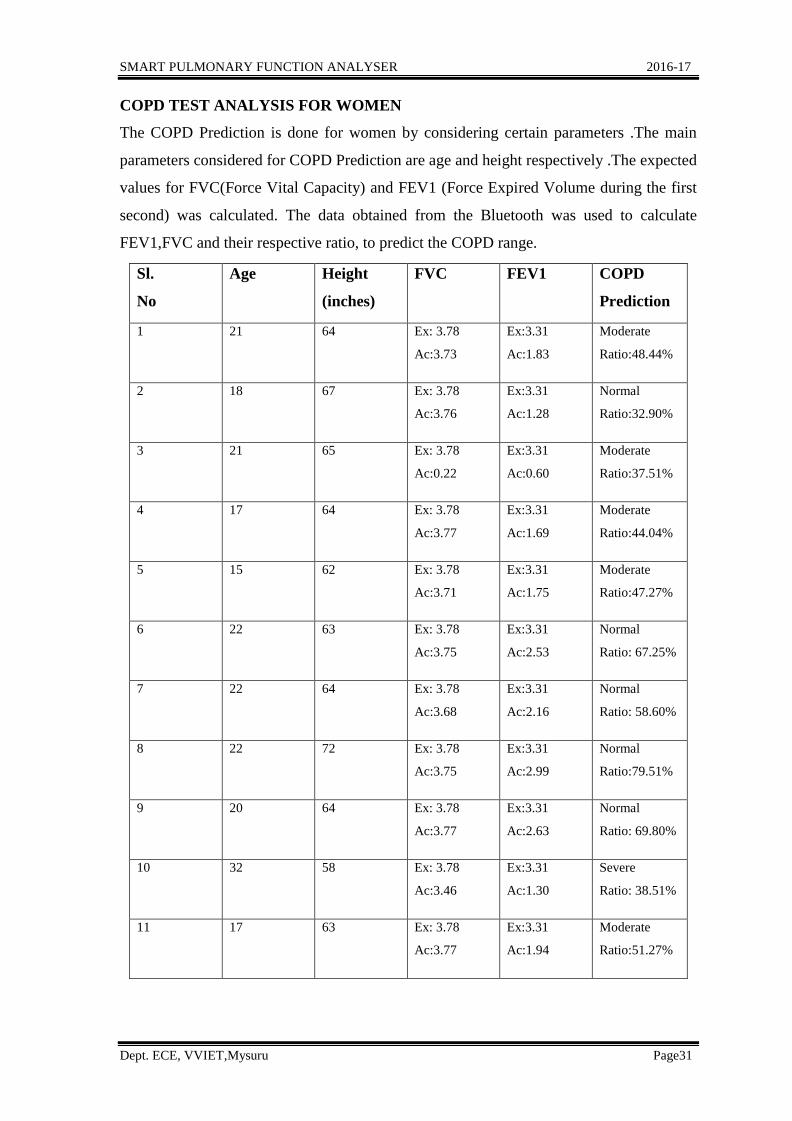
COPD TEST ANALYSIS FOR WOMEN
The COPD Prediction is done for women by considering certain parameters .The main
parameters considered for COPD Prediction are age and height respectively .The expected
values for FVC(Force Vital Capacity) and FEV1 (Force Expired Volume during the first
second) was calculated. The data obtained from the Bluetooth was used to calculate
FEV1,FVC and their respective ratio, to predict the COPD range.
Sl.
No
Age Height
(inches)
FVC FEV1 COPD
Prediction
1 21 64 Ex: 3.78
Ac:3.73
Ex:3.31
Ac:1.83
Moderate
Ratio:48.44%
2 18 67 Ex: 3.78
Ac:3.76
Ex:3.31
Ac:1.28
Normal
Ratio:32.90%
3 21 65 Ex: 3.78
Ac:0.22
Ex:3.31
Ac:0.60
Moderate
Ratio:37.51%
4 17 64 Ex: 3.78
Ac:3.77
Ex:3.31
Ac:1.69
Moderate
Ratio:44.04%
5 15 62 Ex: 3.78
Ac:3.71
Ex:3.31
Ac:1.75
Moderate
Ratio:47.27%
6 22 63 Ex: 3.78
Ac:3.75
Ex:3.31
Ac:2.53
Normal
Ratio: 67.25%
7 22 64 Ex: 3.78
Ac:3.68
Ex:3.31
Ac:2.16
Normal
Ratio: 58.60%
8 22 72 Ex: 3.78
Ac:3.75
Ex:3.31
Ac:2.99
Normal
Ratio:79.51%
9 20 64 Ex: 3.78
Ac:3.77
Ex:3.31
Ac:2.63
Normal
Ratio: 69.80%
10 32 58 Ex: 3.78
Ac:3.46
Ex:3.31
Ac:1.30
Severe
Ratio: 38.51%
11 17 63 Ex: 3.78
Ac:3.77
Ex:3.31
Ac:1.94
Moderate
Ratio:51.27%
SMART PULMONARY FUNCTION ANALYSER 2016-17
Dept. ECE, VVIET,Mysuru Page32
TEST ANALYSIS
The COPD test was conducted for both men and women of different age groups .Based on
the ranges considered COPD was predicted
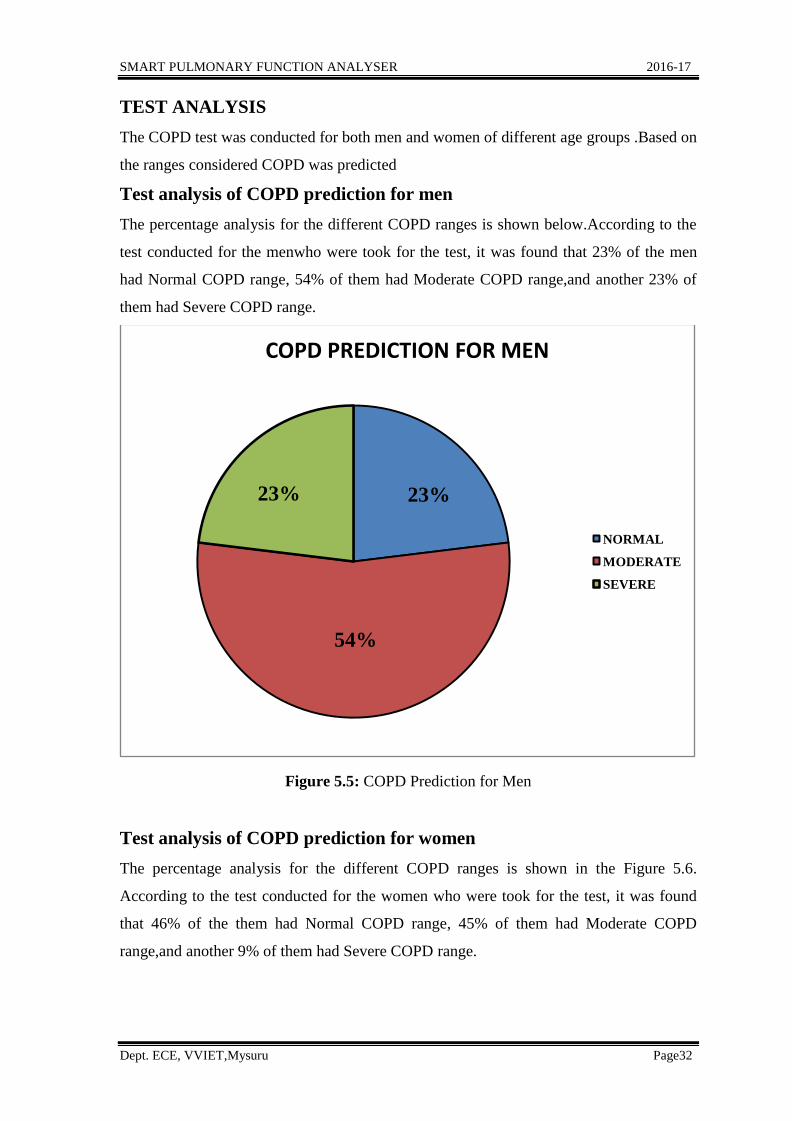
Test analysis of COPD prediction for men
The percentage analysis for the different COPD ranges is shown below.According to the
test conducted for the menwho were took for the test, it was found that 23% of the men
had Normal COPD range, 54% of them had Moderate COPD range,and another 23% of
them had Severe COPD range.
Figure 5.5: COPD Prediction for Men
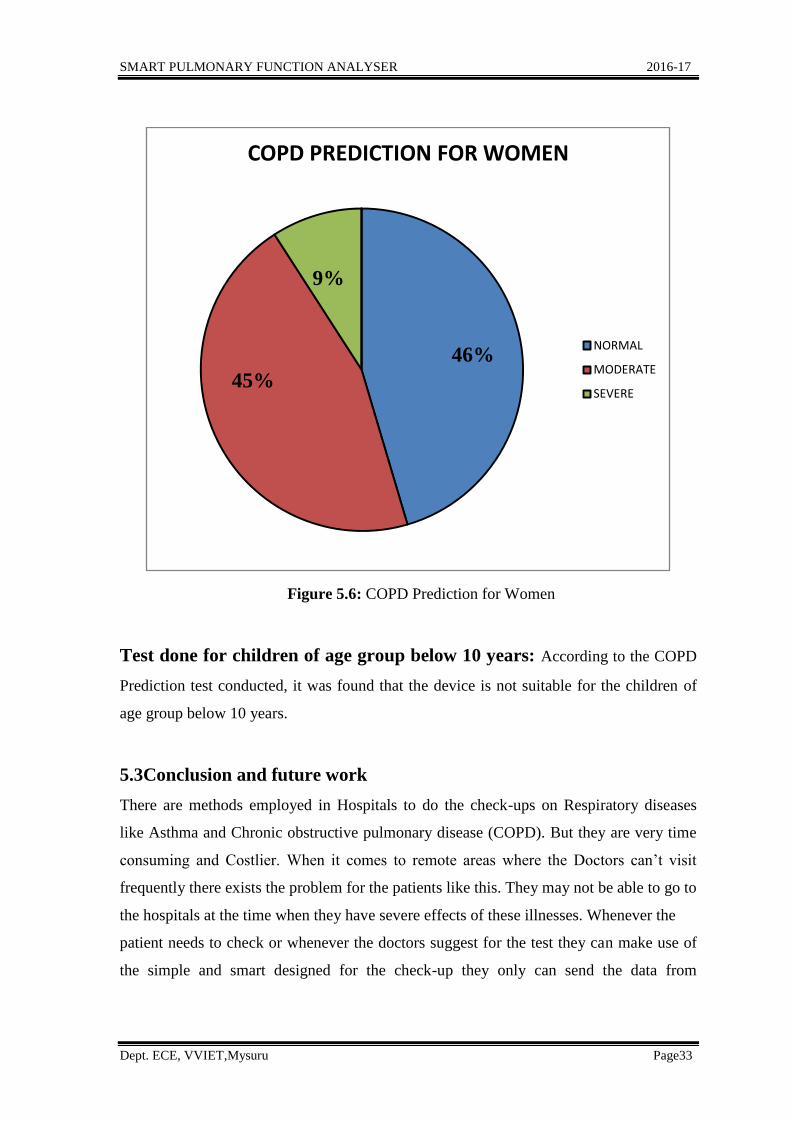
Test analysis of COPD prediction for women
The percentage analysis for the different COPD ranges is shown in the Figure 5.6.
According to the test conducted for the women who were took for the test, it was found
that 46% of the them had Normal COPD range, 45% of them had Moderate COPD
range,and another 9% of them had Severe COPD range.
23%
54%
23%
COPD PREDICTION FOR MEN
NORMAL
MODERATE
SEVERE
SMART PULMONARY FUNCTION ANALYSER 2016-17
Dept. ECE, VVIET,Mysuru Page33
Figure 5.6: COPD Prediction for Women
Test done for children of age group below 10 years: According to the COPD
Prediction test conducted, it was found that the device is not suitable for the children of
age group below 10 years.
5.3Conclusion and future work
There are methods employed in Hospitals to do the check-ups on Respiratory diseases
like Asthma and Chronic obstructive pulmonary disease (COPD). But they are very time
consuming and Costlier. When it comes to remote areas where the Doctors can’t visit
frequently there exists the problem for the patients like this. They may not be able to go to
the hospitals at the time when they have severe effects of these illnesses. Whenever the
patient needs to check or whenever the doctors suggest for the test they can make use of
the simple and smart designed for the check-up they only can send the data from
46%
45%
9%
COPD PREDICTION FOR WOMEN
NORMAL
MODERATE
SEVERE
SMART PULMONARY FUNCTION ANALYSER 2016-17
Dept. ECE, VVIET,Mysuru Page34
wherever they are irrespective of time and place. Since the device is small in size they can
be carried with them.
Smartphone users around the globe are expanding every year. For most of all
purpose people are relying on smart devices. As it is handy now researches are linking
module with smart application. For the benefits patients many applications have been
developed in healthcare domain but here concentrating only on the spirometry
monitoring. With the increasing proliferation of Internet-Connected Smartphone's across
the world, low-cost smartphone-based medical devices are now attractive alternate to
traditional custom-made medical equipment, especially in developing countries. So this
project encourages easy and reassuring use and is of low-cost and used for routine
respiratory health checks at home. The spirometry equipment used in hospitals for
pulmonary function testing costs thousands of dollars, which is beyond the means of
health care facilities in many countries. The Smart pulmonary function analyser designed
in this project will be of low cost and encourages easy and reassuring use. It gives a fast
detection of possibility of pulmonary restrictions and obstructions. It can be operated
regardless of time and place. It can also be used to provide real-on-time analysis and tale
medicine opportunities in remote areas. The device can be used in patient’s own home for
routine respiratory health check.
Advantages
1. Since the device is small in size it can be used everywhere.
2. The device is portable and can be carried with the patients for routine check-ups.
3. The device is cheap compared to the tests conducted in the Hospitals.
4. It can give accurate results as of the devices used in Hospitals.
Disadvantages
1. Since the data sent through the Bluetooth is un-encrypted these data can be easily
manipulated.
2. Since it’s still a prototype module it can lead to some damage when we carry
without any extra care.
Limitation
1.Device is not suitable for the children below the age group of 10 years.
SMART PULMONARY FUNCTION ANALYSER 2016-17
Dept. ECE, VVIET,Mysuru Page35
REFERENCES
[1] Larson, E.C., Lee, T., Liu, S., Rosenfeld, M., and Patel, S.N. Accurateand Privacy
Preserving Cough Sensing using a Low-Cost Microphone. Proceedings of the 13th
ACM international conference onUbiquitous computing, (2011).
[2] Majchrzak, T. and Chakravorty, A. Improving the Compliance ofTransplantation
Medicine Patients with an Integrated Mobile System.International Conference on
System Sciences, (2012).
[3] Miller, M.R., Hankinson, J., Brusasco, V., et al. Standardisation ofspirometry. The
European Respiratory Journal 26, 2 (2005).
[4] MiravitallesS, M., Murio, C., Guerrero, T., and Gisbert, R. Pharmacoeconomic
evaluation of acute exacerbations of chronic bronchitis andCOPD. Chest 121, 5,
1449-1455.
[5] Neuman, M.R. Vital Signs: Heart Rate. Pulse, IEEE 1, 3 (2010).
[6] Nishimura, J. and Kuroda, T. Eating habits monitoring using wirelesswearable in-
ear microphone. ISWPC 2008, (2008).
[7] Otulana, B., Higenbottam, T., Ferrari, L., Scott, J., Igboaka, G., andWallwork, J.
The use of home spirometry in detecting acute lung rejection and infection
following heart-lung transplantation. Chest 97, 2(1990).
[8] Pamplona, V.F., Mohan, A., Oliveira, M.M., and Raskar, R. NETRA:interactive
display for estimating refractive errors and focal range.SIGGRAPH’10, ACM
(2010), 77:1--77:8.
[9] Pesola, G., O’Donnell, P., and Jr, G.P. Peak expiratory flow in normals: comparison
of the Mini Wright versus spirometricpredictedpeak flows. Journal of Asthma, 4
(2009), 845-848.
[10] Poh, M.-Z., McDuff, D.J., and Picard, R.W. Non-contact, automatedcardiac pulse
measurements using video imaging and blind sourceseparation. Opt. Express 18, 10
(2010).
[11] Poh, M.-Z., Swenson, N.C., and Picard, R.W. Motion-Tolerant Magnetic Earring
Sensor and Wireless Earpiece for Wearable Photoplethysmography. Information
Technology in Biomedicine, IEEE Transactions on 14, 3 (2010).
[12] Rebuck, D. a., Hanania, N. a., D’Urzo, a. D., and Chapman, K.R. TheAccuracy of a
Handheld Portable Spirometer. Chest 109, 1 (1996).
SMART PULMONARY FUNCTION ANALYSER 2016-17
Dept. ECE, VVIET,Mysuru Page36
[13] Rubini, A., Parmagnani, A., Redaelli, M., Bondì, M., Del Monte, D.,and Catena, V.
Daily variations of spirometric indexes and maximumexpiratory pressure in young
healthy adults. Biological Rhythm Research 41, 2 (2010).
[14] Savitzky, A. and Golay, M.J.E. Smoothing and Differentiation of Databy Simplified
Least Squares Procedures. Analytical Chemistry 36, 8(1964).
[15] Seemungal, T. a, Donaldson, G.C., Bhowmik, A., Jeffries, D.J., andWedzicha, J. a.
Time course and recovery of exacerbations in patientswith chronic obstructive
pulmonary disease. American jousrnal of respiratory and critical care medicine 161,
5 (2000).
[16] Sevick, M., Trauth, J., Ling, B., et al. Patients with Complex ChronicDiseases:
Perspectives on Supporting Self-Management. Journal ofGeneral Internal Medicine
22, 0 (2007).
[17] Swanney, M.P., Ruppel, G., Enright, P.L., et al. Using the lower limitof normal for
the FEV1/FVC ratio reduces the misclassification ofairway obstruction. Thorax 63,
12 (2008).
[18] Townsend, M.C. Spirometry in the occupational health setting. Journal of
occupational and environmental medicine AmericanCollegeof Occupational and
Environmental Medicine 53, 5 (2011).
[19] Wakita, H. Direct estimation of the vocal tract shape by inverse filtering of acoustic
speech waveforms. Audio and Electroacoustics, IEEETransactions on 21, 5 (1973),
417–427.
[20] Walters, J., Woodibaker, R., and Walls, J. Stability of the EasyOneultrasonic
spirometer for use in general practice. Respirology 11, 3(2006).
[21] Ölmez, T. and Dokur, Z. Classification of heart sounds using an artificial neural
network. Pattern Recognition Letters 24, 1–3 (2003).
SMART PULMONARY FUNCTION ANALYSER 2016-17
Dept. ECE, VVIET,Mysuru Page37
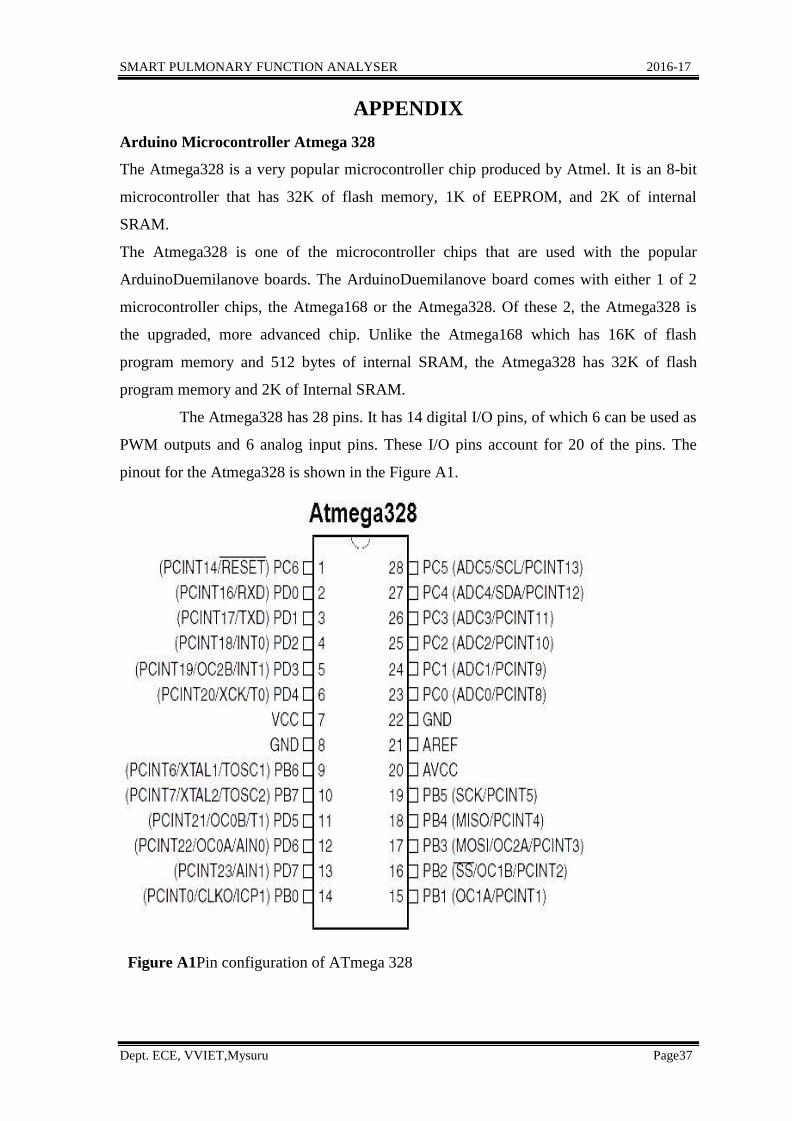
APPENDIX
Arduino Microcontroller Atmega 328
The Atmega328 is a very popular microcontroller chip produced by Atmel. It is an 8-bit
microcontroller that has 32K of flash memory, 1K of EEPROM, and 2K of internal
SRAM.
The Atmega328 is one of the microcontroller chips that are used with the popular
ArduinoDuemilanove boards. The ArduinoDuemilanove board comes with either 1 of 2
microcontroller chips, the Atmega168 or the Atmega328. Of these 2, the Atmega328 is
the upgraded, more advanced chip. Unlike the Atmega168 which has 16K of flash
program memory and 512 bytes of internal SRAM, the Atmega328 has 32K of flash
program memory and 2K of Internal SRAM.
The Atmega328 has 28 pins. It has 14 digital I/O pins, of which 6 can be used as
PWM outputs and 6 analog input pins. These I/O pins account for 20 of the pins. The
pinout for the Atmega328 is shown in the Figure A1.
Figure A1Pin configuration of ATmega 328
SMART PULMONARY FUNCTION ANALYSER 2016-17
Dept. ECE, VVIET,Mysuru Page38
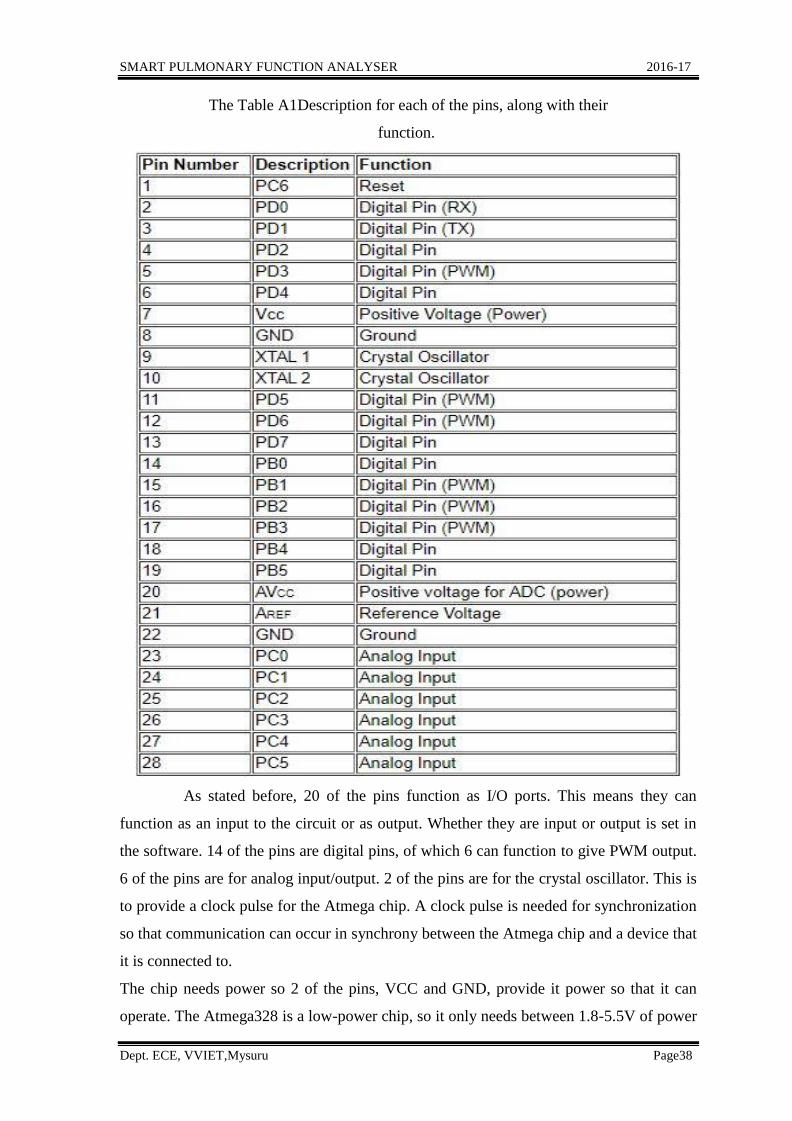
The Table A1Description for each of the pins, along with their
function.
As stated before, 20 of the pins function as I/O ports. This means they can
function as an input to the circuit or as output. Whether they are input or output is set in
the software. 14 of the pins are digital pins, of which 6 can function to give PWM output.
6 of the pins are for analog input/output. 2 of the pins are for the crystal oscillator. This is
to provide a clock pulse for the Atmega chip. A clock pulse is needed for synchronization
so that communication can occur in synchrony between the Atmega chip and a device that
it is connected to.
The chip needs power so 2 of the pins, VCC and GND, provide it power so that it can
operate. The Atmega328 is a low-power chip, so it only needs between 1.8-5.5V of power
SMART PULMONARY FUNCTION ANALYSER 2016-17
Dept. ECE, VVIET,Mysuru Page39
to operate.The Atmega328 wouldn't be capable of interpreting analog signals. Because
there is an ADC, the chip can interpret analog input, which is why the chip has 6 pins for
analog input. The ADC has 3 pins set aside for it to function- AVCC, AREF, and GND.
AVCC is the power supply, positive voltage, that for the ADC. The ADC needs its own
power supply in order to work. GND is the power supply ground. AREF is the reference
voltage that the ADC uses to convert an analog signal to its corresponding digital value.
Analog voltages higher than the reference voltage will be assigned to a digital value of 1,
while analog voltages below the reference voltage will be assigned the digital value of 0.
Since the ADC for the Atmega328 is a 10-bit ADC, meaning it produces a 10-bit digital
value, it converts an analog signal to its digital value, with the AREF value being a
reference for which digital values are high or low. Thus, a portrait of an analog signal is
shown by this digital value; thus, it is its digital correspondent value. The last pin is the
RESET pin. This allows a program to be rerun and start over.And this sums up the pinout
of an Atmega328 chip.
Pressure sensor GY-65
The BMP085 offers a measuring range of 300 to 1100 hPa with an absolute accuracy of
down to 0.03 hPa. It's based on piezo-resistive technology for EMC robustness, high
accuracy and linearity as well as long term stability. This sensor supports a voltage supply
between 1.8 and 3.6VDC. It is designed to be connected directly to a micro-controller via
the I²C bus.This board breaks out all pins of the BMP085 to a 4-pin 0.1" pitch header and
also features put two 10k pull-up resistors on the I2C lines.
Features:
1. Digital two wire (I2C) interface
2. Wide barometric pressure range
3. Flexible supply voltage range
4. Ultra-low power consumption
5. Low noise measurement
6. Fully calibrated Temperature measurement included Ultra-flat, small footprint
7. Supplied with sensor cable (240mm)
8. Dimensions: 15.2 x 15.2mm
SMART PULMONARY FUNCTION ANALYSER 2016-17
Dept. ECE, VVIET,Mysuru Page40
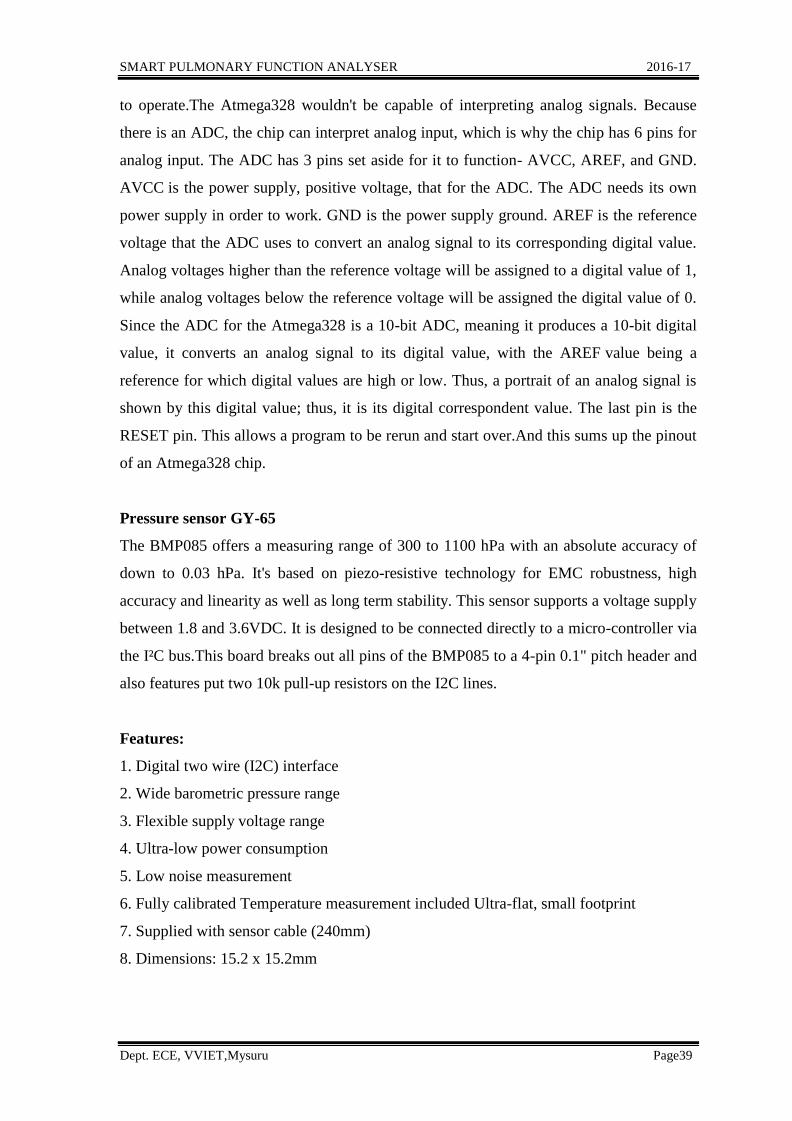
Figure A2 Pin Configuration of Pressure Sensor
Table A2Pin functions and types
Bluetooth HC-05
HC‐05 module is an easy to use Bluetooth SPP (Serial Port Protocol) module, designed
for transparent wireless serial connection setup. The HC-05 Bluetooth Module can be
used in a Master or Slave configuration, making it a great solution for wireless
communication. This serial port Bluetooth module is fully qualified Bluetooth V2.0+EDR
(Enhanced Data Rate)3Mbps Modulation with complete 2.4GHz radio transceiver and
SMART PULMONARY FUNCTION ANALYSER 2016-17
Dept. ECE, VVIET,Mysuru Page41
baseband. It uses CSR Blue core 04‐External single chip Bluetooth system with CMOS
technology and with AFH (Adaptive Frequency Hopping Feature).
Hardware Features
Typical ‐80dBm sensitivity.
Up to +4dBm RF transmit power.
3.3 to 5 V I/O.
PIO(Programmable Input/ Output) control.
UART interface with programmable baud rate.
With integrated antenna.
With edge connector.
Software Features
Slave default Baud rate: 9600, Data bits:8, Stop bit:1,Parity:No parity.
Auto‐connect to the last device on power as default.
Permit pairing device to connect as default.
Auto‐pairing PINCODE:”1234” as default.
SMART PULMONARY FUNCTION ANALYSER 2016-17
Dept. ECE, VVIET,Mysuru Page42
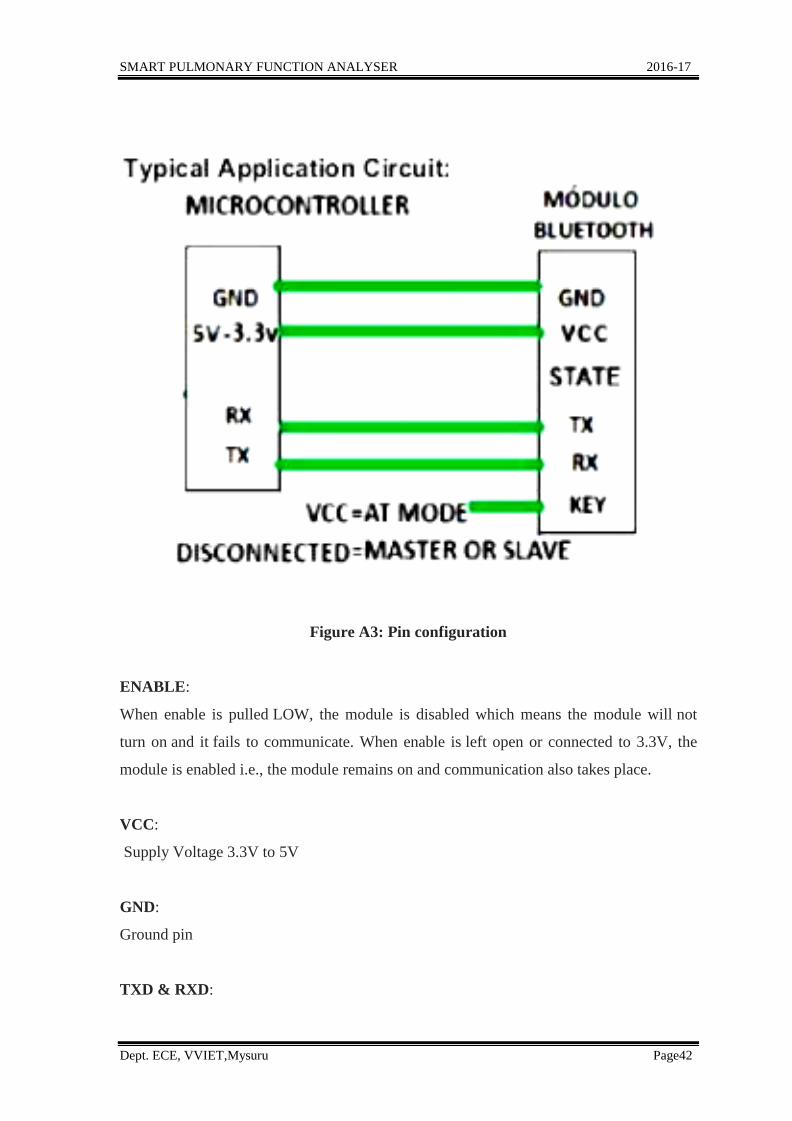
Figure A3: Pin configuration
ENABLE:
When enable is pulled LOW, the module is disabled which means the module will not
turn on and it fails to communicate. When enable is left open or connected to 3.3V, the
module is enabled i.e., the module remains on and communication also takes place.
VCC:
Supply Voltage 3.3V to 5V
GND:
Ground pin
TXD & RXD:
SMART PULMONARY FUNCTION ANALYSER 2016-17
Dept. ECE, VVIET,Mysuru Page43
These two pins acts as an UART interface for communication
STATE:
It acts as a status indicator. When the module is not connected to / paired with any other
Bluetooth device, signal goes Low. At this low state, the led flashes continuously which
denotes that the module is not paired with other device. When this module is connected
to/paired with any other Bluetooth device, the signal goes High. At this high state, the led
blinks with a constant delay say for example 2s delay which indicates that the module
is paired.
BUTTON SWITCH:
This is used to switch the module into AT command mode. To enable AT command
mode, press the button switch for a second. With the help of AT commands, the user can
change the parameters of this module but only when the module is not paired with any
other BT device. If the module is connected to any other Bluetooth device, it starts to
communicate with that device and fails to work in AT command mode.