Modelling an Institutional Mobile Learning Readiness Analyser
8
Journal of Education and Practice www.iiste.org ISSN 2222-1735 (Paper) ISSN 2222-288X (Online) Vol.6, No.5, 2015 104 Modelling an Institutional Mobile Learning Readiness Analyser Bonface Ngari Ireri 1* Elijah I. Omwenga 2 1.CIT department, Africa Nazarene University PO box 53067-00200, Nairobi, Kenya 2.School of Computing & informatics, University of Nairobi PO box 30197-00100, Nairobi, Kenya * E-mail of the corresponding author: [email protected] The research was financed by National Commission for Science, Technology and Innovation (P. O. Box 30623, 00100 Nairobi KENYA email: [email protected] ) Abstract Due to the affordability, ease of use and availability of mobile devices, many people in Africa and developing countries have acquired at least a mobile device. The penetration of mobile devices places many learning institution in a position to adopt mobile learning, however there are few tools for measuring mobile learning readiness for an institution. The research work presented by this paper has developed a method or framework to be a tool for measuring the mobile learning readiness. The Kenya Education Network (KENET) e-readiness framework was modified through a logical framework to fit mobile indicators. Staging method used had value 1as least while 4 as the best. An institution of higher learning (University) was used to validate the framework. A survey results used revealed the institution was ready to adopt mobile learning as a means of delivering teaching and learning. The institution scored a mobile learning readiness index of 2.61 above the benchmark of 2.5 set by KENET. The researcher recommends use of mobile learning readiness framework to all learning institutions intending to implement mobile learning. Keywords: Mobile Learning, Readiness index, Distance Learners, KENET 1. Introduction Mobile Learning can be defined as any sort of learning that take place when the learner is not at a fixed, predetermined location or learning that takes place anytime and anywhere when the learner takes advantage of the learning opportunities offered by mobile technologies (O’Malley et al.2003). Mobile learning readiness involves institutional readiness (Kashoda & Waema, 2002) and student and faculty ownership, use, and readiness for mobile learning (Corbeil, J. R., & Valdes-Corbeil, M. E. 2007). Many learning institutions in Africa need to assess their readiness despite the facts of high penetrations of mobile devices. According to Ericsson Mobility Report of June 2013, Africa has 775 million subscribers 27% of the world mobile subscription with a penetration of 75%. Kenya has a mobile penetration slightly above 70% (CCK, 2014) and all Kenyan university students own a mobile device (Ireri & Omwenga, 2014). In order to evaluate mobile readiness, many factors are used. One of them is technological readiness by the learner, institution and instructors (Wagner, 2005), Technology Acceptance Model (Davis, 1989) and Concerns-Based Adoption Model (Hord, Rutherford, Huling-Austin, & Hall, 1987). The latter two are used when implementing technological new modes of learning but technological readiness is used during planning and designing of an educational technology. 2. Research Question This research was motivated to answer the question, which indicators are appropriate to determine whether an institution is ready to adopt mobile learning? 3. Methodology This research survey was done in Kenya, Africa. A Kenyan university was purposefully sampled. The university offers its programs through three main modes, i.e. Day (regular), School-based, and Distance learning. The survey targeted 1800 learners in the selected institution where a sample was obtained. The target population was distributed as follows: - Day and Evening 1000 learners, School based 600 learners and, 200 distance learners. To determine sample size, a formula for computing samples of finite population and also for infinite population as provided for by Kothari (2011) and Mugenda (2008) was used. For finite population formula was used. According to Mugenda, the infinite population formula can be used if population is greater than ten thousands; therefore, since the population targeted is finite the first formula was used to do sampling. In the formula, n is the sample size desired, z is standard normal deviation at the required confident level, p is the proportion in the target population estimated to have the characteristics, q=1-p and e is the level of statistical significance. brought to you by CORE View metadata, citation and similar papers at core.ac.uk provided by International Institute for Science, Technology and Education (IISTE): E-Journals
-
Upload
khangminh22 -
Category
Documents
-
view
0 -
download
0
Transcript of Modelling an Institutional Mobile Learning Readiness Analyser
Journal of Education and Practice www.iiste.org
ISSN 2222-1735 (Paper) ISSN 2222-288X (Online)
Vol.6, No.5, 2015
104
Modelling an Institutional Mobile Learning Readiness Analyser
Bonface Ngari Ireri 1*
Elijah I. Omwenga 2
1.CIT department, Africa Nazarene University PO box 53067-00200, Nairobi, Kenya
2.School of Computing & informatics, University of Nairobi PO box 30197-00100, Nairobi, Kenya
* E-mail of the corresponding author: [email protected]
The research was financed by National Commission for Science, Technology and Innovation (P. O. Box 30623,
00100 Nairobi KENYA email: [email protected] )
Abstract
Due to the affordability, ease of use and availability of mobile devices, many people in Africa and developing
countries have acquired at least a mobile device. The penetration of mobile devices places many learning
institution in a position to adopt mobile learning, however there are few tools for measuring mobile learning
readiness for an institution. The research work presented by this paper has developed a method or framework to
be a tool for measuring the mobile learning readiness. The Kenya Education Network (KENET) e-readiness
framework was modified through a logical framework to fit mobile indicators. Staging method used had value
1as least while 4 as the best. An institution of higher learning (University) was used to validate the framework. A
survey results used revealed the institution was ready to adopt mobile learning as a means of delivering teaching
and learning. The institution scored a mobile learning readiness index of 2.61 above the benchmark of 2.5 set by
KENET. The researcher recommends use of mobile learning readiness framework to all learning institutions
intending to implement mobile learning.
Keywords: Mobile Learning, Readiness index, Distance Learners, KENET
1. Introduction
Mobile Learning can be defined as any sort of learning that take place when the learner is not at a fixed,
predetermined location or learning that takes place anytime and anywhere when the learner takes advantage of
the learning opportunities offered by mobile technologies (O’Malley et al.2003). Mobile learning readiness
involves institutional readiness (Kashoda & Waema, 2002) and student and faculty ownership, use, and readiness
for mobile learning (Corbeil, J. R., & Valdes-Corbeil, M. E. 2007). Many learning institutions in Africa need to
assess their readiness despite the facts of high penetrations of mobile devices.
According to Ericsson Mobility Report of June 2013, Africa has 775 million subscribers 27% of the
world mobile subscription with a penetration of 75%. Kenya has a mobile penetration slightly above 70%
(CCK, 2014) and all Kenyan university students own a mobile device (Ireri & Omwenga, 2014).
In order to evaluate mobile readiness, many factors are used. One of them is technological readiness by
the learner, institution and instructors (Wagner, 2005), Technology Acceptance Model (Davis, 1989) and
Concerns-Based Adoption Model (Hord, Rutherford, Huling-Austin, & Hall, 1987). The latter two are used
when implementing technological new modes of learning but technological readiness is used during planning
and designing of an educational technology.
2. Research Question
This research was motivated to answer the question, which indicators are appropriate to determine whether an
institution is ready to adopt mobile learning?
3. Methodology
This research survey was done in Kenya, Africa. A Kenyan university was purposefully sampled. The university
offers its programs through three main modes, i.e. Day (regular), School-based, and Distance learning. The
survey targeted 1800 learners in the selected institution where a sample was obtained. The target population was
distributed as follows: - Day and Evening 1000 learners, School based 600 learners and, 200 distance learners.
To determine sample size, a formula for computing samples of finite population and also for infinite population
as provided for by Kothari (2011) and Mugenda (2008) was used.
For finite population formula was used. According to Mugenda, the infinite
population formula can be used if population is greater than ten thousands; therefore, since the
population targeted is finite the first formula was used to do sampling.
In the formula, n is the sample size desired, z is standard normal deviation at the required confident
level, p is the proportion in the target population estimated to have the characteristics, q=1-p and e is the level of
statistical significance.
brought to you by COREView metadata, citation and similar papers at core.ac.uk
provided by International Institute for Science, Technology and Education (IISTE): E-Journals
Journal of Education and Practice www.iiste.org
ISSN 2222-1735 (Paper) ISSN 2222-288X (Online)
Vol.6, No.5, 2015
105
Table 1 summarizes the samples used as computed by the formula.
Table 1: Table of Calculated and Used Samples
From table 1, the sampled population was give questionnaires to fill
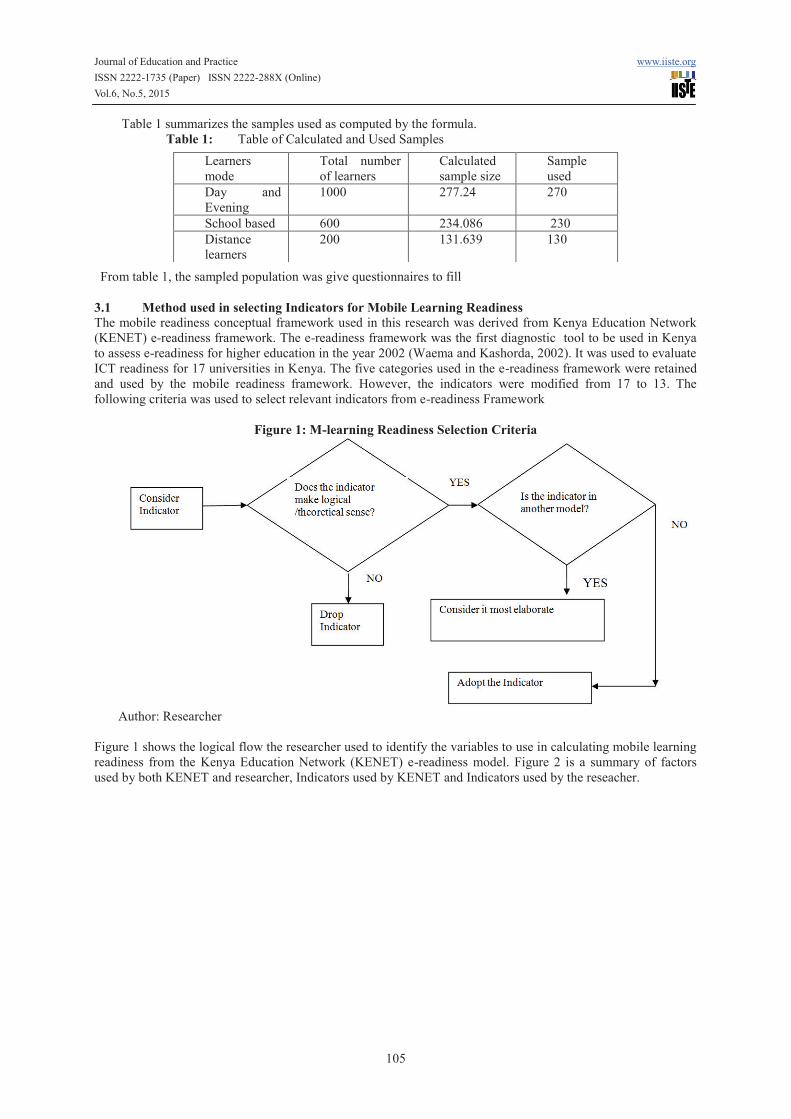
3.1 Method used in selecting Indicators for Mobile Learning Readiness
The mobile readiness conceptual framework used in this research was derived from Kenya Education Network
(KENET) e-readiness framework. The e-readiness framework was the first diagnostic tool to be used in Kenya
to assess e-readiness for higher education in the year 2002 (Waema and Kashorda, 2002). It was used to evaluate
ICT readiness for 17 universities in Kenya. The five categories used in the e-readiness framework were retained
and used by the mobile readiness framework. However, the indicators were modified from 17 to 13. The
following criteria was used to select relevant indicators from e-readiness Framework
Figure 1: M-learning Readiness Selection Criteria
Author: Researcher
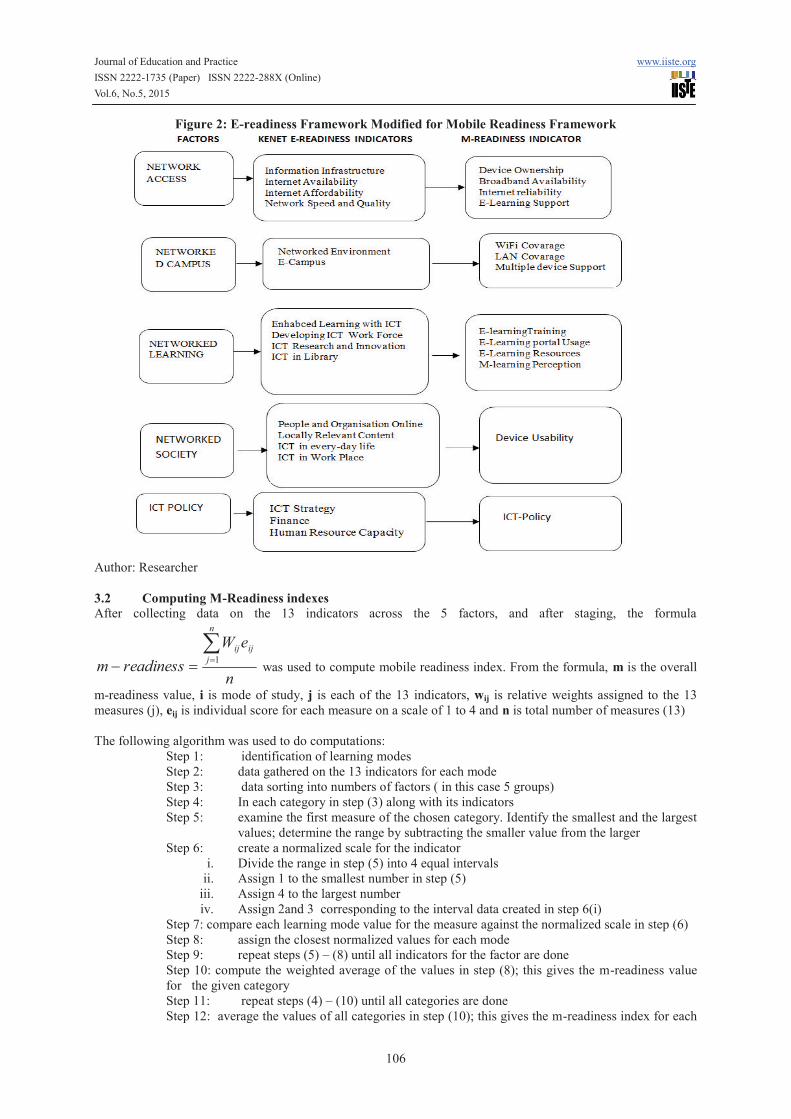
Figure 1 shows the logical flow the researcher used to identify the variables to use in calculating mobile learning
readiness from the Kenya Education Network (KENET) e-readiness model. Figure 2 is a summary of factors
used by both KENET and researcher, Indicators used by KENET and Indicators used by the reseacher.
Learners
mode
Total number
of learners
Calculated
sample size
Sample
used
Day and
Evening
1000 277.24 270
School based 600 234.086 230
Distance
learners
200 131.639 130
Journal of Education and Practice www.iiste.org
ISSN 2222-1735 (Paper) ISSN 2222-288X (Online)
Vol.6, No.5, 2015
106
Figure 2: E-readiness Framework Modified for Mobile Readiness Framework
Author: Researcher
3.2 Computing M-Readiness indexes
After collecting data on the 13 indicators across the 5 factors, and after staging, the formula
n
eW
readinessm
n
j
ijijå=
=-1
was used to compute mobile readiness index. From the formula, m is the overall
m-readiness value, i is mode of study, j is each of the 13 indicators, wij is relative weights assigned to the 13
measures (j), eij is individual score for each measure on a scale of 1 to 4 and n is total number of measures (13)
The following algorithm was used to do computations:
Step 1: identification of learning modes
Step 2: data gathered on the 13 indicators for each mode
Step 3: data sorting into numbers of factors ( in this case 5 groups)
Step 4: In each category in step (3) along with its indicators
Step 5: examine the first measure of the chosen category. Identify the smallest and the largest
values; determine the range by subtracting the smaller value from the larger
Step 6: create a normalized scale for the indicator
i. Divide the range in step (5) into 4 equal intervals
ii. Assign 1 to the smallest number in step (5)
iii. Assign 4 to the largest number
iv. Assign 2and 3 corresponding to the interval data created in step 6(i)
Step 7: compare each learning mode value for the measure against the normalized scale in step (6)
Step 8: assign the closest normalized values for each mode
Step 9: repeat steps (5) – (8) until all indicators for the factor are done
Step 10: compute the weighted average of the values in step (8); this gives the m-readiness value
for the given category
Step 11: repeat steps (4) – (10) until all categories are done
Step 12: average the values of all categories in step (10); this gives the m-readiness index for each
Journal of Education and Practice www.iiste.org
ISSN 2222-1735 (Paper) ISSN 2222-288X (Online)
Vol.6, No.5, 2015
107
learning mode.
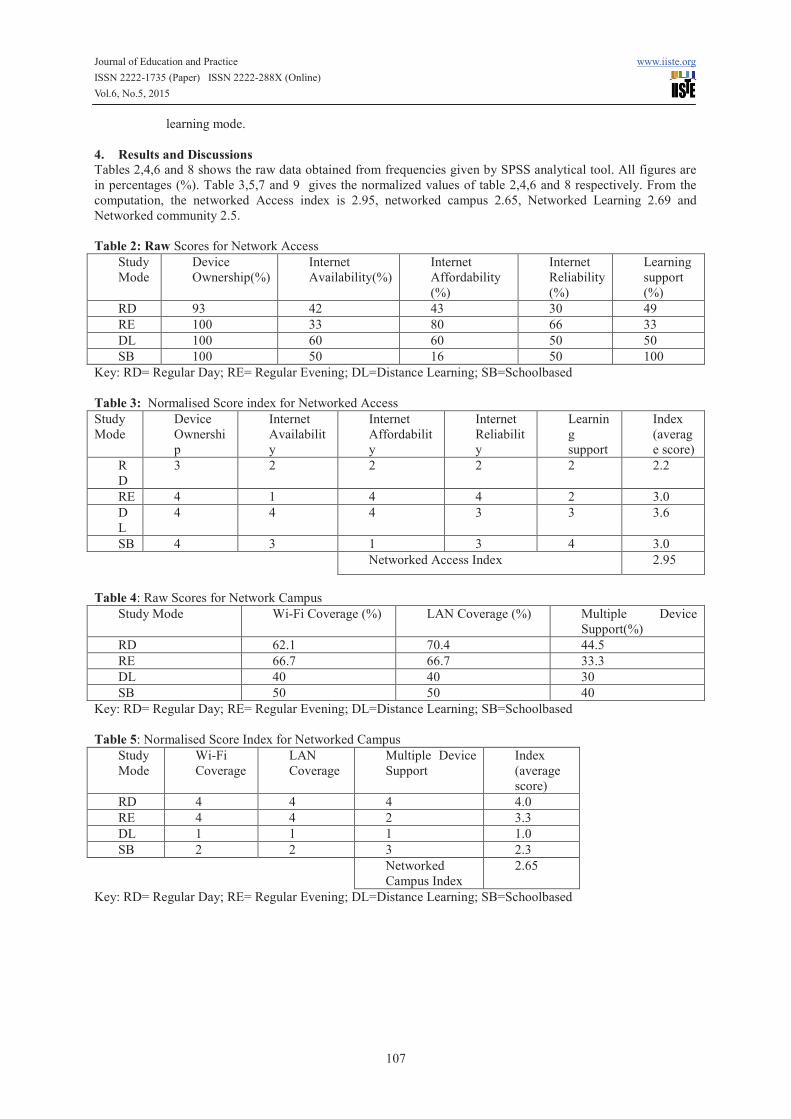
4. Results and Discussions
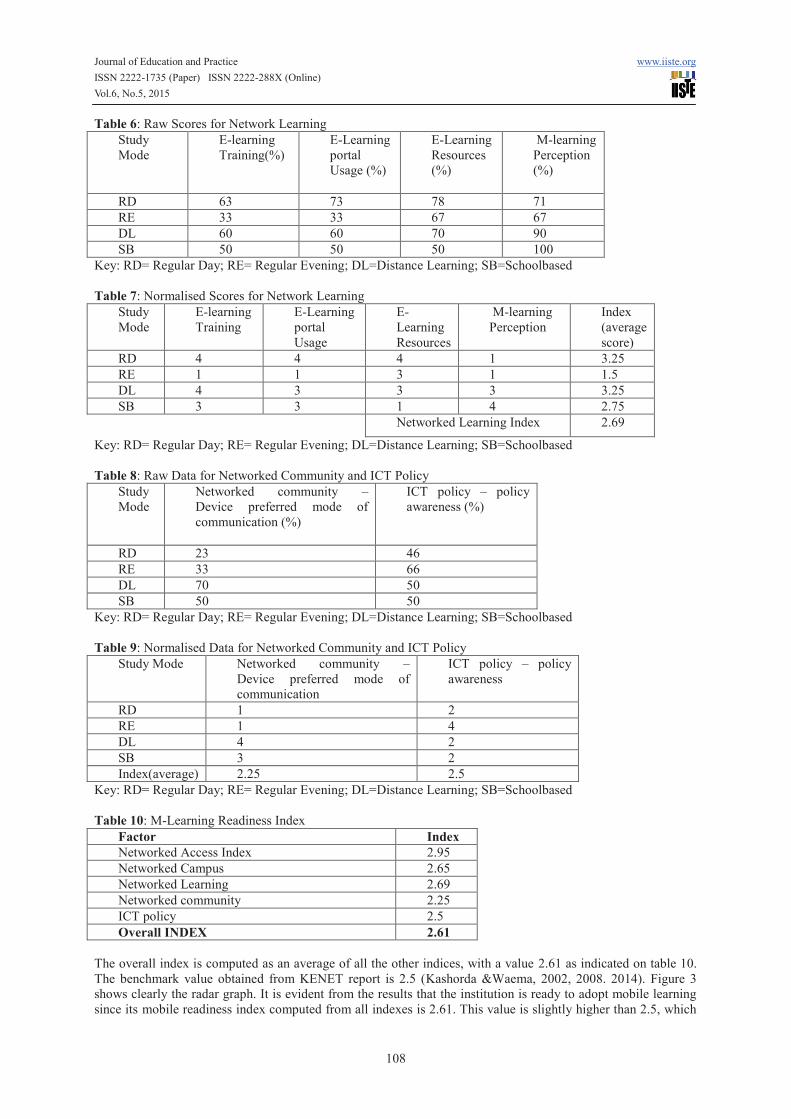
Tables 2,4,6 and 8 shows the raw data obtained from frequencies given by SPSS analytical tool. All figures are
in percentages (%). Table 3,5,7 and 9 gives the normalized values of table 2,4,6 and 8 respectively. From the
computation, the networked Access index is 2.95, networked campus 2.65, Networked Learning 2.69 and
Networked community 2.5.
Table 2: Raw Scores for Network Access
Study
Mode
Device
Ownership(%)
Internet
Availability(%)
Internet
Affordability
(%)
Internet
Reliability
(%)
Learning
support
(%)
RD 93 42 43 30 49
RE 100 33 80 66 33
DL 100 60 60 50 50
SB 100 50 16 50 100
Key: RD= Regular Day; RE= Regular Evening; DL=Distance Learning; SB=Schoolbased
Table 3: Normalised Score index for Networked Access
Study
Mode
Device
Ownershi
p
Internet
Availabilit
y
Internet
Affordabilit
y
Internet
Reliabilit
y
Learnin
g
support
Index
(averag
e score)
R
D
3 2 2 2 2 2.2
RE 4 1 4 4 2 3.0
D
L
4 4 4 3 3 3.6
SB 4 3 1 3 4 3.0
Networked Access Index 2.95
Table 4: Raw Scores for Network Campus
Study Mode Wi-Fi Coverage (%) LAN Coverage (%) Multiple Device
Support(%)
RD 62.1 70.4 44.5
RE 66.7 66.7 33.3
DL 40 40 30
SB 50 50 40
Key: RD= Regular Day; RE= Regular Evening; DL=Distance Learning; SB=Schoolbased
Table 5: Normalised Score Index for Networked Campus
Study
Mode
Wi-Fi
Coverage
LAN
Coverage
Multiple Device
Support
Index
(average
score)
RD 4 4 4 4.0
RE 4 4 2 3.3
DL 1 1 1 1.0
SB 2 2 3 2.3
Networked
Campus Index
2.65
Key: RD= Regular Day; RE= Regular Evening; DL=Distance Learning; SB=Schoolbased
Journal of Education and Practice www.iiste.org
ISSN 2222-1735 (Paper) ISSN 2222-288X (Online)
Vol.6, No.5, 2015
108
Table 6: Raw Scores for Network Learning
Study
Mode
E-learning
Training(%)
E-Learning
portal
Usage (%)
E-Learning
Resources
(%)
M-learning
Perception
(%)
RD 63 73 78 71
RE 33 33 67 67
DL 60 60 70 90
SB 50 50 50 100
Key: RD= Regular Day; RE= Regular Evening; DL=Distance Learning; SB=Schoolbased
Table 7: Normalised Scores for Network Learning
Study
Mode
E-learning
Training
E-Learning
portal
Usage
E-
Learning
Resources
M-learning
Perception
Index
(average
score)
RD 4 4 4 1 3.25
RE 1 1 3 1 1.5
DL 4 3 3 3 3.25
SB 3 3 1 4 2.75
Networked Learning Index 2.69
Key: RD= Regular Day; RE= Regular Evening; DL=Distance Learning; SB=Schoolbased
Table 8: Raw Data for Networked Community and ICT Policy
Study
Mode
Networked community –
Device preferred mode of
communication (%)
ICT policy – policy
awareness (%)
RD 23 46
RE 33 66
DL 70 50
SB 50 50
Key: RD= Regular Day; RE= Regular Evening; DL=Distance Learning; SB=Schoolbased
Table 9: Normalised Data for Networked Community and ICT Policy
Study Mode Networked community –
Device preferred mode of
communication
ICT policy – policy
awareness
RD 1 2
RE 1 4
DL 4 2
SB 3 2
Index(average) 2.25 2.5
Key: RD= Regular Day; RE= Regular Evening; DL=Distance Learning; SB=Schoolbased
Table 10: M-Learning Readiness Index
Factor Index
Networked Access Index 2.95
Networked Campus 2.65
Networked Learning 2.69
Networked community 2.25
ICT policy 2.5
Overall INDEX 2.61
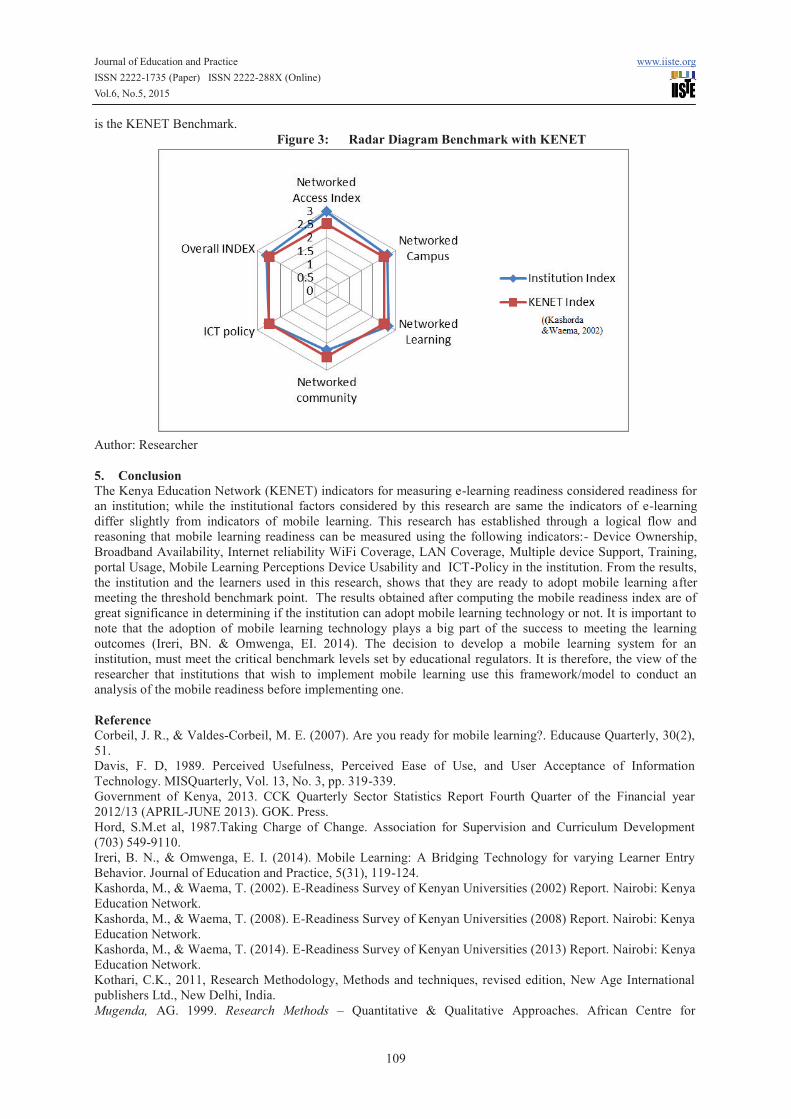
The overall index is computed as an average of all the other indices, with a value 2.61 as indicated on table 10.
The benchmark value obtained from KENET report is 2.5 (Kashorda &Waema, 2002, 2008. 2014). Figure 3
shows clearly the radar graph. It is evident from the results that the institution is ready to adopt mobile learning
since its mobile readiness index computed from all indexes is 2.61. This value is slightly higher than 2.5, which
Journal of Education and Practice www.iiste.org
ISSN 2222-1735 (Paper) ISSN 2222-288X (Online)
Vol.6, No.5, 2015
109
is the KENET Benchmark.
Figure 3: Radar Diagram Benchmark with KENET
Author: Researcher
5. Conclusion
The Kenya Education Network (KENET) indicators for measuring e-learning readiness considered readiness for
an institution; while the institutional factors considered by this research are same the indicators of e-learning
differ slightly from indicators of mobile learning. This research has established through a logical flow and
reasoning that mobile learning readiness can be measured using the following indicators:- Device Ownership,
Broadband Availability, Internet reliability WiFi Coverage, LAN Coverage, Multiple device Support, Training,
portal Usage, Mobile Learning Perceptions Device Usability and ICT-Policy in the institution. From the results,
the institution and the learners used in this research, shows that they are ready to adopt mobile learning after
meeting the threshold benchmark point. The results obtained after computing the mobile readiness index are of
great significance in determining if the institution can adopt mobile learning technology or not. It is important to
note that the adoption of mobile learning technology plays a big part of the success to meeting the learning
outcomes (Ireri, BN. & Omwenga, EI. 2014). The decision to develop a mobile learning system for an
institution, must meet the critical benchmark levels set by educational regulators. It is therefore, the view of the
researcher that institutions that wish to implement mobile learning use this framework/model to conduct an
analysis of the mobile readiness before implementing one.
Reference
Corbeil, J. R., & Valdes-Corbeil, M. E. (2007). Are you ready for mobile learning?. Educause Quarterly, 30(2),
51.
Davis, F. D, 1989. Perceived Usefulness, Perceived Ease of Use, and User Acceptance of Information
Technology. MISQuarterly, Vol. 13, No. 3, pp. 319-339.
Government of Kenya, 2013. CCK Quarterly Sector Statistics Report Fourth Quarter of the Financial year
2012/13 (APRIL-JUNE 2013). GOK. Press.
Hord, S.M.et al, 1987.Taking Charge of Change. Association for Supervision and Curriculum Development
(703) 549-9110.
Ireri, B. N., & Omwenga, E. I. (2014). Mobile Learning: A Bridging Technology for varying Learner Entry
Behavior. Journal of Education and Practice, 5(31), 119-124.
Kashorda, M., & Waema, T. (2002). E-Readiness Survey of Kenyan Universities (2002) Report. Nairobi: Kenya
Education Network.
Kashorda, M., & Waema, T. (2008). E-Readiness Survey of Kenyan Universities (2008) Report. Nairobi: Kenya
Education Network.
Kashorda, M., & Waema, T. (2014). E-Readiness Survey of Kenyan Universities (2013) Report. Nairobi: Kenya
Education Network.
Kothari, C.K., 2011, Research Methodology, Methods and techniques, revised edition, New Age International
publishers Ltd., New Delhi, India.
Mugenda, AG. 1999. Research Methods – Quantitative & Qualitative Approaches. African Centre for
Journal of Education and Practice www.iiste.org
ISSN 2222-1735 (Paper) ISSN 2222-288X (Online)
Vol.6, No.5, 2015
110
Technology Studies.
O’Malley C., Vavoula G., Taylor J., Sharples M., Lefrere P. “Guidelines for learning/teaching/tutoring in a
mobile environment”. Mobilearn deliverable D 4.1., 2003. Available at:
http://www.mobilearn.org/download/results/guidelines.pdf.
Omwenga, E., Waema, T., & Wagacha, P. (June 2004). A model for introducing and implementing e-learning
for delivery of educational content within the African context. African Journal of Sciences and Technology 5(1)
35-48.
Wagner, E. D., 2005. Enabling Mobile Learning. Educause Review, pp. 41-52. Retrieved, 25 May, 2008. from
http://connect.educause.edu/Library/EDUCAUSE+Review/EnablingMobileLearning/40549?time=129470759.
The IISTE is a pioneer in the Open-Access hosting service and academic event management.
The aim of the firm is Accelerating Global Knowledge Sharing.
More information about the firm can be found on the homepage:
http://www.iiste.org
CALL FOR JOURNAL PAPERS
There are more than 30 peer-reviewed academic journals hosted under the hosting platform.
Prospective authors of journals can find the submission instruction on the following
page: http://www.iiste.org/journals/ All the journals articles are available online to the
readers all over the world without financial, legal, or technical barriers other than those
inseparable from gaining access to the internet itself. Paper version of the journals is also
available upon request of readers and authors.
MORE RESOURCES
Book publication information: http://www.iiste.org/book/
Academic conference: http://www.iiste.org/conference/upcoming-conferences-call-for-paper/
IISTE Knowledge Sharing Partners
EBSCO, Index Copernicus, Ulrich's Periodicals Directory, JournalTOCS, PKP Open
Archives Harvester, Bielefeld Academic Search Engine, Elektronische Zeitschriftenbibliothek
EZB, Open J-Gate, OCLC WorldCat, Universe Digtial Library , NewJour, Google Scholar