X-Ray Spectroscopy of Bromine Compounds and Biomedical Applications
Upload
independentCategory
view
0download
0
This content has been downloaded from IOPscience. Please scroll down to see the full text.
Download details:
IP Address: 193.166.190.220
This content was downloaded on 10/12/2013 at 19:58
Please note that terms and conditions apply.
Analyser-based x-ray imaging for biomedical research
View the table of contents for this issue, or go to the journal homepage for more
2013 J. Phys. D: Appl. Phys. 46 494002
(http://iopscience.iop.org/0022-3727/46/49/494002)
Home Search Collections Journals About Contact us My IOPscience

IOP PUBLISHING JOURNAL OF PHYSICS D: APPLIED PHYSICS
J. Phys. D: Appl. Phys. 46 (2013) 494002 (25pp) doi:10.1088/0022-3727/46/49/494002
Analyser-based x-ray imaging forbiomedical researchPekka Suortti1, Jani Keyrilainen2 and William Thomlinson3
1 University of Helsinki, Department of Physics, POB 64, FIN-00014 Helsinki University, Finland2 Helsinki University Central Hospital, Department of Oncology, POB 180, FIN-00290 Helsinki, Finland3 University of Saskatchewan, Department of Physics, Saskatoon, Saskatchewan, S7N 5A2, Canada
E-mail: [email protected], [email protected] and [email protected]
Received 19 January 2013, in final form 17 April 2013Published 22 November 2013Online at stacks.iop.org/JPhysD/46/494002
AbstractAnalyser-based imaging (ABI) is one of the several phase-contrast x-ray imaging techniquesbeing pursued at synchrotron radiation facilities. With advancements in compact sourcetechnology, there is a possibility that ABI will become a clinical imaging modality. This paperpresents the history of ABI as it has developed from its laboratory source to synchrotronimaging. The fundamental physics of phase-contrast imaging is presented both in a generalsense and specifically for ABI. The technology is dependent on the use of perfect crystalmonochromator optics. The theory of the x-ray optics is developed and presented in a way thatwill allow optimization of the imaging for specific biomedical systems. The advancement ofanalytical algorithms to produce separate images of the sample absorption, refraction anglemap and small-angle x-ray scattering is detailed. Several detailed applications to biomedicalimaging are presented to illustrate the broad range of systems and body sites studiedpreclinically to date: breast, cartilage and bone, soft tissue and organs. Ultimately, theapplication of ABI in clinical imaging will depend partly on the availability of compact sourceswith sufficient x-ray intensity comparable with that of the current synchrotron environment.
(Some figures may appear in colour only in the online journal)
1. Introduction: an overview of phase-contrastx-ray imaging
Over the past few decades, there have been extraordinaryadvances in medical imaging using complimentary clinicaltechniques to guide medical diagnosis and radiation therapy.In parallel with clinical advances, the application of advancedtechnologies to basic biomedical research is leading to a newunderstanding of the origin, progression and morphology ofdiseases.
In this context, the development of advanced imagingtechnologies using synchrotron radiation (SR) sources isadvancing x-ray medical imaging in both the preclinicaland clinical environments. Bravin et al (2013) haverecently published a comprehensive review of x-ray phase-contrast (PC) biomedical imaging. There are a number ofother review articles that deal in part with PC synchrotronimaging (Lewis 1997, Suortti and Thomlinson 2003, Andoet al 2004, Thomlinson et al 2005) and breast imaging in
particular (Keyrilainen et al 2010). With advantages over theclinically used x-ray tubes having an extremely intense, highlycollimated and tuneable spectra over a wide energy range,synchrotron imaging modalities are proving to be an excellenttest bed for technology development. This is particularly truein the exploitation of the fundamental properties of x-raysthat include both the amplitude and phase of the radiation.Even though the phase contrast can be orders of magnitudehigher than absorption contrast (Takeda et al 1995), presentday medical imaging almost exclusively relies on contrastarising from absorption since phase changes are technicallymore difficult to measure. Using SR, advanced imagingmodalities are being developed that rely on both absorption(amplitude or imaginary part of the wave description) andphase contrast (phase or real part of the wave description).In addition to phase changes and true absorption of energy,the x-ray beam is scattered due to the structure of the materialthrough which it is passing. It is of great interest to obtaininformation about absorption, phase shift and scattering in
0022-3727/13/494002+25$33.00 1 © 2013 IOP Publishing Ltd Printed in the UK & the USA

J. Phys. D: Appl. Phys. 46 (2013) 494002 P Suortti et al
Si(333) CrystalMonochromator
Si(333) CrystalAnalyzer
ImagingShutter
IonizationChamber
SlitSpecimen
Si(111)PM-L
Detector
IonizationChamber Ionization
Chamber
Rocking angle ( rad)
HL
P
R()
-10 -5 0 5 100.0
1.0
0.8
0.4
0.2
0.6 y
z
Figure 1. Standard ABI setup in the plane of diffraction (y, z). PM-L is a Laue-type premonochromator. The reflectivity of the analyser at30 keV x-ray energy is shown in the insert, with the conversion of beam deviation to an intensity change at the working point L. The detectoris scanned synchronously with the sample in planar imaging. Reprinted from Keyrilainen et al 2008, Copyright (2013), with kindpermission from the Radiological Society of North America (RSNA).
order to gain a complete description of the material sincethe various mechanisms are sensitive to different physicalproperties.
Phase contrast, which is due to the changing phase ofthe x-ray wave as it traverses an object, arises from both theintegrated phase difference through various parts of the sampledue to varying electronic charge densities as well as from thegradients of the density. The change in phase can be seen, forexample, in Fresnel imaging in which the phase-shifted beaminterferes with the unchanged reference beam (Snigirev et al1995). At large object-to-detector distances, the appearance offringes in the projection of the object on the detector plane thatoccurs enhances the image contrast. This method is denotedas propagation-based imaging (PBI), although some authors inthe literature refer to it simply as PC imaging. PBI does not relyon any complex optics for implementation, making it readilyapplicable to research and potential clinical development. Inthe discussions relevant to analyser-based imaging (ABI), thetopic of this paper, there will be references made to PBI;however, it will not be extensively developed (Bravin et al2013).
Another means of detecting phase shifts is to use a crystalinterferometer to image the interference of the phase-shiftedbeam and the direct beam. The first x-ray interferometer wasreported by Bonse and Hart (1965). Interferometry has beenapplied to biomedical research using SR sources (Momose1995, 2005, Takeda et al 1995, 2002, Momose et al 1998,2000, 2001).
The direction of the wave front changes where there isa gradient of the index of refraction perpendicular to thedirection of propagation. The refracted beam, although at verysmall angles to the incident direction, can be measured usingeither grating interferometers or perfect crystal optics. Gratinginterferometers have become widely applied using SR basedon the early observation of self-imaging of diffraction gratingsusing visible light (Talbot 1836). Grating interferometry
(GI) has been developed and applied to soft tissue imaging(Momose et al 2003, Weitkamp et al 2005, McDonald et al2009, Bech et al 2010, Diemoz et al 2011). There is avariation of grating-based imaging where coded apertures areused (Olivo and Speller 2007, 2008). GI techniques andapplications will not be detailed in this paper.
1.1. Development of synchrotron ABI
The first example of small angle x-ray scattering (SAXS)imaging using perfect crystals was the camera developedby Bonse and Hart (1966). A simplified version of theircamera is to replace the multiple-crystal arrangements bysingle-reflection crystals. A laboratory or synchrotron sourceilluminates the sample, and then a separate perfect crystalanalyser is placed after the sample to record the image. Thistechnique is generally referred to as ABI, although in the earlyyears of synchrotron ABI, it was referred to as diffraction-enhanced imaging (DEI) (Chapman et al 1997). The twonames for the technology are used interchangeably in theliterature, although DEI technically refers to those experimentsin which the crystal rocking curve (RC; see the theory sectionbelow) is approximated by the first-order Taylor expansion atthe operating point of the analyser crystal. When measuredRCs or more advanced analytical approximations to the RCare used, those methods will be referred to by the names usedin the literature.
The basic experimental setup for ABI is shown in figure 1.The necessary longitudinal coherence of the beam on thesample is created by the monochromator. The monochromatoris set at the Bragg angle corresponding to the desiredenergy. For the biomedical applications, the monochromatoris typically a perfect Si crystal, and low-order reflections areused at energies between 20 and 60 keV. Since the synchrotronmonochromatic beam is a wide fan beam, the sample is scannedvertically through the beam to create an image. The beam
2
J. Phys. D: Appl. Phys. 46 (2013) 494002 P Suortti et al
that has passed through the sample is absorbed, refracted andscattered. This beam is then incident on the analyser crystal,where those rays that are within its RC (i.e. reflectivity curve)are diffracted and recorded by the detector. The intensitydistribution recorded at the detector for a given angle of theanalyser thus depends on the true absorption by the sample,loss of radiation scattered outside the RC acceptance angles,scattered radiation in the beam and the angle of the x-raysrelative to the analyser Bragg angle. Ideally, the resultingimage can be deconvoluted to yield separate images of theabsorption, the refraction angles and the scattering by thesample structures. Since the RC of the crystals is in the rangeof microradians (µrad), the scattering that can be measured isin the region of SAXS or ultrasmall angle x-ray scattering(USAXS). Due to the very small magnitude of the indexof refraction at x-ray energies for biological materials, therefracted rays generally are accepted by the analyser. Anyx-rays scattered beyond the RC acceptance are not recordedand thus contribute to the ‘apparent absorption’ of the sample.Many of the recent developments of ABI analysis techniquesdeal with trying to properly represent the RCs analytically atwide angles in order to allow accurate deconvolutions.
1.2. The foundation years: 1995–2002
One interesting way of reviewing synchrotron ABI is to thinkof ‘waves’ of development. Although far from exact, such ananalysis reveals how the applications to biomedical researchfollow from instrumentation and analytical method advances.ABI was developed in the mid-1990s. Several importantdemonstrations of ABI were reported for imaging of soft tissueusing conventional laboratory sources (Davis et al 1995a,1995b, Ingal and Beliaevskaya 1995, Ingal et al 1998). Itwas when SR was first used as a source that the stage was setfor ABI to become a major PC biomedical imaging technique(Johnston et al 1995, 1996). The methodology, called DEIby the authors, was developed for deconvoluting the imagesof excised breast tissue into separate absorption and refractionimages (Chapman et al 1996, 1997).
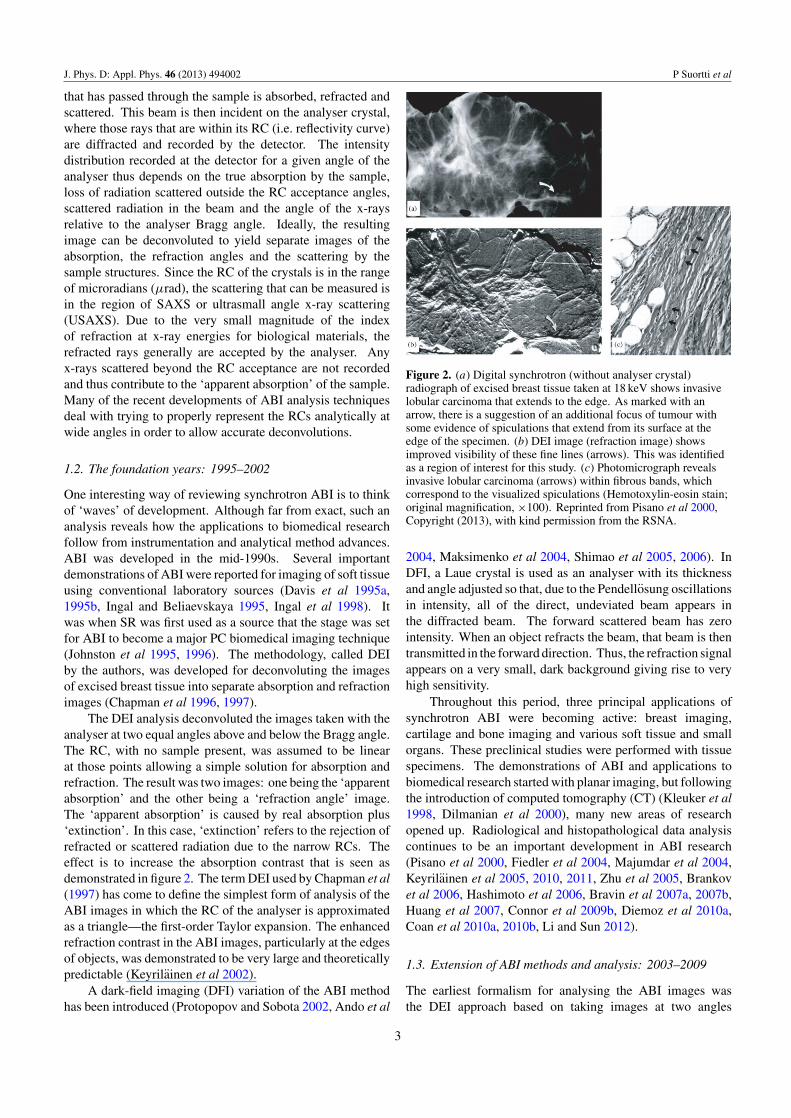
The DEI analysis deconvoluted the images taken with theanalyser at two equal angles above and below the Bragg angle.The RC, with no sample present, was assumed to be linearat those points allowing a simple solution for absorption andrefraction. The result was two images: one being the ‘apparentabsorption’ and the other being a ‘refraction angle’ image.The ‘apparent absorption’ is caused by real absorption plus‘extinction’. In this case, ‘extinction’ refers to the rejection ofrefracted or scattered radiation due to the narrow RCs. Theeffect is to increase the absorption contrast that is seen asdemonstrated in figure 2. The term DEI used by Chapman et al(1997) has come to define the simplest form of analysis of theABI images in which the RC of the analyser is approximatedas a triangle—the first-order Taylor expansion. The enhancedrefraction contrast in the ABI images, particularly at the edgesof objects, was demonstrated to be very large and theoreticallypredictable (Keyrilainen et al 2002).
A dark-field imaging (DFI) variation of the ABI methodhas been introduced (Protopopov and Sobota 2002, Ando et al
Figure 2. (a) Digital synchrotron (without analyser crystal)radiograph of excised breast tissue taken at 18 keV shows invasivelobular carcinoma that extends to the edge. As marked with anarrow, there is a suggestion of an additional focus of tumour withsome evidence of spiculations that extend from its surface at theedge of the specimen. (b) DEI image (refraction image) showsimproved visibility of these fine lines (arrows). This was identifiedas a region of interest for this study. (c) Photomicrograph revealsinvasive lobular carcinoma (arrows) within fibrous bands, whichcorrespond to the visualized spiculations (Hemotoxylin-eosin stain;original magnification, ×100). Reprinted from Pisano et al 2000,Copyright (2013), with kind permission from the RSNA.
2004, Maksimenko et al 2004, Shimao et al 2005, 2006). InDFI, a Laue crystal is used as an analyser with its thicknessand angle adjusted so that, due to the Pendellosung oscillationsin intensity, all of the direct, undeviated beam appears inthe diffracted beam. The forward scattered beam has zerointensity. When an object refracts the beam, that beam is thentransmitted in the forward direction. Thus, the refraction signalappears on a very small, dark background giving rise to veryhigh sensitivity.
Throughout this period, three principal applications ofsynchrotron ABI were becoming active: breast imaging,cartilage and bone imaging and various soft tissue and smallorgans. These preclinical studies were performed with tissuespecimens. The demonstrations of ABI and applications tobiomedical research started with planar imaging, but followingthe introduction of computed tomography (CT) (Kleuker et al1998, Dilmanian et al 2000), many new areas of researchopened up. Radiological and histopathological data analysiscontinues to be an important development in ABI research(Pisano et al 2000, Fiedler et al 2004, Majumdar et al 2004,Keyrilainen et al 2005, 2010, 2011, Zhu et al 2005, Brankovet al 2006, Hashimoto et al 2006, Bravin et al 2007a, 2007b,Huang et al 2007, Connor et al 2009b, Diemoz et al 2010a,Coan et al 2010a, 2010b, Li and Sun 2012).
1.3. Extension of ABI methods and analysis: 2003–2009
The earliest formalism for analysing the ABI images wasthe DEI approach based on taking images at two angles
3

J. Phys. D: Appl. Phys. 46 (2013) 494002 P Suortti et al
symmetric to the Bragg angle. In addition, images takenat the top of the RC (the analyser positioned at the Braggangle corresponding to the monochromator) showed excellentcontrast due to a combination of effects arising from refractionand the apparent absorption due to extinction. These imageswere not used analytically in the early analysis. TheDEI formalism has a major deficiency in that it cannotbe used to determine the scattering from the object. Inorder to allow the calculation of scattering in addition toabsorption and refraction, various experimental and analyticalmethodologies have been introduced starting in about 2003.These methodologies are detailed in the theory section of thispaper and include generalized DEI (G-DEI), extended DEI (E-DEI), multiple-image radiography (MIR) and Gaussian curvefitting (GCF).
The RC of the analyser is a convolution of the RC ofthe monochromator, the distribution of the transmitted beamthrough the object, the RC of the analyser and the responsefunctions of the detector. To generalize the analysis, it isessential to measure or calculate the detailed shape of theconvoluted RCs with and without the sample present. TheGaussian form of the RC is often assumed implicitly orexplicitly in these algorithms, although the Gaussian functionhas limitations particularly for large scattering angles relativeto the RC width. To overcome these limitations, morecomplex functions can be fitted to the RCs at the expense ofhigh computational requirements. The Voigtian function is aconvolution of a Gaussian and a Lorentzian function. Use ofthe pseudo-Voigtian function (see the theory section for details)can extend the useful angle range to as much as ten timesthe full-width at half-maximum (FWHM) of the RC (Suhonenet al 2007). Most recently, Kitchen et al (2007, 2010) haveintroduced the use of the Pearson VII function. This is a veryflexible function and has allowed for tissue differentiation fromthe resulting images.
Since synchrotron ABI imaging was a new technologybeing applied to biomedical research, many of the earlyexperiments compared the images and biomedical informationobtained by ABI with those obtained using standardnonanalyser imaging (Chapman et al 1997, Majumdar et al2004). That was especially the case for biomedical programswith potential direct translational possibilities to clinicalpractice: breast imaging (Pisano et al 2000, Fiedler et al2004, Keyrilainen et al 2005, 2008, 2011, Bravin et al 2007a),cartilage imaging (Mollenhauer et al 2002, Li et al 2003,Muehleman et al 2004a, 2004b, 2006, 2009a, 2009b) andtrabecular bone (Connor et al 2009b). The studies wereperformed either with tissue specimens or laboratory animalsex vivo. There were also efforts to compare ABI with PBI(Pagot et al 2005) and interferometry (Yoneyama et al 2008).With the burst of analysis methods, it was important to comparethe image quality and methods utilizing the various imageextraction algorithms for ABI (Hu et al 2008, 2009).
1.4. Advanced applications, methodology comparisons andcompact sources: 2009–2012
In recent years, the maturing of ABI applications in breastimaging, cartilage and bone and soft tissue and organs have
been addressed. Much of the focus of the research has beenon applying the analytical methods to obtain the most accurateimages for the three components: absorption, refraction andscattering. Given this as the goal, there have been recent directcomparisons between ABI, PBI and GI (Diemoz et al 2012).The use of the various algorithms introduced above has beendiscussed by Diemoz et al (2010b). Coan et al (2013) comparethe various PC imaging modalities applied to breast imaging.
In parallel with the advancement of the varioussynchrotron PC imaging methods (PBI, ABI, GI), there hasbeen a continual development of compact source technology.In order to translate the technologies being developed at thesynchrotrons into the clinic, such compact sources will benecessary. In fact, PBI is already being incorporated in acommercial system by Konica-Minolta (2012). In the case ofABI, there have been results reported using standard laboratorysources (Muehleman et al 2009a, 2010). These sources, usingx-ray tubes, are being studied as prototypes for dedicatedclinical PC imaging (Faulconer et al 2009, Nesch et al 2009,Parham et al 2009). GI has already been shown to be possiblein a preclinical x-ray PC CT scanner (Tapfer et al 2012). Thereare two other compact source technologies being advanced forpossible clinical use: a mini-SR ring (van Heekeren et al 2011)and inverse Compton x-rays (Bech et al 2009). The future isnot clear but with these and other ongoing efforts (Coan et al2009), it is likely that PC x-ray imaging will become a clinicaltool.
2. Physical foundations of x-ray imaging
ABI is based on the fundamental properties of x-raysinteracting with matter and on the utilization of perfect crystaloptics to measure the resulting changes in x-ray beams due tothose interactions. ABI measures the absorption, refractionand scattering of the x-rays after they have traversed anobject. It is the properties of the reflectivity (RCs) ofthe monochromator and analyser crystals that allow thoseproperties to be analysed and transformed into images.
2.1. Scattering phenomena
X-rays interact with the electrons of the target leading tovarious excitations in the target and scattering of the rays.Ignoring collective phenomena, the scattering can be elastic,inelastic (Compton) and resonant scattering. Scatteringdistributions carry information about the structures andelectronic states of the object and are useful for medicalimaging.
In Compton scattering, the energy of the incident x-rayphoton is shared by the scattered photon and the recoil electron.The scattering amplitude is zero in the strictly forward directionand increases monotonically with the scattering angle. TheCompton scattering cross section is proportional to the electrondensity, so scattering is element-specific to some degree.It has been used for medical imaging (Puumalainen et al1979). In this context, it is important to note that high-energies Compton scattering dominates the x-ray attenuationand energy absorption due to the recoil electrons. The
4

J. Phys. D: Appl. Phys. 46 (2013) 494002 P Suortti et al
A / rr e
f ´
´f + f0
A / r0 e
Figure 3. Resultant amplitude of the forward x-ray beam, Ar/re, asthe sum of the amplitudes of the nonscattered beam Ao/re andforward scattering, fo + f ′ + if ′′ in the amplitude-phase plane. Thescattering amplitude is given by the Argand diagram, where thephase difference between real and imaginary components is π/2 andis rotated by 3π/2 due to phase-lag (see the text).
Compton scattering distribution is not directly determined inthe ABI analysis.
The essential features of elastic and resonant scatteringcan be understood on the basis of a simple classical picture ofthe forced motion of a bound electron in the electric field ofthe incident x-ray beam (James 1962). In the equatorial plane,the scattering amplitude is as follows:
A = −reω2/(ω2 − ω2
s − iω�) = − ref. (1)
Here, re = e2/mc2 = 2.82 × 10⁻¹³ cm is the free-electronscattering amplitude (electron classical radius), ω is the angularfrequency of the incident x-ray wave, ωs is the resonantfrequency, � is a (radiation) damping factor and f is the atomicscattering factor. At high frequencies ω � ωs, there is a phaseshift of π in the scattered wave. In an atom of Z electrons,the amplitudes add up, and it is customary to separate thedispersion terms f ′ and f ′′ (James 1962),
f = fo + f ′ + if ′′. (2)
In the following, only forward scattering is considered, sofo = Z when the small relativistic effects are ignored.
The resulting wave is the sum of the nonscattered waveand the forward scattered wave. From the Fresnel zoneconstruction, it is seen that the scattered wave lags by π /2behind the waves scattered by individual electrons so that thetotal phase-lag of the forward scattered wave is 3π /2. Thevector sum of the nonscattered and forward scattered wavesis illustrated in figure 3, demonstrating the phase change andattenuation of the transmitted wave. The refractive index ofthe medium is as follows (James 1962):
n = 1 − (Nλ2/2π)ref = 1 − δ − iβ, (3)
where, N is the number of atoms per unit volume, λ = 2π/K
is the x-ray wavelength, δ is phase-shift term and β is theabsorption term. The coefficient of change of phase φ is givenbelow:
η = δK = δ(2π/λ) = Nλre(Z + f ′) , (4a)
15 keV
Atomic number
60 keV30 keV
Figure 4. Calculated ratio of the coefficient of phase change η to theabsorption coefficient µ at different x-ray energies as functions ofthe atomic number of typical human body tissue elements (ICRU1989, NIST 2013).
and the linear photoelectric absorption coefficient (relativeintensity loss per unit path length) is as follows:
σph = 2β (2π/λ) = 2Nλref′′. (4b)
This classical description covers elastic forward scattering andthe stepwise onset of photoelectric absorption at each resonantfrequency ωs. The coefficients of phase change and absorptionhave very different dependencies on the x-ray energy E. Athigh energies, where f ′ approaches zero, η is proportional to1/E (4a). Each contribution to f ′′ drops approximately as(ωs/ω)2 above the respective resonant frequency, so that atx-ray energies higher than the K-absorption edge EK , σph isproportional to 1/E3 (4b). The total attenuation coefficientµ is the sum of the photoelectric absorption coefficient andthe elastic (coherent) and inelastic (incoherent) scatteringcoefficients,
µ = σph + σcoh + σinc. (5)
The numerical values of η and µ are very different at energiesused for medical imaging. It is seen in figure 4 that for themain constituents of soft tissue, η is more than two orders ofmagnitude larger than µ. At high energies, this ratio prevailsup to Z = 20 (Ca), which is sufficient for medical imagingsince together with calcium and ten light elements (Z � 19)—namely, H, C, O, N, Na, Mg, P, S, Cl, K—account for morethan 99.5% of human body mass (Heymsfield et al 1997).
Photon cross sections for breast tissue are shown infigure 5. The signal in current absorption-contrast medicalimaging is the variation in the total attenuation of the x-raybeam. All components of µ are proportional to the electrondensity but only the photoelectric cross section is elementspecific. In soft tissue, Compton scattering becomes thedominant attenuation process at approximately 25 keV so thatthe beam attenuation becomes proportional to the tissue densityonly.
The radiation dose is proportional to the energy absorptioncoefficient µen. This is equal to the photoelectric absorption
5

J. Phys. D: Appl. Phys. 46 (2013) 494002 P Suortti et al2
Cross-section(cmg)
ph
coh
inc
Photon energy (keV)
-1
en
Figure 5. Total scattering cross section (total attenuationcoefficient) µ, and partial cross section for breast tissue between 1and 100 keV x-ray energy. Photoelectric cross section σph isdominant up to 26 keV, above which incoherent (Compton)scattering cross section σinc is dominant. The energy absorptioncoefficient is indicated by µen, and the coherent scattering crosssection by σcoh (ICRU 1989, NIST 2013).
coefficient that drops approximately as 1/E3 up to the x-rayenergy, where the kinetic energy transferred to the Comptonrecoil electrons becomes larger than the kinetic energy of thephotoelectrons. This x-ray energy is approximately 60 keVin breast tissue and above that energy, µen levels off. This isthe upper limit of the useful energy range for both absorption-contrast and PC imaging of soft tissue. In cortical bone, thelimit is approximately 120 keV. In PC imaging, the optimumx-ray energy is probably the energy, where µen(E)/η(E) isminimum. This energy is approximately 50 keV in soft tissueand 100 keV in cortical bone. In absorption-contrast imaging,the small differences in photoelectric absorption give rise tothe contrast. In soft tissue imaging, x-rays of approximately20 keV are used (e.g. filtered polychromatic radiation from aMo-target tube) as a compromise between absorption contrastand radiation dose.
There is a fundamental advantage in PC imaging withrespect to absorption-contrast imaging in addition to thefavourable η/µ ratio. The signal in absorption-contrastimaging is the reduction of transmitted intensity due to actualabsorption and all scattering that does not reach the detector.This results in small variations in a large quantity. In PCimaging, the particular signal of forward scattering is extracted,while other signals remain in the background. This is true alsofor detection of x-ray fluorescence, which may be used formapping of trace elements in tissue and for recording SAXSthat is discussed in the following section.
2.2. Refraction and elastic scattering
A lateral gradient of the real part δ of 1 − n causes a deviationof the x-ray beam. The refraction angle γ can be calculatedusing geometrical optics and Snell’s law at an interface, wherethe refractive index changes by �δ (James 1962).
γ = �δ tan α, (6a)
where, α is the angle between the normal of the interface andthe incident ray. If the propagation direction is z and thedeviation direction is y, tan α = dz/dy, and from (6a), thefollowing equation has been formulated:
γ = (λ/2π)(dφ/dy). (6b)
The expression diverges when the ray is parallel to the interfaceso that sharp refraction contrast takes place at an internalor external edge of the object. It has been verified bymeasurements that (6a) and (6b) holds quantitatively evenwhen the refraction effect is very large (Keyrilainen et al 2002).It is important to note that refraction does not require a coherentwave front.
The term ‘refraction’ is used in the cases where thedeviation of the ray that is observed at the detector correspondsto density gradients on the length scale of the detectorresolution. Density variations on smaller length scales causeSAXS around the refracted ray. At least some part of SAXSis detected together with the transmitted direct beam. Ratherthan being a nuisance in imaging, it is a source of essentialinformation on the tissue structures on the supramolecularlevel. ABI data can be acquired such that it can be analysed toyield SAXS information as well as absorption and refraction.It is thus important to understand some of the general featuresof SAXS that are described in the following section using theformulation introduced by Guinier (1963).
As a scattering object, a tissue sample is fully describedby its electron density ρ(r). It is typical that ρ(r) has severalhierarchical levels; for example, many organic materials arebuilt of chain-like molecules that form fibres and those in turncreate bundles and so forth. Any object has a finite size and inthe following, the effect of size in elastic scattering (diffraction)is considered. The convolution theorem of Fourier transformsis used in the formulation; that is, the Fourier transform ofthe product of two functions is the convolution of the Fouriertransforms of those functions. This theorem is very usefulfor separating the effects of the internal structure and externalshape of an object in x-ray diffraction.
Consider an object of volume V cut from a statisticallyhomogeneous electron density ρo(r) by the shape functionτ(r) that is 1 inside the object and 0 outside,
ρ(r) = ρo(r)τ (r). (7)
The amplitude of scattering in units of re is the Fouriertransform of ρ(r), that is, the convolution A(k) = Ao(k) ×T(k), where, T(k) is the transform of τ(r) and k is thescattering vector of length 4π sin θ/λ. Here, θ is half ofthe scattering angle. The intensity I (k) is the amplitudemultiplied by its complex conjugate, and it turns out that theeffects of the electron density ρo(r) and the shape functionτ(r) are separated in the convolution of the respective Fouriertransforms.
I(k) = F [Po(r)] × |T(k)|2 . (8)
Here, the scattering pattern is given by the transform F ofthe Patterson function Po(r) of the electron density, and thisis convolved by the transform of the autocorrelation functionV (r) of the object shape function (Guinier 1963).
6

J. Phys. D: Appl. Phys. 46 (2013) 494002 P Suortti et al
The transform F [Po(r)] can be divided into parts thatcorrespond to diffraction from the average structure of theobject and from the fluctuations of the object. The first part isthe central maximum at k = 0,
I (k) = ρ2o |T (k)|2 . (9)
This is the SAXS term that depends on the size and shape ofthe object but not on its internal structure. It is useful to relatethe object size and the angular width of the SAXS intensity.At small values of k · r, the Guinier approximation is valid(Guinier 1939),
I (k) = I (0) exp[−(kRg)2/3], (10)
where, Rg is the radius of gyration of the electron densityof the object. The FWHM of I (k) is �θ = 2.9/(KRg),where, K = 2π/λ. For instance, with 50 keV radiation,�θ = 0.3 mrad for a spherical particle of 100 nm diameter.The Gaussian form for (U)SAXS is used frequently evenoutside the limits of validity of the approximation.
In a real object such as a tissue sample, the scatteringentities are not isolated but closely packed or embedded in amatrix of uniform density ρm. Scattering from the matrix isnot separable from the direct beam, so that ρo is replaced by(ρo − ρm) in (9).
At large values of k, even small variations in distance r toneighbouring objects lead to destructive interference so that theindependent particle approximation is valid. The asymptoticSAXS intensity distribution follows a power law (Porod 1951),
I (k) = 2π(ρo − ρm)2Sk−4, (11)
where, S is the surface area of the particles in unit mass ofthe object. Before reaching the asymptotic behaviour or thefinal slope of −4, different values of the slope exponent areobserved depending on the shape of the object. The exponentis 4 for three-dimensional (3D) objects with a continuous outersurface, 2 for two-dimensional (2D) disks, 1 for rods, 2 or 5/3for coils and between 1 and 4 for different mass and surfacefractals (Feigin and Svergun 1987, Schmidt 1991). The powerlaw exponent and specific surface are important parametersthat characterize the object and can be utilized for imaging ofmolecular and supramolecular structures of tissues.
2.3. ABI methods
2.3.1. Perfect crystals. Perfect crystals, mostly fabricatedof silicon, are used to create a parallel, monochromatic x-raybeam from the incident radiation and to analyse the changesof the beam caused by the object. The monochromatorand analyser crystals are used in the transmission geometry(Laue case) or in the reflection geometry (Bragg case). Themonochromator reflects a narrow-band �E of energy fromthe incident radiation with two components to the width of theband (James 1962).
(�E/E)o = wD cot θm, (12a)
(�E/E)ψ = ψ cot θm. (12b)
y
P / P0
y
P / P0
Figure 6. Reflectivity of a thick, nonabsorbing perfect crystal insymmetrical Bragg (left) and Laue (right) cases. In the Bragg case,total reflection takes place between y = −1 and y = +1, whichcorresponds to the angular Darwin width wD. In the Lauereflectivity curve, the fast Pendellosung oscillations are smoothedout to correspond to an equal partition between beams diffracted tothe forward direction and to angle 2θ . The FWHM of the Lauereflectivity curve in the y-scale is 2.
where, wD is the Darwin width of the crystal reflection (angularwidth of total reflection of a nonabsorbing crystal) and ψ isthe angular divergence of the beam incident on the crystaldue to the source and collimating slit sizes. The angle θm
is determined by Bragg’s law, 2d sin θm = λ, where d is thespacing of reflecting atom planes. In Bragg diffraction, from athick crystal, the reflectivity curve is of top-hat shape within theDarwin width, with tails falling off as {1 − [1 − y−2]}, where2y = �θm/wD. In the Laue case, the reflectivity oscillatesbetween zero and 1/(1 + y2), depending on the thickness ofthe crystal. This is the Pendellosung situation, where thediffracted beam oscillates between the forward direction andthe 2θm direction (Zachariasen 1945, James 1962). It is usuallyassumed that there is sufficient thickness variation to smear theoscillations, so that there are two beams of equal reflectivityof 1/2(1 + y2), i.e. the reflectivity curve is Lorentzian. TheBragg and Laue reflectivity curves for nonabsorbing crystalsare shown in figure 6. The Darwin width wD can be given interms of the extinction length �, which is proportional to theinverse of the attenuation coefficient µe upon total reflectionfrom a nonabsorbing crystal, µe = π/2� (James 1962, Suorttiet al 1986).
wD = 2λ/π� sin 2θm, (13a)
� = Vc/reλCF ′. (13b)
where, Vc is the volume of the crystal unit cell, C is thepolarization factor (1 for σ polarization and cos 2θ for π
polarization) and F ′ is the real part of the structure factor.Numerical values for several reflections of perfect crystalsilicon are given in table 1.
Bragg crystals are sometimes cut asymmetrically so thatthe reflecting planes make an angle χ with the crystal surface.The width of the beam and the range of total reflection vary asillustrated in figure 7. The x-ray beam volume in the position-momentum phase space is conserved so that in this case theproduct of the beam width and angular divergence is constant.The angular acceptance width, wa, and the emittance width,we, are as follows (Suortti et al 1986):
wa = M1/2wD, (14a)
we = wD/M1/2, (14b)
7

J. Phys. D: Appl. Phys. 46 (2013) 494002 P Suortti et al
Table 1. Structure factors (F(h k l)), Darwin widths (wD) and extinction lengths (�) for perfect Si crystal reflections hkl at x-ray energiesbetween 20 and 60 keV.
E (keV) 20 40 60
h k l F (h k l) wD (µrad) � (µm) wD (µrad) � (µm) wD (µrad) � (µm)
111 60.33 13.20 15.20 6.57 30.40 4.38 45.60220 67.49 9.12 13.58 4.51 27.17 3.00 40.75311 43.81 5.07 20.93 2.50 41.85 1.66 62.78400 56.42 5.46 16.25 2.68 32.50 1.78 48.75333 32.98 2.51 27.80 1.21 55.60 0.80 83.40440 43.10 3.04 21.27 1.46 42.54 0.96 63.81
Note: Small effects of anomalous dispersion are ignored, and σ -polarization of the x-ray beamis assumed.
wa we
hahe
P / P0 P / P0
Figure 7. Reflection of x-rays from an asymmetrically cut,nonabsorbing perfect crystal in the Bragg case. Acceptance andemittance are equal in phase space, that is, hawa = hewe.
where, M = sin(θ +χ)/ sin(θ −χ) is the magnification factor.For instance, the angular acceptance and band pass may beincreased, and the reflected beam can be expanded and mademore parallel.
2.3.2. ABI setup. In the standard ABI setup, theanalyser crystal is in the nondispersive setting with themonochromator crystal (or the last crystal of a multiple-reflection monochromator) where the Bragg-plane normal ofthe monochromator is opposite to that of the analyser (seefigure 1). This eliminates the effect of beam divergence andthe RC of the analyser is the convolution of the monochromatorand analyser reflectivity curves. When the symmetrical Bragggeometry is used, the RC is approximately triangular witha width of 1.5wD (James 1962). The use of a Laue-typeanalyser crystal is less common but offers some variations inthe imaging methods, as discussed later in the applicationssection.
The analyser crystal is a narrow angular slit in onedirection in the plane of diffraction but ‘open’ in theperpendicular direction. The ABI setup is actually a Bonse–Hart camera in its simplest form with a ‘long-slit’ geometry sothat scattering is integrated along the slit. SAXS is an importantsource of information about the molecule-level structure of theobject, but in ABI, the intensity distribution is smeared andsome details are lost (Suhonen et al 2007).
In an ideal ABI measurement, the entire analyser RCmodified by the beam traversing the object is recordedand compared with the intrinsic RC. The intrinsic RC hastypically wider and higher tails than expected from thecalculated convolution of the monochromator and analyserRCs (Keyrilainen et al 2002). The extra intensity is due tothermal diffuse scattering that peaks at the Bragg reflectionsand is not attenuated by total reflection from a thin surfacelayer. Therefore, it is essential to use the measured intrinsiccurve as the reference. The difference between that and theRC measured with the object provides total attenuation (dueto true absorption and scatter rejection) at the peak of theRC, phase gradient (from the RC shift due to refraction) andUSAXS + SAXS (extra intensity at slopes and far tails ofthe RC).
2.3.3. Parametric presentation of the RC. In practice, thetransmitted intensity can be recorded only at a limited numberof analyser-rocking angles. This number is determined by thegoals of the study. For a visual comparison with a conventionalabsorption radiograph, a single image taken at the peak orslope of the RC may be adequate. For mapping, absorption,phase and scattering probably 5 to 10 images along the RC areneeded. Three different approaches are used for parametricpresentation of the images. In one approach, Taylor seriesof leading terms at the working points on the RC are used todescribe the intensity changes (Chapman et al 1997, Rigonet al 2003, 2007, Chou et al 2007). The second approach is tofit a functional form to the measured RCs. This form has to besufficiently flexible, and the parameters should correspond tothe different signals from the object. A Gaussian curve fitting(GCF) algorithm was suggested by Nesterets et al (2006) andused in image analysis (Diemoz et al 2012). To overcomethe limitations of the Gaussian form, more general functionshave been used: Voigtian (Suhonen et al 2007) and Pearson VII(Kitchen et al 2007, Fernandez et al 2008). The third approachis called MIR, where the RC is parameterized from severalmeasurements at different working points without actual curvefitting. The object RC (acquired with the sample) is comparedwith the reference RC (without the sample) pixel by pixel, andabsorption, refraction and scattering images are derived fromthe differences between the RCs (Oltulu et al 2003, Pagot et al2003, Wernick et al 2003).
8

J. Phys. D: Appl. Phys. 46 (2013) 494002 P Suortti et al
(a) Taylor series expansions. The original algorithm, calledDEI by Chapman et al (1997), is based on the first-order Taylorseries expansion of the RC R(θ) at the mid-slopes on the low(L) and high (H) angle sides.
R(θo+�θ) = R(θo)+(dR(θo)/dθ)�θ = R(θo)+R′�θ. (15)
The effects of refraction are converted to intensity changes ofthe beam reflected by the analyser at these working points.For instance, when the angle of incidence is increased dueto refraction, i.e., �θ > 0, the intensity increases at L anddecreases at H since the gradient of R is positive at L andnegative at H. The refraction angle �θ and the intensity IR ofthe forward transmitted beam are calculated when the intensityis recorded at L and H.
�θ = {IHR(θL) − ILR(θH)}/{ILR′H − IHR′
L}, (16a)
IR = {ILR′H − IHR′
L}/{R(θL)R′H − R(θH)R′
L}. (16b)
The images of these parameters are called the refractionimage �θ(x, y) and the apparent absorption image IR(x, y),respectively. The DEI algorithm is simple and adequate whenthe refraction angle �θ is small and the RC is not broadenedby scattering in the object. The higher order Taylor expansionshave been introduced to lift these limitations.
In the G-DEI, the transmitted intensity is recorded at threesettings of the analyser, and second-order Taylor expansionsare used at these working points (j ) (Rigon et al 2007, 2008).
Ij = IR{Rj + R′j�θ + (1/2)R′′
j [(�θ)2 + σ 2�θ(sc)]}. (17)
where, R′j is the first derivative and R′′
j is the second derivativeof the RC at the working point j . This three-equation systemcan be solved to yield the apparent absorption image IR(x, y),the refraction image �θ(x, y) and the USAXS image σ 2
�θ(sc).An identical expression is derived in the E-DEI method
(Chou et al 2007). A compact solution of the object propertiesis obtained by the introduction of a matrix formulation.
g = Ht, (18)
where, g is the data vector, t is an intermediate vector of mixedobject properties and H is the three-row matrix of elements Rj ,R′
j and (1/2)R′′j . Absorption, refraction and USAXS images
are given by the following equations:
IR = t1(x, y), (19a)
�θ = t2(x, y)/t1(x, y), (19b)
σ 2�θ(sc) = t3(x, y)/t1(x, y) − [t2(x, y)/t1(x, y)]2. (19c)
It is important that the working points can be chosen freelyin G-DEI and E-DEI. For instance, (18) is reduced to theoriginal DEI at or close to points L and H, where R′′ = 0, andthe USAXS image would be calculated from measurementsat an appropriately chosen third working point. The choiceof working points and the limitations of the algorithms havebeen discussed in detail on the basis of phantom studies andsimulated images (Rigon et al 2007, Chou et al 2007). Theoverall conclusion is that the algorithms yield reliable resultswhen the refraction angles and the width of the USAXSdistribution are small with respect to the width of the RC, andwhen the coefficients of the Taylor expansion are constantswithin sufficient ranges about the working points.
(b) Fitting functions for the RC. A different approach forextracting relevant parameters from ABI intensity distributionsacquired at a limited number of working points on the RC isthe use of suitable fitting functions for the RC. This may becomputationally heavy but allows flexible postprocessing ofthe data.
Gaussian is the obvious first choice for the fitting functionand has been used in the Gaussian curve fitting (GCF)algorithm (Nesterets et al 2006). The intensity is written as
Io,r = Ao,r exp[−(�θzo,r + θA)2/2σ 2o,r], (20)
where, the subscripts ‘o’ and ‘r’ refer to the object and referencecurves, respectively, for the peak value A, the centre �θz
and the standard deviation σ . The absorption is calculatedfrom the ratio ‘object/reference’, the refraction angle from thedifference ‘object-reference’ and USAXS = (σ 2
o − σ 2r )1/2.
The Voigtian function is the convolution of a Gaussian anda Lorentzian function, each of which is the limiting case whenthe other function becomes infinitely narrow. For practicalfitting purposes, a Voigtian is approximated by the pseudo-Voigtian, which is a weighted sum of a Gaussian GpV and aLorentzian LpV of equal FWHMs (Suhonen et al 2007).
V = κLpV + (1 − κ)GpV, (21)
where, 0 � κ � 1. In this approach, the transmitted beam isdivided into the nonscattered refracted beam, centred at �θz,and the halo of scattering around it. The RC is given by thesum of corresponding pseudo-Voigtian functions.
R(θA)/ωint = exp(−µT ){ξ [κrLr,pV + (1 − κr)Gr,pV]
+ (1 − ξ)[κoLo,pV + (1 − κo)Go,pV]}. (22)
where ωint is the integrated reflectivity of the analyser withouta sample, µ the absorption coefficient of a sample of thicknessT and ξ the fraction of the nonscattered beam. For a goodfit, a minimum of 5 RC angles are needed. It has been shownthat the scattering part is characterized by Lorentzian tails thatmay extend to angles more than ten times the FWHM of theRC (Suhonen et al 2007).
Pearson VII is a flexible function that has only a fewparameters,
P(x) = c[1 + (x − xo)2/(ma)2]−m, (23)
where c is the amplitude, xo is the centroid and m governsthe rate of decay of the tails. Both a and m determine theprofile width. Special cases are a Lorentzian (m = 1), amodified Lorentzian (m = 2) and Gaussian (1/m = 0). Ithas been demonstrated that P(x) can be fitted to the ABI RCsfrom different tissue types, allowing separation of absorption,refraction and scattering when the RCs are compared with theintrinsic RC (Kitchen et al 2007, 2008, 2010).
(c) Multiple-image radiography (MIR) and central moments.The obvious disadvantages of the function fitting approachare the need for multiple-image acquisition along the RCand probably excessive computing time in fitting the functionpixel by pixel. Therefore, simple algorithms are used that arebased, in most cases, on an explicit or implicit assumption
9

J. Phys. D: Appl. Phys. 46 (2013) 494002 P Suortti et al
of a Gaussian shape of the intrinsic RC and the scatteringdistribution. The object RC (acquired with the sample) iscompared with the reference RC (without the sample) pixelby pixel. Absorption, refraction and scattering images arecalculated from the differences in the zeroth, first and secondmoments of the RCs (Pagot et al 2003). Alternatively,Gaussian functions are explicitly used to extract these imagesfrom the differences between the object RC and referenceRC in a method called MIR (Oltulu et al 2003, Wernicket al 2003, Muehleman et al 2006). These approachesare supported by studies on phantoms that exhibit strongUSAXS. Measurements on actual tissue samples, however,indicate that USAXS may be weak while the SAXS intensityintegrated in the ‘long slit’ ABI geometry may be substantial(Fernandez et al 2008). At the moment, an adequate parametricpresentation of the scattering part in ABI remains to bedeveloped.
2.3.4. Geometrical optics approximation (GOA). Theabove description of ABI and the algorithms for retrieval ofabsorption, refraction and scattering of x-rays is based on thegeometrical optics approximation (GOA). The interactions of apencil ray with matter are assumed to take place in infinitesimalvolumes at the object and the analyser crystal. The propagationof the ray is fully described by forward diffraction in the objectand specular reflection at the analyser with probability R(θ).The area of the first Fresnel zone, where forward scatteringtakes place, is A = πr2
1 = πλd , where d is the distancefrom the object to the detector. At the analyser, the thicknessof the interaction layer, where total reflection takes place, isthe extinction depth, � sin θ . The conditions of the validityof GOA are often expressed by requiring that the Fresnelnumber NF = h2/λd = (h/r1)
2 and the Tagaki numberNT = (h/� sin θ)2 are much larger than unity (Pavlov et al2004), where h is the size of the object detail to be imaged,limited by the detector pixel size. For GOA to be valid, h
must be sufficiently larger than the lateral dimension of theinteraction volume in the object and the analyser.
Another way of expressing the validity condition of GOAis to require that the change of phase φ of the x-ray waveis small within the interaction volume. It is useful to giveestimates for the actual volumes of interaction. With an object-to-detector distance, d = 1 m and x-ray energy of 50 keV, thediameter of the first Fresnel zone is 10 µm. The extinctiondepth is independent of the x-ray energy, and from the valuesgiven in table 1, one obtains 1.5 µm for Si(1 1 1) and 8 µm forSi(3 3 3). The following example shows how a small phasechange within the first Fresnel zone translates to refractioncontrast at the analyser. From (6b), dφ/dy = 2πγ/λ, and ifdφ = 0.1 within 10 µm of the object in the lateral direction,the refraction angle of a 50 keV x-ray is 0.04 µrad. This maybe compared with the Darwin width wD of reflection given intable 1. The deepest slope of the RC is approximately 1.5/wD.In the case of Si(3 3 3) at 50 keV, the slope is 1.5 µrad−1. In theabove example, the intensity change due to refraction is 6% atthe slope of the RC, so that the linearity conditions of the DEIalgorithms (equations (16a) to (19c)) are evidently fulfilled.
GOA is often formulated as the requirement that theFresnel and Tagaki propagators (transfer functions) can beexpressed as low-order Taylor expansions (Pavlov et al 2004,Nesterets et al 2006). This is equivalent to the conditionsof the E-DEI and G-DEI algorithms. Analysis of simulatedand experimental data for cylindrical objects demonstrates thefailure of these algorithms at the edges of the object where thephase changes are large. In the MIR approach, the apparentabsorption, refraction and scattering signals are mixed at theedges, giving rise to artefacts such as SAXS from objects ofuniform density (Nesterets et al 2006).
When the object-to-detector distance is large theinterference within the propagating wave front is superimposedon the refracted wave. This is the origin of propagationphase contrast, which is proportional to the Laplacian ofphase, d2φ/dx2 + d2φ/dy2, and emphasizes the internal andexternal contours of the object. It has been suggested thatABI and propagation phase imaging could be combined forenhanced contrast (Coan et al 2005, Pavlov et al 2005).Data on cylindrical objects demonstrate that a wave-opticalcalculation is required to reproduce the experimental resultswhen propagation phase contrast is important, while GOAis valid at short object-to-detector distances (Bravin et al2007b). This corroborates the earlier observation that verystrong effects can be described within GOA, when Snell’s lawand the experimental intrinsic RC are used to calculate theintensity changes due to refraction (Keyrilainen et al 2002).
2.3.5. Scattering and DFI. It has been mentioned alreadythat scattering from the object provides essential informationabout micrometre and submicrometre structures, that is, onthe cellular and molecular level. In general, it is not possibleto invert (8) to solve the structure from the SAXS intensitydistribution, but the structure may be modelled, that is, usinginformation from electron microscopy. The diffraction patternis then computed on the basis of a few parameters deducedfrom experiment (Suhonen et al 2005). For instance, structuralparameters of fibrous collagen can be extracted. It has beenfound that cancer invasion causes changes in the structure ofcollagen in human breast tissue that becomes visible in theSAXS pattern (Fernandez et al 2008, Sidhu et al 2009). Instandard ABI, this would mean mapping scattering by tuningthe analyser to the far tails of the RC. In principle, the entireSAXS intensity pattern could be recorded by rotating theanalyser crystal. For many purposes, however, recording ofthe scattering within a limited angular range may be sufficient.In ABI, a Laue-type analyser crystal splits the transmittedbeam into the direct beam and the diffracted beam, which arethen recorded simultaneously (Ingal and Beliaevskaya 1995,Sunaguchi et al 2010). In this setup, the incident beam isexpanded by asymmetric reflection at the monochromator asshown in figure 8.
DFI is a method where refraction and scattering arerecorded separately from the attenuated nondeviated beam.The reflected beam from the first crystal, expanded by theasymmetry of the crystal, has a very small divergence, so thatthe Pendellosung effect is observed in the analyser crystal thathas uniform thickness. When the crystal thickness is chosen
10

J. Phys. D: Appl. Phys. 46 (2013) 494002 P Suortti et al
Figure 8. Setup for DFI using a Laue-type analyser crystal. Theincident x-ray beam is expanded and made more parallel by anasymmetrical reflection at a Bragg-type monochromator. Due to thePendellosung effect, the nonscattered beam is directed to the 2θangle, while the scattered and refracted beam is transmitted in theforward direction, providing a dark-field image of the sample.Reprinted from Sunaguchi et al 2010, Copyright (2013), with kindpermission from the American Institute of Physics (AIP).
properly, and the analyser is tuned to the peak position thenondeviated beam is diffracted to angle 2θ , while the refractedand scattered part passes through the crystal in the forwarddirection (Ando et al 2004, 2008, Sunaguchi et al 2010). Inanother method, the Pendellosung effect is not utilized but theanalyser is tuned to the tail of the intrinsic RC (Kitchen et al2010). The nonscattered beam is not reflected but transmittedin the forward direction, while the scattered beam is reflected inthe 2θ direction. The two beams are recorded simultaneously.An algorithm has been developed to separate the contributionsof absorption, refraction and scattering (Kitchen et al 2010,2011).
2.3.6. Tomographic imaging and reconstruction. Theinteraction of a pencil beam with an object is described bythe local values of the absorption coefficient, µ(x, y, z); thelateral phase gradient, gradtφ(x, y, z), and the scattering (ordiffusion) coefficient σ(x, y, z), where z is the propagationdirection and x is perpendicular to the plane of diffraction(see figure 1). CT imaging and reconstruction are possible,if the line integrals of these coefficients give the cumulatedabsorption, refraction angle and scattering behind the object.This implies that the pencil beam stays together within thechannel determined by the detector pixel. While this is thecase for the nondeviated, attenuated beam and probably forthe refracted beam, scattering may spread over many pixels.
In ABI, the y-component of the refraction angle isregistered by the analyser crystal. This is the line integralalong the beam path, and from (6a), we have obtained thebelow equation:
γ =∫
dγ =∫
(dδ/dy) dz. (24)
The gradient of the real part of refractive index δ can bemapped by CT reconstruction from a sufficient number ofprojected arrays of γ when the object is rotated about the y-axis (Dilmanian et al 2000). If the rotation is about the x-axis,the integrand is (dδ/dy) sin ε, where ε is the angle betweenthe beam direction and the gradient. A different algorithm
is required for reconstruction of the refractive index gradient(Maksimenko et al 2005).
The attenuation coefficient and refraction index gradientare given by scalar values. The first is always positive whilethe second takes positive and negative values. The integralvalue of the real part of refraction index gradient for the field-of-view of the whole object is zero (Kitchen et al 2011). Thesituation in SAXS is more complex. The forward x-ray beam ata distance z from the entry point is the sum of the nonscatteredand SAXS beams, which have been refracted and attenuatedby scattering that is not observed in the forward direction. Theintensity distribution is convolved by the scattering probabilityfunction between z and z+dz, that is, by function |Tz(k)|2 (6a)and (6b). The Fourier transform of this function is V (r), theintegral of which is proportional to the scattering coefficientσ(x, y, z) per unit path length. Using the convolution theorem,the successive convolutions of intensity are written as theinverse Fourier transform of the successive multiplicationsof the corresponding Vz(x, y). The Fourier transform of theintensity distribution behind the object, F [Ix,y(k)], gives thisproduct.
Both |T (k)|2 and V (r) are modified in ABI becauseof the long-slit geometry and the rotational averaging inCT. Probably, the maximum information about the samplestructures contributing locally to SAXS is the width andintegral of V (r). A parametric presentation on the basis ofGaussian functions has been given by Chen et al (2010). Thesefunctions have convenient properties because the Gaussianform is retained in successive convolutions, multiplications andin Fourier transforms. The transmitted intensity of the directbeam is reduced exponentially by SAXS, and the exponent isa line integral of the local scattering cross section and numberdensity of the particles. Standard CT reconstruction methodscan be used that yield a map of characteristic sizes of thescattering particles.
A Gaussian description of the SAXS distributions hasits limitations as previously discussed. It would be possibleto develop CT reconstruction algorithms based on differentfunctional forms such as Lorentzian and even Voigtian orPearson VII. For instance, convolutions of Lorentzians result ina Lorentzian where the FWHM is the sum of the FWHMs of theindividual Lorentzians. The Fourier transform of Lorentzianis of the form exp(−a|r|).
In summary, when the effects of absorption, refraction andscattering on the RC in ABI can be separated in a projectionimage, CT imaging and reconstruction of the respective objectparameters is possible (Khelashvili et al 2006). Attenuationdue to true absorption and scatter rejection as well as the phasegradient due to changes in the refractive index are well definedbut the inversion of the object structure and composition fromthe scattering pattern is model dependent.
3. ABI instrumentation and radiation sources
Refraction contrast of x-rays was demonstrated usingconventional tube sources and ABI setups (Forster et al 1980,Podurets et al 1989). There were also applications to softtissue imaging (Ingal and Beliaevskaya 1995, Ingal et al 1998),
11

J. Phys. D: Appl. Phys. 46 (2013) 494002 P Suortti et al
although the exposure times were long. Rapid developmentsof the ABI methods took place only when SR was introducedin this field (Chapman et al 1997, Pisano et al 2000, Arfelliet al 2000). Extensive references to subsequent work are foundin review articles (Suortti and Thomlinson 2003, Keyrilainenet al 2010). Detailed accounts on instrumentation and imagingalgorithms have been given in recent PhD theses (Coan 2006a,2006b, Suhonen 2008, Diemoz 2011).
The availability of SR is limited so that in order totransfer ABI to a clinical setting, new x-ray sources are beingdeveloped. At the same time, innovative constructions andoptical solutions based on use of conventional x-ray sourceshave been put forward. It is essential that the x-ray beamon the object is monochromatic (longitudinally coherent) buttransverse coherence is not important, that is, extended sourcescan be used. In the diffraction-enhanced x-ray imaging (DEXI)instrument, a 2.2 kW silver line-anode x-ray tube serves asthe source and (3 3 3) reflections from a pair of Ge and Sicrystals are used to provide a monochromatic Kα1 (22 keV)beam, which measures 12 × 60 mm at the sample (Neschet al 2009). A Si(3 3 3) analyser is followed by a digital areadetector with an overall spatial resolution of about 150 µm.The measured flux is 800 photons mm−2 s−1 so that 40 minexposures are needed to reach image quality that is adequatefor mammography. In another construction, a 1 kW tungstenpoint source and Si(3 3 3) monochromator and analyser areused. The measured flux of WKα radiation on the sample is4400 photons mm−2 s−1 in a beam about 1.5 mm wide so thata macroscopic object can be scanned across the beam (Parhamet al 2009). If these results are extrapolated to setups where60 kW rotating anode x-ray tubes are used, the imaging timefor a planar mammogram is approximately 1 min, which is stilltoo long for clinical mammography (order of ms).
To bridge the gap between conventional and synchrotronsources, several new concepts and constructions have beenintroduced. ‘Table-top’ sources include a mini synchrotronwhere a circulating electron beam of high energy (orderof 10 MeV) hits a wire or rod target emitting a cone ofbremsstrahlung radiation in the forward direction (Hirai et al2006). The cone-shaped beam is well suited for GI and PBI,and probably could be used for ABI, too. In a high-brilliancex-ray ‘tube’, the solid target is replaced by a jet of liquidmetal and an electron beam is focused on the jet (Tuohimaaet al 2007, Larsson et al 2011). The spectral brilliance of thesource is approximately ten times higher than the brilliance ofa microfocus x-ray tube. It may be possible to further increasethe brilliance by one or two orders of magnitude.
Compact narrow-band SR sources are based on inverseCompton scattering where a laser pulse is back scattered ashard x-rays by a head-on collision with an electron bunchin a small-scale storage ring. The pulse interval is of theorder of 10 ns, the radiation is collimated to a cone of afew mrad opening, and the spectral bandwidth is of theorder of 1%. Several light sources are under construction orbeing commissioned, and their performance is expected to becomparable with the performance of bending magnet sourcesof large synchrotrons (Lyncean Technologies 2012, Variolaet al 2010). GI and PBI using an inverse Compton scattering
source have been demonstrated (Bech et al 2009, Yamada et al2009).
4. Applications of ABI
4.1. Breast
Imaging of breast tissue is one of the most active areas ofsynchrotron biomedical research. The first monochromaticx-ray imaging experiments were reported by Burattini et al(1992, 1995). In those early experiments, the use ofmonochromatic SR x-rays showed some enhancement incontrast. There was no PC component to the images. Perhapsone of the most important results of the experiments was thatit was the basis upon which Johnston et al decided to repeatthe measurements, and in the process, they applied ABI tosynchrotron imaging for the very first time (Johnston et al 1995,1996, Chapman et al 1996). In those experiments, they imagedstandard clinical mammography phantoms, including for thefirst time samples with a tissue equivalent of a compressedbreast in clinical examinations. Other workers demonstratingthe ABI technique on laboratory sources had used thinsamples (Davis et al 1995a, 1995b, Ingal and Beliaevskaya1995). It was important to show that phase information, inthis case refraction, was retained and contributed to imageenhancement in thick samples. In addition, in the courseof these experiments, the first deconvolution of the imagestaken at various points of the RC was made resulting in bothapparent absorption and refraction angle images. The DEIalgorithm was developed (Chapman et al 1997) and applied tohuman breast tissue images (Chapman et al 1998). In parallelwith the development of the synchrotron ABI techniques,Ingal et al (1998) showed that the absorption and refractionimages of ABI do not depend on the coherence properties ofa synchrotron source. They used a laboratory-based sourceto obtain breast tissue images. During this same period,the development of PBI breast imaging was being carriedout, ultimately leading to the human clinical trials currentlyunderway at the ELETTRA synchrotron facility (Arfelli et al2000, Castelli et al 2011). Coan et al (2013) are reviewing thevarious synchrotron PC breast imaging technologies.
The motivation for using synchrotron imaging methodsin breast imaging is to increase the effectiveness ofmammography in diagnosing cancer. With the ABI techniqueit is hoped to increase the information content in mammogramsthrough higher-contrast images, high-resolution details andobservation of small calcifications and potential tissuedifferentiation. ABI also allows the imaging at lower radiationdose by working at high energies, and the same goal is beingattained by Talbot-Lau GI (Stutman et al 2013). At all stagesof development of ABI breast imaging, it has been importantto compare the images with the very best competing modalitiesand to validate the analysis of the images through directcomparison with histological examinations of the imagedtissues.
An example of some of the earliest planar breast imagingis that of Pisano et al (2000) using the DEI analysis to createa refraction angle image. In this study, seven excised breast
12

J. Phys. D: Appl. Phys. 46 (2013) 494002 P Suortti et al
tissues with known cancerous lesions were imaged, and theimages assessed professionally. In six of the seven cases,there was improved assessment of the disease. The imagesshowed excellent correlation with the histopathology. Oneexample of tissue with invasive lobular carcinoma is shown infigure 2 in which the DEI refraction image (b) is comparedwith a SR digital radiograph (a) and a photomicrograph (c)of the specimen. Synchrotron radiographs are taken with thesynchrotron imaging setup without the analyser in place. Thesample was 1 cm thick and placed between plastic plates sothat the effective thickness was approximately 4 cm. TheDEI images were taken at 18 keV using a Si 3 3 3 analyserat symmetric positions corresponding to the plus and minushalf intensity points of the RC. The surface dose on thesample was estimated to be a few mGy. It is clear that therefraction image shows much more detail than the radiographyand correlates excellently with the histology. Visualizationof lesion spiculations and architectural distortion improvedrelative to the radiographs along with correlations to thehistopathology that explained the images. The radiation doseto the tissue was a few mGy, but the authors noted thatworking at an energy of 30 keV would reduce the dose byan order of magnitude. Some data taken at that energy showedimages that were comparable. On the basis of this earlystudy, they speculated that ABI could become a clinical toolif compact clinical sources were to be developed. PlanarABI breast tissue evaluation and optimization has been a veryactive area of research to improve the technology, validate theimaging modality with respect to clinical standards and assessadvantages for future clinical utilization (Hasnah et al 2002,Kiss et al 2004, Fernandez et al 2005, Keyrilainen et al 2005,Liu et al 2007, Faulconer et al 2009, Kao et al 2009).
In terms of visualization of the features in breast tissue, itwas found during the early studies that it is not necessary toactually produce separate apparent absorption and refractionimages. In fact, for clinical use, it may be best to use thedirect images taken either at the top of the RC or at variouspositions on the slopes of the RCs. At the top of the RC, theimages have contributions due to true absorption, extinctiondue to scatter rejection by the narrow angular width of theRC and some refraction. The top images are superior inrevealing small calcifications due to the effects of refractionand scatter rejection. On the other hand, the slope images withfurther enhanced refraction effects are sensitive to refractingthe boundaries of other small but weakly absorbing structures.The contrast enhancement from refraction can be so strong thatthe calcifications are obscured by the improved contrast fromthe other structures. Probably the most interesting observationby Keyrilainen et al (2005) was the strong contrast that arisesfrom scatter rejection. There was evidence that the apparentabsorption in top images arose from increased scattering fromdisintegrated supramolecular structures, which increase thelocal variation of the density. The histological sections verifiedthat unchanged collagen, which had an inactive background ofconnective tissue, had a very low signal in the top images. Inthe regions where contrast was strongest in the top images, thecollagen was very interlaced, and an active de novo synthesisof collagen was in progress.
One of the most significant developments in DEI breastimaging was the introduction of CT techniques. High-resolution, low-dose CT images of breast tissue has been theobjective of a number of synchrotron studies (Fiedler et al2004, Bravin et al 2007a, Keyrilainen et al 2008, 2010, 2011,Zhao et al 2012). As an example of DEI-CT compared withhistology, the work by Bravin et al (2007a) has been chosen.Figure 9 is a DEI-CT image of an excised breast tissue samplewith partly ductal and lobular carcinoma. The DEI images ofthe cylindrical samples with a diameter of 5 cm were takenat 33 keV in the CT mode with a Si 3 3 3 analyser. For thiswork, a high-resolution FReLon detector (Coan et al 2006a,2006b) with 47 µm resolution was used. In DEI-CT mode,the mean glandular dose (MGD) for both the slope and topimages was approximately 14 mGy; for the SR CT image, itwas 25 mGy and for the clinical CT, it was 12 mGy. Thus,the dose is comparable with that one may receive in clinicalpractice.
The DEI-CT top images, where the contrast is due torefraction and scatter rejection, have the closest resemblanceto the optical images of the stained histology sections andare visually perhaps the most useful for diagnosis. Themorphology of the object is most obvious in the DEI-CTslope images where the refraction highlights the interfaceswhere density changes occur. On the other hand, as earlierwith planar DEI, the extreme detail in the refraction (slope)image can obscure details such as calcifications. It maytherefore be necessary to use processed images using, forexample, the MIR approach to display separate absorption,refraction and scattering images (Wernick et al 2003). Oneimportant circumstance relative to in vivo applications was theindication that enhanced contrast at ABI-CT is possible witha clinically acceptable radiation dose (Keyrilainen et al 2008).The MGD of ABI-CT at 30 keV was found to be approximatelyequivalent to the dose administered in single-view screeningmammography (MGD of 2–3 mGy). It was also comparableto the dose delivered in planar PC mammography, as had beenreported in earlier publications (Arfelli et al 2000, Pisano et al2000, Keyrilainen et al 2005).
In a very recent study, Zhao et al (2012) report the useof ABI-CT for 3D imaging of human breast cancers at high-resolution and low radiation dose. A SR beam of 60 keV wasused to significantly reduce the radiation dose to the sample.For this experiment, the analyser crystal, Si (3 3 3), was setnear the top position of the RC. Using the equally slopedtomography (EST) reconstruction method (Fahimian et al2010), a limited number of projections are adequate. For theimages in figure 10, only 512 projections were used with imagequality equivalent to those taken with 2000 projections andreconstructed with a standard filtered back projection (FBP)algorithm. At an effective resolution of 92 µm CT images wereobtained with a MGD of 2 mGy, which is comparable with thedoses prescribed in mammography accreditation programmes(ACR 1999). Figure 10 shows the 3D visualization of atumour along with additional fine features. Implementationof the EST-based ABI technique has the distinct advantageof fewer projections, thus decreasing the dose and the timefor the imaging. These data should lead to development
13

J. Phys. D: Appl. Phys. 46 (2013) 494002 P Suortti et al
Figure 9. (a) Scanner image of the histologic whole-mount slide from the centre plane of a 28 mm thick sample of excised breast tissue withductal partly lobular carcinoma (Herovici’s stain; original magnification, ×1). (b) Clinical screen-film mammogram of the same sample(26 kV, 8.0 mAs). (c) Clinical CT image of the same sample (80 kVp, 50 mAs). (d) DEI-CT top image of the same sample (33 keV). (e)DEI-CT minus image of the same sample (33 keV). (f ) SR-CT image of the same sample (33 keV). The various arrows indicate carcinomas,microcalcifications, collagen, ducts and malignancies as described in detail in the original reference. Reprinted from Bravin et al 2007a,2007b, Copyright (2013), with kind permission from IOP Publishing Ltd.
of high-contrast, low-dose in vivo breast CT, which wouldallow 3D microscale information on breast structures to beobtained nondestructively. Clinical implementation is possibleif the compact sources being developed can generate thenecessary flux.
Image quality depends not only on the radiation dosein the organ but also on other factors related to the imagingsystem and target. There is inevitable loss of intensity whenthe transmitted beam is analysed by the perfect crystal (or by anabsorption grating in GI). In this respect, ABI at the top position
14

J. Phys. D: Appl. Phys. 46 (2013) 494002 P Suortti et al
Figure 10. Three-dimensional visualization of a breast tumour from the EST. In total, 512 projections were taken at 60 keV near the topposition of the RC. (a) A segmented tumour in an axial slice, in which the yellow contour line indicates the tumour boundary. (b) Threeperpendicular slices of the segmented tumour (in red). (c) Three-dimensional volume renderings of the tumour (in red) in which the arrowsindicate different fine features: 1, lobules; 2, tumour; 3, skin and 4, lactiferous duct. Reprinted from Zhao et al 2012, Copyright (2013), withkind permission from the National Academy of Sciences of the United States of America.
of the analyser is most favourable because crystal reflectivityis close to unity. Another advantage of ABI is that the perfectcrystal analyser rejects virtually all background. Blurring ofthe image due to organ movement is avoided by short exposuretimes. Ideally, single 2D shots or multiple shots within a fewseconds would provide high-resolution PC mammograms oreven reconstructed CT or tomosynthesis images. Sufficientflux is available from SR sources and presumably will be alsofrom the compact sources being developed. Perfect crystaloptics for wide-field ABI have been built and demonstrated(see figure 8). Focusing provides high beam intensity butrequires scanning of the object and development of imagingoptics. The results quoted above indicate that high-resolutionABI-CT images can be acquired with MGD of approximately1 mGy and planar images at even lower doses. These limitsmay be reached in many different ways by using optimizedx-ray optics, exposure protocol and detectors.
4.2. Cartilage and bone
The study of DEI applied to imaging joints began with theseminal work by Mollenhauer et al (2002). By studying in vitrohuman articular cartilage from both intact and disarticulatedjoints, they showed for the first time with x-rays that thevisualization of structural organization as well as orientationin gross cartilage defects, even at very early stages in thedegenerative process is possible. Noninvasive detection ofthe initial stages of degenerative articulation diseases, typifiedby osteoarthritis, is currently rather limited and with ordinaryx-ray radiography generally impossible. Therefore, theseresults served as favourable evidence for the potential ofDEI technology to extend from preclinical mammography topreclinical skeletal radiology. Cartilage is visible in standardradiographs when osteoarthritis has advanced to a level ofsevere disease and by then intervention is not possible. Hence,the goal of the DEI study was to determine the efficacy ofpossible diagnosis of early disease by imaging the cartilage andsubchondrial bone at high resolution (100 µm). The cartilagewas visible due to refraction imaging and the condition ofthe bones was seen largely due to absorption and scattering.Human talus and intact human knee joints were imaged withSR in the planar DEI mode at both 18 and 30 keV. Total
exposure time varied from 4 s to 6 s and radiation dose from1 mGy to 3 mGy for 30 keV and 18 keV images, respectively.One outcome was that the higher energies also producedexcellent images. On the basis of comparisons with thehistology of the samples, they found excellent correlationwith the high visibility of degenerative cartilage disease inthe images. Working at various positions of the analyser onthe RC and using cartilage ranging from normal to severelydamaged, this work laid the foundations for all later cartilageand joint imaging studies.
Later studies imaged the soft tissues of the foot and ankle(Li et al 2003, 2005, 2009, Muehleman et al 2004a, 2004b,2009a, 2009b) and continued to develop the techniques to studycartilage damage (Muehleman et al 2006) and rat spines (Kellyet al 2006). The DEI technique is one dimensional, and itis sensitive only to refraction in the plane of the scatteringvector. This is evident in the images of the bones in the joints.This orientational dependence of the refraction can be a usefultool in understanding the intrinsic structure of the samples(Majumdar et al 2004, Muehleman et al 2004b). Cooperet al (2011) used this effect to understand the development oftrabecular bone, and also DFI has been used in cartilage studies(Shimao et al 2005, 2006). One applied area for DEI studiesof bone has been on investigating the bone growth in relationto metal implants (Connor et al 2006, Wagner et al 2006, Coanet al 2008). Such studies cannot be made successfully usingstandard radiographic techniques, making destruction of thesamples necessary for visualization. The DEI results haveallowed evaluation of the quality of integration of the bonewith the metal implants. As the ABI applications to cartilage,bones and joints matured, the advanced analysis algorithmswere applied to elucidate the soft tissue, cartilage and bonestructures (Wernick et al 2003, Diemoz et al 2010a).
In clinical absorption-contrast imaging, the patientmovement during the exposure may cause radiographicblurring (unsharpness) in the acquired image. It was stillunknown if a high-flux SR beam together with a fast readoutdetector are able to resolve the refraction and extinction effectsin in vivo imaging. On the other hand, in order to studythe development of osteoarthritis and potential interventionfor treatment, it is best if a model can be developed forlongitudinal in vivo studies of the disease. One such study by
15

J. Phys. D: Appl. Phys. 46 (2013) 494002 P Suortti et al
Figure 11. (a) Lateral view ABI planar image (plus 50% slope) at 52 keV of the knee of a guinea pig presenting two osteophytes (plussigns). (b) Frontal view ABI planar image (plus 50% slope) of a guinea pig joint, in which an osteophyte at its early stage (plus sign), acalcified meniscus (diesis sign) and possible cartilage damage zone (arrow) are indicated. Reprinted from Coan et al 2010a, Copyright(2013), with kind permission from IOP Publishing Ltd.
Coan et al (2010a) developed a guinea pig model for in vivostudies of the anatomy of joints and detection of osteoarthritisin articular joints. Working at 52 keV allowed the dose tobe acceptable for repetitive imaging of the joints at highresolution (47 µm). Figure 11 presents ABI planar imagesof guinea pig knees clearly showing the osteophytes at theirearly stages. Osteophytes are formations that may grow onthe edges of joints and represent one of the signs and effectsof osteoarthritis progression together with cartilage loss andinflammation. The importance of this principle study lays inthe fact that the ability of both ABI and ABI-CT in depictinganatomic details was shown for the first time in complex livingorganisms. In addition, it was able to reveal all known signsof osteoarthritis with high-contrast, high spatial resolution andwith a clinically acceptable radiation dose (an entrance doseof about 0.15 mGy).
Along with longitudinal studies, many experiments haveshown that in order to advance osteoarthritis research usingthe ABI technology, it will be necessary to use laboratory-based/clinical based systems. One such study on imagingarticular cartilage of disarticulated tali at various stages ofdegeneration was reported by Muehleman et al (2010) in whichthey used the DEXI developed by Nesch, LLC (Nesch et al2009, Fogarty et al 2011). The efficacy of DEXI is shownin figure 12, which shows the photograph (a), radiograph(b), extinction (c), scatter (d) and refraction (e) images of atalus sample with both normal and diseased cartilage throughapplication of MIR analysis (Wernick et al 2003). Theirimages showed that early diagnosis of disease may be possible
with detection of lesions not visible with radiography. Theplanar DEXI refraction image highlighted both the cartilageand bone best. This work clearly demonstrated the usefulnessof the laboratory sources for studying osteoarthritis even ata relatively low x-ray energy of 22 keV. In clinical practice,such a low energy is typically not used to image dense bonedue to low signal-to-noise and relatively high radiation dose.The dose with 4 min exposure time per angular position wasof the order of a few mGy. The DEXI instrument has aspatial resolution of approximately 150 µm and 12 by 60 mmfield-of-view (Nesch et al 2009). As the authors noted, oncethe working energy is increased, the DEXI instrument (andother table-top sources) will be a suitable compliment toconventional radiographic imaging tools.
Li et al (2012) studied the efficacy of planar DEI imagingfor assessing cartilage degeneration. Human cadaveric intactknee joints were imaged with six surfaces of interest identifiedusing a SR beam of 40 keV. The samples and the DEI imageswere assessed and graded to evaluate the technology. Theyfound significant correlation with the actual gross anatomyof the samples for the diagnosis of both cartilage lesions andchondrocalcinosis. One example of the imaging of a kneewith an abnormal ridge on the lateral condyle bone is shownin figure 13. For this sample, the cartilage is intact and veryclearly shown, demonstrating the visualization and assessmentof the joint. Average radiation dose was approximately 1 mGyper 5 min scan. The detector has a pixel size of 31.2 µm withan active imaging area of 12 × 80 cm2. These authors alsopoint to the development of laboratory-based and clinical based
16

J. Phys. D: Appl. Phys. 46 (2013) 494002 P Suortti et al
Figure 12. Photograph (a), radiograph image (b) and DEXI images(c)–(e) at 22 keV of a human talus displaying both normal andfibrillated articular cartilage. The dashed line arrow in thephotograph is the direction of the x-ray beam. The fibrillated site isidentifiable in both the photograph of the specimen and in the DEXIimages (solid arrows), but the articular surface is smooth anduninterrupted in other regions and shows a homogeneousappearance. The synchrotron radiograph shows a cartilage shadowbut no signs of fibrillation. It is important to note that this is ahigher-quality radiograph than would be obtained through trulyconventional radiography. Reprinted from Muehleman et al 2010,Copyright (2013), with kind permission from John Wiley and Sons.
compact sources as being critical to the future applications ofABI to the study of joint disease.
4.3. Soft tissue
Breast tissue is naturally the soft tissue most widely beingimaged by ABI. There have been, however, many otherexamples of soft tissue and small organs having been imagedby this technique. Some examples, in addition to thosealready referenced above and to be detailed below, are uterineleiomyomas (Liu et al 2005), microorgans and soft tissues(Gao et al 2006), porcine eye (Kelly et al 2007), liver (Huet al 2009), mouse organs (Zhang et al 2010) and stomachwith gastric cancer (Tang et al 2012). In recent years, ABI hasbeen applied in many new areas of biomedical research. Thefollowing three subsections detail some images illustrating thebreadth of soft tissue imaging capabilities.
Figure 13. (a) Photograph of a human knee joint showing anabnormal ridge in the morphology of the lateral femoral condyle,which is also identifiable in the oblique ((b), solid arrows) andlateral ((c), solid arrows) DEI views (refraction images) of the sameknee taken at 40 keV. The integrity of the cartilage is intact and isidentifiable by a crisp edge in the DEI images. At the dashed arrowin (c), collagen fibre bundles of a tendon are also seen. Only acartilage shadow is barely visible in the synchrotron radiographimage in (d). Reprinted from Li et al 2012, Copyright (2013), withkind permission from John Wiley and Sons.
4.3.1. Lung. Lung structure is a fractal tree of airways thatterminate in alveoli. The specific surface of the alveoli is large,and together with the large density, difference between air andlung tissue, this gives rise to strong SAXS as shown above (seeequation (11)). This was observed already in early DEI studies(Zhong et al 2000). At the top position of the analyser crystal,the apparent absorption in mouse lung was about four timeslarger than normal absorption due to the contribution of scatterrejection (extinction). Another observation in lung imaging ismultiple refraction that leads to variable focusing and specklepatterns. The alveoli act as an assembly of refractive lenses(Snigirev et al 1996, Kitchen et al 2004). The effects of
17

J. Phys. D: Appl. Phys. 46 (2013) 494002 P Suortti et al
Figure 14. Reconstructed MIR images of an adolescent mouse thorax. (a) Refraction angle image. (b) Scatter-half-width at half-maximum(HWHM) image. (c) Integrated absorption image. (d) Peak absorption image. Field-of-view: 21 × 21 mm2. X-ray energy: 26 keV. Netexposure time: 78 s. Reprinted from Kitchen et al 2010, Copyright (2013), with kind permission from the Optical Society of America.
multiple refraction and SAXS are inseparable, and togetherthese may be used for observing pathological changes in thelung structure (Lewis et al 2005).
The combination of a Bragg-type monochromator and aLaue-type analyser has been used for planar ABI of a mouselung ex vivo (Kitchen et al 2008, 2010, 2011). The RC wasmeasured at each image pixel with and without the object, andPearson VII functions were fitted to the measured curves. Forthe actual imaging, the forward diffracted and 2θ diffractedbeams were recorded simultaneously at a RC angle where thetransmitted intensity without the sample is weak but SAXSfrom the object is still strong. An iterative algorithm wasdeveloped for reconstruction of absorption, refraction andscattering images (Kitchen et al 2010). The demonstration ofthis is presented in figure 14, which shows the reconstructedMIR images of the mouse thorax. SR x-rays of 26 keV wereused to image the field-of-view of 50 × 40 mm2, which wassufficiently large to image the chest of mouse in a singleexposure with a pixel size of 16.2 µm. The entrance doserate of 23 mGy s−1 and exposure time of 78 s resulted in a highentrance dose of 1.8 Gy.
DFI setup (see figure 8) was utilized in another lung tissueimaging study (Sunaguchi et al 2010, 2011). The crystalthickness was chosen such that the nondeviated SR beam of35 keV was reflected in the 2θ direction, but the beam refractedand scattered in the sample passed through the analyser crystalto the detector. DFI provides a refraction (and scattering)
contrast map of the sample. The beam of 1.65 × 38 mm2
from the monochromator is expanded by an asymmetric cutmonochromator crystal so that the sample can be imagedwithout scanning. Figure 15 shows examples of the planarDFI images of forwardly diffracted and diffracted beams with apixel size of 12.5 µm. It presents an excised honey-comb lungtissue sample from a human with end-stage lung associatedwith collagen vascular disease. The other special feature wasthe use of tomosynthesis reconstruction from 91 projectionimages by the shift-and-add and FBP methods. The figuredemonstrates that image quality in tomosynthesis is as good asin a normal CT image and the images have close resemblanceto the stained histological image. This opens new avenues insoft tissue imaging, particularly when the radiation dose andimaging time must be kept to a minimum.
4.3.2. Brain. It has long been known that Alzheimer’sdisease is related to the presence of amyloid plaques in theaffected brain. These plaques are very small, of the order of5–200 µm, and of low inherent contrast in CT and magneticresonance imaging (MRI). In addition, they are smaller than theresolution of nuclear medicine imaging (Connor et al 2009a).For those reasons, it has been historically difficult to image andquantify individual plaques in the live human brain. Positronemission tomography (PET) and MRI can determine bulkmeasurements of plaque quantities but not individual plaques.
18

J. Phys. D: Appl. Phys. 46 (2013) 494002 P Suortti et al
Figure 15. Comparison between images of a human lung tissuesample obtained by DFI imaging optics and the comparablehistological image. An example of (a) forwardly diffracted planarimage, (b) diffracted planar image, (c) refraction-contrasttomosynthesis image with the shift-and-add method, (d)refraction-contrast tomosynthesis image with the FBP method, (e)refraction-contrast CT image and (f ) a histological image stainedwith Hemotoxylin-eosin stain. Arrows (i) show remaining alveoli.Arrows (ii) show dilated air spaces. Arrow (iii) shows the thickenedseptum. Arrows (iv) show small arteries identified in the septum.Reprinted from Sunaguchi et al 2011, Copyright (2013), with kindpermission from the American Institute of Physics (AIP).
One new approach to imaging the brain to determine theanatomical details of the plaques and the mass density of eachindividual plaque in the brain is to use PC imaging. PBI hasbeen shown to be capable of such measurements ex vivo (Noda-Saita et al 2006). In recent times, Connor et al (2009a) testedthe efficacy of using DEI-CT to measure plaque in the mousebrain model. Their experiment used excised mouse brainsfrom both wild mice and transgenic mice showing Alzheimer’s
plaque development. The imaging was performed in CT modeat 20 keV with a Si 333 analyser. The data acquisition wasperformed with 36 by 24 mm field-of-view and a 9 µm pixelsize. The acquisition time was 1 s per projection image, and theaverage total absorbed dose within the brain was 28 Gy. TheDEI refraction images were directly compared with the samplehistology and the measured number density of the plaques inthe cortex in DEI-CT agreed well with that of the histology.
Figure 16 shows the coronal DEI-CT slice image throughthe brain of a transgenic mouse and its histology. It is evidentthat there is excellent quantification and identification of theamyloid β plaques throughout the cortex and hippocampusof the mouse brain. The correspondence of radiographicappearance with actual morphological structures in the stainedsections is near one-to-one. The plaques were less than 30 µmin diameter, which can be improved upon in the future witha theoretical limit of approximately 2 µm. Thus, DEI-CTshould be able to depict even the smallest plaques of 5 µm indiameter without the use of contrast agent. Figure 16 shows,as was also seen in a recent breast study (Keyrilainen et al2011), that the appearance of DEI-CT is more similar to MRIthan the ordinary absorption-contrast CT due to its ability togenerate high contrast in soft tissue. One problem foreseenfor the future by the authors is imaging of a brain withinthe skull. CT imaging artefacts may obscure the very smallcontrast resolution (2%) of the plaques. One way to avoidsuch a situation will be to image at much higher energieswhere the skull artefacts may be greatly reduced. The highradiation dose required for the high-resolution DEI-CT meansthat such an imaging method will not be applied in vivo tohumans but will be a promising animal research model. Asnoted by the authors, for humans, low-dose planar DEI couldyield a measure of relative plaque load.
4.3.3. Circulation. Visualization of the circulation inorgans can be a crucial tool for diagnosis and monitoring thedevelopment of many diseases, which alter the morphologyof blood vessels. At present, the methods used for studyingthe vessels are radiography and MRI with contrast agents andbiopsy. Clearly, a noninvasive imaging method is preferable tobiopsy. The use of contrast agents is occasionally not possiblefor patient medical reasons, and MRI suffers from poor spatialresolution relative to x-ray imaging. One approach being takenis to use PC imaging in the form of ABI to overcome the lackof contrast in standard radiographs (Seo et al 2012, Zhanget al 2013). Zhang et al (2013) studied the efficacy of planarDEI to visualise the extracellular matrix proteins associatedwith liver fibrosis. In the randomized study, they used mice inwhich the common bile duct was ligated and then imaged theexcised livers after 15 and 40 days using SR beam of 15 keV.The acquisition time for each image of 10.9 µm pixel sizewas approximately 300 ms. Comparison was made with thehistology of each sample, and excellent correlation was found.Information was compared for images taken at the FWHMpoint of the RC with that for DEI refraction images obtainedby subtraction of two opposite slope images. Figure 17 showsthe refraction images of mice from three randomized groups(normal, 15 days and 40 days), and the associated changes in
19

J. Phys. D: Appl. Phys. 46 (2013) 494002 P Suortti et al
Figure 16. Slice refraction images of the brain of a transgenic mouse obtained through histology (a) and the corresponding brain regionimaged with DEI-CT at 20 keV (c). Zoomed-in views of the boxed regions of (a) and (c) are presented in (b) and (d), respectively. Thenumbered arrows point to plaques (in (b)) and nodules (in (d)). Reprinted from Connor et al 2009a, Copyright (2013), with kind permissionfrom Elsevier.
the vessel structures as a function of time. Fibrotic septa, bileduct and blood vessels down to 40 µm were visualized withexcellent contrast against the liver tissue.
5. Conclusion
In this paper, the fundamental physics of phase-contrast x-rayimaging and the optical setup for ABI have been presented.Several ABI research programs have been detailed in orderto demonstrate the wide range of potential preclinical andclinical applications. It is clear that ABI produces images ofbiomedical systems with the ability to determine absorption,refraction angle and scattering profiles. ABI can be optimizedfor imaging a particular system since many experimentalparameters are available to the user, such as crystal reflectivity,energy and in some cases the orientation of the object tothe scattering plane of the analyser. ABI does not dependon the transverse coherence of the source so that the use ofconventional x-ray sources, such as tubes and rotating anodes,is possible while new high-power sources are being developed.The demonstrations and applications have shown that by usingadvanced algorithms and methods, the ABI methodology ishighly quantitative. It is particularly suited to assessing thescattering from the object.
In determining what imaging method to use for a givenapplication, it is necessary to understand the technologicalsystems and the relative advantages and disadvantages of each.In particular, ABI must be compared with both PBI and GIwhen considering the advancement of the technology to widerutilization, potentially with clinical implications. This is acomplex task as demonstrated by a very detailed and thoroughanalysis presented by Diemoz et al (2012). Using the samesynchrotron x-ray beam, the same samples and the samedetector for ABI, GI and PBI analysis, they compared variousparameters of the systems. The authors make it clear that,due to experimental limitations and the physical basis of thetechniques themselves, it was not always possible to optimizeeach technique for individual comparisons. For example(among other parameters), the signal-to-noise and figure ofmerit for ABI is dependent on the crystal reflection and energy,GI is dependent on the grating parameters and the integratingdistance and PBI are dependent on source parameters andsample to detector distance.
However, given those caveats, some clear generalizationsfollowed that are due to the details of the physics underlyingthe methods. The sensitivity to phase shifts is highest forABI and lowest for PBI, and ABI can detect much smallerrefraction angles than GI. PBI is superior in imaging small
20

J. Phys. D: Appl. Phys. 46 (2013) 494002 P Suortti et al
Figure 17. Refraction images of a mouse liver obtained by subtracting two opposite slope DEI images at FWHM. (a) Normal liver withonly blood vessels visualized. (b) Refraction images taken 15 days after common bile duct ligation with liver fibrosis seen in the periphery.(c) Refraction images taken 40 days after common bile duct ligation. The arrow indicates the dilated bile duct (b) and (c). Bar 500 µm.Reprinted from Zhang et al 2013, Copyright (2013), with kind permission from Springer.
objects with high spatial frequencies than either ABI or GIsince it is dependent on the Laplacian of the phase. Onthe other hand, ABI has a higher figure of merit for larger,smoother varying objects due to its high sensitivity to the one-dimensional gradients. ABI also is better than both PBI andGI at high energies since its energy dependence is weaker.Thus, ABI can be used in situations where radiation dose is animportant factor.
The development of the ABI technology and the associatedanalysis methods over the past years have been largely devotedto understanding more deeply the physics of the imagingand to producing higher-quality images of the absorption,refraction and scattering. Outstanding advances have beenmade. However, it is important to keep in mind that onefuture outcome may be the application of ABI in the clinicalenvironment. As noted by several authors (Fiedler et al2004, Keyrilainen et al 2005, 2008, 2011 Bravin et al2007a), the images available to a clinical radiographer do notnecessarily need to be highly processed. In fact, ABI topimages and/or a small number of refraction images may besufficient for detailed visual analysis in diagnostic situations.Understanding this also means that the experimental opticscomplexity of ABI may be reduced when contemplating aclinical system. The inherent need for high stability at anygiven position on the RC for the detailed analytical analysis ofthe images may be able to be relaxed. Finally, as noted earlier,the future application of ABI in the clinic depends on thecontinued development of the compact source technologies.
References
ACR (American College of Radiology) 1999 Mammography qualitycontrol manual Committee on Quality Assurance inMammography (Reston, VA: ACR)
Ando M, Sugiyama H, Maksimenko A, Rubenstein E, Roberson J,Shimao D, Hashimoto E and Mori K 2004 X-ray dark-fieldimaging and its application to medicine Radiat. Phys. Chem.71 899–904
Ando M et al 2008 Refraction-based 2D, 2.5D and 3D medicalimaging: stepping forward to a clinical trial Eur. J. Radiol.68 S32–6
Arfelli F et al 2000 Mammography with synchrotron radiation:phase-detection techniques Radiology 215 286–93
Bech M, Bunk O, David C, Ruth R, Rifkin J, Loewen R,Feidenhans’l R and Pfeiffer F 2009 Hard x-ray phase-contrast
imaging with the compact light source based on inverseCompton x-rays J. Synchrotron Radiat. 16 43–7
Bech M, Jensen T H, Bunk O, Donath T, David C, Weitkamp T,Le Duc G, Bravin A, Cloetens P and Pfeiffer F 2010 Advancedcontrast modalities for x-ray radiology: phase-contrast anddark-field imaging using a grating interferometer Z. Med. Phys.20 7–16
Bonse U and Hart M 1965 An x-ray interferometer Appl. Phys. Lett.6 155–6
Bonse U and Hart M 1966 Small angle x-ray scattering by sphericalparticles of polystyrene and polyvinyltouluene Z. Phys.189 151–62
Brankov J G, Wernick M N, Yang Y, Li J, Muehleman C, Zhong Zand Anastasio M A 2006 A computed tomographyimplementation of multiple-image radiography Med. Phys.33 278–89
Bravin A et al 2007a High-resolution CT by diffraction-enhancedx-ray imaging: mapping of breast tissue samples andcomparison with their histo-pathology Phys. Med. Biol.52 2197–211
Bravin A, Mocella V, Coan P, Astolfo A and Ferrero C 2007b Anumerical wave-optical approach for the simulation ofanalyzer-based x-ray imaging Opt. Express 15 5641–8
Bravin A, Coan P and Suortti P 2013 X-ray phase-contrast imaging:from pre-clinical applications towards clinics Phys. Med. Biol.57 R1–35
Burattini E, Gambaccini M, Marziani M, Rimondi O, Indovina P L,Pocek M, Simonetti G, Benassi M, Tirelli C and Passariello R1992 X-ray mammography with synchrotron radiation Rev. Sci.Instrum. 63 638–40
Burattini E, Cossu E, Di Maggio C, Gambaccini M, Indovina P,Marziani M, Pocek M, Simeoni S and Simonetti G 1995Mammography with synchrotron radiation Radiology 195239–44
Castelli E et al 2011 Mammography with synchrotron radiation:first clinical experience with phase-detection techniqueRadiology 259 684–94
Chapman D, Thomlinson W, Arfelli F, Gmur N, Zhong Z, Menk R,Johnston R E, Washburn D, Pisano E and Sayers D 1996Mammography imaging studies using a Laue crystal analyzerRev. Sci. Instrum. 67 1–5
Chapman D, Thomlinson, W, Johnston R E, Washburn D, Pisano E,Gmur N, Zhong Z, Menk R, Arfelli F and Sayers D 1997Diffraction enhanced x-ray imaging Phys. Med. Biol.42 2015–25
Chapman D, Pisano E, Thomlinson W, Zhong Z, Johnston R E,Washburn D, Sayers D and Malinowska K 1998 Medicalapplications of diffraction enhanced imaging Breast Disease10 197–207
Chen G H, Bevins N, Zambelli J and Qi Z 2010 Small-anglescattering computed tomography (SAS-CT) using a Talbot-Lau
21
J. Phys. D: Appl. Phys. 46 (2013) 494002 P Suortti et al
interferometer and a rotating anode x-ray tube: theory andexperiments Opt. Express 18 12960–70
Chou C Y, Anastasio M A, Brankov J G, Wernick M N, Brey E M,Connor D M and Zhong Z 2007 An extendeddiffraction-enhanced imaging method for implementingmultiple-image radiography Phys. Med. Biol. 52 1923–45
Coan P, Pagot E, Fiedler S, Cloetens P, Baruchel J and Bravin A2005 Phase-contrast x-ray imaging combining free spacepropagation and Bragg diffraction J. Synchrotron Radiat.12 241–5
Coan P 2006a Development and application of the analyzer-basedimaging technique with hard synchrotron radiation PhD ThesisUniversite Joseph Fourier, Grenoble, France
Coan P, Peterzol A, Fiedler S, Ponchut C, Labiche J C and Bravin A2006b Evaluation of imaging performance of a taper opticsCCD; ‘FReLoN’ camera designed for medical imaging J.Synchrotron Radiat. 13 260–70
Coan P, Mollenhauer J, Wagner A, Muehleman C and Bravin A2008 Analyzer-based imaging technique in tomography ofcartilage and metal implants: A study at the ESRF Eur. J.Radiol. 68S S41–8
Coan P, Gruener A F, Glaser C, Schneider T, Bravin A, Reiser M andHabs D 2009 Phase-contrast medical imaging with compactx-ray sources at the Munich-Centre for Advance Photonics(MAP) Nucl. Instrum. Methods Phys. Res. A 608 S44–6
Coan P, Wagner A, Bravin A, Diemoz P C, Keyrilainen J andMollenhauer J 2010a In vivo x-ray phase contrastanalyzer-based imaging for longitudinal osteoarthritis studiesin guinea pigs Phys. Med. Biol. 55 7649–62
Coan P, Bamberg F, Diemoz P C, Bravin A, Timpert K, Mutzel E,Raya J G, Adam-Neumair S, Reiser M F and Glaser C 2010bCharacterization of osteoarthritic and normal human patellacartilage by computed tomography x-ray phase-contrastimaging: a feasibility study Invest. Radiol. 45 437–44
Coan P, Bravin A and Tromba G 2013 Phase-contrast x-ray imagingof the breast: recent developments towards clinics J. Phys. D.Appl. Phys. 46 494007
Connor D M, Sayers D, Sumner D R and Zhong Z 2006 Diffractionenhanced imaging of controlled defects within bone, includingbone–metal gaps Phys. Med. Biol. 51 3283–300
Connor D M, Benveniste H, Dilmanian F A, Kritzer M F,Miller L M and Zhong Z 2009a Computed tomography ofamyloid plaques in a mouse model of Alzheimer’s diseaseusing diffraction enhanced imaging Neuroimage46 908–14
Connor D M, Hallen H D, Lalush D S, Sumner D R and Zhong Z2009b Comparison of diffraction-enhanced computedtomography and monochromatic synchrotron radiationcomputed tomography of human trabecular bone Phys. Med.Biol. 54 6123–33
Cooper D M, Bewer B, Wiebe S, Wysokinski T W and Chapman D2011 Diffraction enhanced x-ray imaging of the distal radius: anovel approach for visualization of trabecular bone architectureCan. Assoc. Radiol. J. 62 251–5
Davis T J, Gureyev T E, Gao D, Stevenson A W and Wilkins S W1995a X-ray image contrast from a simple phase object Phys.Rev. Lett. 74 3173–6
Davis T J, Gao D, Gureyev T E, Stevenson A W and Wilkins S W1995b Phase-contrast imaging of weakly absorbing materialsusing hard x-rays Nature 373 595–8
Diemoz P C 2011 Experimental and theoretical contributions tox-ray phase-contrast techniques for medical imaging PhDThesis Universite Joseph Fourier, Grenoble, France
Diemoz P C, Bravin A, Glaser C and Coan P 2010a Comparison ofanalyzer-based imaging computed tomography extractionalgorithms and application to bone–cartilage imaging Phys.Med. Biol. 55 7663–79
Diemoz P C, Bravin A, Glaser C and Coan P 2010b Absorption,refraction and scattering in analyzer-based imaging:
comparison of different algorithms Opt. Express18 3494–509
Diemoz P C, Coan P, Zanette I, Bravin A, Lang S, Glaser C andWeitkamp T 2011 A simplified approach for computedtomography with an x-ray grating interferometer Opt. Express19 1691–8
Diemoz P C, Bravin A, Langer M and Coan P 2012 Analytical andexperimental determination of signal-to-noise ratio and figureof merit in three phase-contrast imaging techniques Opt.Express 25 27670–90
Dilmanian F A, Zhong Z, Ren B, Wu X Y, Chapman L D, Orion Iand Thomlinson W C 2000 Computed tomography of x-rayindex of refraction using the diffraction enhanced imagingmethod Phys. Med. Biol. 45 933–46
Fahimian B P, Mao Y, Cloetens P and Miao J 2010 Low-dose x-rayphase-contrast and absorption CT using equally slopedtomography Phys. Med. Biol. 55 5383–400
Faulconer L et al 2009 Radiologist evaluation of an x-raytube-based diffraction-enhanced imaging prototype usingfull-thickness breast specimens Acad Radiol. 16 1329–57
Feigin L A and Svergun D I 1987 Structure Analysis by Small-AngleX-ray and Neutron Scattering (London: Plenum)
Fernandez M et al 2005 Human breast cancer in vitro: matchinghisto-pathology with small-angle x-ray scattering anddiffraction enhanced x-ray imaging Phys. Med. Biol.50 2991–3006
Fernandez M, Suhonen H, Keyrilainen J, Bravin A, Fiedler S,Karjalainen-Lindberg M L, Leidenius M, von Smitten K andSuortti P 2008 USAXS and SAXS from cancer-bearing breasttissue samples Eur. J. Radiol. 68 S89–94
Fiedler S, Bravin A, J Keyrilainen J, Fernandez M, Suortti P,Thomlinson W, Tenhunen M, Virkkunen P andKarjalainen-Lindsberg M L 2004 Imaging lobular breastcarcinoma: comparison of synchrotron radiation DEI–CTtechnique with clinical CT, mammography and histology Phys.Med. Biol. 49 175–88
Fogarty D P, Reinhart B, Tzvetkov T, Nesch I and Williams C 2011In-laboratory diffraction-enhanced x-ray imaging of an equinehoof J. Equine Vet. Sci. 31 365–9
Forster E, Goetz K and Zaumseil P 1980 Double crystaldiffractometry for the characterization of targets for laserfusion experiments Krist. Tech. 15 937–45
Gao X, Luo S, Yin H, Liu B, Xu M, Yuan Q, Gao X and Zhu P 2006A micro-tomography method based on x-ray diffractionenhanced imaging for the visualization of micro-organs andsoft tissues Comput. Med. Imaging Graph. 30 339–47
Guinier A 1939 La diffraction des rayons X aux tres petits angles:application a l’etude de phenomenes ultramicroscopiques Ann.Phys. 12 161–237
Guinier A 1963 X-ray Diffraction (New York: Dover)Hashimoto E, Maksimenko A, Sugiyama H, Hyodo K, Shimao D,
Nishino Y, Ishikawa T and Ando M 2006 First application ofx-ray refraction-based computed tomography to a biomedicalobject Zoolog. Sci. 23 809–13
Hasnah M O, Zhong Z, Oltulu O, Pisano E, Johnston R E, Sayers D,Thomlinson W and Chapman D 2002 Diffraction enhancedimaging contrast mechanisms in breast cancer specimens Med.Phys. 29 2216–21
Heymsfield S B, Wang Z, Baumgartner R N and Ross R 1997Human body composition: advances in models and methodsAnnu. Rev. Nutr. 17 527–58
Hirai T et al 2006 Refraction contrast 11×-magnified x-ray imagingof large objects by MIRRORCLE-type table-top synchrotronJ. Synchrotron Radiat. 13 397–402
Hu C H, Zhang L, Li H and Luo S Q 2008 Comparison of refractioninformation extraction methods in diffraction enhancedimaging Opt. Express 16 16704–10
Hu C, Zhao T, Zhang L, Li H, Zhao X and Luo S 2009Information extraction and CT reconstruction of liver images
22

J. Phys. D: Appl. Phys. 46 (2013) 494002 P Suortti et al
based on diffraction enhanced imaging Prog. Nat. Sci.19 955–62
Huang Z F, Kang K J, Zhu P P, Huang W X, Yuan Q X andWang J Y 2007 Strategy of extraction methods andreconstruction algorithms in computed tomography ofdiffraction enhanced imaging Phys. Med. Biol. 52 1–12
ICRU (International Commission on Radiation Units andMeasurements) 1989 Tissue Substitutes in Radiation Dosimetryand Measurement (ICRU Report 44) (Bethesda, MD: ICRU)
Ingal V N and Beliaevskaya E A 1995 X-ray plane-wavetopography observation of the phase-contrast from anon-crystalline object J. Phys. D: Appl. Phys. 28 2314–7
Ingal V N, Beliaevskaya E A, Brianskaya A P and Merkurieva R D1998 Phase mammography—a new technique for breastinvestigation Phys. Med. Biol. 43 2555–67
James R W 1962 The Optical Principles of the Diffraction of X-Rays(London: G. Bell and Sons Ltd)
Johnston R E, Washburn D, Pisano E, Thomlinson W C, ChapmanD, Gmur N F, Zhong Z and Sayers D 1995 Preliminaryexperience with monochromatic photon mammography Proc.SPIE 2434 434–41
Johnston R E, Washburn D, Pisano E, Burns C, Thomlinson W C,Chapman L D, Arfelli F, Gmur N F, Zhong Z and Sayers D1996 Mammographic phantom studies with synchrotronradiation Radiology 200 659–63
Kao T, Connor D, Dilmanian F A, Faulconer L, Liu T, Parham C,Pisano E and Zhong Z 2009 Characterization ofdiffraction-enhanced imaging contrast in breast cancer Phys.Med. Biol. 54 3247–56
Kelly M E, Beavis R C, Fourney D R, Schultke E, Parham C,Juurlink B H, Zhong Z and Chapman L D 2006Diffraction-enhanced imaging of the rat spine Can. Assoc.Radiologists. J. 57 204–10
Kelly M E, Coupal D J, Beavis R C, Schultke E, Romanchuk K,Juurlink B H, Zhong Z and Chapman L D 2007Diffraction-enhanced imaging of a porcine eye Can. J.Ophthalmol. 42 731–3
Keyrilainen J, Fernandez M and Suortti P 2002 Refraction contrastin x-ray imaging Nucl. Instrum. Methods Phys. Res. A488 419–27
Keyrilainen J, Fernandez M, Fiedler S, Bravin A,Karjalainen-Lindsberg M L, Virkkunen P, Elo E M, TenhunenM, Suortti P and Thomlinson W 2005 Visualisation ofcalcifications and thin collagen strands in human breast tumourspecimens by the diffraction-enhanced imaging technique: acomparison with conventional mammography and histologyEur. J. Radiol. 53 226–37
Keyrilainen J et al 2008 Toward high-contrast breast CT at lowradiation dose Radiology 249 321–7
Keyrilainen J, Bravin A, Fernandez M, Tenhunen M, Virkkunen Pand Suortti P 2010 Phase-contrast x-ray imaging of breast ActaRadiol. 51 866–84
Keyrilainen J et al P 2011 Comparison of in vitro breast cancervisibility in analyser-based computed tomography withhistopathology, mammography, computed tomography andmagnetic resonance imaging J. Synchrotron Radiat. 18 689–96
Khelashvili G, Brankov J G, Chapman D, Anastasio M A, Yang Y,Zhong Z and Wernick M N 2006 A physical model ofmultiple-image radiography Phys. Med. Biol. 51 221–36
Kiss M Z, Sayers D E, Zhong Z, Parham C and Pisano E D 2004Improved image contrast of calcifications in breast tissuespecimens using diffraction enhanced imaging Phys. Med.Biol. 49 3427–39
Kitchen M J, Paganin D, Lewis R A, Yagi N, Uesugi K andMudie S T 2004 On the origin of speckle in x-rayphase-contrast images of lung tissue Phys. Med. Biol.49 4335–48
Kitchen M J, Pavlov K M, Siu K K, Menk R H, Tromba G andLewis R A 2007 Analyser-based phase-contrast image
reconstruction using geometrical optics Phys. Med. Biol.52 4171–87
Kitchen M J, Pavlov K M, Hooper S B, Vine D J, Siu K K W,Wallace M J, Siew M L, Yagi N, Uesugi K and Lewis R A 2008Simultaneous acquisition of dual analyser-based phase-contrastx-ray images for small animal imaging Eur. J. Radiol.68 S49–53
Kitchen M J, Paganin D M, Uesugi K, Allison B J, Lewis R A,Hooper S B and Pavlov K M 2010 X-ray phase, absorption andscatter retrieval using two or more phase contrast images Opt.Express 18 19994–20012
Kitchen M J, Paganin D M, Uesugi K, Allison B J, Lewis R A,Hooper S B and Pavlov K M 2011 Phase contrast imagesegmentation using a Laue analyzer crystal Phys. Med. Biol.56 515–34
Kleuker U, Suortti P, Weyrich W and Spanne P 1998 Feasibilitystudy of x-ray diffraction computed tomography for medicalimaging Phys. Med. Biol. 43 2911–23
Konica-Minolta 2012 Regius PureView System (Tokyo, Japan:Konica-Minolta Holdings, Inc.) www.konicaminolta.com/healthcare/products/mammo/regius/
Larsson D H, Takman P A C, Lundstrom U, Burvall A andHertz H M 2011 A 24 keV liquid-metal-jet x-ray source forbiomedical applications Rev. Sci. Instrum. 82 123701
Lewis R 1997 Medical applications of synchrotron radiation x-raysPhys. Med. Biol. 42 1213–43
Lewis R A et al 2005 Dynamic imaging of the lungs using x-rayphase-contrast Phys. Med. Biol. 50 5031–40
Li J, Zhong Z, Lidtke R, Kuettner K E, Peterfy C, Aliyeva E andMuehleman C 2003 Radiology of soft tissue of the foot andankle with diffraction enhanced imaging J. Anat. 202 463–70
Li J, Williams J M, Zhong Z, Kuettner K E, Aurich M, MollenhauerJ and Muehleman C 2005 Reliability of diffraction enhancedimaging for assessment of cartilage lesions, ex vivo,Osteoarthritis Cartilage 13 187–97
Li J, Zhong Z, Connor D, Mollenhauer J and Muehleman C 2009Phase-sensitive x-ray imaging of synovial joints OsteoarthritisCartilage 17 1193–6
Li J and Sun Y 2012 Image reconstruction algorithm for diffractionenhanced imaging-based computed tomography Opt. Commun.285 2972–5
Li J, Wilson N, Zelazny I A, Meyer J, Zhong Z and Muehleman C2012 Assessment of diffraction-enhanced synchrotron imagingfor cartilage degeneration of the human knee joint Clin. Anat.doi:10.1002/ca.22106
Liu C, Zhang Y, Zhang X, Yang W, Peng W, Shi D, Zhu P, Tian Yand Huang W 2005 X-ray diffraction-enhanced imaging ofuterine leiomyomas Med. Sci. Monit. 11 33–8
Liu C, Yan X, Zhang X, Yang W, Peng W, Shi D, Zhu P, Huang Wand Yuan Q 2007 Evaluation of x-ray diffraction enhancedimaging in the diagnosis of breast cancer Phys. Med. Biol.52 419–27
Lyncean Technologies 2012 The Compact Light Source (Palo Alto,CA: Lyncean Technologies, Inc) www.lynceantech.com/
Majumdar S, Issever A S, Burghardt A, Lotz J, Arfelli F, Rigon L,Heitner G and Menk R H 2004 Diffraction enhanced imagingof articular cartilage and comparison with micro-computedtomography of the underlying bone structure Eur. Radiol.14 1440–8
Maksimenko A, Sugiyama H, Hirano K, Yuasa T and Ando M 2004Dark-field imaging using an asymmetric Bragg casetransmission analyser Meas. Sci. Technol. 15 1251–4
Maksimenko A et al 2005 Computed tomographic reconstructionbased on x-ray refraction contrast Appl. Phys. Lett.86 124105
McDonald S A, Marone F, Hintermuller C, Mikuljan G, David C,Pfeiffer F and Stampanoni M 2009 Advanced phase-contrastimaging using a grating interferometer J. Synchrotron Radiat.16 562–72
23

J. Phys. D: Appl. Phys. 46 (2013) 494002 P Suortti et al
Mollenhauer J, Aurich M E, Zhong Z, Muehleman C, Cole A A,Hasnah M, Oltulu O, Kuettner K E, Margulis A andChapman L D 2002 Diffraction-enhanced x-ray imaging ofarticular cartilage Osteoarthritis Cartilage 10 163–71
Momose A, Takeda T, Itai Y, Yoneyama A and Hirano K 1998Perspectives for medical applications of phase-contrast x-rayimaging Medical Applications of Synchrotron Radiationed M Ando M and C Uyama (Tokyo: Springer) pp 54–61
Momose A 1995 Demonstration of phase-contrast x-raycomputed-tomography using an x-ray interferometer Nucl.Instrum. Methods Phys. Res. A 352 622–8
Momose A, Takeda T and Itai Y 2000 Blood vessels: depiction atphase-contrast x-ray imaging without contrast agents in themouse and rat—feasibility study Radiology 217 593–6
Momose A, Takeda T, Yoneyama A, Koyama I and Itai Y 2001Wide-area phase-contrast x-ray imaging using large x-rayinterferometers Nucl. Instrum. Methods Phys. Res. A467 917–20
Momose A, Kawamoto S, Koyama I, Hamaishi Y, Takai K andSuzuki Y 2003 Demonstration of x-ray Talbot interferometryJapan. J. Appl. Phys. 42 L866–8
Momose A 2005 Recent advances in x-ray phase imaging Japan. J.Appl. Phys. 44 6355–67
Muehleman C, Sumner D R and Zhong Z 2004a Refraction effectsof diffraction-enhanced radiographic imaging: a new look atbone J. Am. Podiatric Med. Assoc. 94 453–5
Muehleman C et al 2004b X-ray detection of structural orientationin human articular cartilage Osteoarthritis Cartilage12 97–105
Muehleman C, Li J, Zhong Z, Brankov J G and Wernick M N 2006Multiple-image radiography for human soft tissue J. Anat.208 115–24
Muehleman C, Li J, Connor D, Parham C, Pisano E and Zhong Z2009a Diffraction-enhanced imaging of musculoskeletal tissuesusing a conventional x-ray tube Acad. Radiol. 16 918–23
Muehleman C, Li J, Schiff A and Zhong Z 2009bDiffraction-enhanced imaging for Achilles tendon lesions: apreliminary study J. Am. Podiatric Med. Assoc. 99 95–9
Muehleman C, Fogarty D, Reinhart B, Tzvetkov T, Li J and Nesch I2010 In-laboratory diffraction-enhanced x-ray imaging forarticular cartilage Clin. Anat. 23 530–8
Nesch I, Fogarty D P, Tzvetkov T, Reinhart B, Walus A C,Khelashvili G, Muehleman C and Chapman D 2009 The designand application of an in-laboratory diffraction-enhanced x-rayimaging instrument Rev. Sci. Instrum. 80 093702
Nesterets Y I, Coan P, Gureyev T E, Bravin A, Cloetens Pand Wilkins S W 2006 On qualitative and quantitativeanalysis in analyser-based imaging Acta Crystallogr. A62 296–308
NIST (National Institute of Standards and Technology) 2013Physical Reference Data (Gaithersburg, MD: NIST )http://physics.nist.gov/PhysRefData/
Noda-Saita K et al 2006 Quantitative analysis of amyloid plaques ina mouse model of Alzheimer’s disease by phase-contrast x-raycomputed tomography Neuroscience 138 1205–13
Olivo A and Speller R 2007 Modelling of a novel x-rayphase-contrast imaging technique based on coded aperturesPhys. Med. Biol. 52 6555–73
Olivo A and Speller R 2008 Image formation principles incoded-aperture based x-ray phase-contrast imaging Phys. Med.Biol. 53 6461–74
Oltulu O, Zhong Z, Hasnah M, Wernick M N and Chapman D 2003Extraction of extinction, refraction and absorption properties indiffraction enhanced imaging J. Phys. D: Appl. Phys.36 2152–6
Pagot E, Cloetens P, Fiedler S, Bravin A, Coan P, Baruchel J,Hartwig J and Thomlinson W 2003 A method to extractquantitative information in analyzer-based x-ray phase-contrastimaging Appl. Phys. Lett. 82 3421–3
Pagot E, Fiedler S, Cloetens P, Bravin A, Coan P, Fezzaa K,Baruchel J and Hartwig J 2005 Quantitative comparisonbetween two phase-contrast techniques: diffraction enhancedimaging and phase propagation imaging Phys. Med. Biol.50 709–24
Parham C, Zhong Z, Connor D M, Chapman L D and Pisano E D2009 Design and implementation of a compact low-dosediffraction enhanced medical imaging system Acad. Radiol.16 911–7
Pavlov K M, Gureyev T E, Paganin D, Nesterets Y I, Morgan M Jand Lewis R A 2004 Linear systems with slowly varyingtransfer functions and their application to x-ray phase-contrastimaging J. Phys. D: Appl. Phys. 37 2746–50
Pavlov K M et al 2005 Unification of analyser-based andpropagation-based x-ray phase contrast imaging Nucl. Instrum.Methods A548 163–8
Pisano E et al 2000 Human breast cancer specimens:diffraction-enhanced imaging with histologiccorrelation—improved conspicuity of lesion detailcompared with digital radiography Radiology 214895–901
Podurets K M, Somenkov V A and Shil’shtein S Sh 1989Refraction-contrast radiography Sov. Phys. Tech. Phys.34 654–7
Porod G 1951 Die Rontgenkleinwinkelstreuung von dichtgepacktenkolloiden Systemen Colloid Polym. Sci. 124 83–114
Protopopov V V and Sobota J 2002 X-ray dark-fieldrefraction-contrast imaging of micro-objects Opt. Commun.213 267–79
Puumalainen P, Sikanen P and Olkkonen H 1979 Measurement ofstable iodine content of tissue by coherently and Comptonscattered photon Nucl. Instrum. Methods Phys. Res. A163 261–3
Rigon L et al 2003 A new DEI algorithm capable ofinvestigating sub-pixel structures J. Phys. D: Appl. Phys.36 A107–12
Rigon L, Arfelli F and Menk R H 2007 Generalized diffractionenhanced imaging to retrieve absorption, refraction andscattering effects J. Phys. D: Appl. Phys. 40 3077–89
Rigon L, Astolfo A, Arfelli F and Menk R H 2008 Generalizeddiffraction enhanced imaging: application to tomography Eur.J. Radiol. 68 S3–7
Schmidt P W 1991 Small-angle scattering studies of disordered,porous and fractal systems J. Appl. Crystallogr. 24 414–35
Seo S J et al 2012 Visualization of microvascular proliferation as atumor infiltration structure in rat glioma specimens using thediffraction-enhanced imaging in-plane CT technique Phys.Med. Biol. 57 1251–62
Shimao D, Sugiyama H, Hyodo K, Kunisada T and Ando M 2005Evaluation of x-ray dark-field imaging in visualization ofnearly clinical articular cartilage Nucl. Instrum. Methods Phys.Res. A 548 129–34
Shimao D, Sugiyama H, Hyodo K, Kunisada T and Ando M 2006Articular cartilage depicted at optimized angular position ofLaue angular analyzer by x-ray dark-field imaging Appl.Radiat. Isot. 64 868–74
Sidhu S, Siu K K, Falzon G, Hart S A, Foxe J G and Lewis R A2009 Mapping structural changes in breast tissue disease usingx-ray scattering Med. Phys. 36 3211–7
Snigirev A, Snigireva I, Kohn V, Kuznetsov S and Schelokov 1995On the possibilities of x-ray phase-contrast microimaging bycoherent high-energy synchrotron radiation Rev. Sci. Instrum.66 5486–92
Snigirev A, Kohn V, Snigireva I and Lengeler B 1996 A compoundrefractive lens for focusing high-energy x-rays Nature384 49–51
Stutman D, Stayman J W, Finkenthal M and Siewerdsen J H 2013High energy x-ray phase-contrast imaging using glancing anglegrating interferometers Proc. SPIE 8668 (Medical Imaging
24

J. Phys. D: Appl. Phys. 46 (2013) 494002 P Suortti et al
2013: Physics of Medical Imaging 866814)doi:10.1117/12.2007930
Suhonen H, Fernandez M, Serimaa R and Suortti P 2005 Simulationof small-angle x-ray scattering from collagen fibrils andcomparison with experimental patterns Phys. Med. Biol.50 5401–16
Suhonen H, Fernandez M, Bravin A, Keyrilainen J and Suortti P2007 Refraction and scattering of x-rays in analyzer-basedimaging J. Synchrotron Radiat. 14 512–21
Suhonen H 2008 Scattering and refraction as contrast mechanismsin x-ray imaging PhD Thesis, Report Series in PhysicsHU-P-D155, University of Helsinki, Finland
Sunaguchi N, Yuasa T, Huo Q, Ichihara S and Ando M 2010 X-rayrefraction-contrast computed tomography images usingdark-field imaging optics Appl. Phys. Lett. 97 153701
Sunaguchi, N, Yuasa T, Huo Q, Ichihara S and Ando M 2011Refraction-contrast tomosynthesis imaging using dark-fieldimaging optics Appl. Phys. Lett. 99 103704
Suortti P, Pattison P and Weyrich W 1986 An x-ray spectrometer forinelastic scattering experiments: I. Curved crystal x-ray opticsJ. Appl. Crystallogr. 19 336–42
Suortti P and Thomlinson W 2003 Medical applications ofsynchrotron radiation Phys. Med. Biol. 48 R1–25
Takeda T, Momose A, Itai Y, Wu J and Hirano K 1995Phase-contrast imaging with synchrotron x-rays for detectingcancer lesions Acad. Radiol. 2 799–803
Takeda T, Momose A, Wu J, Yu Q, Zeniya T, TT-Lwin, Yoneyama Aand Itai 2002 Vessel imaging by interferometric phase-contrastx-ray technique Circulation 105 1708–12
Talbot H F 1836 Facts relating to optical science No. IV Phil. Mag.9 419–27
Tang L, Li G, Sun Y S, Li J and Zhang X P 2012Synchrotron-radiation phase-contrast imaging of humanstomach and gastric cancer: in vitro studies J. SynchrotronRadiat. 19 319–22
Tapfer A et al 2012 Experimental results from a preclinical x-rayphase-contrast CT scanner Proc. Natl. Acad. Sci. USA109 15691–6
Thomlinson W, Suortti P and Chapman D 2005 Recent advances insynchrotron radiation medical research Nucl. Instrum. MethodsPhys. Res. A 543 288–96
Tuohimaa T, Otendal M and Hertz H M 2007 Phase-contrast x-rayimaging with a liquid-metal-jet-anode microfocus source Appl.Phys. Lett. 91 074104
van Heekeren J, Kostenko A, Hanashima T, Yamada H, Stallinga S,Offerman S E and van Vliet L J 2011 Characterization of an
x-ray phase-contrast imaging system based on the miniaturesynchrotron MIRRORCLE-6X Med. Phys. 38 5136–45
Variola A, Loulergue A and Zomer F (ed) 2010 THOMX:Conceptual Design Report LAL RT 09/28:SOLEIL/SOU-RA-2678 (Saint-Aubin, France: Soleil)http://hal.archives-ouvertes.fr/docs/00/44/82/78/PDF/ThomXCDRAV.pdf
Wagner A et al 2006 Qualitative evaluation of titanium implantintegration into bone by diffraction enhanced imaging Phys.Med. Biol. 51 1313–24
Weitkamp T, Diaz A, David C, Pfeiffer F, Stampanoni M,Cloetens P and Ziegler E 2005 X-ray phase imaging with agrating interferometer Opt. Express 13 6296–304
Wernick M, Wirjadi O, Chapman D, Zhong Z, Galatsanos N P,Yang Y, Brankov J G, Oltulu O, Anastasio M A andMuehleman C 2003 Multiple-image radiography Phys. Med.Biol. 48 3875–95
Yamada K et al 2009 A trial for fine and low-dose imaging ofbiological specimens using quasi-monochromaticlaser-Compton x-rays Nucl. Instrum. Methods Phys. Res. A608 S7–10
Yoneyama A, Wu J, Hyodo K and Takeda T 2008 Quantitativecomparison of imaging performance of x-ray interferometricimaging and diffraction enhanced imaging Med. Phys.35 4724–34
Zachariasen W H 1945 Theory of X-Ray Diffraction in Crystals(New York: Wiley)
Zhang X, Yang X R, Chen Y, Li H Q, Liu W Y, Yuan Q Xand Chen S L 2010 Diffraction-enhanced radiographyof various mouse organs Am. J. Roentgenol.195 545–9
Zhang X, Yang X R, Chen Y, Li H Q, Li R M, Yuan Q X, Zhu P P,Huang W X and Peng W J 2013 Visualising liver fibrosis byphase-contrast x-ray imaging in common bile duct ligated miceEur. Radiol. 23 417–23
Zhao Y et al 2012 High-resolution, low-dose phase-contrast x-raytomography for 3D diagnosis of human breast cancers Proc.Natl Acad. Sci. USA 109 18290–4
Zhong Z, Thomlinson W, Chapman D and Sayers D 2000Implementation of diffraction-enhanced imaging experiments:at the NSLS and APS Nucl. Instrum. Methods Phys. Res. A450 556–67
Zhu P P, Wang J Y, Yuan Q X, Huang W X, Shu H, Gao B, Hu T Dand Wu Z Y 2005 Computed tomography algorithm based ondiffraction-enhanced imaging setup Appl. Phys. Lett.87 264101
25
Copyright © 2022 FDOKUMEN