Refracting Röntgen’s rays: Propagation-based x-ray phase contrast for biomedical imaging
12
Refracting Röntgen’s rays: Propagation-based x-ray phase contrast for biomedical imaging T. E. Gureyev, 1 S. C. Mayo, 1 D. E. Myers, 1,2 Ya. Nesterets, 1 D. M. Paganin, 1,3 A. Pogany, 1 A. W. Stevenson, 1 and S. W. Wilkins 1,a 1 CSIRO Materials Science and Engineering, Private Bag 33, Clayton, Victoria 3169, Australia 2 Department of Medicine (RMH/WH), The University of Melbourne, Clinical Sciences Building, Royal Parade, Parkville, Victoria 3050, Australia 3 School of Physics, Monash University, Victoria 3800, Australia Received 14 April 2008; accepted 8 August 2008; published online 19 May 2009 Absorption-contrast x-ray imaging serves to visualize the variation in x-ray attenuation within the volume of a given sample, whereas phase contrast allows one to visualize variations in x-ray refractive index. The former imaging mechanism has been well known and widely utilized since the time of Röntgen’s Nobel prize winning work, whereas the latter mechanism—sought for, but not found, by Röntgen himself—has laid the foundation for a revolution in x-ray imaging which is the central topic of this review. We consider the physical imaging mechanisms underlying both absorption contrast and phase contrast, together with the associated inverse problem of how one may obtain quantitative two- or three-dimensional information regarding a sample, given one or more phase-contrast images of the same. Practical questions are considered, regarding optimized phase-contrast imaging geometries as a function of detector resolution, source size, x-ray spectrum, and dose. Experimental examples pertaining to biomedical applications are given, and prospects for the future outlined. © 2009 American Institute of Physics. DOI: 10.1063/1.3115402 I. INTRODUCTION AND OVERVIEW Throughout most of the century-long global frisson ini- tiated by Röntgen’s remarkable “shadow picture” of the ring- clad hand of his wife, 1 the absorption of x rays held sway as the dominant paradigm for x-ray radiography. Such absorption-based x-ray imaging enjoyed and continues to enjoy a vast domain of applicability, from the imaging of bone fractures 2 and luggage 3 to the diagnosis of breast cancer 4 and the imaging of coronary arteries. 5 All of these applications exploit the highly penetrating nature of x rays, which render transparent a plethora of materials that are opaque to visible light—from the flesh that encases bones to the suitcases surrounding luggage, from the breast tissue en- veloping tumor-associated microcalcifications to the flesh, fat, and ribs that wall in a beating human heart. Yet, almost ironically, it is the very penetrating power of x rays that leads to an associated weakness: if a material is close to being nonabsorbing, as is often the case for soft biological tissues, then x-ray absorption contrast may be too weak to be uti- lized. This state of affairs may sometimes be palliated via the infusion of suitable contrast agents, such as a barium meal for imaging the stomach cavity 6 or iodine for the imaging of blood vessels. 7 Notwithstanding this, it remains highly desir- able to enable x-ray radiography with the capacity to image structures that are either nonabsorbing or very weakly ab- sorbing e.g., flesh, brain tissue, lungs, blood, and fat, in the absence of any external contrast agent. In this context, one is reminded of the passage of light through glass, which may be viewed as a convenient analog for the passage of x rays through a nonabsorbing material. As the utility of corrective spectacles shows, the nonabsorbing nature of a material does not imply that the said material does not alter the radiation traversing it; the glass lens cannot absorb light, but it can refract light. Bearing the above anal- ogy in mind, one is led to the logical possibility that the refractive properties of a nonabsorbing sample may be visu- alized radiographically. Phase-contrast x-ray imaging, 8 as we shall see, turns this logical possibility into a practical reality. This review is devoted to one such method of phase-contrast x-ray imaging, known as propagation-based x-ray phase contrast, 9–12 with particular reference to the biomedical ap- plications of this powerful imaging modality. The remainder of this review is structured as follows. We begin with an outline of the key distinction between the im- aging mechanisms underpinning x-ray absorption contrast Sec. I A and x-ray phase contrast Sec. I B, with the un- derstanding that in general both of these mechanisms will be operative when undertaking x-ray imaging using sufficiently coherent radiation. While several different forms of phase contrast are mentioned, we explicitly restrict consideration to what is perhaps one of the most clinically relevant such methods, known as propagation-based phase contrast. Hav- ing outlined what may be termed the “forward problem” of image formation via both absorption and phase contrast, in Sec. II we turn to the associated inverse problem of how one may invert such data to obtain quantitative two-dimensional 2D and three-dimensional 3D information regarding the sample under study. Practical considerations are then treated in Sec. III, including signal-to-noise ratio SNR, the effects of finite source size, the importance of dose and detector resolution, and the various trade-offs one makes in seeking a near-optimal phase-contrast imaging geometry. Several con- temporary biomedical applications of x-ray phase contrast a Electronic mail: [email protected]. JOURNAL OF APPLIED PHYSICS 105, 102005 2009 0021-8979/2009/10510/102005/12/$25.00 © 2009 American Institute of Physics 105, 102005-1 Author complimentary copy. Redistribution subject to AIP license or copyright, see http://jap.aip.org/jap/copyright.jsp
-
Upload
independent -
Category
Documents
-
view
0 -
download
0
Transcript of Refracting Röntgen’s rays: Propagation-based x-ray phase contrast for biomedical imaging

Refracting Röntgen’s rays: Propagation-based x-ray phase contrast forbiomedical imaging
T. E. Gureyev,1 S. C. Mayo,1 D. E. Myers,1,2 Ya. Nesterets,1 D. M. Paganin,1,3
A. Pogany,1 A. W. Stevenson,1 and S. W. Wilkins1,a�
1CSIRO Materials Science and Engineering, Private Bag 33, Clayton, Victoria 3169, Australia2Department of Medicine (RMH/WH), The University of Melbourne, Clinical Sciences Building, RoyalParade, Parkville, Victoria 3050, Australia3School of Physics, Monash University, Victoria 3800, Australia
�Received 14 April 2008; accepted 8 August 2008; published online 19 May 2009�
Absorption-contrast x-ray imaging serves to visualize the variation in x-ray attenuation within thevolume of a given sample, whereas phase contrast allows one to visualize variations in x-rayrefractive index. The former imaging mechanism has been well known and widely utilized since thetime of Röntgen’s Nobel prize winning work, whereas the latter mechanism—sought for, but notfound, by Röntgen himself—has laid the foundation for a revolution in x-ray imaging which is thecentral topic of this review. We consider the physical imaging mechanisms underlying bothabsorption contrast and phase contrast, together with the associated inverse problem of how onemay obtain quantitative two- or three-dimensional information regarding a sample, given one ormore phase-contrast images of the same. Practical questions are considered, regarding optimizedphase-contrast imaging geometries as a function of detector resolution, source size, x-ray spectrum,and dose. Experimental examples pertaining to biomedical applications are given, and prospects forthe future outlined. © 2009 American Institute of Physics. �DOI: 10.1063/1.3115402�
I. INTRODUCTION AND OVERVIEW
Throughout most of the century-long global frisson ini-tiated by Röntgen’s remarkable “shadow picture” of the ring-clad hand of his wife,1 the absorption of x rays held sway asthe dominant paradigm for x-ray radiography. Suchabsorption-based x-ray imaging enjoyed �and continues toenjoy� a vast domain of applicability, from the imaging ofbone fractures2 and luggage3 to the diagnosis of breastcancer4 and the imaging of coronary arteries.5 All of theseapplications exploit the highly penetrating nature of x rays,which render transparent a plethora of materials that areopaque to visible light—from the flesh that encases bones tothe suitcases surrounding luggage, from the breast tissue en-veloping tumor-associated microcalcifications to the flesh,fat, and ribs that wall in a beating human heart. Yet, almostironically, it is the very penetrating power of x rays that leadsto an associated weakness: if a material is close to beingnonabsorbing, as is often the case for soft biological tissues,then x-ray absorption contrast may be too weak to be uti-lized. This state of affairs may sometimes be palliated via theinfusion of suitable contrast agents, such as a barium mealfor imaging the stomach cavity6 or iodine for the imaging ofblood vessels.7 Notwithstanding this, it remains highly desir-able to enable x-ray radiography with the capacity to imagestructures that are either nonabsorbing or very weakly ab-sorbing �e.g., flesh, brain tissue, lungs, blood, and fat�, in theabsence of any external contrast agent.
In this context, one is reminded of the passage of lightthrough glass, which may be viewed as a convenient analogfor the passage of x rays through a nonabsorbing material. As
the utility of corrective spectacles shows, the nonabsorbingnature of a material does not imply that the said materialdoes not alter the radiation traversing it; the glass lens cannotabsorb light, but it can refract light. Bearing the above anal-ogy in mind, one is led to the logical possibility that therefractive properties of a nonabsorbing sample may be visu-alized radiographically. Phase-contrast x-ray imaging,8 as weshall see, turns this logical possibility into a practical reality.This review is devoted to one such method of phase-contrastx-ray imaging, known as propagation-based x-ray phasecontrast,9–12 with particular reference to the biomedical ap-plications of this powerful imaging modality.
The remainder of this review is structured as follows. Webegin with an outline of the key distinction between the im-aging mechanisms underpinning x-ray absorption contrast�Sec. I A� and x-ray phase contrast �Sec. I B�, with the un-derstanding that in general both of these mechanisms will beoperative when undertaking x-ray imaging using sufficientlycoherent radiation. While several different forms of phasecontrast are mentioned, we explicitly restrict consideration towhat is perhaps one of the most clinically relevant suchmethods, known as propagation-based phase contrast. Hav-ing outlined what may be termed the “forward problem” ofimage formation via both absorption and phase contrast, inSec. II we turn to the associated inverse problem of how onemay invert such data to obtain quantitative two-dimensional�2D� and three-dimensional �3D� information regarding thesample under study. Practical considerations are then treatedin Sec. III, including signal-to-noise ratio �SNR�, the effectsof finite source size, the importance of dose and detectorresolution, and the various trade-offs one makes in seeking anear-optimal phase-contrast imaging geometry. Several con-temporary biomedical applications of x-ray phase contrasta�Electronic mail: [email protected].
JOURNAL OF APPLIED PHYSICS 105, 102005 �2009�
0021-8979/2009/105�10�/102005/12/$25.00 © 2009 American Institute of Physics105, 102005-1
Author complimentary copy. Redistribution subject to AIP license or copyright, see http://jap.aip.org/jap/copyright.jsp

are considered in Sec. IV, including bone, soft-tissue andhuman blood cells. Section V suggests some future prospectsfor the field of x-ray phase contrast.
A. Absorption contrast
As a prelude to our discussions on propagation-basedx-ray phase-contrast imaging, let us briefly revise the use ofabsorption contrast as an imaging mechanism in conven-tional x-ray radiography. Consider the scenario shown in Fig.1�a�, where we see an extended source S of x-rays illuminat-ing a partially absorbing sample A, so as to cast a shadowradiograph over the surface of a 2D detector B. Let thesource-to-object distance be R1, and let the object-to-detectordistance be R2. As is well known, the shadow cast by theobject will be softened at the edges, through a mechanismknown as “penumbral blurring” �source-size blurring�.13 Forexample, all rays from the source S, which graze the top edgeG of the object, will fall within the region CD of the detec-tor, thereby blurring the image of this point on the edge ofthe object. The region EF will be similarly blurred. Further,all rays which strike the regions between D and E on thedetector will have passed through the object and will there-fore be attenuated. However, every point in this region of theimage is also degraded by penumbral blurring. The detrimen-tal effects of such blurring can be reduced, by making theobject-to-detector distance R2 as small as practicable or bymaking the source size as small as practicable. The formerexpedient is used in conventional radiography, by placing theimaging detector close to the exit surface of the sample to beimaged.14 This intuitive result that shadow imaging is bestaccomplished by minimizing the distance between the objectand the detector accords well with our everyday experience;for example, when standing outside on a clear sunny day, the
sharpness of one’s shadow is increased by decreasing thedistance between the object casting the shadow, and the sur-face upon which this shadow is cast.
B. Phase contrast
The preceding discussion considered how the absorptiveproperties of a sample may be directly imaged usingabsorption-contrast x-ray radiography. However, as men-tioned earlier, one also has the logical possibility that a dif-ferent attribute of a sample, namely, its refractive properties,might be visualized radiographically. Let us define “phase-contrast x-ray imaging” as any form of x-ray imaging thatrealizes this logical possibility, by being able to visualize therefractive properties of a sample. Several methods for x-rayphase contrast exist, such as the Bonse–Hartinterferometer,15 analyzer-based phase-contrast imaging,16–23
Zernike phase contrast based on Fresnel lens optics,24 andgrating-based methods of phase contrast.25–29 What all ofthese methods of phase contrast have in common is that eachrequires specialized optical elements, in addition to a sourceand a detector: a crystal interferometer for the Bonse–Harttechnique, a near-perfect diffracting crystalline surface foranalyzer-based contrast, one or more zone plates for Zernikephase contrast, and a series of aligned diffraction gratings forgrating-based phase contrast. This review is restricted to aform of phase-contrast x-ray imaging, known aspropagation-based x-ray phase contrast,9–12 that does not re-quire any specialized optical elements, besides an x-raysource and a conventional detector. We have confined ourreview in this way since propagation-based phase contrastappears to be one of the most clinically relevant and easilyimplementable phase-contrast techniques.30
With a view to developing the core concept which un-derpins propagation-based x-ray phase contrast, suppose thatone is again standing outside on a clear sunny day, placing a
FIG. 1. �a� Generic setup for absorption-contrast imag-ing, in which a large x-ray source S illuminates an ob-ject A so as to form an absorption-contrast image overthe surface of a detector B. The dashed lines show theincrease in penumbral blurring that arises from increas-ing R2 in this setup �b� Generic setup for phase-contrastimaging, in which a small x-ray source s illuminates anobject H so as to form a propagation-based phase-contrast image over the surface of a detector B.
102005-2 Gureyev et al. J. Appl. Phys. 105, 102005 �2009�
Author complimentary copy. Redistribution subject to AIP license or copyright, see http://jap.aip.org/jap/copyright.jsp
colorless glass lens upon a flat piece of paper. Over the sur-face of the paper, the intensity of the sunlight will be ap-proximately uniform, so that no image contrast is registered.This is not to say that the sunlight has not been altered uponits passage through the sample: it has been refracted, ratherthan attenuated. Such refractive effects, which alter the di-rection of the sun’s rays but not their magnitude, are notvisible when the paper is placed in contact with the lens.However, if one introduces a sufficient distance between thelens and the surface of the paper, the refractive effects of thelens are converted into “refraction contrast” intensity varia-tions over the paper. Note that the term refraction contrast issynonymous with “phase contrast,” the latter term being thestandard usage.
This simple yet powerful analogy makes it clear thatcontact-mode absorption-contrast radiography is insensitiveto the refractive effects of a typical sample. However, withconventional medical x-ray sources, the source size is toolarge for one to observe phase contrast by increasing thedistance R2 between the sample and the detector �see Fig.1�a��. This is because the refractive effects due to the sampleare typically so minute that, if one has sufficiently longpropagation distances R2 for the refractive mechanism to be-come operative, the effect will be completely washed out bysource-size blurring.
This situation changes radically when one works withsufficiently small sources, such as the so-called microfocusx-ray generators.10 Such sources, typical diameters for whichare on the order of 20 �m or less, sufficiently reduce theeffects of penumbral blurring that phase contrast becomesvisible if the sample-to-detector distance R2 is made suffi-ciently large. In such a regime, the absorption-contrast con-tact image �R2�0� is typically seen to have much less con-trast than a phase-contrast image for sufficiently large R2.
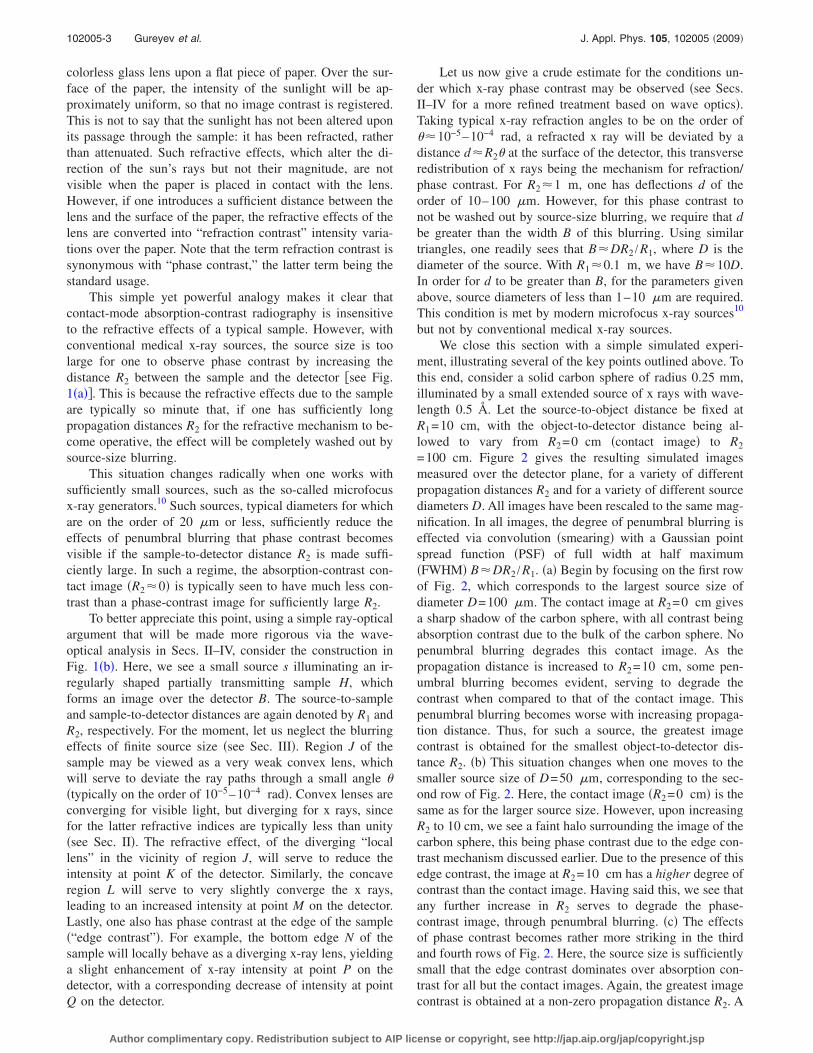
To better appreciate this point, using a simple ray-opticalargument that will be made more rigorous via the wave-optical analysis in Secs. II–IV, consider the construction inFig. 1�b�. Here, we see a small source s illuminating an ir-regularly shaped partially transmitting sample H, whichforms an image over the detector B. The source-to-sampleand sample-to-detector distances are again denoted by R1 andR2, respectively. For the moment, let us neglect the blurringeffects of finite source size �see Sec. III�. Region J of thesample may be viewed as a very weak convex lens, whichwill serve to deviate the ray paths through a small angle ��typically on the order of 10−5–10−4 rad�. Convex lenses areconverging for visible light, but diverging for x rays, sincefor the latter refractive indices are typically less than unity�see Sec. II�. The refractive effect, of the diverging “locallens” in the vicinity of region J, will serve to reduce theintensity at point K of the detector. Similarly, the concaveregion L will serve to very slightly converge the x rays,leading to an increased intensity at point M on the detector.Lastly, one also has phase contrast at the edge of the sample�“edge contrast”�. For example, the bottom edge N of thesample will locally behave as a diverging x-ray lens, yieldinga slight enhancement of x-ray intensity at point P on thedetector, with a corresponding decrease of intensity at pointQ on the detector.
Let us now give a crude estimate for the conditions un-der which x-ray phase contrast may be observed �see Secs.II–IV for a more refined treatment based on wave optics�.Taking typical x-ray refraction angles to be on the order of��10−5–10−4 rad, a refracted x ray will be deviated by adistance d�R2� at the surface of the detector, this transverseredistribution of x rays being the mechanism for refraction/phase contrast. For R2�1 m, one has deflections d of theorder of 10–100 �m. However, for this phase contrast tonot be washed out by source-size blurring, we require that dbe greater than the width B of this blurring. Using similartriangles, one readily sees that B�DR2 /R1, where D is thediameter of the source. With R1�0.1 m, we have B�10D.In order for d to be greater than B, for the parameters givenabove, source diameters of less than 1–10 �m are required.This condition is met by modern microfocus x-ray sources10
but not by conventional medical x-ray sources.We close this section with a simple simulated experi-
ment, illustrating several of the key points outlined above. Tothis end, consider a solid carbon sphere of radius 0.25 mm,illuminated by a small extended source of x rays with wave-length 0.5 Å. Let the source-to-object distance be fixed atR1=10 cm, with the object-to-detector distance being al-lowed to vary from R2=0 cm �contact image� to R2
=100 cm. Figure 2 gives the resulting simulated imagesmeasured over the detector plane, for a variety of differentpropagation distances R2 and for a variety of different sourcediameters D. All images have been rescaled to the same mag-nification. In all images, the degree of penumbral blurring iseffected via convolution �smearing� with a Gaussian pointspread function �PSF� of full width at half maximum�FWHM� B�DR2 /R1. �a� Begin by focusing on the first rowof Fig. 2, which corresponds to the largest source size ofdiameter D=100 �m. The contact image at R2=0 cm givesa sharp shadow of the carbon sphere, with all contrast beingabsorption contrast due to the bulk of the carbon sphere. Nopenumbral blurring degrades this contact image. As thepropagation distance is increased to R2=10 cm, some pen-umbral blurring becomes evident, serving to degrade thecontrast when compared to that of the contact image. Thispenumbral blurring becomes worse with increasing propaga-tion distance. Thus, for such a source, the greatest imagecontrast is obtained for the smallest object-to-detector dis-tance R2. �b� This situation changes when one moves to thesmaller source size of D=50 �m, corresponding to the sec-ond row of Fig. 2. Here, the contact image �R2=0 cm� is thesame as for the larger source size. However, upon increasingR2 to 10 cm, we see a faint halo surrounding the image of thecarbon sphere, this being phase contrast due to the edge con-trast mechanism discussed earlier. Due to the presence of thisedge contrast, the image at R2=10 cm has a higher degree ofcontrast than the contact image. Having said this, we see thatany further increase in R2 serves to degrade the phase-contrast image, through penumbral blurring. �c� The effectsof phase contrast becomes rather more striking in the thirdand fourth rows of Fig. 2. Here, the source size is sufficientlysmall that the edge contrast dominates over absorption con-trast for all but the contact images. Again, the greatest imagecontrast is obtained at a non-zero propagation distance R2. A
102005-3 Gureyev et al. J. Appl. Phys. 105, 102005 �2009�
Author complimentary copy. Redistribution subject to AIP license or copyright, see http://jap.aip.org/jap/copyright.jsp

characteristic feature of the observed phase contrast is thepresence of a “black-white” fringe in the vicinity of the edgeof the object �see points P and Q in Fig. 1�b��. This high-lights the complementary nature of propagation-based phasecontrast and absorption contrast: the former emphasizes theedges of objects, while the latter emphasizes the absorptiondue to the bulk of the object.
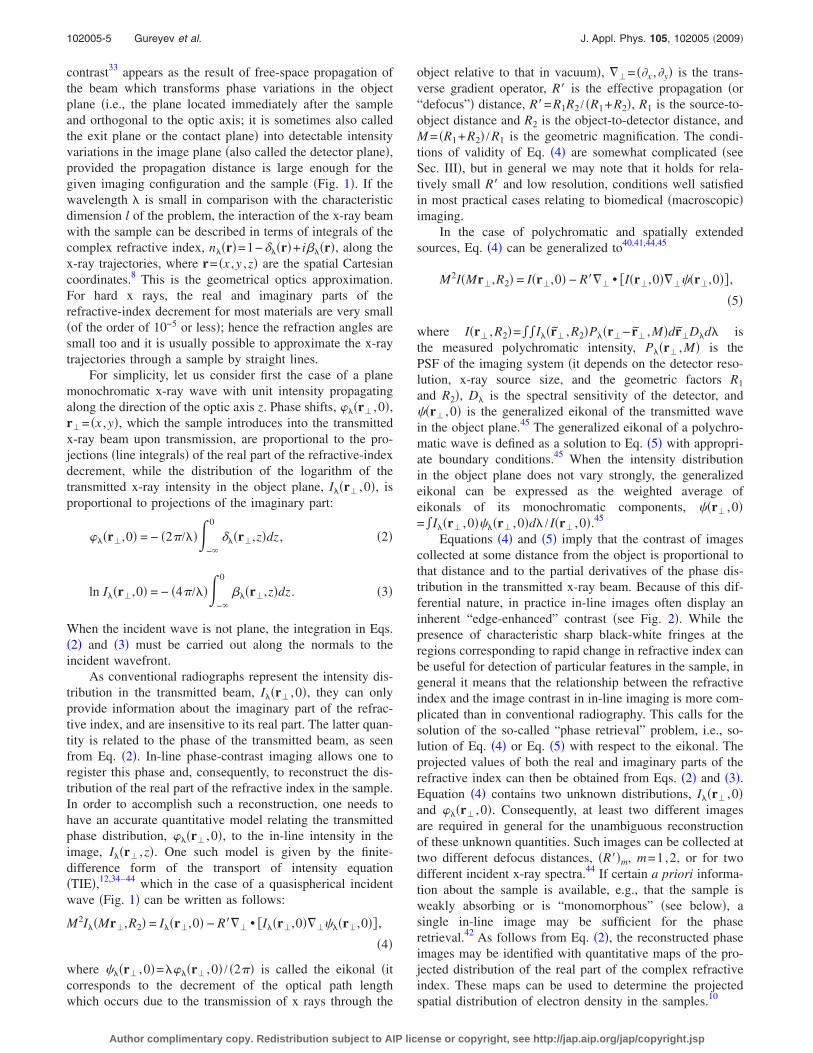
To further explore the point, that maximal image contrastoccurs for a non-zero value of R2, we introduce the contrastC of an image via the definition
C =Imax − Imin
Imax + Imin� 100% . �1�
Here, Imax denotes the maximum intensity in a given image,with Imin denoting the corresponding minimum intensity. Forour 0.25 mm radius carbon sphere, illuminated by 0.5 Å xrays with R1=10 cm, Fig. 3 plots the contrast C as a func-tion of R2 for several different source diameters D. WhenR2�0 cm, both penumbral blurring and phase contrast areabsent, so that the images all display the same small degreeof absorption contrast �due to Beer’s law of absorption by thebulk of the sphere�. For the largest source size �D=100 �m�, contrast progressively decreases with increasingR2. However, for all of the smaller source diameters consid-ered here, contrast initially increases with increasing R2 �dueto phase contrast�, before slowly decreasing with a furtherincrease in R2 �due to penumbral blurring�. For source diam-eters of 10 �m or less, and for all but the smallest object-
to-detector distances R2, phase contrast makes the dominantcontribution to the contrast of the resulting image.
II. QUANTITATIVE INTERPRETATION OF PHASE-CONTRAST IMAGES: PHASE RETRIEVALAND TOMOGRAPHY
As outlined above, propagation-based or “in-line” x-rayimages of most samples usually display conventional absorp-tion contrast as well as phase contrast.9–11,31,32 The phase
FIG. 2. Simulated propagation-basedphase-contrast images of a solid car-bon sphere of radius 0.25 mm, corre-sponding to x-ray wavelength 0.5 Å,and source-to-object distance R1
=10 cm. Phase-contrast images arecalculated as a function of object-to-detector distance R2, for a variety ofdifferent source diameters D.
FIG. 3. Contrast C, defined using Eq. �1�, for phase-contrast images of asolid carbon sphere of radius 0.25 mm. Here, source-to-object distance R1
=10 cm, x-ray wavelength �=0.5 Å, with source diameter D and object-to-detector distance R2 both being variable.
102005-4 Gureyev et al. J. Appl. Phys. 105, 102005 �2009�
Author complimentary copy. Redistribution subject to AIP license or copyright, see http://jap.aip.org/jap/copyright.jsp
contrast33 appears as the result of free-space propagation ofthe beam which transforms phase variations in the objectplane �i.e., the plane located immediately after the sampleand orthogonal to the optic axis; it is sometimes also calledthe exit plane or the contact plane� into detectable intensityvariations in the image plane �also called the detector plane�,provided the propagation distance is large enough for thegiven imaging configuration and the sample �Fig. 1�. If thewavelength � is small in comparison with the characteristicdimension l of the problem, the interaction of the x-ray beamwith the sample can be described in terms of integrals of thecomplex refractive index, n��r�=1−���r�+ i���r�, along thex-ray trajectories, where r= �x ,y ,z� are the spatial Cartesiancoordinates.8 This is the geometrical optics approximation.For hard x rays, the real and imaginary parts of therefractive-index decrement for most materials are very small�of the order of 10−5 or less�; hence the refraction angles aresmall too and it is usually possible to approximate the x-raytrajectories through a sample by straight lines.
For simplicity, let us consider first the case of a planemonochromatic x-ray wave with unit intensity propagatingalong the direction of the optic axis z. Phase shifts, ���r� ,0�,r�= �x ,y�, which the sample introduces into the transmittedx-ray beam upon transmission, are proportional to the pro-jections �line integrals� of the real part of the refractive-indexdecrement, while the distribution of the logarithm of thetransmitted x-ray intensity in the object plane, I��r� ,0�, isproportional to projections of the imaginary part:
���r�,0� = − �2�/���−
0
���r�,z�dz , �2�
ln I��r�,0� = − �4�/���−
0
���r�,z�dz . �3�
When the incident wave is not plane, the integration in Eqs.�2� and �3� must be carried out along the normals to theincident wavefront.
As conventional radiographs represent the intensity dis-tribution in the transmitted beam, I��r� ,0�, they can onlyprovide information about the imaginary part of the refrac-tive index, and are insensitive to its real part. The latter quan-tity is related to the phase of the transmitted beam, as seenfrom Eq. �2�. In-line phase-contrast imaging allows one toregister this phase and, consequently, to reconstruct the dis-tribution of the real part of the refractive index in the sample.In order to accomplish such a reconstruction, one needs tohave an accurate quantitative model relating the transmittedphase distribution, ���r� ,0�, to the in-line intensity in theimage, I��r� ,z�. One such model is given by the finite-difference form of the transport of intensity equation�TIE�,12,34–44 which in the case of a quasispherical incidentwave �Fig. 1� can be written as follows:
M2I��Mr�,R2� = I��r�,0� − R��� • �I��r�,0�����r�,0�� ,
�4�
where ��r� ,0�=����r� ,0� / �2�� is called the eikonal �itcorresponds to the decrement of the optical path lengthwhich occurs due to the transmission of x rays through the
object relative to that in vacuum�, ��= ��x ,�y� is the trans-verse gradient operator, R� is the effective propagation �or“defocus”� distance, R�=R1R2 / �R1+R2�, R1 is the source-to-object distance and R2 is the object-to-detector distance, andM = �R1+R2� /R1 is the geometric magnification. The condi-tions of validity of Eq. �4� are somewhat complicated �seeSec. III�, but in general we may note that it holds for rela-tively small R� and low resolution, conditions well satisfiedin most practical cases relating to biomedical �macroscopic�imaging.
In the case of polychromatic and spatially extendedsources, Eq. �4� can be generalized to40,41,44,45
M2I�Mr�,R2� = I�r�,0� − R��� • �I�r�,0����r�,0�� ,
�5�
where I�r� ,R2�=��I��r� ,R2�P��r�− r� ,M�dr�D�d� isthe measured polychromatic intensity, P��r� ,M� is thePSF of the imaging system �it depends on the detector reso-lution, x-ray source size, and the geometric factors R1
and R2�, D� is the spectral sensitivity of the detector, and�r� ,0� is the generalized eikonal of the transmitted wavein the object plane.45 The generalized eikonal of a polychro-matic wave is defined as a solution to Eq. �5� with appropri-ate boundary conditions.45 When the intensity distributionin the object plane does not vary strongly, the generalizedeikonal can be expressed as the weighted average ofeikonals of its monochromatic components, �r� ,0�=�I��r� ,0���r� ,0�d� / I�r� ,0�.45
Equations �4� and �5� imply that the contrast of imagescollected at some distance from the object is proportional tothat distance and to the partial derivatives of the phase dis-tribution in the transmitted x-ray beam. Because of this dif-ferential nature, in practice in-line images often display aninherent “edge-enhanced” contrast �see Fig. 2�. While thepresence of characteristic sharp black-white fringes at theregions corresponding to rapid change in refractive index canbe useful for detection of particular features in the sample, ingeneral it means that the relationship between the refractiveindex and the image contrast in in-line imaging is more com-plicated than in conventional radiography. This calls for thesolution of the so-called “phase retrieval” problem, i.e., so-lution of Eq. �4� or Eq. �5� with respect to the eikonal. Theprojected values of both the real and imaginary parts of therefractive index can then be obtained from Eqs. �2� and �3�.Equation �4� contains two unknown distributions, I��r� ,0�and ���r� ,0�. Consequently, at least two different imagesare required in general for the unambiguous reconstructionof these unknown quantities. Such images can be collected attwo different defocus distances, �R��m, m=1,2, or for twodifferent incident x-ray spectra.44 If certain a priori informa-tion about the sample is available, e.g., that the sample isweakly absorbing or is “monomorphous” �see below�, asingle in-line image may be sufficient for the phaseretrieval.42 As follows from Eq. �2�, the reconstructed phaseimages may be identified with quantitative maps of the pro-jected distribution of the real part of the complex refractiveindex. These maps can be used to determine the projectedspatial distribution of electron density in the samples.10
102005-5 Gureyev et al. J. Appl. Phys. 105, 102005 �2009�
Author complimentary copy. Redistribution subject to AIP license or copyright, see http://jap.aip.org/jap/copyright.jsp

If the transmitted intensity and phase have been deter-mined after illuminating the sample from multiple incidentangles �, conventional tomographic methods can be used forthe reconstruction of the 3D distribution of the complex re-fractive index. For example, in the simplest case of planemonochromatic incident waves, one has
n��x,y,z� = 1 + �ik�−1�0
� �−
�−
exp�− i2�����x sin �
+ z cos �� + �y�
�F�0.5 ln�I�,�obj /Iin� + i��,�
obj����,����d��d�d� ,
�6�
where I�,�obj and ��,�
obj are the reconstructed �e.g., using Eq. �4��intensity and phase of the transmitted wave in the objectplane for the incident plane wave with intensity I�
in propagat-ing at angle �−� /2 with respect to the z axis and F denotesthe 2D Fourier transform with respect to the transverse spa-tial coordinates.46–48 As both the phase and intensity in theobject plane are required for the reconstruction of the com-plex refractive index in accordance with Eq. �6�, one gener-ally needs to collect at least two images at each incidentangle �, either at two different defocus distances or for twodifferent incident x-ray spectra, as required for the “phaseretrieval” step, i.e., solution of Eq. �4�.
The phase-retrieval step can be incorporated into thecomputed-tomography �CT� reconstruction formulas.49–60
This can lead to improved signal-to-noise in the recon-structed results as well as shorter computation times. In thecase of nonabsorbing �“pure phase”� objects and weakly ab-sorbing “monomorphous” �also called “homogeneous”42� ob-jects, CT reconstruction can be achieved from a single poly-chromatic phase-contrast in-line image for each incidentangle �. An object is called monomorphous with respect tothe incident radiation if the distribution of its complex refrac-tive index n��r�=1−���r�+ i���r� is such that the ratio �
=���r� /���r� is independent of position r, at all wavelengthspresent in the wavelength spectrum. For such objects thecomplex refractive index can be written as n��r�=1−���r���1− i ��. The assumption of monomorphicity is valid forobjects composed of a single material42,53 and for objectscomposed of light elements �Z�10� illuminated by high en-ergy �60–500 keV� x rays.55 Note that nonabsorbing objectsconstitute a subset of monomorphous objects, with �=0 forall relevant wavelengths. For weakly absorbing monomor-phous objects, � is assumed small, and the 3D distributionof the spectrally averaged real decrement of the refractiveindex, ��r�=�0
I�inD����r�d� / Iin, of such objects can be re-
constructed from polychromatic in-line images I��Mr�� ,R2�collected over the full angular interval �� �0,2�� usingparaxial cone-beam illumination:59
��x,y,z� = −R1�M2
8�Iin �0
2� 1
p22F2
−1� ��F2�I��Mx�,My�,R2����R����2 + �2� + �0
�0−1�F2�P�Mx�,My�,M���d� , �7�
where �x� ,y�� are Cartesian coordinates in the object plane,the polychromatic incident intensity Iin=�0
I�inD�d� is as-
sumed to be uniform �i.e., independent of �x� ,y��� over thefield of view, � is the distance from the x-ray source to thecenter of rotation, p2=�−x cos �−y sin �, and �0 is the“center” of the wavelength spectrum which is assumed to benarrow, so that �−�0��0 for all � from the spectrum.
Note that for nonabsorbing objects, the requirement forthe spectrum to be narrow can be dropped, and the recon-struction formula Eq. �7� �with �0
=0� becomesachromatic.59 This is directly related to the fact that phase-contrast CT of nonabsorbing objects does not suffer frombeam-hardening effects. Note also that when a scaling law ofthe type ���r�= f�� ,�0���0
�r� is applicable �e.g., ���r�= �� /�0�2��0
�r� as typically holds outside x-ray absorptionedges of constituent materials�, the 3D distribution of“monochromatic” refractive index can be recovered from thespectrally averaged one according to ��0
�r�=C��0���r�, pro-vided that the position-independent spectral factor C��0� Iin /�0
I�inD�f�� ,�0�d� is known. When any scaling law of
the above type holds, but C��0� is not known, Eq. �7� stillprovides a distribution equal to the refractive index ��0
�r� upto a multiplicative factor.
To date, phase-contrast CT has been proven to possessthe following advantages compared to conventional CT:
�a� potentially reduced absorbed x-ray dose due to the re-liance on refraction, rather than absorption, as a con-trast mechanism;10,11,31,32
�b� better stability with respect to high spatial frequencynoise in experimental projections;51,52,56–58
�c� achromaticity, and, as a consequence, potential absenceof beam-hardening artifacts;10,59 and
�d� improved “locality” �which is understood as the abilityto perform region-of-interest or “zoom” CT in objectsthat are larger than the field of view of the imagingsystem�, providing a further potential for the reductionin absorbed radiation dose.60
III. PRACTICAL CONSIDERATIONS
As the preceding treatment makes clear, the relation be-tween object and image is more complicated for phase-contrast imaging than for the standard radiographic tech-niques which utilize only absorption contrast. Furthermore,there are more parameters which must be carefully controlled
102005-6 Gureyev et al. J. Appl. Phys. 105, 102005 �2009�
Author complimentary copy. Redistribution subject to AIP license or copyright, see http://jap.aip.org/jap/copyright.jsp

to produce optimum results. One is the source size, D, whichcontributes an amount D .R2 /R1 to the PSF of the system andhence its resolving power. The detector resolution also con-tributes to the PSF. Since R2 /R1 is small �ideally zero� forstandard nonmagnification radiography �i.e., contact imag-ing�, D is not then so critical, although even here too large asource can cause some undesirable penumbral blurring. Onthe other hand, for propagation-based phase contrast R2 is bydefinition nonzero.
Thus appropriate selection of the geometrical parametersR1 and R2 as well as the x-ray wavelength and spectral char-acteristics are also important for image optimization. In themedical context, this must of course include dose consider-ations. Clearly there will be trade-offs between these; forinstance, increasing R2 will increase phase contrast �up to apoint� but may also increase the PSF �see below�, which willdecrease this contrast, more especially since it is a differen-tial type of contrast which accentuates high spatial frequen-cies �or in real space terms, rapidly changing features such asedges�. Likewise, there are trade-offs between contrast andabsorbed dose; both increase with increasing wavelength, butclearly one wishes to maximize one and minimize the other.In this connection we may note that, first, phase contrast,being based on elastic interaction, does not contribute to theabsorbed dose, and, second, phase decreases more slowlythan absorption with increasing x-ray energy, so phase con-trast becomes relatively more important than absorption con-trast at higher energies, although they both decrease �see Sec.III B�. Thus there are several quantities which the user maywish to optimize, singly or together. They include SNR, con-trast, resolution, and absorbed dose. The signal itself can bedefined in different ways, e.g., in terms of maximum andminimum intensities of a feature or as integrated intensityminus background. All these quantities are of course speci-men dependent.
A. Optimizing the imaging system
Considering the multiple factors outlined above, it is notsurprising that there is no generally accepted formula ormethod for design and optimization of a propagation-basedphase-contrast imaging system. However, a few general prin-ciples can be given. First, as we see from Eq. �4�, increasingthe effective propagation distance R� will linearly increasephase contrast �the second term on the right hand side of thisequation�, although it should be noted that this equation isonly an approximation valid for small R�, as detailed in thefollowing paragraph. This same equation can explain whyphase contrast in this regime does not require highly mono-chromatic illumination, at least for a pure phase object:31 afactor �2 can be removed from the phase-contrast term,which is then wavelength independent apart from an overallmultiplicative factor given by a spectrally weighted sum.When absorption is present this is no longer strictly true butis often still a reasonable approximation �Eq. �5��. This isimportant as it means that a laboratory source of x rays canbe used without very restrictive monochromatization.
To illustrate optimization for a particular case, we con-sider the image of a phase edge under TIE conditions. It is
known that the TIE approximation is valid if the transmis-sion function of the object, q��r�� I�
1/2�r� ,0�exp�i���r� ,0��, satisfies the following condi-tion: ��
2 q��r��R�� /�M � ��q��r��, which allows one touse the first-order Taylor approximation for q��r��.61 Here,�M is a characteristic size of the object convolved with thespatial distribution of the source and with the resolutionfunction of the detector. For a phase-edge object of length L,convolved with the Gaussian function having standard devia-tion �obj, and characterized by a maximum phase shift��max, and assuming a source with a Gaussian intensity dis-tribution �characterized by a standard deviation �src� and adetector with a Gaussian PSF �having a standard deviation�det�, the latter condition, generalized for a polychromaticincident beam, is equivalent to the following formula:62
N �M�obj/�R� max��/�2��, max� � 1, �8�
where
�M2 �obj
2 + �M − 1�2M−2�src2 + M−2�det
2 , �9�
max �Iin�−1� I�in��max��/2��d� , �10�
� �Iin�−1� I�in�d� , �11�
Iin � I�ind� . �12�
Note that N in Eq. �8� has been defined as the effectiveFresnel number.62
A general expression for the polychromatic figure-of-merit �SNR for the phase induced contrast� in the near-fieldimage of an arbitrary object was obtained by Krol et al.63 Forthe phase-edge object, this result can be presented explicitlyin the following form:62
SNRTIE = U�IinL�1/2maxR��M−3/2, �13�
where U �1−e−2��4��−1/2.Usually one is interested in optimization of the in-line
geometry �e.g., total source-to-detector distance, R, and mag-nification, M�, in terms of the contrast, SNR and resolution,assuming both the incident fluence Iin and the incident spec-tral distribution I�
in to be constant and therefore the absorbeddose to be fixed. Then Eqs. �8� and �13� can be rewrittenexplicitly with respect to R=R1+R2 and M as follows:
N �R���−1 M
M − 1�obj
�M2�obj2 + �M − 1�2�src
2 + �det2
� 1, �14�
where �� max�� / �2�� , max.
102005-7 Gureyev et al. J. Appl. Phys. 105, 102005 �2009�
Author complimentary copy. Redistribution subject to AIP license or copyright, see http://jap.aip.org/jap/copyright.jsp
SNRTIE = ��RM − 1
M1/2�M2�obj2 + �M − 1�2�src
2 + �det2 �3/4 ,
�15�
where �� Umax�IinL�1/2 is constant for a given edgelength L.
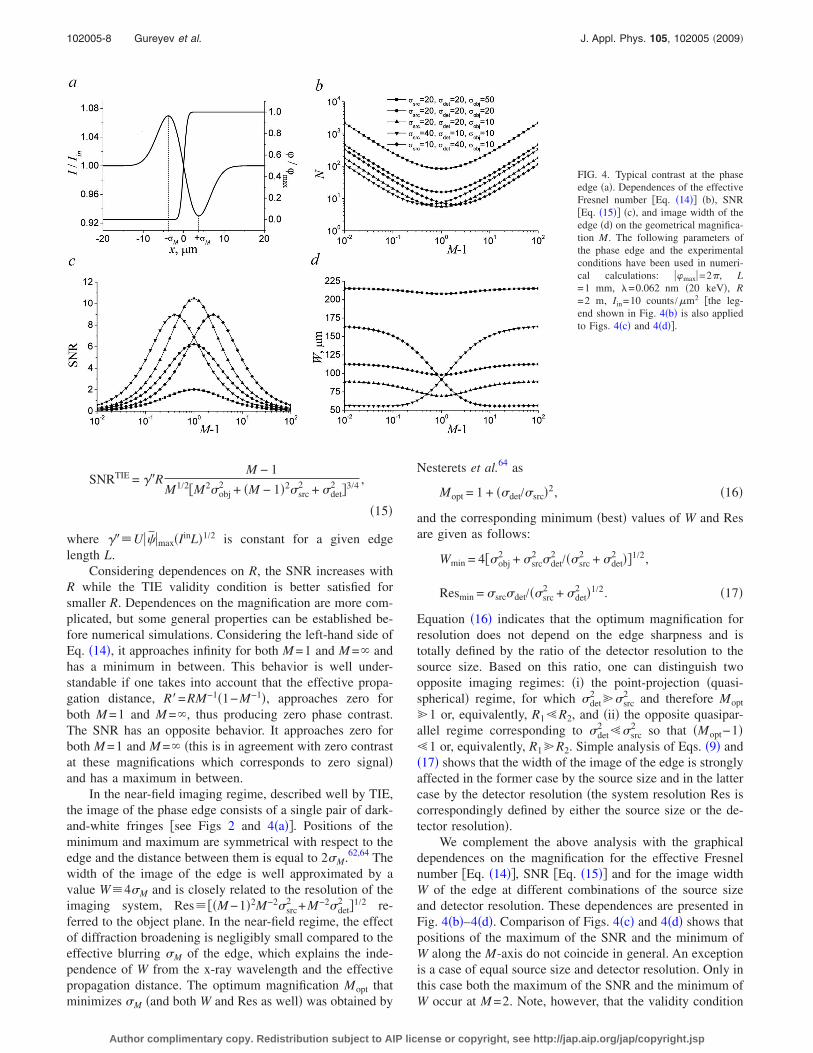
Considering dependences on R, the SNR increases withR while the TIE validity condition is better satisfied forsmaller R. Dependences on the magnification are more com-plicated, but some general properties can be established be-fore numerical simulations. Considering the left-hand side ofEq. �14�, it approaches infinity for both M =1 and M = andhas a minimum in between. This behavior is well under-standable if one takes into account that the effective propa-gation distance, R�=RM−1�1−M−1�, approaches zero forboth M =1 and M =, thus producing zero phase contrast.The SNR has an opposite behavior. It approaches zero forboth M =1 and M = �this is in agreement with zero contrastat these magnifications which corresponds to zero signal�and has a maximum in between.
In the near-field imaging regime, described well by TIE,the image of the phase edge consists of a single pair of dark-and-white fringes �see Figs 2 and 4�a��. Positions of theminimum and maximum are symmetrical with respect to theedge and the distance between them is equal to 2�M.62,64 Thewidth of the image of the edge is well approximated by avalue W 4�M and is closely related to the resolution of theimaging system, Res ��M −1�2M−2�src
2 +M−2�det2 �1/2 re-
ferred to the object plane. In the near-field regime, the effectof diffraction broadening is negligibly small compared to theeffective blurring �M of the edge, which explains the inde-pendence of W from the x-ray wavelength and the effectivepropagation distance. The optimum magnification Mopt thatminimizes �M �and both W and Res as well� was obtained by
Nesterets et al.64 as
Mopt = 1 + ��det/�src�2, �16�
and the corresponding minimum �best� values of W and Resare given as follows:
Wmin = 4��obj2 + �src
2 �det2 /��src
2 + �det2 ��1/2,
Resmin = �src�det/��src2 + �det
2 �1/2. �17�
Equation �16� indicates that the optimum magnification forresolution does not depend on the edge sharpness and istotally defined by the ratio of the detector resolution to thesource size. Based on this ratio, one can distinguish twoopposite imaging regimes: �i� the point-projection �quasi-spherical� regime, for which �det
2 ��src2 and therefore Mopt
�1 or, equivalently, R1�R2, and �ii� the opposite quasipar-allel regime corresponding to �det
2 ��src2 so that �Mopt−1�
�1 or, equivalently, R1�R2. Simple analysis of Eqs. �9� and�17� shows that the width of the image of the edge is stronglyaffected in the former case by the source size and in the lattercase by the detector resolution �the system resolution Res iscorrespondingly defined by either the source size or the de-tector resolution�.
We complement the above analysis with the graphicaldependences on the magnification for the effective Fresnelnumber �Eq. �14��, SNR �Eq. �15�� and for the image widthW of the edge at different combinations of the source sizeand detector resolution. These dependences are presented inFig. 4�b�–4�d�. Comparison of Figs. 4�c� and 4�d� shows thatpositions of the maximum of the SNR and the minimum ofW along the M-axis do not coincide in general. An exceptionis a case of equal source size and detector resolution. Only inthis case both the maximum of the SNR and the minimum ofW occur at M =2. Note, however, that the validity condition
FIG. 4. Typical contrast at the phaseedge �a�. Dependences of the effectiveFresnel number �Eq. �14�� �b�, SNR�Eq. �15�� �c�, and image width of theedge �d� on the geometrical magnifica-tion M. The following parameters ofthe phase edge and the experimentalconditions have been used in numeri-cal calculations: �max=2�, L=1 mm, �=0.062 nm �20 keV�, R=2 m, Iin=10 counts /�m2 �the leg-end shown in Fig. 4�b� is also appliedto Figs. 4�c� and 4�d��.
102005-8 Gureyev et al. J. Appl. Phys. 105, 102005 �2009�
Author complimentary copy. Redistribution subject to AIP license or copyright, see http://jap.aip.org/jap/copyright.jsp

of the TIE is not as well satisfied at this magnification �seethe curves corresponding to �src=�det in Fig. 4�b�� but can beimproved by decreasing the total source-to-detector distanceR, although at the expense of SNR.
As an example of the use of these equations, we considera case which might represent clinical phase-contrast imag-ing: 20 keV mean photon energy, �max=2�, �src=�det
=20 �m, and �obj=50 �m. For this case, we choose M =2which corresponds to the optimum for both resolution andSNR, and Eq. �14� then gives R�167 m. Taking, say, R=2 m, so that the validity conditions for the TIE will be wellsatisfied, and L=1 mm in Eq. �15�, one obtains SNR=2 forIin=10 counts /�m2 �representing a radiation exposure ofabout 3.2�10−6 J /cm2�. It is also readily seen that increas-ing �src and/or �det to around 50 �m would have little effecton SNR but could be a significant design consideration.
Another imaging theory that is commonly used in thiscontext is based on the weak-object approximation.31 Onefeature of this approach is that it is formulated in Fourierspace, i.e., in terms of spatial frequency rather than directcoordinates. This allows optimization as a function of spatialfrequency, which can be advantageous as there is then noneed to use a particular model object �although it is pos-sible�. Workers using this approach include Wu and Liu,43,65
Nesterets et al.,64 and Arhatari et al.66 The last authors alsocompared the results with those based on the TIE, showingwhat conditions were appropriate for each method.
B. X-ray parameters for clinically relevant samplesand x-ray energies
As noted at the start of Sec. III, significant imaging pa-rameters are dependent on properties of the sample, particu-larly the real and imaginary parts � and � of the refractiveindex defined in Sec. II. By way of example, we note heresome relevant properties for breast tissue and cortical bone atx-ray energies typical of those used in clinical imaging ap-plications.
Figure 5 shows the calculated values of � and � as afunction of x-ray energy, encompassing much of the range ofinterest in the diagnostic and clinical context. The calcula-tions utilize x-ray data from McMaster et al.67 and Brennanand Cowan.68 The density values and mass fractions of theconstituent elements for cortical bone and breast tissue arefrom ICRU Report 44 �1989�.69 We have included, for �, thephotoelectric, coherent �Rayleigh—involving bound elec-trons; Thomson—involving “free” electrons� and incoherent�Compton� scattering cross-sections; we will not be consid-ering photon energies high enough for other processes suchas pair production or photodisintegration to be of any rel-evance. Below 20 keV the photoelectric cross-section domi-nates but at higher x-ray energies the other processes, espe-cially Compton scattering, start to play an increasinglyimportant role and dominate at 100 keV. The variation of � inFig. 5 clearly demonstrates the expected 1 /E2 dependence�where E is the x-ray energy; E is related to the x-ray wave-length � by E=12.3986 /� when E is in keV and � in Å�. Theoverall variation of the photoelectric contribution to � in Fig.5 shows the expected 1 /E4 dependence. In the case of corti-cal bone, the significant amounts of P �10.3 wt %� and Ca
�22.5 wt %� present result in noticeable discontinuities in ��p.e.� �and thereby � �total�� at energies corresponding to theK-absorption edges �approximately 2.15 and 4.04 keV, re-spectively�. Very slight fluctuations in � at these two energiescan also be seen but are barely perceptible.
In the case of a homogeneous compound, a simple ex-pression can be written, with certain well-established ap-proximations, which relates � to the electron-number density�e, and E or �. It is, however, more convenient to deal withthe usual mass density � and the following simple equationcan be derived:
� =C��Z/A�
E2 , �18�
where C is a constant �4.152�10−4 cm3 keV2�, �Z /A� is themean ratio of atomic number Z to atomic weight A for thecompound �unit: mole g−1�, � is in unit of g /cm3, and E inkeV. �Z /A� is a convenient quantity as it is often used in themedical/biomedical fields, e.g., see ICRU Report 44 �1989�.
In terms of x-ray imaging modalities, the magnitude of� /� is often important �see, for example, Eq. �7�� and fromFig. 5 we see that this ratio varies, for cortical bone, from 5.7at 1 keV to 77 at 10 keV to 1200 at 100 keV �the respectivevalues for breast tissue are 7.3, 570, and 1400�. The presenceof absorption edges and contributions to � from cross sec-tions other than photoelectric mean that the energy depen-dence of � /� is not in general simple.
IV. APPLICATIONS
Propagation-based phase-contrast x-ray imaging, bothlaboratory- and synchrotron-based, has found application ina wide variety of fields in recent years. For example, re-searchers have used this technique to study pyrocarbon-coated metal matrices,70 inertial confinement fusion fuelpellets,71 real-time solidification of metallic alloys,72 porosity
FIG. 5. Calculated complex x-ray refractive-index decrements � and � as afunction of x-ray energy �log-log plot� for cortical bone and breast tissue.For � the contributions from photoelectric �p.e.�, coherent �coh.�, and inco-herent �incoh.� cross sections are included as well as the total. The photo-electric contributions are indicated by arrows for clarity.
102005-9 Gureyev et al. J. Appl. Phys. 105, 102005 �2009�
Author complimentary copy. Redistribution subject to AIP license or copyright, see http://jap.aip.org/jap/copyright.jsp
in quasicrystals,73 high-performance composite laminates,74
flow dynamics in liquid jets,75 and velocity fields for bloodflowing in microchannels.76 Sample images from themedical/biomedical disciplines have included the intricatedetail within articular cartilage,77 mammography includingparticular emphasis on practical considerations required inthe clinical context,78,79 identification of certain traditionalChinese medicines,80 lungs of small animals such as miceand rabbits,81 and diagnosis in the field of orthopedics.82
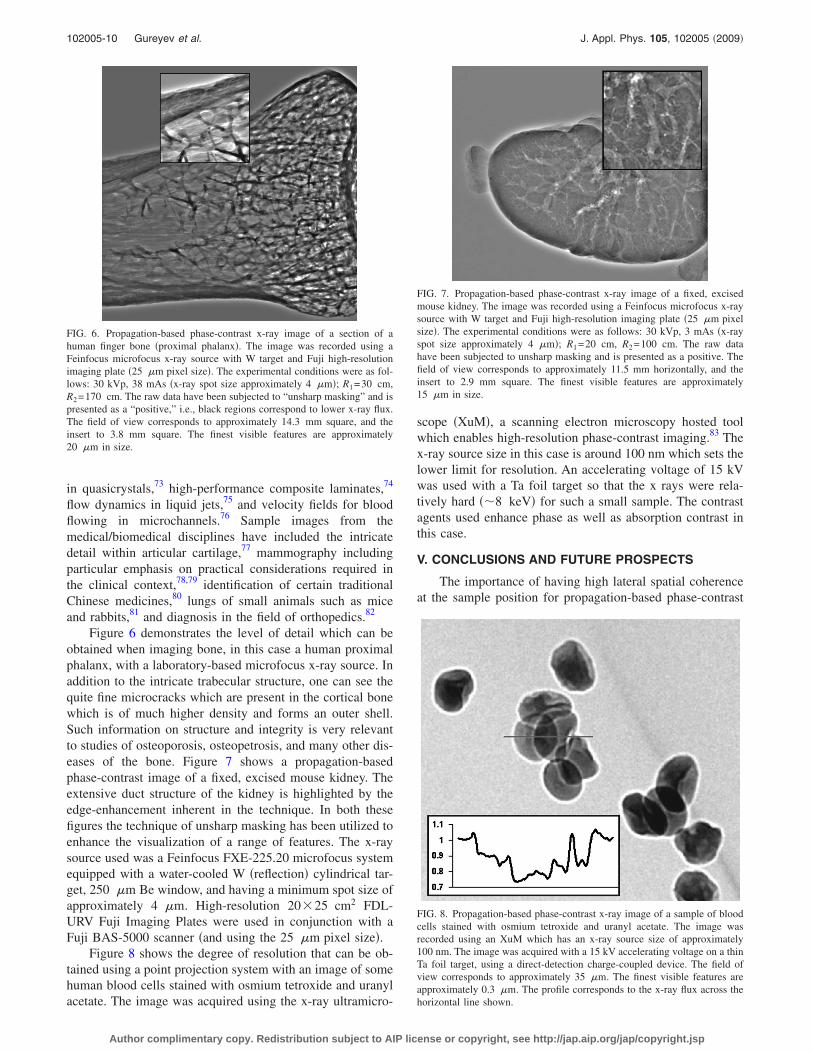
Figure 6 demonstrates the level of detail which can beobtained when imaging bone, in this case a human proximalphalanx, with a laboratory-based microfocus x-ray source. Inaddition to the intricate trabecular structure, one can see thequite fine microcracks which are present in the cortical bonewhich is of much higher density and forms an outer shell.Such information on structure and integrity is very relevantto studies of osteoporosis, osteopetrosis, and many other dis-eases of the bone. Figure 7 shows a propagation-basedphase-contrast image of a fixed, excised mouse kidney. Theextensive duct structure of the kidney is highlighted by theedge-enhancement inherent in the technique. In both thesefigures the technique of unsharp masking has been utilized toenhance the visualization of a range of features. The x-raysource used was a Feinfocus FXE-225.20 microfocus systemequipped with a water-cooled W �reflection� cylindrical tar-get, 250 �m Be window, and having a minimum spot size ofapproximately 4 �m. High-resolution 20�25 cm2 FDL-URV Fuji Imaging Plates were used in conjunction with aFuji BAS-5000 scanner �and using the 25 �m pixel size�.
Figure 8 shows the degree of resolution that can be ob-tained using a point projection system with an image of somehuman blood cells stained with osmium tetroxide and uranylacetate. The image was acquired using the x-ray ultramicro-
scope �XuM�, a scanning electron microscopy hosted toolwhich enables high-resolution phase-contrast imaging.83 Thex-ray source size in this case is around 100 nm which sets thelower limit for resolution. An accelerating voltage of 15 kVwas used with a Ta foil target so that the x rays were rela-tively hard ��8 keV� for such a small sample. The contrastagents used enhance phase as well as absorption contrast inthis case.
V. CONCLUSIONS AND FUTURE PROSPECTS
The importance of having high lateral spatial coherenceat the sample position for propagation-based phase-contrast
FIG. 6. Propagation-based phase-contrast x-ray image of a section of ahuman finger bone �proximal phalanx�. The image was recorded using aFeinfocus microfocus x-ray source with W target and Fuji high-resolutionimaging plate �25 �m pixel size�. The experimental conditions were as fol-lows: 30 kVp, 38 mAs �x-ray spot size approximately 4 �m�; R1=30 cm,R2=170 cm. The raw data have been subjected to “unsharp masking” and ispresented as a “positive,” i.e., black regions correspond to lower x-ray flux.The field of view corresponds to approximately 14.3 mm square, and theinsert to 3.8 mm square. The finest visible features are approximately20 �m in size.
FIG. 7. Propagation-based phase-contrast x-ray image of a fixed, excisedmouse kidney. The image was recorded using a Feinfocus microfocus x-raysource with W target and Fuji high-resolution imaging plate �25 �m pixelsize�. The experimental conditions were as follows: 30 kVp, 3 mAs �x-rayspot size approximately 4 �m�; R1=20 cm, R2=100 cm. The raw datahave been subjected to unsharp masking and is presented as a positive. Thefield of view corresponds to approximately 11.5 mm horizontally, and theinsert to 2.9 mm square. The finest visible features are approximately15 �m in size.
FIG. 8. Propagation-based phase-contrast x-ray image of a sample of bloodcells stained with osmium tetroxide and uranyl acetate. The image wasrecorded using an XuM which has an x-ray source size of approximately100 nm. The image was acquired with a 15 kV accelerating voltage on a thinTa foil target, using a direct-detection charge-coupled device. The field ofview corresponds to approximately 35 �m. The finest visible features areapproximately 0.3 �m. The profile corresponds to the x-ray flux across thehorizontal line shown.
102005-10 Gureyev et al. J. Appl. Phys. 105, 102005 �2009�
Author complimentary copy. Redistribution subject to AIP license or copyright, see http://jap.aip.org/jap/copyright.jsp

imaging has been discussed earlier. High longitudinal spatialcoherence only tends to become important for propagation-based imaging in the case of high spatial resolution imaging�microscopy� and/or large sample-to-detector distances �seeRef. 31�. The cases of laboratory and synchrotron-basedsources are briefly discussed below.
Hard x-ray phase-contrast imaging techniques have be-come widely adopted at synchrotron facilities. High lateralspatial coherence is inherent in the beams produced at thesefacilities due to the inevitable large source-to-sample dis-tances together with the low emittance of third generationsynchrotron sources. High longitudinal coherence may bereadily achieved, where needed, at synchrotron sources with-out too great a loss in intensity at the image plane, by use ofcrystal optics, for example, due to the good match betweenthe highly collimated beams emitted from third generationsources and the typical very narrow angular range of accep-tance of crystal optics.
In the case of laboratory-based in-line hard x-ray phase-contrast imaging for in vivo biomedical applications, a sig-nificant challenge is to obtain sufficient SNR in the imageplane in order to obtain interpretable phase-contrast imagesin, say, less than 1 s exposure time.84 Conventional stationarysolid-target microfocus x-ray sources useful for in-linephase-contrast imaging have achieved a performance level ofaround 2 W /�m of source diameter �FWHM�. Rotating an-ode sources have achieved somewhat higher power loadings.Some alternative lines of development for microfocus x-raysources are those based on high-power pulsed-laser plasmasources �e.g., Ref. 85� and on the so-called inverse Comptoneffect, in which an optical or infrared laser beam is directedat a relativistic electron beam in a storage ring with resultantCompton backscattered photons in the many keV x-ray en-ergy range.86 A class of very compact hybrid synchrotronsources that use a fixed anode has been developed at Rit-sumeikan University and involves the insertion of a thinmetal foil as a target inside a typically 6–20 MeV compactsynchrotron.87 A feature of these synchrotron-based sourcesis that they can be mounted at any angle, including vertical.A further very interesting and promising line of developmentin the field of high-brilliance compact x-ray sources are thosebeing developed at KTH in Stockholm and based on liquid-metal-jet anode targets.88 Current performance levels forthese appear to be around five times better than conventionalfixed target microfocus sources and with claimed potentialfor 10–100 times improvement. Source sizes down to 5 �mhave been achieved. Such sources could provide a basis forroutine and high-performance in-line x-ray phase-contrastimaging in the clinical medical context.
The second major area of challenge for high perfor-mance implementation of in-line phase-contrast imaging is inthe availability of large-area, low-noise, and reasonable res-olution 2D x-ray detectors. At the present time, one class ofuseful detectors for in-line phase-contrast imaging is photo-stimulable phosphor plates which are read via a laser scannerto obtain digital image data. Among their advantages are thatthey can be manufactured in large-area form and linearityover a large dynamic range. Disadvantages are that they cantake several minutes to scan and are not well suited to mul-
tiple rapid exposures. Other forms of 2D detectors for x-rayimaging are becoming available and offer the possibility ofeven lower noise and reduced absorbed dose, e.g., photoncounting detectors such as pixel array detectors �Broenni-mann et al.89 at PSI� and direct-detection detectors com-prised of linear silicon strip sensors in an edge-on geometryconnected to photon counting electronics. The pixel size forthese latter is 50 �m and the field of view 24�26 cm2.90
The combination of high-brilliance compact x-raysources with 10–1000 times the brilliance of current fixedanode microfocus sources combined with very low-noisephoton counting detectors of appropriate area and resolutionwould open up a vast range of routine applications for in-linephase-contrast and create the possibility for a revolution inbiomedical x-ray imaging �see also Ref. 91�. Other forms ofphase-contrast imaging, such as those based on the use ofgratings25,26,92–94 would also benefit from these develop-ments and be of great value, especially in soft-tissue imagingstudies.
A further interesting area of opportunity for x-ray phase-contrast imaging is in the use of contrast media95,96 or ultra-sonic modulation to enhance phase-contrast of specificfeatures.97
ACKNOWLEDGMENTS
D.M.P. acknowledges funding from the Australian Re-search Council, via the Discovery-Projects program. XRTLtd. is gratefully acknowledged for encouragement and somesupport of this work. The authors would like to thank LeanneTilley and colleagues of La Trobe University for providingsamples.
1W. C. Röntgen, Nature �London� 53, 274 �1896�.2C. A. Helms, Fundamentals of Skeletal Radiology, 3rd ed. �Saunders,Philadelphia, 1998�.
3H. Vogel and D. Haller, Eur. J. Radiol. 63, 242 �2007�.4Digital Mammography, edited by E. D. Pisano, M. J. Yaffe, and C. M.Kuzmiak �Lippincott Williams & Wilkins, Philadelphia, 2004�.
5R. Lewis, Phys. Med. Biol. 42, 1213 �1997�.6J. W. Young, T. P. Ginthner, and B. Keramati, Clin. Radiol. 36, 43 �1985�.7A. Peterzol, A. Bravin, P. Coan, and H. Elleaume, Nucl. Instrum. MethodsPhys. Res. A 510, 45 �2003�.
8D. M. Paganin, Coherent X-Ray Optics �Oxford University Press, NewYork, 2006�.
9A. Snigirev, I. Snigireva, V. Kohn, S. Kuznetsov, and I. Schelekov, Rev.Sci. Instrum. 66, 5486 �1995�.
10S. W. Wilkins, T. E. Gureyev, D. Gao, A. Pogany, and A. W. Stevenson,Nature �London� 384, 335 �1996�.
11P. Cloetens, R. Barrett, J. Baruchel, J.-P. Guigay, and M. Schlenker, J.Phys. D 29, 133 �1996�.
12K. A. Nugent, T. E. Gureyev, D. Cookson, D. Paganin, and Z. Barnea,Phys. Rev. Lett. 77, 2961 �1996�.
13L. Beese, R. Feder, and D. Sayre, Biophys. J. 49, 259 �1986�.14E. D. Frank, B. W. Long, and B. J. Smith, Merrill’s Atlas of Radiographic
Positioning and Procedures, 11th ed. �Elsevier Science, New York, 2007�,Vols. 1–3.
15U. Bonse and M. Hart, Appl. Phys. Lett. 6, 155 �1965�.16E. Förster, K. Goetz, and P. Zaumseil, Krist. Tech. 15, 937 �1980�.17V. A. Somenkov, A. K. Tkalich, and S. Shil’stein, Sov. Phys. Tech. Phys.
3, 1309 �1991�.18V. N. Ingal and E. A. Beliaevskaya, J. Phys. D 28, 2314 �1995�.19T. J. Davis, D. Gao, T. E. Gureyev, A. W. Stevenson, and S. W. Wilkins,
Nature �London� 373, 595 �1995�.20T. J. Davis, T. E. Gureyev, D. Gao, A. W. Stevenson, and S. W. Wilkins,
Phys. Rev. Lett. 74, 3173 �1995�.
102005-11 Gureyev et al. J. Appl. Phys. 105, 102005 �2009�
Author complimentary copy. Redistribution subject to AIP license or copyright, see http://jap.aip.org/jap/copyright.jsp

21T. J. Davis, J. X-Ray Sci. Technol. 6, 317 �1996�.22T. J. Davis and A. W. Stevenson, J. Opt. Soc. Am. A 13, 1193 �1996�.23D. Chapman, W. Thomlinson, R. E. Johnston, D. Washburn, E. Pisano, N.
Gmür, Z. Zhong, R. Menk, R. F. Arfelli, and D. Sayers, Phys. Med. Biol.42, 2015 �1997�.
24G. Schmahl, D. Rudolph, and P. Guttmann, X-Ray Microscopy II, editedby D. Sayre, M. Howells, J. Kirz, and H. Rarback �Springer-Verlag, Ber-lin, 1988�.
25C. David, B. Nöhammer, H. H. Solak, and E. Ziegler, Appl. Phys. Lett. 81,3287 �2002�.
26T. Weitkamp, A. Diaz, C. David, F. Pfeiffer, M. Stampanoni, P. Cloetens,and E. Ziegler, Opt. Express 13, 6296 �2005�.
27F. Pfeiffer, T. Weitkamp, O. Bunk, and C. David, Nat. Phys. 2, 258 �2006�.28F. Pfeiffer, C. Kottler, O. Bunk, and C. David, Phys. Rev. Lett. 98, 108105
�2007�.29C. Kottler, C. David, F. Pfeiffer, and O. Bunk, Opt. Express 15, 1175
�2007�.30R. A. Lewis, N. Yagi, M. J. Kitchen, M. J. Morgan, D. Paganin, K. K. W.
Siu, K. Pavlov, I. Williams, K. Uesugi, M. J. Wallace, C. J. Hall, J. Whit-ley, and S. B. Hooper, Phys. Med. Biol. 50, 5031 �2005�.
31A. Pogany, D. Gao, and S. W. Wilkins, Rev. Sci. Instrum. 68, 2774 �1997�.32R. Fitzgerald, Phys. Today 53�7�, 23 �2000�.33D. Gabor, Nature �London� 161, 777 �1948�.34J. M. Cowley, Diffraction Physics, 3rd ed. �Elsevier, Amsterdam, 1995�.35M. R. Teague, J. Opt. Soc. Am. 73, 1434 �1983�.36D. Van Dyck and W. Coene, Optik 77, 125 �1987�.37F. Roddier, Appl. Opt. 29, 1402 �1990�.38T. E. Gureyev and S. W. Wilkins, J. Opt. Soc. Am. A 15, 579 �1998�.39T. E. Gureyev, C. Raven, A. Snigirev, I. Snigireva, and S. W. Wilkins, J.
Phys. D 32, 563 �1999�.40D. Paganin and K. A. Nugent, Phys. Rev. Lett. 80, 2586 �1998�.41T. E. Gureyev, Optik 110, 263 �1999�.42D. Paganin, S. C. Mayo, T. E. Gureyev, P. R. Miller, and S. W. Wilkins, J.
Microsc. 206, 33 �2002�.43X. Wu and H. Liu, J. X-Ray Sci. Technol. 11, 33 �2003�.44T. E. Gureyev, Ya. I. Nesterets, D. M. Paganin, A. Pogany, and S. W.
Wilkins, Opt. Commun. 259, 569 �2006�.45T. E. Gureyev, D. M. Paganin, A. W. Stevenson, S. C. Mayo, and S. W.
Wilkins, Phys. Rev. Lett. 93, 068103 �2004�.46C. Raven, A. Snigirev, I. Snigireva, P. Spanne, A. Souvorov, and V. Kohn,
Appl. Phys. Lett. 69, 1826 �1996�.47P. Cloetens, M. Pateyron-Salome, J. Y. Buffiere, G. Peix, J. Baruchel, F.
Peyrin, and M. Schlenker, J. Appl. Phys. 81, 5878 �1997�.48P. Cloetens, W. Ludwig, J. Baruchel, D. Van Dyck, J. Van Landuyt, J.-P.
Guigay, and M. Schlenker, Appl. Phys. Lett. 75, 2912 �1999�.49E. Wolf, Opt. Commun. 1, 153 �1969�.50A. J. Devaney, Inverse Probl. 2, 161 �1986�.51A. V. Bronnikov, Opt. Commun. 171, 239 �1999�.52A. V. Bronnikov, J. Opt. Soc. Am. A 19, 472 �2002�.53S. C. Mayo, T. J. Davis, T. E. Gureyev, P. R. Miller, D. Paganin, A.
Pogany, A. W. Stevenson, and S. W. Wilkins, Opt. Express 11, 2289�2003�.
54M. A. Anastasio, D. Shi, Y. Huang, and G. Gbur, J. Opt. Soc. Am. A 22,2651 �2005�.
55X. Wu and H. Liu, Opt. Express 13, 6000 �2005�.56T. E. Gureyev, D. M. Paganin, G. R. Myers, Ya. I. Nesterets, and S. W.
Wilkins, Appl. Phys. Lett. 89, 034102 �2006�.57G. R. Myers, T. E. Gureyev, and D. M. Paganin, J. Opt. Soc. Am. A 24,
2516 �2007�.58T. E. Gureyev, G. R. Myers, Ya. I. Nesterets, D. M. Paganin, K. M.
Pavlov, S. C. Mayo, and S. W. Wilkins, Proc. SPIE 6318, 63180V �2006�.59G. R. Myers, S. C. Mayo, T. E. Gureyev, D. M. Paganin, and S. W.
Wilkins, Phys. Rev. A 76, 045804 �2007�.60T. E. Gureyev, Ya. I. Nesterets and S. C. Mayo, Opt. Commun. 280, 39
�2007�.61T. E. Gureyev, A. Pogany, D. M. Paganin, and S. W. Wilkins, Opt. Com-
mun. 231, 53 �2004�.62T. E. Gureyev, Ya. I. Nesterets, A. W. Stevenson, P. R. Miller, A. Pogany,
and S. W. Wilkins, Opt. Express 16, 3223 �2008�.63A. Krol, R. Kincaid, M. Servol, J.-C. Kieffer, Y. Nesterets, T. Gureyev, A.
Stevenson, S. Wilkins, H. Ye, E. Lipson, R. Toth, A. Pogany, and I. Co-man, Proc. SPIE 6510, 65100L �2007�.
64Ya. I. Nesterets, S. W. Wilkins, T. E. Gureyev, A. Pogany, and A. W.
Stevenson, Rev. Sci. Instrum. 76, 093706 �2005�.65X. Wu and H. Liu, Med. Phys. 30, 2169 �2003�.66B. D. Arhatari, K. A. Nugent, A. G. Peele, and J. Thornton, Rev. Sci.
Instrum. 76, 113704 �2005�.67W. H. McMaster, N. K. Del Grande, J. H. Mallett, and J. H. Hubbell,
LLNL Report No. UCRL-50174, 1970.68S. Brennan and P. L. Cowan, Rev. Sci. Instrum. 63, 850 �1992�.69ICRU Report No. 44, 1989.70Y. S. Kashyap, T. Roy, P. S. Sarkar, P. S. Yadav, M. Shukla, A. Sinha, K.
Dasgupta, and D. Sathiyamoorthy, Rev. Sci. Instrum. 78, 083703 �2007�.71B. J. Kozioziemski, J. D. Sater, J. D. Moody, J. J. Sanchez, R. A. London,
A. Barty, H. E. Martz, Jr., and D. S. Montgomery, J. Appl. Phys. 98,103105 �2005�.
72H. N. Thi, H. Jamgotchian, J. Gastaldi, J. Härtwig, T. Schenk, H. Klein, B.Billia, J. Baruchel, and Y. Dabo, J. Phys. D 36, A83 �2003�.
73S. Agliozzo, E. Brunello, H. Klein, L. Mancini, J. Härtwig, J. Baruchel,and J. Gastaldi, J. Cryst. Growth 281, 623 �2005�.
74L. Tesei, G. Tesei, L. Mancini, G. Tromba, and F. Zanini, Adv. Eng. Mater.7, 1054 �2005�.
75Y. Wang, X. Liu, K.-S. Im, W.-K. Lee, J. Wang, K. Fezzaa, D. L. S. Hung,and J. R. Winkelman, Nat. Phys. 4, 305 �2008�.
76S.-J. Lee and G.-B. Kim, J. Appl. Phys. 97, 064701 �2005�.77D. Shimao, K. Mori, H. Sugiyama, and K. Hyodo, Jpn. J. Appl. Phys., Part
1 44, 450 �2005�.78C. J. Kotre and I. P. Birch, Phys. Med. Biol. 44, 2853 �1999�.79A. Abrami, F. Arfelli, R. C. Barroso, A. Bergamaschi, F. Billè, P. Bregant,
F. Brizzi, K. Casarin, E. Castelli, V. Chenda, L. Dalla Palma, D. Dreossi,C. Fava, R. Longo, L. Mancini, R.-H. Menk, F. Montanari, A. Olivo, S.Pani, A. Pillon, E. Quai, S. Ren Kaiser, L. Rigon, T. Rokvic, M. Tonutti,G. Tromba, A. Vascotto, C. Venanzi, F. Zanconati, A. Zanetti, and F.Zanini, Nucl. Instrum. Methods Phys. Res. A 548, 221 �2005�.
80X. Wei, T.-Q. Xiao, L.-X. Liu, G.-H. Du, M. Chen, Y.-Y. Luo, and H.-J.Xu, Phys. Med. Biol. 50, 4277 �2005�.
81M. J. Kitchen, R. A. Lewis, N. Yagi, K. Uesugi, D. Paganin, S. B. Hooper,G. Adams, S. Jureczek, J. Singh, C. R. Christensen, A. P. Hufton, C. J.Hall, K. C. Cheung, and K. M. Pavlov, Br. J. Radiol. 78, 1018 �2005�.
82K. Mori, N. Sekine, H. Sato, D. Shimao, H. Shiwaku, K. Hyodo, H.Sugiyama, M. Ando, K. Ohashi, M. Koyama, and Y. Nakajima, J. Syn-chrotron Radiat. 9, 143 �2002�.
83S. C. Mayo, P. R. Miller, S. W. Wilkins, T. J. Davis, D. Gao, T. E.Gureyev, D. Paganin, D. J. Parry, A. Pogany, and A. W. Stevenson, J.Microsc. 207, 79 �2002�.
84S. W. Wilkins, T. E. Gureyev, S. C. Mayo, Ya. I. Nesterets, D. M. Paganin,A. Pogany, and A. W. Stevenson, Portable Synchrotron Light Sources andAdvanced Applications, AIP Conference Proceedings, edited by M.Sasaki, 902, 33 �2007�.
85J. C. Kieffer, A. Krol, Z. Jiang, C. C. Chamberlain, E. Scalzetti, and Z.Ichalalene, Appl. Phys. B: Lasers Opt. 74, S75 �2002�.
86F. E. Carroll, M. H. Mendenhall, R. H. Traeger, C. Brau, and J. W. Waters,AJR, Am. J. Roentgenol. 181, 1197 �2003�.
87T. Hirai, H. Yamada, M. Sasaki, D. Hasegawa, M. Morita, Y. Oda, J.Takaku, T. Hanashima, N. Nitta, M. Takahashi, and K. Murata, J. Syn-chrotron Radiat. 13, 397 �2006�.
88M. Otendal, T. Tuohimaa, U. Vogt, and H. M. Hertz, Rev. Sci. Instrum. 79,016102 �2008�.
89C. Broennimann, E. F. Eikenberry, B. Henrich, R. Horisberger, R.Huelsen, G. Pohl, B. Schmidt, C. Schulze-Briese, M. Suzuki, T. Tomizaki,and A. Wagner, J. Synchrotron Radiat. 13, 120 �2006�.
90M. Aslund, B. Cederström, M. Lundqvist, and M. Danielsson, Med. Phys.34, 1918 �2007�.
91R. A. Lewis, Phys. Med. Biol. 49, 3573 �2004�.92J. F. Clauser, U.S. Patent No. 5,812,629 �30 April 1997�.93A. Momose, S. Kawamoto, I. Koyama, Y. Hamaishi, K. Takai, and Y.
Suzuki, Jpn. J. Appl. Phys., Part 1 42, L866 �2003�.94Ya. I. Nesterets and S. W. Wilkins, Opt. Express 16, 5849 �2008�.95F. Arfelli, L. Rigon, R. H. Menk, and H. J. Besch, Medical Imaging 2003
Conference, 17–20 February 2003 � Proc. SPIE 5030, 274 �2003��.96C. J. Hall, K. D. Rogers, R. A. Lewis, R. H. Menk, F. Arfelli, K. Siu, A.
Benci, M. Kitchen, A. Pillon, L. Rigon, A. Round, A. P. Hufton, A. Evans,S. E. Pinder, and S. Evans, Conference on Penetrating Radiation Systemsand Applications V, 6–8 August 2003 � Proc. SPIE 5199, 94 �2004��.
97T. J. Hamilton, C. J. Baliat, C. Rose-Petruck, and G. J. Diebold, Phys.Med. Biol. 49, 4985 �2004�.
102005-12 Gureyev et al. J. Appl. Phys. 105, 102005 �2009�
Author complimentary copy. Redistribution subject to AIP license or copyright, see http://jap.aip.org/jap/copyright.jsp